UNITED STATES
SECURITIES AND EXCHANGE COMMISSION
Washington, D.C. 20549
FORM N-CSR
CERTIFIED SHAREHOLDER REPORT OF REGISTERED
MANAGEMENT INVESTMENT COMPANIES
| | |
| Investment Company Act file number: | | 811-03981 |
| |
| Exact name of registrant as specified in charter: | | Prudential World Fund, Inc. |
| |
| Address of principal executive offices: | | Gateway Center 3, |
| | 100 Mulberry Street, |
| | Newark, New Jersey 07102 |
| |
| Name and address of agent for service: | | Deborah A. Docs |
| | Gateway Center 3, |
| | 100 Mulberry Street, |
| | Newark, New Jersey 07102 |
| |
| Registrant’s telephone number, including area code: | | 800-225-1852 |
| |
| Date of fiscal year end: | | 10/31/2011 |
| |
| Date of reporting period: | | 10/31/2011 |
Item 1 – Reports to Stockholders

PRUDENTIAL INVESTMENTS»MUTUAL FUNDS
PRUDENTIAL INTERNATIONAL EQUITY FUND
ANNUAL REPORT · OCTOBER 31, 2011
Fund Type
International stock
Objective
Long-term growth of capital
This report is not authorized for distribution to prospective investors unless preceded or accompanied by a current prospectus.
The views expressed in this report and information about the Fund’s portfolio holdings are for the period covered by this report and are subject to change thereafter.
Prudential Investments, Prudential, the Prudential logo, and the Rock symbol are service marks of Prudential Financial, Inc. and its related entities, registered in many jurisdictions worldwide.

December 15, 2011
Dear Shareholder:
After leading Prudential Investments for the past eight years, I have decided to retire at the end of 2011 from my positions as President of Prudential Investments and President and Director of the Prudential International Equity Fund (the Fund). Effective January 1, 2012, I will become Chairman of Prudential Investments and act as an advisor to the business during 2012 to help facilitate a smooth transition to my successor, Stuart Parker.
Stuart, who will become President of Prudential Investments and President and Director of the Fund on January 1, 2012, previously served as the Executive Vice President of Retail Mutual Fund Distribution at Prudential Investments. With more than 20 years of investment industry experience, Stuart brings a deep understanding of the needs and challenges facing today’s investors.
We hope you find the annual report for the Fund informative. We recognize that ongoing market volatility may make it a difficult time to be an investor. We continue to believe a prudent response to uncertainty is to maintain a diversified portfolio, including stock and bond mutual funds consistent with your tolerance for risk, time horizon, and financial goals.
Your financial professional can help you create a diversified investment plan that reflects your personal investor profile and risk tolerance. Keep in mind that diversification and asset allocation strategies do not assure a profit or protect against loss in declining markets. We encourage you to call your financial professional before making any investment decision.
Prudential Investments provides a wide range of mutual funds to choose from that can help you make progress toward your financial goals. Our funds offer the experience, resources, and professional discipline of Prudential Financial’s affiliated asset managers.
Finally, I’ve been privileged to have had the opportunity to help you address your investment needs, and I thank you for choosing the Prudential Investments family of mutual funds.
Sincerely,

Judy A. Rice, President
Prudential International Equity Fund
| | | | |
| Prudential International Equity Fund | | | 1 | |
Your Fund’s Performance
Performance data quoted represent past performance. Past performance does not guarantee future results. The investment return and principal value of an investment will fluctuate, so that an investor’s shares, when redeemed, may be worth more or less than their original cost. Current performance may be lower or higher than the past performance data quoted. An investor may obtain performance data as of the most recent month-end by visiting our website at www.prudentialfunds.com or by calling (800) 225-1852. Class A and Class L shares have a maximum initial sales charge of 5.50% and 5.75%, respectively. Gross operating expenses: Class A, 1.64%; Class B, 2.34%; Class C, 2.34%; Class F, 2.09%; Class L, 1.84%; Class M, 2.34%; Class X, 2.34%; Class Z, 1.34%. Net operating expenses: Class A, 1.64%; Class B, 2.34%; Class C, 2.34%; Class F, 2.09%; Class L, 1.84%; Class M, 2.34%; Class X, 2.34%; Class Z, 1.34%.
| | | | | | | | | | | | | | | | |
Cumulative Total Returns (Without Sales Charges) as of 10/31/11 | |
| | | One Year | | | Five Years | | | Ten Years | | | Since Inception | |
Class A | | | –5.61 | % | | | –23.19 | % | | | 52.42 | % | | | — | |
Class B | | | –6.27 | | | | –25.83 | | | | 41.53 | | | | — | |
Class C | | | –6.27 | | | | –25.83 | | | | 41.54 | | | | — | |
Class F | | | –6.05 | | | | N/A | | | | N/A | | | | –28.57% (12/18/06) | |
Class L | | | –5.62 | | | | N/A | | | | N/A | | | | –28.15 (3/19/07) | |
Class M | | | –6.27 | | | | N/A | | | | N/A | | | | –29.92 (3/19/07) | |
Class X | | | –6.27 | | | | N/A | | | | N/A | | | | –29.92 (3/19/07) | |
Class Z | | | –5.30 | | | | –22.23 | | | | 55.69 | | | | — | |
MSCI EAFE ND Index | | | –4.08 | | | | –11.50 | | | | 74.62 | | | | — | |
Lipper Average | | | –5.53 | | | | –12.63 | | | | 63.13 | | | | — | |
| | | | | | | | | | | | | | | | |
Average Annual Total Returns (With Sales Charges) as of 9/30/11 | |
| | | One Year | | | Five Years | | | Ten Years | | | Since Inception | |
Class A | | | –15.65 | % | | | –7.35 | % | | | 3.12 | % | | | — | |
Class B | | | –15.76 | | | | –7.14 | | | | 2.94 | | | | — | |
Class C | | | –12.25 | | | | –6.97 | | | | 2.95 | | | | — | |
Class F | | | –15.55 | | | | N/A | | | | N/A | | | | –8.84% (12/18/06) | |
Class L | | | –16.17 | | | | N/A | | | | N/A | | | | –10.21 (3/19/07) | |
Class M | | | –16.63 | | | | N/A | | | | N/A | | | | –9.86 (3/19/07) | |
Class X | | | –16.63 | | | | N/A | | | | N/A | | | | –10.05 (3/19/07) | |
Class Z | | | –10.57 | | | | –6.09 | | | | 3.94 | | | | — | |
MSCI EAFE ND Index | | | –9.36 | | | | –3.46 | | | | 5.03 | | | | — | |
Lipper Average | | | –10.77 | | | | –3.92 | | | | 4.15 | | | | — | |
| | |
| 2 | | Visit our website at www.prudentialfunds.com |
| | | | | | | | | | | | | | | | |
Average Annual Total Returns (With Sales Charges) as of 10/31/11 | |
| | | One Year | | | Five Years | | | Ten Years | | | Since Inception | |
Class A | | | –10.80 | % | | | –6.21 | % | | | 3.72 | % | | | — | |
Class B | | | –10.90 | | | | –5.97 | | | | 3.53 | | | | — | |
Class C | | | –7.19 | | | | –5.80 | | | | 3.54 | | | | — | |
Class F | | | –10.68 | | | | N/A | | | | N/A | | | | –6.85% (12/18/06) | |
Class L | | | –11.05 | | | | N/A | | | | N/A | | | | –8.09 (3/19/07) | |
Class M | | | –11.82 | | | | N/A | | | | N/A | | | | –7.77 (3/19/07) | |
Class X | | | –11.82 | | | | N/A | | | | N/A | | | | –7.96 (3/19/07) | |
Class Z | | | –5.30 | | | | –4.90 | | | | 4.53 | | | | — | |
| | | | | | | | | | | | | | | | |
| Average Annual Total Returns (Without Sales Charges) as of 10/31/11 | |
| | | One Year | | | Five Years | | | Ten Years | | | Since Inception | |
Class A | | | –5.61 | % | | | –5.14 | % | | | 4.30 | % | | | — | |
Class B | | | –6.27 | | | | –5.80 | | | | 3.53 | | | | — | |
Class C | | | –6.27 | | | | –5.80 | | | | 3.54 | | | | — | |
Class F | | | –6.05 | | | | N/A | | | | N/A | | | | –6.67% (12/18/06) | |
Class L | | | –5.62 | | | | N/A | | | | N/A | | | | –6.90 (3/19/07) | |
Class M | | | –6.27 | | | | N/A | | | | N/A | | | | –7.40 (3/19/07) | |
Class X | | | –6.27 | | | | N/A | | | | N/A | | | | –7.40 (3/19/07) | |
Class Z | | | –5.30 | | | | –4.90 | | | | 4.53 | | | | — | |
Growth of a $10,000 Investment
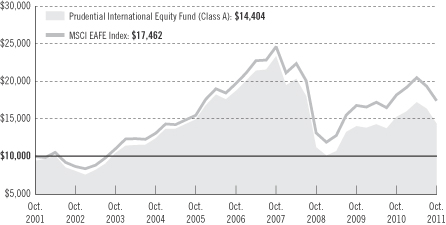
The graph compares a $10,000 investment in the Prudential International Equity Fund (Class A shares) with a similar investment in the MSCI EAFE ND Index by portraying the initial account values at the beginning of the
| | | | |
| Prudential International Equity Fund | | | 3 | |
Your Fund’s Performance (continued)
10-year period for Class A shares (October 31, 2001) and the account values at the end of the current fiscal year (October 31, 2011) as measured on a quarterly basis. For purposes of the graph, and unless otherwise indicated, it has been assumed that (a) the maximum applicable front-end sales charge was deducted from the initial $10,000 investment in Class A shares; (b) all recurring fees (including management fees) were deducted; and (c) all dividends and distributions were reinvested. The line graph provides information for Class A shares only. As indicated in the tables provided earlier, performance for Class B, Class C, Class F, Class L, Class M, Class X, and Class Z shares will vary due to the differing charges and expenses applicable to each share class (as indicated in the following paragraphs). Without the distribution and service (12b-1) fee waiver of 0.05% for Class A shares in effect through February 29, 2012, the returns shown in the graph and for Class A shares in the tables would have been lower.
Total returns and the ending account values in the graph include changes in share price and reinvestment of dividends and capital gains distributions in a hypothetical investment for the periods shown. The Fund’s total returns do not reflect the deduction of income taxes on an individual’s investment. Taxes may reduce your actual investment returns on income or gains paid by the Fund or any gains you may realize if you sell your shares.
Source: Prudential Investments LLC and Lipper Inc. Performance figures may reflect fee waivers and/or expense reimbursements. In the absence of such fee waivers and/or expense reimbursements, total returns would be lower.
Inception returns are provided for any share class with less than 10 calendar years of returns.
The average annual total returns take into account applicable sales charges. Class A and Class L shares are subject to a maximum front-end sales charge of 5.50% and 5.75%, respectively, and a 12b-1 fee of up to 0.30% and 0.50%, respectively, annually. All investors who purchase Class A and Class L shares in an amount of $1 million or more and sell these shares within 12 months of purchase are subject to a contingent deferred sales charge (CDSC) of 1%. Under certain limited circumstances, an exchange may be made from Class A to Class Z shares of the Fund. Class B and Class F shares are subject to a declining CDSC of 5%, 4%, 3%, 2%, 1%, and 1%, respectively, for the first six years after purchase and 12b-1 fees of 1% and 0.75%, respectively, annually. Approximately seven years after purchase, Class B and Class F will automatically convert to Class A shares on a quarterly basis. Class C shares are not subject to a front-end sales charge, but charge a CDSC of 1% for Class C shares sold within 12 months from the date of purchase and an annual 12b-1 fee of 1%. Class M and Class X shares purchased are not subject to a front-end sales charge, but charge a CDSC of 6% and a 12b-1 fee of 1%. The CDSC for Class M shares declines by 1% annually to 2% in the fifth and sixth year after purchase, 1% in the seventh year and 0% in the eighth year after purchase. The CDSC for Class X shares declines by 1% annually to 4% in the third and fourth year after purchase, 3% in the fifth year after purchase, 2% in the sixth and seventh year after purchase, 1% in the eighth year after purchase and 0% in the ninth and tenth year after purchase. Class M and Class X shares convert to Class A shares on a monthly basis approximately eight years and ten years, respectively, after purchase. The returns in the tables and graph reflect the share class expense structure in effect at the close of the fiscal period. The returns in the tables and graph do not reflect the deduction of taxes that a shareholder would pay on Fund distributions or following the redemption of Fund shares.
| | |
| 4 | | Visit our website at www.prudentialfunds.com |
Benchmark Definitions
Morgan Stanley Capital International Europe, Australasia, and Far East ND Index
The Morgan Stanley Capital International Europe, Australasia, and Far East Net Dividend (MSCI EAFE ND) Index is an unmanaged, weighted index of performance that reflects stock price movements of developed-country markets in Europe, Australasia, and the Far East. The ND version of the MSCI EAFE Index reflects the impact of the maximum withholding taxes on reinvested dividends. MSCI EAFE ND Index Closest Month-End to Inception cumulative total returns as of 10/31/11 are –16.68% for Class F, and –19.94% for Class L, Class M, and Class X. MSCI EAFE ND Index Closest Month-End to Inception average annual total returns as of 9/30/11 are –5.62% for Class F, and –6.75% for Class L, Class M, and Class X.
Lipper International Large-Cap Core Funds Average
The Lipper International Large-Cap Core Funds Average (Lipper Average) represents returns based on an average return of all funds in the Lipper International Large-Cap Core Funds category. Funds in the Lipper Average invest at least 75% of their equity assets in companies strictly outside of the United States with market capitalizations (on a three-year weighted basis) greater than the 250th largest company in the S&P Developed ex-U.S. Broad Market Index (BMI). Large-Cap Core funds typically have an average price-to-cash-flow ratio, price-to-book ratio, and three-year sales-per-share-growth value compared with the S&P Developed ex-U.S. BMI. Lipper Average Closest Month-End to Inception cumulative total returns as of 10/31/11 are –17.83% for Class F, and –20.60% for Class L, Class M, and Class X. Lipper Average Closest Month-End to Inception average annual total returns as of 9/30/11 are –6.07% for Class F, and –7.11% for Class L, Class M, and Class X.
Investors cannot invest directly in an index or average. The returns for the Index and the Lipper Average would be lower if they included the effects of sales charges, operating expenses of a mutual fund, or taxes. Returns for the Lipper Average reflect the deduction of operating expenses, but not sales charges or taxes.
| | | | |
Five Largest Holdings in Long-Term Portfolio expressed as a percentage of net assets as of 10/31/11 | | | | |
Total SA, Oil, Gas & Consumable Fuels | | | 1.7 | % |
Novartis AG, Pharmaceuticals | | | 1.6 | |
Sanofi, Pharmaceuticals | | | 1.4 | |
Vodafone Group PLC, Wireless Telecommunication Services | | | 1.4 | |
Roche Holding AG, Pharmaceuticals | | | 1.4 | |
Holdings are subject to change.
| | | | |
Five Largest Industries in Long-Term Portfolio expressed as a percentage of net assets as of 10/31/11 | |
Commercial Banks | | | 11.2 | % |
Oil, Gas & Consumable Fuels | | | 8.7 | |
Pharmaceuticals | | | 7.8 | |
Metals & Mining | | | 6.9 | |
Insurance | | | 4.9 | |
Industry weightings are subject to change.
| | | | |
| Prudential International Equity Fund | | | 5 | |
Strategy and Performance Overview
How did the Fund perform?
Prudential International Equity Fund’s Class A shares declined 5.61% for the 12-month reporting period ended October 31, 2011, underperforming the 4.08% decline of the Morgan Stanley Capital International Europe, Australasia, and Far East Net Dividend Index (MSCI EAFE ND Index). The Class A shares were in line with the 5.53% decline of the Lipper International Large-Cap Core Funds Average.
How is the Fund managed?
Quantitative Management Associates LLC (QMA) tries to outperform the MSCI EAFE ND Index by actively managing the Fund via a quantitative process that evaluates more than 1,000 stocks. Investing in shares of both slowly and rapidly growing companies limits the Fund’s exposure to any particular style of investing and may reduce its volatility relative to the MSCI EAFE ND Index.
When selecting stocks of slowly growing companies, QMA emphasizes attractive valuations and invests more heavily in shares that are priced cheaply relative to their firms’ earnings prospects and book values. When selecting stocks of more rapidly growing companies, QMA places a heavier emphasis on “news” or signals about their future growth prospects. For example, upward revisions in earnings forecasts by Wall Street analysts are used as an indication of good news.
As part of its strategy, the Fund seeks to remain fully invested. In order to accomplish this and to efficiently manage the Fund, QMA utilizes futures contracts based on equity market indexes to provide liquidity for the Fund. The futures contracts are used to equitize cash that has accrued, enabling the Fund to efficiently process large cash flows without requiring it to maintain large cash positions. During the reporting period, the Fund’s exposure to futures contracts did not have a material impact on its performance.
How did international stock markets perform?
International stock markets finished a turbulent period in the red in U.S. dollar terms, as measured by the MSCI EAFE ND Index, which gauges stock markets of economically developed nations other than the United States and Canada.
| | • | | International equity markets got off to a volatile start. A sharp decline for November 2010, caused largely by a flare-up in a sovereign-debt crisis in the geographically peripheral nations of the euro zone, was followed by a large gain for December. Stock prices soared on expectations that a moderate global economic recovery would continue and on pro-growth developments in the United States, such as an agreement in Washington to extend tax cuts. |
| | • | | The stock rally initially continued, with gains in three of the first four months of 2011. Markets, however, remained volatile driven by headline-grabbing developments. Growing political upheaval hurt economic growth in some |
| | |
| 6 | | Visit our website at www.prudentialfunds.com |
| | nations in the Middle East and North Africa and threatened the stability of the global oil supply. Natural disasters occurred in Japan, Southeast Asia, and the United States. Those in Japan and Thailand disrupted global supply lines for critical automobile and electronics components, among other consequences. |
| | • | | The remainder of the period saw the MSCI EAFE ND Index experience five consecutive monthly declines (the largest in September) before rebounding sharply in October. Stock prices were hit hard by fears of recession in several developed economies and the worsening sovereign-debt turmoil. Concerns about a systemic shock to the world’s financial system increased as European leaders failed to contain the region’s debt crisis. |
| | • | | Individual markets turned in a mixed performance. Several suffered double-digit declines such as Greece, which lost the most due to fear it might default on its debt. Some other euro participants such as Italy and Portugal also saw double-digit declines. Meanwhile, New Zealand scored a double-digit increase, the largest of the period. The United Kingdom and Switzerland posted small gains, somewhat buffered from the euro crisis but exposed to the threat of a financial system meltdown. Two markets not in the MSCI EAFE ND Index, the United States and Canada, delivered a single-digit gain and a slight loss, respectively. |
How did international stock markets sectors perform?
The sectors also turned in a mixed performance for the period, in U.S. dollar terms.
| | • | | Utilities suffered the largest decline. The next largest loss was in the financials sector, particularly banks and diversified financials. Telecommunications services, information technology, materials, industrials, and consumer discretionary all delivered single-digit losses. Three sectors posted gains, including energy and the defensive consumer staples and healthcare sectors. |
Among slowly growing companies, which stocks or related group of stocks contributed most and detracted most from the Fund’s return?
Among slowly growing companies, a few of the largest contributors to the Fund’s return were British American Tobacco, GlaxoSmithKline, and Legal & General Group. All of these had significant gains for the reporting period. The largest detractors were primarily financial firms, including Natixis, Resona Holdings, and 3i Group, all of which suffered considerable losses.
Among rapidly growing companies, which stocks or related group of stocks contributed most and detracted most from the Fund’s return?
Among rapidly growing companies, shares of DeNA (a social game firm based in Japan), Royal Dutch Shell, and Mitsubishi Electric rose and were among the largest contributors to the Fund’s return. A few of the largest detractors were shares of Peugeot, BNP Paribas, and Metso Corp. (an engineering firm based in Finland), all of which suffered sharp losses for the period.
| | | | |
| Prudential International Equity Fund | | | 7 | |
Fees and Expenses (Unaudited)
As a shareholder of the Fund, you incur two types of costs: (1) transaction costs, including sales charges (loads) on purchase payments and redemptions, as applicable, and (2) ongoing costs, including management fees, distribution and/or service (12b-1) fees, and other Fund expenses, as applicable. This example is intended to help you understand your ongoing costs (in dollars) of investing in the Fund and to compare these costs with the ongoing costs of investing in other mutual funds.
The example is based on an investment of $1,000 invested on May 1, 2011, at the beginning of the period, and held through the six-month period ended October 31, 2011. The example is for illustrative purposes only; you should consult the Prospectus for information on initial and subsequent minimum investment requirements.
The Fund’s transfer agent may charge additional fees to holders of certain accounts that are not included in the expenses shown in the table on the following page. These fees apply to individual retirement accounts (IRAs) and Section 403(b) accounts. As of the close of the six-month period covered by the table, IRA fees included an annual maintenance fee of $15 per account (subject to a maximum annual maintenance fee of $25 for all accounts held by the same shareholder). Section 403(b) accounts are charged an annual $25 fiduciary maintenance fee. Some of the fees may vary in amount, or may be waived, based on your total account balance or the number of Prudential Investments funds, including the Fund, that you own. You should consider the additional fees that were charged to your Fund account over the six-month period when you estimate the total ongoing expenses paid over the period and the impact of these fees on your ending account value, as these additional expenses are not reflected in the information provided in the expense table. Additional fees have the effect of reducing investment returns.
Actual Expenses
The first line for each share class in the table on the following page provides information about actual account values and actual expenses. You may use the information on this line, together with the amount you invested, to estimate the expenses that you paid over the period. Simply divide your account value by $1,000 (for example, an $8,600 account value ÷ $1,000 = 8.6), then multiply the result by the number on the first line under the heading “Expenses Paid During the Six-Month Period” to estimate the expenses you paid on your account during this period.
Hypothetical Example for Comparison Purposes
The second line for each share class in the table on the following page provides information about hypothetical account values and hypothetical expenses based on the Fund’s actual expense ratio and an assumed rate of return of 5% per year before expenses, which is not the Fund’s actual return. The hypothetical account values and expenses may not be used to estimate the actual ending account balance or expenses you paid for the period. You may use this information to compare the ongoing costs
| | |
| 8 | | Visit our website at www.prudentialfunds.com |
of investing in the Fund and other funds. To do so, compare this 5% hypothetical example with the 5% hypothetical examples that appear in the shareholder reports of the other funds.
Please note that the expenses shown in the table are meant to highlight your ongoing costs only and do not reflect any transactional costs such as sales charges (loads). Therefore, the second line for each share class in the table is useful in comparing ongoing costs only and will not help you determine the relative total costs of owning different funds. In addition, if these transactional costs were included, your costs would have been higher.
| | | | | | | | | | | | | | | | | | |
Prudential International
Equity Fund | | Beginning Account
Value
May 1, 2011 | | | Ending Account
Value
October 31, 2011 | | | Annualized
Expense Ratio
Based on the
Six-Month Period | | | Expenses Paid
During the
Six-Month Period* | |
| | | | | | | | | | | | | | | | | | |
| Class A | | Actual | | $ | 1,000.00 | | | $ | 836.30 | | | | 1.59 | % | | $ | 7.36 | |
| | | Hypothetical | | $ | 1,000.00 | | | $ | 1,017.19 | | | | 1.59 | % | | $ | 8.08 | |
| | | | | | | | | | | | | | | | | | |
| Class B | | Actual | | $ | 1,000.00 | | | $ | 834.60 | | | | 2.29 | % | | $ | 10.59 | |
| | | Hypothetical | | $ | 1,000.00 | | | $ | 1,013.66 | | | | 2.29 | % | | $ | 11.62 | |
| | | | | | | | | | | | | | | | | | |
| Class C | | Actual | | $ | 1,000.00 | | | $ | 834.60 | | | | 2.29 | % | | $ | 10.59 | |
| | | Hypothetical | | $ | 1,000.00 | | | $ | 1,013.66 | | | | 2.29 | % | | $ | 11.62 | |
| | | | | | | | | | | | | | | | | | |
| Class F | | Actual | | $ | 1,000.00 | | | $ | 834.60 | | | | 2.04 | % | | $ | 9.43 | |
| | | Hypothetical | | $ | 1,000.00 | | | $ | 1,014.92 | | | | 2.04 | % | | $ | 10.36 | |
| | | | | | | | | | | | | | | | | | |
| Class L | | Actual | | $ | 1,000.00 | | | $ | 837.70 | | | | 1.79 | % | | $ | 8.29 | |
| | | Hypothetical | | $ | 1,000.00 | | | $ | 1,016.18 | | | | 1.79 | % | | $ | 9.10 | |
| | | | | | | | | | | | | | | | | | |
| Class M | | Actual | | $ | 1,000.00 | | | $ | 834.60 | | | | 2.29 | % | | $ | 10.59 | |
| | | Hypothetical | | $ | 1,000.00 | | | $ | 1,013.66 | | | | 2.29 | % | | $ | 11.62 | |
| | | | | | | | | | | | | | | | | | |
| Class X | | Actual | | $ | 1,000.00 | | | $ | 834.60 | | | | 2.29 | % | | $ | 10.59 | |
| | | Hypothetical | | $ | 1,000.00 | | | $ | 1,013.66 | | | | 2.29 | % | | $ | 11.62 | |
| | | | | | | | | | | | | | | | | | |
| Class Z | | Actual | | $ | 1,000.00 | | | $ | 838.70 | | | | 1.29 | % | | $ | 5.98 | |
| | | Hypothetical | | $ | 1,000.00 | | | $ | 1,018.70 | | | | 1.29 | % | | $ | 6.56 | |
* Fund expenses (net of fee waivers or subsidies, if any) for each share class are equal to the annualized expense ratio for each share class (provided in the table), multiplied by the average account value over the period, multiplied by the 184 days in the six-month period ended October 31, 2011, and divided by the 365 days in the Fund’s fiscal year ended October 31, 2011 (to reflect the six-month period). Expenses presented in the table include the expenses of any underlying portfolios in which the Fund may invest.
| | | | |
| Prudential International Equity Fund | | | 9 | |
Portfolio of Investments
as of October 31, 2011
| | | | | | |
| Shares | | Description | | Value (Note 1) | |
| | | | | | |
LONG-TERM INVESTMENTS 99.4% | | | | |
COMMON STOCKS 98.2% | | | | |
| |
Australia 7.7% | | | | |
| 277,927 | | Asciano Ltd. | | $ | 444,298 | |
| 110,268 | | Australia & New Zealand Banking Group Ltd. | | | 2,491,654 | |
| 67,582 | | Bendigo and Adelaide Bank Ltd. | | | 667,326 | |
| 104,274 | | BHP Billiton Ltd. | | | 4,081,753 | |
| 49,654 | | Caltex Australia Ltd. | | | 689,591 | |
| 5,943 | | Coca-Cola Amatil Ltd. | | | 76,717 | |
| 32,557 | | Commonwealth Bank of Australia | | | 1,672,450 | |
| 482,173 | | Fairfax Media Ltd. | | | 467,539 | |
| 354,385 | | GPT Group | | | 1,169,572 | |
| 48,378 | | Iluka Resources Ltd. | | | 804,267 | |
| 72,299 | | Industrea Ltd. | | | 96,980 | |
| 158,061 | | Mirvac Group | | | 206,978 | |
| 40,600 | | National Australia Bank Ltd. | | | 1,084,399 | |
| 14,313 | | OZ Minerals Ltd. | | | 171,881 | |
| 175,045 | | QR National Ltd. | | | 604,776 | |
| 6,632 | | Ramsay Health Care Ltd. | | | 130,367 | |
| 25,011 | | Rio Tinto Ltd. | | | 1,795,637 | |
| 50,518 | | Santos Ltd. | | | 682,275 | |
| 437,095 | | SP AusNet | | | 455,752 | |
| 585,712 | | Stockland | | | 1,934,137 | |
| 85,209 | | Telstra Corp. Ltd. | | | 276,667 | |
| 56,720 | | Westfield Group | | | 456,616 | |
| 55,466 | | Westpac Banking Corp. | | | 1,287,153 | |
| 17,216 | | Woolworths Ltd. | | | 430,361 | |
| 34,763 | | WorleyParsons Ltd. | | | 1,008,984 | |
| | | | | | |
| | | | | 23,188,130 | |
| |
Austria 0.2% | | | | |
| 126,863 | | IMMOFINANZ AG | | | 416,538 | |
| 3,085 | | Raiffeisen Bank International AG(a) | | | 85,616 | |
| 7,090 | | Voestalpine AG | | | 243,605 | |
| | | | | | |
| | | | | 745,759 | |
| |
Belgium 0.5% | | | | |
| 1,939 | | Delhaize Group SA | | | 126,656 | |
| 7,258 | | Groupe Bruxelles Lambert SA | | | 557,898 | |
| 34,134 | | KBC Groep NV | | | 756,952 | |
| | | | | | |
| | | | | 1,441,506 | |
See Notes to Financial Statements.
| | | | |
| Prudential International Equity Fund | | | 11 | |
Portfolio of Investments
as of October 31, 2011 continued
| | | | | | |
| Shares | | Description | | Value (Note 1) | |
| | | | | | |
COMMON STOCKS (Continued) | | | | |
| |
Brazil 1.8% | | | | |
| 3,200 | | Banco do Brasil SA, ADR | | $ | 49,344 | |
| 79,800 | | Centrais Eletricas Brasileiras SA, ADR | | | 794,010 | |
| 36,700 | | Centrais Eletricas Brasileiras SA (Class B Stock), ADR(a) | | | 511,965 | |
| 27,200 | | Cia de Bebidas das Americas, ADR | | | 917,184 | |
| 10,000 | | Cia de Saneamento Basico do Estado de Sao Paulo, ADR | | | 542,600 | |
| 18,600 | | Petroleo Brasileiro SA (Class A Stock), ADR(a) | | | 470,394 | |
| 28,500 | | Tele Norte Leste Participacoes SA, ADR | | | 309,225 | |
| 36,100 | | Vale SA, ADR | | | 917,301 | |
| 43,600 | | Vale SA (Preference) (Class A Stock), ADR(a) | | | 1,028,960 | |
| | | | | | |
| | | | | 5,540,983 | |
| |
Chile 0.2% | | | | |
| 8,800 | | Cia Cervecerias Unidas SA, ADR(a) | | | 504,064 | |
| |
China 0.4% | | | | |
| 357,500 | | Bank of Communications Co. Ltd. (Class H Stock) | | | 245,700 | |
| 254,000 | | China Petroleum & Chemical Corp. (Class H Stock) | | | 240,216 | |
| 583,000 | | Longfor Properties Co. Ltd. | | | 747,230 | |
| | | | | | |
| | | | | 1,233,146 | |
| |
Denmark 0.9% | | | | |
| 13 | | A.P. Moller - Maersk A/S (Class A Stock) | | | 83,697 | |
| 55 | | A.P. Moller - Maersk A/S (Class B Stock) | | | 371,953 | |
| 4,943 | | Coloplast A/S (Class B Stock) | | | 718,820 | |
| 14,060 | | Novo Nordisk A/S (Class B Stock) | | | 1,492,700 | |
| | | | | | |
| | | | | 2,667,170 | |
| |
Egypt | | | | |
| 1,203 | | Orascom Construction Industries, GDR | | | 49,323 | |
| |
Finland 0.9% | | | | |
| 9,095 | | Kone OYJ (Class B Stock) | | | 500,742 | |
| 7,461 | | Orion OYJ (Class B Stock) | | | 155,263 | |
| 26,376 | | Pohjola Bank PLC (Class A Stock) | | | 303,282 | |
| 28,023 | | Sampo OYJ (Class A Stock) | | | 770,267 | |
| 160,177 | | Stora Enso OYJ (Class R Stock) | | | 1,013,862 | |
| | | | | | |
| | | | | 2,743,416 | |
| |
France 8.3% | | | | |
| 82,176 | | AXA SA | | | 1,321,714 | |
See Notes to Financial Statements.
| | |
| 12 | | Visit our website at www.prudentialfunds.com |
| | | | | | |
| Shares | | Description | | Value (Note 1) | |
| | | | | | |
COMMON STOCKS (Continued) | | | | |
| |
France (cont’d.) | | | | |
| 27,760 | | BNP Paribas SA | | $ | 1,239,620 | |
| 8,302 | | Bouygues SA | | | 310,069 | |
| 1,464 | | Casino Guichard Perrachon SA | | | 137,085 | |
| 6,575 | | Christian Dior SA | | | 927,626 | |
| 19,383 | | Cie Generale des Etablissements Michelin (Class B Stock) | | | 1,403,527 | |
| 28,201 | | France Telecom SA | | | 507,021 | |
| 4,964 | | GDF Suez | | | 139,849 | |
| 414,954 | | Natixis | | | 1,315,093 | |
| 39,640 | | Peugeot SA | | | 862,499 | |
| 584 | | Remy Cointreau SA | | | 47,843 | |
| 62,356 | | Safran SA | | | 2,036,300 | |
| 60,644 | | Sanofi | | | 4,338,413 | |
| 27,629 | | Schneider Electric SA | | | 1,622,366 | |
| 23,118 | | Societe Generale SA | | | 661,909 | |
| 300 | | Societe Internationale de Plantations d’Heveas SA | | | 32,808 | |
| 4,616 | | Technip SA | | | 436,475 | |
| 98,622 | | Total SA | | | 5,145,824 | |
| 9,217 | | Vinci SA | | | 451,987 | |
| 83,636 | | Vivendi SA | | | 1,868,966 | |
| | | | | | |
| | | | | 24,806,994 | |
| |
Germany 7.0% | | | | |
| 19,732 | | Allianz SE | | | 2,195,425 | |
| 44,521 | | BASF SE | | | 3,249,848 | |
| 12,823 | | Bayer AG | | | 816,979 | |
| 10,397 | | Bayerische Motoren Werke AG | | | 844,591 | |
| 59,652 | | Commerzbank AG(b) | | | 145,655 | |
| 20,586 | | Daimler AG | | | 1,045,544 | |
| 49,967 | | Deutsche Bank AG | | | 2,066,064 | |
| 24,501 | | Deutsche Lufthansa AG | | | 332,884 | |
| 38,148 | | Deutsche Post AG | | | 578,649 | |
| 83,275 | | E.ON AG | | | 2,008,175 | |
| 37,086 | | Hannover Rueckversicherung AG | | | 1,825,913 | |
| 4,597 | | Henkel AG & Co. KGaA | | | 224,471 | |
| 12,365 | | Lanxess AG | | | 722,190 | |
| 24,802 | | RWE AG | | | 1,057,233 | |
| 9,999 | | SAP AG | | | 604,619 | |
| 26,054 | | Siemens AG | | | 2,731,004 | |
| 12,070 | | Suedzucker AG | | | 352,567 | |
See Notes to Financial Statements.
| | | | |
| Prudential International Equity Fund | | | 13 | |
Portfolio of Investments
as of October 31, 2011 continued
| | | | | | |
| Shares | | Description | | Value (Note 1) | |
| | | | | | |
COMMON STOCKS (Continued) | | | | |
| |
Germany (cont’d.) | | | | |
| 799 | | Volkswagen AG | | $ | 124,951 | |
| | | | | | |
| | | | | 20,926,762 | |
| |
Hong Kong 4.9% | | | | |
| 336,000 | | Agile Property Holdings Ltd. | | | 302,862 | |
| 459,000 | | Agricultural Bank of China Ltd. (Class H Stock) | | | 206,006 | |
| 81,500 | | ASM Pacific Technology Ltd. | | | 894,942 | |
| 524,000 | | Belle International Holdings Ltd. | | | 1,027,683 | |
| 44,200 | | Cheung Kong Holdings Ltd. | | | 547,900 | |
| 92,000 | | Cheung Kong Infrastructure Holdings Ltd. | | | 492,818 | |
| 288,000 | | China Citic Bank Corp. Ltd. (Class H Stock) | | | 154,723 | |
| 208,000 | | China Overseas Land & Investment Ltd. | | | 384,881 | |
| 331,000 | | China Shanshui Cement Group Ltd. | | | 253,538 | |
| 55,000 | | CNOOC Ltd. | | | 103,970 | |
| 1,673,000 | | Country Garden Holdings Co. Ltd. | | | 662,404 | |
| 1,211,000 | | Evergrande Real Estate Group Ltd. | | | 523,720 | |
| 444,000 | | Franshion Properties (China) Ltd. | | | 91,194 | |
| 350,000 | | Galaxy Entertainment Group Ltd.(b) | | | 707,817 | |
| 380,750 | | Great Wall Motor Co. Ltd. (Class H Stock) | | | 517,025 | |
| 272,800 | | Guangzhou R&F Properties Co. Ltd. (Class H Stock) | | | 265,083 | |
| 40,500 | | Kerry Properties Ltd. | | | 148,632 | |
| 128,000 | | KWG Property Holding Ltd. | | | 55,209 | |
| 600,000 | | Lenovo Group Ltd. | | | 403,383 | |
| 366,500 | | Lifestyle International Holdings Ltd. | | | 981,135 | |
| 195,000 | | Orient Overseas International Ltd. | | | 880,082 | |
| 225,600 | | Sands China Ltd.(b) | | | 677,970 | |
| 71,000 | | Shanghai Industrial Holdings Ltd. | | | 232,457 | |
| 192,000 | | Singamas Container Holdings Ltd. | | | 43,352 | |
| 1,002,000 | | SJM Holdings Ltd. | | | 1,717,483 | |
| 226,900 | | Wheelock & Co. Ltd. | | | 666,652 | |
| 657,600 | | Wynn Macau Ltd. | | | 1,842,515 | |
| | | | | | |
| | | | | 14,785,436 | |
| |
India | | | | |
| 3,000 | | Dr. Reddy’s Laboratories Ltd., ADR(a) | | | 99,450 | |
| |
Israel 0.3% | | | | |
| 16,492 | | Bank Hapoalim BM | | | 63,924 | |
| 17,500 | | Israel Chemicals Ltd. | | | 207,509 | |
| 9,177 | | NICE Systems Ltd.(b) | | | 326,827 | |
See Notes to Financial Statements.
| | |
| 14 | | Visit our website at www.prudentialfunds.com |
| | | | | | |
| Shares | | Description | | Value (Note 1) | |
| | | | | | |
COMMON STOCKS (Continued) | | | | |
| |
Israel (cont’d.) | | | | |
| 7,370 | | Teva Pharmaceutical Industries Ltd. | | $ | 300,463 | |
| 3,400 | | Teva Pharmaceutical Industries Ltd., ADR | | | 138,890 | |
| | | | | | |
| | | | | 1,037,613 | |
| |
Italy 2.7% | | | | |
| 532,092 | | Enel SpA | | | 2,510,463 | |
| 94,578 | | ENI SpA | | | 2,090,544 | |
| 139,556 | | Pirelli & C. SpA | | | 1,231,639 | |
| 21,197 | | Snam Rete Gas SpA | | | 103,615 | |
| 1,000,000 | | Telecom Italia SpA | | | 1,244,277 | |
| 852,592 | | Telecom Italia SpA-RSP | | | 894,759 | |
| | | | | | |
| | | | | 8,075,297 | |
| |
Japan 20.0% | | | | |
| 98,200 | | AEON Co. Ltd. | | | 1,284,332 | |
| 2,300 | | Ain Pharmaciez, Inc. | | | 94,583 | |
| 253,000 | | All Nippon Airways Co. Ltd. | | | 761,782 | |
| 193,000 | | Aozora Bank Ltd. | | | 487,909 | |
| 6,400 | | Arisawa Manufacturing Co. Ltd. | | | 29,061 | |
| 261,200 | | Asahi Kasei Corp. | | | 1,549,004 | |
| 21,600 | | Bridgestone Corp. | | | 506,457 | |
| 39,800 | | Canon, Inc. | | | 1,806,833 | |
| 210 | | Central Japan Railway Co. | | | 1,786,474 | |
| 18,000 | | Chiyoda Corp. | | | 207,283 | |
| 105,000 | | Cosmo Oil Co. Ltd. | | | 262,677 | |
| 153,000 | | Daido Steel Co. Ltd. | | | 927,141 | |
| 97,000 | | Daiwa House Industry Co. Ltd. | | | 1,215,496 | |
| 35,500 | | Dena Co. Ltd. | | | 1,532,237 | |
| 63 | | Dr. Ci:Labo Co. Ltd. | | | 338,963 | |
| 24,400 | | East Japan Railway Co. | | | 1,479,332 | |
| 16,100 | | FANUC Corp. | | | 2,603,213 | |
| 100 | | Fujitsu Ltd. | | | 535 | |
| 30,000 | | Gree, Inc. | | | 968,075 | |
| 17,100 | | Hamamatsu Photonics KK | | | 650,604 | |
| 483,100 | | Hitachi Ltd. | | | 2,588,589 | |
| 9,000 | | Hitachi Metals Ltd. | | | 102,071 | |
| 9,800 | | Idemitsu Kosan Co. Ltd. | | | 916,678 | |
| 20,000 | | Isuzu Motors Ltd. | | | 84,776 | |
| 187,200 | | ITOCHU Corp. | | | 1,851,492 | |
| 8,000 | | JGC Corp. | | | 225,377 | |
See Notes to Financial Statements.
| | | | |
| Prudential International Equity Fund | | | 15 | |
Portfolio of Investments
as of October 31, 2011 continued
| | | | | | |
| Shares | | Description | | Value (Note 1) | |
| | | | | | |
COMMON STOCKS (Continued) | | | | |
| |
Japan (cont’d.) | | | | |
| 380,150 | | JX Holdings, Inc. | | $ | 2,214,330 | |
| 18,500 | | Kamigumi Co. Ltd. | | | 161,540 | |
| 57,600 | | Kao Corp. | | | 1,511,099 | |
| 24 | | KDDI Corp. | | | 175,809 | |
| 6,100 | | Konami Corp. | | | 198,774 | |
| 83,500 | | Kuraray Co. Ltd. | | | 1,168,901 | |
| 1,500 | | MACNICA, Inc. | | | 31,696 | |
| 110,722 | | Marubeni Corp. | | | 644,465 | |
| 35,400 | | Marui Group Co. Ltd. | | | 275,208 | |
| 97,000 | | Mitsubishi Chemical Holdings Corp. | | | 588,002 | |
| 50,000 | | Mitsubishi Corp. | | | 1,028,348 | |
| 35,000 | | Mitsubishi Electric Corp. | | | 323,862 | |
| 720,500 | | Mitsubishi UFJ Financial Group, Inc. | | | 3,131,248 | |
| 81,400 | | Mitsui & Co. Ltd. | | | 1,187,994 | |
| 136,000 | | Mitsui Chemicals, Inc. | | | 446,038 | |
| 518,900 | | Mizuho Financial Group, Inc. | | | 726,299 | |
| 5,100 | | Nabtesco Corp. | | | 111,698 | |
| 29,500 | | Namco Bandai Holdings, Inc. | | | 427,738 | |
| 113,900 | | NHK Spring Co. Ltd. | | | 1,042,444 | |
| 65,100 | | Nikon Corp. | | | 1,457,660 | |
| 32,000 | | Nippon Express Co. Ltd. | | | 123,710 | |
| 41,000 | | Nippon Meat Packers, Inc. | | | 511,043 | |
| 80,100 | | Nippon Steel Corp. | | | 208,838 | |
| 55,100 | | Nippon Telegraph & Telephone Corp. | | | 2,826,401 | |
| 88,400 | | Nissan Motor Co. Ltd. | | | 812,816 | |
| 10,000 | | Nisshin Seifun Group, Inc. | | | 122,905 | |
| 17,270 | | ORIX Corp. | | | 1,507,244 | |
| 9,400 | | Otsuka Corp. | | | 652,963 | |
| 4,100 | | Pola Orbis Holdings, Inc. | | | 109,622 | |
| 298,300 | | Resona Holdings, Inc. | | | 1,337,125 | |
| 1,700 | | Sanrio Co. Ltd. | | | 84,003 | |
| 8,900 | | Sega Sammy Holdings, Inc. | | | 193,504 | |
| 27,000 | | Sekisui House Ltd. | | | 241,695 | |
| 9,400 | | Seven & I Holdings Co. Ltd. | | | 250,846 | |
| 344,700 | | Shinsei Bank Ltd. | | | 378,854 | |
| 45,700 | | SoftBank Corp. | | | 1,483,223 | |
| 29,200 | | Sumitomo Corp. | | | 361,530 | |
| 82,200 | | Sumitomo Mitsui Financial Group, Inc. | | | 2,297,615 | |
| 193,000 | | Sumitomo Mitsui Trust Holdings, Inc. | | | 660,470 | |
| 100,000 | | Tokyu Land Corp. | | | 420,965 | |
See Notes to Financial Statements.
| | |
| 16 | | Visit our website at www.prudentialfunds.com |
| | | | | | |
| Shares | | Description | | Value (Note 1) | |
| | | | | | |
COMMON STOCKS (Continued) | | | | |
| |
Japan (cont’d.) | | | | |
| 53,000 | | Toshiba Corp. | | $ | 231,154 | |
| 116,000 | | Tosoh Corp. | | | 377,022 | |
| 4,000 | | Totetsu Kogyo Co. Ltd. | | | 34,246 | |
| 110,000 | | TOTO Ltd. | | | 914,649 | |
| 40,434 | | Toyota Motor Corp. | | | 1,342,440 | |
| 16,800 | | Toyota Tsusho Corp. | | | 265,109 | |
| 15,700 | | UNY Co. Ltd. | | | 141,625 | |
| 17,600 | | Valor Co. Ltd. | | | 261,760 | |
| 6,200 | | West Japan Railway Co. | | | 262,716 | |
| 6,080 | | Yamada Denki Co. Ltd. | | | 437,242 | |
| | | | | | |
| | | | | 59,967,462 | |
| |
Mexico 0.3% | | | | |
| 32,800 | | America Movil SAB de CV, (Ser. L), ADR(a) | | | 833,776 | |
| |
Netherlands 5.0% | | | | |
| 6,808 | | ASML Holding NV | | | 285,589 | |
| 3,417 | | Delta Lloyd NV | | | 60,001 | |
| 4,651 | | Heineken Holding NV | | | 198,966 | |
| 265,354 | | ING Groep NV(b) | | | 2,287,611 | |
| 111,784 | | Koninklijke Ahold NV | | | 1,428,193 | |
| 91,290 | | Koninklijke KPN NV | | | 1,195,253 | |
| 61,723 | | PostNL NV | | | 312,528 | |
| 112,445 | | Royal Dutch Shell PLC (Class A Stock) | | | 3,983,325 | |
| 103,366 | | Royal Dutch Shell PLC (Class B Stock) | | | 3,708,576 | |
| 22,023 | | SBM Offshore NV | | | 483,898 | |
| 27,412 | | Unilever NV | | | 946,363 | |
| | | | | | |
| | | | | 14,890,303 | |
| |
Norway 0.3% | | | | |
| 37,944 | | DnB NOR ASA | | | 438,898 | |
| 15,071 | | Statoil ASA | | | 382,413 | |
| 1,118 | | Yara International ASA | | | 52,869 | |
| | | | | | |
| | | | | 874,180 | |
| |
Portugal 0.3% | | | | |
| 86,277 | | EDP Renovaveis SA(b) | | | 515,394 | |
| 22,116 | | Jeronimo Martins SGPS SA | | | 379,242 | |
| | | | | | |
| | | | | 894,636 | |
See Notes to Financial Statements.
| | | | |
| Prudential International Equity Fund | | | 17 | |
Portfolio of Investments
as of October 31, 2011 continued
| | | | | | |
| Shares | | Description | | Value (Note 1) | |
| | | | | | |
COMMON STOCKS (Continued) | | | | |
| |
Russia 1.0% | | | | |
| 9,147 | | MMC Norilsk Nickel OJSC, ADR | | $ | 176,080 | |
| 3,549 | | NovaTek OAO, GDR | | | 495,184 | |
| 11,832 | | Sberbank of Russia, ADR | | | 127,194 | |
| 16,457 | | Severstal OAO, GDR | | | 240,359 | |
| 3,628 | | Sistema JSFC, GDR | | | 61,767 | |
| 44,021 | | Uralkali OJSC, GDR | | | 1,896,947 | |
| | | | | | |
| | | | | 2,997,531 | |
| |
Singapore 1.7% | | | | |
| 98,000 | | China Minzhong Food Corp. Ltd.(b) | | | 80,785 | |
| 74,000 | | Golden Agri-Resources Ltd. | | | 37,882 | |
| 33,000 | | Jardine Cycle & Carriage Ltd. | | | 1,186,287 | |
| 21,400 | | SembCorp Industries Ltd. | | | 70,554 | |
| 79,000 | | StarHub Ltd. | | | 176,819 | |
| 88,000 | | STX OSV Holdings Ltd. | | | 77,869 | |
| 226,300 | | UOL Group Ltd. | | | 800,025 | |
| 353,000 | | Wilmar International Ltd. | | | 1,524,193 | |
| 1,413,000 | | Yangzijiang Shipbuilding Holdings Ltd. | | | 1,046,585 | |
| | | | | | |
| | | | | 5,000,999 | |
| |
South Africa 0.4% | | | | |
| 18,500 | | AngloGold Ashanti Ltd., ADR | | | 836,385 | |
| 800 | | Kumba Iron Ore Ltd., ADR | | | 47,544 | |
| 10,200 | | Sasol Ltd., ADR | | | 461,448 | |
| | | | | | |
| | | | | 1,345,377 | |
| |
South Korea 1.1% | | | | |
| 2,220 | | Hyundai Motor Co., GDR(b) | | | 68,046 | |
| 6,500 | | KB Financial Group, Inc., ADR(a) | | | 253,825 | |
| 114,200 | | LG Display Co. Ltd., ADR | | | 1,148,852 | |
| 1,950 | | Samsung Electronics Co. Ltd., GDR | | | 851,651 | |
| 400 | | Samsung Electronics Co. Ltd., GDR, PFD | | | 115,503 | |
| 9,500 | | Shinhan Financial Group Co. Ltd., ADR | | | 756,200 | |
| 2,300 | | SK Telecom Co. Ltd., ADR | | | 34,017 | |
| | | | | | |
| | | | | 3,228,094 | |
| |
Spain 3.0% | | | | |
| 4,662 | | Amadeus IT Holding SA (Class A Stock) | | | 87,862 | |
| 149,474 | | Banco Bilbao Vizcaya Argentaria SA | | | 1,345,254 | |
| 172,100 | | Banco Santander SA | | | 1,456,631 | |
See Notes to Financial Statements.
| | |
| 18 | | Visit our website at www.prudentialfunds.com |
| | | | | | |
| Shares | | Description | | Value (Note 1) | |
| | | | | | |
COMMON STOCKS (Continued) | | | | |
| |
Spain (cont’d.) | | | | |
| 5,604 | | Enagas SA | | $ | 110,194 | |
| 41,974 | | Gas Natural SDG SA | | | 780,209 | |
| 185,000 | | Iberdrola SA | | | 1,338,470 | |
| 922 | | Inditex SA | | | 83,699 | |
| 29,550 | | Mapfre SA | | | 107,974 | |
| 12,161 | | Red Electrica Corp. SA | | | 585,835 | |
| 149,184 | | Telefonica SA | | | 3,170,401 | |
| | | | | | |
| | | | | 9,066,529 | |
| |
Sweden 1.9% | | | | |
| 9,743 | | Atlas Copco AB (Class A Stock) | | | 211,808 | |
| 4,271 | | Axis Communications AB | | | 94,875 | |
| 230,478 | | Nordea Bank AB | | | 2,092,942 | |
| 6,096 | | Scania AB (Class B Stock) | | | 102,291 | |
| 290,700 | | Skandinaviska Enskilda Banken AB (Class A Stock) | | | 1,822,372 | |
| 14,635 | | SKF AB (Class B Stock) | | | 324,341 | |
| 5,671 | | Telefonaktiebolaget LM Ericsson (Class B Stock) | | | 59,112 | |
| 68,058 | | Volvo AB (Class B Stock) | | | 847,097 | |
| | | | | | |
| | | | | 5,554,838 | |
| |
Switzerland 7.2% | | | | |
| 26,594 | | ABB Ltd. | | | 500,643 | |
| 7,604 | | Aryzta AG | | | 366,651 | |
| 29,385 | | Cie Financiere Richemont SA | | | 1,673,905 | |
| 7,539 | | Credit Suisse Group AG | | | 217,433 | |
| 1,665 | | Geberit AG | | | 340,988 | |
| 7 | | Lindt & Spruengli AG | | | 257,769 | |
| 67,722 | | Nestle SA | | | 3,916,884 | |
| 83,696 | | Novartis AG | | | 4,715,038 | |
| 43,026 | | OC Oerlikon Corp. AG(b) | | | 257,655 | |
| 26,030 | | Roche Holding AG | | | 4,270,727 | |
| 1,011 | | Swatch Group AG (The) (Bearer) | | | 425,617 | |
| 15,007 | | Swatch Group AG (The) (Registered) | | | 1,106,621 | |
| 5,691 | | Swiss Life Holding AG | | | 698,953 | |
| 64,283 | | UBS AG(b) | | | 812,422 | |
| 8,565 | | Zurich Financial Services AG | | | 1,973,749 | |
| | | | | | |
| | | | | 21,535,055 | |
See Notes to Financial Statements.
| | | | |
| Prudential International Equity Fund | | | 19 | |
Portfolio of Investments
as of October 31, 2011 continued
| | | | | | |
| Shares | | Description | | Value (Note 1) | |
| | | | | | |
COMMON STOCKS (Continued) | | | | |
| |
Taiwan 0.2% | | | | |
| 3,000 | | Chunghwa Telecom Co. Ltd., ADR | | $ | 100,890 | |
| 27,800 | | Taiwan Semiconductor Manufacturing Co. Ltd., ADR(a) | | | 350,836 | |
| | | | | | |
| | | | | 451,726 | |
| |
Thailand 1.0% | | | | |
| 450,000 | | Charoen Pokphand Foods PCL | | | 442,683 | |
| 582,700 | | CP ALL PCL | | | 890,631 | |
| 100,400 | | Kasikornbank PCL | | | 405,469 | |
| 42,900 | | Kasikornbank PCL, NVDR | | | 171,036 | |
| 1,350,000 | | Krung Thai Bank PCL | | | 667,317 | |
| 10,000 | | PTT PCL | | | 93,171 | |
| 59,200 | | Siam Commercial Bank PCL | | | 218,029 | |
| 15,300 | | Thai Oil PCL, NVDR | | | 28,632 | |
| | | | | | |
| | | | | 2,916,968 | |
| |
United Kingdom 18.7% | | | | |
| 306,318 | | 3i Group PLC | | | 1,009,578 | |
| 29,110 | | Anglo American PLC | | | 1,067,186 | |
| 81,542 | | AstraZeneca PLC | | | 3,914,758 | |
| 243,454 | | Aviva PLC | | | 1,328,177 | |
| 22,932 | | Babcock International Group PLC | | | 259,167 | |
| 284,803 | | BAE Systems PLC | | | 1,262,998 | |
| 198,008 | | Balfour Beatty PLC | | | 798,804 | |
| 8,030 | | BG Group PLC | | | 174,122 | |
| 110,232 | | BHP Billiton PLC | | | 3,471,145 | |
| 544,292 | | BP PLC | | | 4,005,350 | |
| 86,871 | | British American Tobacco PLC | | | 3,983,058 | |
| 158,970 | | BT Group PLC | | | 479,648 | |
| 10,000 | | Burberry Group PLC | | | 214,676 | |
| 119,574 | | Diageo PLC | | | 2,474,673 | |
| 42,892 | | Fresnillo PLC | | | 1,162,842 | |
| 145,199 | | GlaxoSmithKline PLC | | | 3,258,604 | |
| 320,689 | | HSBC Holdings PLC | | | 2,798,107 | |
| 44,612 | | Imperial Tobacco Group PLC | | | 1,625,075 | |
| 83,859 | | Invensys PLC | | | 303,383 | |
| 1,207,482 | | ITV PLC(b) | | | 1,237,207 | |
| 272,224 | | Kingfisher PLC | | | 1,127,848 | |
| 1,461,828 | | Legal & General Group PLC | | | 2,575,168 | |
| 47,450 | | National Grid PLC | | | 471,749 | |
| 55,000 | | Next PLC | | | 2,254,237 | |
See Notes to Financial Statements.
| | |
| 20 | | Visit our website at www.prudentialfunds.com |
| | | | | | |
| Shares | | Description | | Value (Note 1) | |
| | | | | | |
COMMON STOCKS (Continued) | | | | |
| |
United Kingdom (cont’d.) | | | | |
| 1,058,609 | | Old Mutual PLC | | $ | 1,861,173 | |
| 2,814 | | Petrofac Ltd. | | | 64,640 | |
| 5,914 | | Randgold Resources Ltd. | | | 646,798 | |
| 43,292 | | Reckitt Benckiser Group PLC | | | 2,222,163 | |
| 168,783 | | Rexam PLC | | | 935,562 | |
| 50,392 | | Rio Tinto PLC | | | 2,726,149 | |
| 5,950 | | SSE PLC | | | 128,557 | |
| 23,477 | | Tesco PLC | | | 151,366 | |
| 23,833 | | TUI Travel PLC | | | 65,217 | |
| 54,052 | | Unilever PLC | | | 1,811,829 | |
| 1,547,333 | | Vodafone Group PLC | | | 4,296,452 | |
| | | | | | |
| | | | | 56,167,466 | |
| |
United States 0.3% | | | | |
| 7,767 | | Millicom International Cellular SA | | | 856,595 | |
| | | | | | |
| | Total common stocks
(cost $280,423,261) | | | 294,426,584 | |
| | | | | | |
EXCHANGE TRADED FUNDS 0.2% | | | | |
| |
United States | | | | |
| 7,500 | | iShares MSCI Emerging Markets Index Fund(a) | | | 306,000 | |
| 7,500 | | Vanguard MSCI Emerging Markets ETF | | | 311,175 | |
| | | | | | |
| | Total exchange traded funds
(cost $628,125) | | | 617,175 | |
| | | | | | |
PREFERRED STOCKS 1.0% | | | | |
| |
Germany 1.0% | | | | |
| 2,692 | | Bayerische Motoren Werke AG | | | 146,506 | |
| 15,886 | | Henkel AG & Co. KGaA | | | 944,345 | |
| 4,481 | | Porsche Automobil Holding SE | | | 261,041 | |
| 8,712 | | Volkswagen AG | | | 1,517,192 | |
| | | | | | |
| | Total preferred stocks
(cost $2,690,116) | | | 2,869,084 | |
| | | | | | |
| | Total long-term investments
(cost $283,741,502) | | | 297,912,843 | |
| | | | | | |
See Notes to Financial Statements.
| | | | |
| Prudential International Equity Fund | | | 21 | |
Portfolio of Investments
as of October 31, 2011 continued
| | | | | | |
Principal
Amount (000) | | Description | | Value (Note 1) | |
| | | | | | |
SHORT-TERM INVESTMENTS 1.8% | | | | |
| |
United States Government Security 0.2% | | | | |
| $ 520 | | U.S. Treasury Bills
0.020%, 12/15/11
(cost $519,943)(c)(d) | | $ | 519,984 | |
| | | | | | |
| | |
| Shares | | | | | |
| |
Affiliated Money Market Mutual Fund 1.6% | | | | |
| 4,912,148 | | Prudential Investment Portfolios 2 - Prudential Core Taxable Money Market Fund
(cost $4,912,148; includes $4,911,672 of cash collateral received for securities on loan) (Note 3)(e)(f) | | | 4,912,148 | |
| | | | | | |
| | Total short-term investments
(cost $5,432,091) | | | 5,432,132 | |
| | | | | | |
| | Total Investments 101.2%
(cost $289,173,593; Note 5) | | | 303,344,975 | |
| | Liabilities in excess of other assets(g) (1.2%) | | | (3,603,725 | ) |
| | | | | | |
| | Net Assets 100.0% | | $ | 299,741,250 | |
| | | | | | |
The following abbreviations are used in the portfolio descriptions:
ADR—American Depositary Receipt
ETF—Exchange Traded Fund
GDR—Global Depositary Receipt
NVDR—Non-Voting Depositary Receipt
| (a) | All or a portion of security is on loan. The aggregate market value of such securities, including those sold and pending settlement, is $4,630,905; cash collateral of $4,911,672 (included in liabilities) was received with which the Series purchased highly liquid short-term investments. |
| (b) | Non-income producing security. |
| (c) | Represents security, or a portion thereof, segregated as collateral for financial futures contracts. |
| (d) | Rate quoted represents yield-to-maturity as of purchase date. |
| (e) | Prudential Investments LLC, the manager of the Series, also serves as manager of the Prudential Investment Portfolios 2 - Prudential Core Taxable Money Market Fund. |
| (f) | Represents security, or a portion thereof, purchased with cash collateral received for securities on loan. |
See Notes to Financial Statements.
| | |
| 22 | | Visit our website at www.prudentialfunds.com |
| (g) | Includes net unrealized appreciation (depreciation) on the following derivative contracts held at reporting period end: |
Open futures contracts outstanding at October 31, 2011:
| | | | | | | | | | | | | | | | | | | | |
Number of
Contracts | | | Type | | Expiration
Date | | | Value at
October 31,
2011 | | | Value at
Trade
Date | | | Unrealized
Appreciation | |
| | | | Long Positions: | | | | | | | | | | | | | | | | |
| | 45 | | | DJ Euro Stoxx 50 Index | | | Dec. 2011 | | | $ | 1,486,924 | | | $ | 1,301,409 | | | $ | 185,515 | |
| | 3 | | | FTSE 100 Index | | | Dec. 2011 | | | | 267,160 | | | | 252,455 | | | | 14,705 | |
| | 12 | | | MSCI Taiwan Index | | | Nov. 2011 | | | | 320,880 | | | | 315,900 | | | | 4,980 | |
| | 11 | | | SPI 200 Futures Index | | | Dec. 2011 | | | | 1,241,595 | | | | 1,173,749 | | | | 67,846 | |
| | | | | | | | | | | | | | | | | | | | |
| | | | | | | | | | | | | | | | | | $ | 273,046 | |
| | | | | | | | | | | | | | | | | | | | |
Various inputs are used in determining the value of the Series’ investments. These inputs are summarized in the three broad levels listed below.
Level 1—quoted prices generally for securities actively traded on a regulated securities exchange and for open-end mutual funds which trade at daily net asset value.
Level 2—other significant observable inputs (including, but not limited to, quoted prices for similar securities, interest rates, prepayment speeds, foreign currency exchange rates, and amortized cost) generally for debt securities, swaps, forward foreign currency contracts and for foreign stocks priced using vendor modeling tools.
Level 3—significant unobservable inputs for securities valued in accordance with Board approved fair valuation procedures.
The following is a summary of the inputs used as of October 31, 2011 in valuing such portfolio securities:
| | | | | | | | | | | | |
| | | Level 1 | | | Level 2 | | | Level 3 | |
Investments in Securities | | | | | | | | | | | | |
Common Stocks | | | | | | | | | | | | |
Australia | | $ | — | | | $ | 23,188,130 | | | $ | — | |
Austria | | | — | | | | 745,759 | | | | — | |
Belgium | | | — | | | | 1,441,506 | | | | — | |
See Notes to Financial Statements.
| | | | |
| Prudential International Equity Fund | | | 23 | |
Portfolio of Investments
as of October 31, 2011 continued
| | | | | | | | | | | | |
| | | Level 1 | | | Level 2 | | | Level 3 | |
Common Stocks (continued) | | | | | | | | | | | | |
Brazil | | $ | 5,540,983 | | | $ | — | | | $ | — | |
Chile | | | 504,064 | | | | — | | | | — | |
China | | | — | | | | 1,233,146 | | | | — | |
Denmark | | | — | | | | 2,667,170 | | | | — | |
Egypt | | | 49,323 | | | | — | | | | — | |
Finland | | | — | | | | 2,743,416 | | | | — | |
France | | | — | | | | 24,806,994 | | | | — | |
Germany | | | — | | | | 20,926,762 | | | | — | |
Hong Kong | | | — | | | | 14,785,436 | | | | — | |
India | | | 99,450 | | | | — | | | | — | |
Israel | | | 138,890 | | | | 898,723 | | | | — | |
Italy | | | — | | | | 8,075,297 | | | | — | |
Japan | | | 123,644 | | | | 59,843,818 | | | | — | |
Mexico | | | 833,776 | | | | — | | | | — | |
Netherlands | | | — | | | | 14,890,303 | | | | — | |
Norway | | | — | | | | 874,180 | | | | — | |
Portugal | | | — | | | | 894,636 | | | | — | |
Russia | | | 303,274 | | | | 2,694,257 | | | | — | |
Singapore | | | — | | | | 5,000,999 | | | | — | |
South Africa | | | 1,345,377 | | | | — | | | | — | |
South Korea | | | 3,160,048 | | | | 68,046 | | | | — | |
Spain | | | — | | | | 9,066,529 | | | | — | |
Sweden | | | — | | | | 5,554,838 | | | | — | |
Switzerland | | | — | | | | 21,535,055 | | | | — | |
Taiwan | | | 451,726 | | | | — | | | | — | |
Thailand | | | 2,311,831 | | | | 605,137 | | | | — | |
United Kingdom | | | — | | | | 56,167,466 | | | | — | |
United States | | | — | | | | 856,595 | | | | — | |
Exchange Traded Funds | | | | | | | | | | | | |
United States | | | 617,175 | | | | — | | | | — | |
Preferred Stocks | | | | | | | | | | | | |
Germany | | | — | | | | 2,869,084 | | | | — | |
United States Government Security | | | — | | | | 519,984 | | | | — | |
Affiliated Money Market Mutual Fund | | | 4,912,148 | | | | — | | | | — | |
| | | | | | | | | | | | |
| | | 20,391,709 | | | | 282,953,266 | | | | — | |
Other Financial Instruments* | | | | | | | | | | | | |
Futures Contracts | | | 273,046 | | | | — | | | | — | |
| | | | | | | | | | | | |
Total | | $ | 20,664,755 | | | $ | 282,953,266 | | | $ | — | |
| | | | | | | | | | | | |
| * | Other financial instruments are derivative instruments not reflected in the Portfolio of Investments, such as futures, forwards and swap contracts, which are recorded at the unrealized appreciation/depreciation on the instrument. |
See Notes to Financial Statements.
| | |
| 24 | | Visit our website at www.prudentialfunds.com |
Fair value of Level 2 investments at October 31, 2010 was $0. $255,881,131 was transferred into Level 2 from Level 1 at October 31, 2011 as a result of using third-party vendor modeling tools to reflect any significant market movements between the time at which the Series valued its securities and the earlier closing of foreign markets.
It is the Series’ policy to recognize transfers in and transfers out at the fair value as of the beginning of period.
The industry classification of portfolio holdings and liabilities in excess of other assets shown as a percentage of net assets as of October 31, 2011 were as follows:
| | | | |
Commercial Banks | | | 11.2 | % |
Oil, Gas & Consumable Fuels | | | 8.7 | |
Pharmaceuticals | | | 7.8 | |
Metals & Mining | | | 6.9 | |
Insurance | | | 4.9 | |
Diversified Telecommunication Services | | | 4.3 | |
Food Products | | | 3.5 | |
Chemicals | | | 3.4 | |
Electric Utilities | | | 2.9 | |
Wireless Telecommunication Services | | | 2.6 | |
Automobiles | | | 2.5 | |
Real Estate Management & Development | | | 2.4 | |
Machinery | | | 2.2 | |
Food & Staples Retailing | | | 1.9 | |
Tobacco | | | 1.9 | |
Trading Companies & Distributors | | | 1.8 | |
Hotels, Restaurants & Leisure | | | 1.7 | |
Affiliated Money Market Mutual Fund (including 1.6% of collateral received for securities on loan) | | | 1.6 | |
Diversified Financial Services | | | 1.6 | |
Road & Rail | | | 1.6 | |
Electronic Equipment, Instruments & Components | | | 1.5 | |
Auto Components | | | 1.4 | |
Beverages | | | 1.4 | |
Capital Markets | | | 1.4 | |
Textiles, Apparel & Luxury Goods | | | 1.4 | |
Real Estate Investment Trusts | | | 1.3 | |
Multiline Retail | | | 1.2 | |
Aerospace & Defense | | | 1.1 | |
Household Products | | | 1.1 | |
Industrial Conglomerates | | | 1.0 | |
Specialty Retail | | | 0.9 | |
Electrical Equipment | | | 0.8 | |
Internet Software & Services | | | 0.8 | % |
Semiconductors & Semiconductor Equipment | | | 0.8 | |
Construction & Engineering | | | 0.7 | |
Energy Equipment & Services | | | 0.7 | |
Leisure Equipment & Products | | | 0.7 | |
Personal Products | | | 0.7 | |
Media | | | 0.6 | |
Multi-Utilities | | | 0.6 | |
Office Electronics | | | 0.6 | |
Airlines | | | 0.4 | |
Building Products | | | 0.4 | |
Distributors | | | 0.4 | |
Marine | | | 0.4 | |
Software | | | 0.4 | |
Air Freight & Logistics | | | 0.3 | |
Containers & Packaging | | | 0.3 | |
Gas Utilities | | | 0.3 | |
Paper & Forest Products | | | 0.3 | |
Computers & Peripherals | | | 0.2 | |
Exchange Traded Funds | | | 0.2 | |
Healthcare Equipment & Supplies | | | 0.2 | |
Independent Power Producers & Energy Traders | | | 0.2 | |
IT Services | | | 0.2 | |
United States Government Security | | | 0.2 | |
Water Utilities | | | 0.2 | |
Commercial Services & Supplies | | | 0.1 | |
Communications Equipment | | | 0.1 | |
Construction Materials | | | 0.1 | |
Household Durables | | | 0.1 | |
Transportation Infrastructure | | | 0.1 | |
| | | | |
| | | 101.2 | |
Liabilities in excess of other assets | | | (1.2 | ) |
| | | | |
| | | 100.0 | % |
| | | | |
See Notes to Financial Statements.
| | | | |
| Prudential International Equity Fund | | | 25 | |
Portfolio of Investments
as of October 31, 2011 continued
The Series invested in derivative instruments during the reporting period. The primary type of risk associated with these derivative instruments is equity risk. The effect of such derivative instruments on the Series’ financial position and financial performance as reflected in the Statement of Assets and Liabilities and Statement of Operations is presented in the summary below.
Fair values of derivative instruments as of October 31, 2011 as presented in the Statement of Assets and Liabilities:
| | | | | | | | | | | | |
Derivatives not designated
as hedging instruments,
carried at fair value | | Asset Derivatives | | | Liability Derivatives | |
| | Balance
Sheet Location | | Fair
Value | | | Balance
Sheet Location | | Fair
Value | |
| Equity contracts | | Due to broker—variation margin | | $ | 273,046 | * | | — | | $ | — | |
| | | | | | | | | | | | |
| * | Includes cumulative appreciation/depreciation on futures contracts as reported in Portfolio of Investments. Only unsettled variation margin receivable (payable) is reported within the Statement of Assets and Liabilities. |
The effects of derivative instruments on the Statement of Operations for the year ended October 31, 2011 are as follows:
| | | | | | | | | | | | |
Amount of Realized Gain or (Loss) on Derivatives Recognized in Income | |
Derivatives not designated as hedging
instruments, carried at fair value | | Futures | | | Rights | | | Total | |
Equity contracts | | $ | (899,402 | ) | | $ | 251,130 | | | $ | (648,272 | ) |
| | | | | | | | | | | | |
|
Change in Unrealized Appreciation or (Depreciation) on Derivatives Recognized in Income | |
Derivatives not designated as hedging
instruments, carried at fair value | | Futures | | | Rights | | | Total | |
Equity contracts | | $ | 198,679 | | | $ | (3,661 | ) | | $ | 195,018 | |
| | | | | | | | | | | | |
For the year ended October 31, 2011, the average value at trade date for futures contracts was $3,779,533.
See Notes to Financial Statements.
| | |
| 26 | | Visit our website at www.prudentialfunds.com |
Financial Statements
| | |
| OCTOBER 31, 2011 | | ANNUAL REPORT |
Prudential International Equity Fund
Statement of Assets and Liabilities
as of October 31, 2011
| | | | |
Assets | | | | |
Investments at value, including securities on loan of $4,630,905: | | | | |
Unaffiliated Investments (cost $284,261,445) | | $ | 298,432,827 | |
Affiliated Investments (cost $4,912,148) | | | 4,912,148 | |
Foreign currency, at value (cost $766,571) | | | 776,699 | |
Receivable for investments sold | | | 1,578,807 | |
Dividends and interest receivable | | | 786,042 | |
Foreign tax reclaim receivable | | | 602,338 | |
Receivable for Series shares sold | | | 22,357 | |
Prepaid expenses | | | 5,604 | |
| | | | |
Total assets | | | 307,116,822 | |
| | | | |
| |
Liabilities | | | | |
Payable to broker for collateral for securities on loan (Note 3) | | | 4,911,672 | |
Loan payable | | | 1,354,000 | |
Payable for Series shares reacquired | | | 360,990 | |
Accrued expenses | | | 277,775 | |
Management fee payable | | | 212,519 | |
Affiliated transfer agent fee payable | | | 93,177 | |
Distribution fee payable | | | 83,248 | |
Due to broker—variation margin | | | 82,191 | |
| | | | |
Total liabilities | | | 7,375,572 | |
| | | | |
| |
Net Assets | | $ | 299,741,250 | |
| | | | |
| | | | | |
Net assets were comprised of: | | | | |
Common stock, at par | | $ | 525,232 | |
Paid-in capital in excess of par | | | 531,578,763 | |
| | | | |
| | | 532,103,995 | |
Undistributed net investment income | | | 4,069,143 | |
Accumulated net realized loss on investment and foreign currency transactions | | | (250,936,488 | ) |
Net unrealized appreciation on investments and foreign currencies | | | 14,504,600 | |
| | | | |
Net assets, October 31, 2011 | | $ | 299,741,250 | |
| | | | |
See Notes to Financial Statements.
| | |
| 28 | | Visit our website at www.prudentialfunds.com |
| | | | |
Class A | | | | |
Net asset value and redemption price per share
($214,609,853 ÷ 37,486,838 shares of common stock issued and outstanding) | | $ | 5.72 | |
Maximum sales charge (5.50% of offering price) | | | 0.33 | |
| | | | |
Maximum offering price to public | | $ | 6.05 | |
| | | | |
| |
Class B | | | | |
Net asset value, offering price and redemption price per share
($6,719,458 ÷ 1,221,612 shares of common stock issued and outstanding) | | $ | 5.50 | |
| | | | |
| |
Class C | | | | |
Net asset value, offering price and redemption price per share
($21,309,980 ÷ 3,875,333 shares of common stock issued and outstanding) | | $ | 5.50 | |
| | | | |
| |
Class F | | | | |
Net asset value, offering price and redemption price per share
($1,572,040 ÷ 285,568 shares of common stock issued and outstanding) | | $ | 5.50 | |
| | | | |
| |
Class L | | | | |
Net asset value and redemption price per share
($8,644,344 ÷ 1,509,580 shares of common stock issued and outstanding) | | $ | 5.73 | |
Maximum sales charge (5.75% of offering price) | | | 0.35 | |
| | | | |
Maximum offering price to public | | $ | 6.08 | |
| | | | |
| |
Class M | | | | |
Net asset value, offering price and redemption price per share
($743,156 ÷ 135,109 shares of common stock issued and outstanding) | | $ | 5.50 | |
| | | | |
| |
Class X | | | | |
Net asset value, offering price and redemption price per share
($1,569,382 ÷ 285,347 shares of common stock issued and outstanding) | | $ | 5.50 | |
| | | | |
| |
Class Z | | | | |
Net asset value, offering price and redemption price per share
($44,573,037 ÷ 7,723,850 shares of common stock issued and outstanding) | | $ | 5.77 | |
| | | | |
See Notes to Financial Statements.
| | | | |
| Prudential International Equity Fund | | | 29 | |
Statement of Operations
Year Ended October 31, 2011
| | | | |
Net Investment Income | | | | |
Income | | | | |
Unaffiliated dividend (net of foreign withholding taxes of $1,578,150) | | $ | 10,744,179 | |
Affiliated income from securities loaned, net | | | 82,904 | |
Affiliated dividend income | | | 675 | |
Unaffiliated interest income | | | 665 | |
| | | | |
Total income | | | 10,828,423 | |
| | | | |
| |
Expenses | | | | |
Management fee | | | 2,884,387 | |
Distribution fee—Class A | | | 743,573 | |
Distribution fee—Class B | | | 83,203 | |
Distribution fee—Class C | | | 251,274 | |
Distribution fee—Class F | | | 18,318 | |
Distribution fee—Class L | | | 50,947 | |
Distribution fee—Class M | | | 17,683 | |
Distribution fee—Class X | | | 23,505 | |
Transfer agent’s fees and expenses (including affiliated expense of $431,400) (Note 3) | | | 1,031,000 | |
Custodian’s fees and expenses | | | 279,000 | |
Reports to shareholders | | | 116,000 | |
Registration fees | | | 105,000 | |
Legal fees and expenses | | | 79,000 | |
Audit fee | | | 29,000 | |
Directors’ fees | | | 18,000 | |
Insurance | | | 8,000 | |
Loan interest expense (Note 7) | | | 2,761 | |
Miscellaneous | | | 60,385 | |
| | | | |
Total expenses | | | 5,801,036 | |
| | | | |
Net investment income | | | 5,027,387 | |
| | | | |
|
Realized And Unrealized Gain (Loss) On Investment, Futures And Foreign Currency Transactions | |
Net realized gain (loss) on: | | | | |
Investment transactions | | | 18,199,019 | |
Foreign currency transactions | | | (224,830 | ) |
Financial futures transactions | | | (899,402 | ) |
| | | | |
| | | 17,074,787 | |
| | | | |
Net change in unrealized appreciation (depreciation) on: | | | | |
Investments | | | (40,137,901 | ) |
Foreign currencies | | | (88,091 | ) |
Financial futures contracts | | | 198,679 | |
| | | | |
| | | (40,027,313 | ) |
| | | | |
Net loss on investments and foreign currencies | | | (22,952,526 | ) |
| | | | |
Net Decrease In Net Assets Resulting From Operations | | $ | (17,925,139 | ) |
| | | | |
See Notes to Financial Statements.
| | |
| 30 | | Visit our website at www.prudentialfunds.com |
Statement of Changes in Net Assets
| | | | | | | | |
| | | Year Ended October 31, | |
| | | 2011 | | | 2010 | |
Increase (Decrease) In Net Assets | | | | | | | | |
Operations | | | | | | | | |
Net investment income | | $ | 5,027,387 | | | $ | 7,116,368 | |
Net realized gain (loss) on investment and foreign currency transactions | | | 17,074,787 | | | | (25,360,327 | ) |
Net change in unrealized appreciation (depreciation) on investments and foreign currencies | | | (40,027,313 | ) | | | 31,177,215 | |
| | | | | | | | |
Net increase (decrease) in net assets resulting from operations | | | (17,925,139 | ) | | | 12,933,256 | |
| | | | | | | | |
| | |
Dividends from net investment income (Note 1) | | | | | | | | |
Class A | | | (4,571,474 | ) | | | (4,729,701 | ) |
Class B | | | (110,787 | ) | | | (120,437 | ) |
Class C | | | (320,075 | ) | | | (351,530 | ) |
Class F | | | (47,027 | ) | | | (73,250 | ) |
Class L | | | (171,721 | ) | | | (189,123 | ) |
Class M | | | (33,226 | ) | | | (75,237 | ) |
Class X | | | (35,242 | ) | | | (67,157 | ) |
Class Z | | | (949,745 | ) | | | (4,587,489 | ) |
| | | | | | | | |
| | | (6,239,297 | ) | | | (10,193,924 | ) |
| | | | | | | | |
| | |
Series share transactions (Net of share conversions) (Note 6) | | | | | | | | |
Net proceeds from shares sold | | | 19,235,595 | | | | 46,181,096 | |
Net asset value of shares issued in reinvestment of dividends | | | 6,069,976 | | | | 9,997,085 | |
Cost of shares reacquired | | | (64,297,912 | ) | | | (277,348,125 | ) |
| | | | | | | | |
Net decrease in net assets from Series share transactions | | | (38,992,341 | ) | | | (221,169,944 | ) |
| | | | | | | | |
| | |
Capital Contributions (Note 6) | | | | | | | | |
Proceeds from regulatory settlement | | | 1,399,459 | | | | 4,717,145 | |
| | | | | | | | |
Total decrease | | | (61,757,318 | ) | | | (213,713,467 | ) |
| | |
Net Assets: | | | | | | | | |
Beginning of year | | | 361,498,568 | | | | 575,212,035 | |
| | | | | | | | |
End of year(a) | | $ | 299,741,250 | | | $ | 361,498,568 | |
| | | | | | | | |
(a) Includes undistributed net investment income of: | | $ | 4,069,143 | | | $ | 5,112,695 | |
| | | | | | | | |
See Notes to Financial Statements.
| | | | |
| Prudential International Equity Fund | | | 31 | |
Notes to Financial Statements
Prudential World Fund, Inc. (the “Fund”) is an open-end management investment company, registered under the Investment Company Act of 1940, as amended, (“1940 Act”) and currently consists of three series: Prudential International Equity Fund (the “Series”), Prudential International Value Fund and Prudential Emerging Markets Debt Local Currency Fund. These financial statements relate to the Prudential International Equity Fund. The financial statements of the other series are not presented herein. The Series commenced investment operations in March 2000. The investment objective of the Series is to achieve long-term growth of capital. The Series seeks to achieve its objective primarily through investment in equity-related securities of foreign issuers.
Note 1. Accounting Policies
The following is a summary of significant accounting policies followed by the Fund and the Series in the preparation of its financial statements.
Securities Valuation: Securities listed on a securities exchange (other than options on securities and indices) are valued at the last sale price on such exchange on the day of valuation or, if there was no sale on such day, at the mean between the last reported bid and asked prices, or at the last bid price on such day in the absence of an asked price. Securities traded via NASDAQ are valued at the NASDAQ official closing price (“NOCP”) on the day of valuation, or if there was no NOCP, at the last sale price. Securities that are actively traded in the over-the-counter market, including listed securities for which the primary market is believed by Prudential Investments LLC (“PI” or “Manager”), in consultation with the subadvisors, to be over-the-counter, are valued at market value using prices provided by an independent pricing agent or principal market maker. Options on securities and indices traded on an exchange are valued at the last sale price as of the close of trading on the applicable exchange or, if there was no sale, at the mean between the most recently quoted bid and asked prices on such exchange. Futures contracts and options thereon traded on a commodities exchange or board of trade are valued at the last sale price at the close of trading on such exchange or board of trade or, if there was no sale on the applicable commodities exchange or board of trade on such day, at the mean between the most recently quoted bid and asked prices on such exchange or board of trade or at the last bid price in the absence of an asked price. Prices may be obtained from independent pricing services which use information provided by market makers or estimates of market values obtained from yield data relating to investments or
| | |
| 32 | | Visit our website at www.prudentialfunds.com |
securities with similar characteristics. Securities for which reliable market quotations are not readily available, or whose values have been affected by events occurring after the close of the security’s foreign market and before the Series’ normal pricing time, are valued at fair value in accordance with the Board of Directors’ approved fair valuation procedures. When determining the fair valuation of securities some of the factors influencing the valuation include, the nature of any restrictions on disposition of the securities; assessment of the general liquidity of the securities; the issuer’s financial condition and the markets in which it does business; the cost of the investment; the size of the holding and the capitalization of issuer; the prices of any recent transactions or bids/offers for such securities or any comparable securities; any available analyst media or other reports or information deemed reliable by the investment advisor regarding the issuer or the markets or industry in which it operates. Using fair value to price securities may result in a value that is different from a security’s most recent closing price and from the price used by other mutual funds to calculate their net asset values.
Investments in open-end, non-exchange-traded mutual funds are valued at their net asset value as of the close of the New York Stock Exchange on the date of valuation.
Short-term debt securities of sufficient credit quality, which mature in 60 days or less, are valued at amortized cost, which approximates market value. The amortized cost method includes valuing a security at its cost on the date of purchase and thereafter assuming a constant amortization to maturity of the difference between the principal amount due at maturity and cost. Short-term debt securities, which mature in more than 60 days, are valued at fair value.
Securities Lending: The Series may lend its portfolio securities to broker-dealers. The loans are secured by collateral, at least equal, at all times to the market value of the securities loaned. Loans are subject to termination at the option of the borrower or the Series. Upon termination of the loan, the borrower will return to the lender securities identical to the loaned securities. Should the borrower of the securities fail financially, the Series has the right to repurchase the securities using the collateral in the open market. The Series recognizes income, net of any rebate and securities lending agent fees, for lending its securities in the form of fees or interest on the investment of any cash received as collateral. The Series also continues to receive interest and dividends or amounts equivalent thereto, on the securities loaned and recognizes any unrealized gain or loss in the market price of the securities loaned that may occur during the term of the loan.
| | | | |
| Prudential International Equity Fund | | | 33 | |
Notes to Financial Statements
continued
Foreign Currency Translation: The books and records of the Series are maintained in U.S. dollars. Foreign currency amounts are translated into U.S. dollars on the following basis:
(i) market value of investment securities, other assets and liabilities-at the current rates of exchange.
(ii) purchases and sales of investment securities, income and expenses-at the rate of exchange prevailing on the respective dates of such transactions.
The Series does not isolate that portion of the results of operations arising as a result of changes in the foreign exchange rates from the fluctuations arising from changes in the market prices of long term securities held at the end of the fiscal year. Similarly, the Series does not isolate the effect of changes in foreign exchange rates from the fluctuations arising from changes in the market prices of portfolio securities sold during the fiscal year. Accordingly, realized foreign currency gains or losses are included in the reported net realized gains or losses on investment transactions.
Net realized gains or losses on foreign currency transactions represent net foreign exchange gains or losses from holdings of foreign currencies, currency gains or losses realized between the trade and settlement dates on security transactions, and the difference between the amounts of dividends, interest and foreign withholding taxes recorded on the Series’ books and the U.S. dollar equivalent amounts actually received or paid. Net unrealized currency gains or losses from valuing foreign currency denominated assets and liabilities (other than investments) at fiscal year end exchange rates are reflected as a component of net unrealized appreciation (depreciation) on foreign currencies.
Foreign security and currency transactions may involve certain considerations and risks not typically associated with those of domestic origin as a result of, among other factors, the possibility of political or economic instability, or the level of governmental supervision and regulation of foreign securities markets.
Securities Transactions and Net Investment Income: Securities transactions are recorded on the trade date. Realized gains or losses from security and currency transactions are calculated on the identified cost basis. Dividend income is recorded on the ex-dividend date and interest income is recorded on an accrual basis. Expenses are recorded on the accrual basis. Net investment income or loss (other than
| | |
| 34 | | Visit our website at www.prudentialfunds.com |
distribution fees which are charged directly to the respective class) and unrealized and realized gains or losses are allocated daily to each class of shares based upon the relative proportion of net assets of each class at the beginning of the day.
Financial Futures Contracts: A financial futures contract is an agreement to purchase (long) or sell (short) an agreed amount of securities at a set price for delivery on a future date. Upon entering into a financial futures contract, the Series is required to pledge to the broker an amount of cash and/or other assets equal to a certain percentage of the contract amount. This amount is known as the “initial margin.” Subsequent payments, known as “variation margin,” are made or received by the Series each day, depending on the daily fluctuations in the value of the underlying security. Such variation margin is recorded for financial statement purposes on a daily basis as unrealized gain or loss. When the contract expires or is closed, the gain or loss is realized and is presented in the Statement of Operations as net realized gain or loss on financial futures transactions. The Series invested in financial futures contracts in order to hedge its existing portfolio securities, or securities the Series intends to purchase, against fluctuations in value caused by changes in prevailing interest rates, value of equities or foreign currency exchange rates. Should interest rates move unexpectedly, the Series may not achieve the anticipated benefits of the financial futures contracts and may realize a loss. The use of futures transactions involves the risk of imperfect correlation in movements in the price of futures contracts, interest rates and the underlying hedged assets.
Financial futures contracts involve elements of both risk in excess of the amounts reflected on the Statement of Assets and Liabilities.
With exchange-traded futures, there is a minimal counterparty credit risk to the Series since the exchanges’ clearinghouse acts as counterparty to all exchange traded futures and guarantees the futures contracts against default.
Dividends and Distributions: The Series expects to pay dividends of net investment income and distributions of net realized capital and currency gains, if any, annually. Dividends and distributions to shareholders, which are determined in accordance with federal income tax regulations which may differ from generally accepted accounting principles, are recorded on the ex-dividend date.
Taxes: For federal income tax purposes, each Series in the Fund is treated as a separate taxpaying entity. It is each Series’ policy to continue to meet the requirements of the Internal Revenue Code applicable to regulated investment companies and to distribute all of its taxable net investment income and capital gains, if any, to its shareholders. Therefore, no federal income tax provision is required.
| | | | |
| Prudential International Equity Fund | | | 35 | |
Notes to Financial Statements
continued
Withholding taxes on foreign dividends are recorded net of reclaimable amounts, at the time the related income is earned.
Estimates: The preparation of the financial statements requires management to make estimates and assumptions that affect the reported amounts and disclosures in the financial statements. Actual results could differ from those estimates.
Note 2. Agreements
The Fund has a management agreement for the Series with PI. Pursuant to this agreement, PI has responsibility for all investment advisory services and supervises the subadvisor’s performance of such services. PI entered into a subadvisory agreement with Quantitative Management Associates LLC (“QMA”). The subadvisory agreement provides that QMA furnishes investment advisory services in connection with the management of the Series. In connection therewith, QMA is obligated to keep certain books and records of the Series. PI pays for the services of QMA, the cost of compensation of officers of the Series, occupancy and certain clerical and bookkeeping costs of the Series. The Series bears all other costs and expenses.
The management fee paid to PI is computed daily and payable monthly, at an annual rate of .85% of the average daily net assets of the Series up to and including $300 million, .75% of the average daily net assets in excess of $300 million up to and including $1.5 billion and .70% of the Series’ average daily net assets over $1.5 billion. The effective management fee was .84% for the year ended October 31, 2011.
The Series has distribution agreements with Prudential Investment Management Services LLC (“PIMS”) and Prudential Annuities Distributors, Inc. (“PAD”). PIMS and PAD are both affiliates of PI and indirect, wholly-owned subsidiaries of Prudential. PIMS serves as the distributor of the Series’ Class A, Class B, Class C, Class F, and Class Z shares. PIMS, together with PAD, serves as co-distributor of the Fund’s Class L, Class M, and Class X shares.
The Series has adopted a separate Distribution and Service plan (each a “Plan” and collectively the “Plans”) for the Class A, Class B, Class C, Class F, Class L, Class M, and Class X shares of the Series in accordance with Rule 12b-1 of the 1940 Act, as amended. No distribution or service fees are paid to PIMS as distributor for the Series’ Class Z shares.
| | |
| 36 | | Visit our website at www.prudentialfunds.com |
Under the Plans, the Fund compensates PIMS and PAD a distribution and service fee at the annual rate of .30%, 1.00%, 1.00%, .75%, .50%, 1.00%, and 1.00% of the average daily net assets of the Class A, B, C, L, M, and X shares, respectively.
PIMS has advised the Series that they received $62,919 in front-end sales charges resulting from sales of Class A shares during the year ended October 31, 2011. From these fees, PIMS paid such sales charges to broker-dealers, which in turn paid commissions to salespersons and incurred other distribution costs.
PIMS has advised the Series that for the year ended October 31, 2011 it received $147, $17,302, $427, $2,517, $423 and $526 in contingent deferred sales charges imposed upon redemptions by certain Class A, Class B, Class C, Class F, Class M and Class X shareholders, respectively.
PI, QMA and PIMS are indirect, wholly-owned subsidiaries of Prudential Financial, Inc. (“Prudential”).
Note 3. Other Transactions with Affiliates
Prudential Mutual Fund Services LLC (“PMFS”), an affiliate of PI and an indirect, wholly-owned subsidiary of Prudential, serves as the Series’ transfer agent. Transfer agent’s fees and expenses in the Statement of Operations include certain out-of-pocket expenses paid to non-affiliates, where applicable.
Prudential Investment Management, Inc. (“PIM”), an indirect, wholly-owned subsidiary of Prudential, is the Series’ security lending agent. For the year ended October 31, 2011, PIM has been compensated approximately $24,600 for these services.
The Series invests in the Prudential Core Taxable Money Market Fund (the “Core Fund”), a series of the Prudential Investment Portfolios 2, registered under the 1940 Act, and managed by PI. Earnings from the Core Fund are disclosed on the Statement of Operations as affiliated dividend income.
Note 4. Portfolio Securities
Purchases and sales of investment securities, other than short-term investments, for the year ended October 31, 2011 aggregated $238,958,861 and $277,315,736, respectively.
| | | | |
| Prudential International Equity Fund | | | 37 | |
Notes to Financial Statements
continued
Note 5. Distributions and Tax Information
Distributions to shareholders, which are determined in accordance with federal income tax regulations and which may differ from generally accepted accounting principles, are recorded on the ex-dividend date. In order to present undistributed net investment income, accumulated net realized loss on investment and foreign currency transactions and paid-in capital in excess of par on the Statement of Assets and Liabilities that more closely represent their tax character, certain adjustments have been made to undistributed net investment income and accumulated net realized loss on investment and foreign currency transactions. For the fiscal year ended October 31, 2011, the adjustments were to increase undistributed net investment income and to increase accumulated net realized loss on investments and foreign currency transactions by $168,358, due to the differences in the treatment for book and tax purposes of certain transactions involving foreign securities and currencies and investments in passive foreign investment companies. Net investment income, net realized gain (loss) on investment, futures and foreign currency transactions and net assets were not affected by this change.
For the years ended October 31, 2011 and 2010 the tax character of dividends paid as reflected in the Statement of Changes in Net Assets were $6,239,297 and $10,193,924 of ordinary income, respectively.
As of October 31, 2011, the Series had undistributed ordinary income of $4,555,242 on a tax basis.
The United States federal income tax basis of the Series’ investments and the net unrealized appreciation as of October 31, 2011 were as follows:
| | | | | | | | | | |
Tax Basis | | Appreciation | | Depreciation | | Net
Unrealized
Appreciation | | Other Cost
Basis
Adjustments | | Total Net
Unrealized
Appreciation |
| $297,097,983 | | $37,636,284 | | $(31,389,292) | | $6,246,992 | | $318,513 | | $6,565,505 |
The difference between book basis and tax basis were primarily attributable to deferred losses on wash sales and investments in passive foreign investment companies. The other cost basis adjustments are primarily attributable to appreciation (depreciation) of foreign currency, futures and mark-to-market of receivables and payables.
| | |
| 38 | | Visit our website at www.prudentialfunds.com |
For federal income tax purposes, the Series has a capital loss carryforward as of October 31, 2011 of approximately $243,483,000 of which $51,069,000 expires in 2016, $184,077,000 expires in 2017, and $8,337,000 expires in 2018. The Fund utilized approximately $15,462,000 of its capital loss carryforward to offset net taxable gains realized in the year ended October 31, 2011. Accordingly, no capital gains distributions are expected to be paid to shareholders until net gains have been realized in excess of such carryforward. Under the recently enacted Regulated Investment Company Modernization Act of 2010 (“the Act”), the Series is permitted to carryforward capital losses incurred in taxable years beginning after December 22, 2010 (“post-enactment losses”) for an unlimited period. However, any post-enactment losses are required to be utilized before the utilization of losses incurred prior to the effective date of the Act. As a result of this ordering rule, capital loss carryforwards related to the taxable years beginning prior to the effective date of the Act may have an increased likelihood to expire unused. Additionally, post-enactment capital losses that are carried forward will retain their character as either short-term or long-term capital losses rather than being considered all short-term as under previous law.
Management has analyzed the Series’ tax positions taken on federal income tax returns for all open tax years and has concluded that no provision for income tax is required in the Series’ financial statements for the current reporting period. The Series’ federal and state income and federal excise tax returns for tax years for which the applicable statutes of limitations have not expired are subject to examination by the Internal Revenue Service and state departments of revenue.
Note 6. Capital
The Series offers Class A, B, C, F, L, M, X and Z shares. Class A and L shares are sold with a front-end sales charge of up to 5.50% and 5.75%, respectively. All investors who purchase Class A and L shares in an amount of $1 million or more and sell these shares within 12 months of purchase are subject to a contingent deferred sales charge (CDSC) of 1%. The Class A CDSC is waived for purchases by certain retirement and/or benefit plans. Class B and F shares are sold with a CDSC which declines from 5% to zero depending on the period of time the shares are held. Class B and F shares will automatically convert to Class A shares on a quarterly basis approximately seven years after purchase. In addition, under certain circumstances, an exchange may be made from Class A or C shares to Class Z shares of the Series. Class C shares are sold with a CDSC of 1% on shares redeemed within the first 12 months after purchase. Class M and X shares are sold with a CDSC which declines from 6% to zero depending on the period of time the shares are held. Class M and X shares will automatically convert to Class A shares on a quarterly basis approximately eight and
| | | | |
| Prudential International Equity Fund | | | 39 | |
Notes to Financial Statements
continued
ten years after purchase, respectively. A special exchange privilege is also available for shareholders who qualify to purchase Class A shares at net asset value. Class Z shares are not subject to any sales or redemption charge and are offered exclusively for sale to a limited group of investors.
There are 1 billion authorized shares of common stock at $.01 par value per share, designated Class A, Class B, Class C, Class F, Class L, Class M, Class X, Class New X and Class Z, each of which consists of 225 million, 150 million, 150 million, 50 million, 50 million, 50 million, 50 million, 50 million and 225 million authorized shares, respectively. There are no Class X shares outstanding.
During the fiscal years ended October 31, 2011 and October 31, 2010, the Series received $1,399,459 and $4,717,145, respectively, related to settlements of regulatory proceedings involving allegations of improper trading in Series shares. The amounts relating to a former affiliate for the years ended October 31, 2011 and October 31, 2010 were $1,123,251 and $4,493,246, respectively. The total amount is presented in the Series’ Statement of Changes in Net Assets. The Series was not involved in the proceedings or the calculation of the amount of settlement.
Transactions in shares of common stock were as follows:
| | | | | | | | |
Class A | | Shares | | | Amount | |
Year ended October 31, 2011: | | | | | | | | |
Shares sold | | | 1,157,745 | | | $ | 7,274,534 | |
Shares issued in reinvestment of dividends | | | 728,171 | | | | 4,427,283 | |
Shares reacquired | | | (7,310,868 | ) | | | (45,368,737 | ) |
| | | | | | | | |
Net increase (decrease) in shares outstanding before conversion | | | (5,424,952 | ) | | | (33,666,920 | ) |
Shares issued upon conversion from Class B, F, M and X | | | 883,630 | | | | 5,477,217 | |
Shares reacquired upon conversion into Class Z | | | (186,656 | ) | | | (1,187,796 | ) |
| | | | | | | | |
Net increase (decrease) in shares outstanding | | | (4,727,978 | ) | | $ | (29,377,499 | ) |
| | | | | | | | |
Year ended October 31, 2010: | | | | | | | | |
Shares sold | | | 1,468,501 | | | $ | 8,439,334 | |
Shares issued in reinvestment of dividends | | | 784,260 | | | | 4,572,227 | |
Shares reacquired | | | (9,136,119 | ) | | | (52,354,816 | ) |
| | | | | | | | |
Net increase (decrease) in shares outstanding before conversion | | | (6,883,358 | ) | | | (39,343,255 | ) |
Shares issued upon conversion from Class B, F, M and X | | | 1,243,082 | | | | 7,112,292 | |
| | | | | | | | |
Net increase (decrease) in shares outstanding | | | (5,640,276 | ) | | $ | (32,230,963 | ) |
| | | | | | | | |
| | |
| 40 | | Visit our website at www.prudentialfunds.com |
| | | | | | | | |
Class B | | Shares | | | Amount | |
Year ended October 31, 2011: | | | | | | | | |
Shares sold | | | 134,342 | | | $ | 803,818 | |
Shares issued in reinvestment of dividends | | | 18,311 | | | | 107,666 | |
Shares reacquired | | | (240,348 | ) | | | (1,441,980 | ) |
| | | | | | | | |
Net increase (decrease) in shares outstanding before conversion | | | (87,695 | ) | | | (530,496 | ) |
Shares reacquired upon conversion into Class A | | | (233,493 | ) | | | (1,372,829 | ) |
| | | | | | | | |
Net increase (decrease) in shares outstanding | | | (321,188 | ) | | $ | (1,903,325 | ) |
| | | | | | | | |
Year ended October 31, 2010: | | | | | | | | |
Shares sold | | | 212,889 | | | $ | 1,182,667 | |
Shares issued in reinvestment of dividends | | | 20,600 | | | | 116,386 | |
Shares reacquired | | | (361,347 | ) | | | (1,987,158 | ) |
| | | | | | | | |
Net increase (decrease) in shares outstanding before conversion | | | (127,858 | ) | | | (688,105 | ) |
Shares reacquired upon conversion into Class A | | | (124,226 | ) | | | (674,212 | ) |
| | | | | | | | |
Net increase (decrease) in shares outstanding | | | (252,084 | ) | | $ | (1,362,317 | ) |
| | | | | | | | |
Class C | | | | | | |
Year ended October 31, 2011: | | | | | | | | |
Shares sold | | | 285,739 | | | $ | 1,702,762 | |
Shares issued in reinvestment of dividends | | | 52,345 | | | | 307,788 | |
Shares reacquired | | | (948,643 | ) | | | (5,685,795 | ) |
| | | | | | | | |
Net increase (decrease) in shares outstanding before conversion | | | (610,559 | ) | | | (3,675,245 | ) |
Shares reacquired upon conversion into Class Z | | | (151 | ) | | | (831 | ) |
| | | | | | | | |
Net increase (decrease) in shares outstanding | | | (610,710 | ) | | $ | (3,676,076 | ) |
| | | | | | | | |
Year ended October 31, 2010: | | | | | | | | |
Shares sold | | | 166,469 | | | $ | 907,807 | |
Shares issued in reinvestment of dividends | | | 59,737 | | | | 336,914 | |
Shares reacquired | | | (1,018,733 | ) | | | (5,562,982 | ) |
| | | | | | | | |
Net increase (decrease) in shares outstanding | | | (792,527 | ) | | $ | (4,318,261 | ) |
| | | | | | | | |
Class F | | | | | | |
Year ended October 31, 2011: | | | | | | | | |
Shares sold | | | 122 | | | $ | 841 | |
Shares issued in reinvestment of dividends | | | 7,787 | | | | 45,709 | |
Shares reacquired | | | (86,360 | ) | | | (524,163 | ) |
| | | | | | | | |
Net increase (decrease) in shares outstanding before conversion | | | (78,451 | ) | | | (477,613 | ) |
Shares reacquired upon conversion into Class A | | | (200,736 | ) | | | (1,188,873 | ) |
| | | | | | | | |
Net increase (decrease) in shares outstanding | | | (279,187 | ) | | $ | (1,666,486 | ) |
| | | | | | | | |
Year ended October 31, 2010: | | | | | | | | |
Shares sold | | | 131 | | | $ | 690 | |
Shares issued in reinvestment of dividends | | | 12,651 | | | | 71,355 | |
Shares reacquired | | | (203,435 | ) | | | (1,123,341 | ) |
| | | | | | | | |
Net increase (decrease) in shares outstanding before conversion | | | (190,653 | ) | | | (1,051,296 | ) |
Shares reacquired upon conversion into Class A | | | (184,350 | ) | | | (996,186 | ) |
| | | | | | | | |
Net increase (decrease) in shares outstanding | | | (375,003 | ) | | $ | (2,047,482 | ) |
| | | | | | | | |
| | | | |
| Prudential International Equity Fund | | | 41 | |
Notes to Financial Statements
continued
| | | | | | | | |
Class L | | Shares | | | Amount | |
Year ended October 31, 2011: | | | | | | | | |
Shares sold | | | 6,430 | | | $ | 41,363 | |
Shares issued in reinvestment of dividends | | | 27,508 | | | | 167,799 | |
Shares reacquired | | | (292,840 | ) | | | (1,835,606 | ) |
| | | | | | | | |
Net increase (decrease) in shares outstanding | | | (258,902 | ) | | $ | (1,626,444 | ) |
| | | | | | | | |
Year ended October 31, 2010: | | | | | | | | |
Shares sold | | | 10,093 | | | $ | 59,754 | |
Shares issued in reinvestment of dividends | | | 31,646 | | | | 184,815 | |
Shares reacquired | | | (411,930 | ) | | | (2,361,389 | ) |
| | | | | | | | |
Net increase (decrease) in shares outstanding | | | (370,191 | ) | | $ | (2,116,820 | ) |
| | | | | | | | |
Class M | | | | | | | | |
Year ended October 31, 2011: | | | | | | | | |
Shares sold | | | 2,102 | | | $ | 12,843 | |
Shares issued in reinvestment of dividends | | | 5,162 | | | | 30,351 | |
Shares reacquired | | | (70,593 | ) | | | (427,774 | ) |
| | | | | | | | |
Net increase (decrease) in shares outstanding before conversion | | | (63,329 | ) | | | (394,580 | ) |
Shares reacquired upon conversion into Class A | | | (304,398 | ) | | | (1,842,076 | ) |
| | | | | | | | |
Net increase (decrease) in shares outstanding | | | (367,727 | ) | | $ | (2,226,656 | ) |
| | | | | | | | |
Year ended October 31, 2010: | | | | | | | | |
Shares sold | | | 16,379 | | | $ | 91,988 | |
Shares issued in reinvestment of dividends | | | 12,151 | | | | 68,651 | |
Shares reacquired | | | (166,265 | ) | | | (916,746 | ) |
| | | | | | | | |
Net increase (decrease) in shares outstanding before conversion | | | (137,735 | ) | | | (756,107 | ) |
Shares reacquired upon conversion into Class A | | | (550,701 | ) | | | (3,062,454 | ) |
| | | | | | | | |
Net increase (decrease) in shares outstanding | | | (688,436 | ) | | $ | (3,818,561 | ) |
| | | | | | | | |
Class X | | | | | | |
Year ended October 31, 2011: | | | | | | | | |
Shares sold | | | 3,680 | | | $ | 22,212 | |
Shares issued in reinvestment of dividends | | | 5,872 | | | | 34,525 | |
Shares reacquired | | | (63,117 | ) | | | (377,288 | ) |
| | | | | | | | |
Net increase (decrease) in shares outstanding before conversion | | | (53,565 | ) | | | (320,551 | ) |
Shares reacquired upon conversion into Class A | | | (177,542 | ) | | | (1,073,439 | ) |
| | | | | | | | |
Net increase (decrease) in shares outstanding | | | (231,107 | ) | | $ | (1,393,990 | ) |
| | | | | | | | |
Year ended October 31, 2010: | | | | | | | | |
Shares sold | | | 5,982 | | | $ | 33,503 | |
Shares issued in reinvestment of dividends | | | 11,154 | | | | 63,022 | |
Shares reacquired | | | (144,467 | ) | | | (804,626 | ) |
| | | | | | | | |
Net increase (decrease) in shares outstanding before conversion | | | (127,331 | ) | | | (708,101 | ) |
Shares reacquired upon conversion into Class A | | | (428,007 | ) | | | (2,379,440 | ) |
| | | | | | | | |
Net increase (decrease) in shares outstanding | | | (555,338 | ) | | $ | (3,087,541 | ) |
| | | | | | | | |
| | |
| 42 | | Visit our website at www.prudentialfunds.com |
| | | | | | | | |
Class Z | | Shares | | | Amount | |
Year ended October 31, 2011: | | | | | | | | |
Shares sold | | | 1,525,305 | | | $ | 9,377,222 | |
Shares issued in reinvestment of dividends | | | 155,042 | | | | 948,855 | |
Shares reacquired | | | (1,350,436 | ) | | | (8,636,569 | ) |
| | | | | | | | |
Net increase (decrease) in shares outstanding before conversion | | | 329,911 | | | | 1,689,508 | |
Shares issued upon conversion from Class A and C | | | 185,345 | | | | 1,188,627 | |
| | | | | | | | |
Net increase (decrease) in shares outstanding | | | 515,256 | | | $ | 2,878,135 | |
| | | | | | | | |
Year ended October 31, 2010: | | | | | | | | |
Shares sold | | | 6,103,057 | | | $ | 35,465,353 | |
Shares issued in reinvestment of dividends | | | 779,543 | | | | 4,583,715 | |
Shares reacquired | | | (39,124,251 | ) | | | (212,237,067 | ) |
| | | | | | | | |
Net increase (decrease) in shares outstanding | | | (32,241,651 | ) | | $ | (172,187,999 | ) |
| | | | | | | | |
Note 7. Borrowing
The Series, along with other affiliated registered investment companies (the “Funds”), is a party to a Syndicated Credit Agreement (“SCA”) with a group of banks. The purpose of the SCA is to provide an alternative source of temporary funding for capital share redemptions. The SCA provides for a commitment of $750 million for the period December 17, 2010 through December 16, 2011. The Funds pay an annualized commitment fee of 0.10% of the unused portion of the SCA. Prior to December 17, 2010, the Funds had another Syndicated Credit Agreement (the “Expired SCA”) of a $500 million commitment with an annualized commitment fee of 0.15% of the unused portion. Interest on any borrowings under these SCA’s is paid at contracted market rates. The commitment fee for the unused amount is accrued daily and paid quarterly. The SCA has been renewed of substantially similar terms with an increase in the amount of commitment to $900 million.
The Series utilized the line of credit during the year ended October 31, 2011. The average daily balance for the 167 days that the Series had loans outstanding during the year was approximately $408,000, borrowed at a weighted average interest rate of 1.46%. At October 31, 2011, the Series has an outstanding loan amount of $1,354,000.
Note 8. In-Kind Redemption
During the fiscal year ended October 31, 2010, the Series settled the redemption of certain series shares by delivery of certain shares in lieu of cash. The value of such securities was $168,617,337. The Series realized a loss of $28,278,878 related to the in-kind redemption transactions.
| | | | |
| Prudential International Equity Fund | | | 43 | |
Notes to Financial Statements
continued
Note 9. Ownership
As of October 31, 2011, approximately 27% of the Series was owned by two institutional shareholders for the beneficial interest of their underlying account holders.
Note 10. Dividends and Distributions to Shareholders
Subsequent to the fiscal year end, the Series declared ordinary income dividends and capital gain distributions on December 7, 2011 to shareholders of record on December 8, 2011. The ex-dividend date was December 9, 2011. The per share amounts declared were as follows:
| | | | |
| | | Ordinary Income | |
Class A | | $ | 0.11162 | |
Class B | | $ | 0.07092 | |
Class C | | $ | 0.07092 | |
Class F | | $ | 0.08532 | |
Class L | | $ | 0.09933 | |
Class M | | $ | 0.07092 | |
Class X | | $ | 0.07092 | |
Class Z | | $ | 0.12997 | |
Note 11. New Accounting Pronouncements
In April 2011, the Financial Accounting Standards Board (“FASB”) issued Accounting Standards Update (“ASU”) No. 2011-03 “Reconsideration of Effective Control for Repurchase Agreements.” The objective of ASU No. 2011-03 is to improve the accounting for repurchase agreements and other agreements that both entitle and obligate a transferor to repurchase or redeem financial assets before their maturity. Under previous guidance, whether or not to account for a transaction as a sale was based on, in part, if the entity maintained effective control over the transferred financial assets. ASU No. 2011-03 removes the transferor’s ability criterion from the effective control assessment. This guidance is effective prospectively for interim and annual reporting periods beginning on or after December 15, 2011. At this time, management is evaluating the implications of ASU No. 2011-03 and its impact on the financial statements has not been determined.
| | |
| 44 | | Visit our website at www.prudentialfunds.com |
In May 2011, the FASB issued ASU No. 2011-04 “Amendments to Achieve Common Fair Value Measurement and Disclosure Requirements in U.S. GAAP and IFRSs.” ASU No. 2011-04 includes common requirements for measurement of and disclosure about fair value between U.S. GAAP and IFRS. ASU No. 2011-04 will require reporting entities to disclose quantitative information about the unobservable inputs used in the fair value measurements categorized within Level 3 of the fair value hierarchy. In addition, ASU No. 2011-04 will require reporting entities to make disclosures about amounts and reasons for all transfers in and out of Level 1 and Level 2 fair value measurements. The new and revised disclosures are effective for interim and annual reporting periods beginning after December 15, 2011. At this time, management is evaluating the implications of ASU No. 2011-04 and its impact on the financial statements has not been determined.
| | | | |
| Prudential International Equity Fund | | | 45 | |
Financial Highlights
| | | | | | | | | | | | | | | | | | | | |
| Class A Shares | |
| | | Year Ended October 31, | |
| | | 2011(a) | | | 2010(a) | | | 2009(a) | | | 2008(a) | | | 2007(a) | |
| Per Share Operating Performance: | | | | | | | | | | | | | | | | | | | | |
| Net Asset Value, Beginning Of Year | | | $6.17 | | | | $5.77 | | | | $4.80 | | | | $10.49 | | | | $8.54 | |
| Income (loss) from investment operations: | | | | | | | | | | | | | | | | | | | | |
| Net investment income | | | .09 | | | | .08 | | | | .08 | | | | .16 | | | | .16 | |
| Net realized and unrealized gain (loss) on investment and foreign currency transactions | | | (.46 | ) | | | .36 | | | | 1.06 | | | | (5.37 | ) | | | 1.92 | |
| Total from investment operations | | | (.37 | ) | | | .44 | | | | 1.14 | | | | (5.21 | ) | | | 2.08 | |
| Less Dividends and Distributions: | | | | | | | | | | | | | | | | | | | | |
| Dividends from net investment income | | | (.11 | ) | | | (.10 | ) | | | (.17 | ) | | | (.14 | ) | | | (.13 | ) |
| Distributions from net realized gains | | | - | | | | - | | | | - | | | | (.34 | ) | | | - | |
| Total dividends and distributions | | | (.11 | ) | | | (.10 | ) | | | (.17 | ) | | | (.48 | ) | | | (.13 | ) |
| Capital Contributions (Note 6) | | | .03 | | | | .06 | | | | - | | | | - | | | | - | |
| Net asset value, end of year | | | $5.72 | | | | $6.17 | | | | $5.77 | | | | $4.80 | | | | $10.49 | |
| Total Return(b): | | | (5.61)% | | | | 8.78% | | | | 24.65% | | | | (51.87)% | | | | 24.68% | |
| |
| Ratios/Supplemental Data: | |
| Net assets, end of year (000) | | | $214,610 | | | | $260,555 | | | | $275,993 | | | | $246,234 | | | | $557,878 | |
| Average net assets (000) | | | $247,859 | | | | $257,553 | | | | $240,744 | | | | $438,831 | | | | $438,194 | |
| Ratios to average net assets(c): | | | | | | | | | | | | | | | | | | | | |
| Expenses, including distribution and service (12b-1) fees(d) | | | 1.64% | | | | 1.57% | | | | 1.54% | | | | 1.43% | | | | 1.34% | |
| Expenses, excluding distribution and service (12b-1) fees | | | 1.34% | | | | 1.27% | | | | 1.24% | | | | 1.15% | | | | 1.09% | |
| Net investment income | | | 1.51% | | | | 1.35% | | | | 1.75% | | | | 1.94% | | | | 1.60% | |
| For Class A, B, C, F, L, M, X and Z shares: | | | | | | | | | | | | | | | | | | | | |
| Portfolio turnover rate | | | 70% | | | | 96% | | | | 76% | | | | 74% | | | | 114% | |
(a) Calculated based on average shares outstanding during the year.
(b) Total return does not consider the effects of sales loads. Total return is calculated assuming a purchase of a share on the first day and a sale on the last day of each year reported, and includes reinvestment of dividends and distributions. Total returns may reflect adjustments to conform to generally accepted accounting principles.
(c) Does not include expenses of the underlying portfolios in which the Series invests.
(d) The distributor of the Series had contractually agreed to limit its distribution and service (12b-1) fees to .25% of the average daily net assets of the Class A shares through February 28, 2008.
See Notes to Financial Statements.
| | |
| 46 | | Visit our website at www.prudentialfunds.com |
| | | | | | | | | | | | | | | | | | | | |
| Class B Shares | |
| | | Year Ended October 31, | |
| | | 2011(a) | | | 2010(a) | | | 2009(a) | | | 2008(a) | | | 2007(a) | |
| Per Share Operating Performance: | | | | | | | | | | | | | | | | | | | | |
| Net Asset Value, Beginning Of Year | | | $5.94 | | | | $5.56 | | | | $4 .61 | | | | $10.09 | | | | $8.22 | |
| Income (loss) from investment operations: | | | | | | | | | | | | | | | | | | | | |
| Net investment income | | | .05 | | | | .04 | | | | .05 | | | | .09 | | | | .06 | |
| Net realized and unrealized gain (loss) on investment and foreign currency transactions | | | (.45 | ) | | | .35 | | | | 1.02 | | | | (5.16 | ) | | | 1.88 | |
| Total from investment operations | | | (.40 | ) | | | .39 | | | | 1.07 | | | | (5.07 | ) | | | 1.94 | |
| Less Dividends and Distributions: | | | | | | | | | | | | | | | | | | | | |
| Dividends from net investment income | | | (.07 | ) | | | (.07 | ) | | | (.12 | ) | | | (.07 | ) | | | (.07 | ) |
| Distributions from net realized gains | | | - | | | | - | | | | - | | | | (.34 | ) | | | - | |
| Total dividends and distributions | | | (.07 | ) | | | (.07 | ) | | | (.12 | ) | | | (.41 | ) | | | (.07 | ) |
| Capital Contributions (Note 6) | | | .03 | | | | .06 | | | | - | | | | - | | | | - | |
| Net asset value, end of year | | | $5.50 | | | | $5.94 | | | | $5.56 | | | | $4.61 | | | | $10.09 | |
| Total Return(b): | | | (6.27)% | | | | 8.11% | | | | 23.82% | | | | (52.22)% | | | | 23.73% | |
| |
| Ratios/Supplemental Data: | |
| Net assets, end of year (000) | | | $6,720 | | | | $9,160 | | | | $9,976 | | | | $11,205 | | | | $32,905 | |
| Average net assets (000) | | | $8,320 | | | | $9,246 | | | | $9,229 | | | | $22,786 | | | | $39,205 | |
| Ratios to average net assets(c): | | | | | | | | | | | | | | | | | | | | |
| Expenses, including distribution and service (12b-1) fees | | | 2.34% | | | | 2.27% | | | | 2.24% | | | | 2.15% | | | | 2.09% | |
| Expenses, excluding distribution and service (12b-1) fees | | | 1.34% | | | | 1.27% | | | | 1.24% | | | | 1.15% | | | | 1.09% | |
| Net investment income | | | .83% | | | | .66% | | | | 1.06% | | | | 1.17% | | | | .67% | |
(a) Calculated based on average shares outstanding during the year.
(b) Total return does not consider the effects of sales loads. Total return is calculated assuming a purchase of a share on the first day and a sale on the last day of each year reported, and includes reinvestment of dividends and distributions. Total returns may reflect adjustments to conform to generally accepted accounting principles.
(c) Does not include expenses of the underlying portfolios in which the Series invests.
See Notes to Financial Statements.
| | | | |
| Prudential International Equity Fund | | | 47 | |
Financial Highlights
continued
| | | | | | | | | | | | | | | | | | | | |
| Class C Shares | |
| | | Year Ended October 31, | |
| | | 2011(a) | | | 2010(a) | | | 2009(a) | | | 2008(a) | | | 2007(a) | |
| Per Share Operating Performance: | | | | | | | | | | | | | | | | | | | | |
| Net Asset Value, Beginning Of Year | | | $5.94 | | | | $5.56 | | | | $4.61 | | | | $10.09 | | | | $8.22 | |
| Income (loss) from investment operations: | | | | | | | | | | | | | | | | | | | | |
| Net investment income | | | .05 | | | | .04 | | | | .05 | | | | .09 | | | | .10 | |
| Net realized and unrealized gain (loss) on investment and foreign currency transactions | | | (.45 | ) | | | .35 | | | | 1.02 | | | | (5.16 | ) | | | 1.84 | |
| Total from investment operations | | | (.40 | ) | | | .39 | | | | 1.07 | | | | (5.07 | ) | | | 1.94 | |
| Less Dividends and Distributions: | | | | | | | | | | | | | | | | | | | | |
| Dividends from net investment income | | | (.07 | ) | | | (.07 | ) | | | (.12 | ) | | | (.07 | ) | | | (.07 | ) |
| Distributions from net realized gains | | | - | | | | - | | | | - | | | | (.34 | ) | | | - | |
| Total dividends and distributions | | | (.07 | ) | | | (.07 | ) | | | (.12 | ) | | | (.41 | ) | | | (.07 | ) |
| Capital Contributions (Note 6) | | | .03 | | | | .06 | | | | - | | | | - | | | | - | |
| Net asset value, end of year | | | $5.50 | | | | $5.94 | | | | $5.56 | | | | $4.61 | | | | $10.09 | |
| Total Return(b): | | | (6.27)% | | | | 8.11% | | | | 23.83% | | | | (52.22)% | | | | 23.73% | |
| |
| Ratios/Supplemental Data: | |
| Net assets, end of year (000) | | | $21,310 | | | | $26,625 | | | | $29,326 | | | | $28,858 | | | | $75,010 | |
| Average net assets (000) | | | $25,128 | | | | $26,974 | | | | $26,677 | | | | $55,111 | | | | $53,765 | |
| Ratios to average net assets(c): | | | | | | | | | | | | | | | | | | | | |
| Expenses, including distribution and service (12b-1) fees | | | 2.34% | | | | 2.27% | | | | 2.24% | | | | 2.15% | | | | 2.09% | |
| Expenses, excluding distribution and service (12b-1) fees | | | 1.34% | | | | 1.27% | | | | 1.24% | | | | 1.15% | | | | 1.09% | |
| Net investment income | | | .81% | | | | .66% | | | | 1.06% | | | | 1.19% | | | | 1.03% | |
(a) Calculated based on average shares outstanding during the year.
(b) Total return does not consider the effects of sales loads. Total return is calculated assuming a purchase of a share on the first day and a sale on the last day of each year reported, and includes reinvestment of dividends and distributions. Total returns may reflect adjustments to conform to generally accepted accounting principles.
(c) Does not include expenses of the underlying portfolios in which the Series invests.
See Notes to Financial Statements.
| | |
| 48 | | Visit our website at www.prudentialfunds.com |
| | | | | | | | | | | | | | | | | | | | | | |
| Class F Shares | |
| | | Year Ended October 31, | | | | | December 18,
2006(e)
through
October 31, | |
| | | 2011(a) | | | 2010(a) | | | 2009(a) | | | 2008(a) | | | | | 2007(a) | |
| Per Share Operating Performance: | | | | | | | | | | | | | | | | | | | | | | |
| Net Asset Value, Beginning Of Period | | | $5.94 | | | | $5.56 | | | | $4.62 | | | | $10.11 | | | | | | $8.56 | |
| Income (loss) from investment operations: | | | | | | | | | | | | | | | | | | | | | | |
| Net investment income | | | .06 | | | | .05 | | | | .06 | | | | .11 | | | | | | .09 | |
Net realized and unrealized gain (loss) on
investment and foreign currency transactions | | | (.44 | ) | | | .35 | | | | 1.01 | | | | (5.17 | ) | | | | | 1.46 | |
| Total from investment operations | | | (.38 | ) | | | .40 | | | | 1.07 | | | | (5.06 | ) | | | | | 1.55 | |
| Less Dividends and Distributions: | | | | | | | | | | | | | | | | | | | | | | |
| Dividends from net investment income | | | (.09 | ) | | | (.08 | ) | | | (.13 | ) | | | (.09 | ) | | | | | - | |
| Distributions from net realized gains | | | - | | | | - | | | | - | | | | (.34 | ) | | | | | - | |
| Total dividends and distributions | | | (.09 | ) | | | (.08 | ) | | | (.13 | ) | | | (.43 | ) | | | | | - | |
| Capital Contributions (Note 6) | | | .03 | | | | .06 | | | | - | | | | - | | | | | | - | |
| Net asset value, end of period | | | $5.50 | | | | $5.94 | | | | $5.56 | | | | $4.62 | | | | | | $10.11 | |
| Total Return(b): | | | (6.05)% | | | | 8.35% | | | | 24.04% | | | | (52.10)% | | | | | | 18.11% | |
| |
| Ratios/Supplemental Data: | |
| Net assets, end of period (000) | | | $1,572 | | | | $3,355 | | | | $5,226 | | | | $8,171 | | | | | | $28,728 | |
| Average net assets (000) | | | $2,442 | | | | $4,064 | | | | $5,769 | | | | $18,310 | | | | | | $33,219 | |
| Ratios to average net assets(c): | | | | | | | | | | | | | | | | | | | | | | |
| Expenses, including distribution and service (12b-1) fees | | | 2.09% | | | | 2.02% | | | | 1.99% | | | | 1.90% | | | | | | 1.84% | (d) |
| Expenses, excluding distribution and service (12b-1) fees | | | 1.34% | | | | 1.27% | | | | 1.24% | | | | 1.15% | | | | | | 1.09% | (d) |
| Net investment income | | | 1.07% | | | | .95% | | | | 1.35% | | | | 1.37% | | | | | | 1.13% | (d) |
(a) Calculated based on average shares outstanding during the period.
(b) Total return does not consider the effects of sales loads. Total return is calculated assuming a purchase of a share on the first day and a sale on the last day of each period reported, and includes reinvestment of dividends and distributions. Total returns may reflect adjustments to conform to generally accepted accounting principles. Total returns for periods less than one full year are not annualized.
(c) Does not include expenses of the underlying portfolios in which the Series invests.
(d) Annualized.
(e) Commencement of offering.
See Notes to Financial Statements.
| | | | |
| Prudential International Equity Fund | | | 49 | |
Financial Highlights
continued
| | | | | | | | | | | | | | | | | | | | | | |
| Class L Shares | |
| | | Year Ended October 31, | | | | | March 19,
2007(e)
through
October 31, | |
| | | 2011(a) | | | 2010(a) | | | 2009(a) | | | 2008(a) | | | | | 2007(a) | |
| Per Share Operating Performance: | | | | | | | | | | | | | | | | | | | | | | |
| Net Asset Value, Beginning Of Period | | | $6.17 | | | | $5.77 | | | | $4.79 | | | | $10.48 | | | | | | $8.92 | |
| Income (loss) from investment operations: | | | | | | | | | | | | | | | | | | | | | | |
| Net investment income | | | .08 | | | | .07 | | | | .07 | | | | .14 | | | | | | .11 | |
| Net realized and unrealized gain (loss) on investment and foreign currency transactions | | | (.45 | ) | | | .36 | | | | .06 | | | | (5.38 | ) | | | | | 1.45 | |
| Total from investment operations | | | (.37 | ) | | | .43 | | | | 1.13 | | | | (5.24 | ) | | | | | 1.56 | |
| Less Dividends and Distributions: | | | | | | | | | | | | | | | | | | | | | | |
| Dividends from net investment income | | | (.10 | ) | | | (.09 | ) | | | (.15 | ) | | | (.11 | ) | | | | | - | |
| Distributions from net realized gains | | | - | | | | - | | | | - | | | | (.34 | ) | | | | | - | |
| Total dividends and distributions | | | (.10 | ) | | | (.09 | ) | | | (.15 | ) | | | (.45 | ) | | | | | - | |
| Capital Contributions (Note 6) | | | .03 | | | | .06 | | | | - | | | | - | | | | | | - | |
| Net asset value, end of period | | | $5.73 | | | | $6.17 | | | | $5.77 | | | | $4.79 | | | | | | $10.48 | |
| Total Return(b): | | | (5.62)% | | | | 8.59% | | | | 24.49% | | | | (52.07)% | | | | | | 17.49% | |
| |
| Ratios/Supplemental Data: | |
| Net assets, end of period (000) | | | $8,644 | | | | $10,919 | | | | $12,342 | | | | $12,621 | | | | | | $34,433 | |
| Average net assets (000) | | | $10,189 | | | | $11,216 | | | | $11,250 | | | | $24,942 | | | | | | $35,182 | |
| Ratios to average net assets(c): | | | | | | | | | | | | | | | | | | | | | | |
| Expenses, including distribution and service (12b-1) fees | | | 1.84% | | | | 1.77% | | | | 1.74% | | | | 1.65% | | | | | | 1.59% | (d) |
| Expenses, excluding distribution and service (12b-1) fees | | | 1.34% | | | | 1.27% | | | | 1.24% | | | | 1.15% | | | | | | 1.09% | (d) |
| Net investment income | | | 1.31% | | | | 1.16% | | | | 1.56% | | | | 1.68% | | | | | | 1.82% | (d) |
(a) Calculated based on average shares outstanding during the period.
(b) Total return does not consider the effects of sales loads. Total return is calculated assuming a purchase of a share on the first day and a sale on the last day of each period reported, and includes reinvestment of dividends and distributions. Total returns may reflect adjustments to conform to generally accepted accounting principles. Total returns for periods less than one full year are not annualized.
(c) Does not include expenses of the underlying portfolios in which the Series invests.
(d) Annualized.
(e) Commencement of offering.
See Notes to Financial Statements.
| | |
| 50 | | Visit our website at www.prudentialfunds.com |
| | | | | | | | | | | | | | | | | | | | | | |
| Class M Shares | |
| | | Year Ended October 31, | | | | | March 19,
2007(e)
through
October 31, | |
| | | 2011(a) | | | 2010(a) | | | 2009(a) | | | 2008(a) | | | | | 2007(a) | |
| Per Share Operating Performance: | | | | | | | | | | | | | | | | | | | | | | |
| Net Asset Value, Beginning Of Period | | | $5.94 | | | | $5.56 | | | | $4.61 | | | | $10.09 | | | | | | $8.63 | |
| Income (loss) from investment operations: | | | | | | | | | | | | | | | | | | | | | | |
| Net investment income | | | .05 | | | | .04 | | | | .05 | | | | .07 | | | | | | .08 | |
Net realized and unrealized gain (loss) on
investment and foreign currency transactions | | | (.45 | ) | | | .35 | | | | 1.02 | | | | (5.14 | ) | | | | | 1.38 | |
| Total from investment operations | | | (.40 | ) | | | .39 | | | | 1.07 | | | | (5.07 | ) | | | | | 1.46 | |
| Less Dividends and Distributions: | | | | | | | | | | | | | | | | | | | | | | |
| Dividends from net investment income | | | (.07 | ) | | | (.07 | ) | | | (.12 | ) | | | (.07 | ) | | | | | - | |
| Distributions from net realized gains | | | - | | | | - | | | | - | | | | (.34 | ) | | | | | - | |
| Total dividends and distributions | | | (.07 | ) | | | (.07 | ) | | | (.12 | ) | | | (.41 | ) | | | | | - | |
| Capital Contributions (Note 6) | | | .03 | | | | .06 | | | | - | | | | - | | | | | | - | |
| Net asset value, end of period | | | $5.50 | | | | $5.94 | | | | $5.56 | | | | $4.61 | | | | | | $10.09 | |
| Total Return(b): | | | (6.27)% | | | | 8.11% | | | | 23.82% | | | | (52.22)% | | | | | | 16.92% | |
| |
| Ratios/Supplemental Data: | |
| Net assets, end of period (000) | | | $743 | | | | $2,985 | | | | $6,622 | | | | $11,467 | | | | | | $68,244 | |
| Average net assets (000) | | | $1,768 | | | | $4,441 | | | | $7,957 | | | | $34,319 | | | | | | $76,639 | |
| Ratios to average net assets(c): | | | | | | | | | | | | | | | | | | | | | | |
| Expenses, including distribution and service (12b-1) fees | | | 2.34% | | | | 2.27% | | | | 2.24% | | | | 2.15% | | | | | | 2.09% | (d) |
| Expenses, excluding distribution and service (12b-1) fees | | | 1.34% | | | | 1.27% | | | | 1.24% | | | | 1.15% | | | | | | 1.09% | (d) |
| Net investment income | | | .76% | | | | .68% | | | | 1.09% | | | | .92% | | | | | | 1.41% | (d) |
(a) Calculated based on average shares outstanding during the period.
(b) Total return does not consider the effects of sales loads. Total return is calculated assuming a purchase of a share on the first day and a sale on the last day of each period reported, and includes reinvestment of dividends and distributions. Total returns may reflect adjustments to conform to generally accepted accounting principles. Total returns for periods less than one full year are not annualized.
(c) Does not include expenses of the underlying portfolios in which the Series invests.
(d) Annualized.
(e) Commencement of offering.
See Notes to Financial Statements.
| | | | |
| Prudential International Equity Fund | | | 51 | |
Financial Highlights
continued
| | | | | | | | | | | | | | | | | | | | | | |
| Class X Shares | |
| | | Year Ended October 31, | | | | | March 19,
2007(e)
through
October 31, | |
| | | 2011(a) | | | 2010(a) | | | 2009(a) | | | 2008(a) | | | | | 2007(a) | |
| Per Share Operating Performance: | | | | | | | | | | | | | | | | | | | | | | |
| Net Asset Value, Beginning Of Period | | | $5.94 | | | | $5.56 | | | | $4.61 | | | | $10.09 | | | | | | $8.63 | |
| Income (loss) from investment operations: | | | | | | | | | | | | | | | | | | | | | | |
| Net investment income | | | .05 | | | | .04 | | | | .05 | | | | .09 | | | | | | .08 | |
| Net realized and unrealized gain (loss) on investment and foreign currency transactions | | | (.45 | ) | | | .35 | | | | 1.02 | | | | (5.16 | ) | | | | | 1.38 | |
| Total from investment operations | | | (.40 | ) | | | .39 | | | | 1.07 | | | | (5.07 | ) | | | | | 1.46 | |
| Less Dividends and Distributions: | | | | | | | | | | | | | | | | | | | | | | |
| Dividends from net investment income | | | (.07 | ) | | | (.07 | ) | | | (.12 | ) | | | (.07 | ) | | | | | - | |
| Distributions from net realized gains | | | - | | | | - | | | | - | | | | (.34 | ) | | | | | - | |
| Total dividends and distributions | | | (.07 | ) | | | (.07 | ) | | | (.12 | ) | | | (.41 | ) | | | | | - | |
| Capital Contributions (Note 6) | | | .03 | | | | .06 | | | | - | | | | - | | | | | | - | |
| Net asset value, end of period | | | $5.50 | | | | $5.94 | | | | $5.56 | | | | $4.61 | | | | | | $10.09 | |
| Total Return(b): | | | (6.27)% | | | | 8.11% | | | | 23.82% | | | | (52.22)% | | | | | | 16.92% | |
| |
| Ratios/Supplemental Data: | |
| Net assets, end of period (000) | | | $1,569 | | | | $3,067 | | | | $5,957 | | | | $8,597 | | | | | | $25,428 | |
| Average net assets (000) | | | $2,351 | | | | $4,020 | | | | $6,611 | | | | $17,864 | | | | | | $25,351 | |
| Ratios to average net assets(c): | | | | | | | | | | | | | | | | | | | | | | |
| Expenses, including distribution and service (12b-1) fees | | | 2.34% | | | | 2.27% | | | | 2.24% | | | | 2.15% | | | | | | 2.09% | (d) |
| Expenses, excluding distribution and service (12b-1) fees | | | 1.34% | | | | 1.27% | | | | 1.24% | | | | 1.15% | | | | | | 1.09% | (d) |
| Net investment income | | | .80% | | | | .66% | | | | 1.10% | | | | 1.18% | | | | | | 1.30% | (d) |
(a) Calculated based on average shares outstanding during the period.
(b) Total return does not consider the effects of sales loads. Total return is calculated assuming a purchase of a share on the first day and a sale on the last day of each period reported, and includes reinvestment of dividends and distributions. Total returns may reflect adjustments to conform to generally accepted accounting principles. Total returns for periods less than one full year are not annualized.
(c) Does not include expenses of the underlying portfolios in which the Series invests.
(d) Annualized.
(e) Commencement of offering.
See Notes to Financial Statements.
| | |
| 52 | | Visit our website at www.prudentialfunds.com |
| | | | | | | | | | | | | | | | | | | | |
| Class Z Shares | |
| | | Year Ended October 31, | |
| | | 2011(a) | | | 2010(a) | | | 2009(a) | | | 2008(a) | | | 2007(a) | |
| Per Share Operating Performance: | | | | | | | | | | | | | | | | | | | | |
| Net Asset Value, Beginning Of Year | | | $6.22 | | | | $5.82 | | | | $4.85 | | | | $10.60 | | | | $8.62 | |
| Income (loss) from investment operations: | | | | | | | | | | | | | | | | | | | | |
| Net investment income | | | .11 | | | | .13 | | | | .10 | | | | .18 | | | | .16 | |
| Net realized and unrealized gain (loss) on investment and foreign currency transactions | | | (.46 | ) | | | .33 | | | | 1.06 | | | | (5.43 | ) | | | 1.97 | |
| Total from investment operations | | | (.35 | ) | | | .46 | | | | 1.16 | | | | (5.25 | ) | | | 2.13 | |
| Less Dividends and Distributions: | | | | | | | | | | | | | | | | | | | | |
| Dividends from net investment income | | | (.13 | ) | | | (.12 | ) | | | (.19 | ) | | | (.16 | ) | | | (.15 | ) |
| Distributions from net realized gains | | | - | | | | - | | | | - | | | | (.34 | ) | | | - | |
| Total dividends and distributions | | | (.13 | ) | | | (.12 | ) | | | (.19 | ) | | | (.50 | ) | | | (.15 | ) |
| Capital Contributions (Note 6) | | | .03 | | | | .06 | | | | - | | | | - | | | | - | |
| Net asset value, end of year | | | $5.77 | | | | $6.22 | | | | $5.82 | | | | $4.85 | | | | $10.60 | |
| Total Return(b): | | | (5.30)% | | | | 8.98% | | | | 24.95% | | | | (51.77)% | | | | 25.05% | |
| |
| Ratios/Supplemental Data: | |
| Net assets, end of year (000) | | | $44,573 | | | | $44,833 | | | | $229,771 | | | | $169,874 | | | | $353,771 | |
| Average net assets (000) | | | $46,529 | | | | $149,685 | | | | $184,038 | | | | $285,097 | | | | $301,553 | |
| Ratios to average net assets(c): | | | | | | | | | | | | | | | | | | | | |
| Expenses, including distribution and service (12b-1) fees | | | 1.34% | | | | 1.27% | | | | 1.24% | | | | 1.15% | | | | 1.09% | |
| Expenses, excluding distribution and service (12b-1) fees | | | 1.34% | | | | 1.27% | | | | 1.24% | | | | 1.15% | | | | 1.09% | |
| Net investment income | | | 1.77% | | | | 2.12% | | | | 2.05% | | | | 2.22% | | | | 1.73% | |
(a) Calculated based on average shares outstanding during the year.
(b) Total return is calculated assuming a purchase of a share on the first day and a sale on the last day of each year reported, and includes reinvestment of dividends and distributions. Total returns may reflect adjustments to conform to generally accepted accounting principles.
(c) Does not include expenses of the underlying portfolios in which the Series invests.
See Notes to Financial Statements.
| | | | |
| Prudential International Equity Fund | | | 53 | |
Report of Independent Registered Public
Accounting Firm
The Board of Directors and Shareholders
Prudential World Fund, Inc.:
We have audited the accompanying statement of assets and liabilities of Prudential International Equity Fund (one of the series constituting Prudential World Fund, Inc., hereafter referred to as the “Fund”), including the portfolio of investments, as of October 31, 2011, and the related statement of operations for the year then ended, the statement of changes in net assets for each of the years in the two-year period then ended and the financial highlights for each of the years in the five-year period then ended. These financial statements and financial highlights are the responsibility of the Fund’s management. Our responsibility is to express an opinion on these financial statements and financial highlights based on our audits.
We conducted our audits in accordance with the standards of the Public Company Accounting Oversight Board (United States). Those standards require that we plan and perform the audit to obtain reasonable assurance about whether the financial statements and financial highlights are free of material misstatement. An audit includes examining, on a test basis, evidence supporting the amounts and disclosures in the financial statements. Our procedures included confirmation of securities owned as of October 31, 2011, by correspondence with the custodian, transfer agent and brokers or by other appropriate auditing procedures when replies from brokers were not received. An audit also includes assessing the accounting principles used and significant estimates made by management, as well as evaluating the overall financial statement presentation. We believe that our audits provide a reasonable basis for our opinion.
In our opinion, the financial statements and financial highlights referred to above present fairly, in all material respects, the financial position of the Fund as of October 31, 2011, and the results of its operations for the year then ended, the changes in its net assets for each of the years in the two-year period then ended and the financial highlights for each of the years in the five-year period then ended, in conformity with U.S. generally accepted accounting principles.

New York, New York
December 22, 2011
| | |
| 54 | | Visit our website at www.prudentialfunds.com |
Tax Information
(Unaudited)
We are required by Internal Revenue Code of 1986, as amended (“the Code”), to advise you within 60 days of the Series’ year end (October 31, 2011) as to the federal tax status of dividends paid by the Series during such year. We are advising you in the year ended October 31, 2011, the Series paid ordinary income dividends of $0.11 per share for Class A, $0.07 per share for Class B, C, M and X, $0.09 per share for Class F, $0.10 per share for Class L and $0.13 per share for Class Z, respectively, which are taxable as such.
For the year ended October 31, 2011, the Series designates the maximum amount allowable, but not less than 100% of the ordinary income dividends paid during the year as qualified dividend income in accordance with Section 854 of the Internal Revenue Code.
For the year ended October 31, 2011, the Series made an election to pass through the maximum amount of the portion of the ordinary income dividends paid derived from foreign source income as well as any foreign taxes paid by the Series in accordance with Section 853 of the Internal Revenue Code of the following amounts: $1,553,034 foreign tax credit from recognized foreign source income of $12,279,569.
In January 2012, you will be advised on IRS Form 1099 DIV or substitute 1099 DIV as to the federal tax status of distributions received by you in calendar year 2011.
| | | | |
| Prudential International Equity Fund | | | 55 | |
INFORMATION ABOUT BOARD MEMBERS AND OFFICERS
(Unaudited)
Information about Board Members and Officers is set forth below. Board Members who are not deemed to be “interested persons” of the Fund, as defined in the 1940 Act, are referred to as “Independent Board Members.” Board Members who are deemed to be “interested persons” of the Fund are referred to as “Interested Board Members.” The Board Members are responsible for the overall supervision of the operations of the Fund and perform the various duties imposed on the directors of investment companies by the 1940 Act.
| | | | |
Independent Board Members (1) | | | | |
| | | |
Name, Address, Age Position(s) Portfolios Overseen | | Principal Occupation(s) During Past Five Years | | Other Directorships Held |
Kevin J. Bannon (59) Board Member Portfolios Overseen: 58 | | Managing Director (since April 2008) and Chief Investment Officer (since October 2008) of Highmount Capital LLC (registered investment adviser); formerly Executive Vice President and Chief Investment Officer (April 1993-August 2007) of Bank of New York Company; President (May 2003-May 2007) of BNY Hamilton Family of Mutual Funds. | | Director of Urstadt Biddle Properties (since September 2008). |
Linda W. Bynoe (59) Board Member Portfolios Overseen: 58 | | President and Chief Executive Officer (since March 1995) and formerly Chief Operating Officer (December 1989-February 1995) of Telemat Ltd. (management consulting); formerly Vice President (January 1985-June 1989) at Morgan Stanley & Co (broker-dealer). | | Director of Simon Property Group, Inc. (retail real estate) (since May 2003); Director of Anixter International, Inc. (communication products distributor) (since January 2006); Director of Northern Trust Corporation (financial services) (since April 2006); Trustee of Equity Residential (residential real estate) (since December 2009); formerly Director of Dynegy Inc. (power generation) (September 2002-May 2006). |
Michael S. Hyland, CFA (66) Board Member Portfolios Overseen: 58 | | Independent Consultant (since February 2005); formerly Senior Managing Director (July 2001-February 2005) of Bear Stearns & Co, Inc.; Global Partner, INVESCO (1999-2001); Managing Director and President of Salomon Brothers Asset Management (1989-1999). | | None. |
Douglas H. McCorkindale (72) Board Member Portfolios Overseen: 58 | | Formerly Chairman (February 2001-June 2006), Chief Executive Officer (June 2000-July 2005), President (September 1997-July 2005) and Vice Chairman (March 1984-May 2000) of Gannett Co. Inc. (publishing and media). | | Director of Lockheed Martin Corp. (aerospace and defense) (since May 2001). |
Visit our website at www.prudentialfunds.com
| | | | |
Independent Board Members (1) | | | | |
| | | |
Name, Address, Age Position(s) Portfolios Overseen | | Principal Occupation(s) During Past Five Years | | Other Directorships Held |
Stephen P. Munn (69) Board Member Portfolios Overseen: 58 | | Lead Director (since 2007) and formerly Chairman (1993-2007) of Carlisle Companies Incorporated (manufacturer of industrial products). | | Lead Director (since 2007) of Carlisle Companies Incorporated (manufacturer of industrial products). |
Richard A. Redeker (68) Board Member & Independent Chair Portfolios Overseen: 58 | | Retired Mutual Fund Senior Executive (43 years); Management Consultant; Independent Directors Council (organization of 2,800 Independent Mutual Fund Directors)-Executive Committee, Chair of Policy Steering Committee, Governing Council. | | None. |
Robin B. Smith (72) Board Member Portfolios Overseen: 58 | | Chairman of the Board (since January 2003) of Publishers Clearing House (direct marketing); Member of the Board of Directors of ADLPartner (marketing) (since December 2010); formerly Chairman and Chief Executive Officer (August 1996-January 2003) of Publishers Clearing House. | | Formerly Director of BellSouth Corporation (telecommunications) (1992-2006). |
Stephen G. Stoneburn (68) Board Member Portfolios Overseen: 58 | | President and Chief Executive Officer (since June 1996) of Quadrant Media Corp. (publishing company); formerly President (June 1995-June 1996) of Argus Integrated Media, Inc.; Senior Vice President and Managing Director (January 1993-1995) of Cowles Business Media; Senior Vice President of Fairchild Publications, Inc (1975-1989). | | None. |
Prudential International Equity Fund
| | | | |
| Interested Board Members (1) | | |
| | | |
Name, Address, Age Position(s) Portfolios Overseen | | Principal Occupation(s) During Past Five Years | | Other Directorships Held |
Judy A. Rice* (63) Board Member & President Portfolios Overseen: 58 | | President, Chief Executive Officer, Chief Operating Officer and Officer-In-Charge (since February 2003) of Prudential Investments LLC; President, Chief Executive Officer and Officer-In-Charge (since April 2003) of Prudential Mutual Fund Services LLC; President, Chief Executive Officer (since May 2011) and Executive Vice President (since December 2008) of Prudential Investment Management Services LLC; Member of the Board of Directors of Jennison Associates LLC (since November 2010); formerly Vice President (February 1999-April 2006) of Prudential Investment Management Services LLC; President, COO, CEO and Manager of PIFM Holdco, LLC (since April 2006); formerly President, Chief Executive Officer, Chief Operating Officer and Officer-In-Charge (May 2003-June 2005) and Director (May 2003-March 2006) and Executive Vice President (June 2005-March 2006) of AST Investment Services, Inc.; Member of Board of Governors of the Investment Company Institute. | | None. |
Stuart S. Parker* (49) Board Member & President Portfolios Overseen: 58 | | President of Prudential Investments LLC (since January 2012); Executive Vice President of Jennison Associates LLC and Head of Retail Distribution of Prudential Investments LLC (June 2005 - December 2011). | | None. |
Scott E. Benjamin (38) Board Member & Vice President Portfolios Overseen: 58 | | Executive Vice President (since June 2009) of Prudential Investments LLC and Prudential Investment Management Services LLC; Executive Vice President (since September 2009) of AST Investment Services, Inc.; Senior Vice President of Product Development and Marketing, Prudential Investments (since February 2006); Vice President of Product Development and Product Management, Prudential Investments (2003-2006). | | None. |
* Ms. Rice has announced her retirement as President and Board Member effective December 31, 2011. Ms. Rice has been appointed as Vice President effective January 1, 2012. The Board has appointed Stuart S. Parker as President and Board Member effective January 1, 2012.
Visit our website at www.prudentialfunds.com
(1) The year that each Board Member joined the Funds’ Board is as follows:
Kevin J. Bannon, 2008; Linda W. Bynoe, 2005; Michael S. Hyland, 2008; Douglas H. McCorkindale, 2003; Stephen P. Munn, 2008; Richard A. Redeker, 2003; Robin B. Smith, 1996; Stephen G. Stoneburn, 1996; Judy A. Rice, Board Member since 2000 and President since 2003; Scott E. Benjamin, Board Member since 2010 and Vice President since 2009.
| | |
| Fund Officers (a)(1) | | |
| | |
Name, Address and Age Position with Fund | | Principal Occupation(s) During Past Five Years |
Kathryn L. Quirk (59) Chief Legal Officer | | Vice President and Corporate Counsel (since September 2004) of Prudential; Executive Vice President, Chief Legal Officer and Secretary (since July 2005) of PI and Prudential Mutual Fund Services LLC; Vice President and Corporate Counsel (since June 2005) and Secretary (since February 2006) of AST Investment Services, Inc.; formerly Senior Vice President and Assistant Secretary (November 2004-August 2005) of PI; formerly Assistant Secretary (June 2005-February 2006) of AST Investment Services, Inc.; formerly Managing Director, General Counsel, Chief Compliance Officer, Chief Risk Officer and Corporate Secretary (1997-2002) of Zurich Scudder Investments, Inc. |
Deborah A. Docs (53) Secretary | | Vice President and Corporate Counsel (since January 2001) of Prudential; Vice President (since December 1996) and Assistant Secretary (since March 1999) of PI; formerly Vice President and Assistant Secretary (May 2003-June 2005) of AST Investment Services, Inc. |
Jonathan D. Shain (53) Assistant Secretary | | Vice President and Corporate Counsel (since August 1998) of Prudential; Vice President and Assistant Secretary (since May 2001) of PI; Vice President and Assistant Secretary (since February 2001) of PMFS; formerly Vice President and Assistant Secretary (May 2003-June 2005) of AST Investment Services, Inc. |
Claudia DiGiacomo (37) Assistant Secretary | | Vice President and Corporate Counsel (since January 2005) of Prudential; Vice President and Assistant Secretary of PI (since December 2005); Associate at Sidley Austin Brown & Wood LLP (1999-2004). |
John P. Schwartz (40) Assistant Secretary | | Vice President and Corporate Counsel (since April 2005) of Prudential; Vice President and Assistant Secretary of PI (since December 2005); Associate at Sidley Austin Brown & Wood LLP (1997-2005). |
Andrew R. French (49) Assistant Secretary | | Vice President and Corporate Counsel (since February 2010) of Prudential; formerly Director and Corporate Counsel (2006-2010) of Prudential; Vice President and Assistant Secretary (since January 2007) of PI; Vice President and Assistant Secretary (since January 2007) of PMFS. |
Timothy J. Knierim (52) Chief Compliance Officer | | Chief Compliance Officer of Prudential Investment Management, Inc. (since July 2007); formerly Chief Risk Officer of PIM and PI (2002-2007) and formerly Chief Ethics Officer of PIM and PI (2006-2007). |
Valerie M. Simpson (53) Deputy Chief Compliance Officer | | Chief Compliance Officer (since April 2007) of PI and AST Investment Services, Inc.; formerly Vice President-Financial Reporting (June 1999-March 2006) for Prudential Life and Annuities Finance. |
Prudential International Equity Fund
| | |
| Fund Officers(a)(1) | | |
| | |
Name, Address and Age Position with Fund | | Principal Occupation(s) During Past Five Years |
Theresa C. Thompson (49) Deputy Chief Compliance Officer | | Vice President, Compliance, PI (since April 2004); and Director, Compliance, PI (2001-2004). |
Richard W. Kinville (43) Anti-Money Laundering Compliance Officer | | Vice President, Corporate Compliance, Anti-Money Laundering Unit (since January 2005) of Prudential; committee member of the American Council of Life Insurers Anti-Money Laundering and Critical Infrastructure Committee (since January 2007); formerly Investigator and Supervisor in the Special Investigations Unit for the New York Central Mutual Fire Insurance Company (August 1994-January 1999); Investigator in AXA Financial’s Internal Audit Department and Manager in AXA’s Anti-Money Laundering Office (January 1999-January 2005); first chair of the American Council of Life Insurers Anti-Money Laundering and Critical Infrastructure Committee (June 2007-December 2009). |
Grace C. Torres (52) Treasurer and Principal Financial and Accounting Officer | | Assistant Treasurer (since March 1999) and Senior Vice President (since September 1999) of PI; Assistant Treasurer (since May 2003) and Vice President (since June 2005) of AST Investment Services, Inc.; Senior Vice President and Assistant Treasurer (since May 2003) of Prudential Annuities Advisory Services, Inc.; formerly Senior Vice President (May 2003-June 2005) of AST Investment Services, Inc. |
M. Sadiq Peshimam (47) Assistant Treasurer | | Vice President (since 2005) of Prudential Investments LLC. |
Peter Parrella (53) Assistant Treasurer | | Vice President (since 2007) and Director (2004-2007) within Prudential Mutual Fund Administration; formerly Tax Manager at SSB Citi Fund Management LLC (1997-2004). |
(a) Excludes Ms. Rice and Mr. Benjamin, interested Board Members who also serve as President and Vice President, respectively.
(1) The year that each individual became an officer of the Fund is as follows: Kathryn L. Quirk, 2005; Deborah A. Docs, 2005; Jonathan D. Shain, 2005; Claudia DiGiacomo, 2005; John P. Schwartz, 2006; Andrew R. French, 2006; Timothy J. Knierim, 2007; Valerie M. Simpson, 2007; Theresa C. Thompson, 2008; Richard W. Kinville, 2011; Grace C. Torres, 1995; Sadiq Peshimam, 2006; Peter Parrella, 2007.
Explanatory Notes to Tables:
| n | Board Members are deemed to be “Interested,” as defined in the 1940 Act, by reason of their affiliation with Prudential Investments LLC and/or an affiliate of Prudential Investments LLC. |
| n | Unless otherwise noted, the address of all Board Members and Officers is c/o Prudential Investments LLC, Gateway Center Three, 100 Mulberry Street, Newark, New Jersey 07102-4077. |
| n | There is no set term of office for Board Members or Officers. The Board Members have adopted a retirement policy, which calls for the retirement of Board Members on December 31 of the year in which they reach the age of 75. |
| n | “Other Directorships Held” includes only directorships of companies required to register or file reports with the SEC under the 1934 Act) (that is, “public companies”) or other investment companies registered under the 1940 Act. |
| n | “Portfolios Overseen” includes all investment companies managed by Prudential Investments LLC. The investment companies for which PI serves as manager include the Prudential Investments Mutual Funds, The Prudential Variable Contract Accounts, Target Mutual Funds, The Prudential Series Fund, Prudential’s Gibraltar Fund, Inc. and the Advanced Series Trust. |
Visit our website at www.prudentialfunds.com
Approval of Advisory Agreements
The Fund’s Board of Directors
The Board of Directors (the “Board”) of Prudential International Equity Fund (the “Fund”)1 consists of 10 individuals, eight of whom are not “interested persons” of the Fund, as defined in the Investment Company Act of 1940, as amended (the “1940 Act”) (the “Independent Directors”). The Board is responsible for the oversight of the Fund and its operations, and performs the various duties imposed on the directors of investment companies by the 1940 Act. The Independent Directors have retained independent legal counsel to assist them in connection with their duties. The Chair of the Board is an Independent Director. The Board has established three standing committees: the Audit Committee, the Nominating and Governance Committee, and the Investment Committee. Each committee is chaired by, and composed of, Independent Directors.
Annual Approval of the Fund’s Advisory Agreements
As required under the 1940 Act, the Board determines annually whether to renew the Fund’s management agreement with Prudential Investments LLC (“PI”) and the Fund’s subadvisory agreement with Quantitative Management Associates LLC (“QMA”). In considering the renewal of the agreements, the Board, including all of the Independent Directors, met on June 6-8, 2011 and approved the renewal of the agreements through July 31, 2012, after concluding that the renewal of the agreements was in the best interests of the Fund and its shareholders.
In advance of the meetings, the Board requested and received materials relating to the agreements, and had the opportunity to ask questions and request further information in connection with their consideration. Among other things, the Board considered comparative fee information from PI and QMA. Also, the Board considered comparisons with other mutual funds in relevant Peer Universes and Peer Groups. The mutual funds included in each Peer Universe or Peer Group were objectively determined by Lipper Inc. (“Lipper”), an independent provider of mutual fund data. To the extent that PI deems appropriate, and for reasons addressed in detail with the Board, PI may provide supplemental data compiled by Lipper for the Board’s consideration. The comparisons placed the Fund in various quartiles over the one-, three-, five- and 10-year periods ending December 31, 2010, with the first quartile being the best 25% of the mutual funds (for performance, the best performing mutual funds and, for expenses, the lowest cost mutual funds).
In approving the agreements, the Board, including the Independent Directors advised by independent legal counsel, considered the factors it deemed relevant, including the nature, quality and extent of services provided by PI and the subadviser, the
| 1 | Prudential International Equity Fund is a series of Prudential World Fund, Inc. |
Prudential International Equity Fund
Approval of Advisory Agreements (continued)
performance of the Fund, the profitability of PI and its affiliates, expenses and fees, and the potential for economies of scale that may be shared with the Fund and its shareholders as the Fund’s assets grow. In their deliberations, the Directors did not identify any single factor which alone was responsible for the Board’s decision to approve the agreements with respect to the Fund. In connection with its deliberations, the Board considered information provided by PI throughout the year at regular Board meetings, presentations from portfolio managers and other information, as well as information furnished at or in advance of the meetings on June 6-8, 2011.
The Directors determined that the overall arrangements between the Fund and PI, which serves as the Fund’s investment manager pursuant to a management agreement, and between PI and QMA, which serves as the Fund’s subadviser pursuant to the terms of a subadvisory agreement with PI, are in the interest of the Fund and its shareholders in light of the services performed, fees charged and such other matters as the Directors considered relevant in the exercise of their business judgment.
The material factors and conclusions that formed the basis for the Directors’ reaching their determinations to approve the continuance of the agreements are separately discussed below.
Nature, Quality and Extent of Services
The Board received and considered information regarding the nature, quality and extent of services provided to the Fund by PI and QMA. The Board considered the services provided by PI, including but not limited to the oversight of the subadviser for the Fund, as well as the provision of fund recordkeeping, compliance, and other services to the Fund. With respect to PI’s oversight of the subadviser, the Board noted that PI’s Strategic Investment Research Group (“SIRG”), which is a business unit of PI, is responsible for monitoring and reporting to PI’s senior management on the performance and operations of the subadviser. The Board also considered that PI pays the salaries of all of the officers and non-independent Directors of the Fund. The Board also considered the investment subadvisory services provided by QMA, as well as adherence to the Fund’s investment restrictions and compliance with applicable Fund policies and procedures. The Board considered PI’s evaluation of the subadviser, as well as PI’s recommendation, based on its review of the subadviser, to renew the subadvisory agreement.
The Board reviewed the qualifications, backgrounds and responsibilities of PI’s senior management responsible for the oversight of the Fund and QMA, and also reviewed the qualifications, backgrounds and responsibilities of QMA’s portfolio managers who are responsible for the day-to-day management of the Fund’s portfolio. The Board was provided with information pertaining to PI’s and QMA’s organizational structure,
Visit our website at www.prudentialfunds.com
senior management, investment operations, and other relevant information pertaining to both PI and QMA. The Board also noted that it received favorable compliance reports from the Fund’s Chief Compliance Officer (“CCO”) as to both PI and QMA. The Board noted that QMA is affiliated with PI.
The Board concluded that it was satisfied with the nature, extent and quality of the investment management services provided by PI and the subadvisory services provided to the Fund by QMA, and that there was a reasonable basis on which to conclude that the Fund benefits from the services provided by PI and QMA under the management and subadvisory agreements.
Performance of the Fund
The Board received and considered information about the Fund’s historical performance. The Board considered that the Fund’s gross performance in relation to its Peer Universe (the Lipper International Large-Cap Core Funds Performance Universe) was in the third quartile over the one-year period and in the fourth quartile over the three-, five- and 10-year periods. The Board noted that the Fund outperformed its benchmark index over the one-year period, though it underperformed its benchmark index over the three-, five- and 10-year period. The Board also noted that the Fund’s performance during the first quarter of 2011 was in the first quartile. The Board considered PI’s assertion that the Fund’s overweight position in underperforming financial stocks during the global financial crisis was the cause of the Fund’s underperformance for the three- and five-year periods. The Board concluded that it was reasonable to renew the agreements, subject to its continued close scrutiny of the Fund’s performance.
Fees and Expenses
The Board considered the Fund’s actual management fees (which reflects any subsidies, expense caps or waivers) ranked in the Expense Group’s second quartile and that the Fund’s total expenses ranked in the Expense Group’s third quartile. The Board considered that the Fund’s total expenses were 6 basis points higher than the median for all funds included in the Expense Group. The Board concluded that the management fees (including subadvisory fees) and total expenses were reasonable in light of the services provided.
Costs of Services and Profits Realized by PI
The Board was provided with information on the profitability of PI and its affiliates in serving as the Fund’s investment manager. The Board discussed with PI the methodology utilized in assembling the information regarding profitability and considered its reasonableness. The Board recognized that it is difficult to make comparisons of profitability from fund management contracts because comparative information is not
Prudential International Equity Fund
Approval of Advisory Agreements (continued)
generally publicly available and is affected by numerous factors, including the structure of the particular adviser, the types of funds it manages, its business mix, numerous assumptions regarding allocations and the adviser’s capital structure and cost of capital. The Board did not separately consider the profitability of the subadviser, an affiliate of PI, as its profitability was reflected in the profitability report for PI. Taking these factors into account, the Board concluded that the profitability of PI and its affiliates in relation to the services rendered was not unreasonable.
Economies of Scale
The Board noted that the management fee schedule for the Fund includes breakpoints, which have the effect of decreasing the fee rate as assets increase, and that at its current level of assets, the Fund’s effective fee rate reflected some of those rate reductions. The Board received and discussed information concerning whether PI realizes economies of scale as the Fund’s assets grow beyond current levels. The Board took note that the Fund’s fee structure currently results in benefits to Fund shareholders whether or not PI realizes any economies of scale.
Other Benefits to PI and QMA
The Board considered potential ancillary benefits that might be received by PI and QMA and their affiliates as a result of their relationship with the Fund. The Board concluded that potential benefits to be derived by PI included fees received by affiliates of PI for serving as the Fund’s securities lending agent, transfer agency fees received by the Fund’s transfer agent (which is affiliated with PI), and benefits to the reputation as well as other intangible benefits resulting from PI’s association with the Fund. The Board concluded that the potential benefits to be derived by QMA included its ability to use soft dollar credits, as well as the potential benefits consistent with those generally resulting from an increase in assets under management, specifically, potential access to additional research resources and benefits to the reputation. The Board concluded that the benefits derived by PI and QMA were consistent with the types of benefits generally derived by investment managers and subadvisers to mutual funds.
After full consideration of these factors, the Board concluded that the approval of the agreements was in the best interests of the Fund and its shareholders.
Visit our website at www.prudentialfunds.com
| | | | |
| n MAIL | | n TELEPHONE | | n WEBSITE |
Gateway Center Three 100 Mulberry Street Newark, NJ 07102 | | (800) 225-1852 | | www.prudentialfunds.com |
|
| PROXY VOTING |
| The Board of Directors of the Fund has delegated to the Fund’s investment subadviser the responsibility for voting any proxies and maintaining proxy recordkeeping with respect to the Fund. A description of these proxy voting policies and procedures is available without charge, upon request, by calling (800) 225-1852 or by visiting the Securities and Exchange Commission’s website at www.sec.gov. Information regarding how the Fund voted proxies relating to portfolio securities during the most recent 12-month period ended June 30 is available on the Fund’s website and on the Commission’s website. |
|
| DIRECTORS |
Kevin J. Bannon • Scott E. Benjamin • Linda W. Bynoe • Michael S. Hyland • Douglas H. McCorkindale • Stephen P. Munn • Richard A. Redeker • Judy A. Rice •
Robin B. Smith • Stephen G. Stoneburn |
|
| OFFICERS |
| Judy A. Rice, President • Scott E. Benjamin, Vice President • Grace C. Torres, Treasurer and Principal Financial and Accounting Officer • Kathryn L. Quirk, Chief Legal Officer • Deborah A. Docs, Secretary • Timothy J. Knierim, Chief Compliance Officer • Valerie M. Simpson, Deputy Chief Compliance Officer • Theresa C. Thompson, Deputy Chief Compliance Officer • Richard W. Kinville, Anti-Money Laundering Compliance Officer • Jonathan D. Shain, Assistant Secretary • Claudia DiGiacomo, Assistant Secretary • John P. Schwartz, Assistant Secretary • Andrew R. French, Assistant Secretary • M. Sadiq Peshimam, Assistant Treasurer • Peter Parrella, Assistant Treasurer |
| | | | |
| MANAGER | | Prudential Investments LLC | | Gateway Center Three
100 Mulberry Street
Newark, NJ 07102 |
|
| INVESTMENT SUBADVISER | | Quantitative Management
Associates LLC | | Gateway Center Two
100 Mulberry Street
Newark, NJ 07102 |
|
| DISTRIBUTOR | | Prudential Investment
Management Services LLC | | Gateway Center Three
100 Mulberry Street
Newark, NJ 07102 |
|
| CUSTODIAN | | The Bank of New York Mellon | | One Wall Street
New York, NY 10286 |
|
| TRANSFER AGENT | | Prudential Mutual Fund
Services LLC | | PO Box 9658
Providence, RI 02940 |
|
| INDEPENDENT REGISTERED PUBLIC ACCOUNTING FIRM | | KPMG LLP | | 345 Park Avenue
New York, NY 10154 |
|
| FUND COUNSEL | | Willkie Farr & Gallagher LLP | | 787 Seventh Avenue
New York, NY 10019 |
|
| An investor should consider the investment objectives, risks, charges, and expenses of the Fund carefully before investing. The prospectus and summary prospectus contain this and other information about the Fund. An investor may obtain a prospectus and summary prospectus by visiting our website at www.prudentialfunds.com or by calling (800) 225-1852. The prospectus and summary prospectus should be read carefully before investing. |
|
| E-DELIVERY |
| To receive your mutual fund documents online, go to www.prudentialfunds.com/edelivery and enroll. Instead of receiving printed documents by mail, you will receive notification via email when new materials are available. You can cancel your enrollment or change your email address at any time by visiting the website address above. |
|
| SHAREHOLDER COMMUNICATIONS WITH DIRECTORS |
| Shareholders can communicate directly with the Board of Directors by writing to the Chair of the Board, Prudential International Equity Fund, Prudential Investments, Attn: Board of Directors, 100 Mulberry Street, Gateway Center Three, Newark, NJ 07102. Shareholders can communicate directly with an individual Director by writing to the same address. Communications are not screened before being delivered to the addressee. |
|
| AVAILABILITY OF PORTFOLIO SCHEDULE |
| The Fund files its complete schedule of portfolio holdings with the Securities and Exchange Commission for the first and third quarters of each fiscal year on Form N-Q. The Fund’s Forms N-Q are available on the Commission’s website at www.sec.gov. The Fund’s Forms N-Q may also be reviewed and copied at the Commission’s Public Reference Room in Washington, D.C. Information on the operation and location of the Public Reference Room may be obtained by calling (202) 551-8090. The Fund’s schedule of portfolio holdings is also available on the Fund’s website as of the end of each month. |
|
| The Fund’s Statement of Additional Information contains additional information about the Fund’s Directors and is available without charge, upon request, by calling (800) 225-1852. |
Mutual Funds:
| | | | |
ARE NOT INSURED BY THE FDIC OR ANY
FEDERAL GOVERNMENT AGENCY | | MAY LOSE VALUE | | ARE NOT A DEPOSIT OF OR GUARANTEED
BY ANY BANK OR ANY BANK AFFILIATE |

PRUDENTIAL INTERNATIONAL EQUITY FUND
| | | | | | | | | | | | | | | | |
| SHARE CLASS | | A | | B | | C | | F | | L | | M | | X | | Z |
| NASDAQ | | PJRAX | | PJRBX | | PJRCX | | N/A | | DEILX | | DEIMX | | DEIQX | | PJIZX |
| CUSIP | | 743969859 | | 743969867 | | 743969875 | | 743969842 | | 743969834 | | 743969826 | | 743969818 | | 743969883 |
MF190E 0215362-00001-00

PRUDENTIAL INVESTMENTS»MUTUAL FUNDS
PRUDENTIAL INTERNATIONAL VALUE FUND
ANNUAL REPORT · OCTOBER 31, 2011
Fund Type
International stock
Objective
Long-term growth of capital
This report is not authorized for distribution to prospective investors unless preceded or accompanied by a current prospectus.
The views expressed in this report and information about the Fund’s portfolio holdings are for the period covered by this report and are subject to change thereafter.
Prudential Investments, Prudential, the Prudential logo, and the Rock symbol are service marks of Prudential Financial, Inc. and its related entities, registered in many jurisdictions worldwide.

December 15, 2011
Dear Shareholder:
After leading Prudential Investments for the past eight years, I have decided to retire at the end of 2011 from my positions as President of Prudential Investments and President and Director of the Prudential International Value Fund (the Fund). Effective January 1, 2012, I will become Chairman of Prudential Investments and act as an advisor to the business during 2012 to help facilitate a smooth transition to my successor, Stuart Parker.
Stuart, who will become President of Prudential Investments and President and Director of the Fund on January 1, 2012, previously served as the Executive Vice President of Retail Mutual Fund Distribution at Prudential Investments. With more than 20 years of investment industry experience, Stuart brings a deep understanding of the needs and challenges facing today’s investors.
We hope you find the annual report for the Fund informative. We recognize that ongoing market volatility may make it a difficult time to be an investor. We continue to believe a prudent response to uncertainty is to maintain a diversified portfolio, including stock and bond mutual funds consistent with your tolerance for risk, time horizon, and financial goals.
Your financial professional can help you create a diversified investment plan that reflects your personal investor profile and risk tolerance. Keep in mind that diversification and asset allocation strategies do not assure a profit or protect against loss in declining markets. We encourage you to call your financial professional before making any investment decision.
Prudential Investments provides a wide range of mutual funds to choose from that can help you make progress toward your financial goals. Our funds offer the experience, resources, and professional discipline of Prudential Financial’s affiliated asset managers.
Finally, I’ve been privileged to have had the opportunity to help you address your investment needs, and I thank you for choosing the Prudential Investments family of mutual funds.
Sincerely,

Judy A. Rice, President
Prudential International Value Fund
| | | | |
| Prudential International Value Fund | | | 1 | |
Your Fund’s Performance
Performance data quoted represent past performance. Past performance does not guarantee future results. The investment return and principal value of an investment will fluctuate, so that an investor’s shares, when redeemed, may be worth more or less than their original cost. Current performance may be lower or higher than the past performance data quoted. An investor may obtain performance data as of the most recent month-end by visiting our website at www.prudentialfunds.com or by calling (800) 225-1852. The maximum initial sales charge is 5.50% (Class A shares). Gross operating expenses: Class A, 1.83%; Class B, 2.52%; Class C, 2.53%; Class Z, 1.47%. Net operating expenses: Class A, 1.78%; Class B, 2.52%; Class C, 2.53%; Class Z, 1.47%, after contractual reduction for Class A shares through 2/28/2013.
| | | | | | | | | | | | |
Cumulative Total Returns (Without Sales Charges) as of 10/31/11 | |
| | | One Year | | | Five Years | | | Ten Years | |
Class A | | | –6.56 | % | | | –11.01 | % | | | 54.11 | % |
Class B | | | –7.26 | | | | –14.29 | | | | 42.80 | |
Class C | | | –7.25 | | | | –14.27 | | | | 42.91 | |
Class Z | | | –6.30 | | | | –9.80 | | | | 57.91 | |
MSCI EAFE® ND Index | | | –4.08 | | | | –11.50 | | | | 74.62 | |
Lipper Average | | | –5.53 | | | | –12.63 | | | | 63.13 | |
| | | | | | | | | | | | |
Average Annual Total Returns (With Sales Charges) as of 9/30/11 | |
| | | One Year | | | Five Years | | | Ten Years | |
Class A | | | –16.10 | % | | | –4.48 | % | | | 3.10 | % |
Class B | | | –16.27 | | | | –4.28 | | | | 2.90 | |
Class C | | | –12.74 | | | | –4.11 | | | | 2.90 | |
Class Z | | | –10.94 | | | | –3.14 | | | | 3.94 | |
MSCI EAFE® ND Index | | | –9.36 | | | | –3.46 | | | | 5.03 | |
Lipper Average | | | –10.77 | | | | –3.92 | | | | 4.15 | |
| | | | | | | | | | | | |
Average Annual Total Returns (With Sales Charges) as of 10/31/11 | |
| | | One Year | | | Five Years | | | Ten Years | |
Class A | | | –11.70 | % | | | –3.40 | % | | | 3.83 | % |
Class B | | | –11.89 | | | | –3.19 | | | | 3.63 | |
Class C | | | –8.17 | | | | –3.03 | | | | 3.63 | |
Class Z | | | –6.30 | | | | –2.04 | | | | 4.67 | |
| | |
| 2 | | Visit our website at www.prudentialfunds.com |
| | | | | | | | | | | | |
Average Annual Total Returns (Without Sales Charges) as of 10/31/11 | |
| | | One Year | | | Five Years | | | Ten Years | |
Class A | | | –6.56 | % | | | –2.31 | % | | | 4.42 | % |
Class B | | | –7.26 | | | | –3.04 | | | | 3.63 | |
Class C | | | –7.25 | | | | –3.03 | | | | 3.63 | |
Class Z | | | –6.30 | | | | –2.04 | | | | 4.67 | |
Growth of a $10,000 Investment
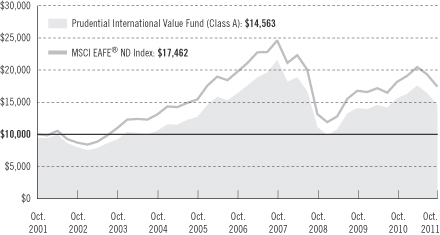
The graph compares a $10,000 investment in the Prudential International Value Fund (Class A shares) with a similar investment in the MSCI EAFE® ND Index by portraying the initial account values at the beginning of the 10-year period for Class A shares (October 31, 2001) and the account values at the end of the current fiscal year (October 31, 2011) as measured on a quarterly basis. For purposes of the graph, and unless otherwise indicated, it has been assumed that (a) the maximum applicable front-end sales charge was deducted from the initial $10,000 investment in Class A shares; (b) all recurring fees (including management fees) were deducted; and (c) all dividends and distributions were reinvested. The line graph provides information for Class A shares only. As indicated in the tables provided earlier, performance for Class B, Class C, and Class Z shares will vary due to the differing charges and expenses applicable to each share class (as indicated in the following paragraphs). Without the contractual distribution and service (12b-1) fee waiver of 0.05% for Class A shares in effect through February 28, 2013, the returns shown in the graph and for Class A shares in the tables would have been lower.
Total returns and the ending account values in the graph include changes in share price and reinvestment of dividends and capital gains distributions in a hypothetical investment for the periods shown. The Fund’s total returns do not reflect the deduction of income taxes on an individual’s investment. Taxes may reduce your actual investment returns on income or gains paid by the Fund or any gains you may realize if you sell your shares.
| | | | |
| Prudential International Value Fund | | | 3 | |
Your Fund’s Performance (continued)
Source: Prudential Investments LLC and Lipper Inc. Performance figures may reflect fee waivers and/or expense reimbursements. In the absence of such fee waivers and/or expense reimbursements, total returns would be lower.
The average annual total returns take into account applicable sales charges. Class A shares are subject to a maximum front-end sales charge of 5.50%, and a 12b-1 fee of up to 0.30% annually. All investors who purchase Class A shares in an amount of $1 million or more and sell these shares within 12 months of purchase are subject to a contingent deferred sales charge (CDSC) of 1%. Under certain limited circumstances, an exchange may be made from Class A, Class B, or Class C shares to Class Z shares of the Fund. Class B shares are subject to a declining CDSC of 5%, 4%, 3%, 2%, 1%, and 1%, respectively, for the first six years after purchase and a 12b-1 fee of 1% annually. Approximately seven years after purchase, Class B shares will automatically convert to Class A shares on a quarterly basis. Class C shares purchased are not subject to a front-end sales charge, but are subject to a CDSC of 1% for Class C shares sold within 12 months from the date of purchase, and an annual 12b-1 fee of 1%. Class Z shares are not subject to a sales charge or 12b-1 fees. The returns in the tables and graph reflect the share class expense structure in effect at the close of the fiscal period.
Benchmark Definitions
Morgan Stanley Capital International Europe, Australasia, and Far East ND Index
The Morgan Stanley Capital International Europe, Australasia, and Far East Index (MSCI EAFE® ND Index) is an unmanaged, weighted index of performance that reflects stock price movements of developed-country markets in Europe, Australasia, and the Far East. The Net Dividend (ND) version of the MSCI EAFE Index reflects the impact of the maximum withholding taxes on reinvested dividends.
Lipper International Large-Cap Core Funds Average
The Lipper International Large-Cap Core Funds Average (Lipper Average) represents returns based on an average return of all funds in the Lipper International Large-Cap Core Funds category. Funds in the Lipper Average invest at least 75% of their equity assets in companies strictly outside of the U.S. with market capitalizations (on a three-year weighted basis) above Lipper’s international large-cap floor. International large-cap core funds typically have average characteristics compared to the large-cap-specific subset of the MSCI EAFE Index.
Investors cannot invest directly in an index or average. The returns for the Index would be lower if they included the effects of sales charges, operating expenses, or taxes. Returns for the Lipper Average reflect the deduction of operating expenses of a mutual fund, but not sales charges or taxes.
| | | | |
Five Largest Holdings expressed as a percentage of net assets as of 10/31/11 | | | | |
Novartis AG, Pharmaceuticals | | | 1.8 | % |
Royal Dutch Shell PLC (Class B stock), Oil, Gas & Consumable Fuels | | | 1.7 | |
KDDI Corp., Telecommunications | | | 1.4 | |
Allianz SE, Insurance | | | 1.3 | |
SAP AG, Computer Services & Software | | | 1.2 | |
Holdings reflect only long-term investments and are subject to change.
| | |
| 4 | | Visit our website at www.prudentialfunds.com |
| | | | |
Five Largest Industries expressed as a percentage of net assets as of 10/31/11 | | | | |
Oil, Gas & Consumable Fuels | | | 10.4 | % |
Pharmaceuticals | | | 9.4 | |
Telecommunications | | | 7.6 | |
Insurance | | | 7.0 | |
Financial—Bank & Trust | | | 6.4 | |
Industry weightings reflect only long-term investments and are subject to change.
| | | | |
| Prudential International Value Fund | | | 5 | |
Strategy and Performance Overview
How did the Fund perform?
Prudential International Value Fund Class A shares declined 6.56% for the 12-month reporting period ended October 31, 2011, underperforming the Morgan Stanley Capital International Europe, Australasia, and Far East Net Dividend Index (MSCI EAFE ND Index), which fell 4.08%. The Class A shares also lagged the Lipper International Large-Cap Core Funds Average, which fell 5.53%.
How is the Fund managed?
LSV Asset Management (LSV) and Thornburg Investment Management, Inc. (Thornburg) are co-managers of the Fund, which combines the distinct approaches of LSV international value (deep value) and Thornburg international (core/relative value).
How did international stock markets perform?
International stock markets finished a turbulent period in the red in U.S. dollar terms, as measured by the MSCI EAFE ND Index, which gauges stock markets of economically developed nations other than the United States and Canada.
| | • | | International equity markets got off to a volatile start. A sharp decline for November 2010, caused largely by a flare-up in a sovereign-debt crisis in the geographically peripheral nations of the euro zone, was followed by a large gain for December. Stock prices soared on expectations that a moderate global economic recovery would continue and on pro-growth developments in the United States, such as an agreement in Washington to extend tax cuts. |
| | • | | The stock rally initially continued, with gains in three of the first four months of 2011. Markets, however, remained volatile driven by headline-grabbing developments. Growing political upheaval hurt economic growth in some nations in the Middle East and North Africa and threatened the stability of the global oil supply. Natural disasters occurred in Japan, Southeast Asia, and the United States. Those in Japan and Thailand disrupted global supply lines for critical automobile and electronics components, among other consequences. |
| | • | | The remainder of the period saw the MSCI EAFE ND Index experience five consecutive monthly declines (the largest in September) before rebounding sharply in October. Stock prices were hit hard by fears of recession in several developed economies and the worsening sovereign-debt turmoil. Concerns about a systemic shock to the world’s financial system increased as European leaders failed to contain the region’s debt crisis. |
| | • | | Individual markets turned in a mixed performance. Several suffered double-digit declines such as Greece, which lost the most due to fear it might default on its debt. Some other euro participants such as Italy and Portugal also saw double-digit declines. Meanwhile, New Zealand scored a double-digit |
| | |
| 6 | | Visit our website at www.prudentialfunds.com |
| | increase, the largest of the period. The United Kingdom and Switzerland posted small gains, somewhat buffered from the euro crisis but exposed to the threat of a financial system meltdown. Two markets not in the MSCI EAFE ND Index, the United States and Canada, delivered a single-digit gain and a slight loss, respectively. |
How did stock markets sectors and stock-specific styles perform?
International stock markets sectors also turned in a mixed performance for the period in U.S. dollar terms.
| | • | | Utilities suffered the largest decline. The next largest loss was in the financials sector, particularly banks and diversified financials. Telecommunications services, information technology, materials, industrials, and consumer discretionary all delivered single-digit losses. Three sectors posted gains, including energy and the defensive consumer staples and healthcare sectors. |
| | • | | International value stocks underperformed for the period in U.S. dollar terms, declining more than international growth stocks, according to MSCI EAFE indexes. Broadly, it was the large amount of shares of financial companies in the international value style that caused it to lag international growth. |
Why did the Fund underperform the MSCI EAFE ND Index?
The Fund underperformed largely due to emphasis and de-emphasis of particular countries relative to their index weightings, including positions in several regions not included in the benchmark.
| | • | | Investments in Canada, South Korea, and the United States aided its performance, but allocations to emerging markets countries hurt, particularly China, Brazil, and Turkey. |
| | • | | The Fund had smaller exposures than the MSCI EAFE ND Index to Australia and the United Kingdom, which hurt its relative performance, but this was largely offset by the absence of exposure to Greece. Favorable stock selection aided its performance, particularly in the consumer discretionary, industrials, and telecommunications sectors as well as in Japan and the United Kingdom. |
What impact did the LSV strategy have on the Fund’s performance?
LSV’s active quantitative strategy is based on research in value investing and behavioral finance. It believes that superior investment performance can be achieved by exploiting investor biases. Some of these biases include: a tendency to extrapolate the past too far into the future; wrongly equating a good company with a good investment irrespective of price; ignoring statistical evidence; and developing a “mindset” about a firm.
| | | | |
| Prudential International Value Fund | | | 7 | |
Strategy and Performance Overview (continued)
| | • | | The LSV portion slightly outperformed the MSCI EAFE ND Index for the period due partly to favorable stock selection, with stock picking in Japan accounting for most of its outperformance regionally. It benefitted from owning equities in that market and from avoiding stocks the LSV models signaled not to hold. For example, avoiding a certain Japanese electric utility firm (down more than 80% for the period) helped its relative performance, as did avoiding a few Japanese consumer electronics firms that performed poorly. It benefited greatly from having larger exposures than the MSCI EAFE ND Index to several telecommunications firms and from exposures to several Japanese stocks (not in the MSCI EAFE ND Index) that performed well. |
| | • | | Favorable sector allocation also helped the LSV portion’s relative performance. Asset selection in the financials sector proved profitable, specifically avoiding financials in the MSCI EAFE ND Index that performed poorly, including European and Asian banks. Overweight positions in other financial institutions (leasing and general services companies) added value, as did banks in regions seen as more stable globally (Australia and Switzerland). Holdings in utilities and telecommunications also benefited the LSV portion of the Fund. |
What impact did Thornburg’s strategy have on the Fund’s performance?
Thornburg seeks companies trading at a discount to what it believes are their intrinsic value. It tries to cut risk by exposing the portfolio to traditional, relative, and/or deep value stocks. Thornburg uses quantitative screens based upon metrics such as price/earnings and price to cash/flow to identify attractive prospects. It then performs fundamental research on the firms, including visiting their management, peers, competitors, and suppliers. It also searches for investment value among firms not identified by the screening process.
| | • | | The Thornburg portion of the Fund slightly underperformed the MSCI EAFE ND Index due primarily to poor stock selection in the financials sector and, to a lesser extent, in the materials sector. This impact was offset somewhat by a strong relative performance from Thornburg’s holdings in the consumer discretionary and industrials sectors. Another key detractor from its relative performance was its underweight exposure to Japan compared to the MSCI EAFE ND Index and exposure to China. |
| | • | | Thornburg was rewarded for overweighting stocks with positive price momentum and underweighting highly leveraged companies. |
| | |
| 8 | | Visit our website at www.prudentialfunds.com |
How did derivatives exposure affect the Fund’s performance?
Thornburg uses forward contracts to prevent currency movements from undermining stock positions in its portfolio. (LSV does not use derivatives to manage its portion of the Fund.)
| | • | | Thornburg evaluates the need for hedging on a stock-by-stock basis, considering how each company might be affected by currency movements. It hedges where it believes there is significant risk of a major adverse currency movement. Overall, foreign exchange hedging had a slightly negative effect on the Fund for the period. |
| | | | |
| Prudential International Value Fund | | | 9 | |
Fees and Expenses (Unaudited)
As a shareholder of the Fund, you incur two types of costs: (1) transaction costs, including sales charges (loads) on purchase payments and redemptions, as applicable, and (2) ongoing costs, including management fees, distribution and/or service (12b-1) fees, and other Fund expenses, as applicable. This example is intended to help you understand your ongoing costs (in dollars) of investing in the Fund and to compare these costs with the ongoing costs of investing in other mutual funds.
The example is based on an investment of $1,000 invested on May 1, 2011, at the beginning of the period, and held through the six-month period ended October 31, 2011. The example is for illustrative purposes only; you should consult the Prospectus for information on initial and subsequent minimum investment requirements.
The Fund’s transfer agent may charge additional fees to holders of certain accounts that are not included in the expenses shown in the table on the following page. These fees apply to individual retirement accounts (IRAs) and Section 403(b) accounts. As of the close of the six-month period covered by the table, IRA fees included an annual maintenance fee of $15 per account (subject to a maximum annual maintenance fee of $25 for all accounts held by the same shareholder). Section 403(b) accounts are charged an annual $25 fiduciary maintenance fee. Some of the fees may vary in amount, or may be waived, based on your total account balance or the number of Prudential Investments funds, including the Fund, that you own. You should consider the additional fees that were charged to your Fund account over the six-month period when you estimate the total ongoing expenses paid over the period and the impact of these fees on your ending account value, as these additional expenses are not reflected in the information provided in the expense table. Additional fees have the effect of reducing investment returns.
Actual Expenses
The first line for each share class in the table on the following page provides information about actual account values and actual expenses. You may use the information on this line, together with the amount you invested, to estimate the expenses that you paid over the period. Simply divide your account value by $1,000 (for example, an $8,600 account value ÷ $1,000 = 8.6), then multiply the result by the number on the first line under the heading “Expenses Paid During the Six-Month Period” to estimate the expenses you paid on your account during this period.
Hypothetical Example for Comparison Purposes
The second line for each share class in the table on the following page provides information about hypothetical account values and hypothetical expenses based on the Fund’s actual expense ratio and an assumed rate of return of 5% per year before expenses, which is not the Fund’s actual return. The hypothetical account values and
| | |
| 10 | | Visit our website at www.prudentialfunds.com |
expenses may not be used to estimate the actual ending account balance or expenses you paid for the period. You may use this information to compare the ongoing costs of investing in the Fund and other funds. To do so, compare this 5% hypothetical example with the 5% hypothetical examples that appear in the shareholder reports of the other funds.
Please note that the expenses shown in the table are meant to highlight your ongoing costs only and do not reflect any transactional costs such as sales charges (loads). Therefore, the second line for each share class in the table is useful in comparing ongoing costs only and will not help you determine the relative total costs of owning different funds. In addition, if these transactional costs were included, your costs would have been higher.
| | | | | | | | | | | | | | | | | | |
Prudential International
Value Fund | | Beginning Account
Value
May 1, 2011 | | | Ending Account
Value
October 31, 2011 | | | Annualized
Expense Ratio
Based on the
Six-Month Period | | | Expenses Paid
During the
Six-Month Period* | |
| | | | | | | | | | | | | | | | | | |
| Class A | | Actual | | $ | 1,000.00 | | | $ | 827.50 | | | | 1.84 | % | | $ | 8.48 | |
| | | Hypothetical | | $ | 1,000.00 | | | $ | 1,015.88 | | | | 1.84 | % | | $ | 9.35 | |
| | | | | | | | | | | | | | | | | | |
| Class B | | Actual | | $ | 1,000.00 | | | $ | 824.40 | | | | 2.57 | % | | $ | 11.82 | |
| | | Hypothetical | | $ | 1,000.00 | | | $ | 1,012.10 | | | | 2.57 | % | | $ | 13.03 | |
| | | | | | | | | | | | | | | | | | |
| Class C | | Actual | | $ | 1,000.00 | | | $ | 824.60 | | | | 2.59 | % | | $ | 11.91 | |
| | | Hypothetical | | $ | 1,000.00 | | | $ | 1,012.10 | | | | 2.59 | % | | $ | 13.14 | |
| | | | | | | | | | | | | | | | | | |
| Class Z | | Actual | | $ | 1,000.00 | | | $ | 828.80 | | | | 1.60 | % | | $ | 7.38 | |
| | | Hypothetical | | $ | 1,000.00 | | | $ | 1,017.14 | | | | 1.60 | % | | $ | 8.13 | |
* Fund expenses (net of fee waivers or subsidies, if any) for each share class are equal to the annualized expense ratio for each share class (provided in the table), multiplied by the average account value over the period, multiplied by the 184 days in the six-month period ended October 31, 2011, and divided by the 365 days in the Fund’s fiscal year ended October 31, 2011 (to reflect the six-month period). Expenses presented in the table include the expenses of any underlying portfolios in which the Fund may invest.
| | | | |
| Prudential International Value Fund | | | 11 | |
Portfolio of Investments
as of October 31, 2011
| | | | | | |
| Shares | | Description | | Value (Note 1) | |
| | | | | | |
LONG-TERM INVESTMENTS 97.0% | |
COMMON STOCKS 96.0% | |
|
Australia 4.6% | |
| 33,100 | | Bendigo and Adelaide Bank Ltd. | | $ | 326,840 | |
| 18,052 | | BHP Billiton Ltd. | | | 706,636 | |
| 61,388 | | BlueScope Steel Ltd. | | | 53,704 | |
| 12,700 | | Caltex Australia Ltd. | | | 176,377 | |
| 82,600 | | Challenger Ltd. | | | 393,766 | |
| 71,625 | | Downer EDI Ltd. | | | 227,457 | |
| 253,200 | | Emeco Holdings Ltd. | | | 262,312 | |
| 171,558 | | Goodman Fielder Ltd. | | | 99,772 | |
| 77,000 | | Metcash Ltd. | | | 336,960 | |
| 24,000 | | National Australia Bank Ltd. | | | 641,024 | |
| 176,200 | | OneSteel Ltd. | | | 224,086 | |
| 88,300 | | Pacific Brands Ltd. | | | 55,168 | |
| 6,200 | | Rio Tinto Ltd. | | | 445,122 | |
| 37,100 | | Tabcorp Holdings Ltd. | | | 114,075 | |
| 135,500 | | Telstra Corp. Ltd. | | | 439,958 | |
| | | | | | |
| | | | | 4,503,257 | |
|
Austria 0.6% | |
| 10,700 | | OMV AG | | | 372,856 | |
| 5,700 | | Voestalpine AG | | | 195,846 | |
| | | | | | |
| | | | | 568,702 | |
|
Belgium 0.6% | |
| 32,700 | | AGFA-Gevaert NV* | | | 81,684 | |
| 7,300 | | Delhaize Group SA | | | 476,838 | |
| 4,935 | | Dexia NV/SA* | | | 3,828 | |
| | | | | | |
| | | | | 562,350 | |
|
Brazil 1.4% | |
| 86,410 | | BM&FBOVESPA SA | | | 519,914 | |
| 14,217 | | Embraer SA, ADR | | | 395,517 | |
| 22,900 | | Natura Cosmeticos SA | | | 446,836 | |
| | | | | | |
| | | | | 1,362,267 | |
|
Canada 2.6% | |
| 11,370 | | Canadian National Railway Co. | | | 890,664 | |
| 17,200 | | Canadian Natural Resources Ltd. | | | 606,724 | |
| 13,711 | | Cenovus Energy, Inc. | | | 469,620 | |
See Notes to Financial Statements.
| | | | |
| Prudential International Value Fund | | | 13 | |
Portfolio of Investments
as of October 31, 2011 continued
| | | | | | |
| Shares | | Description | | Value (Note 1) | |
| | | | | | |
COMMON STOCKS (Continued) | |
|
Canada (cont’d.) | |
| 13,660 | | Potash Corp. of Saskatchewan, Inc. | | $ | 646,528 | |
| | | | | | |
| | | | | 2,613,536 | |
|
Cayman Islands 0.5% | |
| 20,969 | | Tencent Holdings Ltd. | | | 484,962 | |
|
China 2.0% | |
| 143,404 | | China Life Insurance Co. Ltd. (Class H Stock) | | | 370,756 | |
| 281,529 | | China Merchants Bank Co. Ltd. (Class H Stock) | | | 568,453 | |
| 20,000 | | Citi Securities Co. Ltd. (Class H Stock)* | | | 39,852 | |
| 830,300 | | Industrial & Commercial Bank of China Ltd. (Class H Stock) | | | 518,492 | |
| 167,399 | | Sinopharm Group Co. Ltd. (Class H Stock) | | | 455,648 | |
| | | | | | |
| | | | | 1,953,201 | |
|
Denmark 1.4% | |
| 7,700 | | Danske Bank A/S* | | | 105,278 | |
| 13,600 | | H. Lundbeck A/S | | | 274,235 | |
| 9,965 | | Novo Nordisk A/S (Class B Stock) | | | 1,057,949 | |
| | | | | | |
| | | | | 1,437,462 | |
|
Finland 0.5% | |
| 34,900 | | Nokia Oyj | | | 234,848 | |
| 13,700 | | Tieto Oyj | | | 216,906 | |
| | | | | | |
| | | | | 451,754 | |
|
France 8.2% | |
| 7,296 | | Air Liquide SA | | | 942,040 | |
| 20,000 | | AXA SA | | | 321,679 | |
| 8,100 | | BNP Paribas | | | 361,704 | |
| 2,700 | | Ciments Francais SA | | | 238,462 | |
| 37,707 | | Credit Agricole SA | | | 291,865 | |
| 9,900 | | France Telecom SA | | | 177,990 | |
| 7,275 | | LVMH Moet Hennessy Louis Vuitton SA | | | 1,205,789 | |
| 13,784 | | Publicis Groupe SA | | | 664,955 | |
| 3,900 | | Rallye SA | | | 124,694 | |
| 4,600 | | Renault SA | | | 192,198 | |
| 13,760 | | Sanofi | | | 984,377 | |
| 12,000 | | SCOR SE | | | 279,559 | |
| 5,863 | | Societe Generale | | | 167,868 | |
| 5,900 | | Thales SA | | | 208,076 | |
See Notes to Financial Statements.
| | |
| 14 | | Visit our website at www.prudentialfunds.com |
| | | | | | |
| Shares | | Description | | Value (Note 1) | |
| | | | | | |
COMMON STOCKS (Continued) | |
|
France (cont’d.) | |
| 16,400 | | Total SA | | $ | 855,707 | |
| 5,100 | | Valeo SA | | | 255,996 | |
| 4,100 | | Vallourec SA | | | 248,609 | |
| 26,900 | | Vivendi SA | | | 601,119 | |
| | | | | | |
| | | | | 8,122,687 | |
|
Germany 9.9% | |
| 15,190 | | Adidas AG | | | 1,069,783 | |
| 11,900 | | Allianz SE | | | 1,324,019 | |
| 3,300 | | Aurubis AG | | | 186,190 | |
| 8,700 | | BASF SE | | | 635,064 | |
| 3,100 | | Bayer AG | | | 197,507 | |
| 7,500 | | Daimler AG | | | 380,918 | |
| 8,700 | | Deutsche Bank AG | | | 359,733 | |
| 12,200 | | E.ON AG | | | 294,203 | |
| 13,228 | | Fresenius Medical Care AG & Co. KGaA | | | 963,603 | |
| 4,300 | | Hannover Rueckversicherung AG | | | 211,709 | |
| 4,100 | | Merck KGaA | | | 382,590 | |
| 100 | | MTU Aero Engines Holding AG | | | 6,697 | |
| 2,700 | | Muenchener Rueckversicherungs-Gesellschaft AG | | | 361,582 | |
| 5,100 | | Rheinmetall AG | | | 270,473 | |
| 7,300 | | RWE AG | | | 311,177 | |
| 20,118 | | SAP AG | | | 1,216,494 | |
| 9,400 | | Siemens AG | | | 985,316 | |
| 12,300 | | ThyssenKrupp AG | | | 352,378 | |
| 1,700 | | Volkswagen AG | | | 265,854 | |
| | | | | | |
| | | | | 9,775,290 | |
|
Hong Kong 2.7% | |
| 103,000 | | Cathay Pacific Airways Ltd. | | | 186,963 | |
| 314,120 | | Chaoda Modern Agriculture Holdings Ltd. | | | 25,473 | |
| 458,717 | | CNOOC Ltd. | | | 867,140 | |
| 388,800 | | First Pacific Co. Ltd. | | | 405,054 | |
| 49,348 | | Hong Kong Exchanges and Clearing Ltd. | | | 836,542 | |
| 58,100 | | Kingboard Chemical Holdings Ltd. | | | 198,447 | |
| 68,200 | | Yue Yuen Industrial Holdings Ltd. | | | 194,231 | |
| | | | | | |
| | | | | 2,713,850 | |
|
Ireland 0.6% | |
| 20,600 | | Allied Irish Banks PLC* | | | 2,850 | |
See Notes to Financial Statements.
| | | | |
| Prudential International Value Fund | | | 15 | |
Portfolio of Investments
as of October 31, 2011 continued
| | | | | | |
| Shares | | Description | | Value (Note 1) | |
| | | | | | |
COMMON STOCKS (Continued) | |
|
Ireland (cont’d.) | |
| 29,500 | | Bank of Ireland* | | $ | 4,153 | |
| 11,800 | | Covidien PLC | | | 555,072 | |
| 15,600 | | Irish Life & Permanent Group Holdings PLC* | | | 713 | |
| | | | | | |
| | | | | 562,788 | |
|
Israel 2.0% | |
| 62,300 | | Bank Hapoalim BM | | | 241,478 | |
| 9,500 | | Check Point Software Technologies Ltd.* | | | 547,485 | |
| 6,200 | | Elbit Systems Ltd. | | | 274,447 | |
| 22,014 | | Teva Pharmaceutical Industries Ltd., ADR | | | 899,272 | |
| | | | | | |
| | | | | 1,962,682 | |
|
Italy 1.8% | |
| 14,400 | | Banco Popolare Scarl | | | 21,371 | |
| 124,700 | | Enel SpA | | | 588,347 | |
| 35,100 | | ENI SpA | | | 775,848 | |
| 15,200 | | Finmeccanica SpA | | | 104,183 | |
| 5,500 | | Fondiaria-SAI SpA | | | 12,084 | |
| 251,900 | | Telecom Italia SpA | | | 313,433 | |
| | | | | | |
| | | | | 1,815,266 | |
|
Japan 16.6% | |
| 8,373 | | Alpine Electronics, Inc. | | | 98,321 | |
| 11,400 | | Aoyama Trading Co. Ltd. | | | 180,081 | |
| 6,600 | | Asahi Group Holdings Ltd. | | | 135,109 | |
| 15,366 | | Canon, Inc. | | | 697,583 | |
| 9,800 | | Circle K Sunkus Co. Ltd. | | | 159,779 | |
| 22,500 | | COMSYS Holdings Corp. | | | 220,234 | |
| 294 | | Dai-ichi Life Insurance Co. Ltd. (The) | | | 334,808 | |
| 3,374 | | Fanuc Corp. | | | 545,543 | |
| 73,900 | | Fukuoka Financial Group, Inc. | | | 286,143 | |
| 8,700 | | Fuyo General Lease Co. Ltd. | | | 298,940 | |
| 21,600 | | Heiwa Corp. | | | 357,934 | |
| 12,800 | | Hitachi Capital Corp. | | | 156,414 | |
| 7,100 | | Itochu Techno-Solutions Corp. | | | 307,421 | |
| 57,894 | | JX Holdings, Inc. | | | 337,226 | |
| 183 | | KDDI Corp. | | | 1,340,540 | |
| 16,700 | | Keihin Corp. | | | 257,586 | |
| 38,345 | | Komatsu Ltd. | | | 948,073 | |
| 50,100 | | Kurabo Industries Ltd. | | | 95,010 | |
See Notes to Financial Statements.
| | |
| 16 | | Visit our website at www.prudentialfunds.com |
| | | | | | |
| Shares | | Description | | Value (Note 1) | |
| | | | | | |
COMMON STOCKS (Continued) | |
|
Japan (cont’d.) | |
| 20,400 | | Kyorin Holdings, Inc. | | $ | 375,373 | |
| 25,600 | | Kyowa Exeo Corp. | | | 225,183 | |
| 88,000 | | Marubeni Corp. | | | 512,210 | |
| 5,400 | | Miraca Holdings, Inc. | | | 205,944 | |
| 5,900 | | Mitsubishi Corp. | | | 121,345 | |
| 191,000 | | Mitsubishi UFJ Financial Group, Inc. | | | 830,074 | |
| 25,800 | | Mitsui & Co. Ltd. | | | 376,539 | |
| 248,700 | | Mizuho Financial Group, Inc. | | | 348,103 | |
| 56,600 | | Nichirei Corp. | | | 251,226 | |
| 14,700 | | Nippon Electric Glass Co. Ltd. | | | 131,877 | |
| 22,800 | | Nippon Shokubai Co. Ltd. | | | 232,542 | |
| 12,300 | | Nippon Telegraph & Telephone Corp. | | | 630,939 | |
| 78,700 | | Nishi-Nippon City Bank Ltd. (The) | | | 214,622 | |
| 29,400 | | Nissan Shatai Co. Ltd. | | | 263,581 | |
| 300 | | NTT DoCoMo, Inc. | | | 532,813 | |
| 3,400 | | Sankyo Co. Ltd. | | | 177,673 | |
| 49,800 | | Sankyu, Inc. | | | 197,182 | |
| 29,400 | | Seino Holdings Co. Ltd. | | | 220,570 | |
| 13,500 | | Shimachu Co. Ltd. | | | 291,170 | |
| 25,400 | | Shizuoka Gas Co. Ltd. | | | 153,526 | |
| 5,200 | | Sumitomo Bakelite Co. Ltd. | | | 30,447 | |
| 44,400 | | Sumitomo Corp. | | | 549,723 | |
| 17,900 | | Sumitomo Mitsui Financial Group, Inc. | | | 500,332 | |
| 14,006 | | Sumitomo Mitsui Trust Holdings, Inc. | | | 47,930 | |
| 9,400 | | Takeda Pharmaceutical Co. Ltd. | | | 423,765 | |
| 52,600 | | Toagosei Co. Ltd. | | | 234,948 | |
| 16,700 | | Toppan Forms Co. Ltd. | | | 130,710 | |
| 26,370 | | Toyota Motor Corp. | | | 875,505 | |
| 18,300 | | Toyota Tsusho Corp. | | | 288,780 | |
| 44,900 | | Yokohama Rubber Co. Ltd. (The) | | | 256,298 | |
| | | | | | |
| | | | | 16,387,675 | |
|
Mexico 0.6% | |
| 249,556 | | Wal-Mart de Mexico SAB de CV (Class V Stock) | | | 644,161 | |
|
Netherlands 3.4% | |
| 18,800 | | Aegon NV | | | 89,656 | |
| 80,900 | | ING Groep NV, CVA* | | | 697,437 | |
| 19,500 | | Koninklijke Ahold NV | | | 249,139 | |
| 8,300 | | Koninklijke DSM NV | | | 424,727 | |
See Notes to Financial Statements.
| | | | |
| Prudential International Value Fund | | | 17 | |
Portfolio of Investments
as of October 31, 2011 continued
| | | | | | |
| Shares | | Description | | Value (Note 1) | |
| | | | | | |
COMMON STOCKS (Continued) | |
|
Netherlands (cont’d.) | |
| 21,300 | | Koninklijke KPN NV | | $ | 278,879 | |
| 8,366 | | Koninklijke Philips Electronics NV | | | 174,153 | |
| 2,000 | | Nutreco NV | | | 132,878 | |
| 13,769 | | Schlumberger Ltd. | | | 1,011,609 | |
| 11,700 | | Yandex NV (Class A Stock)* | | | 321,984 | |
| | | | | | |
| | | | | 3,380,462 | |
|
New Zealand 0.2% | |
| 279,800 | | Air New Zealand Ltd. | | | 236,469 | |
|
Norway 0.7% | |
| 15,500 | | Cermaq ASA* | | | 171,925 | |
| 20,700 | | DnB NOR ASA | | | 239,437 | |
| 9,700 | | Statoil ASA | | | 246,128 | |
| | | | | | |
| | | | | 657,490 | |
|
South Korea 1.1% | |
| 5,443 | | Hyundai Motor Co. | | | 1,096,157 | |
|
Spain 2.7% | |
| 28,659 | | Banco Bilbao Vizcaya Argentaria SA | | | 257,929 | |
| 19,900 | | Banco Espanol de Credito SA | | | 117,829 | |
| 73,500 | | Banco Santander SA | | | 622,094 | |
| 20,300 | | Repsol YPF SA | | | 611,024 | |
| 50,304 | | Telefonica SA | | | 1,069,041 | |
| | | | | | |
| | | | | 2,677,917 | |
|
Sweden 1.9% | |
| 31,600 | | Boliden AB | | | 449,239 | |
| 13,800 | | Electrolux AB (Class B Stock) | | | 256,962 | |
| 25,116 | | Hennes & Mauritz AB (Class B Stock) | | | 830,444 | |
| 5,500 | | NCC AB (Class B Stock) | | | 100,802 | |
| 16,500 | | Svenska Cellulosa AB (Class B Stock) | | | 240,876 | |
| | | | | | |
| | | | | 1,878,323 | |
|
Switzerland 7.7% | |
| 4,500 | | Baloise Holding AG | | | 366,551 | |
| 14,084 | | Clariant AG* | | | 152,517 | |
| 37,700 | | Credit Suisse Group AG* | | | 1,087,307 | |
| 500 | | Georg Fischer AG* | | | 207,181 | |
See Notes to Financial Statements.
| | |
| 18 | | Visit our website at www.prudentialfunds.com |
| | | | | | |
| Shares | | Description | | Value (Note 1) | |
| | | | | | |
COMMON STOCKS (Continued) | |
|
Switzerland (cont’d.) | |
| 12,133 | | Julius Baer Group Ltd.* | | $ | 455,895 | |
| 19,300 | | Nestle SA | | | 1,116,268 | |
| 32,367 | | Novartis AG | | | 1,823,404 | |
| 4,900 | | Roche Holding AG | | | 803,940 | |
| 700 | | Swatch Group AG (The) | | | 294,691 | |
| 2,100 | | Swiss Life Holding AG* | | | 257,916 | |
| 6,400 | | Swiss Re Ltd.* | | | 349,430 | |
| 1,400 | | Verwaltungs-und Privat-Bank AG | | | 141,069 | |
| 2,500 | | Zurich Financial Services AG* | | | 576,109 | |
| | | | | | |
| | | | | 7,632,278 | |
|
Taiwan 0.8% | |
| 34,191 | | HTC Corp. | | | 768,393 | |
|
Turkey 0.4% | |
| 122,100 | | Turkiye Garanti Bankasi A/S | | | 428,396 | |
|
United Kingdom 20.5% | |
| 50,858 | | ARM Holdings PLC | | | 477,194 | |
| 20,700 | | AstraZeneca PLC | | | 993,788 | |
| 60,800 | | Aviva PLC | | | 331,698 | |
| 115,600 | | BAE Systems PLC | | | 512,644 | |
| 85,481 | | Barclays PLC | | | 264,986 | |
| 75,157 | | Beazley PLC | | | 151,610 | |
| 34,400 | | Berendsen PLC | | | 256,294 | |
| 47,644 | | BG Group PLC | | | 1,033,112 | |
| 116,400 | | BP PLC | | | 856,567 | |
| 24,296 | | British American Tobacco PLC | | | 1,113,978 | |
| 243,400 | | BT Group PLC | | | 734,392 | |
| 22,573 | | Carnival PLC | | | 825,933 | |
| 38,100 | | Cookson Group PLC | | | 292,857 | |
| 29,400 | | Dairy Crest Group PLC | | | 163,032 | |
| 38,000 | | Drax Group PLC | | | 330,792 | |
| 97,800 | | DS Smith PLC | | | 334,130 | |
| 30,100 | | GlaxoSmithKline PLC | | | 675,514 | |
| 98,900 | | Home Retail Group PLC | | | 159,587 | |
| 55,000 | | Intermediate Capital Group PLC | | | 215,360 | |
| 165,503 | | Kingfisher PLC | | | 685,694 | |
| 234,900 | | Legal & General Group PLC | | | 413,802 | |
| 123,600 | | Logica PLC | | | 185,468 | |
See Notes to Financial Statements.
| | | | |
| Prudential International Value Fund | | | 19 | |
Portfolio of Investments
as of October 31, 2011 continued
| | | | | | |
| Shares | | Description | | Value (Note 1) | |
| | | | | | |
COMMON STOCKS (Continued) | |
|
United Kingdom (cont’d.) | |
| 24,800 | | Marks & Spencer Group PLC | | $ | 127,859 | |
| 48,900 | | Marston’s PLC | | | 76,033 | |
| 35,300 | | Mondi PLC | | | 268,479 | |
| 8,700 | | Next PLC | | | 356,579 | |
| 163,200 | | Old Mutual PLC | | | 286,927 | |
| 29,034 | | Pearson PLC | | | 533,378 | |
| 19,673 | | Reckitt Benckiser Group PLC | | | 1,009,808 | |
| 2,021,010 | | Rolls-Royce Holdings PLC (Class C Stock)* | | | 3,250 | |
| 29,290 | | Rolls-Royce Holdings PLC* | | | 329,702 | |
| 46,900 | | Royal Dutch Shell PLC (Class B Stock) | | | 1,682,683 | |
| 100,287 | | RSA Insurance Group PLC | | | 179,098 | |
| 14,457 | | SABMiller PLC | | | 526,526 | |
| 43,857 | | Standard Chartered PLC | | | 1,023,372 | |
| 167,579 | | Tesco PLC | | | 1,080,450 | |
| 56,900 | | Thomas Cook Group PLC | | | 47,214 | |
| 50,700 | | Tullett Prebon PLC | | | 285,886 | |
| 355,800 | | Vodafone Group PLC | | | 987,944 | |
| 84,500 | | WM Morrison Supermarkets PLC | | | 409,776 | |
| | | �� | | | |
| | | | | 20,223,396 | |
| | | | | | |
| | Total common stocks
(cost $90,004,987) | | | 94,901,171 | |
| | | | | | |
PREFERRED STOCK 1.0% | |
| | |
Germany | | | | | | |
| 5,492 | | Volkswagen AG, 1.81% (PRFC)
(cost $473,650) | | | 956,430 | |
| | | | | | |
| | Total long-term investments
(cost $90,478,637) | | | 95,857,601 | |
| | | | | | |
SHORT-TERM INVESTMENT 2.3% | |
|
Affiliated Money Market Mutual Fund | |
| 2,284,653 | | Prudential Investment Portfolios 2 - Prudential Core Taxable Money Market Fund
(cost $2,284,653)(a) | | | 2,284,653 | |
| | | | | | |
| | Total Investments 99.3%
(cost $92,763,290; Note 5) | | | 98,142,254 | |
| | Other assets in excess of liabilities(b) 0.7% | | | 722,897 | |
| | | | | | |
| | Net Assets 100% | | $ | 98,865,151 | |
| | | | | | |
See Notes to Financial Statements.
| | |
| 20 | | Visit our website at www.prudentialfunds.com |
The following abbreviations are used in the Portfolio descriptions:
ADR—American Depositary Receipt
CVA—Certificate Van Aandelen (Bearer)
PRFC—Preference Shares
EUR—Euro
| * | Non-income producing security. |
| (a) | Prudential Investments LLC, the manager of the Portfolio, also serves as manager of the Prudential Investment Portfolios 2 - Prudential Core Taxable Money Market Fund. |
| (b) | Includes net unrealized appreciation on the following derivative contracts held at reporting period end: |
Forward foreign currency exchange contracts outstanding at October 31, 2011:
| | | | | | | | | | | | | | | | | | |
Sale Contracts | | Counterparty | | Notional
Amount
(000) | | | Value at
Settlement
Date
Receivable | | | Current
Value | | | Unrealized
Appreciation | |
Euro, | | | | | | | | | | | | | | | | | | |
Expiring 11/09/11 | | Citigroup Global Markets | | EUR | 759 | | | $ | 1,090,409 | | | $ | 1,050,273 | | | $ | 40,136 | |
Expiring 11/09/11 | | State Street Bank | | EUR | 1,049 | | | | 1,503,056 | | | | 1,451,096 | | | | 51,960 | |
| | | | | | | | | | | | | | | | | | |
| | | | | | | | $ | 2,593,465 | | | $ | 2,501,369 | | | $ | 92,096 | |
| | | | | | | | | | | | | | | | | | |
Various inputs are used in determining the value of the Fund’s investments. These inputs are summarized in the three broad levels listed below.
Level 1—quoted prices generally for securities actively traded on a regulated securities exchange and for open-end mutual funds which trade at daily net asset value.
Level 2—other significant observable inputs (including, but not limited to, quoted prices for similar securities, interest rates, prepayment speeds, foreign currency exchange rates, and amortized cost) generally for debt securities, swaps, forward foreign currency contracts and for foreign stocks priced using vendor modeling tools.
Level 3—significant unobservable inputs for securities valued in accordance with Board approved fair valuation procedures.
See Notes to Financial Statements.
| | | | |
| Prudential International Value Fund | | | 21 | |
Portfolio of Investments
as of October 31, 2011 continued
The following is a summary of the inputs used as of October 31, 2011 in valuing such portfolio securities:
| | | | | | | | | | | | |
| | | Level 1 | | | Level 2 | | | Level 3 | |
Investments in Securities | | | | | | | | | | | | |
Common Stocks: | | | | | | | | | | | | |
Australia | | $ | — | | | $ | 4,503,257 | | | $ | — | |
Austria | | | — | | | | 568,702 | | | | — | |
Belgium | | | — | | | | 562,350 | | | | — | |
Brazil | | | 1,362,267 | | | | — | | | | — | |
Canada | | | 2,613,536 | | | | — | | | | — | |
Cayman Islands | | | — | | | | 484,962 | | | | — | |
China | | | 39,852 | | | | 1,913,349 | | | | — | |
Denmark | | | — | | | | 1,437,462 | | | | — | |
Finland | | | — | | | | 451,754 | | | | — | |
France | | | — | | | | 8,122,687 | | | | — | |
Germany | | | — | | | | 9,775,290 | | | | — | |
Hong Kong | | | — | | | | 2,688,377 | | | | 25,473 | |
Ireland | | | 558,635 | | | | 4,153 | | | | — | |
Israel | | | 1,446,757 | | | | 515,925 | | | | — | |
Italy | | | — | | | | 1,815,266 | | | | — | |
Japan | | | — | | | | 16,387,675 | | | | — | |
Mexico | | | 644,161 | | | | — | | | | — | |
Netherlands | | | 1,333,593 | | | | 2,046,869 | | | | — | |
New Zealand | | | — | | | | 236,469 | | | | — | |
Norway | | | — | | | | 657,490 | | | | — | |
South Korea | | | — | | | | 1,096,157 | | | | — | |
Spain | | | — | | | | 2,677,917 | | | | — | |
Sweden | | | — | | | | 1,878,323 | | | | — | |
Switzerland | | | 141,069 | | | | 7,491,209 | | | | — | |
Taiwan | | | — | | | | 768,393 | | | | — | |
Turkey | | | — | | | | 428,396 | | | | — | |
United Kingdom | | | — | | | | 20,223,396 | | | | — | |
Preferred Stock—Germany | | | — | | | | 956,430 | | | | — | |
Affiliated Money Market Mutual Fund | | | 2,284,653 | | | | — | | | | — | |
Other Financial Instruments* | | | | | | | | | | | | |
Foreign Forward Currency Exchange Contracts | | | — | | | | 92,096 | | | | — | |
| | | | | | | | | | | | |
Total | | $ | 10,424,523 | | | $ | 87,784,354 | | | $ | 25,473 | |
| | | | | | | | | | | | |
| * | Other financial instruments are derivative instruments not reflected in the Schedule of Investments, such as futures, forwards and swap contracts, which are recorded at the unrealized appreciation/depreciation on the instrument. |
See Notes to Financial Statements.
| | |
| 22 | | Visit our website at www.prudentialfunds.com |
Fair Value of Level 2 investments at 10/31/10 was $0. $148,619,868 was transferred into Level 2 from Level 1 at 10/31/11 as a result of using third-party vendor modeling tools due to significant market movements between the time at which the Portfolio valued its securities and the earlier closing of foreign markets.
It is the Portfolio’s policy to recognize transfers in and transfers out at the fair value as of the beginning of period.
The industry classification of investments and other assets in excess of liabilities shown as a percentage of net assets as of October 31, 2011 were as follows:
| | | | |
Oil, Gas & Consumable Fuels | | | 10.4 | % |
Pharmaceuticals | | | 9.4 | |
Telecommunications | | | 7.6 | |
Insurance | | | 7.0 | |
Financial—Bank & Trust | | | 6.4 | |
Food & Beverage | | | 5.3 | |
Automobile Manufacturers | | | 4.2 | |
Retail & Merchandising | | | 3.9 | |
Banks | | | 3.8 | |
Chemicals | | | 3.5 | |
Metals & Mining | | | 2.9 | |
Diversified Financial Services | | | 2.5 | |
Affiliated Money Market Mutual Fund | | | 2.3 | |
Holding Companies—Diversified | | | 1.9 | |
Computer Services & Software | | | 1.9 | |
Distribution/Wholesale | | | 1.9 | |
Machinery & Equipment | | | 1.9 | |
Aerospace/Defense | | | 1.8 | |
Entertainment & Leisure | | | 1.6 | |
Miscellaneous Manufacturing | | | 1.4 | |
Apparel | | | 1.4 | |
Transportation | | | 1.3 | |
Utilities | | | 1.2 | |
Media & Entertainment | | | 1.1 | |
Tobacco | | | 1.1 | % |
Consumer Products & Services | | | 1.1 | |
Automotive Parts | | | 1.1 | |
Healthcare Providers & Services | | | 1.0 | |
Forest & Paper Products | | | 0.8 | |
Internet | | | 0.8 | |
Engineering & Construction | | | 0.7 | |
Office Equipment | | | 0.7 | |
Advertising | | | 0.7 | |
Commercial Services | | | 0.7 | |
Healthcare Products | | | 0.6 | |
Software | | | 0.6 | |
Semiconductors | | | 0.5 | |
Cosmetics/Personal Care | | | 0.5 | |
Financial Services | | | 0.5 | |
Airlines | | | 0.4 | |
Electronic Components & Equipment | | | 0.4 | |
Home Furnishings | | | 0.3 | |
Building Materials | | | 0.2 | |
| | | | |
| | | 99.3 | |
Other assets in excess of liabilities | | | 0.7 | |
| | | | |
| | | 100.0 | % |
| | | | |
The Series invested in various derivative instruments during the reporting period. The primary types of risk associated with these derivative instruments were equity risk and foreign exchange risk.
The effect of such derivative instruments on the Series’ financial position and financial performance as reflected in the Statement of Assets and Liabilities and Statement of Operations is presented in the summary below.
See Notes to Financial Statements.
| | | | |
| Prudential International Value Fund | | | 23 | |
Portfolio of Investments
as of October 31, 2011 continued
Fair values of derivative instruments as of October 31, 2011 as presented in the Statement of Assets and Liabilities:
| | | | | | | | | | | | |
Derivatives not accounted for
as hedging instruments,
carried at fair value | | Asset Derivatives | | | Liability Derivatives | |
| | Balance
Sheet Location | | Fair
Value | | | Balance
Sheet Location | | Fair
Value | |
| Foreign exchange contracts | | Unrealized appreciation on foreign currency forward contracts | | $ | 92,096 | | | — | | $ | — | |
| | | | | | | | | | | | |
The effects of derivative instruments on the Statement of Operations for the year ended October 31, 2011 are as follows:
| | | | | | | | | | | | |
Amount of Realized Gain or (Loss) on Derivatives Recognized in Income | |
Derivatives not accounted for as hedging
instruments, carried at fair value | | Rights | | | Forward
Currency
Contracts | | | Total | |
Foreign exchange contracts | | $ | — | | | $ | (809,944 | ) | | $ | (809,944 | ) |
Equity contracts | | | (129,156 | ) | | | — | | | | (129,156 | ) |
| | | | | | | | | | | | |
Total | | $ | (129,156 | ) | | $ | (809,944 | ) | | $ | (939,100 | ) |
| | | | | | | | | | | | |
|
Change in Unrealized Appreciation or (Depreciation) on Derivatives Recognized in Income | |
Derivatives not accounted for as hedging
instruments, carried at fair value | | Rights | | | Forward
Currency
Contracts | | | Total | |
Foreign exchange contracts | | $ | — | | | $ | 720,246 | | | $ | 720,246 | |
Equity contracts | | | (80,624 | ) | | | — | | | | (80,624 | ) |
| | | | | | | | | | | | |
Total | | $ | (80,624 | ) | | $ | 720,246 | | | $ | 639,622 | |
| | | | | | | | | | | | |
For the year ended October 31, 2011, the Series’ average volume of derivative activities are as follows:
| | | | | | |
Forward Currency
Contracts—Purchased
(Value at Settlement Date Payable) | | | Forward Currency
Contracts—Sold
(Value at Settlement Date Receivable) | |
| $ | 2,381,543 | | | $ | 4,491,364 | |
See Notes to Financial Statements.
| | |
| 24 | | Visit our website at www.prudentialfunds.com |
Financial Statements
| | |
| OCTOBER 31, 2011 | | ANNUAL REPORT |
Prudential International Value Fund
Statement of Assets and Liabilities
as of October 31, 2011
| | | | |
Assets | | | | |
Investments at value: | | | | |
Unaffiliated investments (cost $90,478,637) | | $ | 95,857,601 | |
Affiliated investments (cost $2,284,653) | | | 2,284,653 | |
Foreign currency, at value (cost $13,717) | | | 13,929 | |
Dividends and interest receivable | | | 624,849 | |
Receivable for investments sold | | | 270,219 | |
Unrealized appreciation on foreign currency forward contracts | | | 92,096 | |
Receivable for Fund shares sold | | | 55,524 | |
Prepaid expenses | | | 1,880 | |
| | | | |
Total assets | | | 99,200,751 | |
| | | | |
| |
Liabilities | | | | |
Accrued expenses | | | 130,708 | |
Payable for Fund shares reacquired | | | 90,106 | |
Advisory fee payable | | | 81,667 | |
Affiliated transfer agent fee payable | | | 18,552 | |
Distribution fee payable | | | 14,567 | |
| | | | |
Total liabilities | | | 335,600 | |
| | | | |
| |
Net assets | | $ | 98,865,151 | |
| | | | |
| | | | | |
Net assets were comprised of: | | | | |
Common stock, at par value | | $ | 52,593 | |
Paid-in capital in excess of par | | | 117,928,870 | |
| | | | |
| | | 117,981,463 | |
Undistributed net investment income | | | 1,565,160 | |
Accumulated net realized loss on investment and foreign currency transactions | | | (26,179,213 | ) |
Net unrealized appreciation on investments and foreign currencies | | | 5,497,741 | |
| | | | |
Net assets, October 31, 2011 | | $ | 98,865,151 | |
| | | | |
See Notes to Financial Statements.
| | |
| 26 | | Visit our website at www.prudentialfunds.com |
| | | | |
Class A: | | | | |
Net asset value and redemption price per share
($38,857,540 ÷ 2,066,639 shares of common stock issued and outstanding) | | $ | 18.80 | |
Maximum sales charge (5.5% of offering price) | | | 1.09 | |
| | | | |
Maximum offering price to public | | $ | 19.89 | |
| | | | |
| |
Class B: | | | | |
Net asset value, offering price and redemption price per share
($1,974,921 ÷ 110,133 shares of common stock issued and outstanding) | | $ | 17.93 | |
| | | | |
| |
Class C: | | | | |
Net asset value, offering price and redemption price per share
($5,946,658 ÷ 331,092 shares of common stock issued and outstanding) | | $ | 17.96 | |
| | | | |
| |
Class Z: | | | | |
Net asset value, offering price and redemption price per share
($52,086,032 ÷ 2,751,462 shares of common stock issued and outstanding) | | $ | 18.93 | |
| | | | |
See Notes to Financial Statements.
| | | | |
| Prudential International Value Fund | | | 27 | |
Statement of Operations
Year Ended October 31, 2011
| | | | |
Net Investment Income | | | | |
Investment Income | | | | |
Unaffiliated dividend income (net of foreign withholding taxes of $342,540) | | $ | 3,878,430 | |
Affiliated dividend income | | | 4,140 | |
| | | | |
Total income | | | 3,882,570 | |
| | | | |
| |
Expenses | | | | |
Advisory fee | | | 1,330,603 | |
Distribution fee—Class A | | | 110,422 | |
Distribution fee—Class B | | | 26,512 | |
Distribution fee—Class C | | | 66,902 | |
Transfer agent’s fee and expenses (including affiliated expense of $165,800) | | | 227,000 | |
Custodian’s fees and expenses | | | 206,000 | |
Registration fees | | | 52,000 | |
Legal fees and expenses | | | 47,000 | |
Reports to shareholders | | | 35,000 | |
Audit fees | | | 30,000 | |
Directors’ fees | | | 15,000 | |
Insurance fees | | | 4,000 | |
Interest expense (Note 7) | | | 792 | |
Miscellaneous | | | 40,143 | |
| | | | |
Total expenses | | | 2,191,374 | |
| | | | |
Net investment income | | | 1,691,196 | |
| | | | |
| |
Realized And Unrealized Gain (Loss) On Investment And Foreign Currency Transactions | | | | |
Net realized gain (loss) on: | | | | |
Investment transactions (Note 8) | | | 11,544,445 | |
Foreign currency transactions | | | (770,353 | ) |
| | | | |
| | | 10,774,092 | |
| | | | |
Net change in unrealized appreciation (depreciation) on: | | | | |
Investments | | | (13,460,882 | ) |
Foreign currencies | | | 672,180 | |
| | | | |
| | | (12,788,702 | ) |
| | | | |
Net loss on investments and foreign currencies | | | (2,014,610 | ) |
| | | | |
Net Decrease In Net Assets Resulting From Operations | | $ | (323,414 | ) |
| | | | |
See Notes to Financial Statements.
| | |
| 28 | | Visit our website at www.prudentialfunds.com |
Statement of Changes in Net Assets
| | | | | | | | |
| | | Year Ended October 31, | |
| | | 2011 | | | 2010 | |
Increase (Decrease) in Net Assets | | | | | | | | |
Operations | | | | | | | | |
Net investment income | | $ | 1,691,196 | | | $ | 2,522,160 | |
Net realized gain (loss) on investment and foreign currency transactions | | | 10,774,092 | | | | (654,388 | ) |
Net change in unrealized appreciation (depreciation) on investments and foreign currencies | | | (12,788,702 | ) | | | 19,531,537 | |
| | | | | | | | |
Net increase in net assets resulting from operations | | | (323,414 | ) | | | 21,399,309 | |
| | | | | | | | |
| | |
Dividends and Distributions (Note 1) | | | | | | | | |
Dividends from net investment income | | | | | | | | |
Class A | | | (376,129 | ) | | | (304,699 | ) |
Class B | | | (5,738 | ) | | | (1,944 | ) |
Class C | | | (12,666 | ) | | | (3,666 | ) |
Class Z | | | (1,693,194 | ) | | | (1,196,167 | ) |
| | | | | | | | |
| | | (2,087,727 | ) | | | (1,506,476 | ) |
| | | | | | | | |
| | |
Series share transactions (Net of share conversions) (Note 6) | | | | | | | | |
Net proceeds from shares sold | | | 27,552,858 | | | | 37,559,143 | |
Net asset value of shares issued in reinvestment of dividends and distributions | | | 2,073,598 | | | | 1,495,770 | |
Cost of shares reacquired | | | (142,888,872 | ) | | | (38,267,943 | ) |
| | | | | | | | |
Net increase (decrease) in net assets from Series share transactions | | | (113,262,416 | ) | | | 786,970 | |
| | | | | | | | |
| | |
Capital Contributions (Note 6) | | | | | | | | |
Proceeds from regulatory settlement | | | — | | | | 329,878 | |
| | | | | | | | |
Total increase (decrease) | | | (115,673,557 | ) | | | 21,009,681 | |
| | |
Net Assets | | | | | | | | |
Beginning of year | | | 214,538,708 | | | | 193,529,027 | |
| | | | | | | | |
End of year(a) | | $ | 98,865,151 | | | $ | 214,538,708 | |
| | | | | | | | |
(a) Includes undistributed net investment income of: | | $ | 1,565,160 | | | $ | 2,707,642 | |
| | | | | | | | |
See Notes to Financial Statements.
| | | | |
| Prudential International Value Fund | | | 29 | |
Notes to Financial Statements
Prudential World Fund, Inc. (the “Fund”), is registered under the Investment Company Act of 1940, as amended, (“1940 Act”) as an open-end management investment company and currently consists of three series: Prudential International Value Fund (the “Series”), Prudential International Equity Fund and Prudential Emerging Markets Debt Local Currency Fund. These financial statements relate to Prudential International Value Fund. The financial statements of the other series are not presented herein. The investment objective of the Series is to achieve long-term growth of capital. The Series seeks to achieve its objective primarily through investment in common stock and preferred stock of foreign companies of all sizes. The Series is diversified.
Note 1. Accounting Policies
The following is a summary of significant accounting policies followed by the Fund and the Series in the preparation of its financial statements.
Securities Valuation: Securities listed on a securities exchange (other than options on securities and indices) are valued at the last sale price on such exchange on the day of valuation or, if there was no sale on such day, at the mean between the last reported bid and ask prices, or at the last bid price on such day in the absence of an asked price. Securities traded via NASDAQ are valued at the NASDAQ official closing price (NOCP) on the day of valuation, or if there was no NOCP, at the last sale price. Securities that are actively traded in the over-the-counter market, including listed securities for which the primary market is believed by Prudential Investments LLC (“PI” or “Manager”), in consultation with the subadvisor(s), to be over-the-counter, are valued at market value using prices provided by an independent pricing agent or principal market maker. Options on securities and indices traded on an exchange are valued at the last sale price as of the close of trading on the applicable exchange or, if there was no sale, at the mean between the most recently quoted bid and asked prices on such exchange. Futures contracts and options thereon traded on a commodities exchange or board of trade are valued at the last sale price at the close of trading on such exchange or board of trade or, if there was no sale on the applicable commodities exchange or board of trade on such day, at the mean between the most recently quoted bid and asked prices on such exchange or board of trade or at the last bid price in the absence of an asked price. Securities for which market quotations are not readily available, or whose values have been affected by events occurring after the close of the security’s foreign market and before the Funds’
| | |
| 30 | | Visit our website at www.prudentialfunds.com |
normal pricing time, are valued at fair value in accordance with the Board of Directors’ approved fair valuation procedures. When determining the fair valuation of securities some of the factors influencing the valuation include the nature of any restrictions on disposition of the securities; assessment of the general liquidity of the securities; the issuer’s financial condition and the markets in which it does business; the cost of the investment; the size of the holding and the capitalization of issuer; the prices of any recent transactions or bids/offers for such securities or any comparable securities; any available analyst media or other reports or information deemed reliable by the investment advisor regarding the issuer or the markets or industry in which it operates. Using fair value to price securities may result in a value that is different from a security’s most recent closing price and from the price used by other mutual funds to calculate their net asset values.
Investments in open-end, non-exchange-traded mutual funds are valued at their net asset value as of the close of the New York Stock Exchange on the date of the valuation.
Short-term securities of sufficient credit quality, which mature in 60 days or less, are valued at amortized cost, which approximates market value. The amortized cost method involves valuing a security at its cost on the date of purchase and thereafter assuming a constant amortization to maturity of the difference between the principal amount due at maturity and cost. Short-term securities which mature in more than 60 days are valued at fair value.
Securities Lending: The Series may lend its portfolio securities to broker-dealers. The loans are secured by collateral at least equal at all times to the market value of the securities loaned. Loans are subject to termination at the option of the borrower or the Series. Upon termination of the loan, the borrower will return to the lender securities identical to the loaned securities. Should the borrower of the securities fail financially, the Series has the right to repurchase the securities using the collateral in the open market. The Series recognizes income, net of any rebate and securities lending agent fees, for lending its securities in the form of fees or interest on the investment of any cash received as collateral. The Series also continues to receive interest and dividends or amounts equivalent thereto, on the securities loaned and recognizes any unrealized gain or loss in the market price of the securities loaned that may occur during the term of the loan.
| | | | |
| Prudential International Value Fund | | | 31 | |
Notes to Financial Statements
continued
Foreign Currency Translation: The books and records of the Series are maintained in U.S. dollars. Foreign currency amounts are translated into U.S. dollars on the following basis:
(i) market value of investment securities, other assets and liabilities—at the current rates of exchange.
(ii) Purchases and sales of investment securities, income and expenses—at the rates of exchange prevailing on the respective dates of such transactions.
Although the net assets of the Series are presented at the foreign exchange rates and market values at the close of the fiscal period, the Series does not isolate that portion of the results of operations arising as a result of changes in the foreign exchange rates from the fluctuations arising from changes in the market prices of long-term securities held at the end of the fiscal period. Similarly, the Series does not isolate the effect of changes in foreign exchange rates from the fluctuations arising from changes in the market prices of long-term portfolio securities sold during the fiscal period. Accordingly, realized foreign currency gains or losses are included in the reported net realized gains or losses on investment transactions.
Net realized gains or losses on foreign currency transactions represent net foreign exchange gains or losses from the holding of foreign currencies, currency gains or losses realized between the trade date and settlement date on securities transactions, and the difference between the amounts of dividends, interest and foreign withholding taxes recorded on the Series’ books and the U.S. dollar equivalent amounts actually received or paid. Net unrealized currency gains or losses from valuing foreign currency denominated assets and liabilities (other than investments) at period end exchange rates are reflected as a component of net unrealized appreciation (depreciation) on investments and foreign currencies.
Foreign security and currency transactions may involve certain considerations and risks not typically associated with those of domestic origin as a result of, among other factors, the possibility of political and economic instability or the level of governmental supervision and regulation of foreign securities markets.
Foreign Currency Contracts: A forward currency contract is a commitment to purchase or sell a foreign currency at a future date at a negotiated forward rate between two parties. The Series enters into forward currency contracts in order to
| | |
| 32 | | Visit our website at www.prudentialfunds.com |
hedge its exposure to changes in foreign currency exchange rates on its foreign portfolio holdings or specific receivables and payables denominated in a foreign currency. The contracts are valued daily at current forward exchange rates and any unrealized gain or loss is included in net unrealized appreciation or depreciation on foreign currencies. Gain or loss is realized on the settlement date of the contract equal to the difference between the settlement value of the original and negotiated forward contracts. This gain or loss, if any, is included in net realized gain (loss) on foreign currency transactions. Risks may arise upon entering into these contracts from the potential inability of the counterparties to meet the terms of their contracts. Forward currency contracts involve elements of both market and credit risk in excess of the amounts reflected on the Statement of Assets and Liabilities. The Series’ maximum risk of loss from counterparty credit risk is the net value of the cash flows to be received from the counterparty at the end of the contract’s life. A master netting agreement between the Series and the counterparty permits the Series to offset amounts payable by the Series to the same counterparty against amounts to be received; and by the receipt of collateral from the counterparty by the Series to cover the Series’ exposure to the counterparty. However, there is no assurance that such mitigating factors are easily enforceable.
Securities Transactions and Net Investment Income: Securities transactions are recorded on the trade date. Realized and unrealized gains or losses on sales of securities are calculated on the identified cost basis. Dividend income is recorded on the ex-dividend date and interest income, including amortization of premium and accretion of discount on debt securities, as required, is recorded on an accrual basis. Expenses are recorded on the accrual basis. Net investment income or loss, (other than distribution fees which are charged directly to the respective class) and unrealized and realized gains or losses are allocated daily to each class of shares based upon the relative proportion of net assets of each class at the beginning of the day.
Dividends and Distributions: The Series expects to pay dividends of net investment income and distributions of net realized capital gains, if any, annually. Dividends and distributions to shareholders, which are determined in accordance with federal income tax regulations and which may differ from generally accepted accounting principles, are recorded on the ex-dividend date. Permanent book/tax differences relating to income and gains are reclassified amongst undistributed net investment income, accumulated net realized gain or loss and paid-in capital in excess of par, as appropriate.
Taxes: For federal income tax purposes, each series in the Fund is treated as a separate taxpaying entity. It is the Series’ policy to continue to meet the requirements
| | | | |
| Prudential International Value Fund | | | 33 | |
Notes to Financial Statements
continued
of the Internal Revenue Code applicable to regulated investment companies and to distribute all of its taxable net income and capital gains, if any, to shareholders. Therefore, no federal income tax provision is required.
Withholding taxes on foreign dividends are recorded, net of reclaimable amounts, at the time the related income is earned.
Estimates: The preparation of the financial statements requires management to make estimates and assumptions that affect the reported amounts and disclosures in the financial statements. Actual results could differ from those estimates.
Note 2. Agreements
The Fund has a management agreement for the Series with Prudential Investments LLC (“PI”). Pursuant to this agreement, PI has responsibility for all investment advisory services and supervises the subadvisor’s performance of such services. PI has entered into subadvisory agreements with LSV Asset Management (“LSV”) and Thornburg Investment Management (“Thornburg”) for the Series.
The subadvisory agreements provide that LSV and Thornburg furnish investment advisory services in connection with the management of the Series. In connection therewith, LSV and Thornburg are obligated to keep certain books and records of the Series. PI pays for the services of the subadvisors, the compensation of officers of the Series, occupancy and certain clerical and bookkeeping costs of the Series. The Series bears all other costs and expenses.
The management fee paid to PI is computed daily and payable monthly at an annual rate of 1% of the average daily net assets up to $300 million, 0.95% of the next $700 million of average daily net assets and 0.90% of average daily net assets in excess of $1 billion of the Series. The effective management fee rate as of October 31, 2011 was 1.00%.
The Fund has a distribution agreement with Prudential Investment Management Services LLC (“PIMS”), which acts as the distributor of the Class A, Class B, Class C and Class Z shares of the Series. The Series compensates PIMS for distributing and servicing the Series’ Class A, Class B and Class C shares pursuant to plans of distribution (the “Class A, B and C Plans”), regardless of expenses actually incurred by
| | |
| 34 | | Visit our website at www.prudentialfunds.com |
PIMS. The distribution fees are accrued daily and payable monthly. No distribution or service fees are paid to PIMS as distributor of the Class Z shares of the Series.
Pursuant to the Class A, B and C Plans, the Series compensates PIMS for distribution related activities at an annual rate of up to 0.30%, 1% and 1% of the average daily net assets of the Class A, B and C shares, respectively. Through February 28, 2013, PIMS contractually agreed to limit such fee to 0.25% of the average daily net assets of the Class A shares.
PIMS has advised the Series that it received $34,396 in front-end sales charges resulting from sales of Class A shares, during the year ended October 31, 2011. From these fees, PIMS paid such sales charges to broker-dealers, which in turn paid commissions to salespersons and incurred other distribution costs.
PIMS advised the Series that for the year ended October 31, 2011, it received $4,743 and $158 in contingent deferred sales charges imposed upon certain redemptions by Class B and Class C shareholders, respectively.
PI and PIMS are indirect, wholly-owned subsidiaries of Prudential Financial, Inc. (“Prudential”).
Note 3. Other Transactions with Affiliates
Prudential Mutual Fund Services LLC (“PMFS”), an affiliate of PI and an indirect, wholly owned subsidiary of Prudential, serves as the Series’ transfer agent. The transfer agent fees and expenses in the Statement of Operations also include certain out-of-pocket expenses paid to non-affiliates, where applicable.
The Series invests in the Prudential Core Taxable Money Market Fund (the “Core Fund”), a series of Prudential Investment Portfolios 2 registered under the 1940 Act, as amended, and managed by PI. Earnings from the Core Fund are disclosed on the Statement of Operations as affiliated dividend income.
Note 4. Portfolio Securities
Purchases and sales of investment securities, other than short-term investments, for the year ended October 31, 2011 were $33,616,271 and $32,464,429, respectively.
| | | | |
| Prudential International Value Fund | | | 35 | |
Notes to Financial Statements
continued
Note 5. Distributions and Tax Information
Distributions to shareholders, which are determined in accordance with federal income tax regulations, which may differ from generally accepted accounting principles, are recorded on the ex-dividend date. In order to present undistributed net investment income, accumulated net realized loss on investment and foreign currency transactions and paid-in capital in excess of par on the Statement of Assets and Liabilities that more closely represent their tax character, certain adjustments have been made to undistributed net investment income, accumulated net realized loss on investment and foreign currency transactions and paid-in capital in excess of par. For the tax year ended October 31, 2011 the adjustments were to decrease undistributed net investment income by $745,951, increase accumulated net realized loss on investment and foreign currency transactions by $6,741,882 and increase paid-in-capital in excess of par by $7,487,833 due to differences in the treatment for book and tax purposes of certain transactions involving foreign securities and currencies, investments in passive foreign investment companies and in-kind distributions for shareholder redemptions. Net investment income, net realized gain and net assets were not affected by this change.
For the years ended October 31, 2011 and 2010, the tax character of dividends paid as reflected in the Statement of Changes in Net Assets were $2,087,727 and $1,506,476 of ordinary income, respectively.
As of October 31, 2011, the accumulated undistributed earnings on a tax basis was $1,657,256 from ordinary income. This differs from the amount shown on the Statement of Assets and Liabilities primarily due to cumulative timing differences between financial and tax reporting.
For federal income tax purposes, the Series had a capital loss carryforward as of October 31, 2011 of approximately $25,464,000 of which $24,487,000 expires in 2017, and $977,000 expires in 2018. The Series utilized capital loss carryforward to offset net taxable capital gains realized in the fiscal year ended October 31, 2011 of approximately $3,208,000. Accordingly, no capital gain distributions are expected to be paid to shareholders until net gains have been realized in excess of such carryforward. Under the recently enacted Regulated Investment Company Modernization Act of 2010 (“the Act”), the Series is permitted to carryforward capital losses incurred in taxable years beginning after December 22, 2010 (“post-enactment
| | |
| 36 | | Visit our website at www.prudentialfunds.com |
losses”) for an unlimited period. However, any post-enactment losses are required to be utilized before the utilization of losses incurred prior to the effective date of the Act. As a result of this ordering rule, capital loss carryforwards related to the taxable years beginning prior to the effective date of the Act may have an increased likelihood to expire unused. Additionally, post-enactment capital losses that are carried forward will retain their character as either short-term or long-term capital losses rather than being considered all short-term as under previous law.
The federal income tax basis of the Series’ investments and the net unrealized appreciation as of October 31, 2011 was as follows:
| | | | | | | | | | |
Tax Basis | | Appreciation | | Depreciation | | Net
Unrealized
Appreciation | | Other
Cost Basis
Adjustment | | Total Net
Unrealized
Appreciation |
| $93,478,495 | | $17,364,899 | | $(12,701,140) | | $4,663,759 | | $26,682 | | $4,690,441 |
The difference between book basis and tax basis was primarily attributable to deferred losses on wash sales and mark-to-market of open passive foreign investment companies.
Management has analyzed the Series‘ tax positions taken on federal income tax returns for all open tax years and has concluded that no provision for income tax is required in the Series’ financial statements for the current reporting period. The Series’ federal and state income and federal excise tax returns for tax years for which the applicable statuses of limitations have not expired are subject to examination by the Internal Revenue Service and state departments of revenue.
Note 6. Capital
The Series offers Class A, Class B, Class C and Class Z shares. Class A shares are sold with a front-end sales charge of up to 5.50%. All investors who purchase Class A shares in an amount of $1 million or more and sell these shares within 12 months of purchase are subject to a contingent deferred sales charge (“CDSC”) of 1%. The Class A CDSC is waived for purchases by certain retirement, and/or benefit plans. Under certain limited circumstances, an exchange may be made from Class A, Class B or Class C to Class Z shares of the Series. Class B shares are sold with a CDSC which declines from 5% to zero depending upon the period of time the shares are held. Class C shares are sold with a CDSC of 1% on shares redeemed within the first 12 months after purchase. Class B shares will automatically convert to Class A shares on a quarterly basis approximately seven years after purchase. A special exchange privilege is also available for shareholders who qualify to purchase Class A shares at
| | | | |
| Prudential International Value Fund | | | 37 | |
Notes to Financial Statements
continued
net asset value. Class Z shares are not subject to any sales or redemption charge and are offered exclusively for sale to a limited group of investors.
There are 250 million shares of common stock at $0.01 par value per share, designated Class A, Class B, Class C and Class Z common stock, each of which consists of 75 million, 50 million, 50 million and 75 million authorized shares, respectively.
For the year ended October 31, 2010, the Series received $329,878 related to an affiliate’s settlement of regulatory proceedings involving allegations of improper trading. This amount is presented in the Series’ Statement of Changes in Net Assets. The Fund was not involved in the proceedings or the calculation of the payment.
Transactions in shares of common stock were as follows:
| | | | | | | | |
Class A | | Shares | | | Amount | |
Year ended October 31, 2011: | | | | | | | | |
Shares sold | | | 174,148 | | | $ | 3,564,449 | |
Shares issued in reinvestment of dividends and distributions | | | 18,196 | | | | 363,555 | |
Shares reacquired | | | (405,920 | ) | | | (8,369,754 | ) |
| | | | | | | | |
Net increase (decrease) in shares outstanding before conversion | | | (213,576 | ) | | | (4,441,750 | ) |
Shares issued upon conversion from Class B | | | 33,177 | | | | 671,705 | |
| | | | | | | | |
Net increase (decrease) in shares outstanding | | | (180,399 | ) | | $ | (3,770,045 | ) |
| | | | | | | | |
Year ended October 31, 2010: | | | | | | | | |
Shares sold | | | 250,295 | | | $ | 4,667,067 | |
Shares issued in reinvestment of dividends and distributions | | | 15,329 | | | | 295,084 | |
Shares reacquired | | | (527,727 | ) | | | (9,884,143 | ) |
| | | | | | | | |
Net increase (decrease) in shares outstanding before conversion | | | (262,103 | ) | | | (4,921,992 | ) |
Shares issued upon conversion from Class B | | | 18,751 | | | | 346,361 | |
| | | | | | | | |
Net increase (decrease) in shares outstanding | | | (243,352 | ) | | $ | (4,575,631 | ) |
| | | | | | | | |
| | |
| 38 | | Visit our website at www.prudentialfunds.com |
| | | | | | | | |
Class B | | Shares | | | Amount | |
Year ended October 31, 2011: | | | | | | | | |
Shares sold | | | 11,306 | | | $ | 223,306 | |
Shares issued in reinvestment of dividends and distributions | | | 281 | | | | 5,390 | |
Shares reacquired | | | (26,475 | ) | | | (519,188 | ) |
| | | | | | | | |
Net increase (decrease) in shares outstanding before conversion | | | (14,888 | ) | | | (290,492 | ) |
Shares reacquired upon conversion into Class A | | | (34,655 | ) | | | (671,705 | ) |
| | | | | | | | |
Net increase (decrease) in shares outstanding | | | (49,543 | ) | | $ | (962,197 | ) |
| | | | | | | | |
Year ended October 31, 2010: | | | | | | | | |
Shares sold | | | 25,281 | | | $ | 452,751 | |
Shares issued in reinvestment of dividends and distributions | | | 98 | | | | 1,815 | |
Shares reacquired | | | (63,830 | ) | | | (1,130,992 | ) |
| | | | | | | | |
Net increase (decrease) in shares outstanding before conversion | | | (38,451 | ) | | | (676,426 | ) |
Shares reacquired upon conversion into Class A | | | (19,560 | ) | | | (346,361 | ) |
| | | | | | | | |
Net increase (decrease) in shares outstanding | | | (58,011 | ) | | $ | (1,022,787 | ) |
| | | | | | | | |
Class C | | | | | | |
Year ended October 31, 2011: | | | | | | | | |
Shares sold | | | 33,601 | | | $ | 667,489 | |
Shares issued in reinvestment of dividends and distributions | | | 649 | | | | 12,462 | |
Shares reacquired | | | (55,107 | ) | | | (1,085,844 | ) |
| | | | | | | | |
Net increase (decrease) in shares outstanding | | | (20,857 | ) | | $ | (405,893 | ) |
| | | | | | | | |
Year ended October 31, 2010: | | | | | | | | |
Shares sold | | | 28,606 | | | $ | 505,699 | |
Shares issued in reinvestment of dividends and distributions | | | 193 | | | | 3,567 | |
Shares reacquired | | | (101,874 | ) | | | (1,808,306 | ) |
| | | | | | | | |
Net increase (decrease) in shares outstanding | | | (73,075 | ) | | $ | (1,299,040 | ) |
| | | | | | | | |
Class Z | | | | | | |
Year ended October 31, 2011: | | | | | | | | |
Shares sold | | | 1,145,232 | | | $ | 23,097,614 | |
Shares issued in reinvestment of dividends and distributions | | | 84,356 | | | | 1,692,191 | |
Shares reacquired | | | (6,266,505 | ) | | | (132,914,086 | ) |
| | | | | | | | |
Net increase (decrease) in shares outstanding | | | (5,036,917 | ) | | $ | (108,124,281 | ) |
| | | | | | | | |
Year ended October 31, 2010: | | | | | | | | |
Shares sold | | | 1,740,604 | | | $ | 31,933,626 | |
Shares issued in reinvestment of dividends and distributions | | | 61,869 | | | | 1,195,304 | |
Shares reacquired | | | (1,357,924 | ) | | | (25,444,502 | ) |
| | | | | | | | |
Net increase (decrease) in shares outstanding | | | 444,549 | | | $ | 7,684,428 | |
| | | | | | | | |
Note 7. Borrowings
The Fund, along with other affiliated registered investment companies (the “Companies”), is a party to a Syndicated Credit Agreement (“SCA”) with a group of
| | | | |
| Prudential International Value Fund | | | 39 | |
Notes to Financial Statements
continued
banks. The purpose of the SCA is to provide an alternative source of temporary funding for capital share redemptions. The SCA provides for a commitment of $750 million for the period December 17, 2010 through December 16, 2011. The Companies pay an annualized commitment fee of 0.10% of the unused portion of the SCA. Prior to December 17, 2010, the Companies had another Syndicated Credit Agreement (the “Expired SCA”) of a $500 million commitment with an annualized commitment fee of 0.15% of the unused portion. Interest on any borrowings under these is contracted market rates. The commitment fee for the unused amount is accrued daily and paid quarterly. The SCA has been renewed on substantially similar terms with an increase in the amount of commitment to $900 million.
The Series utilized the line of credit during the year ended October 31, 2011. The average daily balance for the 28 days the Series had loans outstanding during the period was approximately $690,000, borrowed at a weighted average interest rate of 1.50%. At October 31, 2011, the Series did not have an outstanding loan amount.
Note 8. In-Kind Redemption
During the year ended October 31, 2011, the Series settled the redemption of certain fund shares by delivery of certain portfolio securities in lieu of cash. The value of such securities was $112,688,510. The Series realized a gain of $8,016,394 related to the in-kind redemption transactions, which amount is included in the Statement of Operations under “Realized gain (loss) on investment and foreign currency transactions”. Such gain is excluded from calculation of the Series’ taxable gain for federal income tax purposes.
Note 9. Dividends to Shareholders
Subsequent to the fiscal year end, the Series declared ordinary income dividends on December 2, 2011 to shareholders of record on December 5, 2011. The ex-dividend date was December 6, 2011. The per share amounts declared were as follows:
| | | | |
| | | Ordinary Income | |
Class A | | $ | 0.3019 | |
Class B | | $ | 0.1592 | |
Class C | | $ | 0.1592 | |
Class Z | | $ | 0.3523 | |
| | |
| 40 | | Visit our website at www.prudentialfunds.com |
Note 10. New Accounting Pronouncements
In April 2011, the Financial Accounting Standards Board (“FASB”) issued Accounting Standards Update (“ASU”) No. 2011-03 “Reconsideration of Effective control for Repurchase Agreements.” The objective of ASU No. 2011-03 is to improve the accounting for repurchase agreements and other agreements that both entitle and obligate a transferor to repurchase or redeem financial assets before their maturity. Under previous guidance, whether or not to account for a transaction as a sale was based on, in part, if the entity maintained effective control over the transferred financial assets. ASU No. 2011-03 removes the transferor’s ability criterion from the effective control assessment. This guidance is effective prospectively for interim and annual reporting periods beginning on or after December 15, 2011. At this time, management is evaluating the implications of ASU No. 2011-03 and its impact on the financial statements has not been determined.
In May 2011, the FASB issued ASU No. 2011-04 “Amendments to Achieve Common Fair Value Measurement and Disclosure Requirements in U.S. GAAP and IFRSs.” ASU No. 2011-04 includes common requirements for measurement of and disclosure about fair value between U.S. GAAP and IFRS. ASU No. 2011-04 will require reporting entities to disclose quantitative information about the unobservable inputs used in the fair value measurements categorized within Level 3 of the fair value hierarchy. In addition, ASU No. 2011-04 will require reporting entities to make disclosures about amounts and reasons for all transfers in and out of Level 1 and Level 2 fair value measurements. The new and revised disclosures are effective for interim and annual reporting periods beginning after December 15, 2011. At this time, management is evaluating the implications of ASU No. 2011-04 and its impact on the financial statements has not been determined.
| | | | |
| Prudential International Value Fund | | | 41 | |
Financial Highlights
| | | | | | | | | | | | | | | | | | | | |
| Class A Shares | | | |
| | | Year Ended October 31, | |
| | | 2011(b) | | | 2010(b) | | | 2009(b) | | | 2008(b) | | | 2007(b) | |
| Per Share Operating Performance: | | | | | | | | | | | | | | | | | | | | |
| Net Asset Value, Beginning Of Year | | | $20.29 | | | | $18.45 | | | | $15.28 | | | | $34.10 | | | | $27.12 | |
| Income (loss) from investment operations: | | | | | | | | | | | | | | | | | | | | |
| Net investment income | | | .32 | | | | .22 | | | | .20 | | | | .44 | | | | .51 | |
| Net realized and unrealized gain (loss) on investments | | | (1.64 | ) | | | 1.71 | | | | 3.59 | | | | (14.93 | ) | | | 7.85 | |
| Total from investment operations | | | (1.32 | ) | | | 1.93 | | | | 3.79 | | | | (14.49 | ) | | | 8.36 | |
| Less Dividends and Distributions: | | | | | | | | | | | | | | | | | | | | |
| Dividends from net investment income | | | (.17 | ) | | | (.12 | ) | | | (.62 | ) | | | (.38 | ) | | | (.03 | ) |
| Distributions from net realized gains | | | - | | | | - | | | | - | | | | (3.95 | ) | | | (1.35 | ) |
| Total dividends and distributions | | | (.17 | ) | | | (.12 | ) | | | (.62 | ) | | | (4.33 | ) | | | (1.38 | ) |
| Capital Contributions (Note 6) | | | - | | | | .03 | | | | - | | | | - | | | | - | |
| Net asset value, end of year | | | $18.80 | | | | $20.29 | | | | $18.45 | | | | $15.28 | | | | $34.10 | |
| Total Return(a): | | | (6.56)% | | | | 10.68% | | | | 26.03% | | | | (48.33)% | | | | 32.15% | |
| |
| Ratios/Supplemental Data: | |
| Net assets, end of year (000) | | | $38,858 | | | | $45,598 | | | | $45,945 | | | | $40,580 | | | | $91,221 | |
| Average net assets (000) | | | $44,169 | | | | $44,626 | | | | $39,582 | | | | $71,618 | | | | $84,344 | |
| Ratios to average net assets(d): | | | | | | | | | | | | | | | | | | | | |
| Expenses, including distribution and service (12b-1) fees(c) | | | 1.78% | | | | 1.66% | | | | 1.65% | | | | 1.56% | | | | 1.57% | |
| Expenses, excluding distribution and service (12b-1) fees | | | 1.53% | | | | 1.41% | | | | 1.40% | | | | 1.31% | | | | 1.32% | |
| Net investment income | | | 1.56% | | | | 1.17% | | | | 1.30% | | | | 1.79% | | | | 1.74% | |
| For Class A, B, C and Z shares: | | | | | | | | | | | | | | | | | | | | |
| Portfolio turnover rate | | | 25% | | | | 40% | | | | 40% | | | | 27% | | | | 44% | |
(a) These total returns do not consider the effect of sales load. Total return is calculated assuming a purchase of a share on the first day and a sale on the last day of each year reported and includes reinvestment of dividends and distributions. Total returns may reflect adjustments to confrom to generally accepted accounting principles.
(b) Calculations are based on the average daily number of shares outstanding.
(c) The distributor of the Fund has contractually agreed to limit its distribution and service (12b-1) fees to .25 of 1% of the average daily assets of the Class A shares.
(d) Does not include expenses of the underlying portfolio in which the Series invests.
See Notes to Financial Statements.
| | |
| 42 | | Visit our website at www.prudentialfunds.com |
| | | | | | | | | | | | | | | | | | | | |
| Class B Shares | | | |
| | | Year Ended October 31, | |
| | | 2011(b) | | | 2010(b) | | | 2009(b) | | | 2008(b) | | | 2007(b) | |
| Per Share Operating Performance: | | | | | | | | | | | | | | | | | | | | |
| Net Asset Value, Beginning Of Year | | | $19.37 | | | | $17.64 | | | | $14.58 | | | | $32.73 | | | | $26.24 | |
| Income (loss) from investment operations: | | | | | | | | | | | | | | | | | | | | |
| Net investment income | | | .16 | | | | .08 | | | | .08 | | | | .24 | | | | .24 | |
| Net realized and unrealized gain (loss) on investments | | | (1.56 | ) | | | 1.63 | | | | 3.45 | | | | (14.29 | ) | | | 7.60 | |
| Total from investment operations | | | (1.40 | ) | | | 1.71 | | | | 3.53 | | | | (14.05 | ) | | | 7.84 | |
| Less Dividends and Distributions: | | | | | | | | | | | | | | | | | | | | |
| Dividends from net investment income | | | (.04 | ) | | | (.01 | ) | | | (.47 | ) | | | (.15 | ) | | | - | |
| Distributions from net realized gains | | | - | | | | - | | | | - | | | | (3.95 | ) | | | (1.35 | ) |
| Total dividends and distributions | | | (.04 | ) | | | (.01 | ) | | | (.47 | ) | | | (4.10 | ) | | | (1.35 | ) |
| Capital Contributions (Note 6) | | | - | | | | .03 | | | | - | | | | - | | | | - | |
| Net asset value, end of year | | | $17.93 | | | | $19.37 | | | | $17.64 | | | | $14.58 | | | | $32.73 | |
| Total Return(a): | | | (7.26)% | | | | 9.86% | | | | 25.11% | | | | (48.74)% | | | | 31.17% | |
| |
| Ratios/Supplemental Data: | |
| Net assets, end of year (000) | | | $1,975 | | | | $3,093 | | | | $3,839 | | | | $5,143 | | | | $16,279 | |
| Average net assets (000) | | | $2,651 | | | | $3,314 | | | | $3,985 | | | | $10,730 | | | | $16,627 | |
| Ratios to average net assets(c): | | | | | | | | | | | | | | | | | | | | |
| Expenses, including distribution and service (12b-1) fees | | | 2.52% | | | | 2.41% | | | | 2.40% | | | | 2.31% | | | | 2.32% | |
| Expenses, excluding distribution and service (12b-1) fees | | | 1.52% | | | | 1.41% | | | | 1.40% | | | | 1.31% | | | | 1.32% | |
| Net investment income | | | .81% | | | | .43% | | | | .58% | | | | 1.01% | | | | .84% | |
(a) These total returns do not consider the effect of sales load. Total return is calculated assuming a purchase of a share on the first day and a sale on the last day of each year reported and includes reinvestment of dividends and distributions. Total returns may reflect adjustments to confrom to generally accepted accounting principles.
(b) Calculations are based on the average daily number of shares outstanding.
(c) Does not include expenses of the underlying portfolio in which the Series invests.
See Notes to Financial Statements.
| | | | |
| Prudential International Value Fund | | | 43 | |
Financial Highlights
continued
| | | | | | | | | | | | | | | | | | | | |
| Class C Shares | |
| | | Year Ended October 31, | |
| | | 2011(b) | | | 2010(b) | | | 2009(b) | | | 2008(b) | | | 2007(b) | |
| Per Share Operating Performance: | | | | | | | | | | | | | | | | | | | | |
| Net Asset Value, Beginning Of Year | | | $19.40 | | | | $17.66 | | | | $14.60 | | | | $32.77 | | | | $26.27 | |
| Income (loss) from investment operations: | | | | | | | | | | | | | | | | | | | | |
| Net investment income | | | .16 | | | | .07 | | | | .08 | | | | .24 | | | | .27 | |
| Net realized and unrealized gain (loss) on investments | | | (1.56 | ) | | | 1.65 | | | | 3.45 | | | | (14.31 | ) | | | 7.58 | |
| Total from investment operations | | | (1.40 | ) | | | 1.72 | | | | 3.53 | | | | (14.07 | ) | | | 7.85 | |
| Less Dividends and Distributions: | | | | | | | | | | | | | | | | | | | | |
| Dividends from net investment income | | | (.04 | ) | | | (.01 | ) | | | (.47 | ) | | | (.15 | ) | | | - | |
| Distributions from net realized gains | | | - | | | | - | | | | - | | | | (3.95 | ) | | | (1.35 | ) |
| Total dividends and distributions | | | (.04 | ) | | | (.01 | ) | | | (.47 | ) | | | (4.10 | ) | | | (1.35 | ) |
| Capital Contributions (Note 6) | | | - | | | | .03 | | | | - | | | | - | | | | - | |
| Net asset value, end of year | | | $17.96 | | | | $19.40 | | | | $17.66 | | | | $14.60 | | | | $32.77 | |
| Total Return(a): | | | (7.25)% | | | | 9.91% | | | | 25.08% | | | | (48.74)% | | | | 31.17% | |
| |
| Ratios/Supplemental Data: | |
| Net assets, end of year (000) | | | $5,947 | | | | $6,828 | | | | $7,507 | | | | $7,355 | | | | $17,938 | |
| Average net assets (000) | | | $6,690 | | | | $6,760 | | | | $6,807 | | | | $13,571 | | | | $16,297 | |
| Ratios to average net assets(c): | | | | | | | | | | | | | | | | | | | | |
Expenses, including distribution and
service (12b-1) fees | | | 2.53% | | | | 2.41% | | | | 2.40% | | | | 2.31% | | | | 2.32% | |
Expenses, excluding distribution and
service (12b-1) fees | | | 1.53% | | | | 1.41% | | | | 1.40% | | | | 1.31% | | | | 1.32% | |
| Net investment income | | | .81% | | | | .42% | | | | .58% | | | | 1.04% | | | | .94% | |
(a) These total returns do not consider the effect of sales load. Total return is calculated assuming a purchase of a share on the first day and a sale on the last day of each year reported and includes reinvestment of dividends and distributions. Total returns may reflect adjustments to confrom to generally accepted accounting principles.
(b) Calculations are based on the average daily number of shares outstanding.
(c) Does not include expenses of the underlying portfolio in which the Series invests.
See Notes to Financial Statements.
| | |
| 44 | | Visit our website at www.prudentialfunds.com |
| | | | | | | | | | | | | | | | | | | | |
| Class Z Shares | | | |
| | | Year Ended October 31, | |
| | | 2011(b) | | | 2010(b) | | | 2009(b) | | | 2008(b) | | | 2007(b) | |
| Per Share Operating Performance: | | | | | | | | | | | | | | | | | | | | |
| Net Asset Value, Beginning Of Year | | | $20.42 | | | | $18.55 | | | | $15.37 | | | | $34.30 | | | | $27.26 | |
| Income (loss) from investment operations: | | | | | | | | | | | | | | | | | | | | |
| Net investment income | | | .24 | | | | .26 | | | | .24 | | | | .50 | | | | .60 | |
| Net realized and unrealized gain (loss) on investments | | | (1.51 | ) | | | 1.74 | | | | 3.62 | | | | (15.02 | ) | | | 7.89 | |
| Total from investment operations | | | (1.27 | ) | | | 2.00 | | | | 3.86 | | | | (14.52 | ) | | | 8.49 | |
| Less Dividends and Distributions: | | | | | | | | | | | | | | | | | | | | |
| Dividends from net investment income | | | (.22 | ) | | | (.16 | ) | | | (.68 | ) | | | (.46 | ) | | | (.10 | ) |
| Distributions from net realized gains | | | - | | | | - | | | | - | | | | (3.95 | ) | | | (1.35 | ) |
| Total dividends and distributions | | | (.22 | ) | | | (.16 | ) | | | (.68 | ) | | | (4.41 | ) | | | (1.45 | ) |
| Capital Contributions (Note 6) | | | - | | | | .03 | | | | - | | | | - | | | | - | |
| Net asset value, end of year | | | $18.93 | | | | $20.42 | | | | $18.55 | | | | $15.37 | | | | $34.30 | |
| Total Return(a): | | | (6.30)% | | | | 11.01% | | | | 26.41% | | | | (48.23)% | | | | 32.50% | |
| |
| Ratios/Supplemental Data: | |
| Net assets, end of year (000) | | | $52,086 | | | | $159,020 | | | | $136,238 | | | | $115,710 | | | | $234,828 | |
| Average net assets (000) | | | $79,550 | | | | $139,023 | | | | $115,310 | | | | $186,380 | | | | $206,798 | |
| Ratios to average net assets(c): | | | | | | | | | | | | | | | | | | | | |
| Expenses, including distribution and service (12b-1) fees | | | 1.47% | | | | 1.41% | | | | 1.40% | | | | 1.31% | | | | 1.32% | |
| Expenses, excluding distribution and service (12b-1) fees | | | 1.47% | | | | 1.41% | | | | 1.40% | | | | 1.31% | | | | 1.32% | |
| Net investment income | | | 1.16% | | | | 1.41% | | | | 1.58% | | | | 2.06% | | | | 2.02% | |
(a) These total returns do not consider the effect of sales load. Total return is calculated assuming a purchase of a share on the first day and a sale on the last day of each year reported and includes reinvestment of dividends and distributions. Total returns may reflect adjustments to confrom to generally accepted accounting principles.
(b) Calculations are based on the average daily number of shares outstanding.
(c) Does not include expenses of the underlying portfolio in which the Series invests.
See Notes to Financial Statements.
| | | | |
| Prudential International Value Fund | | | 45 | |
Report of Independent Registered Public
Accounting Firm
The Board of Directors and Shareholders
Prudential World Fund, Inc.:
We have audited the accompanying statement of assets and liabilities of Prudential International Value Fund (one of the series constituting Prudential World Fund, Inc., hereafter referred to as the “Fund”), including the portfolio of investments, as of October 31, 2011, and the related statement of operations for the year then ended, the statement of changes in net assets for each of the years in the two-year period then ended and the financial highlights for each of the years in the five-year period then ended. These financial statements and financial highlights are the responsibility of the Fund’s management. Our responsibility is to express an opinion on these financial statements and financial highlights based on our audits.
We conducted our audits in accordance with the standards of the Public Company Accounting Oversight Board (United States). Those standards require that we plan and perform the audit to obtain reasonable assurance about whether the financial statements and financial highlights are free of material misstatement. An audit includes examining, on a test basis, evidence supporting the amounts and disclosures in the financial statements. Our procedures included confirmation of securities owned as of October 31, 2011, by correspondence with the custodian, transfer agent and brokers or by other appropriate auditing procedures when replies from brokers were not received. An audit also includes assessing the accounting principles used and significant estimates made by management, as well as evaluating the overall financial statement presentation. We believe that our audits provide a reasonable basis for our opinion.
In our opinion, the financial statements and financial highlights referred to above present fairly, in all material respects, the financial position of the Fund as of October 31, 2011, and the results of its operations for the year then ended, the changes in its net assets for each of the years in the two-year period then ended and the financial highlights for each of the years in the five-year period then ended, in conformity with U.S. generally accepted accounting principles.

New York, New York
December 22, 2011
| | |
| 46 | | Visit our website at www.prudentialfunds.com |
Tax Information
(Unaudited)
We are required by Internal Revenue Code of 1986, as amended (“the Code”), to advise you within 60 days of the Fund’s fiscal year end (October 31, 2011) as to the federal tax status of dividends paid by the Series during such fiscal year. We are advising you in the fiscal year ended October 31, 2011, the Series paid ordinary income dividends of $0.17, $0.04, $0.04 and $0.22 per share from Class A, B, C and Z shares, respectively.
For the fiscal year ended October 31, 2011, the Series designates the maximum amount allowable, but not less than 100% of the ordinary income dividends paid during the year as qualified dividend income in accordance with Section 854 of the Internal Revenue Code.
For the fiscal year ended October 31, 2011, the Series made an election to pass through the maximum amount of the portion of the ordinary income dividends paid derived from foreign source income as well as any foreign taxes paid by the Series in accordance with Section 853 of the Internal Revenue Code of the following amounts: $342,540 foreign tax credit from recognized foreign source income of $4,202,028.
In January 2012, you will be advised on IRS Form 1099DIV or Substitute Form 1099DIV as to the federal tax status of dividends and distributions received by you in calendar year 2011.
| | | | |
| Prudential International Value Fund | | | 47 | |
INFORMATION ABOUT BOARD MEMBERS AND OFFICERS
(Unaudited)
Information about Board Members and Officers is set forth below. Board Members who are not deemed to be “interested persons” of the Fund, as defined in the 1940 Act, are referred to as “Independent Board Members.” Board Members who are deemed to be “interested persons” of the Fund are referred to as “Interested Board Members.” The Board Members are responsible for the overall supervision of the operations of the Fund and perform the various duties imposed on the directors of investment companies by the 1940 Act.
| | | | |
Independent Board Members(1) | | | | |
Name, Address, Age Position(s) Portfolios Overseen | | Principal Occupation(s) During Past Five Years | | Other Directorships Held |
Kevin J. Bannon (59) Board Member Portfolios Overseen: 58 | | Managing Director (since April 2008) and Chief Investment Officer (since October 2008) of Highmount Capital LLC (registered investment adviser); formerly Executive Vice President and Chief Investment Officer (April 1993-August 2007) of Bank of New York Company; President (May 2003-May 2007) of BNY Hamilton Family of Mutual Funds. | | Director of Urstadt Biddle Properties (since September 2008). |
Linda W. Bynoe (59) Board Member Portfolios Overseen: 58 | | President and Chief Executive Officer (since March 1995) and formerly Chief Operating Officer (December 1989-February 1995) of Telemat Ltd. (management consulting); formerly Vice President (January 1985-June 1989) at Morgan Stanley & Co (broker-dealer). | | Director of Simon Property Group, Inc. (retail real estate) (since May 2003); Director of Anixter International, Inc. (communication products distributor) (since January 2006); Director of Northern Trust Corporation (financial services) (since April 2006); Trustee of Equity Residential (residential real estate) (since December 2009); formerly Director of Dynegy Inc. (power generation) (September 2002-May 2006). |
Michael S. Hyland, CFA (66) Board Member Portfolios Overseen: 58 | | Independent Consultant (since February 2005); formerly Senior Managing Director (July 2001-February 2005) of Bear Stearns & Co, Inc.; Global Partner, INVESCO (1999-2001); Managing Director and President of Salomon Brothers Asset Management (1989-1999). | | None. |
Douglas H. McCorkindale (72) Board Member Portfolios Overseen: 58 | | Formerly Chairman (February 2001-June 2006), Chief Executive Officer (June 2000-July 2005), President (September 1997-July 2005) and Vice Chairman (March 1984-May 2000) of Gannett Co. Inc. (publishing and media). | | Director of Lockheed Martin Corp. (aerospace and defense) (since May 2001). |
Visit our website at www.prudentialfunds.com
| | | | |
Independent Board Members(1) | | | | |
Name, Address, Age Position(s) Portfolios Overseen | | Principal Occupation(s) During Past Five Years | | Other Directorships Held |
Stephen P. Munn (69) Board Member Portfolios Overseen: 58 | | Lead Director (since 2007) and formerly Chairman (1993-2007) of Carlisle Companies Incorporated (manufacturer of industrial products). | | Lead Director (since 2007) of Carlisle Companies Incorporated (manufacturer of industrial products). |
Richard A. Redeker (68) Board Member & Independent Chair Portfolios Overseen: 58 | | Retired Mutual Fund Senior Executive (43 years); Management Consultant; Independent Directors Council (organization of 2,800 Independent Mutual Fund Directors)-Executive Committee, Chair of Policy Steering Committee, Governing Council. | | None. |
Robin B. Smith (72) Board Member Portfolios Overseen: 58 | | Chairman of the Board (since January 2003) of Publishers Clearing House (direct marketing); Member of the Board of Directors of ADLPartner (marketing) (since December 2010); formerly Chairman and Chief Executive Officer (August 1996-January 2003) of Publishers Clearing House. | | Formerly Director of BellSouth Corporation (telecommunications) (1992-2006). |
Stephen G. Stoneburn (68) Board Member Portfolios Overseen: 58 | | President and Chief Executive Officer (since June 1996) of Quadrant Media Corp. (publishing company); formerly President (June 1995-June 1996) of Argus Integrated Media, Inc.; Senior Vice President and Managing Director (January 1993-1995) of Cowles Business Media; Senior Vice President of Fairchild Publications, Inc (1975-1989). | | None. |
Prudential International Value Fund
| | | | |
| Interested Board Members(1) | | | | |
Name, Address, Age Position(s) Portfolios Overseen | | Principal Occupation(s) During Past Five Years | | Other Directorships Held |
Judy A. Rice* (63) Board Member & President Portfolios Overseen: 58 | | President, Chief Executive Officer, Chief Operating Officer and Officer-In-Charge (since February 2003) of Prudential Investments LLC; President, Chief Executive Officer and Officer-In-Charge (since April 2003) of Prudential Mutual Fund Services LLC; President, Chief Executive Officer (since May 2011) and Executive Vice President (since December 2008) of Prudential Investment Management Services LLC; Member of the Board of Directors of Jennison Associates LLC (since November 2010); formerly Vice President (February 1999-April 2006) of Prudential Investment Management Services LLC; President, COO, CEO and Manager of PIFM Holdco, LLC (since April 2006); formerly President, Chief Executive Officer, Chief Operating Officer and Officer-In-Charge (May 2003-June 2005) and Director (May 2003-March 2006) and Executive Vice President (June 2005-March 2006) of AST Investment Services, Inc.; Member of Board of Governors of the Investment Company Institute. | | None. |
Stuart S. Parker* (49) Board Member & President Portfolios Overseen: 58 | | President of Prudential Investments LLC (since January 2012); Executive Vice President of Jennison Associates LLC and Head of Retail Distribution of Prudential Investments LLC (June 2005 - December 2011). | | None. |
Scott E. Benjamin (38) Board Member & Vice President Portfolios Overseen: 58 | | Executive Vice President (since June 2009) of Prudential Investments LLC and Prudential Investment Management Services LLC; Executive Vice President (since September 2009) of AST Investment Services, Inc.; Senior Vice President of Product Development and Marketing, Prudential Investments (since February 2006); Vice President of Product Development and Product Management, Prudential Investments (2003-2006). | | None. |
*Ms. Rice has announced her retirement as President and Board Member effective December 31, 2011. Ms. Rice has been appointed as Vice President effective January 1, 2012. The Board has appointed Stuart S. Parker as President and Board Member effective January 1, 2012.
Visit our website at www.prudentialfunds.com
(1) The year that each Board Member joined the Fund’s Board is as follows:
Kevin J. Bannon, 2008; Linda W. Bynoe, 2005; Michael S. Hyland, 2008; Douglas H. McCorkindale, 2003; Stephen P. Munn, 2008; Richard A. Redeker, 2003; Robin B. Smith, 1996; Stephen G. Stoneburn, 1996; Judy A. Rice, Board Member since 2000 and President since 2003; Scott E. Benjamin, Board Member since 2010 and Vice President since 2009.
| | |
| Fund Officers(a)(1) | | |
Name, Address and Age Position with Fund | | Principal Occupation(s) During Past Five Years |
Kathryn L. Quirk (59) Chief Legal Officer | | Vice President and Corporate Counsel (since September 2004) of Prudential; Executive Vice President, Chief Legal Officer and Secretary (since July 2005) of PI and Prudential Mutual Fund Services LLC; Vice President and Corporate Counsel (since June 2005) and Secretary (since February 2006) of AST Investment Services, Inc.; formerly Senior Vice President and Assistant Secretary (November 2004-August 2005) of PI; formerly Assistant Secretary (June 2005-February 2006) of AST Investment Services, Inc.; formerly Managing Director, General Counsel, Chief Compliance Officer, Chief Risk Officer and Corporate Secretary (1997-2002) of Zurich Scudder Investments, Inc. |
Deborah A. Docs (53) Secretary | | Vice President and Corporate Counsel (since January 2001) of Prudential; Vice President (since December 1996) and Assistant Secretary (since March 1999) of PI; formerly Vice President and Assistant Secretary (May 2003-June 2005) of AST Investment Services, Inc. |
Jonathan D. Shain (53) Assistant Secretary | | Vice President and Corporate Counsel (since August 1998) of Prudential; Vice President and Assistant Secretary (since May 2001) of PI; Vice President and Assistant Secretary (since February 2001) of PMFS; formerly Vice President and Assistant Secretary (May 2003-June 2005) of AST Investment Services, Inc. |
Claudia DiGiacomo (37) Assistant Secretary | | Vice President and Corporate Counsel (since January 2005) of Prudential; Vice President and Assistant Secretary of PI (since December 2005); Associate at Sidley Austin Brown & Wood LLP (1999-2004). |
John P. Schwartz (40) Assistant Secretary | | Vice President and Corporate Counsel (since April 2005) of Prudential; Vice President and Assistant Secretary of PI (since December 2005); Associate at Sidley Austin Brown & Wood LLP (1997-2005). |
Andrew R. French (49) Assistant Secretary | | Vice President and Corporate Counsel (since February 2010) of Prudential; formerly Director and Corporate Counsel (2006-2010) of Prudential; Vice President and Assistant Secretary (since January 2007) of PI; Vice President and Assistant Secretary (since January 2007) of PMFS. |
Timothy J. Knierim (52) Chief Compliance Officer | | Chief Compliance Officer of Prudential Investment Management, Inc. (since July 2007); formerly Chief Risk Officer of PIM and PI (2002-2007) and formerly Chief Ethics Officer of PIM and PI (2006-2007). |
Valerie M. Simpson (53) Deputy Chief Compliance Officer | | Chief Compliance Officer (since April 2007) of PI and AST Investment Services, Inc.; formerly Vice President-Financial Reporting (June 1999-March 2006) for Prudential Life and Annuities Finance. |
Prudential International Value Fund
| | |
| Fund Officers(a)(1) | | |
Name, Address and Age Position with Fund | | Principal Occupation(s) During Past Five Years |
Theresa C. Thompson (49) Deputy Chief Compliance Officer | | Vice President, Compliance, PI (since April 2004); and Director, Compliance, PI (2001-2004). |
Richard W. Kinville (43) Anti-Money Laundering Compliance Officer | | Vice President, Corporate Compliance, Anti-Money Laundering Unit (since January 2005) of Prudential; committee member of the American Council of Life Insurers Anti-Money Laundering and Critical Infrastructure Committee (since January 2007); formerly Investigator and Supervisor in the Special Investigations Unit for the New York Central Mutual Fire Insurance Company (August 1994-January 1999); Investigator in AXA Financial’s Internal Audit Department and Manager in AXA’s Anti-Money Laundering Office (January 1999-January 2005); first chair of the American Council of Life Insurers Anti-Money Laundering and Critical Infrastructure Committee (June 2007-December 2009). |
Grace C. Torres (52) Treasurer and Principal Financial and Accounting Officer | | Assistant Treasurer (since March 1999) and Senior Vice President (since September 1999) of PI; Assistant Treasurer (since May 2003) and Vice President (since June 2005) of AST Investment Services, Inc.; Senior Vice President and Assistant Treasurer (since May 2003) of Prudential Annuities Advisory Services, Inc.; formerly Senior Vice President (May 2003-June 2005) of AST Investment Services, Inc. |
M. Sadiq Peshimam (47) Assistant Treasurer | | Vice President (since 2005) of Prudential Investments LLC. |
Peter Parrella (53) Assistant Treasurer | | Vice President (since 2007) and Director (2004-2007) within Prudential Mutual Fund Administration; formerly Tax Manager at SSB Citi Fund Management LLC (1997-2004). |
(a) Excludes Ms. Rice and Mr. Benjamin, interested Board Members who also serve as President and Vice President, respectively.
(1) The year that each individual became an officer of the Fund is as follows:
Kathryn L. Quirk, 2005; Deborah A. Docs, 2005; Jonathan D. Shain, 2005; Claudia DiGiacomo, 2005; John P. Schwartz, 2006; Andrew R. French, 2006; Timothy J. Knierim, 2007; Valerie M. Simpson, 2007; Theresa C. Thompson, 2008; Richard W. Kinville, 2011; Grace C. Torres, 1995; Sadiq Peshimam, 2006; Peter Parrella, 2007.
Explanatory Notes to Tables:
| n | Board Members are deemed to be “Interested,” as defined in the 1940 Act, by reason of their affiliation with Prudential Investments LLC and/or an affiliate of Prudential Investments LLC. |
| n | Unless otherwise noted, the address of all Board Members and Officers is c/o Prudential Investments LLC, Gateway Center Three, 100 Mulberry Street, Newark, New Jersey 07102-4077. |
| n | There is no set term of office for Board Members or Officers. The Board Members have adopted a retirement policy, which calls for the retirement of Board Members on December 31 of the year in which they reach the age of 75. |
| n | “Other Directorships Held” includes only directorships of companies required to register or file reports with the SEC under the 1934 Act) (that is, “public companies”) or other investment companies registered under the 1940 Act. |
| n | “Portfolios Overseen” includes all investment companies managed by Prudential Investments LLC. The investment companies for which PI serves as manager include the Prudential Investments Mutual Funds, The Prudential Variable Contract Accounts, Target Mutual Funds, The Prudential Series Fund, Prudential’s Gibraltar Fund, Inc. and the Advanced Series Trust. |
Visit our website at www.prudentialfunds.com
Approval of Advisory Agreements
The Fund’s Board of Directors
The Board of Directors (the “Board”) of Prudential International Value Fund (the “Fund”)1 consists of 10 individuals, eight of whom are not “interested persons” of the Fund, as defined in the Investment Company Act of 1940, as amended (the “1940 Act”) (the “Independent Directors”). The Board is responsible for the oversight of the Fund and its operations, and performs the various duties imposed on the directors of investment companies by the 1940 Act. The Independent Directors have retained independent legal counsel to assist them in connection with their duties. The Chair of the Board is an Independent Director. The Board has established three standing committees: the Audit Committee, the Nominating and Governance Committee, and the Investment Committee. Each committee is chaired by, and composed of, Independent Directors.
Annual Approval of the Fund’s Advisory Agreements
As required under the 1940 Act, the Board determines annually whether to renew the Fund’s management agreement with Prudential Investments LLC (“PI”) and the Fund’s subadvisory agreements with each of LSV Asset Management (“LSV”) and Thornburg Investment Management, Inc. (“Thornburg”). In considering the renewal of the agreements, the Board, including all of the Independent Directors, met on June 6-8, 2011 and approved the renewal of the agreements through July 31, 2012, after concluding that the renewal of the agreements was in the best interests of the Fund and its shareholders.
In advance of the meetings, the Board requested and received materials relating to the agreements, and had the opportunity to ask questions and request further information in connection with its consideration. Among other things, the Board considered comparative fee information from PI, LSV and Thornburg. Also, the Board considered comparisons with other mutual funds in relevant Peer Universes and Peer Groups. The mutual funds included in each Peer Universe or Peer Group were objectively determined by Lipper Inc. (“Lipper”), an independent provider of mutual fund data. To the extent that PI deems appropriate, and for reasons addressed in detail with the Board, PI may provide supplemental data compiled by Lipper for the Board’s consideration. The comparisons placed the Fund in various quartiles over the one-, three-, five-, and 10-year periods ending December 31, 2010, with the first quartile being the best 25% of the mutual funds (for performance, the best performing mutual funds and, for expenses, the lowest cost mutual funds).
In approving the agreements, the Board, including the Independent Directors advised by independent legal counsel, considered the factors it deemed relevant, including the nature, quality and extent of services provided by PI and each subadviser, the performance of the Fund, the profitability of PI and its affiliates, expenses and fees,
| 1 | Prudential International Value Fund is a series of Prudential World Fund, Inc. |
Prudential International Value Fund
Approval of Advisory Agreements (continued)
and the potential for economies of scale that may be shared with the Fund and its shareholders as the Fund’s assets grow. In their deliberations, the Directors did not identify any single factor which alone was responsible for the Board’s decision to approve the agreements with respect to the Fund. In connection with its deliberations, the Board considered information provided by PI throughout the year at regular Board meetings, presentations from portfolio managers and other information, as well as information furnished at or in advance of the meetings on June 6-8, 2011.
The Directors determined that the overall arrangements between the Fund and PI, which serves as the Fund’s investment manager pursuant to a management agreement, and between PI and each of LSV and Thornburg, which serve as the Fund’s subadvisers pursuant to the terms of subadvisory agreements with PI, are in the interest of the Fund and its shareholders in light of the services performed, fees charged and such other matters as the Directors considered relevant in the exercise of their business judgment.
The material factors and conclusions that formed the basis for the Directors’ reaching their determinations to approve the continuance of the agreements are separately discussed below.
Nature, Quality and Extent of Services
The Board received and considered information regarding the nature, quality and extent of services provided to the Fund by PI, LSV and Thornburg. The Board considered the services provided by PI, including but not limited to the oversight of the subadvisers for the Fund, as well as the provision of fund recordkeeping, compliance, and other services to the Fund. With respect to PI’s oversight of the subadvisers, the Board noted that PI’s Strategic Investment Research Group (“SIRG”), which is a business unit of PI, is responsible for screening and recommending new subadvisers when appropriate, as well as monitoring and reporting to the Board on the performance and operations of the subadvisers. The Board also considered that PI pays the salaries of all of the officers and non-independent Directors of the Fund. The Board also considered the investment subadvisory services provided by LSV and Thornburg, as well as adherence to the Fund’s investment restrictions and compliance with applicable Fund policies and procedures. The Board considered PI’s evaluations of the subadvisers, as well as PI’s recommendation, based on its review of each subadviser, to renew the subadvisory agreements.
The Board reviewed the qualifications, backgrounds and responsibilities of PI’s senior management responsible for the oversight of the Fund and LSV and Thornburg, and also reviewed the qualifications, backgrounds and responsibilities of the LSV and Thornburg portfolio managers who are responsible for the day-to-day management of
Visit our website at www.prudentialfunds.com
the Fund’s portfolio. The Board was provided with information pertaining to PI’s, LSV’s and Thornburg’s organizational structure, senior management, investment operations, and other relevant information pertaining to PI, LSV and Thornburg. The Board also noted that it received favorable compliance reports from the Fund’s Chief Compliance Officer (“CCO”) as to each of PI, LSV and Thornburg.
The Board concluded that it was satisfied with the nature, extent and quality of the investment management services provided by PI and the subadvisory services provided to the Fund by LSV and Thornburg, and that there was a reasonable basis on which to conclude that the Fund benefits from the services provided by PI, LSV and Thornburg under the management and subadvisory agreements.
Performance of the Fund
The Board received and considered information about the Fund’s historical performance. The Board considered that the Fund’s gross performance in relation to its Peer Universe (a blend of the Lipper International Large-Cap Core Funds and International Multi-Cap Core Funds Performance Universes)2 was in the second quartile over the one-, three-, five- and 10-year periods. The Board also noted that the Fund outperformed its benchmark index over all periods. The Board concluded that, in light of the Fund’s competitive performance, it would be in the interest of the Fund and its shareholders for the Fund to renew the agreements.
Fees and Expenses
The Board considered that the Fund’s actual management fees (which reflect any subsidies, waivers or expense caps) and the Fund’s total expenses both ranked in the Expense Group’s third quartile. The Board noted that the Fund’s actual management fees were 5 basis points higher than the Expense Group median, while the Fund’s total expenses were 6 basis points higher than the Expense Group median. The Board concluded that the management fees (including subadvisory fees) and total expenses were reasonable in light of the services provided.
Costs of Services and Profits Realized by PI
The Board was provided with information on the profitability of PI and its affiliates in serving as the Fund’s investment manager. The Board discussed with PI the methodology utilized in assembling the information regarding profitability and considered its reasonableness. The Board recognized that it is difficult to make comparisons of
| 2 | Although Lipper classifies the Fund in its International Large-Cap Core Funds Performance Universe, the International Large-Cap Core Funds and International Multi-Cap Core Funds Performance Universes were utilized because PI believes that the funds included in these Universes provide a more appropriate basis for Fund performance comparisons. |
Prudential International Value Fund
Approval of Advisory Agreements (continued)
profitability from fund management contracts because comparative information is not generally publicly available and is affected by numerous factors, including the structure of the particular adviser, the types of funds it manages, its business mix, numerous assumptions regarding allocations and the adviser’s capital structure and cost of capital. Taking these factors into account, the Board concluded that the profitability of PI and its affiliates in relation to the services rendered was not unreasonable.
The Board considered information about the profitability of LSV or Thornburg, but concluded that the level of a subadviser’s profitability may not be as significant given the arm’s length nature of the process by which the subadvisory fee rates were negotiated by PI, LSV and Thornburg as well as the fact that PI compensates the subadvisers out of its management fee.
Economies of Scale
The Board received and discussed information concerning whether PI realizes economies of scale as the Fund’s assets grow beyond current levels. The Board noted that the management fee schedule for the Fund includes breakpoints, which have the effect of decreasing the fee rate as assets increase, but at the current level of assets the Fund does not realize the effect of those rate reductions. The Board took note that the Fund’s fee structure would result in benefits to Fund shareholders when (and if) assets reach the levels at which the fee rate is reduced. These benefits will accrue whether or not PI is then realizing any economies of scale.
Other Benefits to PI, LSV and Thornburg
The Board considered potential ancillary benefits that might be received by PI, LSV and Thornburg and their affiliates as a result of their relationship with the Fund. The Board concluded that potential benefits to be derived by PI included fees received by affiliates of PI for serving as the Fund’s securities lending agent, transfer agency fees received by the Fund’s transfer agent (which is affiliated with PI), and benefits to the reputation as well as other intangible benefits resulting from PI’s association with the Fund. The Board concluded that the potential benefits to be derived by LSV and Thornburg included their ability to use soft dollar credits, brokerage commissions received by affiliates of LSV or Thorrnburg, as well as the potential benefits consistent with those generally resulting from an increase in assets under management, specifically, potential access to additional research resources and benefits to the reputation. The Board concluded that the benefits derived by PI, LSV and Thornburg were consistent with the types of benefits generally derived by investment managers and subadvisers to mutual funds.
After full consideration of these factors, the Board concluded that the approval of the agreements was in the interest of the Fund and its shareholders.
Visit our website at www.prudentialfunds.com
| | | | |
| n MAIL | | n TELEPHONE | | n WEBSITE |
Gateway Center Three 100 Mulberry Street Newark, NJ 07102 | | (800) 225-1852 | | www.prudentialfunds.com |
|
| PROXY VOTING |
| The Board of Directors of the Fund has delegated to the Fund’s investment subadvisers the responsibility for voting any proxies and maintaining proxy recordkeeping with respect to the Fund. A description of these proxy voting policies and procedures is available without charge, upon request, by calling (800) 225-1852 or by visiting the Securities and Exchange Commission’s website at www.sec.gov. Information regarding how the Fund voted proxies relating to portfolio securities during the most recent 12-month period ended June 30 is available on the Fund’s website and on the Commission’s website. |
|
| DIRECTORS |
Kevin J. Bannon • Scott E. Benjamin • Linda W. Bynoe • Michael S. Hyland •
Douglas H. McCorkindale • Stephen P. Munn • Richard A. Redeker • Judy A. Rice •
Robin B. Smith • Stephen G. Stoneburn |
|
| OFFICERS |
| Judy A. Rice, President • Scott E. Benjamin, Vice President • Grace C. Torres, Treasurer and Principal Financial and Accounting Officer • Kathryn L. Quirk, Chief Legal Officer • Deborah A. Docs, Secretary • Timothy J. Knierim, Chief Compliance Officer • Valerie M. Simpson, Deputy Chief Compliance Officer • Theresa C. Thompson, Deputy Chief Compliance Officer • Richard W. Kinville, Anti-Money Laundering Compliance Officer • Jonathan D. Shain, Assistant Secretary • Claudia DiGiacomo, Assistant Secretary • John P. Schwartz, Assistant Secretary • Andrew R. French, Assistant Secretary • M. Sadiq Peshimam, Assistant Treasurer • Peter Parrella, Assistant Treasurer |
| | | | |
| MANAGER | | Prudential Investments LLC | | Gateway Center Three
100 Mulberry Street
Newark, NJ 07102 |
|
| INVESTMENT SUBADVISERS | | LSV Asset Management
| | 155 North Wacker Drive
46th Floor Chicago, IL 60606 |
| | Thornburg Investment
Management, Inc. | | 2300 North Ridgetop Road
Santa Fe, NM 87506 |
|
| DISTRIBUTOR | | Prudential Investment
Management Services LLC | | Gateway Center Three
100 Mulberry Street
Newark, NJ 07102 |
|
| CUSTODIAN | | The Bank of New York Mellon | | One Wall Street
New York, NY 10286 |
|
| TRANSFER AGENT | | Prudential Mutual Fund
Services LLC | | PO Box 9658
Providence, RI 02940 |
|
| INDEPENDENT REGISTERED PUBLIC ACCOUNTING FIRM | | KPMG LLP | | 345 Park Avenue
New York, NY 10154 |
|
| FUND COUNSEL | | Willkie Farr & Gallagher LLP | | 787 Seventh Avenue
New York, NY 10019 |
|
| An investor should consider the investment objectives, risks, charges, and expenses of the Fund carefully before investing. The prospectus and summary prospectus contain this and other information about the Fund. An investor may obtain a prospectus and summary prospectus by visiting our website at www.prudentialfunds.com or by calling (800) 225-1852. The prospectus and summary prospectus should be read carefully before investing. |
|
| E-DELIVERY |
| To receive your mutual fund documents online, go to www.prudentialfunds.com/edelivery and enroll. Instead of receiving printed documents by mail, you will receive notification via email when new materials are available. You can cancel your enrollment or change your email address at any time by visiting the website address above. |
|
| SHAREHOLDER COMMUNICATIONS WITH DIRECTORS |
| Shareholders can communicate directly with the Board of Directors by writing to the Chair of the Board, Prudential International Value Fund, Prudential Investments, Attn: Board of Directors, 100 Mulberry Street, Gateway Center Three, Newark, NJ 07102. Shareholders can communicate directly with an individual Director by writing to the same address. Communications are not screened before being delivered to the addressee. |
|
| AVAILABILITY OF PORTFOLIO SCHEDULE |
| The Fund files its complete schedule of portfolio holdings with the Securities and Exchange Commission for the first and third quarters of each fiscal year on Form N-Q. The Fund’s Forms N-Q are available on the Commission’s website at www.sec.gov. The Fund’s Forms N-Q may also be reviewed and copied at the Commission’s Public Reference Room in Washington, D.C. Information on the operation and location of the Public Reference Room may be obtained by calling (202) 551-8090. The Fund’s schedule of portfolio holdings is also available on the Fund’s website as of the end of each month. |
|
| The Fund’s Statement of Additional Information contains additional information about the Fund’s Directors and is available without charge, upon request, by calling (800) 225-1852. |
Mutual Funds:
| | | | |
| ARE NOT INSURED BY THE FDIC OR ANY FEDERAL GOVERNMENT AGENCY | | MAY LOSE VALUE | | ARE NOT A DEPOSIT OF OR GUARANTEED BY ANY BANK OR ANY BANK AFFILIATE |

PRUDENTIAL INTERNATIONAL VALUE FUND
| | | | | | | | |
| SHARE CLASS | | A | | B | | C | | Z |
| NASDAQ | | PISAX | | PISBX | | PCISX | | PISZX |
| CUSIP | | 743969503 | | 743969602 | | 743969701 | | 743969800 |
MF115E 0215366-00001-00

PRUDENTIAL INVESTMENTS»MUTUAL FUNDS
PRUDENTIAL EMERGING MARKETS DEBT LOCAL CURRENCY FUND
ANNUAL REPORT · OCTOBER 31, 2011
Fund Type
Emerging market bond
Objective
Total return, through a combination of current income and capital appreciation
This report is not authorized for distribution to prospective investors unless preceded or accompanied by a current prospectus.
The views expressed in this report and information about the Fund’s portfolio holdings are for the period covered by this report and are subject to change thereafter.
Prudential Investments, Prudential, the Prudential logo, and the Rock symbol are service marks of Prudential Financial, Inc. and its related entities, registered in many jurisdictions worldwide.

December 15, 2011
Dear Shareholder:
After leading Prudential Investments for the past eight years, I have decided to retire at the end of 2011 from my positions as President of Prudential Investments and President and Director of the Prudential Emerging Markets Debt Local Currency Fund (the Fund). Effective January 1, 2012, I will become Chairman of Prudential Investments and act as an advisor to the business during 2012 to help facilitate a smooth transition to my successor, Stuart Parker.
Stuart, who will become President of Prudential Investments and President and Director of the Fund on January 1, 2012, previously served as the Executive Vice President of Retail Mutual Fund Distribution at Prudential Investments. With more than 20 years of investment industry experience, Stuart brings a deep understanding of the needs and challenges facing today’s investors.
We hope you find the annual report for the Fund informative. We recognize that ongoing market volatility may make it a difficult time to be an investor. We continue to believe a prudent response to uncertainty is to maintain a diversified portfolio, including stock and bond mutual funds consistent with your tolerance for risk, time horizon, and financial goals.
Your financial professional can help you create a diversified investment plan that reflects your personal investor profile and risk tolerance. Keep in mind that diversification and asset allocation strategies do not assure a profit or protect against loss in declining markets. We encourage you to call your financial professional before making any investment decision.
Prudential Investments provides a wide range of mutual funds to choose from that can help you make progress toward your financial goals. Our funds offer the experience, resources, and professional discipline of Prudential Financial’s affiliated asset managers.
Finally, I’ve been privileged to have had the opportunity to help you address your investment needs, and I thank you for choosing the Prudential Investments family of mutual funds.
Sincerely,

Judy A. Rice, President
Prudential Emerging Markets Debt Local Currency Fund
| | | | |
| Prudential Emerging Markets Debt Local Currency Fund | | | 1 | |
Your Fund’s Performance
Performance data quoted represent past performance. Past performance does not guarantee future results. The investment return and principal value of an investment will fluctuate, so that an investor’s shares, when redeemed, may be worth more or less than their original cost. Current performance may be lower or higher than the past performance data quoted. An investor may obtain performance data as of the most recent month-end by visiting our website at www.prudentialfunds.com or by calling (800) 225-1852. Class A shares have a maximum initial sales charge of 4.50%. Gross operating expenses: Class A, 2.81%; Class C, 3.52%; Class Q, 2.67%; Class Z, 2.72%. Net operating expenses: Class A, 1.30%; Class C, 2.05%; Class Q, 1.05%; Class Z, 1.05%, after contractual reduction through 2/28/2013.
| | | | | | | | |
Cumulative Total Returns (Without Sales Charges) as of 10/31/11 |
| | | | | | | | | Since Inception |
Class A | | | | | | | | –3.14% |
Class C | | | | | | | | –2.72 |
Class Q | | | | | | | | –3.14 |
Class Z | | | | | | | | –3.14 |
JP Morgan Government Bond Index-Emerging Markets Global Diversified Index | | | | | | | | 0.36 |
Lipper Average | | | | | | | | 1.64 |
| | | | | | | | |
Average Annual Total Returns (With Sales Charges) as of 9/30/11 |
| | | | | | | | | Since Inception |
Class A | | | | | | | | N/A |
Class C | | | | | | | | N/A |
Class Q | | | | | | | | N/A |
Class Z | | | | | | | | N/A |
JP Morgan Government Bond Index-Emerging Markets Global Diversified Index | | | | | | | | N/A |
Lipper Average | | | | | | | | N/A |
| | | | | | | | |
Average Annual Total Returns (With Sales Charges) as of 10/31/11 |
| | | | | | | | | Since Inception |
Class A | | | | | | | | N/A |
Class C | | | | | | | | N/A |
Class Q | | | | | | | | N/A |
Class Z | | | | | | | | N/A |
| | | | | | | | |
| | |
| 2 | | Visit our website at www.prudentialfunds.com |
| | | | | | | | |
Average Annual Total Returns (Without Sales Charges) as of 10/31/11 |
| | | | | | | | | Since Inception |
Class A | | | | | | | | N/A |
Class C | | | | | | | | N/A |
Class Q | | | | | | | | N/A |
Class Z | | | | | | | | N/A |
Growth of a $10,000 Investment
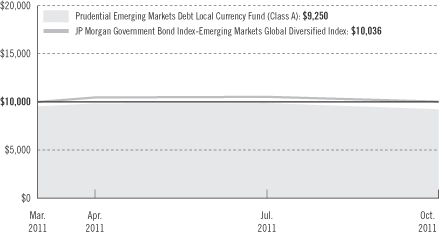
The graph compares a $10,000 investment in the Prudential Emerging Markets Debt Local Currency Fund (Class A shares) with a similar investment in the JP Morgan Government Bond Index-Emerging Markets Global Diversified Index by portraying the initial account values at the commencement of operations for Class A shares (March 30, 2011) and the account values at the end of the current fiscal year (October 31, 2011), as measured on a quarterly basis. For purposes of the graph, and unless otherwise indicated, it has been assumed that (a) the maximum applicable front-end sales charge was deducted from the initial $10,000 investment in Class A shares; (b) all recurring fees (including management fees) were deducted; and (c) all dividends and distributions were reinvested. The line graph provides information for Class A shares only. As indicated in the tables provided earlier, performance for Class C, Class Q, and Class Z shares will vary due to the differing charges and expenses applicable to each share class (as indicated in the following paragraphs). Without a distribution and service (12b-1) fee waiver of 0.05% for Class A shares through February 28, 2013, the returns shown in the graph and for Class A shares in the tables would have been lower.
Total returns and the ending account values in the graph include changes in share price and reinvestment of dividends and capital gains distributions in a hypothetical investment for the periods shown. The Fund’s total returns do not reflect the deduction of income taxes on an individual’s investment. Taxes may reduce your actual investment returns on income or gains paid by the Fund or any gains you may realize if you sell your shares.
| | | | |
| Prudential Emerging Markets Debt Local Currency Fund | | | 3 | |
Your Fund’s Performance (continued)
Source: Prudential Investments LLC and Lipper Inc. Performance figures may reflect fee waivers and/or expense reimbursements. In the absence of such fee waivers and/or expense reimbursements, total returns would be lower.
The performance data featured represents past performance for a period of less than one year. While past performance is never an indication of future results, short periods of performance may be particularly unrepresentative of long-term performance for certain types of funds.
Inception date: 3/30/11
The average annual total returns take into account applicable sales charges. Class A shares are subject to a maximum front-end sales charge of 4.50% and a 12b-1 fee of up to 0.30% annually. All investors who purchase Class A shares in an amount of $1 million or more and sell these shares within 12 months of purchase are subject to a contingent deferred sales charge (CDSC) of 1%. Under certain limited circumstances, an exchange may be made from Class A or Class C to Class Z shares of the Fund. Class C shares are not subject to a front-end sales charge, but charge a CDSC of 1% for shares sold within 12 months from the date of purchase and an annual 12b-1 fee of 1%. Class Q and Class Z shares are not subject to a CDSC or 12b-1 fee. The returns in the tables and graph reflect the share class expense structure in effect at the close of the fiscal period. The returns in the tables and graph do not reflect the deduction of taxes that a shareholder would pay on Fund distributions or following the redemption of Fund shares.
Benchmark Definitions
JP Morgan Government Bond Index-Emerging Markets Global Diversified Index
The JP Morgan GBI-EM Global Diversified Index (GBI-EM Global Diversified), an unmanaged index, is a comprehensive emerging markets debt benchmark that tracks local currency bonds issued by emerging market governments.
Lipper Emerging Markets Debt Funds Average
Funds in the Lipper Emerging Markets Debt Funds Average seek either current income or total return by investing at least 65% of total assets in emerging market debt securities, where “emerging market” is defined by a country’s GNP per capita or other economic measure.
Investors cannot invest directly in an index or average. The returns for the Index would be lower if they included the effects of sales charges, operating expenses of a mutual fund, or taxes. Returns for the Lipper Average reflect the deduction of operating expenses, but not sales charges or taxes.
| | | | | | | | |
Distributions and Yields as of 10/31/11 | |
| | | Total Distributions
Paid during the Period | | | 30-Day
SEC Yield | |
Class A | | $ | 0.34 | | | | 4.91 | % |
Class C | | | 0.33 | | | | 4.37 | |
Class Q | | | 0.33 | | | | 5.42 | |
Class Z | | | 0.33 | | | | 5.41 | |
| | |
| 4 | | Visit our website at www.prudentialfunds.com |
| | | | |
Five Largest Issues expressed as a percentage of net assets as of 10/31/11 | | | | |
Brazil Notas Do Tesouro Nacional, Notes, Ser. NTN-F, 10.000%, 01/01/13 | | | 4.9 | % |
Poland Government Bond, Bonds, Ser. 1019, 5.500%, 10/25/19 | | | 3.8 | |
Eskom Holdings Ltd., Notes, MTN, 10.000%, 01/25/23 | | | 3.6 | |
Poland Government Bond, Bonds, Ser. 0415, 5.500%, 04/25/15 | | | 3.5 | |
South Africa Government Bond, Bonds, Ser. R186, 10.500%, 12/21/26 | | | 3.2 | |
Issues reflect only long-term investments and are subject to change.
| | | | |
Credit Quality* expressed as a percentage of net assets as of 10/31/11 | |
A | | | 17.3 | % |
Baa | | | 42.9 | |
Ba | | | 10.0 | |
B | | | 2.0 | |
Not Rated | | | 23.0 | |
Total Investments | | | 95.2 | |
Other assets in excess of liabilities | | | 4.8 | |
Net Assets | | | 100.0 | % |
| | | | |
*Source: Moody’s rating, defaulting to S&P when not rated by Moody’s.
Credit Quality is subject to change.
| | | | |
| Prudential Emerging Markets Debt Local Currency Fund | | | 5 | |
Strategy and Performance Overview
How did the Fund perform?
The Prudential Emerging Markets Debt Local Currency Fund Class A shares declined 3.14% in U.S. dollar terms for the reporting period from inception on March 30, 2011 through October 31, 2011. The Class A shares underperformed the benchmark, the JP Morgan Government Bond Index-Emerging Markets Global Diversified Index (GBI-EM Global Diversified Index), which returned 0.36% in U.S. dollar terms. The Class A shares also lagged the Lipper Emerging Markets Debt Funds Average, which returned 1.64%.
How is the Fund managed?
Prudential Fixed Income’s dedicated team of emerging markets specialists manages the Fund, which seeks current income and capital appreciation by investing at least 80% of its investable assets in currencies of, and fixed income instruments denominated in currencies of, emerging market countries. The team, which has been managing emerging markets fixed income portfolios since 1996, draws upon Prudential’s global network of economists, analysts, and asset managers to evaluate the best investment opportunities in emerging market currencies and emerging market bonds denominated in local currencies.
How did local currency-denominated government bonds of emerging market countries perform?
The performance of these government bond markets was affected by dramatic changes in investor risk appetite, which were largely driven by economic and political problems in the developed world.
| | • | | Emerging market government bonds denominated in local currencies delivered a single-digit gain overall for the second quarter of 2011 in U.S. dollar terms. However, market returns were somewhat volatile, reflecting concerns about the latest flare up in a sovereign-debt crisis in the euro zone centered in Greece and other geographically peripheral nations in that region. Other key sources of anxiety were the potential for the U.S. economy to slip into a double-dip recession, the end of a massive bond-buying program by the Federal Reserve that was intended to help boost growth, and fear that the U.S. government might technically default on its debt. Nevertheless, global investors remained optimistic about the healthy state of emerging market fundamentals. |
| | • | | Market conditions grew increasingly volatile during the third quarter as European policymakers struggled to contain the crisis in the euro zone and investors continued to fear the U.S. economy was headed for a double-dip recession. A flight to safety, which had begun in the spring, gained momentum during the summer as risk-averse investors sought refuge in U.S. Treasury securities and the U.S. dollar. In September, the greenback appreciated sharply |
| | |
| 6 | | Visit our website at www.prudentialfunds.com |
| | against most emerging market currencies. This pressured emerging market government bonds denominated in local currencies, which posted a loss for the third quarter in U.S. dollar terms. |
| | • | | Investor risk appetite improved in October 2011, as signs of strength in the U.S. economy quieted fears that it might lapse into a double-dip recession. European leaders also appeared to make progress on containing that region’s sovereign-debt crisis. Consequently, emerging market currencies regained some of the ground lost against the U.S. dollar, and emerging market government bonds denominated in local currencies also appreciated in value, finishing the entire period with a 0.36% return, as measured by the GBI-EM Global Diversified Index. |
Which investment strategies had a major impact on the Fund’s performance?
Several factors involving currency exposures, timing of investments, taxes, and country selection significantly affected the Fund’s performance.
| | • | | Positions in currencies of Latin American countries, particularly Brazil, helped the Fund’s performance as they generally held up better during the period than currencies in other regions. But the positive impact from the Latin American currencies was more than offset by positions in currencies of European emerging market nations, which weakened due to the close proximity and exposure of those nations to the euro zone sovereign-debt crisis. |
| | • | | The Fund benefited from having a smaller exposure than the GBI-EM Global Diversified Index to the Hungarian forint, one of the worst performing currencies of the period. |
| | • | | The Fund sometimes utilized forward currency contracts to manage its currency exposures. The use of forward currency contracts had a net negative impact on the Fund’s return for the period. |
| | • | | The Fund prudently invested, early in the period, seed capital allocated to it on March 30, 2011. It was initially under-invested versus its peers and the GBI-EM Global Diversified Index. Consequently, the Fund lagged the GBI-EM Global Diversified Index as emerging market debt performed well during the second quarter of 2011. |
| | • | | A major drag on the Fund’s performance was caused by taxes related to its local market investments in Brazil, which were a significant overweight exposure that comprised almost 15% of the Fund’s assets. Even though building this position led to a large tax imposition, Prudential Fixed Income |
| | | | |
| Prudential Emerging Markets Debt Local Currency Fund | | | 7 | |
Strategy and Performance Overview (continued)
| | favored local currency-denominated Brazilian government bonds as they offered very attractive tax-adjusted yields over a medium term perspective. |
| | • | | Non-benchmark positions in Argentina, Venezuela, and Ukraine denominated in hard currencies such as the U.S. dollar detracted from the Fund’s performance versus the GBI-EM Global Diversified Index. They performed poorly during the third quarter period of heightened risk aversion. Nevertheless, they continue to represent key positions in the Fund, as Argentina, Venezuela, and Ukraine are among the highest-yielding countries in the universe of hard currency-denominated emerging market bonds. |
| | |
| 8 | | Visit our website at www.prudentialfunds.com |
Fees and Expenses (Unaudited)
As a shareholder of the Fund, you incur two types of costs: (1) transaction costs, including sales charges (loads) on purchase payments and redemptions, as applicable, and (2) ongoing costs, including management fees, distribution and/or service (12b-1) fees, and other Fund expenses, as applicable. This example is intended to help you understand your ongoing costs (in dollars) of investing in the Fund and to compare these costs with the ongoing costs of investing in other mutual funds.
The example is based on an investment of $1,000 invested on May 1, 2011, at the beginning of the period, and held through the six-month period ended October 31, 2011. The example is for illustrative purposes only; you should consult the Prospectus for information on initial and subsequent minimum investment requirements.
The Fund’s transfer agent may charge additional fees to holders of certain accounts that are not included in the expenses shown in the table on the following page. These fees apply to individual retirement accounts (IRAs) and Section 403(b) accounts. As of the close of the six-month period covered by the table, IRA fees included an annual maintenance fee of $15 per account (subject to a maximum annual maintenance fee of $25 for all accounts held by the same shareholder). Section 403(b) accounts are charged an annual $25 fiduciary maintenance fee. Some of the fees may vary in amount, or may be waived, based on your total account balance or the number of Prudential Investments funds, including the Fund, that you own. You should consider the additional fees that were charged to your Fund account over the six-month period when you estimate the total ongoing expenses paid over the period and the impact of these fees on your ending account value, as these additional expenses are not reflected in the information provided in the expense table. Additional fees have the effect of reducing investment returns.
Actual Expenses
The first line for each share class in the table on the following page provides information about actual account values and actual expenses. You may use the information on this line, together with the amount you invested, to estimate the expenses that you paid over the period. Simply divide your account value by $1,000 (for example, an $8,600 account value ÷ $1,000 = 8.6), then multiply the result by the number on the first line under the heading “Expenses Paid During the Six-Month Period” to estimate the expenses you paid on your account during this period.
Hypothetical Example for Comparison Purposes
The second line for each share class in the table on the following page provides information about hypothetical account values and hypothetical expenses based on the Fund’s actual expense ratio and an assumed rate of return of 5% per year before
| | | | |
| Prudential Emerging Markets Debt Local Currency Fund | | | 9 | |
Fees and Expenses (continued)
expenses, which is not the Fund’s actual return. The hypothetical account values and expenses may not be used to estimate the actual ending account balance or expenses you paid for the period. You may use this information to compare the ongoing costs of investing in the Fund and other funds. To do so, compare this 5% hypothetical example with the 5% hypothetical examples that appear in the shareholder reports of the other funds.
Please note that the expenses shown in the table are meant to highlight your ongoing costs only and do not reflect any transactional costs such as sales charges (loads). Therefore, the second line for each share class in the table is useful in comparing ongoing costs only and will not help you determine the relative total costs of owning different funds. In addition, if these transactional costs were included, your costs would have been higher.
| | | | | | | | | | | | | | | | | | |
Prudential
Emerging Markets Debt
Local Currency Fund | | Beginning Account
Value
May 1, 2011 | | | Ending Account
Value
October 31, 2011 | | | Annualized
Expense Ratio
Based on the
Six-Month Period | | | Expenses Paid
During the
Six-Month Period* | |
| | | | | | | | | | | | | | | | | | |
| Class A | | Actual | | $ | 1,000.00 | | | $ | 939.60 | | | | 1.30 | % | | $ | 6.36 | |
| | | Hypothetical | | $ | 1,000.00 | | | $ | 1,018.65 | | | | 1.30 | % | | $ | 6.61 | |
| | | | | | | | | | | | | | | | | | |
| Class C | | Actual | | $ | 1,000.00 | | | $ | 943.60 | | | | 2.05 | % | | $ | 10.04 | |
| | | Hypothetical | | $ | 1,000.00 | | | $ | 1,014.87 | | | | 2.05 | % | | $ | 10.41 | |
| | | | | | | | | | | | | | | | | | |
| Class Q | | Actual | | $ | 1,000.00 | | | $ | 938.90 | | | | 1.05 | % | | $ | 5.13 | |
| | | Hypothetical | | $ | 1,000.00 | | | $ | 1,019.86 | | | | 1.05 | % | | $ | 5.35 | |
| | | | | | | | | | | | | | | | | | |
| Class Z | | Actual | | $ | 1,000.00 | | | $ | 938.90 | | | | 1.05 | % | | $ | 5.13 | |
| | | Hypothetical | | $ | 1,000.00 | | | $ | 1,019.91 | | | | 1.05 | % | | $ | 5.35 | |
* Fund expenses (net of fee waivers or subsidies, if any) for each share class are equal to the annualized expense ratio for each share class (provided in the table), multiplied by the average account value over the period, multiplied by the 184 days in the six-month period ended October 31, 2011, and divided by the 365 days in the Fund’s fiscal year ended October 31, 2011 (to reflect the six-month period). Expenses presented in the table include the expenses of any underlying portfolios in which the Fund may invest.
| | |
| 10 | | Visit our website at www.prudentialfunds.com |
Portfolio of Investments
as of October 31, 2011
| | | | | | | | | | | | | | | | |
| Description | | Moody’s
Ratings†
(Unaudited) | | Interest
Rate | | Maturity
Date | | | Principal
Amount (000)# | | | Value (Note 1) | |
| | | | | | | | | | | | | | | | |
LONG-TERM INVESTMENTS 90.8% | | | | | | | | | | | | |
FOREIGN BONDS | | | | | | | | | | | | | | | | |
| | | | | |
Argentina 0.8% | | | | | | | | | | | | | | | | |
Argentina Bonos,
Sr. Unsec’d. Notes(a) | | B3 | | 0.439% | | | 08/03/12 | | | $ | 2,000 | | | $ | 241,200 | |
| | | | | |
Brazil 14.7% | | | | | | | | | | | | | | | | |
Banco Votorantim Ltd.,
Sr. Unsec’d. Notes, MTN, RegS | | Baa1 | | 10.625 | | | 04/10/14 | | | BRL | 415 | | | | 246,556 | |
Brasil Telecom SA,
Sr. Unsec’d. Notes, 144A | | Baa2 | | 9.750 | | | 09/15/16 | | | BRL | 300 | | | | 171,244 | |
Brazil Notas Do Tesouro Nacional, Notes,
Ser. NTN-B | | Baa2 | | 6.000 | | | 08/15/14 | | | BRL | 52 | | | | 64,971 | |
Ser. NTN-B | | Baa2 | | 6.000 | | | 05/15/15 | | | BRL | 185 | | | | 231,170 | |
Ser. NTN-F | | Baa2 | | 10.000 | | | 01/01/12 | | | BRL | 1,180 | | | | 685,438 | |
Ser. NTN-F | | Baa2 | | 10.000 | | | 01/01/13 | | | BRL | 2,500 | | | | 1,448,977 | |
Ser. NTN-F | | Baa2 | | 10.000 | | | 01/01/14 | | | BRL | 750 | | | | 429,958 | |
Ser. NTN-F | | NR | | 10.000 | | | 01/01/15 | | | BRL | 775 | | | | 438,312 | |
Ser. NTN-F | | Baa2 | | 10.000 | | | 01/01/17 | | | BRL | 800 | | | | 440,763 | |
Ser. NTN-F | | Baa2 | | 10.000 | | | 01/01/21 | | | BRL | 350 | | | | 186,735 | |
| | | | | | | | | | | | | | | | |
| | | | | | | | | | | | | | | 4,344,124 | |
| | | | | |
Colombia 4.1% | | | | | | | | | | | | | | | | |
Colombia Government International Bond,
Sr. Unsec’d. Notes | | Baa3 | | 7.750 | | | 04/14/21 | | | COP | 947,000 | | | | 595,676 | |
Sr. Unsec’d. Notes | | Baa3 | | 12.000 | | | 10/22/15 | | | COP | 700,000 | | | | 475,344 | |
Republic of Colombia,
Sr. Unsec’d. Notes | | Baa3 | | 9.850 | | | 06/28/27 | | | COP | 180,000 | | | | 135,890 | |
| | | | | | | | | | | | | | | | |
| | | | | | | | | | | | | | | 1,206,910 | |
| | | | | |
Hungary 4.5% | | | | | | | | | | | | | | | | |
Hungary Government Bond, Bonds,
Ser. 15/A | | Baa3 | | 8.000 | | | 02/12/15 | | | HUF | 42,850 | | | | 198,052 | |
Ser. 16/C | | Baa3 | | 5.500 | | | 02/12/16 | | | HUF | 95,490 | | | | 403,538 | |
Ser. 17/B | | Baa3 | | 6.750 | | | 02/24/17 | | | HUF | 108,610 | | | | 476,161 | |
Ser. 19/A | | Baa3 | | 6.500 | | | 06/24/19 | | | HUF | 58,990 | | | | 250,012 | |
| | | | | | | | | | | | | | | | |
| | | | | | | | | | | | | | | 1,327,763 | |
See Notes to Financial Statements.
| | | | |
| Prudential Emerging Markets Debt Local Currency Fund | | | 11 | |
Portfolio of Investments
as of October 31, 2011 continued
| | | | | | | | | | | | | | | | |
| Description | | Moody’s
Ratings†
(Unaudited) | | Interest
Rate | | Maturity
Date | | | Principal
Amount (000)# | | | Value (Note 1) | |
| | | | | | | | | | | | | | | | |
LONG-TERM INVESTMENTS (Continued) | | | | | | | | | | | | |
| | | | | |
Indonesia 8.3% | | | | | | | | | | | | | | | | |
Indonesia Treasury Bond,
Sr. Unsec’d. Notes,
Ser. FR36 | | Ba1 | | 11.500% | | | 09/15/19 | | | IDR | 3,500,000 | | | $ | 525,658 | |
Ser. FR51 | | Ba1 | | 11.250 | | | 05/15/14 | | | IDR | 450,000 | | | | 58,021 | |
Ser. FR53 | | Ba1 | | 8.250 | | | 07/15/21 | | | IDR | 4,300,000 | | | | 554,035 | |
Ser. FR54 | | Ba1 | | 9.500 | | | 07/15/31 | | | IDR | 4,000,000 | | | | 562,265 | |
Ser. FR55 | | Ba1 | | 7.375 | | | 09/15/16 | | | IDR | 3,000,000 | | | | 363,348 | |
Ser. FR58 | | NR | | 8.250 | | | 06/15/32 | | | IDR | 3,000,000 | | | | 382,374 | |
| | | | | | | | | | | | | | | | |
| | | | | | | | | | | | | | | 2,445,701 | |
| | | | | |
Malaysia 4.1% | | | | | | | | | | | | | | | | |
Malaysia Government Bond, Bonds,
Ser. 0111 | | A3 | | 4.160 | | | 07/15/21 | | | MYR | 1,935 | | | | 651,833 | |
Ser. 0311 | | NR | | 4.392 | | | 04/15/26 | | | MYR | 965 | | | | 328,590 | |
Ser. 0411 | | NR | | 4.232 | | | 06/30/31 | | | MYR | 700 | | | | 234,046 | |
| | | | | | | | | | | | | | | | |
| | | | | | | | | | | | | | | 1,214,469 | |
| | | | | |
Mexico 9.0% | | | | | | | | | | | | | | | | |
Mexican Bonos, Bonds,
Ser. M | | Baa1 | | 6.000 | | | 06/18/15 | | | MXN | 1,400 | | | | 109,112 | |
Ser. M | | Baa1 | | 6.500 | | | 06/10/21 | | | MXN | 3,500 | | | | 268,429 | |
Ser. M 10 | | Baa1 | | 7.250 | | | 12/15/16 | | | MXN | 775 | | | | 63,764 | |
Ser. M 10 | | Baa1 | | 8.000 | | | 12/17/15 | | | MXN | 600 | | | | 50,037 | |
Ser. M 20 | | Baa1 | | 8.500 | | | 05/31/29 | | | MXN | 1,400 | | | | 120,019 | |
Ser. M 30 | | Baa1 | | 8.500 | | | 11/18/38 | | | MXN | 9,300 | | | | 778,128 | |
Petroleos Mexicanos,
Gtd. Notes | | Baa1 | | 9.100 | | | 01/27/20 | | | MXN | 9,650 | | | | 821,847 | |
Notes | | NR | | 5.230 | | | 05/12/14 | | | MXN | 6,000 | | | | 453,590 | |
| | | | | | | | | | | | | | | | |
| | | | | | | | | | | | | | | 2,664,926 | |
| | | | | |
Peru 4.1% | | | | | | | | | | | | | | | | |
Peruvian Government International Bond,
Sr. Unsec’d. Notes, 144A | | Baa3 | | 7.840 | | | 08/12/20 | | | PEN | 650 | | | | 275,220 | |
Sr. Unsec’d. Notes, 144A | | Baa3 | | 9.910 | | | 05/05/15 | | | PEN | 600 | | | | 260,810 | |
Sr. Unsec’d. Notes, RegS | | Baa3 | | 6.950 | | | 08/12/31 | | | PEN | 95 | | | | 37,445 | |
Sr. Unsec’d. Notes, RegS | | Baa3 | | 7.840 | | | 08/12/20 | | | PEN | 560 | | | | 237,112 | |
See Notes to Financial Statements.
| | |
| 12 | | Visit our website at www.prudentialfunds.com |
| | | | | | | | | | | | | | | | |
| Description | | Moody’s
Ratings†
(Unaudited) | | Interest
Rate | | Maturity
Date | | | Principal
Amount (000)# | | | Value (Note 1) | |
| | | | | | | | | | | | | | | | |
LONG-TERM INVESTMENTS (Continued) | | | | | | | | | | | | |
| | | | | |
Peru (cont’d.) | | | | | | | | | | | | | | | | |
Sr. Unsec’d. Notes, RegS | | Baa3 | | 8.200% | | | 08/12/26 | | | PEN | 880 | | | $ | 390,941 | |
| | | | | | | | | | | | | | | | |
| | | | | | | | | | | | | | | 1,201,528 | |
| | | | | |
Philippines 0.4% | | | | | | | | | | | | | | | | |
Philippine Government International Bond,
Sr. Unsec’d. Notes | | Ba2 | | 4.950 | | | 01/15/21 | | | PHP | 5,000 | | | | 112,877 | |
| | | | | |
Poland 7.5% | | | | | | | | | | | | | | | | |
Poland Government Bond, Bonds,
Ser. 0415 | | A2 | | 5.500 | | | 04/25/15 | | | PLN | 3,195 | | | | 1,024,933 | |
Ser. 1019 | | A2 | | 5.500 | | | 10/25/19 | | | PLN | 3,565 | | | | 1,118,165 | |
Ser. 1020 | | A2 | | 5.250 | | | 10/25/20 | | | PLN | 240 | | | | 73,331 | |
| | | | | | | | | | | | | | | | |
| | | | | | | | | | | | | | | 2,216,429 | |
| | | | | |
Russia 7.8% | | | | | | | | | | | | | | | | |
Home Credit & Finance Bank Ooo Via Eurasia Capital SA
Sr. Sec’d. Notes | | Ba3 | | 7.000 | | | 03/18/14 | | | $ | 250 | | | | 248,750 | |
Rushydro JSC Via Rushydro Finance Ltd., Sec’d. Notes,
Ser. E, MTN | | Ba1 | | 7.875 | | | 10/28/15 | | | RUB | 10,000 | | | | 319,717 | |
Russian Agricultural Bank OJSC Via RSHB Capital SA,
Notes, MTN | | Baa1 | | 8.700 | | | 03/17/16 | | | RUB | 6,000 | | | | 196,745 | |
Sec’d. Notes | | Baa1 | | 7.500 | | | 03/25/13 | | | RUB | 10,100 | | | | 332,901 | |
Russian Foreign Bond -Eurobond,
Sr. Unsec’d. Notes, RegS, | | Baa1 | | 7.850 | | | 03/10/18 | | | RUB | 20,000 | | | | 679,482 | |
Sr. Unsec’d. Notes, 144A | | Baa1 | | 7.850 | | | 03/10/18 | | | RUB | 10,000 | | | | 339,741 | |
Vimpelcom Holdings BV, Gtd. Notes, 144A(a) | | Ba3 | | 4.365 | | | 06/29/14 | | | $ | 200 | | | | 196,246 | |
| | | | | | | | | | | | | | | | |
| | | | | | | | | | | | | | | 2,313,582 | |
| | | | | |
South Africa 11.2% | | | | | | | | | | | | | | | | |
Eskom Holdings Ltd., Notes, MTN | | NR | | 10.000 | | | 01/25/23 | | | ZAR | 7,500 | | | | 1,054,384 | |
See Notes to Financial Statements.
| | | | |
| Prudential Emerging Markets Debt Local Currency Fund | | | 13 | |
Portfolio of Investments
as of October 31, 2011 continued
| | | | | | | | | | | | | | | | |
| Description | | Moody’s
Ratings†
(Unaudited) | | Interest
Rate | | Maturity
Date | | | Principal
Amount (000)# | | | Value (Note 1) | |
| | | | | | | | | | | | | | | | |
LONG-TERM INVESTMENTS (Continued) | | | | | | | | | | | | |
| | | | | |
South Africa (cont’d.) | | | | | | | | | | | | | | | | |
South Africa Government Bond, Bonds,
Ser. R186 | | A3 | | 10.500% | | | 12/21/26 | | | ZAR | 6,310 | | | $ | 946,401 | |
Ser. R204 | | A3 | | 8.000 | | | 12/21/18 | | | ZAR | 2,775 | | | | 356,968 | |
Ser. R208 | | A3 | | 6.750 | | | 03/31/21 | | | ZAR | 1,010 | | | | 118,232 | |
Ser. R209 | | A3 | | 6.250 | | | 03/31/36 | | | ZAR | 565 | | | | 53,335 | |
Sr. Sec’d. Notes,
Ser. R207 | | A3 | | 7.250 | | | 01/15/20 | | | ZAR | 6,390 | | | | 771,625 | |
| | | | | | | | | | | | | | | | |
| | | | | | | | | | | | | | | 3,300,945 | |
| | | | | |
Thailand 4.3% | | | | | | | | | | | | | | | | |
Thailand Government Bond,
Sr. Unsec’d. Notes | | Baa1 | | 3.625 | | | 06/16/23 | | | THB | 4,177 | | | | 136,346 | |
Sr. Unsec’d. Notes | | Baa1 | | 3.850 | | | 12/12/25 | | | THB | 4,000 | | | | 132,588 | |
Sr. Unsec’d. Notes | | Baa1 | | 3.875 | | | 06/13/19 | | | THB | 15,000 | | | | 509,434 | |
Sr. Unsec’d. Notes | | Baa1 | | 4.125 | | | 11/18/16 | | | THB | 6,500 | | | | 220,492 | |
Sr. Unsec’d. Notes | | Baa1 | | 5.250 | | | 05/12/14 | | | THB | 2,000 | | | | 68,108 | |
Sr. Unsec’d. Notes | | Baa1 | | 5.670 | | | 03/13/28 | | | THB | 5,000 | | | | 200,713 | |
| | | | | | | | | | | | | | | | |
| | | | | | | | | | | | | | | 1,267,681 | |
| | | | | |
Turkey 4.2% | | | | | | | | | | | | | | | | |
Turkey Government Bond,
Bonds | | NR | | 8.000 | | | 10/09/13 | | | TRY | 380 | | | | 210,156 | |
Bonds | | NR | | 10.500 | | | 01/15/20 | | | TRY | 1,500 | | | | 896,149 | |
Bonds | | NR | | 11.000 | | | 08/06/14 | | | TRY | 225 | | | | 131,814 | |
| | | | | | | | | | | | | | | | |
| | | | | | | | | | | | | | | 1,238,119 | |
| | | | | |
Ukraine 1.6% | | | | | | | | | | | | | | | | |
NAK Naftogaz Ukraine, Gtd. Notes | | NR | | 9.500 | | | 09/30/14 | | | $ | 230 | | | | 227,700 | |
Ukraine Government International Bond,
Sr. Unsec’d. Notes, 144A | | B2 | | 6.250 | | | 06/17/16 | | | | 275 | | | | 260,562 | |
| | | | | | | | | | | | | | | | |
| | | | | | | | | | | | | | | 488,262 | |
See Notes to Financial Statements.
| | |
| 14 | | Visit our website at www.prudentialfunds.com |
| | | | | | | | | | | | | | | | |
| Description | | Moody’s
Ratings†
(Unaudited) | | Interest
Rate | | Maturity
Date | | | Principal
Amount (000)# | | | Value (Note 1) | |
| | | | | | | | | | | | | | | | |
LONG-TERM INVESTMENTS (Continued) | | | | | | | | | | | | |
| | |
United Arab Emirates 0.9% | | | | | | | | | |
Emirate of Dubai Government International Bonds,
Sr. Notes, Ser. E, MTN | | NR | | 6.700% | | | 10/05/15 | | | $ | 250 | | | $ | 260,000 | |
| | | | | |
Venezuela 3.3% | | | | | | | | | | | | | | | | |
Petroleos de Venezuela SA,
Gtd. Notes, Regs | | B+(b) | | 8.500 | | | 11/02/17 | | | | 140 | | | | 101,500 | |
Sr. Unsec’d. Notes | | NR | | 8.000 | | | 11/17/13 | | | | 40 | | | | 36,800 | |
Sr. Unsec’d. Notes, Ser. 2014 | | NR | | 4.900 | | | 10/28/14 | | | | 1,100 | | | | 836,000 | |
| | | | | | | | | | | | | | | | |
| | | | | | | | | | | | | | | 974,300 | |
| | | | | | | | | | | | | | | | |
Total long-term investments
(cost $28,001,695) | | | | | | | | | | | | | | | 26,818,816 | |
| | | | | | | | | | | | | | | | |
| | | |
| | | | | | Shares | | | | |
SHORT-TERM INVESTMENT 4.4% | | | | | | | | | | | | |
| | |
Affiliated Money Market Mutual Fund | | | | | | | | | |
Prudential Investment Portfolios 2 - Prudential Core Taxable Money Market Fund
(cost $1,298,612)(c) | | | | | | | | | | | 1,298,612 | | | | 1,298,612 | |
| | | | | | | | | | | | | | | | |
Total Investments 95.2%
(cost $29,300,307; Note 5) | | | | | | | | | | | | | | | 28,117,428 | |
Other assets in excess of liabilities(d) 4.8% | | | | | | | | | | | | | | | 1,433,059 | |
| | | | | | | | | | | | | | | | |
Net Assets 100.0% | | | | | | | | | | | | | | $ | 29,550,487 | |
| | | | | | | | | | | | | | | | |
The following abbreviations are used in the portfolio descriptions:
144A—Security was purchased pursuant to Rule 144A under the Securities Act of 1933 and may not be resold subject to that rule except to qualified institutional buyers. Unless otherwise noted, 144A securities are deemed to be liquid.
RegS—Regulation S. Security was purchased pursuant to Regulation S and may not be offered, sold or delivered within the United States or to, or for the account or benefit of, U.S. persons, except pursuant to an exemption from, or in a transaction not subject to, the registration requirements of the Securities Act of 1933.
See Notes to Financial Statements.
| | | | |
| Prudential Emerging Markets Debt Local Currency Fund | | | 15 | |
Portfolio of Investments
as of October 31, 2011 continued
BRL—Brazilian Real
CLP—Chilean Peso
COP—Colombian Peso
EUR—Euro
HUF—Hungarian Forint
IDR—Indonesian Rupiah
INR—Indian Rupee
KRW—South Korean Won
MTN—Medium Term Note
MXN—Mexican Peso
MYR—Malaysian Ringgit
NR—Not Rated by Moody’s or Standard & Poor’s
PEN—Peruvian Nuevo Sol
PHP—Philippine Peso
PLN—Polish Zloty
RUB—Russian Rouble
SGD—Singapore Dollar
THB—Thailand Baht
TRY—Turkish Lira
ZAR—South African Rand
| † | The ratings reflected are as of October 31, 2011. Ratings of certain bonds may have changed subsequent to that date. |
| # | Principal amount shown in U.S. dollars unless otherwise stated. |
| (a) | Variable rate instrument. The interest rate shown reflects the rate in effect at October 31, 2011. |
| (b) | Standard & Poor’s Rating. |
| (c) | Prudential Investments LLC, the manager of the Series, also serves as manager of the Prudential Investment Portfolios 2 - Prudential Core Taxable Money Market Fund. |
| (d) | Includes net unrealized appreciation (depreciation) on the following derivative contracts held at reporting period end: |
Forward foreign currency exchange contracts outstanding at October 31, 2011:
| | | | | | | | | | | | | | | | | | |
Purchase Contracts | | Counterparty | | Notional
Amount | | | Value at
Settlement
Date
Payable | | | Value at
October 31,
2011 | | | Unrealized
Appreciation/
(Depreciation) | |
Brazilian Real | | | | | | | | | | | | | | | | | | |
expiring 01/19/12 | | Citibank NA | | BRL | 62,685 | | | $ | 35,000 | | | $ | 35,847 | | | $ | 847 | |
expiring 01/19/12 | | Citibank NA | | BRL | 62,668 | | | | 35,000 | | | | 35,837 | | | | 837 | |
expiring 01/19/12 | | Citibank NA | | BRL | 59,990 | | | | 35,000 | | | | 34,306 | | | | (694 | ) |
expiring 01/19/12 | | Morgan Stanley & Co., Inc. | | BRL | 132,247 | | | | 73,700 | | | | 75,627 | | | | 1,927 | |
See Notes to Financial Statements.
| | |
| 16 | | Visit our website at www.prudentialfunds.com |
| | | | | | | | | | | | | | | | | | |
Purchase Contracts | | Counterparty | | Notional
Amount | | | Value at
Settlement
Date
Payable | | | Value at
October 31,
2011 | | | Unrealized
Appreciation/
(Depreciation) | |
Chilean Peso | | | | | | | | | | | | | | | | | | |
expiring 11/17/11 | | Citibank NA | | CLP | 37,301,880 | | | $ | 73,400 | | | $ | 75,985 | | | $ | 2,585 | |
expiring 12/02/11 | | Citibank NA | | CLP | 203,948,425 | | | | 438,552 | | | | 414,722 | | | | (23,830 | ) |
expiring 12/02/11 | | Citibank NA | | CLP | 51,739,800 | | | | 97,000 | | | | 105,211 | | | | 8,211 | |
expiring 12/02/11 | | Citibank NA | | CLP | 51,585,885 | | | | 98,100 | | | | 104,898 | | | | 6,798 | |
expiring 12/02/11 | | Citibank NA | | CLP | 17,209,500 | | | | 35,000 | | | | 34,995 | | | | (5 | ) |
expiring 12/02/11 | | Citibank NA | | CLP | 17,185,000 | | | | 35,000 | | | | 34,945 | | | | (55 | ) |
expiring 12/02/11 | | Citibank NA | | CLP | 11,911,900 | | | | 22,100 | | | | 24,222 | | | | 2,122 | |
expiring 12/02/11 | | Goldman Sachs Group LP | | CLP | 27,871,250 | | | | 55,000 | | | | 56,675 | | | | 1,675 | |
Colombian Peso | | | | | | | | | | | | | | | | | | |
expiring 11/01/11 | | Morgan Stanley & Co., Inc. | | COP | 226,365,100 | | | | 127,100 | | | | 121,310 | | | | (5,790 | ) |
expiring 11/01/11 | | UBS AG | | COP | 123,822,050 | | | | 69,700 | | | | 66,357 | | | | (3,343 | ) |
expiring 12/06/11 | | Citibank NA | | COP | 229,116,000 | | | | 125,200 | | | | 122,732 | | | | (2,468 | ) |
expiring 12/06/11 | | Citibank NA | | COP | 222,410,000 | | | | 115,000 | | | | 119,140 | | | | 4,140 | |
expiring 12/06/11 | | Citibank NA | | COP | 219,587,085 | | | | 112,100 | | | | 117,628 | | | | 5,528 | |
expiring 12/06/11 | | Citibank NA | | COP | 163,718,000 | | | | 87,200 | | | | 87,700 | | | | 500 | |
expiring 12/06/11 | | Citibank NA | | COP | 90,728,300 | | | | 50,500 | | | | 48,601 | | | | (1,899 | ) |
expiring 12/06/11 | | Morgan Stanley & Co., Inc. | | COP | 114,871,000 | | | | 62,600 | | | | 61,534 | | | | (1,066 | ) |
expiring 12/06/11 | | UBS AG | | COP | 350,187,150 | | | | 186,816 | | | | 187,587 | | | | 771 | |
Euro | | | | | | | | | | | | | | | | | | |
expiring 11/21/11 | | Citibank NA | | EUR | 90,000 | | | | 127,399 | | | | 124,508 | | | | (2,891 | ) |
Hungarian Forint | | | | | | | | | | | | | | | | | | |
expiring 11/21/11 | | Citibank NA | | HUF | 44,002,545 | | | | 205,040 | | | | 199,096 | | | | (5,944 | ) |
expiring 11/21/11 | | Citibank NA | | HUF | 31,735,889 | | | | 147,396 | | | | 143,594 | | | | (3,802 | ) |
expiring 11/21/11 | | UBS AG | | HUF | 76,679,230 | | | | 346,026 | | | | 346,946 | | | | 920 | |
Indian Rupee | | | | | | | | | | | | | | | | | | |
expiring 12/23/11 | | Citibank NA | | INR | 14,265,664 | | | | 310,596 | | | | 290,230 | | | | (20,366 | ) |
expiring 12/23/11 | | Citibank NA | | INR | 6,134,375 | | | | 125,000 | | | | 124,802 | | | | (198 | ) |
expiring 12/23/11 | | Citibank NA | | INR | 4,245,750 | | | | 85,000 | | | | 86,378 | | | | 1,378 | |
expiring 12/23/11 | | Citibank NA | | INR | 3,427,900 | | | | 70,000 | | | | 69,739 | | | | (261 | ) |
expiring 12/23/11 | | Citibank NA | | INR | 2,963,853 | | | | 65,900 | | | | 60,299 | | | | (5,601 | ) |
expiring 12/23/11 | | Citibank NA | | INR | 1,368,000 | | | | 30,000 | | | | 27,831 | | | | (2,169 | ) |
expiring 12/23/11 | | Goldman Sachs Group LP | | INR | 2,465,100 | | | | 55,000 | | | | 50,152 | | | | (4,848 | ) |
expiring 12/23/11 | | Morgan Stanley & Co., Inc. | | INR | 3,159,100 | | | | 70,000 | | | | 64,271 | | | | (5,729 | ) |
See Notes to Financial Statements.
| | | | |
| Prudential Emerging Markets Debt Local Currency Fund | | | 17 | |
Portfolio of Investments
as of October 31, 2011 continued
| | | | | | | | | | | | | | | | | | |
Purchase Contracts | | Counterparty | | Notional
Amount | | | Value at
Settlement
Date
Payable | | | Value at
October 31,
2011 | | | Unrealized
Appreciation/
(Depreciation) | |
Indonesian Rupiah | | | | | | | | | | | | | | | | | | |
expiring 01/19/12 | | Citibank NA | | IDR | 2,369,317,045 | | | $ | 262,674 | | | $ | 265,330 | | | $ | 2,656 | |
expiring 01/20/12 | | Citibank NA | | IDR | 5,124,141,000 | | | | 575,100 | | | | 573,776 | | | | (1,324 | ) |
Malaysian Ringgit | | | | | | | | | | | | | | | | | | |
expiring 11/14/11 | | Citibank NA | | MYR | 922,588 | | | | 287,500 | | | | 300,466 | | | | 12,966 | |
expiring 11/14/11 | | Morgan Stanley & Co., Inc. | | MYR | 203,339 | | | | 65,657 | | | | 66,223 | | | | 566 | |
expiring 12/23/11 | | Citibank NA | | MYR | 5,923,275 | | | | 1,840,555 | | | | 1,925,279 | | | | 84,724 | |
Mexican Peso | | | | | | | | | | | | | | | | | | |
expiring 11/17/11 | | Citibank NA | | MXN | 6,720,500 | | | | 498,587 | | | | 503,433 | | | | 4,846 | |
expiring 11/17/11 | | Citibank NA | | MXN | 1,078,776 | | | | 80,000 | | | | 80,811 | | | | 811 | |
expiring 11/17/11 | | Citibank NA | | MXN | 936,355 | | | | 68,774 | | | | 70,142 | | | | 1,368 | |
expiring 11/17/11 | | Citibank NA | | MXN | 924,850 | | | | 70,000 | | | | 69,281 | | | | (719 | ) |
expiring 11/17/11 | | Citibank NA | | MXN | 675,283 | | | | 50,000 | | | | 50,585 | | | | 585 | |
Peruvian Nuevo Sol | | | | | | | | | | | | | | | | | | |
expiring 01/13/12 | | Citibank NA | | PEN | 154,344 | | | | 55,400 | | | | 56,667 | | | | 1,267 | |
Philippine Peso | | | | | | | | | | | | | | | | | | |
expiring 11/22/11 | | Citibank NA | | PHP | 5,355,872 | | | | 121,600 | | | | 125,450 | | | | 3,850 | |
expiring 11/22/11 | | Citibank NA | | PHP | 5,034,263 | | | | 119,338 | | | | 117,917 | | | | (1,421 | ) |
expiring 11/22/11 | | Citibank NA | | PHP | 1,395,933 | | | | 31,929 | | | | 32,697 | | | | 768 | |
Polish Zloty | | | | | | | | | | | | | | | | | | |
expiring 11/21/11 | | Citibank NA | | PLN | 730,750 | | | | 229,152 | | | | 229,178 | | | | 26 | |
expiring 11/21/11 | | Citibank NA | | PLN | 293,456 | | | | 90,658 | | | | 92,034 | | | | 1,376 | |
expiring 11/21/11 | | Citibank NA | | PLN | 218,618 | | | | 69,361 | | | | 68,563 | | | | (798 | ) |
expiring 11/21/11 | | Citibank NA | | PLN | 199,500 | | | | 63,078 | | | | 62,567 | | | | (511 | ) |
expiring 11/21/11 | | Citibank NA | | PLN | 166,471 | | | | 55,000 | | | | 52,209 | | | | (2,791 | ) |
expiring 04/16/12 | | Morgan Stanley & Co., Inc. | | PLN | 1,508,455 | | | | 533,400 | | | | 466,837 | | | | (66,563 | ) |
Russian Rouble | | | | | | | | | | | | | | | | | | |
expiring 11/08/11 | | Morgan Stanley & Co., Inc. | | RUB | 8,666,050 | | | | 311,695 | | | | 285,280 | | | | (26,415 | ) |
expiring 12/21/11 | | Citibank NA | | RUB | 11,036,436 | | | | 342,417 | | | | 360,499 | | | | 18,082 | |
expiring 02/06/12 | | Morgan Stanley & Co., Inc. | | RUB | 6,218,736 | | | | 187,100 | | | | 201,801 | | | | 14,701 | |
expiring 02/06/12 | | Morgan Stanley & Co., Inc. | | RUB | 3,913,200 | | | | 120,000 | | | | 126,985 | | | | 6,985 | |
expiring 02/06/12 | | Morgan Stanley & Co., Inc. | | RUB | 3,795,600 | | | | 120,000 | | | | 123,169 | | | | 3,169 | |
See Notes to Financial Statements.
| | |
| 18 | | Visit our website at www.prudentialfunds.com |
| | | | | | | | | | | | | | | | | | |
Purchase Contracts | | Counterparty | | Notional
Amount | | | Value at
Settlement
Date
Payable | | | Value at
October 31,
2011 | | | Unrealized
Appreciation/
(Depreciation) | |
Singapore Dollar | | | | | | | | | | | | | | | | | | |
expiring 11/18/11 | | Morgan Stanley & Co., Inc. | | SGD | 150,240 | | | $ | 120,000 | | | $ | 119,732 | | | $ | (268 | ) |
expiring 11/18/11 | | UBS AG | | SGD | 218,182 | | | | 172,394 | | | | 173,877 | | | | 1,483 | |
South African Rand | | | | | | | | | | | | | | | | | | |
expiring 11/28/11 | | Citibank NA | | ZAR | 7,171,477 | | | | 926,326 | | | | 899,954 | | | | (26,372 | ) |
expiring 11/28/11 | | Citibank NA | | ZAR | 2,237,031 | | | | 288,938 | | | | 280,727 | | | | (8,211 | ) |
expiring 11/29/11 | | Barclays Capital, Inc. | | ZAR | 594,113 | | | | 75,000 | | | | 74,544 | | | | (456 | ) |
expiring 11/29/11 | | Citibank NA | | ZAR | 955,632 | | | | 120,000 | | | | 119,905 | | | | (95 | ) |
expiring 11/29/11 | | Citibank NA | | ZAR | 505,639 | | | | 65,000 | | | | 63,444 | | | | (1,556 | ) |
South Korean Won | | | | | | | | | | | | | | | | | | |
expiring 11/30/11 | | Citibank NA | | KRW | 151,557,188 | | | | 139,942 | | | | 136,452 | | | | (3,490 | ) |
Thai Baht | | | | | | | | | | | | | | | | | | |
expiring 11/30/11 | | Citibank NA | | THB | 40,486,463 | | | | 1,342,389 | | | | 1,313,216 | | | | (29,173 | ) |
expiring 11/30/11 | | Citibank NA | | THB | 6,681,920 | | | | 212,800 | | | | 216,734 | | | | 3,934 | |
expiring 11/30/11 | | Citibank NA | | THB | 2,703,801 | | | | 87,800 | | | | 87,700 | | | | (100 | ) |
expiring 11/30/11 | | Morgan Stanley & Co., Inc. | | THB | 4,375,000 | | | | 139,661 | | | | 141,907 | | | | 2,246 | |
Turkish Lira | | | | | | | | | | | | | | | | | | |
expiring 11/28/11 | | Citibank NA | | TRY | 411,282 | | | | 233,882 | | | | 231,119 | | | | (2,763 | ) |
expiring 11/28/11 | | Citibank NA | | TRY | 61,727 | | | | 35,000 | | | | 34,688 | | | | (312 | ) |
expiring 11/28/11 | | UBS | | TRY | 2,802,741 | | | | 1,560,317 | | | | 1,574,998 | | | | 14,681 | |
| | | | | | | | | | | | | | | | | | |
| | | | | | | | $ | 15,374,849 | | | $ | 15,329,881 | | | $ | (44,968 | ) |
| | | | | | | | | | | | | | | | | | |
| | | | | | | | | | | | | | | | | | |
Sales Contracts | | Counterparty | | Notional
Amount | | | Value at
Settlement
Date
Receivable | | | Value at
October 31,
2011 | | | Unrealized
Appreciation/
(Depreciation) | |
Brazilian Real | | | | | | | | | | | | | | | | | | |
expiring 01/19/12 | | Citibank NA | | BRL | 1,476,873 | | | $ | 809,245 | | | $ | 844,563 | | | $ | (35,318 | ) |
expiring 01/19/12 | | Citibank NA | | BRL | 343,900 | | | | 200,000 | | | | 196,662 | | | | 3,338 | |
expiring 01/19/12 | | Citibank NA | | BRL | 188,133 | | | | 104,200 | | | | 107,586 | | | | (3,386 | ) |
expiring 01/19/12 | | Citibank NA | | BRL | 90,525 | | | | 50,000 | | | | 51,768 | | | | (1,768 | ) |
expiring 01/19/12 | | Citibank NA | | BRL | 76,998 | | | | 45,400 | | | | 44,032 | | | | 1,368 | |
Chilean Peso | | | | | | | | | | | | | | | | | | |
expiring 12/02/11 | | Citibank NA | | CLP | 68,131,570 | | | | 131,300 | | | | 138,543 | | | | (7,243 | ) |
expiring 12/02/11 | | Citibank NA | | CLP | 57,103,360 | | | | 121,600 | | | | 116,118 | | | | 5,482 | |
expiring 12/02/11 | | Citibank NA | | CLP | 37,387,360 | | | | 72,400 | | | | 76,026 | | | | (3,626 | ) |
See Notes to Financial Statements.
| | | | |
| Prudential Emerging Markets Debt Local Currency Fund | | | 19 | |
Portfolio of Investments
as of October 31, 2011 continued
| | | | | | | | | | | | | | | | | | |
Sales Contracts | | Counterparty | | Notional
Amount | | | Value at
Settlement
Date
Receivable | | | Value at
October 31,
2011 | | | Unrealized
Appreciation/
(Depreciation) | |
expiring 12/02/11 | | Citibank NA | | CLP | 31,562,040 | | | $ | 65,400 | | | $ | 64,180 | | | $ | 1,220 | |
expiring 12/02/11 | | Citibank NA | | CLP | 27,871,280 | | | | 54,800 | | | | 56,675 | | | | (1,875 | ) |
expiring 12/02/11 | | Citibank NA | | CLP | 5,170,000 | | | | 10,000 | | | | 10,513 | | | | (513 | ) |
expiring 12/02/11 | | Goldman Sachs Group LP | | CLP | 70,905,000 | | | | 150,000 | | | | 144,183 | | | | 5,817 | |
expiring 12/02/11 | | Morgan Stanley & Co., Inc. | | CLP | 12,956,250 | | | | 25,000 | | | | 26,346 | | | | (1,346 | ) |
Colombian Peso | | | | | | | | | | | | | | | | | | |
expiring 11/01/11 | | UBS AG | | COP | 350,187,150 | | | | 186,866 | | | | 187,667 | | | | (801 | ) |
expiring 12/06/11 | | Citibank NA | | COP | 259,835,650 | | | | 141,100 | | | | 139,188 | | | | 1,912 | |
expiring 12/06/11 | | Citibank NA | | COP | 181,788,750 | | | | 102,318 | | | | 97,380 | | | | 4,938 | |
expiring 12/06/11 | | Citibank NA | | COP | 181,004,550 | | | | 100,600 | | | | 96,960 | | | | 3,640 | |
expiring 12/06/11 | | Citibank NA | | COP | 141,030,160 | | | | 77,900 | | | | 75,546 | | | | 2,354 | |
expiring 12/06/11 | | Citibank NA | | COP | 87,579,600 | | | | 47,200 | | | | 46,914 | | | | 286 | |
Euro | | | | | | | | | | | | | | | | | | |
expiring 11/21/11 | | Citibank NA | | EUR | 106,100 | | | | 147,396 | | | | 146,781 | | | | 615 | |
expiring 11/21/11 | | Citibank NA | | EUR | 50,000 | | | | 69,361 | | | | 69,171 | | | | 190 | |
expiring 11/22/11 | | Citibank NA | | EUR | 240,100 | | | | 332,988 | | | | 332,156 | | | | 832 | |
expiring 11/22/11 | | Citibank NA | | EUR | 40,000 | | | | 55,094 | | | | 55,336 | | | | (242 | ) |
expiring 11/22/11 | | Citibank NA | | EUR | 40,000 | | | | 55,462 | | | | 55,336 | | | | 126 | |
expiring 11/22/11 | | Citibank NA | | EUR | 40,000 | | | | 55,190 | | | | 55,336 | | | | (146 | ) |
expiring 11/22/11 | | Citibank NA | | EUR | 40,000 | | | | 55,349 | | | | 55,336 | | | | 13 | |
expiring 11/22/11 | | Citibank NA | | EUR | 40,000 | | | | 55,348 | | | | 55,336 | | | | 12 | |
expiring 11/22/11 | | Citibank NA | | EUR | 35,000 | | | | 49,319 | | | | 48,419 | | | | 900 | |
Hungarian Forint | | | | | | | | | | | | | | | | | | |
expiring 11/21/11 | | Citibank NA | | HUF | 49,917,575 | | | | 231,438 | | | | 225,859 | | | | 5,579 | |
expiring 11/21/11 | | Citibank NA | | HUF | 27,404,208 | | | | 127,399 | | | | 123,994 | | | | 3,405 | |
Indian Rupee | | | | | | | | | | | | | | | | | | |
expiring 12/23/11 | | Citibank NA | | INR | 6,629,280 | | | | 140,000 | | | | 134,870 | | | | 5,130 | |
expiring 12/23/11 | | Morgan Stanley & Co., Inc. | | INR | 14,004,000 | | | | 300,000 | | | | 284,906 | | | | 15,094 | |
Indonesian Rupiah | | | | | | | | | | | | | | | | | | |
expiring 01/19/12 | | Morgan Stanley & Co., Inc. | | IDR | 3,641,274,000 | | | | 405,600 | | | | 407,772 | | | | (2,172 | ) |
Malaysian Ringgit | | | | | | | | | | | | | | | | | | |
expiring 12/23/11 | | Citibank NA | | MYR | 398,567 | | | | 123,300 | | | | 129,549 | | | | (6,249 | ) |
Mexican Peso | | | | | | | | | | | | | | | | | | |
expiring 11/17/11 | | Citibank NA | | MXN | 809,788 | | | | 60,000 | | | | 60,661 | | | | (661 | ) |
expiring 11/17/11 | | Morgan Stanley & Co., Inc. | | MXN | 1,089,973 | | | | 80,000 | | | | 81,650 | | | | (1,650 | ) |
See Notes to Financial Statements.
| | |
| 20 | | Visit our website at www.prudentialfunds.com |
| | | | | | | | | | | | | | | | | | |
Sales Contracts | | Counterparty | | Notional
Amount | | | Value at
Settlement
Date
Receivable | | | Value at
October 31,
2011 | | | Unrealized
Appreciation/
(Depreciation) | |
Peruvian Nuevo Sol | | | | | | | | | | | | | | | | | | |
expiring 01/13/12 | | Citibank NA | | PEN | 1,860,115 | | | $ | 665,611 | | | $ | 682,936 | | | $ | (17,325 | ) |
Philippine Peso | | | | | | | | | | | | | | | | | | |
expiring 11/22/11 | | Citibank NA | | PHP | 5,141,133 | | | | 121,900 | | | | 120,420 | | | | 1,480 | |
expiring 11/22/11 | | Goldman Sachs Group LP | | PHP | 5,888,700 | | | | 135,000 | | | | 137,930 | | | | (2,930 | ) |
Polish Zloty | | | | | | | | | | | | | | | | | | |
expiring 11/21/11 | | Citibank NA | | PLN | 515,653 | | | | 162,519 | | | | 161,719 | | | | 800 | |
Russian Rouble | | | | | | | | | | | | | | | | | | |
expiring 12/21/11 | | Citibank NA | | RUB | 4,646,908 | | | | 145,800 | | | | 151,789 | | | | (5,989 | ) |
expiring 12/21/11 | | Citibank NA | | RUB | 3,743,561 | | | | 118,700 | | | | 122,281 | | | | (3,581 | ) |
expiring 12/21/11 | | Morgan Stanley & Co., Inc. | | RUB | 5,417,528 | | | | 184,521 | | | | 176,960 | | | | 7,561 | |
Singapore Dollar | | | | | | | | | | | | | | | | | | |
expiring 11/18/11 | | Barclays Capital, Inc. | | SGD | 218,182 | | | | 171,136 | | | | 173,877 | | | | (2,741 | ) |
South African Rand | | | | | | | | | | | | | | | | | | |
expiring 11/28/11 | | UBS AG | | ZAR | 11,580,334 | | | | 1,460,950 | | | | 1,453,225 | | | | 7,725 | |
expiring 11/29/11 | | UBS AG | | ZAR | 566,948 | | | | 70,349 | | | | 71,136 | | | | (787 | ) |
South Korean Won | | | | | | | | | | | | | | | | | | |
expiring 11/30/11 | | Citibank NA | | KRW | 79,914,000 | | | | 70,100 | | | | 71,949 | | | | (1,849 | ) |
expiring 11/30/11 | | Morgan Stanley & Co., Inc. | | KRW | 72,404,340 | | | | 65,400 | | | | 65,188 | | | | 212 | |
Thai Baht | | | | | | | | | | | | | | | | | | |
expiring 11/30/11 | | Citibank NA | | THB | 5,652,304 | | | | 185,200 | | | | 183,338 | | | | 1,862 | |
expiring 11/30/11 | | Citibank NA | | THB | 4,295,993 | | | | 138,500 | | | | 139,345 | | | | (845 | ) |
expiring 11/30/11 | | Citibank NA | | THB | 2,191,371 | | | | 69,800 | | | | 71,079 | | | | (1,279 | ) |
expiring 11/30/11 | | Citibank NA | | THB | 1,315,440 | | | | 42,000 | | | | 42,668 | | | | (668 | ) |
| | | | | | | | | | | | | | | | | | |
| | | | | | | | $ | 8,646,059 | | | $ | 8,669,158 | | | | (23,099 | ) |
| | | | | | | | | | | | | | | | | | |
| | | | | | | | | | | | | | | | $ | (68,067 | ) |
| | | | | | | | | | | | | | | | | | |
Various inputs are used in determining the value of the Series’ investments. These inputs are summarized in the three broad levels listed below.
Level 1—quoted prices generally for securities actively traded on a regulated securities exchange and for open-end mutual funds which trade at daily net asset value.
See Notes to Financial Statements.
| | | | |
| Prudential Emerging Markets Debt Local Currency Fund | | | 21 | |
Portfolio of Investments
as of October 31, 2011 continued
Level 2—other significant observable inputs (including, but not limited to, quoted prices for similar securities, interest rates, prepayment speeds, foreign currency exchange rates, and amortized cost) generally for debt securities, swaps, forward foreign currency contracts and for foreign stocks priced using vendor modeling tools.
Level 3—significant unobservable inputs for securities valued in accordance with Board approved fair valuation procedures.
The following is a summary of the inputs used as of October 31, 2011 in valuing such portfolio securities:
| | | | | | | | | | | | |
| | | Level 1 | | | Level 2 | | | Level 3 | |
Investments in Securities | | | | | | | | | | | | |
Foreign Bonds: | | | | | | | | | | | | |
Argentina | | $ | — | | | $ | 241,200 | | | $ | — | |
Brazil | | | — | | | | 4,344,124 | | | | — | |
Colombia | | | — | | | | 1,206,910 | | | | — | |
Hungary | | | — | | | | 1,327,763 | | | | — | |
Indonesia | | | — | | | | 2,445,701 | | | | — | |
Malaysia | | | — | | | | 1,214,469 | | | | — | |
Mexico | | | — | | | | 1,389,489 | | | | 1,275,437 | |
Peru | | | — | | | | 1,201,528 | | | | — | |
Philippines | | | — | | | | 112,877 | | | | — | |
Poland | | | — | | | | 2,216,429 | | | | — | |
Russia | | | — | | | | 2,313,582 | | | | — | |
South Africa | | | — | | | | 3,300,945 | | | | — | |
Thailand | | | — | | | | 1,267,681 | | | | — | |
Turkey | | | — | | | | 1,238,119 | | | | — | |
Ukraine | | | — | | | | 488,262 | | | | — | |
United Arab Emirates | | | — | | | | 260,000 | | | | — | |
Venezuela | | | — | | | | 974,300 | | | | — | |
Affiliated Money Market Mutual Fund | | | 1,298,612 | | | | — | | | | — | |
Other Financial Instruments* | | | | | | | | | | | | |
Forward Foreign Currency Exchange Contracts | | | — | | | | (68,067 | ) | | | — | |
| | | | | | | | | | | | |
Total | | $ | 1,298,612 | | | $ | 25,475,312 | | | $ | 1,275,437 | |
| | | | | | | | | | | | |
See Notes to Financial Statements.
| | |
| 22 | | Visit our website at www.prudentialfunds.com |
The following is a reconciliation of assets in which significant unobservable inputs (Level 3) were used in determining fair value:
| | | | |
| | | Foreign Bonds | |
Balance as of 03/30/11** | | $ | — | |
Realized gain (loss) | | | — | |
Change in unrealized appreciation (depreciation)*** | | | (110,710 | ) |
Purchases | | | 1,386,147 | |
Sales | | | — | |
Accrued discount/premium | | | — | |
Transfers into Level 3 | | | — | |
Transfers out of Level 3 | | | — | |
| | | | |
Balance as of 10/31/11 | | $ | 1,275,437 | |
| | | | |
| * | Other financial instruments are derivative instruments not reflected in the Portfolio of Investments, such as futures, forwards and swap contracts, which are recorded at the unrealized appreciation/depreciation on the instrument. |
| ** | Commencement of operations. |
| *** | Of which, $(110,710) was included in Net Assets relating to securities held at the reporting period end. |
The industry classification of portfolio holdings and other assets in excess of liabilities shown as a percentage of net assets as of October 31, 2011 was as follows:
| | | | |
Foreign Government Obligations | | | 70.4 | % |
Foreign Agencies | | | 13.8 | |
Foreign Corporations | | | 6.6 | |
Affiliated Money Market Mutual Fund | | | 4.4 | |
| | | | |
| | | 95.2 | |
Other assets in excess of liabilities | | | 4.8 | |
| | | | |
| Net Assets | | | 100.0 | % |
| | | | |
The Series invested in derivative instruments during the reporting period. The primary type of risk associated with these derivative instruments is foreign exchange risk. The effect of such derivative instruments on the Series’ financial position and financial performance as reflected in the Statement of Assets and Liabilities and Statement of Operations is presented in the summary below.
See Notes to Financial Statements.
| | | | |
| Prudential Emerging Markets Debt Local Currency Fund | | | 23 | |
Portfolio of Investments
as of October 31, 2011 continued
Fair values of derivative instruments as of October 31, 2011 as presented in the Statement of Assets and Liabilities:
| | | | | | | | | | | | |
Derivatives not designated
as hedging instruments,
carried at fair value | | Asset Derivatives | | | Liability Derivatives | |
| | Balance
Sheet Location | | Fair
Value | | | Balance
Sheet Location | | Fair
Value | |
| Foreign exchange contracts | | Unrealized appreciation on forward foreign currency contracts | | $ | 301,220 | | | Unrealized depreciation on forward foreign currency contracts | | $ | 369,287 | |
| | | | | | | | | | | | |
The effects of derivative instruments on the Statement of Operations for the period March 30, 2011* through October 31, 2011 are as follows:
| | | | |
Amount of Realized Gain or (Loss) on Derivatives Recognized in Income | |
Derivatives not designated as hedging
instruments, carried at fair value | | Forward
Contracts | |
Foreign exchange contracts | | $ | (32,836 | ) |
| | | | |
|
Change in Unrealized Appreciation or (Depreciation) on Derivatives Recognized in Income | |
Derivatives not designated as hedging
instruments, carried at fair value | | Forward
Contracts | |
Foreign exchange contracts | | $ | (68,067 | ) |
| | | | |
| * | Commencement of operations. |
As of October 31, 2011, the Series’ volume of derivative activities is as follows:
| | | | | | |
Forward
Currency
Contracts - Purchased
(Value at Settlement Date Payable) | | | Forward
Currency
Contracts - Sold
(Value at Settlement Date Receivable) | |
| $ | 11,966,685 | | | $ | 4,926,983 | |
See Notes to Financial Statements.
| | |
| 24 | | Visit our website at www.prudentialfunds.com |
Financial Statements
| | |
| OCTOBER 31, 2011 | | ANNUAL REPORT |
Prudential Emerging Markets Debt Local Currency Fund
Statement of Assets and Liabilities
as of October 31, 2011
| | | | |
Assets | | | | |
Investments at value: | | | | |
Unaffiliated investments (cost $28,001,695) | | $ | 26,818,816 | |
Affiliated investments (cost $1,298,612) | | | 1,298,612 | |
Foreign currency, at value (cost $118,533) | | | 124,682 | |
Receivable for Series shares sold | | | 657,860 | |
Dividends and interest receivable | | | 544,423 | |
Receivable for investments sold | | | 510,435 | |
Unrealized appreciation on forward foreign currency contracts | | | 301,220 | |
Foreign tax reclaim receivable | | | 15,681 | |
Prepaid expenses | | | 1,114 | |
| | | | |
Total assets | | | 30,272,843 | |
| | | | |
| |
Liabilities | | | | |
Unrealized depreciation on forward foreign currency contracts | | | 369,287 | |
Accrued expenses | | | 114,139 | |
Dividends payable | | | 118,630 | |
Payable to custodian | | | 69,191 | |
Capital gains tax liability | | | 47,046 | |
Management fee payable | | | 2,035 | |
Distribution fee payable | | | 1,039 | |
Payable for Series shares reacquired | | | 665 | |
Affiliated transfer agent fee payable | | | 324 | |
| | | | |
Total liabilities | | | 722,356 | |
| | | | |
| |
Net Assets | | $ | 29,550,487 | |
| | | | |
| | | | | |
Net assets were comprised of: | | | | |
Common stock, at par | | $ | 31,527 | |
Paid-in capital in excess of par | | | 30,885,322 | |
| | | | |
| | | 30,916,849 | |
Distributions in excess of net investment income | | | (36,278 | ) |
Accumulated net realized loss on investment and foreign currency transactions | | | (17,758 | ) |
Net unrealized depreciation on investments and foreign currencies (net of capital gains tax) | | | (1,312,326 | ) |
| | | | |
Net assets, October 31, 2011 | | $ | 29,550,487 | |
| | | | |
See Notes to Financial Statements.
| | |
| 26 | | Visit our website at www.prudentialfunds.com |
| | | | |
Class A | | | | |
Net asset value and redemption price per share
($2,620,029 ÷ 279,775 shares of common stock issued and outstanding)
Maximum sales charge (4.50% of offering price) | | $
| 9.36
0.44 |
|
| | | | |
Maximum offering price to public | | $ | 9.80 | |
| | | | |
| |
Class C | | | | |
Net asset value, offering price and redemption price per share
($397,552 ÷ 42,230 shares of common stock issued and outstanding) | | $ | 9.41 | |
| | | | |
| |
Class Q | | | | |
Net asset value, offering price and redemption price per share
($969 ÷ 103.4 shares of common stock issued and outstanding) | | $ | 9.37 | |
| | | | |
| |
Class Z | | | | |
Net asset value, offering price and redemption price per share
($26,531,937 ÷ 2,830,599 shares of common stock issued and outstanding) | | $ | 9.37 | |
| | | | |
See Notes to Financial Statements.
| | | | |
| Prudential Emerging Markets Debt Local Currency Fund | | | 27 | |
Statement of Operations
For the Period March 30, 2011* through October 31, 2011
| | | | |
Net Investment Income | | | | |
Income | | | | |
Unaffiliated interest income (net of foreign withholding taxes of $51,868) | | $ | 982,766 | |
Affiliated dividend income | | | 3,062 | |
| | | | |
Total income | | | 985,828 | |
| | | | |
| |
Expenses | | | | |
Management fee | | | 130,390 | |
Distribution fee—Class A | | | 2,417 | |
Distribution fee—Class C | | | 1,248 | |
Custodian’s fees and expenses | | | 88,000 | |
Registration fees | | | 68,000 | |
Audit fee | | | 60,000 | |
Reports to shareholders | | | 40,000 | |
Legal fees and expenses | | | 35,000 | |
Directors’ fees | | | 6,000 | |
Transfer agent’s fees and expenses (including affiliated expense of $658) (Note 3) | | | 2,000 | |
Miscellaneous | | | 8,841 | |
| | | | |
Total expenses | | | 441,896 | |
Expense reimbursement (Note 2) | | | (266,398 | ) |
| | | | |
Net expenses | | | 175,498 | |
| | | | |
Net investment income | | | 810,330 | |
| | | | |
| |
Realized And Unrealized Loss On Investment And Foreign Currency Transactions | | | | |
Net realized loss on: | | | | |
Investment transactions | | | (244,692 | ) |
Foreign currency transactions | | | (293,169 | ) |
| | | | |
| | | (537,861 | ) |
| | | | |
Net change in unrealized depreciation on: | | | | |
Investments (net of capital gains tax) | | | (1,229,925 | ) |
Foreign currencies | | | (82,401 | ) |
| | | | |
| | | (1,312,326 | ) |
| | | | |
Net loss on investment and foreign currency transactions | | | (1,850,187 | ) |
| | | | |
Net Decrease In Net Assets Resulting From Operations | | $ | (1,039,857 | ) |
| | | | |
| * | Commencement of operations. |
See Notes to Financial Statements.
| | |
| 28 | | Visit our website at www.prudentialfunds.com |
Statement of Changes in Net Assets
| | | | |
| | | March 30, 2011*
through
October 31, 2011 | |
Increase (Decrease) In Net Assets | | | | |
Operations | | | | |
Net investment income | | $ | 810,330 | |
Net realized loss on investment and foreign currency transactions | | | (537,861 | ) |
Net change in unrealized depreciation on investments and foreign currencies | | | (1,312,326 | ) |
| | | | |
Net decrease in net assets resulting from operations | | | (1,039,857 | ) |
| | | | |
| |
Dividends and Distributions (Note 1) | | | | |
Dividends from net investment income | | | | |
Class A | | | 19,533 | |
Class C | | | 2,172 | |
Class Q | | | 12 | |
Class Z | | | 314,913 | |
| | | | |
| | | 336,630 | |
| | | | |
Tax return of capital | | | | |
Class A | | | 33,363 | |
Class C | | | 3,710 | |
Class Q | | | 21 | |
Class Z | | | 537,863 | |
| | | | |
| | | 574,957 | |
| | | | |
| |
Series share transactions (Note 6) | | | | |
Net proceeds from shares sold | | | 32,459,449 | |
Net asset value of shares issued in reinvestment of dividends and tax return of capital | | | 894,161 | |
Cost of shares reacquired | | | (1,851,679 | ) |
| | | | |
Net increase in net assets from Series share transactions | | | 31,501,931 | |
| | | | |
Total increase | | | 29,550,487 | |
| |
Net Assets: | | | | |
Beginning of period | | | — | |
| | | | |
End of period | | $ | 29,550,487 | |
| | | | |
| * | Commencement of operations. |
See Notes to Financial Statements.
| | | | |
| Prudential Emerging Markets Debt Local Currency Fund | | | 29 | |
Notes to Financial Statements
Prudential World Fund, Inc. (the “Fund”) is an open-end management investment company, registered under the Investment Company Act of 1940, as amended, (“1940 Act”) and currently consists of three series: Prudential International Equity Fund, Prudential International Value Fund and Prudential Emerging Markets Debt Local Currency Fund (the “Series”). These financial statements relate to the Prudential Emerging Markets Debt Local Currency Fund. The financial statements of the other series are not presented herein. The Series commenced investment operations on March 30, 2011. The investment objective of the Series is to seek total return, through a combination of current income and capital appreciation. The Series is non-diversified.
Note 1. Accounting Policies
The following is a summary of significant accounting policies followed by the Fund and the Series in the preparation of its financial statements.
Security Valuation: In valuing the Series’ assets, quotations of foreign securities in a foreign currency are converted to U.S. dollar equivalents at the then current currency value. Securities listed on a securities exchange (other than options on securities and indices) are valued at the last sale price on such exchange or market on the day of valuation or, if there was no sale on such a day, at the mean between the last reported bid and asked prices, or at the last bid price on such day in the absence of an asked price. Securities that are actively traded via NASDAQ are valued at the NASDAQ official closing price (“NOCP”) on the day of valuation, or if there was no NOCP, at the last sales price. Securities that are actively traded in the over-the-counter market, including listed securities for which the primary market is believed by Prudential Investments LLC (“PI” or “Manager”), in consultation with the subadvisor, to be over-the-counter, are valued at market value using prices provided by an independent pricing agent or principal market maker. Prices may be obtained from independent pricing services which use information provided by market makers or estimates of market values obtained from yield data relating to investments or securities with similar characteristics. Securities for which reliable market quotations are not readily available, or whose values have been affected by events occurring after the close of the security’s foreign market and before the Series’ normal pricing time, are valued at fair value in accordance with Board of Directors’ approved fair valuation procedures. When determining the fair valuation of securities, some of the factors influencing the valuation include, the nature of any restrictions on disposition of the securities; assessment of the general liquidity of the securities; the issuer’s
| | |
| 30 | | Visit our website at www.prudentialfunds.com |
financial condition and the markets in which it does business; the cost of the investment; the size of the holding and the capitalization of issuer; the prices of any recent transactions or bids/offers for such securities or any comparable securities; any available analyst media or other reports or information deemed reliable by the investment advisor regarding the issuer or the markets or industry in which it operates. Using fair value to price securities may result in a value that is different from a security’s most recent closing price and from the price used by other mutual funds to calculate their net asset values.
Investments in open-end, non-exchange-traded mutual funds are valued at their net asset value as of the close of the New York Stock Exchange on the date of the valuation.
Short-term debt securities of sufficient credit quality which mature in sixty days or less, are valued at amortized cost, which approximates fair value. The amortized cost method involves valuing a security at its cost on the date of purchase and thereafter assuming a constant amortization to maturity of the difference between the principal amount due at maturity and cost. Short-term debt securities, which mature in more than sixty days, are valued at fair value.
Foreign Currency Translation: The books and records of the Series are maintained in U.S. dollars. Foreign currency amounts are translated into U.S. dollars on the following basis:
(i) market value of investment securities, other assets and liabilities-at the current rates of exchange.
(ii) purchases and sales of investment securities, income and expenses-at the rate of exchange prevailing on the respective dates of such transactions.
The Series does not isolate that portion of the results of operations arising as a result of changes in the foreign exchange rates from the fluctuations arising from changes in the market prices of long term securities held at the end of the period. Similarly, the Series does not isolate the effect of changes in foreign exchange rates from the fluctuations arising from changes in the market prices of portfolio securities sold during the period. Accordingly, realized foreign currency gains or losses are included in the reported net realized gains or losses on investment transactions. Net realized gains or losses on foreign currency transactions represent net foreign exchange gains or losses from holdings of foreign currencies, currency gains or losses realized between the trade and settlement dates on security transactions, and the difference between the amounts of dividends, interest and foreign withholding taxes recorded on the Series’ books and the U.S. dollar equivalent amounts actually received or paid.
| | | | |
| Prudential Emerging Markets Debt Local Currency Fund | | | 31 | |
Notes to Financial Statements
continued
Net unrealized currency gains or losses from valuing foreign currency denominated assets and liabilities (other than investments) at period end exchange rates are reflected as a component of net unrealized appreciation (depreciation) on foreign currencies.
Forward Currency Contracts: A forward currency contract is a commitment to purchase or sell a foreign currency at a future date at a negotiated forward rate between two parties. The Series entered into forward currency contracts in order to hedge its exposure to changes in foreign currency exchange rates on its foreign portfolio holdings or specific receivables and payables denominated in a foreign currency. The contracts are valued daily at current exchange rates and any unrealized gain or loss is included in net unrealized appreciation or depreciation on foreign currencies. Gain or loss is realized on the settlement date of the contract equal to the difference between the settlement value of the original and negotiated forward contracts. This gain or loss, if any, is included in net realized gain (loss) on foreign currency transactions. Risks may arise upon entering into these contracts from the potential inability of the counterparties to meet the terms of their contracts. Forward currency contracts involve risks from currency exchange rate and credit risk in excess of the amounts reflected on the Statement of Assets and Liabilities. The Series’ maximum risk of loss from counterparty credit risk is the net value of the cash flows to be received from the counterparty at the end of the contract’s life. A master netting arrangement between the Series and the counterparty which may permit the Series to offset amounts payable by the Series to the same counterparty against amounts to be received; and by the receipt of collateral from the counterparty by the Series to cover the Series’ exposure to the counterparty. However, there is no assurance that such mitigating factors are easily enforceable.
Concentration of Risk: The ability of issuers of debt securities (other than those issued or guaranteed by the U.S. Government) held by the Series to meet their obligations may be affected by the economic or political developments in a specific industry, region or country. Foreign security and currency transactions may involve certain considerations and risks not typically associated with those of domestic origin as a result of, among other factors, the possibility of political or economic instability, or the level of governmental supervision and regulation of foreign securities markets.
Securities Transactions and Net Investment Income: Securities transactions are recorded on the trade date. Realized gains or losses on sales of securities are
| | |
| 32 | | Visit our website at www.prudentialfunds.com |
calculated on the identified cost basis. Dividend income is recorded on the ex-dividend date and interest income is recorded on the accrual basis. The Series amortizes premiums and accretes discounts on debt securities as adjustments to interest income. Expenses are recorded on the accrual basis. Net investment income or loss (other than distribution fees which are charged directly to the respective class) and unrealized and realized gains or losses are allocated daily to each class of shares based upon the relative proportion of net assets of each class at the beginning of the day.
Dividends and Distributions: The Series declares dividends of net investment income daily and payment is made monthly. Distributions of net realized capital and currency gains, if any, are made annually. Dividends and distributions are recorded on the ex-dividend date. Dividends and distributions are determined in accordance with federal income tax regulations which may differ from generally accepted accounting principles. Permanent book/tax differences relating to income and gains are reclassified amongst distribution in excess of net investment income, accumulated net realized gain or loss and paid-in-capital in excess of par, as appropriate.
Taxes: For federal income tax purposes, each series in the Fund is treated as a separate taxpaying entity. It is each series’ policy to continue to meet the requirements of the Internal Revenue Code applicable to regulated investment companies and to distribute all of its taxable net investment income and capital gains, if any, to its shareholders. Therefore, no federal income tax provision is required.
Withholding taxes on foreign interest are recorded, net of reclaimable amounts, at the time the related income is earned.
Estimates: The preparation of the financial statements requires management to make estimates and assumptions that affect the reported amounts and disclosures in the financial statements. Actual results could differ from those estimates.
Note 2. Agreements
The Fund has a management agreement with PI. Pursuant to this agreement, PI has responsibility for all investment advisory services and supervises the subadvisor’s performance of such services. PI has entered into a subadvisory agreement with Prudential Investment Management, Inc. (“PIM”). The subadvisory agreement provides that PIM will furnish investment advisory services in connection with the management of the Series. In connection therewith, PIM is obligated to keep certain books and records of the Series. PI pays for the services of PIM, the cost of
| | | | |
| Prudential Emerging Markets Debt Local Currency Fund | | | 33 | |
Notes to Financial Statements
continued
compensation of officers of the Series, occupancy and certain clerical and bookkeeping costs of the Series. The Series bears all other costs and expenses.
The management fee paid to PI is computed daily and payable monthly at an annual rate of .80% of the average daily net assets of the Series.
PI has contractually agreed through February 28, 2013 to limit net annual Series operating expenses (excluding distribution and service (12b-1) fees, extraordinary and certain other expenses such as taxes, interest and brokerage commissions) to each class of shares to 1.05% of the Series’ average daily net assets.
The Series has a distribution agreement with Prudential Investment Management Services LLC (“PIMS”) who acts as the distributor of the Class A, Class C, Class Q and Class Z shares. The Series compensates PIMS for distributing and servicing the Series’ Class A and Class C, pursuant to plans of distribution (the “Class A and C Plans”), regardless of expenses actually incurred by PIMS. The distribution fees are accrued daily and payable monthly. No distribution or service fees are paid to PIMS as distributor of the Class Q and Z shares of the Series.
Pursuant to the Class A and C Plans, the Series compensates PIMS for distribution related activities at an annual rate of up to .30% and 1% of the average daily net assets of the Class A and C shares, respectively. PIMS has contractually agreed through February 28, 2013, to limit such expenses to .25% of the average daily net assets of the Class A shares.
PIMS has advised the Series that it received $23,170 in front-end sales charges resulting from sales of Class A shares during the period ended October 31, 2011. From these fees, PIMS paid such sales charges to affiliated broker-dealers, which in turn paid commissions to salespersons and incurred other distribution costs.
PIMS has advised the Series that for the period ended October 31, 2011, it received $573 contingent deferred sales charges imposed upon redemptions by certain Class C shareholders.
PI, PIM and PIMS are indirect, wholly-owned subsidiaries of Prudential Financial, Inc. (“Prudential”).
| | |
| 34 | | Visit our website at www.prudentialfunds.com |
Note 3. Other Transactions with Affiliates
Prudential Mutual Fund Services LLC (“PMFS”), an affiliate of PI and an indirect, wholly-owned subsidiary of Prudential, serves as the Series’ transfer agent. Transfer agent fees and expenses in the Statement of Operations include certain out-of-pocket expenses paid to non-affiliates, where applicable.
The Series invests in the Prudential Core Taxable Money Market Fund (the “Core Fund”), a Series of the Prudential Investment Portfolios 2 registered under the 1940 Act, as amended, and managed by PI. Earnings from the Core Fund are disclosed on the Statement of Operations as affiliated dividend income.
Note 4. Portfolio Securities
Purchases and sales of investment securities, other than short-term investments, for the period ended October 31, 2011 aggregated $40,747,582 and $13,229,445, respectively.
Note 5. Distributions and Tax Information
Distributions to shareholders, which are determined in accordance with federal income tax regulations and which may differ from generally accepted accounting principles, are recorded on the ex-dividend date. In order to present distributions in excess of net income, accumulated net realized loss on investment and foreign currency transactions and paid-in capital in excess of par on the Statement of Assets and Liabilities that more closely represent their tax character, certain adjustments have been made to distributions in excess of net income, accumulated net realized loss on investment and foreign currency transactions and paid-in capital in excess of par. For the period ended October 31, 2011, the adjustments were to decrease distributions in excess of net income by $509,978, decrease accumulated net realized loss on investment and foreign currency transactions by $520,103 and decrease paid-in capital in excess of par by $10,125, due to the differences in the treatment for book and tax purposes of certain transactions involving foreign securities and currencies and other book to tax adjustments. Net investment income, net realized loss on investment and foreign currency transactions and net assets were not affected by this change.
For the period ended October 31, 2011, the tax character of dividends paid as reflected in the Statement of Changes in Net Assets were $336,630 of ordinary income and $574,957 of tax return of capital.
| | | | |
| Prudential Emerging Markets Debt Local Currency Fund | | | 35 | |
Notes to Financial Statements
continued
As of October 31, 2011, there were no undistributed earnings on a tax basis.
The United States federal income tax basis of the Series’ investments and the net unrealized depreciation as of October 31, 2011 were as follows:
| | | | | | | | | | |
Tax Basis | | Appreciation | | Depreciation | | Net
Unrealized
Depreciation | | Other Cost
Basis
Adjustments | | Total Net
Unrealized
Depreciation |
| $29,444,899 | | $324,696 | | $(1,652,167) | | $(1,327,471) | | $(32,224) | | $(1,359,695) |
The difference between book basis and tax basis were primarily attributable to the difference in treatment of amortizations of premiums. The other cost basis adjustments were primarily attributable to appreciation (depreciation) of foreign currencies, forward currency transactions and other cost tax adjustment.
Management has analyzed the Series’ tax positions and has concluded that no provision for income tax is required in the Series’ financial statements for the current reporting period.
Note 6. Capital
The Series offers Class A, Class C, Class Q and Class Z shares. Class A shares are sold with a front-end sales charge of up to 4.50%. All Investors who purchase Class A shares in an amount of $1 million or more and sell these shares within 12 months of purchase are subject to a contingent deferred sales charge (CDSC) of 1%. The Class A CDSC is waived for purchases by certain retirement and/or benefit plans. Class C shares are sold with a contingent deferred sales charge of 1% on shares redeemed within the first 12 months after purchase. Under certain limited circumstances, an exchange may be made from Class A or Class C to Class Z shares of the Series. A special exchange privilege is also available for shareholders who qualified to purchase Class A shares at net asset value. Class Q and Z shares are not subject to any sales or redemption charge and are offered exclusively for sale to a limited group of investors.
As of October 31, 2011, Prudential Financial, Inc. through its affiliates owned 103 Class A shares, 103 Class C shares, 103 Class Q shares and 2,584,437 Class Z shares of the Series.
| | |
| 36 | | Visit our website at www.prudentialfunds.com |
There are 275 million shares of common stock at $0.01 par value per share, designated Class A, Class C, Class Q and Class Z common stock, each of which consists of 75 million, 75 million, 50 million and 75 million authorized shares, respectively.
Transactions in shares of common stock were as follows:
| | | | | | | | |
Class A | | Shares | | | Amount | |
Period ended October 31, 2011*: | | | | | | | | |
Shares sold | | | 415,348 | | | $ | 4,173,929 | |
Shares issued in reinvestment of dividends and tax return of capital | | | 4,853 | | | | 46,027 | |
Shares reacquired | | | (140,426 | ) | | | (1,355,681 | ) |
| | | | | | | | |
Net increase (decrease) in shares outstanding | | | 279,775 | | | $ | 2,864,275 | |
| | | | | | | | |
Class C | | | | | | |
Period ended October 31, 2011*: | | | | | | | | |
Shares sold | | | 50,542 | | | $ | 505,520 | |
Shares issued in reinvestment of dividends and tax return of capital | | | 571 | | | | 5,479 | |
Shares reacquired | | | (8,883 | ) | | | (82,126 | ) |
| | | | | | | | |
Net increase (decrease) in shares outstanding | | | 42,230 | | | $ | 428,873 | |
| | | | | | | | |
Class Q | | | | | | |
Period ended October 31, 2011*: | | | | | | | | |
Shares sold | | | 100.0 | | | $ | 1,000 | |
Shares issued in reinvestment of dividends and tax return of capital | | | 3.4 | | | | 33 | |
Shares reacquired | | | — | | | | — | |
| | | | | | | | |
Net increase (decrease) in shares outstanding | | | 103.4 | | | $ | 1,033 | |
| | | | | | | | |
Class Z | | | | | | |
Period ended October 31, 2011*: | | | | | | | | |
Shares sold | | | 2,790,861 | | | $ | 27,779,000 | |
Shares issued in reinvestment of dividends and tax return of capital | | | 85,813 | | | | 842,622 | |
Shares reacquired | | | (46,075 | ) | | | (413,872 | ) |
| | | | | | | | |
Net increase (decrease) in shares outstanding | | | 2,830,599 | | | $ | 28,207,750 | |
| | | | | | | | |
| * | Commenced of operations on March 30, 2011. |
Note 7. Borrowing
The Series, along with other affiliated registered investment companies (the “Funds”), is a party to a Syndicated Credit Agreement (“SCA”) with a group of banks. The purpose of the SCA is to provide an alternative source of temporary funding for capital share redemptions. The SCA provides for a commitment of $750 million for the period December 17, 2010 through December 16, 2011. The Funds pay an annualized commitment fee of 0.10% of the unused portion of the SCA. Interest on any borrowings under these SCA’s is paid at contracted market rates. The
| | | | |
| Prudential Emerging Markets Debt Local Currency Fund | | | 37 | |
Notes to Financial Statements
continued
commitment fee for the unused amount is accrued daily and paid quarterly. The SCA has been renewed on substantially similar terms with an increase in the amount of commitment to $900 million.
The Series did not utilize the line of credit during the period ended October 31, 2011.
Note 8. New Accounting Pronouncements
In April 2011, the Financial Accounting Standards Board (“FASB”) issued Accounting Standards Update (“ASU”) No. 2011-03 “Reconsideration of Effective Control for Repurchase Agreements”. The objective of ASU No. 2011-03 is to improve the accounting for repurchase agreements and other agreements that both entitle and obligate a transferor to repurchase or redeem financial assets before their maturity. Under previous guidance, whether or not to account for a transaction as a sale was based on, in part, if the entity maintained effective control over the transferred financial assets. ASU No. 2011-03 removes the transferor’s ability criterion from the effective control assessment. This guidance is effective prospectively for interim and annual reporting periods beginning on or after December 15, 2011. At this time, management is evaluating the implications of ASU No. 2011-03 and its impact on the financial statements has not been determined.
In May 2011, the FASB issued ASU No. 2011-04 “Amendments to Achieve Common Fair Value Measurement and Disclosure Requirements in U.S. GAAP and IFRSs”. ASU No. 2011-04 includes common requirements for measurement of and disclosure about fair value between U.S. GAAP and IFRS. ASU No. 2011-04 will require reporting entities to disclose quantitative information about the unobservable inputs used in the fair value measurements categorized within Level 3 of the fair value hierarchy. In addition, ASU No. 2011-04 will require reporting entities to make disclosures about amounts and reasons for all transfers in and out of Level 1 and Level 2 fair value measurements. The new and revised disclosures are effective for interim and annual reporting periods beginning after December 15, 2011. At this time, management is evaluating the implications of ASU No. 2011-04 and its impact on the financial statements has not been determined.
| | |
| 38 | | Visit our website at www.prudentialfunds.com |
Financial Highlights
| | | | |
| Class A Shares | |
| | | March 30,
2011(a)
through
October 31,
2011 | |
| Per Share Operating Performance: | | | | |
| Net Asset Value, Beginning Of Period | | | $10.00 | |
| Income (loss) from investment operations: | | | | |
| Net investment income | | | .32 | |
| Net realized and unrealized loss on investment and foreign currency transactions | | | (.62 | ) |
| Total from investment operations | | | (.30 | ) |
Less Dividends and Distributions: | | | | |
Dividends from net investment income | | | (.13 | ) |
Tax return of capital | | | (.21 | ) |
Total dividends and distributions | | | (.34 | ) |
| Net asset value, end of period | | | $9.36 | |
| Total Return(b): | | | (3.14)% | |
| |
| Ratios/Supplemental Data: | |
| Net assets, end of period (000) | | | $2,620 | |
| Average net assets (000) | | | $1,634 | |
| Ratios to average net assets(c)(d): | | | | |
| Expenses, including distribution and service (12b-1) fees(e) | | | 1.30% | (f) |
| Expenses, excluding distribution and service (12b-1) fees | | | 1.05% | (f) |
| Net investment income | | | 4.85% | (f) |
| For Class A, C, Q and Z shares: | | | | |
| Portfolio turnover rate | | | 60% | (g) |
(a) Commencement of operations.
(b) Total return does not consider the effects of sales loads. Total return is calculated assuming a purchase of a share on the first day and a sale on the last day of the reporting period, and includes reinvestment of dividends and distributions. Total return may reflect adjustments to conform to generally accepted accounting principles. Total return for a period less than a full year is not annualized.
(c) Does not include expenses of the underlying portfolios in which the Series invests.
(d) Net of expense waiver/reimbursement. If the investment manager had not waived/reimbursed expenses, the expense ratios including and excluding distribution and services (12b-1) fees and net investment income ratio would be 2.76%, 2.51% and 3.39%, respectively, for the period ended October 31, 2011.
(e) The distributor of the Series has contractually agreed to limit its distribution and service (12b-1) fees to .25% of the average daily net assets of the Class A shares.
(f) Annualized
(g) Not annualized.
See Notes to Financial Statements.
| | | | |
| Prudential Emerging Markets Debt Local Currency Fund | | | 39 | |
Financial Highlights
continued
| | | | |
| Class C Shares | | | |
| | | March 30,
2011(a)
through
October 31,
2011 | |
| Per Share Operating Performance: | | | | |
| Net Asset Value, Beginning Of Period | | | $10.00 | |
| Income (loss) from investment operations: | | | | |
| Net investment income | | | .31 | |
| Net realized and unrealized loss on investment and foreign currency transactions | | | (.57 | ) |
| Total from investment operations | | | (.26 | ) |
Less Dividends and Distributions: | | | | |
Dividends from net investment income | | | (.12 | ) |
Tax return of capital | | | (.21 | ) |
Total dividends and distributions | | | (.33 | ) |
| Net asset value, end of period | | | $9.41 | |
| Total Return(b): | | | (2.72)% | |
| |
| Ratios/Supplemental Data: | | | |
| Net assets, end of period (000) | | | $398 | |
| Average net assets (000) | | | $211 | |
| Ratios to average net assets(c)(d): | | | | |
| Expenses, including distribution and service (12b-1) fees | | | 2.05% | (e) |
| Expenses, excluding distribution and service (12b-1) fees | | | 1.05% | (e) |
| Net investment income | | | 4.09% | (e) |
(a) Commencement of operations.
(b) Total return does not consider the effects of sales loads. Total return is calculated assuming a purchase of a share on the first day and a sale on the last day of the reporting period, and includes reinvestment of dividends and distributions. Total return may reflect adjustments to conform to generally accepted accounting principles. Total return for a period less than a full year is not annualized.
(c) Does not include expenses of the underlying portfolios in which the Series invests.
(d) Net of expense waiver/reimbursement. If the investment manager had not waived/reimbursed expenses, the expense ratios including and excluding distribution and services (12b-1) fees and net investment income ratio would be 3.52%, 2.52% and 2.62%, respectively, for the period ended October 31, 2011.
(e) Annualized.
See Notes to Financial Statements.
| | |
| 40 | | Visit our website at www.prudentialfunds.com |
| | | | |
| Class Q Shares | |
| | | March 30,
2011(a)
through
October 31,
2011 | |
| Per Share Operating Performance: | | | | |
| Net Asset Value, Beginning Of Period | | | $10.00 | |
| Income (loss) from investment operations: | | | | |
| Net investment income | | | .29 | |
| Net realized and unrealized loss on investment and foreign currency transactions | | | (.59 | ) |
| Total from investment operations | | | (.30 | ) |
Less Dividends and Distributions: | | | | |
Dividends from net investment income | | | (.12 | ) |
Tax return of capital | | | (.21 | ) |
Total dividends and distributions | | | (.33 | ) |
| Net asset value, end of period | | | $9.37 | |
| Total Return(b): | | | (3.14)% | |
| |
| Ratios/Supplemental Data: | |
| Net assets, end of period (000) | | | $1 | |
| Average net assets (000) | | | $1 | |
| Ratios to average net assets(c)(d): | | | | |
| Expenses, including distribution and service (12b-1) fees | | | 1.05% | (e) |
| Expenses, excluding distribution and service (12b-1) fees | | | 1.05% | (e) |
| Net investment income | | | 4.98% | (e) |
(a) Commencement of operations.
(b) Total return is calculated assuming a purchase of a share on the first day and a sale on the last day of the reporting period, and includes reinvestment of dividends and distributions. Total return may reflect adjustments to conform to generally accepted accounting principles. Total return for a period less than a full year is not annualized.
(c) Does not include expenses of the underlying portfolios in which the Series invests.
(d) Net of expense waiver/reimbursement. If the investment manager had not waived/reimbursed expenses, the expense ratios including and excluding distribution and services (12b-1) fees and net investment income ratio would be 2.67%, 2.67% and 3.36%, respectively, for the period ended October 31, 2011.
(e) Annualized.
See Notes to Financial Statements.
| | | | |
| Prudential Emerging Markets Debt Local Currency Fund | | | 41 | |
Financial Highlights
continued
| | | | |
| Class Z Shares | |
| | | March 30,
2011(a)
through
October 31,
2011 | |
| Per Share Operating Performance: | | | | |
| Net Asset Value, Beginning Of Period | | | $10.00 | |
| Income (loss) from investment operations: | | | | |
| Net investment income | | | .29 | |
| Net realized and unrealized loss on investment and foreign currency transactions | | | (.59 | ) |
| Total from investment operations | | | (.30 | ) |
Less Dividends and Distributions: | | | | |
Dividends from net investment income | | | (.12 | ) |
Tax return of capital | | | (.21 | ) |
Total dividends and distributions | | | (.33 | ) |
| Net asset value, end of period | | | $9.37 | |
| Total Return(b): | | | (3.14)% | |
| |
| Ratios/Supplemental Data: | | | |
| Net assets, end of period (000) | | | $26,532 | |
| Average net assets (000) | | | $25,697 | |
| Ratios to average net assets(c)(d): | | | | |
| Expenses, including distribution and service (12b-1) fees | | | 1.05% | (e) |
| Expenses, excluding distribution and service (12b-1) fees | | | 1.05% | (e) |
| Net investment income | | | 4.99% | (e) |
(a) Commencement of operations.
(b) Total return is calculated assuming a purchase of a share on the first day and a sale on the last day of the reporting period, and includes reinvestment of dividends and distributions. Total return may reflect adjustments to conform to generally accepted accounting principles. Total return for a period less than a full year is not annualized.
(c) Does not include expenses of the underlying portfolios in which the Series invests.
(d) Net of expense waiver/reimbursement. If the investment manager had not waived/reimbursed expenses, the expense ratios including and excluding distribution and services (12b-1) fees and net investment income ratio would be 2.72%, 2.72% and 3.32%, respectively, for the period ended October 31, 2011.
(e) Annualized.
See Notes to Financial Statements.
| | |
| 42 | | Visit our website at www.prudentialfunds.com |
Report of Independent Registered Public
Accounting Firm
The Board of Trustees and Shareholders
Prudential World Fund, Inc.:
We have audited the accompanying statement of assets and liabilities of Prudential Emerging Markets Debt Local Currency Fund, a series of Prudential World Fund, Inc. (hereafter referred to as the “Fund”), including the portfolio of investments, as of October 31, 2011, and the related statements of operations, changes in net assets and the financial highlights for the period March 30, 2011 (commencement of operations) to October 31, 2011. These financial statements and financial highlights are the responsibility of the Fund’s management. Our responsibility is to express an opinion on these financial statements and financial highlights based on our audit.
We conducted our audit in accordance with the standards of the Public Company Accounting Oversight Board (United States). Those standards require that we plan and perform the audit to obtain reasonable assurance about whether the financial statements and financial highlights are free of material misstatement. An audit includes examining, on a test basis, evidence supporting the amounts and disclosures in the financial statements. Our procedures included confirmation of securities owned as of October 31, 2011, by correspondence with the custodian, transfer agent and brokers or by other appropriate auditing procedures when replies from brokers were not received. An audit also includes assessing the accounting principles used and significant estimates made by management, as well as evaluating the overall financial statement presentation. We believe that our audit provides a reasonable basis for our opinion.
In our opinion, the financial statements and financial highlights referred to above present fairly, in all material respects, the financial position of the Fund as of October 31, 2011, and the results of its operations, the changes in its net assets and the financial highlights for the period March 30, 2011 (commencement of operations) to October 31, 2011, in conformity with U.S. generally accepted accounting principles.

New York, New York
December 22, 2011
| | | | |
| Prudential Emerging Markets Debt Local Currency Fund | | | 43 | |
Federal Income Tax Information
(Unaudited)
For the fiscal period ended October 31, 2011, the Fund designates the maximum amount allowable but not less than 17.76% as interest related dividends in accordance with Sections 871(k)(1) and 881(e)(1) of the Internal Revenue Code.
| | |
| 44 | | Visit our website at www.prudentialfunds.com |
INFORMATION ABOUT BOARD MEMBERS AND OFFICERS
(Unaudited)
Information about Board Members and Officers is set forth below. Board Members who are not deemed to be “interested persons” of the Fund, as defined in the 1940 Act, are referred to as “Independent Board Members.” Board Members who are deemed to be “interested persons” of the Fund are referred to as “Interested Board Members.” The Board Members are responsible for the overall supervision of the operations of the Fund and perform the various duties imposed on the directors of investment companies by the 1940 Act.
| | | | |
Independent Board Members(1) | | | | |
Name, Address, Age Position(s) Portfolios Overseen | | Principal Occupation(s) During Past Five Years | | Other Directorships Held |
Kevin J. Bannon (59) Board Member Portfolios Overseen: 58 | | Managing Director (since April 2008) and Chief Investment Officer (since October 2008) of Highmount Capital LLC (registered investment adviser); formerly Executive Vice President and Chief Investment Officer (April 1993-August 2007) of Bank of New York Company; President (May 2003-May 2007) of BNY Hamilton Family of Mutual Funds. | | Director of Urstadt Biddle Properties (since September 2008). |
Linda W. Bynoe (59) Board Member Portfolios Overseen: 58 | | President and Chief Executive Officer (since March 1995) and formerly Chief Operating Officer (December 1989-February 1995) of Telemat Ltd. (management consulting); formerly Vice President (January 1985-June 1989) at Morgan Stanley & Co (broker-dealer). | | Director of Simon Property Group, Inc. (retail real estate) (since May 2003); Director of Anixter International, Inc. (communication products distributor) (since January 2006); Director of Northern Trust Corporation (financial services) (since April 2006); Trustee of Equity Residential (residential real estate) (since December 2009); formerly Director of Dynegy Inc. (power generation) (September 2002-May 2006). |
Michael S. Hyland, CFA (66) Board Member Portfolios Overseen: 58 | | Independent Consultant (since February 2005); formerly Senior Managing Director (July 2001-February 2005) of Bear Stearns & Co, Inc.; Global Partner, INVESCO (1999-2001); Managing Director and President of Salomon Brothers Asset Management (1989-1999). | | None. |
Douglas H. McCorkindale (72) Board Member Portfolios Overseen: 58 | | Formerly Chairman (February 2001-June 2006), Chief Executive Officer (June 2000-July 2005), President (September 1997-July 2005) and Vice Chairman (March 1984-May 2000) of Gannett Co. Inc. (publishing and media). | | Director of Lockheed Martin Corp. (aerospace and defense) (since May 2001). |
Visit our website at www.prudentialfunds.com
| | | | |
Independent Board Members(1) | | | | |
Name, Address, Age Position(s) Portfolios Overseen | | Principal Occupation(s) During Past Five Years | | Other Directorships Held |
Stephen P. Munn (69) Board Member Portfolios Overseen: 58 | | Lead Director (since 2007) and formerly Chairman (1993-2007) of Carlisle Companies Incorporated (manufacturer of industrial products). | | Lead Director (since 2007) of Carlisle Companies Incorporated (manufacturer of industrial products). |
Richard A. Redeker (68) Board Member & Independent Chair Portfolios Overseen: 58 | | Retired Mutual Fund Senior Executive (43 years); Management Consultant; Independent Directors Council (organization of 2,800 Independent Mutual Fund Directors)-Executive Committee, Chair of Policy Steering Committee, Governing Council. | | None. |
Robin B. Smith (72) Board Member Portfolios Overseen: 58 | | Chairman of the Board (since January 2003) of Publishers Clearing House (direct marketing); Member of the Board of Directors of ADLPartner (marketing) (since December 2010); formerly Chairman and Chief Executive Officer (August 1996-January 2003) of Publishers Clearing House. | | Formerly Director of BellSouth Corporation (telecommunications) (1992-2006). |
Stephen G. Stoneburn (68) Board Member Portfolios Overseen: 58 | | President and Chief Executive Officer (since June 1996) of Quadrant Media Corp. (publishing company); formerly President (June 1995-June 1996) of Argus Integrated Media, Inc.; Senior Vice President and Managing Director (January 1993-1995) of Cowles Business Media; Senior Vice President of Fairchild Publications, Inc (1975-1989). | | None. |
Prudential Emerging Markets Debt Local Currency Fund
| | | | |
| Interested Board Members(1) | | | | |
Name, Address, Age Position(s) Portfolios Overseen | | Principal Occupation(s) During Past Five Years | | Other Directorships Held |
Judy A. Rice* (63) Board Member & President Portfolios Overseen: 58 | | President, Chief Executive Officer, Chief Operating Officer and Officer-In-Charge (since February 2003) of Prudential Investments LLC; President, Chief Executive Officer and Officer-In-Charge (since April 2003) of Prudential Mutual Fund Services LLC; President, Chief Executive Officer (since May 2011) and Executive Vice President (since December 2008) of Prudential Investment Management Services LLC; Member of the Board of Directors of Jennison Associates LLC (since November 2010); formerly Vice President (February 1999-April 2006) of Prudential Investment Management Services LLC; President, COO, CEO and Manager of PIFM Holdco, LLC (since April 2006); formerly President, Chief Executive Officer, Chief Operating Officer and Officer-In-Charge (May 2003-June 2005) and Director (May 2003-March 2006) and Executive Vice President (June 2005-March 2006) of AST Investment Services, Inc.; Member of Board of Governors of the Investment Company Institute. | | None. |
Stuart S. Parker* (49) Board Member & President Portfolios Overseen: 58 | | President of Prudential Investments LLC (since January 2012); Executive Vice President of Jennison Associates LLC and Head of Retail Distribution of Prudential Investments LLC (June 2005 - December 2011). | | None. |
Scott E. Benjamin (38) Board Member & Vice President Portfolios Overseen: 58 | | Executive Vice President (since June 2009) of Prudential Investments LLC and Prudential Investment Management Services LLC; Executive Vice President (since September 2009) of AST Investment Services, Inc.; Senior Vice President of Product Development and Marketing, Prudential Investments (since February 2006); Vice President of Product Development and Product Management, Prudential Investments (2003-2006). | | None. |
*Ms. Rice has announced her retirement as President and Board Member effective December 31, 2011. Ms. Rice has been appointed as Vice President effective January 1, 2012. The Board has appointed Stuart S. Parker as President and Board Member effective January 1, 2012.
Visit our website at www.prudentialfunds.com
(1) The year that each Board Member joined the Fund’s Board is as follows:
Kevin J. Bannon, 2008; Linda W. Bynoe, 2005; Michael S. Hyland, 2008; Douglas H. McCorkindale, 2003; Stephen P. Munn, 2008; Richard A. Redeker, 2003; Robin B. Smith, 1996; Stephen G. Stoneburn, 1996; Judy A. Rice, Board Member since 2000 and President since 2003; Scott E. Benjamin, Board Member since 2010 and Vice President since 2009.
| | |
| Fund Officers(a)(1) | | |
Name, Address and Age Position with Fund | | Principal Occupation(s) During Past Five Years |
Kathryn L. Quirk (59) Chief Legal Officer | | Vice President and Corporate Counsel (since September 2004) of Prudential; Executive Vice President, Chief Legal Officer and Secretary (since July 2005) of PI and Prudential Mutual Fund Services LLC; Vice President and Corporate Counsel (since June 2005) and Secretary (since February 2006) of AST Investment Services, Inc.; formerly Senior Vice President and Assistant Secretary (November 2004-August 2005) of PI; formerly Assistant Secretary (June 2005-February 2006) of AST Investment Services, Inc.; formerly Managing Director, General Counsel, Chief Compliance Officer, Chief Risk Officer and Corporate Secretary (1997-2002) of Zurich Scudder Investments, Inc. |
Deborah A. Docs (53) Secretary | | Vice President and Corporate Counsel (since January 2001) of Prudential; Vice President (since December 1996) and Assistant Secretary (since March 1999) of PI; formerly Vice President and Assistant Secretary (May 2003-June 2005) of AST Investment Services, Inc. |
Jonathan D. Shain (53) Assistant Secretary | | Vice President and Corporate Counsel (since August 1998) of Prudential; Vice President and Assistant Secretary (since May 2001) of PI; Vice President and Assistant Secretary (since February 2001) of PMFS; formerly Vice President and Assistant Secretary (May 2003-June 2005) of AST Investment Services, Inc. |
Claudia DiGiacomo (37) Assistant Secretary | | Vice President and Corporate Counsel (since January 2005) of Prudential; Vice President and Assistant Secretary of PI (since December 2005); Associate at Sidley Austin Brown & Wood LLP (1999-2004). |
John P. Schwartz (40) Assistant Secretary | | Vice President and Corporate Counsel (since April 2005) of Prudential; Vice President and Assistant Secretary of PI (since December 2005); Associate at Sidley Austin Brown & Wood LLP (1997-2005). |
Andrew R. French (49) Assistant Secretary | | Vice President and Corporate Counsel (since February 2010) of Prudential; formerly Director and Corporate Counsel (2006-2010) of Prudential; Vice President and Assistant Secretary (since January 2007) of PI; Vice President and Assistant Secretary (since January 2007) of PMFS. |
Timothy J. Knierim (52) Chief Compliance Officer | | Chief Compliance Officer of Prudential Investment Management, Inc. (since July 2007); formerly Chief Risk Officer of PIM and PI (2002-2007) and formerly Chief Ethics Officer of PIM and PI (2006-2007). |
Valerie M. Simpson (53) Deputy Chief Compliance Officer | | Chief Compliance Officer (since April 2007) of PI and AST Investment Services, Inc.; formerly Vice President-Financial Reporting (June 1999-March 2006) for Prudential Life and Annuities Finance. |
Prudential Emerging Markets Debt Local Currency Fund
| | |
| Fund Officers(a)(1) | | |
Name, Address and Age Position with Fund | | Principal Occupation(s) During Past Five Years |
Theresa C. Thompson (49) Deputy Chief Compliance Officer | | Vice President, Compliance, PI (since April 2004); and Director, Compliance, PI (2001-2004). |
Richard W. Kinville (43) Anti-Money Laundering Compliance Officer | | Vice President, Corporate Compliance, Anti-Money Laundering Unit (since January 2005) of Prudential; committee member of the American Council of Life Insurers Anti-Money Laundering and Critical Infrastructure Committee (since January 2007); formerly Investigator and Supervisor in the Special Investigations Unit for the New York Central Mutual Fire Insurance Company (August 1994-January 1999); Investigator in AXA Financial’s Internal Audit Department and Manager in AXA’s Anti-Money Laundering Office (January 1999-January 2005); first chair of the American Council of Life Insurers Anti-Money Laundering and Critical Infrastructure Committee (June 2007-December 2009). |
Grace C. Torres (52) Treasurer and Principal Financial and Accounting Officer | | Assistant Treasurer (since March 1999) and Senior Vice President (since September 1999) of PI; Assistant Treasurer (since May 2003) and Vice President (since June 2005) of AST Investment Services, Inc.; Senior Vice President and Assistant Treasurer (since May 2003) of Prudential Annuities Advisory Services, Inc.; formerly Senior Vice President (May 2003-June 2005) of AST Investment Services, Inc. |
M. Sadiq Peshimam (47) Assistant Treasurer | | Vice President (since 2005) of Prudential Investments LLC. |
Peter Parrella (53) Assistant Treasurer | | Vice President (since 2007) and Director (2004-2007) within Prudential Mutual Fund Administration; formerly Tax Manager at SSB Citi Fund Management LLC (1997-2004). |
(a) Excludes Ms. Rice and Mr. Benjamin, interested Board Members who also serve as President and Vice President, respectively.
(1) The year that each individual became an officer of the Fund is as follows:
Kathryn L. Quirk, 2005; Deborah A. Docs, 2005; Jonathan D. Shain, 2005; Claudia DiGiacomo, 2005; John P. Schwartz, 2006; Andrew R. French, 2006; Timothy J. Knierim, 2007; Valerie M. Simpson, 2007; Theresa C. Thompson, 2008; Richard W. Kinville, 2011; Grace C. Torres, 1995; Sadiq Peshimam, 2006; Peter Parrella, 2007.
Explanatory Notes to Tables:
| n | Board Members are deemed to be “Interested,” as defined in the 1940 Act, by reason of their affiliation with Prudential Investments LLC and/or an affiliate of Prudential Investments LLC. |
| n | Unless otherwise noted, the address of all Board Members and Officers is c/o Prudential Investments LLC, Gateway Center Three, 100 Mulberry Street, Newark, New Jersey 07102-4077. |
| n | There is no set term of office for Board Members or Officers. The Board Members have adopted a retirement policy, which calls for the retirement of Board Members on December 31 of the year in which they reach the age of 75. |
| n | “Other Directorships Held” includes only directorships of companies required to register or file reports with the SEC under the 1934 Act) (that is, “public companies”) or other investment companies registered under the 1940 Act. |
| n | “Portfolios Overseen” includes all investment companies managed by Prudential Investments LLC. The investment companies for which PI serves as manager include the Prudential Investments Mutual Funds, The Prudential Variable Contract Accounts, Target Mutual Funds, The Prudential Series Fund, Prudential’s Gibraltar Fund, Inc. and the Advanced Series Trust. |
Visit our website at www.prudentialfunds.com
| | | | |
| n MAIL | | n TELEPHONE | | n WEBSITE |
Gateway Center Three 100 Mulberry Street Newark, NJ 07102 | | (800) 225-1852 | | www.prudentialfunds.com |
|
| PROXY VOTING |
| The Board of Directors of the Fund has delegated to the Fund’s investment subadviser the responsibility for voting any proxies and maintaining proxy recordkeeping with respect to the Fund. A description of these proxy voting policies and procedures is available without charge, upon request, by calling (800) 225-1852 or by visiting the Securities and Exchange Commission’s website at www.sec.gov. Information regarding how the Fund voted proxies relating to portfolio securities during the most recent 12-month period ended June 30 is available on the Fund’s website and on the Commission’s website. |
|
| DIRECTORS |
Kevin J. Bannon • Scott E. Benjamin • Linda W. Bynoe • Michael S. Hyland • Douglas H. McCorkindale • Stephen P. Munn • Richard A. Redeker • Judy A. Rice •
Robin B. Smith • Stephen G. Stoneburn |
|
| OFFICERS |
| Judy A. Rice, President • Scott E. Benjamin, Vice President • Grace C. Torres, Treasurer and Principal Financial and Accounting Officer • Kathryn L. Quirk, Chief Legal Officer • Deborah A. Docs, Secretary • Timothy J. Knierim, Chief Compliance Officer • Valerie M. Simpson, Deputy Chief Compliance Officer • Theresa C. Thompson, Deputy Chief Compliance Officer • Richard W. Kinville, Anti-Money Laundering Compliance Officer • Jonathan D. Shain, Assistant Secretary • Claudia DiGiacomo, Assistant Secretary • John P. Schwartz, Assistant Secretary • Andrew R. French, Assistant Secretary • M. Sadiq Peshimam, Assistant Treasurer • Peter Parrella, Assistant Treasurer |
| | | | |
| MANAGER | | Prudential Investments LLC | | Gateway Center Three
100 Mulberry Street
Newark, NJ 07102 |
|
| INVESTMENT SUBADVISER | | Prudential Investment
Management, Inc. | | Gateway Center Two
100 Mulberry Street
Newark, NJ 07102 |
|
| DISTRIBUTOR | | Prudential Investment
Management Services LLC | | Gateway Center Three
100 Mulberry Street
Newark, NJ 07102 |
|
| CUSTODIAN | | The Bank of New York Mellon | | One Wall Street
New York, NY 10286 |
|
| TRANSFER AGENT | | Prudential Mutual Fund
Services LLC | | PO Box 9658
Providence, RI 02940 |
|
| INDEPENDENT REGISTERED PUBLIC ACCOUNTING FIRM | | KPMG LLP | | 345 Park Avenue
New York, NY 10154 |
|
| FUND COUNSEL | | Willkie Farr & Gallagher LLP | | 787 Seventh Avenue
New York, NY 10019 |
|
| An investor should consider the investment objectives, risks, charges, and expenses of the Fund carefully before investing. The prospectus and summary prospectus contain this and other information about the Fund. An investor may obtain a prospectus and summary prospectus by visiting our website at www.prudentialfunds.com or by calling (800) 225-1852. The prospectus and summary prospectus should be read carefully before investing. |
|
| E-DELIVERY |
| To receive your mutual fund documents online, go to www.prudentialfunds.com/edelivery and enroll. Instead of receiving printed documents by mail, you will receive notification via email when new materials are available. You can cancel your enrollment or change your email address at any time by visiting the website address above. |
|
| SHAREHOLDER COMMUNICATIONS WITH DIRECTORS |
| Shareholders can communicate directly with the Board of Directors by writing to the Chair of the Board, Prudential Emerging Markets Debt Local Currency Fund, Prudential Investments, Attn: Board of Directors, 100 Mulberry Street, Gateway Center Three, Newark, NJ 07102. Shareholders can communicate directly with an individual Director by writing to the same address. Communications are not screened before being delivered to the addressee. |
|
| AVAILABILITY OF PORTFOLIO SCHEDULE |
| The Fund files its complete schedule of portfolio holdings with the Securities and Exchange Commission for the first and third quarters of each fiscal year on Form N-Q. The Fund’s Forms N-Q are available on the Commission’s website at www.sec.gov. The Fund’s Forms N-Q may also be reviewed and copied at the Commission’s Public Reference Room in Washington, D.C. Information on the operation and location of the Public Reference Room may be obtained by calling (202) 551-8090. The Fund’s schedule of portfolio holdings is also available on the Fund’s website as of the end of each month. |
|
| The Fund’s Statement of Additional Information contains additional information about the Fund’s Directors and is available without charge, upon request, by calling (800) 225-1852. |
Mutual Funds:
| | | | |
| ARE NOT INSURED BY THE FDIC OR ANY FEDERAL GOVERNMENT AGENCY | | MAY LOSE VALUE | | ARE NOT A DEPOSIT OF OR GUARANTEED BY ANY BANK OR ANY BANK AFFILIATE |

PRUDENTIAL EMERGING MARKETS DEBT LOCAL CURRENCY FUND
| | | | | | | | |
| SHARE CLASS | | A | | C | | Q | | Z |
| NASDAQ | | EMDAX | | EMDCX | | EMDQX | | EMDZX |
| CUSIP | | 743969750 | | 743969743 | | 743969735 | | 743969727 |
MF212E 0215338-00001-00
Item 2 – Code of Ethics — See Exhibit (a)
As of the end of the period covered by this report, the registrant has adopted a code of ethics (the “Section 406 Standards for Investment Companies – Ethical Standards for Principal Executive and Financial Officers”) that applies to the registrant’s Principal Executive Officer and Principal Financial Officer; the registrant’s Principal Financial Officer also serves as the Principal Accounting Officer.
The registrant hereby undertakes to provide any person, without charge, upon request, a copy of the code of ethics. To request a copy of the code of ethics, contact the registrant 800-225-1852, and ask for a copy of the Section 406 Standards for Investment Companies - Ethical Standards for Principal Executive and Financial Officers.
Item 3 – Audit Committee Financial Expert –
The registrant’s Board has determined that Mr. Stephen P. Munn, member of the Board’s Audit Committee is an “audit committee financial expert,” and that he is “independent,” for purposes of this Item.
Item 4 – Principal Accountant Fees and Services –
(a) Audit Fees
For the fiscal years ended October 31, 2011 and October 31, 2010, KPMG LLP (“KPMG”), the Registrant’s principal accountant, billed the Registrant $118,000 and $57,500, respectively, for professional services rendered for the audit of the Registrant’s annual financial statements or services that are normally provided in connection with statutory and regulatory filings.
(b) Audit-Related Fees
None.
(c) Tax Fees
None.
(d) All Other Fees
None.
(e) (1) Audit Committee Pre-Approval Policies and Procedures
THE PRUDENTIAL MUTUAL FUNDS
AUDIT COMMITTEE POLICY
on
Pre-Approval of Services Provided by the Independent Accountants
The Audit Committee of each Prudential Mutual Fund is charged with the responsibility to monitor the independence of the Fund’s independent accountants. As part of this responsibility, the Audit Committee must pre-approve any independent accounting firm’s engagement to render audit and/or permissible non-audit services, as required by law. In evaluating a proposed engagement of the independent accountants, the Audit Committee will assess the effect that the engagement might reasonably be expected to have on the accountant’s independence. The Committee’s evaluation will be based on:
| | • | | a review of the nature of the professional services expected to be provided, |
| | • | | a review of the safeguards put into place by the accounting firm to safeguard independence, and |
| | • | | periodic meetings with the accounting firm. |
Policy for Audit and Non-Audit Services Provided to the Funds
On an annual basis, the scope of audits for each Fund, audit fees and expenses, and audit-related and non-audit services (and fees proposed in respect thereof) proposed to be performed by the Fund’s independent accountants will be presented by the Treasurer and the independent accountants to the Audit Committee for review and, as appropriate, approval prior to the initiation of such services. Such presentation shall be accompanied by confirmation by both the Treasurer and the independent accountants that the proposed services will not adversely affect the independence of the independent accountants. Proposed services shall be described in sufficient detail to enable the Audit Committee to assess the appropriateness of such services and fees, and the compatibility of the provision of such services with the auditor’s independence. The Committee shall receive periodic reports on the progress of the audit and other services which are approved by the Committee or by the Committee Chair pursuant to authority delegated in this Policy.
The categories of services enumerated under “Audit Services”, “Audit-related Services”, and “Tax Services” are intended to provide guidance to the Treasurer and the independent accountants as to those categories of services which the Committee believes are generally consistent with the independence of the independent accountants and which the Committee (or the Committee Chair) would expect upon the presentation of specific proposals to pre-approve. The enumerated categories are not intended as an exclusive list of audit, audit-related or tax services, which the Committee (or the Committee Chair) would consider for pre-approval.
Audit Services
The following categories of audit services are considered to be consistent with the role of the Fund’s independent accountants:
| | • | | Annual Fund financial statement audits |
| | • | | Seed audits (related to new product filings, as required) |
| | • | | SEC and regulatory filings and consents |
Audit-related Services
The following categories of audit-related services are considered to be consistent with the role of the Fund’s independent accountants:
| | • | | Accounting consultations |
| | • | | Fund merger support services |
| | • | | Agreed Upon Procedure Reports |
| | • | | Other Internal Control Reports |
Individual audit-related services that fall within one of these categories and are not presented to the Audit Committee as part of the annual pre-approval process will be subject to pre-approval by the Committee Chair (or any other Committee member on whom this responsibility has been delegated) so long as the estimated fee for those services does not exceed $50,000.
Tax Services
The following categories of tax services are considered to be consistent with the role of the Fund’s independent accountants:
| | • | | Tax compliance services related to the filing or amendment of the following: |
| | • | | Federal, state and local income tax compliance; and, |
| | • | | Sales and use tax compliance |
| | • | | Timely RIC qualification reviews |
| | • | | Tax distribution analysis and planning |
| | • | | Tax authority examination services |
| | • | | Tax appeals support services |
| | • | | Accounting methods studies |
| | • | | Fund merger support services |
| | • | | Tax consulting services and related projects |
Individual tax services that fall within one of these categories and are not presented to the Audit Committee as part of the annual pre-approval process will be subject to pre-approval by the Committee Chair (or any other Committee member on whom this responsibility has been delegated) so long as the estimated fee for those services does not exceed $50,000.
Other Non-audit Services
Certain non-audit services that the independent accountants are legally permitted to render will be subject to pre-approval by the Committee or by one or more Committee members to whom the Committee has delegated this authority and who will report to the full Committee any pre-approval decisions made pursuant to this Policy. Non-audit services presented for pre-approval pursuant to this paragraph will be accompanied by a confirmation from both the Treasurer and the independent accountants that the proposed services will not adversely affect the independence of the independent accountants.
Proscribed Services
The Fund’s independent accountants will not render services in the following categories of non-audit services:
| | • | | Bookkeeping or other services related to the accounting records or financial statements of the Fund |
| | • | | Financial information systems design and implementation |
| | • | | Appraisal or valuation services, fairness opinions, or contribution-in-kind reports |
| | • | | Internal audit outsourcing services |
| | • | | Management functions or human resources |
| | • | | Broker or dealer, investment adviser, or investment banking services |
| | • | | Legal services and expert services unrelated to the audit |
| | • | | Any other service that the Public Company Accounting Oversight Board determines, by regulation, is impermissible. |
Pre-approval of Non-Audit Services Provided to Other Entities Within the Prudential Fund Complex
Certain non-audit services provided to Prudential Investments LLC or any of its affiliates that also provide ongoing services to the Prudential Mutual Funds will be subject to pre-approval by the Audit Committee. The only non-audit services provided to these entities that will require pre-approval are those related directly to the operations and financial reporting of the Funds. Individual projects that are not presented to the Audit Committee as part of the annual pre-approval process will be subject to pre-approval by the Committee Chair (or any other Committee member on whom this responsibility has been delegated) so long as the estimated fee for those services does not exceed $50,000. Services presented for pre-approval pursuant to this paragraph will be accompanied by a confirmation from both the Treasurer and the independent accountants that the proposed services will not adversely affect the independence of the independent accountants.
Although the Audit Committee will not pre-approve all services provided to Prudential Investments LLC and its affiliates, the Committee will receive an annual report from the Fund’s independent accounting firm showing the aggregate fees for all services provided to Prudential Investments and its affiliates.
(e) (2) Percentage of services referred to in 4(b) – 4(d) that were approved by the audit committee –
Not applicable.
(f) Percentage of hours expended attributable to work performed by other than full time employees of principal accountant if greater
than 50%.
The percentage of hours expended on the principal accountant’s engagement to audit the registrant’s financial statements for the most recent fiscal year that were attributed to work performed by persons other than the principal accountant’s full-time, permanent employees was 0%.
(g) Non-Audit Fees
Not applicable to Registrant for the fiscal years 2011 and 2010. The aggregate non-audit fees billed by KPMG for services rendered to the registrant’s investment adviser and any entity controlling, controlled by, or under common control with the investment adviser that provides ongoing services to the registrant for the fiscal years 2011 and 2010 was $0 and $0, respectively.
(h) Principal Accountant’s Independence
Not applicable as KPMG has not provided non-audit services to the registrant’s investment adviser and any entity controlling, controlled by, or under common control with the investment adviser that provides ongoing services to the registrant that were not pre-approved pursuant to Rule 2-01(c)(7)(ii) of Regulation S-X.
| | |
| Item 5 – | | Audit Committee of Listed Registrants – Not applicable. |
| |
| Item 6 – | | Schedule of Investments – The schedule is included as part of the report to shareholders filed under Item 1 of this Form. |
| |
| Item 7 – | | Disclosure of Proxy Voting Policies and Procedures for Closed-End Management Investment Companies – Not applicable. |
| |
| Item 8 – | | Portfolio Managers of Closed-End Management Investment Companies – Not applicable. |
| |
| Item 9 – | | Purchases of Equity Securities by Closed-End Management Investment Company and Affiliated Purchasers – Not applicable. |
| |
| Item 10 – | | Submission of Matters to a Vote of Security Holders – Not applicable. |
| |
| Item 11 – | | Controls and Procedures |
| | (a) | It is the conclusion of the registrant’s principal executive officer and principal financial officer that the effectiveness of the registrant’s current disclosure controls and procedures (such disclosure controls and procedures having been evaluated within 90 days of the date of this filing) provide reasonable assurance that the information required to be disclosed by the registrant has been recorded, processed, summarized and reported within the time period specified in the Commission’s rules and forms and that the information required to be disclosed by the registrant has been accumulated and communicated to the registrant’s principal executive officer and principal financial officer in order to allow timely decisions regarding required disclosure. |
| | (b) | There has been no significant change in the registrant’s internal control over financial reporting that occurred during the registrant’s most recent fiscal quarter of the period covered by this report that has materially affected, or is likely to materially affect, the registrant’s internal control over financial reporting. |
Item 12 – Exhibits
(a) (1) Code of Ethics – Attached hereto as Exhibit EX-99.CODE-ETH
(2) Certifications pursuant to Section 302 of the Sarbanes-Oxley Act – Attached hereto as Exhibit EX-99.CERT.
(3) Any written solicitation to purchase securities under Rule 23c-1. – Not applicable.
(b) Certifications pursuant to Section 906 of the Sarbanes-Oxley Act – Attached hereto as Exhibit EX-99.906CERT.
SIGNATURES
Pursuant to the requirements of the Securities Exchange Act of 1934 and the Investment Company Act of 1940, the registrant has duly caused this report to be signed on its behalf by the undersigned, thereunto duly authorized.
| | |
| Registrant: | | Prudential World Fund, Inc. |
| |
| By: | | /s/ Deborah A. Docs |
| | Deborah A. Docs |
| | Secretary |
| |
| Date: | | December 20, 2011 |
Pursuant to the requirements of the Securities Exchange Act of 1934 and the Investment Company Act of 1940, this report has been signed below by the following persons on behalf of the registrant and in the capacities and on the dates indicated.
| | |
| By: | | /s/ Judy A. Rice |
| | Judy A. Rice |
| | President and Principal Executive Officer |
| |
| Date: | | December 20, 2011 |
| |
| By: | | /s/Grace C. Torres |
| | Grace C. Torres |
| | Treasurer and Principal Financial Officer |
| |
| Date: | | December 20, 2011 |