UNITED STATES
SECURITIES AND EXCHANGE COMMISSION
Washington, D.C. 20549
FORM N-CSR
CERTIFIED SHAREHOLDER REPORT OF REGISTERED MANAGEMENT
INVESTMENT COMPANIES
| | |
| Investment Company Act file number: | | 811-03981 |
| |
| Exact name of registrant as specified in charter: | | Prudential World Fund, Inc. |
| |
| Address of principal executive offices: | | Gateway Center 3, |
| | 100 Mulberry Street, |
| | Newark, New Jersey 07102 |
| |
| Name and address of agent for service: | | Deborah A. Docs |
| | Gateway Center 3, |
| | 100 Mulberry Street, |
| | Newark, New Jersey 07102 |
| |
| Registrant’s telephone number, including area code: | | 800-225-1852 |
| |
| Date of fiscal year end: | | 10/31/2014 |
| |
| Date of reporting period: | | 10/31/2014 |
Item 1 – Reports to Stockholders –

PRUDENTIAL INVESTMENTS»MUTUAL FUNDS
PRUDENTIAL INTERNATIONAL EQUITY FUND
ANNUAL REPORT · OCTOBER 31, 2014
Fund Type
International Stock
Objective
Long-term growth of capital
This report is not authorized for distribution to prospective investors unless preceded or accompanied by a current prospectus.
The views expressed in this report and information about the Fund’s portfolio holdings are for the period covered by this report and are subject to change thereafter.
Mutual funds are distributed by Prudential Investment Management Services LLC, a Prudential Financial company. Quantitative Management Associates, LLC (QMA) is a wholly owned subsidiary of Prudential Investment Management, Inc. (PIM). QMA and PIM are registered investment advisers and Prudential Financial companies. © 2014 Prudential Financial, Inc. and its related entities. Prudential Investments LLC, Prudential, the Prudential logo, Bring Your Challenges, and the Rock symbol are service marks of Prudential Financial, Inc. and its related entities, registered in many jurisdictions worldwide.

December 15, 2014
Dear Shareholder:
We hope you find the annual report for the Prudential International Equity Fund informative and useful. The report covers performance for the 12-month period that ended October 31, 2014.
Since market conditions change over time, we believe it is important to maintain a diversified portfolio of funds consistent with your tolerance for risk, time horizon, and financial goals.
Your financial advisor can help you create a diversified investment plan that may include funds covering all the basic asset classes and that reflects your personal investor profile and risk tolerance. Keep in mind, however, that diversification and asset allocation strategies do not assure a profit or protect against loss in declining markets.
Prudential Investments® is dedicated to helping you solve your toughest investment challenges—whether it’s capital growth, reliable income, or protection from market volatility and other risks. We offer the expertise of Prudential Financial’s affiliated asset managers* that strive to be leaders in a broad range of funds to help you stay on course to the future you envision. They also manage money for major corporations and pension funds around the world, which means you benefit from the same expertise, innovation, and attention to risk demanded by today’s most sophisticated investors.
Thank you for choosing the Prudential Investments family of funds.
Sincerely,

Stuart S. Parker, President
Prudential International Equity Fund
*Most of Prudential Investments’ equity funds are advised by Jennison Associates LLC, Quantitative Management Associates LLC (QMA), or Prudential Real Estate Investors. Prudential Investments’ fixed income and money market funds are advised by Prudential Investment Management, Inc. (PIM) through its Prudential Fixed Income unit. Jennison Associates, QMA, and PIM are registered investment advisers and Prudential Financial companies. Prudential Real Estate Investors is a unit of PIM.
| | | | |
| Prudential International Equity Fund | | | 1 | |
Your Fund’s Performance (Unaudited)
Performance data quoted represent past performance. Past performance does not guarantee future results. The investment return and principal value of an investment will fluctuate, so that an investor’s shares, when redeemed, may be worth more or less than their original cost. Current performance may be lower or higher than the past performance data quoted. An investor may obtain performance data as of the most recent month-end by visiting our website at www.prudentialfunds.com or by calling (800) 225-1852.
| | | | | | | | | | | | |
Cumulative Total Returns (Without Sales Charges) as of 10/31/14 | |
| | | One Year | | | Five Years | | | Ten Years | |
Class A | | | 1.84 | % | | | 40.44 | % | | | 58.44 | % |
Class B | | | 1.10 | | | | 35.59 | | | | 47.40 | |
Class C | | | 1.10 | | | | 35.60 | | | | 47.42 | |
Class Z | | | 2.12 | | | | 42.28 | | | | 62.46 | |
MSCI All Country World Ex-US Index | | | 0.06 | | | | 34.36 | | | | 89.34 | |
Lipper International Multi-Cap Core Funds Average | | | 0.16 | | | | 40.27 | | | | 74.38 | |
| | | | | | | | | | | | |
Average Annual Total Returns (With Sales Charges) as of 9/30/14 | |
| | | One Year | | | Five Years | | | Ten Years | |
Class A | | | 0.15 | % | | | 5.53 | % | | | 4.50 | % |
Class B | | | 0.23 | | | | 5.84 | | | | 4.34 | |
Class C | | | 4.08 | | | | 5.97 | | | | 4.33 | |
Class Z | | | 6.23 | | | | 6.97 | | | | 5.35 | |
MSCI All Country World Ex-US Index | | | 4.77 | | | | 6.03 | | | | 7.06 | |
Lipper International Multi-Cap Core Funds Average | | | 3.95 | | | | 6.52 | | | | 6.02 | |
| | | | | | | | | | | | |
Average Annual Total Returns (With Sales Charges) as of 10/31/14 | |
| | | One Year | | | Five Years | | | Ten Years | |
Class A | | | –3.76 | % | | | 5.82 | % | | | 4.12 | % |
Class B | | | –3.88 | | | | 6.12 | | | | 3.96 | |
Class C | | | 0.10 | | | | 6.28 | | | | 3.96 | |
Class Z | | | 2.12 | | | | 7.31 | | | | 4.97 | |
| | | | | | | | | | | | |
Average Annual Total Returns (Without Sales Charges) as of 10/31/14 | |
| | | One Year | | | Five Years | | | Ten Years | |
Class A | | | 1.84 | % | | | 7.03 | % | | | 4.71 | % |
Class B | | | 1.10 | | | | 6.28 | | | | 3.96 | |
Class C | | | 1.10 | | | | 6.28 | | | | 3.96 | |
Class Z | | | 2.12 | | | | 7.31 | | | | 4.97 | |
| | |
| 2 | | Visit our website at www.prudentialfunds.com |
Growth of a $10,000 Investment
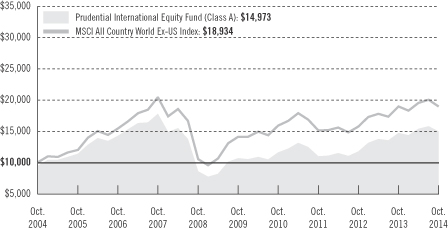
The graph compares a $10,000 investment in the Prudential International Equity Fund (Class A shares) with a similar investment in the MSCI All Country World Ex-US Index by portraying the initial account values at the beginning of the 10-year period for Class A shares (October 31, 2004) and the account values at the end of the current fiscal year (October 31, 2014) as measured on a quarterly basis. For purposes of the graph, and unless otherwise indicated, it has been assumed that (a) the maximum applicable front-end sales charge was deducted from the initial $10,000 investment in Class A shares; (b) all recurring fees (including management fees) were deducted; and (c) all dividends and distributions were reinvested. The line graph provides information for Class A shares only. As indicated in the tables provided earlier, performance for Class B, Class C, and Class Z shares will vary due to the differing charges and expenses applicable to each share class (as indicated in the following paragraphs). Without waiver of fees and/or expense reimbursement, if any, the returns would have been lower.
Past performance does not predict future performance. Total returns and the ending account values in the graph include changes in share price and reinvestment of dividends and capital gains distributions in a hypothetical investment for the periods shown. The Fund’s total returns do not reflect the deduction of income taxes on an individual’s investment. Taxes may reduce your actual investment returns on income or gains paid by the Fund or any gains you may realize if you sell your shares.
Source: Prudential Investments LLC and Lipper Inc.
| | | | |
| Prudential International Equity Fund | | | 3 | |
Your Fund’s Performance (continued)
The returns in the tables do not reflect the deduction of taxes that a shareholder would pay on Fund distributions or following the redemption of Fund shares. The average annual total returns take into account applicable sales charges, which are described for each share class in the table below.
| | | | | | | | |
| | Class A | | Class B* | | Class C | | Class Z |
Maximum initial sales charge | | 5.50% of
the public
offering
price | | None | | None | | None |
Contingent deferred sales charge (CDSC) (as a percentage of the lower of original purchase price or net asset value at redemption) | | 1% on sales
of $1 million
or more
made within
12 months of
purchase | | 5%(Yr.1)
4%(Yr.2)
3%(Yr.3)
2%(Yr.4)
1%(Yr.5)
1%(Yr.6)
0%(Yr.7) | | 1% on sales
made within
12 months
of purchase | | None |
Annual distribution and service (12b-1) fees (shown as a percentage of average daily net assets) | | .30% | | 1% | | 1% | | None |
*Class B shares are closed to all purchase activity and no additional Class B shares may be purchased or acquired except by exchange from Class B shares of another Fund or through dividend or capital gains reinvestment.
Benchmark Definitions
MSCI All Country World Ex-US Index
The Morgan Stanley Capital International All Country World Ex-US (MSCI ACWI Ex-US) Index is an unmanaged, market-capitalization weighted index designed to provide a broad measure of stock performance throughout the world, with the exception of US based companies. The MSCI ACWI Ex-US Index includes both developed and emerging markets.
Lipper International Multi-Cap Core Funds Average
The Lipper International Multi-Cap Core Funds Average (Lipper Average) represents returns based on the average return of all funds in the Lipper International Multi-Cap Core Funds category for the periods noted. Funds in the Lipper Average are funds that, by portfolio practice, invest in a variety of market capitalization ranges without concentrating 75% of their equity assets in any one market capitalization range over an extended period of time.
Investors cannot invest directly in an index or average. The returns for the Index would be lower if they included the effects of sales charges, operating expenses of a mutual fund, or taxes. Returns for the Lipper Average reflect the deduction of operating expenses, but not sales charges or taxes.
| | |
| 4 | | Visit our website at www.prudentialfunds.com |
| | | | |
Five Largest Holdings in Long-Term Portfolio expressed as a percentage of net assets
as of 10/31/14 | |
Novartis AG, Pharmaceuticals | | | 1.9 | % |
Roche Holding AG, Pharmaceuticals | | | 1.4 | |
BP PLC, Oil, Gas & Consumable Fuels | | | 1.4 | |
Total SA, Oil, Gas & Consumable Fuels | | | 1.3 | |
Royal Dutch Shell PLC (Class A Stock), Oil, Gas & Consumable Fuels | | | 1.3 | |
Holdings reflect only long-term investments and are subject to change.
| | | | |
Five Largest Industries in Long-Term Portfolio expressed as a percentage of net assets
as of 10/31/14 | |
Banks | | | 15.2 | % |
Oil, Gas & Consumable Fuels | | | 8.7 | |
Pharmaceuticals | | | 7.3 | |
Insurance | | | 5.1 | |
Metals & Mining | | | 5.1 | |
Industry weightings reflect only long-term investments and are subject to change.
| | | | |
| Prudential International Equity Fund | | | 5 | |
Strategy and Performance Overview
How did the Fund perform?
The Prudential International Equity Fund’s Class A shares gained 1.84% for the 12-month reporting period ended October 31, 2014, surpassing the 0.06% gain of the Morgan Stanley Capital International All Country World Ex-US (MSCI ACWI Ex-US) Index and the 0.16% gain of the Lipper International Multi-Cap Core Funds Average.
How did international stock markets perform?
| | • | | Despite indications in late 2013 that the economies of developed countries led by Japan and the euro zone were positioned to expand in 2014, international equity markets were relatively flat over the past 12 months, as measured by the Index. |
| | • | | International equities eked out a small gain during the first quarter of 2014. Europe continued to combat deflationary pressures and European stocks, particularly those of the Nordic countries, generated positive returns overall. Geopolitical tensions between Russia and Ukraine emerged, threatening market stability. Returns in the Pacific were weakest, as worries about China’s manufacturing growth weighed on stock prices. Japanese equities declined on lower export growth and fears a new sales tax could hamper earlier stimulus efforts. |
| | • | | Despite softer-than-expected global economic growth, the second quarter saw a global rally. Strength in the global manufacturing sector, accommodative monetary policy at the central bank level, and governments’ targeted stimulus or eased austerity measures were viewed as promising, despite the persistently fragile recovery in Europe and weakness in Japan. |
| | • | | In the third quarter, international equities generated only modest gains. Euro zone returns mirrored the region’s economic woes, as the continent awaited additional stimulus efforts and dealt with ongoing concerns about tensions with Russia. Germany and France experienced steep declines, but Denmark posted a double-digit return. Asian markets generally recorded tepid returns, with stocks in Singapore and Hong Kong advancing and Japanese stocks declining. |
| | • | | During October, international markets posted steep declines due to geopolitical strife, concerns about China’s slowdown, and fears of the potentially detrimental effects of rising US interest rates. The strength of the US dollar, which gained nearly 8% versus the euro and yen, negatively impacted currency translation for Europe and Asia. Developed markets in the Asia-Pacific region held up better than most euro zone markets, but emerging Asian markets generated mixed results. |
| | |
| 6 | | Visit our website at www.prudentialfunds.com |
| | • | | For the reporting period, two small markets, Israel and Denmark, were among the top performers. Japan and the United Kingdom, the two largest markets in the Index, were basically flat. Portugal and Austria had large losses of about 26% and 24%, respectively. Overall, about half of the 44 countries included in the Index posted a positive return while the remainder ended the period in the red. |
| | • | | Emerging markets were primarily the best performers, although there was wide dispersion within returns. Egypt and India advanced more than 30%, while Indonesia, the Philippines, and Thailand gained between 23% and 27%. Greece reversed its performance of the prior twelve months, falling almost 33%, and Russia, following troubles in Crimea and Ukraine, was down over 21%. |
| | • | | For the reporting period, the majority of the value added in the Fund came in Switzerland in healthcare, Canada in financials and materials, and South Africa in telecommunication services and financials, while the Fund’s exposures in Australia in materials, Brazil in financials, and China in materials detracted from performance. |
How did international stock markets sectors perform?
| | • | | There was also wide variance in sector performance. Healthcare led with an almost 14% gain, followed by information technology, which gained over 11%. Utilities and telecommunication services also did well. The poorest performing sectors were materials, which fell over 8%, and energy, which lost 4%. Consumer discretionary and industrials also ended the reporting period in the red. |
| | • | | The Fund’s holdings in information technology in Japan and Taiwan; consumer discretionary in France, India, and Denmark; utilities in China and Portugal; and telecommunication services in Japan and South Africa outperformed their respective benchmark returns. However, three sectors, including materials in Australia and China, consumer staples in the United Kingdom and Germany, and financials in Brazil detracted from relative performance. |
How did slow-growing and fast-growing stocks perform in the Fund?
| | • | | The Fund uses a well-diversified core strategy that seeks to pick the best stocks in each sector. The Fund maintains a balance between slow-growing value stocks and fast-growing growth stocks. |
| | • | | Quantitative Management Associates (QMA) places a heavier emphasis on valuation factors, such as price-to-earnings ratios and dividend yield, when |
| | | | |
| Prudential International Equity Fund | | | 7 | |
Strategy and Performance Overview (continued)
| | evaluating slower-growing stocks. For faster-growing stocks, QMA’s process places a heavier weighting on information about earnings and sales growth. Quality is considered important across the growth spectrum. This allows the Fund to potentially add value throughout the full range from slow- to fast-growing companies, while maintaining a core profile. |
| | • | | Over the past year, both valuation and growth/revisions factors performed well and positively impacted the Fund’s total return. Quality and financial momentum factors also did well. |
| | • | | If the Index is aligned in quintiles from fastest- to slowest-growing stocks, in absolute terms, the Fund’s faster-growing stocks did better than the slower-growing value stocks overall. However, in terms of relative performance compared to the Index, the situation was reversed. |
| | • | | Within the faster-growth category, performance was best in healthcare and industrials, mainly from companies in developed markets such as Denmark, Finland, Switzerland, and the United Kingdom. Laggards included consumer staples holdings in Taiwan, Brazil, and India, as well as financial stocks in India, Italy, Hong Kong, and the United Kingdom. |
| | • | | Within the slower-growth category, performance was best in the telecommunication services, primarily South Africa’s Telkom SA SOC and Japan’s Nippon Telegraph and Telephone, and in the energy sector, namely Brazil’s Petroleo Brasileiro. Value was detracted in the materials sectors in China, Australia, and Japan and in the consumer discretionary sector, chiefly in Japan and the United Kingdom. |
| | |
| 8 | | Visit our website at www.prudentialfunds.com |
Fees and Expenses (Unaudited)
As a shareholder of the Fund, you incur two types of costs: (1) transaction costs, including sales charges (loads) on purchase payments and redemptions, as applicable, and (2) ongoing costs, including management fees, distribution, and/or service (12b-1) fees, and other Fund expenses, as applicable. This example is intended to help you understand your ongoing costs (in dollars) of investing in the Fund and to compare these costs with the ongoing costs of investing in other mutual funds.
The example is based on an investment of $1,000 invested on May 1, 2014, at the beginning of the period, and held through the six-month period ended October 31, 2014. The example is for illustrative purposes only; you should consult the Prospectus for information on initial and subsequent minimum investment requirements.
Actual Expenses
The first line for each share class in the table on the following page provides information about actual account values and actual expenses. You may use the information on this line, together with the amount you invested, to estimate the expenses that you paid over the period. Simply divide your account value by $1,000 (for example, an $8,600 account value ÷ $1,000 = 8.6), then multiply the result by the number on the first line under the heading “Expenses Paid During the Six-Month Period” to estimate the expenses you paid on your account during this period.
Hypothetical Example for Comparison Purposes
The second line for each share class in the table on the following page provides information about hypothetical account values and hypothetical expenses based on the Fund’s actual expense ratio and an assumed rate of return of 5% per year before expenses, which is not the Fund’s actual return. The hypothetical account values and expenses may not be used to estimate the actual ending account balance or expenses you paid for the period. You may use this information to compare the ongoing costs of investing in the Fund and other funds. To do so, compare this 5% hypothetical example with the 5% hypothetical examples that appear in the shareholder reports of the other funds.
The Fund’s transfer agent may charge additional fees to holders of certain accounts that are not included in the expenses shown in the table on the following page. These fees apply to individual retirement accounts (IRAs) and Section 403(b) accounts. As of the close of the six-month period covered by the table, IRA fees included an annual maintenance fee of $15 per account (subject to a maximum annual maintenance fee of $25 for all accounts held by the same shareholder). Section 403(b) accounts are charged an annual $25 fiduciary maintenance fee. Some of the fees may vary in amount, or may be waived, based on your total account balance or the number of Prudential Investments funds, including the Fund, that you own. You should consider
| | | | |
| Prudential International Equity Fund | | | 9 | |
Fees and Expenses (continued)
the additional fees that were charged to your Fund account over the six-month period when you estimate the total ongoing expenses paid over the period and the impact of these fees on your ending account value, as these additional expenses are not reflected in the information provided in the expense table. Additional fees have the effect of reducing investment returns.
Please note that the expenses shown in the table are meant to highlight your ongoing costs only and do not reflect any transactional costs such as sales charges (loads). Therefore, the second line for each share class in the table is useful in comparing ongoing costs only and will not help you determine the relative total costs of owning different funds. In addition, if these transactional costs were included, your costs would have been higher.
| | | | | | | | | | | | | | | | | | |
Prudential
International
Equity Fund | | Beginning Account
Value
May 1, 2014 | | | Ending Account
Value
October 31, 2014 | | | Annualized
Expense Ratio
Based on the
Six-Month Period | | | Expenses Paid
During the
Six-Month Period* | |
| | | | | | | | | | | | | | | | | | |
| Class A | | Actual | | $ | 1,000.00 | | | $ | 974.80 | | | | 1.61 | % | | $ | 8.01 | |
| | | Hypothetical | | $ | 1,000.00 | | | $ | 1,017.09 | | | | 1.61 | % | | $ | 8.19 | |
| | | | | | | | | | | | | | | | | | |
| Class B | | Actual | | $ | 1,000.00 | | | $ | 971.10 | | | | 2.31 | % | | $ | 11.48 | |
| | | Hypothetical | | $ | 1,000.00 | | | $ | 1,013.56 | | | | 2.31 | % | | $ | 11.72 | |
| | | | | | | | | | | | | | | | | | |
| Class C | | Actual | | $ | 1,000.00 | | | $ | 971.10 | | | | 2.31 | % | | $ | 11.48 | |
| | | Hypothetical | | $ | 1,000.00 | | | $ | 1,013.56 | | | | 2.31 | % | | $ | 11.72 | |
| | | | | | | | | | | | | | | | | | |
| Class Z | | Actual | | $ | 1,000.00 | | | $ | 976.30 | | | | 1.31 | % | | $ | 6.53 | |
| | | Hypothetical | | $ | 1,000.00 | | | $ | 1,018.60 | | | | 1.31 | % | | $ | 6.67 | |
*Fund expenses (net of fee waivers or subsidies, if any) for each share class are equal to the annualized expense ratio for each share class (provided in the table), multiplied by the average account value over the period, multiplied by the 184 days in the six-month period ended October 31, 2014, and divided by the 365 days in the Fund’s fiscal year ended October 31, 2014 (to reflect the six-month period). Expenses presented in the table include the expenses of any underlying portfolios in which the Fund may invest.
| | |
| 10 | | Visit our website at www.prudentialfunds.com |
The Fund’s annualized expense ratios for the year ended October 31, 2014, are as follows:
| | | | | | | | |
| Class | | Gross Operating Expenses | | | Net Operating Expenses | |
A | | | 1.59 | % | | | 1.59 | % |
B | | | 2.29 | | | | 2.29 | |
C | | | 2.29 | | | | 2.29 | |
Z | | | 1.29 | | | | 1.29 | |
Net operating expenses shown above reflect any fee waivers and/or expense reimbursements. Additional information on Fund expenses and any fee waivers and/or expense reimbursements can be found in the “Financial Highlights” tables in this report and in the Notes to the Financial Statements in this report.
| | | | |
| Prudential International Equity Fund | | | 11 | |
Portfolio of Investments
as of October 31, 2014
| | | | | | | | |
| Description | | Shares | | | Value (Note 1) | |
LONG-TERM INVESTMENTS 99.5% | | | | | | | | |
| | |
COMMON STOCKS 96.8% | | | | | | | | |
| | |
Australia 4.5% | | | | | | | | |
BHP Billiton Ltd. | | | 95,558 | | | $ | 2,858,804 | |
Commonwealth Bank of Australia | | | 4,576 | | | | 325,398 | |
CSL Ltd. | | | 7,603 | | | | 536,796 | |
Dexus Property Group, REIT | | | 84,051 | | | | 89,835 | |
Federation Centres Ltd., REIT | | | 667,127 | | | | 1,602,042 | |
Fortescue Metals Group Ltd. | | | 415,036 | | | | 1,280,946 | |
Insurance Australia Group Ltd. | | | 323,843 | | | | 1,872,633 | |
Leighton Holdings Ltd. | | | 87,966 | | | | 1,712,605 | |
Lend Lease Group | | | 14,305 | | | | 199,513 | |
Suncorp Group Ltd. | | | 135,307 | | | | 1,760,652 | |
Woodside Petroleum Ltd. | | | 11,805 | | | | 419,320 | |
Woolworths Ltd. | | | 9,678 | | | | 307,138 | |
| | | | | | | | |
| | | | | | | 12,965,682 | |
| | |
Austria 0.2% | | | | | | | | |
ams AG | | | 9,246 | | | | 331,553 | |
UNIQA Insurance Group AG | | | 25,674 | | | | 286,276 | |
Voestalpine AG | | | 1,873 | | | | 75,028 | |
| | | | | | | | |
| | | | | | | 692,857 | |
| | |
Belgium 0.5% | | | | | | | | |
Anheuser-Busch InBev NV | | | 12,724 | | | | 1,411,019 | |
| | |
Brazil 1.0% | | | | | | | | |
Banco do Brasil SA | | | 139,000 | | | | 1,555,539 | |
Cielo SA | | | 11,300 | | | | 185,559 | |
Light SA | | | 109,900 | | | | 902,565 | |
Localiza Rent a Car SA | | | 5,200 | | | | 74,960 | |
TPI-Triunfo Participacoes e Investimentos SA* | | | 97,400 | | | | 229,949 | |
| | | | | | | | |
| | | | | | | 2,948,572 | |
| | |
Canada 8.4% | | | | | | | | |
Alimentation Couche Tard, Inc. (Class B Stock) | | | 6,900 | | | | 234,173 | |
Bank of Montreal | | | 10,300 | | | | 746,922 | |
Canadian Imperial Bank of Commerce | | | 22,773 | | | | 2,078,980 | |
Canadian National Railway Co. | | | 32,800 | | | | 2,312,487 | |
Canadian Natural Resources Ltd. | | | 55,700 | | | | 1,943,730 | |
Empire Co. Ltd. (Class A Stock) | | | 1,300 | | | | 89,935 | |
Genworth MI Canada, Inc. | | | 30,000 | | | | 1,048,756 | |
See Notes to Financial Statements.
| | | | |
| Prudential International Equity Fund | | | 13 | |
Portfolio of Investments
as of October 31, 2014 continued
| | | | | | | | |
| Description | | Shares | | | Value (Note 1) | |
COMMON STOCKS (Continued) | | | | | | | | |
| | |
Canada (cont’d.) | | | | | | | | |
Imperial Oil Ltd. | | | 4,800 | | | $ | 230,960 | |
Linamar Corp. | | | 7,700 | | | | 393,318 | |
Loblaw Cos. Ltd. | | | 2,732 | | | | 142,339 | |
Magna International, Inc. | | | 22,800 | | | | 2,250,363 | |
Metro, Inc. | | | 19,700 | | | | 1,384,357 | |
National Bank of Canada | | | 21,200 | | | | 990,920 | |
Potash Corp of Saskatchewan, Inc. | | | 38,600 | | | | 1,317,548 | |
Royal Bank of Canada | | | 46,300 | | | | 3,286,867 | |
Shaw Communications, Inc. (Class B Stock) | | | 6,300 | | | | 161,769 | |
Suncor Energy, Inc. | | | 73,800 | | | | 2,620,537 | |
Toronto-Dominion Bank (The) | | | 60,499 | | | | 2,977,578 | |
| | | | | | | | |
| | | | | | | 24,211,539 | |
| | |
Chile 0.1% | | | | | | | | |
Administradora de Fondos de Pensiones Habitat SA | | | 50,083 | | | | 79,325 | |
Banco de Credito e Inversiones | | | 1,454 | | | | 81,731 | |
Enersis SA | | | 314,450 | | | | 100,501 | |
| | | | | | | | |
| | | | | | | 261,557 | |
| | |
China 5.2% | | | | | | | | |
Agricultural Bank of China Ltd. (Class H Stock) | | | 3,441,000 | | | | 1,599,009 | |
Bank of China Ltd. (Class H Stock) | | | 4,862,000 | | | | 2,327,203 | |
Bank of Communications Co. Ltd. (Class H Stock) | | | 141,000 | | | | 105,723 | |
Beijing Capital Land Ltd. (Class H Stock) | | | 662,000 | | | | 228,772 | |
China CITIC Bank Corp. Ltd. (Class H Stock) | | | 2,762,000 | | | | 1,799,303 | |
China Construction Bank Corp. (Class H Stock) | | | 1,356,000 | | | | 1,011,711 | |
China Lumena New Materials Corp.*(a) | | | 5,060,000 | | | | 695,859 | |
China Merchants Bank Co. Ltd. (Class H Stock) | | | 229,000 | | | | 424,389 | |
China Power International Development Ltd. | | | 2,145,000 | | | | 968,945 | |
China Railway Group Ltd. (Class H Stock) | | | 132,000 | | | | 81,431 | |
China Resources Power Holdings Co. Ltd. | | | 28,000 | | | | 81,498 | |
China Telecom Corp. Ltd. (Class H Shares) | | | 260,000 | | | | 165,738 | |
Huaneng Power International, Inc. (Class H Stock) | | | 1,482,000 | | | | 1,822,033 | |
Industrial & Commercial Bank of China Ltd. (Class H Stock) | | | 1,079,000 | | | | 716,413 | |
Jiangnan Group Ltd. | | | 4,370,000 | | | | 873,420 | |
Kaisa Group Holdings Ltd. | | | 1,496,000 | | | | 555,959 | |
Shenzhen Expressway Co. Ltd. (Class H Stock) | | | 730,000 | | | | 467,036 | |
Tencent Holdings Ltd. | | | 59,200 | | | | 951,478 | |
Tiangong International Co. Ltd. | | | 1,072,000 | | | | 273,796 | |
| | | | | | | | |
| | | | | | | 15,149,716 | |
See Notes to Financial Statements.
| | | | | | | | |
| Description | | Shares | | | Value (Note 1) | |
COMMON STOCKS (Continued) | | | | | | | | |
| | |
Czech Republic | | | | | | | | |
CEZ A/S | | | 2,983 | | | $ | 82,516 | |
| | |
Denmark 1.9% | | | | | | | | |
A.P. Moeller - Maersk A/S (Class A Stock) | | | 714 | | | | 1,624,317 | |
A.P. Moeller - Maersk A/S (Class B Stock) | | | 761 | | | | 1,775,852 | |
Pandora A/S | | | 23,639 | | | | 1,993,040 | |
Schouw & Co. | | | 4,984 | | | | 220,819 | |
| | | | | | | | |
| | | | | | | 5,614,028 | |
| | |
Finland 1.1% | | | | | | | | |
Fortum OYJ | | | 56,594 | | | | 1,312,515 | |
Huhtamaki OYJ | | | 9,557 | | | | 242,510 | |
Kone OYJ (Class B Stock) | | | 12,690 | | | | 546,532 | |
Nokia OYJ | | | 58,753 | | | | 490,933 | |
Sampo OYJ (Class A Stock) | | | 7,116 | | | | 340,980 | |
Wartsila OYJ Abp | | | 2,341 | | | | 108,547 | |
| | | | | | | | |
| | | | | | | 3,042,017 | |
| | |
France 5.6% | | | | | | | | |
AXA SA | | | 88,399 | | | | 2,041,886 | |
Cap Gemini SA | | | 18,204 | | | | 1,197,752 | |
Carrefour SA | | | 9,731 | | | | 285,218 | |
Casino Guichard Perrachon SA | | | 12,813 | | | | 1,313,759 | |
Credit Agricole SA | | | 16,939 | | | | 250,668 | |
Electricite de France SA | | | 33,162 | | | | 979,220 | |
Ingenico | | | 6,303 | | | | 627,925 | |
Natixis SA | | | 141,594 | | | | 974,658 | |
Orange SA | | | 107,273 | | | | 1,707,824 | |
Peugeot SA* | | | 7,292 | | | | 86,662 | |
Rallye SA | | | 9,013 | | | | 349,312 | |
Safran SA | | | 4,331 | | | | 274,297 | |
Sanofi | | | 16,906 | | | | 1,534,050 | |
Sopra Group SA | | | 2,784 | | | | 208,686 | |
Teleperformance | | | 7,851 | | | | 494,727 | |
Thales SA | | | 1,805 | | | | 89,636 | |
Total SA | | | 64,416 | | | | 3,845,844 | |
| | | | | | | | |
| | | | | | | 16,262,124 | |
See Notes to Financial Statements.
| | | | |
| Prudential International Equity Fund | | | 15 | |
Portfolio of Investments
as of October 31, 2014 continued
| | | | | | | | |
| Description | | Shares | | | Value (Note 1) | |
COMMON STOCKS (Continued) | | | | | | | | |
| | |
Germany 5.1% | | | | | | | | |
Allianz SE | | | 15,794 | | | $ | 2,511,593 | |
BASF SE | | | 5,975 | | | | 527,951 | |
Bayer AG | | | 12,506 | | | | 1,788,628 | |
Bayerische Motoren Werke AG | | | 18,979 | | | | 2,035,264 | |
Continental AG | | | 1,761 | | | | 346,856 | |
Daimler AG | | | 18,287 | | | | 1,425,817 | |
Deutsche Post AG | | | 15,532 | | | | 489,099 | |
DO Deutsche Office AG* | | | 28,765 | | | | 104,896 | |
Henkel AG & Co. KGaA | | | 17,196 | | | | 1,565,159 | |
Hochtief AG | | | 1,146 | | | | 84,802 | |
Infineon Technologies AG | | | 18,232 | | | | 177,629 | |
K+S AG | | | 50,035 | | | | 1,402,217 | |
KUKA AG(b) | | | 4,444 | | | | 280,078 | |
Merck KGaA | | | 2,316 | | | | 209,654 | |
Muenchener Rueckversicherungs AG | | | 2,730 | | | | 537,504 | |
Stada Arzneimittel AG | | | 13,734 | | | | 529,183 | |
Volkswagen AG | | | 4,134 | | | | 881,650 | |
| | | | | | | | |
| | | | | | | 14,897,980 | |
| | |
Hong Kong 1.8% | | | | | | | | |
BOC Hong Kong Holdings Ltd. | | | 60,500 | | | | 201,399 | |
Cheung Kong Holdings Ltd. | | | 23,000 | | | | 408,302 | |
Cheung Kong Infrastructure Holdings Ltd. | | | 11,000 | | | | 80,348 | |
Henderson Land Development Co. Ltd. | | | 16,000 | | | | 108,092 | |
Hysan Development Co. Ltd. | | | 310,000 | | | | 1,414,484 | |
Link REIT (The) | | | 361,500 | | | | 2,125,836 | |
New World Development Co. Ltd. | | | 82,000 | | | | 103,075 | |
PCCW Ltd. | | | 537,000 | | | | 341,380 | |
Power Assets Holdings Ltd. | | | 21,500 | | | | 207,590 | |
TCC International Holdings Ltd. | | | 604,000 | | | | 242,997 | |
| | | | | | | | |
| | | | | | | 5,233,503 | |
| | |
Hungary 0.1% | | | | | | | | |
Magyar Telekom Telecommunications PLC* | | | 219,113 | | | | 303,252 | |
| | |
India 0.6% | | | | | | | | |
Infosys Ltd., ADR(b) | | | 19,500 | | | | 1,303,770 | |
Sesa Sterlite Ltd., ADR | | | 4,900 | | | | 82,516 | |
Tata Motors Ltd., ADR | | | 4,700 | | | | 221,370 | |
See Notes to Financial Statements.
| | | | | | | | |
| Description | | Shares | | | Value (Note 1) | |
COMMON STOCKS (Continued) | | | | | | | | |
| | |
India (cont’d.) | | | | | | | | |
Tata Steel Ltd., GDR, RegS | | | 12,767 | | | $ | 101,887 | |
| | | | | | | | |
| | | | | | | 1,709,543 | |
| | |
Indonesia 0.2% | | | | | | | | |
PT Bank Negara Indonesia (Persero) Tbk | | | 190,000 | | | | 93,645 | |
PT Bank Rakyat Indonesia (Persero) Tbk | | | 186,100 | | | | 170,541 | |
PT Surya Citra Media TbK | | | 1,189,200 | | | | 332,880 | |
| | | | | | | | |
| | | | | | | 597,066 | |
| | |
Ireland 0.3% | | | | | | | | |
Greencore Group PLC | | | 218,848 | | | | 918,283 | |
| | |
Israel 1.4% | | | | | | | | |
Bank Hapoalim BM | | | 285,886 | | | | 1,471,701 | |
Teva Pharmaceutical Industries Ltd. | | | 45,052 | | | | 2,543,066 | |
| | | | | | | | |
| | | | | | | 4,014,767 | |
| | |
Italy 0.7% | | | | | | | | |
Brembo SpA | | | 17,993 | | | | 596,672 | |
Eni SpA | | | 41,062 | | | | 874,821 | |
Snam SpA | | | 33,349 | | | | 180,334 | |
UnipolSai SpA | | | 109,519 | | | | 294,468 | |
| | | | | | | | |
| | | | | | | 1,946,295 | |
| | |
Japan 15.9% | | | | | | | | |
Alfresa Holdings Corp. | | | 6,300 | | | | 79,946 | |
Asahi Kasei Corp. | | | 21,000 | | | | 172,330 | |
Bandai Namco Holdings, Inc. | | | 2,800 | | | | 69,490 | |
Daicel Corp. | | | 7,000 | | | | 80,692 | |
Daikin Industries Ltd. | | | 28,700 | | | | 1,793,982 | |
FANUC Corp. | | | 3,100 | | | | 546,331 | |
Fuji Electric Co. Ltd. | | | 18,000 | | | | 79,082 | |
Fuji Heavy Industries Ltd. | | | 72,800 | | | | 2,423,013 | |
Fujitsu Ltd. | | | 278,000 | | | | 1,690,091 | |
Japan Tobacco, Inc. | | | 46,300 | | | | 1,579,712 | |
KDDI Corp. | | | 36,700 | | | | 2,410,069 | |
Kobe Steel Ltd. | | | 49,000 | | | | 77,854 | |
Koito Manufacturing Co. Ltd. | | | 3,400 | | | | 102,450 | |
Medipal Holdings Corp. | | | 63,900 | | | | 708,279 | |
Mitsubishi Corp. | | | 111,000 | | | | 2,176,527 | |
See Notes to Financial Statements.
| | | | |
| Prudential International Equity Fund | | | 17 | |
Portfolio of Investments
as of October 31, 2014 continued
| | | | | | | | |
| Description | | Shares | | | Value (Note 1) | |
COMMON STOCKS (Continued) | | | | | | | | |
| | |
Japan (cont’d.) | | | | | | | | |
Mitsubishi Electric Corp. | | | 147,000 | | | $ | 1,895,389 | |
Mitsubishi Materials Corp. | | | 458,000 | | | | 1,433,500 | |
Mitsubishi UFJ Financial Group, Inc. | | | 540,100 | | | | 3,148,359 | |
Mitsui & Co. Ltd. | | | 93,000 | | | | 1,404,213 | |
Murata Manufacturing Co. Ltd. | | | 3,200 | | | | 359,554 | |
NH Foods Ltd. | | | 4,000 | | | | 92,239 | |
Nippon Telegraph & Telephone Corp. | | | 38,300 | | | | 2,382,982 | |
Nitto Denko Corp. | | | 2,700 | | | | 146,027 | |
NOK Corp. | | | 4,000 | | | | 101,338 | |
NSK Ltd. | | | 126,000 | | | | 1,650,359 | |
Omron Corp. | | | 3,200 | | | | 151,471 | |
Oriental Land Co. Ltd. | | | 800 | | | | 171,071 | |
ORIX Corp. | | | 21,100 | | | | 292,873 | |
Otsuka Holdings Co. Ltd. | | | 61,600 | | | | 2,160,808 | |
Panasonic Corp. | | | 180,600 | | | | 2,172,845 | |
Resona Holdings, Inc. | | | 32,800 | | | | 187,609 | |
Rohm Co. Ltd. | | | 1,600 | | | | 97,393 | |
Seiko Epson Corp. | | | 43,200 | | | | 2,004,685 | |
Sekisui Chemical Co. Ltd. | | | 15,000 | | | | 186,951 | |
Shimano, Inc. | | | 1,300 | | | | 172,387 | |
Sony Corp. | | | 91,800 | | | | 1,812,436 | |
Sumitomo Metal Mining Co. Ltd. | | | 106,000 | | | | 1,470,487 | |
Sumitomo Mitsui Financial Group, Inc. | | | 63,100 | | | | 2,573,402 | |
Suzuki Motor Corp. | | | 52,100 | | | | 1,746,314 | |
Taiheiyo Cement Corp. | | | 19,000 | | | | 69,710 | |
Taisei Corp. | | | 16,000 | | | | 88,975 | |
Tokio Marine Holdings, Inc. | | | 11,300 | | | | 362,370 | |
Toyota Industries Corp. | | | 21,300 | | | | 1,014,227 | |
Toyota Motor Corp. | | | 43,634 | | | | 2,625,773 | |
| | | | | | | | |
| | | | | | | 45,965,595 | |
| | |
Malaysia 0.3% | | | | | | | | |
DiGi.Com Bhd | | | 56,300 | | | | 105,981 | |
IGB Real Estate Investment Trust, REIT | | | 658,800 | | | | 264,426 | |
IOI Corp. Bhd | | | 59,900 | | | | 89,051 | |
Malayan Flour Mills Bhd | | | 149,800 | | | | 85,213 | |
Sunway Bhd | | | 361,600 | | | | 379,412 | |
| | | | | | | | |
| | | | | | | 924,083 | |
See Notes to Financial Statements.
| | | | | | | | |
| Description | | Shares | | | Value (Note 1) | |
COMMON STOCKS (Continued) | | | | | | | | |
| | |
Mexico 0.7% | | | | | | | | |
Alfa SAB de CV (Class A Stock) | | | 78,800 | | | $ | 251,563 | |
Arca Continental SAB de CV | | | 12,300 | | | | 79,191 | |
Grupo Mexico SAB de CV (Class B Stock) | | | 482,900 | | | | 1,662,112 | |
| | | | | | | | |
| | | | | | | 1,992,866 | |
| | |
Netherlands 2.0% | | | | | | | | |
Royal Dutch Shell PLC (Class A Stock) | | | 101,532 | | | | 3,626,885 | |
Royal Dutch Shell PLC (Class B Stock) | | | 50,082 | | | | 1,850,292 | |
TomTom NV*(b) | | | 57,040 | | | | 414,354 | |
| | | | | | | | |
| | | | | | | 5,891,531 | |
| | |
New Zealand 0.4% | | | | | | | | |
Air New Zealand Ltd. | | | 497,431 | | | | 787,477 | |
Chorus Ltd.* | | | 249,569 | | | | 410,479 | |
| | | | | | | | |
| | | | | | | 1,197,956 | |
| | |
Norway 1.5% | | | | | | | | |
Bakkafrost P/F | | | 3,933 | | | | 96,166 | |
DNB ASA | | | 8,105 | | | | 148,907 | |
Gjensidige Forsikring ASA | | | 32,143 | | | | 583,863 | |
Leroy Seafood Group ASA | | | 7,357 | | | | 278,311 | |
Marine Harvest ASA | | | 78,001 | | | | 1,104,688 | |
Salmar ASA | | | 33,029 | | | | 595,069 | |
Statoil ASA | | | 63,295 | | | | 1,448,534 | |
Yara International ASA | | | 2,880 | | | | 132,254 | |
| | | | | | | | |
| | | | | | | 4,387,792 | |
| | |
Philippines | | | | | | | | |
Universal Robina Corp. | | | 17,770 | | | | 73,607 | |
| | |
Poland 1.1% | | | | | | | | |
KGHM Polska Miedz SA | | | 2,269 | | | | 87,512 | |
PGE SA | | | 233,237 | | | | 1,530,280 | |
Powszechny Zaklad Ubezpieczen SA | | | 10,084 | | | | 1,513,003 | |
| | | | | | | | |
| | | | | | | 3,130,795 | |
| | |
Portugal 0.6% | | | | | | | | |
CTT-Correios de Portugal SA | | | 77,893 | | | | 721,931 | |
EDP - Energias de Portugal SA | | | 37,600 | | | | 161,805 | |
Sonae SGPS SA | | | 623,289 | | | | 835,977 | |
| | | | | | | | |
| | | | | | | 1,719,713 | |
See Notes to Financial Statements.
| | | | |
| Prudential International Equity Fund | | | 19 | |
Portfolio of Investments
as of October 31, 2014 continued
| | | | | | | | |
| Description | | Shares | | | Value (Note 1) | |
COMMON STOCKS (Continued) | | | | | | | | |
| | |
Russia 0.9% | | | | | | | | |
Gazprom OAO, ADR | | | 133,485 | | | $ | 884,739 | |
Lukoil OAO, ADR | | | 13,411 | | | | 658,480 | |
MMC Norilsk Nickel OJSC, ADR | | | 24,344 | | | | 453,042 | |
NOVATEK OAO, GDR, RegS | | | 1,431 | | | | 153,689 | |
Rosneft OAO, GDR, RegS | | | 68,985 | | | | 384,246 | |
Surgutneftegas OAO, ADR | | | 23,126 | | | | 152,169 | |
| | | | | | | | |
| | | | | | | 2,686,365 | |
| | |
Singapore 1.3% | | | | | | | | |
Keppel Corp. Ltd. | | | 198,000 | | | | 1,451,977 | |
Mapletree Commercial Trust, REIT | | | 357,000 | | | | 397,235 | |
Mapletree Industrial Trust, REIT | | | 255,000 | | | | 292,876 | |
Oversea-Chinese Banking Corp. Ltd. | | | 833 | | | | 6,417 | |
Wilmar International Ltd. | | | 639,000 | | | | 1,592,829 | |
| | | | | | | | |
| | | | | | | 3,741,334 | |
| | |
South Africa 2.7% | | | | | | | | |
AVI Ltd. | | | 113,493 | | | | 740,120 | |
FirstRand Ltd. | | | 456,842 | | | | 1,956,804 | |
Investec PLC | | | 10,028 | | | | 91,951 | |
Mr Price Group Ltd. | | | 31,198 | | | | 645,934 | |
RMB Holdings Ltd. | | | 17,417 | | | | 96,776 | |
Sanlam Ltd. | | | 29,341 | | | | 185,407 | |
Sasol Ltd. | | | 43,181 | | | | 2,156,253 | |
Sibanye Gold Ltd. | | | 416,169 | | | | 784,138 | |
Telkom SA SOC Ltd.* | | | 191,422 | | | | 1,017,240 | |
| | | | | | | | |
| | | | | | | 7,674,623 | |
| | |
South Korea 2.0% | | | | | | | | |
Coway Co. Ltd. | | | 877 | | | | 67,044 | |
Dongsuh Co., Inc. | | | 4,126 | | | | 80,582 | |
Hanil Cement Co. Ltd. | | | 2,194 | | | | 282,245 | |
Hyundai Hysco Co. Ltd. | | | 13,215 | | | | 857,965 | |
Hyundai Steel Co. | | | 7,972 | | | | 508,087 | |
Korea Electric Power Corp. | | | 2,872 | | | | 126,069 | |
KT&G Corp. | | | 5,501 | | | | 487,074 | |
LG Display Co. Ltd.* | | | 6,169 | | | | 181,610 | |
LG Electronics, Inc. | | | 24,123 | | | | 1,473,232 | |
POSCO | | | 289 | | | | 83,474 | |
Samsung Electronics Co. Ltd. | | | 559 | | | | 651,874 | |
See Notes to Financial Statements.
| | | | | | | | |
| Description | | Shares | | | Value (Note 1) | |
COMMON STOCKS (Continued) | | | | | | | | |
| | |
South Korea (cont’d.) | | | | | | | | |
Seah Besteel Corp. | | | 15,827 | | | $ | 473,272 | |
SK Hynix, Inc.* | | | 9,127 | | | | 407,012 | |
SK Telecom Co. Ltd. | | | 822 | | | | 205,992 | |
| | | | | | | | |
| | | | | | | 5,885,532 | |
| | |
Spain 2.4% | | | | | | | | |
ACS Actividades de Construccion y Servicios SA | | | 43,527 | | | | 1,615,627 | |
Banco Santander SA | | | 341,904 | | | | 3,020,899 | |
Telefonica SA | | | 145,367 | | | | 2,187,434 | |
| | | | | | | | |
| | | | | | | 6,823,960 | |
| | |
Sweden 2.8% | | | | | | | | |
Axfood AB | | | 1,895 | | | | 116,639 | |
Hennes & Mauritz AB (Class B Stock) | | | 15,290 | | | | 610,063 | |
Hexpol AB | | | 8,432 | | | | 747,053 | |
Industrivarden AB (Class C Stock) | | | 4,515 | | | | 79,096 | |
Investment AB Kinnevik (Class B Stock) | | | 52,243 | | | | 1,658,866 | |
Investor AB (Class B Stock) | | | 7,569 | | | | 271,671 | |
Skandinaviska Enskilda Banken AB (Class A Stock) | | | 171,861 | | | | 2,207,429 | |
Svenska Cellulosa AB SCA (Class B Stock) | | | 9,189 | | | | 205,893 | |
Svenska Handelsbanken AB (Class A Stock) | | | 39,781 | | | | 1,901,739 | |
Swedbank AB (Class A Stock) | | | 14,919 | | | | 395,364 | |
| | | | | | | | |
| | | | | | | 8,193,813 | |
| | |
Switzerland 5.3% | | | | | | | | |
Actelion Ltd. | | | 14,488 | | | | 1,725,451 | |
Baloise Holding AG | | | 755 | | | | 95,043 | |
Geberit AG | | | 595 | | | | 203,095 | |
Givaudan SA | | | 148 | | | | 247,156 | |
Huber & Suhner AG | | | 2,591 | | | | 127,779 | |
Nestle SA | | | 39,408 | | | | 2,889,952 | |
Novartis AG | | | 58,431 | | | | 5,422,565 | |
Roche Holding AG | | | 14,048 | | | | 4,145,588 | |
Swiss Life Holding AG | | | 525 | | | | 120,456 | |
Swiss Re AG | | | 5,576 | | | | 450,880 | |
| | | | | | | | |
| | | | | | | 15,427,965 | |
| | |
Taiwan 3.6% | | | | | | | | |
Advanced Semiconductor Engineering, Inc. | | | 108,000 | | | | 130,286 | |
Catcher Technology Co. Ltd. | | | 226,000 | | | | 1,907,834 | |
See Notes to Financial Statements.
| | | | |
| Prudential International Equity Fund | | | 21 | |
Portfolio of Investments
as of October 31, 2014 continued
| | | | | | | | |
| Description | | Shares | | | Value (Note 1) | |
COMMON STOCKS (Continued) | | | | | | | | |
| | |
Taiwan (cont’d.) | | | | | | | | |
Chimei Materials Technology Corp. | | | 510,800 | | | $ | 560,186 | |
Fubon Financial Holding Co. Ltd. | | | 107,000 | | | | 181,143 | |
Hon Hai Precision Industry Co. Ltd. | | | 909,440 | | | | 2,878,377 | |
Ichia Technologies, Inc. | | | 165,000 | | | | 180,376 | |
Inotera Memories, Inc.* | | | 62,000 | | | | 95,819 | |
King Yuan Electronics Co. Ltd. | | | 611,000 | | | | 484,062 | |
Largan Precision Co. Ltd. | | | 2,000 | | | | 140,499 | |
Lung Yen Life Service Corp. | | | 34,000 | | | | 100,144 | |
Mega Financial Holding Co. Ltd. | | | 104,891 | | | | 86,996 | |
Namchow Chemical Industrial Co. Ltd. | | | 240,000 | | | | 386,847 | |
Pegatron Corp. | | | 817,000 | | | | 1,488,978 | |
Taishin Financial Holding Co. Ltd. | | | 181,000 | | | | 86,343 | |
Taiwan Semiconductor Manufacturing Co. Ltd. | | | 407,000 | | | | 1,764,293 | |
| | | | | | | | |
| | | | | | | 10,472,183 | |
| | |
Thailand 1.4% | | | | | | | | |
GFPT PCL | | | 1,471,500 | | | | 871,966 | |
Kasikornbank PCL | | | 177,400 | | | | 1,286,275 | |
Krungthai Card PCL | | | 93,000 | | | | 197,022 | |
Pruksa Real Estate PCL | | | 780,000 | | | | 802,272 | |
PTT PCL | | | 7,600 | | | | 86,011 | |
Siam Commercial Bank PCL (The) | | | 98,900 | | | | 538,985 | |
Thai Vegetable Oil PCL | | | 292,800 | | | | 200,474 | |
| | | | | | | | |
| | | | | | | 3,983,005 | |
| | |
Turkey 0.6% | | | | | | | | |
Akcansa Cimento AS | | | 58,249 | | | | 374,672 | |
Cimsa Cimento Sanayi VE Ticaret AS | | | 38,787 | | | | 286,875 | |
Koza Anadolu Metal Madencilik Isletmeleri AS* | | | 576,759 | | | | 448,734 | |
Trakya Cam Sanayii AS | | | 478,592 | | | | 628,566 | |
| | | | | | | | |
| | | | | | | 1,738,847 | |
| | |
United Kingdom 12.5% | | | | | | | | |
888 Holdings PLC | | | 178,749 | | | | 366,441 | |
Ashtead Group PLC | | | 62,767 | | | | 1,051,609 | |
AstraZeneca PLC | | | 19,754 | | | | 1,442,991 | |
Aviva PLC | | | 46,093 | | | | 385,532 | |
BP PLC | | | 545,303 | | | | 3,923,386 | |
British American Tobacco PLC | | | 20,344 | | | | 1,153,044 | |
BT Group PLC | | | 384,540 | | | | 2,266,980 | |
See Notes to Financial Statements.
| | | | | | | | |
| Description | | Shares | | | Value (Note 1) | |
COMMON STOCKS (Continued) | | | | | | | | |
| | |
United Kingdom (cont’d.) | | | | | | | | |
Bunzl PLC | | | 5,366 | | | $ | 145,716 | |
Capita PLC | | | 93,959 | | | | 1,651,972 | |
Centamin PLC | | | 869,919 | | | | 712,501 | |
CNH Industrial NV | | | 14,851 | | | | 121,190 | |
Direct Line Insurance Group PLC | | | 23,971 | | | | 106,039 | |
Dixons Carphone PLC | | | 96,924 | | | | 615,443 | |
Ferrexpo PLC | | | 297,530 | | | | 400,518 | |
Fiat Chrysler Automobiles NV* | | | 8,915 | | | | 99,740 | |
GlaxoSmithKline PLC | | | 51,641 | | | | 1,167,803 | |
Highland Gold Mining Ltd. | | | 212,234 | | | | 129,014 | |
HSBC Holdings PLC | | | 259,620 | | | | 2,646,908 | |
Imperial Tobacco Group PLC | | | 15,316 | | | | 665,352 | |
International Consolidated Airlines Group SA* | | | 16,233 | | | | 106,170 | |
Intu Properties PLC, REIT | | | 292,961 | | | | 1,598,159 | |
ITV PLC | | | 660,637 | | | | 2,146,192 | |
J. Sainsbury PLC(b) | | | 275,527 | | | | 1,085,450 | |
Legal & General Group PLC | | | 423,194 | | | | 1,568,472 | |
National Grid PLC | | | 60,597 | | | | 899,253 | |
Next PLC | | | 16,662 | | | | 1,720,123 | |
Persimmon PLC | | | 4,847 | | | | 113,832 | |
Provident Financial PLC | | | 20,745 | | | | 705,459 | |
Prudential PLC | | | 15,399 | | | | 356,578 | |
Reckitt Benckiser Group PLC | | | 10,487 | | | | 883,248 | |
Rio Tinto Ltd. | | | 6,930 | | | | 370,052 | |
Unilever NV, CVA | | | 61,936 | | | | 2,400,541 | |
Unilever PLC | | | 20,954 | | | | 842,881 | |
Vodafone Group PLC | | | 506,679 | | | | 1,684,931 | |
WH Smith PLC | | | 22,658 | | | | 409,083 | |
WM Morrison Supermarkets PLC | | | 33,120 | | | | 82,233 | |
Wolseley PLC | | | 4,188 | | | | 222,717 | |
| | | | | | | | |
| | | | | | | 36,247,553 | |
| | |
United States 0.1% | | | | | | | | |
Catamaran Corp.* | | | 3,300 | | | | 157,233 | |
Transocean Ltd. | | | 5,575 | | | | 166,044 | |
| | | | | | | | |
| | | | | | | 323,277 | |
| | | | | | | | |
TOTAL COMMON STOCKS
(cost $251,730,023) | | | | | | | 280,744,711 | |
| | | | | | | | |
See Notes to Financial Statements.
| | | | |
| Prudential International Equity Fund | | | 23 | |
Portfolio of Investments
as of October 31, 2014 continued
| | | | | | | | |
| Description | | Shares | | | Value (Note 1) | |
EXCHANGE TRADED FUNDS 0.8% | | | | | | | | |
| | |
United States | | | | | | | | |
iShares MSCI EAFE Index Fund(b) | | | 30,300 | | | $ | 1,937,685 | |
iShares MSCI Emerging Markets Index Fund(b) | | | 12,600 | | | | 531,090 | |
| | | | | | | | |
TOTAL EXCHANGE TRADED FUNDS
(cost $2,494,529) | | | | | | | 2,468,775 | |
| | | | | | | | |
| | |
PREFERRED STOCKS 1.9% | | | | | | | | |
| | |
Brazil 1.9% | | | | | | | | |
Banco ABC Brasil SA (PRFC) | | | 40,400 | | | | 224,508 | |
Banco Bradesco SA (PRFC) | | | 33,600 | | | | 506,054 | |
Banco do Estado do Rio Grande do Sul SA (PRFC) | | | 72,500 | | | | 433,028 | |
Cia Energetica de Minas Gerais (PRFC) | | | 207,200 | | | | 1,189,901 | |
Cia Energetica de Sao Paulo (PRFC) | | | 7,700 | | | | 75,916 | |
Itau Unibanco Holding SA (PRFC) | | | 127,600 | | | | 1,892,449 | |
Oi SA (PRFC)* | | | 2,058,000 | | | | 1,079,705 | |
| | | | | | | | |
| | | | | | | 5,401,561 | |
| | |
South Korea | | | | | | | | |
Samsung Electronics Co. Ltd. (PRFC) | | | 131 | | | | 120,921 | |
| | | | | | | | |
TOTAL PREFERRED STOCKS
(cost $6,274,092) | | | | | | | 5,522,482 | |
| | | | | | | | |
TOTAL LONG-TERM INVESTMENTS
(cost $260,498,644) | | | | | | | 288,735,968 | |
| | | | | | | | |
| | |
SHORT-TERM INVESTMENT 2.1% | | | | | | | | |
| | |
AFFILIATED MONEY MARKET MUTUAL FUND | | | | | | | | |
Prudential Investment Portfolios 2 - Prudential Core Taxable Money Market Fund
(cost $6,143,769; includes $5,626,825 of cash collateral for
securities on loan) (Note 3)(c)(d) | | | 6,143,769 | | | | 6,143,769 | |
| | | | | | | | |
TOTAL INVESTMENTS 101.6%
(cost $266,642,413; Note 5) | | | | | | | 294,879,737 | |
Liabilities in excess of other assets (1.6)% | | | | | | | (4,754,979 | ) |
| | | | | | | | |
NET ASSETS 100.0% | | | | | | $ | 290,124,758 | |
| | | | | | | | |
See Notes to Financial Statements.
The following abbreviations are used in the portfolio descriptions:
RegS—Regulation S. Security was purchased pursuant to Regulation S and may not be offered, sold or delivered within the United States or to, or for the account or benefit of, U.S. persons, except pursuant to an exemption from, or in a transaction not subject to, the registration requirements of the Securities Act of 1933.
ADR—American Depositary Receipt
CVA—Certificate Van Aandelen (Bearer)
EAFE—Europe, Australasia and Far East
GDR—Global Depositary Receipt
MSCI—Morgan Stanley Capital International
PRFC—Preference Shares
REIT—Real Estate Investment Trust
| * | Non-income producing security. |
| (a) | Indicates a security or securities that has been deemed illiquid. |
| (b) | All or a portion of security is on loan. The aggregate market value of such securities, including those sold and pending settlement, is $5,476,953; cash collateral of $5,626,825 (included in liabilities) was received with which the Series purchased highly liquid short-term investments. Securities on loan are subject to contractual netting arrangements. |
| (c) | Prudential Investments LLC, the manager of the Series, also serves as manager of the Prudential Investment Portfolios 2 - Prudential Core Taxable Money Market Fund. |
| (d) | Represents security, or a portion thereof, purchased with cash collateral received for securities on loan. |
Various inputs are used in determining the value of the Series’ investments. These inputs are summarized in the three broad levels listed below.
Level 1—quoted prices generally in active markets for identical securities.
Level 2—quoted prices for similar securities, interest rates and yield curves, prepayment speeds, foreign currency exchange rates, and other significant observable inputs.
Level 3—significant unobservable inputs for securities valued in accordance with Board approved fair valuation procedures.
The following is a summary of the inputs used as of October 31, 2014 in valuing such portfolio securities:
| | | | | | | | | | | | |
| | | Level 1 | | | Level 2 | | | Level 3 | |
Investments in Securities | | | | | | | | | | | | |
Common Stocks | | | | | | | | | | | | |
Australia | | $ | — | | | $ | 12,965,682 | | | $ | — | |
Austria | | | — | | | | 692,857 | | | | — | |
See Notes to Financial Statements.
| | | | |
| Prudential International Equity Fund | | | 25 | |
Portfolio of Investments
as of October 31, 2014 continued
| | | | | | | | | | | | |
| | | Level 1 | | | Level 2 | | | Level 3 | |
Common Stocks (continued) | | | | | | | | | | | | |
Belgium | | $ | — | | | $ | 1,411,019 | | | $ | — | |
Brazil | | | 2,948,572 | | | | — | | | | — | |
Canada | | | 24,211,539 | | | | — | | | | — | |
Chile | | | 261,557 | | | | — | | | | — | |
China | | | 1,102,192 | | | | 13,351,665 | | | | 695,859 | |
Czech Republic | | | — | | | | 82,516 | | | | — | |
Denmark | | | — | | | | 5,614,028 | | | | — | |
Finland | | | — | | | | 3,042,017 | | | | — | |
France | | | — | | | | 16,262,124 | | | | — | |
Germany | | | 104,896 | | | | 14,793,084 | | | | — | |
Hong Kong | | | 242,997 | | | | 4,990,506 | | | | — | |
Hungary | | | — | | | | 303,252 | | | | — | |
India | | | 1,709,543 | | | | — | | | | — | |
Indonesia | | | — | | | | 597,066 | | | | — | |
Ireland | | | — | | | | 918,283 | | | | — | |
Israel | | | — | | | | 4,014,767 | | | | — | |
Italy | | | — | | | | 1,946,295 | | | | — | |
Japan | | | — | | | | 45,965,595 | | | | — | |
Malaysia | | | 89,051 | | | | 835,032 | | | | — | |
Mexico | | | 1,992,866 | | | | — | | | | — | |
Netherlands | | | — | | | | 5,891,531 | | | | — | |
New Zealand | | | 410,479 | | | | 787,477 | | | | — | |
Norway | | | — | | | | 4,387,792 | | | | — | |
Philippines | | | — | | | | 73,607 | | | | — | |
Poland | | | — | | | | 3,130,795 | | | | — | |
Portugal | | | — | | | | 1,719,713 | | | | — | |
Russia | | | 2,686,365 | | | | — | | | | — | |
Singapore | | | — | | | | 3,741,334 | | | | — | |
South Africa | | | — | | | | 7,674,623 | | | | — | |
South Korea | | | — | | | | 5,885,532 | | | | — | |
Spain | | | — | | | | 6,823,960 | | | | — | |
Sweden | | | 116,639 | | | | 8,077,174 | | | | — | |
Switzerland | | | 127,779 | | | | 15,300,186 | | | | — | |
Taiwan | | | — | | | | 10,472,183 | | | | — | |
Thailand | | | — | | | | 3,983,005 | | | | — | |
Turkey | | | — | | | | 1,738,847 | | | | — | |
United Kingdom | | | 1,242,033 | | | | 35,005,520 | | | | — | |
United States | | | 157,233 | | | | 166,044 | | | | — | |
Exchange Traded Funds | | | | | | | | | | | | |
United States | | | 2,468,775 | | | | — | | | | — | |
See Notes to Financial Statements.
| | | | | | | | | | | | |
| | | Level 1 | | | Level 2 | | | Level 3 | |
Preferred Stocks | | | | | | | | | | | | |
Brazil | | $ | 5,401,561 | | | $ | — | | | $ | — | |
South Korea | | | — | | | | 120,921 | | | | — | |
Affiliated Money Market Mutual Fund | | | 6,143,769 | | | | — | | | | — | |
| | | | | | | | | | | | |
Total | | $ | 51,417,846 | | | $ | 242,766,032 | | | $ | 695,859 | |
| | | | | | | | | | | | |
The industry classification of investments and liabilities in excess of other assets shown as a percentage of net assets as of October 31, 2014 was as follows (Unaudited):
| | | | |
Banks | | | 15.2 | % |
Oil, Gas & Consumable Fuels | | | 8.7 | |
Pharmaceuticals | | | 7.3 | |
Insurance | | | 5.1 | |
Metals & Mining | | | 5.1 | |
Food Products | | | 4.6 | |
Diversified Telecommunication Services | | | 4.2 | |
Automobiles | | | 3.9 | |
Electric Utilities | | | 2.4 | |
Real Estate Investment Trusts (REITs) | | | 2.2 | |
Food & Staples Retailing | | | 2.1 | |
Household Durables | | | 2.1 | |
Technology Hardware, Storage & Peripherals | | | 2.1 | |
Affiliated Money Market Mutual Fund (including 1.9% of collateral for securities on loan) | | | 2.1 | |
Chemicals | | | 2.0 | |
Electronic Equipment, Instruments & Components | | | 1.9 | |
Trading Companies & Distributors | | | 1.9 | |
IT Services | | | 1.7 | |
Auto Components | | | 1.6 | |
Diversified Financial Services | | | 1.6 | |
Wireless Telecommunication Services | | | 1.6 | |
Real Estate Management & Development | | | 1.5 | |
Tobacco | | | 1.3 | |
Construction & Engineering | | | 1.2 | |
Machinery | | | 1.2 | |
Semiconductors & Semiconductor Equipment | | | 1.1 | |
Marine | | | 1.1 | |
Electrical Equipment | | | 1.0 | |
Independent Power & Renewable Electricity Producers | | | 0.9 | |
Household Products | | | 0.9 | % |
Media | | | 0.9 | |
Building Products | | | 0.9 | |
Exchange Traded Funds | | | 0.8 | |
Road & Rail | | | 0.8 | |
Biotechnology | | | 0.8 | |
Professional Services | | | 0.8 | |
Specialty Retail | | | 0.7 | |
Textiles, Apparel & Luxury Goods | | | 0.7 | |
Multiline Retail | | | 0.6 | |
Industrial Conglomerates | | | 0.6 | |
Beverages | | | 0.5 | |
Construction Materials | | | 0.4 | |
Air Freight & Logistics | | | 0.4 | |
Thrifts & Mortgage Finance | | | 0.4 | |
Consumer Finance | | | 0.4 | |
Internet Software & Services | | | 0.3 | |
Multi-Utilities | | | 0.3 | |
Airlines | | | 0.3 | |
Transportation Infrastructure | | | 0.3 | |
Health Care Providers & Services | | | 0.2 | |
Hotels, Restaurants & Leisure | | | 0.2 | |
Communications Equipment | | | 0.2 | |
Aerospace & Defense | | | 0.1 | |
Containers & Packaging | | | 0.1 | |
Leisure Products | | | 0.1 | |
Gas Utilities | | | 0.1 | |
Energy Equipment & Services | | | 0.1 | |
| | | | |
| | | 101.6 | |
Liabilities in excess of other assets | | | (1.6 | ) |
| | | | |
| | | 100.0 | % |
| | | | |
See Notes to Financial Statements.
| | | | |
| Prudential International Equity Fund | | | 27 | |
Portfolio of Investments
as of October 31, 2014 continued
The Series invested in derivative instruments during the reporting period. The primary type of risk associated with these derivative instruments is equity risk. The effect of such derivative instruments on the Series’ financial position and financial performance as reflected in the Statement of Assets and Liabilities and Statement of Operations is presented in the summary below.
At October 31, 2014, the Series did not have any derivative instruments in the Statement of Assets and Liabilities.
The effects of derivative instruments on the Statement of Operations for the year ended October 31, 2014 are as follows:
| | | | | | | | | | | | |
Amount of Realized Gain or (Loss) on Derivatives Recognized in Income | |
Derivatives not accounted for as hedging
instruments, carried at fair value | | Futures | | | Rights* | | | Total | |
Equity contracts | | $ | 38,288 | | | $ | 1,737 | | | $ | 40,025 | |
| | | | | | | | | | | | |
| * | Included in net realized gain (loss) on investment transactions in the Statement of Operations. |
| | | | | | | | | | | | |
|
Change in Unrealized Appreciation or (Depreciation) on Derivatives Recognized in Income | |
Derivatives not accounted for as hedging
instruments, carried at fair value | | Futures | | | Rights** | | | Total | |
Equity contracts | | $ | (40,773 | ) | | $ | (790 | ) | | $ | (41,563 | ) |
| | | | | | | | | | | | |
| ** | Included in net change in unrealized appreciation (depreciation) on investments in the Statement of Operations. |
For the year ended October 31, 2014, the average value at trade date for futures long positions was $518,767.
See Notes to Financial Statements.
PRUDENTIAL INVESTMENTS»MUTUAL FUNDS
FINANCIAL STATEMENTS
ANNUAL REPORT · OCTOBER 31, 2014
Prudential International Equity Fund
Statement of Assets & Liabilities
as of October 31, 2014
| | | | |
Assets | | | | |
Investments at value, including securities on loan of $5,476,953: | | | | |
Unaffiliated investments (cost $260,498,644) | | $ | 288,735,968 | |
Affiliated investments (cost $6,143,769) | | | 6,143,769 | |
Cash | | | 139 | |
Foreign currency, at value (cost $306,169) | | | 304,159 | |
Tax reclaim receivable | | | 722,752 | |
Dividends receivable | | | 628,515 | |
Receivable for Series shares sold | | | 19,852 | |
Prepaid expenses | | | 3,090 | |
| | | | |
Total assets | | | 296,558,244 | |
| | | | |
| |
Liabilities | | | | |
Payable to broker for collateral for securities on loan (Note 3) | | | 5,626,825 | |
Accrued expenses | | | 313,981 | |
Management fee payable | | | 205,889 | |
Payable for Series shares reacquired | | | 148,704 | |
Distribution fee payable | | | 73,885 | |
Affiliated transfer agent fee payable | | | 64,169 | |
Loan interest payable (Note 7) | | | 33 | |
| | | | |
Total liabilities | | | 6,433,486 | |
| | | | |
| |
Net Assets | | $ | 290,124,758 | |
| | | | |
| | | | | |
Net assets were comprised of: | | | | |
Common stock, at par | | $ | 394,926 | |
Paid-in capital in excess of par | | | 446,398,522 | |
| | | | |
| | | 446,793,448 | |
Undistributed net investment income | | | 5,479,387 | |
Accumulated net realized loss on investment and foreign currency transactions | | | (190,311,284 | ) |
Net unrealized appreciation on investments and foreign currencies | | | 28,163,207 | |
| | | | |
Net assets, October 31, 2014 | | $ | 290,124,758 | |
| | | | |
See Notes to Financial Statements.
| | | | |
Class A | | | | |
Net asset value and redemption price per share
($218,908,710 ÷ 29,734,998 shares of common stock issued and outstanding) | | $ | 7.36 | |
Maximum sales charge (5.50% of offering price) | | | 0.43 | |
| | | | |
Maximum offering price to public | | $ | 7.79 | |
| | | | |
| |
Class B | | | | |
Net asset value, offering price and redemption price per share
($5,005,806 ÷ 709,679 shares of common stock issued and outstanding) | | $ | 7.05 | |
| | | | |
| |
Class C | | | | |
Net asset value, offering price and redemption price per share
($18,146,311 ÷ 2,573,494 shares of common stock issued and outstanding) | | $ | 7.05 | |
| | | | |
| |
Class Z | | | | |
Net asset value, offering price and redemption price per share
($48,063,931 ÷ 6,474,416 shares of common stock issued and outstanding) | | $ | 7.42 | |
| | | | |
See Notes to Financial Statements.
| | | | |
| Prudential International Equity Fund | | | 31 | |
Statement of Operations
Year Ended October 31, 2014
| | | | |
Net Investment Income | | | | |
Income | | | | |
Unaffiliated dividend income (net of foreign withholding taxes of $1,016,162) | | $ | 11,113,056 | |
Affiliated income from securities loaned, net | | | 12,494 | |
Interest income | | | 5,155 | |
Affiliated dividend income | | | 1,188 | |
| | | | |
Total income | | | 11,131,893 | |
| | | | |
| |
Expenses | | | | |
Management fee | | | 2,634,549 | |
Distribution fee—Class A | | | 696,147 | |
Distribution fee—Class B | | | 58,680 | |
Distribution fee—Class C | | | 194,023 | |
Distribution fee—Class F | | | 201 | |
Distribution fee—Class X | | | 462 | |
Transfer agent’s fees and expenses (including affiliated expense of $267,000) | | | 786,000 | |
Custodian’s fees and expenses | | | 321,000 | |
Registration fees | | | 73,000 | |
Shareholders’ reports | | | 72,000 | |
Audit fee | | | 30,000 | |
Legal fees and expenses | | | 21,000 | |
Directors’ fees | | | 20,000 | |
Insurance expenses | | | 4,000 | |
Interest expense | | | 3,836 | |
Miscellaneous | | | 69,752 | |
| | | | |
Total expenses | | | 4,984,650 | |
| | | | |
Net investment income | | | 6,147,243 | |
| | | | |
| |
Realized And Unrealized Gain (Loss) On Investment And Foreign Currency Transactions | | | | |
Net realized gain (loss) on: | | | | |
Investment transactions | | | 36,718,994 | |
Futures transactions | | | 38,288 | |
Foreign currency transactions | | | (79,175 | ) |
| | | | |
| | | 36,678,107 | |
| | | | |
Net change in unrealized appreciation (depreciation) on: | | | | |
Investments | | | (37,049,482 | ) |
Futures | | | (40,773 | ) |
Foreign currencies | | | (129,304 | ) |
| | | | |
| | | (37,219,559 | ) |
| | | | |
Net loss on investment and foreign currency transactions | | | (541,452 | ) |
| | | | |
Net Increase In Net Assets Resulting From Operations | | $ | 5,605,791 | |
| | | | |
See Notes to Financial Statements.
Statement of Changes in Net Assets
| | | | | | | | |
| | | Year Ended October 31, | |
| | | 2014 | | | 2013 | |
Increase (Decrease) In Net Assets | | | | | | | | |
Operations | | | | | | | | |
Net investment income | | $ | 6,147,243 | | | $ | 5,659,124 | |
Net realized gain on investment and foreign currency transactions | | | 36,678,107 | | | | 32,547,864 | |
Net change in unrealized appreciation (depreciation) on investments and foreign currencies | | | (37,219,559 | ) | | | 30,209,826 | |
| | | | | | | | |
Net increase in net assets resulting from operations | | | 5,605,791 | | | | 68,416,814 | |
| | | | | | | | |
| | |
Dividends from net investment income (Note 1) | | | | | | | | |
Class A | | | (4,392,794 | ) | | | (4,559,841 | ) |
Class B | | | (82,095 | ) | | | (87,134 | ) |
Class C | | | (258,429 | ) | | | (283,431 | ) |
Class F | | | (2,101 | ) | | | (10,934 | ) |
Class X | | | (2,191 | ) | | | (9,832 | ) |
Class Z | | | (1,570,284 | ) | | | (1,229,773 | ) |
| | | | | | | | |
| | | (6,307,894 | ) | | | (6,180,945 | ) |
| | | | | | | | |
| | |
Series share transactions (Net of share conversions) (Note 6) | | | | | | | | |
Net proceeds from shares sold | | | 17,501,842 | | | | 24,830,694 | |
Net asset value of shares issued in reinvestment of dividends | | | 6,176,619 | | | | 6,043,937 | |
Cost of shares reacquired | | | (65,161,727 | ) | | | (45,385,832 | ) |
| | | | | | | | |
Net decrease in net assets from Series share transactions | | | (41,483,266 | ) | | | (14,511,201 | ) |
| | | | | | | | |
Total increase (decrease) | | | (42,185,369 | ) | | | 47,724,668 | |
| | |
Net Assets: | | | | | | | | |
Beginning of year | | | 332,310,127 | | | | 284,585,459 | |
| | | | | | | | |
End of year(a) | | $ | 290,124,758 | | | $ | 332,310,127 | |
| | | | | | | | |
(a) Includes undistributed net investment income of: | | $ | 5,479,387 | | | $ | 4,690,335 | |
| | | | | | | | |
See Notes to Financial Statements.
| | | | |
| Prudential International Equity Fund | | | 33 | |
Notes to Financial Statements
Prudential World Fund, Inc. (the “Fund”) is an open-end management investment company, registered under the Investment Company Act of 1940, as amended, (“1940 Act”) and currently consists of seven series: Prudential International Equity Fund (the “Series”), Prudential Jennison Global Infrastructure Fund, Prudential International Value Fund, Prudential Jennison Global Opportunities Fund, Prudential Jennison International Opportunities Fund, Prudential Jennison Emerging Markets Equity Fund and Prudential Emerging Markets Debt Local Currency Fund. These financial statements relate to the Prudential International Equity Fund. The financial statements of the other series are not presented herein. The investment objective of the Series is to seek long-term growth of capital.
Note 1. Accounting Policies
The following accounting policies conform to U.S. generally accepted accounting principles. The Fund and the Series consistently follow such policies in the preparation of their financial statements.
Securities Valuation: The Series holds securities and other assets that are fair valued at the close of each day the New York Stock Exchange (“NYSE”) is open for trading. Fair value is the price that would be received to sell an asset or paid to transfer a liability in an orderly transaction between market participants on the measurement date. The Board of Directors (the “Board”) has adopted Valuation Procedures for security valuation under which fair valuation responsibilities have been delegated to Prudential Investments LLC (“PI” or “Manager”). Under the current Valuation Procedures, the established Valuation Committee is responsible for supervising the valuation of portfolio securities and other assets. The Valuation Procedures permit the Series to utilize independent pricing vendor services, quotations from market makers, and alternative valuation methods when market quotations are either not readily available or not deemed representative of fair value. A record of the Valuation Committee’s actions is subject to the Board’s review, approval, and ratification at its next regularly-scheduled quarterly meeting.
Various inputs determine how the Series’ investments are valued, all of which are categorized according to the three broad levels (Level 1, 2, or 3) detailed in the table following the Portfolio of Investments.
Common and preferred stocks, exchange-traded funds, and derivative instruments such as futures or options that are traded on a national securities exchange are valued
at the last sale price as of the close of trading on the applicable exchange. Securities traded via NASDAQ are valued at the NASDAQ official closing price. To the extent these securities are valued at the last sale price or NASDAQ official closing price, they are classified as Level 1 in the fair value hierarchy.
In the event that no sale or official closing price on valuation date exists, these securities are generally valued at the mean between the last reported bid and asked prices, or at the last bid price in the absence of an asked price. These securities are classified as Level 2 in the fair value hierarchy, as the inputs are observable and considered to be significant to the valuation.
Common and preferred stocks traded on foreign securities exchanges are valued using pricing vendor services that provide model prices derived using adjustment factors based on information such as local closing price, relevant general and sector indices, currency fluctuations, depositary receipts, and futures, as applicable. Securities valued using such model prices are classified as Level 2 in the fair value hierarchy, as the adjustment factors are observable and considered to be significant to the valuation. Securities not valued using such model prices are valued in accordance with exchange-traded common and preferred stocks discussed above.
Investments in open-end, non-exchange-traded mutual funds are valued at their net asset values as of the close of the NYSE on the date of valuation. These securities are classified as Level 1 in the fair value hierarchy since they may be purchased or sold at their net asset values on the date of valuation.
Fixed income securities traded in the over-the-counter market are generally valued at prices provided by approved independent pricing vendors. The pricing vendors provide these prices after evaluating observable inputs including, but not limited to yield curves, yield spreads, credit ratings, deal terms, tranche level attributes, default rates, cash flows, prepayment speeds, broker/dealer quotations, and reported trades. Securities valued using such vendor prices are classified as Level 2 in the fair value hierarchy.
Over-the-counter derivative instruments are generally valued using pricing vendor services, which derive the valuation based on inputs such as underlying asset prices, indices, spreads, interest rates, and exchange rates. These instruments are categorized as Level 2 in the fair value hierarchy.
Centrally cleared swaps listed or traded on a multilateral or trade facility platform, such as a registered exchange, are valued at the daily settlement price determined by the respective exchange. These securities are classified as Level 2 in the fair value hierarchy, as the prices marked at the official settle are not public.
| | | | |
| Prudential International Equity Fund | | | 35 | |
Notes to Financial Statements
continued
Securities and other assets that cannot be priced according to the methods described above are valued based on pricing methodologies approved by the Board. In the event that significant unobservable inputs are used when determining such valuations, the securities will be classified as Level 3 in the fair value hierarchy.
When determining the fair value of securities, some of the factors influencing the valuation include: the nature of any restrictions on disposition of the securities; assessment of the general liquidity of the securities; the issuer’s financial condition and the markets in which it does business; the cost of the investment; the size of the holding and the capitalization of the issuer; the prices of any recent transactions or bids/offers for such securities or any comparable securities; any available analyst media or other reports or information deemed reliable by the investment adviser regarding the issuer or the markets or industry in which it operates. Using fair value to price securities may result in a value that is different from a security’s most recent closing price and from the price used by other mutual funds to calculate their net asset values.
Foreign Currency Translation: The books and records of the Series are maintained in U.S. dollars. Foreign currency amounts are translated into U.S. dollars on the following basis:
(i) market value of investment securities, other assets and liabilities—at the current rates of exchange.
(ii) purchases and sales of investment securities, income and expenses—at the rates of exchange prevailing on the respective dates of such transactions.
Although the net assets of the Series are presented at the foreign exchange rates and market values at the close of the period, the Series does not isolate that portion of the results of operations arising as a result of changes in the foreign exchange rates from the fluctuations arising from changes in the market prices of long-term portfolio securities held at the end of the period. Similarly, the Series does not isolate the effect of changes in foreign exchange rates from the fluctuations arising from changes in the market prices of long-term portfolio securities sold during the period. Accordingly, these realized foreign currency gains or losses are included in the reported net realized gains or losses on investment transactions.
Net realized gains or losses on foreign currency transactions represent net foreign exchange gains or losses from holdings of foreign currencies, forward currency
contracts, disposition of foreign currencies, currency gains or losses realized between the trade and settlement dates on security transactions, and the difference between the amounts of interest, dividends and foreign withholding taxes recorded on the Series’ books and the U.S. dollar equivalent amounts actually received or paid. Net unrealized currency gains or losses from valuing foreign currency denominated assets and liabilities (other than investments) at period end exchange rates are reflected as a component of net unrealized appreciation (depreciation) on foreign currencies.
Concentration of Risk: The ability of debt securities issuers (other than those issued or guaranteed by the U.S. Government) held by the Fund to meet its obligations may be affected by the economic or political developments in a specific industry, region or country. Foreign security and currency transactions may involve certain considerations and risks not typically associated with those of U.S. companies as a result of, among other factors, the possibility of political and economic instability or the level of governmental supervision and regulation of foreign securities markets.
Financial Futures Contracts: A financial futures contract is an agreement to purchase (long) or sell (short) an agreed amount of securities at a set price for delivery on a future date. Upon entering into a financial futures contract, the Series is required to pledge to the broker an amount of cash and/or other assets equal to a certain percentage of the contract amount. This amount is known as the “initial margin.” Subsequent payments, known as “variation margin,” are made or received by the Series each day, depending on the daily fluctuations in the value of the underlying security. Such variation margin is recorded for financial statement purposes on a daily basis as unrealized gain (loss). When the contract expires or is closed, the gain (loss) is realized and is presented in the Statement of Operations as net realized gain (loss) on financial futures transactions.
The Series invested in financial futures contracts in order to hedge its existing portfolio securities, or securities the Series intends to purchase, against fluctuations in value caused by changes in prevailing interest rates or foreign currency exchange rates. Should interest rates move unexpectedly, the Series may not achieve the anticipated benefits of the financial futures contracts and may realize a loss. The use of futures transactions involves the risk of imperfect correlation in movements in the price of futures contracts, interest rates and the underlying hedged assets. With exchange-traded futures contracts, there is minimal counterparty credit risk to the Series since the exchanges’ clearing house acts as counterparty to all exchange-traded futures and guarantees the futures contracts against default.
Master Netting Arrangements: The Series is subject to various Master Agreements, or netting arrangements, with select counterparties. A master netting arrangement
| | | | |
| Prudential International Equity Fund | | | 37 | |
Notes to Financial Statements
continued
between the Series and the counterparty permits the Series to offset amounts payable by the Series to the same counterparty against amounts to be received; and by the receipt of collateral from the counterparty by the Series to cover the Series’ exposure to the counterparty. However, there is no assurance that such mitigating factors are easily enforceable. The right to set-off exists when all the conditions are met such that each of the parties owes the other determinable amounts, the reporting party has the right to set-off the amount owed with the amount owed by the other party, the reporting party intends to set-off and the right of set-off is enforceable by law. During the reporting period, there were no instances where the right of set-off existed and management has not elected to offset.
REITs: The Series invests in real estate investment trusts (“REITs”), which report information on the source of their distributors annually. Based on current and historical information, a portion of distributions received from REITs during the period is estimated to be dividend income, capital gain or return of capital and recorded accordingly. These estimates are adjusted periodically when the actual source of distributions is disclosed by the REITs.
Securities Lending: The Series may lend its portfolio securities to banks and broker-dealers. The loans are secured by collateral at least equal to the market value of the securities loaned. Collateral pledged by each borrower is invested in a highly liquid short-term money market fund and is marked to market daily, based on the previous day’s market value, such that the value of the collateral exceeds the value of the loaned securities. Loans are subject to termination at the option of the borrower or the Series. Upon termination of the loan, the borrower will return to the Series securities identical to the loaned securities. Should the borrower of the securities fail financially, the Series has the right to repurchase the securities in the open market using the collateral. The Series recognizes income, net of any rebate and securities lending agent fees, for lending its securities, and any interest on the investment of cash received as collateral. The Series also continues to receive interest and dividends or amounts equivalent thereto, on the securities loaned and recognizes any unrealized gain or loss in the market price of the securities loaned that may occur during the term of the loan.
Warrants and Rights: The Series may hold warrants and rights acquired either through a direct purchase, included as part of a private placement, or pursuant to corporate actions. Warrants and rights entitle the holder to buy a proportionate amount of
common stock, or such other security that the issuer may specify, at a specific price and time through the expiration dates. The Series holds such warrants and rights as long positions until exercised, sold or expired. Warrants and rights are valued at fair value in accordance with the Board of Directors’ approved fair valuation procedures.
Securities Transactions and Net Investment Income: Securities transactions are recorded on the trade date. Realized gains or losses from investment and currency transactions are calculated on the identified cost basis. Dividend income is recorded on the ex-dividend date. Interest income, including amortization of premium and accretion of discount on debt securities, as required, is recorded on an accrual basis. Expenses are recorded on an accrual basis, which may require the use of certain estimates by management that may differ from actual.
Net investment income or loss (other than distribution fees, which are charged directly to the respective class) and unrealized and realized gains or losses are allocated daily to each class of shares based upon the relative proportion of adjusted net assets of each class at the beginning of the day.
Dividends and Distributions: The Series expects to pay dividends from net investment income and distributions from net realized capital gains, if any, at least annually. Dividends and distributions to shareholders, which are determined in accordance with federal income tax regulations and which may differ from generally accepted accounting principles, are recorded on the ex-dividend date. Permanent book/tax differences relating to income and gains are reclassified amongst undistributed net investment income, accumulated net realized gain or loss and paid-in capital in excess of par, as appropriate.
Taxes: For federal income tax purposes, the Series is treated as a separate taxpaying entity. It is the Series’ policy to continue to meet the requirements of the Internal Revenue Code applicable to regulated investment companies and to distribute all of its taxable net income and capital gains, if any, to its shareholders. Therefore, no federal income tax provision is required. Withholding taxes on foreign dividends are recorded, net of reclaimable amounts, at the time the related income is earned.
Estimates: The preparation of the financial statements requires management to make estimates and assumptions that affect the reported amounts and disclosures in the financial statements. Actual results could differ from those estimates.
| | | | |
| Prudential International Equity Fund | | | 39 | |
Notes to Financial Statements
continued
Note 2. Agreements
The Fund has a management agreement for the Series with PI. Pursuant to this agreement, PI has responsibility for all investment advisory services and supervises the subadvisor’s performance of such services. PI entered into a subadvisory agreement with Quantitative Management Associates LLC (“QMA”). The subadvisory agreement provides that QMA furnishes investment advisory services in connection with the management of the Series. In connection therewith, QMA is obligated to keep certain books and records of the Series. PI pays for the services of QMA, the cost of compensation of officers of the Series, occupancy and certain clerical and bookkeeping costs of the Series. The Series bears all other costs and expenses.
The management fee paid to PI is computed daily and payable monthly, at an annual rate of .85% of the average daily net assets of the Series up to and including $300 million, .75% of the average daily net assets in excess of $300 million up to and including $1.5 billion and .70% of the Series’ average daily net assets over $1.5 billion. The effective management fee was ..85% for the year ended October 31, 2014.
The Series has distribution agreements with Prudential Investment Management Services LLC (“PIMS”) and Prudential Annuities Distributors, Inc. (“PAD”). PIMS and PAD are both affiliates of PI and indirect, wholly-owned subsidiaries of Prudential. PIMS serves as the distributor of the Series’ Class A, Class B, Class C, Class F, and Class Z shares. PIMS, together with PAD, serves as co-distributor of the Series’ Class X shares.
The Series has adopted a separate Distribution and Service plan (each a “Plan” and collectively the “Plans”) for the Class A, Class B, Class C, Class F and Class X shares of the Series in accordance with Rule 12b-1 of the 1940 Act. No distribution or service fees are paid to PIMS as distributor for the Series’ Class Z shares. Under the Plans, the Series compensates PIMS and PAD a distribution and service fee at the annual rate of .30%, 1%, 1%, .75% and 1% of the average daily net assets of the Class A, B, C, F and X shares, respectively.
PIMS has advised the Series that they received $96,496 in front-end sales charges resulting from sales of Class A shares during the year ended October 31, 2014. From these fees, PIMS paid such sales charges to broker-dealers, which in turn paid commissions to salespersons and incurred other distribution costs.
PIMS has advised the Series that for the year ended October 31, 2014 it received $1,407, $8,344, $1,155, and $49 in contingent deferred sales charges imposed upon redemptions by certain Class A, Class B, Class C and Class F shareholders, respectively.
PI, QMA, PAD and PIMS are indirect, wholly-owned subsidiaries of Prudential Financial, Inc. (“Prudential”).
Note 3. Other Transactions with Affiliates
Prudential Mutual Fund Services LLC (“PMFS”), an affiliate of PI and an indirect, wholly-owned subsidiary of Prudential, serves as the Series’ transfer agent. Transfer agent’s fees and expenses in the Statement of Operations include certain out-of-pocket expenses paid to non-affiliates, where applicable.
Prudential Investment Management, Inc. (“PIM”), an indirect, wholly-owned subsidiary of Prudential, is the Series’ security lending agent. For the year ended October 31, 2014, PIM has been compensated approximately $4,000 for these services.
The Series invests in the Prudential Core Taxable Money Market Fund (the “Core Fund”), a series of the Prudential Investment Portfolios 2, registered under the 1940 Act and managed by PI. Earnings from the Core Fund are disclosed on the Statement of Operations as affiliated dividend income.
Note 4. Portfolio Securities
Purchases and sales of portfolio securities, other than short-term investments, for the year ended October 31, 2014 aggregated $415,745,542 and $457,522,297, respectively.
Note 5. Distributions and Tax Information
Distributions to shareholders, which are determined in accordance with federal income tax regulations and which may differ from generally accepted accounting principles, are recorded on the ex-dividend date. In order to present undistributed net investment income, accumulated net realized loss on investment and foreign currency transactions and paid-in capital in excess of par on the Statement of Assets and Liabilities that more closely represent their tax character, certain adjustments have been made to undistributed net investment income and accumulated net realized loss on investment and foreign currency transactions. For the fiscal year ended October 31, 2014, the adjustments were to increase undistributed net investment income and to increase accumulated net realized loss on investment and
| | | | |
| Prudential International Equity Fund | | | 41 | |
Notes to Financial Statements
continued
foreign currency transactions by $949,703, due to the differences in the treatment for book and tax purposes of certain transactions involving foreign securities and currencies and investments in passive foreign investment companies. Net investment income, net realized gain (loss) on investment and foreign currency transactions and net assets were not affected by this change.
For the years ended October 31, 2014 and October 31, 2013, the tax character of dividends paid by the Fund were $6,307,894 and $6,180,945 of ordinary income, respectively.
As of October 31, 2014, the Series had undistributed ordinary income of $6,345,611 on a tax basis.
The United States federal income tax basis of the Series’ investments and the net unrealized appreciation as of October 31, 2014 were as follows:
| | | | | | | | | | |
Tax Basis | | Appreciation | | Depreciation | | Net
Unrealized
Appreciation | | Other Cost
Basis
Adjustments | | Total Net
Unrealized
Appreciation |
| $269,156,745 | | $36,085,103 | | $(10,362,111) | | $25,722,992 | | $(74,116) | | $25,648,876 |
The differences between book basis and tax basis were primarily attributable to deferred losses on wash sales and investments in passive foreign investment companies. The other cost basis adjustments are primarily attributable to appreciation (depreciation) of foreign currency and mark-to-market of receivables and payables.
Under the Regulated Investment Company Modernization Act of 2010 (the “Act”), the Series is permitted to carryforward capital losses realized on or after November 1, 2011 (“post-enactment losses”) for an unlimited period. Post-enactment losses are required to be utilized before the utilization of losses incurred prior to the effective date of the Act. As a result of this ordering rule, capital loss carryforwards related to taxable years ending before October 31, 2012 (“pre-enactment losses”) may have an increased likelihood to expire unused. The Series utilized approximately $34,677,000 of its capital loss carryforward to offset net taxable gains realized in the fiscal year ended October 31, 2014. No capital gains distributions are expected to be paid to
shareholders until net gains have been realized in excess of such losses. As of October 31, 2014, the pre and post-enactment losses were approximately:
| | | | |
Post-Enactment Losses: | | $ | 0 | |
| | | | |
Pre-Enactment Losses: | | | | |
Expiring 2017 | | $ | 180,326,000 | |
Expiring 2018 | | | 8,337,000 | |
| | | | |
| | $ | 188,663,000 | |
| | | | |
Management has analyzed the Series’ tax positions taken on federal income tax returns for all open tax years and has concluded that no provision for income tax is required in the Series’ financial statements for the current reporting period. The Series’ federal and state income and federal excise tax returns for tax years for which the applicable statutes of limitations have not expired are subject to examination by the Internal Revenue Service and state departments of revenue.
Note 6. Capital
The Series offers Class A, B, C, and Z shares. Class A shares are sold with a front-end sales charge of up to 5.50%. All investors who purchase Class A shares in an amount of $1 million or more and sell these shares within 12 months of purchase are subject to a contingent deferred sales charge (“CDSC”) of 1%. The Class A CDSC is waived for purchases by certain retirement and/or benefit plans. Class B shares are sold with a CDSC which declines from 5% to zero depending on the period of time the shares are held. Class B shares will automatically convert to Class A shares on a quarterly basis approximately seven years after purchase. Class B Shares are closed to new purchases. Class C shares are sold with a CDSC of 1% on shares redeemed within the first 12 months after purchase. The last conversion of Class F and Class X shares to Class A shares was completed as of March 14, 2014 and April 11, 2014, respectively. There are no Class F and Class X shares outstanding and Class F and Class X shares are no longer being offered for sale. A special exchange privilege is also available for shareholders who qualify to purchase Class A shares at net asset value. Class Z shares are not subject to any sales or redemption charge and are offered exclusively for sale to a limited group of investors.
Under certain circumstances, an exchange may be made from specified share classes of the Series to one or more other share classes of the Series as presented in the table of transactions in shares of common stock.
| | | | |
| Prudential International Equity Fund | | | 43 | |
Notes to Financial Statements
continued
There are 875 million authorized shares of common stock at $.01 par value per share, designated Class A, Class B, Class C and Class Z, each of which consists of 325 million, 150 million, 150 million and 250 million authorized shares, respectively.
Transactions in shares of common stock were as follows:
| | | | | | | | |
Class A | | Shares | | | Amount | |
Year ended October 31, 2014: | | | | | | | | |
Shares sold | | | 997,836 | | | $ | 7,437,126 | |
Shares issued in reinvestment of dividends and distributions | | | 606,075 | | | | 4,278,811 | |
Shares reacquired | | | (3,845,795 | ) | | | (28,680,565 | ) |
| | | | | | | | |
Net increase (decrease) in shares outstanding before conversion | | | (2,241,884 | ) | | | (16,964,628 | ) |
Shares issued upon conversion from Class B, Class F, Class X and Class Z | | | 217,343 | | | | 1,616,468 | |
Shares reacquired upon conversion into Class Z | | | (68,971 | ) | | | (522,940 | ) |
| | | | | | | | |
Net increase (decrease) in shares outstanding | | | (2,093,512 | ) | | $ | (15,871,100 | ) |
| | | | | | | | |
Year ended October 31, 2013: | | | | | | | | |
Shares sold | | | 1,007,911 | | | $ | 6,687,880 | |
Shares issued in reinvestment of dividends and distributions | | | 709,948 | | | | 4,437,173 | |
Shares reacquired | | | (4,910,399 | ) | | | (32,339,317 | ) |
| | | | | | | | |
Net increase (decrease) in shares outstanding before conversion | | | (3,192,540 | ) | | | (21,214,264 | ) |
Shares issued upon conversion from Class B, Class F, Class X and Class Z | | | 294,902 | | | | 1,955,257 | |
Shares reacquired upon conversion into Class Z | | | (78,700 | ) | | | (530,920 | ) |
| | | | | | | | |
Net increase (decrease) in shares outstanding | | | (2,976,338 | ) | | $ | (19,789,927 | ) |
| | | | | | | | |
Class B | | | | | | |
Year ended October 31, 2014: | | | | | | | | |
Shares sold | | | 115,280 | | | $ | 820,488 | |
Shares issued in reinvestment of dividends and distributions | | | 11,788 | | | | 80,161 | |
Shares reacquired | | | (115,309 | ) | | | (828,558 | ) |
| | | | | | | | |
Net increase (decrease) in shares outstanding before conversion | | | 11,759 | | | | 72,091 | |
Shares reacquired upon conversion into Class A | | | (159,740 | ) | | | (1,144,832 | ) |
| | | | | | | | |
Net increase (decrease) in shares outstanding | | | (147,981 | ) | | $ | (1,072,741 | ) |
| | | | | | | | |
Year ended October 31, 2013: | | | | | | | | |
Shares sold | | | 140,384 | | | $ | 904,991 | |
Shares issued in reinvestment of dividends and distributions | | | 14,301 | | | | 86,379 | |
Shares reacquired | | | (105,231 | ) | | | (665,748 | ) |
| | | | | | | | |
Net increase (decrease) in shares outstanding before conversion | | | 49,454 | | | | 325,622 | |
Shares reacquired upon conversion into Class A | | | (132,182 | ) | | | (844,219 | ) |
| | | | | | | | |
Net increase (decrease) in shares outstanding | | | (82,728 | ) | | $ | (518,597 | ) |
| | | | | | | | |
| | | | | | | | |
Class C | | Shares | | | Amount | |
Year ended October 31, 2014: | | | | | | | | |
Shares sold | | | 250,597 | | | $ | 1,782,658 | |
Shares issued in reinvestment of dividends and distributions | | | 36,950 | | | | 251,259 | |
Shares reacquired | | | (452,927 | ) | | | (3,246,557 | ) |
| | | | | | | | |
Net increase (decrease) in shares outstanding before conversion | | | (165,380 | ) | | | (1,212,640 | ) |
Shares reacquired upon conversion into Class Z | | | (15,245 | ) | | | (112,272 | ) |
| | | | | | | | |
Net increase (decrease) in shares outstanding | | | (180,625 | ) | | $ | (1,324,912 | ) |
| | | | | | | | |
Year ended October 31, 2013: | | | | | | | | |
Shares sold | | | 194,985 | | | $ | 1,261,519 | |
Shares issued in reinvestment of dividends and distributions | | | 45,635 | | | | 275,180 | |
Shares reacquired | | | (537,568 | ) | | | (3,387,583 | ) |
| | | | | | | | |
Net increase (decrease) in shares outstanding before conversion | | | (296,948 | ) | | | (1,850,884 | ) |
Shares reacquired upon conversion into Class Z | | | (2,569 | ) | | | (17,777 | ) |
| | | | | | | | |
Net increase (decrease) in shares outstanding | | | (299,517 | ) | | $ | (1,868,661 | ) |
| | | | | | | | |
Class F | | | | | | |
Period ended March 14, 2014*: | | | | | | | | |
Shares issued in reinvestment of dividends and distributions | | | 86 | | | $ | 583 | |
Shares reacquired | | | (5,211 | ) | | | (37,196 | ) |
| | | | | | | | |
Net increase (decrease) in shares outstanding before conversion | | | (5,125 | ) | | | (36,613 | ) |
Shares reacquired upon conversion into Class A | | | (14,245 | ) | | | (97,276 | ) |
| | | | | | | | |
Net increase (decrease) in shares outstanding | | | (19,370 | ) | | $ | (133,889 | ) |
| | | | | | | | |
Year ended October 31, 2013: | | | | | | | | |
Shares sold | | | 16 | | | $ | 107 | |
Shares issued in reinvestment of dividends and distributions | | | 1,732 | | | | 10,446 | |
Shares reacquired | | | (10,025 | ) | | | (62,519 | ) |
| | | | | | | | |
Net increase (decrease) in shares outstanding before conversion | | | (8,277 | ) | | | (51,966 | ) |
Shares reacquired upon conversion into Class A | | | (90,014 | ) | | | (575,098 | ) |
| | | | | | | | |
Net increase (decrease) in shares outstanding | | | (98,291 | ) | | $ | (627,064 | ) |
| | | | | | | | |
| | | | |
| Prudential International Equity Fund | | | 45 | |
Notes to Financial Statements
continued
| | | | | | | | |
Class X | | Shares | | | Amount | |
Period ended April 11, 2014**: | | | | | | | | |
Shares sold | | | 14 | | | $ | 99 | |
Shares issued in reinvestment of dividends and distributions | | | 311 | | | | 2,117 | |
Shares reacquired | | | (1,493 | ) | | | (10,397 | ) |
| | | | | | | | |
Net increase (decrease) in shares outstanding before conversion | | | (1,168 | ) | | | (8,181 | ) |
Shares reacquired upon conversion into Class A | | | (29,057 | ) | | | (203,038 | ) |
| | | | | | | | |
Net increase (decrease) in shares outstanding | | | (30,225 | ) | | $ | (211,219 | ) |
| | | | | | | | |
Year ended October 31, 2013: | | | | | | | | |
Shares sold | | | 1,547 | | | $ | 9,653 | |
Shares issued in reinvestment of dividends and distributions | | | 1,618 | | | | 9,773 | |
Shares reacquired | | | (11,055 | ) | | | (70,470 | ) |
| | | | | | | | |
Net increase (decrease) in shares outstanding before conversion | | | (7,890 | ) | | | (51,044 | ) |
Shares reacquired upon conversion into Class A | | | (84,144 | ) | | | (533,747 | ) |
| | | | | | | | |
Net increase (decrease) in shares outstanding | | | (92,034 | ) | | $ | (584,791 | ) |
| | | | | | | | |
Class Z | | | | | | |
Year ended October 31, 2014: | | | | | | | | |
Shares sold | | | 999,881 | | | $ | 7,461,471 | |
Shares issued in reinvestment of dividends and distributions | | | 220,238 | | | | 1,563,688 | |
Shares reacquired | | | (4,459,314 | ) | | | (32,358,454 | ) |
| | | | | | | | |
Net increase (decrease) in shares outstanding before conversion | | | (3,239,195 | ) | | | (23,333,295 | ) |
Shares issued upon conversion from Class A and Class C | | | 83,020 | | | | 635,212 | |
Shares reacquired upon conversion into Class A | | | (21,953 | ) | | | (171,322 | ) |
| | | | | | | | |
Net increase (decrease) in shares outstanding | | | (3,178,128 | ) | | $ | (22,869,405 | ) |
| | | | | | | | |
Year ended October 31, 2013: | | | | | | | | |
Shares sold | | | 2,363,610 | | | $ | 15,966,544 | |
Shares issued in reinvestment of dividends and distributions | | | 194,751 | | | | 1,224,986 | |
Shares reacquired | | | (1,312,558 | ) | | | (8,860,195 | ) |
| | | | | | | | |
Net increase (decrease) in shares outstanding before conversion | | | 1,245,803 | | | | 8,331,335 | |
Shares issued upon conversion from Class A and Class C | | | 80,644 | | | | 548,697 | |
Shares reacquired upon conversion into Class A | | | (341 | ) | | | (2,193 | ) |
| | | | | | | | |
Net increase (decrease) in shares outstanding | | | 1,326,106 | | | $ | 8,877,839 | |
| | | | | | | | |
| * | As of March 14, 2014, the last conversion of Class F shares to Class A shares was completed. There are no Class F shares outstanding and Class F shares are no longer being offered for sale. |
| ** | As of April 11, 2014, the last conversion of Class X shares to Class A shares was completed. There are no Class X shares outstanding and Class X shares are no longer being offered for sale. |
Note 7. Borrowings
The Series, along with other affiliated registered investment companies (the “Funds”), is a party to a Syndicated Credit Agreement (“SCA”) with a group of banks. The purpose of the SCA is to provide an alternative source of temporary funding for capital share redemptions. The SCA provides for a commitment of $900 million for the period October 9, 2014 through October 8, 2015. The Funds pay an annualized commitment fee of .075% of the unused portion of the SCA. Prior to October 9, 2014, the Funds had another SCA that provided a commitment of $900 million and the Funds paid an annualized commitment fee of .08% of the unused portion of the SCA. Interest on any borrowings under the SCA is paid at contracted market rates. The commitment fee for the unused amount is accrued daily and paid quarterly.
The Series utilized the SCA during the year ended October 31, 2014. The average daily balance for the 131 days that the Series had loans outstanding during the period was approximately $748,817, borrowed at a weighted average interest rate of 1.41%. At October 31, 2014, the Series did not have an outstanding loan amount.
Note 8. Ownership
As of October 31, 2014, approximately 26% of the Series was owned by two institutional shareholders for the beneficial interest of their underlying account holders.
Note 9. Dividends and Distributions to Shareholders
Subsequent to the fiscal year end, the Series declared ordinary income dividends on December 10, 2014 to shareholders of record on December 11, 2014. The ex-dividend date was December 12, 2014. The per share amounts declared were as follows:
| | | | |
| | | Ordinary Income | |
Class A | | $ | 0.17214 | |
Class B | | $ | 0.12271 | |
Class C | | $ | 0.12271 | |
Class Z | | $ | 0.19460 | |
Note 10. Subsequent Event
Pursuant to a Plan of Reorganization approved by the shareholders of the Prudential International Value Fund, a series of the Prudential World Fund, Inc., the Series is expected to acquire the net assets of the Prudential International Value Fund at the close of business on or about December 19, 2014. According to the terms of the merger, the shareholders of the Prudential International Value Fund will be issued shares in the Series.
| | | | |
| Prudential International Equity Fund | | | 47 | |
Financial Highlights
| | | | | | | | | | | | | | | | | | | | |
| Class A Shares | |
| | | Year Ended October 31, | |
| | | 2014 | | | 2013 | | | 2012 | | | 2011 | | | 2010 | |
| Per Share Operating Performance(a): | | | | | | | | | | | | | | | | | |
| Net Asset Value, Beginning Of Year | | | $7.37 | | | | $6.02 | | | | $5.72 | | | | $6.17 | | | | $5.77 | |
| Income (loss) from investment operations: | | | | | | | | | | | | | | | | | | | | |
| Net investment income | | | .15 | | | | .12 | | | | .12 | | | | .09 | | | | .08 | |
| Net realized and unrealized gain (loss) on investment transactions | | | (.02 | ) | | | 1.36 | | | | .29 | | | | (.46 | ) | | | .36 | |
| Total from investment operations | | | .13 | | | | 1.48 | | | | .41 | | | | (.37 | ) | | | .44 | |
| Less Dividends: | | | | | | | | | | | | | | | | | | | | |
| Dividends from net investment income | | | (.14 | ) | | | (.13 | ) | | | (.11 | ) | | | (.11 | ) | | | (.10 | ) |
| Capital Contributions(d): | | | - | | | | - | | | | - | | | | .03 | | | | .06 | |
| Net asset value, end of year | | | $7.36 | | | | $7.37 | | | | $6.02 | | | | $5.72 | | | | $6.17 | |
| Total Return(b): | | | 1.84% | | | | 25.06% | | | | 7.40% | | | | (5.61)% | | | | 8.78% | |
| |
| Ratios/Supplemental Data: | |
| Net assets, end of year (000) | | | $218,909 | | | | $234,668 | | | | $209,568 | | | | $214,610 | | | | $260,555 | |
| Average net assets (000) | | | $232,049 | | | | $221,300 | | | | $204,088 | | | | $247,859 | | | | $257,553 | |
| Ratios to average net assets(c): | | | | | | | | | | | | | | | | | | | | |
| Expenses after waivers and/or expense reimbursement | | | 1.59% | | | | 1.59% | | | | 1.67% | | | | 1.64% | | | | 1.57% | |
| Expenses before waivers and/or expense reimbursement | | | 1.59% | | | | 1.59% | | | | 1.67% | | | | 1.64% | | | | 1.57% | |
| Net investment income | | | 2.02% | | | | 1.83% | | | | 2.18% | | | | 1.51% | | | | 1.35% | |
| Portfolio turnover rate | | | 134% | | | | 114% | | | | 83% | | | | 70% | | | | 96% | |
(a) Calculated based on average shares outstanding during the year.
(b) Total return does not consider the effects of sales loads. Total return is calculated assuming a purchase of a share on the first day and a sale on the last day of each year reported and includes reinvestment of dividends and distributions. Total investment returns may reflect adjustments to conform to generally accepted accounting principles.
(c) Does not include expenses of the underlying portfolios in which the Series invests.
(d) The Series received payments related to a former affiliate’s settlement of regulatory proceedings involving allegations of improper trading in Series shares during the fiscal years ended October 31, 2011 and October 31, 2010. The Series was not involved in the proceedings or in the calculation of the amount of settlement.
See Notes to Financial Statements.
| | | | | | | | | | | | | | | | | | | | |
| Class B Shares | |
| | | Year Ended October 31, | |
| | | 2014 | | | 2013 | | | 2012 | | | 2011 | | | 2010 | |
| Per Share Operating Performance(a): | | | | | | | | | | | | | | | | | |
| Net Asset Value, Beginning Of Year | | | $7.07 | | | | $5.78 | | | | $5.50 | | | | $5.94 | | | | $5.56 | |
| Income (loss) from investment operations: | | | | | | | | | | | | | | | | | | | | |
| Net investment income | | | .10 | | | | .07 | | | | .08 | | | | .05 | | | | .04 | |
| Net realized and unrealized gain (loss) on investment transactions | | | (.03 | ) | | | 1.32 | | | | .27 | | | | (.45 | ) | | | .35 | |
| Total from investment operations | | | .07 | | | | 1.39 | | | | .35 | | | | (.40 | ) | | | .39 | |
| Less Dividends: | | | | | | | | | | | | | | | | | | | | |
| Dividends from net investment income | | | (.09 | ) | | | (.10 | ) | | | (.07 | ) | | | (.07 | ) | | | (.07 | ) |
| Capital Contributions(d): | | | - | | | | - | | | | - | | | | .03 | | | | .06 | |
| Net asset value, end of year | | | $7.05 | | | | $7.07 | | | | $5.78 | | | | $5.50 | | | | $5.94 | |
| Total Return(b): | | | 1.10% | | | | 24.26% | | | | 6.50% | | | | (6.27)% | | | | 8.11% | |
| | | | | | | | | | | | | | | | | | | | |
| Ratios/Supplemental Data: | |
| Net assets, end of year (000) | | | $5,006 | | | | $6,066 | | | | $5,439 | | | | $6,720 | | | | $9,160 | |
| Average net assets (000) | | | $5,868 | | | | $5,690 | | | | $5,823 | | | | $8,320 | | | | $9,246 | |
| Ratios to average net assets(c): | | | | | | | | | | | | | | | | | | | | |
| Expenses after waivers and/or expense reimbursement | | | 2.29% | | | | 2.29% | | | | 2.37% | | | | 2.34% | | | | 2.27% | |
| Expenses before waivers and/or expense reimbursement | | | 2.29% | | | | 2.29% | | | | 2.37% | | | | 2.34% | | | | 2.27% | |
| Net investment income | | | 1.35% | | | | 1.13% | | | | 1.48% | | | | .83% | | | | .66% | |
| Portfolio turnover rate | | | 134% | | | | 114% | | | | 83% | | | | 70% | | | | 96% | |
(a) Calculated based on average shares outstanding during the year.
(b) Total return does not consider the effects of sales loads. Total return is calculated assuming a purchase of a share on the first day and a sale on the last day of each year reported and includes reinvestment of dividends and distributions. Total investment returns may reflect adjustments to conform to generally accepted accounting principles.
(c) Does not include expenses of the underlying portfolios in which the Series invests.
(d) The Series received payments related to a former affiliate’s settlement of regulatory proceedings involving allegations of improper trading in Series shares during the fiscal years ended October 31, 2011 and October 31, 2010. The Series was not involved in the proceedings or in the calculation of the amount of settlement.
See Notes to Financial Statements.
| | | | |
| Prudential International Equity Fund | | | 49 | |
Financial Highlights
continued
| | | | | | | | | | | | | | | | | | | | |
| Class C Shares | |
| | | Year Ended October 31, | |
| | | 2014 | | | 2013 | | | 2012 | | | 2011 | | | 2010 | |
| Per Share Operating Performance(a): | | | | | | | | | | | | | | | | | |
| Net Asset Value, Beginning Of Year | | | $7.07 | | | | $5.78 | | | | $5.50 | | | | $5.94 | | | | $5.56 | |
| Income (loss) from investment operations: | | | | | | | | | | | | | | | | | | | | |
| Net investment income | | | .10 | | | | .07 | | | | .08 | | | | .05 | | | | .04 | |
| Net realized and unrealized gain (loss) on investment transactions | | | (.03 | ) | | | 1.32 | | | | .27 | | | | (.45 | ) | | | .35 | |
| Total from investment operations | | | .07 | | | | 1.39 | | | | .35 | | | | (.40 | ) | | | .39 | |
| Less Dividends: | | | | | | | | | | | | | | | | | | | | |
| Dividends from net investment income | | | (.09 | ) | | | (.10 | ) | | | (.07 | ) | | | (.07 | ) | | | (.07 | ) |
| Capital Contributions(d): | | | - | | | | - | | | | - | | | | .03 | | | | .06 | |
| Net asset value, end of year | | | $7.05 | | | | $7.07 | | | | $5.78 | | | | $5.50 | | | | $5.94 | |
| Total Return(b): | | | 1.10% | | | | 24.27% | | | | 6.51% | | | | (6.27)% | | | | 8.11% | |
| | | | | | | | | | | | | | | | | | | | |
| Ratios/Supplemental Data: | |
| Net assets, end of year (000) | | | $18,146 | | | | $19,472 | | | | $17,658 | | | | $21,310 | | | | $26,625 | |
| Average net assets (000) | | | $19,402 | | | | $18,341 | | | | $19,019 | | | | $25,128 | | | | $26,974 | |
| Ratios to average net assets(c): | | | | | | | | | | | | | | | | | | | | |
| Expenses after waivers and/or expense reimbursement | | | 2.29% | | | | 2.29% | | | | 2.37% | | | | 2.34% | | | | 2.27% | |
| Expenses before waivers and/or expense reimbursement | | | 2.29% | | | | 2.29% | | | | 2.37% | | | | 2.34% | | | | 2.27% | |
| Net investment income | | | 1.32% | | | | 1.13% | | | | 1.49% | | | | .81% | | | | .66% | |
| Portfolio turnover rate | | | 134% | | | | 114% | | | | 83% | | | | 70% | | | | 96% | |
(a) Calculated based on average shares outstanding during the year.
(b) Total return does not consider the effects of sales loads. Total return is calculated assuming a purchase of a share on the first day and a sale on the last day of each year reported and includes reinvestment of dividends and distributions. Total investment returns may reflect adjustments to conform to generally accepted accounting principles.
(c) Does not include expenses of the underlying portfolios in which the Series invests.
(d) The Series received payments related to a former affiliate’s settlement of regulatory proceedings involving allegations of improper trading in Series shares during the fiscal years ended October 31, 2011 and October 31, 2010. The Series was not involved in the proceedings or in the calculation of the amount of settlement.
See Notes to Financial Statements.
| | | | | | | | | | | | | | | | | | | | | | | | | | |
| Class F Shares | |
| | | Period
Ended
March 14, | | | | | Year Ended October 31, | |
| | | 2014(g) | | | | | 2013 | | | 2012 | | | 2011 | | | 2010 | | | 2009 | |
| Per Share Operating Performance(a): | | | | | | | | | | | | | | | | | | | | | | | |
| Net Asset Value, Beginning Of Period | | | $7.08 | | | | | | $5.79 | | | | $5.50 | | | | $5.94 | | | | $5.56 | | | | $4.62 | |
| Income (loss) from investment operations: | | | | | | | | | | | | | | | | | | | | | | | | | | |
| Net investment income | | | .01 | | | | | | .09 | | | | .09 | | | | .06 | | | | .05 | | | | .06 | |
| Net realized and unrealized gain (loss) on investment transactions | | | (.05 | ) | | | | | 1.31 | | | | .29 | | | | (.44 | ) | | | .35 | | | | 1.01 | |
| Total from investment operations | | | (.04 | ) | | | | | 1.40 | | | | .38 | | | | (.38 | ) | | | .40 | | | | 1.07 | |
| Less Dividends: | | | | | | | | | | | | | | | | | | | | | | | | | | |
| Dividends from net investment income | | | (.11 | ) | | | | | (.11 | ) | | | (.09 | ) | | | (.09 | ) | | | (.08 | ) | | | (.13 | ) |
| Capital Contributions(d): | | | - | | | | | | - | | | | - | | | | .03 | | | | .06 | | | | - | |
| Net asset value, end of period | | | $6.93 | | | | | | $7.08 | | | | $5.79 | | | | $5.50 | | | | $5.94 | | | | $5.56 | |
| Total Return(b): | | | (.51)% | | | | | | 24.51% | | | | 6.98% | | | | (6.05)% | | | | 8.35% | | | | 24.04% | |
| | | | | | | | | | | | | | | | | | | | | | | | | | |
| Ratios/Supplemental Data: | |
| Net assets, end of period (000) | | | $5 | | | | | | $137 | | | | $681 | | | | $1,572 | | | | $3,355 | | | | $5,226 | |
| Average net assets (000) | | | $71 | | | | | | $423 | | | | $1,044 | | | | $2,442 | | | | $4,064 | | | | $5,769 | |
| Ratios to average net assets(c): | | | | | | | | | | | | | | | | | | | | | | | | | | |
| Expenses after waivers and/or expense reimbursement | | | 2.03% | (e) | | | | | 2.04% | | | | 2.12% | | | | 2.09% | | | | 2.02% | | | | 1.99% | |
| Expenses before waivers and/or expense reimbursement | | | 2.03% | (e) | | | | | 2.04% | | | | 2.12% | | | | 2.09% | | | | 2.02% | | | | 1.99% | |
| Net investment income | | | .27% | (e) | | | | | 1.36% | | | | 1.74% | | | | 1.07% | | | | .95% | | | | 1.35% | |
| Portfolio turnover rate | | | 134% | (f) | | | | | 114% | | | | 83% | | | | 70% | | | | 96% | | | | 76% | |
(a) Calculated based on average shares outstanding during the period.
(b) Total return does not consider the effects of sales loads. Total return is calculated assuming a purchase of a share on the first day and a sale on the last day of each period reported and includes reinvestment of dividends and distributions. Total investment returns may reflect adjustments to conform to generally accepted accounting principles. Total returns for periods less than a full year are not annualized.
(c) Does not include expenses of the underlying portfolios in which the Series invests.
(d) The Series received payments related to a former affiliate’s settlement of regulatory proceedings involving allegations of improper trading in Series shares during the fiscal years ended October 31, 2011 and October 31, 2010. The Series was not involved in the proceedings or in the calculation of the amount of settlement.
(e) Annualized.
(f) Calculated as of October 31, 2014.
(g) As of March 14, 2014, the last conversion of Class F shares to Class A shares was completed. There are no Class F shares outstanding and Class F shares are no longer being offered for sale.
See Notes to Financial Statements.
| | | | |
| Prudential International Equity Fund | | | 51 | |
Financial Highlights
continued
| | | | | | | | | | | | | | | | | | | | | | | | | | |
| Class X Shares | |
| | | Period
Ended
April 11, | | | | | Year Ended October 31, | |
| | | 2014(g) | | | | | 2013 | | | 2012 | | | 2011 | | | 2010 | | | 2009 | |
| Per Share Operating Performance(a): | | | | | | | | | | | | | | | | | | | | | | | | | | |
| Net Asset Value, Beginning Of Period | | | $7.07 | | | | | | $5.79 | | | | $5.50 | | | | $5.94 | | | | $5.56 | | | | $4.61 | |
| Income (loss) from investment operations: | | | | | | | | | | | | | | | | | | | | | | | | | | |
| Net investment income (loss) | | | - | (h) | | | | | .07 | | | | .08 | | | | .05 | | | | .04 | | | | .05 | |
| Net realized and unrealized gain (loss) on investment transactions | | | .15 | | | | | | 1.31 | | | | .28 | | | | (.45 | ) | | | .35 | | | | 1.02 | |
| Total from investment operations | | | .15 | | | | | | 1.38 | | | | .36 | | | | (.40 | ) | | | .39 | | | | 1.07 | |
| Less Dividends: | | | | | | | | | | | | | | | | | | | | | | | | | | |
| Dividends from net investment income | | | (.09 | ) | | | | | (.10 | ) | | | (.07 | ) | | | (.07 | ) | | | (.07 | ) | | | (.12 | ) |
| Capital Contributions(d): | | | - | | | | | | - | | | | - | | | | .03 | | | | .06 | | | | - | |
| Net asset value, end of period | | | $7.13 | | | | | | $7.07 | | | | $5.79 | | | | $5.50 | | | | $5.94 | | | | $5.56 | |
| Total Return(b): | | | 2.25% | | | | | | 24.05% | | | | 6.69% | | | | (6.27)% | | | | 8.11% | | | | 23.82% | |
| |
| Ratios/Supplemental Data: | |
| Net assets, end of period (000) | | | $11 | | | | | | $214 | | | | $707 | | | | $1,569 | | | | $3,067 | | | | $5,957 | |
| Average net assets (000) | | | $102 | | | | | | $449 | | | | $1,077 | | | | $2,351 | | | | $4,020 | | | | $6,611 | |
| Ratios to average net assets(c): | | | | | | | | | | | | | | | | | | | | | | | | | | |
| Expenses after waivers and/or expense reimbursement | | | 2.28% | (e) | | | | | 2.29% | | | | 2.37% | | | | 2.34% | | | | 2.27% | | | | 2.24% | |
| Expenses before waivers and/or expense reimbursement | | | 2.28% | (e) | | | | | 2.29% | | | | 2.37% | | | | 2.34% | | | | 2.27% | | | | 2.24% | |
| Net investment income (loss) | | | (.04)% | (e) | | | | | 1.05% | | | | 1.45% | | | | .80% | | | | .66% | | | | 1.10% | |
| Portfolio turnover rate | | | 134% | (f) | | | | | 114% | | | | 83% | | | | 70% | | | | 96% | | | | 76% | |
(a) Calculated based on average shares outstanding during the period.
(b) Total return does not consider the effects of sales loads. Total return is calculated assuming a purchase of a share on the first day and a sale on the last day of each period reported and includes reinvestment of dividends and distributions. Total investment returns may reflect adjustments to conform to generally accepted accounting principles. Total returns for periods less than a full year are not annualized.
(c) Does not include expenses of the underlying portfolios in which the Series invests.
(d) The Series received payments related to a former affiliate’s settlement of regulatory proceedings involving allegations of improper trading in Series shares during the fiscal years ended October 31, 2011 and October 31, 2010. The Series was not involved in the proceedings or in the calculation of the amount of settlement.
(e) Annualized.
(f) Calculated as of October 31, 2014.
(g) As of April 11, 2014, the last conversion of Class X shares to Class A shares was completed. There are no Class X shares outstanding and Class X shares are no longer being offered for sale.
(h) Less than $.005 per share.
See Notes to Financial Statements.
| | | | | | | | | | | | | | | | | | | | |
| Class Z Shares | |
| | | Year Ended October 31, | |
| | | 2014 | | | 2013 | | | 2012 | | | 2011 | | | 2010 | |
| Per Share Operating Performance(a): | | | | | | | | | | | | | | | | | |
| Net Asset Value, Beginning Of Year | | | $7.43 | | | | $6.07 | | | | $5.77 | | | | $6.22 | | | | $5.82 | |
| Income (loss) from investment operations: | | | | | | | | | | | | | | | | | | | | |
| Net investment income | | | .16 | | | | .15 | | | | .14 | | | | .11 | | | | .13 | |
| Net realized and unrealized gain (loss) on investment transactions | | | (.01 | ) | | | 1.36 | | | | .29 | | | | (.46 | ) | | | .33 | |
| Total from investment operations | | | .15 | | | | 1.51 | | | | .43 | | | | (.35 | ) | | | .46 | |
| Less Dividends: | | | | | | | | | | | | | | | | | | | | |
| Dividends from net investment income | | | (.16 | ) | | | (.15 | ) | | | (.13 | ) | | | (.13 | ) | | | (.12 | ) |
| Capital Contributions(d): | | | - | | | | - | | | | - | | | | .03 | | | | .06 | |
| Net asset value, end of year | | | $7.42 | | | | $7.43 | | | | $6.07 | | | | $5.77 | | | | $6.22 | |
| Total Return(b): | | | 2.12% | | | | 25.36% | | | | 7.69% | | | | (5.30)% | | | | 8.98% | |
| | | | | | | | | | | | | | | | | | | | |
| Ratios/Supplemental Data: | |
| Net assets, end of year (000) | | | $48,064 | | | | $71,753 | | | | $50,531 | | | | $44,573 | | | | $44,833 | |
| Average net assets (000) | | | $53,881 | | | | $60,981 | | | | $45,946 | | | | $46,529 | | | | $149,685 | |
| Ratios to average net assets(c): | | | | | | | | | | | | | | | | | | | | |
| Expenses after waivers and/or expense reimbursement | | | 1.29% | | | | 1.29% | | | | 1.37% | | | | 1.34% | | | | 1.27% | |
| Expenses before waivers and/or expense reimbursement | | | 1.29% | | | | 1.29% | | | | 1.37% | | | | 1.34% | | | | 1.27% | |
| Net investment income | | | 2.07% | | | | 2.17% | | | | 2.46% | | | | 1.77% | | | | 2.12% | |
| Portfolio turnover rate | | | 134% | | | | 114% | | | | 83% | | | | 70% | | | | 96% | |
(a) Calculated based on average shares outstanding during the year.
(b) Total return is calculated assuming a purchase of a share on the first day and a sale on the last day of each year reported and includes reinvestment of dividends and distributions. Total investment returns may reflect adjustments to conform to generally accepted accounting principles.
(c) Does not include expenses of the underlying portfolios in which the Series invests.
(d) The Series received payments related to a former affiliate’s settlement of regulatory proceedings involving allegations of improper trading in Series shares during the fiscal years ended October 31, 2011 and October 31, 2010. The Series was not involved in the proceedings or in the calculation of the amount of settlement.
See Notes to Financial Statements.
| | | | |
| Prudential International Equity Fund | | | 53 | |
Report of Independent Registered Public
Accounting Firm
The Board of Directors and Shareholders
Prudential World Fund, Inc.:
We have audited the accompanying statement of assets and liabilities of Prudential International Equity Fund, a series of Prudential World Fund, Inc., (hereafter referred to as the “Fund”), including the portfolio of investments, as of October 31, 2014, and the related statement of operations for the year then ended, the statements of changes in net assets for each of the years in the two-year period then ended and the financial highlights for each of the years in the five-year period then ended. These financial statements and financial highlights are the responsibility of the Fund’s management. Our responsibility is to express an opinion on these financial statements and financial highlights based on our audits.
We conducted our audits in accordance with the standards of the Public Company Accounting Oversight Board (United States). Those standards require that we plan and perform the audit to obtain reasonable assurance about whether the financial statements and financial highlights are free of material misstatement. An audit includes examining, on a test basis, evidence supporting the amounts and disclosures in the financial statements. Our procedures included confirmation of securities owned as of October 31, 2014, by correspondence with the custodian, transfer agent and brokers or by other appropriate auditing procedures when replies from brokers were not received. An audit also includes assessing the accounting principles used and significant estimates made by management, as well as evaluating the overall financial statement presentation. We believe that our audits provide a reasonable basis for our opinion.
In our opinion, the financial statements and financial highlights referred to above present fairly, in all material respects, the financial position of the Fund as of October 31, 2014, and the results of its operations for the year then ended, the changes in its net assets for each of the years in the two-year period then ended and the financial highlights for each of the years in the five-year period then ended, in conformity with U.S. generally accepted accounting principles.

New York, New York
December 16, 2014
Tax Information
(Unaudited)
For the year ended October 31, 2014, the Series reports, in accordance with Section 854 of the Internal Revenue Code, the following percentages of the ordinary income dividends paid as qualified dividend income (QDI):
| | | | |
| | | QDI | |
Prudential International Equity Fund | | | 99.39% | |
For the fiscal year ended October 31, 2014, the Series made an election to pass through the maximum amount of the portion of the ordinary income dividends paid derived from foreign source income as well as any foreign taxes paid by the Series in accordance with Section 853 of the Internal Revenue Code of the following amounts: $896,785 foreign tax credit from recognized foreign source income of $12,005,694.
In January 2015, you will be advised on IRS Form 1099-DIV or substitute 1099-DIV as to the federal tax status of dividends received by you in calendar year 2014.
| | | | |
| Prudential International Equity Fund | | | 55 | |
INFORMATION ABOUT BOARD MEMBERS AND OFFICERS
(Unaudited)
Information about Board Members and Officers of the Fund is set forth below. Board Members who are not deemed to be “interested persons” of the Fund, as defined in the 1940 Act, are referred to as “Independent Board Members.” Board Members who are deemed to be “interested persons” of the Fund are referred to as “Interested Board Members.” The Board Members are responsible for the overall supervision of the operations of the Fund and perform the various duties imposed on the directors of investment companies by the 1940 Act. The Board in turn elects the Officers, who are responsible for administering the day-to-day operations of the Fund.
| | | | |
| Independent Board Members(1) |
| | | |
Name, Address, Age Position(s) Portfolios Overseen | | Principal Occupation(s) During Past Five Years | | Other Directorships Held |
Ellen S. Alberding (56) Board Member Portfolios Overseen: 69 | | President and Board Member, The Joyce Foundation (charitable foundation) (since 2002); Vice Chair, City Colleges of Chicago (community college system) (since 2011); Trustee, Skills for America’s Future (national initiative to connect employers to community colleges) (since 2011); Trustee, National Park Foundation (charitable foundation for national park system) (since 2009); Trustee, Economic Club of Chicago (since 2009). | | None. |
Kevin J. Bannon (62) Board Member Portfolios Overseen: 70 | | Managing Director (since April 2008) and Chief Investment Officer (October 2008-November 2013) of Highmount Capital LLC (registered investment adviser); formerly Executive Vice President and Chief Investment Officer (April 1993-August 2007) of Bank of New York Company; President (May 2003-May 2007) of BNY Hamilton Family of Mutual Funds. | | Director of Urstadt Biddle Properties (equity real estate investment trust) (since September 2008). |
Linda W. Bynoe (62) Board Member Portfolios Overseen: 70 | | President and Chief Executive Officer (since March 1995) and formerly Chief Operating Officer (December 1989-February 1995) of Telemat Ltd. (management consulting); formerly Vice President (January 1985-June 1989) at Morgan Stanley & Co (broker-dealer). | | Director of Simon Property Group, Inc. (retail real estate) (May 2003-May 2012); Director of Anixter International, Inc. (communication products distributor) (since January 2006); Director of Northern Trust Corporation (financial services) (since April 2006); Trustee of Equity Residential (residential real estate) (since December 2009). |
Prudential International Equity Fund
| | | | |
| Independent Board Members(1) |
| | | |
Name, Address, Age Position(s) Portfolios Overseen | | Principal Occupation(s) During Past Five Years | | Other Directorships Held |
Keith F. Hartstein (58) Board Member Portfolios Overseen: 70 | | Retired; Formerly President and Chief Executive Officer (2005-2012), Senior Vice President (2004-2005), Senior Vice President of Sales and Marketing (1997-2004), and various executive management positions (1990-1997), John Hancock Funds, LLC (asset management); Chairman, Investment Company Institute’s Sales Force Marketing Committee (2003-2008). | | None. |
Michael S. Hyland, CFA (69) Board Member Portfolios Overseen: 69 | | Retired (since February 2005); Formerly Senior Managing Director (July 2001-February 2005) of Bear Stearns & Co, Inc.; Global Partner, INVESCO (1999-2001); Managing Director and President of Salomon Brothers Asset Management (1989-1999). | | None. |
Douglas H. McCorkindale (75) Board Member Portfolios Overseen: 69 | | Retired; Formerly Chairman (February 2001-June 2006), Chief Executive Officer (June 2000-July 2005), President (September 1997-July 2005) and Vice Chairman (March 1984-May 2000) of Gannett Co. Inc. (publishing and media). | | Director of Lockheed Martin Corp. (aerospace and defense) (since May 2001). |
Stephen P. Munn (72) Board Member Portfolios Overseen: 70 | | Lead Director (since 2007) and formerly Chairman (1993-2007) of Carlisle Companies Incorporated (manufacturer of industrial products). | | Lead Director (since 2007) of Carlisle Companies Incorporated (manufacturer of industrial products). |
James E. Quinn (62) Board Member Portfolios Overseen: 69 | | Retired; Formerly President (2003-2012) and Director (2003-2008), and Vice Chairman and Director (1998-2003), Tiffany & Company (jewelry retailing); Director, Mutual of America Capital Management Corporation (asset management) (since 1996); Director, Hofstra University (since 2008); Vice Chairman, Museum of the City of New York (since 1994). | | Director of Deckers Outdoor Corporation (footwear manufacturer) (since 2011). |
Richard A. Redeker (71) Board Member & Independent Chair Portfolios Overseen: 70 | | Retired Mutual Fund Senior Executive (44 years); Management Consultant; Director, Mutual Fund Directors Forum (since 2014); Independent Directors Council (organization of 2,800 Independent Mutual Fund Directors)-Executive Committee, Chair of Policy Steering Committee, Governing Council. | | None. |
Visit our website at www.prudentialfunds.com
| | | | |
| Independent Board Members(1) |
| | | |
Name, Address, Age Position(s) Portfolios Overseen | | Principal Occupation(s) During Past Five Years | | Other Directorships Held |
Robin B. Smith (75) Board Member Portfolios Overseen:70 | | Chairman of the Board (since January 2003) of Publishers Clearing House (direct marketing); Member of the Board of Directors of ADLPartner (marketing) (since December 2010); formerly Chairman and Chief Executive Officer (August 1996-January 2003) of Publishers Clearing House. | | Formerly Director of BellSouth Corporation (telecommunications) (1992-2006). |
Stephen G. Stoneburn (71) Board Member Portfolios Overseen: 70 | | Chairman, (since July 2011), President and Chief Executive Officer (since June 1996) of Quadrant Media Corp. (publishing company); formerly President (June 1995-June 1996) of Argus Integrated Media, Inc.; Senior Vice President and Managing Director (January 1993-1995) of Cowles Business Media; Senior Vice President of Fairchild Publications, Inc. (1975-1989). | | None. |
| | | | |
| Interested Board Members(1) |
| | | |
Name, Address, Age Position(s) Portfolios Overseen | | Principal Occupation(s) During Past Five Years | | Other Directorships Held |
Stuart S. Parker (52) Board Member & President Portfolios Overseen: 64 | | President of Prudential Investments LLC (since January 2012); Executive Vice President of Prudential Investment Management Services LLC (since December 2012); Executive Vice President of Jennison Associates LLC and Head of Retail Distribution of Prudential Investments LLC (June 2005-December 2011). | | None. |
Scott E. Benjamin (41) Board Member & Vice President Portfolios Overseen: 70 | | Executive Vice President (since June 2009) of Prudential Investments LLC; Executive Vice President (June 2009-June 2012) and Vice President (since June 2012) of Prudential Investment Management Services LLC; Executive Vice President (since September 2009) of AST Investment Services, Inc.; Senior Vice President of Product Development and Marketing, Prudential Investments (since February 2006); Vice President of Product Development and Product Management, Prudential Investments (2003-2006). | | None. |
Prudential International Equity Fund
| | | | |
| Interested Board Members(1) |
| | | |
Name, Address, Age Position(s) Portfolios Overseen | | Principal Occupation(s) During Past Five Years | | Other Directorships Held |
Grace C. Torres* (55) Board Member Portfolios Overseen: 65 | | Retired; Formerly Treasurer and Principal Financial and Accounting Officer of the Prudential Investments Funds, Target Funds, Advanced Series Trust, Prudential Variable Contract Accounts and The Prudential Series Fund (1998-June 2014); Assistant Treasurer (March 1999-June 2014) and Senior Vice President (September 1999-June 2014) of Prudential Investments LLC; Assistant Treasurer (May 2003-June 2014) and Vice President (June 2005-June 2014) of AST Investment Services, Inc.; Senior Vice President and Assistant Treasurer (May 2003-June 2014) of Prudential Annuities Advisory Services, Inc. | | None. |
* Note: Prior to her retirement in 2014, Ms. Torres was employed by Prudential Investments LLC. Due to her prior employment, she is considered to be an “interested person” under the 1940 Act. Ms. Torres is a non-management Interested Board Member.
(1) The year that each Board Member joined the Funds’ Board is as follows:
Ellen S. Alberding; 2013; Kevin J. Bannon, 2008; Linda W. Bynoe, 2005; Keith F. Hartstein, 2013; Michael S. Hyland, 2008; Douglas H. McCorkindale, 2003; Stephen P. Munn, 2008; James E. Quinn, 2013; Richard A. Redeker, 2003; Robin B. Smith, 1996; Stephen G. Stoneburn, 1996; Stuart S. Parker, Board Member and President since 2012; Scott E. Benjamin, Board Member since 2010 and Vice President since 2009; Grace C. Torres, 2014.
| | | | |
| Fund Officers(a) |
| | | |
Name, Address and Age Position with Fund | | Principal Occupation(s) During Past Five Years | | Length of Service as Fund Officer |
Raymond A. O’Hara (59) Chief Legal Officer | | Vice President and Corporate Counsel (since July 2010) of Prudential Insurance Company of America (Prudential); Vice President (March 2011-Present) of Pruco Life Insurance Company and Pruco Life Insurance Company of New Jersey; Vice President and Corporate Counsel (March 2011-Present) of Prudential Annuities Life Assurance Corporation; Chief Legal Officer of Prudential Investments LLC (since June 2012); Chief Legal Officer of Prudential Mutual Fund Services LLC (since June 2012) and Corporate Counsel of AST Investment Services, Inc. (since June 2012); formerly Assistant Vice President and Corporate Counsel (September 2008-July 2010) of The Hartford Financial Services Group, Inc.; formerly Associate (September 1980-December 1987) and Partner (January 1988–August 2008) of Blazzard & Hasenauer, P.C. (formerly, Blazzard, Grodd & Hasenauer, P.C.). | | Since 2012 |
Visit our website at www.prudentialfunds.com
| | | | |
| Fund Officers(a) |
| | | |
Name, Address and Age Position with Fund | | Principal Occupation(s) During Past Five Years | | Length of Service as Fund Officer |
Chad A. Earnst (39) Chief Compliance Officer | | Chief Compliance Officer (September 2014-Present) of Prudential Investments LLC; Chief Compliance Officer (September 2014-Present) of the Prudential Investments Funds, Target Funds, Advanced Series Trust, The Prudential Series Fund, Prudential’s Gibraltar Fund, Inc., Prudential Global Short Duration High Yield Income Fund, Inc., Prudential Short Duration High Yield Fund, Inc. and Prudential Jennison MLP Income Fund, Inc.; formerly Assistant Director (March 2010-August 2014) of the Asset Management Unit, Division of Enforcement, US Securities & Exchange Commission; Assistant Regional Director (January 2010-August 2014), Branch Chief (June 2006–December 2009) and Senior Counsel (April 2003-May 2006) of the Miami Regional Office, Division of Enforcement, US Securities & Exchange Commission. | | Since 2014 |
Deborah A. Docs (56) Secretary | | Vice President and Corporate Counsel (since January 2001) of Prudential; Vice President (since December 1996) and Assistant Secretary (since March 1999) of Prudential Investments LLC; formerly Vice President and Assistant Secretary (May 2003-June 2005) of AST Investment Services, Inc. | | Since 2004 |
Jonathan D. Shain (56) Assistant Secretary | | Vice President and Corporate Counsel (since August 1998) of Prudential; Vice President and Assistant Secretary (since May 2001) of Prudential Investments LLC; Vice President and Assistant Secretary (since February 2001) of Prudential Mutual Fund Services LLC; formerly Vice President and Assistant Secretary (May 2003-June 2005) of AST Investment Services, Inc. | | Since 2005 |
Claudia DiGiacomo (40) Assistant Secretary | | Vice President and Corporate Counsel (since January 2005) of Prudential; Vice President and Assistant Secretary of Prudential Investments LLC (since December 2005); Associate at Sidley Austin Brown & Wood LLP (1999-2004). | | Since 2005 |
Andrew R. French (52) Assistant Secretary | | Vice President and Corporate Counsel (since February 2010) of Prudential; formerly Director and Corporate Counsel (2006-2010) of Prudential; Vice President and Assistant Secretary (since January 2007) of Prudential Investments LLC; Vice President and Assistant Secretary (since January 2007) of Prudential Mutual Fund Services LLC. | | Since 2006 |
Amanda S. Ryan (36) Assistant Secretary | | Director and Corporate Counsel (since March 2012) of Prudential; Director and Assistant Secretary (since June 2012) of Prudential Investments LLC; Associate at Ropes & Gray LLP (2008-2012). | | Since 2012 |
Theresa C. Thompson (52) Deputy Chief Compliance Officer | | Vice President, Compliance, Prudential Investments LLC (since April 2004); and Director, Compliance, Prudential Investments LLC (2001-2004). | | Since 2008 |
Prudential International Equity Fund
| | | | |
| Fund Officers(a) |
| | | |
Name, Address and Age Position with Fund | | Principal Occupation(s) During Past Five Years | | Length of Service as Fund Officer |
Richard W. Kinville (46) Anti-Money Laundering Compliance Officer | | Vice President, Corporate Compliance, Anti-Money Laundering Unit (since January 2005) of Prudential; committee member of the American Council of Life Insurers Anti-Money Laundering and Critical Infrastructure Committee (since January 2007); formerly Investigator and Supervisor in the Special Investigations Unit for the New York Central Mutual Fire Insurance Company (August 1994-January 1999); Investigator in AXA Financial’s Internal Audit Department and Manager in AXA’s Anti-Money Laundering Office (January 1999-January 2005); first chair of the American Council of Life Insurers Anti-Money Laundering and Critical Infrastructure Committee (June 2007-December 2009). | | Since 2011 |
M. Sadiq Peshimam (50) Treasurer and Principal Financial and Accounting Officer | | Assistant Treasurer of funds in the Prudential Mutual Fund Complex (2006-2014); Vice President (since 2005) of Prudential Investments LLC. | | Since 2006 |
Peter Parrella (56) Assistant Treasurer | | Vice President (since 2007) and Director (2004-2007) within Prudential Mutual Fund Administration; formerly Tax Manager at SSB Citi Fund Management LLC (1997-2004). | | Since 2007 |
Lana Lomuti (47) Assistant Treasurer | | Vice President (since 2007) and Director (2005-2007), within Prudential Mutual Fund Administration; formerly Assistant Treasurer (December 2007-February 2014) of The Greater China Fund, Inc. | | Since 2014 |
Linda McMullin (53) Assistant Treasurer | | Vice President (since 2011) and Director (2008-2011) within Prudential Mutual Fund Administration. | | Since 2014 |
| (a) | Excludes Mr. Parker and Mr. Benjamin, interested Board Members who also serve as President and Vice President, respectively. |
Explanatory Notes to Tables:
| n | Board Members are deemed to be “Interested,” as defined in the 1940 Act, by reason of their affiliation with Prudential Investments LLC and/or an affiliate of Prudential Investments LLC. |
| n | Unless otherwise noted, the address of all Board Members and Officers is c/o Prudential Investments LLC, Gateway Center Three, 100 Mulberry Street, Newark, New Jersey 07102-4077. |
| n | There is no set term of office for Board Members or Officers. The Board Members have adopted a retirement policy, which calls for the retirement of Board Members on December 31 of the year in which they reach the age of 75. |
| n | “Other Directorships Held” includes only directorships of companies required to register or file reports with the SEC under the 1934 Act (that is, “public companies”) or other investment companies registered under the 1940 Act. |
| n | “Portfolios Overseen” includes all investment companies managed by Prudential Investments LLC. The investment companies for which Prudential Investments LLC serves as manager include the Prudential Investments Mutual Funds, The Prudential Variable Contract Accounts, Target Mutual Funds, Prudential Short Duration High Yield Fund, Inc., Prudential Global Short Duration High Yield Fund, Inc., The Prudential Series Fund, Prudential’s Gibraltar Fund, Inc. and the Advanced Series Trust. |
Visit our website at www.prudentialfunds.com
Approval of Advisory Agreements
The Fund’s Board of Directors
The Board of Directors (the “Board”) of Prudential International Equity Fund (the “Fund”)1 consists of thirteen individuals, eleven of whom are not “interested persons” of the Fund, as defined in the Investment Company Act of 1940, as amended (the “1940 Act”) (the “Independent Directors”). The Board is responsible for the oversight of the Fund and its operations, and performs the various duties imposed on the directors of investment companies by the 1940 Act. The Independent Directors have retained independent legal counsel to assist them in connection with their duties. The Chair of the Board is an Independent Director. The Board has established three standing committees: the Audit Committee, the Nominating and Governance Committee, and the Investment Committee. Each committee is chaired by, and composed of, Independent Directors.
Annual Approval of the Fund’s Advisory Agreements
As required under the 1940 Act, the Board determines annually whether to renew the Fund’s management agreement with Prudential Investments LLC (“PI”) and the Fund’s subadvisory agreement with Quantitative Management Associates LLC (“QMA”). In considering the renewal of the agreements, the Board, including all of the Independent Directors, met on June 9-11, 2014 and approved the renewal of the agreements through July 31, 2015, after concluding that the renewal of the agreements was in the best interests of the Fund and its shareholders.2
In advance of the meetings, the Board requested and received materials relating to the agreements, and had the opportunity to ask questions and request further information in connection with their consideration. Among other things, the Board considered comparative fee information from PI and QMA. Also, the Board considered comparisons with other mutual funds in relevant Peer Universes and Peer Groups, as is further discussed below.
In approving the agreements, the Board, including the Independent Directors advised by independent legal counsel, considered the factors it deemed relevant, including the nature, quality and extent of services provided by PI and the subadviser, the performance of the Fund, the profitability of PI and its affiliates, expenses and fees, and the potential for economies of scale that may be shared with the Fund and its shareholders as the Fund’s assets grow. In their deliberations, the Directors did not identify any single factor which alone was responsible for the Board’s decision to approve the agreements with respect to the Fund. In connection with its deliberations, the Board considered information provided by PI throughout the year at regular Board
| 1 | Prudential International Equity Fund is a series of Prudential World Fund, Inc. |
| 2 | Grace C. Torres was elected to the Board as of December 2014, and therefore did not participate in the consideration of these approvals. |
Prudential International Equity Fund
Approval of Advisory Agreements (continued)
meetings, presentations from portfolio managers and other information, as well as information furnished at or in advance of the meetings on June 9-11, 2014.
The Directors determined that the overall arrangements between the Fund and PI, which serves as the Fund’s investment manager pursuant to a management agreement, and between PI and QMA, which serves as the Fund’s subadviser pursuant to the terms of a subadvisory agreement with PI, are in the best interests of the Fund and its shareholders in light of the services performed, fees charged and such other matters as the Directors considered relevant in the exercise of their business judgment.
The material factors and conclusions that formed the basis for the Directors’ reaching their determinations to approve the continuance of the agreements are separately discussed below.
Nature, Quality and Extent of Services
The Board received and considered information regarding the nature, quality and extent of services provided to the Fund by PI and QMA. The Board considered the services provided by PI, including but not limited to the oversight of the subadviser for the Fund, as well as the provision of fund recordkeeping, compliance, and other services to the Fund. With respect to PI’s oversight of the subadviser, the Board noted that PI’s Strategic Investment Research Group (“SIRG”), which is a business unit of PI, is responsible for monitoring and reporting to PI’s senior management on the performance and operations of the subadviser. The Board also considered that PI pays the salaries of all of the officers and non-independent Directors of the Fund. The Board also considered the investment subadvisory services provided by QMA, as well as adherence to the Fund’s investment restrictions and compliance with applicable Fund policies and procedures. The Board considered PI’s evaluation of the subadviser, as well as PI’s recommendation, based on its review of the subadviser, to renew the subadvisory agreement.
The Board considered the qualifications, backgrounds and responsibilities of PI’s senior management responsible for the oversight of the Fund and QMA, and also considered the qualifications, backgrounds and responsibilities of QMA’s portfolio managers who are responsible for the day-to-day management of the Fund’s portfolio. The Board was provided with information pertaining to PI’s and QMA’s organizational structure, senior management, investment operations, and other relevant information pertaining to both PI and QMA. The Board also noted that it received favorable compliance reports from the Fund’s Chief Compliance Officer (“CCO”) as to both PI and QMA. The Board noted that QMA is affiliated with PI.
Visit our website at www.prudentialfunds.com
The Board concluded that it was satisfied with the nature, extent and quality of the investment management services provided by PI and the subadvisory services provided to the Fund by QMA, and that there was a reasonable basis on which to conclude that the Fund benefits from the services provided by PI and QMA under the management and subadvisory agreements.
Costs of Services and Profits Realized by PI
The Board was provided with information on the profitability of PI and its affiliates in serving as the Fund’s investment manager. The Board discussed with PI the methodology utilized in assembling the information regarding profitability and considered its reasonableness. The Board recognized that it is difficult to make comparisons of profitability from fund management contracts because comparative information is not generally publicly available and is affected by numerous factors, including the structure of the particular adviser, the types of funds it manages, its business mix, numerous assumptions regarding allocations and the adviser’s capital structure and cost of capital. The Board separately considered information regarding the profitability of the subadviser, an affiliate of PI. Taking these factors into account, the Board concluded that the profitability of PI and its affiliates in relation to the services rendered was not unreasonable.
Economies of Scale
In 2013, PI and the Board retained an outside business consulting firm, in order to assist the Board in its consideration of the renewal of the management and subadvisory agreements, by reviewing management fee breakpoint usage and trends in management fees across the mutual fund industry. The consulting firm’s analysis and conclusions with respect to the Funds’ management fee structures were presented to the Board and PI at the December 3-5, 2013 meeting, and were discussed extensively by the Board and PI over the following two quarters.
The Board noted that the management fee schedule for the Fund includes breakpoints, which have the effect of decreasing the fee rate as assets increase, and that at its current level of assets the Fund’s effective fee rate reflected some of those rate reductions. The Board received and discussed information concerning whether PI realizes economies of scale as the Fund’s net assets grow beyond current levels. The Board took note that the Fund’s fee structure would result in benefits to Fund shareholders when (and if) net assets reach the levels at which the fee rate is reduced. These benefits will accrue whether or not PI is then realizing any economies of scale. The Board recognized the inherent limitations of any analysis of economies of scale, stemming largely from the Board’s understanding that most of PI’s costs are not specific to any individual funds, but rather are incurred across a variety of products and services.
Prudential International Equity Fund
Approval of Advisory Agreements (continued)
Other Benefits to PI and QMA
The Board considered potential ancillary benefits that might be received by PI and QMA and their affiliates as a result of their relationship with the Fund. The Board concluded that potential benefits to be derived by PI included fees received by affiliates of PI for serving as the Fund’s securities lending agent, transfer agency fees received by the Fund’s transfer agent (which is affiliated with PI), and benefits to its reputation as well as other intangible benefits resulting from PI’s association with the Fund. The Board concluded that the potential benefits to be derived by QMA included its ability to use soft dollar credits, as well as the potential benefits consistent with those generally resulting from an increase in assets under management, specifically, potential access to additional research resources and benefits to its reputation. The Board concluded that the benefits derived by PI and QMA were consistent with the types of benefits generally derived by investment managers and subadvisers to mutual funds.
Performance of the Fund / Fees and Expenses
The Board considered certain additional specific factors and made related conclusions relating to the historical performance of the Fund for the one-, three-, five- and ten-year periods ended December 31, 2013.
The Board also considered the Fund’s actual management fee, as well as the Fund’s net total expense ratio, for the fiscal year ended October 31, 2013. The Board considered the management fee for the Fund as compared to the management fee charged by PI to other funds and the fee charged by other advisers to comparable mutual funds in a Peer Group. The actual management fee represents the fee rate actually paid by Fund shareholders and includes any fee waivers or reimbursements. The net total expense ratio for the Fund represents the actual expense ratio incurred by Fund shareholders.
The mutual funds included in the Peer Universe (the Lipper International Large-Cap Core Funds Performance Universe) and the Peer Group were objectively determined by Lipper Inc. (“Lipper”), an independent provider of mutual fund data. The comparisons placed the Fund in various quartiles, with the first quartile being the best 25% of the mutual funds (for performance, the best performing mutual funds and, for expenses, the lowest cost mutual funds).
The section below summarizes key factors considered by the Board and the Board’s conclusions regarding the Fund’s performance, fees and overall expenses. The table sets forth gross performance comparisons (which do not reflect the impact on performance of fund expenses, or any subsidies, expense caps or waivers that may be
Visit our website at www.prudentialfunds.com
applicable) with the Peer Universe, actual management fees with the Peer Group (which reflect the impact of any subsidies or fee waivers), and net total expenses with the Peer Group, each of which were key factors considered by the Board.
| | | | | | | | |
| Performance | | 1 Year | | 3 Years | | 5 Years | | 10 Years |
| | | 2nd Quartile | | 2nd Quartile | | 3rd Quartile | | 3rd Quartile |
| Actual Management Fees: 3rd Quartile |
| Net Total Expenses: 4th Quartile |
| | • | | The Board noted that the Fund outperformed its benchmark index over the one-, three-, and five-year periods, and slightly underperformed its benchmark index over the ten-year period. |
| | • | | The Board concluded that, in light of the Fund’s improved performance, it would be in the best interests of the Fund and its shareholders to renew the agreements. |
| | • | | The Board concluded that the management fees (including subadvisory fees) and total expenses were reasonable in light of the services provided. |
* * *
After full consideration of these factors, the Board concluded that approval of the agreements was in the best interests of the Fund and its shareholders.
Prudential International Equity Fund
| | | | |
| n MAIL | | n TELEPHONE | | n WEBSITE |
Gateway Center Three 100 Mulberry Street Newark, NJ 07102 | | (800) 225-1852 | | www.prudentialfunds.com |
|
| PROXY VOTING |
| The Board of Directors of the Fund has delegated to the Fund’s investment subadviser the responsibility for voting any proxies and maintaining proxy recordkeeping with respect to the Fund. A description of these proxy voting policies and procedures is available without charge, upon request, by calling (800) 225-1852 or by visiting the Securities and Exchange Commission’s website at www.sec.gov. Information regarding how the Fund voted proxies relating to portfolio securities during the most recent 12-month period ended June 30 is available on the Fund’s website and on the Securities and Exchange Commission’s website. |
|
| DIRECTORS |
| Ellen S. Alberding • Kevin J. Bannon • Scott E. Benjamin • Linda W. Bynoe • Keith F. Hartstein • Michael S. Hyland • Douglas H. McCorkindale • Stephen P. Munn • Stuart S. Parker • James E. Quinn • Richard A. Redeker • Robin B. Smith • Stephen G. Stoneburn • Grace C. Torres |
|
| OFFICERS |
| Stuart S. Parker, President • Scott E. Benjamin, Vice President • M. Sadiq Peshimam, Treasurer and Principal Financial and Accounting Officer • Raymond A. O’Hara, Chief Legal Officer • Deborah A. Docs, Secretary • Chad A. Earnst, Chief Compliance Officer • Theresa C. Thompson, Deputy Chief Compliance Officer • Richard W. Kinville, Anti-Money Laundering Compliance Officer • Jonathan D. Shain, Assistant Secretary • Claudia DiGiacomo, Assistant Secretary • Amanda S. Ryan, Assistant Secretary • Andrew R. French, Assistant Secretary • Peter Parrella, Assistant Treasurer • Lana Lomuti, Assistant Treasurer • Linda McMullin, Assistant Treasurer |
| | | | |
| MANAGER | | Prudential Investments LLC | | Gateway Center Three
100 Mulberry Street
Newark, NJ 07102 |
|
| INVESTMENT SUBADVISER | | Quantitative Management
Associates LLC | | Gateway Center Two
100 Mulberry Street
Newark, NJ 07102 |
|
| DISTRIBUTOR | | Prudential Investment
Management Services LLC | | Gateway Center Three
100 Mulberry Street
Newark, NJ 07102 |
|
| CUSTODIAN | | The Bank of New York Mellon | | One Wall Street
New York, NY 10286 |
|
| TRANSFER AGENT | | Prudential Mutual Fund
Services LLC | | PO Box 9658
Providence, RI 02940 |
|
| INDEPENDENT REGISTERED PUBLIC ACCOUNTING FIRM | | KPMG LLP | | 345 Park Avenue
New York, NY 10154 |
|
| FUND COUNSEL | | Willkie Farr & Gallagher LLP | | 787 Seventh Avenue
New York, NY 10019 |
|
| An investor should consider the investment objectives, risks, charges, and expenses of the Fund carefully before investing. The prospectus and summary prospectus contain this and other information about the Fund. An investor may obtain a prospectus and summary prospectus by visiting our website at www.prudentialfunds.com or by calling (800) 225-1852. The prospectus and summary prospectus should be read carefully before investing. |
|
| E-DELIVERY |
| To receive your mutual fund documents online, go to www.prudentialfunds.com/edelivery and enroll. Instead of receiving printed documents by mail, you will receive notification via email when new materials are available. You can cancel your enrollment or change your email address at any time by visiting the website address above. |
|
| SHAREHOLDER COMMUNICATIONS WITH DIRECTORS |
| Shareholders can communicate directly with the Board of Directors by writing to the Chair of the Board, Prudential International Equity Fund, Prudential Investments, Attn: Board of Directors, 100 Mulberry Street, Gateway Center Three, Newark, NJ 07102. Shareholders can communicate directly with an individual Director by writing to the same address. Communications are not screened before being delivered to the addressee. |
|
| AVAILABILITY OF PORTFOLIO SCHEDULE |
| The Fund files its complete schedule of portfolio holdings with the Securities and Exchange Commission for the first and third quarters of each fiscal year on Form N-Q. The Fund’s Forms N-Q are available on the Commission’s website at www.sec.gov. The Fund’s Forms N-Q may also be reviewed and copied at the Commission’s Public Reference Room in Washington, D.C. Information on the operation and location of the Public Reference Room may be obtained by calling (202) 551-8090. The Fund’s schedule of portfolio holdings is also available on the Fund’s website as of the end of each month. |
|
| The Fund’s Statement of Additional Information contains additional information about the Fund’s Directors and is available without charge, upon request, by calling (800) 225-1852. |
Mutual Funds:
| | | | |
ARE NOT INSURED BY THE FDIC OR ANY
FEDERAL GOVERNMENT AGENCY | | MAY LOSE VALUE | | ARE NOT A DEPOSIT OF OR GUARANTEED
BY ANY BANK OR ANY BANK AFFILIATE |

PRUDENTIAL INTERNATIONAL EQUITY FUND
| | | | | | | | |
| SHARE CLASS | | A | | B | | C | | Z |
| NASDAQ | | PJRAX | | PJRBX | | PJRCX | | PJIZX |
| CUSIP | | 743969859 | | 743969867 | | 743969875 | | 743969883 |
MF190E 0270911-00001-00

PRUDENTIAL INVESTMENTS»MUTUAL FUNDS
PRUDENTIAL INTERNATIONAL VALUE FUND
ANNUAL REPORT · OCTOBER 31, 2014
Fund Type
International Stock
Objective
Long-term growth of capital
This report is not authorized for distribution to prospective investors unless preceded or accompanied by a current prospectus.
The views expressed in this report and information about the Fund’s portfolio holdings are for the period covered by this report and are subject to change thereafter.
Mutual funds are distributed by Prudential Investment Management Services LLC, a Prudential Financial company and member SIPC. © 2014 Prudential Financial, Inc. and its related entities. Prudential Investments LLC, Prudential, the Prudential logo, the Rock symbol, and Bring Your Challenges are service marks of Prudential Financial, Inc. and its related entities, registered in many jurisdictions worldwide.

December 15, 2014
Dear Shareholder:
We hope you find the annual report for the Prudential International Value Fund informative and useful. The report covers performance for the 12-month period that ended October 31, 2014. After careful review of a broad range of factors, the Board of Directors has determined it is in the best interest of shareholders to merge the Prudential International Value Fund into the Prudential International Equity Fund. It is expected that the merger will be completed in late 2014 or early 2015.
Since market conditions change over time, we believe it is important to maintain a diversified portfolio of funds consistent with your tolerance for risk, time horizon, and financial goals.
Your financial advisor can help you create a diversified investment plan that may include funds covering all the basic asset classes and that reflects your personal investor profile and risk tolerance. Keep in mind, however, that diversification and asset allocation strategies do not assure a profit or protect against loss in declining markets.
Prudential Investments® is dedicated to helping you solve your toughest investment challenges—whether it’s capital growth, reliable income, or protection from market volatility and other risks. We offer the expertise of Prudential Financial’s affiliated asset managers* that strive to be leaders in a broad range of funds to help you stay on course to the future you envision. They also manage money for major corporations and pension funds around the world, which means you benefit from the same expertise, innovation, and attention to risk demanded by today’s most sophisticated investors.
Thank you for choosing the Prudential Investments family of funds.
Sincerely,

Stuart S. Parker, President
Prudential International Value Fund
*Most of Prudential Investments’ equity funds are advised by Jennison Associates LLC, Quantitative Management Associates LLC (QMA), or Prudential Real Estate Investors. Prudential Investments’ fixed income and money market funds are advised by Prudential Investment Management, Inc. (PIM) through its Prudential Fixed Income unit. Jennison Associates, QMA, and PIM are registered investment advisers and Prudential Financial companies. Prudential Real Estate Investors is a unit of PIM.
| | | | |
| Prudential International Value Fund | | | 1 | |
Your Fund’s Performance (Unaudited)
Performance data quoted represent past performance. Past performance does not guarantee future results. The investment return and principal value of an investment will fluctuate, so that an investor’s shares, when redeemed, may be worth more or less than their original cost. Current performance may be lower or higher than the past performance data quoted. An investor may obtain performance data as of the most recent month-end by visiting our website at www.prudentialfunds.com or by calling (800) 225-1852.
| | | | | | | | | | | | |
Cumulative Total Returns (Without Sales Charges) as of 10/31/14 | |
| | | One Year | | | Five Years | | | Ten Years | |
Class A | | | –1.88 | % | | | 28.95 | % | | | 72.25 | % |
Class B | | | –2.59 | | | | 24.27 | | | | 59.55 | |
Class C | | | –2.58 | | | | 24.28 | | | | 59.71 | |
Class Z | | | –1.59 | | | | 30.73 | | | | 76.59 | |
MSCI EAFE ND Index | | | –0.60 | | | | 37.13 | | | | 75.84 | |
Lipper International Multi-Cap Core Funds Average | | | 0.16 | | | | 40.27 | | | | 74.38 | |
Lipper Customized Blend Funds Average | | | 0.18 | | | | 39.25 | | | | 76.23 | |
| | | | | | | | | | | | |
Average Annual Total Returns (With Sales Charges) as of 9/30/14 | |
| | | One Year | | | Five Years | | | Ten Years | |
Class A | | | –4.12 | % | | | 3.80 | % | | | 5.41 | % |
Class B | | | –4.28 | | | | 4.03 | | | | 5.20 | |
Class C | | | –0.29 | | | | 4.21 | | | | 5.21 | |
Class Z | | | 1.69 | | | | 5.26 | | | | 6.27 | |
MSCI EAFE ND Index | | | 4.25 | | | | 6.56 | | | | 6.32 | |
Lipper International Multi-Cap Core Funds Average | | | 3.95 | | | | 6.52 | | | | 6.02 | |
Lipper Customized Blend Funds Average | | | 4.03 | | | | 6.39 | | | | 6.14 | |
| | | | | | | | | | | | |
Average Annual Total Returns (With Sales Charges) as of 10/31/14 | |
| | | One Year | | | Five Years | | | Ten Years | |
Class A | | | –7.28 | % | | | 4.03 | % | | | 4.99 | % |
Class B | | | –7.43 | | | | 4.27 | | | | 4.78 | |
Class C | | | –3.55 | | | | 4.44 | | | | 4.79 | |
Class Z | | | –1.59 | | | | 5.51 | | | | 5.85 | |
| | | | | | | | | | | | |
Average Annual Total Returns (Without Sales Charges) as of 10/31/14 | |
| | | One Year | | | Five Years | | | Ten Years | |
Class A | | | –1.88 | % | | | 5.22 | % | | | 5.59 | % |
Class B | | | –2.59 | | | | 4.44 | | | | 4.78 | |
Class C | | | –2.58 | | | | 4.44 | | | | 4.79 | |
Class Z | | | –1.59 | | | | 5.51 | | | | 5.85 | |
| | |
| 2 | | Visit our website at www.prudentialfunds.com |
Growth of a $10,000 Investment
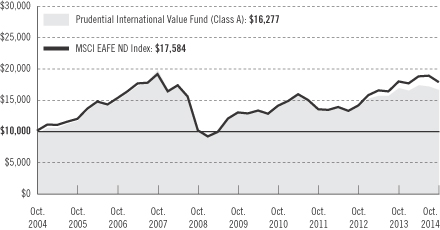
The graph compares a $10,000 investment in the Prudential International Value Fund (Class A shares) with a similar investment in the MSCI EAFE ND Index by portraying the initial account values at the beginning of the 10-year period for Class A shares (October 31, 2004) and the account values at the end of the current fiscal year (October 31, 2014) as measured on a quarterly basis. For purposes of the graph, and unless otherwise indicated, it has been assumed that (a) the maximum applicable front-end sales charge was deducted from the initial $10,000 investment in Class A shares; (b) all recurring fees (including management fees) were deducted; and (c) all dividends and distributions were reinvested. The line graph provides information for Class A shares only. As indicated in the tables provided earlier, performance for Class B, Class C, and Class Z shares will vary due to the differing charges and expenses applicable to each share class (as indicated in the following paragraphs). Without waiver of fees and/or expense reimbursement, if any, the returns would have been lower.
Past performance does not predict future performance. Total returns and the ending account values in the graph include changes in share price and reinvestment of dividends and capital gains distributions in a hypothetical investment for the periods shown. The Fund’s total returns do not reflect the deduction of income taxes on an individual’s investment. Taxes may reduce your actual investment returns on income or gains paid by the Fund or any gains you may realize if you sell your shares.
Source: Prudential Investments LLC and Lipper Inc.
| | | | |
| Prudential International Value Fund | | | 3 | |
Your Fund’s Performance (continued)
The returns in the tables do not reflect the deduction of taxes that a shareholder would pay on Fund distributions or following the redemption of Fund shares. The average annual total returns take into account applicable sales charges, which are described for each share class in the table below.
| | | | | | | | |
| | Class A | | Class B* | | Class C | | Class Z |
Maximum initial sales charge | | 5.50% of
the public
offering
price | | None | | None | | None |
Contingent deferred sales charge (CDSC) (as a percentage of the lower of original purchase price or net asset value at redemption) | | 1% on sales
of $1 million
or more
made within
12 months
of purchase | | 5% (Yr. 1)
4% (Yr. 2) 3% (Yr. 3) 2% (Yr. 4) 1% (Yr. 5/6) 0% (Yr. 7) | | 1% on sales
made within
12 months
of purchase | | None |
Annual distribution and service (12b-1) fees (shown as a percentage of average daily net assets) | | .30%
(.25%
currently) | | 1% | | 1% | | None |
*Class B shares are closed to all purchase activity and no additional Class B shares may be purchased or acquired except by exchange from Class B shares of another Fund or through dividend or capital gains reinvestment.
Benchmark Definitions
Morgan Stanley Capital International Europe, Australasia, and Far East Net Dividend Index
The Morgan Stanley Capital International Europe, Australasia, and Far East Index (MSCI EAFE ND Index) is an unmanaged, weighted index of performance that reflects stock price movements of developed-country markets in Europe, Australasia, and the Far East. The Net Dividend (ND) version of the MSCI EAFE Index reflects the impact of the maximum withholding taxes on reinvested dividends.
Lipper International Multi-Cap Core Funds Average
The Lipper International Multi-Cap Core Funds Average (Lipper Average) represents returns based on the average return of all funds in the Lipper International Multi-Cap Core Funds category for the periods noted. The Lipper Average includes funds that, by portfolio practice, invest in a variety of market-capitalization ranges without concentrating 75% of their equity assets in any one market-capitalization range over an extended period of time. International multi-cap core funds typically have average characteristics compared to the MSCI EAFE Index.
Lipper Customized Blend Funds Average
The Lipper Customized Blend Funds Average is a 50/50 blend of the Lipper International Multi-Cap Core Funds and Lipper International Large-Cap Core Funds Averages.
Note: Although Lipper classifies the Prudential International Value Fund in the Lipper International Multi-Cap Core Funds Performance Universe, the Lipper Customized Blend Funds Performance Universe is utilized because the Fund’s investment manager believes that the funds included in this custom blend universe provide a more appropriate basis for Fund performance comparisons.
| | |
| 4 | | Visit our website at www.prudentialfunds.com |
Investors cannot invest directly in an index or average. The returns for the Index would be lower if they included the effects of sales charges, operating expenses, or taxes. Returns for the Lipper Averages reflect the deduction of operating expenses of a mutual fund, but not sales charges or taxes.
| | | | |
Five Largest Holdings expressed as a percentage of net assets as of 10/31/14 | | | | |
Novartis AG, Pharmaceuticals | | | 1.9 | % |
Total SA, Oil, Gas & Consumable Fuels | | | 1.7 | |
ING Groep NV, Banks | | | 1.6 | |
Nippon Telegraph & Telephone Corp., Diversified Telecommunication Services | | | 1.5 | |
Royal Dutch Shell PLC (Class B Stock), Oil, Gas & Consumable Fuels | | | 1.4 | |
Holdings reflect only long-term investments and are subject to change.
| | | | |
Five Largest Industries expressed as a percentage of net assets as of 10/31/14 | | | | |
Banks | | | 12.5 | % |
Pharmaceuticals | | | 8.6 | |
Insurance | | | 7.9 | |
Oil, Gas & Consumable Fuels | | | 6.2 | |
Diversified Telecommunication Services | | | 3.3 | |
Industry weightings reflect only long-term investments and are subject to change.
| | | | |
| Prudential International Value Fund | | | 5 | |
Strategy and Performance Overview
How did the Fund perform?
The Prudential International Value Fund’s Class A shares declined by 1.88% for the 12-month reporting period ended October 31, 2014, underperforming the 0.60% decline of the Morgan Stanley Capital International Europe, Australasia, and Far East Net Dividend Index (MSCI EAFE ND Index (the Index)), the 0.16% gain of the Lipper International Multi-Cap Core Funds Average, and the 0.18% gain of the Lipper Customized Blend Funds Average.
After careful review of a broad range of factors, including performance, expenses, asset levels, and the investment objectives and policies of the Prudential International Value Fund and Prudential International Equity Fund, the Board of Directors has determined it is in the best interest of shareholders to merge the Prudential International Value Fund into the Prudential International Equity Fund. It is expected that the merger will be completed in late 2014 or early 2015.
LSV Asset Management (LSV) and Thornburg Investment Management, Inc. (Thornburg) are co-subadvisers of the Fund.
How did international stock markets perform?
Over the reporting period, all international regions and sectors, as listed in the Index, turned in relatively flat returns. At the start of the year global indexes were essentially unchanged as optimism was tempered in the US, Europe, and Japan, and a series of negative developments occurred in emerging markets. Japan underperformed while European markets were somewhat more resilient. This was followed by the second quarter’s global rally as Europe continued its recovery and Japan performed positively as well.
However, in the final three months of the reporting period, markets outside of the US posted steep declines due to geopolitical strife, concerns about China’s slowdown, and the fears of potentially detrimental effects of rising US interest rates. Most importantly, the strength of the US Dollar, which gained nearly 8% versus the euro and yen, negatively impacted currency translation for Europe and Asia. Developed markets in the Asia-Pacific region held up better than most markets in Europe, while emerging Asian markets generated mixed results.
What made the most positive and negative contributions to the Fund’s performance?
| | • | | The Fund underperformed the Index during the period due to both stock selection and allocation effects. An overweight position in the consumer discretionary sector (one the Index’s worst performing groups) detracted from relative results; additionally, the Fund’s holdings failed to keep up with the group’s return within the Index. |
| | |
| 6 | | Visit our website at www.prudentialfunds.com |
| | • | | The Fund also struggled with stock selection in the consumer staples and utilities sectors. On a positive note, selection was quite strong in the telecommunication services sectors. From a regional standpoint, the Fund’s stock selection in Western Europe was a detractor; this was offset somewhat by strong results from North America and the Pacific Rim regions versus the Index. |
| | • | | LSV’s portion of the Fund outperformed the Index, while Thornburg’s portion underperformed during the reporting period. LSV outperformed largely due to stock selection; its results were strongest in the financials, telecommunications, and consumer discretionary sectors. From a country perspective, holdings in Japan, the US, and New Zealand benefited the most. The Thornburg portion of the Fund underperformed due to negative stock selection and allocation effects; the total impact was negative versus the Index in five of the ten sectors. The largest areas of weakness were in the consumer discretionary and financials sectors. From a country allocation perspective, Thornburg’s underexposure to Japan detracted from relative results. Additionally, exposure to the UK and Germany detracted significantly. |
Did the Fund use derivatives and how did they affect performance?
From time to time, Thornburg will use currency forwards (a form of a derivative security) as a tool to hedge some of the currency risk from investing in stocks outside of the US. This intermittent hedging strategy is not expected to have a significant impact on the overall performance of the Fund. During the reporting period, foreign exchange hedging had a slightly positive effect on the Fund.
| | | | |
| Prudential International Value Fund | | | 7 | |
Fees and Expenses (Unaudited)
As a shareholder of the Fund, you incur two types of costs: (1) transaction costs, including sales charges (loads) on purchase payments and redemptions, as applicable, and (2) ongoing costs, including management fees, distribution, and/or service (12b-1) fees, and other Fund expenses, as applicable. This example is intended to help you understand your ongoing costs (in dollars) of investing in the Fund and to compare these costs with the ongoing costs of investing in other mutual funds.
The example is based on an investment of $1,000 invested on May 1, 2014, at the beginning of the period, and held through the six-month period ended October 31, 2014. The example is for illustrative purposes only; you should consult the Prospectus for information on initial and subsequent minimum investment requirements.
Actual Expenses
The first line for each share class in the table on the following page provides information about actual account values and actual expenses. You may use the information on this line, together with the amount you invested, to estimate the expenses that you paid over the period. Simply divide your account value by $1,000 (for example, an $8,600 account value ÷ $1,000 = 8.6), then multiply the result by the number on the first line under the heading “Expenses Paid During the Six-Month Period” to estimate the expenses you paid on your account during this period.
Hypothetical Example for Comparison Purposes
The second line for each share class in the table on the following page provides information about hypothetical account values and hypothetical expenses based on the Fund’s actual expense ratio and an assumed rate of return of 5% per year before expenses, which is not the Fund’s actual return. The hypothetical account values and expenses may not be used to estimate the actual ending account balance or expenses you paid for the period. You may use this information to compare the ongoing costs of investing in the Fund and other funds. To do so, compare this 5% hypothetical example with the 5% hypothetical examples that appear in the shareholder reports of the other funds.
The Fund’s transfer agent may charge additional fees to holders of certain accounts that are not included in the expenses shown in the table on the following page. These fees apply to individual retirement accounts (IRAs) and Section 403(b) accounts. As of the close of the six-month period covered by the table, IRA fees included an annual maintenance fee of $15 per account (subject to a maximum annual maintenance fee of $25 for all accounts held by the same shareholder). Section 403(b) accounts are charged an annual $25 fiduciary maintenance fee. Some of the fees may vary in amount, or may be waived, based on your total account balance or the number of
| | |
| 8 | | Visit our website at www.prudentialfunds.com |
Prudential Investments funds, including the Fund, that you own. You should consider the additional fees that were charged to your Fund account over the six-month period when you estimate the total ongoing expenses paid over the period and the impact of these fees on your ending account value, as these additional expenses are not reflected in the information provided in the expense table. Additional fees have the effect of reducing investment returns.
Please note that the expenses shown in the table are meant to highlight your ongoing costs only and do not reflect any transactional costs such as sales charges (loads). Therefore, the second line for each share class in the table is useful in comparing ongoing costs only and will not help you determine the relative total costs of owning different funds. In addition, if these transactional costs were included, your costs would have been higher.
| | | | | | | | | | | | | | | | | | |
Prudential
International
Value Fund | | Beginning Account
Value
May 1, 2014 | | | Ending Account
Value
October 31, 2014 | | | Annualized
Expense Ratio
Based on the
Six-Month Period | | | Expenses Paid
During the
Six-Month Period* | |
| | | | | | | | | | | | | | | | | | |
| Class A | | Actual | | $ | 1,000.00 | | | $ | 957.20 | | | | 1.89 | % | | $ | 9.32 | |
| | | Hypothetical | | $ | 1,000.00 | | | $ | 1,015.63 | | | | 1.89 | % | | $ | 9.60 | |
| | | | | | | | | | | | | | | | | | |
| Class B | | Actual | | $ | 1,000.00 | | | $ | 953.80 | | | | 2.64 | % | | $ | 13.00 | |
| | | Hypothetical | | $ | 1,000.00 | | | $ | 1,011.85 | | | | 2.64 | % | | $ | 13.39 | |
| | | | | | | | | | | | | | | | | | |
| Class C | | Actual | | $ | 1,000.00 | | | $ | 953.90 | | | | 2.64 | % | | $ | 13.00 | |
| | | Hypothetical | | $ | 1,000.00 | | | $ | 1,011.85 | | | | 2.64 | % | | $ | 13.39 | |
| | | | | | | | | | | | | | | | | | |
| Class Z | | Actual | | $ | 1,000.00 | | | $ | 958.80 | | | | 1.64 | % | | $ | 8.10 | |
| | | Hypothetical | | $ | 1,000.00 | | | $ | 1,016.89 | | | | 1.64 | % | | $ | 8.34 | |
| | | | | | | | | | | | | | | | | | |
*Fund expenses (net of fee waivers or subsidies, if any) for each share class are equal to the annualized expense ratio for each share class (provided in the table), multiplied by the average account value over the period, multiplied by the 184 days in the six-month period ended October 31, 2014, and divided by the 365 days in the Fund’s fiscal year ended October 31, 2014 (to reflect the six-month period). Expenses presented in the table include the expenses of any underlying funds in which the Fund may invest.
| | | | |
| Prudential International Value Fund | | | 9 | |
Fees and Expenses (continued)
The Fund’s annualized expense ratios for the year ended October 31, 2014, are as follows:
| | | | | | | | |
| Class | | Gross Operating Expenses | | | Net Operating Expenses | |
A | | | 2.07 | % | | | 1.90 | % |
B | | | 2.77 | | | | 2.65 | |
C | | | 2.78 | | | | 2.65 | |
Z | | | 1.65 | | | | 1.59 | |
Net operating expenses shown above reflect any fee waivers and/or expense reimbursements. Additional information on Fund expenses and any fee waivers and/or expense reimbursements can be found in the “Financial Highlights” tables in this report and in the Notes to the Financial Statements in this report.
| | |
| 10 | | Visit our website at www.prudentialfunds.com |
Portfolio of Investments
as of October 31, 2014
| | | | | | | | |
| Description | | Shares | | | Value (Note 1) | |
LONG-TERM INVESTMENTS 97.8% | | | | | | | | |
| | |
COMMON STOCKS 97.5% | | | | | | | | |
| | |
Australia 3.2% | | | | | | | | |
Arrium Ltd. | | | 175,200 | | | $ | 52,015 | |
Ausdrill Ltd. | | | 42,900 | | | | 23,202 | |
Bendigo & Adelaide Bank Ltd. | | | 16,800 | | | | 184,497 | |
Bradken Ltd. | | | 29,500 | | | | 100,631 | |
Challenger Ltd. | | | 32,000 | | | | 196,822 | |
Downer EDI Ltd. | | | 35,500 | | | | 149,911 | |
Fortescue Metals Group Ltd. | | | 26,500 | | | | 81,788 | |
Lend Lease Group | | | 15,500 | | | | 216,180 | |
Metcash Ltd. | | | 42,000 | | | | 104,898 | |
Mineral Resources Ltd. | | | 11,000 | | | | 82,456 | |
National Australia Bank Ltd. | | | 5,700 | | | | 176,335 | |
Pacific Brands Ltd. | | | 88,300 | | | | 36,693 | |
Primary Health Care Ltd. | | | 33,900 | | | | 138,924 | |
Toll Holdings Ltd. | | | 25,300 | | | | 126,759 | |
| | | | | | | | |
| | | | | | | 1,671,111 | |
| | |
Austria 0.6% | | | | | | | | |
OMV AG | | | 5,800 | | | | 182,311 | |
Voestalpine AG | | | 3,800 | | | | 152,220 | |
| | | | | | | | |
| | | | | | | 334,531 | |
| | |
Belgium 0.7% | | | | | | | | |
AGFA-Gevaert NV* | | | 32,700 | | | | 82,448 | |
Delhaize Group SA | | | 3,800 | | | | 259,824 | |
Dexia SA* | | | 4,935 | | | | 167 | |
| | | | | | | | |
| | | | | | | 342,439 | |
| | |
Canada 0.7% | | | | | | | | |
Canadian National Railway Co. | | | 5,233 | | | | 368,940 | |
| | |
China 2.5% | | | | | | | | |
Baidu, Inc., ADR* | | | 1,514 | | | | 361,497 | |
China Mobile Ltd. | | | 36,093 | | | | 449,088 | |
Industrial & Commercial Bank of China Ltd. (Class H Stock) | | | 152,536 | | | | 101,278 | |
Tencent Holdings Ltd. | | | 24,654 | | | | 396,246 | |
| | | | | | | | |
| | | | | | | 1,308,109 | |
See Notes to Financial Statements.
| | | | |
| Prudential International Value Fund | | | 11 | |
Portfolio of Investments
as of October 31, 2014 continued
| | | | | | | | |
| Description | | Shares | | | Value (Note 1) | |
COMMON STOCKS (Continued) | | | | | |
| | |
Denmark 1.1% | | | | | | | | |
Novo Nordisk A/S (Class B Stock) | | | 12,366 | | | $ | 558,977 | |
| | |
Finland 0.4% | | | | | | | | |
Tieto OYJ | | | 8,700 | | | | 220,580 | |
| | |
France 10.7% | | | | | | | | |
Accor SA | | | 8,181 | | | | 343,702 | |
Alstom SA* | | | 6,000 | | | | 209,419 | |
AXA SA | | | 9,100 | | | | 210,197 | |
BNP Paribas SA | | | 3,700 | | | | 232,515 | |
Cie Generale des Etablissements Michelin | | | 3,914 | | | | 339,958 | |
Compagnie de Saint-Gobain | | | 4,300 | | | | 184,835 | |
Credit Agricole SA | | | 12,800 | | | | 189,418 | |
Electricite de France SA | | | 5,500 | | | | 162,406 | |
LVMH Moet Hennessy Louis Vuitton SA | | | 2,942 | | | | 499,387 | |
Pernod Ricard SA | | | 2,589 | | | | 294,917 | |
Publicis Groupe SA | | | 4,015 | | | | 278,471 | |
Renault SA | | | 2,200 | | | | 163,650 | |
Safran SA | | | 4,861 | | | | 307,864 | |
Sanofi | | | 3,000 | | | | 272,220 | |
SCOR SE | | | 3,900 | | | | 119,505 | |
Societe Generale SA | | | 2,800 | | | | 134,935 | |
Thales SA | | | 5,100 | | | | 253,266 | |
Total SA | | | 14,802 | | | | 883,727 | |
Valeo SA | | | 2,400 | | | | 269,113 | |
Vallourec SA | | | 6,275 | | | | 229,333 | |
| | | | | | | | |
| | | | | | | 5,578,838 | |
| | |
Germany 5.5% | | | | | | | | |
Allianz SE | | | 2,000 | | | | 318,044 | |
Aurubis AG | | | 2,300 | | | | 120,065 | |
BASF SE | | | 1,700 | | | | 150,212 | |
Daimler AG | | | 4,900 | | | | 382,047 | |
Deutsche Bank AG | | | 4,700 | | | | 146,975 | |
E.ON SE | | | 7,600 | | | | 131,025 | |
Freenet AG | | | 7,800 | | | | 204,654 | |
Fresenius Medical Care AG & Co. KGaA | | | 3,575 | | | | 262,397 | |
Hannover Rueck SE | | | 2,000 | | | | 166,935 | |
Merck KGaA | | | 2,700 | | | | 244,415 | |
Muenchener Rueckversicherungs-Gesellschaft AG | | | 1,400 | | | | 275,643 | |
See Notes to Financial Statements.
| | | | | | | | |
| Description | | Shares | | | Value (Note 1) | |
COMMON STOCKS (Continued) | | | | | |
| | |
Germany (cont’d.) | | | | | | | | |
Rheinmetall AG | | | 3,000 | | | $ | 129,260 | |
Stada Arzneimittel AG | | | 2,300 | | | | 88,621 | |
Volkswagen AG | | | 1,300 | | | | 277,248 | |
| | | | | | | | |
| | | | | | | 2,897,541 | |
| | |
Hong Kong 4.5% | | | | | | | | |
AIA Group Ltd. | | | 121,530 | | | | 678,189 | |
Cheung Kong Holdings Ltd. | | | 9,000 | | | | 159,771 | |
China Resources Cement Holdings Ltd. | | | 184,000 | | | | 125,120 | |
First Pacific Co. Ltd. | | | 112,000 | | | | 120,871 | |
Galaxy Entertainment Group Ltd. | | | 53,475 | | | | 365,657 | |
Hong Kong Exchanges and Clearing Ltd. | | | 11,910 | | | | 263,980 | |
Huabao International Holdings Ltd. | | | 354,000 | | | | 253,129 | |
Kingboard Chemical Holdings Ltd. | | | 69,720 | | | | 137,359 | |
Yue Yuen Industrial Holdings Ltd. | | | 68,200 | | | | 228,946 | |
| | | | | | | | |
| | | | | | | 2,333,022 | |
| | |
India 1.0% | | | | | | | | |
ICICI Bank Ltd., ADR | | | 9,536 | | | | 537,449 | |
| | |
Ireland 0.4% | | | | | | | | |
Permanent TSB Group Holdings PLC* | | | 15,600 | | | | 1,408 | |
Smurfit Kappa Group PLC | | | 9,500 | | | | 196,286 | |
| | | | | | | | |
| | | | | | | 197,694 | |
| | |
Israel 0.9% | | | | | | | | |
Bank Hapoalim BM | | | 21,500 | | | | 110,679 | |
Elbit Systems Ltd. | | | 2,300 | | | | 139,898 | |
Teva Pharmaceutical Industries Ltd. | | | 3,700 | | | | 208,855 | |
| | | | | | | | |
| | | | | | | 459,432 | |
| | |
Italy 1.6% | | | | | | | | |
Enel SpA | | | 52,200 | | | | 266,738 | |
Eni SpA | | | 14,200 | | | | 302,529 | |
Intesa Sanpaolo SpA | | | 82,004 | | | | 241,072 | |
| | | | | | | | |
| | | | | | | 810,339 | |
| | |
Japan 18.1% | | | | | | | | |
Alfresa Holdings Corp. | | | 9,600 | | | | 121,823 | |
Alpine Electronics, Inc. | | | 8,373 | | | | 142,923 | |
See Notes to Financial Statements.
| | | | |
| Prudential International Value Fund | | | 13 | |
Portfolio of Investments
as of October 31, 2014 continued
| | | | | | | | |
| Description | | Shares | | | Value (Note 1) | |
COMMON STOCKS (Continued) | | | | | |
| | |
Japan (cont’d.) | | | | | | | | |
Aoyama Trading Co. Ltd. | | | 8,400 | | | $ | 199,794 | |
FANUC Corp. | | | 1,252 | | | | 220,647 | |
Fukuoka Financial Group, Inc. | | | 39,000 | | | | 199,565 | |
Fuyo General Lease Co. Ltd. | | | 4,300 | | | | 169,770 | |
Heiwa Corp. | | | 12,700 | | | | 260,050 | |
Japan Tobacco, Inc. | | | 4,795 | | | | 163,601 | |
JX Holdings, Inc. | | | 23,900 | | | | 102,379 | |
KDDI Corp. | | | 3,400 | | | | 223,276 | |
Keihin Corp. | | | 9,400 | | | | 118,760 | |
Kubota Corp. | | | 23,689 | | | | 377,082 | |
KYORIN Holdings, Inc. | | | 5,300 | | | | 111,659 | |
Kyowa Exeo Corp. | | | 16,200 | | | | 198,373 | |
Marubeni Corp. | | | 29,000 | | | | 186,454 | |
Miraca Holdings, Inc. | | | 2,400 | | | | 100,751 | |
Mitsubishi Corp. | | | 5,900 | | | | 115,689 | |
Mitsubishi UFJ Financial Group, Inc. | | | 33,400 | | | | 194,696 | |
Mitsui & Co. Ltd. | | | 18,800 | | | | 283,862 | |
Mizuho Financial Group, Inc. | | | 186,800 | | | | 340,409 | |
Morinaga Milk Industry Co. Ltd. | | | 66,000 | | | | 220,678 | |
Nichi-iko Pharmaceutical Co. Ltd. | | | 8,600 | | | | 142,159 | |
Nippon Telegraph & Telephone Corp. | | | 12,808 | | | | 796,899 | |
Nishi-Nippon City Bank Ltd. (The) | | | 48,000 | | | | 131,578 | |
NTT DoCoMo, Inc. | | | 16,200 | | | | 273,227 | |
Olympus Corp.* | | | 11,088 | | | | 398,115 | |
Otsuka Holdings Co. Ltd. | | | 5,800 | | | | 203,453 | |
Resona Holdings, Inc. | | | 65,400 | | | | 374,074 | |
Sankyu, Inc. | | | 29,000 | | | | 134,075 | |
Seino Holdings Co. Ltd. | | | 6,000 | | | | 47,045 | |
Shimachu Co. Ltd. | | | 6,200 | | | | 159,627 | |
SKY Perfect JSAT Holdings, Inc. | | | 28,100 | | | | 172,500 | |
Sumitomo Corp. | | | 15,100 | | | | 161,113 | |
Sumitomo Metal Mining Co. Ltd. | | | 9,000 | | | | 124,853 | |
Sumitomo Mitsui Financial Group, Inc. | | | 8,700 | | | | 354,811 | |
Toagosei Co. Ltd. | | | 33,000 | | | | 144,224 | |
Tokyo Electron Ltd. | | | 6,840 | | | | 438,544 | |
Toppan Forms Co. Ltd. | | | 16,700 | | | | 157,505 | |
Toyota Motor Corp. | | | 11,971 | | | | 720,381 | |
Tsumura & Co. | | | 4,300 | | | | 96,216 | |
West Japan Railway Co. | | | 2,800 | | | | 133,463 | |
Yokohama Rubber Co. Ltd. (The) | | | 31,000 | | | | 281,404 | |
| | | | | | | | |
| | | | | | | 9,497,507 | |
See Notes to Financial Statements.
| | | | | | | | |
| Description | | Shares | | | Value (Note 1) | |
COMMON STOCKS (Continued) | | | | | |
| | |
Liechtenstein 0.2% | | | | | | | | |
VP Bank AG | | | 1,400 | | | $ | 116,115 | |
| | |
Luxembourg 0.2% | | | | | | | | |
Altice SA* | | | 1,700 | | | | 105,857 | |
| | |
Netherlands 4.9% | | | | | | | | |
Aegon NV | | | 18,800 | | | | 153,228 | |
ASML Holding NV | | | 2,762 | | | | 275,405 | |
ING Groep NV, CVA* | | | 59,828 | | | | 856,758 | |
Koninklijke Ahold NV | | | 15,415 | | | | 258,180 | |
Koninklijke Philips NV | | | 10,135 | | | | 283,353 | |
Royal Dutch Shell PLC (Class B Stock) | | | 20,300 | | | | 749,989 | |
| | | | | | | | |
| | | | | | | 2,576,913 | |
| | |
New Zealand 0.4% | | | | | | | | |
Air New Zealand Ltd. | | | 142,300 | | | | 225,273 | |
| | |
Norway 1.1% | | | | | | | | |
DnB ASA | | | 10,900 | | | | 200,258 | |
Statoil ASA | | | 8,300 | | | | 189,949 | |
Yara International ASA | | | 4,500 | | | | 206,646 | |
| | | | | | | | |
| | | | | | | 596,853 | |
| | |
Panama 0.4% | | | | | | | | |
Copa Holdings SA (Class A Stock) | | | 1,636 | | | | 191,281 | |
| | |
Singapore 0.7% | | | | | | | | |
DBS Group Holdings Ltd. | | | 26,000 | | | | 374,021 | |
| | |
South Africa 0.2% | | | | | | | | |
Mondi PLC | | | 6,900 | | | | 116,613 | |
| | |
Spain 2.8% | | | | | | | | |
Amadeus IT Holding SA (Class A Stock) | | | 7,708 | | | | 283,594 | |
Banco Bilbao Vizcaya Argentaria SA | | | 42,287 | | | | 472,975 | |
Banco Santander SA | | | 22,300 | | | | 197,032 | |
Repsol SA | | | 17,300 | | | | 386,637 | |
Telefonica SA | | | 8,000 | | | | 120,381 | |
| | | | | | | | |
| | | | | | | 1,460,619 | |
See Notes to Financial Statements.
| | | | |
| Prudential International Value Fund | | | 15 | |
Portfolio of Investments
as of October 31, 2014 continued
| | | | | | | | |
| Description | | Shares | | | Value (Note 1) | |
COMMON STOCKS (Continued) | | | | | |
| | |
Sweden 2.5% | | | | | | | | |
Boliden AB | | | 8,600 | | | $ | 142,135 | |
Hennes & Mauritz AB (Class B Stock) | | | 5,938 | | | | 236,923 | |
Oriflame Cosmetics SA, SDR | | | 5,700 | | | | 99,637 | |
Securitas AB (Class B Stock) | | | 12,600 | | | | 139,427 | |
Svenska Cellulosa AB SCA (Class B Stock) | | | 10,418 | | | | 233,431 | |
Swedbank AB (Class A Stock) | | | 8,900 | | | | 235,856 | |
TeliaSonera AB | | | 33,900 | | | | 234,750 | |
| | | | | | | | |
| | | | | | | 1,322,159 | |
| | |
Switzerland 9.1% | | | | | | | | |
Baloise Holding AG | | | 2,200 | | | | 276,946 | |
Credit Suisse Group AG* | | | 8,200 | | | | 218,479 | |
Georg Fischer AG* | | | 400 | | | | 231,030 | |
Holcim Ltd.* | | | 5,860 | | | | 415,911 | |
Julius Baer Group Ltd.* | | | 6,865 | | | | 300,946 | |
Lonza Group AG* | | | 600 | | | | 66,112 | |
Nestle SA | | | 6,425 | | | | 471,172 | |
Novartis AG | | | 10,704 | | | | 993,362 | |
Roche Holding AG | | | 1,222 | | | | 360,614 | |
Swiss Life Holding AG* | | | 1,100 | | | | 252,385 | |
Swiss Re AG* | | | 5,400 | | | | 436,649 | |
UBS AG* | | | 24,783 | | | | 430,930 | |
Zurich Insurance Group AG* | | | 1,000 | | | | 302,629 | |
| | | | | | | | |
| | | | | | | 4,757,165 | |
| | |
Taiwan 0.5% | | | | | | | | |
Taiwan Semiconductor Manufacturing Co. Ltd., ADR | | | 12,915 | | | | 284,388 | |
| | |
United Kingdom 18.4% | | | | | | | | |
Alent PLC | | | 4,673 | | | | 25,267 | |
AMEC PLC | | | 5,100 | | | | 85,038 | |
Anglo American PLC | | | 9,400 | | | | 198,466 | |
AstraZeneca PLC | | | 5,400 | | | | 394,460 | |
Aviva PLC | | | 68,281 | | | | 571,117 | |
BAE Systems PLC | | | 63,500 | | | | 467,628 | |
Barclays PLC | | | 56,600 | | | | 217,678 | |
Beazley PLC | | | 31,500 | | | | 132,306 | |
BP PLC | | | 76,000 | | | | 546,810 | |
BT Group PLC | | | 107,473 | | | | 633,586 | |
Burberry Group PLC | | | 8,746 | | | | 214,919 | |
See Notes to Financial Statements.
| | | | | | | | |
| Description | | Shares | | | Value (Note 1) | |
COMMON STOCKS (Continued) | | | | | |
| |
United Kingdom (cont’d.) | | | | | |
Centrica PLC | | | 49,700 | | | $ | 241,043 | |
Compass Group PLC | | | 30,279 | | | | 488,729 | |
Dairy Crest Group PLC | | | 24,700 | | | | 164,997 | |
Experian PLC | | | 26,691 | | | | 401,328 | |
GlaxoSmithKline PLC | | | 6,500 | | | | 146,990 | |
Home Retail Group PLC | | | 40,400 | | | | 118,555 | |
Intermediate Capital Group PLC | | | 25,000 | | | | 164,342 | |
ITV PLC | | | 108,951 | | | | 353,946 | |
J. Sainsbury PLC | | | 53,500 | | | | 210,766 | |
Kingfisher PLC | | | 96,085 | | | | 465,478 | |
Legal & General Group PLC | | | 21,000 | | | | 77,832 | |
Liberty Global PLC (Class C Stock)* | | | 11,662 | | | | 518,609 | |
Lloyds Banking Group PLC* | | | 308,928 | | | | 381,490 | |
Marston’s PLC | | | 48,900 | | | | 117,963 | |
Old Mutual PLC | | | 65,800 | | | | 204,346 | |
Petrofac Ltd. | | | 6,900 | | | | 116,909 | |
Reckitt Benckiser Group PLC | | | 6,545 | | | | 551,240 | |
Rio Tinto Ltd. | | | 4,700 | | | | 250,973 | |
Rio Tinto PLC | | | 4,482 | | | | 213,259 | |
SABMiller PLC | | | 5,503 | | | | 311,265 | |
Tesco PLC | | | 51,800 | | | | 143,796 | |
Tullett Prebon PLC | | | 37,100 | | | | 168,721 | |
Vesuvius PLC | | | 14,800 | | | | 101,045 | |
WM Morrison Supermarkets PLC | | | 88,600 | | | | 219,983 | |
| | | | | | | | |
| | | | | | | 9,620,880 | |
| | |
United States 4.2% | | | | | | | | |
Accenture PLC (Class A Stock) | | | 947 | | | | 76,821 | |
Actavis PLC* | | | 2,415 | | | | 586,217 | |
Lululemon Athletica, Inc.* | | | 5,979 | | | | 249,025 | |
MasterCard, Inc. (Class A Stock) | | | 7,684 | | | | 643,535 | |
Nielsen NV | | | 6,754 | | | | 286,978 | |
Schlumberger Ltd. | | | 3,423 | | | | 337,713 | |
| | | | | | | | |
| | | | | | | 2,180,289 | |
| | | | | | | | |
TOTAL COMMON STOCKS
(cost $44,186,776) | | | | | | | 51,044,935 | |
| | | | | | | | |
See Notes to Financial Statements.
| | | | |
| Prudential International Value Fund | | | 17 | |
Portfolio of Investments
as of October 31, 2014 continued
| | | | | | | | |
| Description | | Shares | | | Value (Note 1) | |
PREFERRED STOCK 0.3% | | | | | | | | |
| | |
Brazil | | | | | | | | |
Itau Unibanco Holding SA, ADR (PRFC)
(cost $157,598) | | | 11,812 | | | $ | 174,345 | |
| | | | | | | | |
TOTAL LONG-TERM INVESTMENTS
(cost $44,344,374) | | | | | | | 51,219,280 | |
| | | | | | | | |
| | |
SHORT-TERM INVESTMENT 1.6% | | | | | | | | |
| | |
AFFILIATED MONEY MARKET MUTUAL FUND | | | | | | | | |
Prudential Investment Portfolios 2 - Prudential Core Taxable Money Market Fund
(cost $854,852)(a) | | | 854,852 | | | | 854,852 | |
| | | | | | | | |
TOTAL INVESTMENTS 99.4%
(cost $45,199,226; Note 5) | | | | | | | 52,074,132 | |
Other assets in excess of liabilities(b) 0.6% | | | | | | | 293,607 | |
| | | | | | | | |
NET ASSETS 100.0% | | | | | | $ | 52,367,739 | |
| | | | | | | | |
The following abbreviations are used in the portfolio descriptions:
ADR—American Depositary Receipt
CVA—Certificate Van Aandelen (Bearer)
PRFC—Preference Shares
SDR—Swedish Depositary Receipt
EUR—Euro
JPY—Japanese Yen
| * | Non-income producing security. |
| (a) | Prudential Investments LLC, the manager of the Series also serves as manager of the Prudential Investment Portfolios 2 - Prudential Core Taxable Money Market Fund. |
| (b) | Includes net unrealized appreciation (depreciation) on the following derivative contracts held at reporting period end: |
Forward foreign currency exchange contracts outstanding at October 31, 2014:
| | | | | | | | | | | | | | | | | | |
Purchase Contracts | | Counterparty | | Notional
Amount
(000) | | | Value at
Settlement
Date
Payable | | | Current
Value | | | Unrealized
Depreciation | |
Japanese Yen, | | | | | | | | | | | | | | | | | | |
Expiring 04/02/15 | | State Street Bank | | | JPY 55,209 | | | $ | 493,788 | | | $ | 492,391 | | | $ | (1,397 | ) |
| | | | | | | | | | | | | | | | | | |
See Notes to Financial Statements.
| | | | | | | | | | | | | | | | | | |
Sale Contracts | | Counterparty | | Notional
Amount
(000) | | | Value at
Settlement
Date
Receivable | | | Current
Value | | | Unrealized
Appreciation | |
Euro, | | | | | | | | | | | | | | | | | | |
Expiring 04/28/15 | | State Street Bank | | EUR | 2,226 | | | $ | 2,826,223 | | | $ | 2,792,456 | | | $ | 33,767 | |
Japanese Yen, | | | | | | | | | | | | | | | | | | |
Expiring 04/02/15 | | State Street Bank | | JPY | 191,190 | | | | 1,746,586 | | | | 1,705,158 | | | | 41,428 | |
| | | | | | | | | | | | | | | | | | |
| | | | | | | | $ | 4,572,809 | | | $ | 4,497,614 | | | $ | 75,195 | |
| | | | | | | | | | | | | | | | | | |
Various inputs are used in determining the value of the Series’ investments. These inputs are summarized in the three broad levels listed below.
Level 1—quoted prices generally in active markets for identical securities.
Level 2—quoted prices for similar securities, interest rates and yield curves, prepayment speeds, foreign currency exchange rates, and other significant observable inputs.
Level 3—significant unobservable inputs for securities valued in accordance with Board approved fair valuation procedures.
The following is a summary of the inputs used as of October 31, 2014 in valuing such portfolio securities:
| | | | | | | | | | | | |
| | | Level 1 | | | Level 2 | | | Level 3 | |
Investments in Securities | | | | | | | | | | | | |
Common Stocks | | | | | | | | | | | | |
Australia | | $ | — | | | $ | 1,671,111 | | | $ | — | |
Austria | | | — | | | | 334,531 | | | | — | |
Belgium | | | 82,615 | | | | 259,824 | | | | — | |
Canada | | | 368,940 | | | | — | | | | — | |
China | | | 361,497 | | | | 946,612 | | | | — | |
Denmark | | | — | | | | 558,977 | | | | — | |
Finland | | | — | | | | 220,580 | | | | — | |
France | | | — | | | | 5,578,838 | | | | — | |
Germany | | | — | | | | 2,897,541 | | | | — | |
Hong Kong | | | — | | | | 2,333,022 | | | | — | |
India | | | 537,449 | | | | — | | | | — | |
Ireland | | | 1,408 | | | | 196,286 | | | | — | |
Israel | | | — | | | | 459,432 | | | | — | |
Italy | | | — | | | | 810,339 | | | | — | |
See Notes to Financial Statements.
| | | | |
| Prudential International Value Fund | | | 19 | |
Portfolio of Investments
as of October 31, 2014 continued
| | | | | | | | | | | | |
| | | Level 1 | | | Level 2 | | | Level 3 | |
Common Stocks (continued) | | | | | | | | | | | | |
Japan | | $ | — | | | $ | 9,497,507 | | | $ | — | |
Liechtenstein | | | 116,115 | | | | — | | | | — | |
Luxembourg | | | 105,857 | | | | — | | | | — | |
Netherlands | | | — | | | | 2,576,913 | | | | — | |
New Zealand | | | — | | | | 225,273 | | | | — | |
Norway | | | — | | | | 596,853 | | | | — | |
Panama | | | 191,281 | | | | — | | | | — | |
Singapore | | | — | | | | 374,021 | | | | — | |
South Africa | | | — | | | | 116,613 | | | | — | |
Spain | | | — | | | | 1,460,619 | | | | — | |
Sweden | | | — | | | | 1,322,159 | | | | — | |
Switzerland | | | — | | | | 4,757,165 | | | | — | |
Taiwan | | | 284,388 | | | | — | | | | — | |
United Kingdom | | | 661,839 | | | | 8,959,041 | | | | — | |
United States | | | 2,180,289 | | | | — | | | | — | |
Preferred Stock | | | | | | | | | | | | |
Brazil | | | 174,345 | | | | — | | | | — | |
Affiliated Money Market Mutual Fund | | | 854,852 | | | | — | | | | — | |
Other Financial Instruments* | | | | | | | | | | | | |
Forward Foreign Currency Exchange Contracts | | | — | | | | 73,798 | | | | — | |
| | | | | | | | | | | | |
Total | | $ | 5,920,875 | | | $ | 46,227,055 | | | $ | — | |
| | | | | | | | | | | | |
| * | Other financial instruments are derivative instruments not reflected in the Portfolio of Investments, such as futures, forwards and exchange-traded swap contracts, which are recorded at the unrealized appreciation/depreciation on the instrument, and over-the-counter swap contracts which are recorded at fair value. |
See Notes to Financial Statements.
The industry classification of investments and other assets in excess of liabilities shown as a percentage of net assets as of October 31, 2014 was as follows (Unaudited):
| | | | |
Banks | | | 12.5 | % |
Pharmaceuticals | | | 8.6 | |
Insurance | | | 7.9 | |
Oil, Gas & Consumable Fuels | | | 6.2 | |
Diversified Telecommunication Services | | | 3.3 | |
Capital Markets | | | 2.9 | |
Automobiles | | | 2.9 | |
Media | | | 2.7 | |
Metals & Mining | | | 2.6 | |
Hotels, Restaurants & Leisure | | | 2.5 | |
Machinery | | | 2.4 | |
IT Services | | | 2.4 | |
Food & Staples Retailing | | | 2.3 | |
Textiles, Apparel & Luxury Goods | | | 2.3 | |
Aerospace & Defense | | | 2.3 | |
Wireless Telecommunication Services | | | 2.2 | |
Specialty Retail | | | 2.1 | |
Auto Components | | | 1.8 | |
Semiconductors & Semiconductor Equipment | | | 1.8 | |
Food Products | | | 1.6 | |
Affiliated Money Market Mutual Fund | | | 1.6 | |
Household Products | | | 1.5 | |
Chemicals | | | 1.5 | |
Internet Software & Services | | | 1.4 | |
Diversified Financial Services | | | 1.4 | |
Trading Companies & Distributors | | | 1.4 | |
Professional Services | | | 1.4 | |
Road & Rail | | | 1.4 | |
Health Care Providers & Services | | | 1.2 | |
Beverages | | | 1.2 | |
Construction Materials | | | 1.1 | % |
Commercial Services & Supplies | | | 1.1 | |
Energy Equipment & Services | | | 1.0 | |
Electric Utilities | | | 0.8 | |
Airlines | | | 0.8 | |
Industrial Conglomerates | | | 0.8 | |
Health Care Equipment & Supplies | | | 0.8 | |
Multi-Utilities | | | 0.8 | |
Real Estate Management & Development | | | 0.7 | |
Leisure Products | | | 0.5 | |
Construction & Engineering | | | 0.4 | |
Electrical Equipment | | | 0.4 | |
Containers & Packaging | | | 0.4 | |
Building Products | | | 0.4 | |
Tobacco | | | 0.3 | |
Household Durables | | | 0.3 | |
Electronic Equipment, Instruments & Components | | | 0.3 | |
Air Freight & Logistics | | | 0.2 | |
Internet & Catalog Retail | | | 0.2 | |
Paper & Forest Products | | | 0.2 | |
Personal Products | | | 0.2 | |
Health Care Technology | | | 0.2 | |
Life Sciences Tools & Services | | | 0.1 | |
Distributors | | | 0.1 | |
| | | | |
| | | 99.4 | |
Other assets in excess of liabilities | | | 0.6 | |
| | | | |
| | | 100.0 | % |
| | | | |
The Series invested in various derivative instruments during the reporting period. The primary types of risk associated with these derivative instruments were equity risk and foreign exchange risk. The effect of such derivative instruments on the Series’ financial position and financial performance as reflected in the Statement of Assets and Liabilities and Statement of Operations is presented in the summary below.
See Notes to Financial Statements.
| | | | |
| Prudential International Value Fund | | | 21 | |
Portfolio of Investments
as of October 31, 2014 continued
Fair values of derivative instruments as of October 31, 2014 as presented in the Statement of Assets and Liabilities:
| | | | | | | | | | | | |
Derivatives not accounted for
as hedging instruments,
carried at fair value | | Asset Derivatives | | | Liability Derivatives | |
| | Balance Sheet
Location | | Fair
Value | | | Balance Sheet
Location | | Fair
Value | |
| Foreign exchange contracts | | Unrealized appreciation on forward foreign currency exchange contracts | | $ | 75,195 | | | Unrealized depreciation on forward foreign currency exchange contracts | | $ | 1,397 | |
| | | | | | | | | | | | |
The effects of derivative instruments on the Statement of Operations for the year ended October 31, 2014 are as follows:
| | | | | | | | | | | | |
Amount of Realized Gain or (Loss) on Derivatives Recognized in Income | |
Derivatives not accounted for as hedging
instruments, carried at fair value | | Rights(1) | | | Forward
Currency
Contracts(2) | | | Total | |
Foreign exchange contracts | | $ | — | | | $ | 305,572 | | | $ | 305,572 | |
Equity contracts | | | (22,911 | ) | | | — | | | | (22,911 | ) |
| | | | | | | | | | | | |
Total | | $ | (22,911 | ) | | $ | 305,572 | | | $ | 282,661 | |
| | | | | | | | | | | | |
| | | | |
Change in Unrealized Appreciation or (Depreciation) on Derivatives Recognized in Income | |
Derivatives not accounted for as hedging
instruments, carried at fair value | | Forward
Currency
Contracts(3) | |
Foreign exchange contracts | | $ | 127,125 | |
| | | | |
| (1) | Included in net realized gain (loss) on investment transactions in the Statement of Operations. |
| (2) | Included in net realized gain (loss) on foreign currency transactions in the Statement of Operations. |
| (3) | Included in net change in unrealized appreciation (depreciation) on foreign currencies in the Statement of Operations. |
For the year ended October 31, 2014, the Series’ average value at settlement date payable for forward foreign currency exchange purchase contracts was $1,511,021 and the Series’ average value at settlement date receivable for forward foreign currency exchange sale contracts was $6,556,645.
See Notes to Financial Statements.
Offsetting of over-the-counter (OTC) derivative assets and liabilities:
The Series invested in OTC derivatives during the reporting period that are either offset in accordance with current requirements or are subject to enforceable master netting arrangements or similar agreements that permit offsetting. The information about offsetting and related netting arrangements for OTC derivatives, where the legal right to set-off exists, is presented in the summary below.
| | | | | | | | | | | | | | | | |
Counterparty | | Gross
Amounts of
Recognized
Assets(1) | | | Gross
Amounts
Available
for Offset | | | Collateral
Received(3) | | | Net
Amount | |
State Street Bank | | $ | 75,195 | | | $ | (1,397 | ) | | $ | — | | | $ | 73,798 | |
| | | | | | | | | | | | | | | | |
Counterparty | | Gross
Amounts of
Recognized
Liabilities(2) | | | Gross
Amounts
Available
for Offset | | | Collateral
Pledged(3) | | | Net
Amount | |
State Street Bank | | $ | (1,397 | ) | | $ | 1,397 | | | $ | — | | | $ | — | |
| (1) | Includes unrealized appreciation on swaps and forwards, premiums paid on swap agreements and market value of purchased options. |
| (2) | Includes unrealized depreciation on swaps and forwards, premiums received on swap agreements and market value of written options. |
| (3) | Amounts shown reflect actual collateral received or pledged by the Series. Such amounts are applied up to 100% of the Series’ OTC derivative exposure by counterparty. |
See Notes to Financial Statements.
| | | | |
| Prudential International Value Fund | | | 23 | |
Statement of Assets & Liabilities
as of October 31, 2014
| | | | |
Assets | | | | |
Investments at value: | | | | |
Unaffiliated investments (cost $44,344,374) | | $ | 51,219,280 | |
Affiliated investments (cost $854,852) | | | 854,852 | |
Foreign currency, at value (cost $165,834) | | | 162,886 | |
Receivable for investments sold | | | 483,449 | |
Tax reclaim receivable | | | 278,628 | |
Dividends receivable | | | 121,373 | |
Unrealized appreciation on forward foreign currency exchange contracts | | | 75,195 | |
Receivable for Fund shares sold | | | 19,622 | |
Prepaid expenses | | | 803 | |
| | | | |
Total assets | | | 53,216,088 | |
| | | | |
| |
Liabilities | | | | |
Payable for investments purchased | | | 342,732 | |
Loan payable | | | 285,000 | |
Accrued expenses and other liabilities | | | 105,986 | |
Payable for Fund shares reacquired | | | 69,069 | |
Management fee payable | | | 18,919 | |
Distribution fee payable | | | 11,610 | |
Affiliated transfer agent fee payable | | | 8,321 | |
Payable to custodian | | | 5,259 | |
Unrealized depreciation on forward foreign currency exchange contracts | | | 1,397 | |
Loan interest payable | | | 56 | |
| | | | |
Total liabilities | | | 848,349 | |
| | | | |
| |
Net Assets | | $ | 52,367,739 | |
| | | | |
| | | | | |
Net assets were comprised of: | | | | |
Common stock, at par | | $ | 23,489 | |
Paid-in capital in excess of par | | | 52,264,339 | |
| | | | |
| | | 52,287,828 | |
Undistributed net investment income | | | 814,361 | |
Accumulated net realized loss on investment and foreign currency transactions | | | (7,673,781 | ) |
Net unrealized appreciation on investments and foreign currencies | | | 6,939,331 | |
| | | | |
Net assets, October 31, 2014 | | $ | 52,367,739 | |
| | | | |
See Notes to Financial Statements.
| | | | |
Class A | | | | |
Net asset value and redemption price per share,
($32,457,813 ÷ 1,450,676 shares of common stock issued and outstanding) | | $ | 22.37 | |
Maximum sales charge 5.50% of offering price) | | | 1.30 | |
| | | | |
Maximum offering price to public | | $ | 23.67 | |
| | | | |
| |
Class B | | | | |
Net asset value, offering price and redemption price per share, | | | | |
($1,215,878 ÷ 57,212 shares of common stock issued and outstanding) | | $ | 21.25 | |
| | | | |
| |
Class C | | | | |
Net asset value, offering price and redemption price per share, | | | | |
($4,538,804 ÷ 213,177 shares of common stock issued and outstanding) | | $ | 21.29 | |
| | | | |
| |
Class Z | | | | |
Net asset value, offering price and redemption price per share, | | | | |
($14,155,244 ÷ 627,825 shares of common stock issued and outstanding) | | $ | 22.55 | |
| | | | |
See Notes to Financial Statements.
| | | | |
| Prudential International Value Fund | | | 25 | |
Statement of Operations
Year Ended October 31, 2014
| | | | |
Net Investment Income | | | | |
Income | | | | |
Unaffiliated dividend income (net of foreign withholding taxes of $158,655) | | $ | 1,900,341 | |
Interest income | | | 2,271 | |
Affiliated dividend income | | | 1,815 | |
| | | | |
Total income | | | 1,904,427 | |
| | | | |
| |
Expenses | | | | |
Management fee | | | 721,328 | |
Distribution fee—Class A | | | 107,326 | |
Distribution fee—Class B | | | 14,166 | |
Distribution fee—Class C | | | 48,471 | |
Custodian’s fees and expenses | | | 200,000 | |
Transfer agent’s fees and expenses (including affiliated expenses of $68,000) | | | 125,000 | |
Registration fees | | | 52,000 | |
Audit fee | | | 30,000 | |
Reports to shareholders | | | 26,000 | |
Legal fees and expenses | | | 17,000 | |
Directors’ fees | | | 16,000 | |
Insurance fees | | | 1,000 | |
Interest expense | | | 114 | |
Miscellaneous | | | 52,638 | |
| | | | |
Total expenses | | | 1,411,043 | |
Less: Management fee waiver | | | (68,714 | ) |
Less: Distribution fee waiver—Class A | | | (17,888 | ) |
| | | | |
Net expenses | | | 1,324,441 | |
| | | | |
Net investment income | | | 579,986 | |
| | | | |
| |
Realized and Unrealized Gain (Loss) on Investment and Foreign Currency Transactions | | | | |
Net realized gain on: | | | | |
Investment transactions | | | 14,389,459 | |
Foreign currency transactions | | | 279,362 | |
| | | | |
| | | 14,668,821 | |
| | | | |
Net change in unrealized appreciation (depreciation) on: | | | | |
Investments | | | (15,401,306 | ) |
Foreign currencies | | | 100,983 | |
| | | | |
| | | (15,300,323 | ) |
| | | | |
Net loss on investments | | | (631,502 | ) |
| | | | |
Net Decrease In Net Assets Resulting From Operations | | $ | (51,516 | ) |
| | | | |
See Notes to Financial Statements.
Statement of Changes in Net Assets
| | | | | | | | |
| | | Year Ended October 31, | |
| | | 2014 | | | 2013 | |
Increase (Decrease) in Net Assets | | | | | | | | |
Operations | | | | | | | | |
Net investment income | | $ | 579,986 | | | $ | 1,233,561 | |
Net realized gain on investment and foreign currency transactions | | | 14,668,821 | | | | 4,554,824 | |
Net change in unrealized appreciation (depreciation) on investments | | | (15,300,323 | ) | | | 13,824,095 | |
| | | | | | | | |
Net increase (decrease) in net assets resulting from operations | | | (51,516 | ) | | | 19,612,480 | |
| | | | | | | | |
| | |
Dividends from net investment income (Note 1) | | | | | | | | |
Class A | | | (379,684 | ) | | | (674,229 | ) |
Class B | | | (7,698 | ) | | | (19,472 | ) |
Class C | | | (25,260 | ) | | | (65,031 | ) |
Class Z | | | (759,858 | ) | | | (1,269,401 | ) |
| | | | | | | | |
| | | (1,172,500 | ) | | | (2,028,133 | ) |
| | | | | | | | |
| | |
Series share transactions (Net of share conversions) (Note 6) | | | | | | | | |
Net proceeds from shares sold | | | 6,464,054 | | | | 11,093,355 | |
Net asset value of shares issued in reinvestment of dividends | | | 1,154,938 | | | | 2,004,448 | |
Cost of shares reacquired | | | (59,854,881 | ) | | | (21,607,276 | ) |
| | | | | | | | |
Net decrease in net assets from Series share transactions | | | (52,235,889 | ) | | | (8,509,473 | ) |
| | | | | | | | |
Total increase (decrease) | | | (53,459,905 | ) | | | 9,074,874 | |
| | |
Net Assets: | | | | | | | | |
Beginning of year | | | 105,827,644 | | | | 96,752,770 | |
| | | | | | | | |
End of year(a) | | $ | 52,367,739 | | | $ | 105,827,644 | |
| | | | | | | | |
(a) Includes undistributed net investment income of: | | $ | 814,361 | | | $ | 1,054,326 | |
| | | | | | | | |
See Notes to Financial Statements.
| | | | |
| Prudential International Value Fund | | | 27 | |
Notes to Financial Statements
Prudential World Fund, Inc. (the “Fund”), is registered under the Investment Company Act of 1940, as amended, (“1940 Act”) as an open-end diversified management investment company and currently consists of seven series: Prudential International Value Fund (the “Series”), Prudential Jennison Global Infrastructure Fund, Prudential International Equity Fund, Prudential Emerging Markets Debt Local Currency Fund, Prudential Emerging Markets Equity Fund, Prudential Jennison Global Opportunities Fund and Prudential Jennison International Opportunities Fund. These financial statements relate to Prudential International Value Fund. The financial statements of the other series are not presented herein. The investment objective of the Series is long-term growth of capital.
Note 1. Accounting Policies
The following accounting policies conform to U.S. generally accepted accounting principles. The Trust consistently follows such policies in the preparation of its financial statements.
Securities Valuation: The Series holds securities and other assets that are fair valued at the close of each day the New York Stock Exchange (“NYSE”) is open for trading. Fair value is the price that would be received to sell an asset or paid to transfer a liability in an orderly transaction between market participants on the measurement date. The Board of Directors (the “Board”) has adopted Valuation Procedures for security valuation under which fair valuation responsibilities have been delegated to Prudential Investments LLC (“PI”). Under the current Valuation Procedures, the established Valuation Committee is responsible for supervising the valuation of portfolio securities and other assets. The Valuation Procedures permit the Series to utilize independent pricing vendor services, quotations from market makers, and alternative valuation methods when market quotations are either not readily available or not deemed representative of fair value. A record of the Valuation Committee’s actions is subject to the Board’s review, approval, and ratification at its next regularly-scheduled quarterly meeting.
Various inputs determine how the Series’ investments are valued, all of which are categorized according to the three broad levels (Level 1, 2, or 3) detailed in the table following the Portfolio of Investments.
Common and preferred stocks, exchange-traded funds, and derivative instruments such as futures or options that are traded on a national securities exchange are valued at the last sale price as of the close of trading on the applicable exchange. Securities traded via NASDAQ are valued at the NASDAQ official closing price. To the extent these securities are valued at the last sale price or NASDAQ official closing price, they are classified as Level 1 in the fair value hierarchy except for exchange-traded and cleared swaps which are classified as Level 2 in the fair value hierarchy, as the prices marked at the official settle are not public.
In the event that no sale or official closing price on valuation date exists, these securities are generally valued at the mean between the last reported bid and ask prices, or at the last bid price in the absence of an ask price. These securities are classified as Level 2 in the fair value hierarchy, as the inputs are observable and considered to be significant to the valuation.
Common and preferred stocks, exchange-traded funds, and derivative instruments such as futures or options that are traded on a national securities exchange are valued at the last sale price as of the close of trading on the applicable exchange. Securities traded via NASDAQ are valued at the NASDAQ official closing price. To the extent these securities are valued at the last sale price or NASDAQ official closing price, they are classified as Level 1 in the fair value hierarchy.
Investments in open-end, non-exchange-traded mutual funds are valued at their net asset values as of the close of the NYSE on the date of valuation. These securities are classified as Level 1 in the fair value hierarchy since they may be purchased or sold at their net asset values on the date of valuation.
Fixed income securities traded in the over-the-counter market are generally valued at prices provided by approved independent pricing vendors. The pricing vendors provide these prices after evaluating observable inputs including, but not limited to yield curves, yield spreads, credit ratings, deal terms, tranche level attributes, default rates, cash flows, prepayment speeds, broker/dealer quotations, and reported trades. Securities valued using such vendor prices are classified as Level 2 in the fair value hierarchy.
Over-the-counter derivative instruments are generally valued using pricing vendor services, which derive the valuation based on inputs such as underlying asset prices, indices, spreads, interest rates, and exchange rates. These instruments are categorized as Level 2 in the fair value hierarchy.
Centrally cleared swaps listed or traded on a multilateral or trade facility platform, such as a registered exchange, are valued at the daily settlement price determined by
| | | | |
| Prudential International Value Fund | | | 29 | |
Notes to Financial Statements
continued
the respective exchange. These securities are classified as Level 2 in the fair value hierarchy, as the prices marked at the official settle are not public.
Securities and other assets that cannot be priced according to the methods described above are valued based on pricing methodologies approved by the Board. In the event that significant unobservable inputs are used when determining such valuations, the securities will be classified as Level 3 in the fair value hierarchy.
When determining the fair value of securities, some of the factors influencing the valuation include: the nature of any restrictions on disposition of the securities; assessment of the general liquidity of the securities; the issuer’s financial condition and the markets in which it does business; the cost of the investment; the size of the holding and the capitalization of the issuer; the prices of any recent transactions or bids/offers for such securities or any comparable securities; any available analyst media or other reports or information deemed reliable by the investment adviser regarding the issuer or the markets or industry in which it operates. Using fair value to price securities may result in a value that is different from a security’s most recent closing price and from the price used by other mutual funds to calculate their net asset values.
Foreign Currency Translation: The books and records of the Series are maintained in U.S. dollars. Foreign currency amounts are translated into U.S. dollars on the following basis:
(i) market value of investment securities, other assets and liabilities—at the current rates of exchange.
(ii) Purchases and sales of investment securities, income and expenses—at the rates of exchange prevailing on the respective dates of such transactions.
Although the net assets of the Series are presented at the foreign exchange rates and market values at the close of the fiscal period, the Series does not isolate that portion of the results of operations arising as a result of changes in the foreign exchange rates from the fluctuations arising from changes in the market prices of long-term securities held at the end of the fiscal period. Similarly, the Series does not isolate the effect of changes in foreign exchange rates from the fluctuations arising from changes in the market prices of long-term portfolio securities sold during the fiscal period. Accordingly, realized foreign currency gains or losses are included in the reported net realized gains or losses on investment transactions.
Net realized gains or losses on foreign currency transactions represent net foreign exchange gains or losses from the holding of foreign currencies, currency gains or losses realized between the trade date and settlement date on securities transactions, and the difference between the amounts of dividends, interest and foreign withholding taxes recorded on the Series’ books and the U.S. dollar equivalent amounts actually received or paid. Net unrealized currency gains or losses from valuing foreign currency denominated assets and liabilities (other than investments) at period end exchange rates are reflected as a component of net unrealized appreciation (depreciation) on investments and foreign currencies.
Concentration of Risks: Foreign security and currency transactions may involve certain considerations and risks not typically associated with those of domestic origin as a result of, among other factors, the possibility of political and economic instability or the level of governmental supervision and regulation of foreign securities markets.
Foreign Currency Contracts: A forward currency contract is a commitment to purchase or sell a foreign currency at a future date at a negotiated forward rate between two parties. The Series enters into forward currency contracts in order to hedge its exposure to changes in foreign currency exchange rates on its foreign portfolio holdings or specific receivables and payables denominated in a foreign currency. The contracts are valued daily at current forward exchange rates and any unrealized gain or loss is included in net unrealized appreciation or depreciation on foreign currencies. Gain or loss is realized on the settlement date of the contract equal to the difference between the settlement value of the original and negotiated forward contracts. This gain or loss, if any, is included in net realized gain (loss) on foreign currency transactions. Risks may arise upon entering into these contracts from the potential inability of the counterparties to meet the terms of their contracts. Forward currency contracts involve elements of both market and credit risk in excess of the amounts reflected on the Statement of Assets and Liabilities. The Series’ maximum risk of loss from counterparty credit risk is the net value of the cash flows to be received from the counterparty at the end of the contract’s life.
Warrants and Rights: The Series may hold warrants and rights acquired either through a direct purchase, included as part of a private placement, or pursuant to corporate actions. Warrants and rights entitle the holder to buy a proportionate amount of common stock at a specific price and time through the expiration dates. Such warrants and rights are held as long positions by the Series until exercised, sold or expired. Warrants and rights are valued at fair value in accordance with the Board’s approved fair valuation procedures.
| | | | |
| Prudential International Value Fund | | | 31 | |
Notes to Financial Statements
continued
Restricted and Illiquid Securities: Subject to guidelines adopted by the Board, the Series may invest up to 15% of its net assets in illiquid securities, including those which are restricted as to disposition under securities law (“restricted securities”). Restricted securities are valued pursuant to the valuation procedures noted above. Illiquid securities are those that, because of the absence of a readily available market or due to legal or contractual restrictions on resale, cannot be sold within seven days in the ordinary course of business at approximately the amount at which the Series has valued the investment. Therefore, the Series may find it difficult to sell illiquid securities at the time considered most advantageous by its Subadviser and may incur expenses that would not be incurred in the sale of securities that were freely marketable. Certain securities that would otherwise be considered illiquid because of legal restrictions on resale to the general public may be traded among qualified institutional buyers under Rule 144A of the Securities Act of 1933. These Rule 144A securities, as well as commercial paper that is sold in private placements under Section 4(2) of the Securities Act, may be deemed liquid by the Series’ Subadviser under the guidelines adopted by the Directors of the Series. However, the liquidity of the Series’ investments in Rule 144A securities could be impaired if trading does not develop or declines.
Master Netting Arrangements: The Series is subject to various Master Agreements, or netting arrangements, with select counterparties. A master netting arrangement between the Series and the counterparty permits the Series to offset amounts payable by the Series to the same counterparty against amounts to be received; and by the receipt of collateral from the counterparty by the Series to cover the Series’ exposure to the counterparty. However, there is no assurance that such mitigating factors are easily enforceable. The right to set-off exists when all the conditions are met such that each of the parties owes the other determinable amounts, the reporting party has the right to set-off the amount owed with the amount owed by the other party, the reporting party intends to set-off and the right of set-off is enforceable by law. During the reporting period, there were no instances where the right of set-off existed and management has not elected to offset.
The Series is a party to ISDA (International Swaps and Derivatives Association, Inc.) Master Agreements with certain counterparties that govern over-the-counter derivative and foreign exchange contracts entered into from time to time. The Master Agreements may contain provisions regarding, among other things, the parties’ general obligations, representations, agreements, collateral requirements, events of
default and early termination. With respect to certain counterparties, in accordance with the terms of the Master Agreements, collateral posted to the Series is held in a segregated account by the Series’ custodian and with respect to those amounts which can be sold or re-pledged, is presented in the Portfolio of Investments. Collateral pledged by the Series is segregated by the Series’ custodian and identified in the Portfolio of Investments. Collateral can be in the form of cash or debt securities issued by the U.S. Government or related agencies or other securities as agreed to by the Series and the applicable counterparty. Collateral requirements are determined based on the Series’ net position with each counterparty. Termination events applicable to the Series may occur upon a decline in the Series’ net assets below a specified threshold over a certain period of time. Termination events applicable to counterparties may occur upon a decline in the counterparty’s long-term and short term credit ratings below a specified level. In each case, upon occurrence, the other party may elect to terminate early and cause settlement of all derivative and foreign exchange contracts outstanding, including the payment of any losses and costs resulting from such early termination, as reasonably determined by the terminating party. Any decision by one or more of the Series’ counterparties to elect early termination could impact the Series’ future derivative activity.
In addition to each instrument’s primary underlying risk exposure (e.g. interest rate, credit, equity or foreign exchange, etc.), swap agreements involve, to varying degrees, elements of credit, market and documentation risk. Such risks involve the possibility that no liquid market for these agreements will exist, the counterparty to the agreement may default on its obligation to perform or disagree on the contractual terms of the agreement, and changes in net interest rates will be unfavorable. In connection with these agreements, securities in the portfolio may be identified or received as collateral from the counterparty in accordance with the terms of the respective swap agreements to provide or receive assets of value and to serve as recourse in the event of default or bankruptcy/insolvency of either party. Such over-the-counter derivative agreements include conditions which, when materialized, give the counterparty the right to cause an early termination of the transactions under those agreements. Any election by the counterparty for early termination of the contract(s) may impact the amounts reported on financial statements.
As of October 31, 2014, the Series has not met conditions under such agreements which give the counterparty the right to call for an early termination.
Forward currency contracts involve elements of both market and credit risk in excess of the amounts reflected on the Statement of Assets and Liabilities. Such risks may be mitigated by engaging in master netting arrangements.
| | | | |
| Prudential International Value Fund | | | 33 | |
Notes to Financial Statements
continued
Securities Transactions and Net Investment Income: Securities transactions are recorded on the trade date. Realized and unrealized gains or losses from investment and currency transactions are calculated on the identified cost basis. Dividend income is recorded on the ex-dividend date. Interest income, including amortization of premium and accretion of discount on debt securities, as required, is recorded on an accrual basis. Expenses are recorded on the accrual basis, which may require the use of certain estimates by management that may differ from actual.
Net investment income or loss, (other than distribution fees which are charged directly to the respective class) and unrealized and realized gains or losses are allocated daily to each class of shares based upon the relative proportion of adjusted net assets of each class at the beginning of the day.
Dividends and Distributions: The Series expects to pay dividends of net investment income and distributions of net realized capital gains, if any, annually. Dividends and distributions to shareholders, which are determined in accordance with federal income tax regulations and which may differ from generally accepted accounting principles, are recorded on the ex-dividend date. Permanent book/tax differences relating to income and gains are reclassified amongst undistributed net investment income, accumulated net realized gain or loss and paid-in capital in excess of par, as appropriate.
Taxes: For federal income tax purposes, each series in the Fund is treated as a separate taxpaying entity. It is the Series’ policy to continue to meet the requirements of the Internal Revenue Code applicable to regulated investment companies and to distribute all of its taxable net income and capital gains, if any, to shareholders. Therefore, no federal income tax provision is required.
Withholding taxes on foreign dividends are recorded, net of reclaimable amounts, at the time the related income is earned.
Estimates: The preparation of the financial statements requires management to make estimates and assumptions that affect the reported amounts and disclosures in the financial statements. Actual results could differ from those estimates.
Note 2. Agreements
The Fund has a management agreement for the Series with Prudential Investments LLC (“PI”). Pursuant to this agreement, PI has responsibility for all investment advisory services and supervises the subadvisor’s performance of such services. PI has entered into subadvisory agreements with LSV Asset Management (“LSV”) and Thornburg Investment Management, Inc. (“Thornburg”) for the Series.
The subadvisory agreements provide that LSV and Thornburg furnish investment advisory services in connection with the management of the Series. In connection therewith, LSV and Thornburg are obligated to keep certain books and records of the Series. PI pays for the services of the subadvisors, the compensation of officers of the Series, occupancy and certain clerical and bookkeeping costs of the Series. The Series bears all other costs and expenses.
The management fee paid to PI is accrued daily and payable monthly at an annual rate of 1% of the average daily net assets up to $300 million, .95% of the next $700 million of average daily net assets and .90% of average daily net assets in excess of $1 billion of the Series. The effective management fee was 1.00% for the year ended October 31, 2014.
Effective July 1, 2014, PI has contractually agreed through February 28, 2015 to limit net annual Series operating expenses (excluding distribution and service (12b-1) fees, extraordinary and certain other expenses such as taxes, interest and brokerage commissions) to each class of shares to 1.54% of the Series’ average daily net assets.
The Fund has a distribution agreement with Prudential Investment Management Services LLC (“PIMS”), which acts as the distributor of the Class A, Class B, Class C and Class Z shares of the Series. The Series compensates PIMS for distributing and servicing the Series’ Class A, Class B and Class C shares pursuant to plans of distribution (the “Class A, B and C Plans”), regardless of expenses actually incurred by PIMS. The distribution fees are accrued daily and payable monthly. No distribution or service fees are paid to PIMS as distributor of the Class Z shares of the Series.
Pursuant to the Class A, B and C Plans, the Series compensates PIMS for distribution related activities at an annual rate of up to .30%, 1% and 1% of the average daily net assets of the Class A, B and C shares, respectively. For the year ended October 31, 2014, PIMS contractually agreed to limit such fee to .25% of the average daily net assets of the Class A shares.
| | | | |
| Prudential International Value Fund | | | 35 | |
Notes to Financial Statements
continued
PIMS has advised the Series that it received $25,645 in front-end sales charges resulting from sales of Class A shares, during the year ended October 31, 2014. From these fees, PIMS paid such sales charges to broker-dealers, which in turn paid commissions to salespersons and incurred other distribution costs.
PIMS advised the Series that for the year ended October 31, 2014, it received $8, $1,789 and $361 in contingent deferred sales charges imposed upon certain redemptions by Class A, Class B and Class C shareholders, respectively.
PI and PIMS are indirect, wholly-owned subsidiaries of Prudential Financial, Inc. (“Prudential”).
Note 3. Other Transactions with Affiliates
Prudential Mutual Fund Services LLC (“PMFS”), an affiliate of PI and an indirect, wholly owned subsidiary of Prudential, serves as the Series’ transfer agent. The transfer agent fees and expenses in the Statement of Operations also include certain out-of-pocket expenses paid to non-affiliates, where applicable.
The Series invests in the Prudential Core Taxable Money Market Fund (the “Core Fund”), a portfolio of Prudential Investment Portfolios 2 registered under the 1940 Act, and managed by PI. Earnings from the Core Fund are disclosed on the Statement of Operations as affiliated dividend income.
Note 4. Portfolio Securities
Purchases and sales of investment securities, other than short-term investments, for the year ended October 31, 2014 were $22,394,744 and $73,543,260, respectively.
Note 5. Distributions and Tax Information
Distributions to shareholders, which are determined in accordance with federal income tax regulations, which may differ from generally accepted accounting principles, are recorded on the ex-dividend date. In order to present undistributed net investment income, accumulated net realized loss on investment and foreign
currency transactions and paid-in capital in excess of par on the Statement of Assets and Liabilities that more closely represent their tax character, certain adjustments have been made to undistributed net investment income and accumulated net realized loss on investment and foreign currency transactions. For the tax year ended October 31, 2014 the adjustments were to increase undistributed net investment income and increase accumulated net realized loss on investment and foreign currency transactions by $352,549 due to the differences in the treatment for book and tax purposes of certain transactions involving foreign securities and investments in passive foreign investment companies. Net investment income, net realized gain and net assets were not affected by this change.
For the years ended October 31, 2014 and October 31, 2013, the tax character of dividends paid as reflected in the Statement of Changes in Net Assets were $1,172,500 and $2,028,133 of ordinary income, respectively.
As of October 31, 2014, the accumulated undistributed earnings on a tax basis was $941,863 of ordinary income. This differs from the amount shown on the Statement of Assets and Liabilities primarily due to cumulative timing differences between financial and tax reporting.
The United States federal income tax basis of the Series’ investments and the net unrealized appreciation as of October 31, 2014 were as follows:
| | | | | | | | | | |
Tax Basis | | Appreciation | | Depreciation | | Net
Unrealized
Appreciation | | Other Cost
Basis
Adjustment | | Total Net
Unrealized
Appreciation |
| $45,566,681 | | $10,872,347 | | $(4,364,896) | | $6,507,451 | | $(9,373) | | $6,498,078 |
The difference between book basis and tax basis was primarily attributable to deferred losses on wash sales and investments in passive foreign investment companies.
Under the Regulated Investment Company Modernization Act of 2010 (“the Act”), the Series is permitted to carryforward capital losses realized on or after November 1, 2011 (“post-enactment losses”) for an unlimited period. Post-enactment losses are required to be utilized before the utilization of losses incurred prior to the effective date of the Act. As a result of this ordering rule, capital loss carryforwards related to taxable years ending before October 31, 2012 (“pre-enactment losses”) may have an increased likelihood to expire unused. The Series utilized approximately $14,132,000 of its capital loss carryforward to offset net taxable gains realized in the fiscal year ended October 31, 2014. No capital gains distributions are expected to be paid to
| | | | |
| Prudential International Value Fund | | | 37 | |
Notes to Financial Statements
continued
shareholders until net gains have been realized in excess of such losses. As of October 31, 2014, the pre and post-enactment losses were approximately:
| | | | |
Post-Enactment Losses: | | $ | 0 | |
| | | | |
Pre-Enactment Losses: | | | | |
Expiring 2017 | | | 6,382,000 | |
Expiring 2018 | | | 978,000 | |
| | | | |
| | $ | 7,360,000 | |
| | | | |
Management has analyzed the Series’ tax positions taken on federal income tax returns for all open tax years and has concluded that no provision for income tax is required in the Series’ financial statements for the current reporting period. The Series’ federal and state income and federal excise tax returns for tax years for which the applicable statutes of limitations have not expired are subject to examination by the Internal Revenue Service and state departments of revenue.
Note 6. Capital
The Series offers Class A, Class B, Class C and Class Z shares. Class A shares are sold with a front-end sales charge of up to 5.50%. All investors who purchase Class A shares in an amount of $1 million or more and sell these shares within 12 months of purchase are subject to a contingent deferred sales charge (“CDSC”) of 1%, including investors who purchase their shares through broker-dealers affiliated with Prudential. Class B shares are sold with a CDSC which declines from 5% to zero depending upon the period of time the shares are held. Class C shares are sold with a CDSC of 1% during the first 12 months from the date of purchase. Class B shares will automatically convert to Class A shares on a quarterly basis approximately seven years after purchase. A special exchange privilege is also available for shareholders who qualify to purchase Class A shares at net asset value. Class Z shares are not subject to any sales or redemption charge and are offered exclusively for sale to a limited group of investors.
Under certain circumstances, an exchange may be made from specified share classes of the Series to one or more other share classes of the Series as presented in the table of transactions in shares of common stock.
There are 235 million authorized shares of $.01 par value common stock, divided into four classes, designated Class A, Class B, Class C and Class Z common stock, each of which consists of 100 million, 10 million, 50 million and 75 million authorized shares, respectively.
Transactions in shares of common stock were as follows:
| | | | | | | | |
Class A | | Shares | | | Amount | |
Year ended October 31, 2014: | | | | | | | | |
Shares sold | | | 84,911 | | | $ | 1,944,080 | |
Shares issued in reinvestment of dividends and distributions | | | 16,103 | | | | 364,726 | |
Shares reacquired | | | (260,117 | ) | | | (5,961,185 | ) |
| | | | | | | | |
Net increase (decrease) in shares outstanding before conversion | | | (159,103 | ) | | | (3,652,379 | ) |
Shares issued upon conversion from Class B | | | 9,908 | | | | 228,041 | |
Shares reacquired upon conversion into Class Z | | | (2,563 | ) | | | (59,804 | ) |
| | | | | | | | |
Net increase (decrease) in shares outstanding | | | (151,758 | ) | | $ | (3,484,142 | ) |
| | | | | | | | |
Year ended October 31, 2013: | | | | | | | | |
Shares sold | | | 122,524 | | | $ | 2,555,126 | |
Shares issued in reinvestment of dividends and distributions | | | 32,904 | | | | 653,810 | |
Shares reacquired | | | (311,730 | ) | | | (6,480,038 | ) |
| | | | | | | | |
Net increase (decrease) in shares outstanding before conversion | | | (156,302 | ) | | | (3,271,102 | ) |
Shares issued upon conversion from Class B | | | 17,629 | | | | 368,731 | |
Shares reacquired upon conversion into Class Z | | | (2,840 | ) | | | (57,629 | ) |
| | | | | | | | |
Net increase (decrease) in shares outstanding | | | (141,513 | ) | | $ | (2,960,000 | ) |
| | | | | | | | |
Class B | | | | | | |
Year ended October 31, 2014: | | | | | | | | |
Shares sold | | | 8,337 | | | $ | 181,609 | |
Shares issued in reinvestment of dividends and distributions | | | 335 | | | | 7,255 | |
Shares reacquired | | | (11,286 | ) | | | (244,523 | ) |
| | | | | | | | |
Net increase (decrease) in shares outstanding before conversion | | | (2,614 | ) | | | (55,659 | ) |
Shares reacquired upon conversion into Class A | | | (10,401 | ) | | | (228,041 | ) |
| | | | | | | | |
Net increase (decrease) in shares outstanding | | | (13,015 | ) | | $ | (283,700 | ) |
| | | | | | | | |
Year ended October 31, 2013: | | | | | | | | |
Shares sold | | | 17,604 | | | $ | 353,419 | |
Shares issued in reinvestment of dividends and distributions | | | 966 | | | | 18,389 | |
Shares reacquired | | | (8,813 | ) | | | (172,803 | ) |
| | | | | | | | |
Net increase (decrease) in shares outstanding before conversion | | | 9,757 | | | | 199,005 | |
Shares reacquired upon conversion into Class A | | | (18,476 | ) | | | (368,731 | ) |
| | | | | | | | |
Net increase (decrease) in shares outstanding | | | (8,719 | ) | | $ | (169,726 | ) |
| | | | | | | | |
| | | | |
| Prudential International Value Fund | | | 39 | |
Notes to Financial Statements
continued
| | | | | | | | |
Class C | | Shares | | | Amount | |
Year ended October 31, 2014: | | | | | | | | |
Shares sold | | | 17,476 | | | $ | 384,123 | |
Shares issued in reinvestment of dividends and distributions | | | 1,131 | | | | 24,548 | |
Shares reacquired | | | (27,043 | ) | | | (590,027 | ) |
| | | | | | | | |
Net increase (decrease) in shares outstanding | | | (8,436 | ) | | $ | (181,356 | ) |
| | | | | | | | |
Year ended October 31, 2013: | | | | | | | | |
Shares sold | | | 18,448 | | | $ | 377,849 | |
Shares issued in reinvestment of dividends and distributions | | | 3,380 | | | | 64,459 | |
Shares reacquired | | | (58,936 | ) | | | (1,181,776 | ) |
| | | | | | | | |
Net increase (decrease) in shares outstanding | | | (37,108 | ) | | $ | (739,468 | ) |
| | | | | | | | |
Class Z | | | | | | |
Year ended October 31, 2014: | | | | | | | | |
Shares sold | | | 171,325 | | | $ | 3,954,242 | |
Shares issued in reinvestment of dividends and distributions | | | 33,293 | | | | 758,409 | |
Shares reacquired | | | (2,272,856 | ) | | | (53,059,146 | ) |
| | | | | | | | |
Net increase (decrease) in shares outstanding before conversion | | | (2,068,238 | ) | | | (48,346,495 | ) |
Shares issued upon conversion into Class A | | | 2,544 | | | | 59,804 | |
| | | | | | | | |
Net increase (decrease) in shares outstanding | | | (2,065,694 | ) | | $ | (48,286,691 | ) |
| | | | | | | | |
Year ended October 31, 2013: | | | | | | | | |
Shares sold | | | 371,363 | | | $ | 7,806,961 | |
Shares issued in reinvestment of dividends and distributions | | | 63,485 | | | | 1,267,790 | |
Shares reacquired | | | (656,863 | ) | | | (13,772,659 | ) |
| | | | | | | | |
Net increase (decrease) in shares outstanding before conversion | | | (222,015 | ) | | | (4,697,908 | ) |
Shares issued upon conversion into Class A | | | 2,824 | | | | 57,629 | |
| | | | | | | | |
Net increase (decrease) in shares outstanding | | | (219,191 | ) | | $ | (4,640,279 | ) |
| | | | | | | | |
Note 7. Borrowings
The Series, along with other affiliated registered investment companies (the “Funds”), is a party to a Syndicated Credit Agreement (“SCA”) with a group of banks. The purpose of the SCA is to provide an alternative source of temporary funding for capital share redemptions. The SCA provides for a commitment of $900 million for the period October 9, 2014 through October 8, 2015. The Funds pay an annualized commitment fee of .075% of the unused portion of the SCA. Prior to October 9, 2014, the Funds had another SCA that provided a commitment of $900 million and the Funds paid an annualized commitment fee of .08% of the unused portion of the SCA.
Interest on any borrowings under the SCA is paid at contracted market rates. The commitment fee for the unused amount is accrued daily and paid quarterly.
The Series utilized the SCA during the year ended October 31, 2014. The average daily balance for the 10 days the Series had loans outstanding during the period was $234,400, borrowed at a weighted average interest rate of 1.405%. At October 31, 2014, the Series had an outstanding loan amount of $285,000.
Note 8. Notice of Dividends to Shareholders
The Series declared ordinary income dividends on December 15, 2014 to shareholders of record on December 16, 2014. The ex-dividend date was December 17, 2014. The per share amounts declared were as follows:
| | | | |
| | | Ordinary Income | |
Class A | | $ | 0.4160 | |
Class B | | $ | 0.2598 | |
Class C | | $ | 0.2598 | |
Class Z | | $ | 0.4715 | |
Note 9. Reorganization
At a meeting held in August 2014, the Board of Directors of the Series approved an Agreement and Plan of Reoganization (the ”Plan”) which provides for the transfer of all assets of each class of shares of Prudential International Value Fund into the like shares of Prudential International Equity Fund, another series of Prudential World Fund, Inc., and the assumption of the liabilities of the Series.
Shareholders approved the Plan on December 10, 2014 and the reorganization is expected to be completed on or about December 19, 2014.
| | | | |
| Prudential International Value Fund | | | 41 | |
Financial Highlights
| | | | | | | | | | | | | | | | | | | | |
| Class A Shares | |
| | | Year Ended October 31, | |
| | | 2014 | | | 2013 | | | 2012 | | | 2011 | | | 2010 | |
| Per Share Operating Performance(b): | | | | | | | | | | | | | | | | | | | | |
| Net Asset Value, Beginning Of Year | | | $23.04 | | | | $19.36 | | | | $18.80 | | | | $20.29 | | | | $18.45 | |
| Income (loss) from investment operations: | | | | | | | | | | | | | | | | | | | | |
| Net investment income | | | .27 | | | | .24 | | | | .29 | | | | .32 | | | | .22 | |
| Net realized and unrealized gain (loss) on investments | | | (.70 | ) | | | 3.83 | | | | .57 | | | | (1.64 | ) | | | 1.71 | |
| Total from investment operations | | | (.43 | ) | | | 4.07 | | | | .86 | | | | (1.32 | ) | | | 1.93 | |
| Less Dividends and Distributions: | | | | | | | | | | | | | | | | | | | | |
| Dividends from net investment income | | | (.24 | ) | | | (.39 | ) | | | (.30 | ) | | | (.17 | ) | | | (.12 | ) |
| Capital Contributions(d) | | | - | | | | - | | | | - | | | | - | | | | .03 | |
| Net asset value, end of year | | | $22.37 | | | | $23.04 | | | | $19.36 | | | | $18.80 | | | | $20.29 | |
| Total Return(a): | | | (1.88)% | | | | 21.37% | | | | 4.71% | | | | (6.56)% | | | | 10.68% | |
| |
| Ratios/Supplemental Data: | |
| Net assets, end of year (000) | | | $32,458 | | | | $36,920 | | | | $33,759 | | | | $38,858 | | | | $45,598 | |
| Average net assets (000) | | | $35,775 | | | | $35,050 | | | | $34,669 | | | | $44,169 | | | | $44,626 | |
| Ratios to average net assets(c): | | | | | | | | | | | | | | | | | | | | |
| Expenses after waivers and/or expense reimbursement | | | 1.90% | | | | 1.79% | | | | 1.79% | | | | 1.78% | | | | 1.66% | |
| Expenses before waivers and/or expense reimbursement | | | 2.07% | | | | 1.84% | | | | 1.84% | | | | 1.83% | | | | 1.71% | |
| Net investment income | | | 1.16% | | | | 1.14% | | | | 1.59% | | | | 1.56% | | | | 1.17% | |
| Portfolio turnover rate | | | 32% | | | | 21% | | | | 16% | | | | 25% | | | | 40% | |
(a) Total return does not consider the effect of sales load. Total return is calculated assuming a purchase of a share on the first day and a sale on the last day of each year reported and includes reinvestment of dividends and distributions. Total returns may reflect adjustments to conform to generally accepted accounting principles.
(b) Calculated based on the average shares outstanding during the year.
(c) Does not include expenses of the underlying portfolio in which the Series invests.
(d) The Series received payments related to a former affiliate’s settlement of regulatory proceedings involving allegations of improper trading in Series shares during the fiscal year ended October 31, 2010. The Series was not involved in the proceedings or in the calculation of the amount of the settlement.
See Notes to Financial Statements.
| | | | | | | | | | | | | | | | | | | | |
| Class B Shares | |
| | | Year Ended October 31, | |
| | | 2014 | | | 2013 | | | 2012 | | | 2011 | | | 2010 | |
| Per Share Operating Performance(b): | | | | | | | | | | | | | | | | | | | | |
| Net Asset Value, Beginning Of Year | | | $21.93 | | | | $18.46 | | | | $17.93 | | | | $19.37 | | | | $17.64 | |
| Income (loss) from investment operations: | | | | | | | | | | | | | | | | | | | | |
| Net investment income | | | .09 | | | | .08 | | | | .15 | | | | .16 | | | | .08 | |
| Net realized and unrealized gain (loss) on investments | | | (.66 | ) | | | 3.65 | | | | .54 | | | | (1.56 | ) | | | 1.63 | |
| Total from investment operations | | | (.57 | ) | | | 3.73 | | | | .69 | | | | (1.40 | ) | | | 1.71 | |
| Less Dividends and Distributions: | | | | | | | | | | | | | | | | | | | | |
| Dividends from net investment income | | | (.11 | ) | | | (.26 | ) | | | (.16 | ) | | | (.04 | ) | | | (.01 | ) |
| Capital Contributions(d) | | | - | | | | - | | | | - | | | | - | | | | .03 | |
| Net asset value, end of year | | | $21.25 | | | | $21.93 | | | | $18.46 | | | | $17.93 | | | | $19.37 | |
| Total Return(a): | | | (2.59)% | | | | 20.43% | | | | 3.91% | | | | (7.26)% | | | | 9.86% | |
| |
| Ratios/Supplemental Data: | |
| Net assets, end of year (000) | | | $1,216 | | | | $1,540 | | | | $1,457 | | | | $1,975 | | | | $3,093 | |
| Average net assets (000) | | | $1,417 | | | | $1,468 | | | | $1,655 | | | | $2,651 | | | | $3,314 | |
| Ratios to average net assets(c): | | | | | | | | | | | | | | | | | | | | |
| Expenses after waivers and/or expense reimbursement | | | 2.65% | | | | 2.54% | | | | 2.54% | | | | 2.52% | | | | 2.41% | |
| Expenses before waivers and/or expense reimbursement | | | 2.77% | | | | 2.54% | | | | 2.54% | | | | 2.52% | | | | 2.41% | |
| Net investment income | | | .41% | | | | .40% | | | | .83% | | | | .81% | | | | .43% | |
| Portfolio turnover rate | | | 32% | | | | 21% | | | | 16% | | | | 25% | | | | 40% | |
(a) Total return does not consider the effect of sales load. Total return is calculated assuming a purchase of a share on the first day and a sale on the last day of each year reported and includes reinvestment of dividends and distributions. Total returns may reflect adjustments to conform to generally accepted accounting principles.
(b) Calculated based on the average shares outstanding during the year.
(c) Does not include expenses of the underlying portfolio in which the Series invests.
(d) The Series received payments related to a former affiliate’s settlement of regulatory proceedings involving allegations of improper trading in Series shares during the fiscal year ended October 31, 2010. The Series was not involved in the proceedings or in the calculation of the amount of the settlement.
See Notes to Financial Statements.
| | | | |
| Prudential International Value Fund | | | 43 | |
Financial Highlights
continued
| | | | | | | | | | | | | | | | | | | | |
| Class C Shares | | | |
| | | Year Ended October 31, | |
| | | 2014 | | | 2013 | | | 2012 | | | 2011 | | | 2010 | |
| Per Share Operating Performance(b): | | | | | | | | | | | | | | | | | | | | |
| Net Asset Value, Beginning Of Year | | | $21.97 | | | | $18.49 | | | | $17.96 | | | | $19.40 | | | | $17.66 | |
| Income (loss) from investment operations: | | | | | | | | | | | | | | | | | | | | |
| Net investment income | | | .09 | | | | .08 | | | | .15 | | | | .16 | | | | .07 | |
Net realized and unrealized gain (loss)
on investments | | | (.66 | ) | | | 3.66 | | | | .54 | | | | (1.56 | ) | | | 1.65 | |
| Total from investment operations | | | (.57 | ) | | | 3.74 | | | | .69 | | | | (1.40 | ) | | | 1.72 | |
| Less Dividends and Distributions: | | | | | | | | | | | | | | | | | | | | |
| Dividends from net investment income | | | (.11 | ) | | | (.26 | ) | | | (.16 | ) | | | (.04 | ) | | | (.01 | ) |
| Capital Contributions(d) | | | - | | | | - | | | | - | | | | - | | | | .03 | |
| Net asset value, end of year | | | $21.29 | | | | $21.97 | | | | $18.49 | | | | $17.96 | | | | $19.40 | |
| Total Return(a): | | | (2.58)% | | | | 20.45% | | | | 3.90% | | | | (7.25)% | | | | 9.91% | |
| | | | | | | | | | | | | | | | | | | | |
| Ratios/Supplemental Data: | | | | |
| Net assets, end of year (000) | | | $4,539 | | | | $4,870 | | | | $4,784 | | | | $5,947 | | | | $6,828 | |
| Average net assets (000) | | | $4,847 | | | | $4,802 | | | | $5,132 | | | | $6,690 | | | | $6,760 | |
| Ratios to average net assets(c): | | | | | | | | | | | | | | | | | | | | |
Expenses after waivers and/or
expense reimbursement | | | 2.65% | | | | 2.54% | | | | 2.54% | | | | 2.53% | | | | 2.41% | |
Expenses before waivers and/or
expense reimbursement | | | 2.78% | | | | 2.54% | | | | 2.54% | | | | 2.53% | | | | 2.41% | |
| Net investment income | | | .41% | | | | .38% | | | | .83% | | | | .81% | | | | .42% | |
| Portfolio turnover rate | | | 32% | | | | 21% | | | | 16% | | | | 25% | | | | 40% | |
(a) Total return does not consider the effect of sales load. Total return is calculated assuming a purchase of a share on the first day and a sale on the last day of each year reported and includes reinvestment of dividends and distributions. Total returns may reflect adjustments to conform to generally accepted accounting principles.
(b) Calculated based on the average shares outstanding during the year.
(c) Does not include expenses of the underlying portfolio in which the Series invests.
(d) The Series received payments related to a former affiliate’s settlement of regulatory proceedings involving allegations of improper trading in Series shares during the fiscal year ended October 31, 2010. The Series was not involved in the proceedings or in the calculation of the amount of the settlement.
See Notes to Financial Statements.
| | | | | | | | | | | | | | | | | | | | |
| Class Z Shares | |
| | | Year Ended October 31, | |
| | | 2014 | | | 2013 | | | 2012 | | | 2011 | | | 2010 | |
| Per Share Operating Performance(b): | | | | | | | | | | | | | | | | | | | | |
| Net Asset Value, Beginning Of Year | | | $23.20 | | | | $19.48 | | | | $18.93 | | | | $20.42 | | | | $18.55 | |
| Income (loss) from investment operations: | | | | | | | | | | | | | | | | | | | | |
| Net investment income | | | .11 | | | | .29 | | | | .34 | | | | .24 | | | | .26 | |
| Net realized and unrealized gain (loss) on investments | | | (.48 | ) | | | 3.87 | | | | .56 | | | | (1.51 | ) | | | 1.74 | |
| Total from investment operations | | | (.37 | ) | | | 4.16 | | | | .90 | | | | (1.27 | ) | | | 2.00 | |
| Less Dividends and Distributions: | | | | | | | | | | | | | | | | | | | | |
| Dividends from net investment income | | | (.28 | ) | | | (.44 | ) | | | (.35 | ) | | | (.22 | ) | | | (.16 | ) |
| Capital Contributions(d) | | | - | | | | - | | | | - | | | | - | | | | .03 | |
| Net asset value, end of year | | | $22.55 | | | | $23.20 | | | | $19.48 | | | | $18.93 | | | | $20.42 | |
| Total Return(a): | | | (1.59)% | | | | 21.73% | | | | 4.92% | | | | (6.30)% | | | | 11.01% | |
| |
| Ratios/Supplemental Data: | |
| Net assets, end of year (000) | | | $14,155 | | | | $62,498 | | | | $56,753 | | | | $52,086 | | | | $159,020 | |
| Average net assets (000) | | | $30,094 | | | | $58,925 | | | | $53,465 | | | | $79,550 | | | | $139,023 | |
| Ratios to average net assets(c): | | | | | | | | | | | | | | | | | | | | |
| Expenses after waivers and/or expense reimbursement | | | 1.59% | | | | 1.54% | | | | 1.54% | | | | 1.47% | | | | 1.41% | |
| Expenses before waivers and/or expense reimbursement | | | 1.65% | | | | 1.54% | | | | 1.54% | | | | 1.47% | | | | 1.41% | |
| Net investment income | | | .47% | | | | 1.37% | | | | 1.86% | | | | 1.16% | | | | 1.41% | |
| Portfolio turnover rate | | | 32% | | | | 21% | | | | 16% | | | | 25% | | | | 40% | |
(a) Total return is calculated assuming a purchase of a share on the first day and a sale on the last day of each year reported and includes reinvestment of dividends and distributions. Total returns may reflect adjustments to conform to generally accepted accounting principles.
(b) Calculated based on the average shares outstanding during the year.
(c) Does not include expenses of the underlying portfolio in which the Series invests.
(d) The Series received payments related to a former affiliate’s settlement of regulatory proceedings involving allegations of improper trading in Series shares during the fiscal year ended October 31, 2010. The Series was not involved in the proceedings or in the calculation of the amount of the settlement.
See Notes to Financial Statements.
| | | | |
| Prudential International Value Fund | | | 45 | |
Report of Independent Registered Public
Accounting Firm
The Board of Directors and Shareholders
Prudential World Fund, Inc.:
We have audited the accompanying statement of assets and liabilities of Prudential International Value Fund, a series of Prudential World Fund, Inc., (hereafter referred to as the “Fund”), including the portfolio of investments, as of October 31, 2014, and the related statement of operations for the year then ended, the statements of changes in net assets for each of the years in the two-year period then ended and the financial highlights for each of the years in the five-year period then ended. These financial statements and financial highlights are the responsibility of the Fund’s management. Our responsibility is to express an opinion on these financial statements and financial highlights based on our audits.
We conducted our audits in accordance with the standards of the Public Company Accounting Oversight Board (United States). Those standards require that we plan and perform the audit to obtain reasonable assurance about whether the financial statements and financial highlights are free of material misstatement. An audit includes examining, on a test basis, evidence supporting the amounts and disclosures in the financial statements. Our procedures included confirmation of securities owned as of October 31, 2014, by correspondence with the custodian, transfer agent and brokers or by other appropriate auditing procedures when replies from brokers were not received. An audit also includes assessing the accounting principles used and significant estimates made by management, as well as evaluating the overall financial statement presentation. We believe that our audits provide a reasonable basis for our opinion.
In our opinion, the financial statements and financial highlights referred to above present fairly, in all material respects, the financial position of the Fund as of October 31, 2014, and the results of its operations for the year then ended, the changes in its net assets for each of the years in the two-year period then ended and the financial highlights for each of the years in the five-year period then ended, in conformity with U.S. generally accepted accounting principles.

New York, New York
December 16, 2014
Tax Information
(Unaudited)
For the year ended October 31, 2014, the Series reports 100% of the ordinary income dividends paid during the year as qualified dividend income in accordance with Section 854 of the Internal Revenue Code.
For the fiscal year ended October 31, 2014, the Series made an election to pass through the maximum amount of the portion of the ordinary income dividends paid derived from foreign source income as well as any foreign taxes paid by the Series in accordance with Section 853 of the Internal Revenue Code of the following amounts: $125,895 foreign tax credit from recognized foreign source income of $1,995,498.
In January 2015, you will be advised on IRS Form 1099-DIV or substitute 1099-DIV as to the federal tax status of distributions received by you in calendar year 2014.
| | | | |
| Prudential International Value Fund | | | 47 | |
INFORMATION ABOUT BOARD MEMBERS AND OFFICERS
(Unaudited)
Information about Board Members and Officers of the Fund is set forth below. Board Members who are not deemed to be “interested persons” of the Fund, as defined in the 1940 Act, are referred to as “Independent Board Members.” Board Members who are deemed to be “interested persons” of the Fund are referred to as “Interested Board Members.” The Board Members are responsible for the overall supervision of the operations of the Fund and perform the various duties imposed on the directors of investment companies by the 1940 Act. The Board in turn elects the Officers, who are responsible for administering the day-to-day operations of the Fund.
| | | | |
| Independent Board Members(1) |
| | | |
Name, Address, Age Position(s) Portfolios Overseen | | Principal Occupation(s) During Past Five Years | | Other Directorships Held |
Ellen S. Alberding (56) Board Member Portfolios Overseen: 69 | | President and Board Member, The Joyce Foundation (charitable foundation) (since 2002); Vice Chair, City Colleges of Chicago (community college system) (since 2011); Trustee, Skills for America’s Future (national initiative to connect employers to community colleges) (since 2011); Trustee, National Park Foundation (charitable foundation for national park system) (since 2009); Trustee, Economic Club of Chicago (since 2009). | | None. |
Kevin J. Bannon (62) Board Member Portfolios Overseen: 70 | | Managing Director (since April 2008) and Chief Investment Officer (October 2008-November 2013) of Highmount Capital LLC (registered investment adviser); formerly Executive Vice President and Chief Investment Officer (April 1993-August 2007) of Bank of New York Company; President (May 2003-May 2007) of BNY Hamilton Family of Mutual Funds. | | Director of Urstadt Biddle Properties (equity real estate investment trust) (since September 2008). |
Linda W. Bynoe (62) Board Member Portfolios Overseen: 70 | | President and Chief Executive Officer (since March 1995) and formerly Chief Operating Officer (December 1989-February 1995) of Telemat Ltd. (management consulting); formerly Vice President (January 1985-June 1989) at Morgan Stanley & Co (broker-dealer). | | Director of Simon Property Group, Inc. (retail real estate) (May 2003-May 2012); Director of Anixter International, Inc. (communication products distributor) (since January 2006); Director of Northern Trust Corporation (financial services) (since April 2006); Trustee of Equity Residential (residential real estate) (since December 2009). |
Prudential International Value Fund
| | | | |
| Independent Board Members(1) |
| | | |
Name, Address, Age Position(s) Portfolios Overseen | | Principal Occupation(s) During Past Five Years | | Other Directorships Held |
Keith F. Hartstein (58) Board Member Portfolios Overseen: 70 | | Retired; Formerly President and Chief Executive Officer (2005-2012), Senior Vice President (2004-2005), Senior Vice President of Sales and Marketing (1997-2004), and various executive management positions (1990-1997), John Hancock Funds, LLC (asset management); Chairman, Investment Company Institute’s Sales Force Marketing Committee (2003-2008). | | None. |
Michael S. Hyland, CFA (69) Board Member Portfolios Overseen: 69 | | Retired (since February 2005); Formerly Senior Managing Director (July 2001-February 2005) of Bear Stearns & Co, Inc.; Global Partner, INVESCO (1999-2001); Managing Director and President of Salomon Brothers Asset Management (1989-1999). | | None. |
Douglas H. McCorkindale (75) Board Member Portfolios Overseen: 69 | | Retired; Formerly Chairman (February 2001-June 2006), Chief Executive Officer (June 2000-July 2005), President (September 1997-July 2005) and Vice Chairman (March 1984-May 2000) of Gannett Co. Inc. (publishing and media). | | Director of Lockheed Martin Corp. (aerospace and defense) (since May 2001). |
Stephen P. Munn (72) Board Member Portfolios Overseen: 70 | | Lead Director (since 2007) and formerly Chairman (1993-2007) of Carlisle Companies Incorporated (manufacturer of industrial products). | | Lead Director (since 2007) of Carlisle Companies Incorporated (manufacturer of industrial products). |
James E. Quinn (62) Board Member Portfolios Overseen: 69 | | Retired; Formerly President (2003-2012) and Director (2003-2008), and Vice Chairman and Director (1998-2003), Tiffany & Company (jewelry retailing); Director, Mutual of America Capital Management Corporation (asset management) (since 1996); Director, Hofstra University (since 2008); Vice Chairman, Museum of the City of New York (since 1994). | | Director of Deckers Outdoor Corporation (footwear manufacturer) (since 2011). |
Richard A. Redeker (71) Board Member & Independent Chair Portfolios Overseen: 70 | | Retired Mutual Fund Senior Executive (44 years); Management Consultant; Director, Mutual Fund Directors Forum (since 2014); Independent Directors Council (organization of 2,800 Independent Mutual Fund Directors)-Executive Committee, Chair of Policy Steering Committee, Governing Council. | | None. |
Visit our website at www.prudentialfunds.com
| | | | |
| Independent Board Members(1) |
| | | |
Name, Address, Age Position(s) Portfolios Overseen | | Principal Occupation(s) During Past Five Years | | Other Directorships Held |
Robin B. Smith (75) Board Member Portfolios Overseen:70 | | Chairman of the Board (since January 2003) of Publishers Clearing House (direct marketing); Member of the Board of Directors of ADLPartner (marketing) (since December 2010); formerly Chairman and Chief Executive Officer (August 1996-January 2003) of Publishers Clearing House. | | Formerly Director of BellSouth Corporation (telecommunications) (1992-2006). |
Stephen G. Stoneburn (71) Board Member Portfolios Overseen: 70 | | Chairman, (since July 2011), President and Chief Executive Officer (since June 1996) of Quadrant Media Corp. (publishing company); formerly President (June 1995-June 1996) of Argus Integrated Media, Inc.; Senior Vice President and Managing Director (January 1993-1995) of Cowles Business Media; Senior Vice President of Fairchild Publications, Inc. (1975-1989). | | None. |
| | | | |
| Interested Board Members(1) |
| | | |
Name, Address, Age Position(s) Portfolios Overseen | | Principal Occupation(s) During Past Five Years | | Other Directorships Held |
Stuart S. Parker (52) Board Member & President Portfolios Overseen: 64 | | President of Prudential Investments LLC (since January 2012); Executive Vice President of Prudential Investment Management Services LLC (since December 2012); Executive Vice President of Jennison Associates LLC and Head of Retail Distribution of Prudential Investments LLC (June 2005-December 2011). | | None. |
Scott E. Benjamin (41) Board Member & Vice President Portfolios Overseen: 70 | | Executive Vice President (since June 2009) of Prudential Investments LLC; Executive Vice President (June 2009-June 2012) and Vice President (since June 2012) of Prudential Investment Management Services LLC; Executive Vice President (since September 2009) of AST Investment Services, Inc.; Senior Vice President of Product Development and Marketing, Prudential Investments (since February 2006); Vice President of Product Development and Product Management, Prudential Investments (2003-2006). | | None. |
Prudential International Value Fund
| | | | |
| Interested Board Members(1) |
| | | |
Name, Address, Age Position(s) Portfolios Overseen | | Principal Occupation(s) During Past Five Years | | Other Directorships Held |
Grace C. Torres* (55) Board Member Portfolios Overseen: 65 | | Retired; Formerly Treasurer and Principal Financial and Accounting Officer of the Prudential Investments Funds, Target Funds, Advanced Series Trust, Prudential Variable Contract Accounts and The Prudential Series Fund (1998-June 2014); Assistant Treasurer (March 1999-June 2014) and Senior Vice President (September 1999-June 2014) of Prudential Investments LLC; Assistant Treasurer (May 2003-June 2014) and Vice President (June 2005-June 2014) of AST Investment Services, Inc.; Senior Vice President and Assistant Treasurer (May 2003-June 2014) of Prudential Annuities Advisory Services, Inc. | | None. |
* Note: Prior to her retirement in 2014, Ms. Torres was employed by Prudential Investments LLC. Due to her prior employment, she is considered to be an “interested person” under the 1940 Act. Ms. Torres is a non-management Interested Board Member.
(1) The year that each Board Member joined the Funds’ Board is as follows:
Ellen S. Alberding; 2013; Kevin J. Bannon, 2008; Linda W. Bynoe, 2005; Keith F. Hartstein, 2013; Michael S. Hyland, 2008; Douglas H. McCorkindale, 2003; Stephen P. Munn, 2008; James E. Quinn, 2013; Richard A. Redeker, 2003; Robin B. Smith, 1996; Stephen G. Stoneburn, 1996; Stuart S. Parker, Board Member and President since 2012; Scott E. Benjamin, Board Member since 2010 and Vice President since 2009; Grace C. Torres, 2014.
| | | | |
| Fund Officers(a) |
| | | |
Name, Address and Age Position with Fund | | Principal Occupation(s) During Past Five Years | | Length of Service as Fund Officer |
Raymond A. O’Hara (59) Chief Legal Officer | | Vice President and Corporate Counsel (since July 2010) of Prudential Insurance Company of America (Prudential); Vice President (March 2011-Present) of Pruco Life Insurance Company and Pruco Life Insurance Company of New Jersey; Vice President and Corporate Counsel (March 2011-Present) of Prudential Annuities Life Assurance Corporation; Chief Legal Officer of Prudential Investments LLC (since June 2012); Chief Legal Officer of Prudential Mutual Fund Services LLC (since June 2012) and Corporate Counsel of AST Investment Services, Inc. (since June 2012); formerly Assistant Vice President and Corporate Counsel (September 2008-July 2010) of The Hartford Financial Services Group, Inc.; formerly Associate (September 1980-December 1987) and Partner (January 1988–August 2008) of Blazzard & Hasenauer, P.C. (formerly, Blazzard, Grodd & Hasenauer, P.C.). | | Since 2012 |
Visit our website at www.prudentialfunds.com
| | | | |
| Fund Officers(a) |
| | | |
Name, Address and Age Position with Fund | | Principal Occupation(s) During Past Five Years | | Length of Service as Fund Officer |
Chad A. Earnst (39) Chief Compliance Officer | | Chief Compliance Officer (September 2014-Present) of Prudential Investments LLC; Chief Compliance Officer (September 2014-Present) of the Prudential Investments Funds, Target Funds, Advanced Series Trust, The Prudential Series Fund, Prudential’s Gibraltar Fund, Inc., Prudential Global Short Duration High Yield Income Fund, Inc., Prudential Short Duration High Yield Fund, Inc. and Prudential Jennison MLP Income Fund, Inc.; formerly Assistant Director (March 2010-August 2014) of the Asset Management Unit, Division of Enforcement, US Securities & Exchange Commission; Assistant Regional Director (January 2010-August 2014), Branch Chief (June 2006–December 2009) and Senior Counsel (April 2003-May 2006) of the Miami Regional Office, Division of Enforcement, US Securities & Exchange Commission. | | Since 2014 |
Deborah A. Docs (56) Secretary | | Vice President and Corporate Counsel (since January 2001) of Prudential; Vice President (since December 1996) and Assistant Secretary (since March 1999) of Prudential Investments LLC; formerly Vice President and Assistant Secretary (May 2003-June 2005) of AST Investment Services, Inc. | | Since 2004 |
Jonathan D. Shain (56) Assistant Secretary | | Vice President and Corporate Counsel (since August 1998) of Prudential; Vice President and Assistant Secretary (since May 2001) of Prudential Investments LLC; Vice President and Assistant Secretary (since February 2001) of Prudential Mutual Fund Services LLC; formerly Vice President and Assistant Secretary (May 2003-June 2005) of AST Investment Services, Inc. | | Since 2005 |
Claudia DiGiacomo (40) Assistant Secretary | | Vice President and Corporate Counsel (since January 2005) of Prudential; Vice President and Assistant Secretary of Prudential Investments LLC (since December 2005); Associate at Sidley Austin Brown & Wood LLP (1999-2004). | | Since 2005 |
Andrew R. French (52) Assistant Secretary | | Vice President and Corporate Counsel (since February 2010) of Prudential; formerly Director and Corporate Counsel (2006-2010) of Prudential; Vice President and Assistant Secretary (since January 2007) of Prudential Investments LLC; Vice President and Assistant Secretary (since January 2007) of Prudential Mutual Fund Services LLC. | | Since 2006 |
Amanda S. Ryan (36) Assistant Secretary | | Director and Corporate Counsel (since March 2012) of Prudential; Director and Assistant Secretary (since June 2012) of Prudential Investments LLC; Associate at Ropes & Gray LLP (2008-2012). | | Since 2012 |
Theresa C. Thompson (52) Deputy Chief Compliance Officer | | Vice President, Compliance, Prudential Investments LLC (since April 2004); and Director, Compliance, Prudential Investments LLC (2001-2004). | | Since 2008 |
Prudential International Value Fund
| | | | |
| Fund Officers(a) |
| | | |
Name, Address and Age Position with Fund | | Principal Occupation(s) During Past Five Years | | Length of Service as Fund Officer |
Richard W. Kinville (46) Anti-Money Laundering Compliance Officer | | Vice President, Corporate Compliance, Anti-Money Laundering Unit (since January 2005) of Prudential; committee member of the American Council of Life Insurers Anti-Money Laundering and Critical Infrastructure Committee (since January 2007); formerly Investigator and Supervisor in the Special Investigations Unit for the New York Central Mutual Fire Insurance Company (August 1994-January 1999); Investigator in AXA Financial’s Internal Audit Department and Manager in AXA’s Anti-Money Laundering Office (January 1999-January 2005); first chair of the American Council of Life Insurers Anti-Money Laundering and Critical Infrastructure Committee (June 2007-December 2009). | | Since 2011 |
M. Sadiq Peshimam (50) Treasurer and Principal Financial and Accounting Officer | | Assistant Treasurer of funds in the Prudential Mutual Fund Complex (2006-2014); Vice President (since 2005) of Prudential Investments LLC. | | Since 2006 |
Peter Parrella (56) Assistant Treasurer | | Vice President (since 2007) and Director (2004-2007) within Prudential Mutual Fund Administration; formerly Tax Manager at SSB Citi Fund Management LLC (1997-2004). | | Since 2007 |
Lana Lomuti (47) Assistant Treasurer | | Vice President (since 2007) and Director (2005-2007), within Prudential Mutual Fund Administration; formerly Assistant Treasurer (December 2007-February 2014) of The Greater China Fund, Inc. | | Since 2014 |
Linda McMullin (53) Assistant Treasurer | | Vice President (since 2011) and Director (2008-2011) within Prudential Mutual Fund Administration. | | Since 2014 |
| (a) | Excludes Mr. Parker and Mr. Benjamin, interested Board Members who also serve as President and Vice President, respectively. |
Explanatory Notes to Tables:
| n | Board Members are deemed to be “Interested,” as defined in the 1940 Act, by reason of their affiliation with Prudential Investments LLC and/or an affiliate of Prudential Investments LLC. |
| n | Unless otherwise noted, the address of all Board Members and Officers is c/o Prudential Investments LLC, Gateway Center Three, 100 Mulberry Street, Newark, New Jersey 07102-4077. |
| n | There is no set term of office for Board Members or Officers. The Board Members have adopted a retirement policy, which calls for the retirement of Board Members on December 31 of the year in which they reach the age of 75. |
| n | “Other Directorships Held” includes only directorships of companies required to register or file reports with the SEC under the 1934 Act (that is, “public companies”) or other investment companies registered under the 1940 Act. |
| n | “Portfolios Overseen” includes all investment companies managed by Prudential Investments LLC. The investment companies for which Prudential Investments LLC serves as manager include the Prudential Investments Mutual Funds, The Prudential Variable Contract Accounts, Target Mutual Funds, Prudential Short Duration High Yield Fund, Inc., Prudential Global Short Duration High Yield Fund, Inc., The Prudential Series Fund, Prudential’s Gibraltar Fund, Inc. and the Advanced Series Trust. |
Visit our website at www.prudentialfunds.com
Approval of Advisory Agreements
The Fund’s Board of Directors
The Board of Directors (the “Board”) of Prudential International Value Fund (the “Fund”)1 consists of thirteen individuals, eleven of whom are not “interested persons” of the Fund, as defined in the Investment Company Act of 1940, as amended (the “1940 Act”) (the “Independent Directors”). The Board is responsible for the oversight of the Fund and its operations, and performs the various duties imposed on the directors of investment companies by the 1940 Act. The Independent Directors have retained independent legal counsel to assist them in connection with their duties. The Chair of the Board is an Independent Director. The Board has established three standing committees: the Audit Committee, the Nominating and Governance Committee, and the Investment Committee. Each committee is chaired by, and composed of, Independent Directors.
Annual Approval of the Fund’s Advisory Agreements
As required under the 1940 Act, the Board determines annually whether to renew the Fund’s management agreement with Prudential Investments LLC (“PI”) and the Fund’s subadvisory agreements with each of LSV Asset Management (“LSV”) and Thornburg Investment Management, Inc. (“Thornburg”). In considering the renewal of the agreements, the Board, including all of the Independent Directors, met on June 9-11, 2014 and approved the renewal of the agreements through July 31, 2015, after concluding that the renewal of the agreements was in the best interests of the Fund and its shareholders.2
In advance of the meetings, the Board requested and received materials relating to the agreements, and had the opportunity to ask questions and request further information in connection with its consideration. Among other things, the Board considered comparative fee information from PI, LSV and Thornburg. Also, the Board considered comparisons with other mutual funds in relevant Peer Universes and Peer Groups, as is further discussed below.
In approving the agreements, the Board, including the Independent Directors advised by independent legal counsel, considered the factors it deemed relevant, including the nature, quality and extent of services provided by PI and each subadviser, the performance of the Fund, the profitability of PI and its affiliates, expenses and fees, and the potential for economies of scale that may be shared with the Fund and its shareholders as the Fund’s assets grow. In their deliberations, the Directors did not identify any single factor which alone was responsible for the Board’s decision to
| 1 | Prudential International Value Fund is a series of Prudential World Fund, Inc. |
| 2 | Grace C. Torres was elected to the Board as of December 2014, and therefore did not participate in the consideration of these approvals. |
Prudential International Value Fund
Approval of Advisory Agreements (continued)
approve the agreements with respect to the Fund. In connection with its deliberations, the Board considered information provided by PI throughout the year at regular Board meetings, presentations from portfolio managers and other information, as well as information furnished at or in advance of the meetings on June 9-11, 2014.
The Directors determined that the overall arrangements between the Fund and PI, which serves as the Fund’s investment manager pursuant to a management agreement, and between PI and each of LSV and Thornburg, which serve as the Fund’s subadvisers pursuant to the terms of subadvisory agreements with PI, are in the best interests of the Fund and its shareholders in light of the services performed, fees charged and such other matters as the Directors considered relevant in the exercise of their business judgment.
The material factors and conclusions that formed the basis for the Directors’ reaching their determinations to approve the continuance of the agreements are separately discussed below.
Nature, Quality and Extent of Services
The Board received and considered information regarding the nature, quality and extent of services provided to the Fund by PI, LSV and Thornburg. The Board considered the services provided by PI, including but not limited to the oversight of the subadvisers for the Fund, as well as the provision of fund recordkeeping, compliance, and other services to the Fund. With respect to PI’s oversight of the subadvisers, the Board noted that PI’s Strategic Investment Research Group (“SIRG”), which is a business unit of PI, is responsible for screening and recommending new subadvisers when appropriate, as well as monitoring and reporting to the Board on the performance and operations of the subadvisers. The Board also considered that PI pays the salaries of all of the officers and non-independent Directors of the Fund. The Board also considered the investment subadvisory services provided by LSV and Thornburg, as well as adherence to the Fund’s investment restrictions and compliance with applicable Fund policies and procedures. The Board considered PI’s evaluations of the subadvisers, as well as PI’s recommendation, based on its review of each subadviser, to renew the subadvisory agreements.
The Board considered the qualifications, backgrounds and responsibilities of PI’s senior management responsible for the oversight of the Fund, LSV and Thornburg, and also considered the qualifications, backgrounds and responsibilities of the LSV and Thornburg portfolio managers who are responsible for the day-to-day management of the Fund’s portfolio. The Board was provided with information pertaining to PI’s, LSV’s and Thornburg’s organizational structure, senior management, investment operations, and other relevant information pertaining to PI, LSV and Thornburg. The Board also
Visit our website at www.prudentialfunds.com
noted that it received favorable compliance reports from the Fund’s Chief Compliance Officer (“CCO”) as to each of PI, LSV and Thornburg.
The Board concluded that it was satisfied with the nature, extent and quality of the investment management services provided by PI and the subadvisory services provided to the Fund by LSV and Thornburg, and that there was a reasonable basis on which to conclude that the Fund benefits from the services provided by PI, LSV and Thornburg under the management and subadvisory agreements.
Costs of Services and Profits Realized by PI
The Board was provided with information on the profitability of PI in serving as the Fund’s investment manager. The Board discussed with PI the methodology utilized in assembling the information regarding profitability and considered its reasonableness. The Board recognized that it is difficult to make comparisons of profitability from fund management contracts because comparative information is not generally publicly available and is affected by numerous factors, including the structure of the particular adviser, the types of funds it manages, its business mix, numerous assumptions regarding allocations and the adviser’s capital structure and cost of capital. Taking these factors into account, the Board concluded that the profitability of PI in relation to the services rendered was not unreasonable.
The Board considered information about the profitability of LSV and Thornburg, but concluded that the level of a subadviser’s profitability may not be as significant given the arm’s length nature of the process by which the subadvisory fee rates were negotiated by PI, LSV and Thornburg as well as the fact that PI compensates the subadvisers out of its management fee.
Economies of Scale
In 2013, PI and the Board retained an outside business consulting firm, in order to assist the Board in its consideration of the renewal of the management and subadvisory agreements, by reviewing management fee breakpoint usage and trends in management fees across the mutual fund industry. The consulting firm’s analysis and conclusions with respect to the Funds’ management fee structures were presented to the Board and PI at the December 3-5, 2013 meeting, and were discussed extensively by the Board and PI over the following two quarters.
The Board received and discussed information concerning whether PI realizes economies of scale as the Fund’s assets grow beyond current levels. The Board noted that the management fee schedule for the Fund includes breakpoints, which have the effect of decreasing the fee rate as assets increase, but at the current level of assets the
Prudential International Value Fund
Approval of Advisory Agreements (continued)
Fund does not realize the effect of those rate reductions. The Board took note that the Fund’s fee structure would result in benefits to Fund shareholders when (and if) assets reach the levels at which the fee rate is reduced. These benefits will accrue whether or not PI is then realizing any economies of scale. The Board also recognized the inherent limitations of any analysis of economies of scale, stemming largely from the Board’s understanding that most of PI’s costs are not specific to individual funds, but rather are incurred across a variety of products and services.
Other Benefits to PI, LSV and Thornburg
The Board considered potential ancillary benefits that might be received by PI, LSV and Thornburg and their affiliates as a result of their relationship with the Fund. The Board concluded that potential benefits to be derived by PI included fees received by affiliates of PI for serving as the Fund’s securities lending agent, transfer agency fees received by the Fund’s transfer agent (which is affiliated with PI), and benefits to its reputation as well as other intangible benefits resulting from PI’s association with the Fund. The Board concluded that the potential benefits to be derived by LSV and Thornburg included their ability to use soft dollar credits, brokerage commissions received by affiliates of LSV or Thornburg, as well as the potential benefits consistent with those generally resulting from an increase in assets under management, specifically, potential access to additional research resources and benefits to their reputations. The Board concluded that the benefits derived by PI, LSV and Thornburg were consistent with the types of benefits generally derived by investment managers and subadvisers to mutual funds.
Performance of the Fund / Fees and Expenses
The Board considered certain additional specific factors and made related conclusions relating to the historical performance of the Fund for the one-, three-, five- and ten-year periods ended December 31, 2013.
The Board also considered the Fund’s actual management fee, as well as the Fund’s net total expense ratio, for the fiscal year ended October 31, 2013. The Board considered the management fee for the Fund as compared to the management fee charged by PI to other funds and the fee charged by other advisers to comparable mutual funds in a Peer Group. The actual management fee represents the fee rate actually paid by Fund shareholders and includes any fee waivers or reimbursements. The net total expense ratio for the Fund represents the actual expense ratio incurred by Fund shareholders.
The mutual funds included in the Peer Universe (a blend of the Lipper International Large-Cap Core Funds and International Multi-Cap Core Funds Performance
Visit our website at www.prudentialfunds.com
Universes)3 and the Peer Group were objectively determined by Lipper Inc. (“Lipper”), an independent provider of mutual fund data. To the extent that PI deemed appropriate, and for reasons addressed in detail with the Board, PI may have provided supplemental data compiled by Lipper for the Board’s consideration. The comparisons placed the Fund in various quartiles, with the first quartile being the best 25% of the mutual funds (for performance, the best performing mutual funds and, for expenses, the lowest cost mutual funds).
The section below summarizes key factors considered by the Board and the Board’s conclusions regarding the Fund’s performance, fees and overall expenses. The table sets forth gross performance comparisons (which do not reflect the impact on performance of fund expenses, or any subsidies, expense caps or waivers that may be applicable) with the Peer Universe, actual management fees with the Peer Group (which reflect the impact of any subsidies or fee waivers), and net total expenses with the Peer Group, each of which were key factors considered by the Board.
| | | | | | | | |
| Performance | | 1 Year | | 3 Years | | 5 Years | | 10 Years |
| | | 3rd Quartile | | 3rd Quartile | | 2nd Quartile | | 2nd Quartile |
| Actual Management Fees: 4th Quartile |
| Net Total Expenses: 4th Quartile |
| | • | | The Board noted that the Fund outperformed its benchmark index over the five- and ten-year periods, but underperformed its benchmark index over the one- and three-year periods. |
| | • | | The Board and PI agreed to implement an expense cap of 1.54% (exclusive of 12b-1 fees and certain other fees) through February 28, 2015. |
| | • | | The Board concluded that, in light of the Fund’s longer-term performance record, it was reasonable to continue to monitor performance, and that it would be in the best interests of the Fund and its shareholders to renew the agreements. |
| | • | | The Board concluded that the management fees (including subadvisory fees) and total expenses were reasonable in light of the services provided. |
* * *
After full consideration of these factors, the Board concluded that approval of the agreements was in the best interests of the Fund and its shareholders.
| 3 | Although Lipper classifies the Fund in its International Multi-Cap Core Funds Performance Universe, a blend of the International Large-Cap Core Funds and International Multi-Cap Core Funds Performance Universes was utilized because PI believes that the funds included in these Universes provide a more appropriate basis for Fund performance comparisons. |
Prudential International Value Fund
| | | | |
| n MAIL | | n TELEPHONE | | n WEBSITE |
Gateway Center Three 100 Mulberry Street Newark, NJ 07102 | | (800) 225-1852 | | www.prudentialfunds.com |
|
| PROXY VOTING |
| The Board of Directors of the Fund has delegated to the Fund’s investment subadvisers the responsibility for voting any proxies and maintaining proxy recordkeeping with respect to the Fund. A description of these proxy voting policies and procedures is available without charge, upon request, by calling (800) 225-1852 or by visiting the Securities and Exchange Commission’s website at www.sec.gov. Information regarding how the Fund voted proxies relating to portfolio securities during the most recent 12-month period ended June 30 is available on the Fund’s website and on the Securities and Exchange Commission’s website. |
|
| DIRECTORS |
| Ellen S. Alberding • Kevin J. Bannon • Scott E. Benjamin • Linda W. Bynoe • Keith F. Hartstein • Michael S. Hyland • Douglas H. McCorkindale • Stephen P. Munn • Stuart S. Parker • James E. Quinn • Richard A. Redeker • Robin B. Smith • Stephen G. Stoneburn • Grace C. Torres |
|
| OFFICERS |
| Stuart S. Parker, President • Scott E. Benjamin, Vice President • M. Sadiq Peshimam, Treasurer and Principal Financial and Accounting Officer • Raymond A. O’Hara, Chief Legal Officer • Deborah A. Docs, Secretary • Chad A. Earnst, Chief Compliance Officer • Theresa C. Thompson, Deputy Chief Compliance Officer • Richard W. Kinville, Anti-Money Laundering Compliance Officer • Jonathan D. Shain, Assistant Secretary • Claudia DiGiacomo, Assistant Secretary • Amanda S. Ryan, Assistant Secretary • Andrew R. French, Assistant Secretary • Peter Parrella, Assistant Treasurer • Lana Lomuti, Assistant Treasurer • Linda McMullin, Assistant Treasurer |
| | | | |
| MANAGER | | Prudential Investments LLC | | Gateway Center Three
100 Mulberry Street
Newark, NJ 07102 |
|
| INVESTMENT SUBADVISERS | | LSV Asset Management | | 155 North Wacker Drive
46th Floor Chicago, IL 60606 |
|
| | Thornburg Investment
Management, Inc. | | 2300 North Ridgetop Road
Santa Fe, NM 87506 |
|
| DISTRIBUTOR | | Prudential Investment
Management Services LLC | | Gateway Center Three
100 Mulberry Street
Newark, NJ 07102 |
|
| CUSTODIAN | | The Bank of New York Mellon | | One Wall Street
New York, NY 10286 |
|
| TRANSFER AGENT | | Prudential Mutual Fund
Services LLC | | PO Box 9658
Providence, RI 02940 |
|
| INDEPENDENT REGISTERED PUBLIC ACCOUNTING FIRM | | KPMG LLP | | 345 Park Avenue
New York, NY 10154 |
|
| FUND COUNSEL | | Willkie Farr & Gallagher LLP | | 787 Seventh Avenue
New York, NY 10019 |
|
| An investor should consider the investment objectives, risks, charges, and expenses of the Fund carefully before investing. The prospectus and summary prospectus contain this and other information about the Fund. An investor may obtain a prospectus and summary prospectus by visiting our website at www.prudentialfunds.com or by calling (800) 225-1852. The prospectus and summary prospectus should be read carefully before investing. |
|
| E-DELIVERY |
| To receive your mutual fund documents online, go to www.prudentialfunds.com/edelivery and enroll. Instead of receiving printed documents by mail, you will receive notification via email when new materials are available. You can cancel your enrollment or change your email address at any time by visiting the website address above. |
|
| SHAREHOLDER COMMUNICATIONS WITH DIRECTORS |
| Shareholders can communicate directly with the Board of Directors by writing to the Chair of the Board, Prudential International Value Fund, Prudential Investments, Attn: Board of Directors, 100 Mulberry Street, Gateway Center Three, Newark, NJ 07102. Shareholders can communicate directly with an individual Director by writing to the same address. Communications are not screened before being delivered to the addressee. |
|
| AVAILABILITY OF PORTFOLIO SCHEDULE |
| The Fund files its complete schedule of portfolio holdings with the Securities and Exchange Commission for the first and third quarters of each fiscal year on Form N-Q. The Fund’s Forms N-Q are available on the Commission’s website at www.sec.gov. The Fund’s Forms N-Q may also be reviewed and copied at the Commission’s Public Reference Room in Washington, D.C. Information on the operation and location of the Public Reference Room may be obtained by calling 1-800-SEC-0330. The Fund’s schedule of portfolio holdings is also available on the Fund’s website as of the end of each month. |
|
| The Fund’s Statement of Additional Information contains additional information about the Fund’s Directors and is available without charge, upon request, by calling (800) 225-1852. |
Mutual Funds:
| | | | |
ARE NOT INSURED BY THE FDIC OR ANY
FEDERAL GOVERNMENT AGENCY | | MAY LOSE VALUE | | ARE NOT A DEPOSIT OF OR GUARANTEED
BY ANY BANK OR ANY BANK AFFILIATE |

PRUDENTIAL INTERNATIONAL VALUE FUND
| | | | | | | | |
| SHARE CLASS | | A | | B | | C | | Z |
| NASDAQ | | PISAX | | PISBX | | PCISX | | PISZX |
| CUSIP | | 743969503 | | 743969602 | | 743969701 | | 743969800 |
MF115E 0270904-00001-00

PRUDENTIAL INVESTMENTS»MUTUAL FUNDS
PRUDENTIAL EMERGING MARKETS DEBT LOCAL CURRENCY FUND
ANNUAL REPORT · OCTOBER 31, 2014
Fund Type
Emerging Market Bond
Objective
Total return, through a combination of current income and capital appreciation
This report is not authorized for distribution to prospective investors unless preceded or accompanied by a current prospectus.
The views expressed in this report and information about the Fund’s portfolio holdings are for the period covered by this report and are subject to change thereafter.
Mutual funds are distributed by Prudential Investment Management Services LLC (PIMS). Prudential Fixed Income is a unit of Prudential Investment Management, Inc. (PIM), a registered investment adviser. PIMS and PIM are Prudential Financial companies. © 2014 Prudential Financial, Inc. and its related entities. Prudential Investments LLC, Prudential, the Prudential logo, Bring Your Challenges, and the Rock symbol are service marks of Prudential Financial, Inc. and its related entities, registered in many jurisdictions worldwide.

December 15, 2014
Dear Shareholder:
We hope you find the annual report for the Prudential Emerging Markets Debt Local Currency Fund informative and useful. The report covers performance for the 12-month period that ended October 31, 2014.
Since market conditions change over time, we believe it is important to maintain a diversified portfolio of funds consistent with your tolerance for risk, time horizon, and financial goals.
Your financial advisor can help you create a diversified investment plan that may include funds covering all the basic asset classes and that reflects your personal investor profile and risk tolerance. Keep in mind, however, that diversification and asset allocation strategies do not assure a profit or protect against loss in declining markets.
Prudential Investments® is dedicated to helping you solve your toughest investment challenges—whether it’s capital growth, reliable income, or protection from market volatility and other risks. We offer the expertise of Prudential Financial’s affiliated asset managers* that strive to be leaders in a broad range of funds to help you stay on course to the future you envision. They also manage money for major corporations and pension funds around the world, which means you benefit from the same expertise, innovation, and attention to risk demanded by today’s most sophisticated investors.
Thank you for choosing the Prudential Investments family of funds.
Sincerely,

Stuart S. Parker, President
Prudential Emerging Markets Debt Local Currency Fund
*Most of Prudential Investments’ equity funds are advised by Jennison Associates LLC, Quantitative Management Associates LLC (QMA), or Prudential Real Estate Investors. Prudential Investments’ fixed income and money market funds are advised by Prudential Investment Management, Inc. (PIM) through its Prudential Fixed Income unit. Jennison Associates, QMA, and PIM are registered investment advisers and Prudential Financial companies. Prudential Real Estate Investors is a unit of PIM.
| | | | |
| Prudential Emerging Markets Debt Local Currency Fund | | | 1 | |
Your Fund’s Performance (Unaudited)
Performance data quoted represent past performance. Past performance does not guarantee future results. The investment return and principal value of an investment will fluctuate, so that an investor’s shares, when redeemed, may be worth more or less than their original cost. Current performance may be lower or higher than the past performance data quoted. An investor may obtain performance data as of the most recent month-end by visiting our website at www.prudentialfunds.com or by calling (800) 225-1852.
| | | | | | | | |
Cumulative Total Returns (Without Sales Charges) as of 10/31/14 | |
| | | One Year | | | Since Inception | |
Class A | | | –2.47 | % | | | –0.79% (3/30/11) | |
Class C | | | –3.21 | | | | –2.63 (3/30/11) | |
Class Q | | | –1.97 | | | | 0.61 (3/30/11) | |
Class Z | | | –2.12 | | | | 0.46 (3/30/11) | |
JP Morgan Government Bond Index-Emerging Markets Global Diversified Index | | | –2.68 | | | | 3.08 | |
Lipper Emerging Markets Local Currency Debt Funds Average | | | –2.69 | | | | 1.71 | |
| | | | | | | | |
Average Annual Total Returns (With Sales Charges) as of 9/30/14 | |
| | | One Year | | | Since Inception | |
Class A | | | –5.52 | % | | | –2.07% (3/30/11) | |
Class C | | | –2.74 | | | | –1.28 (3/30/11) | |
Class Q | | | –0.69 | | | | –0.38 (3/30/11) | |
Class Z | | | –0.71 | | | | –0.38 (3/30/11) | |
JP Morgan Government Bond Index-Emerging Markets Global Diversified Index | | | –1.54 | | | | 0.43 | |
Lipper Emerging Markets Local Currency Debt Funds Average | | | –1.47 | | | | 0.13 | |
| | | | | | | | |
Average Annual Total Returns (With Sales Charges) as of 10/31/14 | |
| | | One Year | | | Since Inception | |
Class A | | | –6.86 | % | | | –1.49% (3/30/11) | |
Class C | | | –4.12 | | | | –0.74 (3/30/11) | |
Class Q | | | –1.97 | | | | 0.17 (3/30/11) | |
Class Z | | | –2.12 | | | | 0.13 (3/30/11) | |
| | | | | | | | |
Average Annual Total Returns (Without Sales Charges) as of 10/31/14 | |
| | | One Year | | | Since Inception | |
Class A | | | –2.47 | % | | | –0.22% (3/30/11) | |
Class C | | | –3.21 | | | | –0.74 (3/30/11) | |
Class Q | | | –1.97 | | | | 0.17 (3/30/11) | |
Class Z | | | –2.12 | | | | 0.13 (3/30/11) | |
| | |
| 2 | | Visit our website at www.prudentialfunds.com |
Growth of a $10,000 Investment
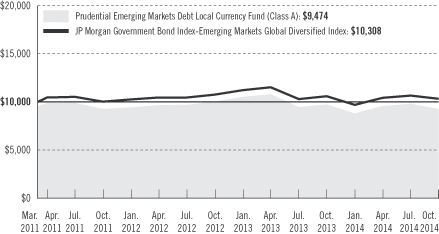
The graph compares a $10,000 investment in the Prudential Emerging Markets Debt Local Currency Fund (Class A shares) with a similar investment in the JP Morgan Government Bond Index-Emerging Markets Global Diversified Index by portraying the initial account values at the commencement of operations for Class A shares (March 30, 2011) and the account values at the end of the current fiscal year (October 31, 2014), as measured on a quarterly basis. For purposes of the graph, and unless otherwise indicated, it has been assumed that (a) the maximum applicable front-end sales charge was deducted from the initial $10,000 investment in Class A shares; (b) all recurring fees (including management fees) were deducted; and (c) all dividends and distributions were reinvested. The line graph provides information for Class A shares only. As indicated in the tables provided earlier, performance for Class C, Class Q, and Class Z shares will vary due to the differing charges and expenses applicable to each share class (as indicated in the following paragraphs). Without waiver of fees and/or expense reimbursement, if any, the returns would have been lower.
Past performance does not predict future performance. Total returns and the ending account values in the graph include changes in share price and reinvestment of dividends and capital gains distributions in a hypothetical investment for the periods shown. The Fund’s total returns do not reflect the deduction of income taxes on an individual’s investment. Taxes may reduce your actual investment returns on income or gains paid by the Fund or any gains you may realize if you sell your shares.
Source: Prudential Investments LLC and Lipper Inc.
Inception returns are provided for any share class with less than 10 calendar years of returns.
| | | | |
| Prudential Emerging Markets Debt Local Currency Fund | | | 3 | |
Your Fund’s Performance (continued)
The returns in the tables do not reflect the deduction of taxes that a shareholder would pay on Fund distributions or following the redemption of Fund shares. The average annual total returns take into account applicable sales charges, which are described for each share class in the table below.
| | | | | | | | |
| | Class A | | Class C | | Class Q | | Class Z |
Maximum initial sales charge | | 4.50% of
the public
offering
price | | None | | None | | None |
Contingent deferred sales charge (CDSC) (as a percentage of the lower of original purchase price or net asset value
at redemption) | | 1% on sales
of $1 million
or more
made within
12 months of
purchase | | 1% on sales
made within
12 months
of purchase | | None | | None |
Annual distribution and service (12b-1) fees (shown as a percentage of average daily net assets) | | .30%
(.25%
currently) | | 1% | | None | | None |
Benchmark Definitions
JP Morgan Government Bond Index-Emerging Markets Global Diversified Index
The JP Morgan Government Bond Index-Emerging Markets Global Diversified Index (GBI-EM Global Diversified), an unmanaged index, is a comprehensive emerging markets debt benchmark that tracks local currency bonds issued by emerging market governments.
Lipper Emerging Markets Local Currency Debt Funds Average
The Lipper Emerging Markets Local Currency Debt Funds Average (Lipper Average) represents returns based on the average return of all funds in the Lipper Emerging Markets Local Currency Debt Funds category for the periods noted. Funds in the Lipper Average seek either current income or total return by investing at least 65% of total assets in debt issues denominated in the currency of their market of issuance. “Emerging market” is defined by a country’s GNP per capita or other economic measures.
Investors cannot invest directly in an index or average. The returns for the Index would be lower if they included the effects of sales charges, operating expenses of a mutual fund, or taxes. Returns for the Lipper Average reflect the deduction of operating expenses, but not sales charges or taxes. The Since Inception returns for the Index and the Lipper Average are measured from the closest month-end to inception date, and not from the Fund’s actual inception date.
| | | | | | | | |
Distributions and Yields as of 10/31/14 | |
| | | Total Distributions
Paid for 12 Months | | | 30-Day
SEC Yield | |
Class A | | $ | 0.53 | | | | 5.50 | % |
Class C | | | 0.47 | | | | 4.96 | |
Class Q | | | 0.55 | | | | 6.09 | |
Class Z | | | 0.55 | | | | 5.96 | |
| | |
| 4 | | Visit our website at www.prudentialfunds.com |
| | | | |
Five Largest Holdings expressed as a percentage of net assets as of 10/31/14 | |
Mexican Bonos, (Mexico), Bonds, Ser. M, 7.750%, 05/29/2031 | | | 3.2 | % |
South Africa Government Bond, (South Africa), Sr. Unsec’d. Notes, Ser. R209, 6.250%, 03/31/2036 | | | 3.2 | |
Colombian TES, (Colombia), Bonds, Ser. B, 6.000%, 04/28/2028 | | | 3.1 | |
Turkey Government Bond, (Turkey), Bonds, 8.500%, 09/14/2022 | | | 2.8 | |
Brazil Notas do Tesouro Nacionalie, (Brazil), Notes, Ser. NTNF, 10.000%, 01/01/2021 | | | 2.7 | |
Holdings reflect only long-term investments and are subject to change.
| | | | |
Credit Quality expressed as a percentage of total investments as of 10/31/14 | |
A | | | 24.72 | % |
BBB | | | 64.66 | |
BB | | | 5.52 | |
B | | | 1.00 | |
CCC | | | 1.61 | |
Not Rated | | | –0.18 | |
Cash/Cash Equivalents | | | 2.67 | |
Total Investments | | | 100.00 | % |
Source: PIM
Credit ratings reflect the highest rating assigned by Moody’s Investor Service, Inc. (Moody’s), Standard & Poor’s (S&P) or Fitch, Inc. (Fitch). Credit ratings reflect the common nomenclature used by both S&P and Fitch. Where applicable, Moody’s ratings are converted to the comparable S&P/Fitch rating tier nomenclature. These rating agencies are independent, nationally recognized statistical rating organizations and are widely used. The Not Rated category consists of securities that have not been rated by Moody’s, S&P or Fitch. Credit ratings are subject to change.
| | | | |
| Prudential Emerging Markets Debt Local Currency Fund | | | 5 | |
Strategy and Performance Overview
How did the Fund Perform?
The Prudential Emerging Markets Debt Local Currency Fund’s Class A shares declined by 2.47% for the 12-month reporting period that ended October 31, 2014, slightly outperforming the 2.68% decline of the JP Morgan GBI-EM Global Diversified Index (the Index) and the 2.69% decline of the Lipper Emerging Markets Local Currency Debt Funds Average.
What was the market environment for emerging market bonds denominated in local currencies?
Although most local emerging markets debt markets posted positive returns in local currency terms, they generated a negative return in US dollar terms. During the reporting period, the US dollar appreciated versus almost all other world currencies, driven by increasing confidence about US economic growth and a rise in shorter-term US Treasury yields.
| | • | | When the period began, the Federal Reserve (Fed) was widely expected to announce the reduction (or tapering) of its quantitative easing asset purchase program. US Treasury yields rose in anticipation, with the bellwether 10-year Treasury yield hitting a high of 3.03% on December 31, 2013. The rise in Treasury yields led several emerging markets central banks to accelerate interest rate hikes and embark on structural reforms. |
| | • | | In December, the Fed announced it would begin tapering its asset purchases in January 2014. |
| | • | | After the Fed starting tapering its asset purchases, longer-term US Treasury yields fell, continuing to decline during the period overall. At the end of the reporting period, the 10-year Treasury yield stood at 2.33%. |
| | • | | The Fed’s monetary policy diverged from that of Bank of Japan and the European Central Bank (ECB) during the reporting period. As the Fed ended its quantitative easing program and hinted at a hike in short-term interest rates, the Bank of Japan and the ECB continued to ease their monetary policies and sought to weaken their currencies relative to the US dollar. |
| | • | | In China, slowing economic growth fueled a drop in commodity prices. Falling commodity prices, especially a drop in the price of oil, helped selected emerging markets countries such as Indonesia and India reduce energy subsidies. Though popular, these subsidies have increased budget deficits and interfered with government spending on roads, schools, and healthcare. |
| | • | | Geopolitics, especially the Russia-Ukraine conflict, led to negative market sentiment towards Russia and Russian assets. As foreigners pulled money out of |
| | |
| 6 | | Visit our website at www.prudentialfunds.com |
| | the country, Russian local bond prices fell, pushing yields up, and the Russian ruble weakened. Near the end of the period, the ruble was near its lowest level versus the US dollar since Russia’s 1998 debt default. |
| | • | | Local elections—especially in Brazil, India, Turkey, and Indonesia—also drove market sentiment. In India and Indonesia, the final results were generally perceived as market-friendly for the longer term. |
| | • | | Spreads (yield differentials) between emerging market government local currency bonds and developed market bonds widened during the reporting period. Persistently wide spreads can potentially create attractive investment opportunities in local currency bonds and, more broadly, among emerging market currencies. |
Which strategies made the most positive and negative contributions to the Fund’s performance?
Prudential Fixed Income manages the Fund, which was well-diversified across a variety of emerging market countries, securities, and currencies. Its portfolio management team closely analyzes each country’s currency, local currency bonds, and hard currency bonds from three viewpoints—fundamental, technical, and relative value. During the reporting period, a number of factors contributed to the Fund’s outperformance versus the Index.
| | • | | Foreign currency selection was the largest contributor to the Fund’s relative performance. Tactical positioning in the Brazilian real, which was used to hedge the Fund’s currency exposure in its holdings of Brazilian local bonds, added to results as the real sold off during the period. For similar reasons, the Fund benefited from its tactical positioning in the Turkish lira and South African rand. In addition, overweight exposure to the Mexican peso and Korean won enhanced performance. Conversely, an overweight position in the Chilean peso and underweight in the Thai baht detracted from relative returns. |
| | • | | The Fund also benefited from select positions in bonds denominated in hard currencies that are not included in the Index. Most notably, it owned dollar-denominated corporate bonds and quasi-sovereign debt from Venezuela, Russia, Brazil, and Indonesia. A position in Spanish US dollar-denominated sovereign bonds also contributed positively. |
| | • | | The Fund’s long positions in Mexican local bonds also added to relative returns during the period. The Mexican local debt market rallied in line with US Treasury yields, a demonstration of the close ties between the Mexican and US bond markets. |
| | | | |
| Prudential Emerging Markets Debt Local Currency Fund | | | 7 | |
Strategy and Performance Overview (continued)
| | • | | An underweight in Turkish local debt lifted Fund performance, as high oil prices increased Turkey’s inflation rate and led to weakness in the Turkish lira. Turkey is a major oil importer. |
| | • | | Detracting was an overweight position in Russian local debt, which hurt returns as the market sold off in response to the Russia/Ukraine conflict and US and European sanctions. Despite these short-term results, the Prudential Fixed Income team believes Russian debt is attractively valued and that Russia has the ability and willingness to meet its debt payments going forward. |
| | • | | In addition, the Fund’s overweight positioning in local Brazilian debt hampered returns as election-related news and central bank interest rate increases led that market to underperform. With yields near 12% and real yields at 6%, the Prudential Fixed Income team continues to find local Brazilian debt attractive and it remains one of the Fund’s core holdings. |
Did the Fund use derivatives and how did they affect performance?
Derivatives were used in the Fund and are instrumental in attaining specific exposures targeted to gain from anticipated market developments. Currency positioning in the Fund was partially facilitated by the use of currency forward contracts and currency options. During the reporting period, the Fund’s currency positioning added to relative performance.
| | |
| 8 | | Visit our website at www.prudentialfunds.com |
Fees and Expenses (Unaudited)
As a shareholder of the Fund, you incur two types of costs: (1) transaction costs, including sales charges (loads) on purchase payments and redemptions, as applicable, and (2) ongoing costs, including management fees, distribution, and/or service (12b-1) fees, and other Fund expenses, as applicable. This example is intended to help you understand your ongoing costs (in dollars) of investing in the Fund and to compare these costs with the ongoing costs of investing in other mutual funds.
The example is based on an investment of $1,000 invested on May 1, 2014, at the beginning of the period, and held through the six-month period ended October 31, 2014. The example is for illustrative purposes only; you should consult the Prospectus for information on initial and subsequent minimum investment requirements.
Actual Expenses
The first line for each share class in the table on the following page provides information about actual account values and actual expenses. You may use the information on this line, together with the amount you invested, to estimate the expenses that you paid over the period. Simply divide your account value by $1,000 (for example, an $8,600 account value ÷ $1,000 = 8.6), then multiply the result by the number on the first line under the heading “Expenses Paid During the Six-Month Period” to estimate the expenses you paid on your account during this period.
Hypothetical Example for Comparison Purposes
The second line for each share class in the table on the following page provides information about hypothetical account values and hypothetical expenses based on the Fund’s actual expense ratio and an assumed rate of return of 5% per year before expenses, which is not the Fund’s actual return. The hypothetical account values and expenses may not be used to estimate the actual ending account balance or expenses you paid for the period. You may use this information to compare the ongoing costs of investing in the Fund and other funds. To do so, compare this 5% hypothetical example with the 5% hypothetical examples that appear in the shareholder reports of the other funds.
The Fund’s transfer agent may charge additional fees to holders of certain accounts that are not included in the expenses shown in the table on the following page. These fees apply to individual retirement accounts (IRAs) and Section 403(b) accounts. As of the close of the six-month period covered by the table, IRA fees included an annual maintenance fee of $15 per account (subject to a maximum annual maintenance fee of $25 for all accounts held by the same shareholder). Section 403(b) accounts are charged an annual $25 fiduciary maintenance fee. Some of the fees may vary in amount, or may be waived, based on your total account balance or the number of
| | | | |
| Prudential Emerging Markets Debt Local Currency Fund | | | 9 | |
Fees and Expenses (continued)
Prudential Investments funds, including the Fund, that you own. You should consider the additional fees that were charged to your Fund account over the six-month period when you estimate the total ongoing expenses paid over the period and the impact of these fees on your ending account value, as these additional expenses are not reflected in the information provided in the expense table. Additional fees have the effect of reducing investment returns.
Please note that the expenses shown in the table are meant to highlight your ongoing costs only and do not reflect any transactional costs such as sales charges (loads). Therefore, the second line for each share class in the table is useful in comparing ongoing costs only and will not help you determine the relative total costs of owning different funds. In addition, if these transactional costs were included, your costs would have been higher.
| | | | | | | | | | | | | | | | | | |
Prudential
Emerging Markets Debt
Local Currency Fund | | Beginning Account
Value
May 1, 2014 | | | Ending Account
Value
October 31, 2014 | | | Annualized
Expense Ratio
Based on the
Six-Month Period | | | Expenses Paid
During the
Six-Month Period* | |
| | | | | | | | | | | | | | | | | | |
| Class A | | Actual | | $ | 1,000.00 | | | $ | 990.70 | | | | 1.30 | % | | $ | 6.52 | |
| | | Hypothetical | | $ | 1,000.00 | | | $ | 1,018.50 | | | | 1.30 | % | | $ | 6.61 | |
| | | | | | | | | | | | | | | | | | |
| Class C | | Actual | | $ | 1,000.00 | | | $ | 985.70 | | | | 2.05 | % | | $ | 10.26 | |
| | | Hypothetical | | $ | 1,000.00 | | | $ | 1,014.87 | | | | 2.05 | % | | $ | 10.41 | |
| | | | | | | | | | | | | | | | | | |
| Class Q | | Actual | | $ | 1,000.00 | | | $ | 991.80 | | | | 1.05 | % | | $ | 5.27 | |
| | | Hypothetical | | $ | 1,000.00 | | | $ | 1,019.91 | | | | 1.05 | % | | $ | 5.35 | |
| | | | | | | | | | | | | | | | | | |
| Class Z | | Actual | | $ | 1,000.00 | | | $ | 990.70 | | | | 1.05 | % | | $ | 5.27 | |
| | | Hypothetical | | $ | 1,000.00 | | | $ | 1,019.91 | | | | 1.05 | % | | $ | 5.35 | |
*Fund expenses (net of fee waivers or subsidies, if any) for each share class are equal to the annualized expense ratio for each share class (provided in the table), multiplied by the average account value over the period, multiplied by the 184 days in the six-month period ended October 31, 2014, and divided by the 365 days in the Fund’s fiscal year ended October 31, 2014 (to reflect the six-month period). Expenses presented in the table include the expenses of any underlying portfolios in which the Fund may invest.
| | |
| 10 | | Visit our website at www.prudentialfunds.com |
The Fund’s annualized expense ratios for the year ended October 31, 2014, are as follows:
| | | | |
| Class | | Gross Operating Expenses | | Net Operating Expenses |
A | | 2.13% | | 1.30% |
C | | 2.82 | | 2.05 |
Q | | 1.69 | | 1.05 |
Z | | 1.82 | | 1.05 |
Net operating expenses shown above reflect any fee waivers and/or expense reimbursements. Additional information on Fund expenses and any fee waivers and/or expense reimbursements can be found in the “Financial Highlights” tables in this report and in the Notes to the Financial Statements in this report.
| | | | |
| Prudential Emerging Markets Debt Local Currency Fund | | | 11 | |
Portfolio of Investments
as of October 31, 2014
| | | | | | | | | | | | | | |
| Description | | Interest
Rate | | Maturity
Date | | | Principal
Amount (000)# | | | Value (Note 1) | |
LONG-TERM INVESTMENTS 96.1% | |
|
FOREIGN BONDS | |
|
Argentina 1.6% | |
Argentina Boden Bonds, Sr. Unsec’d. Notes | | 7.000% | | | 10/03/15 | | | | 500 | | | $ | 468,889 | |
City of Buenos Aires Argentina, Sr. Unsec’d Notes, MTN, RegS | | 12.500 | | | 04/06/15 | | | | 100 | | | | 101,000 | |
| | | | | | | | | | | | | | |
| | | | | | | | | | | | | 569,889 | |
| | | | |
Brazil 11.0% | | | | | | | | | | | | | | |
Banco BMG SA, Sr. Unsec’d. Notes, RegS | | 9.150 | | | 01/15/16 | | | | 80 | | | | 83,000 | |
Brazil Notas do Tesouro Nacionalie, | | | | | | | | | | | | | | |
Notes, Ser. NTNB | | 6.000 | | | 08/15/50 | | | | 331 | | | | 331,202 | |
Notes, Ser. NTNF | | 10.000 | | | 01/01/18 | | | BRL | 698 | | | | 265,792 | |
Notes, Ser. NTNF | | 10.000 | | | 01/01/19 | | | BRL | 380 | | | | 142,717 | |
Notes, Ser. NTNF | | 10.000 | | | 01/01/21 | | | BRL | 2,613 | | | | 963,768 | |
Notes, Ser. NTNF | | 10.000 | | | 01/01/23 | | | BRL | 1,177 | | | | 426,743 | |
Notes, Ser. NTNF | | 10.000 | | | 01/01/25 | | | BRL | 1,360 | | | | 486,210 | |
Sr. Notes, Ser. NTNF | | 10.000 | | | 01/01/17 | | | BRL | 2,345 | | | | 906,995 | |
Brazilian Government International Bond,
Sr. Unsec’d. Notes | | 8.500 | | | 01/05/24 | | | BRL | 54 | | | | 20,866 | |
Itau Unibanco Holding SA, Sr. Unsec’d.
Notes, RegS | | 10.500 | | | 11/23/15 | | | BRL | 300 | | | | 119,860 | |
JBS Finance II Ltd., Gtd. Notes, RegS | | 8.250 | | | 01/29/18 | | | | 150 | | | | 157,875 | |
| | | | | | | | | | | | | | |
| | | | | | | | | | | | | 3,905,028 | |
| | | | |
Colombia 8.2% | | | | | | | | | | | | | | |
Colombia Government International Bond, Sr. Unsec’d. Notes | | 9.850 | | | 06/28/27 | | | COP | 180,000 | | | | 111,954 | |
Colombian TES, | | | | | | | | | | | | | | |
Bonds, Ser. B | | 6.000 | | | 04/28/28 | | | COP | 2,476,700 | | | | 1,095,827 | |
Bonds, Ser. B | | 7.500 | | | 08/26/26 | | | COP | 1,286,600 | | | | 655,000 | |
Bonds, Ser. B | | 10.000 | | | 07/24/24 | | | COP | 640,500 | | | | 385,909 | |
Bonds, Ser. B | | 11.000 | | | 07/24/20 | | | COP | 841,700 | | | | 507,143 | |
Empresas Publicas de Medellin ESP,
Sr. Unsec’d. Notes, RegS | | 8.375 | | | 02/01/21 | | | COP | 300,000 | | | | 155,286 | |
| | | | | | | | | | | | | | |
| | | | | | | | | | | | | 2,911,119 | |
| | | | |
Dominican Republic 0.3% | | | | | | | | | | | | | | |
Dominican Republic International Bond,
Sr. Unsec’d. Notes, RegS | | 9.040 | | | 01/23/18 | | | | 107 | | | | 116,752 | |
See Notes to Financial Statements.
| | | | |
| Prudential Emerging Markets Debt Local Currency Fund | | | 13 | |
Portfolio of Investments
as of October 31, 2014 continued
| | | | | | | | | | | | | | |
| Description | | Interest
Rate | | Maturity
Date | | | Principal
Amount (000)# | | | Value (Note 1) | |
FOREIGN BONDS (Continued) | |
| | | | |
Ghana 0.1% | | | | | | | | | | | | | | |
Ghana Government Bond, Bonds, Ser. 3Y | | 16.900 % | | | 03/07/16 | | | GHS | 120 | | | $ | 34,654 | |
| | | | |
Hungary 4.7% | | | | | | | | | | | | | | |
Hungary Government Bond, | | | | | | | | | | | | | | |
Bonds, Ser. 17/B | | 6.750 | | | 02/24/17 | | | HUF | 65,900 | | | | 293,309 | |
Bonds, Ser. 19/A | | 6.500 | | | 06/24/19 | | | HUF | 167,400 | | | | 780,337 | |
Bonds, Ser. 23/A | | 6.000 | | | 11/24/23 | | | HUF | 130,000 | | | | 613,188 | |
| | | | | | | | | | | | | | |
| | | | | | | | | | | | | 1,686,834 | |
| | | | |
Indonesia 10.5% | | | | | | | | | | | | | | |
Berau Capital Resources Pte Ltd., Sr. Sec’d. Notes, RegS | | 12.500 | | | 07/08/15 | | | | 145 | | | | 111,650 | |
Indonesia Treasury Bond, | | | | | | | | | | | | | | |
Sr. Unsec’d. Notes, Ser. FR53 | | 8.250 | | | 07/15/21 | | | IDR | 6,500,000 | | | | 544,580 | |
Sr. Unsec’d. Notes, Ser. FR56 | | 8.375 | | | 09/15/26 | | | IDR | 1,000,000 | | | | 82,650 | |
Sr. Unsec’d. Notes, Ser. FR58 | | 8.250 | | | 06/15/32 | | | IDR | 1,700,000 | | | | 136,103 | |
Sr. Unsec’d. Notes, Ser. FR59 | | 7.000 | | | 05/15/27 | | | IDR | 3,800,000 | | | | 283,310 | |
Sr. Unsec’d. Notes, Ser. FR61 | | 7.000 | | | 05/15/22 | | | IDR | 2,000,000 | | | | 155,978 | |
Sr. Unsec’d. Notes, Ser. FR63 | | 5.625 | | | 05/15/23 | | | IDR | 3,100,000 | | | | 219,321 | |
Sr. Unsec’d. Notes, Ser. FR65 | | 6.625 | | | 05/15/33 | | | IDR | 7,500,000 | | | | 506,624 | |
Sr. Unsec’d. Notes, Ser. FR67 | | 8.750 | | | 02/15/44 | | | IDR | 2,700,000 | | | | 221,840 | |
Sr. Unsec’d. Notes, Ser. FR68 | | 8.375 | | | 03/15/34 | | | IDR | 2,200,000 | | | | 180,770 | |
Sr. Unsec’d. Notes, Ser. FR70 | | 8.375 | | | 03/15/24 | | | IDR | 8,500,000 | | | | 718,473 | |
Sr. Unsec’d. Notes, Ser. FR71 | | 9.000 | | | 03/15/29 | | | IDR | 4,400,000 | | | | 382,409 | |
Majapahit Holding BV, Sr. Unsec’d. Notes, RegS | | 8.000 | | | 08/07/19 | | | | 160 | | | | 187,600 | |
| | | | | | | | | | | | | | |
| | | | | | | | | | | | | 3,731,308 | |
| | | | |
Kazakhstan 1.3% | | | | | | | | | | | | | | |
KazMunayGas National Co. JSC, Sr. Unsec’d. Notes, MTN, RegS | | 9.125 | | | 07/02/18 | | | | 380 | | | | 449,350 | |
| | | | |
Luxembourg 0.6% | | | | | | | | | | | | | | |
Millicom International Cellular SA, Sr. Unsec’d. Notes, 144A | | 4.750 | | | 05/22/20 | | | | 200 | | | | 197,500 | |
| | | | |
Malaysia 4.6% | | | | | | | | | | | | | | |
Malaysia Government Bond, | | | | | | | | | | | | | | |
Sr. Unsec’d. Notes, Ser. 0311 | | 4.392 | | | 04/15/26 | | | MYR | 580 | | | | 181,768 | |
Sr. Unsec’d. Notes, Ser. 0412 | | 4.127 | | | 04/15/32 | | | MYR | 2,200 | | | | 653,662 | |
See Notes to Financial Statements.
| | | | | | | | | | | | | | |
| Description | | Interest
Rate | | Maturity
Date | | | Principal
Amount (000)# | | | Value (Note 1) | |
FOREIGN BONDS (Continued) | |
| | | | |
Malaysia (cont’d.) | | | | | | | | | | | | | | |
Malaysia Government Bond, (Continued) | | | | | | | | | | | | | | |
Sr. Unsec’d. Notes, Ser. 0413 | | 3.844 % | | | 04/15/33 | | | MYR | 1,050 | | | $ | 302,640 | |
Sr. Unsec’d. Notes, Ser. 0414 | | 3.654 | | | 10/31/19 | | | MYR | 1,180 | | | | 358,808 | |
Sr. Unsec’d. Notes, Ser. 0612 | | 3.492 | | | 03/31/20 | | | MYR | 430 | | | | 129,542 | |
| | | | | | | | | | | | | | |
| | | | | | | | | | | | | 1,626,420 | |
| | | | |
Mexico 10.0% | | | | | | | | | | | | | | |
America Movil SAB de CV, Sr. Unsec’d. Notes | | 6.450 | | | 12/05/22 | | | MXN | 7,500 | | | | 546,700 | |
Cemex SAB de CV, Sr. Sec’d. Notes, RegS | | 9.500 | | | 06/15/18 | | | | 200 | | | | 223,400 | |
Mexican Bonos, | | | | | | | | | | | | | | |
Bonds, Ser. M | | 6.500 | | | 06/09/22 | | | MXN | 5,525 | | | | 429,486 | |
Bonds, Ser. M | | 7.750 | | | 05/29/31 | | | MXN | 13,528 | | | | 1,119,841 | |
Bonds, Ser. M | | 8.000 | | | 12/07/23 | | | MXN | 10,710 | | | | 912,641 | |
Petroleos Mexicanos, Gtd. Notes, 144A | | 7.650 | | | 11/24/21 | | | MXN | 4,120 | | | | 325,419 | |
| | | | | | | | | | | | | | |
| | | | | | | | | | | | | 3,557,487 | |
| | | | |
Nigeria 2.4% | | | | | | | | | | | | | | |
Nigeria Government Bond, | | | | | | | | | | | | | | |
Bonds, Ser. 5YR | | 15.100 | | | 04/27/17 | | | NGN | 42,870 | | | | 273,550 | |
Bonds, Ser. 7 | | 16.000 | | | 06/29/19 | | | NGN | 25,215 | | | | 170,104 | |
Bonds, Ser. 10YR | | 7.000 | | | 10/23/19 | | | NGN | 78,721 | | | | 378,137 | |
Nigeria Treasury Bill, Unsec’d. Notes | | 11.158(a) | | | 08/06/15 | | | NGN | 7,600 | | | | 42,165 | |
| | | | | | | | | | | | | | |
| | | | | | | | | | | | | 863,956 | |
| | | | |
Peru 2.0% | | | | | | | | | | | | | | |
Peruvian Government Bond, Bonds | | 6.950 | | | 08/12/31 | | | PEN | 190 | | | | 69,296 | |
Peruvian Government International Bond, | | | | | | | | | | | | | | |
Bonds, 144A | | 5.700 | | | 08/12/24 | | | PEN | 538 | | | | 183,395 | |
Sr. Unsec’d. Notes, RegS | | 6.950 | | | 08/12/31 | | | PEN | 1,253 | | | | 456,987 | |
| | | | | | | | | | | | | | |
| | | | | | | | | | | | | 709,678 | |
| | | | |
Philippines 0.7% | | | | | | | | | | | | | | |
Philippine Government International Bond, Sr. Unsec’d. Notes | | 6.250 | | | 01/14/36 | | | PHP | 10,000 | | | | 243,677 | |
| | | | |
Poland 4.8% | | | | | | | | | | | | | | |
Poland Government Bond, | | | | | | | | | | | | | | |
Bonds, Ser. 0719 | | 3.250 | | | 07/25/19 | | | PLN | 295 | | | | 92,467 | |
Bonds, Ser. 0725 | | 3.250 | | | 07/25/25 | | | PLN | 2,170 | | | | 686,236 | |
See Notes to Financial Statements.
| | | | |
| Prudential Emerging Markets Debt Local Currency Fund | | | 15 | |
Portfolio of Investments
as of October 31, 2014 continued
| | | | | | | | | | | | | | |
| Description | | Interest
Rate | | Maturity
Date | | | Principal
Amount (000)# | | | Value (Note 1) | |
FOREIGN BONDS (Continued) | |
| | | | |
Poland (cont’d.) | | | | | | | | | | | | | | |
Poland Government Bond, (Continued) | | | | | | | | | | | | | | |
Bonds, Ser. 1019 | | 5.500 % | | | 10/25/19 | | | PLN | 550 | | | $ | 189,977 | |
Bonds, Ser. 1023 | | 4.000 | | | 10/25/23 | | | PLN | 2,165 | | | | 721,539 | |
| | | | | | | | | | | | | | |
| | | | | | | | | | | | | 1,690,219 | |
| | | | |
Romania 1.7% | | | | | | | | | | | | | | |
Romania Government Bond, | | | | | | | | | | | | | | |
Bonds, Ser.10Y | | 5.850 | | | 04/26/23 | | | RON | 1,020 | | | | 334,164 | |
Bonds, Ser.10YR | | 6.750 | | | 06/11/17 | | | RON | 850 | | | | 267,135 | |
| | | | | | | | | | | | | | |
| | | | | | | | | | | | | 601,299 | |
| | | | |
Russia 10.4% | | | | | | | | | | | | | | |
AHML Finance Ltd., Unsec’d. Notes, 144A | | 7.750 | | | 02/13/18 | | | RUB | 12,250 | | | | 254,081 | |
Gazprom OAO Via Gaz Capital SA, Sr. Unsec’d. Notes, RegS | | 9.250 | | | 04/23/19 | | | | 230 | | | | 265,697 | |
Russian Agricultural Bank OJSC Via RSHB Capital SA, | | | | | | | | | | | | | | |
Sr. Unsec’d. Notes, RegS | | 8.625 | | | 02/17/17 | | | RUB | 10,400 | | | | 221,194 | |
Sr. Unsec’d. Notes, MTN, RegS | | 8.700 | | | 03/17/16 | | | RUB | 23,500 | | | | 512,779 | |
Russian Federal Bond - OFZ, | | | | | | | | | | | | | | |
Bonds, Ser. 5081 | | 6.200 | | | 01/31/18 | | | RUB | 17,000 | | | | 354,543 | |
Bonds, Ser. 6205 | | 7.600 | | | 04/14/21 | | | RUB | 1,000 | | | | 20,821 | |
Bonds, Ser. 6212 | | 7.050 | | | 01/19/28 | | | RUB | 26,718 | | | | 496,339 | |
Bonds, Ser. 6215 | | 7.000 | | | 08/16/23 | | | RUB | 14,039 | | | | 274,675 | |
Bonds, Ser. 6216 | | 6.700 | | | 05/15/19 | | | RUB | 4,400 | | | | 90,381 | |
Russian Foreign Bond - Eurobond, Sr. Unsec’d. Notes, RegS | | 11.000 | | | 07/24/18 | | | | 212 | | | | 263,410 | |
Russian Railways via RZD Capital PLC, Sr. Unsec’d. Notes, RegS | | 8.300 | | | 04/02/19 | | | RUB | 30,200 | | | | 627,680 | |
VimpelCom Holdings BV, Gtd. Notes, 144A | | 9.000 | | | 02/13/18 | | | RUB | 5,000 | | | | 107,161 | |
Vnesheconombank Via VEB Finance PLC, Sr. Unsec’d. Notes, RegS | | 6.902 | | | 07/09/20 | | | | 200 | | | | 204,250 | |
| | | | | | | | | | | | | | |
| | | | | | | | | | | | | 3,693,011 | |
| | | | |
South Africa 6.5% | | | | | | | | | | | | | | |
Eskom Holdings SOC Ltd., Govt. Gtd.,
Ser. ES23, MTN | | 10.000 | | | 01/25/23 | | | ZAR | 7,500 | | | | 749,919 | |
South Africa Government Bond, | | | | | | | | | | | | | | |
Bonds, Ser. R207 | | 7.250 | | | 01/15/20 | | | ZAR | 720 | | | | 65,200 | |
See Notes to Financial Statements.
| | | | | | | | | | | | | | |
| Description | | Interest
Rate | | Maturity
Date | | | Principal
Amount (000)# | | | Value (Note 1) | |
FOREIGN BONDS (Continued) | |
| | | | |
South Africa (cont’d.) | | | | | | | | | | | | | | |
South Africa Government Bond, (Continued) | | | | | | | | | | | | | | |
Bonds, Ser. R213 | | 7.000 % | | | 02/28/31 | | | ZAR | 4,565 | | | $ | 364,219 | |
Sr. Unsec’d. Notes, Ser. R209 | | 6.250 | | | 03/31/36 | | | ZAR | 15,761 | | | | 1,113,698 | |
| | | | | | | | | | | | | | |
| | | | | | | | | | | | | 2,293,036 | |
| | | | |
Spain 1.5% | | | | | | | | | | | | | | |
Spain Government International Bond, Sr. Unsec’d. Notes, MTN, 144A | | 4.000 | | | 03/06/18 | | | | 500 | | | | 532,410 | |
| | | | |
Sri Lanka 1.2% | | | | | | | | | | | | | | |
Bank of Ceylon, Sr. Unsec’d. Notes, RegS | | 6.875 | | | 05/03/17 | | | | 400 | | | | 422,500 | |
| | | | |
Thailand 3.8% | | | | | | | | | | | | | | |
Thailand Government Bond, | | | | | | | | | | | | | | |
Sr. Unsec’d. Notes | | 3.580 | | | 12/17/27 | | | THB | 2,400 | | | | 74,833 | |
Sr. Unsec’d. Notes | | 3.625 | | | 06/16/23 | | | THB | 24,127 | | | | 769,742 | |
Sr. Unsec’d. Notes | | 3.775 | | | 06/25/32 | | | THB | 600 | | | | 18,178 | |
Sr. Unsec’d. Notes | | 5.670 | | | 03/13/28 | | | THB | 5,000 | | | | 188,926 | |
Sr. Unsec’d. Notes - Inflation Linked | | 1.200 | | | 07/14/21 | | | THB | 5,913 | | | | 175,254 | |
Unsec’d. Notes - Inflation Linked | | 1.250 | | | 03/12/28 | | | THB | 4,126 | | | | 116,093 | |
| | | | | | | | | | | | | | |
| | | | | | | | | | | | | 1,343,026 | |
| | | | |
Turkey 8.2% | | | | | | | | | | | | | | |
Turkey Government Bond, | | | | | | | | | | | | | | |
Bonds | | 7.100 | | | 03/08/23 | | | TRY | 465 | | | | 191,427 | |
Bonds | | 8.300 | | | 06/20/18 | | | TRY | 750 | | | | 337,435 | |
Bonds | | 8.500 | | | 07/10/19 | | | TRY | 125 | | | | 56,801 | |
Bonds | | 8.500 | | | 09/14/22 | | | TRY | 2,250 | | | | 1,010,787 | |
Bonds | | 8.800 | | | 11/14/18 | | | TRY | 200 | | | | 91,692 | |
Bonds | | 8.800 | | | 09/27/23 | | | TRY | 670 | | | | 305,964 | |
Bonds | | 9.500 | | | 01/12/22 | | | TRY | 415 | | | | 196,610 | |
Bonds | | 10.500 | | | 01/15/20 | | | TRY | 1,490 | | | | 733,051 | |
| | | | | | | | | | | | | | |
| | | | | | | | | | | | | 2,923,767 | |
| | | | |
Uruguay | | | | | | | | | | | | | | |
Uruguay Government International Bond, Sr. Unsec’d. Notes | | 4.375 | | | 12/15/28 | | | UYU | 254 | | | | 11,476 | |
| | | | | | | | | | | | | | |
TOTAL LONG-TERM INVESTMENTS
(cost $37,770,844) | | | | | | | | | | | | | 34,114,396 | |
| | | | | | | | | | | | | | |
See Notes to Financial Statements.
| | | | |
| Prudential Emerging Markets Debt Local Currency Fund | | | 17 | |
Portfolio of Investments
as of October 31, 2014 continued
| | | | | | | | | | | | |
| Description | | | | | | Shares | | | Value (Note 1) | |
SHORT-TERM INVESTMENTS 2.6% | | | | | | | | | | | | |
| | | |
AFFILIATED MONEY MARKET MUTUAL FUND 2.6% | | | | | | | | | | |
Prudential Investment Portfolios 2 - Prudential Core Taxable Money Market Fund
(cost $920,664)(Note 3)(b) | | | | | 920,664 | | | $ | 920,664 | |
| | | | | | | | | | | | |
| | | | |
| | | | | Counterparty | | Notional
Amount (000)# | | | | |
OPTION PURCHASED* | | | | | | | | | | | | |
| | | | |
Put Option | | | | | | | | | | | | |
Currency Option USD vs JPY, expiring 11/14/14, @ FX Rate 100.00
(cost $9,845) | | | | Citigroup Global
Markets | | | 1,432 | | | | 1 | |
| | | | | | | | | | | | |
TOTAL SHORT-TERM INVESTMENTS
(cost $930,509) | | | | | | | | | | | 920,665 | |
| | | | | | | | | | | | |
| | | | |
TOTAL INVESTMENTS, BEFORE OPTIONS
WRITTEN 98.7%
(cost $38,701,353) | | | | | | | | | | | 35,035,061 | |
| | | | | | | | | | | | |
| | | | |
OPTIONS WRITTEN* (0.2)% | | | | | | | | | | | | |
| | | | |
Put Option | | | | | | | | | | | | |
Currency Option USD vs JPY, expiring 11/14/14, @ FX Rate 96.00 | | | | Citigroup Global
Markets | | | 1,432 | | | | — | |
| | | | |
Call Option | | | | | | | | | | | | |
Currency Option USD vs JPY, expiring 01/16/15, @ FX Rate 106.00 | | | | Citigroup Global
Markets | | | 1,432 | | | | (81,904 | ) |
| | | | | | | | | | | | |
TOTAL OPTIONS WRITTEN
(premiums received $7,253) | | | | | | | | | | | (81,904 | ) |
| | | | | | | | | | | | |
| | | |
TOTAL INVESTMENTS, NET OF OPTIONS WRITTEN 98.5%
(cost $38,694,100; Note 5) | | | | | | | | | 34,953,157 | |
Other assets in excess of liabilities(c) 1.5% | | | | | | | | | | | 543,418 | |
| | | | | | | | | | | | |
NET ASSETS 100.0% | | | | | | | | | | $ | 35,496,575 | |
| | | | | | | | | | | | |
See Notes to Financial Statements.
The following abbreviations are used in the portfolio descriptions:
144A—Security was purchased pursuant to Rule 144A under the Securities Act of 1933 and may not be resold subject to that rule except to qualified institutional buyers. Unless otherwise noted, 144A securities are deemed to be liquid.
MOSPRIME—Moscow Prime Offered Rate
MTN—Medium Term Note
RegS—Regulation S. Security was purchased pursuant to Regulation S and may not be offered, sold or delivered within the United States or to, or for the account or benefit of, U.S. persons, except pursuant to an exemption from, or in a transaction not subject to, the registration requirements of the Securities Act of 1933.
BRL—Brazilian Real
CLP—Chilean Peso
CNH—Chinese Renminbi
COP—Colombian Peso
EUR—Euro
GHS—Ghana Cedi
HUF—Hungarian Forint
IDR—Indonesian Rupiah
INR—Indian Rupee
JPY—Japanese Yen
KRW—South Korean Won
MXN—Mexican Peso
MYR—Malaysian Ringgit
NGN—Nigerian Naira
PEN—Peruvian Nuevo Sol
PHP—Philippine Peso
PLN—Polish Zloty
RON—Romanian Leu
RUB—Russian Ruble
THB—Thai Baht
TRY—Turkish Lira
TWD—New Taiwanese Dollar
USD—United States Dollar
UYU—Uruguayan Peso
ZAR—South African Rand
| * | Non-income producing security. |
| # | Principal or notional amount is shown in U.S. dollars unless otherwise stated. |
| (a) | Represents zero coupon bond or step coupon bond. Rate quoted represents effective yield at October 31, 2014. |
| (b) | Prudential Investments LLC, the manager of the Series, also serves as manager of the Prudential Investment Portfolios 2 - Prudential Core Taxable Money Market Fund. |
See Notes to Financial Statements.
| | | | |
| Prudential Emerging Markets Debt Local Currency Fund | | | 19 | |
Portfolio of Investments
as of October 31, 2014 continued
| (c) | Includes net unrealized appreciation (depreciation) on the following derivative contracts held at reporting period end: |
Forward foreign currency exchange contracts outstanding at October 31, 2014:
| | | | | | | | | | | | | | | | | | |
Purchase Contracts | | Counterparty | | Notional
Amount
(000) | | | Value at
Settlement
Date
Payable | | | Current
Value | | | Unrealized
Appreciation
(Depreciation) | |
Brazilian Real, | | | | | | | | | | | | | | | | | | |
Expiring 12/11/14 | | Barclays Capital Group | | BRL | 504 | | | $ | 201,751 | | | $ | 200,807 | | | $ | (944 | ) |
Expiring 12/11/14 | | Barclays Capital Group | | BRL | 2,172 | | | | 890,474 | | | | 865,822 | | | | (24,652 | ) |
Expiring 12/11/14 | | Deutsche Bank AG | | BRL | 264 | | | | 107,074 | | | | 105,168 | | | | (1,906 | ) |
Expiring 12/11/14 | | Goldman Sachs & Co. | | BRL | 221 | | | | 90,281 | | | | 88,257 | | | | (2,024 | ) |
Expiring 12/11/14 | | JPMorgan Chase | | BRL | 1,249 | | | | 512,992 | | | | 497,911 | | | | (15,081 | ) |
Expiring 12/11/14 | | Toronto Dominion | | BRL | 224 | | | | 89,876 | | | | 89,420 | | | | (456 | ) |
Chilean Peso, | | | | | | | | | | | | | | | | | | |
Expiring 01/15/15 | | Barclays Capital Group | | CLP | 22,827 | | | | 38,775 | | | | 39,396 | | | | 621 | |
Chinese Renminbi, | | | | | | | | | | | | | | | | | | |
Expiring 01/15/15 | | Barclays Capital Group | | CNH | 1,115 | | | | 180,125 | | | | 181,162 | | | | 1,037 | |
Expiring 01/15/15 | | Citigroup Global Markets | | CNH | 2,782 | | | | 449,580 | | | | 452,143 | | | | 2,563 | |
Expiring 01/15/15 | | Deutsche Bank AG | | CNH | 726 | | | | 117,265 | | | | 117,930 | | | | 665 | |
Expiring 01/15/15 | | UBS AG | | CNH | 992 | | | | 160,414 | | | | 161,327 | | | | 913 | |
Colombian Peso, | | | | | | | | | | | | | | | | | | |
Expiring 12/11/14 | | Barclays Capital Group | | COP | 95,180 | | | | 46,835 | | | | 46,045 | | | | (790 | ) |
Expiring 12/11/14 | | Barclays Capital Group | | COP | 222,615 | | | | 107,637 | | | | 107,694 | | | | 57 | |
Expiring 12/11/14 | | Barclays Capital Group | | COP | 371,587 | | | | 180,732 | | | | 179,761 | | | | (971 | ) |
Expiring 12/11/14 | | Barclays Capital Group | | COP | 911,507 | | | | 460,590 | | | | 440,957 | | | | (19,633 | ) |
Expiring 12/11/14 | | Credit Suisse First
Boston Corp. | | COP | 169,242 | | | | 84,733 | | | | 81,874 | | | | (2,859 | ) |
Expiring 12/11/14 | | Credit Suisse First
Boston Corp. | | COP | 369,941 | | | | 185,230 | | | | 178,965 | | | | (6,265 | ) |
Expiring 12/11/14 | | JPMorgan Chase | | COP | 186,197 | | | | 93,672 | | | | 90,076 | | | | (3,596 | ) |
Expiring 12/11/14 | | JPMorgan Chase | | COP | 763,918 | | | | 382,437 | | | | 369,558 | | | | (12,879 | ) |
Expiring 02/23/15 | | Citigroup Global Markets | | COP | 3,704,245 | | | | 1,768,221 | | | | 1,779,516 | | | | 11,295 | |
Hungarian Forint, | | | | | | | | | | | | | | | | | | |
Expiring 11/24/14 | | Barclays Capital Group | | HUF | 73,512 | | | | 305,667 | | | | 298,800 | | | | (6,867 | ) |
Expiring 01/22/15 | | Barclays Capital Group | | HUF | 6,192 | | | | 25,115 | | | | 25,135 | | | | 20 | |
Indian Rupee, | | | | | | | | | | | | | | | | | | |
Expiring 11/10/14 | | Barclays Capital Group | | INR | 6,420 | | | | 104,050 | | | | 104,339 | | | | 289 | |
Expiring 01/28/15 | | Barclays Capital Group | | INR | 6,588 | | | | 106,292 | | | | 105,258 | | | | (1,034 | ) |
Indonesia Rupiah, | | | | | | | | | | | | | | | | | | |
Expiring 12/15/14 | | Barclays Capital Group | | IDR | 5,892,700 | | | | 487,000 | | | | 483,885 | | | | (3,115 | ) |
Malaysian Ringgit, | | | | | | | | | | | | | | | | | | |
Expiring 01/09/15 | | Bank of America | | MYR | 1,952 | | | | 594,853 | | | | 590,449 | | | | (4,404 | ) |
Expiring 01/09/15 | | Barclays Capital Group | | MYR | 659 | | | | 201,478 | | | | 199,316 | | | | (2,162 | ) |
Expiring 01/09/15 | | Barclays Capital Group | | MYR | 3,034 | | | | 925,739 | | | | 917,625 | | | | (8,114 | ) |
Expiring 01/09/15 | | Citigroup Global Markets | | MYR | 298 | | | | 89,698 | | | | 90,255 | | | | 557 | |
Expiring 01/09/15 | | Goldman Sachs & Co. | | MYR | 2,928 | | | | 886,875 | | | | 885,673 | | | | (1,202 | ) |
See Notes to Financial Statements.
| | | | | | | | | | | | | | | | | | |
Purchase Contracts | | Counterparty | | Notional
Amount
(000) | | | Value at
Settlement
Date
Payable | | | Current
Value | | | Unrealized
Appreciation
(Depreciation) | |
Mexican Peso, | | | | | | | | | | | | | | | | | | |
Expiring 01/22/15 | | Citigroup Global Markets | | MXN | 4,737 | | | $ | 350,190 | | | $ | 349,981 | | | $ | (209 | ) |
Expiring 01/22/15 | | Toronto Dominion | | MXN | 340 | | | | 25,115 | | | | 25,134 | | | | 19 | |
Expiring 01/22/15 | | Toronto Dominion | | MXN | 3,372 | | | | 247,729 | | | | 249,123 | | | | 1,394 | |
Nigerian Naira, | | | | | | | | | | | | | | | | | | |
Expiring 01/09/15 | | Barclays Capital Group | | NGN | 21,874 | | | | 129,852 | | | | 129,062 | | | | (790 | ) |
Peruvian Nuevo Sol, | | | | | | | | | | | | | | | | | | |
Expiring 01/16/15 | | Barclays Capital Group | | PEN | 739 | | | | 252,000 | | | | 250,619 | | | | (1,381 | ) |
Philippine Peso, | | | | | | | | | | | | | | | | | | |
Expiring 11/14/14 | | BNP Paribas | | PHP | 9,252 | | | | 210,849 | | | | 206,075 | | | | (4,774 | ) |
Expiring 11/14/14 | | Citigroup Global Markets | | PHP | 12,446 | | | | 285,000 | | | | 277,215 | | | | (7,785 | ) |
Expiring 11/14/14 | | Credit Suisse First
Boston Corp. | | PHP | 4,153 | | | | 94,650 | | | | 92,497 | | | | (2,153 | ) |
Expiring 11/14/14 | | Credit Suisse First
Boston Corp. | | PHP | 8,306 | | | | 189,341 | | | | 185,012 | | | | (4,329 | ) |
Expiring 11/14/14 | | Goldman Sachs & Co. | | PHP | 4,151 | | | | 94,953 | | | | 92,465 | | | | (2,488 | ) |
Polish Zloty, | | | | | | | | | | | | | | | | | | |
Expiring 01/14/15 | | Barclays Capital Group | | PLN | 181 | | | | 53,819 | | | | 53,683 | | | | (136 | ) |
Expiring 01/14/15 | | Barclays Capital Group | | PLN | 346 | | | | 104,517 | | | | 102,496 | | | | (2,021 | ) |
Expiring 01/14/15 | | Toronto Dominion | | PLN | 783 | | | | 232,880 | | | | 231,509 | | | | (1,371 | ) |
Expiring 01/26/15 | | Citigroup Global Markets | | PLN | 3,527 | | | | 1,054,295 | | | | 1,043,059 | | | | (11,236 | ) |
Expiring 01/26/15 | | Goldman Sachs & Co. | | PLN | 93 | | | | 28,132 | | | | 27,643 | | | | (489 | ) |
Romanian Leu, | | | | | | | | | | | | | | | | | | |
Expiring 01/26/15 | | Barclays Capital Group | | RON | 304 | | | | 86,110 | | | | 86,079 | | | | (31 | ) |
Expiring 01/26/15 | | JPMorgan Chase | | RON | 695 | | | | 198,963 | | | | 196,875 | | | | (2,088 | ) |
Russian Ruble, | | | | | | | | | | | | | | | | | | |
Expiring 12/17/14 | | Citigroup Global Markets | | RUB | 1,198 | | | | 28,000 | | | | 27,446 | | | | (554 | ) |
South African Rand, | | | | | | | | | | | | | | | | | | |
Expiring 01/23/15 | | Citigroup Global Markets | | ZAR | 6,894 | | | | 618,822 | | | | 616,004 | | | | (2,818 | ) |
South Korean Won, | | | | | | | | | | | | | | | | | | |
Expiring 11/03/14 | | Credit Suisse First
Boston Corp. | | KRW | 254,376 | | | | 241,572 | | | | 237,987 | | | | (3,585 | ) |
Expiring 12/17/14 | | BNP Paribas | | KRW | 153,763 | | | | 143,436 | | | | 143,605 | | | | 169 | |
Thai Baht, | | | | | | | | | | | | | | | | | | |
Expiring 12/15/14 | | Citigroup Global Markets | | THB | 5,928 | | | | 183,259 | | | | 181,645 | | | | (1,614 | ) |
Expiring 12/15/14 | | Citigroup Global Markets | | THB | 7,104 | | | | 219,240 | | | | 217,665 | | | | (1,575 | ) |
Turkish Lira, | | | | | | | | | | | | | | | | | | |
Expiring 01/20/15 | | Deutsche Bank AG | | TRY | 1,411 | | | | 617,693 | | | | 623,410 | | | | 5,717 | |
Expiring 01/20/15 | | JPMorgan Chase | | TRY | 205 | | | | 88,839 | | | | 90,739 | | | | 1,900 | |
Expiring 01/23/15 | | Wells Fargo Bank N.A. | | TRY | 224 | | | | 100,000 | | | | 99,031 | | | | (969 | ) |
| | | | | | | | | | | | | | | | | | |
| | | | | | | | $ | 15,754,717 | | | $ | 15,610,583 | | | $ | (144,134 | ) |
| | | | | | | | | | | | | | | | | | |
See Notes to Financial Statements.
| | | | |
| Prudential Emerging Markets Debt Local Currency Fund | | | 21 | |
Portfolio of Investments
as of October 31, 2014 continued
| | | | | | | | | | | | | | | | | | |
Sale Contracts | | Counterparty | | Notional
Amount
(000) | | | Value at
Settlement
Date
Receivable | | | Current
Value | | | Unrealized
Appreciation
(Depreciation) | |
Brazilian Real, | | | | | | | | | | | | | | | | | | |
Expiring 12/11/14 | | Barclays Capital Group | | BRL | 265 | | | $ | 109,235 | | | $ | 105,688 | | | $ | 3,547 | |
Expiring 12/11/14 | | Barclays Capital Group | | BRL | 120 | | | | 48,375 | | | | 47,834 | | | | 541 | |
Expiring 12/11/14 | | Citigroup Global Markets | | BRL | 3,785 | | | | 1,542,030 | | | | 1,509,055 | | | | 32,975 | |
Expiring 12/11/14 | | Goldman Sachs & Co. | | BRL | 62 | | | | 25,115 | | | | 24,847 | | | | 268 | |
Expiring 12/11/14 | | Toronto Dominion | | BRL | 572 | | | | 244,179 | | | | 228,171 | | | | 16,008 | |
Expiring 12/11/14 | | Toronto Dominion | | BRL | 175 | | | | 68,834 | | | | 69,953 | | | | (1,119 | ) |
Expiring 12/11/14 | | Toronto Dominion | | BRL | 42 | | | | 16,763 | | | | 16,706 | | | | 57 | |
Chinese Renminbi, | | | | | | | | | | | | | | | | | | |
Expiring 01/15/15 | | BNP Paribas | | CNH | 4,359 | | | | 704,589 | | | | 708,600 | | | | (4,011 | ) |
Expiring 01/15/15 | | Hong Kong & Shanghai
Bank | | CNH | 1,255 | | | | 202,821 | | | | 203,962 | | | | (1,141 | ) |
Colombian Peso, | | | | | | | | | | | | | | | | | | |
Expiring 11/24/14 | | Citigroup Global Markets | | COP | 3,704,245 | | | | 1,784,404 | | | | 1,795,025 | | | | (10,621 | ) |
Expiring 12/11/14 | | Barclays Capital Group | | COP | 892,630 | | | | 433,000 | | | | 431,825 | | | | 1,175 | |
Expiring 12/11/14 | | Barclays Capital Group | | COP | 554,398 | | | | 272,935 | | | | 268,200 | | | | 4,735 | |
Expiring 12/11/14 | | Barclays Capital Group | | COP | 432,594 | | | | 208,000 | | | | 209,275 | | | | (1,275 | ) |
Expiring 12/11/14 | | Barclays Capital Group | | COP | 373,409 | | | | 180,217 | | | | 180,643 | | | | (426 | ) |
Expiring 12/11/14 | | Barclays Capital Group | | COP | 147,427 | | | | 72,197 | | | | 71,320 | | | | 877 | |
Expiring 12/11/14 | | Barclays Capital Group | | COP | 87,505 | | | | 43,000 | | | | 42,332 | | | | 668 | |
Expiring 12/11/14 | | Barclays Capital Group | | COP | 75,036 | | | | 37,000 | | | | 36,300 | | | | 700 | |
Expiring 12/11/14 | | Barclays Capital Group | | COP | 74,791 | | | | 36,306 | | | | 36,181 | | | | 125 | |
Expiring 12/11/14 | | Citigroup Global Markets | | COP | 365,968 | | | | 178,000 | | | | 177,043 | | | | 957 | |
Expiring 12/11/14 | | Credit Suisse First
Boston Corp. | | COP | 14,810 | | | | 7,222 | | | | 7,165 | �� | | | 57 | |
Euro, | | | | | | | | | | | | | | | | | | |
Expiring 01/28/15 | | Citigroup Global Markets | | EUR | 71 | | | | 90,008 | | | | 89,029 | | | | 979 | |
Expiring 01/28/15 | | Credit Suisse First
Boston Corp. | | EUR | 79 | | | | 99,684 | | | | 99,060 | | | | 624 | |
Expiring 01/28/15 | | Toronto Dominion | | EUR | 1,354 | | | | 1,717,987 | | | | 1,697,216 | | | | 20,771 | |
Hungarian Forint, | | | | | | | | | | | | | | | | | | |
Expiring 01/21/15 | | Citigroup Global Markets | | HUF | 61,090 | | | | 254,692 | | | | 247,983 | | | | 6,709 | |
Indonesia Rupiah, | | | | | | | | | | | | | | | | | | |
Expiring 12/15/14 | | Barclays Capital Group | | IDR | 795,870 | | | | 65,289 | | | | 65,354 | | | | (65 | ) |
Expiring 12/15/14 | | Barclays Capital Group | | IDR | 795,870 | | | | 65,316 | | | | 65,354 | | | | (38 | ) |
Expiring 12/15/14 | | Citigroup Global Markets | | IDR | 7,529,606 | | | | 607,251 | | | | 618,301 | | | | (11,050 | ) |
Expiring 12/15/14 | | Citigroup Global Markets | | IDR | 1,380,042 | | | | 110,535 | | | | 113,323 | | | | (2,788 | ) |
Expiring 12/15/14 | | Credit Suisse First
Boston Corp. | | IDR | 1,114,389 | | | | 90,601 | | | | 91,509 | | | | (908 | ) |
Expiring 01/20/15 | | Barclays Capital Group | | IDR | 2,616,577 | | | | 207,995 | | | | 213,387 | | | | (5,392 | ) |
Expiring 01/20/15 | | Barclays Capital Group | | IDR | 2,267,800 | | | | 184,000 | | | | 184,944 | | | | (944 | ) |
Expiring 01/20/15 | | JPMorgan Chase | | IDR | 2,836,162 | | | | 225,809 | | | | 231,295 | | | | (5,486 | ) |
See Notes to Financial Statements.
| | | | | | | | | | | | | | | | | | |
Sale Contracts | | Counterparty | | Notional
Amount
(000) | | | Value at
Settlement
Date
Receivable | | | Current
Value | | | Unrealized
Appreciation
(Depreciation) | |
Japanese Yen, | | | | | | | | | | | | | | | | | | |
Expiring 01/28/15 | | Toronto Dominion | | JPY | 272,392 | | | $ | 2,520,862 | | | $ | 2,427,637 | | | $ | 93,225 | |
Malaysian Ringgit, | | | | | | | | | | | | | | | | | | |
Expiring 01/09/15 | | Citigroup Global Markets | | MYR | 1,202 | | | | 363,865 | | | | 363,647 | | | | 218 | |
Expiring 01/09/15 | | Toronto Dominion | | MYR | 65 | | | | 19,654 | | | | 19,517 | | | | 137 | |
Mexican Peso, | | | | | | | | | | | | | | | | | | |
Expiring 01/22/15 | | Citigroup Global Markets | | MXN | 3 | | | | 218 | | | | 219 | | | | (1 | ) |
Expiring 01/22/15 | | Toronto Dominion | | MXN | 280 | | | | 20,608 | | | | 20,672 | | | | (64 | ) |
New Taiwanese Dollar, | | | | | | | | | | | | | | | | | | |
Expiring 02/02/15 | | BNP Paribas | | TWD | 5,535 | | | | 182,001 | | | | 182,234 | | | | (233 | ) |
Expiring 02/02/15 | | Credit Suisse First
Boston Corp. | | TWD | 5,476 | | | | 179,901 | | | | 180,310 | | | | (409 | ) |
Peruvian Nuevo Sol, | | | | | | | | | | | | | | | | | | |
Expiring 12/16/14 | | BNP Paribas | | PEN | 95 | | | | 32,300 | | | | 32,308 | | | | (8 | ) |
Expiring 12/16/14 | | Credit Suisse First
Boston Corp. | | PEN | 535 | | | | 184,913 | | | | 182,171 | | | | 2,742 | |
Expiring 12/16/14 | | Credit Suisse First
Boston Corp. | | PEN | 534 | | | | 184,298 | | | | 181,678 | | | | 2,620 | |
Expiring 12/16/14 | | Toronto Dominion | | PEN | 443 | | | | 150,700 | | | | 150,737 | | | | (37 | ) |
Expiring 04/10/15 | | BNP Paribas | | PEN | 1,050 | | | | 354,480 | | | | 353,006 | | | | 1,474 | |
Philippine Peso, | | | | | | | | | | | | | | | | | | |
Expiring 11/14/14 | | Citigroup Global Markets | | PHP | 4,118 | | | | 94,320 | | | | 91,716 | | | | 2,604 | |
Expiring 11/14/14 | | Credit Suisse First
Boston Corp. | | PHP | 13,464 | | | | 301,684 | | | | 299,894 | | | | 1,790 | |
Polish Zloty, | | | | | | | | | | | | | | | | | | |
Expiring 01/14/15 | | Citigroup Global Markets | | PLN | 301 | | | | 89,486 | | | | 88,911 | | | | 575 | |
Expiring 01/26/15 | | Citigroup Global Markets | | PLN | 298 | | | | 88,775 | | | | 88,004 | | | | 771 | |
Russian Ruble, | | | | | | | | | | | | | | | | | | |
Expiring 12/17/14 | | BNP Paribas | | RUB | 12,440 | | | | 299,902 | | | | 284,936 | | | | 14,966 | |
Expiring 12/17/14 | | Citigroup Global Markets | | RUB | 2,188 | | | | 50,231 | | | | 50,118 | | | | 113 | |
Expiring 12/17/14 | | Credit Suisse First
Boston Corp. | | RUB | 5,293 | | | | 126,641 | | | | 121,235 | | | | 5,406 | |
Expiring 12/17/14 | | Credit Suisse First
Boston Corp. | | RUB | 1,884 | | | | 46,835 | | | | 43,147 | | | | 3,688 | |
Expiring 03/18/15 | | Credit Suisse First
Boston Corp. | | RUB | 24,757 | | | | 621,976 | | | | 553,904 | | | | 68,072 | |
South African Rand, | | | | | | | | | | | | | | | | | | |
Expiring 01/23/15 | | Barclays Capital Group | | ZAR | 2,010 | | | | 179,395 | | | | 179,578 | | | | (183 | ) |
See Notes to Financial Statements.
| | | | |
| Prudential Emerging Markets Debt Local Currency Fund | | | 23 | |
Portfolio of Investments
as of October 31, 2014 continued
| | | | | | | | | | | | | | | | | | |
Sale Contracts | | Counterparty | | Notional
Amount
(000) | | | Value at
Settlement
Date
Receivable | | | Current
Value | | | Unrealized
Appreciation
(Depreciation) | |
South Korean Won, | | | | | | | | | | | | | | | | | | |
Expiring 11/03/14 | | Citigroup Global Markets | | KRW | 254,376 | | | $ | 241,000 | | | $ | 237,988 | | | $ | 3,012 | |
Expiring 12/17/14 | | Barclays Capital Group | | KRW | 192,154 | | | | 183,424 | | | | 179,460 | | | | 3,964 | |
Expiring 12/17/14 | | Credit Suisse First
Boston Corp. | | KRW | 191,760 | | | | 183,766 | | | | 179,091 | | | | 4,675 | |
Expiring 12/17/14 | | Credit Suisse First
Boston Corp. | | KRW | 191,760 | | | | 183,942 | | | | 179,091 | | | | 4,851 | |
Expiring 12/17/14 | | Credit Suisse First
Boston Corp. | | KRW | 107,986 | | | | 103,188 | | | | 100,852 | | | | 2,336 | |
Expiring 01/16/15 | | Credit Suisse First
Boston Corp. | | KRW | 254,376 | | | | 240,852 | | | | 237,306 | | | | 3,546 | |
Expiring 01/16/15 | | Credit Suisse First
Boston Corp. | | KRW | 200,160 | | | | 187,687 | | | | 186,728 | | | | 959 | |
Thai Baht, | | | | | | | | | | | | | | | | | | |
Expiring 12/15/14 | | Citigroup Global Markets | | THB | 2,975 | | | | 91,694 | | | | 91,139 | | | | 555 | |
Expiring 12/15/14 | | Citigroup Global Markets | | THB | 2,933 | | | | 89,511 | | | | 89,876 | | | | (365 | ) |
Expiring 12/15/14 | | Citigroup Global Markets | | THB | 2,112 | | | | 64,849 | | | | 64,719 | | | | 130 | |
Expiring 12/15/14 | | Citigroup Global Markets | | THB | 1,867 | | | | 57,143 | | | | 57,219 | | | | (76 | ) |
Expiring 12/15/14 | | Deutsche Bank AG | | THB | 3,663 | | | | 112,740 | | | | 112,248 | | | | 492 | |
Turkish Lira, | | | | | | | | | | | | | | | | | | |
Expiring 01/20/15 | | Barclays Capital Group | | TRY | 405 | | | | 179,395 | | | | 179,026 | | | | 369 | |
Expiring 01/20/15 | | Toronto Dominion | | TRY | 41 | | | | 18,004 | | | | 18,182 | | | | (178 | ) |
| | | | | | | | | | | | | | | | | | |
| | | | | | | | $ | 17,963,629 | | | $ | 17,695,384 | | | $ | 268,245 | |
| | | | | | | | | | | | | | | | | | |
| | | | | | | | | | | | | | | | $ | 124,111 | |
| | | | | | | | | | | | | | | | | | |
Cross currency exchange contracts outstanding at October 31, 2014:
| | | | | | | | | | | | | | | | | | | | | | | | | | |
Settlement | | | Type | | | Notional
Amount
(000) | | In
Exchange
For
(000) | | | Unrealized
Appreciation | | | Counterparty |
| | 01/14/15 | | | | Buy | | | | EUR | | | 72 | | | PLN | | | | 303 | | | $ | 575 | | | Barclays Capital Group |
See Notes to Financial Statements.
Interest rate swap agreements outstanding at October 31, 2014:
| | | | | | | | | | | | | | | | | | | | | | | | | | |
Notional
Amount
(000)# | | | Termination
Date | | | Fixed
Rate | | | Floating
Rate | | Fair
Value | | | Upfront
Premiums
Paid
(Received) | | | Unrealized
Appreciation
(Depreciation) | | | Counterparty |
| Over-the-counter swap agreements: | | | | | | | | | | | |
| RUB | 25,000 | | | | 06/09/19 | | | | 8.790% | | | 3 Month MOSPRIME(1) | | $ | (42,651 | ) | | $ | — | | | $ | (42,651 | ) | | Hong Kong & Shanghai Bank |
| MXN | 3,300 | | | | 02/21/22 | | | | 6.620% | | | 28 Day Mexican Interbank Rate(1) | | | 13,816 | | | | — | | | | 13,816 | | | Barclays Capital Group |
| | | | | | | | | | | | | | | | | | | | | | | | | | |
| | | | | | | | | | | | | | $ | (28,835 | ) | | $ | — | | | $ | (28,835 | ) | | |
| | | | | | | | | | | | | | | | | | | | | | | | | | |
| (1) | The Series pays the floating rate and receives the fixed rate. |
Various inputs are used in determining the value of the Series’ investments. These inputs are summarized in the three broad levels listed below.
Level 1—quoted prices generally in active markets for identical securities.
Level 2—quoted prices for similar securities, interest rates and yield curves, prepayment speeds, foreign currency exchange rates, and other significant observable inputs.
Level 3—significant unobservable inputs for securities valued in accordance with Board approved fair valuation procedures.
The following is a summary of the inputs used as of October 31, 2014 in valuing such portfolio securities:
| | | | | | | | | | | | |
| | | Level 1 | | | Level 2 | | | Level 3 | |
Investments in Securities | | | | | | | | | | | | |
Foreign Bonds | | | | | | | | | | | | |
Argentina | | $ | — | | | $ | 569,889 | | | $ | — | |
Brazil | | | — | | | | 3,905,028 | | | | — | |
Colombia | | | — | | | | 2,911,119 | | | | — | |
Dominican Republic | | | — | | | | 116,752 | | | | — | |
Ghana | | | — | | | | 34,654 | | | | — | |
Hungary | | | — | | | | 1,686,834 | | | | — | |
Indonesia | | | — | | | | 3,731,308 | | | | — | |
Kazakhstan | | | — | | | | 449,350 | | | | — | |
Luxembourg | | | — | | | | 197,500 | | | | — | |
See Notes to Financial Statements.
| | | | |
| Prudential Emerging Markets Debt Local Currency Fund | | | 25 | |
Portfolio of Investments
as of October 31, 2014 continued
| | | | | | | | | | | | |
| | | Level 1 | | | Level 2 | | | Level 3 | |
Foreign Bonds (continued) | | | | | | | | | | | | |
Malaysia | | $ | — | | | $ | 1,626,420 | | | $ | — | |
Mexico | | | — | | | | 3,557,487 | | | | — | |
Nigeria | | | — | | | | 863,956 | | | | — | |
Peru | | | — | | | | 709,678 | | | | — | |
Philippines | | | — | | | | 243,677 | | | | — | |
Poland | | | — | | | | 1,690,219 | | | | — | |
Romania | | | — | | | | 601,299 | | | | — | |
Russia | | | — | | | | 3,693,011 | | | | — | |
South Africa | | | — | | | | 2,293,036 | | | | — | |
Spain | | | — | | | | 532,410 | | | | — | |
Sri Lanka | | | — | | | | 422,500 | | | | — | |
Thailand | | | — | | | | 1,343,026 | | | | — | |
Turkey | | | — | | | | 2,923,767 | | | | — | |
Uruguay | | | — | | | | 11,476 | | | | — | |
Affiliated Money Market Mutual Fund | | | 920,664 | | | | — | | | | — | |
Option Purchased | | | — | | | | 1 | | | | — | |
Options Written | | | — | | | | (81,904 | ) | | | — | |
Other Financial Instruments* | | | | | | | | | | | | |
Forward Foreign Currency Exchange Contracts | | | — | | | | 124,111 | | | | — | |
Cross Currency Exchange Contract | | | — | | | | 575 | | | | — | |
Interest Rate Swap Agreements | | | | | | | | | | | | |
Over-the-counter swap agreements | | | — | | | | (28,835 | ) | | | — | |
| | | | | | | | | | | | |
Total | | $ | 920,664 | | | $ | 34,128,344 | | | $ | — | |
| | | | | | | | | | | | |
| * | Other financial instruments are derivative instruments not reflected in the Portfolio of Investments, such as futures, forwards and exchange-traded swap contracts, which are recorded at the unrealized appreciation/depreciation on the instrument, and over-the-counter swap contracts which are recorded at fair value. |
The industry classification of investments and other assets in excess of liabilities shown as a percentage of net assets as of October 31, 2014 was as follows (Unaudited):
| | | | |
Foreign Government Obligations | | | 83.5 | % |
Foreign Agencies | | | 7.4 | |
Foreign Corporations | | | 5.2 | |
Affiliated Money Market Mutual Fund | | | 2.6 | |
Option Purchased | | | — | * |
Options Written | | | (0.2 | ) |
| | | | |
| | | 98.5 | |
Other assets in excess of liabilities | | | 1.5 | |
| | | | |
| | | 100.0 | % |
| | | | |
See Notes to Financial Statements.
Prudential Emerging Markets Debt Local Currency Fund (the “Series”) invested in derivative instruments during the reporting period. The primary types of risk associated with these derivative instruments is foreign exchange risk and interest rate risk. The effect of such derivative instruments on the Series’ financial position and financial performance as reflected in the Statement of Assets and Liabilities and Statement of Operations is presented in the summary below.
Fair values of derivative instruments as of October 31, 2014 as presented in the Statement of Assets and Liabilities:
| | | | | | | | | | | | |
Derivatives not accounted for
as hedging instruments,
carried at fair value | | Asset Derivatives | | | Liability Derivatives | |
| | Balance Sheet
Location | | Fair
Value | | | Balance Sheet
Location | | Fair
Value | |
| Foreign exchange contracts | | Unrealized appreciation on forward foreign currency contracts | | $ | 342,279 | | | Unrealized depreciation on forward foreign currency contracts | | $ | 218,168 | |
| Foreign exchange contracts | | Unrealized appreciation on cross currency exchange contracts | | | 575 | | | — | | | — | |
| Foreign exchange contracts | | Unaffiliated investments | | | 1 | | | Options written outstanding, at value | | | 81,904 | |
| Interest rate contracts | | Unrealized appreciation on swap agreements | | | 13,816 | | | Unrealized depreciation on swap agreements | | | 42,651 | |
| | | | | | | | | | | | |
| | | | $ | 356,671 | | | | | $ | 342,723 | |
| | | | | | | | | | | | |
The effects of derivative instruments on the Statement of Operations for the year ended October 31, 2014 are as follows:
| | | | | | | | | | | | | | | | | | | | |
Amount of Realized Gain or (Loss) on Derivatives Recognized in Income | |
Derivatives not accounted for as hedging
instruments, carried at fair value | | Options
Purchased* | | | Options
Written | | | Forward
and Cross
Currency
Contracts** | | | Swaps | | | Total | |
Foreign exchange contracts | | $ | (60,719 | ) | | $ | 5,298 | | | $ | 24,872 | | | $ | — | | | $ | (30,549 | ) |
Interest rate contracts | | | — | | | | — | | | | — | | | | 180,400 | | | | 180,400 | |
| | | | | | | | | | | | | | | | | | | | |
Total | | $ | (60,719 | ) | | $ | 5,298 | | | $ | 24,872 | | | $ | 180,400 | | | $ | 149,851 | |
| | | | | | | | | | | | | | | | | | | | |
| * | Included in net realized gain (loss) on investment transactions in the Statement of Operations. |
| ** | Included in net realized gain (loss) on foreign currency transactions in the Statement of Operations. |
See Notes to Financial Statements.
| | | | |
| Prudential Emerging Markets Debt Local Currency Fund | | | 27 | |
Portfolio of Investments
as of October 31, 2014 continued
| | | | | | | | | | | | | | | | | | | | |
Change in Unrealized Appreciation or (Depreciation) on Derivatives Recognized in Income | |
Derivatives not accounted for as hedging
instruments, carried at fair value | | Options
Purchased* | | | Options
Written | | | Forward
and Cross
Currency
Contracts** | | | Swaps | | | Total | |
Foreign exchange contracts | | $ | 14,250 | | | $ | (74,651 | ) | | $ | 99,909 | | | $ | — | | | $ | 39,508 | |
Interest rate contracts | | | — | | | | — | | | | — | | | | (144,992 | ) | | | (144,992 | ) |
| | | | | | | | | | | | | | | | | | | | |
Total | | $ | 14,250 | | | $ | (74,651 | ) | | $ | 99,909 | | | $ | (144,992 | ) | | $ | (105,484 | ) |
| | | | | | | | | | | | | | | | | | | | |
| * | Included in net change in unrealized appreciation (depreciation) on investments in the Statement of Operations. |
| ** | Included in net change in unrealized appreciation (depreciation) on foreign currencies in the Statement of Operations. |
For the year ended October 31, 2014, the Series’ average volume of derivative activities are as follows:
| | | | | | | | | | | | | | | | | | | | | | |
Options
Purchased
(Cost) | | | Options
Written
(Notional
Amount
in USD
(000)) | | | Forward
Currency
Contracts—Purchased
(Value at Settlement
Date Payable) | | | Forward
Currency
Contracts—Sold
(Value at Settlement
Date Receivable) | | | Cross
Currency
Contracts
(Notional
Amount
in USD
(000)) | | | Interest Rate Swaps
(Notional Amount
in USD (000)) | |
| $ | 34,423 | | | $ | 1,487 | | | $ | 23,099,713 | | | $ | 16,920,513 | | | $ | 145 | | | $ | 1,551 | |
Offsetting of over-the-counter (OTC) derivative assets and liabilities:
The Series invested in OTC derivatives during the reporting period that are either offset in accordance with current requirements or are subject to enforceable master netting arrangements or similar agreements that permit offsetting. The information about offsetting and related netting arrangements for OTC derivatives, where the legal right to set-off exists, is presented in the summary below.
| | | | | | | | | | | | | | | | |
Counterparty | | Gross
amounts of
recognized
assets(1) | | | Gross
amounts
available
for offset | | | Collateral
Received(3) | | | Net
Amount | |
Bank of America | | $ | — | | | $ | — | | | $ | — | | | $ | — | |
Barclays Capital Group | | | 33,116 | | | | (33,116 | ) | | | — | | | | — | |
BNP Paribas | | | 16,609 | | | | (9,026 | ) | | | — | | | | 7,583 | |
Citigroup Global Markets | | | 64,014 | | | | (64,014 | ) | | | — | | | | — | |
Credit Suisse First Boston Corp. | | | 101,366 | | | | (20,508 | ) | | | — | | | | 80,858 | |
See Notes to Financial Statements.
| | | | | | | | | | | | | | | | |
Counterparty | | Gross
amounts of
recognized
assets(1) | | | Gross
amounts
available
for offset | | | Collateral
Received(3) | | | Net
Amount | |
Deutsche Bank AG | | $ | 6,874 | | | $ | (1,906 | ) | | $ | — | | | $ | 4,968 | |
Goldman Sachs & Co. | | | 268 | | | | (268 | ) | | | — | | | | — | |
Hong Kong & Shanghai Bank | | | — | | | | — | | | | — | | | | — | |
JPMorgan Chase | | | 1,900 | | | | (1,900 | ) | | | — | | | | — | |
Toronto Dominion | | | 131,611 | | | | (3,225 | ) | | | — | | | | 128,386 | |
UBS AG | | | 913 | | | | — | | | | — | | | | 913 | |
Wells Fargo Bank N.A. | | | — | | | | — | | | | — | | | | — | |
| | | | | | | | | | | | | | | | |
| | $ | 356,671 | | | | | | | | | | | | | |
| | | | | | | | | | | | | | | | |
| | | | |
Counterparty | | Gross
amounts of
recognized
liabilities(2) | | | Gross
amounts
available
for offset | | | Collateral
Pledged(3) | | | Net
Amount | |
Bank of America | | $ | (4,404 | ) | | $ | — | | | $ | — | | | $ | (4,404 | ) |
Barclays Capital Group | | | (80,964 | ) | | | 33,116 | | | | — | | | | (47,848 | ) |
BNP Paribas | | | (9,026 | ) | | | 9,026 | | | | — | | | | — | |
Citigroup Global Markets | | | (132,596 | ) | | | 64,014 | | | | — | | | | (68,582 | ) |
Credit Suisse First Boston Corp. | | | (20,508 | ) | | | 20,508 | | | | — | | | | — | |
Deutsche Bank AG | | | (1,906 | ) | | | 1,906 | | | | — | | | | — | |
Goldman Sachs & Co. | | | (6,203 | ) | | | 268 | | | | — | | | | (5,935 | ) |
Hong Kong & Shanghai Bank | | | (43,792 | ) | | | — | | | | — | | | | (43,792 | ) |
JPMorgan Chase | | | (39,130 | ) | | | 1,900 | | | | — | | | | (37,230 | ) |
Toronto Dominion | | | (3,225 | ) | | | 3,225 | | | | — | | | | — | |
UBS AG | | | — | | | | — | | | | — | | | | — | |
Wells Fargo Bank N.A. | | | (969 | ) | | | — | | | | — | | | | (969 | ) |
| | | | | | | | | | | | | | | | |
| | $ | (342,723 | ) | | | | | | | | | | | | |
| | | | | | | | | | | | | | | | |
| (1) | Includes unrealized appreciation on swaps and forwards, premiums paid on swap agreements and market value of purchased options. |
| (2) | Includes unrealized depreciation on swaps and forwards, premiums received on swap agreements and market value of written options. |
| (3) | Amounts shown reflect actual collateral received or pledged by the Series. Such amounts are applied up to 100% of the Series’s OTC derivative exposure by counterparty. |
See Notes to Financial Statements.
| | | | |
| Prudential Emerging Markets Debt Local Currency Fund | | | 29 | |
Statement of Assets & Liabilities
as of October 31, 2014
| | | | |
Assets | | | | |
Investments at value: | | | | |
Unaffiliated Investments (cost $37,780,689) | | $ | 34,114,397 | |
Affiliated Investments (cost $920,664) | | | 920,664 | |
Foreign currency, at value (cost $86,255) | | | 86,057 | |
Dividends and interest receivable | | | 671,513 | |
Receivable for investments sold | | | 501,054 | |
Unrealized appreciation on forward foreign currency exchange contracts | | | 342,279 | |
Tax reclaim receivable | | | 24,473 | |
Receivable for Series shares sold | | | 14,856 | |
Unrealized appreciation on over-the-counter swap agreements | | | 13,816 | |
Due from Manager | | | 4,229 | |
Unrealized appreciation on cross currency exchange contracts | | | 575 | |
Prepaid expenses | | | 670 | |
| | | | |
Total assets | | | 36,694,583 | |
| | | | |
| |
Liabilities | | | | |
Payable for investments purchased | | | 682,197 | |
Unrealized depreciation on forward foreign currency exchange contracts | | | 218,168 | |
Accrued expenses and other liabilities | | | 88,326 | |
Options written outstanding, at value (premiums received $7,253) | | | 81,904 | |
Payable for Series shares reacquired | | | 72,301 | |
Unrealized depreciation on over-the-counter swap agreements | | | 42,651 | |
Dividends payable | | | 9,657 | |
Distribution fee payable | | | 2,063 | |
Affiliated transfer agent fee payable | | | 741 | |
| | | | |
Total liabilities | | | 1,198,008 | |
| | | | |
| |
Net Assets | | $ | 35,496,575 | |
| | | | |
| | | | | |
Net assets were comprised of: | | | | |
Common stock, at par | | $ | 44,528 | |
Paid-in capital in excess of par | | | 41,747,406 | |
| | | | |
| | | 41,791,934 | |
Distributions in excess of net investment income | | | (479,017 | ) |
Accumulated net realized loss on investment and foreign currency transactions | | | (2,137,502 | ) |
Net unrealized depreciation on investments and foreign currencies | | | (3,678,840 | ) |
| | | | |
Net assets, October 31, 2014 | | $ | 35,496,575 | |
| | | | |
See Notes to Financial Statements.
| | | | |
Class A | | | | |
Net asset value and redemption price per share
($5,990,934 ÷ 756,554 shares of common stock issued and outstanding) | | $ | 7.92 | |
Maximum sales charge (4.50% of offering price) | | | 0.37 | |
| | | | |
Maximum offering price to public | | $ | 8.29 | |
| | | | |
| |
Class C | | | | |
Net asset value, offering price and redemption price per share
($927,056 ÷ 116,364 shares of common stock issued and outstanding) | | $ | 7.97 | |
| | | | |
| |
Class Q | | | | |
Net asset value, offering price and redemption price per share
($1,005 ÷ 126 shares of common stock issued and outstanding) | | $ | 7.98 | |
| | | | |
| |
Class Z | | | | |
Net asset value, offering price and redemption price per share
($28,577,580 ÷ 3,579,733 shares of common stock issued and outstanding) | | $ | 7.98 | |
| | | | |
See Notes to Financial Statements.
| | | | |
| Prudential Emerging Markets Debt Local Currency Fund | | | 31 | |
Statement of Operations
Year Ended October 31, 2014
| | | | |
Net Investment Income | | | | |
Income | | | | |
Interest income (net of foreign withholding taxes of $49,752) | | $ | 2,752,633 | |
Affiliated dividend income | | | 550 | |
| | | | |
Total income | | | 2,753,183 | |
| | | | |
| |
Expenses | | | | |
Management fee | | | 305,559 | |
Distribution fee—Class A | | | 20,103 | |
Distribution fee—Class C | | | 12,074 | |
Custodian’s fees and expenses | | | 175,000 | |
Audit fee | | | 60,000 | |
Registration fees | | | 52,000 | |
Transfer agent’s fees and expenses (including affiliated expense of $4,200) | | | 28,000 | |
Shareholders’ reports | | | 26,000 | |
Legal fees and expenses | | | 17,000 | |
Directors’ fees | | | 15,000 | |
Insurance expenses | | | 1,000 | |
Interest expense | | | 704 | |
Miscellaneous | | | 15,268 | |
| | | | |
Total expenses | | | 727,708 | |
Less: Expense reimbursement | | | (293,501 | ) |
Distribution fee waiver—Class A | | | (3,350 | ) |
| | | | |
Net expenses | | | 430,857 | |
| | | | |
Net investment income | | | 2,322,326 | |
| | | | |
| |
Realized And Unrealized Gain (Loss) on Investment And Foreign Currency Transactions | | | | |
Net realized gain (loss) on: | | | | |
Investment transactions | | | (4,060,166 | ) |
Options written transactions | | | 5,298 | |
Swap agreements transactions | | | 180,400 | |
Foreign currency transactions | | | (80,326 | ) |
| | | | |
| | | (3,954,794 | ) |
| | | | |
Net change in unrealized appreciation (depreciation) on: | | | | |
Investments (net of capital gains tax) | | | 641,773 | |
Options written | | | (74,651 | ) |
Swap agreements | | | (144,992 | ) |
Foreign currencies | | | 75,848 | |
| | | | |
| | | 497,978 | |
| | | | |
Net loss on investment and foreign currency transactions | | | (3,456,816 | ) |
| | | | |
Net Decrease In Net Assets Resulting From Operations | | $ | (1,134,490 | ) |
| | | | |
See Notes to Financial Statements.
Statement of Changes in Net Assets
| | | | | | | | |
| | | Year Ended October 31, | |
| | | 2014 | | | 2013 | |
Increase (Decrease) In Net Assets | | | | | | | | |
Operations | | | | | | | | |
Net investment income | | $ | 2,322,326 | | | $ | 2,571,128 | |
Net realized loss on investment and foreign currency transactions | | | (3,954,794 | ) | | | (983,511 | ) |
Net change in unrealized appreciation (depreciation) on investments and foreign currencies | | | 497,978 | | | | (4,483,628 | ) |
| | | | | | | | |
Net decrease in net assets resulting from operations | | | (1,134,490 | ) | | | (2,896,011 | ) |
| | | | | | | | |
| | |
Dividends and Distributions (Note 1) | | | | | | | | |
Dividends from net investment income | | | | | | | | |
Class A | | | (69,495 | ) | | | (408,643 | ) |
Class C | | | (10,949 | ) | | | (44,305 | ) |
Class Q | | | (11 | ) | | | (36 | ) |
Class Z | | | (321,017 | ) | | | (1,194,303 | ) |
| | | | | | | | |
| | | (401,472 | ) | | | (1,647,287 | ) |
| | | | | | | | |
Tax Return of Capital | | | | | | | | |
Class A | | | (367,986 | ) | | | (392,499 | ) |
Class C | | | (57,974 | ) | | | (42,579 | ) |
Class Q | | | (56 | ) | | | (36 | ) |
Class Z | | | (1,699,832 | ) | | | (1,148,753 | ) |
| | | | | | | | |
| | | (2,125,848 | ) | | | (1,583,867 | ) |
| | | | | | | | |
Distributions from net realized gains | | | | | | | | |
Class A | | | — | | | | (37,964 | ) |
Class C | | | — | | | | (5,081 | ) |
Class Q | | | — | | | | (4 | ) |
Class Z | | | — | | | | (171,012 | ) |
| | | | | | | | |
| | | — | | | | (214,061 | ) |
| | | | | | | | |
| | |
Series share transactions (Net of share conversions) (Note 6) | | | | | | | | |
Net proceeds from shares sold | | | 7,683,127 | | | | 30,796,003 | |
Net asset value of shares issued in reinvestment of dividends and tax return of capital | | | 2,370,809 | | | | 3,330,196 | |
Cost of shares reacquired | | | (14,557,474 | ) | | | (24,693,903 | ) |
| | | | | | | | |
Net increase (decrease) in net assets from Series share transactions | | | (4,503,538 | ) | | | 9,432,296 | |
| | | | | | | | |
Total increase (decrease) | | | (8,165,348 | ) | | | 3,091,070 | |
| | |
Net Assets: | | | | | | | | |
Beginning of year | | | 43,661,923 | | | | 40,570,853 | |
| | | | | | | | |
End of year | | $ | 35,496,575 | | | $ | 43,661,923 | |
| | | | | | | | |
See Notes to Financial Statements.
| | | | |
| Prudential Emerging Markets Debt Local Currency Fund | | | 33 | |
Notes to Financial Statements
Prudential World Fund, Inc. (the “Fund”) is an open-end management investment company, registered under the Investment Company Act of 1940, as amended, (“1940 Act”) and currently consists of six series: Prudential International Equity Fund, Prudential Jennison Global Infrastructure Fund, Prudential International Value Fund, Prudential Jennison Global Opportunities Fund, Prudential Jennison International Opportunities Fund, and Prudential Emerging Markets Debt Local Currency Fund (the “Series”). These financial statements relate to Prudential Emerging Markets Debt Local Currency Fund. The financial statements of the other series are not presented herein. The Series commenced investment operations on March 30, 2011. The Series is non-diversified. The investment objective of the Series is total return, through a combination of current income and capital appreciation.
Note 1. Accounting Policies
The following accounting policies conform to U.S. generally accepted accounting principles. The Fund and the Series consistently follow such policies in the preparation of their financial statements.
Securities Valuation: The Series holds securities and other assets that are fair valued at the close of each day the New York Stock Exchange (“NYSE”) is open for trading. Fair value is the price that would be received to sell an asset or paid to transfer a liability in an orderly transaction between market participants on the measurement date. The Board of Directors (the “Board”) has adopted Valuation Procedures for security valuation under which fair valuation responsibilities have been delegated to Prudential Investments LLC (“PI” or “Manager”). Under the current Valuation Procedures, the established Valuation Committee is responsible for supervising the valuation of portfolio securities and other assets. The Valuation Procedures permit the Series to utilize independent pricing vendor services, quotations from market makers, and alternative valuation methods when market quotations are either not readily available or not deemed representative of fair value. A record of the Valuation Committee’s actions is subject to the Board’s review, approval, and ratification at its next regularly-scheduled quarterly meeting.
Various inputs determine how the Series’ investments are valued, all of which are categorized according to the three broad levels (Level 1, 2, or 3) detailed in the table following the Portfolio of Investments.
Common and preferred stocks, exchange-traded funds, and derivative instruments such as futures or options that are traded on a national securities exchange are valued at the last sale price as of the close of trading on the applicable exchange. Securities traded via NASDAQ are valued at the NASDAQ official closing price. To the extent these securities are valued at the last sale price or NASDAQ official closing price, they are classified as Level 1 in the fair value hierarchy.
In the event that no sale or official closing price on valuation date exists, these securities are generally valued at the mean between the last reported bid and ask prices, or at the last bid price in the absence of an ask price. These securities are classified as Level 2 in the fair value hierarchy, as the inputs are observable and considered to be significant to the valuation.
Common and preferred stocks traded on foreign securities exchanges are valued using pricing vendor services that provide model prices derived using adjustment factors based on information such as local closing price, relevant general and sector indices, currency fluctuations, depositary receipts, and futures, as applicable. Securities valued using such model prices are classified as Level 2 in the fair value hierarchy, as the adjustment factors are observable and considered to be significant to the valuation. Securities not valued using such model prices are valued in accordance with exchange-traded common and preferred stocks discussed above.
Investments in open-end, non-exchange-traded mutual funds are valued at their net asset values as of the close of the NYSE on the date of valuation. These securities are classified as Level 1 in the fair value hierarchy since they may be purchased or sold at their net asset values on the date of valuation.
Fixed income securities traded in the over-the-counter market are generally valued at prices provided by approved independent pricing vendors. The pricing vendors provide these prices after evaluating observable inputs including, but not limited to yield curves, yield spreads, credit ratings, deal terms, tranche level attributes, default rates, cash flows, prepayment speeds, broker/dealer quotations, and reported trades. Securities valued using such vendor prices are classified as Level 2 in the fair value hierarchy.
Over-the-counter derivative instruments are generally valued using pricing vendor services, which derive the valuation based on inputs such as underlying asset prices, indices, spreads, interest rates, and exchange rates. These instruments are categorized as Level 2 in the fair value hierarchy.
Centrally cleared swaps listed or traded on a multilateral or trade facility platform, such as a registered exchange, are valued at the daily settlement price determined by
| | | | |
| Prudential Emerging Markets Debt Local Currency Fund | | | 35 | |
Notes to Financial Statements
continued
the respective exchange. These securities are classified as Level 2 in the fair value hierarchy, as the prices marked at the official settle are not public.
Securities and other assets that cannot be priced according to the methods described above are valued based on pricing methodologies approved by the Board. In the event that significant unobservable inputs are used when determining such valuations, the securities will be classified as Level 3 in the fair value hierarchy.
When determining the fair value of securities, some of the factors influencing the valuation include: the nature of any restrictions on disposition of the securities; assessment of the general liquidity of the securities; the issuer’s financial condition and the markets in which it does business; the cost of the investment; the size of the holding and the capitalization of the issuer; the prices of any recent transactions or bids/offers for such securities or any comparable securities; any available analyst media or other reports or information deemed reliable by the investment adviser regarding the issuer or the markets or industry in which it operates. Using fair value to price securities may result in a value that is different from a security’s most recent closing price and from the price used by other mutual funds to calculate their net asset values.
Restricted and Illiquid Securities: Subject to guidelines adopted by the Board, the Series may invest up to 15% of its net assets in illiquid securities, including those which are restricted as to disposition under securities law (“restricted securities”). Restricted securities are valued pursuant to the valuation procedures noted above. Illiquid securities are those that, because of the absence of a readily available market or due to legal or contractual restrictions on resale, cannot be sold within seven days in the ordinary course of business at approximately the amount at which the Series has valued the investment. Therefore, the Series may find it difficult to sell illiquid securities at the time considered most advantageous by its Subadviser and may incur expenses that would not be incurred in the sale of securities that were freely marketable. Certain securities that would otherwise be considered illiquid because of legal restrictions on resale to the general public may be traded among qualified institutional buyers under Rule 144A of the Securities Act of 1933. These Rule 144A securities, as well as commercial paper that is sold in private placements under Section 4(2) of the Securities Act, may be deemed liquid by the Series’ Subadviser under the guidelines adopted by the Directors of the Series. However, the liquidity of the Series’ investments in Rule 144A securities could be impaired if trading does not develop or declines.
Foreign Currency Translation: The books and records of the Series are maintained in U.S. dollars. Foreign currency amounts are translated into U.S. dollars on the following basis:
(i) market value of investment securities, other assets and liabilities—at the current rates of exchange.
(ii) purchases and sales of investment securities, income and expenses—at the rates of exchange prevailing on the respective dates of such transactions.
Although the net assets of the Series are presented at the foreign exchange rates and market values at the close of the period, the Series does not isolate that portion of the results of operations arising as a result of changes in the foreign exchange rates from the fluctuations arising from changes in the market prices of long-term portfolio securities held at the end of the period. Similarly, the Series does not isolate the effect of changes in foreign exchange rates from the fluctuations arising from changes in the market prices of long-term portfolio securities sold during the period. Accordingly, these realized foreign currency gains or losses are included in the reported net realized gains or losses on investment transactions.
Net realized gains or losses on foreign currency transactions represent net foreign exchange gains or losses from holdings of foreign currencies, forward currency contracts, disposition of foreign currencies, currency gains or losses realized between the trade and settlement dates on securities transactions, and the difference between the amounts of interest, dividends and foreign withholding taxes recorded on the Series’ books and the U.S. dollar equivalent amounts actually received or paid. Net unrealized currency gains or losses from valuing foreign currency denominated assets and liabilities (other than investments) at period end exchange rates are reflected as a component of net unrealized appreciation (depreciation) on foreign currencies.
Concentration of Risk: The ability of issuers of debt securities (other than those issued or guaranteed by the U.S. Government), held by the Series to meet their obligations may be affected by the economic or political developments in a specific industry, region or country. Foreign security and currency transactions may involve certain considerations and risks not typically associated with those of U.S. companies as a result of, among other factors, the possibility of political or economic instability, or the level of governmental supervision and regulation of foreign securities markets.
Forward Currency Contracts: A forward currency contract is a commitment to purchase or sell a foreign currency at a future date at a negotiated forward rate between two parties. The Series enters into forward currency contracts in order to hedge its exposure to changes in foreign currency exchange rates on its foreign
| | | | |
| Prudential Emerging Markets Debt Local Currency Fund | | | 37 | |
Notes to Financial Statements
continued
portfolio holdings or specific receivables and payables denominated in a foreign currency. The contracts are valued daily at current exchange rates and any unrealized gain or loss is included in net unrealized appreciation or depreciation on foreign currencies. Gain or loss is realized on the settlement date of the contract equal to the difference between the settlement value of the original and negotiated forward contracts. This gain or loss, if any, is included in net realized gain (loss) on foreign currency transactions. Risks may arise upon entering into these contracts from the potential inability of the counterparties to meet the terms of their contracts. Forward currency contracts involve risks from currency exchange rate and credit risk in excess of the amounts reflected on the Statement of Assets and Liabilities. The Series’ maximum risk of loss from counterparty credit risk is the net value of the cash flows to be received from the counterparty at the end of the contract’s life.
Cross Currency Exchange Contracts: A cross currency contract is a forward contract where a specified amount of one currency will be exchanged for a specified amount of another currency.
Options: The Series purchased options and wrote options in order to hedge against adverse market movements or fluctuations in value caused by changes in prevailing interest rates or foreign currency exchange rates, with respect to securities which the Series currently owns or intends to purchase. The Series’ principal reason for writing options would be to realize, through receipt of premiums, a greater current return than would be realized on the underlying security alone. When the Series purchases an option, it pays a premium and an amount equal to that premium is recorded as an asset. When the Series writes an option, it receives a premium and an amount equal to that premium is recorded as a liability. The asset or liability is adjusted daily to reflect the current market value of the option. If an option expires unexercised, the Series realizes a gain or loss to the extent of the premium received or paid. If an option is exercised, the premium received or paid is recorded as an adjustment to the proceeds from the sale or the cost of the purchase in determining whether the Series has realized a gain or loss. The difference between the premium and the amount received or paid on effecting a closing purchase or sale transaction is also treated as a realized gain or loss. Gain or loss on purchased options is included in net realized gain or loss on investment transactions. Gain or loss on written options is presented separately as net realized gain or loss on options written. The Series, as writer of an option, may have no control over whether the underlying securities may be sold (called) or purchased (put). As a result, the Series bears the market risk of an unfavorable change in the price of the security underlying the written option.
Over-the-counter options involve the risk of the potential inability of the counterparties to meet the terms of their contracts.
With exchange-traded options contracts, there is minimal counterparty credit risk to the Series since the exchanges’ clearinghouse acts as counterparty to all exchange-traded options and guarantees the options contracts against default.
Swap Agreements: The Series entered into interest rate swap agreements. A swap agreement is an agreement to exchange the return generated by one instrument for the return generated by another instrument. Swap agreements are negotiated in the over-the-counter market and may be executed either directly with counterparty (“OTC-traded”) or through a central clearing facility, such as a registered commodities exchange (“Exchange-traded”). The swap agreements are valued daily at current market value and any change in value is included in the net unrealized appreciation or depreciation on investments. Exchange-traded swaps pay or receive an amount known as “variation margin”, based on daily changes in the valuation of the swap contract. Payments received or paid by the Series are recorded as realized gains or losses upon termination or maturity of the swap. Risk of loss may exceed amounts recognized on the Statements of Assets and Liabilities. Swap agreements outstanding at period end, if any, are listed on the Portfolio of Investments.
Interest Rate Swaps: Interest rate swaps represent an agreement between counterparties to exchange cash flows based on the difference between two interest rates, applied to a notional principal amount for a specified period. The Series used interest rate swaps to maintain its ability to generate steady cash flow by receiving a stream of fixed-rate payments and to increase exposure to prevailing market rates by receiving floating rate payments using interest rate swap contracts. The Series is subject to interest rate risk exposure in the normal course of pursuing its investment objectives.
Master Netting Arrangements: The Series is subject to various Master Agreements, or netting arrangements, with select counterparties. A master netting arrangement between the Series and the counterparty permits the Series to offset amounts payable by the Series to the same counterparty against amounts to be received; and by the receipt of collateral from the counterparty by the Series to cover the Series’ exposure to the counterparty. However, there is no assurance that such mitigating factors are easily enforceable. The right to set-off exists when all the conditions are met such that each of the parties owes the other determinable amounts, the reporting party has the right to set-off the amount owed with the amount owed by the other party, the reporting party intends to set-off and the right of set-off is enforceable by law. During the reporting period, there were no instances where the right of set-off existed and management has not elected to offset.
| | | | |
| Prudential Emerging Markets Debt Local Currency Fund | | | 39 | |
Notes to Financial Statements
continued
The Series is a party to ISDA (International Swaps and Derivatives Association, Inc.) Master Agreements with certain counterparties that govern over-the-counter derivative and foreign exchange contracts entered into from time to time. The Master Agreements may contain provisions regarding, among other things, the parties’ general obligations, representations, agreements, collateral requirements, events of default and early termination. With respect to certain counterparties, in accordance with the terms of the Master Agreements, collateral posted to the Series is held in a segregated account by the Series’ custodian and with respect to those amounts which can be sold or re-pledged, is presented in the Portfolio of Investments. Collateral pledged by the Series is segregated by the Series’ custodian and identified in the Portfolio of Investments. Collateral can be in the form of cash or debt securities issued by the U.S. Government or related agencies or other securities as agreed to by the Series and the applicable counterparty. Collateral requirements are determined based on the Series’ net position with each counterparty. Termination events applicable to the Series may occur upon a decline in the Series’ net assets below a specified threshold over a certain period of time. Termination events applicable to counterparties may occur upon a decline in the counterparty’s long-term and short term credit ratings below a specified level. In each case, upon occurrence, the other party may elect to terminate early and cause settlement of all derivative and foreign exchange contracts outstanding, including the payment of any losses and costs resulting from such early termination, as reasonably determined by the terminating party. Any decision by one or more of the Series’ counterparties to elect early termination could impact the Series’ future derivative activity.
In addition to each instrument’s primary underlying risk exposure (e.g. interest rate, credit, equity or foreign exchange, etc.), swap agreements involve, to varying degrees, elements of credit, market and documentation risk. Such risks involve the possibility that no liquid market for these agreements will exist, the counterparty to the agreement may default on its obligation to perform or disagree on the contractual terms of the agreement, and changes in net interest rates will be unfavorable. In connection with these agreements, securities in the portfolio may be identified or received as collateral from the counterparty in accordance with the terms of the respective swap agreements to provide or receive assets of value and to serve as recourse in the event of default or bankruptcy/insolvency of either party. Such over-the-counter derivative agreements include conditions which, when materialized, give the counterparty the right to cause an early termination of the transactions under those agreements. Any election by the counterparty for early termination of the contract(s) may impact the amounts reported on financial statements.
As of October 31, 2014, the Series has not met conditions under such agreements which give the counterparty the right to call for an early termination.
Forward currency contracts, written options, short sales, swaps and financial futures contracts involve elements of both market and credit risk in excess of the amounts reflected on the Statement of Assets and Liabilities. Such risks may be mitigated by engaging in master netting arrangements.
Securities Transactions and Net Investment Income: Securities transactions are recorded on the trade date. Realized gains or losses from investment and currency transactions are calculated on the identified cost basis. Dividend income is recorded on the ex-dividend date. Interest income, including amortization of premium and accretion of discount on debt securities, as required, is recorded on an accrual basis. Expenses are recorded on an accrual basis, which may require the use of certain estimates by management that may differ from actual.
Net investment income or loss (other than distribution fees, which are charged directly to the respective class and transfer agency fees specific to Class Q shares which are charged to that share class) and unrealized and realized gains or losses are allocated daily to each class of shares based upon the relative proportion of adjusted net assets of each class at the beginning of the day.
Dividends and Distributions: The Series declares dividends of net investment income daily and payment is made monthly. Distributions from net realized capital and currency gains, if any, are made annually.
Dividends and distributions are recorded on the ex-dividend date. Dividends and distributions are determined in accordance with federal income tax regulations which may differ from generally accepted accounting principles. Permanent book/tax differences relating to income and gains are reclassified amongst distribution in excess of net investment income, accumulated net realized gain or loss and paid-in-capital in excess of par, as appropriate.
Taxes: For federal income tax purposes, each series in the Fund is treated as a separate taxpaying entity. It is each series’ policy to continue to meet the requirements of the Internal Revenue Code applicable to regulated investment companies and to distribute all of its taxable net investment income and capital gains, if any, to its shareholders. Therefore, no federal income tax provision is required. Withholding taxes on foreign interest are recorded, net of reclaimable amounts, at the time the related income is earned.
| | | | |
| Prudential Emerging Markets Debt Local Currency Fund | | | 41 | |
Notes to Financial Statements
continued
Estimates: The preparation of the financial statements requires management to make estimates and assumptions that affect the reported amounts and disclosures in the financial statements. Actual results could differ from those estimates.
Note 2. Agreements
The Series has a management agreement with PI. Pursuant to this agreement, PI has responsibility for all investment advisory services and supervises the subadvisor’s performance of such services. PI has entered into a subadvisory agreement with Prudential Investment Management, Inc. (“PIM”). The subadvisory agreement provides that PIM will furnish investment advisory services in connection with the management of the Series. In connection therewith, PIM is obligated to keep certain books and records of the Series. PI pays for the services of PIM, the cost of compensation of officers of the Series, occupancy and certain clerical and bookkeeping costs of the Series. The Series bears all other costs and expenses.
The management fee paid to PI is accrued daily and payable monthly at an annual rate of .80% of the average daily net assets of the Series.
PI has contractually agreed through February 29, 2016 to limit net annual Series operating expenses (excluding distribution and service (12b-1) fees, extraordinary and certain other expenses such as taxes, interest and brokerage commissions) to each class of shares to 1.05% of the Series’ average daily net assets.
The Series has a distribution agreement with Prudential Investment Management Services LLC (“PIMS”) who acts as the distributor of the Class A, Class C, Class Q and Class Z shares. The Series compensates PIMS for distributing and servicing the Series’ Class A and Class C, pursuant to plans of distribution (the “Class A and C Plans”), regardless of expenses actually incurred by PIMS. The distribution fees are accrued daily and payable monthly. No distribution or service fees are paid to PIMS as distributor of the Class Q and Z shares of the Series.
Pursuant to the Class A and C Plans, the Series compensates PIMS for distribution related activities at an annual rate of up to .30% and 1% of the average daily net assets of the Class A and C shares, respectively. For the year ended October 31, 2014, PIMS contractually agreed to limit such expenses to .25% of the average daily net assets of the Class A shares.
PIMS has advised the Series that it received $26,761 in front-end sales charges resulting from sales of Class A shares during the year ended October 31, 2014. From these fees, PIMS paid such sales charges to affiliated broker-dealers, which in turn paid commissions to salespersons and incurred other distribution costs.
PIMS has advised the Series that for the year ended October 31, 2014, it received $418 in contingent deferred sales charges imposed upon certain redemptions by Class C shareholders.
PI, PIM and PIMS are indirect, wholly-owned subsidiaries of Prudential Financial, Inc. (“Prudential”).
Note 3. Other Transactions with Affiliates
Prudential Mutual Fund Services LLC (“PMFS”), an affiliate of PI and an indirect, wholly-owned subsidiary of Prudential, serves as the Series’ transfer agent. Transfer agent’s fees and expenses in the Statement of Operations include certain out-of-pocket expenses paid to non-affiliates, where applicable.
The Series invests in the Prudential Core Taxable Money Market Fund (the “Core Fund”), a Series of the Prudential Investment Portfolios 2 registered under the 1940 Act and managed by PI. Earnings from the Core Fund are disclosed on the Statement of Operations as affiliated dividend income.
Note 4. Portfolio Securities
Purchases and sales of portfolio securities, other than short-term investments and U.S. Government securities, for the year ended October 31, 2014, were $40,781,463 and $45,876,279, respectively.
Transactions in options written during the year ended October 31, 2014, were as follows:
| | | | | | | | |
| | | Notional
Amount | | | Premiums
Received | |
Options outstanding at October 31, 2013 | | $ | — | | | $ | — | |
Options written | | | 4,094,000 | | | | 12,551 | |
Options expired | | | (1,230,000 | ) | | | (5,298 | ) |
| | | | | | | | |
Options outstanding at October 31, 2014 | | $ | 2,864,000 | | | $ | 7,253 | |
| | | | | | | | |
| | | | |
| Prudential Emerging Markets Debt Local Currency Fund | | | 43 | |
Notes to Financial Statements
continued
Note 5. Distributions and Tax Information
Distributions to shareholders, which are determined in accordance with federal income tax regulations and which may differ from generally accepted accounting principles, are recorded on the ex-dividend date. In order to present distributions in excess of net investment income, accumulated net realized loss on investment and foreign currency transactions and paid-in capital in excess of par on the Statement of Assets and Liabilities that more closely represent their tax character, certain adjustments have been made to distributions in excess of net investment income, accumulated net realized loss on investment and foreign currency transactions and paid-in capital in excess of par. For the year ended October 31, 2014, the adjustments were to increase distributions in excess of net investment income by $2,096,139, decrease accumulated net realized loss on investment and foreign currency transactions by $2,342,575 and decrease paid-in capital in excess of par by $246,436 due to the differences in the treatment for book and tax purposes of certain transactions involving foreign currencies, swaps, paydown gains/losses, differences in the treatment of premium amortization, net operating loss and reclassification of distributions. Net investment income, net realized gain (loss) on investment and foreign currency transactions and net assets were not affected by this change.
For the year ended October 31, 2014, the tax character of dividends paid as reflected in the Statement of Changes in Net Assets were $401,472 of long-term capital gains and $2,125,848 of tax return of capital. For the year ended October 31, 2013, the tax character of dividends paid as reflected in the Statement of Changes in Net Assets were $1,769,548 of ordinary income, $91,800 of long-term capital gains and $1,583,867 of tax return of capital.
As of October 31, 2014, the Fund had no accumulated undistributed earnings on a tax basis.
The United States federal income tax basis of the Series’ investments and the net unrealized depreciation as of October 31, 2014 were as follows:
| | | | | | | | | | |
Tax Basis | | Appreciation | | Depreciation | | Net
Unrealized
Depreciation | | Other Cost
Basis
Adjustments | | Total Net
Unrealized
Depreciation |
| $41,065,171 | | $315,347 | | $(6,345,457) | | $(6,030,110) | | $(250,314) | | $(6,280,424) |
The difference between book basis and tax basis is primarily attributable to the difference in the treatment of amortization of premiums, wash sales and straddle loss deferrals. The other cost basis adjustments are primarily attributable to appreciation (depreciation) of foreign currencies, swaps and mark-to-market of receivables and payables.
The Fund utilized approximately $129,000 of its capital loss carryforward to offset net taxable gains realized in the fiscal year ended October 31, 2014.
Management has analyzed the Series’ tax positions taken on federal income tax returns for all open tax years and has concluded that no provision for income tax is required in the Series’ financial statements for the current reporting period. The Series’ federal and state income and federal excise tax returns for tax years for which the applicable statutes of limitations have not expired are subject to examination by the Internal Revenue Service and state departments of revenue.
Note 6. Capital
The Series offers Class A, Class C, Class Q and Class Z shares. Class A shares are sold with a front-end sales charge of up to 4.50%. Investors who purchase Class A shares in an amount of $1 million or more and sell these shares within 12 months of purchase are subject to a contingent deferred sales charge (“CDSC”) of 1%. The Class A CDSC is waived for purchases by certain retirement and/or benefit plans. Class C shares are sold with a CDSC of 1% on shares redeemed within the first 12 months after purchase. A special exchange privilege is also available for shareholders who qualified to purchase Class A shares at net asset value. Class Q and Z shares are not subject to any sales or redemption charge and are offered exclusively for sale to a limited group of investors.
Under certain circumstances, an exchange may be made from specified share classes of the Series to one or more other share classes of the Series as presented in the table of transactions in shares of common stock. For the year ended October 31, 2014, no such exchanges were made.
As of October 31, 2014, Prudential Financial, Inc. through its affiliates owned 126 Class Q shares and 2,976,964 Class Z shares of the Series.
There are 425 million shares of common stock at $0.01 par value per share, designated Class A, Class C, Class Q and Class Z common stock, each of which consists of 75 million, 50 million, 50 million and 250 million authorized shares, respectively.
| | | | |
| Prudential Emerging Markets Debt Local Currency Fund | | | 45 | |
Notes to Financial Statements
continued
Transactions in shares of common stock were as follows:
| | | | | | | | |
Class A | | Shares | | | Amount | |
Year ended October 31, 2014: | | | | | | | | |
Shares sold | | | 279,301 | | | $ | 2,302,607 | |
Shares issued in reinvestment of dividends and tax return of capital | | | 36,690 | | | | 299,271 | |
Shares reacquired | | | (781,785 | ) | | | (6,398,476 | ) |
| | | | | | | | |
Net increase (decrease) in shares outstanding before conversion | | | (465,794 | ) | | | (3,796,598 | ) |
Shares reacquired upon conversion into Class Z | | | (30,119 | ) | | | (247,386 | ) |
| | | | | | | | |
Net increase (decrease) in shares outstanding | | | (495,913 | ) | | $ | (4,043,984 | ) |
| | | | | | | | |
Year ended October 31, 2013: | | | | | | | | |
Shares sold | | | 1,778,574 | | | $ | 17,221,493 | |
Shares issued in reinvestment of dividends and tax return of capital | | | 81,238 | | | | 743,125 | |
Shares reacquired | | | (1,229,880 | ) | | | (11,043,144 | ) |
| | | | | | | | |
Net increase (decrease) in shares outstanding | | | 629,932 | | | $ | 6,921,474 | |
| | | | | | | | |
Class C | | | | | | |
Year ended October 31, 2014: | | | | | | | | |
Shares sold | | | 60,555 | | | $ | 508,979 | |
Shares issued in reinvestment of dividends and tax return of capital | | | 7,366 | | | | 60,508 | |
Shares reacquired | | | (118,303 | ) | | | (981,084 | ) |
| | | | | | | | |
Net increase (decrease) in shares outstanding before conversion | | | (50,382 | ) | | | (411,597 | ) |
Shares reacquired upon conversion into Class Z | | | (1,820 | ) | | | (15,115 | ) |
| | | | | | | | |
Net increase (decrease) in shares outstanding | | | (52,202 | ) | | $ | (426,712 | ) |
| | | | | | | | |
Year ended October 31, 2013: | | | | | | | | |
Shares sold | | | 160,719 | | | $ | 1,568,898 | |
Shares issued in reinvestment of dividends and tax return of capital | | | 8,863 | | | | 81,701 | |
Shares reacquired | | | (107,280 | ) | | | (977,299 | ) |
| | | | | | | | |
Net increase (decrease) in shares outstanding | | | 62,302 | | | $ | 673,300 | |
| | | | | | | | |
Class Q | | | | | | |
Year ended October 31, 2014: | | | | | | | | |
Shares issued in reinvestment of dividends and tax return of capital | | | 8.2 | | | $ | 67 | |
| | | | | | | | |
Net increase (decrease) in shares outstanding | | | 8.2 | | | $ | 67 | |
| | | | | | | | |
Year ended October 31, 2013: | | | | | | | | |
Shares issued in reinvestment of dividends and tax return of capital | | | 8.3 | | | $ | 76 | |
| | | | | | | | |
Net increase (decrease) in shares outstanding | | | 8.3 | | | $ | 76 | |
| | | | | | | | |
| | | | | | | | |
Class Z | | Shares | | | Amount | |
Year ended October 31, 2014: | | | | | | | | |
Shares sold | | | 584,734 | | | $ | 4,871,541 | |
Shares issued in reinvestment of dividends and tax return of capital | | | 244,501 | | | | 2,010,963 | |
Shares reacquired | | | (873,483 | ) | | | (7,177,914 | ) |
| | | | | | | | |
Net increase (decrease) in shares outstanding before conversion | | | (44,248 | ) | | | (295,410 | ) |
Shares issued upon conversion from Class A and Class C | | | 31,701 | | | | 262,501 | |
| | | | | | | | |
Net increase (decrease) in shares outstanding | | | (12,547 | ) | | $ | (32,909 | ) |
| | | | | | | | |
Year ended October 31, 2013: | | | | | | | | |
Shares sold | | | 1,250,099 | | | $ | 12,005,612 | |
Shares issued in reinvestment of dividends and tax return of capital | | | 270,309 | | | | 2,505,294 | |
Shares reacquired | | | (1,401,122 | ) | | | (12,673,460 | ) |
| | | | | | | | |
Net increase (decrease) in shares outstanding | | | 119,286 | | | $ | 1,837,446 | |
| | | | | | | | |
Note 7. Borrowings
The Series, along with other affiliated registered investment companies (the “Funds”), is a party to a Syndicated Credit Agreement (“SCA”) with a group of banks. The purpose of the SCA is to provide an alternative source of temporary funding for capital share redemptions. The SCA provides for a commitment of $900 million for the period November 5, 2013 through October 8, 2014. The Funds pay an annualized commitment fee of .075% of the unused portion of the SCA. Prior to October 9, 2014, the Funds had another SCA that provided a commitment of $900 million and the Funds paid an annualized commitment fee of .08% of the unused portion of the SCA. Interest on any borrowings under the SCA is paid at contracted market rates. The commitment fee for the unused amount is accrued daily and paid quarterly.
The Series utilized the SCA during the year ended October 31, 2014. The average daily balance for the 59 days the Series had loans outstanding during the period was $306,153 borrowed at a weighted average interest rate of 1.41%. At October 31, 2014, the Series did not have an outstanding loan amount.
| | | | |
| Prudential Emerging Markets Debt Local Currency Fund | | | 47 | |
Financial Highlights
| | | | | | | | | | | | | | | | | | |
| Class A Shares | | | | | | | | | | | | | | |
| | | Year Ended October 31, | | | | | March 30,
2011(a)
through
October 31, | |
| | | 2014(b) | | | 2013(b) | | | 2012(b) | | | | | 2011 | |
| Per Share Operating Performance: | | | | | | | | | | | | | | | | | | |
| Net Asset Value, Beginning Of Period | | | $8.67 | | | | $9.61 | | | | $9.36 | | | | | | $10.00 | |
| Income (loss) from investment operations: | | | | | | | | | | | | | | | | | | |
| Net investment income | | | .49 | | | | .47 | | | | .42 | | | | | | .32 | |
| Net realized and unrealized gain (loss) on investment transactions | | | (.71 | ) | | | (.76 | ) | | | .35 | | | | | | (.62 | ) |
| Total from investment operations | | | (.22 | ) | | | (.29 | ) | | | .77 | | | | | | (.30 | ) |
| Less Dividends and Distributions: | | | | | | | | | | | | | | | | | | |
| Dividends from net investment income | | | (.07 | ) | | | (.30 | ) | | | (.52 | ) | | | | | (.13 | ) |
| Distributions from net realized gains | | | - | | | | (.05 | ) | | | - | | | | | | - | |
| Tax return of capital | | | (.46 | ) | | | (.30 | ) | | | - | | | | | | (.21 | ) |
| Total dividends and distributions | | | (.53 | ) | | | (.65 | ) | | | (.52 | ) | | | | | (.34 | ) |
| Net asset value, end of period | | | $7.92 | | | | $8.67 | | | | $9.61 | | | | | | $9.36 | |
| Total Return(c): | | | (2.47)% | | | | (3.23)% | | | | 8.53% | | | | | | (3.14)% | |
| |
| Ratios/Supplemental Data: | | | | | | | | | | | | | | |
| Net assets, end of period (000) | | | $5,991 | | | | $10,862 | | | | $5,985 | | | | | | $2,620 | |
| Average net assets (000) | | | $6,701 | | | | $12,797 | | | | $2,721 | | | | | | $1,634 | |
| Ratios to average net assets(d): | | | | | | | | | | | | | | | | | | |
| Expenses after advisory fee waivers and/or expense reimbursement | | | 1.30% | | | | 1.30% | | | | 1.30% | | | | | | 1.30% | (e) |
| Expenses before advisory fee waivers and/or expense reimbursement | | | 2.13% | | | | 1.78% | | | | 2.09% | | | | | | 2.81% | (e) |
| Net investment income | | | 5.99% | | | | 5.07% | | | | 4.73% | | | | | | 4.85% | (e) |
| Portfolio turnover rate | | | 110% | | | | 102% | | | | 70% | | | | | | 60% | (f) |
(a) Commencement of operations.
(b) Calculated based on average shares outstanding during the period.
(c) Total return does not consider the effects of sales loads. Total return is calculated assuming a purchase of a share on the first day and a sale on the last day of the reporting period, and includes reinvestment of dividends and distributions. Total return may reflect adjustments to conform to generally accepted accounting principles. Total return for a period less than a full year is not annualized.
(d) Does not include expenses of the underlying fund in which the Series invests.
(e) Annualized.
(f) Not annualized.
See Notes to Financial Statements.
| | | | | | | | | | | | | | | | | | |
| Class C Shares | | | | | | | | | | | | | | |
| | | Year Ended October 31, | | | | | March 30,
2011(a)
through
October 31, | |
| | | 2014(b) | | | 2013(b) | | | 2012(b) | | | | | 2011 | |
| Per Share Operating Performance: | | | | | | | | | | | | | | | | | | |
| Net Asset Value, Beginning Of Period | | | $8.72 | | | | $9.65 | | | | $9.41 | | | | | | $10.00 | |
| Income (loss) from investment operations: | | | | | | | | | | | | | | | | | | |
| Net investment income | | | .43 | | | | .40 | | | | .37 | | | | | | .31 | |
| Net realized and unrealized gain (loss) on investment transactions | | | (.71 | ) | | | (.75 | ) | | | .32 | | | | | | (.57 | ) |
| Total from investment operations | | | (.28 | ) | | | (.35 | ) | | | .69 | | | | | | (.26 | ) |
| Less Dividends and Distributions: | | | | | | | | | | | | | | | | | | |
| Dividends from net investment income | | | (.01 | ) | | | (.23 | ) | | | (.45 | ) | | | | | (.12 | ) |
| Distributions from net realized gains | | | - | | | | (.05 | ) | | | - | | | | | | - | |
| Tax return of capital | | | (.46 | ) | | | (.30 | ) | | | - | | | | | | (.21 | ) |
| Total dividends and distributions | | | (.47 | ) | | | (.58 | ) | | | (.45 | ) | | | | | (.33 | ) |
| Net asset value, end of period | | | $7.97 | | | | $8.72 | | | | $9.65 | | | | | | $9.41 | |
| Total Return(c): | | | (3.21)% | | | | (3.85)% | | | | 7.55% | | | | | | (2.72)% | |
| |
| Ratios/Supplemental Data: | | | | | | | | | | | | | | |
| Net assets, end of period (000) | | | $927 | | | | $1,469 | | | | $1,025 | | | | | | $398 | |
| Average net assets (000) | | | $1,207 | | | | $1,585 | | | | $786 | | | | | | $211 | |
| Ratios to average net assets(d): | | | | | | | | | | | | | | | | | | |
| Expenses after advisory fee waivers and/or expense reimbursement | | | 2.05% | | | | 2.05% | | | | 2.05% | | | | | | 2.05% | (e) |
| Expenses before advisory fee waivers and/or expense reimbursement | | | 2.82% | | | | 2.47% | | | | 2.78% | | | | | | 3.52% | (e) |
| Net investment income | | | 5.17% | | | | 4.26% | | | | 3.89% | | | | | | 4.09% | (e) |
| Portfolio turnover rate | | | 110% | | | | 102% | | | | 70% | | | | | | 60% | (f) |
(a) Commencement of operations.
(b) Calculated based on average shares outstanding during the period.
(c) Total return does not consider the effects of sales loads. Total return is calculated assuming a purchase of a share on the first day and a sale on the last day of the reporting period, and includes reinvestment of dividends and distributions. Total return may reflect adjustments to conform to generally accepted accounting principles. Total return for a period less than a full year is not annualized.
(d) Does not include expenses of the underlying fund in which the Series invests.
(e) Annualized.
(f) Not annualized.
See Notes to Financial Statements.
| | | | |
| Prudential Emerging Markets Debt Local Currency Fund | | | 49 | |
Financial Highlights
continued
| | | | | | | | | | | | | | | | | | |
| Class Q Shares | | | | | | | | | | | | | | |
| | | Year Ended October 31, | | | | | March 30,
2011(a)
through
October 31, | |
| | | 2014(b) | | | 2013(b) | | | 2012(b) | | | | | 2011 | |
| Per Share Operating Performance: | | | | | | | | | | | | | | | | | | |
| Net Asset Value, Beginning Of Period | | | $8.71 | | | | $9.66 | | | | $9.37 | | | | | | $10.00 | |
| Income (loss) from investment operations: | | | | | | | | | | | |
| Net investment income | | | .51 | | | | .58 | | | | .47 | | | | | | .29 | |
| Net realized and unrealized gain (loss) on investment transactions | | | (.69 | ) | | | (.86 | ) | | | .37 | | | | | | (.59 | ) |
| Total from investment operations | | | (.18 | ) | | | (.28 | ) | | | .84 | | | | | | (.30 | ) |
| Less Dividends and Distributions: | | | | | | | | | | | | | | | | | | |
| Dividends from net investment income | | | (.09 | ) | | | (.32 | ) | | | (.55 | ) | | | | | (.12 | ) |
| Distributions from net realized gains | | | - | | | | (.05 | ) | | | - | | | | | | - | |
| Tax return of capital | | | (.46 | ) | | | (.30 | ) | | | - | | | | | | (.21 | ) |
| Total dividends and distributions | | | (.55 | ) | | | (.67 | ) | | | (.55 | ) | | | | | (.33 | ) |
| Net asset value, end of period | | | $7.98 | | | | $8.71 | | | | $9.66 | | | | | | $9.37 | |
| Total Return(c): | | | (1.97)% | | | | (3.06)% | | | | 9.31% | | | | | | (3.14)% | |
| |
| Ratios/Supplemental Data: | | | | | | | | | | | | | | |
| Net assets, end of period (000) | | | $1 | | | | $1 | | | | $1 | | | | | | $1 | |
| Average net assets (000) | | | $1 | | | | $1 | | | | $1 | | | | | | $1 | |
| Ratios to average net assets(d): | | | | | | | | | | | | | | | | | | |
| Expenses after advisory fee waivers and/or expense reimbursement | | | 1.05% | | | | 1.05% | | | | 1.05% | | | | | | 1.05% | (e) |
| Expenses before advisory fee waivers and/or expense reimbursement | | | 1.69% | | | | 1.39% | | | | 1.71% | | | | | | 2.67% | (e) |
| Net investment income | | | 6.17% | | | | 6.22% | | | | 5.06% | | | | | | 4.98% | (e) |
| Portfolio turnover rate | | | 110% | | | | 102% | | | | 70% | | | | | | 60% | (f) |
(a) Commencement of operations.
(b) Calculated based on average shares outstanding during the period.
(c) Total return is calculated assuming a purchase of a share on the first day and a sale on the last day of the reporting period, and includes reinvestment of dividends and distributions. Total return may reflect adjustments to conform to generally accepted accounting principles. Total return for a period less than a full year is not annualized.
(d) Does not include expenses of the underlying fund in which the Series invests.
(e) Annualized.
(f) Not annualized.
See Notes to Financial Statements.
| | | | | | | | | | | | | | | | | | |
| Class Z Shares | | | | | | | | | | | | | | |
| | | Year Ended October 31, | | | | | March 30,
2011(a)
through
October 31, | |
| | | 2014(b) | | | 2013(b) | | | 2012(b) | | | | | 2011 | |
| Per Share Operating Performance: | | | | | | | | | | | | | | | | | | |
| Net Asset Value, Beginning Of Period | | | $8.72 | | | | $9.66 | | | | $9.37 | | | | | | $10.00 | |
| Income (loss) from investment operations: | | | | | | | | | | | | | | | | | | |
| Net investment income | | | .51 | | | | .49 | | | | .47 | | | | | | .29 | |
| Net realized and unrealized gain (loss) on investment transactions | | | (.70 | ) | | | (.76 | ) | | | .36 | | | | | | (.59 | ) |
| Total from investment operations | | | (.19 | ) | | | (.27 | ) | | | .83 | | | | | | (.30 | ) |
| Less Dividends and Distributions: | | | | | | | | | | | | | | | | | | |
| Dividends from net investment income | | | (.09 | ) | | | (.32 | ) | | | (.54 | ) | | | | | (.12 | ) |
| Distributions from net realized gains | | | - | | | | (.05 | ) | | | - | | | | | | - | |
| Tax return of capital | | | (.46 | ) | | | (.30 | ) | | | - | | | | | | (.21 | ) |
| Total dividends and distributions | | | (.55 | ) | | | (.67 | ) | | | (.54 | ) | | | | | (.33 | ) |
| Net asset value, end of period | | | $7.98 | | | | $8.72 | | | | $9.66 | | | | | | $9.37 | |
| Total Return(c): | | | (2.12)% | | | | (2.98)% | | | | 9.21% | | | | | | (3.14)% | |
| |
| Ratios/Supplemental Data: | | | | | | | | | | | | | | |
| Net assets, end of period (000) | | | $28,578 | | | | $31,330 | | | | $33,559 | | | | | | $26,532 | |
| Average net assets (000) | | | $30,288 | | | | $35,341 | | | | $30,441 | | | | | | $25,697 | |
| Ratios to average net assets(d): | | | | | | | | | | | | | | | | | | |
| Expenses after advisory fee waivers and/or expense reimbursement | | | 1.05% | | | | 1.05% | | | | 1.05% | | | | | | 1.05% | (e) |
| Expenses before advisory fee waivers and/or expense reimbursement | | | 1.82% | | | | 1.49% | | | | 1.81% | | | | | | 2.72% | (e) |
| Net investment income | | | 6.14% | | | | 5.25% | | | | 4.96% | | | | | | 4.99% | (e) |
| Portfolio turnover rate | | | 110% | | | | 102% | | | | 70% | | | | | | 60% | (f) |
(a) Commencement of operations.
(b) Calculated based on average shares outstanding during the period.
(c) Total return is calculated assuming a purchase of a share on the first day and a sale on the last day of the reporting period, and includes reinvestment of dividends and distributions. Total return may reflect adjustments to conform to generally accepted accounting principles. Total return for a period less than a full year is not annualized.
(d) Does not include expenses of the underlying fund in which the Series invests.
(e) Annualized.
(f) Not annualized.
See Notes to Financial Statements.
| | | | |
| Prudential Emerging Markets Debt Local Currency Fund | | | 51 | |
Report of Independent Registered Public
Accounting Firm
The Board of Trustees and Shareholders
Prudential World Fund, Inc.:
We have audited the accompanying statement of assets and liabilities of Prudential Emerging Markets Debt Local Currency Fund, a series of Prudential World Fund, Inc., (hereafter referred to as the “Fund”), including the portfolio of investments, as of October 31, 2014, and the related statement of operations for the year then ended, the statements of changes in net assets for each of the years in the two-year period then ended and the financial highlights for each of the years in the three-year period then ended and for the period March 30, 2011 (commencement of operations) to October 31, 2011. These financial statements and financial highlights are the responsibility of the Fund’s management. Our responsibility is to express an opinion on these financial statements and financial highlights based on our audits.
We conducted our audits in accordance with the standards of the Public Company Accounting Oversight Board (United States). Those standards require that we plan and perform the audit to obtain reasonable assurance about whether the financial statements and financial highlights are free of material misstatement. An audit includes examining, on a test basis, evidence supporting the amounts and disclosures in the financial statements. Our procedures included confirmation of securities owned as of October 31, 2014, by correspondence with the custodian, transfer agent and brokers or by other appropriate auditing procedures when replies from brokers were not received. An audit also includes assessing the accounting principles used and significant estimates made by management, as well as evaluating the overall financial statement presentation. We believe that our audits provide a reasonable basis for our opinion.
In our opinion, the financial statements and financial highlights referred to above present fairly, in all material respects, the financial position of the Fund as of October 31, 2014, and the results of its operations, the changes in its net assets and the financial highlights for the periods described in the first paragraph above, in conformity with U.S. generally accepted accounting principles.

New York, New York
December 16, 2014
INFORMATION ABOUT BOARD MEMBERS AND OFFICERS
(Unaudited)
Information about Board Members and Officers of the Fund is set forth below. Board Members who are not deemed to be “interested persons” of the Fund, as defined in the 1940 Act, are referred to as “Independent Board Members.” Board Members who are deemed to be “interested persons” of the Fund are referred to as “Interested Board Members.” The Board Members are responsible for the overall supervision of the operations of the Fund and perform the various duties imposed on the directors of investment companies by the 1940 Act. The Board in turn elects the Officers, who are responsible for administering the day-to-day operations of the Fund.
| | | | |
| Independent Board Members(1) |
| | | |
Name, Address, Age Position(s) Portfolios Overseen | | Principal Occupation(s) During Past Five Years | | Other Directorships Held |
Ellen S. Alberding (56) Board Member Portfolios Overseen: 69 | | President and Board Member, The Joyce Foundation (charitable foundation) (since 2002); Vice Chair, City Colleges of Chicago (community college system) (since 2011); Trustee, Skills for America’s Future (national initiative to connect employers to community colleges) (since 2011); Trustee, National Park Foundation (charitable foundation for national park system) (since 2009); Trustee, Economic Club of Chicago (since 2009). | | None. |
Kevin J. Bannon (62) Board Member Portfolios Overseen: 70 | | Managing Director (since April 2008) and Chief Investment Officer (October 2008-November 2013) of Highmount Capital LLC (registered investment adviser); formerly Executive Vice President and Chief Investment Officer (April 1993-August 2007) of Bank of New York Company; President (May 2003-May 2007) of BNY Hamilton Family of Mutual Funds. | | Director of Urstadt Biddle Properties (equity real estate investment trust) (since September 2008). |
Linda W. Bynoe (62) Board Member Portfolios Overseen: 70 | | President and Chief Executive Officer (since March 1995) and formerly Chief Operating Officer (December 1989-February 1995) of Telemat Ltd. (management consulting); formerly Vice President (January 1985-June 1989) at Morgan Stanley & Co (broker-dealer). | | Director of Simon Property Group, Inc. (retail real estate) (May 2003-May 2012); Director of Anixter International, Inc. (communication products distributor) (since January 2006); Director of Northern Trust Corporation (financial services) (since April 2006); Trustee of Equity Residential (residential real estate) (since December 2009). |
Prudential Emerging Markets Debt Local Currency Fund
| | | | |
| Independent Board Members(1) |
| | | |
Name, Address, Age Position(s) Portfolios Overseen | | Principal Occupation(s) During Past Five Years | | Other Directorships Held |
Keith F. Hartstein (58) Board Member Portfolios Overseen: 70 | | Retired; Formerly President and Chief Executive Officer (2005-2012), Senior Vice President (2004-2005), Senior Vice President of Sales and Marketing (1997-2004), and various executive management positions (1990-1997), John Hancock Funds, LLC (asset management); Chairman, Investment Company Institute’s Sales Force Marketing Committee (2003-2008). | | None. |
Michael S. Hyland, CFA (69) Board Member Portfolios Overseen: 69 | | Retired (since February 2005); Formerly Senior Managing Director (July 2001-February 2005) of Bear Stearns & Co, Inc.; Global Partner, INVESCO (1999-2001); Managing Director and President of Salomon Brothers Asset Management (1989-1999). | | None. |
Douglas H. McCorkindale (75) Board Member Portfolios Overseen: 69 | | Retired; Formerly Chairman (February 2001-June 2006), Chief Executive Officer (June 2000-July 2005), President (September 1997-July 2005) and Vice Chairman (March 1984-May 2000) of Gannett Co. Inc. (publishing and media). | | Director of Lockheed Martin Corp. (aerospace and defense) (since May 2001). |
Stephen P. Munn (72) Board Member Portfolios Overseen: 70 | | Lead Director (since 2007) and formerly Chairman (1993-2007) of Carlisle Companies Incorporated (manufacturer of industrial products). | | Lead Director (since 2007) of Carlisle Companies Incorporated (manufacturer of industrial products). |
James E. Quinn (62) Board Member Portfolios Overseen: 69 | | Retired; Formerly President (2003-2012) and Director (2003-2008), and Vice Chairman and Director (1998-2003), Tiffany & Company (jewelry retailing); Director, Mutual of America Capital Management Corporation (asset management) (since 1996); Director, Hofstra University (since 2008); Vice Chairman, Museum of the City of New York (since 1994). | | Director of Deckers Outdoor Corporation (footwear manufacturer) (since 2011). |
Richard A. Redeker (71) Board Member & Independent Chair Portfolios Overseen: 70 | | Retired Mutual Fund Senior Executive (44 years); Management Consultant; Director, Mutual Fund Directors Forum (since 2014); Independent Directors Council (organization of 2,800 Independent Mutual Fund Directors)-Executive Committee, Chair of Policy Steering Committee, Governing Council. | | None. |
Visit our website at www.prudentialfunds.com
| | | | |
| Independent Board Members(1) |
| | | |
Name, Address, Age Position(s) Portfolios Overseen | | Principal Occupation(s) During Past Five Years | | Other Directorships Held |
Robin B. Smith (75) Board Member Portfolios Overseen:70 | | Chairman of the Board (since January 2003) of Publishers Clearing House (direct marketing); Member of the Board of Directors of ADLPartner (marketing) (since December 2010); formerly Chairman and Chief Executive Officer (August 1996-January 2003) of Publishers Clearing House. | | Formerly Director of BellSouth Corporation (telecommunications) (1992-2006). |
Stephen G. Stoneburn (71) Board Member Portfolios Overseen: 70 | | Chairman, (since July 2011), President and Chief Executive Officer (since June 1996) of Quadrant Media Corp. (publishing company); formerly President (June 1995-June 1996) of Argus Integrated Media, Inc.; Senior Vice President and Managing Director (January 1993-1995) of Cowles Business Media; Senior Vice President of Fairchild Publications, Inc. (1975-1989). | | None. |
| | | | |
| Interested Board Members(1) |
| | | |
Name, Address, Age Position(s) Portfolios Overseen | | Principal Occupation(s) During Past Five Years | | Other Directorships Held |
Stuart S. Parker (52) Board Member & President Portfolios Overseen: 64 | | President of Prudential Investments LLC (since January 2012); Executive Vice President of Prudential Investment Management Services LLC (since December 2012); Executive Vice President of Jennison Associates LLC and Head of Retail Distribution of Prudential Investments LLC (June 2005-December 2011). | | None. |
Scott E. Benjamin (41) Board Member & Vice President Portfolios Overseen: 70 | | Executive Vice President (since June 2009) of Prudential Investments LLC; Executive Vice President (June 2009-June 2012) and Vice President (since June 2012) of Prudential Investment Management Services LLC; Executive Vice President (since September 2009) of AST Investment Services, Inc.; Senior Vice President of Product Development and Marketing, Prudential Investments (since February 2006); Vice President of Product Development and Product Management, Prudential Investments (2003-2006). | | None. |
Prudential Emerging Markets Debt Local Currency Fund
| | | | |
| Interested Board Members(1) |
| | | |
Name, Address, Age Position(s) Portfolios Overseen | | Principal Occupation(s) During Past Five Years | | Other Directorships Held |
Grace C. Torres* (55) Board Member Portfolios Overseen: 65 | | Retired; Formerly Treasurer and Principal Financial and Accounting Officer of the Prudential Investments Funds, Target Funds, Advanced Series Trust, Prudential Variable Contract Accounts and The Prudential Series Fund (1998-June 2014); Assistant Treasurer (March 1999-June 2014) and Senior Vice President (September 1999-June 2014) of Prudential Investments LLC; Assistant Treasurer (May 2003-June 2014) and Vice President (June 2005-June 2014) of AST Investment Services, Inc.; Senior Vice President and Assistant Treasurer (May 2003-June 2014) of Prudential Annuities Advisory Services, Inc. | | None. |
* Note: Prior to her retirement in 2014, Ms. Torres was employed by Prudential Investments LLC. Due to her prior employment, she is considered to be an “interested person” under the 1940 Act. Ms. Torres is a non-management Interested Board Member.
(1) The year that each Board Member joined the Funds’ Board is as follows:
Ellen S. Alberding; 2013; Kevin J. Bannon, 2008; Linda W. Bynoe, 2005; Keith F. Hartstein, 2013; Michael S. Hyland, 2008; Douglas H. McCorkindale, 2003; Stephen P. Munn, 2008; James E. Quinn, 2013; Richard A. Redeker, 2003; Robin B. Smith, 1996; Stephen G. Stoneburn, 1996; Stuart S. Parker, Board Member and President since 2012; Scott E. Benjamin, Board Member since 2010 and Vice President since 2009; Grace C. Torres, 2014.
| | | | |
| Fund Officers(a) |
| | | |
Name, Address and Age Position with Fund | | Principal Occupation(s) During Past Five Years | | Length of Service as Fund Officer |
Raymond A. O’Hara (59) Chief Legal Officer | | Vice President and Corporate Counsel (since July 2010) of Prudential Insurance Company of America (Prudential); Vice President (March 2011-Present) of Pruco Life Insurance Company and Pruco Life Insurance Company of New Jersey; Vice President and Corporate Counsel (March 2011-Present) of Prudential Annuities Life Assurance Corporation; Chief Legal Officer of Prudential Investments LLC (since June 2012); Chief Legal Officer of Prudential Mutual Fund Services LLC (since June 2012) and Corporate Counsel of AST Investment Services, Inc. (since June 2012); formerly Assistant Vice President and Corporate Counsel (September 2008-July 2010) of The Hartford Financial Services Group, Inc.; formerly Associate (September 1980-December 1987) and Partner (January 1988–August 2008) of Blazzard & Hasenauer, P.C. (formerly, Blazzard, Grodd & Hasenauer, P.C.). | | Since 2012 |
Visit our website at www.prudentialfunds.com
| | | | |
| Fund Officers(a) |
| | | |
Name, Address and Age Position with Fund | | Principal Occupation(s) During Past Five Years | | Length of Service as Fund Officer |
Chad A. Earnst (39) Chief Compliance Officer | | Chief Compliance Officer (September 2014-Present) of Prudential Investments LLC; Chief Compliance Officer (September 2014-Present) of the Prudential Investments Funds, Target Funds, Advanced Series Trust, The Prudential Series Fund, Prudential’s Gibraltar Fund, Inc., Prudential Global Short Duration High Yield Income Fund, Inc., Prudential Short Duration High Yield Fund, Inc. and Prudential Jennison MLP Income Fund, Inc.; formerly Assistant Director (March 2010-August 2014) of the Asset Management Unit, Division of Enforcement, US Securities & Exchange Commission; Assistant Regional Director (January 2010-August 2014), Branch Chief (June 2006–December 2009) and Senior Counsel (April 2003-May 2006) of the Miami Regional Office, Division of Enforcement, US Securities & Exchange Commission. | | Since 2014 |
Deborah A. Docs (56) Secretary | | Vice President and Corporate Counsel (since January 2001) of Prudential; Vice President (since December 1996) and Assistant Secretary (since March 1999) of Prudential Investments LLC; formerly Vice President and Assistant Secretary (May 2003-June 2005) of AST Investment Services, Inc. | | Since 2004 |
Jonathan D. Shain (56) Assistant Secretary | | Vice President and Corporate Counsel (since August 1998) of Prudential; Vice President and Assistant Secretary (since May 2001) of Prudential Investments LLC; Vice President and Assistant Secretary (since February 2001) of Prudential Mutual Fund Services LLC; formerly Vice President and Assistant Secretary (May 2003-June 2005) of AST Investment Services, Inc. | | Since 2005 |
Claudia DiGiacomo (40) Assistant Secretary | | Vice President and Corporate Counsel (since January 2005) of Prudential; Vice President and Assistant Secretary of Prudential Investments LLC (since December 2005); Associate at Sidley Austin Brown & Wood LLP (1999-2004). | | Since 2005 |
Andrew R. French (52) Assistant Secretary | | Vice President and Corporate Counsel (since February 2010) of Prudential; formerly Director and Corporate Counsel (2006-2010) of Prudential; Vice President and Assistant Secretary (since January 2007) of Prudential Investments LLC; Vice President and Assistant Secretary (since January 2007) of Prudential Mutual Fund Services LLC. | | Since 2006 |
Amanda S. Ryan (36) Assistant Secretary | | Director and Corporate Counsel (since March 2012) of Prudential; Director and Assistant Secretary (since June 2012) of Prudential Investments LLC; Associate at Ropes & Gray LLP (2008-2012). | | Since 2012 |
Theresa C. Thompson (52) Deputy Chief Compliance Officer | | Vice President, Compliance, Prudential Investments LLC (since April 2004); and Director, Compliance, Prudential Investments LLC (2001-2004). | | Since 2008 |
Prudential Emerging Markets Debt Local Currency Fund
| | | | |
| Fund Officers(a) |
| | | |
Name, Address and Age Position with Fund | | Principal Occupation(s) During Past Five Years | | Length of Service as Fund Officer |
Richard W. Kinville (46) Anti-Money Laundering Compliance Officer | | Vice President, Corporate Compliance, Anti-Money Laundering Unit (since January 2005) of Prudential; committee member of the American Council of Life Insurers Anti-Money Laundering and Critical Infrastructure Committee (since January 2007); formerly Investigator and Supervisor in the Special Investigations Unit for the New York Central Mutual Fire Insurance Company (August 1994-January 1999); Investigator in AXA Financial’s Internal Audit Department and Manager in AXA’s Anti-Money Laundering Office (January 1999-January 2005); first chair of the American Council of Life Insurers Anti-Money Laundering and Critical Infrastructure Committee (June 2007-December 2009). | | Since 2011 |
M. Sadiq Peshimam (50) Treasurer and Principal Financial and Accounting Officer | | Assistant Treasurer of funds in the Prudential Mutual Fund Complex (2006-2014); Vice President (since 2005) of Prudential Investments LLC. | | Since 2006 |
Peter Parrella (56) Assistant Treasurer | | Vice President (since 2007) and Director (2004-2007) within Prudential Mutual Fund Administration; formerly Tax Manager at SSB Citi Fund Management LLC (1997-2004). | | Since 2007 |
Lana Lomuti (47) Assistant Treasurer | | Vice President (since 2007) and Director (2005-2007), within Prudential Mutual Fund Administration; formerly Assistant Treasurer (December 2007-February 2014) of The Greater China Fund, Inc. | | Since 2014 |
Linda McMullin (53) Assistant Treasurer | | Vice President (since 2011) and Director (2008-2011) within Prudential Mutual Fund Administration. | | Since 2014 |
| (a) | Excludes Mr. Parker and Mr. Benjamin, interested Board Members who also serve as President and Vice President, respectively. |
Explanatory Notes to Tables:
| n | Board Members are deemed to be “Interested,” as defined in the 1940 Act, by reason of their affiliation with Prudential Investments LLC and/or an affiliate of Prudential Investments LLC. |
| n | Unless otherwise noted, the address of all Board Members and Officers is c/o Prudential Investments LLC, Gateway Center Three, 100 Mulberry Street, Newark, New Jersey 07102-4077. |
| n | There is no set term of office for Board Members or Officers. The Board Members have adopted a retirement policy, which calls for the retirement of Board Members on December 31 of the year in which they reach the age of 75. |
| n | “Other Directorships Held” includes only directorships of companies required to register or file reports with the SEC under the 1934 Act (that is, “public companies”) or other investment companies registered under the 1940 Act. |
| n | “Portfolios Overseen” includes all investment companies managed by Prudential Investments LLC. The investment companies for which Prudential Investments LLC serves as manager include the Prudential Investments Mutual Funds, The Prudential Variable Contract Accounts, Target Mutual Funds, Prudential Short Duration High Yield Fund, Inc., Prudential Global Short Duration High Yield Fund, Inc., The Prudential Series Fund, Prudential’s Gibraltar Fund, Inc. and the Advanced Series Trust. |
Visit our website at www.prudentialfunds.com
Approval of Advisory Agreements
The Fund’s Board of Directors
The Board of Directors (the “Board”) of Prudential Emerging Markets Debt Local Currency Fund (the “Fund”)1 consists of thirteen individuals, eleven of whom are not “interested persons” of the Fund, as defined in the Investment Company Act of 1940, as amended (the “1940 Act”) (the “Independent Directors”). The Board is responsible for the oversight of the Fund and its operations, and performs the various duties imposed on the directors of investment companies by the 1940 Act. The Independent Directors have retained independent legal counsel to assist them in connection with their duties. The Chair of the Board is an Independent Director. The Board has established three standing committees: the Audit Committee, the Nominating and Governance Committee, and the Investment Committee. Each committee is chaired by, and composed of, Independent Directors.
Annual Approval of the Fund’s Advisory Agreements
As required under the 1940 Act, the Board determines annually whether to renew the Fund’s management agreement with Prudential Investments LLC (“PI”) and the Fund’s subadvisory agreement with Prudential Investment Management, Inc. (“PIM”). In considering the renewal of the agreements, the Board, including all of the Independent Directors, met on June 9-11, 2014 and approved the renewal of the agreements through July 31, 2015, after concluding that the renewal of the agreements was in the best interests of the Fund and its shareholders.2
In advance of the meetings, the Board requested and received materials relating to the agreements, and had the opportunity to ask questions and request further information in connection with its consideration. Among other things, the Board considered comparative fee information from PI and PIM. Also, the Board considered comparisons with other mutual funds in relevant Peer Universes and Peer Groups, as is further discussed below.
In approving the agreements, the Board, including the Independent Directors advised by independent legal counsel, considered the factors it deemed relevant, including the nature, quality and extent of services provided by PI and the subadviser, the performance of the Fund, the profitability of PI and its affiliates, expenses and fees, and the potential for economies of scale that may be shared with the Fund and its shareholders as the Fund’s assets grow. In their deliberations, the Directors did not identify any single factor which alone was responsible for the Board’s decision to
| 1 | Prudential Emerging Markets Debt Local Currency Fund is a series of Prudential World Fund, Inc. |
| 2 | Grace C. Torres was elected to the Board as of December 2014, and therefore did not participate in the consideration of these approvals. |
Prudential Emerging Markets Debt Local Currency Fund
Approval of Advisory Agreements (continued)
approve the agreements with respect to the Fund. In connection with its deliberations, the Board considered information provided by PI throughout the year at regular Board meetings, presentations from portfolio managers and other information, as well as information furnished at or in advance of the meetings on June 9-11, 2014.
The Directors determined that the overall arrangements between the Fund and PI, which serves as the Fund’s investment manager pursuant to a management agreement, and between PI and PIM, which serves as the Fund’s subadviser pursuant to the terms of a subadvisory agreement with PI, are in the best interests of the Fund and its shareholders in light of the services performed, fees charged and such other matters as the Directors considered relevant in the exercise of their business judgment.
The material factors and conclusions that formed the basis for the Directors’ reaching their determinations to approve the continuance of the agreements are separately discussed below.
Nature, quality and extent of services
The Board received and considered information regarding the nature, quality and extent of services provided to the Fund by PI and PIM. The Board considered the services provided by PI, including but not limited to the oversight of the subadviser for the Fund, as well as the provision of fund recordkeeping, compliance, and other services to the Fund. With respect to PI’s oversight of the subadviser, the Board noted that PI’s Strategic Investment Research Group (“SIRG”), which is a business unit of PI, is responsible for monitoring and reporting to PI’s senior management on the performance and operations of the subadviser. The Board also considered that PI pays the salaries of all of the officers and non-independent Directors of the Fund. The Board also considered the investment subadvisory services provided by PIM, including investment research and security selection, as well as adherence to the Fund’s investment restrictions and compliance with applicable Fund policies and procedures. The Board considered PI’s evaluation of the subadviser, as well as PI’s recommendation, based on its review of the subadviser, to renew the subadvisory agreement.
The Board considered the qualifications, backgrounds and responsibilities of PI’s senior management responsible for the oversight of the Fund and PIM, and also considered the qualifications, backgrounds and responsibilities of PIM’s portfolio managers who are responsible for the day-to-day management of the Fund’s portfolio. The Board was provided with information pertaining to PI’s and PIM’s organizational structure, senior management, investment operations, and other relevant information pertaining to both PI and PIM. The Board also noted that it received favorable
Visit our website at www.prudentialfunds.com
compliance reports from the Fund’s Chief Compliance Officer (“CCO”) as to both PI and PIM. The Board noted that PIM is affiliated with PI.
The Board concluded that it was satisfied with the nature, extent and quality of the investment management services provided by PI and the subadvisory services provided to the Fund by PIM, and that there was a reasonable basis on which to conclude that the Fund benefits from the services provided by PI and PIM under the management and subadvisory agreements.
Costs of Services and Profits Realized by PI
The Board was provided with information on the profitability of PI and its affiliates in serving as the Fund’s investment manager. The Board discussed with PI the methodology utilized in assembling the information regarding profitability and considered its reasonableness. The Board recognized that it is difficult to make comparisons of profitability from fund management contracts because comparative information is not generally publicly available and is affected by numerous factors, including the structure of the particular adviser, the types of funds it manages, its business mix, numerous assumptions regarding allocations and the adviser’s capital structure and cost of capital. However, the Board considered that the cost of services provided by PI for the year ended December 31, 2013 exceeded the management fees received by PI, resulting in an operating loss to PI. The Board separately considered information regarding the profitability of the subadviser, an affiliate of PI. Taking these factors into account, the Board concluded that the profitability of PI and its affiliates in relation to the services rendered was not unreasonable.
Economies of Scale
In 2013, PI and the Board retained an outside business consulting firm, in order to assist the Board in its consideration of the renewal of the management and subadvisory agreements, by reviewing management fee breakpoint usage and trends in management fees across the mutual fund industry. The consulting firm’s analysis and conclusions with respect to the Funds’ management fee structures were presented to the Board and PI at the December 3-5, 2013 meeting, and were discussed extensively by the Board and PI over the following two quarters.
The Board noted that the management fee schedule for the Fund does not contain breakpoints that would reduce the fee rate on assets above specified levels. The Board received and discussed information concerning whether PI realizes economies of scale as the Fund’s assets grow beyond current levels. The Board recognized the inherent limitations of any analysis of economies of scale, stemming largely from the Board’s understanding that most of PI’s costs are not specific to any individual funds, but rather are incurred across a variety of products and services.
Prudential Emerging Markets Debt Local Currency Fund
Approval of Advisory Agreements (continued)
In light of the Fund’s current size, performance and expense structure, the Board concluded that the absence of breakpoints in the Fund’s fee schedule is acceptable at this time.
Other Benefits to PI and PIM
The Board considered potential ancillary benefits that might be received by PI and PIM and their affiliates as a result of their relationship with the Fund. The Board concluded that potential benefits to be derived by PI included fees received by affiliates of PI for serving as the Fund’s securities lending agent, transfer agency fees received by the Fund’s transfer agent (which is affiliated with PI), as well as benefits to its reputation or other intangible benefits resulting from PI’s association with the Fund. The Board concluded that the potential benefits to be derived by PIM included the ability to use soft dollar credits, as well as the potential benefits consistent with those generally resulting from an increase in assets under management, specifically, potential access to additional research resources and benefits to its reputation. The Board concluded that the benefits derived by PI and PIM were consistent with the types of benefits generally derived by investment managers and subadvisers to mutual funds.
Performance of the Fund / Fees and Expenses
The Board considered certain additional specific factors and made related conclusions relating to the historical performance of the Fund for the one-year period ended December 31, 2013. The Board considered that the Fund commenced operations on March 30, 2011 and that longer-term performance was not yet available.
The Board also considered the Fund’s actual management fee, as well as the Fund’s net total expense ratio, for the fiscal year ended October 31, 2013. The Board considered the management fee for the Fund as compared to the management fee charged by PI to other funds and the fee charged by other advisers to comparable mutual funds in a Peer Group. The actual management fee represents the fee rate actually paid by Fund shareholders and includes any fee waivers or reimbursements. The net total expense ratio for the Fund represents the actual expense ratio incurred by Fund shareholders.
The mutual funds included in the Peer Universe (the Lipper Emerging Markets Debt Local Currency Funds Performance Universe) and the Peer Group were objectively determined by Lipper Inc. (“Lipper”), an independent provider of mutual fund data. The comparisons placed the Fund in various quartiles, with the first quartile being the best 25% of the mutual funds (for performance, the best performing mutual funds and, for expenses, the lowest cost mutual funds).
Visit our website at www.prudentialfunds.com
The section below summarizes key factors considered by the Board and the Board’s conclusions regarding the Fund’s performance, fees and overall expenses. The table sets forth gross performance comparisons (which do not reflect the impact on performance of fund expenses, or any subsidies, expense caps or waivers that may be applicable) with the Peer Universe, actual management fees with the Peer Group (which reflect the impact of any subsidies or fee waivers), and net total expenses with the Peer Group, each of which were key factors considered by the Board.
| | | | | | | | |
| Performance | | 1 Year | | 3 Years | | 5 Years | | 10 Years |
| | | 4th Quartile | | N/A | | N/A | | N/A |
| Actual Management Fees: 2nd Quartile |
| Net Total Expenses: 4th Quartile |
| | • | | The Board noted that the Fund underperformed its benchmark index for the one-year period. |
| | • | | The Board noted information provided by PI indicating that the Fund ranked in the first quartile of its Peer Universe for the first quarter of 2014. |
| | • | | The Board also noted information provided by PI which indicated that, although the Fund’s net total expenses were in the fourth quartile, the Fund’s net total expenses were only 6 basis points higher than the median of all funds in the Peer Group. |
| | • | | The Board and PI agreed to continue the existing expense cap of 1.05% (exclusive of 12b-1 fees and certain other fees) through February 28, 2015. |
| | • | | The Board concluded that, in light of the Fund’s recent inception date, it would be in the best interests of the Fund and its shareholders to renew the agreements to allow the subadviser time to develop a performance record against which performance could be evaluated. |
| | • | | The Board concluded that the management fees (including subadvisory fees) and total expenses were reasonable in light of the services provided. |
* * *
After full consideration of these factors, the Board concluded that the approval of the agreements was in the best interests of the Fund and its shareholders.
Prudential Emerging Markets Debt Local Currency Fund
| | | | |
| n MAIL | | n TELEPHONE | | n WEBSITE |
Gateway Center Three 100 Mulberry Street Newark, NJ 07102 | | (800) 225-1852 | | www.prudentialfunds.com |
|
| PROXY VOTING |
| The Board of Directors of the Fund has delegated to the Fund’s investment subadviser the responsibility for voting any proxies and maintaining proxy recordkeeping with respect to the Fund. A description of these proxy voting policies and procedures is available without charge, upon request, by calling (800) 225-1852 or by visiting the Securities and Exchange Commission’s website at www.sec.gov. Information regarding how the Fund voted proxies relating to portfolio securities during the most recent 12-month period ended June 30 is available on the Fund’s website and on the Securities and Exchange Commission’s website. |
|
| DIRECTORS |
| Ellen S. Alberding • Kevin J. Bannon • Scott E. Benjamin • Linda W. Bynoe • Keith F. Hartstein • Michael S. Hyland • Douglas H. McCorkindale • Stephen P. Munn • Stuart S. Parker • James E. Quinn • Richard A. Redeker • Robin B. Smith • Stephen G. Stoneburn • Grace C. Torres |
|
| OFFICERS |
| Stuart S. Parker, President • Scott E. Benjamin, Vice President • M. Sadiq Peshimam, Treasurer and Principal Financial and Accounting Officer • Raymond A. O’Hara, Chief Legal Officer • Deborah A. Docs, Secretary • Chad A. Earnst, Chief Compliance Officer • Theresa C. Thompson, Deputy Chief Compliance Officer • Richard W. Kinville, Anti-Money Laundering Compliance Officer • Jonathan D. Shain, Assistant Secretary • Claudia DiGiacomo, Assistant Secretary • Amanda S. Ryan, Assistant Secretary • Andrew R. French, Assistant Secretary • Peter Parrella, Assistant Treasurer • Lana Lomuti, Assistant Treasurer • Linda McMullin, Assistant Treasurer |
| | | | |
| MANAGER | | Prudential Investments LLC | | Gateway Center Three
100 Mulberry Street
Newark, NJ 07102 |
|
| INVESTMENT SUBADVISER | | Prudential Investment
Management, Inc. | | Gateway Center Two
100 Mulberry Street
Newark, NJ 07102 |
|
| DISTRIBUTOR | | Prudential Investment
Management Services LLC | | Gateway Center Three
100 Mulberry Street
Newark, NJ 07102 |
|
| CUSTODIAN | | The Bank of New York Mellon | | One Wall Street
New York, NY 10286 |
|
| TRANSFER AGENT | | Prudential Mutual Fund
Services LLC | | PO Box 9658
Providence, RI 02940 |
|
| INDEPENDENT REGISTERED PUBLIC ACCOUNTING FIRM | | KPMG LLP | | 345 Park Avenue
New York, NY 10154 |
|
| FUND COUNSEL | | Willkie Farr & Gallagher LLP | | 787 Seventh Avenue
New York, NY 10019 |
|
| An investor should consider the investment objectives, risks, charges, and expenses of the Fund carefully before investing. The prospectus and summary prospectus contain this and other information about the Fund. An investor may obtain a prospectus and summary prospectus by visiting our website at www.prudentialfunds.com or by calling (800) 225-1852. The prospectus and summary prospectus should be read carefully before investing. |
|
| E-DELIVERY |
| To receive your mutual fund documents online, go to www.prudentialfunds.com/edelivery and enroll. Instead of receiving printed documents by mail, you will receive notification via email when new materials are available. You can cancel your enrollment or change your email address at any time by visiting the website address above. |
|
| SHAREHOLDER COMMUNICATIONS WITH DIRECTORS |
| Shareholders can communicate directly with the Board of Directors by writing to the Chair of the Board, Prudential Emerging Markets Debt Local Currency Fund, Prudential Investments, Attn: Board of Directors, 100 Mulberry Street, Gateway Center Three, Newark, NJ 07102. Shareholders can communicate directly with an individual Director by writing to the same address. Communications are not screened before being delivered to the addressee. |
|
| AVAILABILITY OF PORTFOLIO SCHEDULE |
| The Fund files its complete schedule of portfolio holdings with the Securities and Exchange Commission for the first and third quarters of each fiscal year on Form N-Q. The Fund’s Forms N-Q are available on the Commission’s website at www.sec.gov. The Fund’s Forms N-Q may also be reviewed and copied at the Commission’s Public Reference Room in Washington, D.C. Information on the operation and location of the Public Reference Room may be obtained by calling 1-800-SEC-0330. The Fund’s schedule of portfolio holdings is also available on the Fund’s website as of the end of each month. |
|
| The Fund’s Statement of Additional Information contains additional information about the Fund’s Directors and is available without charge, upon request, by calling (800) 225-1852. |
Mutual Funds:
| | | | |
| ARE NOT INSURED BY THE FDIC OR ANY FEDERAL GOVERNMENT AGENCY | | MAY LOSE VALUE | | ARE NOT A DEPOSIT OF OR GUARANTEED BY ANY BANK OR ANY BANK AFFILIATE |

PRUDENTIAL EMERGING MARKETS DEBT LOCAL CURRENCY FUND
| | | | | | | | |
| SHARE CLASS | | A | | C | | Q | | Z |
| NASDAQ | | EMDAX | | EMDCX | | EMDQX | | EMDZX |
| CUSIP | | 743969750 | | 743969743 | | 743969735 | | 743969727 |
MF212E 0270916-00001-00

PRUDENTIAL INVESTMENTS»MUTUAL FUNDS
PRUDENTIAL JENNISON GLOBAL OPPORTUNITIES FUND
ANNUAL REPORT · OCTOBER 31, 2014
Fund Type
Global Stock
Objective
To seek long-term growth of capital
This report is not authorized for distribution to prospective investors unless preceded or accompanied by a current prospectus.
The views expressed in this report and information about the Fund’s portfolio holdings are for the period covered by this report and are subject to change thereafter.
Mutual funds are distributed by Prudential Investment Management Services LLC (PIMS). Jennison Associates is a registered investment adviser. Both are Prudential Financial companies. © 2014 Prudential Financial, Inc. and its related entities. Prudential Investments LLC, Prudential, Jennison Associates, Jennison, the Prudential logo, Bring Your Challenges, and the Rock symbol are service marks of Prudential Financial, Inc. and its related entities, registered in many jurisdictions worldwide.

December 15, 2014
Dear Shareholder:
We hope you find the annual report for the Prudential Jennison Global Opportunities Fund informative and useful. The report covers performance for the 12-month period that ended October 31, 2014.
Since market conditions change over time, we believe it is important to maintain a diversified portfolio of funds consistent with your tolerance for risk, time horizon, and financial goals.
Your financial advisor can help you create a diversified investment plan that may include funds covering all the basic asset classes and that reflects your personal investor profile and risk tolerance. Keep in mind, however, that diversification and asset allocation strategies do not assure a profit or protect against loss in declining markets.
Prudential Investments® is dedicated to helping you solve your toughest investment challenges—whether it’s capital growth, reliable income, or protection from market volatility and other risks. We offer the expertise of Prudential Financial’s affiliated asset managers* that strive to be leaders in a broad range of funds to help you stay on course to the future you envision. They also manage money for major corporations and pension funds around the world, which means you benefit from the same expertise, innovation, and attention to risk demanded by today’s most sophisticated investors.
Thank you for choosing the Prudential Investments family of funds.
Sincerely,

Stuart S. Parker, President
Prudential Jennison Global Opportunities Fund
*Most of Prudential Investments’ equity funds are advised by Jennison Associates LLC, Quantitative Management Associates LLC (QMA), or Prudential Real Estate Investors. Prudential Investments’ fixed income and money market funds are advised by Prudential Investment Management, Inc. (PIM) through its Prudential Fixed Income unit. Jennison Associates LLC, QMA, and PIM are registered investment advisers and Prudential Financial companies. Prudential Real Estate Investors is a unit of PIM.
| | | | |
| Prudential Jennison Global Opportunities Fund | | | 1 | |
Your Fund’s Performance (Unaudited)
Performance data quoted represent past performance. Past performance does not guarantee future results. The investment return and principal value of an investment will fluctuate, so that an investor’s shares, when redeemed, may be worth more or less than their original cost. Current performance may be lower or higher than the past performance data quoted. An investor may obtain performance data as of the most recent month-end by visiting our website at www.prudentialfunds.com or by calling (800) 225-1852.
| | | | | | | | | | |
Cumulative Total Returns (Without Sales Charges) as of 10/31/14 |
| | | | | | | One Year | | | Since Inception |
Class A | | | | | | | 8.81 | % | | 40.80% (3/14/12) |
Class C | | | | | | | 7.99 | | | 37.90 (3/14/12) |
Class Z | | | | | | | 9.08 | | | 41.70 (3/14/12) |
MSCI AC World ND Index | | | | | | | 7.77 | | | 34.04 |
Lipper Global Multi-Cap Core Funds Average | | | | | | | 6.86 | | | 31.63 |
Lipper Global Multi-Cap Growth Funds Average | | | | | | | 6.70 | | | 32.54 |
| | | | | | | | | | |
Average Annual Total Returns (With Sales Charges) as of 9/30/14 |
| | | | | | | One Year | | | Since Inception |
Class A | | | | | | | 3.12 | % | | 10.47% (3/14/12) |
Class C | | | | | | | 7.26 | | | 12.07 (3/14/12) |
Class Z | | | | | | | 9.32 | | | 13.21 (3/14/12) |
MSCI AC World ND Index | | | | | | | 11.32 | | | 11.71 |
Lipper Global Multi-Cap Core Funds Average | | | | | | | 9.90 | | | 10.88 |
Lipper Global Multi-Cap Growth Funds Average | | | | | | | 8.82 | | | 10.77 |
| | | | | | | | | | |
Average Annual Total Returns (With Sales Charges) as of 10/31/14 |
| | | | | | | One Year | | | Since Inception |
Class A | | | | | | | 2.83 | % | | 11.45% (3/14/12) |
Class C | | | | | | | 6.99 | | | 12.98 (3/14/12) |
Class Z | | | | | | | 9.08 | | | 14.15 (3/14/12) |
| | | | | | | | | | |
Average Annual Total Returns (Without Sales Charges) as of 10/31/14 |
| | | | | | | One Year | | | Since Inception |
Class A | | | | | | | 8.81 | % | | 13.87% (3/14/12) |
Class C | | | | | | | 7.99 | | | 12.98 (3/14/12) |
Class Z | | | | | | | 9.08 | | | 14.15 (3/14/12) |
| | |
| 2 | | Visit our website at www.prudentialfunds.com |
Growth of a $10,000 Investment

The graph compares a $10,000 investment in the Prudential Jennison Global Opportunities Fund (Class A shares) with a similar investment in the MSCI AC World ND Index by portraying the initial account values at the commencement of operations for Class A shares (March 14, 2012) and the account values at the end of the current fiscal year (October 31, 2014), as measured on a quarterly basis. For purposes of the graph, and unless otherwise indicated, it has been assumed that (a) the maximum applicable front-end sales charge was deducted from the initial $10,000 investment in Class A shares; (b) all recurring fees (including management fees) were deducted; and (c) all dividends and distributions were reinvested. The line graph provides information for Class A shares only. As indicated in the tables provided earlier, performance for Class C and Class Z shares will vary due to the differing charges and expenses applicable to each share class (as indicated in the following paragraphs). Without waiver of fees and/or expense reimbursement, if any, the returns would have been lower.
Past performance does not predict future performance. Total returns and the ending account values in the graph include changes in share price and reinvestment of dividends and capital gains distributions in a hypothetical investment for the periods shown. The Fund’s total returns do not reflect the deduction of income taxes on an individual’s investment. Taxes may reduce your actual investment returns on income or gains paid by the Fund or any gains you may realize if you sell your shares.
Source: Prudential Investments LLC and Lipper Inc.
Inception returns are provided for any share class with less than 10 calendar years of returns.
| | | | |
| Prudential Jennison Global Opportunities Fund | | | 3 | |
Your Fund’s Performance (continued)
The returns in the tables do not reflect the deduction of taxes that a shareholder would pay on Fund distributions or following the redemption of Fund shares. The average annual total returns take into account applicable sales charges, which are described for each share class in the table below.
| | | | | | |
| | Class A | | Class C | | Class Z |
Maximum initial sales charge | | 5.50% of
the public
offering
price | | None | | None |
Contingent deferred sales charge (CDSC) (as a percentage of the lower of original purchase price or net asset value at redemption) | | 1% on sales
of $1 million
or more
made within
12 months of
purchase | | 1% on sales
made within
12 months
of purchase | | None |
Annual distribution and service (12b-1) fees (shown as a percentage of average daily net assets) | | .30%
(.25%
currently) | | 1% | | None |
Benchmark Definitions
Morgan Stanley Capital International (MSCI) All Country (AC) World Net Dividend (ND) Index
The MSCI ACWI Index is an unmanaged free float-adjusted market capitalization weighted index that is designed to measure the equity market performance of developed and emerging markets. The MSCI ACWI consists of 46 country indexes comprising 23 developed and 23 emerging market country indexes. The developed market country indexes included are: Australia, Austria, Belgium, Canada, Denmark, Finland, France, Germany, Hong Kong, Ireland, Israel, Italy, Japan, Netherlands, New Zealand, Norway, Portugal, Singapore, Spain, Sweden, Switzerland, the United Kingdom and the United States. The emerging market country indexes included are: Brazil, Chile, China, Colombia, Czech Republic, Egypt, Greece, Hungary, India, Indonesia, Korea, Malaysia, Mexico, Peru, Philippines, Poland, Qatar, Russia, South Africa, Taiwan, Thailand, Turkey, and United Arab Emirates.
Lipper Global Multi-Cap Core Funds Average
The Lipper Global Multi-Cap Core Funds Average (Lipper Average) represents returns based on the average return of all funds in the Lipper Global Multi-Cap Core Funds category for the periods noted. Funds in the Lipper Average are funds that, by portfolio practice, invest in a variety of market capitalization ranges without concentrating 75% of their equity assets in any one market capitalization range over an extended period of time. Global multi-cap core funds typically have average characteristics compared to the MSCI World Index.
Lipper Global Multi-Cap Growth Funds Average
The Lipper Global Multi-Cap Growth Funds Average (Lipper Average) represents returns based on the average return of all funds in the Lipper Global Multi-Cap Core Funds category for the periods noted. Funds in the Lipper Average are funds that, by portfolio practice, invest in a variety of market capitalization ranges without concentrating 75% of their equity assets in any one market capitalization range over an extended period of time. Global multi-cap growth funds typically have above-average characteristics compared to the MSCI World Index.
| | |
| 4 | | Visit our website at www.prudentialfunds.com |
Note: Although the Fund is classified by Lipper in its Global Multi-Cap Core Funds Performance Universe, the Global Multi-Cap Growth Funds Performance Universe was utilized for performance comparisons, because the Fund’s investment manager believes that the Global Multi-Cap Growth Funds Performance Universe provides a more appropriate basis for Fund performance comparisons.
Investors cannot invest directly in an index or average. The returns for the Index would be lower if they included the effects of sales charges, operating expenses of a mutual fund, or taxes. Returns for the Lipper Averages reflect the deduction of operating expenses, but not sales charges or taxes. The Since Inception returns for the Index and the Lipper Averages are measured from the closest month-end to inception date, and not from the Fund’s actual inception date.
| | | | |
Five Largest Holdings expressed as a percentage of net assets as of 10/31/14 | | | | |
Facebook, Inc. (Class A Stock), Internet Software & Services | | | 5.1 | % |
MasterCard, Inc. (Class A Stock), IT Services | | | 4.8 | |
Tencent Holdings Ltd., Internet Software & Services | | | 4.2 | |
Biogen Idec, Inc., Biotechnology | | | 4.0 | |
Bristol-Myers Squibb Co., Pharmaceuticals | | | 3.9 | |
Holdings reflect only long-term investments and are subject to change.
| | | | |
Five Largest Industries expressed as a percentage of net assets as of 10/31/14 | | | | |
Internet Software & Services | | | 21.8 | % |
Biotechnology | | | 17.4 | |
Pharmaceuticals | | | 12.1 | |
Textiles, Apparel & Luxury Goods | | | 11.1 | |
Internet & Catalog Retail | | | 6.9 | |
Industry weightings reflect long-term investments and are subject to change.
| | | | |
| Prudential Jennison Global Opportunities Fund | | | 5 | |
Strategy and Performance Overview
How did the Fund perform?
For the 12-month period ended October 31, 2014, the Prudential Jennison Global Opportunities Fund’s Class A shares advanced 8.81%. Over the same period, the MSCI All Country World Index (the Index) rose 7.77% and the Lipper Global Multi-Cap Growth Average gained 6.70%.
What was the market environment?
| | • | | Global equity market performance varied widely by region1 in the reporting period. The US equity market’s double-digit advance reflected sustained improvement in the US economic outlook. Corporate profits remained strong, housing and employment indicators improved, and consumer confidence rose to post-recession highs. The Federal Reserve tapered its quantitative easing program, signaling confidence in the health of US economic activity and labor market conditions. US gross domestic product (GDP) contracted in early 2014, largely because of severe winter weather, before quickly rebounding. |
| | • | | Economic activity in Europe, already anemic, faced new challenges stemming from Ukraine-Russia tensions. European equity markets dropped slightly over the year. China’s economic expansion moderated as the country was navigating a better balance between fixed investment and consumer-led growth. A number of other key emerging market countries were hurt by a combination of slower growth, fiscal pressures, and weakening currencies. Later in the period, signs of improvement began to emerge in a small but growing number of emerging market countries with stabilizing political, fiscal, and currency situations. Japan’s efforts to stimulate growth and reform aspects of the economy remained a work in progress. |
Which holdings made the largest positive contributions to the Fund’s return?
Healthcare positions were the most significant contributors to the Fund’s returns. Meaningful scientific advances over the past decade coupled with increased research and development and clinical trial activity have led to numerous drug introductions and material improvement in the treatment of serious diseases. Biotech companies held in the Fund benefited from their innovative drugs for:
| | • | | hepatitis C (Gilead Sciences’ Sovaldi), |
| | • | | cancer (Celgene’s Revlimid and Abraxane), |
| 1 | Jennison regional definitions: Developed North America includes countries classified by MSCI as developed markets in North America. Developed Europe includes countries classified by MSCI as developed markets in Europe and the Middle East. Developed Asia/Pacific includes countries classified by MSCI as developed markets in Asia and Australia. Emerging Markets includes all countries classified by MSCI as emerging and frontier markets. |
| | |
| 6 | | Visit our website at www.prudentialfunds.com |
| | • | | multiple sclerosis (Biogen Idec’s Tecfidera), |
| | • | | cystic fibrosis (Vertex Pharmaceuticals’ Kalydeco), and |
| | • | | blood disorders and autoimmune diseases (Alexion Pharmaceuticals’ Soliris). |
Information technology positions were likewise strong contributors to returns, although the Fund’s positions slightly lagged the sector in the Index.
| | • | | Apple’s strong revenue and earnings reflected expanding global acceptance of its platform. Jennison expects that product updates, especially the iPhone 6, will sustain attractive revenue growth in the medium term. |
| | • | | Please see “Comments on Largest Holdings” below for discussion of Facebook and Tencent Holdings. |
Which holdings detracted from the Fund’s return?
Faced with a challenging consumer environment, the Fund’s consumer discretionary holdings lost ground and underperformed the consumer companies in the Index.
| | • | | London-based global online apparel retailer ASOS was hurt by currency-exchange issues and accelerated investment in warehouse operations and new markets, which limited near-term profit margin expansion. |
| | • | | Milan-based Yoox, a leading global luxury fashion e-commerce site, suffered from currency translation and concerns about decelerating growth in luxury goods markets. |
| | • | | Prada’s financial results were compromised as the euro strengthened and currencies of emerging markets—Prada’s greatest source of growth—weakened. Spending on marketing and production pressured near-term margins. |
| | • | | The decline in shares of Galaxy Entertainment Group was related to slowing growth in Macao’s gross gaming revenue. Galaxy owns and operates casinos in Macao, the world’s largest gaming market. The company has been gaining market share in both the mass and VIP markets, and major expansion is expected to fuel growth for several years. |
In information technology:
| | • | | ARM Holdings was hurt as product mix created temporary profit margin pressures. The company licenses its intellectual property designs to semiconductor companies and receives upfront license fees and ongoing royalties based on a percentage of microchip prices. |
| | | | |
| Prudential Jennison Global Opportunities Fund | | | 7 | |
Strategy and Performance Overview (continued)
In energy:
| | • | | Amsterdam-based Core Laboratories, which analyzes petroleum reservoir rock and fluids, fell on concerns that declining energy prices might cause customers to curtail future spending as cash-flow growth slows. |
Were there significant changes to the portfolio?
Over the reporting period, the Fund’s weights increased in healthcare and information technology, and decreased in consumer discretionary. Relative to the Index, the Fund is overweight in information technology, healthcare, and consumer discretionary, and underweight in financials, consumer staples, and energy.
By region, the Fund’s weight increased in North America and decreased in emerging markets. The Fund is overweight in North America, and underweight in Asia/Pacific and emerging markets.
| | |
| 8 | | Visit our website at www.prudentialfunds.com |
Comments on Largest Holdings
| 5.1% | Facebook, Inc., Internet Software & Services |
Internet-based social platform Facebook allows users to share information, post photos and videos, play games, and otherwise connect with one another through online profiles. The company has successfully implemented its mobile interface, and revenue from both mobile and desktop applications has improved. Jennison believes that as Facebook solidifies its dominant position, it continues to increase its appeal to both users and advertisers.
| 4.8% | MasterCard, Inc., IT Services |
MasterCard is the No. 2 payment system in the US. The company markets the MasterCard (credit and debit cards) and Maestro (debit cards) brands, provides a transaction authorization network, establishes guidelines for use, and collects fees from members. Jennison expects continued growth in MasterCard’s gross dollar volume (the total value of its cardholders’ transactions) as consumers continue their ongoing shift from paper money to electronic credit/debit transactions (retailers and banks pay MasterCard each time consumers use MasterCard-branded payment cards).
| 4.2% | Tencent Holdings Ltd., Internet Software & Services |
Tencent Holdings is China’s largest and most visited Internet service portal. The company’s dominant position in China’s online gaming and instant messaging markets and its growing e-commerce efforts have resulted in strong fundamental performance.
| 4.0% | Biogen Idec Inc., Biotechnology |
Jennison believes that ease of use of Biogen Idec’s Tecfidera, an oral multiple sclerosis treatment, could support broad adoption and sustain Biogen’s market leadership. The drug may also have applications in other neurodegenerative diseases such as ALS and Parkinson’s.
| 3.9% | Bristol-Myers Squibb Co., Pharmaceuticals |
Bristol-Myers Squibb has been a leader in the development of oncology active immune therapy, an approach that leverages a patient’s own immune system. Jennison believes immunotherapy could result in more durable responses to cancers and become the backbone of cancer treatment protocols in the next decade. It believes the company will continue to benefit from product momentum, new product launches, pipeline data, and strong business development deals.
| | | | |
| Prudential Jennison Global Opportunities Fund | | | 9 | |
Fees and Expenses (Unaudited)
As a shareholder of the Fund, you incur two types of costs: (1) transaction costs, including sales charges (loads) on purchase payments and redemptions, as applicable, and (2) ongoing costs, including management fees, distribution, and/or service (12b-1) fees, and other Fund expenses, as applicable. This example is intended to help you understand your ongoing costs (in dollars) of investing in the Fund and to compare these costs with the ongoing costs of investing in other mutual funds.
The example is based on an investment of $1,000 invested on May 1, 2014, at the beginning of the period, and held through the six-month period ended October 31, 2014. The example is for illustrative purposes only; you should consult the Prospectus for information on initial and subsequent minimum investment requirements.
Actual Expenses
The first line for each share class in the table on the following page provides information about actual account values and actual expenses. You may use the information on this line, together with the amount you invested, to estimate the expenses that you paid over the period. Simply divide your account value by $1,000 (for example, an $8,600 account value ÷ $1,000 = 8.6), then multiply the result by the number on the first line under the heading “Expenses Paid During the Six-Month Period” to estimate the expenses you paid on your account during this period.
Hypothetical Example for Comparison Purposes
The second line for each share class in the table on the following page provides information about hypothetical account values and hypothetical expenses based on the Fund’s actual expense ratio and an assumed rate of return of 5% per year before expenses, which is not the Fund’s actual return. The hypothetical account values and expenses may not be used to estimate the actual ending account balance or expenses you paid for the period. You may use this information to compare the ongoing costs of investing in the Fund and other funds. To do so, compare this 5% hypothetical example with the 5% hypothetical examples that appear in the shareholder reports of the other funds.
The Fund’s transfer agent may charge additional fees to holders of certain accounts that are not included in the expenses shown in the table on the following page. These fees apply to individual retirement accounts (IRAs) and Section 403(b) accounts. As of the close of the six-month period covered by the table, IRA fees included an annual maintenance fee of $15 per account (subject to a maximum annual maintenance fee of $25 for all accounts held by the same shareholder). Section 403(b) accounts are charged an annual $25 fiduciary maintenance fee. Some of the fees may vary in amount, or may be waived, based on your total account balance or the number of
| | |
| 10 | | Visit our website at www.prudentialfunds.com |
Prudential Investments funds, including the Fund, that you own. You should consider the additional fees that were charged to your Fund account over the six-month period when you estimate the total ongoing expenses paid over the period and the impact of these fees on your ending account value, as these additional expenses are not reflected in the information provided in the expense table. Additional fees have the effect of reducing investment returns.
Please note that the expenses shown in the table are meant to highlight your ongoing costs only and do not reflect any transactional costs such as sales charges (loads). Therefore, the second line for each share class in the table is useful in comparing ongoing costs only and will not help you determine the relative total costs of owning different funds. In addition, if these transactional costs were included, your costs would have been higher.
| | | | | | | | | | | | | | | | | | |
Prudential
Jennison Global
Opportunities Fund | | Beginning Account
Value
May 1, 2014 | | | Ending Account
Value
October 31, 2014 | | | Annualized
Expense Ratio
Based on the
Six-Month Period | | | Expenses Paid
During the
Six-Month Period* | |
| | | | | | | | | | | | | | | | | | |
| Class A | | Actual | | $ | 1,000.00 | | | $ | 1,074.80 | | | | 1.60 | % | | $ | 8.37 | |
| | | Hypothetical | | $ | 1,000.00 | | | $ | 1,017.14 | | | | 1.60 | % | | $ | 8.13 | |
| | | | | | | | | | | | | | | | | | |
| Class C | | Actual | | $ | 1,000.00 | | | $ | 1,070.70 | | | | 2.35 | % | | $ | 12.27 | |
| | | Hypothetical | | $ | 1,000.00 | | | $ | 1,013.36 | | | | 2.35 | % | | $ | 11.93 | |
| | | | | | | | | | | | | | | | | | |
| Class Z | | Actual | | $ | 1,000.00 | | | $ | 1,075.90 | | | | 1.35 | % | | $ | 7.06 | |
| | | Hypothetical | | $ | 1,000.00 | | | $ | 1,018.40 | | | | 1.35 | % | | $ | 6.87 | |
*Fund expenses (net of fee waivers or subsidies, if any) for each share class are equal to the annualized expense ratio for each share class (provided in the table), multiplied by the average account value over the period, multiplied by the 184 days in the six-month period ended October 31, 2014, and divided by the 365 days in the Fund’s fiscal year ended October 31, 2014 (to reflect the six-month period). Expenses presented in the table include the expenses of any underlying portfolios in which the Fund may invest.
| | | | |
| Prudential Jennison Global Opportunities Fund | | | 11 | |
Fees and Expenses (continued)
The Fund’s annualized expense ratios for the year ended October 31, 2014, are as follows:
| | | | | | | | |
| Class | | Gross Operating Expenses | | | Net Operating Expenses | |
A | | | 1.71 | % | | | 1.60 | % |
C | | | 2.41 | | | | 2.35 | |
Z | | | 1.42 | | | | 1.35 | |
Net operating expenses shown above reflect any fee waivers and/or expense reimbursements. Additional information on Fund expenses and any fee waivers and/or expense reimbursements can be found in the “Financial Highlights” tables in this report and in the Notes to the Financial Statements in this report.
| | |
| 12 | | Visit our website at www.prudentialfunds.com |
Portfolio of Investments
as of October 31, 2014
| | | | | | | | |
| Description | | Shares | | | Value (Note 1) | |
LONG-TERM INVESTMENTS 99.1% | | | | | | | | |
| | |
COMMON STOCKS | | | | | | | | |
| | |
Argentina 2.1% | | | | | | | | |
MercadoLibre, Inc. | | | 9,207 | | | $ | 1,253,533 | |
| | |
Canada 3.1% | | | | | | | | |
Canadian Pacific Railway Ltd. | | | 9,103 | | | | 1,890,511 | |
| | |
China 9.3% | | | | | | | | |
Alibaba Group Holding Ltd., ADR* | | | 19,339 | | | | 1,906,825 | |
Tencent Holdings Ltd. | | | 156,783 | | | | 2,519,859 | |
Vipshop Holdings Ltd., ADR* | | | 5,203 | | | | 1,192,996 | |
| | | | | | | | |
| | | | | | | 5,619,680 | |
| | |
Denmark 2.1% | | | | | | | | |
Novo Nordisk A/S (Class B Stock) | | | 27,777 | | | | 1,255,596 | |
| | |
Germany 1.8% | | | | | | | | |
Bayer AG | | | 7,389 | | | | 1,056,787 | |
| | |
Hong Kong 0.9% | | | | | | | | |
Galaxy Entertainment Group Ltd. | | | 78,994 | | | | 540,153 | |
| | |
Italy 4.8% | | | | | | | | |
Azimut Holding SpA | | | 48,824 | | | | 1,142,777 | |
Luxottica Group SpA | | | 17,675 | | | | 901,560 | |
Moncler SpA | | | 61,036 | | | | 847,134 | |
| | | | | | | | |
| | | | | | | 2,891,471 | |
| | |
Japan 2.5% | | | | | | | | |
Murata Manufacturing Co. Ltd. | | | 13,530 | | | | 1,520,238 | |
| | |
South Korea 1.7% | | | | | | | | |
NAVER Corp. | | | 1,484 | | | | 1,050,111 | |
| | |
Spain 3.0% | | | | | | | | |
Inditex SA | | | 63,212 | | | | 1,778,348 | |
| | |
Switzerland 2.0% | | | | | | | | |
Roche Holding AG | | | 4,137 | | | | 1,220,835 | |
| | |
Thailand 1.7% | | | | | | | | |
CP ALL PCL | | | 714,256 | | | | 997,809 | |
See Notes to Financial Statements.
| | | | |
| Prudential Jennison Global Opportunities Fund | | | 13 | |
Portfolio of Investments
as of October 31, 2014 continued
| | | | | | | | |
| Description | | Shares | | | Value (Note 1) | |
COMMON STOCKS (Continued) | | | | | | | | |
| | |
United Kingdom 7.1% | | | | | | | | |
ARM Holdings PLC | | | 75,630 | | | $ | 1,070,717 | |
Ashtead Group PLC | | | 64,591 | | | | 1,082,168 | |
Burberry Group PLC | | | 37,126 | | | | 912,314 | |
St. James’s Place PLC | | | 104,445 | | | | 1,248,874 | |
| | | | | | | | |
| | | | | | | 4,314,073 | |
| | |
United States 57.0% | | | | | | | | |
Actavis PLC* | | | 5,686 | | | | 1,380,220 | |
Alexion Pharmaceuticals, Inc.* | | | 8,013 | | | | 1,533,368 | |
Apple, Inc. | | | 15,651 | | | | 1,690,308 | |
Biogen Idec, Inc.* | | | 7,505 | | | | 2,409,705 | |
Bristol-Myers Squibb Co. | | | 40,444 | | | | 2,353,436 | |
Celgene Corp.* | | | 18,036 | | | | 1,931,475 | |
EOG Resources, Inc. | | | 14,601 | | | | 1,387,825 | |
Facebook, Inc. (Class A Stock)* | | | 41,125 | | | | 3,083,964 | |
Gilead Sciences, Inc.* | | | 19,628 | | | | 2,198,336 | |
Google, Inc. (Class A Stock)* | | | 2,141 | | | | 1,215,810 | |
Google, Inc. (Class C Stock)* | | | 1,866 | | | | 1,043,243 | |
Incyte Corp Ltd.* | | | 22,967 | | | | 1,540,167 | |
LinkedIn Corp. (Class A Stock)* | | | 4,896 | | | | 1,120,988 | |
MasterCard, Inc. (Class A Stock) | | | 34,733 | | | | 2,908,889 | |
Michael Kors Holdings Ltd.* | | | 11,503 | | | | 904,021 | |
Netflix, Inc.* | | | 2,153 | | | | 845,634 | |
NIKE, Inc. (Class B Stock) | | | 16,812 | | | | 1,563,012 | |
Priceline Group, Inc. (The)* | | | 1,273 | | | | 1,535,505 | |
Tesla Motors, Inc.* | | | 2,914 | | | | 704,314 | |
Under Armour, Inc. (Class A Stock)* | | | 24,278 | | | | 1,592,151 | |
Vertex Pharmaceuticals, Inc.* | | | 7,865 | | | | 885,913 | |
Zulily, Inc. (Class A Stock)* | | | 16,228 | | | | 590,375 | |
| | | | | | | | |
| | | | | | | 34,418,659 | |
| | | | | | | | |
TOTAL LONG-TERM INVESTMENTS
(cost $47,781,954) | | | | | | | 59,807,804 | |
| | | | | | | | |
See Notes to Financial Statements.
| | | | | | | | |
| Description | | Shares | | | Value (Note 1) | |
SHORT-TERM INVESTMENT 0.6% | | | | | | | | |
| | |
AFFILIATED MONEY MARKET MUTUAL FUND | | | | | | | | |
Prudential Investment Portfolios 2 - Prudential Core Taxable Money
Market Fund
(cost $371,467) (Note 3)(a) | | | 371,467 | | | $ | 371,467 | |
| | | | | | | | |
TOTAL INVESTMENTS 99.7%
(cost $48,153,421) (Note 5) | | | | | | | 60,179,271 | |
Other assets in excess of liabilities 0.3% | | | | | | | 198,093 | |
| | | | | | | | |
NET ASSETS 100.0% | | | | | | $ | 60,377,364 | |
| | | | | | | | |
The following abbreviation is used in the portfolio descriptions:
ADR—American Depositary Receipt
| * | Non-income producing security. |
| (a) | Prudential Investments LLC, the manager of the Series, also serves as manager of the Prudential Investment Portfolios 2 - Prudential Core Taxable Money Market Fund. |
Various inputs are used in determining the value of the Series’ investments. These inputs are summarized in the three broad levels listed below.
Level 1—quoted prices generally in active markets for identical securities.
Level 2—quoted prices for similar securities, interest rates and yield curves, prepayment speeds, foreign currency exchange rates and other significant observable inputs.
Level 3—significant unobservable inputs for securities valued in accordance with Board approved fair valuation procedures.
The following is a summary of the inputs used as of October 31, 2014 in valuing such portfolio securities:
| | | | | | | | | | | | |
| | | Level 1 | | | Level 2 | | | Level 3 | |
Investments in Securities | | | | | | | | | | | | |
Common Stocks | | | | | | | | | | | | |
Argentina | | $ | 1,253,533 | | | $ | — | | | $ | — | |
Canada | | | 1,890,511 | | | | — | | | | — | |
China | | | 3,099,821 | | | | 2,519,859 | | | | — | |
Denmark | | | — | | | | 1,255,596 | | | | — | |
Germany | | | — | | | | 1,056,787 | | | | — | |
Hong Kong | | | — | | | | 540,153 | | | | — | |
See Notes to Financial Statements.
| | | | |
| Prudential Jennison Global Opportunities Fund | | | 15 | |
Portfolio of Investments
as of October 31, 2014 continued
| | | | | | | | | | | | |
| | | Level 1 | | | Level 2 | | | Level 3 | |
Common Stocks (continued): | | | | | | | | | | | | |
Italy | | $ | — | | | $ | 2,891,471 | | | $ | — | |
Japan | | | — | | | | 1,520,238 | | | | — | |
South Korea | | | — | | | | 1,050,111 | | | | — | |
Spain | | | — | | | | 1,778,348 | | | | — | |
Switzerland | | | — | | | | 1,220,835 | | | | — | |
Thailand | | | — | | | | 997,809 | | | | — | |
United Kingdom | | | — | | | | 4,314,073 | | | | — | |
United States | | | 34,418,659 | | | | — | | | | — | |
Affiliated Money Market Mutual Fund | | | 371,467 | | | | — | | | | — | |
| | | | | | | | | | | | |
Total | | $ | 41,033,991 | | | $ | 19,145,280 | | | $ | — | |
| | | | | | | | | | | | |
The industry classification of investments and other assets in excess of liabilities shown as a percentage of net assets as of October 31, 2014 was as follows (Unaudited):
| | | | |
Internet Software & Services | | | 21.8 | % |
Biotechnology | | | 17.4 | |
Pharmaceuticals | | | 12.1 | |
Textiles, Apparel & Luxury Goods | | | 11.1 | |
Internet & Catalog Retail | | | 6.9 | |
IT Services | | | 4.8 | |
Road & Rail | | | 3.1 | |
Specialty Retail | | | 3.0 | |
Technology Hardware, Storage & Peripherals | | | 2.8 | |
Electronic Equipment & Instruments | | | 2.5 | |
Oil, Gas & Consumable Fuels | | | 2.3 | |
Insurance | | | 2.0 | |
Capital Markets | | | 1.9 | % |
Trading Companies & Distributors | | | 1.8 | |
Semiconductors & Semiconductor Equipment | | | 1.8 | |
Food & Staples Retailing | | | 1.7 | |
Automobiles | | | 1.2 | |
Hotels, Restaurants & Leisure | | | 0.9 | |
Affiliated Money Market Mutual Fund | | | 0.6 | |
| | | | |
| | | 99.7 | |
Other assets in excess of liabilities | | | 0.3 | |
| | | | |
| | | 100.0 | % |
| | | | |
See Notes to Financial Statements.
PRUDENTIAL INVESTMENTS»MUTUAL FUNDS
FINANCIAL STATEMENTS
ANNUAL REPORT · OCTOBER 31, 2014
Prudential Jennison Global Opportunities Fund
Statement of Assets & Liabilities
as of October 31, 2014
| | | | |
Assets | | | | |
Investments at value: | | | | |
Unaffiliated Investments (cost $47,781,954) | | $ | 59,807,804 | |
Affiliated Investments (cost $371,467) | | | 371,467 | |
Foreign currency, at value (cost $4,633) | | | 4,633 | |
Receivable for investments sold | | | 625,600 | |
Dividends receivable | | | 27,401 | |
Receivable for Series shares sold | | | 13,739 | |
Tax reclaim receivable | | | 8,554 | |
Prepaid expenses | | | 818 | |
| | | | |
Total assets | | | 60,860,016 | |
| | | | |
| |
Liabilities | | | | |
Payable for investments purchased | | | 349,388 | |
Accrued expenses | | | 81,628 | |
Management fee payable | | | 37,300 | |
Distribution fee payable | | | 8,772 | |
Payable for Series shares reacquired | | | 4,252 | |
Affiliated transfer agent fee payable | | | 1,312 | |
| | | | |
Total liabilities | | | 482,652 | |
| | | | |
| |
Net Assets | | $ | 60,377,364 | |
| | | | |
| | | | | |
Net assets were comprised of: | | | | |
Common stock, at par | | $ | 42,821 | |
Paid-in capital in excess of par | | | 49,856,969 | |
| | | | |
| | | 49,899,790 | |
Accumulated net investment loss | | | (334,526 | ) |
Accumulated net realized loss on investment and foreign currency transactions | | | (1,212,780 | ) |
Net unrealized appreciation on investments and foreign currencies | | | 12,024,880 | |
| | | | |
Net assets, October 31, 2014 | | $ | 60,377,364 | |
| | | | |
See Notes to Financial Statements.
| | | | |
Class A | | | | |
Net asset value and redemption price per share
($21,150,465 ÷ 1,502,339 shares of common stock issued and outstanding) | | $ | 14.08 | |
Maximum sales charge (5.50% of offering price) | | | 0.82 | |
| | | | |
Maximum offering price to public | | $ | 14.90 | |
| | | | |
| |
Class C | | | | |
Net asset value, offering price and redemption price per share
($5,723,084 ÷ 414,983 shares of common stock issued and outstanding) | | $ | 13.79 | |
| | | | |
| |
Class Z | | | | |
Net asset value, offering price and redemption price per share
($33,503,815 ÷ 2,364,801 shares of common stock issued and outstanding) | | $ | 14.17 | |
| | | | |
See Notes to Financial Statements.
| | | | |
| Prudential Jennison Global Opportunities Fund | | | 19 | |
Statement of Operations
Year Ended October 31, 2014
| | | | |
Net Investment Loss | | | | |
Income | | | | |
Unaffiliated dividend income (net of foreign withholding taxes of $28,037) | | $ | 436,113 | |
Affiliated dividend income | | | 1,881 | |
| | | | |
Total income | | | 437,994 | |
| | | | |
| |
Expenses | | | | |
Management fee | | | 492,096 | |
Distribution fee—Class A | | | 58,056 | |
Distribution fee—Class C | | | 43,607 | |
Custodian’s fees and expenses | | | 96,000 | |
Registration fees | | | 43,000 | |
Transfer agent’s fees and expenses (including affiliated expense of $5,300) | | | 40,000 | |
Audit fee | | | 26,000 | |
Shareholders’ reports | | | 25,000 | |
Legal fees and expenses | | | 16,000 | |
Directors’ fees | | | 15,000 | |
Insurance expenses | | | 1,000 | |
Interest expense | | | 86 | |
Miscellaneous | | | 18,585 | |
| | | | |
Total expenses | | | 874,430 | |
Less: Expense reimbursement | | | (34,590 | ) |
Distribution fee waiver—Class A | | | (9,676 | ) |
| | | | |
Net expenses | | | 830,164 | |
| | | | |
Net investment loss | | | (392,170 | ) |
| | | | |
| |
Realized And Unrealized Gain (Loss) On Investment And Foreign Currency Transactions | | | | |
Net realized gain (loss) on: | | | | |
Investment transactions | | | (360,488 | ) |
Foreign currency transactions | | | 4,121 | |
| | | | |
| | | (356,367 | ) |
| | | | |
Net change in unrealized appreciation (depreciation) on: | | | | |
Investments | | | 4,135,095 | |
Foreign currencies | | | (2,997 | ) |
| | | | |
| | | 4,132,098 | |
| | | | |
Net gain on investment and foreign currency transactions | | | 3,775,731 | |
| | | | |
Net Increase In Net Assets Resulting From Operations | | $ | 3,383,561 | |
| | | | |
See Notes to Financial Statements.
Statement of Changes in Net Assets
| | | | | | | | |
| | | Year Ended October 31, | |
| | | 2014 | | | 2013 | |
Increase (Decrease) In Net Assets | | | | | | | | |
Operations | | | | | | | | |
Net investment loss | | $ | (392,170 | ) | | $ | (84,763 | ) |
Net realized gain (loss) on investment and foreign currency transactions | | | (356,367 | ) | | | 254,103 | |
Net change in unrealized appreciation (depreciation) on investments and foreign currencies | | | 4,132,098 | | | | 6,847,925 | |
| | | | | | | | |
Net increase in net assets resulting from operations | | | 3,383,561 | | | | 7,017,265 | |
| | | | | | | | |
| | |
Series share transactions (Net of share conversions) (Note 6) | | | | | | | | |
Net proceeds from shares sold | | | 32,490,687 | | | | 11,184,673 | |
Cost of shares reacquired | | | (12,408,615 | ) | | | (783,244 | ) |
| | | | | | | | |
Net increase in net assets from Series share transactions | | | 20,082,072 | | | | 10,401,429 | |
| | | | | | | | |
Total increase | | | 23,465,633 | | | | 17,418,694 | |
| | |
Net Assets: | | | | | | | | |
Beginning of year | | | 36,911,731 | | | | 19,493,037 | |
| | | | | | | | |
End of year | | $ | 60,377,364 | | | $ | 36,911,731 | |
| | | | | | | | |
See Notes to Financial Statements.
| | | | |
| Prudential Jennison Global Opportunities Fund | | | 21 | |
Notes to Financial Statements
Prudential World Fund, Inc. (the “Fund”) is an open-end management investment company, registered under the Investment Company Act of 1940, as amended, (“1940 Act”) and currently consists of seven series: Prudential Jennison Global Opportunities Fund (the “Series”), Prudential Jennison Global Infrastructure Fund, Prudential International Equity Fund, Prudential International Value Fund, Prudential Jennison International Opportunities Fund, Prudential Jennison Emerging Markets Equity Fund and Prudential Emerging Markets Debt Local Currency Fund. These financial statements relate to Prudential Jennison Global Opportunities Fund. The financial statements of the other series are not presented herein. The Series commenced investment operations on March 14, 2012. The investment objective of the Series is to seek long-term growth of capital.
Note 1. Accounting Policies
The following accounting policies conform to U.S. generally accepted accounting principles. The Fund and the Series consistently follow such policies in the preparation of their financial statements.
Securities Valuation: The Series holds securities and other assets that are fair valued at the close of each day the New York Stock Exchange (“NYSE”) is open for trading. Fair value is the price that would be received to sell an asset or paid to transfer a liability in an orderly transaction between market participants on the measurement date. The Board of Directors (the “Board”) has adopted Valuation Procedures for security valuation under which fair valuation responsibilities have been delegated to Prudential Investments LLC (“PI” or “Manager”). Under the current Valuation Procedures, the established Valuation Committee is responsible for supervising the valuation of portfolio securities and other assets. The Valuation Procedures permit the Series to utilize independent pricing vendor services, quotations from market makers, and alternative valuation methods when market quotations are either not readily available or not deemed representative of fair value. A record of the Valuation Committee’s actions is subject to the Board’s review, approval, and ratification at its next regularly-scheduled quarterly meeting.
Various inputs determine how the Series’ investments are valued, all of which are categorized according to the three broad levels (Level 1, 2, or 3) detailed in the table following the Portfolio of Investments.
Common and preferred stocks, exchange-traded funds, and derivative instruments such as futures or options that are traded on a national securities exchange are valued at the last sale price as of the close of trading on the applicable exchange. Securities traded via NASDAQ are valued at the NASDAQ official closing price. To the extent these securities are valued at the last sale price or NASDAQ official closing price, they are classified as Level 1 in the fair value hierarchy.
In the event that no sale or official closing price on valuation date exists, these securities are generally valued at the mean between the last reported bid and asked prices, or at the last bid price in the absence of an asked price. These securities are classified as Level 2 in the fair value hierarchy, as the inputs are observable and considered to be significant to the valuation.
Common and preferred stocks traded on foreign securities exchanges are valued using pricing vendor services that provide model prices derived using adjustment factors based on information such as local closing price, relevant general and sector indices, currency fluctuations, depositary receipts, and futures, as applicable. Securities valued using such model prices are classified as Level 2 in the fair value hierarchy, as the adjustment factors are observable and considered to be significant to the valuation. Securities not valued using such model prices are valued in accordance with exchange-traded common and preferred stocks discussed above.
Investments in open-end, non-exchange-traded mutual funds are valued at their net asset values as of the close of the NYSE on the date of valuation. These securities are classified as Level 1 in the fair value hierarchy since they may be purchased or sold at their net asset values on the date of valuation.
Fixed income securities traded in the over-the-counter market are generally valued at prices provided by approved independent pricing vendors. The pricing vendors provide these prices after evaluating observable inputs including, but not limited to yield curves, yield spreads, credit ratings, deal terms, tranche level attributes, default rates, cash flows, prepayment speeds, broker/dealer quotations, and reported trades. Securities valued using such vendor prices are classified as Level 2 in the fair value hierarchy.
Over-the-counter derivative instruments are generally valued using pricing vendor services, which derive the valuation based on inputs such as underlying asset prices, indices, spreads, interest rates, and exchange rates. These instruments are categorized as Level 2 in the fair value hierarchy.
| | | | |
| Prudential Jennison Global Opportunities Fund | | | 23 | |
Notes to Financial Statements
continued
Centrally cleared swaps listed or traded on a multilateral or trade facility platform, such as a registered exchange, are valued at the daily settlement price determined by the respective exchange. These securities are classified as Level 2 in the fair value hierarchy, as the prices marked at the official settle are not public.
Securities and other assets that cannot be priced according to the methods described above are valued based on pricing methodologies approved by the Board. In the event that significant unobservable inputs are used when determining such valuations, the securities will be classified as Level 3 in the fair value hierarchy.
When determining the fair value of securities, some of the factors influencing the valuation include: the nature of any restrictions on disposition of the securities; assessment of the general liquidity of the securities; the issuer’s financial condition and the markets in which it does business; the cost of the investment; the size of the holding and the capitalization of the issuer; the prices of any recent transactions or bids/offers for such securities or any comparable securities; any available analyst media or other reports or information deemed reliable by the investment adviser regarding the issuer or the markets or industry in which it operates. Using fair value to price securities may result in a value that is different from a security’s most recent closing price and from the price used by other mutual funds to calculate their net asset values.
Foreign Currency Translation: The books and records of the Series are maintained in U.S. dollars. Foreign currency amounts are translated into U.S. dollars on the following basis:
(i) market value of investment securities, other assets and liabilities—at the current rates of exchange.
(ii) purchases and sales of investment securities, income and expenses—at the rates of exchange prevailing on the respective dates of such transactions.
Although the net assets of the Series are presented at the foreign exchange rates and market values at the close of the period, the Series does not isolate that portion of the results of operations arising as a result of changes in the foreign exchange rates from the fluctuations arising from changes in the market prices of long-term portfolio securities held at the end of the period. Similarly, the Series does not isolate the effect of changes in foreign exchange rates from the fluctuations arising from changes in the
market prices of long-term portfolio securities sold during the period. Accordingly, these realized foreign currency gains or losses are included in the reported net realized gains or losses on investment transactions.
Net realized gains or losses on foreign currency transactions represent net foreign exchange gains or losses from holdings of foreign currencies, forward currency contracts, disposition of foreign currencies, currency gains or losses realized between the trade and settlement dates on securities transactions, and the difference between the amounts of interest, dividends and foreign withholding taxes recorded on the Series’ books and the U.S. dollar equivalent amounts actually received or paid. Net unrealized currency gains or losses from valuing foreign currency denominated assets and liabilities (other than investments) at period end exchange rates are reflected as a component of net unrealized appreciation (depreciation) on foreign currencies.
Concentration of Risk: Foreign security and currency transactions may involve certain considerations and risks not typically associated with those of domestic origin as a result of, among other factors, the possibility of political and economic instability or the level of governmental supervision and regulation of foreign securities markets.
Securities Transactions and Net Investment Income: Securities transactions are recorded on the trade date. Realized gains or losses from investment and currency transactions are calculated on the identified cost basis. Dividend income is recorded on the ex-dividend date. Interest income, including amortization of premium and accretion of discount on debt securities, as required, is recorded on an accrual basis. Expenses are recorded on an accrual basis, which may require the use of certain estimates by management that may differ from actual.
Net investment income or loss (other than distribution fees which are charged directly to the respective class) and unrealized and realized gains or losses are allocated daily to each class of shares based upon the relative proportion of adjusted net assets of each class at the beginning of the day.
Dividends and Distributions: The Series expects to pay dividends of net investment income and distributions from net realized capital and currency gains, if any, annually. Dividends and distributions to shareholders, which are determined in accordance with federal income tax regulations and which may differ from generally accepted accounting principles, are recorded on the ex-dividend date.
Taxes: For federal income tax purposes, each Series in the Fund is treated as a separate taxpaying entity. It is each Series’ policy to continue to meet the requirements of the Internal Revenue Code applicable to regulated investment
| | | | |
| Prudential Jennison Global Opportunities Fund | | | 25 | |
Notes to Financial Statements
continued
companies and to distribute all of its taxable net income and capital gains, if any, to its shareholders. Therefore, no federal income tax provision is required. Withholding taxes on foreign dividends are recorded, net of reclaimable amounts, at the time the related income is earned.
Estimates: The preparation of the financial statements requires management to make estimates and assumptions that affect the reported amounts and disclosures in the financial statements. Actual results could differ from those estimates.
Note 2. Agreements
The Fund has a management agreement for the Series with PI. Pursuant to this agreement, PI has responsibility for all investment advisory services and supervises the subadvisor’s performance of such services. PI has entered into a subadvisory agreement with Jennison Associates LLC (“Jennison”). The subadvisory agreement provides that Jennison furnishes investment advisory services in connection with the management of the Series. In connection therewith, Jennison is obligated to keep certain books and records of the Series. PI pays for the services of Jennison, the cost of compensation of officers of the Series, occupancy and certain clerical and bookkeeping costs of the Series. The Series bears all other costs and expenses.
The management fee paid to PI is computed daily and payable monthly at an annual rate of .90% of the Series’ average daily net assets. PI has contractually agreed through February 29, 2016 to limit net annual Series operating expenses (excluding distribution and service (12b-1) fees, extraordinary and certain other expenses such as taxes, interest and brokerage commissions) to each class of shares to 1.35% of the Series’ average daily net assets.
The Series has a distribution agreement with Prudential Investment Management Services LLC (“PIMS”), which acts as the distributor of the Class A, Class C and Class Z shares of the Series. The Series compensates PIMS for distributing and servicing the Series’ Class A and Class C shares, pursuant to plans of distribution (the “Class A and C Plans”), regardless of expenses actually incurred by PIMS. The distribution fees are accrued daily and payable monthly. No distribution or service fees are paid to PIMS as distributor of the Class Z shares of the Series.
Pursuant to the Class A and C Plans, the Series compensates PIMS for distribution related activities at an annual rate of up to .30% and 1% of the average daily net
assets of the Class A and C shares, respectively. PIMS has contractually agreed to limit such fees to .25% of the average daily net assets of the Class A shares through February 29, 2016.
PIMS has advised the Series that they received $130,081 in front-end sales charges resulting from sales of Class A shares during the year ended October 31, 2014. From these fees, PIMS paid such sales charges to affiliated broker-dealers, which in turn paid commissions to salespersons and incurred other distribution costs.
PIMS has advised the Series that for the year ended October 31, 2014, it received $5,000 and $1,032 in contingent deferred sales charges imposed upon redemptions by certain Class A and Class C shareholders, respectively.
PI, PIMS and Jennison are indirect, wholly-owned subsidiaries of Prudential Financial, Inc. (“Prudential”).
Note 3. Other Transactions with Affiliates
Prudential Mutual Fund Services LLC (“PMFS”), an affiliate of PI and an indirect, wholly-owned subsidiary of Prudential, serves as the Series’ transfer agent. Transfer agent’s fees and expenses in the Statement of Operations include certain out-of-pocket expenses paid to non-affiliates, where applicable.
The Series invests in the Prudential Core Taxable Money Market Fund (the “Core Fund”), a portfolio of the Prudential Investment Portfolios 2, registered under the 1940 Act and managed by PI. Earnings from the Core Fund are disclosed on the Statement of Operations as affiliated dividend income.
Note 4. Portfolio Securities
Purchases and sales of portfolio securities, other than short-term investments, for the year ended October 31, 2014 were $56,688,739 and $36,323,540, respectively.
Note 5. Distributions and Tax Information
Distributions to shareholders, which are determined in accordance with federal income tax regulations and which may differ from generally accepted accounting principles, are recorded on the ex-dividend date. In order to present accumulated net investment loss, accumulated net realized loss on investment and foreign currency transactions and paid-in capital in excess of par on the Statement of Assets and
| | | | |
| Prudential Jennison Global Opportunities Fund | | | 27 | |
Notes to Financial Statements
continued
Liabilities that more closely represent their tax character, certain adjustments have been made to accumulated net investment loss, accumulated net realized loss on investment and foreign currency transactions and paid-in capital in excess of par. For the year ended October 31, 2014, the adjustments were to decrease accumulated net investment loss by $129,345, decrease accumulated net realized loss on investment and foreign currency transactions by $51,455 and decrease paid-in capital in excess of par by $180,800 due to net operating loss, certain transactions involving foreign currencies and other book to tax differences. Net investment loss, net realized gain (loss) on investment and foreign currency transactions and net assets were not affected by this change.
For the years ended October 31, 2014 and October 31, 2013 there were no distributions paid by the Fund.
As of October 31, 2014, the Fund did not have any distributable earnings on a tax basis.
The United States federal income tax basis of the Series’ investments and the net unrealized appreciation as of October 31, 2014 were as follows:
| | | | | | | | | | |
Tax Basis | | Appreciation | | Depreciation | | Net
Unrealized
Appreciation | | Other Cost
Basis
Adjustments | | Total Net
Unrealized
Appreciation |
| $48,276,208 | | $12,989,087 | | $(1,086,024) | | $11,903,063 | | $(966) | | $11,902,097 |
The difference between book basis and tax basis is primarily attributable to deferred losses on wash sales. The other cost basis adjustments are primarily attributable to appreciation (depreciation) of foreign currencies and mark-to-market of receivables and payables.
For federal income tax purposes, the Series had a capital loss carryforward as of October 31, 2014 of approximately $1,090,000 which can be carried forward for an unlimited period. No capital gains distributions are expected to be paid to shareholders until net gains have been realized in excess of such losses.
The Series elected to treat certain late-year ordinary income losses of approximately $327,000 as having been incurred in the following fiscal year (October 31, 2015).
Management has analyzed the Series’ tax positions taken on federal income tax returns for all open tax years and has concluded that no provision for income tax is required in the Series’ financial statements for the current reporting period. The Series’ federal and state income and federal excise tax returns for tax years for which the applicable statutes of limitations have not expired are subject to examination by the Internal Revenue Service and state departments of revenue.
Note 6. Capital
The Series offers Class A, Class C and Class Z shares. Class A shares are subject to a maximum front-end sales charge of 5.50%. All investors who purchase Class A shares in an amount of $1 million or more and sell these shares within 12 months of purchase are subject to a contingent deferred sales charge (“CDSC”) of 1%. The Class A CDSC is waived for purchases by certain retirement or benefits plans. Class C shares are sold with a CDSC of 1% on shares redeemed within the first 12 months after purchase. Class Z shares are not subject to any sales or redemption charge and are offered exclusively for sale to a limited group of investors. A special exchange privilege is also available for shareholders who qualified to purchase Class A shares at net asset value.
Under certain circumstances, an exchange may be made from specified share classes of the Series to one or more other share classes of the Series as presented in the table of transactions in shares of capital stock.
At October 31, 2014, Prudential Financial, Inc. through its affiliates owned 1,725,022 Class Z shares of the Series.
There are 675 million shares of common stock at $.01 par value per share, designated Class A, Class C and Class Z common stock each of which consists of 225 million, 200 million, and 250 million authorized shares, respectively.
| | | | |
| Prudential Jennison Global Opportunities Fund | | | 29 | |
Notes to Financial Statements
continued
Transactions in shares of common stock were as follows:
| | | | | | | | |
Class A | | Shares | | | Amount | |
Year ended October 31, 2014: | | | | | | | | |
Shares sold | | | 1,366,347 | | | $ | 19,010,157 | |
Shares reacquired | | | (602,003 | ) | | | (8,185,086 | ) |
| | | | | | | | |
Net increase (decrease) in shares outstanding before conversion | | | 764,344 | | | | 10,825,071 | |
Shares reacquired upon conversion into Class Z | | | (37,512 | ) | | | (510,417 | ) |
| | | | | | | | |
Net increase (decrease) in shares outstanding | | | 726,832 | | | $ | 10,314,654 | |
| | | | | | | | |
Year ended October 31, 2013: | | | | | | | | |
Shares sold | | | 429,183 | | | $ | 5,230,950 | |
Shares reacquired | | | (52,529 | ) | | | (574,895 | ) |
| | | | | | | | |
Net increase (decrease) in shares outstanding before conversion | | | 376,654 | | | | 4,656,055 | |
Shares issued upon conversion from Class Z | | | 3,655 | | | | 45,724 | |
| | | | | | | | |
Net increase (decrease) in shares outstanding | | | 380,309 | | | $ | 4,701,779 | |
| | | | | | | | |
Class C | | | | | | |
Year ended October 31, 2014: | | | | | | | | |
Shares sold | | | 329,291 | | | $ | 4,481,893 | |
Shares reacquired | | | (40,122 | ) | | | (536,545 | ) |
| | | | | | | | |
Net increase (decrease) in shares outstanding before conversion | | | 289,169 | | | | 3,945,348 | |
Shares reacquired upon conversion into Class Z | | | (4,058 | ) | | | (53,560 | ) |
| | | | | | | | |
Net increase (decrease) in shares outstanding | | | 285,111 | | | $ | 3,891,788 | |
| | | | | | | | |
Year ended October 31, 2013: | | | | | | | | |
Shares sold | | | 75,679 | | | $ | 876,837 | |
Shares reacquired | | | (6,306 | ) | | | (69,558 | ) |
| | | | | | | | |
Net increase (decrease) in shares outstanding | | | 69,373 | | | $ | 807,279 | |
| | | | | | | | |
Class Z | | | | | | |
Year ended October 31, 2014: | | | | | | | | |
Shares sold | | | 655,167 | | | $ | 8,998,637 | |
Shares reacquired | | | (273,142 | ) | | | (3,686,984 | ) |
| | | | | | | | |
Net increase (decrease) in shares outstanding before conversion | | | 382,025 | | | | 5,311,653 | |
Shares issued upon conversion from Class A and Class C | | | 41,268 | | | | 563,977 | |
| | | | | | | | |
Net increase (decrease) in shares outstanding | | | 423,293 | | | $ | 5,875,630 | |
| | | | | | | | |
Year ended October 31, 2013: | | | | | | | | |
Shares sold | | | 437,242 | | | $ | 5,076,886 | |
Shares reacquired | | | (11,330 | ) | | | (138,791 | ) |
| | | | | | | | |
Net increase (decrease) in shares outstanding before conversion | | | 425,912 | | | | 4,938,095 | |
Shares reacquired upon conversion into Class A | | | (3,640 | ) | | | (45,724 | ) |
| | | | | | | | |
Net increase (decrease) in shares outstanding | | | 422,272 | | | $ | 4,892,371 | |
| | | | | | | | |
Note 7. Borrowings
The Series, along with other affiliated registered investment companies (the “Funds”), is a party to a Syndicated Credit Agreement (“SCA”) with a group of banks. The purpose of the SCA is to provide an alternative source of temporary funding for capital share redemptions. The SCA provides for a commitment of $900 million for the period October 9, 2014 through October 8, 2015. The Funds pay an annualized commitment fee of .075% of the unused portion of the SCA. Prior to October 9, 2014, the Funds had another SCA that provided a commitment of $900 million and the Funds paid an annualized commitment fee of .08% of the unused portion of the SCA. Interest on any borrowings under the SCA is paid at contracted market rates. The commitment fee for the unused amount is accrued daily and paid quarterly.
The Series utilized the SCA during the year ended October 31, 2014. The average daily balance for the 3 days the Series had loans outstanding during the period was $736,667 borrowed at a weighted average interest rate of 1.40%. At October 31, 2014, the Series did not have an outstanding loan amount.
| | | | |
| Prudential Jennison Global Opportunities Fund | | | 31 | |
Financial Highlights
| | | | | | | | | | | | | | |
| Class A Shares | |
| | | Year Ended October 31, | | | | | March 14,
2012(a)
through
October 31, | |
| | | 2014(b) | | | 2013(b) | | | | | 2012 | |
| Per Share Operating Performance: | | | | | | | | | | | | | | |
| Net Asset Value, Beginning Of Period | | | $12.94 | | | | $9.86 | | | | | | $10.00 | |
| Income (loss) from investment operations: | | | | | | | | | | | | | | |
| Net investment loss | | | (.11 | ) | | | (.06 | ) | | | | | (.02 | ) |
| Net realized and unrealized gain (loss) on investment and foreign currency transactions | | | 1.25 | | | | 3.14 | | | | | | (.12 | ) |
| Total from investment operations | | | 1.14 | | | | 3.08 | | | | | | (.14 | ) |
| Net asset value, end of period | | | $14.08 | | | | $12.94 | | | | | | $9.86 | |
| Total Return(c): | | | 8.81% | | | | 31.24% | | | | | | (1.40)% | |
| |
| Ratios/Supplemental Data: | | | | | | | | | | | |
| Net assets, end of period (000) | | | $21,150 | | | | $10,035 | | | | | | $3,898 | |
| Average net assets (000) | | | $19,352 | | | | $4,982 | | | | | | $2,967 | |
| Ratios to average net assets(d): | | | | | | | | | | | | | | |
| Expenses after waivers and/or expense reimbursement | | | 1.60% | | | | 1.60% | | | | | | 1.60% | (e) |
| Expenses before waivers and/or expense reimbursement | | | 1.71% | | | | 2.19% | | | | | | 3.10% | (e) |
| Net investment loss | | | (.78)% | | | | (.54)% | | | | | | (.30)% | (e) |
| Portfolio turnover rate | | | 68% | | | | 70% | | | | | | 48% | (f) |
(a) Commencement of Series.
(b) Calculated based on average shares outstanding during the year.
(c) Total return does not consider the effects of sales loads. Total return is calculated assuming a purchase of a share on the first day and a sale on the last day of each period reported, and includes reinvestment of dividends and distributions. Total returns may reflect adjustments to conform to generally accepted accounting principles. Total returns for periods less than a full year are not annualized.
(d) Does not include expenses of the underlying fund in which the Series invests.
(e) Annualized.
(f) Not annualized.
See Notes to Financial Statements.
| | | | | | | | | | | | | | |
| Class C Shares | |
| | | Year Ended October 31, | | | | | March 14,
2012(a)
through
October 31, | |
| | | 2014(b) | | | 2013(b) | | | | | 2012 | |
| Per Share Operating Performance: | | | | | | | | | | | | | | |
| Net Asset Value, Beginning Of Period | | | $12.77 | | | | $9.81 | | | | | | $10.00 | |
| Income (loss) from investment operations: | | | | | | | | | | | | | | |
| Net investment loss | | | (.21 | ) | | | (.14 | ) | | | | | (.06 | ) |
| Net realized and unrealized gain (loss) on investment and foreign currency transactions | | | 1.23 | | | | 3.10 | | | | | | (.13 | ) |
| Total from investment operations | | | 1.02 | | | | 2.96 | | | | | | (.19 | ) |
| Net asset value, end of period | | | $13.79 | | | | $12.77 | | | | | | $9.81 | |
| Total Return(c): | | | 7.99% | | | | 30.17% | | | | | | (1.90)% | |
| |
| Ratios/Supplemental Data: | |
| Net assets, end of period (000) | | | $5,723 | | | | $1,659 | | | | | | $593 | |
| Average net assets (000) | | | $4,361 | | | | $950 | | | | | | $300 | |
| Ratios to average net assets(d): | | | | | | | | | | | | | | |
| Expenses after waivers and/or expense reimbursement | | | 2.35% | | | | 2.35% | | | | | | 2.35% | (e) |
| Expenses before waivers and/or expense reimbursement | | | 2.41% | | | | 2.89% | | | | | | 3.85% | (e) |
| Net investment loss | | | (1.54)% | | | | (1.26)% | | | | | | (.97)% | (e) |
| Portfolio turnover rate | | | 68% | | | | 70% | | | | | | 48% | (f) |
(a) Commencement of Series.
(b) Calculated based on average shares outstanding during the year.
(c) Total return does not consider the effects of sales loads. Total return is calculated assuming a purchase of a share on the first day and a sale on the last day of each period reported, and includes reinvestment of dividends and distributions. Total returns may reflect adjustments to conform to generally accepted accounting principles. Total returns for periods less than a full year are not annualized.
(d) Does not include expenses of the underlying fund in which the Series invests.
(e) Annualized.
(f) Not annualized.
See Notes to Financial Statements.
| | | | |
| Prudential Jennison Global Opportunities Fund | | | 33 | |
Financial Highlights
continued
| | | | | | | | | | | | | | |
| Class Z Shares | | | | | | | | | | | |
| | | Year Ended October 31, | | | | | March 14,
2012(a)
through
October 31, | |
| | | 2014(b) | | | 2013(b) | | | | | 2012 | |
| Per Share Operating Performance: | | | | | | | | | | | | | | |
| Net Asset Value, Beginning Of Period | | | $12.99 | | | | $9.87 | | | | | | $10.00 | |
| Income (loss) from investment operations: | | | | | | | | | | | | | | |
| Net investment loss | | | (.08 | ) | | | (.03 | ) | | | | | - | (e) |
| Net realized and unrealized gain (loss) on investment and foreign currency transactions | | | 1.26 | | | | 3.15 | | | | | | (.13 | ) |
| Total from investment operations | | | 1.18 | | | | 3.12 | | | | | | (.13 | ) |
| Net asset value, end of period | | | $14.17 | | | | $12.99 | | | | | | $9.87 | |
| Total Return(c): | | | 9.08% | | | | 31.61% | | | | | | (1.30)% | |
| |
| Ratios/Supplemental Data: | |
| Net assets, end of period (000) | | | $33,504 | | | | $25,219 | | | | | | $15,002 | |
| Average net assets (000) | | | $30,965 | | | | $18,340 | | | | | | $14,655 | |
| Ratios to average net assets(d): | | | | | | | | | | | | | | |
| Expenses after waivers and/or expense reimbursement | | | 1.35% | | | | 1.35% | | | | | | 1.35% | (f) |
| Expenses before waivers and/or expense reimbursement | | | 1.42% | | | | 1.89% | | | | | | 2.72% | (f) |
| Net investment loss | | | (.56)% | | | | (.25)% | | | | | | (.03)% | (f) |
| Portfolio turnover rate | | | 68% | | | | 70% | | | | | | 48% | (g) |
(a) Commencement of Series.
(b) Calculated based on average shares outstanding during the year.
(c) Total return is calculated assuming a purchase of a share on the first day and a sale on the last day of each period reported, and includes reinvestment of dividends and distributions. Total returns may reflect adjustments to conform to generally accepted accounting principles. Total returns for periods less than a full year are not annualized.
(d) Does not include expenses of the underlying fund in which the Series invests.
(e) Less than $.005 per share.
(f) Annualized.
(g) Not annualized.
See Notes to Financial Statements.
Report of Independent Registered Public
Accounting Firm
The Board of Directors and Shareholders
Prudential World Fund, Inc.:
We have audited the accompanying statement of assets and liabilities of Prudential Jennison Global Opportunities Fund, a series of Prudential World Fund, Inc., (hereafter referred to as the “Fund”), including the portfolio of investments, as of October 31, 2014, and the related statement of operations for the year then ended, the statements of changes in net assets for each of the years in the two-year period then ended and the financial highlights for each of the years in the two-year period then ended and the period March 14, 2012 (commencement of operations) to October 31, 2012. These financial statements and financial highlights are the responsibility of the Fund’s management. Our responsibility is to express an opinion on these financial statements and financial highlights based on our audits.
We conducted our audits in accordance with the standards of the Public Company Accounting Oversight Board (United States). Those standards require that we plan and perform the audit to obtain reasonable assurance about whether the financial statements and financial highlights are free of material misstatement. An audit includes examining, on a test basis, evidence supporting the amounts and disclosures in the financial statements. Our procedures included confirmation of securities owned as of October 31, 2014, by correspondence with the custodian, transfer agent and brokers or by other appropriate auditing procedures when replies from brokers were not received. An audit also includes assessing the accounting principles used and significant estimates made by management, as well as evaluating the overall financial statement presentation. We believe that our audits provide a reasonable basis for our opinion.
In our opinion, the financial statements and financial highlights referred to above present fairly, in all material respects, the financial position of the Fund as of October 31, 2014, and the results of its operations, the changes in its net assets and the financial highlights for the periods described in the first paragraph above, in conformity with U.S. generally accepted accounting principles.

New York, New York
December 16, 2014
| | | | |
| Prudential Jennison Global Opportunities Fund | | | 35 | |
INFORMATION ABOUT BOARD MEMBERS AND OFFICERS
(Unaudited)
Information about Board Members and Officers of the Fund is set forth below. Board Members who are not deemed to be “interested persons” of the Fund, as defined in the 1940 Act, are referred to as “Independent Board Members.” Board Members who are deemed to be “interested persons” of the Fund are referred to as “Interested Board Members.” The Board Members are responsible for the overall supervision of the operations of the Fund and perform the various duties imposed on the directors of investment companies by the 1940 Act. The Board in turn elects the Officers, who are responsible for administering the day-to-day operations of the Fund.
| | | | |
| Independent Board Members(1) |
| | | |
Name, Address, Age Position(s) Portfolios Overseen | | Principal Occupation(s) During Past Five Years | | Other Directorships Held |
Ellen S. Alberding (56) Board Member Portfolios Overseen: 69 | | President and Board Member, The Joyce Foundation (charitable foundation) (since 2002); Vice Chair, City Colleges of Chicago (community college system) (since 2011); Trustee, Skills for America’s Future (national initiative to connect employers to community colleges) (since 2011); Trustee, National Park Foundation (charitable foundation for national park system) (since 2009); Trustee, Economic Club of Chicago (since 2009). | | None. |
Kevin J. Bannon (62) Board Member Portfolios Overseen: 70 | | Managing Director (since April 2008) and Chief Investment Officer (October 2008-November 2013) of Highmount Capital LLC (registered investment adviser); formerly Executive Vice President and Chief Investment Officer (April 1993-August 2007) of Bank of New York Company; President (May 2003-May 2007) of BNY Hamilton Family of Mutual Funds. | | Director of Urstadt Biddle Properties (equity real estate investment trust) (since September 2008). |
Linda W. Bynoe (62) Board Member Portfolios Overseen: 70 | | President and Chief Executive Officer (since March 1995) and formerly Chief Operating Officer (December 1989-February 1995) of Telemat Ltd. (management consulting); formerly Vice President (January 1985-June 1989) at Morgan Stanley & Co (broker-dealer). | | Director of Simon Property Group, Inc. (retail real estate) (May 2003-May 2012); Director of Anixter International, Inc. (communication products distributor) (since January 2006); Director of Northern Trust Corporation (financial services) (since April 2006); Trustee of Equity Residential (residential real estate) (since December 2009). |
Prudential Jennison Global Opportunities Fund
| | | | |
| Independent Board Members(1) |
| | | |
Name, Address, Age Position(s) Portfolios Overseen | | Principal Occupation(s) During Past Five Years | | Other Directorships Held |
Keith F. Hartstein (58) Board Member Portfolios Overseen: 70 | | Retired; Formerly President and Chief Executive Officer (2005-2012), Senior Vice President (2004-2005), Senior Vice President of Sales and Marketing (1997-2004), and various executive management positions (1990-1997), John Hancock Funds, LLC (asset management); Chairman, Investment Company Institute’s Sales Force Marketing Committee (2003-2008). | | None. |
Michael S. Hyland, CFA (69) Board Member Portfolios Overseen: 69 | | Retired (since February 2005); Formerly Senior Managing Director (July 2001-February 2005) of Bear Stearns & Co, Inc.; Global Partner, INVESCO (1999-2001); Managing Director and President of Salomon Brothers Asset Management (1989-1999). | | None. |
Douglas H. McCorkindale (75) Board Member Portfolios Overseen: 69 | | Retired; Formerly Chairman (February 2001-June 2006), Chief Executive Officer (June 2000-July 2005), President (September 1997-July 2005) and Vice Chairman (March 1984-May 2000) of Gannett Co. Inc. (publishing and media). | | Director of Lockheed Martin Corp. (aerospace and defense) (since May 2001). |
Stephen P. Munn (72) Board Member Portfolios Overseen: 70 | | Lead Director (since 2007) and formerly Chairman (1993-2007) of Carlisle Companies Incorporated (manufacturer of industrial products). | | Lead Director (since 2007) of Carlisle Companies Incorporated (manufacturer of industrial products). |
James E. Quinn (62) Board Member Portfolios Overseen: 69 | | Retired; Formerly President (2003-2012) and Director (2003-2008), and Vice Chairman and Director (1998-2003), Tiffany & Company (jewelry retailing); Director, Mutual of America Capital Management Corporation (asset management) (since 1996); Director, Hofstra University (since 2008); Vice Chairman, Museum of the City of New York (since 1994). | | Director of Deckers Outdoor Corporation (footwear manufacturer) (since 2011). |
Richard A. Redeker (71) Board Member & Independent Chair Portfolios Overseen: 70 | | Retired Mutual Fund Senior Executive (44 years); Management Consultant; Director, Mutual Fund Directors Forum (since 2014); Independent Directors Council (organization of 2,800 Independent Mutual Fund Directors)-Executive Committee, Chair of Policy Steering Committee, Governing Council. | | None. |
Visit our website at www.prudentialfunds.com
| | | | |
| Independent Board Members(1) |
| | | |
Name, Address, Age Position(s) Portfolios Overseen | | Principal Occupation(s) During Past Five Years | | Other Directorships Held |
Robin B. Smith (75) Board Member Portfolios Overseen:70 | | Chairman of the Board (since January 2003) of Publishers Clearing House (direct marketing); Member of the Board of Directors of ADLPartner (marketing) (since December 2010); formerly Chairman and Chief Executive Officer (August 1996-January 2003) of Publishers Clearing House. | | Formerly Director of BellSouth Corporation (telecommunications) (1992-2006). |
Stephen G. Stoneburn (71) Board Member Portfolios Overseen: 70 | | Chairman, (since July 2011), President and Chief Executive Officer (since June 1996) of Quadrant Media Corp. (publishing company); formerly President (June 1995-June 1996) of Argus Integrated Media, Inc.; Senior Vice President and Managing Director (January 1993-1995) of Cowles Business Media; Senior Vice President of Fairchild Publications, Inc. (1975-1989). | | None. |
| | | | |
| Interested Board Members(1) |
| | | |
Name, Address, Age Position(s) Portfolios Overseen | | Principal Occupation(s) During Past Five Years | | Other Directorships Held |
Stuart S. Parker (52) Board Member & President Portfolios Overseen: 64 | | President of Prudential Investments LLC (since January 2012); Executive Vice President of Prudential Investment Management Services LLC (since December 2012); Executive Vice President of Jennison Associates LLC and Head of Retail Distribution of Prudential Investments LLC (June 2005-December 2011). | | None. |
Scott E. Benjamin (41) Board Member & Vice President Portfolios Overseen: 70 | | Executive Vice President (since June 2009) of Prudential Investments LLC; Executive Vice President (June 2009-June 2012) and Vice President (since June 2012) of Prudential Investment Management Services LLC; Executive Vice President (since September 2009) of AST Investment Services, Inc.; Senior Vice President of Product Development and Marketing, Prudential Investments (since February 2006); Vice President of Product Development and Product Management, Prudential Investments (2003-2006). | | None. |
Prudential Jennison Global Opportunities Fund
| | | | |
| Interested Board Members(1) |
| | | |
Name, Address, Age Position(s) Portfolios Overseen | | Principal Occupation(s) During Past Five Years | | Other Directorships Held |
Grace C. Torres* (55) Board Member Portfolios Overseen: 65 | | Retired; Formerly Treasurer and Principal Financial and Accounting Officer of the Prudential Investments Funds, Target Funds, Advanced Series Trust, Prudential Variable Contract Accounts and The Prudential Series Fund (1998-June 2014); Assistant Treasurer (March 1999-June 2014) and Senior Vice President (September 1999-June 2014) of Prudential Investments LLC; Assistant Treasurer (May 2003-June 2014) and Vice President (June 2005-June 2014) of AST Investment Services, Inc.; Senior Vice President and Assistant Treasurer (May 2003-June 2014) of Prudential Annuities Advisory Services, Inc. | | None. |
* Note: Prior to her retirement in 2014, Ms. Torres was employed by Prudential Investments LLC. Due to her prior employment, she is considered to be an “interested person” under the 1940 Act. Ms. Torres is a non-management Interested Board Member.
(1) The year that each Board Member joined the Funds’ Board is as follows:
Ellen S. Alberding; 2013; Kevin J. Bannon, 2008; Linda W. Bynoe, 2005; Keith F. Hartstein, 2013; Michael S. Hyland, 2008; Douglas H. McCorkindale, 2003; Stephen P. Munn, 2008; James E. Quinn, 2013; Richard A. Redeker, 2003; Robin B. Smith, 1996; Stephen G. Stoneburn, 1996; Stuart S. Parker, Board Member and President since 2012; Scott E. Benjamin, Board Member since 2010 and Vice President since 2009; Grace C. Torres, 2014.
| | | | |
| Fund Officers(a) |
| | | |
Name, Address and Age Position with Fund | | Principal Occupation(s) During Past Five Years | | Length of Service as Fund Officer |
Raymond A. O’Hara (59) Chief Legal Officer | | Vice President and Corporate Counsel (since July 2010) of Prudential Insurance Company of America (Prudential); Vice President (March 2011-Present) of Pruco Life Insurance Company and Pruco Life Insurance Company of New Jersey; Vice President and Corporate Counsel (March 2011-Present) of Prudential Annuities Life Assurance Corporation; Chief Legal Officer of Prudential Investments LLC (since June 2012); Chief Legal Officer of Prudential Mutual Fund Services LLC (since June 2012) and Corporate Counsel of AST Investment Services, Inc. (since June 2012); formerly Assistant Vice President and Corporate Counsel (September 2008-July 2010) of The Hartford Financial Services Group, Inc.; formerly Associate (September 1980-December 1987) and Partner (January 1988–August 2008) of Blazzard & Hasenauer, P.C. (formerly, Blazzard, Grodd & Hasenauer, P.C.). | | Since 2012 |
Visit our website at www.prudentialfunds.com
| | | | |
| Fund Officers(a) |
| | | |
Name, Address and Age Position with Fund | | Principal Occupation(s) During Past Five Years | | Length of Service as Fund Officer |
Chad A. Earnst (39) Chief Compliance Officer | | Chief Compliance Officer (September 2014-Present) of Prudential Investments LLC; Chief Compliance Officer (September 2014-Present) of the Prudential Investments Funds, Target Funds, Advanced Series Trust, The Prudential Series Fund, Prudential’s Gibraltar Fund, Inc., Prudential Global Short Duration High Yield Income Fund, Inc., Prudential Short Duration High Yield Fund, Inc. and Prudential Jennison MLP Income Fund, Inc.; formerly Assistant Director (March 2010-August 2014) of the Asset Management Unit, Division of Enforcement, US Securities & Exchange Commission; Assistant Regional Director (January 2010-August 2014), Branch Chief (June 2006–December 2009) and Senior Counsel (April 2003-May 2006) of the Miami Regional Office, Division of Enforcement, US Securities & Exchange Commission. | | Since 2014 |
Deborah A. Docs (56) Secretary | | Vice President and Corporate Counsel (since January 2001) of Prudential; Vice President (since December 1996) and Assistant Secretary (since March 1999) of Prudential Investments LLC; formerly Vice President and Assistant Secretary (May 2003-June 2005) of AST Investment Services, Inc. | | Since 2004 |
Jonathan D. Shain (56) Assistant Secretary | | Vice President and Corporate Counsel (since August 1998) of Prudential; Vice President and Assistant Secretary (since May 2001) of Prudential Investments LLC; Vice President and Assistant Secretary (since February 2001) of Prudential Mutual Fund Services LLC; formerly Vice President and Assistant Secretary (May 2003-June 2005) of AST Investment Services, Inc. | | Since 2005 |
Claudia DiGiacomo (40) Assistant Secretary | | Vice President and Corporate Counsel (since January 2005) of Prudential; Vice President and Assistant Secretary of Prudential Investments LLC (since December 2005); Associate at Sidley Austin Brown & Wood LLP (1999-2004). | | Since 2005 |
Andrew R. French (52) Assistant Secretary | | Vice President and Corporate Counsel (since February 2010) of Prudential; formerly Director and Corporate Counsel (2006-2010) of Prudential; Vice President and Assistant Secretary (since January 2007) of Prudential Investments LLC; Vice President and Assistant Secretary (since January 2007) of Prudential Mutual Fund Services LLC. | | Since 2006 |
Amanda S. Ryan (36) Assistant Secretary | | Director and Corporate Counsel (since March 2012) of Prudential; Director and Assistant Secretary (since June 2012) of Prudential Investments LLC; Associate at Ropes & Gray LLP (2008-2012). | | Since 2012 |
Theresa C. Thompson (52) Deputy Chief Compliance Officer | | Vice President, Compliance, Prudential Investments LLC (since April 2004); and Director, Compliance, Prudential Investments LLC (2001-2004). | | Since 2008 |
Prudential Jennison Global Opportunities Fund
| | | | |
| Fund Officers(a) |
| | | |
Name, Address and Age Position with Fund | | Principal Occupation(s) During Past Five Years | | Length of Service as Fund Officer |
Richard W. Kinville (46) Anti-Money Laundering Compliance Officer | | Vice President, Corporate Compliance, Anti-Money Laundering Unit (since January 2005) of Prudential; committee member of the American Council of Life Insurers Anti-Money Laundering and Critical Infrastructure Committee (since January 2007); formerly Investigator and Supervisor in the Special Investigations Unit for the New York Central Mutual Fire Insurance Company (August 1994-January 1999); Investigator in AXA Financial’s Internal Audit Department and Manager in AXA’s Anti-Money Laundering Office (January 1999-January 2005); first chair of the American Council of Life Insurers Anti-Money Laundering and Critical Infrastructure Committee (June 2007-December 2009). | | Since 2011 |
M. Sadiq Peshimam (50) Treasurer and Principal Financial and Accounting Officer | | Assistant Treasurer of funds in the Prudential Mutual Fund Complex (2006-2014); Vice President (since 2005) of Prudential Investments LLC. | | Since 2006 |
Peter Parrella (56) Assistant Treasurer | | Vice President (since 2007) and Director (2004-2007) within Prudential Mutual Fund Administration; formerly Tax Manager at SSB Citi Fund Management LLC (1997-2004). | | Since 2007 |
Lana Lomuti (47) Assistant Treasurer | | Vice President (since 2007) and Director (2005-2007), within Prudential Mutual Fund Administration; formerly Assistant Treasurer (December 2007-February 2014) of The Greater China Fund, Inc. | | Since 2014 |
Linda McMullin (53) Assistant Treasurer | | Vice President (since 2011) and Director (2008-2011) within Prudential Mutual Fund Administration. | | Since 2014 |
| (a) | Excludes Mr. Parker and Mr. Benjamin, interested Board Members who also serve as President and Vice President, respectively. |
Explanatory Notes to Tables:
| n | Board Members are deemed to be “Interested,” as defined in the 1940 Act, by reason of their affiliation with Prudential Investments LLC and/or an affiliate of Prudential Investments LLC. |
| n | Unless otherwise noted, the address of all Board Members and Officers is c/o Prudential Investments LLC, Gateway Center Three, 100 Mulberry Street, Newark, New Jersey 07102-4077. |
| n | There is no set term of office for Board Members or Officers. The Board Members have adopted a retirement policy, which calls for the retirement of Board Members on December 31 of the year in which they reach the age of 75. |
| n | “Other Directorships Held” includes only directorships of companies required to register or file reports with the SEC under the 1934 Act (that is, “public companies”) or other investment companies registered under the 1940 Act. |
| n | “Portfolios Overseen” includes all investment companies managed by Prudential Investments LLC. The investment companies for which Prudential Investments LLC serves as manager include the Prudential Investments Mutual Funds, The Prudential Variable Contract Accounts, Target Mutual Funds, Prudential Short Duration High Yield Fund, Inc., Prudential Global Short Duration High Yield Fund, Inc., The Prudential Series Fund, Prudential’s Gibraltar Fund, Inc. and the Advanced Series Trust. |
Visit our website at www.prudentialfunds.com
Approval of Advisory Agreements
The Fund’s Board of Directors
The Board of Directors (the “Board”) of Prudential Jennison Global Opportunities Fund (the “Fund”)1 consists of thirteen individuals, eleven of whom are not “interested persons” of the Fund, as defined in the Investment Company Act of 1940, as amended (the “1940 Act”) (the “Independent Directors”). The Board is responsible for the oversight of the Fund and its operations, and performs the various duties imposed on the directors of investment companies by the 1940 Act. The Independent Directors have retained independent legal counsel to assist them in connection with their duties. The Chair of the Board is an Independent Director. The Board has established three standing committees: the Audit Committee, the Nominating and Governance Committee, and the Investment Committee. Each committee is chaired by, and composed of, Independent Directors.
Annual Approval of the Fund’s Advisory Agreements
As required under the 1940 Act, the Board determines annually whether to renew the Fund’s management agreement with Prudential Investments LLC (“PI”) and the Fund’s subadvisory agreement with Jennison Associates LLC (“Jennison”). In considering the renewal of the agreements, the Board, including all of the Independent Directors, met on June 9-11, 2014 and approved the renewal of the agreements through July 31, 2015, after concluding that the renewal of the agreements was in the best interests of the Fund and its shareholders.2
In advance of the meetings, the Board requested and received materials relating to the agreements, and had the opportunity to ask questions and request further information in connection with its consideration. Among other things, the Board considered comparative fee information from PI and Jennison. Also, the Board considered comparisons with other mutual funds in relevant Peer Universes and Peer Groups, as is further discussed below.
In approving the agreements, the Board, including the Independent Directors advised by independent legal counsel, considered the factors it deemed relevant, including the nature, quality and extent of services provided by PI and the subadviser, the performance of the Fund, the profitability of PI and its affiliates, expenses and fees, and the potential for economies of scale that may be shared with the Fund and its shareholders as the Fund’s assets grow. In their deliberations, the Directors did not identify any single factor which alone was responsible for the Board’s decision to approve the agreements with respect to the Fund. In connection with its deliberations, the Board considered information provided by PI throughout the year at regular Board
| 1 | Prudential Jennison Global Opportunities Fund is a series of Prudential World Fund, Inc. |
| 2 | Grace C. Torres was elected to the Board as of December 2014, and therefore did not participate in the consideration of these approvals. |
Prudential Jennison Global Opportunities Fund
Approval of Advisory Agreements (continued)
meetings, presentations from portfolio managers and other information, as well as information furnished at or in advance of the meetings on June 9-11, 2014.
The Directors determined that the overall arrangements between the Fund and PI, which serves as the Fund’s investment manager pursuant to a management agreement, and between PI and Jennison, which serves as the Fund’s subadviser pursuant to the terms of a subadvisory agreement with PI, are in the best interests of the Fund and its shareholders in light of the services performed, fees charged and such other matters as the Directors considered relevant in the exercise of their business judgment.
The material factors and conclusions that formed the basis for the Directors’ reaching their determinations to approve the continuance of the agreements are separately discussed below.
Nature, Quality and Extent of Services
The Board received and considered information regarding the nature, quality and extent of services provided to the Fund by PI and Jennison. The Board considered the services provided by PI, including but not limited to the oversight of the subadviser for the Fund, as well as the provision of fund recordkeeping, compliance, and other services to the Fund. With respect to PI’s oversight of the subadviser, the Board noted that PI’s Strategic Investment Research Group (“SIRG”), which is a business unit of PI, is responsible for monitoring and reporting to PI’s senior management on the performance and operations of the subadviser. The Board also considered that PI pays the salaries of all of the officers and non-independent Directors of the Fund. The Board also considered the investment subadvisory services provided by Jennison, as well as adherence to the Fund’s investment restrictions and compliance with applicable Fund policies and procedures. The Board considered PI’s evaluation of the subadviser, as well as PI’s recommendation, based on its review of the subadviser, to renew the subadvisory agreement.
The Board considered the qualifications, backgrounds and responsibilities of PI’s senior management responsible for the oversight of the Fund and Jennison, and also considered the qualifications, backgrounds and responsibilities of Jennison’s portfolio managers who are responsible for the day-to-day management of the Fund’s portfolio. The Board was provided with information pertaining to PI’s and Jennison’s organizational structure, senior management, investment operations, and other relevant information pertaining to both PI and Jennison. The Board also noted that it received favorable compliance reports from the Fund’s Chief Compliance Officer (“CCO”) as to both PI and Jennison. The Board noted that Jennison is affiliated with PI.
Visit our website at www.prudentialfunds.com
The Board concluded that it was satisfied with the nature, extent and quality of the investment management services provided by PI and the subadvisory services provided to the Fund by Jennison, and that there was a reasonable basis on which to conclude that the Fund benefits from the services provided by PI and Jennison under the management and subadvisory agreements.
Costs of Services and Profits Realized by PI
The Board was provided with information on the profitability of PI and its affiliates in serving as the Fund’s investment manager. The Board discussed with PI the methodology utilized in assembling the information regarding profitability and considered its reasonableness. The Board recognized that it is difficult to make comparisons of profitability from fund management contracts because comparative information is not generally publicly available and is affected by numerous factors, including the structure of the particular adviser, the types of funds it manages, its business mix, numerous assumptions regarding allocations and the adviser’s capital structure and cost of capital. However, the Board considered that the cost of services provided by PI to the Fund during the year ended December 31, 2013 exceeded the management fees paid by the Fund, resulting in an operating loss to PI. The Board separately considered information regarding the profitability of the subadviser, an affiliate of PI. Taking these factors into account, the Board concluded that the profitability of PI and its affiliates in relation to the services rendered was not unreasonable.
Economies of Scale
In 2013, PI and the Board retained an outside business consulting firm, in order to assist the Board in its consideration of the renewal of the management and subadvisory agreements, by reviewing management fee breakpoint usage and trends in management fees across the mutual fund industry. The consulting firm’s analysis and conclusions with respect to the Funds’ management fee structures were presented to the Board and PI at the December 3-5, 2013 meeting, and were discussed extensively by the Board and PI over the following two quarters.
The Board noted that the management fee schedule for the Fund does not contain breakpoints that would reduce the fee rate on assets above specified levels. The Board received and discussed information concerning whether PI realizes economies of scale as the Fund’s assets grow beyond current levels. The Board also recognized the inherent limitations of any analysis of economies of scale, stemming largely from the Board’s understanding that most of PI’s costs are not specific to individual funds, but rather are incurred across a variety of products and services. In light of the Fund’s current size, performance and expense structure, the Board concluded that the absence of breakpoints in the Fund’s fee schedule is acceptable at this time.
Prudential Jennison Global Opportunities Fund
Approval of Advisory Agreements (continued)
Other Benefits to PI and Jennison
The Board considered potential ancillary benefits that might be received by PI and Jennison and their affiliates as a result of their relationship with the Fund. The Board concluded that potential benefits to be derived by PI included fees received by affiliates of PI for serving as the Fund’s securities lending agent, transfer agency fees received by the Fund’s transfer agent (which is affiliated with PI), as well as benefits to its reputation or other intangible benefits resulting from PI’s association with the Fund. The Board concluded that the potential benefits to be derived by Jennison included the ability to use soft dollar credits, as well as the potential benefits consistent with those generally resulting from an increase in assets under management, specifically, potential access to additional research resources and benefits to its reputation. The Board concluded that the benefits derived by PI and Jennison were consistent with the types of benefits generally derived by investment managers and subadvisers to mutual funds.
Performance of the Fund / Fees and Expenses
The Board considered certain additional specific factors and made related conclusions relating to the historical performance of the Fund for the one-year period ended December 31, 2013. The Board considered that the Fund commenced operations on March 14, 2012 and that longer-term performance was not yet available.
The Board also considered the Fund’s actual management fee, as well as the Fund’s net total expense ratio, for the fiscal year ended October 31, 2013. The Board considered the management fee for the Fund as compared to the management fee charged by PI to other funds and the fee charged by other advisers to comparable mutual funds in a Peer Group. The actual management fee represents the fee rate actually paid by Fund shareholders and includes any fee waivers or reimbursements. The net total expense ratio for the Fund represents the actual expense ratio incurred by Fund shareholders.
The mutual funds included in the Peer Universe (the Lipper Global Multi-Cap Growth Funds Performance Universe)3 and the Peer Group were objectively determined by Lipper Inc. (“Lipper”), an independent provider of mutual fund data. To the extent that PI deemed appropriate, and for reasons addressed in detail with the Board, PI may
| 3 | The Fund was compared to the Lipper Global Multi-Cap Growth Funds Performance Universe, although Lipper classifies the Fund in its Global Multi-Cap Core Funds Performance Universe. The Fund was compared to the Lipper Global Multi-Cap Growth Funds Performance Universe because PI believes that the funds included in the Lipper Global Multi-Cap Growth Funds Performance Universe provide a more appropriate basis for Fund performance comparisons. |
Visit our website at www.prudentialfunds.com
have provided supplemental data compiled by Lipper for the Board’s consideration. The comparisons placed the Fund in various quartiles, with the first quartile being the best 25% of the mutual funds (for performance, the best performing mutual funds and, for expenses, the lowest cost mutual funds).
The section below summarizes key factors considered by the Board and the Board’s conclusions regarding the Fund’s performance, fees and overall expenses. The table sets forth gross performance comparisons (which do not reflect the impact on performance of fund expenses, or any subsidies, expense caps or waivers that may be applicable) with the Peer Universe, actual management fees with the Peer Group (which reflect the impact of any subsidies or fee waivers), and net total expenses with the Peer Group, each of which were key factors considered by the Board.
| | | | | | | | |
| Performance | | 1 Year | | 3 Years | | 5 Years | | 10 Years |
| | | 1st Quartile | | N/A | | N/A | | N/A |
| Actual Management Fees: 1st Quartile |
| Net Total Expenses: 3rd Quartile |
| | • | | The Board noted that Fund outperformed its benchmark index for the one-year period. |
| | • | | The Board and PI agreed to continue the existing expense cap of 1.35% (exclusive of 12b-1 fees and certain other fees) through February 28, 2015. |
| | • | | The Board concluded that, in light of the Fund’s competitive performance, it would be in the best interests of the Fund and its shareholders to renew the agreements. |
| | • | | The Board concluded that the management fees (including subadvisory fees) and total expenses were reasonable in light of the services provided. |
* * *
After full consideration of these factors, the Board concluded that the approval of the agreements was in the best interests of the Fund and its shareholders.
Prudential Jennison Global Opportunities Fund
| | | | |
| n MAIL | | n TELEPHONE | | n WEBSITE |
Gateway Center Three 100 Mulberry Street Newark, NJ 07102 | | (800) 225-1852 | | www.prudentialfunds.com |
|
| PROXY VOTING |
| The Board of Directors of the Fund has delegated to the Fund’s investment subadviser the responsibility for voting any proxies and maintaining proxy recordkeeping with respect to the Fund. A description of these proxy voting policies and procedures is available without charge, upon request, by calling (800) 225-1852 or by visiting the Securities and Exchange Commission’s website at www.sec.gov. Information regarding how the Fund voted proxies relating to portfolio securities during the most recent 12-month period ended June 30 is available on the Fund’s website and on the Securities and Exchange Commission’s website. |
|
| DIRECTORS |
Ellen S. Alberding • Kevin J. Bannon • Scott E. Benjamin • Linda W. Bynoe •
Keith F. Hartstein • Michael S. Hyland • Douglas H. McCorkindale • Stephen P. Munn • Stuart S. Parker • James E. Quinn • Richard A. Redeker • Robin B. Smith • Stephen G. Stoneburn • Grace C. Torres |
|
| OFFICERS |
| Stuart S. Parker, President • Scott E. Benjamin, Vice President • M. Sadiq Peshimam, Treasurer and Principal Financial and Accounting Officer • Raymond A. O’Hara, Chief Legal Officer • Deborah A. Docs, Secretary • Chad A. Earnst, Chief Compliance Officer • Theresa C. Thompson, Deputy Chief Compliance Officer • Richard W. Kinville, Anti-Money Laundering Compliance Officer • Jonathan D. Shain, Assistant Secretary • Claudia DiGiacomo, Assistant Secretary • Amanda S. Ryan, Assistant Secretary • Andrew R. French, Assistant Secretary • Peter Parrella, Assistant Treasurer • Lana Lomuti, Assistant Treasurer • Linda McMullin, Assistant Treasurer |
| | | | |
| MANAGER | | Prudential Investments LLC | | Gateway Center Three
100 Mulberry Street
Newark, NJ 07102 |
|
| INVESTMENT SUBADVISER | | Jennison Associates LLC | | 466 Lexington Avenue
New York, NY 10017 |
|
| DISTRIBUTOR | | Prudential Investment
Management Services LLC | | Gateway Center Three
100 Mulberry Street
Newark, NJ 07102 |
|
| CUSTODIAN | | The Bank of New York Mellon | | One Wall Street
New York, NY 10286 |
|
| TRANSFER AGENT | | Prudential Mutual Fund
Services LLC | | PO Box 9658
Providence, RI 02940 |
|
| INDEPENDENT REGISTERED PUBLIC ACCOUNTING FIRM | | KPMG LLP | | 345 Park Avenue
New York, NY 10154 |
|
| FUND COUNSEL | | Willkie Farr & Gallagher LLP | | 787 Seventh Avenue
New York, NY 10019 |
|
| An investor should consider the investment objectives, risks, charges, and expenses of the Fund carefully before investing. The prospectus and summary prospectus contain this and other information about the Fund. An investor may obtain a prospectus and summary prospectus by visiting our website at www.prudentialfunds.com or by calling (800) 225-1852. The prospectus and summary prospectus should be read carefully before investing. |
|
| E-DELIVERY |
| To receive your mutual fund documents online, go to www.prudentialfunds.com/edelivery and enroll. Instead of receiving printed documents by mail, you will receive notification via email when new materials are available. You can cancel your enrollment or change your email address at any time by visiting the website address above. |
|
| SHAREHOLDER COMMUNICATIONS WITH DIRECTORS |
| Shareholders can communicate directly with the Board of Directors by writing to the Chair of the Board, Prudential Jennison Global Opportunities Fund, Prudential Investments, Attn: Board of Directors, 100 Mulberry Street, Gateway Center Three, Newark, NJ 07102. Shareholders can communicate directly with an individual Director by writing to the same address. Communications are not screened before being delivered to the addressee. |
|
| AVAILABILITY OF PORTFOLIO SCHEDULE |
| The Fund files its complete schedule of portfolio holdings with the Securities and Exchange Commission for the first and third quarters of each fiscal year on Form N-Q. The Fund’s Forms N-Q are available on the Commission’s website at www.sec.gov. The Fund’s Forms N-Q may also be reviewed and copied at the Commission’s Public Reference Room in Washington, D.C. Information on the operation and location of the Public Reference Room may be obtained by calling 1-800-SEC-0330. The Fund’s schedule of portfolio holdings is also available on the Fund’s website as of the end of each month. |
|
| The Fund’s Statement of Additional Information contains additional information about the Fund’s Directors and is available without charge, upon request, by calling (800) 225-1852. |
Mutual Funds:
| | | | |
| ARE NOT INSURED BY THE FDIC OR ANY FEDERAL GOVERNMENT AGENCY | | MAY LOSE VALUE | | ARE NOT A DEPOSIT OF OR GUARANTEED BY ANY BANK OR ANY BANK AFFILIATE |

PRUDENTIAL JENNISON GLOBAL OPPORTUNITIES FUND
| | | | | | |
| SHARE CLASS | | A | | C | | Z |
| NASDAQ | | PRJAX | | PRJCX | | PRJZX |
| CUSIP | | 743969719 | | 743969693 | | 743969685 |
MF214E 0270920-00001-00

PRUDENTIAL INVESTMENTS»MUTUAL FUNDS
PRUDENTIAL JENNISON INTERNATIONAL OPPORTUNITIES FUND
ANNUAL REPORT · OCTOBER 31, 2014
Fund Type
International Stock
Objective
To seek long-term growth of capital
This report is not authorized for distribution to prospective investors unless preceded or accompanied by a current prospectus.
The views expressed in this report and information about the Fund’s portfolio holdings are for the period covered by this report and are subject to change thereafter.
Mutual funds are distributed by Prudential Investment Management Services LLC. Jennison Associates is a registered investment adviser. Both are Prudential Financial companies. © 2014 Prudential Financial, Inc. and its related entities. Prudential Investments LLC, Prudential, Jennison Associates, Jennison, the Prudential logo, Bring Your Challenges, and the Rock symbol are service marks of Prudential Financial, Inc. and its related entities, registered in many jurisdictions worldwide.

December 15, 2014
Dear Shareholder:
We hope you find the annual report for the Prudential Jennison International Opportunities Fund informative and useful. The report covers performance for the 12-month period that ended October 31, 2014.
Since market conditions change over time, we believe it is important to maintain a diversified portfolio of funds consistent with your tolerance for risk, time horizon, and financial goals.
Your financial advisor can help you create a diversified investment plan that may include funds covering all the basic asset classes and that reflects your personal investor profile and risk tolerance. Keep in mind, however, that diversification and asset allocation strategies do not assure a profit or protect against loss in declining markets.
Prudential Investments® is dedicated to helping you solve your toughest investment challenges—whether it’s capital growth, reliable income, or protection from market volatility and other risks. We offer the expertise of Prudential Financial’s affiliated asset managers* that strive to be leaders in a broad range of funds to help you stay on course to the future you envision. They also manage money for major corporations and pension funds around the world, which means you benefit from the same expertise, innovation, and attention to risk demanded by today’s most sophisticated investors.
Thank you for choosing the Prudential Investments family of funds.
Sincerely,

Stuart S. Parker, President
Prudential Jennison International Opportunities Fund
*Most of Prudential Investments’ equity funds are advised by Jennison Associates LLC, Quantitative Management Associates LLC (QMA), or Prudential Real Estate Investors. Prudential Investments’ fixed income and money market funds are advised by Prudential Investment Management, Inc. (PIM) through its Prudential Fixed Income unit. Jennison Associates LLC, QMA, and PIM are registered investment advisers and Prudential Financial companies. Prudential Real Estate Investors is a unit of PIM.
| | | | |
| Prudential Jennison International Opportunities Fund | | | 1 | |
Your Fund’s Performance (Unaudited)
Performance data quoted represent past performance. Past performance does not guarantee future results. The investment return and principal value of an investment will fluctuate, so that an investor’s shares, when redeemed, may be worth more or less than their original cost. Current performance may be lower or higher than the past performance data quoted. An investor may obtain performance data as of the most recent month-end by visiting our website at www.prudentialfunds.com or by calling (800) 225-1852.
| | | | | | | | |
Cumulative Total Returns (Without Sales Charges) as of 10/31/14 | |
| | | One Year | | | Since Inception | |
Class A | | | 0.20 | % | | | 35.91% (6/5/12) | |
Class C | | | –0.57 | | | | 33.47 (6/5/12) | |
Class Z | | | 0.42 | | | | 36.69 (6/5/12) | |
MSCI All Country World Index ex-US | | | 0.06 | | | | 37.42 | |
Lipper International Multi-Cap Core Funds Average | | | 0.16 | | | | 41.47 | |
Lipper International Multi-Cap Growth Funds Average | | | 0.04 | | | | 37.52 | |
| | | | | | | | |
Average Annual Total Returns (With Sales Charges) as of 9/30/14 | |
| | | One Year | | | Since Inception | |
Class A | | | –4.36 | % | | | 10.57% (6/5/12) | |
Class C | | | –0.46 | | | | 12.48 (6/5/12) | |
Class Z | | | 1.51 | | | | 13.58 (6/5/12) | |
MSCI All Country World Index ex-US | | | 4.77 | | | | 15.08 | |
Lipper International Multi-Cap Core Funds Average | | | 3.95 | | | | 16.17 | |
Lipper International Multi-Cap Growth Funds Average | | | 3.07 | | | | 14.57 | |
| | | | | | | | |
Average Annual Total Returns (With Sales Charges) as of 10/31/14 | |
| | | One Year | | | Since Inception | |
Class A | | | –5.31 | % | | | 10.96% (6/5/12) | |
Class C | | | –1.53 | | | | 12.75 (6/5/12) | |
Class Z | | | 0.42 | | | | 13.87 (6/5/12) | |
| | | | | | | | |
Average Annual Total Returns (Without Sales Charges) as of 10/31/14 | |
| | | One Year | | | Since Inception | |
Class A | | | 0.20 | % | | | 13.60% (6/5/12) | |
Class C | | | –0.57 | | | | 12.75 (6/5/12) | |
Class Z | | | 0.42 | | | | 13.87 (6/5/12) | |
| | |
| 2 | | Visit our website at www.prudentialfunds.com |
Growth of a $10,000 Investment
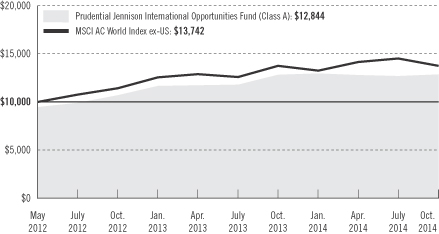
The graph compares a $10,000 investment in the Prudential Jennison International Opportunities Fund (Class A shares) with a similar investment in the MSCI AC World Index ex-US by portraying the initial account values at the commencement of operations for Class A shares (June 5, 2012) and the account values at the end of the current fiscal year (October 31, 2014), as measured on a quarterly basis. For purposes of the graph, and unless otherwise indicated, it has been assumed that (a) the maximum applicable front-end sales charge was deducted from the initial $10,000 investment in Class A shares; (b) all recurring fees (including management fees) were deducted; and (c) all dividends and distributions were reinvested. The line graph provides information for Class A shares only. As indicated in the tables provided earlier, performance for Class C and Class Z shares will vary due to the differing charges and expenses applicable to each share class (as indicated in the following paragraphs). Without waiver of fees and/or expense reimbursement, if any, the returns would have been lower.
Past performance does not predict future performance. Total returns and the ending account values in the graph include changes in share price and reinvestment of dividends and capital gains distributions in a hypothetical investment for the periods shown. The Fund’s total returns do not reflect the deduction of income taxes on an individual’s investment. Taxes may reduce your actual investment returns on income or gains paid by the Fund or any gains you may realize if you sell your shares.
Source: Prudential Investments LLC and Lipper Inc.
Inception returns are provided for any share class with less than 10 calendar years of returns.
| | | | |
| Prudential Jennison International Opportunities Fund | | | 3 | |
Your Fund’s Performance (continued)
The returns in the tables do not reflect the deduction of taxes that a shareholder would pay on Fund distributions or following the redemption of Fund shares. The average annual total returns take into account applicable sales charges, which are described for each share class in the table below.
| | | | | | |
| | Class A | | Class C | | Class Z |
Maximum initial sales charge | | 5.50% of
the public
offering
price | | None | | None |
Contingent deferred sales charge (CDSC)
(as a percentage of the lower of original purchase price or net asset value at redemption) | | 1% on sales
of $1 million
or more
made within
12 months of
purchase | | 1% on sales
made within
12 months
of purchase | | None |
Annual distribution and service (12b-1) fees
(shown as a percentage of average daily net assets) | | .30%
(.25%
currently) | | 1% | | None |
Benchmark Definitions
Morgan Stanley Capital International (MSCI) All Country (AC) World Index ex-US
The MSCI ACWI Index ex-US is an unmanaged free float-adjusted market capitalization weighted index that is designed to measure the equity market performance of developed and emerging markets, excluding the US. The MSCI ACWI ex US consists of 45 country indexes comprising 22 developed and 23 emerging market country indexes. The developed market country indexes included are: Australia, Austria, Belgium, Canada, Denmark, Finland, France, Germany, Hong Kong, Ireland, Israel, Italy, Japan, Netherlands, New Zealand, Norway, Portugal, Singapore, Spain, Sweden, Switzerland, and the United Kingdom. The emerging market country indexes included are: Brazil, Chile, China, Colombia, Czech Republic, Egypt, Greece, Hungary, India, Indonesia, Korea, Malaysia, Mexico, Peru, Philippines, Poland, Qatar, Russia, South Africa, Taiwan, Thailand, Turkey, and United Arab Emirates.
Lipper International Multi-Cap Core Funds Average
The Lipper International Multi-Cap Core Funds Average (Lipper Average) represents returns based on the average return of all funds in the Lipper International Multi-Cap Core Funds category for the periods noted. Funds in the Lipper Average are Funds that, by portfolio practice, invest in a variety of market-capitalization ranges without concentrating 75% of their equity assets in any one market-capitalization range over an extended period of time. International multi-cap core funds typically have average characteristics compared to the MSCI EAFE Index.
Lipper International Multi-Cap Growth Funds Average
The Lipper International Multi-Cap Growth Funds Average (Lipper Average) represents returns based on the average return of all funds in the Lipper International Multi-Cap Core Funds category for the periods noted. Funds in the Lipper Average are Funds that, by portfolio practice, invest in a variety of market-capitalization ranges without concentrating 75% of their equity assets in any one market-capitalization range over an extended period of time. International multi-cap growth funds typically have above-average characteristics compared to the MSCI EAFE Index.
| | |
| 4 | | Visit our website at www.prudentialfunds.com |
Note: Although Lipper classifies the Fund in its International Multi-Cap Core Funds category, the Fund utilizes the Lipper International Multi-Cap Growth Funds category because the Fund’s investment manager believes that the Lipper International Multi-Cap Growth Funds category provides a more appropriate basis for Fund performance comparisons.
Investors cannot invest directly in an index or average. The returns for the Index would be lower if they included the effects of sales charges, operating expenses of a mutual fund, or taxes. Returns for the Lipper Averages reflect the deduction of operating expenses, but not sales charges or taxes. The Since Inception returns for the Index and the Lipper Averages are measured from the closest month-end to inception date, and not from the Fund’s actual inception date.
| | | | |
Five Largest Holdings expressed as a percentage of net assets as of 10/31/14 | | | | |
Tencent Holdings Ltd., China | | | 4.7 | % |
Canadian Pacific Railway Ltd., Canada | | | 3.9 | |
Roche Holding AG, Switzerland | | | 3.6 | |
Inditex SA, Spain | | | 3.3 | |
Alibaba Group Holding Ltd., ADR, China | | | 3.2 | |
Holdings reflect only long-term investments and are subject to change.
| | | | |
Five Largest Industries expressed as a percentage of net assets as of 10/31/14 | | | | |
Pharmaceuticals | | | 19.5 | % |
Internet Software & Services | | | 13.9 | |
Textiles, Apparel & Luxury Goods | | | 7.9 | |
Specialty Retail | | | 4.8 | |
Road & Rail | | | 3.9 | |
Industry weightings reflect only long-term investments and are subject to change.
| | | | |
| Prudential Jennison International Opportunities Fund | | | 5 | |
Strategy and Performance Overview
How did the Fund perform?
For the 12-month period ended October 31, 2014, the Prudential Jennison International Opportunities Fund’s Class A shares rose 0.20%. Over the same period, the MSCI All Country World Index (the Index), excluding the United States, ticked up 0.06% while the Lipper International Multi-Cap Growth Average gained 0.04%.
What was the market environment?
| | • | | Global equity market performance varied by region1 in the reporting period. Economic activity in Europe, already anemic, faced new challenges stemming from Ukraine-Russia tensions. European equity markets dropped slightly over the year. China’s economic expansion moderated as the country navigated a better balance between fixed investment and consumer-led growth. A number of other key emerging market countries were hurt by a combination of slower growth, fiscal pressures, and weakening currencies. Later in the period, signs of improvement began to emerge in a small but growing number of emerging market countries with stabilizing political, fiscal, and currency situations. Japan’s efforts to stimulate growth and reform aspects of the economy showed progress, but remained a work in progress. |
| | • | | The US equity market’s double-digit advance reflected sustained improvement in the US economic outlook. Corporate profits remained strong, housing and employment indicators improved, and consumer confidence rose to post-recession highs. The Federal Reserve tapered its quantitative easing program, signaling confidence in the health of US economic activity and labor market conditions. US gross domestic product (GDP) contracted in early 2014, largely because of severe winter weather, before quickly rebounding. |
Which holdings made the largest positive contributions to the Fund’s return?
Healthcare positions were the most significant contributors to the Fund’s returns.
| | • | | Dublin-based specialty biopharmaceutical company Shire rose on a takeover bid. Separately, a US court ruled that certain Shire patents are valid, suggesting that generic competition for Vyvanse, Shire’s treatment for attention deficit/hyperactivity disorder, will likely be blocked until 2024. |
| | • | | Aspen Pharmacare, Africa’s largest pharmaceutical company, posted strong revenue and earnings growth. The company has generic, branded, and |
| 1 | Jennison regional definitions: Developed North America includes countries classified by MSCI as developed markets in North America. Developed Europe includes countries classified by MSCI as developed markets in Europe and the Middle East. Developed Asia /Pacific includes countries classified by MSCI as developed markets in Asia and Australia. Emerging Markets includes all countries classified by MSCI as emerging and frontier markets. |
| | |
| 6 | | Visit our website at www.prudentialfunds.com |
| | over-the-counter products, and exposure to several fast-growing emerging markets. Jennison expects Aspen to realize significant advantages from recent acquisitions. |
| | • | | Denmark-based Novo Nordisk, the world leader in diabetes care, benefited from strong sales of Victoza, one of its key insulin products. A US Food and Drug Administration expert panel recommended approval of a stronger version of Victoza for the treatment of obesity. Jennison expects Novo’s diabetes product pipeline to foster long-term market share gains. |
Information technology positions were likewise strong contributors to return.
| | • | | Kyoto-based Murata Manufacturing saw strong demand from North American smartphone manufacturers and benefited from the weak yen. The company is the global leader in ceramic capacitors and filters, and high-frequency components for mobile phones. It is also diversifying into the ceramic-based wireless module business. |
| | • | | Naver operates Korea’s largest Internet portal and dominates the Korean search market. Its strength, in part, reflected interest in LINE, its mobile messenger platform, which is favored by smartphone users in Japan, Taiwan, and Thailand. LINE, with more than 300 million users, is well positioned, Jennison believes, to capitalize on global mobile Internet industry growth trends. |
| | • | | Please see “Comments on Largest Holdings” below for discussion of Tencent Holdings. |
In industrials:
| | • | | Ashtead Group rose as construction recovery in the US and UK gained momentum. The company rents construction and industrial equipment, principally in the US and UK. |
| | • | | Please see “Comments on Largest Holdings” below for discussion of Canadian Pacific Railway. |
Which holdings detracted from the Fund’s return?
Faced with a challenging consumer environment, the Fund’s consumer discretionary holdings lost ground and underperformed the benchmark’s consumer companies.
| | • | | London-based global online apparel retailer ASOS was hurt by currency-exchange issues and accelerated investment in warehouse operations and new markets, which limited near-term profit margin expansion. |
| | | | |
| Prudential Jennison International Opportunities Fund | | | 7 | |
Strategy and Performance Overview (continued)
| | • | | Milan-based Yoox, a leading global luxury fashion e-commerce site, suffered from currency translation and concerns about decelerating growth in luxury goods markets. |
| | • | | Prada’s financial results were compromised as the euro strengthened and currencies of emerging markets—Prada’s greatest source of growth—weakened. Spending on marketing and production pressured near-term margins. |
| | • | | The decline in shares of Galaxy Entertainment Group and Sands China was related to slowing growth in Macao’s gross gaming revenue. Both companies own and operate casinos in Macao, the world’s largest gaming market. |
In financials:
| | • | | One of the UK’s largest transaction-only platforms, Hargreaves Lansdown, an investment firm, was affected by weakening financial market sentiment, which slowed transaction volume. In addition, fee pressures from recent banking regulations and very low interest rates in the UK hurt revenue. |
In energy:
| | • | | Oil equipment and services company Schlumberger declined on worries that declining energy prices might cause customers to curtail future spending growth as cash-flow growth slows. Jennison believes Schlumberger stands to benefit from longer-term increased industry activity, especially deepwater drilling and hydraulic fracturing, that favors its best-in-class technologies and services. |
Were there significant changes to the portfolio?
Over the reporting period, the Fund’s weights increased in health care and information technology, and decreased in consumer discretionary, industrials, and consumer staples. Relative to the MSCI All Country World Index (excluding the United States), the Fund is overweight information technology, consumer discretionary, health care, and industrial, and underweight financials and materials.
By region, the Fund’s weight increased in Developed Asia/Pacific and Developed North America, and decreased in Developed Europe. The Fund is overweight Developed North America, and underweight Developed Asia/Pacific.
| | |
| 8 | | Visit our website at www.prudentialfunds.com |
Comments on Largest Holdings
| 4.7% | Tencent Holdings Ltd., China |
Tencent Holdings is China’s largest and most visited Internet service portal. The company’s dominant position in China’s online gaming and instant messaging markets and its growing e-commerce efforts have resulted in strong fundamental performance.
| 3.9% | Canadian Pacific Railway Ltd., Canada |
Canadian Pacific Railway operates a transcontinental rail line from Vancouver to Montreal and south to Kansas City. Its 14,700 miles of track connect with all other major North American Class I rails and support a broad array of markets, including industrial products, intermodal, coal, sulfur/fertilizers, automobiles, and forest products. Jennison believes the company’s management, which has a record of improving operations and margins at underperforming railroads, is in the early stages of a multiyear turnaround.
| 3.6% | Roche Holding AG, Switzerland |
One of the world’s largest biotechnology companies, Roche develops, makes, and sells therapeutic and diagnostic products for cancer, transplantation, autoimmune diseases, inflammatory diseases, virology, metabolic disorders, and diseases of the central nervous system. The company has a broad, and what Jennison views as promising, immune-oncology drug pipeline. Immune-oncology therapy leverages a patient’s own immune system, which could result in more durable responses to cancers and become the backbone of cancer treatment protocols in the next decade.
Best known for its brand, Zara, Industria de Diseño Textil, or Inditex, integrates textile and fashion design, manufacturing, and distribution. Jennison believes this integration is a competitive advantage as it allows the company to shorten turnaround times and achieve greater flexibility, reducing merchandise stock and fashion risk.
| 3.2% | Alibaba Group Holding Ltd., ADR, China |
One of the world’s largest e-commerce companies, the Alibaba Group operates e-commerce websites in Asia, including Alibaba.com, China’s largest global online wholesale platform for small businesses; Taobao Marketplace, China’s largest online retail website; Tmall.com, China’s largest online third-party platform for brands and retailers; and Web portal China Yahoo! It also provides payment, escrow, and cloud computing services. Jennison believes Alibaba, with its dominant market share, offers an attractive opportunity to invest in the long-term growth of the Chinese e-commerce market, which is meaningfully underpenetrated.
| | | | |
| Prudential Jennison International Opportunities Fund | | | 9 | |
Fees and Expenses (Unaudited)
As a shareholder of the Fund, you incur two types of costs: (1) transaction costs, including sales charges (loads) on purchase payments and redemptions, as applicable, and (2) ongoing costs, including management fees, distribution, and/or service (12b-1) fees, and other Fund expenses, as applicable. This example is intended to help you understand your ongoing costs (in dollars) of investing in the Fund and to compare these costs with the ongoing costs of investing in other mutual funds.
The example is based on an investment of $1,000 invested on May 1, 2014, at the beginning of the period, and held through the six-month period ended October 31, 2014. The example is for illustrative purposes only; you should consult the Prospectus for information on initial and subsequent minimum investment requirements.
Actual Expenses
The first line for each share class in the table on the following page provides information about actual account values and actual expenses. You may use the information on this line, together with the amount you invested, to estimate the expenses that you paid over the period. Simply divide your account value by $1,000 (for example, an $8,600 account value ÷ $1,000 = 8.6), then multiply the result by the number on the first line under the heading “Expenses Paid During the Six-Month Period” to estimate the expenses you paid on your account during this period.
Hypothetical Example for Comparison Purposes
The second line for each share class in the table on the following page provides information about hypothetical account values and hypothetical expenses based on the Fund’s actual expense ratio and an assumed rate of return of 5% per year before expenses, which is not the Fund’s actual return. The hypothetical account values and expenses may not be used to estimate the actual ending account balance or expenses you paid for the period. You may use this information to compare the ongoing costs of investing in the Fund and other funds. To do so, compare this 5% hypothetical example with the 5% hypothetical examples that appear in the shareholder reports of the other funds.
The Fund’s transfer agent may charge additional fees to holders of certain accounts that are not included in the expenses shown in the table on the following page. These fees apply to individual retirement accounts (IRAs) and Section 403(b) accounts. As of the close of the six-month period covered by the table, IRA fees included an annual maintenance fee of $15 per account (subject to a maximum annual maintenance fee of $25 for all accounts held by the same shareholder). Section 403(b) accounts are charged an annual $25 fiduciary maintenance fee. Some of the fees may vary in amount, or may be waived, based on your total account balance or the number of
| | |
| 10 | | Visit our website at www.prudentialfunds.com |
Prudential Investments funds, including the Fund, that you own. You should consider the additional fees that were charged to your Fund account over the six-month period when you estimate the total ongoing expenses paid over the period and the impact of these fees on your ending account value, as these additional expenses are not reflected in the information provided in the expense table. Additional fees have the effect of reducing investment returns.
Please note that the expenses shown in the table are meant to highlight your ongoing costs only and do not reflect any transactional costs such as sales charges (loads). Therefore, the second line for each share class in the table is useful in comparing ongoing costs only and will not help you determine the relative total costs of owning different funds. In addition, if these transactional costs were included, your costs would have been higher.
| | | | | | | | | | | | | | | | | | |
Prudential
Jennison International
Opportunities Fund | | Beginning Account
Value
May 1, 2014 | | | Ending Account
Value
October 31, 2014 | | | Annualized
Expense Ratio
Based on the
Six-Month Period | | | Expenses Paid
During the
Six-Month Period* | |
| | | | | | | | | | | | | | | | | | |
| Class A | | Actual | | $ | 1,000.00 | | | $ | 1,005.40 | | | | 1.60 | % | | $ | 8.09 | |
| | | Hypothetical | | $ | 1,000.00 | | | $ | 1,017.14 | | | | 1.60 | % | | $ | 8.13 | |
| | | | | | | | | | | | | | | | | | |
| Class C | | Actual | | $ | 1,000.00 | | | $ | 1,000.80 | | | | 2.35 | % | | $ | 11.85 | |
| | | Hypothetical | | $ | 1,000.00 | | | $ | 1,013.36 | | | | 2.35 | % | | $ | 11.93 | |
| | | | | | | | | | | | | | | | | | |
| Class Z | | Actual | | $ | 1,000.00 | | | $ | 1,006.10 | | | | 1.35 | % | | $ | 6.83 | |
| | | Hypothetical | | $ | 1,000.00 | | | $ | 1,018.40 | | | | 1.35 | % | | $ | 6.87 | |
*Fund expenses (net of fee waivers or subsidies, if any) for each share class are equal to the annualized expense ratio for each share class (provided in the table), multiplied by the average account value over the period, multiplied by the 184 days in the six-month period ended October 31, 2014, and divided by the 365 days in the Fund’s fiscal year ended October 31, 2014 (to reflect the six-month period). Expenses presented in the table include the expenses of any underlying portfolios in which the Fund may invest.
| | | | |
| Prudential Jennison International Opportunities Fund | | | 11 | |
Fees and Expenses (continued)
The Fund’s annualized expense ratios for the year ended October 31, 2014, are as follows:
| | | | | | | | |
| Class | | Gross Operating Expenses | | | Net Operating Expenses | |
A | | | 1.90 | % | | | 1.60 | % |
C | | | 2.60 | | | | 2.35 | |
Z | | | 1.54 | | | | 1.35 | |
Net operating expenses shown above reflect any fee waivers and/or expense reimbursements. Additional information on Fund expenses and any fee waivers and/or expense reimbursements can be found in the “Financial Highlights” tables in this report and in the Notes to the Financial Statements in this report.
| | |
| 12 | | Visit our website at www.prudentialfunds.com |
Portfolio of Investments
as of October 31, 2014
| | | | | | | | |
| Description | | Shares | | | Value (Note 1) | |
LONG-TERM INVESTMENTS 98.3% | | | | | | | | |
| | |
COMMON STOCKS 98.3% | | | | | | | | |
| | |
Brazil 2.6% | | | | | | | | |
Cielo SA | | | 43,647 | | | $ | 716,734 | |
Estacio Participacoes SA | | | 50,813 | | | | 588,536 | |
| | | | | | | | |
| | | | | | | 1,305,270 | |
| | |
Canada 3.9% | | | | | | | | |
Canadian Pacific Railway Ltd. | | | 9,218 | | | | 1,914,394 | |
| | |
China 13.0% | | | | | | | | |
Alibaba Group Holding Ltd., ADR* | | | 16,058 | | | | 1,583,319 | |
Baidu, Inc., ADR* | | | 4,530 | | | | 1,081,628 | |
Tencent Holdings Ltd. | | | 142,906 | | | | 2,296,824 | |
Vipshop Holdings Ltd., ADR* | | | 6,201 | | | | 1,421,827 | |
| | | | | | | | |
| | | | | | | 6,383,598 | |
| | |
Denmark 2.9% | | | | | | | | |
Novo Nordisk A/S (Class B Stock) | | | 31,815 | | | | 1,438,125 | |
| | |
France 1.9% | | | | | | | | |
Dassault Systemes SA | | | 14,788 | | | | 937,720 | |
| | |
Germany 7.4% | | | | | | | | |
Bayer AG | | | 10,018 | | | | 1,432,790 | |
Continental AG | | | 6,438 | | | | 1,268,065 | |
Wirecard AG | | | 26,321 | | | | 944,377 | |
| | | | | | | | |
| | | | | | | 3,645,232 | |
| | |
Hong Kong 0.9% | | | | | | | | |
Galaxy Entertainment Group Ltd. | | | 66,046 | | | | 451,616 | |
| | |
Indonesia 2.0% | | | | | | | | |
PT Bank Mandiri (Persero) Tbk | | | 813,211 | | | | 698,429 | |
PT Tower Bersama Infrastructure Tbk | | | 325,848 | | | | 239,971 | |
PT Tower Bersama Infrastructure Tbk, 144A(a) | | | 72,770 | | | | 53,591 | |
| | | | | | | | |
| | | | | | | 991,991 | |
| | |
Ireland 1.6% | | | | | | | | |
Shire PLC | | | 11,527 | | | | 773,423 | |
See Notes to Financial Statements.
| | | | |
| Prudential Jennison International Opportunities Fund | | | 13 | |
Portfolio of Investments
as of October 31, 2014 continued
| | | | | | | | |
| Description | | Shares | | | Value (Note 1) | |
COMMON STOCKS (Continued) | | | | | | | | |
| | |
Italy 7.5% | | | | | | | | |
Anima Holding SpA* | | | 53,675 | | | $ | 251,261 | |
Anima Holding SpA, 144A*(a) | | | 46,949 | | | | 219,775 | |
Azimut Holding SpA | | | 39,784 | | | | 931,186 | |
Brembo SpA | | | 10,175 | | | | 337,417 | |
Brunello Cucinelli SpA | | | 18,252 | | | | 369,827 | |
Luxottica Group SpA | | | 22,007 | | | | 1,122,525 | |
Moncler SpA | | | 28,988 | | | | 402,332 | |
Moncler SpA, 144A(a) | | | 3,339 | | | | 46,343 | |
| | | | | | | | |
| | | | | | | 3,680,666 | |
| | |
Japan 9.2% | | | | | | | | |
Fuji Heavy Industries Ltd. | | | 30,908 | | | | 1,028,716 | |
Minebea Co. Ltd. | | | 56,122 | | | | 769,008 | |
Murata Manufacturing Co. Ltd. | | | 11,451 | | | | 1,286,640 | |
Nidec Corp. | | | 7,196 | | | | 475,459 | |
Pigeon Corp. | | | 15,591 | | | | 971,902 | |
| | | | | | | | |
| | | | | | | 4,531,725 | |
| | |
Mexico 2.9% | | | | | | | | |
Alfa SAB de CV (Class A Stock) | | | 282,986 | | | | 903,412 | |
Alsea SAB de CV* | | | 141,972 | | | | 445,011 | |
Alsea SAB de CV, 144A*(a) | | | 23,432 | | | | 73,448 | |
| | | | | | | | |
| | | | | | | 1,421,871 | |
| | |
Philippines 1.6% | | | | | | | | |
Universal Robina Corp. | | | 194,612 | | | | 806,124 | |
| | |
South Africa 2.7% | | | | | | | | |
Aspen Pharmacare Holdings Ltd. | | | 36,068 | | | | 1,288,572 | |
Aspen Pharmacare Holdings Ltd., 144A(a) | | | 1,095 | | | | 39,120 | |
| | | | | | | | |
| | | | | | | 1,327,692 | |
| | |
South Korea 2.5% | | | | | | | | |
NAVER Corp. | | | 1,752 | | | | 1,239,754 | |
| | |
Spain 3.3% | | | | | | | | |
Inditex SA | | | 57,395 | | | | 1,614,697 | |
See Notes to Financial Statements.
| | | | | | | | |
| Description | | Shares | | | Value (Note 1) | |
COMMON STOCKS (Continued) | | | | | | | | |
| | |
Sweden 3.2% | | | | | | | | |
Assa Abloy AB (Class B Stock) | | | 18,927 | | | $ | 1,004,732 | |
Hexagon AB (Class B Stock) | | | 17,521 | | | | 591,257 | |
| | | | | | | | |
| | | | | | | 1,595,989 | |
| | |
Switzerland 5.4% | | | | | | | | |
Novartis AG | | | 9,649 | | | | 895,455 | |
Roche Holding AG | | | 6,055 | | | | 1,786,840 | |
| | | | | | | | |
| | | | | | | 2,682,295 | |
| | |
Thailand 3.7% | | | | | | | | |
CP ALL PCL | | | 536,386 | | | | 749,326 | |
Home Product Center PCL | | | 2,552,003 | | | | 728,696 | |
Minor International PCL | | | 313,280 | | | | 334,249 | |
| | | | | | | | |
| | | | | | | 1,812,271 | |
| | |
United Kingdom 11.0% | | | | | | | | |
ARM Holdings PLC | | | 70,039 | | | | 991,563 | |
Ashtead Group PLC | | | 47,967 | | | | 803,647 | |
BTG PLC* | | | 41,928 | | | | 506,814 | |
Burberry Group PLC | | | 47,596 | | | | 1,169,598 | |
Just Eat PLC* | | | 45,342 | | | | 223,112 | |
Just Eat PLC, 144A*(a) | | | 79,394 | | | | 390,671 | |
St. James’s Place PLC | | | 112,422 | | | | 1,344,257 | |
| | | | | | | | |
| | | | | | | 5,429,662 | |
| | |
United States 9.1% | | | | | | | | |
Jazz Pharmaceuticals PLC* | | | 8,598 | | | | 1,451,686 | |
Michael Kors Holdings Ltd.* | | | 9,416 | | | | 740,004 | |
Schlumberger Ltd. | | | 12,200 | | | | 1,203,652 | |
Stratasys Ltd.* | | | 8,955 | | | | 1,077,824 | |
| | | | | | | | |
| | | | | | | 4,473,166 | |
| | | | | | | | |
TOTAL COMMON STOCKS
(cost $43,898,532) | | | | | | | 48,457,281 | |
| | | | | | | | |
See Notes to Financial Statements.
| | | | |
| Prudential Jennison International Opportunities Fund | | | 15 | |
Portfolio of Investments
as of October 31, 2014 continued
| | | | | | | | |
| Description | | Units | | | Value (Note 1) | |
WARRANTS* | | | | | | | | |
| | |
Thailand | | | | | | | | |
Minor International PCL (Thailand), expiring 12/31/2017
(original cost $0; purchased 10/16/2014)(a)(b)
(cost $0) | | | 15,664 | | | $ | — | |
| | | | | | | | |
TOTAL LONG-TERM INVESTMENTS
(cost $43,898,532) | | | | | | | 48,457,281 | |
| | | | | | | | |
| | |
| | | Shares | | | | |
SHORT-TERM INVESTMENT 1.8% | | | | | | | | |
| | |
AFFILIATED MONEY MARKET MUTUAL FUND | | | | | | | | |
Prudential Investment Portfolios 2 - Prudential Core Taxable Money Market Fund (cost $883,730; Note 3)(c) | | | 883,730 | | | | 883,730 | |
| | | | | | | | |
TOTAL INVESTMENTS 100.1%
(cost $44,782,262; Note 5) | | | | | | | 49,341,011 | |
Liabilities in excess of other assets (0.1)% | | | | | | | (47,258 | ) |
| | | | | | | | |
NET ASSETS 100.0% | | | | | | $ | 49,293,753 | |
| | | | | | | | |
The following abbreviations are used in the portfolio descriptions:
144A—Security was purchased pursuant to Rule 144A under the Securities Act of 1933 and may not be resold subject to that rule except to qualified institutional buyers. Unless otherwise noted, 144A securities are deemed to be liquid.
ADR—American Depositary Receipt
| * | Non-income producing security. |
| (a) | Indicates a security or securities that has been deemed illiquid. |
| (b) | Indicates a restricted security; the aggregate original cost of the restricted securities is $0. The aggregate value of $0 is approximately 0.0% of net assets. |
| (c) | Prudential Investments LLC, the manager of the Series, also serves as manager of the Prudential Investment Portfolios 2 - Prudential Core Taxable Money Market Fund. |
Various inputs are used in determining the value of the Series’ investments. These inputs are summarized in the three broad levels listed below.
Level 1—quoted prices generally in active markets for identical securities.
Level 2—quoted prices for similar securities, interest rates and yield curves, prepayment speeds, foreign currency exchange rates and other significant observable inputs.
Level 3—significant unobservable inputs for securities valued in accordance with Board approved fair valuation procedures.
See Notes to Financial Statements.
The following is a summary of the inputs used as of October 31, 2014 in valuing such portfolio securities:
| | | | | | | | | | | | |
| | | Level 1 | | | Level 2 | | | Level 3 | |
Investments in Securities | | | | | | | | | | | | |
Common Stocks | | | | | | | | | | | | |
Brazil | | $ | 1,305,270 | | | $ | — | | | $ | — | |
Canada | | | 1,914,394 | | | | — | | | | — | |
China | | | 4,086,774 | | | | 2,296,824 | | | | — | |
Denmark | | | — | | | | 1,438,125 | | | | — | |
France | | | — | | | | 937,720 | | | | — | |
Germany | | | — | | | | 3,645,232 | | | | — | |
Hong Kong | | | — | | | | 451,616 | | | | — | |
Indonesia | | | 239,971 | | | | 752,020 | | | | — | |
Ireland | | | — | | | | 773,423 | | | | — | |
Italy | | | — | | | | 3,680,666 | | | | — | |
Japan | | | — | | | | 4,531,725 | | | | — | |
Mexico | | | 1,348,423 | | | | 73,448 | | | | — | |
Philippines | | | — | | | | 806,124 | | | | — | |
South Africa | | | — | | | | 1,327,692 | | | | — | |
South Korea | | | — | | | | 1,239,754 | | | | — | |
Spain | | | — | | | | 1,614,697 | | | | — | |
Sweden | | | — | | | | 1,595,989 | | | | — | |
Switzerland | | | — | | | | 2,682,295 | | | | — | |
Thailand | | | — | | | | 1,812,271 | | | | — | |
United Kingdom | | | 223,112 | | | | 5,206,550 | | | | — | |
United States | | | 4,473,166 | | | | — | | | | — | |
Warrants | | | | | | | | | | | | |
Thailand | | | — | | | | — | | | | — | |
Affiliated Money Market Mutual Fund | | | 883,730 | | | | — | | | | — | |
| | | | | | | | | | | | |
Total | | $ | 14,474,840 | | | $ | 34,866,171 | | | $ | — | |
| | | | | | | | | | | | |
See Notes to Financial Statements.
| | | | |
| Prudential Jennison International Opportunities Fund | | | 17 | |
Portfolio of Investments
as of October 31, 2014 continued
The industry classification of investments and liabilities in excess of other assets shown as a percentage of net assets as of October 31, 2014 was as follows (Unaudited):
| | | | |
Pharmaceuticals | | | 19.5 | % |
Internet Software & Services | | | 13.9 | |
Textiles, Apparel & Luxury Goods | | | 7.9 | |
Specialty Retail | | | 4.8 | |
Road & Rail | | | 3.9 | |
Electronic Equipment, Instruments & Components | | | 3.8 | |
IT Services | | | 3.3 | |
Auto Components | | | 3.3 | |
Internet & Catalog Retail | | | 2.9 | |
Capital Markets | | | 2.8 | |
Insurance | | | 2.7 | |
Hotels, Restaurants & Leisure | | | 2.7 | |
Energy Equipment & Services | | | 2.4 | |
Technology Hardware, Storage & Peripherals | | | 2.2 | |
Automobiles | | | 2.1 | |
Building Products | | | 2.0 | |
Semiconductors & Semiconductor Equipment | | | 2.0 | % |
Household Products | | | 2.0 | |
Software | | | 1.9 | |
Industrial Conglomerates | | | 1.8 | |
Affiliated Money Market Mutual Fund | | | 1.8 | |
Food Products | | | 1.6 | |
Trading Companies & Distributors | | | 1.6 | |
Machinery | | | 1.5 | |
Food & Staples Retailing | | | 1.5 | |
Banks | | | 1.4 | |
Diversified Consumer Services | | | 1.2 | |
Electrical Equipment | | | 1.0 | |
Wireless Telecommunication Services | | | 0.6 | |
| | | | |
| | | 100.1 | |
Liabilities in excess of other assets | | | (0.1 | ) |
| | | | |
| | | 100.0 | % |
| | | | |
The Series invested in derivative instruments during the reporting period. The primary type of risk associated with these derivative instruments is equity risk. The fair value of derivative instruments was $0. There was no impact to financial performance in the Statement of Assets and Liabilities and Statement of Operations.
See Notes to Financial Statements.
PRUDENTIAL INVESTMENTS»MUTUAL FUNDS
FINANCIAL STATEMENTS
ANNUAL REPORT · OCTOBER 31, 2014
Prudential Jennison International Opportunities Fund
Statement of Assets & Liabilities
as of October 31, 2014
| | | | |
Assets | | | | |
Investments at value: | | | | |
Unaffiliated Investments (cost $43,898,532) | | $ | 48,457,281 | |
Affiliated Investments (cost $883,730) | | | 883,730 | |
Foreign currency, at value (cost $3,833) | | | 3,833 | |
Tax reclaim receivable | | | 26,970 | |
Dividends receivable | | | 19,982 | |
Receivable for Series shares sold | | | 1,524 | |
Prepaid expenses | | | 727 | |
| | | | |
Total assets | | | 49,394,047 | |
| | | | |
| |
Liabilities | | | | |
Accrued expenses | | | 83,661 | |
Management fee payable | | | 15,600 | |
Distribution fee payable | | | 724 | |
Affiliated transfer agent fee payable | | | 309 | |
| | | | |
Total liabilities | | | 100,294 | |
| | | | |
| |
Net Assets | | $ | 49,293,753 | |
| | | | |
| | | | | |
Net assets were comprised of: | | | | |
Common stock, at par | | $ | 37,560 | |
Paid-in capital in excess of par | | | 46,168,154 | |
| | | | |
| | | 46,205,714 | |
Accumulated net investment loss | | | (36,463 | ) |
Accumulated net realized loss on investment and foreign currency transactions | | | (1,431,290 | ) |
Net unrealized appreciation on investments and foreign currencies | | | 4,555,792 | |
| | | | |
Net assets, October 31, 2014 | | $ | 49,293,753 | |
| | | | |
See Notes to Financial Statements.
| | | | |
| |
Class A | | | | |
Net asset value and redemption price per share
($1,833,162 ÷ 140,413 shares of common stock issued and outstanding) | | $ | 13.06 | |
Maximum sales charge (5.50% of offering price) | | | 0.76 | |
| | | | |
Maximum offering price to public | | $ | 13.82 | |
| | | | |
| |
Class C | | | | |
Net asset value, offering price and redemption price per share
($464,640 ÷ 36,233 shares of common stock issued and outstanding) | | $ | 12.82 | |
| | | | |
| |
Class Z | | | | |
Net asset value, offering price and redemption price per share
($46,995,951 ÷ 3,579,373 shares of common stock issued and outstanding) | | $ | 13.13 | |
| | | | |
See Notes to Financial Statements.
| | | | |
| Prudential Jennison International Opportunities Fund | | | 21 | |
Statement of Operations
Year Ended October 31, 2014
| | | | |
Net Investment Income | | | | |
Income | | | | |
Unaffiliated dividend income (net of foreign withholding taxes of $49,871) | | $ | 491,399 | |
Affiliated dividend income | | | 2,205 | |
| | | | |
Total income | | | 493,604 | |
| | | | |
| |
Expenses | | | | |
Management fee | | | 365,963 | |
Distribution fee—Class A | | | 4,401 | |
Distribution fee—Class C | | | 3,616 | |
Custodian’s fees and expenses | | | 104,000 | |
Registration fees | | | 42,000 | |
Audit fee | | | 26,000 | |
Transfer agent’s fees and expenses (including affiliated expense of $1,500) | | | 19,000 | |
Shareholders’ reports | | | 16,000 | |
Legal fees and expenses | | | 15,000 | |
Directors’ fees | | | 13,000 | |
Insurance expenses | | | 1,000 | |
Miscellaneous | | | 26,112 | |
| | | | |
Total expenses | | | 636,092 | |
Less: Expense reimbursement | | | (79,043 | ) |
Distribution fee waiver—Class A | | | (733 | ) |
| | | | |
Net expenses | | | 556,316 | |
| | | | |
Net investment loss | | | (62,712 | ) |
| | | | |
| |
Realized And Unrealized Gain (Loss) On Investment And Foreign Currency Transactions | | | | |
Net realized loss on: | | | | |
Investment transactions | | | (1,428,795 | ) |
Foreign currency transactions | | | (22,727 | ) |
| | | | |
| | | (1,451,522 | ) |
| | | | |
Net change in unrealized appreciation (depreciation) on: | | | | |
Investments | | | 1,190,362 | |
Foreign currencies | | | (3,994 | ) |
| | | | |
| | | 1,186,368 | |
| | | | |
Net loss on investment and foreign currency transactions | | | (265,154 | ) |
| | | | |
Net Decrease In Net Assets Resulting From Operations | | $ | (327,866 | ) |
| | | | |
See Notes to Financial Statements.
Statement of Changes in Net Assets
| | | | | | | | |
| | | Year Ended October 31, | |
| | | 2014 | | | 2013 | |
Increase (Decrease) In Net Assets | | | | | | | | |
Operations | | | | | | | | |
Net investment income (loss) | | $ | (62,712 | ) | | $ | 16,861 | |
Net realized gain (loss) on investment and foreign currency transactions | | | (1,451,522 | ) | | | 734,198 | |
Net change in unrealized appreciation (depreciation) on investments and foreign currencies | | | 1,186,368 | | | | 1,933,930 | |
| | | | | | | | |
Net increase (decrease) in net assets resulting from operations | | | (327,866 | ) | | | 2,684,989 | |
| | | | | | | | |
| | |
Dividends and Distributions (Note 1) | | | | | | | | |
Dividends from net investment income | | | | | | | | |
Class A | | | — | | | | (532 | ) |
Class C | | | — | | | | (54 | ) |
Class Z | | | — | | | | (56,371 | ) |
| | | | | | | | |
| | | — | | | | (56,957 | ) |
| | | | | | | | |
Distributions from net realized gains | | | | | | | | |
Class A | | | (37,150 | ) | | | — | |
Class C | | | (8,564 | ) | | | — | |
Class Z | | | (594,595 | ) | | | — | |
| | | | | | | | |
| | | (640,309 | ) | | | — | |
| | | | | | | | |
| | |
Series share transactions (Note 6) | | | | | | | | |
Net proceeds from shares sold | | | 34,825,121 | | | | 3,196,495 | |
Net asset value of shares issued in reinvestment of dividends and distributions | | | 625,061 | | | | 56,957 | |
Cost of shares reacquired | | | (2,744,792 | ) | | | (392,418 | ) |
| | | | | | | | |
Net increase in net assets from Series share transactions | | | 32,705,390 | | | | 2,861,034 | |
| | | | | | | | |
Total increase | | | 31,737,215 | | | | 5,489,066 | |
| | |
Net Assets: | | | | | | | | |
Beginning of year | | | 17,556,538 | | | | 12,067,472 | |
| | | | | | | | |
End of year | | $ | 49,293,753 | | | $ | 17,556,538 | |
| | | | | | | | |
See Notes to Financial Statements.
| | | | |
| Prudential Jennison International Opportunities Fund | | | 23 | |
Notes to Financial Statements
Prudential World Fund, Inc. (the “Fund”) is an open-end management investment company, registered under the Investment Company Act of 1940, as amended, (“1940 Act”) and currently consists of seven series: Prudential Jennison International Opportunities Fund (the “Series”), Prudential Jennison Global Infrastructure Fund, Prudential International Equity Fund, Prudential International Value Fund, Prudential Jennison Global Opportunities Fund, Prudential Emerging Markets Debt Local Currency Fund and Prudential Jennison Emerging Markets Equity Fund. These financial statements relate to the Prudential Jennison International Opportunities Fund. The financial statements of the other series are not presented herein. The Series commenced investment operations on June 5, 2012.
The investment objective of the Series is to seek long-term growth of capital.
Note 1. Accounting Policies
The following accounting policies conform to U.S. generally accepted accounting principles. The Series consistently follows such policies in the preparation of its financial statements.
Securities Valuation: The Series holds securities and other assets that are fair valued at the close of each day the New York Stock Exchange (“NYSE”) is open for trading. Fair value is the price that would be received to sell an asset or paid to transfer a liability in an orderly transaction between market participants on the measurement date. The Board of Directors (the “Board”) has adopted Valuation Procedures for security valuation under which fair valuation responsibilities have been delegated to Prudential Investments LLC (“PI” or “Manager”). Under the current Valuation Procedures, the established Valuation Committee is responsible for supervising the valuation of portfolio securities and other assets. The Valuation Procedures permit the Series to utilize independent pricing vendor services, quotations from market makers, and alternative valuation methods when market quotations are either not readily available or not deemed representative of fair value. A record of the Valuation Committee’s actions is subject to the Board’s review, approval, and ratification at its next regularly-scheduled quarterly meeting.
Various inputs determine how the Series’ investments are valued, all of which are categorized according to the three broad levels (Level 1, 2, or 3) detailed in the table following the Portfolio of Investments.
Common and preferred stocks, exchange-traded funds, and derivative instruments such as futures or options that are traded on a national securities exchange are valued at the last sale price as of the close of trading on the applicable exchange. Securities traded via NASDAQ are valued at the NASDAQ official closing price. To the extent these securities are valued at the last sale price or NASDAQ official closing price, they are classified as Level 1 in the fair value hierarchy.
In the event that no sale or official closing price on valuation date exists, these securities are generally valued at the mean between the last reported bid and asked prices, or at the last bid price in the absence of an asked price. These securities are classified as Level 2 in the fair value hierarchy, as the inputs are observable and considered to be significant to the valuation.
Common and preferred stocks traded on foreign securities exchanges are valued using pricing vendor services that provide model prices derived using adjustment factors based on information such as local closing price, relevant general and sector indices, currency fluctuations, depositary receipts, and futures, as applicable. Securities valued using such model prices are classified as Level 2 in the fair value hierarchy, as the adjustment factors are observable and considered to be significant to the valuation. Securities not valued using such model prices are valued in accordance with exchange-traded common and preferred stocks discussed above.
Investments in open-end, non-exchange-traded mutual funds are valued at their net asset values as of the close of the NYSE on the date of valuation. These securities are classified as Level 1 in the fair value hierarchy since they may be purchased or sold at their net asset values on the date of valuation.
Fixed income securities traded in the over-the-counter market are generally valued at prices provided by approved independent pricing vendors. The pricing vendors provide these prices after evaluating observable inputs including, but not limited to yield curves, yield spreads, credit ratings, deal terms, tranche level attributes, default rates, cash flows, prepayment speeds, broker/dealer quotations, and reported trades. Securities valued using such vendor prices are classified as Level 2 in the fair value hierarchy.
Over-the-counter derivative instruments are generally valued using pricing vendor services, which derive the valuation based on inputs such as underlying asset prices, indices, spreads, interest rates, and exchange rates. These instruments are categorized as Level 2 in the fair value hierarchy.
| | | | |
| Prudential Jennison International Opportunities Fund | | | 25 | |
Notes to Financial Statements
continued
Centrally cleared swaps listed or traded on a multilateral or trade facility platform, such as a registered exchange, are valued at the daily settlement price determined by the respective exchange. These securities are classified as Level 2 in the fair value hierarchy, as the prices marked at the official settle are not public.
Securities and other assets that cannot be priced according to the methods described above are valued based on pricing methodologies approved by the Board. In the event that significant unobservable inputs are used when determining such valuations, the securities will be classified as Level 3 in the fair value hierarchy.
When determining the fair value of securities, some of the factors influencing the valuation include: the nature of any restrictions on disposition of the securities; assessment of the general liquidity of the securities; the issuer’s financial condition and the markets in which it does business; the cost of the investment; the size of the holding and the capitalization of the issuer; the prices of any recent transactions or bids/offers for such securities or any comparable securities; any available analyst media or other reports or information deemed reliable by the investment adviser regarding the issuer or the markets or industry in which it operates. Using fair value to price securities may result in a value that is different from a security’s most recent closing price and from the price used by other mutual funds to calculate their net asset values.
Foreign Currency Translation: The books and records of the Series are maintained in U.S. dollars. Foreign currency amounts are translated into U.S. dollars on the following basis:
(i) market value of investment securities, other assets and liabilities—at the current rates of exchange.
(ii) purchases and sales of investment securities, income and expenses—at the rates of exchange prevailing on the respective dates of such transactions.
Although the net assets of the Series are presented at the foreign exchange rates and market values at the close of the period, the Series does not isolate that portion of the results of operations arising as a result of changes in the foreign exchange rates from the fluctuations arising from changes in the market prices of long-term portfolio securities held at the end of the period. Similarly, the Series does not isolate the effect of changes in foreign exchange rates from the fluctuations arising from changes in the market prices of long-term portfolio securities sold during the period. Accordingly,
these realized foreign currency gains or losses are included in the reported net realized gains or losses on investment transactions.
Net realized gains or losses on foreign currency transactions represent net foreign exchange gains or losses from sales and maturities of short-term securities and forward currency contracts, disposition of foreign currencies, currency gains or losses realized between the trade and settlement dates on security transactions, and the difference between the amounts of interest, dividends and foreign withholding taxes recorded on the Series’ books and the U.S. dollar equivalent amounts actually received or paid. Net unrealized currency gains or losses from valuing foreign currency denominated assets and liabilities (other than investments) at period end exchange rates are reflected as a component of net unrealized appreciation (depreciation) on foreign currencies.
Concentration of Risk: Foreign security and currency transactions may involve certain considerations and risks not typically associated with those of domestic origin as a result of, among other factors, the possibility of political and economic instability or the level of governmental supervision and regulation of foreign securities markets.
Warrants and Rights: The Series may hold warrants and rights acquired either through a direct purchase, included as part of a private placement, or pursuant to corporate actions. Warrants and rights entitle the holder to buy a proportionate amount of common stock, or such other security that the issuer may specify, at a specific price and time through the expiration dates. The Series holds such warrants and rights as long positions until exercised, sold or expired. Warrants and rights are valued at fair value in accordance with the Board of Directors’ approved fair valuation procedures.
Securities Transactions and Net Investment Income: Securities transactions are recorded on the trade date. Realized gains or losses from investment and currency transactions are calculated on the identified cost basis. Dividend income is recorded on the ex-dividend date. Interest income, including amortization of premium and accretion of discount on debt securities, as required, is recorded on an accrual basis. Expenses are recorded on an accrual basis, which may require the use of certain estimates by management that may differ from actual.
Net investment income or loss (other than distribution fees, which are charged directly to the respective class) and unrealized and realized gains or losses are allocated daily to each class of shares based upon the relative proportion of adjusted net assets of each class at the beginning of the day.
| | | | |
| Prudential Jennison International Opportunities Fund | | | 27 | |
Notes to Financial Statements
continued
Dividends and Distributions: The Series expects to pay dividends of net investment income and distributions from net realized capital and currency gains, if any, annually. Dividends and distributions to shareholders, which are determined in accordance with federal income tax regulations and which may differ from generally accepted accounting principles, are recorded on the ex-dividend date.
Taxes: For federal income tax purposes, each Series in the Fund is treated as a separate taxpaying entity. It is each Series’ policy to continue to meet the requirements of the Internal Revenue Code applicable to regulated investment companies and to distribute all of its taxable net investment income and capital gains, if any, to its shareholders. Therefore, no federal income tax provision is required. Withholding taxes on foreign dividends are recorded net of reclaimable amounts, at the time the related income is earned.
Estimates: The preparation of the financial statements requires management to make estimates and assumptions that affect the reported amounts and disclosures in the financial statements. Actual results could differ from those estimates.
Note 2. Agreements
The Fund has a management agreement for the Series with PI. Pursuant to this agreement, PI has responsibility for all investment advisory services and supervises the subadvisor’s performance of such services. PI has entered into a subadvisory agreement with Jennison Associates LLC (“Jennison”). The subadvisory agreement provides that Jennison furnishes investment advisory services in connection with the management of the Series. In connection therewith, Jennison is obligated to keep certain books and records of the Series. PI pays for the services of Jennison, the cost of compensation of officers of the Series, occupancy and certain clerical and bookkeeping costs of the Series. The Series bears all other costs and expenses.
The management fee paid to PI is computed daily and payable monthly at an annual rate of .90% of the Series’ average daily net assets.
PI has contractually agreed through February 29, 2016 to limit net annual Series operating expenses (excluding distribution and service (12b-1) fees, extraordinary and certain other expenses such as taxes, interest and brokerage commissions) to each class of shares to 1.35% of the Series’ average daily net assets.
The Series has a distribution agreement with Prudential Investment Management Services LLC (“PIMS”), which acts as the distributor of the Class A, Class C and Class Z shares of the Series. The Series compensates PIMS for distributing and servicing the Series’ Class A and Class C shares, pursuant to plans of distribution (the “Class A and C Plans”), regardless of expenses actually incurred by PIMS. The distribution fees are accrued daily and payable monthly. No distribution or service fees are paid to PIMS as distributor of the Class Z shares of the Series.
Pursuant to the Class A and C Plans, the Series compensates PIMS for distribution related activities at an annual rate of up to .30% and 1% of the average daily net assets of the Class A and C shares, respectively. PIMS has contractually agreed to limit such fees to .25% of the average daily net assets of the Class A shares through February 29, 2016.
PIMS has advised the Series that it has received $26,806 in front-end sales charges resulting from sales of Class A shares during the year ended October 31, 2014. From these fees, PIMS paid such sales charges to broker-dealers, which in turn paid commissions to salespersons and incurred other distribution costs.
PIMS has advised the Series that for the year ended October 31, 2014, it has received $188 in contingent deferred sales charges imposed upon redemptions by certain Class C shareholders.
PI, PIMS and Jennison are indirect, wholly-owned subsidiaries of Prudential Financial, Inc. (“Prudential”).
Note 3. Other Transactions with Affiliates
Prudential Mutual Fund Services LLC (“PMFS”), an affiliate of PI and an indirect, wholly-owned subsidiary of Prudential, serves as the Series’ transfer agent. Transfer agent’s fees and expenses on the Statement of Operations include certain out-of-pocket expenses paid to non-affiliates, where applicable.
The Series invests in the Prudential Core Taxable Money Market Fund (the “Core Fund”), a portfolio of the Prudential Investment Portfolios 2, registered under the 1940 Act and managed by PI. Earnings from the Core Fund are disclosed on the Statement of Operations as affiliated dividend income.
| | | | |
| Prudential Jennison International Opportunities Fund | | | 29 | |
Notes to Financial Statements
continued
Note 4. Portfolio Securities
Purchases and sales of portfolio securities, other than short-term investments, for the year ended October 31, 2014 were $56,215,291 and $24,588,065, respectively.
Note 5. Distributions and Tax Information
Distributions to shareholders, which are determined in accordance with federal income tax regulations and which may differ from generally accepted accounting principles, are recorded on the ex-dividend date. In order to present accumulated net investment loss, accumulated net realized loss on investment and foreign currency transactions and paid-in capital in excess of par on the Statement of Assets and Liabilities that more closely represent their tax character, certain adjustments have been made to accumulated net investment loss, accumulated net realized loss on investment and foreign currency transactions and paid-in capital in excess of par. For the year ended October 31, 2014, the adjustments were to decrease accumulated net investment loss by $28,238, decrease accumulated net realized loss on investment and foreign currency transactions by $31,498 and decrease paid-in capital in excess of par by $59,736 primarily due to the difference between certain transactions involving foreign currencies, reclassification of distributions and net operating losses. Net investment loss, net realized loss on investment and foreign currency transactions and net assets were not affected by this change.
For the year ended October 31, 2014, the tax character of dividends paid as reflected in the Statement of Changes in Net Assets was $451,314 of ordinary income and $188,995 of long-term capital gain. For the year ended October 31, 2013, the tax character of dividends paid as reflected in the Statement of Changes in Net Assets was $56,957 of ordinary income.
As of October 31, 2014, there were no accumulated undistributed earnings on a tax basis.
The United States federal income tax basis of the Series’ investments and the net unrealized appreciation as of October 31, 2014 were as follows:
| | | | | | | | | | |
Tax Basis | | Appreciation | | Depreciation | | Net
Unrealized
Appreciation | | Other Cost
Basis
Adjustments | | Total Net
Unrealized
Appreciation |
| $44,792,461 | | $6,144,308 | | $(1,595,758) | | $4,548,550 | | $(2,952) | | $4,545,598 |
The difference between book basis and tax basis is primarily attributable to deferred losses on wash sales. The other cost basis adjustments are primarily attributable to appreciation (depreciation) of foreign currencies and mark-to-market of receivables and payables.
For federal income tax purposes, the Fund had a capital loss carryforward as of October 31, 2014 of approximately $1,421,000 which can be carried forward for an unlimited period. No capital gains distributions are expected to be paid to shareholders until net gains have been realized in excess of such losses.
The Fund elected to treat certain late-year ordinary income losses of approximately $36,000 as having been incurred in the following fiscal year (October 31, 2015).
Management has analyzed the Series’ tax positions taken on federal income tax returns for all open tax years and has concluded that no provision for income tax is required in the Series’ financial statements for the current reporting period. The Series’ federal and state income and federal excise tax returns for tax years for which the applicable statutes of limitations have not expired are subject to examination by the Internal Revenue Service and state departments of revenue.
Note 6. Capital
The Series offers Class A, Class C and Class Z shares. Class A shares are subject to a maximum front-end sales charge of 5.50%. Investors who purchase Class A shares in an amount of $1 million or more and sell these shares within 12 months of purchase are not subject to an initial sales charge but are subject to a contingent deferred sales charge (“CDSC”) of 1%. The Class A CDSC is waived for purchases by certain retirement or benefits plans. The CDSC for Class C shares is 1% for shares redeemed within 12 months of purchase. Class Z shares are not subject to any sales or redemption charge and are offered exclusively for sale to a limited group of investors. A special exchange privilege is also available for shareholders who qualified to purchase Class A shares at net asset value.
Under certain circumstances, an exchange may be made from specified share classes of the Series to one or more other share classes of the Series as presented in the table of transactions in shares of capital stock.
At October 31, 2014, Prudential Financial, Inc. through its affiliates owned 1,041 Class C shares and 1,041,033 Class Z shares of the Series.
| | | | |
| Prudential Jennison International Opportunities Fund | | | 31 | |
Notes to Financial Statements
continued
There are 600 million shares of common stock, $.01 par value per share, divided into three classes, designated Class A, Class C and Class Z common stock, each of which consists of 200 million authorized shares.
Transactions in shares of common stock were as follows:
| | | | | | | | |
Class A | | Shares | | | Amount | |
Year ended October 31, 2014: | | | | | | | | |
Shares sold | | | 93,987 | | | $ | 1,237,390 | |
Shares issued in reinvestment of dividends and distributions | | | 2,534 | | | | 33,628 | |
Shares reacquired | | | (21,896 | ) | | | (286,332 | ) |
| | | | | | | | |
Net increase (decrease) in shares outstanding | | | 74,625 | | | $ | 984,686 | |
| | | | | | | | |
Year ended October 31, 2013: | | | | | | | | |
Shares sold | | | 65,533 | | | $ | 824,730 | |
Shares issued in reinvestment of dividends and distributions | | | 45 | | | | 532 | |
Shares reacquired | | | (8,111 | ) | | | (101,961 | ) |
| | | | | | | | |
Net increase (decrease) in shares outstanding | | | 57,467 | | | $ | 723,301 | |
| | | | | | | | |
Class C | | | | | | |
Year ended October 31, 2014: | | | | | | | | |
Shares sold | | | 25,563 | | | $ | 337,317 | |
Shares issued in reinvestment of dividends and distributions | | | 627 | | | | 8,234 | |
Shares reacquired | | | (3,468 | ) | | | (43,798 | ) |
| | | | | | | | |
Net increase (decrease) in shares outstanding | | | 22,722 | | | $ | 301,753 | |
| | | | | | | | |
Year ended October 31, 2013: | | | | | | | | |
Shares sold | | | 13,478 | | | $ | 171,150 | |
Shares issued in reinvestment of dividends and distributions | | | 5 | | | | 54 | |
Shares reacquired | | | (985 | ) | | | (12,138 | ) |
| | | | | | | | |
Net increase (decrease) in shares outstanding | | | 12,498 | | | $ | 159,066 | |
| | | | | | | | |
Class Z | | | | | | |
Year ended October 31, 2014: | | | | | | | | |
Shares sold | | | 2,499,565 | | | $ | 33,250,414 | |
Shares issued in reinvestment of dividends and distributions | | | 43,784 | | | | 583,199 | |
Shares reacquired | | | (180,716 | ) | | | (2,414,662 | ) |
| | | | | | | | |
Net increase (decrease) in shares outstanding | | | 2,362,633 | | | $ | 31,418,951 | |
| | | | | | | | |
Year ended October 31, 2013: | | | | | | | | |
Shares sold | | | 177,162 | | | $ | 2,200,615 | |
Shares issued in reinvestment of dividends and distributions | | | 4,798 | | | | 56,371 | |
Shares reacquired | | | (22,112 | ) | | | (278,319 | ) |
| | | | | | | | |
Net increase (decrease) in shares outstanding | | | 159,848 | | | $ | 1,978,667 | |
| | | | | | | | |
Note 7. Borrowings
The Series, along with other affiliated registered investment companies (the “Funds”), is a party to a Syndicated Credit Agreement (“SCA”) with a group of banks. The purpose of the SCA is to provide an alternative source of temporary funding for capital share redemptions. The SCA provides for a commitment of $900 million for the period October 9, 2014 through October 8, 2015. The Funds pay an annualized commitment fee of .075% of the unused portion of the SCA. Prior to October 9, 2014, the Funds had another SCA that provided a commitment of $900 million and the Funds paid an annualized commitment fee of .08% of the unused portion of the SCA. Interest on any borrowings under the SCA is paid at contracted market rates. The commitment fee for the unused amount is accrued daily and paid quarterly.
The Series did not utilize the SCA during the year ended October 31, 2014.
| | | | |
| Prudential Jennison International Opportunities Fund | | | 33 | |
Financial Highlights
| | | | | | | | | | | | | | |
| Class A Shares | | | | | | | | | | | |
| | | Year Ended October 31, | | | | | June 5,
2012(a)
through
October 31, | |
| | | 2014(b) | | | 2013(b) | | | | | 2012 | |
| Per Share Operating Performance: | | | | | | | | | | | | | | |
| Net Asset Value, Beginning Of Period | | | $13.51 | | | | $11.30 | | | | | | $10.00 | |
| Income (loss) from investment operations: | | | | | | | | | | | | | | |
| Net investment loss | | | (.06 | ) | | | (.01 | ) | | | | | (.01 | ) |
| Net realized and unrealized gain on investment transactions | | | .09 | | | | 2.27 | | | | | | 1.31 | |
| Total from investment operations | | | .03 | | | | 2.26 | | | | | | 1.30 | |
| Less Dividends and Distributions: | | | | | | | | | | | | | | |
| Dividends from net investment income | | | - | | | | (.05 | ) | | | | | - | |
| Distributions from net realized gains | | | (.48 | ) | | | - | | | | | | - | |
| Total dividends and distributions | | | (.48 | ) | | | (.05 | ) | | | | | - | |
| Net asset value, end of period | | | $13.06 | | | | $13.51 | | | | | | $11.30 | |
| Total Return(c): | | | .20% | | | | 20.04% | | | | | | 13.00% | |
| |
| Ratios/Supplemental Data: | |
| Net assets, end of period (000) | | | $1,833 | | | | $889 | | | | | | $94 | |
| Average net assets (000) | | | $1,467 | | | | $356 | | | | | | $32 | |
| Ratios to average net assets(d): | | | | | | | | | | | | | | |
| Expenses after waivers and/or expense reimbursement | | | 1.60% | | | | 1.60% | | | | | | 1.60% | (e) |
| Expenses before waivers and/or expense reimbursement | | | 1.90% | | | | 3.16% | | | | | | 4.42% | (e) |
| Net investment loss | | | (.48)% | | | | (.08)% | | | | | | (.61)% | (e) |
| Portfolio turnover rate | | | 61% | | | | 86% | | | | | | 28% | (f) |
(a) Commencement of Series.
(b) Calculated based on average shares outstanding during the period.
(c) Total return does not consider the effects of sales loads. Total return is calculated assuming a purchase of a share on the first day and a sale on the last day of each period reported, and includes reinvestment of dividends and distributions. Total returns may reflect adjustments to conform to generally accepted accounting principles. Total returns for periods less than a full year are not annualized.
(d) Does not include expenses of the underlying fund in which the Series invests.
(e) Annualized.
(f) Not annualized.
See Notes to Financial Statements.
| | | | | | | | | | | | | | |
| Class C Shares | | | |
| | | Year Ended October 31, | | | | | June 5,
2012(a)
through
October 31, | |
| | | 2014(b) | | | 2013(b) | | | | | 2012 | |
| Per Share Operating Performance: | | | | | | | | | | | | | | |
| Net Asset Value, Beginning Of Period | | | $13.37 | | | | $11.27 | | | | | | $10.00 | |
| Income (loss) from investment operations: | | | | | | | | | | | | | | |
| Net investment loss | | | (.16 | ) | | | (.14 | ) | | | | | (.05 | ) |
| Net realized and unrealized gain on investment transactions | | | .09 | | | | 2.29 | | | | | | 1.32 | |
| Total from investment operations | | | (.07 | ) | | | 2.15 | | | | | | 1.27 | |
| Less Dividends and Distributions: | | | | | | | | | | | | | | |
| Dividends from net investment income | | | - | | | | (.05 | ) | | | | | - | |
| Distributions from net realized gains | | | (.48 | ) | | | - | | | | | | - | |
| Total dividends and distributions | | | (.48 | ) | | | (.05 | ) | | | | | - | |
| Net asset value, end of period | | | $12.82 | | | | $13.37 | | | | | | $11.27 | |
| Total Return(c): | | | (.57)% | | | | 19.11% | | | | | | 12.70% | |
| |
| Ratios/Supplemental Data: | | | | | | | | | | | |
| Net assets, end of period (000) | | | $465 | | | | $181 | | | | | | $11 | |
| Average net assets (000) | | | $362 | | | | $38 | | | | | | $11 | |
| Ratios to average net assets(d): | | | | | | | | | | | | | | |
| Expenses after waivers and/or expense reimbursement | | | 2.35% | | | | 2.35% | | | | | | 2.35% | (e) |
| Expenses before waivers and/or expense reimbursement | | | 2.60% | | | | 4.09% | | | | | | 5.29% | (e) |
| Net investment loss | | | (1.21)% | | | | (1.12)% | | | | | | (1.16)% | (e) |
| Portfolio turnover rate | | | 61% | | | | 86% | | | | | | 28% | (f) |
(a) Commencement of Series.
(b) Calculated based on average shares outstanding during the period.
(c) Total return does not consider the effects of sales loads. Total return is calculated assuming a purchase of a share on the first day and a sale on the last day of each period reported, and includes reinvestment of dividends and distributions. Total returns may reflect adjustments to conform to generally accepted accounting principles. Total returns for periods less than a full year are not annualized.
(d) Does not include expenses of the underlying fund in which the Series invests.
(e) Annualized.
(f) Not annualized.
See Notes to Financial Statements.
| | | | |
| Prudential Jennison International Opportunities Fund | | | 35 | |
Financial Highlights
continued
| | | | | | | | | | | | | | |
| Class Z Shares | | | |
| | | Year Ended October 31, | | | | | June 5,
2012(a)
through
October 31, | |
| | | 2014(b) | | | 2013(b) | | | | | 2012 | |
| Per Share Operating Performance: | | | | | | | | | | | | | | |
| Net Asset Value, Beginning Of Period | | | $13.55 | | | | $11.32 | | | | | | $10.00 | |
| Income (loss) from investment operations: | | | | | | | | | | | | | | |
| Net investment income (loss) | | | (.02 | ) | | | .02 | | | | | | (.01 | ) |
| Net realized and unrealized gain on investment transactions | | | .08 | | | | 2.26 | | | | | | 1.33 | |
| Total from investment operations | | | .06 | | | | 2.28 | | | | | | 1.32 | |
| Less Dividends and Distributions: | | | | | | | | | | | | | | |
| Dividends from net investment income | | | - | | | | (.05 | ) | | | | | - | |
| Distributions from net realized gains | | | (.48 | ) | | | - | | | | | | - | |
| Total dividends and distributions | | | (.48 | ) | | | (.05 | ) | | | | | - | |
| Net asset value, end of period | | | $13.13 | | | | $13.55 | | | | | | $11.32 | |
| Total Return(c): | | | .42% | | | | 20.24% | | | | | | 13.20% | |
| |
| Ratios/Supplemental Data: | | | | | | | | | | | |
| Net assets, end of period (000) | | | $46,996 | | | | $16,487 | | | | | | $11,962 | |
| Average net assets (000) | | | $38,835 | | | | $13,938 | | | | | | $11,061 | |
| Ratios to average net assets(d): | | | | | | | | | | | | | | |
| Expenses after waivers and/or expense reimbursement | | | 1.35% | | | | 1.35% | | | | | | 1.35% | (e) |
| Expenses before waivers and/or expense reimbursement | | | 1.54% | | | | 2.73% | | | | | | 4.28% | (e) |
| Net investment income (loss) | | | (.13)% | | | | .13% | | | | | | (.17)% | (e) |
| Portfolio turnover rate | | | 61% | | | | 86% | | | | | | 28% | (f) |
(a) Commencement of Series.
(b) Calculated based on average shares outstanding during the period.
(c) Total return is calculated assuming a purchase of a share on the first day and a sale on the last day of each period reported, and includes reinvestment of dividends and distributions. Total returns may reflect adjustments to conform to generally accepted accounting principles. Total returns for periods less than a full year are not annualized.
(d) Does not include expenses of the underlying fund in which the Series invests.
(e) Annualized.
(f) Not annualized.
See Notes to Financial Statements.
Report of Independent Registered Public
Accounting Firm
The Board of Directors and Shareholders
Prudential World Fund, Inc.:
We have audited the accompanying statement of assets and liabilities of Prudential Jennison International Opportunities Fund, a series of Prudential World Fund, Inc., (hereafter referred to as the “Fund”), including the portfolio of investments, as of October 31, 2014, and the related statement of operations for the year then ended, the statements of changes in net assets for each of the years in the two-year period then ended and the financial highlights for each of the years in the two-year period then ended and for the period June 5, 2012 (commencement of operations) to October 31, 2012. These financial statements and financial highlights are the responsibility of the Fund’s management. Our responsibility is to express an opinion on these financial statements and financial highlights based on our audits.
We conducted our audits in accordance with the standards of the Public Company Accounting Oversight Board (United States). Those standards require that we plan and perform the audit to obtain reasonable assurance about whether the financial statements and financial highlights are free of material misstatement. An audit includes examining, on a test basis, evidence supporting the amounts and disclosures in the financial statements. Our procedures included confirmation of securities owned as of October 31, 2014, by correspondence with the custodian, transfer agent and brokers or by other appropriate auditing procedures when replies from brokers were not received. An audit also includes assessing the accounting principles used and significant estimates made by management, as well as evaluating the overall financial statement presentation. We believe that our audits provide a reasonable basis for our opinion.
In our opinion, the financial statements and financial highlights referred to above present fairly, in all material respects, the financial position of the Fund as of October 31, 2014, and the results of its operations, the changes in its net assets and the financial highlights for the periods described in the first paragraph above, in conformity with U.S. generally accepted accounting principles.

New York, New York
December 16, 2014
| | | | |
| Prudential Jennison International Opportunities Fund | | | 37 | |
Tax Information
(Unaudited)
For the year ended October 31, 2014, the Series reports 38.07% of the ordinary income dividends paid during the year as qualified dividend income in accordance with Section 854 of the Internal Revenue Code.
We are advising that during the fiscal year ended October 31, 2014, the Series reported the maximum amount per share, but not less than $0.15 per share for classes A, C, and Z shares as a capital gain distribution in accordance with Section 852(b)(3)(C) of the Internal Revenue Code.
In January 2015, you will be advised on IRS Form 1099-DIV or substitute 1099-DIV as to the federal tax status of distributions received by you in calendar year 2014.
INFORMATION ABOUT BOARD MEMBERS AND OFFICERS
(Unaudited)
Information about Board Members and Officers of the Fund is set forth below. Board Members who are not deemed to be “interested persons” of the Fund, as defined in the 1940 Act, are referred to as “Independent Board Members.” Board Members who are deemed to be “interested persons” of the Fund are referred to as “Interested Board Members.” The Board Members are responsible for the overall supervision of the operations of the Fund and perform the various duties imposed on the directors of investment companies by the 1940 Act. The Board in turn elects the Officers, who are responsible for administering the day-to-day operations of the Fund.
| | | | |
| Independent Board Members(1) |
| | | |
Name, Address, Age Position(s) Portfolios Overseen | | Principal Occupation(s) During Past Five Years | | Other Directorships Held |
Ellen S. Alberding (56) Board Member Portfolios Overseen: 69 | | President and Board Member, The Joyce Foundation (charitable foundation) (since 2002); Vice Chair, City Colleges of Chicago (community college system) (since 2011); Trustee, Skills for America’s Future (national initiative to connect employers to community colleges) (since 2011); Trustee, National Park Foundation (charitable foundation for national park system) (since 2009); Trustee, Economic Club of Chicago (since 2009). | | None. |
Kevin J. Bannon (62) Board Member Portfolios Overseen: 70 | | Managing Director (since April 2008) and Chief Investment Officer (October 2008-November 2013) of Highmount Capital LLC (registered investment adviser); formerly Executive Vice President and Chief Investment Officer (April 1993-August 2007) of Bank of New York Company; President (May 2003-May 2007) of BNY Hamilton Family of Mutual Funds. | | Director of Urstadt Biddle Properties (equity real estate investment trust) (since September 2008). |
Linda W. Bynoe (62) Board Member Portfolios Overseen: 70 | | President and Chief Executive Officer (since March 1995) and formerly Chief Operating Officer (December 1989-February 1995) of Telemat Ltd. (management consulting); formerly Vice President (January 1985-June 1989) at Morgan Stanley & Co (broker-dealer). | | Director of Simon Property Group, Inc. (retail real estate) (May 2003-May 2012); Director of Anixter International, Inc. (communication products distributor) (since January 2006); Director of Northern Trust Corporation (financial services) (since April 2006); Trustee of Equity Residential (residential real estate) (since December 2009). |
Prudential Jennison International Opportunities Fund
| | | | |
| Independent Board Members(1) |
| | | |
Name, Address, Age Position(s) Portfolios Overseen | | Principal Occupation(s) During Past Five Years | | Other Directorships Held |
Keith F. Hartstein (58) Board Member Portfolios Overseen: 70 | | Retired; Formerly President and Chief Executive Officer (2005-2012), Senior Vice President (2004-2005), Senior Vice President of Sales and Marketing (1997-2004), and various executive management positions (1990-1997), John Hancock Funds, LLC (asset management); Chairman, Investment Company Institute’s Sales Force Marketing Committee (2003-2008). | | None. |
Michael S. Hyland, CFA (69) Board Member Portfolios Overseen: 69 | | Retired (since February 2005); Formerly Senior Managing Director (July 2001-February 2005) of Bear Stearns & Co, Inc.; Global Partner, INVESCO (1999-2001); Managing Director and President of Salomon Brothers Asset Management (1989-1999). | | None. |
Douglas H. McCorkindale (75) Board Member Portfolios Overseen: 69 | | Retired; Formerly Chairman (February 2001-June 2006), Chief Executive Officer (June 2000-July 2005), President (September 1997-July 2005) and Vice Chairman (March 1984-May 2000) of Gannett Co. Inc. (publishing and media). | | Director of Lockheed Martin Corp. (aerospace and defense) (since May 2001). |
Stephen P. Munn (72) Board Member Portfolios Overseen: 70 | | Lead Director (since 2007) and formerly Chairman (1993-2007) of Carlisle Companies Incorporated (manufacturer of industrial products). | | Lead Director (since 2007) of Carlisle Companies Incorporated (manufacturer of industrial products). |
James E. Quinn (62) Board Member Portfolios Overseen: 69 | | Retired; Formerly President (2003-2012) and Director (2003-2008), and Vice Chairman and Director (1998-2003), Tiffany & Company (jewelry retailing); Director, Mutual of America Capital Management Corporation (asset management) (since 1996); Director, Hofstra University (since 2008); Vice Chairman, Museum of the City of New York (since 1994). | | Director of Deckers Outdoor Corporation (footwear manufacturer) (since 2011). |
Richard A. Redeker (71) Board Member & Independent Chair Portfolios Overseen: 70 | | Retired Mutual Fund Senior Executive (44 years); Management Consultant; Director, Mutual Fund Directors Forum (since 2014); Independent Directors Council (organization of 2,800 Independent Mutual Fund Directors)-Executive Committee, Chair of Policy Steering Committee, Governing Council. | | None. |
Visit our website at www.prudentialfunds.com
| | | | |
| Independent Board Members(1) |
| | | |
Name, Address, Age Position(s) Portfolios Overseen | | Principal Occupation(s) During Past Five Years | | Other Directorships Held |
Robin B. Smith (75) Board Member Portfolios Overseen:70 | | Chairman of the Board (since January 2003) of Publishers Clearing House (direct marketing); Member of the Board of Directors of ADLPartner (marketing) (since December 2010); formerly Chairman and Chief Executive Officer (August 1996-January 2003) of Publishers Clearing House. | | Formerly Director of BellSouth Corporation (telecommunications) (1992-2006). |
Stephen G. Stoneburn (71) Board Member Portfolios Overseen: 70 | | Chairman, (since July 2011), President and Chief Executive Officer (since June 1996) of Quadrant Media Corp. (publishing company); formerly President (June 1995-June 1996) of Argus Integrated Media, Inc.; Senior Vice President and Managing Director (January 1993-1995) of Cowles Business Media; Senior Vice President of Fairchild Publications, Inc. (1975-1989). | | None. |
| | | | |
| Interested Board Members(1) |
| | | |
Name, Address, Age Position(s) Portfolios Overseen | | Principal Occupation(s) During Past Five Years | | Other Directorships Held |
Stuart S. Parker (52) Board Member & President Portfolios Overseen: 64 | | President of Prudential Investments LLC (since January 2012); Executive Vice President of Prudential Investment Management Services LLC (since December 2012); Executive Vice President of Jennison Associates LLC and Head of Retail Distribution of Prudential Investments LLC (June 2005-December 2011). | | None. |
Scott E. Benjamin (41) Board Member & Vice President Portfolios Overseen: 70 | | Executive Vice President (since June 2009) of Prudential Investments LLC; Executive Vice President (June 2009-June 2012) and Vice President (since June 2012) of Prudential Investment Management Services LLC; Executive Vice President (since September 2009) of AST Investment Services, Inc.; Senior Vice President of Product Development and Marketing, Prudential Investments (since February 2006); Vice President of Product Development and Product Management, Prudential Investments (2003-2006). | | None. |
Prudential Jennison International Opportunities Fund
| | | | |
| Interested Board Members(1) |
| | | |
Name, Address, Age Position(s) Portfolios Overseen | | Principal Occupation(s) During Past Five Years | | Other Directorships Held |
Grace C. Torres* (55) Board Member Portfolios Overseen: 65 | | Retired; Formerly Treasurer and Principal Financial and Accounting Officer of the Prudential Investments Funds, Target Funds, Advanced Series Trust, Prudential Variable Contract Accounts and The Prudential Series Fund (1998-June 2014); Assistant Treasurer (March 1999-June 2014) and Senior Vice President (September 1999-June 2014) of Prudential Investments LLC; Assistant Treasurer (May 2003-June 2014) and Vice President (June 2005-June 2014) of AST Investment Services, Inc.; Senior Vice President and Assistant Treasurer (May 2003-June 2014) of Prudential Annuities Advisory Services, Inc. | | None. |
* Note: Prior to her retirement in 2014, Ms. Torres was employed by Prudential Investments LLC. Due to her prior employment, she is considered to be an “interested person” under the 1940 Act. Ms. Torres is a non-management Interested Board Member.
(1) The year that each Board Member joined the Funds’ Board is as follows:
Ellen S. Alberding; 2013; Kevin J. Bannon, 2008; Linda W. Bynoe, 2005; Keith F. Hartstein, 2013; Michael S. Hyland, 2008; Douglas H. McCorkindale, 2003; Stephen P. Munn, 2008; James E. Quinn, 2013; Richard A. Redeker, 2003; Robin B. Smith, 1996; Stephen G. Stoneburn, 1996; Stuart S. Parker, Board Member and President since 2012; Scott E. Benjamin, Board Member since 2010 and Vice President since 2009; Grace C. Torres, 2014.
| | | | |
| Fund Officers(a) |
| | | |
Name, Address and Age Position with Fund | | Principal Occupation(s) During Past Five Years | | Length of Service as Fund Officer |
Raymond A. O’Hara (59) Chief Legal Officer | | Vice President and Corporate Counsel (since July 2010) of Prudential Insurance Company of America (Prudential); Vice President (March 2011-Present) of Pruco Life Insurance Company and Pruco Life Insurance Company of New Jersey; Vice President and Corporate Counsel (March 2011-Present) of Prudential Annuities Life Assurance Corporation; Chief Legal Officer of Prudential Investments LLC (since June 2012); Chief Legal Officer of Prudential Mutual Fund Services LLC (since June 2012) and Corporate Counsel of AST Investment Services, Inc. (since June 2012); formerly Assistant Vice President and Corporate Counsel (September 2008-July 2010) of The Hartford Financial Services Group, Inc.; formerly Associate (September 1980-December 1987) and Partner (January 1988–August 2008) of Blazzard & Hasenauer, P.C. (formerly, Blazzard, Grodd & Hasenauer, P.C.). | | Since 2012 |
Visit our website at www.prudentialfunds.com
| | | | |
| Fund Officers(a) |
| | | |
Name, Address and Age Position with Fund | | Principal Occupation(s) During Past Five Years | | Length of Service as Fund Officer |
Chad A. Earnst (39) Chief Compliance Officer | | Chief Compliance Officer (September 2014-Present) of Prudential Investments LLC; Chief Compliance Officer (September 2014-Present) of the Prudential Investments Funds, Target Funds, Advanced Series Trust, The Prudential Series Fund, Prudential’s Gibraltar Fund, Inc., Prudential Global Short Duration High Yield Income Fund, Inc., Prudential Short Duration High Yield Fund, Inc. and Prudential Jennison MLP Income Fund, Inc.; formerly Assistant Director (March 2010-August 2014) of the Asset Management Unit, Division of Enforcement, US Securities & Exchange Commission; Assistant Regional Director (January 2010-August 2014), Branch Chief (June 2006–December 2009) and Senior Counsel (April 2003-May 2006) of the Miami Regional Office, Division of Enforcement, US Securities & Exchange Commission. | | Since 2014 |
Deborah A. Docs (56) Secretary | | Vice President and Corporate Counsel (since January 2001) of Prudential; Vice President (since December 1996) and Assistant Secretary (since March 1999) of Prudential Investments LLC; formerly Vice President and Assistant Secretary (May 2003-June 2005) of AST Investment Services, Inc. | | Since 2004 |
Jonathan D. Shain (56) Assistant Secretary | | Vice President and Corporate Counsel (since August 1998) of Prudential; Vice President and Assistant Secretary (since May 2001) of Prudential Investments LLC; Vice President and Assistant Secretary (since February 2001) of Prudential Mutual Fund Services LLC; formerly Vice President and Assistant Secretary (May 2003-June 2005) of AST Investment Services, Inc. | | Since 2005 |
Claudia DiGiacomo (40) Assistant Secretary | | Vice President and Corporate Counsel (since January 2005) of Prudential; Vice President and Assistant Secretary of Prudential Investments LLC (since December 2005); Associate at Sidley Austin Brown & Wood LLP (1999-2004). | | Since 2005 |
Andrew R. French (52) Assistant Secretary | | Vice President and Corporate Counsel (since February 2010) of Prudential; formerly Director and Corporate Counsel (2006-2010) of Prudential; Vice President and Assistant Secretary (since January 2007) of Prudential Investments LLC; Vice President and Assistant Secretary (since January 2007) of Prudential Mutual Fund Services LLC. | | Since 2006 |
Amanda S. Ryan (36) Assistant Secretary | | Director and Corporate Counsel (since March 2012) of Prudential; Director and Assistant Secretary (since June 2012) of Prudential Investments LLC; Associate at Ropes & Gray LLP (2008-2012). | | Since 2012 |
Theresa C. Thompson (52) Deputy Chief Compliance Officer | | Vice President, Compliance, Prudential Investments LLC (since April 2004); and Director, Compliance, Prudential Investments LLC (2001-2004). | | Since 2008 |
Prudential Jennison International Opportunities Fund
| | | | |
| Fund Officers(a) |
| | | |
Name, Address and Age Position with Fund | | Principal Occupation(s) During Past Five Years | | Length of Service as Fund Officer |
Richard W. Kinville (46) Anti-Money Laundering Compliance Officer | | Vice President, Corporate Compliance, Anti-Money Laundering Unit (since January 2005) of Prudential; committee member of the American Council of Life Insurers Anti-Money Laundering and Critical Infrastructure Committee (since January 2007); formerly Investigator and Supervisor in the Special Investigations Unit for the New York Central Mutual Fire Insurance Company (August 1994-January 1999); Investigator in AXA Financial’s Internal Audit Department and Manager in AXA’s Anti-Money Laundering Office (January 1999-January 2005); first chair of the American Council of Life Insurers Anti-Money Laundering and Critical Infrastructure Committee (June 2007-December 2009). | | Since 2011 |
M. Sadiq Peshimam (50) Treasurer and Principal Financial and Accounting Officer | | Assistant Treasurer of funds in the Prudential Mutual Fund Complex (2006-2014); Vice President (since 2005) of Prudential Investments LLC. | | Since 2006 |
Peter Parrella (56) Assistant Treasurer | | Vice President (since 2007) and Director (2004-2007) within Prudential Mutual Fund Administration; formerly Tax Manager at SSB Citi Fund Management LLC (1997-2004). | | Since 2007 |
Lana Lomuti (47) Assistant Treasurer | | Vice President (since 2007) and Director (2005-2007), within Prudential Mutual Fund Administration; formerly Assistant Treasurer (December 2007-February 2014) of The Greater China Fund, Inc. | | Since 2014 |
Linda McMullin (53) Assistant Treasurer | | Vice President (since 2011) and Director (2008-2011) within Prudential Mutual Fund Administration. | | Since 2014 |
| (a) | Excludes Mr. Parker and Mr. Benjamin, interested Board Members who also serve as President and Vice President, respectively. |
Explanatory Notes to Tables:
| n | Board Members are deemed to be “Interested,” as defined in the 1940 Act, by reason of their affiliation with Prudential Investments LLC and/or an affiliate of Prudential Investments LLC. |
| n | Unless otherwise noted, the address of all Board Members and Officers is c/o Prudential Investments LLC, Gateway Center Three, 100 Mulberry Street, Newark, New Jersey 07102-4077. |
| n | There is no set term of office for Board Members or Officers. The Board Members have adopted a retirement policy, which calls for the retirement of Board Members on December 31 of the year in which they reach the age of 75. |
| n | “Other Directorships Held” includes only directorships of companies required to register or file reports with the SEC under the 1934 Act (that is, “public companies”) or other investment companies registered under the 1940 Act. |
| n | “Portfolios Overseen” includes all investment companies managed by Prudential Investments LLC. The investment companies for which Prudential Investments LLC serves as manager include the Prudential Investments Mutual Funds, The Prudential Variable Contract Accounts, Target Mutual Funds, Prudential Short Duration High Yield Fund, Inc., Prudential Global Short Duration High Yield Fund, Inc., The Prudential Series Fund, Prudential’s Gibraltar Fund, Inc. and the Advanced Series Trust. |
Visit our website at www.prudentialfunds.com
Approval of Advisory Agreements
The Fund’s Board of Directors
The Board of Directors (the “Board”) of Prudential Jennison International Opportunities Fund (the “Fund”)1 consists of thirteen individuals, eleven of whom are not “interested persons” of the Fund, as defined in the Investment Company Act of 1940, as amended (the “1940 Act”) (the “Independent Directors”). The Board is responsible for the oversight of the Fund and its operations, and performs the various duties imposed on the directors of investment companies by the 1940 Act. The Independent Directors have retained independent legal counsel to assist them in connection with their duties. The Chair of the Board is an Independent Director. The Board has established three standing committees: the Audit Committee, the Nominating and Governance Committee, and the Investment Committee. Each committee is chaired by, and composed of, Independent Directors.
Annual Approval of the Fund’s Advisory Agreements
As required under the 1940 Act, the Board determines annually whether to renew the Fund’s management agreement with Prudential Investments LLC (“PI”) and the Fund’s subadvisory agreement with Jennison Associates LLC (“Jennison”). In considering the renewal of the agreements, the Board, including all of the Independent Directors, met on June 9-11, 2014 and approved the renewal of the agreements through July 31, 2015, after concluding that the renewal of the agreements was in the best interests of the Fund and its shareholders.2
In advance of the meetings, the Board requested and received materials relating to the agreements, and had the opportunity to ask questions and request further information in connection with its consideration. Among other things, the Board considered comparative fee information from PI and Jennison. Also, the Board considered comparisons with other mutual funds in relevant Peer Universes and Peer Groups, as is further discussed below.
In approving the agreements, the Board, including the Independent Directors advised by independent legal counsel, considered the factors it deemed relevant, including the nature, quality and extent of services provided by PI and the subadviser, the performance of the Fund, the profitability of PI and its affiliates, expenses and fees, and the potential for economies of scale that may be shared with the Fund and its shareholders as the Fund’s assets grow. In their deliberations, the Directors did not identify any single factor which alone was responsible for the Board’s decision to
| 1 | Prudential Jennison International Opportunities Fund is a series of Prudential World Fund, Inc. |
| 2 | Grace C. Torres was elected to the Board as of December 2014, and therefore did not participate in the consideration of these approvals. |
Prudential Jennison International Opportunities Fund
Approval of Advisory Agreements (continued)
approve the agreements with respect to the Fund. In connection with its deliberations, the Board considered information provided by PI throughout the year at regular Board meetings, presentations from portfolio managers and other information, as well as information furnished at or in advance of the meetings on June 9-11, 2014.
The Directors determined that the overall arrangements between the Fund and PI, which serves as the Fund’s investment manager pursuant to a management agreement, and between PI and Jennison, which serves as the Fund’s subadviser pursuant to the terms of a subadvisory agreement with PI, are in the best interests of the Fund and its shareholders in light of the services performed, fees charged and such other matters as the Directors considered relevant in the exercise of their business judgment.
The material factors and conclusions that formed the basis for the Directors’ reaching their determinations to approve the continuance of the agreements are separately discussed below.
Nature, quality and extent of services
The Board received and considered information regarding the nature, quality and extent of services provided to the Fund by PI and Jennison. The Board considered the services provided by PI, including but not limited to the oversight of the subadviser for the Fund, as well as the provision of fund recordkeeping, compliance, and other services to the Fund. With respect to PI’s oversight of the subadviser, the Board noted that PI’s Strategic Investment Research Group (“SIRG”), which is a business unit of PI, is responsible for monitoring and reporting to PI’s senior management on the performance and operations of the subadviser. The Board also considered that PI pays the salaries of all of the officers and non-independent Directors of the Fund. The Board also considered the investment subadvisory services provided by Jennison, as well as adherence to the Fund’s investment restrictions and compliance with applicable Fund policies and procedures. The Board considered PI’s evaluation of the subadviser, as well as PI’s recommendation, based on its review of the subadviser, to renew the subadvisory agreement.
The Board considered the qualifications, backgrounds and responsibilities of PI’s senior management responsible for the oversight of the Fund and Jennison, and also considered the qualifications, backgrounds and responsibilities of Jennison’s portfolio managers who are responsible for the day-to-day management of the Fund’s portfolio. The Board was provided with information pertaining to PI’s and Jennison’s organizational structure, senior management, investment operations, and other relevant information pertaining to both PI and Jennison. The Board also noted that it
Visit our website at www.prudentialfunds.com
received favorable compliance reports from the Fund’s Chief Compliance Officer (“CCO”) as to both PI and Jennison. The Board noted that Jennison is affiliated with PI.
The Board concluded that it was satisfied with the nature, extent and quality of the investment management services provided by PI and the subadvisory services provided to the Fund by Jennison, and that there was a reasonable basis on which to conclude that the Fund benefits from the services provided by PI and Jennison under the management and subadvisory agreements.
Costs of Services and Profits Realized by PI
The Board was provided with information on the profitability of PI and its affiliates in serving as the Fund’s investment manager. The Board discussed with PI the methodology utilized in assembling the information regarding profitability and considered its reasonableness. The Board recognized that it is difficult to make comparisons of profitability from fund management contracts because comparative information is not generally publicly available and is affected by numerous factors, including the structure of the particular adviser, the types of funds it manages, its business mix, numerous assumptions regarding allocations and the adviser’s capital structure and cost of capital. However, the Board considered that the cost of services provided by PI to the Fund during the year ended December 31, 2013 exceeded the management fees paid by the Fund, resulting in an operating loss to PI. The Board separately considered information regarding the profitability of the subadviser, an affiliate of PI. Taking these factors into account, the Board concluded that the profitability of PI and its affiliates in relation to the services rendered was not unreasonable.
Economies of Scale
In 2013, PI and the Board retained an outside business consulting firm, in order to assist the Board in its consideration of the renewal of the management and subadvisory agreements, by reviewing management fee breakpoint usage and trends in management fees across the mutual fund industry. The consulting firm’s analysis and conclusions with respect to the Funds’ management fee structures were presented to the Board and PI at the December 3-5, 2013 meeting, and were discussed extensively by the Board and PI over the following two quarters.
The Board noted that the management fee schedule for the Fund does not contain breakpoints that would reduce the fee rate on assets above specified levels. The Board received and discussed information concerning whether PI realizes economies of scale as the Fund’s assets grow beyond current levels. The Board also recognized the inherent limitations of any analysis of economies of scale, stemming largely from the Board’s understanding that most of PI’s costs are not specific to individual funds, but rather are incurred across a variety of products and services. In light of the Fund’s
Prudential Jennison International Opportunities Fund
Approval of Advisory Agreements (continued)
current size, performance and expense structure, the Board concluded that the absence of breakpoints in the Fund’s fee schedule is acceptable at this time.
Other Benefits to PI and Jennison
The Board considered potential ancillary benefits that might be received by PI and Jennison and their affiliates as a result of their relationship with the Fund. The Board concluded that potential benefits to be derived by PI included fees received by affiliates of PI for serving as the Fund’s securities lending agent, transfer agency fees received by the Fund’s transfer agent (which is affiliated with PI), as well as benefits to its reputation or other intangible benefits resulting from PI’s association with the Fund. The Board concluded that the potential benefits to be derived by Jennison included the ability to use soft dollar credits, as well as the potential benefits consistent with those generally resulting from an increase in assets under management, specifically, potential access to additional research resources and benefits to its reputation. The Board concluded that the benefits derived by PI and Jennison were consistent with the types of benefits generally derived by investment managers and subadvisers to mutual funds.
Performance of the Fund / Fees and Expenses
The Board considered certain additional specific factors and made related conclusions relating to the historical performance of the Fund for the one-year period ended December 31, 2013. The Board considered that the Fund commenced operations on June 5, 2012 and that longer-term performance was not yet available.
The Board also considered the Fund’s actual management fee, as well as the Fund’s net total expense ratio, for the fiscal year ended October 31, 2013. The Board considered the management fee for the Fund as compared to the management fee charged by PI to other funds and the fee charged by other advisers to comparable mutual funds in a Peer Group. The actual management fee represents the fee rate actually paid by Fund shareholders and includes any fee waivers or reimbursements. The net total expense ratio for the Fund represents the actual expense ratio incurred by Fund shareholders.
The mutual funds included in the Peer Universe (the Lipper International Multi-Cap Growth Funds Performance Universe)3 and the Peer Group were objectively
| 3 | The Fund was compared to the Lipper International Multi-Cap Growth Funds Performance Universe, although Lipper classifies the Fund in its International Multi-Cap Core Funds Performance Universe. The Fund was compared to the Lipper International Multi-Cap Growth Funds Performance Universe because PI believes that the funds included in the Lipper International Multi-Cap Growth Funds Performance Universe provide a more appropriate basis for Fund performance comparisons. |
Visit our website at www.prudentialfunds.com
determined by Lipper Inc. (“Lipper”), an independent provider of mutual fund data. To the extent that PI deemed appropriate, and for reasons addressed in detail with the Board, PI may have provided supplemental data compiled by Lipper for the Board’s consideration. The comparisons placed the Fund in various quartiles, with the first quartile being the best 25% of the mutual funds (for performance, the best performing mutual funds and, for expenses, the lowest cost mutual funds).
The section below summarizes key factors considered by the Board and the Board’s conclusions regarding the Fund’s performance, fees and overall expenses. The table sets forth gross performance comparisons (which do not reflect the impact on performance of fund expenses, or any subsidies, expense caps or waivers that may be applicable) with the Peer Universe, actual management fees with the Peer Group (which reflect the impact of any subsidies or fee waivers), and net total expenses with the Peer Group, each of which were key factors considered by the Board.
| | | | | | | | |
| Performance | | 1 Year | | 3 Years | | 5 Years | | 10 Years |
| | | 2nd Quartile | | N/A | | N/A | | N/A |
| Actual Management Fees: 1st Quartile |
| Net Total Expenses: 4th Quartile |
| | • | | The Board noted that Fund outperformed its benchmark index for the one-year period. |
| | • | | The Board and PI agreed to continue the existing expense cap of 1.35% (exclusive of 12b-1 fees and certain other fees) through February 28, 2015. |
| | • | | The Board concluded that, in light of the Fund’s competitive performance against its benchmark and Peer Universe, and its recent inception date, it would be in the best interests of the Fund and its shareholders to renew the agreements to allow the subadviser to develop a performance record against which performance could be evaluated. |
| | • | | The Board concluded that the management fees (including subadvisory fees) and total expenses were reasonable in light of the services provided. |
* * *
After full consideration of these factors, the Board concluded that the approval of the agreements was in the best interests of the Fund and its shareholders.
Prudential Jennison International Opportunities Fund
| | | | |
| n MAIL | | n TELEPHONE | | n WEBSITE |
Gateway Center Three 100 Mulberry Street Newark, NJ 07102 | | (800) 225-1852 | | www.prudentialfunds.com |
|
| PROXY VOTING |
| The Board of Directors of the Fund has delegated to the Fund’s investment subadviser the responsibility for voting any proxies and maintaining proxy recordkeeping with respect to the Fund. A description of these proxy voting policies and procedures is available without charge, upon request, by calling (800) 225-1852 or by visiting the Securities and Exchange Commission’s website at www.sec.gov. Information regarding how the Fund voted proxies relating to portfolio securities during the most recent 12-month period ended June 30 is available on the Fund’s website and on the Securities and Exchange Commission’s website. |
|
| DIRECTORS |
| Ellen S. Alberding • Kevin J. Bannon • Scott E. Benjamin • Linda W. Bynoe • Keith F. Hartstein • Michael S. Hyland • Douglas H. McCorkindale • Stephen P. Munn • Stuart S. Parker • James E. Quinn • Richard A. Redeker • Robin B. Smith • Stephen G. Stoneburn • Grace C. Torres |
|
| OFFICERS |
| Stuart S. Parker, President • Scott E. Benjamin, Vice President • M. Sadiq Peshimam, Treasurer and Principal Financial and Accounting Officer • Raymond A. O’Hara, Chief Legal Officer • Deborah A. Docs, Secretary • Chad A. Earnst, Chief Compliance Officer • Theresa C. Thompson, Deputy Chief Compliance Officer • Richard W. Kinville, Anti-Money Laundering Compliance Officer • Jonathan D. Shain, Assistant Secretary • Claudia DiGiacomo, Assistant Secretary • Amanda S. Ryan, Assistant Secretary • Andrew R. French, Assistant Secretary • Peter Parrella, Assistant Treasurer • Lana Lomuti, Assistant Treasurer • Linda McMullin, Assistant Treasurer |
| | | | |
| MANAGER | | Prudential Investments LLC | | Gateway Center Three
100 Mulberry Street
Newark, NJ 07102 |
|
| INVESTMENT SUBADVISER | | Jennison Associates LLC | | 466 Lexington Avenue
New York, NY 10017 |
|
| DISTRIBUTOR | | Prudential Investment
Management Services LLC | | Gateway Center Three
100 Mulberry Street
Newark, NJ 07102 |
|
| CUSTODIAN | | The Bank of New York Mellon | | One Wall Street
New York, NY 10286 |
|
| TRANSFER AGENT | | Prudential Mutual Fund
Services LLC | | PO Box 9658
Providence, RI 02940 |
|
| INDEPENDENT REGISTERED PUBLIC ACCOUNTING FIRM | | KPMG LLP | | 345 Park Avenue
New York, NY 10154 |
|
| FUND COUNSEL | | Willkie Farr & Gallagher LLP | | 787 Seventh Avenue
New York, NY 10019 |
|
| An investor should consider the investment objectives, risks, charges, and expenses of the Fund carefully before investing. The prospectus and summary prospectus contain this and other information about the Fund. An investor may obtain a prospectus and summary prospectus by visiting our website at www.prudentialfunds.com or by calling (800) 225-1852. The prospectus and summary prospectus should be read carefully before investing. |
|
| E-DELIVERY |
| To receive your mutual fund documents online, go to www.prudentialfunds.com/edelivery and enroll. Instead of receiving printed documents by mail, you will receive notification via email when new materials are available. You can cancel your enrollment or change your email address at any time by visiting the website address above. |
|
| SHAREHOLDER COMMUNICATIONS WITH DIRECTORS |
| Shareholders can communicate directly with the Board of Directors by writing to the Chair of the Board, Prudential Jennison International Opportunities Fund, Prudential Investments, Attn: Board of Directors, 100 Mulberry Street, Gateway Center Three, Newark, NJ 07102. Shareholders can communicate directly with an individual Director by writing to the same address. Communications are not screened before being delivered to the addressee. |
|
| AVAILABILITY OF PORTFOLIO SCHEDULE |
| The Fund files its complete schedule of portfolio holdings with the Securities and Exchange Commission for the first and third quarters of each fiscal year on Form N-Q. The Fund’s Forms N-Q are available on the Commission’s website at www.sec.gov. The Fund’s Forms N-Q may also be reviewed and copied at the Commission’s Public Reference Room in Washington, D.C. Information on the operation and location of the Public Reference Room may be obtained by calling 1-800-SEC-0330. The Fund’s schedule of portfolio holdings is also available on the Fund’s website as of the end of each month. |
|
| The Fund’s Statement of Additional Information contains additional information about the Fund’s Directors and is available without charge, upon request, by calling (800) 225-1852. |
Mutual Funds:
| | | | |
| ARE NOT INSURED BY THE FDIC OR ANY FEDERAL GOVERNMENT AGENCY | | MAY LOSE VALUE | | ARE NOT A DEPOSIT OF OR GUARANTEED BY ANY BANK OR ANY BANK AFFILIATE |

PRUDENTIAL JENNISON INTERNATIONAL OPPORTUNITIES FUND
| | | | | | |
| SHARE CLASS | | A | | C | | Z |
| NASDAQ | | PWJAX | | PWJCX | | PWJZX |
| CUSIP | | 743969677 | | 743969669 | | 743969651 |
MF215E 0270921-00001-00

PRUDENTIAL INVESTMENTS»MUTUAL FUNDS
PRUDENTIAL JENNISON GLOBAL INFRASTRUCTURE FUND
ANNUAL REPORT · OCTOBER 31, 2014
Fund Type
Sector Stock
Objective
Total return
This report is not authorized for distribution to prospective investors unless preceded or accompanied by a current prospectus.
The views expressed in this report and information about the Fund’s portfolio holdings are for the period covered by this report and are subject to change thereafter.
Mutual funds are distributed by Prudential Investment Management Services LLC. Jennison Associates is a registered investment adviser. Both are Prudential Financial companies. © 2014 Prudential Financial, Inc. and its related entities. Prudential Investments LLC, Prudential, Jennison Associates, Jennison, the Prudential logo, Bring Your Challenges, and the Rock symbol are service marks of Prudential Financial, Inc. and its related entities, registered in many jurisdictions worldwide.

December 15, 2014
Dear Shareholder:
We hope you find the annual report for the Prudential Jennison Global Infrastructure Fund informative and useful. The report covers performance for the 12-month period that ended October 31, 2014.
Since market conditions change over time, we believe it is important to maintain a diversified portfolio of funds consistent with your tolerance for risk, time horizon, and financial goals.
Your financial advisor can help you create a diversified investment plan that may include funds covering all the basic asset classes and that reflects your personal investor profile and risk tolerance. Keep in mind, however, that diversification and asset allocation strategies do not assure a profit or protect against loss in declining markets. Prudential Investments® is dedicated to helping you solve your toughest investment challenges—whether it’s capital growth, reliable income, or protection from market volatility and other risks.
We offer the expertise of Prudential Financial’s affiliated asset managers* that strive to be leaders in a broad range of funds to help you stay on course to the future you envision. They also manage money for major corporations and pension funds around the world, which means you benefit from the same expertise, innovation, and attention to risk demanded by today’s most sophisticated investors.
Thank you for choosing the Prudential Investments family of funds.
Sincerely,

Stuart S. Parker, President
Prudential Jennison Global Infrastructure Fund
*Most of Prudential Investments’ equity funds are advised by Jennison Associates LLC, Quantitative Management Associates LLC (QMA), or Prudential Real Estate Investors. Prudential Investments’ fixed income and money market funds are advised by Prudential Investment Management, Inc. (PIM) through its Prudential Fixed Income unit. Jennison Associates LLC, QMA, and PIM are registered investment advisers and Prudential Financial companies. Prudential Real Estate Investors is a unit of PIM.
| | | | |
| Prudential Jennison Global Infrastructure Fund | | | 1 | |
Your Fund’s Performance (Unaudited)
Performance data quoted represent past performance. Past performance does not guarantee future results. The investment return and principal value of an investment will fluctuate, so that an investor’s shares, when redeemed, may be worth more or less than their original cost. Current performance may be lower or higher than the past performance data quoted. An investor may obtain performance data as of the most recent month-end by visiting our website at www.prudentialfunds.com or by calling (800) 225-1852.
| | | | | | |
Cumulative Total Returns (Without Sales Charges) as of 10/31/14 |
| | | One Year | | | Since Inception |
Class A | | | 22.67 | % | | 27.83% (9/25/13) |
Class C | | | 21.76 | | | 26.75 (9/25/13) |
Class Z | | | 22.91 | | | 28.07 (9/25/13) |
S&P Global Infrastructure Index | | | 13.36 | | | 17.69 |
S&P 500 Index | | | 17.24 | | | 22.62 |
Lipper Global Infrastructure Funds Average | | | 14.24 | | | 19.07 |
| | | | | | |
Average Annual Total Returns (With Sales Charges) as of 9/30/14 | | | |
| | | One Year | | | Since Inception |
Class A | | | 20.25 | % | | 19.79% (9/25/13) |
Class C | | | 25.40 | | | 25.69 (9/25/13) |
Class Z | | | 27.49 | | | 26.89 (9/25/13) |
S&P Global Infrastructure Index | | | 15.80 | | | 15.80 |
S&P 500 Index | | | 19.70 | | | 19.70 |
Lipper Global Infrastructure Funds Average | | | 16.67 | | | 16.67 |
| | | | | | |
Average Annual Total Returns (With Sales Charges) as of 10/31/14 |
| | | One Year | | | Since Inception |
Class A | | | 15.93 | % | | 18.73% (9/25/13) |
Class C | | | 20.76 | | | 24.04 (9/25/13) |
Class Z | | | 22.91 | | | 25.21 (9/25/13) |
| | | | | | |
Average Annual Total Returns (Without Sales Charges) as of 10/31/14 |
| | | One Year | | | Since Inception |
Class A | | | 22.67 | % | | 24.99% (9/25/13) |
Class C | | | 21.76 | | | 24.04 (9/25/13) |
Class Z | | | 22.91 | | | 25.21 (9/25/13) |
| | |
| 2 | | Visit our website at www.prudentialfunds.com |
Growth of a $10,000 Investment
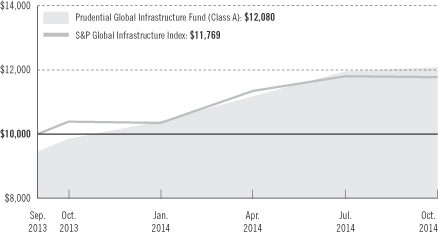
The graph compares a $10,000 investment in the Fund’s Class A shares with a similar investment in the S&P Global Infrastructure Index by portraying the initial account values at the commencement of operations of Class A shares (September 25, 2013) and the account values at the end of the current fiscal year (October 31, 2014), as measured on a quarterly basis. For purposes of the graph, and unless otherwise indicated, it has been assumed that (a) the maximum applicable front-end sales charge was deducted from the initial $10,000 investment in Class A shares; (b) all recurring fees (including management fees) were deducted; and (c) all dividends and distributions were reinvested. The line graph provides information for Class A shares only. As indicated in the tables provided earlier, performance for Class C and Class Z shares will vary due to the differing charges and expenses applicable to each share class (as indicated in the following paragraphs). Without waiver of fees and/or expense reimbursements, if any, the returns would have been lower.
Past performance does not predict future performance. Total returns and the ending account values in the graphs include changes in share price and reinvestment of dividends and capital gains distributions in a hypothetical investment for the periods shown. The Fund’s total returns do not reflect the deduction of income taxes on an individual’s investment. Taxes may reduce your actual investment returns on income or gains paid by the Fund or any gains you may realize if you sell your shares.
Source: Prudential Investments LLC and Lipper Inc.
Inception returns are provided for any share class with less than 10 calendar years of returns.
| | | | |
| Prudential Jennison Global Infrastructure Fund | | | 3 | |
Your Fund’s Performance (continued)
The returns in the tables do not reflect the deduction of taxes that a shareholder would pay on Fund distributions or following the redemption of Fund shares. The average annual total returns take into account applicable sales charges, which are described for each share class in the table below.
| | | | | | |
| | Class A | | Class C | | Class Z |
Maximum initial sales charge | | 5.50% of
the public
offering
price | | None | | None |
Contingent deferred sales charge (CDSC) (as a percentage of the lower of original purchase price or net asset value at redemption) | | 1% on sales
of $1 million
or more
made within
12 months of
purchase | | 1% on sales
made within
12 months
of purchase | | None |
Annual distribution and service (12b-1) fees (shown as a percentage of average daily net assets) | | .30%
(.25%
currently) | | 1% | | None |
Benchmark Definitions
S&P Global Infrastructure Index
The S&P Global Infrastructure Index is an unmanaged index that consists of 75 companies from around the world that represent the listed infrastructure universe. To create diversified exposure across the global listed infrastructure market, the index has balanced weights across three distinct infrastructure clusters: Utilities, Transportation, and Energy.
S&P 500 Index
The S&P 500 Index is an unmanaged index of 500 stocks of large US public companies. It gives a broad look at how stock prices have performed in the United States.
Lipper Global Infrastructure Funds Average
The Lipper Global Infrastructure Funds Average (Lipper Average) represents returns based on the average return of all funds in the Lipper Global Infrastructure Funds category for the periods noted. The Lipper Average invests primarily in equity securities of domestic and foreign companies engaged in an infrastructure industry, including but not limited to transportation, communication, and waste management.
Investors cannot invest directly in an index or average. The returns for the Indexes would be lower if they included the effects of sales charges, operating expenses of a mutual fund, or taxes. Returns for the Lipper Average reflect the deduction of operating expenses, but not sales charges or taxes. The Since Inception returns for the Indexes and the Lipper Average are measured from the closest month-end to inception date, and not from the Fund’s actual inception date.
| | |
| 4 | | Visit our website at www.prudentialfunds.com |
| | | | |
Five Largest Holdings expressed as a percentage of net assets as of 10/31/14 | | | | |
Groupe Eurotunnel SA, Transportation Infrastructure | | | 3.0 | % |
Atlantia SpA, Transportation Infrastructure | | | 2.9 | |
Targa Resources Corp., Oil, Gas & Consumable Fuels | | | 2.4 | |
Ferrovial SA, Construction & Engineering | | | 2.3 | |
Huadian Fuxin Energy Corp. Ltd., Independent Power & Renewable Electricity Producers | | | 2.3 | |
Holdings reflect only long-term investments and are subject to change.
| | | | |
Five Largest Industries expressed as a percentage of net assets as of 10/31/14 | | | | |
Oil, Gas & Consumable Fuels | | | 29.3 | % |
Transportation Infrastructure | | | 11.8 | |
Electric Utilities | | | 11.0 | |
Independent Power & Renewable Electricity Producers | | | 10.2 | |
Multi-Utilities | | | 7.7 | |
Industry weightings reflect only long-term investments and are subject to change.
| | | | |
| Prudential Jennison Global Infrastructure Fund | | | 5 | |
Strategy and Performance Overview
How did the Fund perform?
The Prudential Jennison Global Infrastructure Fund’s Class A shares returned 22.67% for the 12-month reporting period ended October 31, 2014, outperforming the 13.36% return of the S&P Global Infrastructure Index, and the 14.24% return of the Lipper Global Infrastructure Funds Average.
What was the market environment like for stocks during the period?
| | • | | The US equity markets double-digit advance in the 12 months ended October 31, 2014, reflected sustained improvement in the US economic outlook. Corporate profits remained strong, housing and employment indicators improved, and consumer confidence rose to post-recession highs. US gross domestic product (GDP) contracted in early 2014, largely because of severe winter weather, before quickly rebounding. |
| | • | | China’s expansion moderated as the country navigated a better balance between fixed investment and consumer-led growth. |
| | • | | A number of other key emerging market countries were hurt by a combination of slower growth, fiscal pressures, and weakening currencies. Later in the period, there were signs of improvement in a small but growing number of emerging market countries with stabilizing political, fiscal, and currency situations. |
| | • | | The Federal Reserve tapered its quantitative easing program, signaling confidence in the health of US economic activity and labor market conditions. |
Which holdings made the largest positive contributions to the Fund’s return?
The Fund’s leading contributors predominately stemmed from the energy and utilities sectors during the period. Among oil, gas, and consumable fuels companies, Targa Resources topped the list, with other noteworthy contributors including Cheniere Energy and Phillips 66 Partners. Canadian Pacific Railway from the industrial sector and Huadian Fuxin Energy Corp. from the utilities sector also helped performance during the period.
| | • | | Targa Resources enjoyed a steady upward trend. The shares suddenly spiked in mid-June on reports of a pending acquisition by Energy Transfer Equity. In October, heightened volatility in oil prices caused Targa’s shares to drop, but they have since rebounded. Jennison likes Targa for its fundamentals and regards it as having one of the best natural gas liquids footprints along the Gulf Coast, as well as leading positions in the Permian and Bakken shale formations. Jennison continues to believe the company’s strong backlog of projects ($1.5+ billion of potential opportunities for 2015 and beyond) should support potential double-digit dividend growth. |
| | |
| 6 | | Visit our website at www.prudentialfunds.com |
| | • | | Cheniere Energy rose steadily during the period despite a drop in October, likely resulting from the heightened energy sector volatility. Jennison believes the company has a first-mover advantage in the US liquid natural gas (LNG) export opportunity as it moves toward becoming the first large-scale LNG exporter from the US in late 2015. The company is in the process of investing over $30 billion to develop liquefaction and purification facilities, which Jennison believes will produce fixed fee “take or pay” revenue, giving the company the ability to produce substantial free cash flow that can either be reinvested or paid out to investors. |
| | • | | Units of master limited partnership (MLP) Phillips 66 Partners rose steadily during the period, despite the pullback in July and October, perhaps reflecting the heightened sector volatility. The company’s parent, Phillips 66, has provided unparalleled support as it continues to grow its midstream (processing and transportation) backlog and incubate projects, which should lead to potential dropdowns (when the parent company sells assets to the MLP) for the company and result in additional growth. |
Which holdings detracted most from the Fund’s return?
The major overall detractors came from the industrials sector, where positions in Brazil-based transportation infrastructure holding company CCR S.A., Grana y Montero SAA, and East Japan Railway Company all detracted from performance.
| | • | | Shares of CCR S.A., a Brazilian-based transportation infrastructure holding company, detracted from performance during the period. Concerns around the Brazilian elections and the prospects of an economic turnaround in the country further down the road caused the Fund to reduce its Brazilian exposure and exit the position. |
| | • | | Peruvian-based construction & engineering holding company Graña y Montero fell during the period, due, in part, to the potential impact of copper market weakness on mining in Peru. (Copper prices suffered a precipitous drop in March, falling to their lowest level in three-and-a-half years, largely on concerns over slowing growth in China.) Jennison’s concerns over the country’s exposure to natural resources, the company’s failure to win a large-scale passenger transit project, along with macroeconomic concerns, caused the Fund to exit the position during the period. |
| | • | | A position in the East Japan Railway Company was closed over concerns whether Prime Minister Shinzo Abe’s economic plans would be enough to stimulate the Japanese economy. Additionally, Japan’s tax hike in April and Jennison’s sentiment that “Abenomics” was moving much slower than initially anticipated prompted the Fund to exit the position and take profits. |
| | | | |
| Prudential Jennison Global Infrastructure Fund | | | 7 | |
Strategy and Performance Overview (continued)
Were there significant changes to the Fund?
The Fund scaled back its positions in industrials in favor of sectors such as energy, with greater exposure to what Jennison believes is an opportunity within the “energy renaissance” occurring in the US. The Fund increased its exposure to the energy sector, specifically in midstream infrastructure companies.
The Fund added or exited individual positions based on company fundamentals and a stock’s risk-reward characteristics. Significant positions established included Cheniere Energy Partners LP, Veolia Environment SA, Edison International, and industrials company China CNR. Positions in Aurizon Holdings and Grana y Montero SAA were eliminated, while the Fund reduced its positions in utilities company Drax Group.
| | |
| 8 | | Visit our website at www.prudentialfunds.com |
Comments on Largest Holdings
| 3.0% | Groupe Eurotunnel SA, Transportation Infrastructure |
Groupe Eurotunnel SA is a holding company that engages in the fields of infrastructure management and transport operations. The company owns and operates the Channel Tunnel (or Chunnel) beneath the English Channel. It has exposure to the railway system providing passenger and freight transport between continental Europe and the UK. With longer-term plans to expand the Eurotunnel/Eurostar routes to Germany and the Netherlands, the company has a good growth trajectory for generating significant free cash flow, in Jennison’s opinon.
| 2.9% | Atlantia SpA , Transportation Infrastructure |
Atlantia SpA, an Italian-based infrastructure holding company with its subsidiaries, engages in the construction, maintenance, and operation of toll roads and tunnels mainly in Italy, but also in Brazil, Chile, India, Poland, and the United States. In mid-February, Moody’s Investor Services announced a change in its outlook for Atlantia from negative to stable, citing not only the improving economy, but also the company’s strong business and financial risk profile. Jennison continues to view Atlantia as an attractive pure-play European toll operator, with smaller stakes in fast-growing markets in Latin America and elsewhere. Jennison sees continued upside potential for the stock from a sustained recovery in traffic on Italian toll roads.
| 2.4% | Targa Resources, Corp., Oil, Gas & Consumable Fuels |
See discussion of Targa resources in the commentary section.
| 2.3% | Ferrovial, SA, Construction & Engineering |
Ferrovial SA, a Spanish-based infrastructure and construction company, operates and runs infrastructure-related assets and services around the globe. It operates through its construction, services, toll roads, and airports segments. Jennison continues to see Ferrovial’s two most attractive assets as Canada’s 407 ETR (express toll route), just north of Toronto, and BAA (British Airports Authority). Both, in Jennison’s opinion, have a favorable regulatory environment and good long-term growth prospects.
| 2.3% | Huadian Fuxin Energy Corp. Ltd., Independent Power & Renewable |
Electricity Producers
Chinese clean energy company Huadian Fuxin Energy (known as Fuxin), along with its subsidiaries, develops, manages, and operates a complementary portfolio of power generation assets, which include not only wind and solar, but also hydro, nuclear, and biomass projects, as well as some coal-fired plants. With a supportive macroeconomic backdrop for clean energy stocks, China continues to clean up its environment and Jennison sees the company poised for strong growth.
| | | | |
| Prudential Jennison Global Infrastructure Fund | | | 9 | |
Fees and Expenses (Unaudited)
As a shareholder of the Fund, you incur two types of costs: (1) transaction costs, including sales charges (loads) on purchase payments and redemptions, as applicable, and (2) ongoing costs, including management fees, distribution, and/or service (12b-1) fees, and other Fund expenses, as applicable. This example is intended to help you understand your ongoing costs (in dollars) of investing in the Fund and to compare these costs with the ongoing costs of investing in other mutual funds.
The example is based on an investment of $1,000 invested on May 1, 2014, at the beginning of the period, and held through the initial fiscal period ended October 31, 2014. The example is for illustrative purposes only; you should consult the Prospectus for information on initial and subsequent minimum investment requirements.
Actual Expenses
The first line for each share class in the table on the following page provides information about actual account values and actual expenses. You may use the information on this line, together with the amount you invested, to estimate the expenses that you paid over the period. Simply divide your account value by $1,000 (for example, an $8,600 account value ÷ $1,000 = 8.6), then multiply the result by the number on the first line under the heading “Expenses Paid During the Six-Month Period” to estimate the expenses you paid on your account during this period.
Hypothetical Example for Comparison Purposes
The second line for each share class in the table on the following page provides information about hypothetical account values and hypothetical expenses based on the Fund’s actual expense ratio and an assumed rate of return of 5% per year before expenses, which is not the Fund’s actual return. The hypothetical account values and expenses may not be used to estimate the actual ending account balance or expenses you paid for the period. You may use this information to compare the ongoing costs of investing in the Fund and other funds. To do so, compare this 5% hypothetical example with the 5% hypothetical examples that appear in the shareholder reports of the other funds.
The Fund’s transfer agent may charge additional fees to holders of certain accounts that are not included in the expenses shown in the table on the following page. These fees apply to individual retirement accounts (IRAs) and Section 403(b) accounts. As of the close of the period covered by the table, IRA fees included an annual maintenance fee of $15 per account (subject to a maximum annual maintenance fee of $25 for all accounts held by the same shareholder). Section 403(b) accounts are charged an annual $25 fiduciary maintenance fee. Some of the fees may vary in amount, or may be waived, based on your total account balance or the number of Prudential Investments funds, including the Fund, that you own. You should consider
| | |
| 10 | | Visit our website at www.prudentialfunds.com |
the additional fees that were charged to your Fund account over the six-month period when you estimate the total ongoing expenses paid over the period and the impact of these fees on your ending account value, as these additional expenses are not reflected in the information provided in the expense table. Additional fees have the effect of reducing investment returns.
Please note that the expenses shown in the table are meant to highlight your ongoing costs only and do not reflect any transactional costs such as sales charges (loads). Therefore, the second line for each share class in the table is useful in comparing ongoing costs only and will not help you determine the relative total costs of owning different funds. In addition, if these transactional costs were included, your costs would have been higher.
| | | | | | | | | | | | | | | | | | |
Prudential
Jennison Global
Infrastructure Fund | | Beginning Account
Value
May 1, 2014 | | | Ending Account
Value
October 31, 2014 | | | Annualized
Expense Ratio
Based on the
Six-Month Period | | | Expenses Paid
During the
Six-Month Period* | |
| | | | | | | | | | | | | | | | | | |
Class A | | Actual | | $ | 1,000.00 | | | $ | 1,081.40 | | | | 1.50 | % | | $ | 7.87 | |
| | | Hypothetical | | $ | 1,000.00 | | | $ | 1,017.64 | | | | 1.50 | % | | $ | 7.63 | |
| | | | | | | | | | | | | | | | | | |
Class C | | Actual | | $ | 1,000.00 | | | $ | 1,078.00 | | | | 2.25 | % | | $ | 11.78 | |
| | | Hypothetical | | $ | 1,000.00 | | | $ | 1,013.86 | | | | 2.25 | % | | $ | 11.42 | |
| | | | | | | | | | | | | | | | | | |
Class Z | | Actual | | $ | 1,000.00 | | | $ | 1,083.10 | | | | 1.25 | % | | $ | 6.56 | |
| | | Hypothetical | | $ | 1,000.00 | | | $ | 1,018.90 | | | | 1.25 | % | | $ | 6.36 | |
*Fund expenses (net of fee waivers or subsidies, if any) for each share class are equal to the annualized expense ratio for each share class (provided in the table), multiplied by the average account value over the period, multiplied by the 184 days in the six-month period ended October 31, 2014, and divided by the 365 days in the Fund’s fiscal year ended October 31, 2014 (to reflect the six-month period). Expenses presented in the table include the expenses of any underlying portfolios in which the Fund may invest.
| | | | |
| Prudential Jennison Global Infrastructure Fund | | | 11 | |
Fees and Expenses (continued)
The Fund’s annualized expense ratios for the year ended October 31, 2014, are as follows:
| | | | | | | | |
| Class | | Gross Operating Expenses | | | Net Operating Expenses | |
A | | | 1.95 | % | | | 1.50 | % |
C | | | 2.70 | | | | 2.25 | |
Z | | | 2.08 | | | | 1.25 | |
Net operating expenses shown above reflect any fee waivers and/or expense reimbursements. Additional information on Fund expenses and any fee waivers and/or expense reimbursements can be found in the “Financial Highlights” tables in this report and in the Notes to the Financial Statements in this report.
| | |
| 12 | | Visit our website at www.prudentialfunds.com |
Portfolio of Investments
as of October 31, 2014
| | | | | | | | |
| Description | | Shares | | | Value (Note 1) | |
LONG-TERM INVESTMENTS 97.0% | | | | | | | | |
| | |
COMMON STOCKS | | | | | | | | |
| | |
Australia 4.9% | | | | | | | | |
APA Group | | | 36,900 | | | $ | 256,542 | |
Asciano Ltd. | | | 180,889 | | | | 1,000,584 | |
Spotless Group Holdings Ltd.*, 144A | | | 89,870 | | | | 152,059 | |
Spotless Group Holdings Ltd.* | | | 204,872 | | | | 346,642 | |
Transurban Group, 144A | | | 9,747 | | | | 69,808 | |
Transurban Group | | | 95,050 | | | | 680,741 | |
| | | | | | | | |
| | | | | | | 2,506,376 | |
| | |
Bermuda 1.2% | | | | | | | | |
Teekay Corp. | | | 10,523 | | | | 615,175 | |
| | |
Brazil 0.4% | | | | | | | | |
Alupar Investimento SA, UTS | | | 27,294 | | | | 200,362 | |
| | |
Canada 7.8% | | | | | | | | |
AltaGas Ltd. | | | 12,218 | | | | 504,092 | |
Canadian Pacific Railway Ltd. | | | 5,542 | | | | 1,152,754 | |
Enbridge, Inc. | | | 9,576 | | | | 453,519 | |
Pembina Pipeline Corp. | | | 5,616 | | | | 232,727 | |
Secure Energy Services, Inc. | | | 23,218 | | | | 429,936 | |
Veresen, Inc. | | | 39,845 | | | | 625,401 | |
Westshore Terminals Investment Corp. | | | 19,381 | | | | 590,690 | |
| | | | | | | | |
| | | | | | | 3,989,119 | |
| | |
China 7.4% | | | | | | | | |
Beijing Enterprises Water Group Ltd.* | | | 688,371 | | | | 492,871 | |
China CNR Corp. Ltd. (Class H Stock)*, 144A | | | 416,039 | | | | 412,530 | |
China CNR Corp. Ltd. (Class H Stock)* | | | 617,654 | | | | 612,444 | |
China Longyuan Power Group Corp. (Class H Stock) | | | 644,089 | | | | 686,848 | |
Huadian Fuxin Energy Corp. Ltd. (Class H Stock) | �� | | 2,065,112 | | | | 1,188,148 | |
Shenzhen Expressway Co. Ltd. (Class H Stock) | | | 591,488 | | | | 378,419 | |
| | | | | | | | |
| | | | | | | 3,771,260 | |
| | |
France 4.9% | | | | | | | | |
Groupe Eurotunnel SA | | | 120,076 | | | | 1,517,668 | |
Suez Environnement Co. | | | 28,516 | | | | 480,417 | |
Veolia Environnement SA | | | 31,980 | | | | 531,149 | |
| | | | | | | | |
| | | | | | | 2,529,234 | |
See Notes to Financial Statements.
| | | | |
| Prudential Jennison Global Infrastructure Fund | | | 13 | |
Portfolio of Investments
as of October 31, 2014 (continued)
| | | | | | | | |
| Description | | Shares | | | Value (Note 1) | |
COMMON STOCKS (Continued) | | | | | | | | |
| | |
Germany 0.8% | | | | | | | | |
Fraport AG Frankfurt Airport Services Worldwide | | | 6,520 | | | $ | 403,983 | |
| | |
Italy 4.9% | | | | | | | | |
Atlantia SpA | | | 62,265 | | | | 1,470,524 | |
Enel SpA | | | 131,030 | | | | 669,552 | |
Telecom Italia SpA* | | | 312,322 | | | | 353,948 | |
| | | | | | | | |
| | | | | | | 2,494,024 | |
| | |
Japan 2.0% | | | | | | | | |
Nippon Prologis REIT, Inc., 144A | | | 42 | | | | 97,461 | |
Nippon Prologis REIT, Inc. | | | 390 | | | | 904,989 | |
| | | | | | | | |
| | | | | | | 1,002,450 | |
| | |
Mexico 2.2% | | | | | | | | |
Infraestructura Energetica Nova SAB de CV | | | 88,813 | | | | 541,864 | |
Promotora y Operadora de Infraestructura SAB de CV* | | | 43,926 | | | | 605,904 | |
| | | | | | | | |
| | | | | | | 1,147,768 | |
| | |
New Zealand 2.3% | | | | | | | | |
Auckland International Airport Ltd. | | | 114,782 | | | | 347,009 | |
Meridian Energy Ltd., 144A | | | 71,425 | | | | 92,134 | |
Meridian Energy Ltd. | | | 555,522 | | | | 716,586 | |
| | | | | | | | |
| | | | | | | 1,155,729 | |
| | |
Portugal 0.7% | | | | | | | | |
EDP - Energias de Portugal SA, 144A | | | 2,143 | | | | 9,222 | |
EDP - Energias de Portugal SA | | | 80,971 | | | | 348,444 | |
| | | | | | | | |
| | | | | | | 357,666 | |
| | |
South Korea 1.7% | | | | | | | | |
Korea Electric Power Corp., ADR | | | 40,752 | | | | 890,839 | |
| | |
Spain 3.6% | | | | | | | | |
Abengoa Yield PLC* | | | 19,927 | | | | 647,627 | |
Ferrovial SA | | | 58,315 | | | | 1,192,252 | |
| | | | | | | | |
| | | | | | | 1,839,879 | |
| | |
Switzerland 1.1% | | | | | | | | |
Flughafen Zuerich AG | | | 888 | | | | 565,850 | |
See Notes to Financial Statements.
| | | | | | | | |
| Description | | Shares | | | Value (Note 1) | |
COMMON STOCKS (Continued) | | | | | | | | |
| | |
United Kingdom 3.2% | | | | | | | | |
Drax Group PLC | | | 56,303 | | | $ | 535,720 | |
Liberty Global PLC (Class C Stock)* | | | 13,753 | | | | 611,596 | |
National Grid PLC, ADR | | | 6,799 | | | | 505,778 | |
| | | | | | | | |
| | | | | | | 1,653,094 | |
| | |
United States 47.9% | | | | | | | | |
American Tower Corp., REIT | | | 5,101 | | | | 497,347 | |
American Water Works Co., Inc. | | | 10,189 | | | | 543,787 | |
Calpine Corp.* | | | 23,296 | | | | 531,615 | |
Charter Communications, Inc. (Class A Stock)* | | | 3,759 | | | | 595,388 | |
Cheniere Energy Partners LP Holdings LLC | | | 24,508 | | | | 592,113 | |
Cheniere Energy, Inc.* | | | 10,495 | | | | 787,125 | |
CMS Energy Corp. | | | 7,646 | | | | 249,795 | |
Dominion Midstream Partners LP, MLP* | | | 12,330 | | | | 368,050 | |
Dominion Resources, Inc. | | | 9,522 | | | | 678,919 | |
Edison International | | | 15,517 | | | | 971,054 | |
Energy Transfer Equity LP, MLP | | | 20,053 | | | | 1,170,293 | |
EnLink Midstream LLC | | | 11,387 | | | | 431,567 | |
EQT Midstream Partners LP, MLP | | | 11,971 | | | | 1,060,391 | |
Exelon Corp. | | | 16,204 | | | | 592,904 | |
Kinder Morgan, Inc. | | | 16,321 | | | | 631,623 | |
Kirby Corp.* | | | 4,841 | | | | 535,318 | |
MPLX LP, MLP | | | 14,879 | | | | 992,132 | |
NextEra Energy, Inc. | | | 7,527 | | | | 754,356 | |
NiSource, Inc. | | | 17,172 | | | | 722,254 | |
NRG Energy, Inc. | | | 16,732 | | | | 501,625 | |
NRG Yield, Inc. (Class A Stock) | | | 23,416 | | | | 1,170,098 | |
ONEOK, Inc. | | | 8,224 | | | | 484,723 | |
Phillips 66 Partners LP, MLP | | | 13,225 | | | | 921,650 | |
Plains GP Holdings LP, MLP (Class A Stock) | | | 22,632 | | | | 649,086 | |
SBA Communications Corp. (Class A Stock)* | | | 10,196 | | | | 1,145,317 | |
SemGroup Corp. (Class A Stock) | | | 13,360 | | | | 1,025,380 | |
Sempra Energy | | | 7,334 | | | | 806,740 | |
Shell Midstream Partners LP, MLP | | | 15,337 | | | | 516,704 | |
SunEdison, Inc.* | | | 22,930 | | | | 447,364 | |
Targa Resources Corp. | | | 9,520 | | | | 1,224,558 | |
Union Pacific Corp. | | | 5,985 | | | | 696,953 | |
Vivint Solar, Inc. | | | 22,991 | | | | 323,713 | |
Western Gas Equity Partners LP, MLP | | | 10,702 | | | | 660,527 | |
Westlake Chemical Partners LP, MLP* | | | 4,971 | | | | 149,876 | |
See Notes to Financial Statements.
| | | | |
| Prudential Jennison Global Infrastructure Fund | | | 15 | |
Portfolio of Investments
as of October 31, 2014 continued
| | | | | | | | |
| Description | | Shares | | | Value (Note 1) | |
COMMON STOCKS (Continued) | | | | | | | | |
| | |
United States (cont’d.) | | | | | | | | |
Williams Cos., Inc. (The) | | | 19,543 | | | $ | 1,084,832 | |
| | | | | | | | |
| | | | | | | 24,515,177 | |
| | | | | | | | |
TOTAL LONG-TERM INVESTMENTS
(cost $45,742,194) | | | | | | | 49,637,985 | |
| | | | | | | | |
| | |
SHORT-TERM INVESTMENT 3.3% | | | | | | | | |
| | |
AFFILIATED MONEY MARKET MUTUAL FUND | | | | | | | | |
Prudential Investment Portfolios 2 - Prudential Core Taxable Money Market Fund
(cost $1,667,960) (Note 3)(a) | | | 1,667,960 | | | | 1,667,960 | |
| | | | | | | | |
TOTAL INVESTMENTS 100.3%
(cost $47,410,154; Note 5) | | | | | | | 51,305,945 | |
Liabilities in excess of other assets (0.3)% | | | | | | | (162,553 | ) |
| | | | | | | | |
NET ASSETS 100.0% | | | | | | $ | 51,143,392 | |
| | | | | | | | |
The following abbreviations are used in the portfolio descriptions:
144A—Security was purchased pursuant to Rule 144A under the Securities Act of 1933 and may not be resold subject to that rule except to qualified institutional buyers. Unless otherwise noted, 144A securities are deemed to be liquid.
ADR—American Depositary Receipt
MLP—Master Limited Partnership
REIT—Real Estate Investment Trust
UTS—Unit Trust Security
| * | Non-income producing security. |
| (a) | Prudential Investments LLC, the manager of the Fund also serves as manager of the Prudential Investment Portfolios 2 - Prudential Core Taxable Money Market Fund. |
Various inputs are used in determining the value of the Fund’s investments. These inputs are summarized in the three broad levels listed below.
Level 1—quoted prices generally in active markets for identical securities.
Level 2—quoted prices for similar securities, interest rates and yield curves, prepayment speeds, foreign currency exchange rates, and other significant observable inputs.
Level 3—significant unobservable inputs for securities valued in accordance with Board approved fair valuation procedures.
See Notes to Financial Statements.
The following is a summary of the inputs used as of October 31, 2014 in valuing such portfolio securities:
| | | | | | | | | | | | |
| | | Level 1 | | | Level 2 | | | Level 3 | |
Investments in Securities | | | | | | | | | | | | |
Common Stocks | | | | | | | | | | | | |
Australia | | $ | — | | | $ | 2,506,376 | | | $ | — | |
Bermuda | | | 615,175 | | | | — | | | | — | |
Brazil | | | 200,362 | | | | — | | | | — | |
Canada | | | 3,989,119 | | | | — | | | | — | |
China | | | — | | | | 2,746,286 | | | | 1,024,974 | |
France | | | — | | | | 2,529,234 | | | | — | |
Germany | | | — | | | | 403,983 | | | | — | |
Italy | | | — | | | | 2,494,024 | | | | — | |
Japan | | | — | | | | 1,002,450 | | | | — | |
Mexico | | | 1,147,768 | | | | — | | | | — | |
New Zealand | | | — | | | | 1,155,729 | | | | — | |
Portugal | | | — | | | | 357,666 | | | | — | |
South Korea | | | 890,839 | | | | — | | | | — | |
Spain | | | 647,627 | | | | 1,192,252 | | | | — | |
Switzerland | | | — | | | | 565,850 | | | | — | |
United Kingdom | | | 1,117,374 | | | | 535,720 | | | | — | |
United States | | | 24,515,177 | | | | — | | | | — | |
Affiliated Money Market Mutual Fund | | | 1,667,960 | | | | — | | | | — | |
| | | | | | | | | | | | |
Total | | $ | 34,791,401 | | | $ | 15,489,570 | | | $ | 1,024,974 | |
| | | | | | | | | | | | |
The following is a reconciliation of assets in which significant unobservable inputs (Level 3) were used in determining fair value:
| | | | |
| | | Common
Stock | |
Balance as of 10/31/13 | | $ | — | |
Accrued discount/premium | | | — | |
Realized gain (loss) | | | — | |
Change in unrealized appreciation (depreciation)* | | | 191,697 | |
Purchases | | | 833,277 | |
Sales | | | — | |
Transfers into Level 3 | | | — | |
Transfers out of Level 3 | | | — | |
| | | | |
Balance as of 10/31/14 | | $ | 1,024,974 | |
| | | | |
| * | Of which, $191,697 was included in Net Assets relating to securities held at the reporting period end. |
| | | | |
| Prudential Jennison Global Infrastructure Fund | | | 17 | |
Portfolio of Investments
as of October 31, 2014 continued
Level 3 securities as presented in the table above are being fair valued using pricing methodologies approved by the Valuation Committee, which contain unobservable inputs. Such methodologies include, but are not limited to, using prices provided by a single broker/dealer, the cost of the investment, and broker quotes adjusted for changes in yields of compariable U.S. Government and other securities using fixed income securities valuation model.
The industry classification of investments and liabilities in excess of other assets shown as a percentage of net assets as of October 31, 2014 was as follows (Unaudited):
| | | | |
Oil, Gas & Consumable Fuels | | | 29.3 | % |
Transportation Infrastructure | | | 11.8 | |
Electric Utilities | | | 11.0 | |
Independent Power & Renewable Electricity Producers | | | 10.2 | |
Multi-Utilities | | | 7.7 | |
Road & Rail | | | 5.6 | |
Construction & Engineering | | | 3.5 | |
Affiliated Money Market Mutual Fund | | | 3.3 | |
Real Estate Investment Trusts (REITs) | | | 3.0 | |
Media | | | 2.4 | |
Wireless Telecommunication Services | | | 2.2 | |
Water Utilities | | | 2.1 | |
Machinery | | | 2.0 | % |
Gas Utilities | | | 1.5 | |
Marine | | | 1.0 | |
Commercial Services & Supplies | | | 1.0 | |
Semiconductors & Semiconductor Equipment | | | 0.9 | |
Energy Equipment & Services | | | 0.8 | |
Diversified Telecommunication Services | | | 0.7 | |
Chemicals | | | 0.3 | |
| | | | |
| | | 100.3 | |
Liabilities in excess of other assets | | | (0.3 | ) |
| | | | |
| | | 100.0 | % |
| | | | |
See Notes to Financial Statements.
PRUDENTIAL INVESTMENTS»MUTUAL FUNDS
FINANCIAL STATEMENTS
ANNUAL REPORT · OCTOBER 31, 2014
Prudential Jennison Global Infrastructure Fund
Statement of Assets and Liabilities
as of October 31, 2014
| | | | |
Assets | | | | |
Investments at value: | | | | |
Unaffiliated investments (cost $45,742,194) | | $ | 49,637,985 | |
Affiliated investments (cost $1,667,960) | | | 1,667,960 | |
Cash | | | 4,798 | |
Foreign currency, at value (cost $4) | | | 4 | |
Receivable for Fund shares sold | | | 524,905 | |
Dividends receivable | | | 66,620 | |
Tax reclaim receivable | | | 15,204 | |
Prepaid expenses | | | 660 | |
| | | | |
Total assets | | | 51,918,136 | |
| | | | |
| |
Liabilities | | | | |
Payable for investments purchased | | | 465,368 | |
Payable for Fund shares reacquired | | | 202,422 | |
Accrued expenses | | | 64,978 | |
Management fee payable | | | 34,506 | |
Distribution fee payable | | | 6,062 | |
Affiliated transfer agent fee payable | | | 1,408 | |
| | | | |
Total liabilities | | | 774,744 | |
| | | | |
| |
Net Assets | | $ | 51,143,392 | |
| | | | |
| | | | | |
Net assets were comprised of: | | | | |
Common stock, at par | | $ | 40,534 | |
Paid-in capital in excess of par | | | 47,415,998 | |
| | | | |
| | | 47,456,532 | |
Undistributed net investment income | | | 12,100 | |
Accumulated net realized loss on investment and foreign currency transactions | | | (219,682 | ) |
Net unrealized appreciation on investments and foreign currencies | | | 3,894,442 | |
| | | | |
Net assets, October 31, 2014 | | $ | 51,143,392 | |
| | | | |
See Notes to Financial Statements.
| | | | |
Class A | | | | |
Net asset value and redemption price per share,
($15,521,019 ÷ 1,229,874 shares of common stock issued and outstanding) | | $ | 12.62 | |
Maximum sales charge (5.50% of offering price) | | | 0.73 | |
| | | | |
Maximum offering price to public | | $ | 13.35 | |
| | | | |
| |
Class C | | | | |
Net asset value, offering price and redemption price per share,
($3,834,784 ÷ 304,897 shares of common stock issued and outstanding) | | $ | 12.58 | |
| | | | |
| |
Class Z | | | | |
Net asset value, offering price and redemption price per share,
($31,787,589 ÷ 2,518,603 shares of common stock issued and outstanding) | | $ | 12.62 | |
| | | | |
See Notes to Financial Statements.
| | | | |
| Prudential Jennison Global Infrastructure Fund | | | 21 | |
Statement of Operations
Year Ended October 31, 2014
| | | | |
Net Investment Income | | | | |
Income | | | | |
Unaffiliated dividend income (net of foreign withholding taxes of $45,051) | | $ | 744,334 | |
Affiliated dividend income | | | 1,797 | |
Interest income | | | 84 | |
| | | | |
Total income | | | 746,215 | |
| | | | |
| |
Expenses | | | | |
Management fee | | | 261,266 | |
Distribution fee—Class A | | | 14,717 | |
Distribution fee—Class C | | | 11,040 | |
Custodian’s fees and expenses | | | 81,000 | |
Registration fees | | | 44,000 | |
Legal fees and expenses | | | 36,000 | |
Reports to shareholders | | | 30,000 | |
Audit fee | | | 24,000 | |
Transfer agent’s fees and expenses (including affiliated expense of $3,600) | | | 14,000 | |
Directors’ fees | | | 13,000 | |
Insurance fees | | | 1,000 | |
Miscellaneous | | | 14,928 | |
| | | | |
Total expenses | | | 544,951 | |
Less: Management fee waivers and/or expense reimbursements | | | (192,613 | ) |
Distribution fee waiver—Class A | | | (2,453 | ) |
| | | | |
Net expenses | | | 349,885 | |
| | | | |
Net investment income | | | 396,330 | |
| | | | |
| |
Realized and Unrealized Gain (Loss) on Investments and Foreign Currencies | | | | |
Net realized loss on: | | | | |
Investment transactions | | | (297,968 | ) |
Foreign currency transactions | | | (10,976 | ) |
| | | | |
| | | (308,944 | ) |
| | | | |
Net change in unrealized appreciation (depreciation) on: | | | | |
Investments | | | 3,689,865 | |
Foreign currencies | | | (1,319 | ) |
| | | | |
| | | 3,688,546 | |
| | | | |
Net gain on investments and foreign currencies | | | 3,379,602 | |
| | | | |
Net Increase In Net Assets Resulting From Operations | | $ | 3,775,932 | |
| | | | |
See Notes to Financial Statements.
Statement of Changes in Net Assets
| | | | | | | | |
| | | Year
Ended
October 31, 2014 | | | September 25, 2013*
through October 31, 2014 | |
Increase (Decrease) in Net Assets | | | | | | | | |
Operations | | | | | | | | |
Net investment income | | $ | 396,330 | | | $ | 2,939 | |
Net realized gain (loss) on investment and foreign currency transactions | | | (308,944 | ) | | | 2,587 | |
Net change in unrealized appreciation (depreciation) on investments and foreign currencies | | | 3,688,546 | | | | 205,896 | |
| | | | | | | | |
Net increase in net assets resulting from operations | | | 3,775,932 | | | | 211,422 | |
| | | | | | | | |
| | |
Dividends and Distributions (Note 1) | | | | | | | | |
Dividends from net investment income | | | | | | | | |
Class A | | | (26,294 | ) | | | — | |
Class C | | | (3,856 | ) | | | — | |
Class Z | | | (267,600 | ) | | | — | |
| | | | | | | | |
| | | (297,750 | ) | | | — | |
| | | | | | | | |
Distributions from net realized gains | | | | | | | | |
Class A | | | (188 | ) | | | — | |
Class C | | | (45 | ) | | | — | |
Class Z | | | (5,357 | ) | | | — | |
| | | | | | | | |
| | | (5,590 | ) | | | — | |
| | | | | | | | |
| | |
Fund share transactions (Note 6) | | | | | | | | |
Net proceeds from shares sold | | | 53,476,844 | | | | 5,097,070 | |
Net asset value of shares issued in reinvestment of dividends and distributions | | | 296,204 | | | | — | |
Cost of shares reacquired | | | (11,410,715 | ) | | | (25 | ) |
| | | | | | | | |
Net increase in net assets from Fund share transactions | | | 42,362,333 | | | | 5,097,045 | |
| | | | | | | | |
Total increase | | | 45,834,925 | | | | 5,308,467 | |
| | |
Net Assets | | | | | | | | |
Beginning of period | | | 5,308,467 | | | | — | |
| | | | | | | | |
End of period(a) | | $ | 51,143,392 | | | $ | 5,308,467 | |
| | | | | | | | |
(a) Includes undistributed net investment income of: | | $ | 12,100 | | | $ | 4,298 | |
| | | | | | | | |
| * | Commencement of operations. |
See Notes to Financial Statements.
| | | | |
| Prudential Jennison Global Infrastructure Fund | | | 23 | |
Notes to Financial Statements
Prudential World Fund, Inc. (the “Fund”) is an open-end management investment company, registered under the Investment Company Act of 1940, as amended, (“1940 Act”) and currently consists of seven series: Prudential International Equity Fund, Prudential Jennison Global Infrastructure Fund (the “Series”), Prudential International Value Fund, Prudential Jennison Emerging Markets Equity Fund, Prudential Jennison Global Opportunities Fund, Prudential Jennison International Opportunities Fund and Prudential Emerging Markets Debt Local Currency Fund. These financial statements relate to the Prudential Jennison Global Infrastructure Fund. The financial statements of the other series are not presented herein.
The investment objective of the Series is to achieve total return.
Note 1. Accounting Policies
The following accounting policies conform to U.S. generally accepted accounting principles. The Trust consistently follows such policies in the preparation of its financial statements.
Securities Valuation: The Series holds securities and other assets that are fair valued at the close of each day the New York Stock Exchange (“NYSE”) is open for trading. Fair value is the price that would be received to sell an asset or paid to transfer a liability in an orderly transaction between market participants on the measurement date. The Board of Directors (the “Board”) has adopted Valuation Procedures for security valuation under which fair valuation responsibilities have been delegated to Prudential Investments LLC (“PI”). Under the current Valuation Procedures, the established Valuation Committee is responsible for supervising the valuation of portfolio securities and other assets. The Valuation Procedures permit the Series to utilize independent pricing vendor services, quotations from market makers, and alternative valuation methods when market quotations are either not readily available or not deemed representative of fair value. A record of the Valuation Committee’s actions is subject to the Board’s review, approval, and ratification at its next regularly-scheduled quarterly meeting.
Various inputs determine how the Series’ investments are valued, all of which are categorized according to the three broad levels (Level 1, 2, or 3) detailed in the table following the Portfolio of Investments.
Common and preferred stocks, exchange-traded funds, and derivative instruments such as futures or options that are traded on a national securities exchange are valued at the last sale price as of the close of trading on the applicable exchange. Securities traded via NASDAQ are valued at the NASDAQ official closing price. To the extent these securities are valued at the last sale price or NASDAQ official closing price, they are classified as Level 1 in the fair value hierarchy.
In the event that no sale or official closing price on valuation date exists, these securities are generally valued at the mean between the last reported bid and ask prices, or at the last bid price in the absence of an ask price. These securities are classified as Level 2 in the fair value hierarchy, as the inputs are observable and considered to be significant to the valuation.
Common and preferred stocks traded on foreign securities exchanges are valued using pricing vendor services that provide model prices derived using adjustment factors based on information such as local closing price, relevant general and sector indices, currency fluctuations, depositary receipts, and futures, as applicable. Securities valued using such model prices are classified as Level 2 in the fair value hierarchy, as the adjustment factors are observable and considered to be significant to the valuation. Securities not valued using such model prices are valued in accordance with exchange-traded common and preferred stocks discussed above.
Investments in open-end, non-exchange-traded mutual funds are valued at their net asset values as of the close of the NYSE on the date of valuation. These securities are classified as Level 1 in the fair value hierarchy since they may be purchased or sold at their net asset values on the date of valuation.
Fixed income securities traded in the over-the-counter market are generally valued at prices provided by approved independent pricing vendors. The pricing vendors provide these prices after evaluating observable inputs including, but not limited to yield curves, yield spreads, credit ratings, deal terms, tranche level attributes, default rates, cash flows, prepayment speeds, broker/dealer quotations, and reported trades. Securities valued using such vendor prices are classified as Level 2 in the fair value hierarchy.
Over-the-counter derivative instruments are generally valued using pricing vendor services, which derive the valuation based on inputs such as underlying asset prices, indices, spreads, interest rates, and exchange rates. These instruments are categorized as Level 2 in the fair value hierarchy.
Centrally cleared swaps listed or traded on a multilateral or trade facility platform, such as a registered exchange, are valued at the daily settlement price determined by
| | | | |
| Prudential Jennison Global Infrastructure Fund | | | 25 | |
Notes to Financial Statements
continued
the respective exchange. These securities are classified as Level 2 in the fair value hierarchy, as the prices marked at the official settle are not public.
Securities and other assets that cannot be priced according to the methods described above are valued based on pricing methodologies approved by the Board. In the event that significant unobservable inputs are used when determining such valuations, the securities will be classified as Level 3 in the fair value hierarchy.
When determining the fair value of securities, some of the factors influencing the valuation include: the nature of any restrictions on disposition of the securities; assessment of the general liquidity of the securities; the issuer’s financial condition and the markets in which it does business; the cost of the investment; the size of the holding and the capitalization of the issuer; the prices of any recent transactions or bids/offers for such securities or any comparable securities; any available analyst media or other reports or information deemed reliable by the investment adviser regarding the issuer or the markets or industry in which it operates. Using fair value to price securities may result in a value that is different from a security’s most recent closing price and from the price used by other mutual funds to calculate their net asset values.
Restricted and Illiquid Securities: Subject to guidelines adopted by the Board, the Series may invest up to 15% of its net assets in illiquid securities, including those which are restricted as to disposition under securities law (“restricted securities”). Restricted securities are valued pursuant to the valuation procedures noted above. Illiquid securities are those that, because of the absence of a readily available market or due to legal or contractual restrictions on resale, cannot be sold within seven days in the ordinary course of business at approximately the amount at which the Series has valued the investment. Therefore, the Series may find it difficult to sell illiquid securities at the time considered most advantageous by its Subadviser and may incur expenses that would not be incurred in the sale of securities that were freely marketable. Certain securities that would otherwise be considered illiquid because of legal restrictions on resale to the general public may be traded among qualified institutional buyers under Rule 144A of the Securities Act of 1933. These Rule 144A securities, as well as commercial paper that is sold in private placements under Section 4(2) of the Securities Act, may be deemed liquid by the Series’ Subadviser under the guidelines adopted by the Directors of the Series. However, the liquidity of the Series’ investments in Rule 144A securities could be impaired if trading does not develop or declines.
Foreign Currency Translation: The books and records of the Series are maintained in U.S. dollars. Foreign currency amounts are translated into U.S. dollars on the following basis:
(i) market value of investment securities, other assets and liabilities at the current rates of exchange;
(ii) purchases and sales of investment securities, income and expenses at the rates of exchange prevailing on the respective dates of such transactions.
Although the net assets of the Series are presented at the foreign exchange rates and market values at the close of the fiscal period, the Series does not isolate that portion of the results of operations arising as a result of changes in the foreign exchange rates from the fluctuations arising from changes in the market prices of long-term securities held at the end of the fiscal period. Similarly, the Series does not isolate the effect of changes in foreign exchange rates from the fluctuations arising from changes in the market prices of long-term portfolio securities sold during the fiscal period. Accordingly, realized foreign currency gains or losses are included in the reported net realized gains or losses on investment transactions.
Net realized gains or losses on foreign currency transactions represent net foreign exchange gains or losses from the holding of foreign currencies, currency gains or losses realized between the trade date and settlement date on securities transactions, and the difference between the amounts of dividends, interest and foreign withholding taxes recorded on the Series’ books and the U.S. dollar equivalent amounts actually received or paid. Net unrealized currency gains or losses from valuing foreign currency denominated assets and liabilities (other than investments) at period end exchange rates are reflected as a component of net unrealized appreciation (depreciation) on investments and foreign currencies. Foreign security and currency transactions may involve certain considerations and risks not typically associated with those of domestic origin as a result of, among other factors, the possibility of political and economic instability or the level of governmental supervision and regulation of foreign securities markets.
REITs: The Series invests in real estate investment trusts (“REITs”), which report information on the source of their distributions annually. Based on current and historical information, a portion of distributions received from REITs during the year is estimated to be dividend income, capital gain or return of capital and is recorded accordingly. These estimates are adjusted periodically when the actual source of distributions is disclosed by the REITs.
Securities Lending: The Series may lend its portfolio securities to banks and broker-dealers. The loans are secured by collateral at least equal to the market value of the
| | | | |
| Prudential Jennison Global Infrastructure Fund | | | 27 | |
Notes to Financial Statements
continued
securities loaned. Collateral pledged by each borrower is invested in a highly liquid short-term money market fund and is marked to market daily, based on the previous day’s market value, such that the value of the collateral exceeds the value of the loaned securities. Loans are subject to termination at the option of the borrower or the Series. Upon termination of the loan, the borrower will return to the Series securities identical to the loaned securities. Should the borrower of the securities fail financially, the Series has the right to repurchase the securities using the collateral in the open market. The Series recognizes income, net of any rebate and securities lending agent fees, for lending its securities, and any interest on the investment of cash received as collateral. The Series also continues to receive interest and dividends or amounts equivalent thereto, on the securities loaned and recognizes any unrealized gain or loss in the market price of the securities loaned that may occur during the term of the loan.
Warrants and Rights: The Series may hold warrants and rights acquired either through a direct purchase, included as part of a private placement, or pursuant to corporate actions. Warrants and rights entitle the holder to buy a proportionate amount of common stock, or such other security that the issuer may specify, at a specific price and time through the expiration dates. Such warrants and rights are held as long positions by the Series until exercised, sold or expired. Warrants and rights are valued at fair value in accordance with the Board of Directors’ approved fair valuation procedures.
Securities Transactions and Net Investment Income: Securities transactions are recorded on the trade date. Realized gains or losses from investment and currency transactions are calculated on the identified cost basis. Dividend income is recorded on the ex-dividend date. Interest income, including amortization of premium and accretion of discount on debt securities, as required, is recorded on the accrual basis. Expenses are recorded on the accrual basis, which may require the use of certain estimates by management that may differ from actual.
Net investment income or loss (other than distribution fees which are charged directly to the respective class) and unrealized and realized gains or losses are allocated daily to each class of shares based upon the relative proportion of adjusted net assets of each class at the beginning of the day.
Dividends and Distributions: The Series expects to pay dividends from net investment income quarterly and distributions from net realized capital gains, if any, at least annually. Dividends and distributions to shareholders, which are determined in accordance with federal income tax regulations and which may differ from generally accepted accounting principles, are recorded on the ex-dividend date. Permanent book/tax differences relating to income and gains are reclassified amongst undistributed net investment income, accumulated net realized gain or loss and paid-in capital in excess of par, as appropriate.
Taxes: It is the Series’ policy to continue to meet the requirements of the Internal Revenue Code applicable to regulated investment companies and to distribute all of its taxable net investment income and capital gains, if any, to its shareholders. Therefore, no federal income tax provision is required. Withholding taxes on foreign dividends are recorded, net of reclaimable amounts, at the time the related income is earned.
Estimates: The preparation of the financial statements requires management to make estimates and assumptions that affect the reported amounts and disclosures in the financial statements. Actual results could differ from those estimates.
Note 2. Agreements
The Fund has a management agreement for the Series with PI. Pursuant to this agreement, PI has responsibility for all investment advisory services and supervises the subadvisor’s performance of such services. PI entered into a subadvisory agreement with Jennison Associates LLC (“Jennison”). The subadvisory agreement provides that Jennison furnishes investment advisory services in connection with the management of the Series. In connection therewith, Jennison is obligated to keep certain books and records of the Series. PI pays for the services of Jennison, the cost of compensation of officers of the Series, occupancy and certain clerical and bookkeeping costs of the Series. The Series bears all other costs and expenses.
The management fee paid to PI is computed daily and payable monthly, at an annual rate of 1.00% of the average daily net assets of the Series.
PI has contractually agreed, through February 29, 2016, to limit net annual Fund operating expenses (exclusive of distribution and service (12b-1) fees, acquired fund fees and expenses, extraordinary and certain other expenses, including taxes, interest and brokerage commissions) of each class of shares to 1.25% of the Fund’s average daily net assets.
| | | | |
| Prudential Jennison Global Infrastructure Fund | | | 29 | |
Notes to Financial Statements
continued
The Series has a distribution agreement with Prudential Investment Management Services LLC (“PIMS”) which acts as the distributor of the Class A, C, and Z shares of the Series. The Series compensates PIMS for distributing and servicing the Fund’s Class A and C shares, pursuant to plans of distribution (the “Distribution Plans”) regardless of expenses actually incurred by PIMS. The distribution fees are accrued daily and payable monthly. No distribution or service fees are paid to PIMS as distributor for Class Z shares of the Fund.
Pursuant to the Distribution Plans, the Fund compensates PIMS for distribution related activities at an annual rate of up to .30% and 1% of the average daily net assets of the Class A and C shares, respectively. For the year ended October 31, 2014, PIMS contractually agreed to limit such fees to .25% of the average daily net assets of the Class A shares.
PIMS has advised the Series that it has received $130,596 in front-end sales charges resulting from sales of Class A shares during the year ended October 31, 2014. From these fees, PIMS paid such sales charges to broker-dealers, which in turn paid commissions to salespersons and incurred other distribution costs.
PIMS has advised the Series that for the year ended October 31, 2014 it has received $462 in contingent deferred sales charges imposed upon redemptions by certain Class C shareholders.
PI, Jennison and PIMS are indirect, wholly-owned subsidiaries of Prudential Financial, Inc. (“Prudential”).
Note 3. Other Transactions with Affiliates
Prudential Mutual Fund Services LLC (“PMFS”), an affiliate of PI and an indirect, wholly-owned subsidiary of Prudential, serves as the Series’ transfer agent. Transfer agent’s fees and expenses in the Statement of Operations include certain out-of-pocket expenses paid to non-affiliates, where applicable.
The Series invests in the Prudential Core Taxable Money Market Fund (the “Core Fund”), a series of the Prudential Investment Portfolios 2, registered under the 1940 Act, and managed by PI. Earnings from the Core Fund are disclosed on the Statement of Operations as affiliated dividend income.
Note 4. Portfolio Securities
Purchases and sales of portfolio securities, other than short-term investments, for the year ended October 31, 2014 aggregated $53,367,304 and $12,502,084, respectively.
Note 5. Tax Information
Distributions to shareholders, which are determined in accordance with federal income tax regulations and which may differ from generally accepted accounting principles, are recorded on the ex-dividend date. In order to present undistributed net investment income, accumulated net realized loss on investment and foreign currency transactions and paid-in capital in excess of par on the Statement of Assets and Liabilities that more closely represent their tax character, certain adjustments have been made to undistributed net investment income, accumulated net realized loss on investment and foreign currency transactions and paid-in capital in excess of par. For the year ended October 31, 2014, the adjustments were to decrease undistributed net investment income by $90,778, decrease accumulated net realized loss on investment and foreign currency transactions by $90,793 and decrease paid-in capital in excess of par by $15 due to differences in the treatment for book and tax purposes of certain transactions involving foreign currencies, partnership investments, reclassification of distributions and other book to tax differences. Net investment income, net realized gain (loss) on investment and foreign currencies transactions and net assets were not affected by this change.
For the year ended October 31, 2014, the tax character of dividends paid by the Fund was $303,340 of ordinary income. For the period ended October 31, 2013, there were no dividends paid by the Fund.
As of October 31, 2014, the accumulated undistributed earnings on a tax basis was $12,100 of ordinary income.
The United States federal income tax basis of the Series’ investments and the net unrealized appreciation as of October 31, 2014 were as follows:
| | | | | | | | | | |
Tax Basis | | Appreciation | | Depreciation | | Net
Unrealized
Appreciation | | Other Cost
Basis
Adjustment | | Total Net
Unrealized
Appreciation |
| $47,530,358 | | $4,792,943 | | $(1,017,356) | | $3,775,587 | | $(1,349) | | $3,774,238 |
The difference between book basis and tax basis is primarily attributable to deferred losses on wash sales and investments in partnerships. The other cost basis adjustments are primarily attributable to appreciation (depreciation) of foreign currencies and mark-to-market of receivables and payables.
| | | | |
| Prudential Jennison Global Infrastructure Fund | | | 31 | |
Notes to Financial Statements
continued
For federal income tax purposes, the Series had a capital loss carryforward as of October 31, 2014 of approximately $99,000 which can be carried forward for an unlimited period. No capital gains distributions are expected to be paid to shareholders until net gains have been realized in excess of such losses.
Management has analyzed the Series’ tax positions taken on federal income tax returns for all open tax years and has concluded that no provision for income tax is required in the Series’ financial statements for the current reporting period. The Series’ federal and state income and federal excise tax returns for tax years for which the applicable statutes of limitations have not expired are subject to examination by the Internal Revenue Service and state departments of revenue.
Note 6. Capital
The Series offers Class A, C, and Z shares. Class A shares are sold with a front-end sales charge of up to 5.50%. All investors who purchase Class A shares in an amount of $1 million or more and sell these shares within 12 months of purchase are subject to a contingent deferred sales charge (CDSC) of 1%. The Class A CDSC is waived for purchases by certain retirement and/or benefit plans. Class C shares are sold with a CDSC of 1% on shares redeemed within the first 12 months after purchase. A special exchange privilege is also available for shareholders who qualify to purchase Class A shares at net asset value. Class Z shares are not subject to any sales or redemption charge and are offered exclusively for sale to a limited group of investors.
Under certain circumstances, an exchange may be made from specified share classes of the Series to one or more other share classes of the Series as presented in the table of transactions in shares of common stock.
There are 900 million authorized shares of common stock at $.01 par value per share, designated Class A, Class C, and Class Z, each of which consists of 200 million, 100 million, and 225 million authorized shares, respectively.
As of October 31, 2014, PI owned 1,013, 1,008 and 508,440 Class A, C and Z shares of the Series, respectively.
Transactions in shares of common stock were as follows:
| | | | | | | | |
Class A | | Shares | | | Amount | |
Year ended October 31, 2014: | | | | | | | | |
Shares sold | | | 1,489,657 | | | $ | 18,591,711 | |
Shares issued in reinvestment of dividends and distributions | | | 1,572 | | | | 19,650 | |
Shares reacquired | | | (263,419 | ) | | | (3,183,158 | ) |
| | | | | | | | |
Net increase (decrease) in shares outstanding | | | 1,227,810 | | | $ | 15,428,203 | |
| | | | | | | | |
Period* ended October 31, 2013: | | | | | | | | |
Shares sold | | | 2,064 | | | $ | 20,615 | |
Shares reacquired | | | — | | | | — | |
| | | | | | | | |
Net increase (decrease) in shares outstanding | | | 2,064 | | | $ | 20,615 | |
| | | | | | | | |
Class C | | | | | | |
Year ended October 31, 2014: | | | | | | | | |
Shares sold | | | 312,101 | | | $ | 3,876,606 | |
Shares issued in reinvestment of dividends and distributions | | | 290 | | | | 3,597 | |
Shares reacquired | | | (11,304 | ) | | | (137,633 | ) |
| | | | | | | | |
Net increase (decrease) in shares outstanding | | | 301,087 | | | $ | 3,742,570 | |
| | | | | | | | |
Period* ended October 31, 2013: | | | | | | | | |
Shares sold | | | 3,810 | | | $ | 39,025 | |
Shares reacquired | | | — | | | | — | |
| | | | | | | | |
Net increase (decrease) in shares outstanding | | | 3,810 | | | $ | 39,025 | |
| | | | | | | | |
Class Z | | | | | | |
Year ended October 31, 2014: | | | | | | | | |
Shares sold | | | 2,642,919 | | | $ | 31,008,527 | |
Shares issued in reinvestment of dividends and distributions | | | 22,904 | | | | 272,957 | |
Shares reacquired | | | (650,889 | ) | | | (8,089,924 | ) |
| | | | | | | | |
Net increase (decrease) in shares outstanding | | | 2,014,934 | | | $ | 23,191,560 | |
| | | | | | | | |
Period* ended October 31, 2013: | | | | | | | | |
Shares sold | | | 503,671 | | | $ | 5,037,430 | |
Shares reacquired | | | (2 | ) | | | (25 | ) |
| | | | | | | | |
Net increase (decrease) in shares outstanding | | | 503,669 | | | $ | 5,037,405 | |
| | | | | | | | |
| * | Commencement of operations was September 25, 2013. |
Note 7. Borrowings
The Series, along with other affiliated registered investment companies (the “Funds”), is a party to a Syndicated Credit Agreement (“SCA”) with a group of banks. The purpose of the SCA is to provide an alternative source of temporary funding for capital share redemptions. The SCA provides for a commitment of $900 million for
| | | | |
| Prudential Jennison Global Infrastructure Fund | | | 33 | |
Notes to Financial Statements
continued
the period October 9, 2014 through October 8, 2015. The Funds pay an annualized commitment fee of .075% of the unused portion of the SCA. Prior to October 9, 2014, the Funds had another SCA that provided a commitment of $900 million and the Funds paid an annualized commitment fee of .08% of the unused portion of the SCA. Interest on any borrowings under the SCA is paid at contracted market rates. The commitment fee for the unused amount is accrued daily and paid quarterly.
The Series did not utilize the SCA during the year ended October 31, 2014.
Financial Highlights
| | | | | | | | | | |
| Class A Shares | |
| | | Year Ended
October 31,
2014(c) | | | | | September 25,
2013(b)
through
October 31,
2013(c) | |
| Per Share Operating Performance: | | | | | | | | | | |
| Net Asset Value, Beginning of Period | | | $10.42 | | | | | | $10.00 | |
| Income (loss) from investment operations: | | | | | | | | | | |
| Net investment income | | | .09 | | | | | | - | (g) |
| Net realized and unrealized gain on investments | | | 2.26 | | | | | | .42 | |
| Total from investment operations | | | 2.35 | | | | | | .42 | |
| Less Dividends and Distributions: | | | | | | | | | | |
| Dividends from net investment income | | | (.14 | ) | | | | | - | |
| Distributions from net realized gains | | | (.01 | ) | | | | | - | |
| Total dividends and distributions | | | (.15 | ) | | | | | - | |
| Net Asset Value, end of period | | | $12.62 | | | | | | $10.42 | |
| Total Return(a): | | | 22.67% | | | | | | 4.20% | |
| | | | | | | | | | |
| Ratios/Supplemental Data: | |
| Net assets, end of period (000) | | | $15,521 | | | | | | $21 | |
| Average net assets (000) | | | $4,906 | | | | | | $17 | |
| Ratios to average net assets(d): | | | | | | | | | | |
| Expenses After Waivers and/or Expense Reimbursement | | | 1.50% | | | | | | 1.50% | (e) |
| Expenses Before Waivers and/or Expense Reimbursement | | | 1.95% | | | | | | 25.87% | (e) |
| Net investment income | | | .73% | | | | | | .28% | (e) |
| Portfolio turnover rate | | | 49% | | | | | | 10% | (f) |
(a) Total return does not consider the effect of sales load. Total return is calculated assuming a purchase of a share on the first day and a sale on the last day of each period reported and includes reinvestment of dividends and distributions. Total returns may reflect adjustments to conform to generally accepted accounting principles. Total returns for periods less than one full year are not annualized.
(b) Commencement of operations.
(c) Calculated based on the average shares outstanding during the period.
(d) Does not include expenses of the underlying portfolio in which the Fund invests.
(e) Annualized.
(f) Not Annualized.
(g) Less than $.005.
See Notes to Financial Statements.
| | | | |
| Prudential Jennison Global Infrastructure Fund | | | 35 | |
Financial Highlights
continued
| | | | | | | | | | |
| Class C Shares | |
| | | Year Ended
October 31,
2014(c) | | | | | September 25,
2013(b)
through
October 31,
2013(c) | |
| Per Share Operating Performance: | | | | | | | | | | |
| Net Asset Value, Beginning of Period | | | $10.41 | | | | | | $10.00 | |
| Income (loss) from investment operations: | | | | | | | | | | |
| Net investment income | | | .01 | | | | | | .01 | |
| Net realized and unrealized gain on investments | | | 2.25 | | | | | | .40 | |
| Total from investment operations | | | 2.26 | | | | | | .41 | |
| Less Dividends and Distributions: | | | | | | | | | | |
| Dividends from net investment income | | | (.08 | ) | | | | | - | |
| Distributions from net realized gains | | | (.01 | ) | | | | | - | |
| Total dividends and distributions | | | (.09 | ) | | | | | - | |
| Net Asset Value, end of period | | | $12.58 | | | | | | $10.41 | |
| Total Return(a): | | | 21.76% | | | | | | 4.10% | |
| | | | | | | | | | |
| Ratios/Supplemental Data: | |
| Net assets, end of period (000) | | | $3,835 | | | | | | $40 | |
| Average net assets (000) | | | $1,104 | | | | | | $17 | |
| Ratios to average net assets(d): | | | | | | | | | | |
| Expenses After Waivers and/or Expense Reimbursement | | | 2.25% | | | | | | 2.25% | (e) |
| Expenses Before Waivers and/or Expense Reimbursement | | | 2.70% | | | | | | 38.05% | (e) |
| Net investment income | | | .12% | | | | | | .52% | (e) |
| Portfolio turnover rate | | | 49% | | | | | | 10% | (f) |
(a) Total return does not consider the effect of sales load. Total return is calculated assuming a purchase of a share on the first day and a sale on the last day of each period reported and includes reinvestment of dividends and distributions. Total returns may reflect adjustments to conform to generally accepted accounting principles. Total returns for periods less than one full year are not annualized.
(b) Commencement of operations.
(c) Calculated based on the average shares outstanding during the period.
(d) Does not include expenses of the underlying portfolio in which the Fund invests.
(e) Annualized.
(f) Not Annualized.
See Notes to Financial Statements.
| | | | | | | | | | |
| Class Z Shares | |
| | | Year Ended
October 31,
2014(c) | | | | | September 25,
2013(b)
through
October 31,
2013(c) | |
| Per Share Operating Performance: | | | | | | | | | | |
| Net Asset Value, Beginning of Period | | | $10.42 | | | | | | $10.00 | |
| Income (loss) from investment operations: | | | | | | | | | | |
| Net investment income | | | .22 | | | | | | .01 | |
| Net realized and unrealized gain on investments | | | 2.15 | | | | | | .41 | |
| Total from investment operations | | | 2.37 | | | | | | .42 | |
| Less Dividends and Distributions: | | | | | | | | | | |
| Dividends from net investment income | | | (.16 | ) | | | | | - | |
| Distributions from net realized gains | | | (.01 | ) | | | | | - | |
| Total dividends and distributions | | | (.17 | ) | | | | | - | |
| Net Asset Value, end of period | | | $12.62 | | | | | | $10.42 | |
| Total Return(a): | | | 22.91% | | | | | | 4.20% | |
| | | | | | | | | | |
| Ratios/Supplemental Data: | |
| Net assets, end of period (000) | | | $31,788 | | | | | | $5,247 | |
| Average net assets (000) | | | $20,117 | | | | | | $5,113 | |
| Ratios to average net assets(d): | | | | | | | | | | |
| Expenses After Waivers and/or Expense Reimbursement | | | 1.25% | | | | | | 1.25% | (e) |
| Expenses Before Waivers and/or Expense Reimbursement | | | 2.08% | | | | | | 22.65% | (e) |
| Net investment income | | | 1.79% | | | | | | .56% | (e) |
| Portfolio turnover rate | | | 49% | | | | | | 10% | (f) |
(a) Total return is calculated assuming a purchase of a share on the first day and a sale on the last day of each period reported and includes reinvestment of dividends and distributions. Total returns may reflect adjustments to conform to generally accepted accounting principles. Total returns for periods less than one full year are not annualized.
(b) Commencement of operations.
(c) Calculated based on the average shares outstanding during the period.
(d) Does not include expenses of the underlying portfolio in which the Fund invests.
(e) Annualized.
(f) Not Annualized.
See Notes to Financial Statements.
| | | | |
| Prudential Jennison Global Infrastructure Fund | | | 37 | |
Report of Independent Registered Public
Accounting Firm
The Board of Directors and Shareholders
Prudential World Fund, Inc.:
We have audited the accompanying statement of assets and liabilities of Prudential Jennison Global Infrastructure Fund, a series of Prudential World Fund, Inc., (hereafter referred to as the “Fund”), including the portfolio of investments, as of October 31, 2014, and the related statement of operations for the year then ended, and the statements of changes in net assets and financial highlights for the year then ended and for the period September 25, 2013 (commencement of operations) to October 31, 2013. These financial statements and financial highlights are the responsibility of the Fund’s management. Our responsibility is to express an opinion on these financial statements and financial highlights based on our audits.
We conducted our audits in accordance with the standards of the Public Company Accounting Oversight Board (United States). Those standards require that we plan and perform the audit to obtain reasonable assurance about whether the financial statements and financial highlights are free of material misstatement. An audit includes examining, on a test basis, evidence supporting the amounts and disclosures in the financial statements. Our procedures included confirmation of securities owned as of October 31, 2014, by correspondence with the custodian, transfer agent and brokers or by other appropriate auditing procedures when replies from brokers were not received. An audit also includes assessing the accounting principles used and significant estimates made by management, as well as evaluating the overall financial statement presentation. We believe that our audits provide a reasonable basis for our opinion.
In our opinion, the financial statements and financial highlights referred to above present fairly, in all material respects, the financial position of the Fund as of October 31, 2014, and the results of its operations, the changes in its net assets and the financial highlights for the periods described in the first paragraph above, in conformity with U.S. generally accepted accounting principles.

New York, New York
December 16, 2014
Tax Information
For the year ended October 31, 2014, the Series reports the maximum amount allowable under Section 854 of the Internal Revenue Code, but not less than, the following percentages of the ordinary income dividends paid as 1) qualified dividend income (QDI); and 2) eligible for corporate dividends received deduction (DRD):
| | | | | | | | |
| | | QDI | | | DRD | |
| | |
Prudential Jennison Global Infrastructure Fund | | | 96.94 | % | | | 58.42 | % |
In January 2015, you will be advised on IRS Form 1099-DIV or substitute 1099-DIV, as to the federal tax status of dividends and distributions received by you in calendar year 2014.
| | | | |
| Prudential Jennison Global Infrastructure Fund | | | 39 | |
INFORMATION ABOUT BOARD MEMBERS AND OFFICERS
(Unaudited)
Information about Board Members and Officers of the Fund is set forth below. Board Members who are not deemed to be “interested persons” of the Fund, as defined in the 1940 Act, are referred to as “Independent Board Members.” Board Members who are deemed to be “interested persons” of the Fund are referred to as “Interested Board Members.” The Board Members are responsible for the overall supervision of the operations of the Fund and perform the various duties imposed on the directors of investment companies by the 1940 Act. The Board in turn elects the Officers, who are responsible for administering the day-to-day operations of the Fund.
| | | | |
| Independent Board Members(1) |
| | | |
Name, Address, Age Position(s) Portfolios Overseen | | Principal Occupation(s) During Past Five Years | | Other Directorships Held |
Ellen S. Alberding (56) Board Member Portfolios Overseen: 69 | | President and Board Member, The Joyce Foundation (charitable foundation) (since 2002); Vice Chair, City Colleges of Chicago (community college system) (since 2011); Trustee, Skills for America’s Future (national initiative to connect employers to community colleges) (since 2011); Trustee, National Park Foundation (charitable foundation for national park system) (since 2009); Trustee, Economic Club of Chicago (since 2009). | | None. |
Kevin J. Bannon (62) Board Member Portfolios Overseen: 70 | | Managing Director (since April 2008) and Chief Investment Officer (October 2008-November 2013) of Highmount Capital LLC (registered investment adviser); formerly Executive Vice President and Chief Investment Officer (April 1993-August 2007) of Bank of New York Company; President (May 2003-May 2007) of BNY Hamilton Family of Mutual Funds. | | Director of Urstadt Biddle Properties (equity real estate investment trust) (since September 2008). |
Linda W. Bynoe (62) Board Member Portfolios Overseen: 70 | | President and Chief Executive Officer (since March 1995) and formerly Chief Operating Officer (December 1989-February 1995) of Telemat Ltd. (management consulting); formerly Vice President (January 1985-June 1989) at Morgan Stanley & Co (broker-dealer). | | Director of Simon Property Group, Inc. (retail real estate) (May 2003-May 2012); Director of Anixter International, Inc. (communication products distributor) (since January 2006); Director of Northern Trust Corporation (financial services) (since April 2006); Trustee of Equity Residential (residential real estate) (since December 2009). |
Prudential Jennison Global Infrastructure Fund
| | | | |
| Independent Board Members(1) |
| | | |
Name, Address, Age Position(s) Portfolios Overseen | | Principal Occupation(s) During Past Five Years | | Other Directorships Held |
Keith F. Hartstein (58) Board Member Portfolios Overseen: 70 | | Retired; Formerly President and Chief Executive Officer (2005-2012), Senior Vice President (2004-2005), Senior Vice President of Sales and Marketing (1997-2004), and various executive management positions (1990-1997), John Hancock Funds, LLC (asset management); Chairman, Investment Company Institute’s Sales Force Marketing Committee (2003-2008). | | None. |
Michael S. Hyland, CFA (69) Board Member Portfolios Overseen: 69 | | Retired (since February 2005); Formerly Senior Managing Director (July 2001-February 2005) of Bear Stearns & Co, Inc.; Global Partner, INVESCO (1999-2001); Managing Director and President of Salomon Brothers Asset Management (1989-1999). | | None. |
Douglas H. McCorkindale (75) Board Member Portfolios Overseen: 69 | | Retired; Formerly Chairman (February 2001-June 2006), Chief Executive Officer (June 2000-July 2005), President (September 1997-July 2005) and Vice Chairman (March 1984-May 2000) of Gannett Co. Inc. (publishing and media). | | Director of Lockheed Martin Corp. (aerospace and defense) (since May 2001). |
Stephen P. Munn (72) Board Member Portfolios Overseen: 70 | | Lead Director (since 2007) and formerly Chairman (1993-2007) of Carlisle Companies Incorporated (manufacturer of industrial products). | | Lead Director (since 2007) of Carlisle Companies Incorporated (manufacturer of industrial products). |
James E. Quinn (62) Board Member Portfolios Overseen: 69 | | Retired; Formerly President (2003-2012) and Director (2003-2008), and Vice Chairman and Director (1998-2003), Tiffany & Company (jewelry retailing); Director, Mutual of America Capital Management Corporation (asset management) (since 1996); Director, Hofstra University (since 2008); Vice Chairman, Museum of the City of New York (since 1994). | | Director of Deckers Outdoor Corporation (footwear manufacturer) (since 2011). |
Richard A. Redeker (71) Board Member & Independent Chair Portfolios Overseen: 70 | | Retired Mutual Fund Senior Executive (44 years); Management Consultant; Director, Mutual Fund Directors Forum (since 2014); Independent Directors Council (organization of 2,800 Independent Mutual Fund Directors)-Executive Committee, Chair of Policy Steering Committee, Governing Council. | | None. |
Visit our website at www.prudentialfunds.com
| | | | |
| Independent Board Members(1) |
| | | |
Name, Address, Age Position(s) Portfolios Overseen | | Principal Occupation(s) During Past Five Years | | Other Directorships Held |
Robin B. Smith (75) Board Member Portfolios Overseen:70 | | Chairman of the Board (since January 2003) of Publishers Clearing House (direct marketing); Member of the Board of Directors of ADLPartner (marketing) (since December 2010); formerly Chairman and Chief Executive Officer (August 1996-January 2003) of Publishers Clearing House. | | Formerly Director of BellSouth Corporation (telecommunications) (1992-2006). |
Stephen G. Stoneburn (71) Board Member Portfolios Overseen: 70 | | Chairman, (since July 2011), President and Chief Executive Officer (since June 1996) of Quadrant Media Corp. (publishing company); formerly President (June 1995-June 1996) of Argus Integrated Media, Inc.; Senior Vice President and Managing Director (January 1993-1995) of Cowles Business Media; Senior Vice President of Fairchild Publications, Inc. (1975-1989). | | None. |
| | | | |
| Interested Board Members(1) |
| | | |
Name, Address, Age Position(s) Portfolios Overseen | | Principal Occupation(s) During Past Five Years | | Other Directorships Held |
Stuart S. Parker (52) Board Member & President Portfolios Overseen: 64 | | President of Prudential Investments LLC (since January 2012); Executive Vice President of Prudential Investment Management Services LLC (since December 2012); Executive Vice President of Jennison Associates LLC and Head of Retail Distribution of Prudential Investments LLC (June 2005-December 2011). | | None. |
Scott E. Benjamin (41) Board Member & Vice President Portfolios Overseen: 70 | | Executive Vice President (since June 2009) of Prudential Investments LLC; Executive Vice President (June 2009-June 2012) and Vice President (since June 2012) of Prudential Investment Management Services LLC; Executive Vice President (since September 2009) of AST Investment Services, Inc.; Senior Vice President of Product Development and Marketing, Prudential Investments (since February 2006); Vice President of Product Development and Product Management, Prudential Investments (2003-2006). | | None. |
Prudential Jennison Global Infrastructure Fund
| | | | |
| Interested Board Members(1) |
| | | |
Name, Address, Age Position(s) Portfolios Overseen | | Principal Occupation(s) During Past Five Years | | Other Directorships Held |
Grace C. Torres* (55) Board Member Portfolios Overseen: 65 | | Retired; Formerly Treasurer and Principal Financial and Accounting Officer of the Prudential Investments Funds, Target Funds, Advanced Series Trust, Prudential Variable Contract Accounts and The Prudential Series Fund (1998-June 2014); Assistant Treasurer (March 1999-June 2014) and Senior Vice President (September 1999-June 2014) of Prudential Investments LLC; Assistant Treasurer (May 2003-June 2014) and Vice President (June 2005-June 2014) of AST Investment Services, Inc.; Senior Vice President and Assistant Treasurer (May 2003-June 2014) of Prudential Annuities Advisory Services, Inc. | | None. |
* Note: Prior to her retirement in 2014, Ms. Torres was employed by Prudential Investments LLC. Due to her prior employment, she is considered to be an “interested person” under the 1940 Act. Ms. Torres is a non-management Interested Board Member.
(1) The year that each Board Member joined the Funds’ Board is as follows:
Ellen S. Alberding; 2013; Kevin J. Bannon, 2008; Linda W. Bynoe, 2005; Keith F. Hartstein, 2013; Michael S. Hyland, 2008; Douglas H. McCorkindale, 2003; Stephen P. Munn, 2008; James E. Quinn, 2013; Richard A. Redeker, 2003; Robin B. Smith, 1996; Stephen G. Stoneburn, 1996; Stuart S. Parker, Board Member and President since 2012; Scott E. Benjamin, Board Member since 2010 and Vice President since 2009; Grace C. Torres, 2014.
| | | | |
| Fund Officers(a) |
| | | |
Name, Address and Age Position with Fund | | Principal Occupation(s) During Past Five Years | | Length of Service as Fund Officer |
Raymond A. O’Hara (59) Chief Legal Officer | | Vice President and Corporate Counsel (since July 2010) of Prudential Insurance Company of America (Prudential); Vice President (March 2011-Present) of Pruco Life Insurance Company and Pruco Life Insurance Company of New Jersey; Vice President and Corporate Counsel (March 2011-Present) of Prudential Annuities Life Assurance Corporation; Chief Legal Officer of Prudential Investments LLC (since June 2012); Chief Legal Officer of Prudential Mutual Fund Services LLC (since June 2012) and Corporate Counsel of AST Investment Services, Inc. (since June 2012); formerly Assistant Vice President and Corporate Counsel (September 2008-July 2010) of The Hartford Financial Services Group, Inc.; formerly Associate (September 1980-December 1987) and Partner (January 1988–August 2008) of Blazzard & Hasenauer, P.C. (formerly, Blazzard, Grodd & Hasenauer, P.C.). | | Since 2012 |
Visit our website at www.prudentialfunds.com
| | | | |
| Fund Officers(a) |
| | | |
Name, Address and Age Position with Fund | | Principal Occupation(s) During Past Five Years | | Length of Service as Fund Officer |
Chad A. Earnst (39) Chief Compliance Officer | | Chief Compliance Officer (September 2014-Present) of Prudential Investments LLC; Chief Compliance Officer (September 2014-Present) of the Prudential Investments Funds, Target Funds, Advanced Series Trust, The Prudential Series Fund, Prudential’s Gibraltar Fund, Inc., Prudential Global Short Duration High Yield Income Fund, Inc., Prudential Short Duration High Yield Fund, Inc. and Prudential Jennison MLP Income Fund, Inc.; formerly Assistant Director (March 2010-August 2014) of the Asset Management Unit, Division of Enforcement, US Securities & Exchange Commission; Assistant Regional Director (January 2010-August 2014), Branch Chief (June 2006–December 2009) and Senior Counsel (April 2003-May 2006) of the Miami Regional Office, Division of Enforcement, US Securities & Exchange Commission. | | Since 2014 |
Deborah A. Docs (56) Secretary | | Vice President and Corporate Counsel (since January 2001) of Prudential; Vice President (since December 1996) and Assistant Secretary (since March 1999) of Prudential Investments LLC; formerly Vice President and Assistant Secretary (May 2003-June 2005) of AST Investment Services, Inc. | | Since 2004 |
Jonathan D. Shain (56) Assistant Secretary | | Vice President and Corporate Counsel (since August 1998) of Prudential; Vice President and Assistant Secretary (since May 2001) of Prudential Investments LLC; Vice President and Assistant Secretary (since February 2001) of Prudential Mutual Fund Services LLC; formerly Vice President and Assistant Secretary (May 2003-June 2005) of AST Investment Services, Inc. | | Since 2005 |
Claudia DiGiacomo (40) Assistant Secretary | | Vice President and Corporate Counsel (since January 2005) of Prudential; Vice President and Assistant Secretary of Prudential Investments LLC (since December 2005); Associate at Sidley Austin Brown & Wood LLP (1999-2004). | | Since 2005 |
Andrew R. French (52) Assistant Secretary | | Vice President and Corporate Counsel (since February 2010) of Prudential; formerly Director and Corporate Counsel (2006-2010) of Prudential; Vice President and Assistant Secretary (since January 2007) of Prudential Investments LLC; Vice President and Assistant Secretary (since January 2007) of Prudential Mutual Fund Services LLC. | | Since 2006 |
Amanda S. Ryan (36) Assistant Secretary | | Director and Corporate Counsel (since March 2012) of Prudential; Director and Assistant Secretary (since June 2012) of Prudential Investments LLC; Associate at Ropes & Gray LLP (2008-2012). | | Since 2012 |
Theresa C. Thompson (52) Deputy Chief Compliance Officer | | Vice President, Compliance, Prudential Investments LLC (since April 2004); and Director, Compliance, Prudential Investments LLC (2001-2004). | | Since 2008 |
Prudential Jennison Global Infrastructure Fund
| | | | |
| Fund Officers(a) |
| | | |
Name, Address and Age Position with Fund | | Principal Occupation(s) During Past Five Years | | Length of Service as Fund Officer |
Richard W. Kinville (46) Anti-Money Laundering Compliance Officer | | Vice President, Corporate Compliance, Anti-Money Laundering Unit (since January 2005) of Prudential; committee member of the American Council of Life Insurers Anti-Money Laundering and Critical Infrastructure Committee (since January 2007); formerly Investigator and Supervisor in the Special Investigations Unit for the New York Central Mutual Fire Insurance Company (August 1994-January 1999); Investigator in AXA Financial’s Internal Audit Department and Manager in AXA’s Anti-Money Laundering Office (January 1999-January 2005); first chair of the American Council of Life Insurers Anti-Money Laundering and Critical Infrastructure Committee (June 2007-December 2009). | | Since 2011 |
M. Sadiq Peshimam (50) Treasurer and Principal Financial and Accounting Officer | | Assistant Treasurer of funds in the Prudential Mutual Fund Complex (2006-2014); Vice President (since 2005) of Prudential Investments LLC. | | Since 2006 |
Peter Parrella (56) Assistant Treasurer | | Vice President (since 2007) and Director (2004-2007) within Prudential Mutual Fund Administration; formerly Tax Manager at SSB Citi Fund Management LLC (1997-2004). | | Since 2007 |
Lana Lomuti (47) Assistant Treasurer | | Vice President (since 2007) and Director (2005-2007), within Prudential Mutual Fund Administration; formerly Assistant Treasurer (December 2007-February 2014) of The Greater China Fund, Inc. | | Since 2014 |
Linda McMullin (53) Assistant Treasurer | | Vice President (since 2011) and Director (2008-2011) within Prudential Mutual Fund Administration. | | Since 2014 |
| (a) | Excludes Mr. Parker and Mr. Benjamin, interested Board Members who also serve as President and Vice President, respectively. |
Explanatory Notes to Tables:
| n | Board Members are deemed to be “Interested,” as defined in the 1940 Act, by reason of their affiliation with Prudential Investments LLC and/or an affiliate of Prudential Investments LLC. |
| n | Unless otherwise noted, the address of all Board Members and Officers is c/o Prudential Investments LLC, Gateway Center Three, 100 Mulberry Street, Newark, New Jersey 07102-4077. |
| n | There is no set term of office for Board Members or Officers. The Board Members have adopted a retirement policy, which calls for the retirement of Board Members on December 31 of the year in which they reach the age of 75. |
| n | “Other Directorships Held” includes only directorships of companies required to register or file reports with the SEC under the 1934 Act (that is, “public companies”) or other investment companies registered under the 1940 Act. |
| n | “Portfolios Overseen” includes all investment companies managed by Prudential Investments LLC. The investment companies for which Prudential Investments LLC serves as manager include the Prudential Investments Mutual Funds, The Prudential Variable Contract Accounts, Target Mutual Funds, Prudential Short Duration High Yield Fund, Inc., Prudential Global Short Duration High Yield Fund, Inc., The Prudential Series Fund, Prudential’s Gibraltar Fund, Inc. and the Advanced Series Trust. |
Visit our website at www.prudentialfunds.com
Approval of Advisory Agreements
Initial Approval of the Fund’s Advisory Agreements
As required by the Investment Company Act of 1940 (the “1940 Act”), the Board of Directors of Prudential World Fund, Inc. (the Board) considered the proposed management agreement with Prudential Investments LLC (the “Manager”) and the proposed subadvisory agreement with Jennison Associates LLC (the “Subadviser”), with respect to Prudential Jennison Global Infrastructure Fund (the Fund) prior to the Fund’s commencement of operations. The Board, including all of the Independent Directors, met telephonically on June 21, 2013 and in person on September 17-19, 2013 and approved the agreements at the September meeting for an initial two year period, after concluding that approval of the agreements was in the best interests of the Fund.
In advance of the meetings, the Board requested and received materials relating to the agreements, and had the opportunity to ask questions and request further information in connection with its consideration.
In approving the agreements, the Board, including the Independent Directors advised by independent legal counsel, considered the factors it deemed relevant, including the nature, quality and extent of services to be provided to the Fund by the Manager and the Subadviser; any relevant comparable performance and the Subadviser’s qualifications and track record in serving other affiliated mutual funds; the fees proposed to be paid by the Fund to the Manager and by the Manager to the Subadviser under the agreements; and the potential for economies of scale that may be shared with the Fund and its shareholders. In connection with its deliberations, the Board considered information provided by the Manager and the Subadviser at or in advance of the meetings on June 21, 2013 and September 17-19, 2013. The Board also considered information provided by the Manager with respect to other funds managed by the Manager and the Subadviser, which information had been provided throughout the year at regular Board meetings. In their deliberations, the Directors did not identify any single factor which alone was responsible for the Board’s decision to approve the agreements with respect to the Fund.1
The Directors determined that the overall arrangements between the Fund and the Manager, which will serve as the Fund’s investment manager pursuant to a management agreement, and between the Manager and the Subadviser, which will serve as the Fund’s Subadviser pursuant to the terms of a subadvisory agreement, are appropriate in light of the services to be performed and the fees to be charged under the agreements and such other matters as the Directors considered relevant in the exercise of their business judgment.
| 1 | Grace C. Torres was elected to the Board as of December 2014, and therefore did not participate in the consideration of these reports. |
Prudential Jennison Global Infrastructure Fund
Approval of Advisory Agreements (continued)
The material factors and conclusions that formed the basis for the Directors’ reaching their determinations to approve the agreements are separately discussed below.
Nature, quality and extent of services
With respect to the Manager, the Board noted that it had received and considered information about the Manager at the June 4-6, 2013 meetings in connection with the renewal of the management agreements between the Manager and the other Prudential Retail Funds, as well as at other regular meetings throughout the year, regarding the nature, quality and extent of services provided by the Manager. The Board considered the services to be provided by the Manager, including but not limited to the oversight of the Subadviser, as well as the provision of fund recordkeeping, compliance and other services to the Fund. With respect to the Manager’s oversight of the Subadviser, the Board noted that the Manager’s Strategic Investment Research Group, which is a business unit of the Manager, is responsible for monitoring and reporting to the Manager’s senior management on the performance and operations of the Subadviser. The Board also noted that the Manager pays the salaries of all the officers and non-independent Directors of the Fund. The Board reviewed the qualifications, backgrounds and responsibilities of the Manager’s senior management responsible for the oversight of the Fund and the Subadviser, and was also provided with information pertaining to the Manager’s organizational structure, senior management, investment operations and other relevant information. The Board further noted that it received favorable compliance reports from the Fund’s Chief Compliance Officer as to the Manager. The Board noted that it had concluded that it was satisfied with the nature, quality and extent of the services provided by the Manager to the other Prudential Retail Funds and determined that it was reasonable to conclude that the nature, quality and extent of services to be provided by the Manager under the management agreement for the Fund would be similar in nature to those provided under the other management agreements.
With respect to the Subadviser, the Board noted that it had received and considered information about the Subadviser at the June 4-6, 2013 meetings in connection with the renewal of the subadvisory agreements between the Manager and the Subadviser with respect to other Prudential Retail Funds, as well as at other regular meetings throughout the year, regarding the nature, quality and extent of services provided by the Subadviser. The Board considered, among other things, the qualifications, background and experience of the Subadviser’s portfolio managers who will be responsible for the day-to-day management of the Fund’s portfolio, as well as information on the Subadviser’s organizational structure, senior management, investment operations and other relevant information. The Board further noted that it received favorable compliance reports from the Fund’s Chief Compliance Officer as
Visit our website at www.prudentialfunds.com
to the Subadviser. The Board noted that it was satisfied with the nature, quality and extent of services provided by the Subadviser with respect to the other Prudential Retail Funds served by the Subadviser and determined that it was reasonable to conclude that the nature, quality and extent of services to be provided by the Subadviser under the subadvisory agreement for the Fund would be similar in nature to those provided under the other subadvisory agreements. The Board noted that the Subadviser is affiliated with the Manager.
Performance
Because the Fund had not yet commenced operations and the actual asset base of the Fund has not yet been determined, no investment performance for the Fund existed for Board review. Nevertheless, as noted above, the Board did consider the background and professional experience of the proposed portfolio management team for the Fund. The Manager will provide information relating to performance to the Board periodically and in connection with future annual reviews of the management agreement and subadvisory agreement.
Fee Rates
The Board considered the proposed management fees of 1.00% of the Fund’s average daily net assets to be paid by the Fund to the Manager and the proposed subadvisory fees of 0.60% of the average daily value of the Fund’s investable assets up to $100 million and 0.55% of the average daily value of the Fund’s investable assets over $100 million to be paid by the Manager to the subadviser.
The Board considered information provided by the Manager comparing the Fund’s proposed management fee rate and total expenses for Class A shares to the Lipper 15(c) Peer Group. The Board noted that the Fund’s gross management fee was in the third quartile of the Lipper Peer Group (first quartile being the lowest fee). The Board further noted that the anticipated net total expenses for Class A shares, after waivers and reimbursements, were in the third quartile of the Lipper Peer Group (first quartile being the lowest expenses).
The Board noted that the Fund’s contractual management fee of 1.00% was 5 basis points from the Peer Group median and that the Fund’s actual management fee would be 18 basis points, due to waivers and reimbursements to support the net total expense limitation, given that the Fund’s initial assets will be low. The Board concluded that the proposed management fee and total expenses were reasonable in light of the services to be provided.
Prudential Jennison Global Infrastructure Fund
Approval of Advisory Agreements (continued)
Profitability
Because the Fund had not yet commenced operations and the actual asset base of the Funds has not yet been determined, the Board noted that there was no historical profitability information with respect to the Fund to be reviewed. The Board noted that it would review profitability information in connection with the annual renewal of the advisory and subadvisory agreements.
Economies of Scale
Because the Fund had not yet commenced operations and the actual asset base of the Fund has not yet been determined, the Board noted that there was no historical information regarding economies of scale with respect to the Fund to be reviewed. The Board noted that it would review such information in connection with the annual renewal of the advisory and subadvisory agreements.
Other Benefits to the Manager and the Subadviser
The Board considered potential “fall-out” or ancillary benefits anticipated to be received by the Manager and the Subadviser. The Board concluded that any potential benefits to be derived by the Manager were similar to benefits derived by the Manager in connection with its management of the other Prudential Retail Funds, which are reviewed on an annual basis. The Board also concluded that any potential benefits to be derived by the Subadviser were consistent with those generally derived by subadvisers to the Prudential Retail Funds, and that those benefits are reviewed on an annual basis. The Board concluded that any potential benefits derived by the Manager and the Subadviser were consistent with the types of benefits generally derived by investment managers and subadvisers to mutual funds.
* * *
After full consideration of these factors, the Board concluded that the approval of the agreements was in the interests of the Fund.
Visit our website at www.prudentialfunds.com
| | | | |
| n MAIL | | n TELEPHONE | | n WEBSITE |
Gateway Center Three 100 Mulberry Street Newark, NJ 07102 | | (800) 225-1852 | | www.prudentialfunds.com |
|
| PROXY VOTING |
| The Board of Directors of the Fund has delegated to the Fund’s investment subadviser the responsibility for voting any proxies and maintaining proxy recordkeeping with respect to the Fund. A description of these proxy voting policies and procedures is available without charge, upon request, by calling (800) 225-1852 or by visiting the Securities and Exchange Commission’s website at www.sec.gov. Information regarding how the Fund voted proxies relating to portfolio securities during the most recent 12-month period ended June 30 is available on the Fund’s website and on the Securities and Exchange Commission’s website. |
|
| DIRECTORS |
| Ellen S. Alberding • Kevin J. Bannon • Scott E. Benjamin • Linda W. Bynoe • Keith F. Hartstein • Michael S. Hyland • Douglas H. McCorkindale • Stephen P. Munn • Stuart S. Parker • James E. Quinn • Richard A. Redeker • Robin B. Smith • Stephen G. Stoneburn • Grace C. Torres |
|
| OFFICERS |
| Stuart S. Parker, President • Scott E. Benjamin, Vice President • M. Sadiq Peshimam, Treasurer and Principal Financial and Accounting Officer • Raymond A. O’Hara, Chief Legal Officer • Deborah A. Docs, Secretary • Chad A. Earnst, Chief Compliance Officer • Theresa C. Thompson, Deputy Chief Compliance Officer • Richard W. Kinville, Anti-Money Laundering Compliance Officer • Jonathan D. Shain, Assistant Secretary • Claudia DiGiacomo, Assistant Secretary • Amanda S. Ryan, Assistant Secretary • Andrew R. French, Assistant Secretary • Peter Parrella, Assistant Treasurer • Lana Lomuti, Assistant Treasurer • Linda McMullin, Assistant Treasurer |
| | | | |
| MANAGER | | Prudential Investments LLC | | Gateway Center Three
100 Mulberry Street
Newark, NJ 07102 |
|
| INVESTMENT SUBADVISER | | Jennison Associates LLC | | 466 Lexington Avenue
New York, NY 10017 |
|
| DISTRIBUTOR | | Prudential Investment
Management Services LLC | | Gateway Center Three
100 Mulberry Street
Newark, NJ 07102 |
|
| CUSTODIAN | | The Bank of New York Mellon | | One Wall Street
New York, NY 10286 |
|
| TRANSFER AGENT | | Prudential Mutual Fund
Services LLC | | PO Box 9658
Providence, RI 02940 |
|
| INDEPENDENT REGISTERED PUBLIC ACCOUNTING FIRM | | KPMG LLP | | 345 Park Avenue
New York, NY 10154 |
|
| FUND COUNSEL | | Willkie Farr & Gallagher LLP | | 787 Seventh Avenue
New York, NY 10019 |
|
| An investor should consider the investment objectives, risks, charges, and expenses of the Fund carefully before investing. The prospectus and summary prospectus contain this and other information about the Fund. An investor may obtain a prospectus and summary prospectus by visiting our website at www.prudentialfunds.com or by calling (800) 225-1852. The prospectus and summary prospectus should be read carefully before investing. |
|
| E-DELIVERY |
| To receive your mutual fund documents online, go to www.prudentialfunds.com/edelivery and enroll. Instead of receiving printed documents by mail, you will receive notification via email when new materials are available. You can cancel your enrollment or change your email address at any time by visiting the website address above. |
|
| SHAREHOLDER COMMUNICATIONS WITH DIRECTORS |
| Shareholders can communicate directly with the Board of Directors by writing to the Chair of the Board, Prudential Jennison Global Infrastructure Fund, Prudential Investments, Attn: Board of Directors, 100 Mulberry Street, Gateway Center Three, Newark, NJ 07102. Shareholders can communicate directly with an individual Director by writing to the same address. Communications are not screened before being delivered to the addressee. |
|
| AVAILABILITY OF PORTFOLIO SCHEDULE |
| The Fund files its complete schedule of portfolio holdings with the Securities and Exchange Commission for the first and third quarters of each fiscal year on Form N-Q. The Fund’s Forms N-Q are available on the Commission’s website at www.sec.gov. The Fund’s Forms N-Q may also be reviewed and copied at the Commission’s Public Reference Room in Washington, D.C. Information on the operation and location of the Public Reference Room may be obtained by calling (202) 551-8090. The Fund’s schedule of portfolio holdings is also available on the Fund’s website as of the end of each month. |
|
| The Fund’s Statement of Additional Information contains additional information about the Fund’s Directors and is available without charge, upon request, by calling (800) 225-1852. |
Mutual Funds:
| | | | |
| ARE NOT INSURED BY THE FDIC OR ANY FEDERAL GOVERNMENT AGENCY | | MAY LOSE VALUE | | ARE NOT A DEPOSIT OF OR GUARANTEED BY ANY BANK OR ANY BANK AFFILIATE |

PRUDENTIAL JENNISON GLOBAL INFRASTRUCTURE FUND
| | | | | | |
| SHARE CLASS | | A | | C | | Z |
| NASDAQ | | PGJAX | | PGJCX | | PGJZX |
| CUSIP | | 743969792 | | 743969784 | | 743969776 |
MF217E 0270922-00001-00

PRUDENTIAL INVESTMENTS»MUTUAL FUNDS
PRUDENTIAL JENNISON
EMERGING MARKETS EQUITY FUND
ANNUAL REPORT · OCTOBER 31, 2014
Fund Type
International Stock
Objective
Long-term growth of capital
This report is not authorized for distribution to prospective investors unless preceded or accompanied by a current prospectus.
The views expressed in this report and information about the Fund’s portfolio holdings are for the period covered by this report and are subject to change thereafter.
Mutual funds are distributed by Prudential Investment Management Services LLC (PIMS). Jennison Associates is a registered investment advisor. Both are Prudential Financial companies. ©2014 Prudential Financial, Inc. and its related entities. Prudential Investments LLC, Prudential, Jennison Associates, Jennison, the Prudential logo, Bring Your Challenges, and the Rock symbol are service marks of Prudential Financial, Inc. and its related entities, registered in many jurisdictions worldwide.

December 15, 2014
Dear Shareholder:
We hope you find the annual report for the Prudential Jennison Emerging Markets Equity Fund informative and useful. The report covers performance since its inception on September 16, 2014, through October 31, 2014.
Since market conditions change over time, we believe it is important to maintain a diversified portfolio of funds consistent with your tolerance for risk, time horizon, and financial goals.
Your financial advisor can help you create a diversified investment plan that may include funds covering all the basic asset classes and that reflects your personal investor profile and risk tolerance. Keep in mind, however, that diversification and asset allocation strategies do not assure a profit or protect against loss in declining markets.
Prudential Investments® is dedicated to helping you solve your toughest investment challenges—whether it’s capital growth, reliable income, or protection from market volatility and other risks. We offer the expertise of Prudential Financial’s affiliated asset managers* that strive to be leaders in a broad range of funds to help you stay on course to the future you envision. They also manage money for major corporations and pension funds around the world, which means you benefit from the same expertise, innovation, and attention to risk demanded by today’s most sophisticated investors.
Thank you for choosing the Prudential Investments family of funds.
Sincerely,

Stuart S. Parker, President
Prudential Jennison Emerging Markets Equity Fund
*Most of Prudential Investments’ equity funds are advised by Jennison Associates LLC, Quantitative Management Associates LLC (QMA), or Prudential Real Estate Investors. Prudential Investments’ fixed income and money market funds are advised by Prudential Investment Management, Inc. (PIM) through its Prudential Fixed Income unit. Jennison Associates LLC, QMA, and PIM are registered investment advisers and Prudential Financial companies. Prudential Real Estate Investors is a unit of PIM.
| | | | |
| Prudential Jennison Emerging Markets Equity Fund | | | 1 | |
Your Fund’s Performance (Unaudited)
Performance data quoted represent past performance. Past performance does not guarantee future results. The investment return and principal value of an investment will fluctuate, so that an investor’s shares, when redeemed, may be worth more or less than their original cost. Current performance may be lower or higher than the past performance data quoted. An investor may obtain performance data as of the most recent month-end by visiting our website at www.prudentialfunds.com or by calling (800) 225-1852.
| | | | |
Cumulative Total Returns (Without Sales Charges) as of��10/31/14 |
| | | | | Since Inception |
Class A | | | | 0.90% (9/16/14) |
Class C | | | | 0.80 (9/16/14) |
Class Q | | | | 0.90 (9/16/14) |
Class Z | | | | 0.90 (9/16/14) |
MSCI Emerging Markets Index | | | | 1.18 |
Lipper Emerging Markets Funds Average | | | | 0.75 |
| | | | |
Average Annual Total Returns (With Sales Charges) as of 9/30/14 |
| | | | | Since Inception |
Class A | | | | N/A (9/16/14) |
Class C | | | | N/A (9/16/14) |
Class Q | | | | N/A (9/16/14) |
Class Z | | | | N/A (9/16/14) |
MSCI Emerging Markets Index | | | | N/A |
Lipper Emerging Markets Funds Average | | | | N/A |
| | | | |
Average Annual Total Returns (With Sales Charges) as of 10/31/14 |
| | | | | Since Inception |
Class A | | | | N/A (9/16/14) |
Class C | | | | N/A (9/16/14) |
Class Q | | | | N/A (9/16/14) |
Class Z | | | | N/A (9/16/14) |
| | | | |
Average Annual Total Returns (Without Sales Charges) as of 10/31/14 |
| | | | | Since Inception |
Class A | | | | N/A (9/16/14) |
Class C | | | | N/A (9/16/14) |
Class Q | | | | N/A (9/16/14) |
Class Z | | | | N/A (9/16/14) |
Source: Prudential Investments LLC and Lipper Inc.
Inception returns are provided for any share class with less than 10 calendar years of returns.
| | |
| 2 | | Visit our website at www.prudentialfunds.com |
Growth of a $10,000 Investment
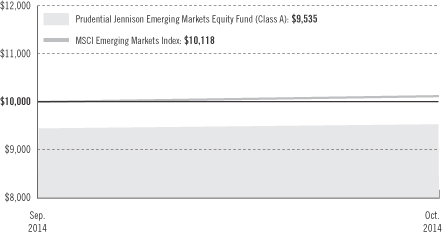
The graph compares a $10,000 investment in the Prudential Jennison Emerging Markets Equity Fund (Class A shares) with a similar investment in the MSCI Emerging Markets Index, by portraying the initial account values at the commencement of operations for Class A shares (September 16, 2014) and the account values at the end of the current fiscal year (October 31, 2014) as measured on a quarterly basis. For purposes of the graph, and unless otherwise indicated, it has been assumed that (a) the maximum applicable front-end sales charge was deducted from the initial $10,000 investment in Class A shares; (b) all recurring fees (including management fees) were deducted; and (c) all dividends and distributions were reinvested. The line graph provides information for Class A shares only. As indicated in the tables provided earlier, performance for Class C, Class Q, and Class Z shares will vary due to the differing charges and expenses applicable to each share class (as explained in the following paragraphs). Without waiver of fees and/or expense reimbursements, if any, the returns would have been lower.
Past performance does not predict future performance. Total returns and the ending account values in the graph include changes in share price and reinvestment of dividends and capital gains distributions in a hypothetical investment for the periods shown. The Fund’s total returns do not reflect the deduction of income taxes on an individual’s investment. Taxes may reduce your actual investment returns on income or gains paid by the Fund or any gains you may realize if you sell your shares.
| | | | |
| Prudential Jennison Emerging Markets Equity Fund | | | 3 | |
Your Fund’s Performance (continued)
The returns in the tables do not reflect the deduction of taxes that a shareholder would pay on Fund distributions or following the redemption of Fund shares. The average annual total returns take into account applicable sales charges, which are described for each share class in the table below.
| | | | | | | | |
| | Class A | | Class C | | Class Q | | Class Z |
Maximum initial sales charge | | 5.50% of
the public
offering
price | | None | | None | | None |
Contingent deferred sales charge (CDSC) (as a percentage of the lower of original purchase price or net asset value at redemption) | | 1% on sales
of $1 million
or more
made within
12 months of
purchase | | 1% on sales
made within
12 months
of purchase | | None | | None |
Annual distribution and service (12b-1) fees (shown as a percentage of average daily net assets) | | .30% (.25%
currently) | | 1% | | None | | None |
Benchmark Definitions
MSCI Emerging Markets Index
The MSCI Emerging Markets Index is an unmanaged free float-adjusted market capitalization index that is designed to measure equity market performance of emerging markets. The MSCI Emerging Markets Index consists of the following 23 emerging market country indexes: Brazil, Chile, China, Colombia, Czech Republic, Egypt, Greece, Hungary, India, Indonesia, Korea, Malaysia, Mexico, Peru, Philippines, Poland, Qatar, Russia, South Africa, Taiwan, Thailand, Turkey, and United Arab Emirates.
Lipper Emerging Markets Funds Average
The Lipper Emerging Markets Funds Average are funds that seek long-term capital appreciation by investing at least 65% of total assets in emerging market equity securities, where “emerging market” is defined by a country’s GNP per capita or other economic measures.
Investors cannot invest directly in an index or average. The returns for the Index would be lower if they included the effects of sales charges, operating expenses of a mutual fund, or taxes. Returns for the Lipper Average reflect the deduction of operating expenses, but not sales charges or taxes. The Since Inception returns for the Index and Lipper Average are measured from the closest month-end to inception date, and not from the Fund’s actual inception date.
| | | | |
Five Largest Holdings expressed as a percentage of net assets as of 10/31/14 | | | | |
Vipshop Holdings Ltd., Internet & Catalog Retail | | | 4.0 | % |
Baidu, Inc., Internet Software & Services | | | 3.9 | |
Tencent Holdings Ltd., Internet Software & Services | | | 3.5 | |
Alibaba Group Holding Ltd., Internet Software & Services | | | 3.4 | |
Universal Robina Corp., Food Products | | | 3.1 | |
Holdings reflect only long-term investments and are subject to change.
| | |
| 4 | | Visit our website at www.prudentialfunds.com |
| | | | |
Five Largest Industries expressed as a percentage of net assets as of 10/31/14 | | | | |
Internet Software & Services | | | 17.5 | % |
Banks | | | 9.6 | |
Internet & Catalog Retail | | | 6.4 | |
Hotels, Restaurants & Leisure | | | 6.1 | |
Pharmaceuticals | | | 5.6 | |
Industry weightings reflect only long-term investments and are subject to change.
| | | | |
| Prudential Jennison Emerging Markets Equity Fund | | | 5 | |
Fees and Expenses (Unaudited)
As a shareholder of the Fund, you incur two types of costs: (1) transaction costs, including sales charges (loads) on purchase payments and redemptions, as applicable, and (2) ongoing costs, including management fees, distribution, and/or service (12b-1) fees, and other Fund expenses, as applicable. This example is intended to help you understand your ongoing costs (in dollars) of investing in the Fund and to compare these costs with the ongoing costs of investing in other mutual funds.
The example is based on an investment of $1,000 invested on September 16, 2014, at the Fund’s commencement of operations, and held through the initial fiscal period ended October 31, 2014. The example is for illustrative purposes only; you should consult the Prospectus for information on initial and subsequent minimum investment requirements.
Actual Expenses
The first line for each share class in the table on the following page provides information about actual account values and actual expenses. You may use the information on this line, together with the amount you invested, to estimate the expenses that you paid over the period. Simply divide your account value by $1,000 (for example, an $8,600 account value ÷ $1,000 = 8.6), then multiply the result by the number on the first line under the heading “Expenses Paid During the Six-Month Period” to estimate the expenses you paid on your account during this period.
Hypothetical Example for Comparison Purposes
The second line for each share class in the table on the following page provides information about hypothetical account values and hypothetical expenses based on the Fund’s actual expense ratio and an assumed rate of return of 5% per year before expenses, which is not the Fund’s actual return. The hypothetical account values and expenses may not be used to estimate the actual ending account balance or expenses you paid for the period. You may use this information to compare the ongoing costs of investing in the Fund and other funds. To do so, compare this 5% hypothetical example with the 5% hypothetical examples that appear in the shareholder reports of the other funds.
The Fund’s transfer agent may charge additional fees to holders of certain accounts that are not included in the expenses shown in the table on the following page. These fees apply to individual retirement accounts (IRAs) and Section 403(b) accounts. As of the close of the period covered by the table, IRA fees included an annual maintenance fee of $15 per account (subject to a maximum annual maintenance fee of $25 for all accounts held by the same shareholder). Section 403(b) accounts are charged an annual $25 fiduciary maintenance fee. Some of the fees may vary in amount, or may be waived, based on your total account balance or the number of
| | |
| 6 | | Visit our website at www.prudentialfunds.com |
Prudential Investments funds, including the Fund, that you own. You should consider the additional fees that were charged to your Fund account over the six-month period when you estimate the total ongoing expenses paid over the period and the impact of these fees on your ending account value, as these additional expenses are not reflected in the information provided in the expense table. Additional fees have the effect of reducing investment returns.
Please note that the expenses shown in the table are meant to highlight your ongoing costs only and do not reflect any transactional costs such as sales charges (loads). Therefore, the second line for each share class in the table is useful in comparing ongoing costs only and will not help you determine the relative total costs of owning different funds. In addition, if these transactional costs were included, your costs would have been higher.
| | | | | | | | | | | | | | | | | | |
Prudential
Jennison Emerging
Markets Equity Fund | | Beginning Account
Value
September 16, 2014 | | | Ending Account
Value
October 31, 2014 | | | Annualized
Expense Ratio
Based on the
Six-Month Period | | | Expenses Paid
During the
Six-Month Period* | |
| | | | | | | | | | | | | | | | | | |
| Class A | | Actual** | | $ | 1,000.00 | | | $ | 1,009.00 | | | | 1.55 | % | | $ | 1.96 | |
| | | Hypothetical | | $ | 1,000.00 | | | $ | 1,017.39 | | | | 1.55 | % | | $ | 7.88 | |
| | | | | | | | | | | | | | | | | | |
| Class C | | Actual** | | $ | 1,000.00 | | | $ | 1,008.00 | | | | 2.30 | % | | $ | 2.91 | |
| | | Hypothetical | | $ | 1,000.00 | | | $ | 1,013.61 | | | | 2.30 | % | | $ | 11.67 | |
| | | | | | | | | | | | | | | | | | |
| Class Q | | Actual** | | $ | 1,000.00 | | | $ | 1,009.00 | | | | 1.30 | % | | $ | 1.65 | |
| | | Hypothetical | | $ | 1,000.00 | | | $ | 1,018.65 | | | | 1.30 | % | | $ | 6.61 | |
| | | | | | | | | | | | | | | | | | |
| Class Z | | Actual** | | $ | 1,000.00 | | | $ | 1,009.00 | | | | 1.30 | % | | $ | 1.65 | |
| | | Hypothetical | | $ | 1,000.00 | | | $ | 1,018.65 | | | | 1.30 | % | | $ | 6.61 | |
*Fund expenses (net of fee waivers or subsidies, if any) for each share class are equal to the annualized expense ratio for each share class (provided in the table), multiplied by the average account value over the period, multiplied by the 184 days in the six-month period ended October 31, 2014, and divided by 365 days. Expenses presented in the table include the expenses of any underlying portfolios in which the Fund may invest.
**“Actual” expenses are calculated using the 46 day period ended October 31, 2014 due to the Fund’s inception date of September 16, 2014.
| | | | |
| Prudential Jennison Emerging Markets Equity Fund | | | 7 | |
Fees and Expenses (continued)
The Fund’s annualized expense ratios for the period September 16, 2014 through October 31, 2014, are as follows:
| | | | | | | | |
| Class | | Gross Operating Expenses | | | Net Operating Expenses | |
A | | | 14.06 | % | | | 1.55 | % |
C | | | 15.19 | | | | 2.30 | |
Q | | | 13.37 | | | | 1.30 | |
Z | | | 13.51 | | | | 1.30 | |
Net operating expenses shown above reflect any fee waivers and/or expense reimbursements. Additional information on Fund expenses and any fee waivers and/or expense reimbursements can be found in the “Financial Highlights” tables in this report and in the Notes to the Financial Statements in this report.
| | |
| 8 | | Visit our website at www.prudentialfunds.com |
Portfolio of Investments
as of October 31, 2014
| | | | | | | | |
| Description | | Shares | | | Value (Note 1) | |
LONG-TERM INVESTMENTS 97.8% | | | | | | | | |
| | |
COMMON STOCKS 90.8% | | | | | | | | |
| | |
Argentina 2.7% | | | | | | | | |
MercadoLibre, Inc. | | | 2,109 | | | $ | 287,140 | |
| | |
Brazil 5.3% | | | | | | | | |
Cielo SA | | | 10,633 | | | | 174,606 | |
Estacio Participacoes SA | | | 20,903 | | | | 242,107 | |
Linx SA | | | 7,268 | | | | 150,998 | |
| | | | | | | | |
| | | | | | | 567,711 | |
| | |
China 27.4% | | | | | | | | |
Alibaba Group Holding Ltd., ADR* | | | 3,673 | | | | 362,158 | |
Baidu, Inc., ADR* | | | 1,750 | | | | 417,847 | |
Beijing Enterprises Water Group Ltd.* | | | 222,319 | | | | 159,179 | |
Ctrip.com International Ltd., ADR* | | | 4,322 | | | | 251,973 | |
Huadian Fuxin Energy Corp. Ltd. (Class H Stock) | | | 324,805 | | | | 186,874 | |
PW Medtech Group Ltd.* | | | 247,568 | | | | 156,104 | |
Shanghai Fosun Pharmaceutical Group Co. Ltd. (Class H Stock) | | | 39,262 | | | | 141,355 | |
Tencent Holdings Ltd. | | | 23,162 | | | | 372,266 | |
Tong Ren Tang Technologies Co. Ltd. (Class H Stock) | | | 75,616 | | | | 101,614 | |
Vipshop Holdings Ltd., ADS* | | | 1,876 | | | | 430,148 | |
WuXi PharmaTech Cayman, Inc., ADR* | | | 4,489 | | | | 169,235 | |
YY, Inc., ADR* | | | 1,958 | | | | 162,240 | |
| | | | | | | | |
| | | | | | | 2,910,993 | |
| | |
Greece 1.1% | | | | | | | | |
FF Group* | | | 3,456 | | | | 113,109 | |
| | |
Hong Kong 2.4% | | | | | | | | |
Galaxy Entertainment Group Ltd. | | | 15,614 | | | | 106,767 | |
Haier Electronics Group Co. Ltd. | | | 55,304 | | | | 149,368 | |
| | | | | | | | |
| | | | | | | 256,135 | |
| | |
India 5.0% | | | | | | | | |
Axis Bank Ltd., GDR, RegS | | | 5,108 | | | | 179,853 | |
Larsen & Toubro Ltd., GDR, RegS | | | 7,186 | | | | 193,747 | |
Tata Motors Ltd., ADR | | | 3,364 | | | | 158,444 | |
| | | | | | | | |
| | | | | | | 532,044 | |
See Notes to Financial Statements.
| | | | |
| Prudential Jennison Emerging Markets Equity Fund | | | 9 | |
Portfolio of Investments
as of October 31, 2014 continued
| | | | | | | | |
| Description | | Shares | | | Value (Note 1) | |
COMMON STOCKS (Continued) | | | | | | | | |
| | |
Indonesia 10.6% | | | | | | | | |
Ace Hardware Indonesia Tbk PT | | | 2,299,172 | | | $ | 154,315 | |
Bank Mandiri Persero Tbk PT | | | 215,864 | | | | 185,396 | |
Jasa Marga Persero Tbk PT | | | 248,280 | | | | 130,534 | |
Kalbe Farma Tbk PT | | | 1,132,869 | | | | 159,953 | |
Matahari Department Store Tbk PT | | | 117,046 | | | | 141,716 | |
Surya Citra Media Tbk PT | | | 571,815 | | | | 160,062 | |
Tower Bersama Infrastructure Tbk PT | | | 269,172 | | | | 198,232 | |
| | | | | | | | |
| | | | | | | 1,130,208 | |
| | |
Malaysia 1.5% | | | | | | | | |
IHH Healthcare Bhd | | | 102,885 | | | | 154,832 | |
| | |
Mexico 7.9% | | | | | | | | |
Alfa SAB de CV (Class A Stock) | | | 37,922 | | | | 121,063 | |
Alsea SAB de CV* | | | 47,074 | | | | 147,554 | |
Cemex SAB de CV, ADR | | | 14,000 | | | | 172,200 | |
Corporacion Inmobiliaria Vesta SAB de CV | | | 108,130 | | | | 237,679 | |
Infraestructura Energetica Nova SAB de CV | | | 25,876 | | | | 157,874 | |
| | | | | | | | |
| | | | | | | 836,370 | |
| | |
Panama 1.0% | | | | | | | | |
Copa Holdings SA (Class A Stock) | | | 863 | | | | 100,902 | |
| | |
Peru 1.3% | | | | | | | | |
Credicorp Ltd. | | | 852 | | | | 137,172 | |
| | |
Philippines 4.6% | | | | | | | | |
Ayala Land, Inc. | | | 213,910 | | | | 159,839 | |
Universal Robina Corp. | | | 79,713 | | | | 330,188 | |
| | | | | | | | |
| | | | | | | 490,027 | |
| | |
Qatar 1.0% | | | | | | | | |
Qatar National Bank SAQ | | | 1,742 | | | | 102,758 | |
| | |
Russia 1.1% | | | | | | | | |
Magnit PJSC, GDR, RegS | | | 1,743 | | | | 116,258 | |
| | |
South Africa 1.8% | | | | | | | | |
Aspen Pharmacare Holdings Ltd.* | | | 5,276 | | | | 188,491 | |
See Notes to Financial Statements.
| | | | | | | | |
| Description | | Shares | | | Value (Note 1) | |
COMMON STOCKS (Continued) | | | | | | | | |
| | |
South Korea 7.0% | | | | | | | | |
Coway Co. Ltd. | | | 1,642 | | | $ | 125,526 | |
Hotel Shilla Co. Ltd. | | | 1,232 | | | | 115,986 | |
NAVER Corp. | | | 385 | | | | 272,434 | |
Paradise Co. Ltd. | | | 3,884 | | | | 119,548 | |
SK Hynix, Inc.* | | | 2,555 | | | | 113,938 | |
| | | | | | | | |
| | | | | | | 747,432 | |
| | |
Thailand 7.6% | | | | | | | | |
Bangkok Dusit Medical Services PCL | | | 272,797 | | | | 154,913 | |
CP ALL PCL | | | 130,796 | | | | 182,721 | |
Home Product Center PCL | | | 562,615 | | | | 160,648 | |
LPN Development PCL | | | 203,390 | | | | 155,493 | |
Minor International PCL | | | 147,856 | | | | 157,753 | |
| | | | | | | | |
| | | | | | | 811,528 | |
| | |
Turkey 1.5% | | | | | | | | |
BIM Birlesik Magazalar AS | | | 7,107 | | | | 162,354 | |
| | | | | | | | |
TOTAL COMMON STOCKS
(cost $9,485,133) | | | | | | | 9,645,464 | |
| | | | | | | | |
| | |
| | | Units | | | | |
WARRANTS* 7.0% | | | | | | | | |
| | |
India 7.0% | | | | | | | | |
Ashok Leyland Ltd., expiring 10/29/15 144A(a) | | | 205,513 | | | | 155,470 | |
Asian Paints Ltd., expiring 07/29/15 144A(a) | | | 11,816 | | | | 126,435 | |
Eicher Motors Ltd., expiring 08/27/18 144A(a) | | | 761 | | | | 158,265 | |
Lupin Ltd., expiring 10/29/15 144A(a) | | | 7,725 | | | | 172,246 | |
Zee Entertainment Enterprises Ltd., expiring 12/09/15 144A(a) | | | 23,232 | | | | 130,255 | |
| | | | | | | | |
| | | | | | | 742,671 | |
| | | | | | | | |
| | |
Thailand | | | | | | | | |
Minor International PCL , expiring 11/13/17(a) | | | 7,392 | | | | — | |
| | | | | | | | |
TOTAL WARRANTS
(cost $757,037) | | | | | | | 742,671 | |
| | | | | | | | |
TOTAL LONG-TERM INVESTMENTS
(cost $10,242,170) | | | | | | | 10,388,135 | |
| | | | | | | | |
See Notes to Financial Statements.
| | | | |
| Prudential Jennison Emerging Markets Equity Fund | | | 11 | |
Portfolio of Investments
as of October 31, 2014 continued
| | | | | | | | |
| Description | | Shares | | | Value (Note 1) | |
SHORT-TERM INVESTMENT 3.7% | | | | | | | | |
| | |
AFFILIATED MONEY MARKET MUTUAL FUND | | | | | | | | |
Prudential Investment Portfolios 2 - Prudential Core Taxable Money Market Fund
(cost $395,965)(Note 3)(b) | | | 395,965 | | | $ | 395,965 | |
| | | | | | | | |
TOTAL INVESTMENTS 101.5%
(cost $10,638,135; Note 5) | | | | | | | 10,784,100 | |
Liabilities in excess of other assets (1.5)% | | | | | | | (154,320 | ) |
| | | | | | | | |
NET ASSETS 100.0% | | | | | | $ | 10,629,780 | |
| | | | | | | | |
The following abbreviations are used in the portfolio descriptions:
144A—Security was purchased pursuant to Rule 144A under the Securities Act of 1933 and may not be resold subject to that rule except to qualified institutional buyers. Unless otherwise noted, 144A securities are deemed to be liquid.
RegS—Regulation S. Security was purchased pursuant to Regulation S and may not be offered, sold or delivered within the United States or to, or for the account or benefit of, U.S. persons, except pursuant to an exemption from, or in a transaction not subject to, the registration requirements of the Securities Act of 1933.
ADR—American Depositary Receipt
ADS—American Depositary Security
GDR—Global Depository Receipt
| * | Non-income producing security. |
| (a) | Indicates a security or securities that has been deemed illiquid. |
| (b) | Prudential Investments LLC, the manager of the Series also serves as manager of the Prudential Investment Portfolios 2 - Prudential Core Taxable Money Market Fund. |
Various inputs are used in determining the value of the Series’ investments. These inputs are summarized in the three broad levels listed below.
Level 1—quoted prices generally in active markets for identical securities.
Level 2—quoted prices for similar securities, interest rates and yield curves, prepayment speeds, foreign currency exchange rates, and other significant observable inputs.
Level 3—significant unobservable inputs for securities valued in accordance with Board approved fair valuation procedures.
See Notes to Financial Statements.
The following is a summary of the inputs used as of October 31, 2014 in valuing such portfolio securities:
| | | | | | | | | | | | |
| | | Level 1 | | | Level 2 | | | Level 3 | |
Investments in Securities | | | | | | | | | | | | |
Common Stocks | | | | | | | | | | | | |
Argentina | | $ | 287,140 | | | $ | — | | | $ | — | |
Brazil | | | 567,711 | | | | — | | | | — | |
China | | | 1,949,705 | | | | 961,288 | | | | — | |
Greece | | | — | | | | 113,109 | | | | — | |
Hong Kong | | | — | | | | 256,135 | | | | — | |
India | | | 532,044 | | | | — | | | | — | |
Indonesia | | | 198,232 | | | | 931,976 | | | | — | |
Malaysia | | | 154,832 | | | | — | | | | — | |
Mexico | | | 836,370 | | | | — | | | | — | |
Panama | | | 100,902 | | | | — | | | | — | |
Peru | | | 137,172 | | | | — | | | | — | |
Philippines | | | — | | | | 490,027 | | | | — | |
Qatar | | | — | | | | 102,758 | | | | — | |
Russia | | | 116,258 | | | | — | | | | — | |
South Africa | | | — | | | | 188,491 | | | | — | |
South Korea | | | — | | | | 747,432 | | | | — | |
Thailand | | | 656,615 | | | | 154,913 | | | | — | |
Turkey | | | — | | | | 162,354 | | | | — | |
Warrants | | | | | | | | | | | | |
India | | | — | | | | 742,671 | | | | — | |
Thailand | | | — | | | | — | | | | — | |
Affiliated Money Market Mutual Fund | | | 395,965 | | | | — | | | | — | |
| | | | | | | | | | | | |
Total | | $ | 5,932,946 | | | $ | 4,851,154 | | | $ | — | |
| | | | | | | | | | | | |
See Notes to Financial Statements.
| | | | |
| Prudential Jennison Emerging Markets Equity Fund | | | 13 | |
Portfolio of Investments
as of October 31, 2014 continued
The industry classification of investments and liabilities in excess of other assets shown as a percentage of net assets as of October 31, 2014 was as follows (Unaudited):
| | | | |
Internet Software & Services | | | 17.5 | % |
Banks | | | 9.6 | |
Internet & Catalog Retail | | | 6.4 | |
Hotels, Restaurants & Leisure | | | 6.1 | |
Pharmaceuticals | | | 5.6 | |
Real Estate Management & Development | | | 5.2 | |
Food & Staples Retailing | | | 4.3 | |
Specialty Retail | | | 4.1 | |
Affiliated Money Market Mutual Fund | | | 3.7 | |
Food Products | | | 3.1 | |
Capital Markets | | | 3.1 | |
Health Care Providers & Services | | | 2.9 | |
Household Durables | | | 2.6 | |
Diversified Consumer Services | | | 2.3 | |
Wireless Telecommunication Services | | | 1.9 | |
Construction & Engineering | | | 1.8 | |
Independent Power & Renewable Electricity Producers | | | 1.8 | |
IT Services | | | 1.6 | % |
Construction Materials | | | 1.6 | |
Life Sciences Tools & Services | | | 1.6 | |
Media | | | 1.5 | |
Water Utilities | | | 1.5 | |
Automobiles | | | 1.5 | |
Gas Utilities | | | 1.5 | |
Health Care Equipment & Supplies | | | 1.5 | |
Software | | | 1.4 | |
Multiline Retail | | | 1.3 | |
Transportation Infrastructure | | | 1.2 | |
Industrial Conglomerates | | | 1.2 | |
Semiconductors & Semiconductor Equipment | | | 1.1 | |
Airlines | | | 1.0 | |
| | | | |
| | | 101.5 | |
Liabilities in excess of other assets | | | (1.5 | ) |
| | | | |
| | | 100.0 | % |
| | | | |
The Series invested in various derivative instruments during the reporting period. The primary type of risk associated with these derivative instruments is equity risk.
The effect of such derivative instruments on the Series’ financial position and financial performance as reflected in the Statement of Assets and Liabilities and Statement of Operations is presented in the summary below.
Fair values of derivative instruments as of October 31, 2014 as presented in the Statement of Assets and Liabilities:
| | | | | | | | | | | | |
Derivatives not accounted for
as hedging instruments,
carried at fair value | | Asset Derivatives | | | Liability Derivatives | |
| | Balance Sheet
Location | | Fair
Value | | | Balance Sheet
Location | | Fair
Value | |
| Equity contracts | | Unaffiliated investments | | $ | 742,671 | | | — | | $ | — | |
| | | | | | | | | | | | |
See Notes to Financial Statements.
The effects of derivative instruments on the Statement of Operations for the period* ended October 31, 2014 are as follows:
| | | | |
Change in Unrealized Appreciation or (Depreciation) on Derivatives Recognized in Income | |
Derivatives not accounted for as hedging
instruments, carried at fair value | | Warrants(1) | |
Equity contracts | | $ | (14,366 | ) |
| | | | |
| (1) | Included in net change in unrealized appreciation (depreciation) on investments in the Statement of Operations. |
For the period ended October 31, 2014, the Series did not have any realized gain or (loss) on derivatives recognized in income.
* Commencement of operations was September 16, 2014.
See Notes to Financial Statements.
| | | | |
| Prudential Jennison Emerging Markets Equity Fund | | | 15 | |
Statement of Assets & Liabilities
as of October 31, 2014
| | | | |
Assets | | | | |
Investments at value: | | | | |
Unaffiliated investments (cost $10,242,170) | | $ | 10,388,135 | |
Affiliated investments (cost $395,965) | | | 395,965 | |
Foreign currency, at value (cost $860) | | | 860 | |
Receivable for investments sold | | | 145,763 | |
Due from Manager | | | 95,275 | |
Dividends receivable | | | 728 | |
Tax reclaim receivable | | | 104 | |
Prepaid expenses | | | 661 | |
| | | | |
Total assets | | | 11,027,491 | |
| | | | |
| |
Liabilities | | | | |
Payable for investments purchased | | | 312,874 | |
Accrued expenses | | | 84,461 | |
Distribution fee payable | | | 329 | |
Affiliated transfer agent fee payable | | | 43 | |
Payable to custodian | | | 4 | |
| | | | |
Total liabilities | | | 397,711 | |
| | | | |
| |
Net Assets | | $ | 10,629,780 | |
| | | | |
| | | | | |
Net assets were comprised of: | | | | |
Common stock, at par | | $ | 10,535 | |
Paid-in capital in excess of par | | | 10,510,373 | |
| | | | |
| | | 10,520,908 | |
Undistributed net investment income | | | 4,706 | |
Accumulated net realized loss on investment and foreign currency transactions | | | (41,789 | ) |
Net unrealized appreciation on investments and foreign currencies | | | 145,955 | |
| | | | |
Net assets, October 31, 2014 | | $ | 10,629,780 | |
| | | | |
See Notes to Financial Statements.
| | | | |
Class A: | | | | |
Net asset value and redemption price per share,
($18,021 ÷ 1,786 shares of common stock issued and outstanding) | | $ | 10.09 | |
Maximum sales charge (5.50% of offering price) | | | 0.59 | |
| | | | |
Maximum offering price to public | | $ | 10.68 | |
| | | | |
| |
Class C: | | | | |
Net asset value, offering price and redemption price per share,
($500,958 ÷ 49,677 shares of common stock issued and outstanding) | | $ | 10.08 | |
| | | | |
| |
Class Q: | | | | |
Net asset value, offering price and redemption price per share,
($10,100,710 ÷ 1,001,000 shares of common stock issued and outstanding) | | $ | 10.09 | |
| | | | |
| |
Class Z: | | | | |
Net asset value, offering price and redemption price per share,
($10,091 ÷ 1,000 shares of common stock issued and outstanding) | | $ | 10.09 | |
| | | | |
See Notes to Financial Statements.
| | | | |
| Prudential Jennison Emerging Markets Equity Fund | | | 17 | |
Statement of Operations
For the period September 16, 2014* through October 31, 2014
| | | | |
Net Investment Loss | | | | |
Income | | | | |
Unaffiliated dividend income (net of foreign withholding taxes of $267) | | $ | 7,590 | |
Affiliated dividend income | | | 324 | |
| | | | |
Total income | | | 7,914 | |
| | | | |
| |
Expenses | | | | |
Management fee | | | 13,373 | |
Distribution fee—Class A | | | 6 | |
Distribution fee—Class C | | | 373 | |
Registration fees | | | 60,000 | |
Legal fees and expenses | | | 40,000 | |
Audit fee | | | 22,000 | |
Reports to shareholders | | | 20,000 | |
Custodian’s fees and expenses | | | 10,000 | |
Directors’ fees | | | 1,000 | |
Transfer agent’s fees and expenses (including affiliated expense of $43) | | | 101 | |
Miscellaneous | | | 4,071 | |
| | | | |
Total expenses | | | 170,924 | |
Less: Management fee waiver | | | (153,988 | ) |
Distribution fee waiver—Class A | | | (1 | ) |
| | | | |
Net expense | | | 16,935 | |
| | | | |
Net investment loss | | | (9,021 | ) |
| | | | |
| |
Realized and Unrealized Gain (Loss) on Investment and Foreign Currencies | | | | |
Net realized gain (loss) on: | | | | |
Investment transactions | | | (41,789 | ) |
Foreign currency transactions | | | 7,523 | |
| | | | |
| | | (34,266 | ) |
| | | | |
Net change in unrealized appreciation (depreciation) on: | | | | |
Investments | | | 145,965 | |
Foreign currencies | | | (10 | ) |
| | | | |
| | | 145,955 | |
| | | | |
Net gain on investments and foreign currencies | | | 111,689 | |
| | | | |
Net Increase In Net Assets Resulting From Operations | | $ | 102,668 | |
| | | | |
| * | Commencement of operations. |
See Notes to Financial Statements.
Statement of Changes in Net Assets
| | | | |
| | | September 16, 2014*
through
October 31, 2014 | |
Increase (Decrease) in Net Assets | | | | |
Operations | | | | |
Net investment loss | | $ | (9,021 | ) |
Net realized loss on investment and foreign currency transactions | | | (34,266 | ) |
Net change in unrealized appreciation (depreciation) on investments and foreign currencies | | | 145,955 | |
| | | | |
Net increase in net assets resulting from operations | | | 102,668 | |
| | | | |
| |
Series share transactions (Note 6) | | | | |
Net proceeds from shares sold | | | 10,528,444 | |
Cost of shares reacquired | | | (1,332 | ) |
| | | | |
Net increase in net assets from Series share transactions | | | 10,527,112 | |
| | | | |
Total increase | | | 10,629,780 | |
| |
Net Assets | | | | |
Beginning of period | | | — | |
| | | | |
End of period(a) | | $ | 10,629,780 | |
| | | | |
(a) Includes undistributed net investment income of: | | $ | 4,706 | |
| | | | |
| * | Commencement of operations. |
See Notes to Financial Statements.
| | | | |
| Prudential Jennison Emerging Markets Equity Fund | | | 19 | |
Notes to Financial Statements
Prudential World Fund, Inc. (the “Fund”), is registered under the Investment Company Act of 1940, as amended, (“1940 Act”) as an open-end diversified management investment company and currently consists of seven series: Prudential Jennison Emerging Markets Equity Fund, (the “Series”), Prudential International Value Fund, Prudential Jennison Global Infrastructure Fund, Prudential International Equity Fund, Prudential Emerging Markets Debt Local Currency Fund, Prudential Jennison Global Opportunities Fund and Prudential Jennison International Opportunities Fund. These financial statements relate to Prudential Jennison Emerging Markets Equity Fund. The Series commenced operations on September 16, 2014. The financial statements of the other series are not presented herein. The investment objective of the Series is to seek long-term growth of capital.
Note 1. Accounting Policies
The following accounting policies conform to U.S. generally accepted accounting principles. The Fund and the Series consistently follows such policies in the preparation of their financial statements.
Securities Valuation: The Series holds securities and other assets that are fair valued at the close of each day the New York Stock Exchange (“NYSE”) is open for trading. Fair value is the price that would be received to sell an asset or paid to transfer a liability in an orderly transaction between market participants on the measurement date. The Board of Directors (the “Board”) has adopted Valuation Procedures for security valuation under which fair valuation responsibilities have been delegated to Prudential Investments LLC (“PI” or “Manager”). Under the current Valuation Procedures, the established Valuation Committee is responsible for supervising the valuation of portfolio securities and other assets. The Valuation Procedures permit the Series to utilize independent pricing vendor services, quotations from market makers, and alternative valuation methods when market quotations are either not readily available or not deemed representative of fair value. A record of the Valuation Committee’s actions is subject to the Board’s review, approval, and ratification at its next regularly-scheduled quarterly meeting.
Various inputs determine how the Series’ investments are valued, all of which are categorized according to the three broad levels (Level 1, 2, or 3) detailed in the table following the Portfolio of Investments.
Common and preferred stocks, exchange-traded funds, and derivative instruments such as futures or options that are traded on a national securities exchange are valued at the last sale price as of the close of trading on the applicable exchange. Securities traded via NASDAQ are valued at the NASDAQ official closing price. To the extent these securities are valued at the last sale price or NASDAQ official closing price, they are classified as Level 1 in the fair value hierarchy.
In the event that no sale or official closing price on valuation date exists, these securities are generally valued at the mean between the last reported bid and ask prices, or at the last bid price in the absence of an ask price. These securities are classified as Level 2 in the fair value hierarchy, as the inputs are observable and considered to be significant to the valuation.
Common and preferred stocks traded on a foreign securities exchanges are valued using pricing vendor services that provide model prices derived using adjustment factors based on information such as local closing price, relevant general and sector indices, currency fluctuations, depositary receipts, and futures, as applicable. Securities valued using such model prices are classified as Level 2 in the fair value hierarchy, as the adjustment factors are observable and considered to be significant to the valuation. Securities not valued using such model prices are valued in accordance with exchange-traded common and preferred stocks discussed above.
Investments in open-end, non-exchange-traded mutual funds are valued at their net asset values as of the close of the NYSE on the date of valuation. These securities are classified as Level 1 in the fair value hierarchy since they may be purchased or sold at their net asset values on the date of valuation.
Fixed income securities traded in the over-the-counter market are generally valued at prices provided by approved independent pricing vendors. The pricing vendors provide these prices after evaluating observable inputs including, but not limited to yield curves, yield spreads, credit ratings, deal terms, tranche level attributes, default rates, cash flows, prepayment speeds, broker/dealer quotations, and reported trades. Securities valued using such vendor prices are classified as Level 2 in the fair value hierarchy.
Over-the-counter derivative instruments are generally valued using pricing vendor services, which derive the valuation based on inputs such as underlying asset prices, indices, spreads, interest rates, and exchange rates. These instruments are categorized as Level 2 in the fair value hierarchy.
| | | | |
| Prudential Jennison Emerging Markets Equity Fund | | | 21 | |
Notes to Financial Statements
continued
Centrally cleared swaps listed or traded on a multilateral or trade facility platform, such as a registered exchange, are valued at the daily settlement price determined by the respective exchange. These securities are classified as Level 2 in the fair value hierarchy, as the prices marked at the official settle are not public.
Securities and other assets that cannot be priced according to the methods described above are valued based on pricing methodologies approved by the Board. In the event that significant unobservable inputs are used when determining such valuations, the securities will be classified as Level 3 in the fair value hierarchy.
When determining the fair value of securities, some of the factors influencing the valuation include: the nature of any restrictions on disposition of the securities; assessment of the general liquidity of the securities; the issuer’s financial condition and the markets in which it does business; the cost of the investment; the size of the holding and the capitalization of the issuer; the prices of any recent transactions or bids/offers for such securities or any comparable securities; any available analyst media or other reports or information deemed reliable by the investment adviser regarding the issuer or the markets or industry in which it operates. Using fair value to price securities may result in a value that is different from a security’s most recent closing price and from the price used by other mutual funds to calculate their net asset values.
Foreign Currency Translation: The books and records of the Series are maintained in U.S. dollars. Foreign currency amounts are translated into U.S. dollars on the following basis:
(i) market value of investment securities, other assets and liabilities—at the current rates of exchange.
(ii) Purchases and sales of investment securities, income and expenses—at the rates of exchange prevailing on the respective dates of such transactions.
Although the net assets of the Series are presented at the foreign exchange rates and market values at the close of the period, the Series does not isolate that portion of the results of operations arising as a result of changes in the foreign exchange rates from the fluctuations arising from changes in the market prices of long-term portfolio securities held at the end of the period. Similarly, the Series does not isolate the effect of changes in foreign exchange rates from the fluctuations arising from changes in the market prices of long-term portfolio securities sold during the period.
Accordingly, realized foreign currency gains or losses are included in the reported net realized gains or losses on investment transactions.
Net realized gains or losses on foreign currency transactions represent net foreign exchange gains or losses from the holding of foreign currencies, forward currency contracts disposition of foreign currencies, currency gains or losses realized between the trade date and settlement date on securities transactions, and the difference between the amounts of dividends, interest and foreign withholding taxes recorded on the Series’ books and the U.S. dollar equivalent amounts actually received or paid. Net unrealized currency gains or losses from valuing foreign currency denominated assets and liabilities (other than investments) at period end exchange rates are reflected as a component of net unrealized appreciation (depreciation) on investments and foreign currencies.
Concentration of Risk: Foreign security and currency transactions may involve certain considerations and risks not typically associated with those of domestic origin as a result of, among other factors, the possibility of political and economic instability or the level of governmental supervision and regulation of foreign securities markets.
Warrants and Rights: The Series may hold warrants and rights acquired either through a direct purchase, included as part of a private placement, or pursuant to corporate actions. Warrants and rights entitle the holder to buy a proportionate amount of common stock at a specific price and time through the expiration dates. Such warrants and rights are held as long positions by the Series until exercised, sold or expired. Warrants and rights are valued at fair value in accordance with the Board’s approved fair valuation procedures.
Restricted and Illiquid Securities: Subject to guidelines adopted by the Board, the Series may invest up to 15% of its net assets in illiquid securities, including those which are restricted as to disposition under securities law (“restricted securities”). Restricted securities are valued pursuant to the valuation procedures noted above. Illiquid securities are those that, because of the absence of a readily available market or due to legal or contractual restrictions on resale, cannot be sold within seven days in the ordinary course of business at approximately the amount at which the Series has valued the investment. Therefore, the Series may find it difficult to sell illiquid securities at the time considered most advantageous by its Subadviser and may incur expenses that would not be incurred in the sale of securities that were freely
| | | | |
| Prudential Jennison Emerging Markets Equity Fund | | | 23 | |
Notes to Financial Statements
continued
marketable. Certain securities that would otherwise be considered illiquid because of legal restrictions on resale to the general public may be traded among qualified institutional buyers under Rule 144A of the Securities Act of 1933. These Rule 144A securities, as well as commercial paper that is sold in private placements under Section 4(2) of the Securities Act, may be deemed liquid by the Series’ Subadviser under the guidelines adopted by the Directors of the Series. However, the liquidity of the Series’ investments in Rule 144A securities could be impaired if trading does not develop or declines.
Securities Transactions and Net Investment Income: Securities transactions are recorded on the trade date. Realized gains or losses from investment and currency transactions are calculated on the identified cost basis. Dividend income is recorded on the ex-dividend date. Interest income, including amortization of premium and accretion of discount on debt securities, as required, is recorded on an accrual basis. Expenses are recorded on the accrual basis, which may require the use of certain estimates by management that may differ from actual.
Net investment income or loss, (other than distribution fees, which are charged directly to the respective class and transfer agency fees specific to Class Q shares which are charged to that share class) and unrealized and realized gains or losses are allocated daily to each class of shares based upon the relative proportion of adjusted net assets of each class at the beginning of the day.
Dividends and Distributions: The Series expects to pay dividends of net investment income and distributions of net realized capital gains, if any, annually. Dividends and distributions to shareholders, which are determined in accordance with federal income tax regulations and which may differ from generally accepted accounting principles, are recorded on the ex-dividend date. Permanent book/tax differences relating to income and gains are reclassified amongst undistributed net investment income, accumulated net realized gain or loss and paid-in capital in excess of par, as appropriate.
Taxes: For federal income tax purposes, each series in the Fund is treated as a separate taxpaying entity. It is the Series’ policy to meet the requirements of the Internal Revenue Code applicable to regulated investment companies and to distribute all of its taxable net income and capital gains, if any, to shareholders. Therefore, no federal income tax provision is required. Withholding taxes on foreign dividends are recorded, net of reclaimable amounts, at the time the related income is earned.
Estimates: The preparation of the financial statements requires management to make estimates and assumptions that affect the reported amounts and disclosures in the financial statements. Actual results could differ from those estimates.
Note 2. Agreements
The Fund has a management agreement for the Series with Prudential Investments LLC (“PI”). Pursuant to this agreement, PI has responsibility for all investment advisory services and supervises the subadvisor’s performance of such services. PI has entered into a subadvisory agreement with Jennison Associates LLC (“Jennison”). The subadvisory agreement provides that Jennison furnishes investment advisory services in connection with the management of the Series. In connection therewith, Jennison is obligated to keep certain books and records of the Series. PI pays for the services of Jennison, the compensation of officers of the Series, occupancy and certain clerical and bookkeeping costs of the Series. The Series bears all other costs and expenses.
The management fee paid to PI is accrued daily and payable monthly at an annual rate of 1.05% of the Series’ average daily net assets. PI has contractually agreed through February 29, 2016 to limit net annual Series operating expenses (excluding distribution and service (12b-1) fees, extraordinary and certain other expenses such as taxes, interest and brokerage commissions) to each class of shares to 1.30% of the Series’ average daily net assets.
The Series has a distribution agreement with Prudential Investment Management Services LLC (“PIMS”), which acts as the distributor of the Class A, Class C, Class Q and Class Z shares of the Series. The Series compensates PIMS for distributing and servicing the Series’ Class A and Class C shares pursuant to plans of distribution (the “Class A and C Plans”), regardless of expenses actually incurred by PIMS. The distribution fees are accrued daily and payable monthly. No distribution or service fees are paid to PIMS as distributor of the Class Q shares and Class Z shares of the Series.
Pursuant to the Class A and C Plans, the Series compensates PIMS for distribution related activities at an annual rate of up to .30% and 1% of the average daily net assets of the Class A and C shares, respectively. PIMS has contractually agreed to limit such fee to .25% of the average daily net assets of the Class A shares through February 29, 2016.
| | | | |
| Prudential Jennison Emerging Markets Equity Fund | | | 25 | |
Notes to Financial Statements
continued
PIMS has advised the Series that it received $56 in front-end sales charges resulting from sales of Class A shares, during the period ended October 31, 2014. From these fees, PIMS paid such sales charges to broker-dealers, which in turn paid commissions to salespersons and incurred other distribution costs.
PI and PIMS are indirect, wholly-owned subsidiaries of Prudential Financial, Inc. (“Prudential”).
Note 3. Other Transactions with Affiliates
Prudential Mutual Fund Services LLC (“PMFS”), an affiliate of PI and an indirect, wholly owned subsidiary of Prudential, serves as the Series’ transfer agent. The transfer agent fees and expenses in the Statement of Operations also include certain out-of-pocket expenses paid to non-affiliates, where applicable.
The Series invests in the Prudential Core Taxable Money Market Fund (the “Core Fund”), a portfolio of Prudential Investment Portfolios 2 registered under the 1940 Act, and managed by PI. Earnings from the Core Fund are disclosed on the Statement of Operations as affiliated dividend income.
Note 4. Portfolio Securities
Purchases and sales of investment securities, other than short-term investments, for the period ended October 31, 2014 were $11,722,950 and $1,438,991, respectively.
Note 5. Distributions and Tax Information
Distributions to shareholders, which are determined in accordance with federal income tax regulations, which may differ from generally accepted accounting principles, are recorded on the ex-dividend date. In order to present undistributed net investment income, accumulated net realized loss on investment and foreign currency transactions and paid-in capital in excess of par on the Statement of Assets and Liabilities that more closely represent their tax character, certain adjustments have been made to undistributed net investment income, accumulated net realized loss on investment and foreign currency transactions and paid-in capital in excess of par. For the tax period ended October 31, 2014 the adjustments were to increase
undistributed net investment income by $13,727, increase accumulated net realized loss on investment and foreign currency transactions by $7,523 and decrease paid-in capital in excess of par by $6,204 due to the differences in the treatment for book and tax purposes of certain transactions involving foreign securities and other book to tax differences. Net investment loss, net realized gain (loss) on investment and foreign currencies transactions and net assets were not affected by this change.
For the tax period ended October 31, 2014, there were no distributions paid by the Series.
As of October 31, 2014, the accumulated undistributed earnings on a tax basis was $4,706 of ordinary income.
The United States federal income tax basis of the Series’ investments and the net unrealized appreciation as of October 31, 2014 were as follows:
| | | | | | | | | | |
Tax Basis | | Appreciation | | Depreciation | | Net
Unrealized
Appreciation | | Other
Cost Basis
Adjustment | | Total Net
Unrealized
Appreciation |
| $10,638,135 | | $384,643 | | $(238,678) | | $145,965 | | $(10) | | $145,955 |
The other cost basis adjustments are primarily attributable to appreciation (depreciation) of foreign currencies and mark-to-market of receivables and payables.
For federal income tax purposes, the Series had a capital loss carryforward as of October 31, 2014 of approximately $42,000 which can be carried forward for an unlimited period. No capital gains distributions are expected to be paid to shareholders until net gains have been realized in excess of such losses.
Management has analyzed the Series’ tax positions and has concluded that as of October 31, 2014, no provision for income tax is required in the Series’ financial statements for the current reporting period.
Note 6. Capital
The Series offers Class A, Class C, Class Q and Class Z shares. Class A shares are subject to a maximum front-end sales charge of up to 5.50%. All investors who purchase Class A shares in an amount of $1 million or more and sell these shares
| | | | |
| Prudential Jennison Emerging Markets Equity Fund | | | 27 | |
Notes to Financial Statements
continued
within 12 months of purchase are subject to a contingent deferred sales charge (“CDSC”) of 1%, including investors who purchase their shares through broker-dealers affiliated with Prudential. The Class A CDSC is waived for purchases by certain retirement or benefit plans. Class C shares are sold with a CDSC of 1% during the first 12 months from the date of purchase. Class Z shares are not subject to any sales or redemption charge and are offered exclusively for sale to a limited group of investors. A special exchange privilege is also available for shareholders who qualify to purchase Class A shares at net asset value.
Under certain circumstances, an exchange may be made from specified share classes of the Series to one or more other share classes of the Series as presented in the table of transactions in shares of common stock.
At October 31, 2014, Prudential Financial, Inc. through its affiliates owned 1,000 shares of Class A, 1,000 shares of Class C, 1,001,000 shares of Class Q and 1,000 shares of Class Z.
There are 865 million authorized shares of $.01 par value common stock, divided into four classes, designated Class A, Class C, Class Q and Class Z common stock, each of which consists of 250 million, 65 million, 250 million and 300 million authorized shares, respectively.
Transactions in shares of common stock were as follows:
| | | | | | | | |
Class A | | Shares | | | Amount | |
Period* ended October 31, 2014: | | | | | | | | |
Shares sold | | | 1,923 | | | $ | 19,219 | |
Shares reacquired | | | (137 | ) | | | (1,332 | ) |
| | | | | | | | |
Net increase (decrease) in shares outstanding | | | 1,786 | | | $ | 17,887 | |
| | | | | | | | |
Class C | | | | | | |
Period* ended October 31, 2014: | | | | | | | | |
Shares sold | | | 49,677 | | | $ | 489,225 | |
Shares reacquired | | | — | | | | — | |
| | | | | | | | |
Net increase (decrease) in shares outstanding | | | 49,677 | | | $ | 489,225 | |
| | | | | | | | |
| | | | | | | | |
Class Q | | Shares | | | Amount | |
Period* ended October 31, 2014: | | | | | | | | |
Shares sold | | | 1,001,000 | | | $ | 10,010,000 | |
Shares reacquired | | | — | | | | — | |
| | | | | | | | |
Net increase (decrease) in shares outstanding | | | 1,001,000 | | | $ | 10,010,000 | |
| | | | | | | | |
Class Z | | | | | | |
Period* ended October 31, 2014: | | | | | | | | |
Shares sold | | | 1,000 | | | $ | 10,000 | |
Shares reacquired | | | — | | | | — | |
| | | | | | | | |
Net increase (decrease) in shares outstanding | | | 1,000 | | | $ | 10,000 | |
| | | | | | | | |
| * | Commencement of operations was September 16, 2014. |
Note 7. Borrowings
The Series, along with other affiliated registered investment companies (the “Funds”), is a party to a Syndicated Credit Agreement (“SCA”) with a group of banks. The purpose of the SCA is to provide an alternative source of temporary funding for capital share redemptions. The SCA provides for a commitment of $900 million for the period October 9, 2014 through October 8, 2015. The Funds pay an annualized commitment fee of .075% of the unused portion of the SCA. Prior to October 9, 2014, the Funds had another SCA that provided a commitment of $900 million and the Funds paid an annualized commitment fee of .08% of the unused portion of the SCA. Interest on any borrowings under the SCA is paid at contracted market rates. The commitment fee for the unused amount is accrued daily and paid quarterly.
The Series did not utilize the SCA during the period ended October 31, 2014.
Note 8. Notice of Distribution to Shareholders
The Series declared ordinary income distribution on December 4, 2014 to shareholders of Class Q shares of record on December 5, 2014. The ex-dividend date was December 8, 2014. The per share amount declared was $0.0050. No distribution was declared for Class A, Class C and Class Z shares.
| | | | |
| Prudential Jennison Emerging Markets Equity Fund | | | 29 | |
Financial Highlights
| | | | |
| Class A Shares | | | |
| | | September 16,
2014(b)
through
October 31,
2014(c) | |
| Per Share Operating Performance: | | | | |
| Net Asset Value, Beginning of Period | | | $10.00 | |
| Income (loss) from investment operations: | | | | |
| Net investment loss | | | (.01 | ) |
| Net realized and unrealized gain on investments | | | .10 | |
| Total from investment operations | | | .09 | |
| Net Asset Value, end of period | | | $10.09 | |
| Total Return(a): | | | .90% | |
| | | | |
| Ratios/Supplemental Data: | | | |
| Net assets, end of period (000) | | | $18 | |
| Average net assets (000) | | | $15 | |
| Ratios to average net assets(d): | | | | |
| Expenses after waivers and/or expense reimbursement | | | 1.55% | (e) |
| Expenses before waivers and/or expense reimbursement | | | 14.06% | (e) |
| Net investment loss | | | (.93)% | (e) |
| Portfolio turnover rate | | | 15% | (f) |
(a) Total return does not consider the effect of sales load. Total return is calculated assuming a purchase of a share on the first day and a sale on the last day of each period reported and includes reinvestment of dividends and distributions. Total returns may reflect adjustments to conform to generally accepted accounting principles. Total returns for periods less than one full year are not annualized.
(b) Commencement of operations.
(c) Calculated based on the average shares outstanding during the period.
(d) Does not include expenses of the underlying portfolio in which the Series invests.
(e) Annualized.
(f) Not annualized.
See Notes to Financial Statements.
| | | | |
| Class C Shares | | | |
| | | September 16,
2014(b)
through
October 31,
2014(c) | |
| Per Share Operating Performance: | | | | |
| Net Asset Value, Beginning of Period | | | $10.00 | |
| Income (loss) from investment operations: | | | | |
| Net investment loss | | | (.02 | ) |
| Net realized and unrealized gain on investments | | | .10 | |
| Total from investment operations | | | .08 | |
| Net Asset Value, end of period | | | $10.08 | |
| Total Return(a): | | | .80% | |
| | | | |
| Ratios/Supplemental Data: | | | |
| Net assets, end of period (000) | | | $501 | |
| Average net assets (000) | | | $296 | |
| Ratios to average net assets(d): | | | | |
| Expenses after waivers and/or expense reimbursement | | | 2.30% | (e) |
| Expenses before waivers and/or expense reimbursement | | | 15.19% | (e) |
| Net investment loss | | | (1.79)% | (e) |
| Portfolio turnover rate | | | 15% | (f) |
(a) Total return does not consider the effect of sales load. Total return is calculated assuming a purchase of a share on the first day and a sale on the last day of each period reported and includes reinvestment of dividends and distributions. Total returns may reflect adjustments to conform to generally accepted accounting principles. Total returns for periods less than one full year are not annualized.
(b) Commencement of operations.
(c) Calculated based on the average shares outstanding during the period.
(d) Does not include expenses of the underlying portfolio in which the Series invests.
(e) Annualized.
(f) Not annualized.
See Notes to Financial Statements.
| | | | |
| Prudential Jennison Emerging Markets Equity Fund | | | 31 | |
Financial Highlights
continued
| | | | |
| Class Q Shares | |
| | | September 16,
2014(b)
through
October 31,
2014(c) | |
| Per Share Operating Performance: | | | | |
| Net Asset Value, Beginning of Period | | | $10.00 | |
| Income (loss) from investment operations: | | | | |
| Net investment loss | | | (.01 | ) |
| Net realized and unrealized gain on investments | | | .10 | |
| Total from investment operations | | | .09 | |
| Net Asset Value, end of period | | | $10.09 | |
| Total Return(a): | | | .90% | |
| | | | |
| Ratios/Supplemental Data: | |
| Net assets, end of period (000) | | | $10,101 | |
| Average net assets (000) | | | $9,785 | |
| Ratios to average net assets(d): | | | | |
| Expenses after waivers and/or expense reimbursement | | | 1.30% | (e) |
| Expenses before waivers and/or expense reimbursement | | | 13.37% | (e) |
| Net investment loss | | | (.68)% | (e) |
| Portfolio turnover rate | | | 15% | (f) |
(a) Total return does not consider the effect of sales load. Total return is calculated assuming a purchase of a share on the first day and a sale on the last day of each period reported and includes reinvestment of dividends and distributions. Total returns may reflect adjustments to conform to generally accepted accounting principles. Total returns for periods less than one full year are not annualized.
(b) Commencement of operations.
(c) Calculated based on the average shares outstanding during the period.
(d) Does not include expenses of the underlying portfolio in which the Series invests.
(e) Annualized.
(f) Not annualized.
See Notes to Financial Statements.
| | | | |
| Class Z Shares | |
| | | September 16,
2014(b)
through
October 31,
2014(c) | |
| Per Share Operating Performance: | | | | |
| Net Asset Value, Beginning of Period | | | $10.00 | |
| Income (loss) from investment operations: | | | | |
| Net investment loss | | | (.01 | ) |
| Net realized and unrealized gain on investments | | | .10 | |
| Total from investment operations | | | .09 | |
| Net Asset Value, end of period | | | $10.09 | |
| Total Return(a): | | | .90% | |
| | | | |
| Ratios/Supplemental Data: | |
| Net assets, end of period (000) | | | $10 | |
| Average net assets (000) | | | $10 | |
| Ratios to average net assets(d): | | | | |
| Expenses after waivers and/or expense reimbursement | | | 1.30% | (e) |
| Expenses before waivers and/or expense reimbursement | | | 13.51% | (e) |
| Net investment loss | | | (.67)% | (e) |
| Portfolio turnover rate | | | 15% | (f) |
(a) Total return is calculated assuming a purchase of a share on the first day and a sale on the last day of each period reported and includes reinvestment of dividends and distributions. Total returns may reflect adjustments to conform to generally accepted accounting principles. Total returns for periods less than one full year are not annualized.
(b) Commencement of operations.
(c) Calculated based on the average shares outstanding during the period.
(d) Does not include expenses of the underlying portfolio in which the Series invests.
(e) Annualized.
(f) Not annualized.
See Notes to Financial Statements.
| | | | |
| Prudential Jennison Emerging Markets Equity Fund | | | 33 | |
Report of Independent Registered Public
Accounting Firm
The Board of Directors and Shareholders
Prudential World Fund, Inc.:
We have audited the accompanying statement of assets and liabilities of Prudential Jennison Emerging Markets Equity Fund, a series of Prudential World Fund, Inc., (hereafter referred to as the “Fund”), including the portfolio of investments, as of October 31, 2014, and the related statements of operations and changes in net assets and the financial highlights for the period September 16, 2014 (commencement of operations) to October 31, 2014. These financial statements and financial highlights are the responsibility of the Fund’s management. Our responsibility is to express an opinion on these financial statements and financial highlights based on our audit.
We conducted our audit in accordance with the standards of the Public Company Accounting Oversight Board (United States). Those standards require that we plan and perform the audit to obtain reasonable assurance about whether the financial statements and financial highlights are free of material misstatement. An audit includes examining, on a test basis, evidence supporting the amounts and disclosures in the financial statements. Our procedures included confirmation of securities owned as of October 31, 2014, by correspondence with the custodian, transfer agent and brokers or by other appropriate auditing procedures when replies from brokers were not received. An audit also includes assessing the accounting principles used and significant estimates made by management, as well as evaluating the overall financial statement presentation. We believe that our audit provides a reasonable basis for our opinion.
In our opinion, the financial statements and financial highlights referred to above present fairly, in all material respects, the financial position of the Fund as of October 31, 2014, and the results of its operations, the changes in its net assets and the financial highlights for the period September 16, 2014 (commencement of operations) to October 31, 2014, in conformity with U.S. generally accepted accounting principles.

New York, New York
December 16, 2014
INFORMATION ABOUT BOARD MEMBERS AND OFFICERS
(Unaudited)
Information about Board Members and Officers of the Fund is set forth below. Board Members who are not deemed to be “interested persons” of the Fund, as defined in the 1940 Act, are referred to as “Independent Board Members.” Board Members who are deemed to be “interested persons” of the Fund are referred to as “Interested Board Members.” The Board Members are responsible for the overall supervision of the operations of the Fund and perform the various duties imposed on the directors of investment companies by the 1940 Act. The Board in turn elects the Officers, who are responsible for administering the day-to-day operations of the Fund.
| | | | |
| Independent Board Members(1) |
| | | |
Name, Address, Age Position(s) Portfolios Overseen | | Principal Occupation(s) During Past Five Years | | Other Directorships Held |
Ellen S. Alberding (56) Board Member Portfolios Overseen: 69 | | President and Board Member, The Joyce Foundation (charitable foundation) (since 2002); Vice Chair, City Colleges of Chicago (community college system) (since 2011); Trustee, Skills for America’s Future (national initiative to connect employers to community colleges) (since 2011); Trustee, National Park Foundation (charitable foundation for national park system) (since 2009); Trustee, Economic Club of Chicago (since 2009). | | None. |
Kevin J. Bannon (62) Board Member Portfolios Overseen: 70 | | Managing Director (since April 2008) and Chief Investment Officer (October 2008-November 2013) of Highmount Capital LLC (registered investment adviser); formerly Executive Vice President and Chief Investment Officer (April 1993-August 2007) of Bank of New York Company; President (May 2003-May 2007) of BNY Hamilton Family of Mutual Funds. | | Director of Urstadt Biddle Properties (equity real estate investment trust) (since September 2008). |
Linda W. Bynoe (62) Board Member Portfolios Overseen: 70 | | President and Chief Executive Officer (since March 1995) and formerly Chief Operating Officer (December 1989-February 1995) of Telemat Ltd. (management consulting); formerly Vice President (January 1985-June 1989) at Morgan Stanley & Co (broker-dealer). | | Director of Simon Property Group, Inc. (retail real estate) (May 2003-May 2012); Director of Anixter International, Inc. (communication products distributor) (since January 2006); Director of Northern Trust Corporation (financial services) (since April 2006); Trustee of Equity Residential (residential real estate) (since December 2009). |
Prudential Jennison Emerging Markets Equity Fund
| | | | |
| Independent Board Members(1) |
| | | |
Name, Address, Age Position(s) Portfolios Overseen | | Principal Occupation(s) During Past Five Years | | Other Directorships Held |
Keith F. Hartstein (58) Board Member Portfolios Overseen: 70 | | Retired; Formerly President and Chief Executive Officer (2005-2012), Senior Vice President (2004-2005), Senior Vice President of Sales and Marketing (1997-2004), and various executive management positions (1990-1997), John Hancock Funds, LLC (asset management); Chairman, Investment Company Institute’s Sales Force Marketing Committee (2003-2008). | | None. |
Michael S. Hyland, CFA (69) Board Member Portfolios Overseen: 69 | | Retired (since February 2005); Formerly Senior Managing Director (July 2001-February 2005) of Bear Stearns & Co, Inc.; Global Partner, INVESCO (1999-2001); Managing Director and President of Salomon Brothers Asset Management (1989-1999). | | None. |
Douglas H. McCorkindale (75) Board Member Portfolios Overseen: 69 | | Retired; Formerly Chairman (February 2001-June 2006), Chief Executive Officer (June 2000-July 2005), President (September 1997-July 2005) and Vice Chairman (March 1984-May 2000) of Gannett Co. Inc. (publishing and media). | | Director of Lockheed Martin Corp. (aerospace and defense) (since May 2001). |
Stephen P. Munn (72) Board Member Portfolios Overseen: 70 | | Lead Director (since 2007) and formerly Chairman (1993-2007) of Carlisle Companies Incorporated (manufacturer of industrial products). | | Lead Director (since 2007) of Carlisle Companies Incorporated (manufacturer of industrial products). |
James E. Quinn (62) Board Member Portfolios Overseen: 69 | | Retired; Formerly President (2003-2012) and Director (2003-2008), and Vice Chairman and Director (1998-2003), Tiffany & Company (jewelry retailing); Director, Mutual of America Capital Management Corporation (asset management) (since 1996); Director, Hofstra University (since 2008); Vice Chairman, Museum of the City of New York (since 1994). | | Director of Deckers Outdoor Corporation (footwear manufacturer) (since 2011). |
Richard A. Redeker (71) Board Member & Independent Chair Portfolios Overseen: 70 | | Retired Mutual Fund Senior Executive (44 years); Management Consultant; Director, Mutual Fund Directors Forum (since 2014); Independent Directors Council (organization of 2,800 Independent Mutual Fund Directors)-Executive Committee, Chair of Policy Steering Committee, Governing Council. | | None. |
Visit our website at www.prudentialfunds.com
| | | | |
| Independent Board Members(1) |
| | | |
Name, Address, Age Position(s) Portfolios Overseen | | Principal Occupation(s) During Past Five Years | | Other Directorships Held |
Robin B. Smith (75) Board Member Portfolios Overseen:70 | | Chairman of the Board (since January 2003) of Publishers Clearing House (direct marketing); Member of the Board of Directors of ADLPartner (marketing) (since December 2010); formerly Chairman and Chief Executive Officer (August 1996-January 2003) of Publishers Clearing House. | | Formerly Director of BellSouth Corporation (telecommunications) (1992-2006). |
Stephen G. Stoneburn (71) Board Member Portfolios Overseen: 70 | | Chairman, (since July 2011), President and Chief Executive Officer (since June 1996) of Quadrant Media Corp. (publishing company); formerly President (June 1995-June 1996) of Argus Integrated Media, Inc.; Senior Vice President and Managing Director (January 1993-1995) of Cowles Business Media; Senior Vice President of Fairchild Publications, Inc. (1975-1989). | | None. |
| | | | |
| Interested Board Members(1) |
| | | |
Name, Address, Age Position(s) Portfolios Overseen | | Principal Occupation(s) During Past Five Years | | Other Directorships Held |
Stuart S. Parker (52) Board Member & President Portfolios Overseen: 64 | | President of Prudential Investments LLC (since January 2012); Executive Vice President of Prudential Investment Management Services LLC (since December 2012); Executive Vice President of Jennison Associates LLC and Head of Retail Distribution of Prudential Investments LLC (June 2005-December 2011). | | None. |
Scott E. Benjamin (41) Board Member & Vice President Portfolios Overseen: 70 | | Executive Vice President (since June 2009) of Prudential Investments LLC; Executive Vice President (June 2009-June 2012) and Vice President (since June 2012) of Prudential Investment Management Services LLC; Executive Vice President (since September 2009) of AST Investment Services, Inc.; Senior Vice President of Product Development and Marketing, Prudential Investments (since February 2006); Vice President of Product Development and Product Management, Prudential Investments (2003-2006). | | None. |
Prudential Jennison Emerging Markets Equity Fund
| | | | |
| Interested Board Members(1) |
| | | |
Name, Address, Age Position(s) Portfolios Overseen | | Principal Occupation(s) During Past Five Years | | Other Directorships Held |
Grace C. Torres* (55) Board Member Portfolios Overseen: 65 | | Retired; Formerly Treasurer and Principal Financial and Accounting Officer of the Prudential Investments Funds, Target Funds, Advanced Series Trust, Prudential Variable Contract Accounts and The Prudential Series Fund (1998-June 2014); Assistant Treasurer (March 1999-June 2014) and Senior Vice President (September 1999-June 2014) of Prudential Investments LLC; Assistant Treasurer (May 2003-June 2014) and Vice President (June 2005-June 2014) of AST Investment Services, Inc.; Senior Vice President and Assistant Treasurer (May 2003-June 2014) of Prudential Annuities Advisory Services, Inc. | | None. |
* Note: Prior to her retirement in 2014, Ms. Torres was employed by Prudential Investments LLC. Due to her prior employment, she is considered to be an “interested person” under the 1940 Act. Ms. Torres is a non-management Interested Board Member.
(1) The year that each Board Member joined the Funds’ Board is as follows:
Ellen S. Alberding; 2013; Kevin J. Bannon, 2008; Linda W. Bynoe, 2005; Keith F. Hartstein, 2013; Michael S. Hyland, 2008; Douglas H. McCorkindale, 2003; Stephen P. Munn, 2008; James E. Quinn, 2013; Richard A. Redeker, 2003; Robin B. Smith, 1996; Stephen G. Stoneburn, 1996; Stuart S. Parker, Board Member and President since 2012; Scott E. Benjamin, Board Member since 2010 and Vice President since 2009; Grace C. Torres, 2014.
| | | | |
| Fund Officers(a) |
| | | |
Name, Address and Age Position with Fund | | Principal Occupation(s) During Past Five Years | | Length of Service as Fund Officer |
Raymond A. O’Hara (59) Chief Legal Officer | | Vice President and Corporate Counsel (since July 2010) of Prudential Insurance Company of America (Prudential); Vice President (March 2011-Present) of Pruco Life Insurance Company and Pruco Life Insurance Company of New Jersey; Vice President and Corporate Counsel (March 2011-Present) of Prudential Annuities Life Assurance Corporation; Chief Legal Officer of Prudential Investments LLC (since June 2012); Chief Legal Officer of Prudential Mutual Fund Services LLC (since June 2012) and Corporate Counsel of AST Investment Services, Inc. (since June 2012); formerly Assistant Vice President and Corporate Counsel (September 2008-July 2010) of The Hartford Financial Services Group, Inc.; formerly Associate (September 1980-December 1987) and Partner (January 1988–August 2008) of Blazzard & Hasenauer, P.C. (formerly, Blazzard, Grodd & Hasenauer, P.C.). | | Since 2012 |
Visit our website at www.prudentialfunds.com
| | | | |
| Fund Officers(a) |
| | | |
Name, Address and Age Position with Fund | | Principal Occupation(s) During Past Five Years | | Length of Service as Fund Officer |
Chad A. Earnst (39) Chief Compliance Officer | | Chief Compliance Officer (September 2014-Present) of Prudential Investments LLC; Chief Compliance Officer (September 2014-Present) of the Prudential Investments Funds, Target Funds, Advanced Series Trust, The Prudential Series Fund, Prudential’s Gibraltar Fund, Inc., Prudential Global Short Duration High Yield Income Fund, Inc., Prudential Short Duration High Yield Fund, Inc. and Prudential Jennison MLP Income Fund, Inc.; formerly Assistant Director (March 2010-August 2014) of the Asset Management Unit, Division of Enforcement, US Securities & Exchange Commission; Assistant Regional Director (January 2010-August 2014), Branch Chief (June 2006–December 2009) and Senior Counsel (April 2003-May 2006) of the Miami Regional Office, Division of Enforcement, US Securities & Exchange Commission. | | Since 2014 |
Deborah A. Docs (56) Secretary | | Vice President and Corporate Counsel (since January 2001) of Prudential; Vice President (since December 1996) and Assistant Secretary (since March 1999) of Prudential Investments LLC; formerly Vice President and Assistant Secretary (May 2003-June 2005) of AST Investment Services, Inc. | | Since 2004 |
Jonathan D. Shain (56) Assistant Secretary | | Vice President and Corporate Counsel (since August 1998) of Prudential; Vice President and Assistant Secretary (since May 2001) of Prudential Investments LLC; Vice President and Assistant Secretary (since February 2001) of Prudential Mutual Fund Services LLC; formerly Vice President and Assistant Secretary (May 2003-June 2005) of AST Investment Services, Inc. | | Since 2005 |
Claudia DiGiacomo (40) Assistant Secretary | | Vice President and Corporate Counsel (since January 2005) of Prudential; Vice President and Assistant Secretary of Prudential Investments LLC (since December 2005); Associate at Sidley Austin Brown & Wood LLP (1999-2004). | | Since 2005 |
Andrew R. French (52) Assistant Secretary | | Vice President and Corporate Counsel (since February 2010) of Prudential; formerly Director and Corporate Counsel (2006-2010) of Prudential; Vice President and Assistant Secretary (since January 2007) of Prudential Investments LLC; Vice President and Assistant Secretary (since January 2007) of Prudential Mutual Fund Services LLC. | | Since 2006 |
Amanda S. Ryan (36) Assistant Secretary | | Director and Corporate Counsel (since March 2012) of Prudential; Director and Assistant Secretary (since June 2012) of Prudential Investments LLC; Associate at Ropes & Gray LLP (2008-2012). | | Since 2012 |
Theresa C. Thompson (52) Deputy Chief Compliance Officer | | Vice President, Compliance, Prudential Investments LLC (since April 2004); and Director, Compliance, Prudential Investments LLC (2001-2004). | | Since 2008 |
Prudential Jennison Emerging Markets Equity Fund
| | | | |
| Fund Officers(a) |
| | | |
Name, Address and Age Position with Fund | | Principal Occupation(s) During Past Five Years | | Length of Service as Fund Officer |
Richard W. Kinville (46) Anti-Money Laundering Compliance Officer | | Vice President, Corporate Compliance, Anti-Money Laundering Unit (since January 2005) of Prudential; committee member of the American Council of Life Insurers Anti-Money Laundering and Critical Infrastructure Committee (since January 2007); formerly Investigator and Supervisor in the Special Investigations Unit for the New York Central Mutual Fire Insurance Company (August 1994-January 1999); Investigator in AXA Financial’s Internal Audit Department and Manager in AXA’s Anti-Money Laundering Office (January 1999-January 2005); first chair of the American Council of Life Insurers Anti-Money Laundering and Critical Infrastructure Committee (June 2007-December 2009). | | Since 2011 |
M. Sadiq Peshimam (50) Treasurer and Principal Financial and Accounting Officer | | Assistant Treasurer of funds in the Prudential Mutual Fund Complex (2006-2014); Vice President (since 2005) of Prudential Investments LLC. | | Since 2006 |
Peter Parrella (56) Assistant Treasurer | | Vice President (since 2007) and Director (2004-2007) within Prudential Mutual Fund Administration; formerly Tax Manager at SSB Citi Fund Management LLC (1997-2004). | | Since 2007 |
Lana Lomuti (47) Assistant Treasurer | | Vice President (since 2007) and Director (2005-2007), within Prudential Mutual Fund Administration; formerly Assistant Treasurer (December 2007-February 2014) of The Greater China Fund, Inc. | | Since 2014 |
Linda McMullin (53) Assistant Treasurer | | Vice President (since 2011) and Director (2008-2011) within Prudential Mutual Fund Administration. | | Since 2014 |
| (a) | Excludes Mr. Parker and Mr. Benjamin, interested Board Members who also serve as President and Vice President, respectively. |
Explanatory Notes to Tables:
| n | Board Members are deemed to be “Interested,” as defined in the 1940 Act, by reason of their affiliation with Prudential Investments LLC and/or an affiliate of Prudential Investments LLC. |
| n | Unless otherwise noted, the address of all Board Members and Officers is c/o Prudential Investments LLC, Gateway Center Three, 100 Mulberry Street, Newark, New Jersey 07102-4077. |
| n | There is no set term of office for Board Members or Officers. The Board Members have adopted a retirement policy, which calls for the retirement of Board Members on December 31 of the year in which they reach the age of 75. |
| n | “Other Directorships Held” includes only directorships of companies required to register or file reports with the SEC under the 1934 Act (that is, “public companies”) or other investment companies registered under the 1940 Act. |
| n | “Portfolios Overseen” includes all investment companies managed by Prudential Investments LLC. The investment companies for which Prudential Investments LLC serves as manager include the Prudential Investments Mutual Funds, The Prudential Variable Contract Accounts, Target Mutual Funds, Prudential Short Duration High Yield Fund, Inc., Prudential Global Short Duration High Yield Fund, Inc., The Prudential Series Fund, Prudential’s Gibraltar Fund, Inc. and the Advanced Series Trust. |
Visit our website at www.prudentialfunds.com
Approval of Advisory Agreements
Initial Approval of the Fund’s Advisory Agreements
As required by the Investment Company Act of 1940 (the 1940 Act), the Board of Directors (the Board) of Prudential World Fund, Inc. considered the proposed management agreement with Prudential Investments LLC (the Manager) and the proposed subadvisory agreement with Jennison Associates LLC (Jennison or the Subadviser), with respect to the Prudential Jennison Emerging Markets Equity Fund (the Fund) prior to the Fund’s commencement of operations. The Board, including a majority of the Independent Trustees, met on June 9-11, 2014 and approved the agreements for an initial two year period, after concluding that approval of the agreements was in the best interests of the Fund.1
In advance of the meetings, the Board requested and received materials relating to the agreements, and had the opportunity to ask questions and request further information in connection with its consideration.
In approving the agreements, the Board, including the Independent Trustees advised by independent legal counsel, considered the factors it deemed relevant, including the nature, quality and extent of services to be provided to the Fund by the Manager and the Subadviser; any relevant comparable performance and the Subadviser’s qualifications and track record in serving other affiliated mutual funds; the fees proposed to be paid by the Fund to the Manager and by the Manager to the Subadviser under the agreements; and the potential for economies of scale that may be shared with the Fund and its shareholders. In connection with its deliberations, the Board considered information provided by the Manager and the Subadviser at or in advance of the meetings on June 9-11, 2014. The Board also considered information provided by the Manager with respect to other funds managed by the Manager and the Subadviser, which information had been provided throughout the year at regular Board meetings. In their deliberations, the Trustees did not identify any single factor which alone was responsible for the Board’s decision to approve the agreements with respect to the Fund.
The Trustees determined that the overall arrangements between the Fund and the Manager, which will serve as the Fund’s investment manager pursuant to a management agreement, and between the Manager and the Subadviser, which will serve as the Fund’s subadviser pursuant to the terms of a subadvisory agreement, were in the best interests of the Fund in light of the services to be performed and the fees to be charged under the agreements and such other matters as the Trustees considered relevant in the exercise of their business judgment.
| 1 | Grace C. Torres was elected to the Board as of December 2014, and therefore did not participate in the consideration of these approvals. |
Prudential Jennison Emerging Markets Equity Fund
Approval of Advisory Agreements (continued)
The material factors and conclusions that formed the basis for the Trustees’ reaching their determinations to approve the agreements are separately discussed below.
Nature, Quality and Extent of Services
With respect to the Manager, the Board noted that it had received and considered information about the Manager at the June 9-11, 2014 meetings in connection with the renewal of the management agreements between the Manager and the other Prudential Retail Funds. The Board also noted that it received and considered information at other regular meetings throughout the year, regarding the nature, quality and extent of services provided by the Manager. The Board considered the services to be provided by the Manager, including but not limited to the oversight of the Subadviser, as well as the provision of fund recordkeeping, compliance and other services to the Fund. With respect to the Manager’s oversight of the Subadviser, the Board noted that the Manager’s Strategic Investment Research Group, which is a business unit of the Manager, is responsible for monitoring and reporting to the Manager’s senior management on the performance and operations of the Subadviser. The Board also noted that the Manager pays the salaries of all the officers and non-independent Trustees of the Fund. The Board reviewed the qualifications, backgrounds and responsibilities of the Manager’s senior management responsible for the oversight of the Fund and the Subadviser, and was also provided with information pertaining to the Manager’s organizational structure, senior management, investment operations and other relevant information. The Board further noted that it received favorable compliance reports from the Fund’s Chief Compliance Officer as to the Manager. The Board noted that it had concluded that it was satisfied with the nature, quality and extent of the services provided by the Manager to the other Prudential Retail Funds and determined that it was reasonable to conclude that the nature, quality and extent of services to be provided by the Manager under the management agreement for the Fund would be similar in nature to those provided under the other management agreements.
With respect to the Subadviser, the Board noted that it had received and considered information about the Subadviser at the June 9-11, 2014 meetings in connection with the renewal of the subadvisory agreements between the Manager and the Subadviser with respect to other Prudential Retail Funds. The Board also noted that it received and considered information at other regular meetings throughout the year, regarding the nature, quality and extent of services provided by the Subadviser. The Board considered, among other things, the qualifications, background and experience of the Subadviser’s portfolio managers who will be responsible for the day-to-day management of the Fund’s portfolio, as well as information on the Subadviser’s organizational structure, senior management, investment operations and other
Visit our website at www.prudentialfunds.com
relevant information. The Board further noted that it received favorable compliance reports from the Fund’s Chief Compliance Officer as to the Subadviser. The Board noted that it was satisfied with the nature, quality and extent of services provided by the Subadviser with respect to the other Prudential Retail Funds served by the Subadviser and determined that it was reasonable to conclude that the nature, quality and extent of services to be provided by the Subadviser under the subadvisory agreement for the Fund would be similar in nature to those provided under the other subadvisory agreements. The Board noted that the Subadviser is affiliated with the Manager.
Performance
Because the Fund had not yet commenced operations and the actual asset base of the Fund has not yet been determined, no investment performance for the Fund existed for Board review. Nevertheless, as noted above, the Board did consider the background and professional experience of the proposed portfolio management team for the Fund. The Manager will provide information relating to performance to the Board in connection with future annual reviews of the management agreement and subadvisory agreement.
Fee Rates
The Board considered the proposed management fees of 1.05% of the Fund’s average daily net assets to be paid by the Fund to the Manager and the proposed subadvisory fees at the annual rate of 0.55% of the Fund’s average daily net assets to be paid by the Manager to the Subadviser.
The Board considered information provided by the Manager comparing the Fund’s proposed management fee rate and total expenses for Class A shares to the Lipper 15(c) Peer Group. The Board noted that the Fund’s contractual management fee was in the second quartile of the Lipper Peer Group (first quartile being the lowest fee). The Board further noted that the anticipated net total expenses for Class A shares were in the first quartile of the Lipper Peer Group (first quartile being the lowest expenses).
The Board noted that the Fund’s other expenses were expected to be higher than those of other Prudential Retail Funds due to the type of investments required by the Fund’s investment strategy and the Fund’s initial asset size. The Board further noted that the Manager had contractually agreed through February 29, 2016 to limit net annual Fund operating expenses (exclusive of distribution and service (12b-1) fees, taxes, interest, brokerage, extraordinary and certain other expenses) of each class of shares to 1.30% of the Fund’s average daily net assets.
Prudential Jennison Emerging Markets Equity Fund
Approval of Advisory Agreements (continued)
The Board noted that the Fund’s contractual management fee of 1.05% was the same as the median fee of the Peer Group and that the Fund’s actual management fee is expected to be 0.17%, due to waivers and reimbursements required to support the net total expense limitation, given that the Fund’s initial assets will be low. The Board concluded that the proposed management fee and total expenses were reasonable in light of the services to be provided.
Profitability
Because the Fund had not yet commenced operations and the actual asset base of the Fund has not yet been determined, the Board noted that there was no historical profitability information with respect to the Fund to be reviewed. The Board noted that it would review profitability information in connection with the annual renewal of the advisory and subadvisory agreements.
Economies of Scale
Because the Fund had not yet commenced operations and the actual asset base of the Fund has not yet been determined, the Board noted that there was no historical information regarding economies of scale with respect to the Fund to be reviewed. The Board noted that it would review such information in connection with the annual renewal of the advisory and subadvisory agreements.
Other Benefits to the Manager and the Subadviser
The Board considered potential “fall-out” or ancillary benefits anticipated to be received by the Manager and the Subadviser. The Board concluded that any potential benefits to be derived by the Manager were similar to benefits derived by the Manager in connection with its management of the other Prudential Retail Funds, which are reviewed on an annual basis. The Board also concluded that any potential benefits to be derived by the Subadviser were consistent with those generally derived by subadvisers to the Prudential Retail Funds, and that those benefits are reviewed on an annual basis. The Board concluded that any potential benefits derived by the Manager and the Subadviser were consistent with the types of benefits generally derived by investment managers and subadvisers to mutual funds.
* * *
After full consideration of these factors, the Board concluded that the approval of the agreements was in the interests of the Fund.
Visit our website at www.prudentialfunds.com
| | | | |
| n MAIL | | n TELEPHONE | | n WEBSITE |
Gateway Center Three 100 Mulberry Street Newark, NJ 07102 | | (800) 225-1852 | | www.prudentialfunds.com |
|
| PROXY VOTING |
| The Board of Trustees of the Fund has delegated to the Fund’s investment subadviser the responsibility for voting any proxies and maintaining proxy recordkeeping with respect to the Fund. A description of these proxy voting policies and procedures is available without charge, upon request, by calling (800) 225-1852. Information regarding how the Fund voted proxies relating to portfolio securities during the most recent 12-month period ended June 30 is available on the Fund’s website and on the Securities and Exchange Commission’s website. |
|
| TRUSTEES |
| Ellen S. Alberding • Kevin J. Bannon • Scott E. Benjamin • Linda W. Bynoe • Keith F. Hartstein • Michael S. Hyland • Douglas H. McCorkindale • Stephen P. Munn • Stuart S. Parker • James E. Quinn • Richard A. Redeker • Robin B. Smith • Stephen G. Stoneburn • Grace C. Torres |
|
| OFFICERS |
| Stuart S. Parker, President • Scott E. Benjamin, Vice President • M. Sadiq Peshimam, Treasurer and Principal Financial and Accounting Officer • Raymond A. O’Hara, Chief Legal Officer • Chad A. Earnst, Chief Compliance Officer • Deborah A. Docs, Secretary • Theresa C. Thompson, Deputy Chief Compliance Officer • Richard W. Kinville, Anti-Money Laundering Compliance Officer • Jonathan D. Shain, Assistant Secretary • Claudia DiGiacomo, Assistant Secretary • Amanda S. Ryan, Assistant Secretary • Andrew R. French, Assistant Secretary • Peter Parrella, Assistant Treasurer • Lana Lomuti, Assistant Treasurer • Linda McMullin, Assistant Treasurer |
| | | | |
| MANAGER | | Prudential Investments LLC | | Gateway Center Three
100 Mulberry Street
Newark, NJ 07102 |
|
| INVESTMENT SUBADVISER | | Jennison Associates LLC | | 466 Lexington Avenue
New York, NY 10017 |
|
| DISTRIBUTOR | | Prudential Investment
Management Services LLC | | Gateway Center Three
100 Mulberry Street
Newark, NJ 07102 |
|
| CUSTODIAN | | The Bank of New York Mellon | | One Wall Street
New York, NY 10286 |
|
| TRANSFER AGENT | | Prudential Mutual Fund
Services LLC | | PO Box 9658
Providence, RI 02940 |
|
| INDEPENDENT REGISTERED PUBLIC ACCOUNTING FIRM | | KPMG LLP | | 345 Park Avenue
New York, NY 10154 |
|
| FUND COUNSEL | | Willkie Farr & Gallagher LLP | | 787 Seventh Avenue
New York, NY 10019 |
|
| An investor should consider the investment objectives, risks, charges, and expenses of the Fund carefully before investing. The prospectus and summary prospectus contain this and other information about the Fund. An investor may obtain a prospectus and summary prospectus by visiting our website at www.prudentialfunds.com or by calling (800) 225-1852. The prospectus and summary prospectus should be read carefully before investing. |
|
| E-DELIVERY |
| To receive your mutual fund documents online, go to www.prudentialfunds.com/edelivery and enroll. Instead of receiving printed documents by mail, you will receive notification via email when new materials are available. You can cancel your enrollment or change your email address at any time by visiting the website address above. |
|
| SHAREHOLDER COMMUNICATIONS WITH TRUSTEES |
| Shareholders can communicate directly with the Board of Trustees by writing to the Chair of the Board, Prudential Jennison Emerging Markets Equity Fund, Prudential Investments, Attn: Board of Trustees, 100 Mulberry Street, Gateway Center Three, Newark, NJ 07102. Shareholders can communicate directly with an individual Director by writing to the same address. Communications are not screened before being delivered to the addressee. |
|
| AVAILABILITY OF PORTFOLIO SCHEDULE |
| The Fund files its complete schedule of portfolio holdings with the Securities and Exchange Commission for the first and third quarters of each fiscal year on Form N-Q. The Fund’s Forms N-Q are available on the Commission’s website at www.sec.gov. The Fund’s Forms N-Q may also be reviewed and copied at the Commission’s Public Reference Room in Washington, D.C. Information on the operation and location of the Public Reference Room may be obtained by calling (202) 551-8090. The Fund’s schedule of portfolio holdings is also available on the Fund’s website as of the end of each month. |
|
| The Fund’s Statement of Additional Information contains additional information about the Fund’s Trustees and is available without charge, upon request, by calling (800) 225-1852. |
Mutual Funds:
| | | | |
| ARE NOT INSURED BY THE FDIC OR ANY FEDERAL GOVERNMENT AGENCY | | MAY LOSE VALUE | | ARE NOT A DEPOSIT OF OR GUARANTEED BY ANY BANK OR ANY BANK AFFILIATE |

PRUDENTIAL JENNISON EMERGING MARKETS EQUITY FUND
| | | | | | | | |
| SHARE CLASS | | A | | C | | Q | | Z |
| NASDAQ | | PDEAX | | PDECX | | PDEQX | | PDEZX |
| CUSIP | | 743969644 | | 743969636 | | 743969628 | | 743969610 |
MF225E 0270926-00001-00
Item 2 – Code of Ethics — See Exhibit (a)
As of the end of the period covered by this report, the registrant has adopted a code of ethics (the “Section 406 Standards for Investment Companies – Ethical Standards for Principal Executive and Financial Officers”) that applies to the registrant’s Principal Executive Officer and Principal Financial Officer; the registrant’s Principal Financial Officer also serves as the Principal Accounting Officer.
The registrant hereby undertakes to provide any person, without charge, upon request, a copy of the code of ethics. To request a copy of the code of ethics, contact the registrant 800-225-1852, and ask for a copy of the Section 406 Standards for Investment Companies - Ethical Standards for Principal Executive and Financial Officers.
Item 3 – Audit Committee Financial Expert –
The registrant’s Board has determined that Mr. Stephen P. Munn, member of the Board’s Audit Committee is an “audit committee financial expert,” and that he is “independent,” for purposes of this Item.
Item 4 – Principal Accountant Fees and Services –
(a) Audit Fees
For the fiscal years ended October 31, 2014 and October 31, 2013, KPMG LLP (“KPMG”), the Registrant’s principal accountant, billed the Registrant $222,320 and $193,000, respectively, for professional services rendered for the audit of the Registrant’s annual financial statements or services that are normally provided in connection with statutory and regulatory filings.
(b) Audit-Related Fees
None.
(c) Tax Fees
None.
(d) All Other Fees
None.
(e) (1) Audit Committee Pre-Approval Policies and Procedures
THE PRUDENTIAL MUTUAL FUNDS
AUDIT COMMITTEE POLICY
on
Pre-Approval of Services Provided by the Independent Accountants
The Audit Committee of each Prudential Mutual Fund is charged with the responsibility to monitor the independence of the Fund’s independent accountants. As part of this responsibility, the Audit Committee must pre-approve any independent accounting firm’s engagement to render audit and/or permissible non-audit services, as required by law. In evaluating a proposed engagement of the independent accountants, the Audit Committee will assess the effect that the engagement might reasonably be expected to have on the accountant’s independence. The Committee’s evaluation will be based on:
| | • | | a review of the nature of the professional services expected to be provided, |
| | • | | a review of the safeguards put into place by the accounting firm to safeguard independence, and |
| | • | | periodic meetings with the accounting firm. |
Policy for Audit and Non-Audit Services Provided to the Funds
On an annual basis, the scope of audits for each Fund, audit fees and expenses, and audit-related and non-audit services (and fees proposed in respect thereof) proposed to be performed by the Fund’s independent accountants will be presented by the Treasurer and the independent accountants to the Audit Committee for review and, as appropriate, approval prior to the initiation of such services. Such presentation shall be accompanied by confirmation by both the Treasurer and the independent accountants that the proposed services will not adversely affect the independence of the independent accountants. Proposed services shall be described in sufficient detail to enable the Audit Committee to assess the appropriateness of such services and fees, and the compatibility of the provision of such services with the auditor’s independence. The Committee shall receive periodic reports on the progress of the audit and other services which are approved by the Committee or by the Committee Chair pursuant to authority delegated in this Policy.
The categories of services enumerated under “Audit Services”, “Audit-related Services”, and “Tax Services” are intended to provide guidance to the Treasurer and the independent accountants as to those categories of services which the Committee believes are generally consistent with the independence of the independent accountants and which the Committee (or the Committee Chair) would expect upon the presentation of specific proposals to pre-approve. The enumerated categories are not intended as an exclusive list of audit, audit-related or tax services, which the Committee (or the Committee Chair) would consider for pre-approval.
Audit Services
The following categories of audit services are considered to be consistent with the role of the Fund’s independent accountants:
| | Ø | Annual Fund financial statement audits |
| | Ø | Seed audits (related to new product filings, as required) |
| | Ø | SEC and regulatory filings and consents |
Audit-related Services
The following categories of audit-related services are considered to be consistent with the role of the Fund’s independent accountants:
| | Ø | Accounting consultations |
| | Ø | Fund merger support services |
| | Ø | Agreed Upon Procedure Reports |
| | Ø | Other Internal Control Reports |
Individual audit-related services that fall within one of these categories and are not presented to the Audit Committee as part of the annual pre-approval process will be subject to pre-approval by the Committee Chair (or any other Committee member on whom this responsibility has been delegated) so long as the estimated fee for those services does not exceed $50,000.
Tax Services
The following categories of tax services are considered to be consistent with the role of the Fund’s independent accountants:
| | Ø | Tax compliance services related to the filing or amendment of the following: |
| | ¡ | Federal, state and local income tax compliance; and, |
| | ¡ | Sales and use tax compliance |
| | Ø | Timely RIC qualification reviews |
| | Ø | Tax distribution analysis and planning |
| | Ø | Tax authority examination services |
| | Ø | Tax appeals support services |
| | Ø | Accounting methods studies |
| | Ø | Fund merger support services |
| | Ø | Tax consulting services and related projects |
Individual tax services that fall within one of these categories and are not presented to the Audit Committee as part of the annual pre-approval process will be subject to pre-approval by the Committee Chair (or any other Committee member on whom this responsibility has been delegated) so long as the estimated fee for those services does not exceed $50,000.
Other Non-audit Services
Certain non-audit services that the independent accountants are legally permitted to render will be subject to pre-approval by the Committee or by one or more Committee members to whom the Committee has delegated this authority and who will report to the full Committee any pre-approval decisions made pursuant to this Policy. Non-audit services presented for pre-approval pursuant to this paragraph will be accompanied by a confirmation from both the Treasurer and the independent accountants that the proposed services will not adversely affect the independence of the independent accountants.
Proscribed Services
The Fund’s independent accountants will not render services in the following categories of non-audit services:
| | Ø | Bookkeeping or other services related to the accounting records or financial statements of the Fund |
| | Ø | Financial information systems design and implementation |
| | Ø | Appraisal or valuation services, fairness opinions, or contribution-in-kind reports |
| | Ø | Internal audit outsourcing services |
| | Ø | Management functions or human resources |
| | Ø | Broker or dealer, investment adviser, or investment banking services |
| | Ø | Legal services and expert services unrelated to the audit |
| | Ø | Any other service that the Public Company Accounting Oversight Board determines, by regulation, is impermissible. |
Pre-approval of Non-Audit Services Provided to Other Entities Within the Prudential Fund Complex
Certain non-audit services provided to Prudential Investments LLC or any of its affiliates that also provide ongoing services to the Prudential Mutual Funds will be subject to pre-approval by the Audit Committee. The only non-audit services provided to these entities that will require pre-approval are those related directly to the operations and financial reporting of the Funds. Individual projects that are not presented to the Audit Committee as part of the annual pre-approval process will be subject to pre-approval by the Committee Chair (or any other Committee member on whom this responsibility has been delegated) so long as the estimated fee for those services does not exceed $50,000. Services presented for pre-approval pursuant to this paragraph will be accompanied by a confirmation from both the Treasurer and the independent accountants that the proposed services will not adversely affect the independence of the independent accountants.
Although the Audit Committee will not pre-approve all services provided to Prudential Investments LLC and its affiliates, the Committee will receive an annual report from the Fund’s independent accounting firm showing the aggregate fees for all services provided to Prudential Investments and its affiliates.
(e) (2) Percentage of services referred to in 4(b) – 4(d) that were approved by the audit committee –
Not applicable.
(f) Percentage of hours expended attributable to work performed by other than full time employees of principal accountant if greater than 50%.
The percentage of hours expended on the principal accountant’s engagement to audit the registrant’s financial statements for the most recent fiscal year that were attributed to work performed by persons other than the principal accountant’s full-time, permanent employees was 0%.
(g) Non-Audit Fees
Not applicable to Registrant for the fiscal years 2014 and 2013. The aggregate non-audit fees billed by KPMG for services rendered to the registrant’s investment adviser and any entity controlling, controlled by, or under common control with the investment adviser that provides ongoing services to the registrant for the fiscal years 2014 and 2013 was $0 and $0, respectively.
(h) Principal Accountant’s Independence
Not applicable as KPMG has not provided non-audit services to the registrant’s investment adviser and any entity controlling, controlled by, or under common control with the investment adviser that provides ongoing services to the registrant that were not pre-approved pursuant to Rule 2-01(c)(7)(ii) of Regulation S-X.
| | | | |
| | |
| Item 5 | | – | | Audit Committee of Listed Registrants – Not applicable. |
| | |
| Item 6 | | – | | Schedule of Investments – The schedule is included as part of the report to shareholders filed under Item 1 of this Form. |
| | |
| Item 7 | | – | | Disclosure of Proxy Voting Policies and Procedures for Closed-End Management Investment Companies – Not applicable. |
| | |
| Item 8 | | – | | Portfolio Managers of Closed-End Management Investment Companies – Not applicable. |
| | |
| Item 9 | | – | | Purchases of Equity Securities by Closed-End Management Investment Company and Affiliated Purchasers – Not applicable. |
| | |
| Item 10 | | – | | Submission of Matters to a Vote of Security Holders – Not applicable. |
| | |
| Item 11 | | – | | Controls and Procedures |
| | (a) | It is the conclusion of the registrant’s principal executive officer and principal financial officer that the effectiveness of the registrant’s current disclosure controls and procedures (such disclosure controls and procedures having been evaluated within 90 days of the date of this filing) provide reasonable assurance that the information required to be disclosed by the registrant has been recorded, processed, summarized and reported within the time period specified in the Commission’s rules and forms and that the information required to be disclosed by the registrant has been accumulated and communicated to the registrant’s principal executive officer and principal financial officer in order to allow timely decisions regarding required disclosure. |
| | (b) | There has been no significant change in the registrant’s internal control over financial reporting that occurred during the registrant’s most recent fiscal quarter of the period covered by this report that has materially affected, or is likely to materially affect, the registrant’s internal control over financial reporting. |
| | | | |
| | |
| Item 12 | | – | | Exhibits |
| | |
| | (a) | | (1) Code of Ethics – Attached hereto as Exhibit EX-99.CODE-ETH |
| | |
| | | | (2) Certifications pursuant to Section 302 of the Sarbanes-Oxley Act – Attached hereto as Exhibit EX-99.CERT. |
| | |
| | | | (3) Any written solicitation to purchase securities under Rule 23c-1. – Not applicable. |
| | |
| | (b) | | Certifications pursuant to Section 906 of the Sarbanes-Oxley Act – Attached hereto as Exhibit EX-99.906CERT. |
SIGNATURES
Pursuant to the requirements of the Securities Exchange Act of 1934 and the Investment Company Act of 1940, the registrant has duly caused this report to be signed on its behalf by the undersigned, thereunto duly authorized.
| | | | |
| Registrant: | | Prudential World Fund, Inc. | | |
| | |
| By: | | /s/Deborah A. Docs | | |
| | Deborah A. Docs | | |
| | Secretary | | |
| | |
| Date: | | December 18, 2014 | | |
|
Pursuant to the requirements of the Securities Exchange Act of 1934 and the Investment Company Act of 1940, this report has been signed below by the following persons on behalf of the registrant and in the capacities and on the dates indicated. |
| | |
| By: | | /s/Stuart S. Parker | | |
| | Stuart S. Parker | | |
| | President and Principal Executive Officer | | |
| | |
| Date: | | December 18, 2014 | | |
| | |
| By: | | /s/M. Sadiq Peshimam | | |
| | M. Sadiq Peshimam | | |
| | Treasurer and Principal Financial and Accounting Officer | | |
| | |
| Date: | | December 18, 2014 | | |