UNITED STATES
SECURITIES AND EXCHANGE COMMISSION
Washington, D.C. 20549
FORM N-CSR
CERTIFIED SHAREHOLDER REPORT OF REGISTERED MANAGEMENT
INVESTMENT COMPANIES
| | |
| Investment Company Act file number: | | 811-03981 |
| |
| Exact name of registrant as specified in charter: | | Prudential World Fund, Inc. |
| |
| Address of principal executive offices: | | 655 Broad Street, 17th Floor |
| | Newark, New Jersey 07102 |
| |
| Name and address of agent for service: | | Deborah A. Docs |
| | 655 Broad Street, 17th Floor |
| | Newark, New Jersey 07102 |
| |
| Registrant’s telephone number, including area code: | | 800-225-1852 |
| |
| Date of fiscal year end: | | 10/31/2016 |
| |
| Date of reporting period: | | 10/31/2016 |
Item 1 – Reports to Stockholders
PRUDENTIAL INVESTMENTS, A PGIM BUSINESS | MUTUAL FUNDS
Prudential QMA International Equity Fund
| | |
| ANNUAL REPORT | | OCTOBER 31, 2016 |

| | |
To enroll in e-delivery, go to prudentialfunds.com/edelivery | |  |
|
| Objective: Long-term growth of capital |
Highlights
PRUDENTIAL QMA INTERNATIONAL EQUITY FUND
| • | | Strong stock selection in the financials sector, led by bank companies, added to performance. Among countries, the Fund benefited from effective stock picking in Germany’s consumer discretionary sector. |
| • | | Valuation factors detracted from the Fund’s performance overall, with growth (analyst revisions), financial momentum, quality, and profitability signals generating mixed results. |
| • | | The Fund was hampered by stock selection in the industrials sector, most notably in Japan, while China was the largest country detractor due to stock picking in the health care, information technology, and utilities sectors. (For a complete list of holdings, refer to the Portfolio of Investments section of this report.) |
This report is not authorized for distribution to prospective investors unless preceded or accompanied by a current prospectus.
The views expressed in this report and information about the Fund’s portfolio holdings are for the period covered by this report and are subject to change thereafter.
Mutual funds are distributed by Prudential Investment Management Services LLC, a Prudential Financial company and member SIPC. QMA is the primary business name of Quantitative Management Associates LLC, a wholly owned subsidiary of PGIM, Inc. (PGIM), a Prudential Financial company. © 2016 Prudential Financial, Inc. and its related entities. The Prudential logo and the Rock symbol are service marks of Prudential Financial, Inc. and its related entities, registered in many jurisdictions worldwide.
| | |
| 2 | | Visit our website at prudentialfunds.com |
Letter from the President

Dear Shareholder:
We hope you find the annual report for the Prudential QMA International Equity Fund informative and useful. The report covers performance for the 12-month period that ended October 31, 2016.
During the reporting period, the US economy experienced modest growth. Labor markets were healthy, and consumer confidence rose. The housing market brightened somewhat, as momentum continued for the new home market. The Federal Reserve kept interest rates unchanged at its September meeting, but pointed to the strong possibility of a rate hike in December. Internationally, concerns over Brexit—the term used to represent Britain’s decision to leave the European Union—remained in the spotlight.
Equity markets in the US were firmly in positive territory at the end of the reporting period, as US stocks posted strong gains. European stocks struggled earlier, but found some traction in the third quarter. Asian markets also advanced, and emerging markets rose sharply.
US fixed income markets experienced overall gains. High yield bonds posted very strong results. Corporate bonds and Treasuries also performed well. Accommodative monetary policy by central banks helped lift global bond markets.
Given the uncertainty in today’s investment environment, we believe that active professional portfolio management offers a potential advantage. Active managers often have the knowledge and flexibility to find the best investment opportunities in the most challenging markets.
Even so, it’s best if investment decisions are based on your long-term goals rather than on short-term market and economic developments. We also encourage you to work with an experienced financial advisor who can help you set goals, determine your tolerance for risk, build a diversified plan that’s right for you, and make adjustments when necessary.
By having Prudential Investments help you address your goals, you gain the advantage of asset managers that also manage money for many major corporations and pension funds around the world. That means you benefit from the same expertise, innovation, and attention to risk demanded by today’s most sophisticated investors.
Thank you for choosing our family of funds.
Sincerely,

Stuart S. Parker, President
Prudential QMA International Equity Fund
December 15, 2016
| | | | |
| Prudential QMA International Equity Fund | | | 3 | |
Your Fund’s Performance (unaudited)
Performance data quoted represent past performance. Past performance does not guarantee future results. The investment return and principal value of an investment will fluctuate, so that an investor’s shares, when redeemed, may be worth more or less than their original cost. Current performance may be lower or higher than the past performance data quoted. An investor may obtain performance data as of the most recent month-end by visiting our website at www.prudentialfunds.com or by calling (800) 225-1852.
| | | | | | | | | | |
| Cumulative Total Returns (Without Sales Charges) as of 10/31/16 | |
| | One Year (%) | | | Five Years (%) | | | | Ten Years (%) | |
| Class A | | –0.93 | | | 25.53 | | | | –3.58 | |
| Class B | | –1.55 | | | 21.24 | | | | –10.08 | |
| Class C | | –1.56 | | | 21.05 | | | | –10.21 | |
| Class Z | | –0.44 | | | 27.45 | | | | –0.89 | |
| MSCI All Country World Ex-US Index | | 0.22 | | | 19.55 | | | | 17.34 | |
| Lipper International Multi-Cap Core Funds Average | | –1.96 | | | 28.62 | | | | 14.46 | |
| | | | | | | | | | |
| Average Annual Total Returns (With Sales Charges) as of 9/30/16 | |
| | One Year (%) | | | Five Years (%) | | | | Ten Years (%) | |
| Class A | | 0.37 | | | 5.73 | | | | –0.46 | |
| Class B | | 0.35 | | | 6.02 | | | | –0.62 | |
| Class C | | 4.53 | | | 6.17 | | | | –0.62 | |
| Class Z | | 6.51 | | | 7.25 | | | | 0.36 | |
| MSCI All Country World Ex-US Index | | 9.26 | | | 6.04 | | | | 2.16 | |
| Lipper International Multi-Cap Core Funds Average | | 6.28 | | | 7.42 | | | | 1.78 | |
| | | | | | | | | | |
| Average Annual Total Returns (With Sales Charges) as of 10/31/16 | |
| | One Year (%) | | | Five Years (%) | | | | Ten Years (%) | |
| Class A | | –6.37 | | | 3.47 | | | | –0.93 | |
| Class B | | –6.43 | | | 3.75 | | | | –1.06 | |
| Class C | | –2.53 | | | 3.89 | | | | –1.07 | |
| Class Z | | –0.44 | | | 4.97 | | | | –0.09 | |
| | |
| 4 | | Visit our website at prudentialfunds.com |
| | | | | | |
| Average Annual Total Returns (Without Sales Charges) as of 10/31/16 |
| | One Year (%) | | Five Years (%) | | Ten Years (%) |
| Class A | | –0.93 | | 4.65 | | –0.36 |
| Class B | | –1.55 | | 3.93 | | –1.06 |
| Class C | | –1.56 | | 3.89 | | –1.07 |
| Class Z | | –0.44 | | 4.97 | | –0.09 |
Growth of a $10,000 Investment
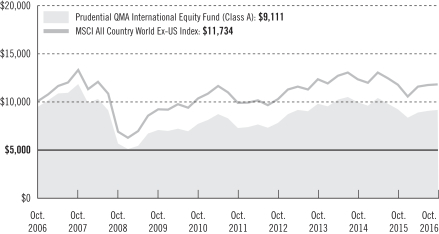
The graph compares a $10,000 investment in the Prudential QMA International Equity Fund (Class A shares) with a similar investment in the MSCI All Country World Ex-US Index by portraying the initial account values at the beginning of the 10-year period for Class A shares (October 31, 2006) and the account values at the end of the current fiscal year (October 31, 2016) as measured on a quarterly basis. For purposes of the graph, and unless otherwise indicated, it has been assumed that (a) the maximum applicable front-end sales charge was deducted from the initial $10,000 investment in Class A shares; (b) all recurring fees (including management fees) were deducted; and (c) all dividends and distributions were reinvested. The line graph provides information for Class A shares only. As indicated in the tables provided earlier, performance for Class B, Class C, and Class Z shares will vary due to the differing charges and expenses applicable to each share class (as indicated in the following paragraphs). Without waiver of fees and/or expense reimbursement, if any, the Fund’s returns would have been lower.
| | | | |
| Prudential QMA International Equity Fund | | | 5 | |
Your Fund’s Performance (continued)
Past performance does not predict future performance. Total returns and the ending account values in the graph include changes in share price and reinvestment of dividends and capital gains distributions in a hypothetical investment for the periods shown. The Fund’s total returns do not reflect the deduction of income taxes on an individual’s investment. Taxes may reduce your actual investment returns on income or gains paid by the Fund or any gains you may realize if you sell your shares.
Source: Prudential Investments LLC and Lipper Inc.
The returns in the tables do not reflect the deduction of taxes that a shareholder would pay on Fund distributions or following the redemption of Fund shares. The average annual total returns take into account applicable sales charges, which are described for each share class in the table below.
| | | | | | | | |
| | | Class A | | Class B* | | Class C | | Class Z |
| Maximum initial sales charge | | 5.50% of the public offering price | | None | | None | | None |
Contingent deferred sales charge (CDSC) (as a percentage of the lower of original purchase
price or net asset value at redemption) | | 1% on sales of $1 million or more made within 12 months of purchase | | 5% (Yr.1) 4% (Yr.2) 3% (Yr.3) 2% (Yr.4) 1% (Yr.5) 1% (Yr.6) 0% (Yr.7) | | 1% on sales made within 12 months of purchase | | None |
Annual distribution and service (12b-1) fees
(shown as a percentage of average daily net assets) | | .30% | | 1% | | 1% | | None |
*Class B shares are closed to all purchase activity and no additional Class B shares may be purchased or acquired except by exchange from Class B shares of another Fund or through dividend or capital gains reinvestment.
Benchmark Definitions
MSCI All Country World Ex-US Index—The Morgan Stanley Capital International All Country World ex-US Index (MSCI ACWI ex-US Index) is an unmanaged free float-adjusted market-capitalization weighted index that is designed to measure the equity market performance of developed and emerging markets, excluding the US. The MSCI ACWI ex-US Index consists of 45 country indexes. The developed market country indexes included are: Australia, Austria, Belgium, Canada, Denmark, Finland, France, Germany, Hong Kong, Ireland, Israel, Italy, Japan, Netherlands, New Zealand, Norway, Portugal, Singapore, Spain, Sweden, Switzerland, and the United Kingdom. The emerging market country indexes included are: Brazil, Chile, China, Colombia, Czech Republic, Egypt, Greece, Hungary, India, Indonesia, Korea, Malaysia, Mexico, Peru, Philippines, Poland, Qatar, Russia, South Africa, Taiwan, Thailand, Turkey, and United Arab Emirates.
| | |
| 6 | | Visit our website at prudentialfunds.com |
Lipper International Multi-Cap Core Funds Average—The Lipper International Multi-Cap Core Funds Average (Lipper Average) is based on the average return of all funds in the Lipper International Multi-Cap Core Funds category for the periods noted. Funds in the Lipper Average are funds that, by portfolio practice, invest in a variety of market-capitalization ranges without concentrating 75% of their equity assets in any one market-capitalization range over an extended period of time. International multi-cap core funds typically have above-average characteristics compared to the MSCI EAFE Index.
Investors cannot invest directly in an index or average. The returns for the Index would be lower if they included the effects of sales charges, operating expenses of a mutual fund, or taxes. Returns for the Lipper Average reflect the deduction of operating expenses, but not sales charges or taxes.
| | | | |
Five Largest Holdings expressed as a
percentage of net assets as of 10/31/16 (%) | |
Samsung Electronics Co. Ltd., Technology Hardware, Storage & Peripherals | | | 1.6 | |
| Roche Holding AG, Pharmaceuticals | | | 1.5 | |
| HSBC Holdings PLC, Banks | | | 1.5 | |
| British American Tobacco PLC, Tobacco | | | 1.2 | |
| BP PLC, Oil, Gas & Consumable Fuels | | | 1.1 | |
Holdings reflect only long-term investments and are subject to change.
| | | | |
Five Largest Industries expressed as a
percentage of net assets as of 10/31/16 (%) | |
Banks | | | 14.8 | |
| Pharmaceuticals | | | 7.5 | |
| Oil, Gas & Consumable Fuels | | | 6.7 | |
| Insurance | | | 4.1 | |
| Diversified Telecommunication Services | | | 4.0 | |
Industry weightings reflect only long-term investments and are subject to change.
| | | | |
| Prudential QMA International Equity Fund | | | 7 | |
Strategy and Performance Overview
How did the Fund perform?
The Prudential QMA International Equity Fund’s Class A shares returned –0.93% for the 12-month period ended October 31, 2016, lagging the 0.22% return of the MSCI All Country World Ex-US (MSCI ACWI Ex-US) Index (the Index) and outperforming the –1.96% decline of the Lipper International Multi-Cap Core Funds Average.
What were market conditions?
| • | | During the fourth quarter of 2015 when the reporting period began, investors generally focused on the plunge in oil prices and the condition of China’s economy and financial markets. Developed markets stocks advanced for the quarter overall, though European equities posted mixed results as the eurozone continued to face deep structural problems. In Japan, the economy appeared to be bouncing back from recession-like conditions seen in the middle of 2016. Performance varied among emerging markets countries, many of which rely on commodity exports. |
| • | | The first quarter of 2016 was a tale in two parts. At the beginning of the quarter, risk aversion increased amid deteriorating economic data in developed and emerging markets countries, a further drop in commodity prices, and heightened volatility in global financial markets. By March, investor sentiment had improved, commodity prices had regained some ground, and the number of negative economic surprises had diminished. Nevertheless, developed markets stocks posted a decline for the quarter as a whole. Emerging markets stocks generated a solid gain. |
| • | | During the second quarter, fears about the global economy receded in the face of considerable stimulus by China’s policymakers, stronger-than-anticipated first-quarter European economic growth, and signs that the Japanese economy was doing somewhat better than expected. In late June, the UK’s surprise vote to leave the European Union, commonly known as “Brexit,” increased market volatility. Although the Brexit decision raised considerable uncertainty, the macroeconomic fallout appeared to be manageable, if not limited. However, Switzerland, Spain, and Ireland have significant banking system exposure to the UK. Overall, developed markets stocks retreated during the quarter, while emerging markets stocks recorded a modestly positive return. |
| • | | In the third quarter, developed markets and emerging markets stocks gained ground. European stocks performed particularly well, led by Austria, Germany, and France. Countries in the Pacific region turned in mixed results, with positive performance in New Zealand, Hong Kong, Japan, and Australia. |
What worked?
| • | | During the reporting period, the Fund benefited from strong stock selection in the financials sector, with holdings in the banking industry contributing most positively to performance versus the Index. Investments in the capital markets industry and among |
| | |
| 8 | | Visit our website at prudentialfunds.com |
| | real estate investment trusts (REITs) also increased relative returns. Within the telecommunications services sector, the Fund’s overweight in Japan was advantageous. |
| • | | In terms of countries, Fund performance was strongest in Germany, largely because of effective stock selection in the consumer discretionary sector, driven by investments and an overweight in textiles, apparel & luxury goods, and holdings among automobile stocks. Positioning in Brazil, more specifically the Fund’s overweights in the financials and materials sectors, added to relative results. In addition, the Fund was helped by its exposure to Australia, primarily stock selection, and an overweight in the materials sector. |
What didn’t work?
| • | | When evaluating slower-growing stocks, QMA places a heavier emphasis on valuation factors, such as price-to-earnings ratios and dividend yield. For faster-growing stocks, QMA’s analyst revisions factor places a heavier weighting on information about earnings and sales. Quality is also considered important across the growth spectrum. This allows the Fund to potentially add value throughout the full range of slow- to fast-growing companies, while maintaining a core profile. |
| • | | During the period, valuation factors detracted from the Fund’s returns in developed markets. Growth, financial momentum and profitability, and quality factors generated mixed results, after having outperformed in the fourth quarter 2015. |
| • | | Valuation factors also detracted from the Fund’s performance in the emerging markets, especially at the beginning of 2016, although their effectiveness improved toward the end of the period. Growth, financial momentum and profitability, and quality factors provided mixed results. |
| • | | In terms of sectors, the Fund’s performance was weakest in industrials due to difficult stock selection in Japan and Spain, as well as an underweight position in Canada. Within energy, the Fund’s losses were led by stock selection and an underweight in Canada, followed an underweight position in Brazil and stock picking in Norway and Poland. In the information technology sector, the Fund was hurt by stock selection in China, Israel, and Taiwan. |
| • | | Among countries, China was the largest detractor from relative returns as effective stock selection in the financials sector was more than offset by weak stock picking in the health care, information technology, and utilities sectors. The Fund also underperformed in Canada because of difficult stock selection and underweight positions in the energy sector and metals & mining stocks. Another laggard was Japan where the Fund was hampered by stock choices in the industrials sector, an overweight in the banking industry, and selection among household durable names. |
| | | | |
| Prudential QMA International Equity Fund | | | 9 | |
Strategy and Performance Overview (continued)
The percentage points shown in the tables identify each security’s positive or negative contribution to the Fund’s return, which is the sum of all contributions by individual holdings.
| | | | | | |
| Top Contributors (%) | | Top Detractors (%) |
| Fortescue Metals Group Ltd | | 0.51 | | Universal Health International Group Holding Ltd. | | –0.36 |
| Banco Santander (Brasil) SA | | 0.48 | | Mitsubishi UFJ Financial Group, Inc. | | –0.39 |
| adidas AG | | 0.49 | | Teva Pharmaceutical Industries Limited | | –0.33 |
| Itausa—Investimentos Itau SA Pfd | | 0.46 | | Abengoa S.A. Class B | | –0.20 |
| Evolution Mining Limited | | 0.29 | | Cia Energetica de Minas Gerais Cemig CMIG Pfd | | –0.25 |
Current outlook
| • | | QMA will continue to manage the Fund as a risk-controlled portfolio, using a bottom-up process that focuses on factors within four broad groups: valuation, growth (analyst revisions), financial momentum/profitability, and quality. |
| • | | All overweight and underweight positions in the Fund will be the result of the stock selection process and not a reflection of sentiment on any particular market segment. |
| | |
| 10 | | Visit our website at prudentialfunds.com |
Fees and Expenses (unaudited)
As a shareholder of the Fund, you incur two types of costs: (1) transaction costs, including sales charges (loads) on purchase payments and redemptions, as applicable, and (2) ongoing costs, including management fees, distribution, and/or service (12b-1) fees, and other Fund expenses, as applicable. This example is intended to help you understand your ongoing costs (in dollars) of investing in the Fund and to compare these costs with the ongoing costs of investing in other mutual funds.
The example is based on an investment of $1,000 invested on May 1, 2016, at the beginning of the period, and held through the six-month period ended October 31, 2016. The example is for illustrative purposes only; you should consult the Prospectus for information on initial and subsequent minimum investment requirements.
Actual Expenses
The first line for each share class in the table on the following page provides information about actual account values and actual expenses. You may use the information on this line, together with the amount you invested, to estimate the expenses that you paid over the period. Simply divide your account value by $1,000 (for example, an $8,600 account value ÷ $1,000 = 8.6), then multiply the result by the number on the first line under the heading “Expenses Paid During the Six-Month Period” to estimate the expenses you paid on your account during this period.
Hypothetical Example for Comparison Purposes
The second line for each share class in the table on the following page provides information about hypothetical account values and hypothetical expenses based on the Fund’s actual expense ratio and an assumed rate of return of 5% per year before expenses, which is not the Fund’s actual return. The hypothetical account values and expenses may not be used to estimate the actual ending account balance or expenses you paid for the period. You may use this information to compare the ongoing costs of investing in the Fund and other funds. To do so, compare this 5% hypothetical example with the 5% hypothetical examples that appear in the shareholder reports of the other funds.
The Fund’s transfer agent may charge additional fees to holders of certain accounts that are not included in the expenses shown in the table on the following page. These fees apply to individual retirement accounts (IRAs) and Section 403(b) accounts. As of the close of the six-month period covered by the table, IRA fees included an annual maintenance fee of $15 per account (subject to a maximum annual maintenance fee of $25 for all accounts held by the same shareholder). Section 403(b) accounts are charged an annual $25 fiduciary maintenance fee. Some of the fees may vary in amount, or may be waived, based on your total account balance or the number of Prudential Investments funds, including the Fund, that you own. You should consider the additional fees that were charged to your
| | | | |
| Prudential QMA International Equity Fund | | | 11 | |
Fees and Expenses (continued)
Fund account over the six-month period when you estimate the total ongoing expenses paid over the period and the impact of these fees on your ending account value, as these additional expenses are not reflected in the information provided in the expense table. Additional fees have the effect of reducing investment returns.
Please note that the expenses shown in the table are meant to highlight your ongoing costs only and do not reflect any transactional costs such as sales charges (loads). Therefore, the second line for each share class in the table is useful in comparing ongoing costs only and will not help you determine the relative total costs of owning different funds. In addition, if these transactional costs were included, your costs would have been higher.
| | | | | | | | | | | | | | | | | | |
Prudential QMA
International
Equity Fund | | Beginning Account
Value
May 1, 2016 | | | Ending Account
Value
October 31, 2016 | | | Annualized
Expense Ratio
Based on the
Six-Month Period | | | Expenses Paid
During the
Six-Month Period* | |
| Class A | | Actual | | $ | 1,000.00 | | | $ | 1,030.20 | | | | 1.62 | % | | $ | 8.27 | |
| | Hypothetical | | $ | 1,000.00 | | | $ | 1,016.99 | | | | 1.62 | % | | $ | 8.21 | |
| Class B | | Actual | | $ | 1,000.00 | | | $ | 1,026.40 | | | | 2.32 | % | | $ | 11.82 | |
| | Hypothetical | | $ | 1,000.00 | | | $ | 1,013.47 | | | | 2.32 | % | | $ | 11.74 | |
| Class C | | Actual | | $ | 1,000.00 | | | $ | 1,026.50 | | | | 2.32 | % | | $ | 11.82 | |
| | Hypothetical | | $ | 1,000.00 | | | $ | 1,013.47 | | | | 2.32 | % | | $ | 11.74 | |
| Class Z | | Actual | | $ | 1,000.00 | | | $ | 1,031.50 | | | | 1.32 | % | | $ | 6.74 | |
| | | Hypothetical | | $ | 1,000.00 | | | $ | 1,018.50 | | | | 1.32 | % | | $ | 6.70 | |
*Fund expenses (net of fee waivers or subsidies, if any) for each share class are equal to the annualized expense ratio for each share class (provided in the table), multiplied by the average account value over the period, multiplied by the 184 days in the six-month period ended October 31, 2016, and divided by the 366 days in the Fund’s fiscal year ended October 31, 2016 (to reflect the six-month period). Expenses presented in the table include the expenses of any underlying portfolios in which the Fund may invest.
| | |
| 12 | | Visit our website at prudentialfunds.com |
The Fund’s annual expense ratios for the 12-month period ended October 31, 2016, are as follows:
| | | | |
| Class | | Gross Operating Expenses (%) | | Net Operating Expenses (%) |
| A | | 1.66 | | 1.66 |
| B | | 2.36 | | 2.36 |
| C | | 2.36 | | 2.36 |
| Z | | 1.36 | | 1.36 |
Net operating expenses shown above reflect any fee waivers and/or expense reimbursements. Additional information on Fund expenses and any fee waivers and/or expense reimbursements can be found in the “Financial Highlights” tables in this report and in the Notes to the Financial Statements in this report.
| | | | |
| Prudential QMA International Equity Fund | | | 13 | |
Portfolio of Investments
as of October 31, 2016
| | | | | | | | |
| Description | | Shares | | | Value (Note 1) | |
LONG-TERM INVESTMENTS 99.6% | | | | | | | | |
| | |
COMMON STOCKS 96.6% | | | | | | | | |
| | |
Australia 4.5% | | | | | | | | |
Aristocrat Leisure Ltd. | | | 72,001 | | | $ | 838,296 | |
Bluescope Steel Ltd. | | | 103,305 | | | | 612,870 | |
Coca-Cola Amatil Ltd. | | | 140,342 | | | | 1,016,747 | |
Commonwealth Bank of Australia | | | 2,158 | | | | 120,138 | |
Credit Corp. Group Ltd. | | | 26,723 | | | | 359,604 | |
Dexus Property Group, REIT | | | 237,196 | | | | 1,611,303 | |
Fortescue Metals Group Ltd. | | | 479,587 | | | | 2,012,647 | |
Goodman Group, REIT | | | 17,990 | | | | 92,730 | |
Macquarie Group Ltd. | | | 29,364 | | | | 1,775,036 | |
Oz Minerals Ltd. | | | 171,314 | | | | 875,302 | |
Perpetual Ltd. | | | 25,470 | | | | 874,582 | |
Regis Resources Ltd. | | | 239,066 | | | | 602,911 | |
Suncorp Group Ltd. | | | 18,750 | | | | 170,177 | |
Sydney Airport | | | 27,783 | | | | 132,074 | |
Transurban Group | | | 29,211 | | | | 230,490 | |
| | | | | | | | |
| | | | | | | 11,324,907 | |
| | |
Austria 1.2% | | | | | | | | |
Erste Group Bank AG | | | 3,509 | | | | 110,038 | |
Lenzing AG | | | 7,431 | | | | 968,485 | |
UNIQA Insurance Group AG | | | 109,793 | | | | 707,208 | |
voestalpine AG | | | 34,859 | | | | 1,234,923 | |
| | | | | | | | |
| | | | | | | 3,020,654 | |
| | |
Belgium 0.1% | | | | | | | | |
Anheuser-Busch InBev SA/NV | | | 1,473 | | | | 169,057 | |
| | |
Brazil 1.3% | | | | | | | | |
Banco Santander Brasil SA | | | 265,100 | | | | 2,188,404 | |
Smiles SA | | | 56,100 | | | | 1,026,391 | |
| | | | | | | | |
| | | | | | | 3,214,795 | |
| | |
Canada 5.5% | | | | | | | | |
Bank of Montreal | | | 35,200 | | | | 2,240,119 | |
Bank of Nova Scotia (The) | | | 16,500 | | | | 886,692 | |
Canadian National Railway Co. | | | 1,600 | | | | 100,583 | |
CCL Industries, Inc. (Class B Stock) | | | 600 | | | | 106,706 | |
CGI Group, Inc.* | | | 2,600 | | | | 123,497 | |
Genworth MI Canada, Inc.(a) | | | 33,000 | | | | 716,685 | |
Magna International, Inc. | | | 6,000 | | | | 246,343 | |
Metro, Inc. | | | 27,800 | | | | 859,307 | |
See Notes to Financial Statements.
| | | | |
| Prudential QMA International Equity Fund | | | 15 | |
Portfolio of Investments (continued)
as of October 31, 2016
| | | | | | | | |
| Description | | Shares | | | Value (Note 1) | |
COMMON STOCKS (Continued) | | | | | | | | |
| | |
Canada (cont’d.) | | | | | | | | |
Open Text Corp. | | | 22,200 | | | $ | 1,378,376 | |
Royal Bank of Canada | | | 42,400 | | | | 2,649,012 | |
Toronto-Dominion Bank (The) | | | 62,800 | | | | 2,849,480 | |
TransCanada Corp. | | | 23,800 | | | | 1,077,415 | |
Turquoise Hill Resources Ltd.* | | | 259,500 | | | | 804,831 | |
| | | | | | | | |
| | | | | | | 14,039,046 | |
| | |
Chile 0.6% | | | | | | | | |
Cencosud SA | | | 389,072 | | | | 1,268,376 | |
Engie Energia Chile SA | | | 200,764 | | | | 356,213 | |
| | | | | | | | |
| | | | | | | 1,624,589 | |
| | |
China 6.0% | | | | | | | | |
Alibaba Group Holding Ltd., ADR*(a) | | | 7,700 | | | | 783,013 | |
Bank of Communications Co. Ltd. (Class H Stock) | | | 2,135,000 | | | | 1,622,757 | |
BYD Electronic International Co. Ltd. | | | 1,092,500 | | | | 859,563 | |
China CITIC Bank Corp. Ltd. (Class H Stock) | | | 1,083,000 | | | | 698,461 | |
China Construction Bank Corp. (Class H Stock) | | | 1,266,000 | | | | 924,493 | |
China Everbright Bank Co. Ltd. (Class H Stock) | | | 744,000 | | | | 339,209 | |
China Lumena New Materials Corp.*(b)(c) | | | 5,060,000 | | | | 6,524 | |
China Railway Group Ltd. (Class H Stock) | | | 129,000 | | | | 99,439 | |
China Telecom Corp. Ltd. (Class H Stock) | | | 792,000 | | | | 408,326 | |
Citic Ltd. | | | 66,000 | | | | 94,708 | |
Guangzhou Automobile Group Co. Ltd. | | | 250,000 | | | | 301,903 | |
Guangzhou R&F Properties Co. Ltd. | | | 802,400 | | | | 1,130,850 | |
Huadian Power International Corp. Ltd. (Class H Stock) | | | 596,000 | | | | 255,441 | |
Huaneng Power International, Inc. (Class H Stock) | | | 1,452,000 | | | | 892,514 | |
JinkoSolar Holding Co. Ltd., ADR*(a) | | | 10,200 | | | | 157,182 | |
Kaisa Group Holdings Ltd.*(a)(b) | | | 1,496,000 | | | | — | |
NetEase, Inc., ADR | | | 1,200 | | | | 308,388 | |
Ping An Insurance Group Co. of China Ltd. (Class H Stock) | | | 245,500 | | | | 1,292,194 | |
Powerlong Real Estate Holdings Ltd. | | | 543,000 | | | | 184,288 | |
Shanghai Pharmaceuticals Holding Co. Ltd. (Class H Stock) | | | 50,500 | | | | 129,953 | |
Sinopec Shanghai Petrochemical Co. Ltd. (Class H Stock) | | | 1,692,000 | | | | 862,503 | |
Tencent Holdings Ltd. | | | 106,000 | | | | 2,809,248 | |
Tianneng Power International Ltd. | | | 266,000 | | | | 240,120 | |
Xinyi Solar Holdings Ltd.(a) | | | 2,064,000 | | | | 764,622 | |
| | | | | | | | |
| | | | | | | 15,165,699 | |
| | |
Colombia 0.3% | | | | | | | | |
Almacenes Exito SA | | | 160,984 | | | | 803,105 | |
See Notes to Financial Statements.
| | | | | | | | |
| Description | | Shares | | | Value (Note 1) | |
COMMON STOCKS (Continued) | | | | | | | | |
| | |
Denmark 1.1% | | | | | | | | |
Novo Nordisk A/S (Class B Stock) | | | 25,422 | | | $ | 905,672 | |
Vestas Wind Systems A/S | | | 25,106 | | | | 2,011,390 | |
| | | | | | | | |
| | | | | | | 2,917,062 | |
| | |
Faroe Islands 0.4% | | | | | | | | |
Bakkafrost P/F | | | 22,630 | | | | 948,814 | |
| | |
Finland 1.7% | | | | | | | | |
Kesko OYJ (Class B Stock) | | | 3,734 | | | | 185,543 | |
Kone OYJ (Class B Stock) | | | 29,832 | | | | 1,372,627 | |
Neste OYJ | | | 2,394 | | | | 103,283 | |
Sponda OYJ | | | 103,438 | | | | 489,725 | |
UPM-Kymmene OYJ | | | 91,926 | | | | 2,138,348 | |
| | | | | | | | |
| | | | | | | 4,289,526 | |
| | |
France 6.5% | | | | | | | | |
Atos SE | | | 1,308 | | | | 135,736 | |
AXA SA | | | 99,025 | | | | 2,234,244 | |
BNP Paribas SA | | | 41,652 | | | | 2,415,131 | |
Orange SA | | | 15,834 | | | | 249,128 | |
Peugeot SA* | | | 92,736 | | | | 1,388,729 | |
Renault SA | | | 8,180 | | | | 711,351 | |
Safran SA | | | 4,517 | | | | 310,822 | |
Sanofi | | | 24,837 | | | | 1,932,795 | |
SEB SA | | | 4,522 | | | | 665,530 | |
Societe Generale SA | | | 48,169 | | | | 1,878,961 | |
Thales SA | | | 1,598 | | | | 150,349 | |
Total SA | | | 46,494 | | | | 2,227,301 | |
Valeo SA | | | 29,094 | | | | 1,678,873 | |
Vinci SA | | | 7,206 | | | | 521,858 | |
| | | | | | | | |
| | | | | | | 16,500,808 | |
| | |
Germany 5.1% | | | | | | | | |
Aareal Bank AG | | | 27,434 | | | | 992,297 | |
adidas AG | | | 12,936 | | | | 2,125,317 | |
Allianz SE | | | 17,794 | | | | 2,777,732 | |
Bayer AG | | | 24,610 | | | | 2,443,531 | |
Deutsche Post AG | | | 13,962 | | | | 432,976 | |
Deutsche Telekom AG | | | 48,567 | | | | 792,385 | |
Evonik Industries AG | | | 3,289 | | | | 103,000 | |
Grammer AG | | | 2,455 | | | | 140,541 | |
Henkel AG & Co. KGaA | | | 2,673 | | | | 294,519 | |
See Notes to Financial Statements.
| | | | |
| Prudential QMA International Equity Fund | | | 17 | |
Portfolio of Investments (continued)
as of October 31, 2016
| | | | | | | | |
| Description | | Shares | | | Value (Note 1) | |
COMMON STOCKS (Continued) | | | | | | | | |
| | |
Germany (cont’d.) | | | | | | | | |
Siemens AG | | | 21,942 | | | $ | 2,493,005 | |
Sixt SE | | | 4,092 | | | | 248,306 | |
| | | | | | | | |
| | | | | | | 12,843,609 | |
| | |
Greece 0.6% | | | | | | | | |
JUMBO SA | | | 73,432 | | | | 1,043,498 | |
Motor Oil Hellas Corinth Refineries SA | | | 34,248 | | | | 410,087 | |
| | | | | | | | |
| | | | | | | 1,453,585 | |
| | |
Hong Kong 3.8% | | | | | | | | |
AIA Group Ltd. | | | 122,200 | | | | 768,761 | |
BOC Hong Kong Holdings Ltd. | | | 431,000 | | | | 1,536,196 | |
China High Speed Transmission Equipment Group Co. Ltd. | | | 869,000 | | | | 900,719 | |
Galaxy Entertainment Group Ltd. | | | 402 | | | | 1,646 | |
Henderson Land Development Co. Ltd. | | | 232,100 | | | | 1,372,924 | |
Kingboard Chemical Holdings Ltd. | | | 67,000 | | | | 198,055 | |
Link REIT (The), REIT | | | 202,000 | | | | 1,437,015 | |
Skyworth Digital Holdings Ltd. | | | 1,132,000 | | | | 730,674 | |
Sun Hung Kai Properties Ltd. | | | 12,000 | | | | 178,694 | |
WH Group Ltd., 144A | | | 1,739,500 | | | | 1,408,815 | |
Wheelock & Co. Ltd. | | | 183,000 | | | | 1,126,202 | |
| | | | | | | | |
| | | | | | | 9,659,701 | |
| | |
Hungary 0.3% | | | | | | | | |
Magyar Telekom Telecommunications PLC | | | 425,746 | | | | 703,915 | |
| | |
India 1.5% | | | | | | | | |
Power Finance Corp. Ltd. | | | 720,476 | | | | 1,345,346 | |
Reliance Industries Ltd., GDR, 144A | | | 36,090 | | | | 1,144,053 | |
Reliance Infrastructure Ltd., GDR | | | 5,869 | | | | 143,497 | |
Rural Electrification Corp. Ltd. | | | 485,226 | | | | 980,647 | |
Tata Motors Ltd., ADR | | | 7,700 | | | | 303,457 | |
| | | | | | | | |
| | | | | | | 3,917,000 | |
| | |
Indonesia 0.4% | | | | | | | | |
Gudang Garam Tbk PT | | | 17,100 | | | | 88,971 | |
Telekomunikasi Indonesia Persero Tbk PT | | | 3,189,400 | | | | 1,029,774 | |
| | | | | | | | |
| | | | | | | 1,118,745 | |
| | |
Ireland 0.3% | | | | | | | | |
Paddy Power Betfair PLC | | | 6,590 | | | | 682,657 | |
See Notes to Financial Statements.
| | | | | | | | |
| Description | | Shares | | | Value (Note 1) | |
COMMON STOCKS (Continued) | | | | | | | | |
| | |
Israel 0.7% | | | | | | | | |
Teva Pharmaceutical Industries Ltd. | | | 40,891 | | | $ | 1,707,844 | |
| | |
Italy 1.3% | | | | | | | | |
Atlantia SpA | | | 6,199 | | | | 151,777 | |
Enel SpA | | | 110,951 | | | | 477,018 | |
Intesa Sanpaolo SpA | | | 213,947 | | | | 496,075 | |
Intesa Sanpaolo SpA-RSP | | | 274,305 | | | | 593,887 | |
Recordati SpA | | | 6,196 | | | | 175,217 | |
Telecom Italia SpA-RSP | | | 1,948,690 | | | | 1,383,282 | |
| | | | | | | | |
| | | | | | | 3,277,256 | |
| | |
Japan 16.3% | | | | | | | | |
ANA Holdings, Inc. | | | 49,000 | | | | 137,630 | |
Astellas Pharma, Inc. | | | 123,100 | | | | 1,827,033 | |
Bandai Namco Holdings, Inc. | | | 5,600 | | | | 167,754 | |
Central Japan Railway Co. | | | 9,800 | | | | 1,666,453 | |
Chubu Electric Power Co., Inc. | | | 8,800 | | | | 129,548 | |
Daiichi Sankyo Co. Ltd. | | | 63,000 | | | | 1,513,842 | |
Daiwa House Industry Co. Ltd. | | | 23,300 | | | | 639,505 | |
East Japan Railway Co. | | | 4,000 | | | | 352,114 | |
Fuji Heavy Industries Ltd. | | | 32,400 | | | | 1,266,079 | |
Fujitsu General Ltd. | | | 7,000 | | | | 160,627 | |
Iida Group Holdings Co. Ltd. | | | 64,600 | | | | 1,248,686 | |
ITOCHU Corp. | | | 125,100 | | | | 1,579,850 | |
Japan Tobacco, Inc. | | | 55,900 | | | | 2,125,325 | |
Kajima Corp. | | | 194,000 | | | | 1,308,248 | |
Kao Corp. | | | 14,500 | | | | 746,120 | |
KDDI Corp. | | | 81,900 | | | | 2,489,201 | |
Koito Manufacturing Co. Ltd. | | | 14,800 | | | | 777,028 | |
Konami Holdings Corp. | | | 30,500 | | | | 1,204,518 | |
Matsumotokiyoshi Holdings Co. Ltd. | | | 16,200 | | | | 834,597 | |
Medipal Holdings Corp. | | | 74,900 | | | | 1,279,757 | |
Mitsubishi Corp. | | | 21,600 | | | | 470,123 | |
Mitsui & Co. Ltd. | | | 70,200 | | | | 972,622 | |
Nippon Telegraph & Telephone Corp. | | | 47,484 | | | | 2,105,291 | |
Nissan Motor Co. Ltd. | | | 171,300 | | | | 1,742,547 | |
Nitori Holdings Co. Ltd. | | | 5,200 | | | | 621,150 | |
North Pacific Bank Ltd. | | | 179,400 | | | | 669,053 | |
NTT DOCOMO, Inc. | | | 15,100 | | | | 379,221 | |
Obayashi Corp. | | | 127,300 | | | | 1,226,308 | |
ORIX Corp. | | | 125,400 | | | | 1,987,139 | |
Penta-ocean Construction Co. Ltd. | | | 52,600 | | | | 313,451 | |
Screen Holdings Co. Ltd. | | | 14,000 | | | | 957,732 | |
See Notes to Financial Statements.
| | | | |
| Prudential QMA International Equity Fund | | | 19 | |
Portfolio of Investments (continued)
as of October 31, 2016
| | | | | | | | |
| Description | | Shares | | | Value (Note 1) | |
COMMON STOCKS (Continued) | | | | | | | | |
| | |
Japan (cont’d.) | | | | | | | | |
Shimizu Corp. | | | 144,000 | | | $ | 1,279,822 | |
Sumitomo Forestry Co. Ltd. | | | 59,800 | | | | 833,029 | |
Sumitomo Mitsui Financial Group, Inc. | | | 55,700 | | | | 1,931,213 | |
Suzuki Motor Corp. | | | 42,600 | | | | 1,518,959 | |
Taisei Corp. | | | 183,000 | | | | 1,371,594 | |
TDK Corp. | | | 1,700 | | | | 117,377 | |
Tokyo Electron Ltd. | | | 3,200 | | | | 288,656 | |
Tosoh Corp. | | | 47,000 | | | | 306,934 | |
Toyota Motor Corp. | | | 16,033 | | | | 930,022 | |
| | | | | | | | |
| | | | | | | 41,476,158 | |
| | |
Malaysia 0.2% | | | | | | | | |
Padini Holdings Bhd | | | 222,100 | | | | 149,784 | |
Unisem M Bhd | | | 684,200 | | | | 415,400 | |
| | | | | | | | |
| | | | | | | 565,184 | |
| | |
Mexico 0.5% | | | | | | | | |
Fresnillo PLC | | | 5,412 | | | | 108,885 | |
Grupo Aeroportuario Del Centro Norte SAB de CV | | | 141,900 | | | | 828,082 | |
Industrias Bachoco SAB de CV | | | 62,300 | | | | 275,292 | |
| | | | | | | | |
| | | | | | | 1,212,259 | |
| | |
Netherlands 2.2% | | | | | | | | |
ING Groep NV | | | 163,321 | | | | 2,143,928 | |
Royal Dutch Shell PLC (Class A Stock) | | | 63,388 | | | | 1,578,814 | |
Royal Dutch Shell PLC (Class B Stock) | | | 61,779 | | | | 1,593,442 | |
Steinhoff International Holdings NV | | | 24,079 | | | | 129,898 | |
Wolters Kluwer NV | | | 2,543 | | | | 98,339 | |
| | | | | | | | |
| | | | | | | 5,544,421 | |
| | |
New Zealand 0.5% | | | | | | | | |
Auckland International Airport Ltd. | | | 196,817 | | | | 926,920 | |
Spark New Zealand Ltd. | | | 49,465 | | | | 129,369 | |
Xero Ltd.* | | | 18,667 | | | | 236,855 | |
| | | | | | | | |
| | | | | | | 1,293,144 | |
| | |
Norway 0.5% | | | | | | | | |
Austevoll Seafood ASA | | | 111,968 | | | | 1,009,506 | |
Marine Harvest ASA | | | 5,868 | | | | 106,482 | |
Yara International ASA | | | 2,796 | | | | 98,767 | |
| | | | | | | | |
| | | | | | | 1,214,755 | |
See Notes to Financial Statements.
| | | | | | | | |
| Description | | Shares | | | Value (Note 1) | |
COMMON STOCKS (Continued) | | | | | | | | |
| | |
Poland 0.8% | | | | | | | | |
Bank Zachodni WBK SA | | | 5,372 | | | $ | 434,064 | |
Ciech SA | | | 20,036 | | | | 326,777 | |
PGE Polska Grupa Energetyczna SA | | | 489,259 | | | | 1,281,907 | |
Polski Koncern Naftowy Orlen SA | | | 6,998 | | | | 138,647 | |
| | | | | | | | |
| | | | | | | 2,181,395 | |
| | |
Portugal 1.0% | | | | | | | | |
Altri SGPS SA | | | 62,920 | | | | 219,243 | |
Galp Energia SGPS SA | | | 103,943 | | | | 1,409,295 | |
Sonae SGPS SA | | | 1,185,540 | | | | 942,568 | |
| | | | | | | | |
| | | | | | | 2,571,106 | |
| | |
Russia 0.9% | | | | | | | | |
Gazprom PAO, ADR | | | 141,081 | | | | 609,470 | |
Lukoil PJSC, ADR | | | 14,482 | | | | 705,997 | |
Magnit PJSC, GDR, RegS | | | 4,245 | | | | 168,484 | |
MMC Norilsk Nickel PJSC, ADR | | | 7,332 | | | | 110,567 | |
Novatek OAO, GDR, RegS | | | 1,343 | | | | 143,567 | |
Rosneft OAO, GDR, RegS | | | 68,985 | | | | 375,968 | |
Surgutneftegas OAO, ADR | | | 23,126 | | | | 99,396 | |
| | | | | | | | |
| | | | | | | 2,213,449 | |
| | |
Singapore 0.1% | | | | | | | | |
DBS Group Holdings Ltd. | | | 16,000 | | | | 172,459 | |
| | |
South Africa 1.4% | | | | | | | | |
Barclays Africa Group Ltd. | | | 50,620 | | | | 587,417 | |
Nedbank Group Ltd. | | | 13,650 | | | | 223,437 | |
Redefine Properties Ltd., REIT | | | 116,473 | | | | 99,665 | |
Standard Bank Group Ltd. | | | 175,413 | | | | 1,862,060 | |
Telkom SA SOC Ltd. | | | 153,073 | | | | 705,589 | |
| | | | | | | | |
| | | | | | | 3,478,168 | |
| | |
South Korea 4.2% | | | | | | | | |
Korea Electric Power Corp. | | | 36,430 | | | | 1,575,986 | |
KT Corp. | | | 53,617 | | | | 1,512,520 | |
LG Uplus Corp. | | | 83,533 | | | | 860,909 | |
Lotte Chemical Corp. | | | 5,180 | | | | 1,301,488 | |
Samsung Electronics Co. Ltd. | | | 2,740 | | | | 3,919,100 | |
Shinhan Financial Group Co. Ltd. | | | 2,941 | | | | 112,505 | |
Sk Holdings Co. Ltd. | | | 546 | | | | 106,514 | |
SK Innovation Co. Ltd. | | | 9,052 | | | | 1,191,554 | |
See Notes to Financial Statements.
| | | | |
| Prudential QMA International Equity Fund | | | 21 | |
Portfolio of Investments (continued)
as of October 31, 2016
| | | | | | | | |
| Description | | Shares | | | Value (Note 1) | |
COMMON STOCKS (Continued) | | | | | | | | |
| | |
South Korea (cont’d.) | | | | | | | | |
Tongyang Life Insurance Co. Ltd. | | | 9,680 | | | $ | 101,415 | |
| | | | | | | | |
| | | | | | | 10,681,991 | |
| | |
Spain 1.6% | | | | | | | | |
Amadeus IT Holding SA | | | 21,741 | | | | 1,023,219 | |
Gamesa Corp. Tecnologica SA | | | 37,077 | | | | 856,054 | |
Industria de Diseno Textil SA | | | 52,851 | | | | 1,844,107 | |
Telefonica SA | | | 33,273 | | | | 338,075 | |
| | | | | | | | |
| | | | | | | 4,061,455 | |
| | |
Sweden 1.4% | | | | | | | | |
Atlas Copco AB (Class A Stock) | | | 55,274 | | | | 1,619,257 | |
Boliden AB | | | 27,230 | | | | 631,095 | |
Electrolux AB (Class B Stock) | | | 3,866 | | | | 91,502 | |
ICA Gruppen AB(a) | | | 34,055 | | | | 1,057,227 | |
Svenska Cellulosa AB SCA (Class B Stock) | | | 10,839 | | | | 306,991 | |
| | | | | | | | |
| | | | | | | 3,706,072 | |
| | |
Switzerland 4.9% | | | | | | | | |
ABB Ltd. | | | 93,380 | | | | 1,926,470 | |
Nestle SA | | | 31,154 | | | | 2,259,098 | |
Novartis AG | | | 34,554 | | | | 2,452,214 | |
Roche Holding AG | | | 16,716 | | | | 3,839,359 | |
Swiss Re AG | | | 21,260 | | | | 1,973,178 | |
| | | | | | | | |
| | | | | | | 12,450,319 | |
| | |
Taiwan 3.9% | | | | | | | | |
Cheng Shin Rubber Industry Co. Ltd. | | | 324,000 | | | | 659,200 | |
Formosa Chemicals & Fibre Corp. | | | 422,000 | | | | 1,252,921 | |
Formosa Petrochemical Corp. | | | 474,000 | | | | 1,582,627 | |
Foxconn Technology Co. Ltd. | | | 567,620 | | | | 1,645,424 | |
Gourmet Master Co. Ltd. | | | 70,350 | | | | 631,320 | |
Grand Pacific Petrochemical | | | 1,041,000 | | | | 580,297 | |
Largan Precision Co. Ltd. | | | 13,000 | | | | 1,533,677 | |
Lite-On Technology Corp. | | | 250,242 | | | | 358,747 | |
Taiwan Semiconductor Manufacturing Co. Ltd. | | | 98,000 | | | | 588,133 | |
Tripod Technology Corp. | | | 410,000 | | | | 970,599 | |
| | | | | | | | |
| | | | | | | 9,802,945 | |
| | |
Thailand 0.5% | | | | | | | | |
Airports of Thailand PCL | | | 9,100 | | | | 99,002 | |
Charoen Pokphand Foods PCL | | | 294,100 | | | | 264,493 | |
See Notes to Financial Statements.
| | | | | | | | |
| Description | | Shares | | | Value (Note 1) | |
COMMON STOCKS (Continued) | | | | | | | | |
| | |
Thailand (cont’d.) | | | | | | | | |
Kiatnakin Bank PCL | | | 342,300 | | | $ | 571,669 | |
SPCG PCL | | | 540,000 | | | | 314,400 | |
| | | | | | | | |
| | | | | | | 1,249,564 | |
| | |
Turkey 1.2% | | | | | | | | |
Aygaz AS | | | 176,711 | | | | 624,468 | |
Eregli Demir VE Celik Fabrikalari TAS | | | 600,040 | | | | 815,876 | |
Koza Altin Isletmeleri AS*(a) | | | 155,243 | | | | 884,349 | |
Petkim Petrokimya Holding AS | | | 109,748 | | | | 149,120 | |
Trakya Cam Sanayii AS | | | 866,255 | | | | 713,956 | |
| | | | | | | | |
| | | | | | | 3,187,769 | |
| | |
United Kingdom 10.6% | | | | | | | | |
3i Group PLC | | | 104,032 | | | | 852,775 | |
AstraZeneca PLC | | | 3,019 | | | | 169,050 | |
BP PLC | | | 490,546 | | | | 2,899,976 | |
British American Tobacco PLC | | | 51,029 | | | | 2,924,635 | |
Coca-Cola European Partners PLC | | | 2,645 | | | | 101,794 | |
Compass Group PLC | | | 24,320 | | | | 440,055 | |
DCC PLC | | | 1,259 | | | | 102,432 | |
Diageo PLC | | | 59,123 | | | | 1,573,656 | |
GlaxoSmithKline PLC | | | 96,972 | | | | 1,915,624 | |
HSBC Holdings PLC | | | 508,421 | | | | 3,829,003 | |
Imperial Brands PLC | | | 46,542 | | | | 2,251,332 | |
J. Sainsbury PLC | | | 357,244 | | | | 1,095,330 | |
JD Sports Fashion PLC | | | 46,830 | | | | 870,684 | |
Legal & General Group PLC | | | 135,323 | | | | 346,192 | |
National Grid PLC | | | 106,789 | | | | 1,389,093 | |
Reckitt Benckiser Group PLC | | | 10,885 | | | | 973,782 | |
RELX PLC | | | 67,731 | | | | 1,209,013 | |
Safestore Holdings PLC, REIT | | | 26,109 | | | | 114,600 | |
Unilever NV, CVA | | | 23,956 | | | | 1,001,988 | |
Worldpay Group PLC, 144A | | | 361,287 | | | | 1,255,633 | |
WPP PLC | | | 72,931 | | | | 1,583,561 | |
| | | | | | | | |
| | | | | | | 26,900,208 | |
| | |
United States 0.7% | | | | | | | | |
lululemon athletica, Inc.* | | | 48 | | | | 2,748 | |
Mobileye NV* | | | 30,700 | | | | 1,141,426 | |
Shire PLC | | | 11,632 | | | | 656,777 | |
| | | | | | | | |
| | | | | | | 1,800,951 | |
| | | | | | | | |
TOTAL COMMON STOCKS
(cost $221,215,542) | | | | | | $ | 245,146,146 | |
| | | | | | | | |
See Notes to Financial Statements.
| | | | |
| Prudential QMA International Equity Fund | | | 23 | |
Portfolio of Investments (continued)
as of October 31, 2016
| | | | | | | | |
| Description | | Shares | | | Value (Note 1) | |
EXCHANGE TRADED FUNDS 0.2% | | | | | | | | |
iShares MSCI EAFE Index Fund | | | 7,800 | | | $ | 450,996 | |
iShares MSCI Emerging Markets Index Fund | | | 3,200 | | | | 118,848 | |
| | | | | | | | |
TOTAL EXCHANGE TRADED FUNDS
(cost $491,546) | | | | | | | 569,844 | |
| | | | | | | | |
| | |
PREFERRED STOCKS 2.8% | | | | | | | | |
| | |
Brazil 1.9% | | | | | | | | |
Banco Bradesco SA (PRFC) | | | 215,210 | | | | 2,256,604 | |
Braskem SA (PRFC) | | | 212,700 | | | | 1,888,445 | |
Itausa—Investimentos Itau SA (PRFC) | | | 216,770 | | | | 639,716 | |
| | | | | | | | |
| | | | | | | 4,784,765 | |
| | |
Colombia 0.1% | | | | | | | | |
Grupo Aval Acciones y Valores SA (PRFC) | | | 691,621 | | | | 285,225 | |
| | |
Germany 0.7% | | | | | | | | |
Volkswagen AG (PRFC) | | | 13,649 | | | | 1,881,872 | |
| | |
South Korea 0.1% | | | | | | | | |
Samsung Electronics Co. Ltd. (PRFC) | | | 131 | | | | 150,620 | |
| | | | | | | | |
TOTAL PREFERRED STOCKS
(cost $5,119,437) | | | | | | | 7,102,482 | |
| | | | | | | | |
TOTAL LONG-TERM INVESTMENTS
(cost $226,826,525) | | | | | | | 252,818,472 | |
| | | | | | | | |
| | |
SHORT-TERM INVESTMENTS 1.9% | | | | | | | | |
| | |
AFFILIATED MUTUAL FUNDS | | | | | | | | |
Prudential Investment Portfolios 2 - Prudential Core Ultra Short Bond Fund(d) | | | 134 | | | | 134 | |
Prudential Investment Portfolios 2 - Prudential Institutional Money Market Fund
(cost $4,766,513; includes $4,763,332 of cash collateral for securities on loan)(d)(e) | | | 4,766,249 | | | | 4,767,202 | |
| | | | | | | | |
TOTAL SHORT-TERM INVESTMENTS
(cost $4,766,647)(Note 3) | | | | | | | 4,767,336 | |
| | | | | | | | |
TOTAL INVESTMENTS 101.5%
(cost $231,593,172)(Note 5) | | | | | | | 257,585,808 | |
Liabilities in excess of other assets (1.5)% | | | | | | | (3,819,096 | ) |
| | | | | | | | |
NET ASSETS 100.0% | | | | | | $ | 253,766,712 | |
| | | | | | | | |
The following abbreviations are used in the annual report:
144A—Security was purchased pursuant to Rule 144A under the Securities Act of 1933 and may not be resold subject to that rule except to qualified institutional buyers. Unless otherwise noted, 144A securities are deemed to be liquid.
See Notes to Financial Statements.
RegS—Regulation S. Security was purchased pursuant to Regulation S and may not be offered, sold or delivered within the United States or to, or for the account or benefit of, U.S. persons, except pursuant to an exemption from, or in a transaction not subject to, the registration requirements of the Securities Act of 1933.
ADR—American Depositary Receipt
CVA—Certificate Van Aandelen (Bearer)
EAFE—Europe, Australasia and Far East
GDR—Global Depositary Receipt
MSCI—Morgan Stanley Capital International
PRFC—Preference Shares
REIT—Real Estate Investment Trust
RSP—Risparimo (Savings Shares)
| * | Non-income producing security. |
| (a) | All or a portion of security is on loan. The aggregate market value of such securities, including those sold and pending settlement, is $4,177,833; cash collateral of $4,763,332 (included in liabilities) was received with which the Series purchased highly liquid short-term investments. Securities on loan are subject to contractual netting arrangements. |
| (b) | Indicates a Level 3 security. The aggregate value of Level 3 securities is $6,524 and 0.0% of net assets. |
| (c) | Indicates a security or securities that have been deemed illiquid. (unaudited) |
| (d) | Prudential Investments LLC, the manager of the Fund, also serves as manager of the Prudential Investment Portfolios 2 - Prudential Core Ultra Short Bond Fund and the Prudential Investment Portfolios 2 - Prudential Institutional Money Market Fund. |
| (e) | Represents security purchased with cash collateral received for securities on loan and includes dividend reinvestment. |
Various inputs are used in determining the value of the Series’ investments. These inputs are summarized in the three broad levels listed below.
Level 1—quoted prices generally in active markets for identical securities.
Level 2—quoted prices for similar securities, interest rates and yield curves, prepayment speeds, foreign currency exchange rates and other observable inputs.
Level 3—unobservable inputs for securities valued in accordance with Board approved fair valuation procedures.
The following is a summary of the inputs used as of October 31, 2016 in valuing such portfolio securities:
| | | | | | | | | | | | |
| | | Level 1 | | | Level 2 | | | Level 3 | |
Investments in Securities | | | | | | | | | | | | |
Common Stocks | | | | | | | | | | | | |
Australia | | $ | — | | | $ | 11,324,907 | | | $ | — | |
Austria | | | — | | | | 3,020,654 | | | | — | |
Belgium | | | 169,057 | | | | — | | | | — | |
Brazil | | | 3,214,795 | | | | — | | | | — | |
Canada | | | 14,039,046 | | | | — | | | | — | |
Chile | | | 1,624,589 | | | | — | | | | — | |
China | | | 1,248,583 | | | | 13,910,592 | | | | 6,524 | |
See Notes to Financial Statements.
| | | | |
| Prudential QMA International Equity Fund | | | 25 | |
Portfolio of Investments (continued)
as of October 31, 2016
| | | | | | | | | | | | |
| | | Level 1 | | | Level 2 | | | Level 3 | |
Common Stocks (continued) | | | | | | | | | | | | |
Colombia | | $ | 803,105 | | | $ | — | | | $ | — | |
Denmark | | | — | | | | 2,917,062 | | | | — | |
Faroe Islands | | | — | | | | 948,814 | | | | — | |
Finland | | | — | | | | 4,289,526 | | | | — | |
France | | | — | | | | 16,500,808 | | | | — | |
Germany | | | — | | | | 12,843,609 | | | | — | |
Greece | | | — | | | | 1,453,585 | | | | — | |
Hong Kong | | | — | | | | 9,659,701 | | | | — | |
Hungary | | | — | | | | 703,915 | | | | — | |
India | | | 1,591,007 | | | | 2,325,993 | | | | — | |
Indonesia | | | — | | | | 1,118,745 | | | | — | |
Ireland | | | — | | | | 682,657 | | | | — | |
Israel | | | — | | | | 1,707,844 | | | | — | |
Italy | | | — | | | | 3,277,256 | | | | — | |
Japan | | | — | | | | 41,476,158 | | | | — | |
Malaysia | | | — | | | | 565,184 | | | | — | |
Mexico | | | 1,103,374 | | | | 108,885 | | | | — | |
Netherlands | | | — | | | | 5,544,421 | | | | — | |
New Zealand | | | — | | | | 1,293,144 | | | | — | |
Norway | | | — | | | | 1,214,755 | | | | — | |
Poland | | | — | | | | 2,181,395 | | | | — | |
Portugal | | | — | | | | 2,571,106 | | | | — | |
Russia | | | 2,213,449 | | | | — | | | | — | |
Singapore | | | — | | | | 172,459 | | | | — | |
South Africa | | | — | | | | 3,478,168 | | | | — | |
South Korea | | | — | | | | 10,681,991 | | | | — | |
Spain | | | — | | | | 4,061,455 | | | | — | |
Sweden | | | — | | | | 3,706,072 | | | | — | |
Switzerland | | | — | | | | 12,450,319 | | | | — | |
Taiwan | | | — | | | | 9,802,945 | | | | — | |
Thailand | | | — | | | | 1,249,564 | | | | — | |
Turkey | | | — | | | | 3,187,769 | | | | — | |
United Kingdom | | | — | | | | 26,900,208 | | | | — | |
United States | | | 1,144,174 | | | | 656,777 | | | | — | |
Exchange Traded Funds | | | | | | | | | | | | |
United States | | | 569,844 | | | | — | | | | — | |
Preferred Stocks | | | | | | | | | | | | |
Brazil | | | 4,784,765 | | | | — | | | | — | |
Colombia | | | 285,225 | | | | — | | | | — | |
Germany | | | — | | | | 1,881,872 | | | | — | |
South Korea | | | — | | | | 150,620 | | | | — | |
Affiliated Mutual Funds | | | 4,767,336 | | | | — | | | | — | |
| | | | | | | | | | | | |
Total | | $ | 37,558,349 | | | $ | 220,020,935 | | | $ | 6,524 | |
| | | | | | | | | | | | |
During the period, there were no Level transfers between Level 1 and Level 2 to report.
See Notes to Financial Statements.
The industry classification of investments and liabilities in excess of other assets shown as a percentage of net assets as of October 31, 2016 were as follows (unaudited):
| | | | |
Banks | | | 14.8 | % |
Pharmaceuticals | | | 7.5 | |
Oil, Gas & Consumable Fuels | | | 6.7 | |
Insurance | | | 4.1 | |
Diversified Telecommunication Services | | | 4.0 | |
Automobiles | | | 3.9 | |
Metals & Mining | | | 3.4 | |
Chemicals | | | 2.9 | |
Tobacco | | | 2.9 | |
Food & Staples Retailing | | | 2.8 | |
Food Products | | | 2.6 | |
Technology Hardware, Storage & Peripherals | | | 2.5 | |
Construction & Engineering | | | 2.3 | |
Electrical Equipment | | | 2.2 | |
Real Estate Management & Development | | | 2.0 | |
Affiliated Mutual Funds (including 1.9% of collateral for securities on loan) | | | 1.9 | |
Specialty Retail | | | 1.7 | |
Diversified Financial Services | | | 1.7 | |
Electric Utilities | | | 1.6 | |
Household Durables | | | 1.6 | |
Auto Components | | | 1.6 | |
Software | | | 1.5 | |
Internet Software & Services | | | 1.5 | |
Capital Markets | | | 1.4 | |
Equity Real Estate Investment Trusts (REITs) | | | 1.4 | |
Semiconductors & Semiconductor Equipment | | | 1.2 | |
Trading Companies & Distributors | | | 1.2 | |
Machinery | | | 1.1 | |
Wireless Telecommunication Services | | | 1.1 | |
Beverages | | | 1.1 | |
Electronic Equipment, Instruments & Components | | | 1.1 | % |
Hotels, Restaurants & Leisure | | | 1.1 | |
IT Services | | | 1.1 | |
Industrial Conglomerates | | | 1.0 | |
Media | | | 1.0 | |
Transportation Infrastructure | | | 1.0 | |
Paper & Forest Products | | | 1.0 | |
Road & Rail | | | 0.9 | |
Textiles, Apparel & Luxury Goods | | | 0.8 | |
Personal Products | | | 0.7 | |
Thrifts & Mortgage Finance | | | 0.7 | |
Household Products | | | 0.6 | |
Independent Power & Renewable Electricity Producers | | | 0.6 | |
Health Care Providers & Services | | | 0.6 | |
Multi-Utilities | | | 0.6 | |
Professional Services | | | 0.5 | |
Communications Equipment | | | 0.3 | |
Building Products | | | 0.3 | |
Biotechnology | | | 0.3 | |
Gas Utilities | | | 0.2 | |
Exchange Traded Fund | | | 0.2 | |
Aerospace & Defense | | | 0.2 | |
Air Freight & Logistics | | | 0.2 | |
Consumer Finance | | | 0.1 | |
Leisure Products | | | 0.1 | |
Airlines | | | 0.1 | |
| | | | |
| | | 101.5 | |
Liabilities in excess of other assets | | | (1.5 | ) |
| | | | |
| | | 100.0 | % |
The Series invested in various derivative instruments during the reporting period. The primary type of risk associated with these derivative instruments is equity risk.
The effect of derivative instruments on the Series financial position and financial performance as reflected in Statement of Assets and Liabilities and Statement of Operations is presented in the summary below.
The Series did not hold any derivative instruments as of October 31, 2016, accordingly, no derivative positions were presented in the Statement of Assets and Liabilities.
See Notes to Financial Statements.
| | | | |
| Prudential QMA International Equity Fund | | | 27 | |
Portfolio of Investments (continued)
as of October 31, 2016
The effects of derivative instruments on the Statement of Operations for the year ended October 31, 2016 are as follows:
| | | | |
Amount of Realized Gain or (Loss) on Derivatives Recognized in Income | |
Derivatives not accounted for as hedging
instruments, carried at fair value | | Rights(1) | |
Equity contracts | | $ | 48,338 | |
| | | | |
|
Change in Unrealized Appreciation or (Depreciation) on Derivatives Recognized in Income | |
Derivatives not accounted for as hedging
instruments, carried at fair value | | Rights(2) | |
Equity contracts | | $ | — | |
| | | | |
| (1) | Included in net realized gain (loss) on investment transactions in the Statement of Operations. |
| (2) | Included in net change in unrealized appreciation (depreciation) on investments in the Statement of Operations. |
See Notes to Financial Statements.
This Page Intentionally Left Blank
Statement of Assets & Liabilities
as of October 31, 2016
| | | | |
Assets | | | | |
Investments at value, including securities on loan of $4,177,833: | | | | |
Unaffiliated investments (cost $226,826,525) | | $ | 252,818,472 | |
Affiliated investments (cost $4,766,647) | | | 4,767,336 | |
Foreign currency, at value (cost $89,541) | | | 89,209 | |
Tax reclaim receivable | | | 865,046 | |
Dividends receivable | | | 651,691 | |
Receivable for investments sold | | | 502,709 | |
Receivable for Series shares sold | | | 49,539 | |
Prepaid expenses | | | 2,550 | |
| | | | |
Total Assets | | | 259,746,552 | |
| | | | |
| |
Liabilities | | | | |
Payable to broker for collateral for securities on loan | | | 4,763,332 | |
Loan payable | | | 392,000 | |
Accrued expenses | | | 237,107 | |
Payable for Series shares reacquired | | | 233,826 | |
Management fee payable | | | 184,419 | |
Affiliated transfer agent fee payable | | | 68,865 | |
Distribution fee payable | | | 63,591 | |
Payable to custodian | | | 36,082 | |
Loan interest payable | | | 486 | |
Payable for investments purchased | | | 132 | |
| | | | |
Total Liabilities | | | 5,979,840 | |
| | | | |
| |
Net Assets | | $ | 253,766,712 | |
| | | | |
| | | | | |
Net assets were comprised of: | | | | |
Common stock, at par | | $ | 392,173 | |
Paid-in capital in excess of par | | | 442,332,351 | |
| | | | |
| | | 442,724,524 | |
Undistributed net investment income | | | 3,525,631 | |
Accumulated net realized loss on investment and foreign currency transactions | | | (218,403,512 | ) |
Net unrealized appreciation on investments and foreign currencies | | | 25,920,069 | |
| | | | |
Net assets, October 31, 2016 | | $ | 253,766,712 | |
| | | | |
See Notes to Financial Statements.
| | | | |
Class A | | | | |
Net asset value and redemption price per share
($185,120,180 ÷ 28,559,675 shares of common stock issued and outstanding) | | $ | 6.48 | |
Maximum sales charge (5.50% of offering price) | | | 0.38 | |
| | | | |
Maximum offering price to public | | $ | 6.86 | |
| | | | |
| |
Class B | | | | |
Net asset value, offering price and redemption price per share
($3,079,630 ÷ 496,233 shares of common stock issued and outstanding) | | $ | 6.21 | |
| | | | |
| |
Class C | | | | |
Net asset value, offering price and redemption price per share
($15,892,341 ÷ 2,561,343 shares of common stock issued and outstanding) | | $ | 6.20 | |
| | | | |
| |
Class Z | | | | |
Net asset value, offering price and redemption price per share
($49,674,561 ÷ 7,600,064 shares of common stock issued and outstanding) | | $ | 6.54 | |
| | | | |
See Notes to Financial Statements.
| | | | |
| Prudential QMA International Equity Fund | | | 31 | |
Statement of Operations
Year Ended October 31, 2016
| | | | |
Net Investment Income (Loss) | | | | |
Income | | | | |
Unaffiliated dividend income (net of foreign withholding taxes of $1,176,019) | | $ | 8,580,695 | |
Income from securities lending, net (including affiliated income of $130,881) | | | 153,870 | |
Affiliated dividend income | | | 2,326 | |
| | | | |
Total income | | | 8,736,891 | |
| | | | |
| |
Expenses | | | | |
Management fee | | | 2,218,740 | |
Distribution fee—Class A | | | 569,944 | |
Distribution fee—Class B | | | 37,102 | |
Distribution fee—Class C | | | 164,156 | |
Transfer agent’s fees and expenses (including affiliated expense of $314,300) | | | 763,000 | |
Custodian and accounting fees (net of $6,000 fee credit) | | | 295,000 | |
Registration fees | | | 65,000 | |
Shareholders’ reports | | | 60,000 | |
Audit fee | | | 35,000 | |
Legal fees and expenses | | | 22,000 | |
Directors’ fees | | | 14,000 | |
Insurance expenses | | | 4,000 | |
Loan interest expense | | | 2,730 | |
Miscellaneous | | | 66,637 | |
| | | | |
Total expenses | | | 4,317,309 | |
| | | | |
Net investment income (loss) | | | 4,419,582 | |
| | | | |
| |
Realized And Unrealized Gain (Loss) On Investment And Foreign Currency Transactions | | | | |
Net realized gain (loss) on: | | | | |
Investment transactions (including affiliated of $610) | | | (19,262,647 | ) |
Foreign currency transactions | | | (27,621 | ) |
| | | | |
| | | (19,290,268 | ) |
| | | | |
Net change in unrealized appreciation (depreciation) on: | | | | |
Investments (including affiliated of $689) | | | 11,218,658 | |
Foreign currencies | | | 56,627 | |
| | | | |
| | | 11,275,285 | |
| | | | |
Net gain (loss) on investment and foreign currency transactions | | | (8,014,983 | ) |
| | | | |
Net Increase (Decrease) In Net Assets Resulting From Operations | | $ | (3,595,401 | ) |
| | | | |
See Notes to Financial Statements.
Statement of Changes in Net Assets
| | | | | | | | |
| | | Year Ended October 31, | |
| | | 2016 | | | 2015 | |
Increase (Decrease) in Net Assets | | | | | | | | |
Operations | | | | | | | | |
Net investment income (loss) | | $ | 4,419,582 | | | $ | 4,308,344 | |
Net realized gain (loss) on investment and foreign currency transactions | | | (19,290,268 | ) | | | (7,863,520 | ) |
Net change in unrealized appreciation (depreciation) on investments and
foreign currencies | | | 11,275,285 | | | | (18,763,386 | ) |
| | | | | | | | |
Net increase (decrease) in net assets resulting from operations | | | (3,595,401 | ) | | | (22,318,562 | ) |
| | | | | | | | |
| | |
Dividends from net investment income (Note 1) | | | | | | | | |
Class A | | | (3,287,114 | ) | | | (5,047,051 | ) |
Class B | | | (41,536 | ) | | | (85,958 | ) |
Class C | | | (170,911 | ) | | | (310,179 | ) |
Class Z | | | (1,031,700 | ) | | | (1,263,747 | ) |
| | | | | | | | |
| | | (4,531,261 | ) | | | (6,706,935 | ) |
| | | | | | | | |
| | |
Series share transactions (Net of share conversions) (Note 6) | | | | | | | | |
Net proceeds from shares sold | | | 10,632,582 | | | | 18,775,253 | |
Net asset value of shares issued in reinvestment of dividends and distributions | | | 4,447,393 | | | | 6,566,147 | |
Net asset value of shares issued in merger (Note 8) | | | — | | | | 50,163,770 | |
Cost of shares reacquired | | | (42,209,977 | ) | | | (47,581,055 | ) |
| | | | | | | | |
Net increase (decrease) in net assets from Series share transactions | | | (27,130,002 | ) | | | 27,924,115 | |
| | | | | | | | |
Total increase (decrease) | | | (35,256,664 | ) | | | (1,101,382 | ) |
| | |
Net Assets: | | | | | | | | |
Beginning of year | | | 289,023,376 | | | | 290,124,758 | |
| | | | | | | | |
End of year(a) | | $ | 253,766,712 | | | $ | 289,023,376 | |
| | | | | | | | |
(a) Includes undistributed net investment income of: | | $ | 3,525,631 | | | $ | 3,178,981 | |
| | | | | | | | |
See Notes to Financial Statements.
| | | | |
| Prudential QMA International Equity Fund | | | 33 | |
Notes to Financial Statements
Prudential World Fund, Inc. (the “Fund”) is an open-end management investment company, registered under the Investment Company Act of 1940, as amended (“1940 Act”) and currently consists of six series: Prudential QMA International Equity Fund (the “Series”, formerly Prudential International Equity Fund), Prudential Jennison Global Infrastructure Fund, Prudential Jennison Global Opportunities Fund, Prudential Jennison International Opportunities Fund, Prudential Jennison Emerging Markets Equity Fund and Prudential Emerging Markets Debt Local Currency Fund. These financial statements relate to the Prudential QMA International Equity Fund. The financial statements of the other series are not presented herein. The Series is a diversified. The investment objective of the Series is to seek long-term growth of capital.
Note 1. Accounting Policies
The Series follows investment company accounting and reporting guidance of the Financial Accounting Standards Board (“FASB”) Accounting Standard Codification Topic 946 Financial Services-Investment Companies. The following accounting policies conform to U.S. generally accepted accounting principles. The Series consistently follows such policies in the preparation of its financial statements.
Securities Valuation: The Series holds securities and other assets that are fair valued at the close of each day (generally, 4:00 PM Eastern time) the New York Stock Exchange (“NYSE”) is open for trading. Fair value is the price that would be received to sell an asset or paid to transfer a liability in an orderly transaction between market participants on the measurement date. The Board of Directors (the “Board”) has adopted Valuation Procedures for security valuation under which fair valuation responsibilities have been delegated to Prudential Investments LLC (“PI” or “Manager”). Under the current Valuation Procedures, the established Valuation Committee is responsible for supervising the valuation of portfolio securities and other assets. The Valuation Procedures permit the Series to utilize independent pricing vendor services, quotations from market makers, and alternative valuation methods when market quotations are either not readily available or not deemed representative of fair value. A record of the Valuation Committee’s actions is subject to the Board’s review, approval, and ratification at its next regularly-scheduled quarterly meeting.
Various inputs determine how the Series’ investments are valued, all of which are categorized according to the three broad levels (Level 1, 2, or 3) detailed in the table following the Portfolio of Investments.
Common and preferred stocks, exchange-traded funds, and derivative instruments such as futures or options that are traded on a national securities exchange are valued at the last
sale price as of the close of trading on the applicable exchange where the security principally trades. Securities traded via NASDAQ are valued at the NASDAQ official closing price. To the extent these securities are valued at the last sale price or NASDAQ official closing price, they are classified as Level 1 in the fair value hierarchy. In the event that no sale or official closing price on valuation date exists, these securities are generally valued at the mean between the last reported bid and ask prices, or at the last bid price in the absence of an ask price. These securities are classified as Level 2 in the fair value hierarchy.
Common and preferred stocks traded on foreign securities exchanges are valued using pricing vendor services that provide model prices derived using adjustment factors based on information such as local closing price, relevant general and sector indices, currency fluctuations, depositary receipts, and futures, as applicable. Securities valued using such model prices are classified as Level 2 in the fair value hierarchy. The models generate an evaluated adjustment factor for each security, which is applied to the local closing price to adjust it for post closing market movements. Utilizing that evaluated adjustment factor, the vendor provides an evaluated price for each security. If the vendor does not provide an evaluated price, securities are valued in accordance with exchange-traded common and preferred stocks discussed above.
Participatory notes (“P-notes”) are generally valued based upon the value of a related underlying security that trades actively in the market and are classified as Level 2 in the fair value hierarchy.
Investments in open-end, non-exchange-traded mutual funds are valued at their net asset values as of the close of the NYSE on the date of valuation. These securities are classified as Level 1 in the fair value hierarchy since they may be purchased or sold at their net asset values on the date of valuation.
Securities and other assets that cannot be priced according to the methods described above are valued based on pricing methodologies approved by the Board. In the event that unobservable inputs are used when determining such valuations, the securities will be classified as Level 3 in the fair value hierarchy.
When determining the fair value of securities, some of the factors influencing the valuation include: the nature of any restrictions on disposition of the securities; assessment of the general liquidity of the securities; the issuer’s financial condition and the markets in which it does business; the cost of the investment; the size of the holding and the capitalization of the issuer; the prices of any recent transactions or bids/offers for such securities or any comparable securities; any available analyst media or other reports or information deemed reliable by the investment adviser regarding the issuer or the markets or industry in which it operates. Using fair value to price securities may result in a value that is different from a security’s most recent closing price and from the price used by other mutual funds to calculate their net asset values.
| | | | |
| Prudential QMA International Equity Fund | | | 35 | |
Notes to Financial Statements (continued)
Restricted and Illiquid Securities: Subject to the guidelines adopted by the Board, the Series may invest up to 15% of its net assets in illiquid securities, including those which are restricted as to disposition under securities law (“restricted securities”). Restricted securities are valued pursuant to the valuation procedures noted above. Illiquid securities are those that, because of the absence of a readily available market or due to legal or contractual restrictions on resale, cannot be sold within seven days in the ordinary course of business at approximately the amount at which the Series has valued the investment. Therefore, the Series may find it difficult to sell illiquid securities at the time considered most advantageous by its Subadviser and may incur expenses that would not be incurred in the sale of securities that were freely marketable. Certain securities that would otherwise be considered illiquid because of legal restrictions on resale to the general public may be traded among qualified institutional buyers under Rule 144A of the Securities Act of 1933. These Rule 144A securities, as well as commercial paper that is sold in private placements under Section 4(2) of the Securities Act, may be deemed liquid by the Series’ Subadviser under the guidelines adopted by the Directors of the Series. However, the liquidity of the Series’ investments in Rule 144A securities could be impaired if trading does not develop or declines.
Foreign Currency Translation: The books and records of the Series are maintained in U.S. dollars. Foreign currency amounts are translated into U.S. dollars on the following basis:
(i) market value of investment securities, other assets and liabilities—at the current rates of exchange;
(ii) purchases and sales of investment securities, income and expenses—at the rates of exchange prevailing on the respective dates of such transactions.
Although the net assets of the Series are presented at the foreign exchange rates and market values at the close of the period, the Series does not generally isolate that portion of the results of operations arising as a result of changes in the foreign exchange rates from the fluctuations arising from changes in the market prices of long-term portfolio securities held at the end of the period. Similarly, the Series does not isolate the effect of changes in foreign exchange rates from the fluctuations arising from changes in the market prices of long-term portfolio securities sold during the period. Accordingly, holding period realized foreign currency gains (losses) are included in the reported net realized gains (losses) on investment transactions. Notwithstanding the above, the Series does isolate the effect of fluctuations in foreign currency exchange rates when determining the gain (loss) upon the sale or maturity of foreign currency denominated debt obligations; such amounts are included in net realized gain (loss) on foreign currency transactions.
Net realized gains (losses) on foreign currency transactions represent net foreign exchange gains (losses) from holdings of foreign currencies, forward currency contracts, disposition
of foreign currencies, currency gains (losses) realized between the trade and settlement dates on securities transactions, and the difference between the amounts of interest, dividends and foreign withholding taxes recorded on the Series’ books and the U.S. dollar equivalent amounts actually received or paid. Net unrealized currency gains (losses) from valuing foreign currency denominated assets and liabilities (other than investments) at period-end exchange rates are reflected as a component of net unrealized appreciation (depreciation) on foreign currency transactions.
Master Netting Arrangements: The Series is subject to various Master Agreements, or netting arrangements, with select counterparties. These are agreements which a subadviser may have negotiated and entered into on behalf of the Series. A master netting arrangement between the Series and the counterparty permits the Series to offset amounts payable by the Series to the same counterparty against amounts to be received; and by the receipt of collateral from the counterparty by the Series to cover the Series’ exposure to the counterparty. However, there is no assurance that such mitigating factors are easily enforceable. In addition to master netting arrangements, the right to set-off exists when all the conditions are met such that each of the parties owes the other determinable amounts, the reporting party has the right to set-off the amount owed with the amount owed by the other party, the reporting party intends to set-off and the right of set-off is enforceable by law. During the reporting period, there was no intention to settle on a net basis and all amounts are presented on a gross basis on the Statement of Assets and Liabilities.
Securities Lending: The Series may lend its portfolio securities to banks and broker-dealers. The loans are secured by collateral at least equal to the market value of the securities loaned. Collateral pledged by each borrower is invested in a money market fund and is marked to market daily, based on the previous day’s market value, such that the value of the collateral exceeds the value of the loaned securities. For the period March 31, 2016 through July 18, 2016 the collateral was invested in an ultra-short bond fund. Loans are subject to termination at the option of the borrower or the Series. Upon termination of the loan, the borrower will return to the Series securities identical to the loaned securities. Should the borrower of the securities fail financially, the Series has the right to repurchase the securities in the open market using the collateral. The Series recognizes income, net of any rebate and securities lending agent fees, for lending its securities in the form of fees or interest on the investment of any cash received as collateral. The borrower receives all interest and dividends from the securities loaned and such payments are passed back to the lender in amounts equivalent thereto. The Series also continues to recognize any unrealized gain (loss) in the market price of the securities loaned and on the change in the value of the collateral invested that may occur during the term of the loan. In addition, realized gain (loss) is recognized on changes in the value of the collateral invested that may occur during the term of the loan.
Concentration of Risk: Foreign security and currency transactions may involve certain considerations and risks not typically associated with those of domestic origin as a result of, among other factors, the possibility of political and economic instability or the level of governmental supervision and regulation of foreign securities markets.
| | | | |
| Prudential QMA International Equity Fund | | | 37 | |
Notes to Financial Statements (continued)
Securities Transactions and Net Investment Income: Securities transactions are recorded on the trade date. Realized gains (losses) from investment and currency transactions are calculated on the identified cost basis. Dividend income is recorded on the ex-date. Interest income, including amortization of premium and accretion of discount on debt securities, as required, is recorded on an accrual basis. Expenses are recorded on an accrual basis, which may require the use of certain estimates by management that may differ from actual.
Net investment income (loss) (other than distribution fees, which are charged directly to the respective class) and unrealized and realized gains (losses) are allocated daily to each class of shares based upon the relative proportion of adjusted net assets of each class at the beginning of the day.
REITs: The Series may invest in REITs, which report information on the source of their distributions annually. Based on current and historical information, a portion of distributions received from REITs during the year is estimated to be dividend income, capital gain or return of capital and is recorded accordingly. These estimates are adjusted when the actual sources of distributions are disclosed by the REITs.
Dividends and Distributions: The Series expects to pay dividends from net investment income and distributions from net realized capital gains, if any, annually. Dividends and distributions to shareholders, which are determined in accordance with federal income tax regulations and which may differ from generally accepted accounting principles, are recorded on the ex-date. Permanent book/tax differences relating to income and gain (loss) are reclassified amongst undistributed net investment income, accumulated net realized gain (loss) and paid-in capital in excess of par, as appropriate.
Taxes: For federal income tax purposes, the Series is treated as a separate taxpaying entity. It is the Series’ policy to continue to meet the requirements of the Internal Revenue Code applicable to regulated investment companies and to distribute all of its taxable net investment income and capital gains, if any, to shareholders. Therefore, no federal income tax provision is required. Withholding taxes on foreign dividends are recorded net of reclaimable amounts, at the time related income is earned.
Estimates: The preparation of the financial statements requires management to make estimates and assumptions that affect the reported amounts and disclosures in the financial statements. Actual results could differ from those estimates.
Note 2. Agreements
The Fund has a management agreement for the Series with PI. Pursuant to this agreement, PI has responsibility for all investment advisory services and supervises the subadvisor’s
performance of such services. PI has entered into a subadvisory agreement with Quantitative Management Associates LLC (“QMA”). The subadvisory agreement provides that QMA will furnish investment advisory services in connection with the management of the Series. In connection therewith, QMA is obligated to keep certain books and records of the Series. PI pays for the services of QMA, the cost of compensation of officers of the Series, occupancy and certain clerical and bookkeeping costs of the Series. The Series bears all other costs and expenses.
The management fee paid to PI is accrued daily and payable monthly, at an annual rate of .85% of the average daily net assets of the Series up to and including $300 million, .75% of the average daily net assets in excess of $300 million up to and including $1.5 billion and .70% of the Series’ average daily net assets over $1.5 billion. The effective management fee was .85% for the year ended October 31, 2016.
The Series has distribution agreements with Prudential Investment Management Services LLC (“PIMS”), which acts as the distributor of the Class A, Class B, Class C and Class Z shares of the Series. The Series compensates PIMS for distributing and servicing the Series’ Class A, Class B and Class C shares, pursuant to plans of distribution (the “Distribution Plans”), regardless of expenses actually incurred by PIMS. The distribution fees are accrued daily and payable monthly. No distribution or service fees are paid to PIMS as distributor of the Class Z shares of the Series.
Pursuant to the Distribution Plans, the Series compensates PIMS for distribution related activities at the annual rate of up to .30%, 1% and 1% of the average daily net assets of the Class A, B and C shares, respectively.
PIMS has advised the Series that it has received $79,943 in front-end sales charges resulting from sales of Class A shares during the year ended October 31, 2016. From these fees, PIMS paid such sales charges to broker-dealers, which in turn paid commissions to salespersons and incurred other distribution costs.
PIMS has advised the Series that for the year ended October 31, 2016 it has received $5,445 and $181 in contingent deferred sales charges imposed upon redemptions by certain Class B and Class C shareholders, respectively.
PI, QMA and PIMS are indirect, wholly-owned subsidiaries of Prudential Financial, Inc. (“Prudential”).
Note 3. Other Transactions with Affiliates
Prudential Mutual Fund Services LLC (“PMFS”), an affiliate of PI and an indirect, wholly-owned subsidiary of Prudential, serves as the Series’ transfer agent. Transfer agent’s fees and expenses in the Statement of Operations include certain out-of-pocket expenses paid to non-affiliates, where applicable.
| | | | |
| Prudential QMA International Equity Fund | | | 39 | |
Notes to Financial Statements (continued)
Effective July 7, 2016, the Board replaced PGIM, Inc., an indirect, wholly-owned subsidiary of Prudential, as securities lending agent with a third party agent. Prior to July 7, 2016, PGIM, Inc. was the Series’ securities lending agent. Net earnings from securities lending are disclosed on the Statement of Operations as “Income from securities lending, net”. For the period November 1, 2015 through February 4, 2016, PGIM, Inc. had been compensated $26,300 for these services. At the June 2016 meeting of the Board, the Board approved compensation to PGIM, Inc. related to securities lending activities. The payment was for services provided from February 5, 2016 through July 5, 2016 and totaled $4,607. Prior to January 4, 2016, PGIM, Inc. was known as Prudential Investment Management, Inc. (“PIM”).
The Series may enter into certain securities purchase or sale transactions under Board approved Rule 17a-7 procedures. Rule 17a-7 is an exemptive rule under the 1940 Act, that permits purchase and sale transactions among affiliated investment companies, or between an investment company and a person that is affiliated solely by reason of having a common (or affiliated) investment adviser, common directors, and/or common officers. Such transactions are subject to ratification by the Board.
The Series invests its overnight sweep cash in the Prudential Core Ultra Short Bond Fund, (formerly known as Prudential Core Taxable Money Market Fund), (the “Core Fund”), and its securities lending cash collateral in the Prudential Institutional Money Market Fund, (the “Money Market Fund”), each a portfolio of Prudential Investment Portfolios 2, registered under the 1940 Act and managed by PI. Earnings from the Core and the Money Market Funds are disclosed on the Statement of Operations as “Affiliated dividend income” and “Income from securities lending, net”, respectively.
Note 4. Portfolio Securities
The cost of purchases and proceeds from sales of investment securities, other than short-term investments, for the year ended October 31, 2016, were $297,234,498 and $324,427,651, respectively.
Note 5. Distributions and Tax Information
Distributions to shareholders, which are determined in accordance with federal income tax regulations and which may differ from generally accepted accounting principles, are recorded on the ex-date. In order to present undistributed net investment income, accumulated net realized loss on investment and foreign currency transactions and paid-in capital in excess of par on the Statement of Assets and Liabilities that more closely represent their tax character, certain adjustments have been made to undistributed net
investment income, accumulated net realized loss on investment and foreign currency transactions and paid-in capital in excess of par. For the year ended October 31, 2016, the adjustments were to increase undistributed net investment income by $458,329, decrease accumulated net realized loss on investment and foreign currency transactions by $519,195 and decrease paid in capital in excess of par by $977,524, due to the differences in the treatment for book and tax purposes of certain transactions involving foreign securities and currencies, investments in passive foreign investment companies, and the expiration of a capital loss carryforward. Net investment income, net realized gain (loss) on investment and foreign currency transactions and net assets were not affected by this change.
For the years ended October 31, 2016 and October 31, 2015, the tax character of dividends paid by the Series were $4,531,261 and $6,706,935 of ordinary income, respectively.
As of October 31, 2016, the Series had undistributed ordinary income of $4,790,782 on a tax basis.
The United States federal income tax basis of the Series’ investments and the net unrealized appreciation as of October 31, 2016 were as follows:
| | | | | | | | | | |
Tax Basis | | Appreciation | | Depreciation | | Net
Unrealized
Appreciation | | Other Cost Basis
Adjustments | | Total Net
Unrealized
Appreciation |
| $234,682,321 | | $33,322,185 | | $(10,418,698) | | $22,903,487 | | $(72,567) | | $22,830,920 |
The differences between book basis and tax basis were primarily attributable to deferred losses on wash sales and investments in passive foreign investment companies. The other cost basis adjustments are primarily attributable to appreciation (depreciation) of foreign currency and mark-to-market of receivables and payables.
Under the Regulated Investment Company Modernization Act of 2010 (the “Act”), the Series is permitted to carryforward capital losses realized on or after November 1, 2011 (“post-enactment losses”) for an unlimited period. Post-enactment losses are required to be utilized before the utilization of losses incurred prior to the effective date of the Act. As a result of this ordering rule, capital loss carryforwards related to taxable years ending before October 31, 2012 (“pre-enactment losses”) may have an increased likelihood to expire unused. Additionally, post-enactment capital losses that are carried forward will retain their character as either short-term or long-term capital losses rather than being considered all short-term as under previous law. Additionally, approximately $978,000 of its capital loss carryforward was written off unused due to expiration. No capital gains distributions are expected to be paid to shareholders until net gains have been realized in excess of such losses. As of October 31, 2016, the pre and post-enactment losses were approximately:
| | | | |
Post-Enactment Losses: | | $ | 27,917,000 | |
| | | | |
Pre-Enactment Losses: | | | | |
Expiring 2017 | | $ | 180,326,000 | |
Expiring 2018 | | | 8,337,000 | |
| | | | |
| | $ | 188,663,000 | |
| | | | |
| | | | |
| Prudential QMA International Equity Fund | | | 41 | |
Notes to Financial Statements (continued)
Management has analyzed the Series’ tax positions taken on federal, state and local income tax returns for all open tax years and has concluded that no provision for income tax is required in the Series’ financial statements for the current reporting period. The Series’ federal, state and local income and federal excise tax returns for tax years for which the applicable statutes of limitations have not expired are subject to examination by the Internal Revenue Service and state departments of revenue.
Note 6. Capital
The Series offers Class A, Class B, Class C, and Class Z shares. Class A shares are sold with a front-end sales charge of up to 5.50%. All investors who purchase Class A shares in an amount of $1 million or more and sell these shares within 12 months of purchase are subject to a contingent deferred sales charge (“CDSC”) of 1%. The Class A CDSC is waived for purchases by certain retirement and/or benefit plans. Class B shares are sold with a CDSC which declines from 5% to zero depending on the period of time the shares are held. Class B shares will automatically convert to Class A shares on a quarterly basis approximately seven years after purchase. Class B Shares are closed to new purchases. Class C shares are sold with a CDSC of 1% on shares redeemed within the first 12 months after purchase. A special exchange privilege is also available for shareholders who qualify to purchase Class A shares at net asset value. Class Z shares are not subject to any sales or redemption charge and are offered exclusively for sale to a limited group of investors.
Under certain circumstances, an exchange may be made from specified share classes of the Series to one or more other share classes of the Series as presented in the table of transactions in shares of common stock.
There are 875 million authorized shares of common stock at $.01 par value per share, designated Class A, Class B, Class C and Class Z, each of which consists of 325 million, 150 million, 150 million and 250 million authorized shares, respectively.
As of October 31, 2016, Prudential did not own any shares of the Series. At reporting period end, 4 shareholders of record held 41% of the Series’ outstanding shares on behalf of multiple beneficial owners.
Transactions in shares of common stock were as follows:
| | | | | | | | |
Class A | | Shares | | | Amount | |
Year ended October 31, 2016: | | | | | | | | |
Shares sold | | | 762,631 | | | $ | 4,732,434 | |
Shares issued in reinvestment of dividends and distributions | | | 512,660 | | | | 3,219,500 | |
Shares reacquired | | | (4,507,217 | ) | | | (28,182,837 | ) |
| | | | | | | | |
Net increase (decrease) in shares outstanding before conversion | | | (3,231,926 | ) | | | (20,230,903 | ) |
Shares issued upon conversion from other share class(es) | | | 149,564 | | | | 935,639 | |
Shares reacquired upon conversion into other share class(es) | | | (142,045 | ) | | | (892,788 | ) |
| | | | | | | | |
Net increase (decrease) in shares outstanding | | | (3,224,407 | ) | | $ | (20,188,052 | ) |
| | | | | | | | |
Year ended October 31, 2015: | | | | | | | | |
Shares sold | | | 1,048,819 | | | $ | 7,448,060 | |
Shares issued in merger | | | 4,537,435 | | | | 31,535,171 | |
Shares issued in reinvestment of dividends and distributions | | | 721,039 | | | | 4,924,699 | |
Shares reacquired | | | (3,970,694 | ) | | | (27,890,695 | ) |
| | | | | | | | |
Net increase (decrease) in shares outstanding before conversion | | | 2,336,599 | | | | 16,017,235 | |
Shares issued upon conversion from other share class(es) | | | 248,806 | | | | 1,769,005 | |
Shares reacquired upon conversion into other share class(es) | | | (536,321 | ) | | | (3,794,099 | ) |
| | | | | | | | |
Net increase (decrease) in shares outstanding | | | 2,049,084 | | | $ | 13,992,141 | |
| | | | | | | | |
Class B | | | | | | |
Year ended October 31, 2016: | | | | | | | | |
Shares sold | | | 10,670 | | | $ | 65,248 | |
Shares issued in reinvestment of dividends and distributions | | | 6,686 | | | | 40,453 | |
Shares reacquired | | | (121,431 | ) | | | (728,578 | ) |
| | | | | | | | |
Net increase (decrease) in shares outstanding before conversion | | | (104,075 | ) | | | (622,877 | ) |
Shares reacquired upon conversion into other share class(es) | | | (149,541 | ) | | | (896,634 | ) |
| | | | | | | | |
Net increase (decrease) in shares outstanding | | | (253,616 | ) | | $ | (1,519,511 | ) |
| | | | | | | | |
Year ended October 31, 2015: | | | | | | | | |
Shares sold | | | 114,895 | | | $ | 806,872 | |
Shares issued in merger | | | 164,257 | | | | 1,100,522 | |
Shares issued in reinvestment of dividends and distributions | | | 12,718 | | | | 83,686 | |
Shares reacquired | | | (107,836 | ) | | | (724,595 | ) |
| | | | | | | | |
Net increase (decrease) in shares outstanding before conversion | | | 184,034 | | | | 1,266,485 | |
Shares reacquired upon conversion into other share class(es) | | | (143,864 | ) | | | (956,537 | ) |
| | | | | | | | |
Net increase (decrease) in shares outstanding | | | 40,170 | | | $ | 309,948 | |
| | | | | | | | |
| | | | |
| Prudential QMA International Equity Fund | | | 43 | |
Notes to Financial Statements (continued)
| | | | | | | | |
Class C | | Shares | | | Amount | |
Year ended October 31, 2016: | | | | | | | | |
Shares sold | | | 200,289 | | | $ | 1,218,445 | |
Shares issued in reinvestment of dividends and distributions | | | 27,456 | | | | 166,109 | |
Shares reacquired | | | (522,460 | ) | | | (3,111,379 | ) |
| | | | | | | | |
Net increase (decrease) in shares outstanding before conversion | | | (294,715 | ) | | | (1,726,825 | ) |
Shares reacquired upon conversion into other share class(es) | | | (4,615 | ) | | | (27,813 | ) |
| | | | | | | | |
Net increase (decrease) in shares outstanding | | | (299,330 | ) | | $ | (1,754,638 | ) |
| | | | | | | | |
Year ended October 31, 2015: | | | | | | | | |
Shares sold | | | 176,343 | | | $ | 1,212,887 | |
Shares issued in merger | | | 656,750 | | | | 4,400,227 | |
Shares issued in reinvestment of dividends and distributions | | | 46,372 | | | | 305,125 | |
Shares reacquired | | | (471,245 | ) | | | (3,191,508 | ) |
| | | | | | | | |
Net increase (decrease) in shares outstanding before conversion | | | 408,220 | | | | 2,726,731 | |
Shares reacquired upon conversion into other share class(es) | | | (121,041 | ) | | | (853,662 | ) |
| | | | | | | | |
Net increase (decrease) in shares outstanding | | | 287,179 | | | $ | 1,873,069 | |
| | | | | | | | |
Class Z | | | | | | |
Year ended October 31, 2016: | | | | | | | | |
Shares sold | | | 751,142 | | | $ | 4,616,455 | |
Shares issued in reinvestment of dividends and distributions | | | 161,859 | | | | 1,021,331 | |
Shares reacquired | | | (1,614,319 | ) | | | (10,187,183 | ) |
| | | | | | | | |
Net increase (decrease) in shares outstanding before conversion | | | (701,318 | ) | | | (4,549,397 | ) |
Shares issued upon conversion from other share class(es) | | | 144,090 | | | | 912,035 | |
Shares reacquired upon conversion into other share class(es) | | | (4,675 | ) | | | (30,439 | ) |
| | | | | | | | |
Net increase (decrease) in shares outstanding | | | (561,903 | ) | | $ | (3,667,801 | ) |
| | | | | | | | |
Year ended October 31, 2015: | | | | | | | | |
Shares sold | | | 1,322,244 | | | $ | 9,307,434 | |
Shares issued in merger | | | 1,878,090 | | | | 13,127,850 | |
Shares issued in reinvestment of dividends and distributions | | | 182,334 | | | | 1,252,637 | |
Shares reacquired | | | (2,233,139 | ) | | | (15,774,257 | ) |
| | | | | | | | |
Net increase (decrease) in shares outstanding before conversion | | | 1,149,529 | | | | 7,913,664 | |
Shares issued upon conversion from other shares class(es) | | | 538,030 | | | | 3,835,345 | |
Shares reacquired upon conversion into other share class(es) | | | (8 | ) | | | (52 | ) |
| | | | | | | | |
Net increase (decrease) in shares outstanding | | | 1,687,551 | | | $ | 11,748,957 | |
| | | | | | | | |
Note 7. Borrowings
The Series, along with other affiliated registered investment companies (the “Funds”), is a party to a Syndicated Credit Agreement (“SCA”) with a group of banks. The purpose of the SCA is to provide an alternative source of temporary funding for capital share redemptions. The SCA provides for a commitment of $900 million for the period October 6, 2016 through October 5, 2017. The Funds pay an annualized commitment fee of .15% of the unused
portion of the SCA. The interest rate on borrowings under the SCA is paid monthly and at a per annum rate based upon the higher of 0.0%, the effective federal funds rate, or the One-Month LIBOR rate, plus a contractual spread. Prior to October 6, 2016, the Series had another SCA that provided a commitment of $900 million and the Series paid an annualized commitment fee of .11% of the unused portion of the SCA. Interest on any borrowings under the SCA is paid at contracted market rates. The interest rate on borrowings was substantially the same. The Series’ portion of the commitment fee for the unused amount is accrued daily and paid quarterly.
The Series utilized the SCA during the year ended October 31, 2016. The average daily balance for the 158 days the Series had loans outstanding during the period was $360,019, borrowed at a weighted average interest rate of 1.73%. The maximum loan balance outstanding during the period was $1,113,000. As of October 31, 2016, the Series had an outstanding loan balance of $392,000.
Note 8. Reorganization
On December 10, 2014, shareholders of the Prudential International Value Fund (“Value Fund”) approved the reorganization of the Value Fund into the Prudential QMA International Equity Fund (“Equity Fund”). As a result of the reorganization, the assets and liabilities of the Value Fund were exchanged for shares of the Equity Fund and the shareholders of the Value Fund are now shareholders of the Equity Fund. The reorganization took place on December 19, 2014. On such date, the merged portfolio had total investments cost and value of $44,833,696 and $50,087,941, respectively, representing the principal assets acquired by the acquiring fund.
The purpose of the transaction was to combine two funds with substantially similar investment objectives and policies. The acquiring fund, the Equity Fund, has the same contractual investment management fee and lower annualized operating expenses as well as stronger historical investment performance.
The acquisition was accomplished by a tax-free exchange of the following shares on December 19, 2014:
| | | | | | | | | | | | | | | | |
| Merged Fund | | | Acquiring Fund | |
Prudential International
Value Fund | | | Prudential QMA International
Equity Fund | |
Class | | Shares | | | Class | | | Shares | | | Value | |
| A | | | 1,463,874 | | | | A | | | | 4,537,435 | | | $ | 31,535,171 | |
| B | | | 53,470 | | | | B | | | | 164,257 | | | | 1,100,522 | |
| C | | | 213,549 | | | | C | | | | 656,750 | | | | 4,400,227 | |
| Z | | | 605,891 | | | | Z | | | | 1,878,090 | | | | 13,127,850 | |
For financial reporting purposes, assets received and shares issued by the Equity Fund were recorded at fair value; however, the cost basis of the investments received from the Value Fund was carried forward to reflect the tax-free status of the acquisition.
| | | | |
| Prudential QMA International Equity Fund | | | 45 | |
Notes to Financial Statements (continued)
The net assets and net unrealized appreciation (depreciation) immediately before the acquisition were as follows:
| | | | | | | | |
| Merged Fund | | | Acquiring Fund | |
Prudential International
Value Fund | | | Prudential QMA International
Equity Fund | |
Net Assets | | Unrealized
Appreciation | | | Net Assets | |
| $50,163,770 | | $ | 5,244,963 | | | $ | 276,541,095 | |
Assuming the acquisition had been completed on November 1, 2014, the Equity Fund’s results of operations for the year ended October 31, 2015 were as follows:
| | | | | | | | |
Net investment income | | $ | 4,304,941 | (a) | | | | |
Net realized and unrealized (loss) on investments | | $ | (27,557,139 | )(b) | | | | |
| | | | | | | | |
Net decrease in net assets resulting from operations | | $ | (23,252,198 | ) | | | | |
| | | | | | | | |
| (a) | $4,308,344, as reported in the Statement of Operations, plus $(3,403) Net Investment Loss from the Value Fund pre-merger. |
| (b) | $(26,626,906), as reported in the Statement of Operations, plus $(930,233) Net Realized and Unrealized Gain (Loss) on Investments from the Value Fund pre-merger. |
Because both the Equity Fund and the Value Fund sold and redeemed shares throughout the period, it is not practicable to provide pro-forma information on a per-share basis.
Because the combined investment funds have been managed as a single integrated fund since the acquisition was completed, it is also not practicable to separate the amounts of revenue and earnings of the Value Fund that have been included in the Equity Fund’s Statement of Operations since December 19, 2014.
Note 9. Recent Accounting Pronouncements and Reporting Updates
In January 2016, the FASB issued Accounting Standards Update (“ASU”) No. 2016-01 regarding “Recognition and Measurement of Financial Assets and Financial Liabilities”. The new guidance is intended to enhance the reporting model for financial instruments to provide users of financial statements with more decision-useful information and addresses certain aspects of the recognition, measurement, presentation, and disclosure of financial instruments. The new standard affects all entities that hold financial assets or owe financial liabilities. The new guidance is effective for public companies for fiscal years beginning after December 15, 2017, including interim periods within those fiscal years. At this time, management is evaluating the implications of ASU No. 2016-01 and its impact on the financial statements and disclosures has not yet been determined.
On October 13, 2016, the Securities and Exchange Commission (the “SEC”) adopted new rules and forms and amended existing rules and forms which are intended to modernize and enhance the reporting and disclosure of information by registered investment companies and to improve the quality of information that funds provide to investors, including modifications to Regulation S-X which would require standardized, enhanced disclosure about derivatives in investment company financial statements. In an effort to enhance monitoring and regulation, the new rules and forms will allow the SEC to more effectively collect and use data reported by funds. The new rules also enhance disclosure regarding fund liquidity and redemption practices. Also under the new rules, the SEC will permit open-end funds, with the exception of money market funds, to offer swing pricing, subject to board approval and review. The compliance dates of the modifications to Regulation S-X are August 1, 2017 and other amendments and rules are generally June 1, 2018 and December 1, 2018. Management is currently evaluating the impacts to the financial statement disclosures, if any.
Note 10. Dividends to Shareholders
Subsequent to the fiscal year end, the Series declared ordinary income dividends on December 2, 2016. The ex-date was December 6, 2016. The per share amounts declared were as follows:
| | | | |
| | | Ordinary Income | |
Class A | | $ | 0.12687 | |
Class B | | $ | 0.08589 | |
Class C | | $ | 0.08589 | |
Class Z | | $ | 0.14552 | |
| | | | |
| Prudential QMA International Equity Fund | | | 47 | |
Financial Highlights
| | | | | | | | | | | | | | | | | | | | |
| Class A Shares | |
| | | Year Ended October 31, | |
| | | 2016 | | | 2015 | | | 2014 | | | 2013 | | | 2012 | |
| Per Share Operating Performance(a): | | | | | | | | | | | | | | | | | | | | |
| Net Asset Value, Beginning of Year | | | $6.65 | | | | $7.36 | | | | $7.37 | | | | $6.02 | | | | $5.72 | |
| Income (loss) from investment operations: | | | | | | | | | | | | | | | | | | | | |
| Net investment income (loss) | | | .11 | | | | .11 | | | | .15 | | | | .12 | | | | .12 | |
| Net realized and unrealized gain (loss) on investment and foreign currency transactions | | | (.17 | ) | | | (.65 | ) | | | (.02 | ) | | | 1.36 | | | | .29 | |
| Total from investment operations | | | (.06 | ) | | | (.54 | ) | | | .13 | | | | 1.48 | | | | .41 | |
| Less Dividends: | | | | | | | | | | | | | | | | | | | | |
| Dividends from net investment income | | | (.11 | ) | | | (.17 | ) | | | (.14 | ) | | | (.13 | ) | | | (.11 | ) |
| Net asset value, end of year | | | $6.48 | | | | $6.65 | | | | $7.36 | | | | $7.37 | | | | $6.02 | |
| Total Return(b): | | | (.93)% | | | | (7.37)% | | | | 1.84% | | | | 25.06% | | | | 7.40% | |
| | | | | | | | | | | | | | | | | | | | |
| Ratios/Supplemental Data: | | | | | | | | | | | | | | | |
| Net assets, end of year (000) | | | $185,120 | | | | $211,314 | | | | $218,909 | | | | $234,668 | | | | $209,568 | |
| Average net assets (000) | | | $189,980 | | | | $229,598 | | | | $232,049 | | | | $221,300 | | | | $204,088 | |
| Ratios to average net assets(c): | | | | | | | | | | | | | | | | | | | | |
| Expenses after waivers and/or expense reimbursement | | | 1.66% | | | | 1.62% | | | | 1.59% | | | | 1.59% | | | | 1.67% | |
| Expenses before waivers and/or expense reimbursement | | | 1.66% | | | | 1.62% | | | | 1.59% | | | | 1.59% | | | | 1.67% | |
| Net investment income (loss) | | | 1.69% | | | | 1.39% | | | | 2.02% | | | | 1.83% | | | | 2.18% | |
| Portfolio turnover rate | | | 114% | | | | 111% | | | | 134% | | | | 114% | | | | 83% | |
| (a) | Calculated based on average shares outstanding during the year. |
| (b) | Total return does not consider the effects of sales loads. Total return is calculated assuming a purchase of a share on the first day and a sale on the last day of each year reported and includes reinvestment of dividends and distributions, if any. Total returns may reflect adjustments to conform to generally accepted accounting principles. |
| (c) | Does not include expenses of the underlying portfolios in which the Series invests. |
See Notes to Financial Statements.
| | | | | | | | | | | | | | | | | | | | |
| Class B Shares | |
| | | Year Ended October 31, | |
| | | 2016 | | | 2015 | | | 2014 | | | 2013 | | | 2012 | |
| Per Share Operating Performance(a): | | | | | | | | | | | | | | | | | | | | |
| Net Asset Value, Beginning of Year | | | $6.37 | | | | $7.05 | | | | $7.07 | | | | $5.78 | | | | $5.50 | |
| Income (loss) from investment operations: | | | | | | | | | | | | | | | | | | | | |
| Net investment income (loss) | | | .06 | | | | .05 | | | | .10 | | | | .07 | | | | .08 | |
| Net realized and unrealized gain (loss) on investment and foreign currency transactions | | | (.16 | ) | | | (.61 | ) | | | (.03 | ) | | | 1.32 | | | | .27 | |
| Total from investment operations | | | (.10 | ) | | | (.56 | ) | | | .07 | | | | 1.39 | | | | .35 | |
| Less Dividends: | | | | | | | | | | | | | | | | | | | | |
| Dividends from net investment income | | | (.06 | ) | | | (.12 | ) | | | (.09 | ) | | | (.10 | ) | | | (.07 | ) |
| Net asset value, end of year | | | $6.21 | | | | $6.37 | | | | $7.05 | | | | $7.07 | | | | $5.78 | |
| Total Return(b): | | | (1.55)% | | | | (7.96)% | | | | 1.10% | | | | 24.26% | | | | 6.50% | |
| | | | | | | | | | | | | | | | | | | | |
| Ratios/Supplemental Data: | | | | | | | | | | | | | | | |
| Net assets, end of year (000) | | | $3,080 | | | | $4,774 | | | | $5,006 | | | | $6,066 | | | | $5,439 | |
| Average net assets (000) | | | $3,710 | | | | $5,313 | | | | $5,868 | | | | $5,690 | | | | $5,823 | |
| Ratios to average net assets(c): | | | | | | | | | | | | | | | | | | | | |
| Expenses after waivers and/or expense reimbursement | | | 2.36% | | | | 2.32% | | | | 2.29% | | | | 2.29% | | | | 2.37% | |
| Expenses before waivers and/or expense reimbursement | | | 2.36% | | | | 2.32% | | | | 2.29% | | | | 2.29% | | | | 2.37% | |
| Net investment income (loss) | | | .96% | | | | .68% | | | | 1.35% | | | | 1.13% | | | | 1.48% | |
| Portfolio turnover rate | | | 114% | | | | 111% | | | | 134% | | | | 114% | | | | 83% | |
| (a) | Calculated based on average shares outstanding during the year. |
| (b) | Total return does not consider the effects of sales loads. Total return is calculated assuming a purchase of a share on the first day and a sale on the last day of each year reported and includes reinvestment of dividends and distributions, if any. Total returns may reflect adjustments to conform to generally accepted accounting principles. |
| (c) | Does not include expenses of the underlying portfolios in which the Series invests. |
See Notes to Financial Statements.
| | | | |
| Prudential QMA International Equity Fund | | | 49 | |
Financial Highlights (continued)
| | | | | | | | | | | | | | | | | | | | |
| Class C Shares | |
| | | Year Ended October 31, | |
| | | 2016 | | | 2015 | | | 2014 | | | 2013 | | | 2012 | |
| Per Share Operating Performance(a): | | | | | |
| Net Asset Value, Beginning of Year | | | $6.37 | | | | $7.05 | | | | $7.07 | | | | $5.78 | | | | $5.50 | |
| Income (loss) from investment operations: | | | | | | | | | | | | | | | | | | | | |
| Net investment income (loss) | | | .06 | | | | .06 | | | | .10 | | | | .07 | | | | .08 | |
| Net realized and unrealized gain (loss) on investment and foreign currency transactions | | | (.17 | ) | | | (.62 | ) | | | (.03 | ) | | | 1.32 | | | | .27 | |
| Total from investment operations | | | (.11 | ) | | | (.56 | ) | | | .07 | | | | 1.39 | | | | .35 | |
| Less Dividends: | | | | | | | | | | | | | | | | | | | | |
| Dividends from net investment income | | | (.06 | ) | | | (.12 | ) | | | (.09 | ) | | | (.10 | ) | | | (.07 | ) |
| Net asset value, end of year | | | $6.20 | | | | $6.37 | | | | $7.05 | | | | $7.07 | | | | $5.78 | |
| Total Return(b): | | | (1.71)% | | | | (7.96)% | | | | 1.10% | | | | 24.27% | | | | 6.51% | |
| |
| Ratios/Supplemental Data: | | | | | | | | | | | | | | | |
| Net assets, end of year (000) | | | $15,892 | | | | $18,209 | | | | $18,146 | | | | $19,472 | | | | $17,658 | |
| Average net assets (000) | | | $16,416 | | | | $20,086 | | | | $19,402 | | | | $18,341 | | | | $19,019 | |
| Ratios to average net assets(c): | | | | | | | | | | | | | | | | | | | | |
| Expenses after waivers and/or expense reimbursement | | | 2.36% | | | | 2.32% | | | | 2.29% | | | | 2.29% | | | | 2.37% | |
| Expenses before waivers and/or expense reimbursement | | | 2.36% | | | | 2.32% | | | | 2.29% | | | | 2.29% | | | | 2.37% | |
| Net investment income (loss) | | | .98% | | | | .71% | | | | 1.32% | | | | 1.13% | | | | 1.49% | |
| Portfolio turnover rate | | | 114% | | | | 111% | | | | 134% | | | | 114% | | | | 83% | |
| (a) | Calculated based on average shares outstanding during the year. |
| (b) | Total return does not consider the effects of sales loads. Total return is calculated assuming a purchase of a share on the first day and a sale on the last day of each year reported and includes reinvestment of dividends and distributions, if any. Total returns may reflect adjustments to conform to generally accepted accounting principles. |
| (c) | Does not include expenses of the underlying portfolios in which the Series invests. |
See Notes to Financial Statements.
| | | | | | | | | | | | | | | | | | | | |
| Class Z Shares | |
| | | Year Ended October 31, | |
| | | 2016 | | | 2015 | | | 2014 | | | 2013 | | | 2012 | |
| Per Share Operating Performance(a): | | | | | |
| Net Asset Value, Beginning of Year | | | $6.70 | | | | $7.42 | | | | $7.43 | | | | $6.07 | | | | $5.77 | |
| Income (loss) from investment operations: | | | | | | | | | | | | | | | | | | | | |
| Net investment income (loss) | | | .13 | | | | .13 | | | | .16 | | | | .15 | | | | .14 | |
| Net realized and unrealized gain (loss) on investment and foreign currency transactions | | | (.16) | | | | (.66) | | | | (.01) | | | | 1.36 | | | | .29 | |
| Total from investment operations | | | (.03) | | | | (.53) | | | | .15 | | | | 1.51 | | | | .43 | |
| Less Dividends: | | | | | | | | | | | | | | | | | | | | |
| Dividends from net investment income | | | (.13) | | | | (.19) | | | | (.16) | | | | (.15) | | | | (.13) | |
| Net asset value, end of year | | | $6.54 | | | | $6.70 | | | | $7.42 | | | | $7.43 | | | | $6.07 | |
| Total Return(b): | | | (.44)% | | | | (7.15)% | | | | 2.12% | | | | 25.36% | | | | 7.69% | |
| |
| Ratios/Supplemental Data: | | | | | | | | | | | | | | | |
| Net assets, end of year (000) | | | $49,675 | | | | $54,726 | | | | $48,064 | | | | $71,753 | | | | $50,531 | |
| Average net assets (000) | | | $50,923 | | | | $55,405 | | | | $53,881 | | | | $60,981 | | | | $45,946 | |
| Ratios to average net assets(c): | | | | | | | | | | | | | | | | | | | | |
| Expenses after waivers and/or expense reimbursement | | | 1.36% | | | | 1.32% | | | | 1.29% | | | | 1.29% | | | | 1.37% | |
| Expenses before waivers and/or expense reimbursement | | | 1.36% | | | | 1.32% | | | | 1.29% | | | | 1.29% | | | | 1.37% | |
| Net investment income (loss) | | | 1.99% | | | | 1.69% | | | | 2.07% | | | | 2.17% | | | | 2.46% | |
| Portfolio turnover rate | | | 114% | | | | 111% | | | | 134% | | | | 114% | | | | 83% | |
| (a) | Calculated based on average shares outstanding during the year. |
| (b) | Total return is calculated assuming a purchase of a share on the first day and a sale on the last day of each year reported and includes reinvestment of dividends and distributions, if any. Total returns may reflect adjustments to conform to generally accepted accounting principles. |
| (c) | Does not include expenses of the underlying portfolios in which the Series invests. |
See Notes to Financial Statements.
| | | | |
| Prudential QMA International Equity Fund | | | 51 | |
Report of Independent Registered Public Accounting Firm
The Board of Directors and Shareholders
Prudential World Fund, Inc.:
We have audited the accompanying statement of assets and liabilities of Prudential QMA International Equity Fund, one of the series constituting Prudential World Fund, Inc. (hereafter referred to as the “Fund”), including the portfolio of investments, as of October 31, 2016, and the related statement of operations for the year then ended, the statements of changes in net assets for each of the years in the two-year period then ended, and the financial highlights for each of the years in the five-year period then ended. These financial statements and financial highlights are the responsibility of the Fund’s management. Our responsibility is to express an opinion on these financial statements and financial highlights based on our audits.
We conducted our audits in accordance with the standards of the Public Company Accounting Oversight Board (United States). Those standards require that we plan and perform the audit to obtain reasonable assurance about whether the financial statements and financial highlights are free of material misstatement. An audit includes examining, on a test basis, evidence supporting the amounts and disclosures in the financial statements. Our procedures included confirmation of securities owned as of October 31, 2016, by correspondence with the custodian, transfer agent and brokers or by other appropriate auditing procedures when replies from brokers were not received. An audit also includes assessing the accounting principles used and significant estimates made by management, as well as evaluating the overall financial statement presentation. We believe that our audits provide a reasonable basis for our opinion.
In our opinion, the financial statements and financial highlights referred to above present fairly, in all material respects, the financial position of the Fund as of October 31, 2016, and the results of its operations for the year then ended, the changes in its net assets for each of the years in the two-year period then ended, and the financial highlights for each of the years in the five-year period then ended, in conformity with U.S. generally accepted accounting principles.

New York, New York
December 15, 2016
Federal Income Tax Information (unaudited)
For the year ended October 31, 2016, the Series reports, the maximum amount allowable under Section 854 of the Internal Revenue Code, but not less than, the following percentage of the ordinary income dividends paid as qualified dividend income (QDI):
| | | | |
| | | QDI | |
Prudential QMA International Equity Fund | | | 96.64 | % |
For the year ended October 31, 2016, the Series made an election to pass through the maximum amount of the portion of the ordinary income dividends paid derived from foreign source income as well as any foreign taxes paid by the Series in accordance with Section 853 of the Internal Revenue Code of the following amounts: $1,026,647 foreign tax credit from recognized foreign source income of $9,685,978.
In January 2017, you will be advised on IRS Form 1099-DIV or substitute 1099-DIV as to the federal tax status of dividends received by you in calendar year 2016.
| | | | |
| Prudential QMA International Equity Fund | | | 53 | |
INFORMATION ABOUT BOARD MEMBERS AND OFFICERS
(Unaudited)
Information about Board Members and Officers of the Fund is set forth below. Board Members who are not deemed to be “interested persons” of the Fund, as defined in the 1940 Act, are referred to as “Independent Board Members.” Board Members who are deemed to be “interested persons” of the Fund are referred to as “Interested Board Members.” The Board Members are responsible for the overall supervision of the operations of the Fund and perform the various duties imposed on the directors of investment companies by the 1940 Act. The Board in turn elects the Officers, who are responsible for administering the day-to-day operations of the Fund.
| | | | |
| Independent Board Members(1) |
Name, Address, Age Position(s) Portfolios Overseen | | Principal Occupation(s) During Past Five Years | | Other Directorships Held During Past Five Years |
Ellen S. Alberding (58) Board Member Portfolios Overseen: 67 | | President and Board Member, The Joyce Foundation (charitable foundation) (since 2002); Vice Chair, City Colleges of Chicago (community college system) (since 2011); Trustee, Skills for America’s Future (national initiative to connect employers to community colleges) (since 2011); Trustee, National Park Foundation (charitable foundation for national park system) (since 2009); Trustee, Economic Club of Chicago (since 2009). | | None. |
Kevin J. Bannon (64) Board Member Portfolios Overseen: 67 | | Managing Director (April 2008-May 2015) and Chief Investment Officer (October 2008-November 2013) of Highmount Capital LLC (registered investment adviser); formerly Executive Vice President and Chief Investment Officer (April 1993-August 2007) of Bank of New York Company; President (May 2003-May 2007) of BNY Hamilton Family of Mutual Funds. | | Director of Urstadt Biddle Properties (equity real estate investment trust) (since September 2008). |
Linda W. Bynoe (64) Board Member Portfolios Overseen: 67 | | President and Chief Executive Officer (since March 1995) and formerly Chief Operating Officer (December 1989-February 1995) of Telemat Ltd. (management consulting); formerly Vice President (January 1985-June 1989) at Morgan Stanley & Co. (broker-dealer). | | Director of Simon Property Group, Inc. (retail real estate) (May 2003-May 2012); Director of Anixter International, Inc. (communication products distributor) (since January 2006); Director of Northern Trust Corporation (financial services) (since April 2006); Trustee of Equity Residential (residential real estate) (since December 2009). |
Prudential QMA International Equity Fund
| | | | |
| Independent Board Members(1) |
Name, Address, Age Position(s) Portfolios Overseen | | Principal Occupation(s) During Past Five Years | | Other Directorships Held During Past Five Years |
Keith F. Hartstein (60) Board Member Portfolios Overseen: 67 | | Retired; Member (since November 2014) of the Governing Council of the Independent Directors Council (organization of independent mutual fund directors); formerly President and Chief Executive Officer (2005-2012), Senior Vice President (2004-2005), Senior Vice President of Sales and Marketing (1997-2004), and various executive management positions (1990-1997), John Hancock Funds, LLC (asset management); Chairman, Investment Company Institute’s Sales Force Marketing Committee (2003-2008). | | None. |
Michael S. Hyland, CFA (71) Board Member Portfolios Overseen: 67 | | Retired (since February 2005); formerly Senior Managing Director (July 2001-February 2005) of Bear Stearns & Co, Inc.; Global Partner, INVESCO (1999-2001); Managing Director and President of Salomon Brothers Asset Management (1989-1999). | | None. |
Richard A. Redeker (73) Board Member & Independent Chair Portfolios Overseen: 67 | | Retired Mutual Fund Senior Executive (47 years); Management Consultant; Director, Mutual Fund Directors Forum (since 2014); Independent Directors Council (organization of independent mutual fund directors)-Executive Committee, Chair of Policy Steering Committee, Governing Council. | | None. |
Stephen G. Stoneburn (73) Board Member Portfolios Overseen: 67 | | Chairman (since July 2011), President and Chief Executive Officer (since June 1996) of Quadrant Media Corp. (publishing company); formerly President (June 1995-June 1996) of Argus Integrated Media, Inc.; Senior Vice President and Managing Director (January 1993-1995) of Cowles Business Media; Senior Vice President of Fairchild Publications, Inc. (1975-1989). | | None. |
Visit our website at prudentialfunds.com
| | | | |
| Interested Board Members(1) |
Name, Address, Age Position(s) Portfolios Overseen | | Principal Occupation(s) During Past Five Years | | Other Directorships Held During Past Five Years |
Stuart S. Parker (54) Board Member & President Portfolios Overseen: 67 | | President of Prudential Investments LLC (since January 2012); Executive Vice President of Prudential Investment Management Services LLC (since December 2012); Executive Vice President of Jennison Associates LLC and Head of Retail Distribution of Prudential Investments LLC (June 2005-December 2011). | | None. |
Scott E. Benjamin (43) Board Member & Vice President Portfolios Overseen: 67 | | Executive Vice President (since June 2009) of Prudential Investments LLC; Executive Vice President (June 2009-June 2012) and Vice President (since June 2012) of Prudential Investment Management Services LLC; Executive Vice President (since September 2009) of AST Investment Services, Inc.; Senior Vice President of Product Development and Marketing, Prudential Investments (since February 2006); Vice President of Product Development and Product Management, Prudential Investments (2003-2006). | | None. |
Grace C. Torres* (57) Board Member Portfolios Overseen: 65 | | Retired; formerly Treasurer and Principal Financial and Accounting Officer of the Prudential Investments Funds, Target Funds, Advanced Series Trust, Prudential Variable Contract Accounts and The Prudential Series Fund (1998-June 2014); Assistant Treasurer (March 1999-June 2014) and Senior Vice President (September 1999-June 2014) of Prudential Investments LLC; Assistant Treasurer (May 2003-June 2014) and Vice President (June 2005-June 2014) of AST Investment Services, Inc.; Senior Vice President and Assistant Treasurer (May 2003-June 2014) of Prudential Annuities Advisory Services, Inc. | | Director (since July 2015) of Sun Bancorp, Inc. N.A. |
| * | Note: Prior to her retirement in 2014, Ms. Torres was employed by Prudential Investments LLC. Due to her prior employment, she is considered to be an “interested person” under the 1940 Act. Ms. Torres is a Non-Management Interested Board Member. |
| (1) | The year that each Board Member joined the Board is as follows: |
Ellen S. Alberding; 2013; Kevin J. Bannon, 2008; Linda W. Bynoe, 2005; Keith F. Hartstein, 2013; Michael S. Hyland, 2008; Richard A. Redeker, 2003; Stephen G. Stoneburn, 1996; Grace C. Torres, 2014; Stuart S. Parker, Board Member and President since 2012; Scott E. Benjamin, Board Member since 2010 and Vice President since 2009.
Prudential QMA International Equity Fund
| | | | |
| Fund Officers(a) |
Name, Address and Age Position with Fund | | Principal Occupation(s) During Past Five Years | | Length of Service as Fund Officer |
Raymond A. O’Hara (61) Chief Legal Officer | | Vice President and Corporate Counsel (since July 2010) of Prudential Insurance Company of America (Prudential); Vice President (March 2011-Present) of Pruco Life Insurance Company and Pruco Life Insurance Company of New Jersey; Vice President and Corporate Counsel (March 2011-Present) of Prudential Annuities Life Assurance Corporation; Chief Legal Officer of Prudential Investments LLC (since June 2012); Chief Legal Officer of Prudential Mutual Fund Services LLC (since June 2012) and Corporate Counsel of AST Investment Services, Inc. (since June 2012); formerly Assistant Vice President and Corporate Counsel (September 2008-July 2010) of The Hartford Financial Services Group, Inc.; formerly Associate (September 1980-December 1987) and Partner (January 1988–August 2008) of Blazzard & Hasenauer, P.C. (formerly, Blazzard, Grodd & Hasenauer, P.C.). | | Since 2012 |
Chad A. Earnst (41) Chief Compliance Officer | | Chief Compliance Officer (September 2014-Present) of Prudential Investments LLC; Chief Compliance Officer (September 2014-Present) of the Prudential Investments Funds, Target Funds, Advanced Series Trust, The Prudential Series Fund, Prudential’s Gibraltar Fund, Inc., Prudential Global Short Duration High Yield Income Fund, Inc., Prudential Short Duration High Yield Fund, Inc. and Prudential Jennison MLP Income Fund, Inc.; formerly Assistant Director (March 2010-August 2014) of the Asset Management Unit, Division of Enforcement, US Securities & Exchange Commission; Assistant Regional Director (January 2010-August 2014), Branch Chief (June 2006–December 2009) and Senior Counsel (April 2003-May 2006) of the Miami Regional Office, Division of Enforcement, US Securities & Exchange Commission. | | Since 2014 |
Deborah A. Docs (58) Secretary | | Vice President and Corporate Counsel (since January 2001) of Prudential; Vice President (since December 1996) and Assistant Secretary (since March 1999) of Prudential Investments LLC; formerly Vice President and Assistant Secretary (May 2003-June 2005) of AST Investment Services, Inc. | | Since 2004 |
Jonathan D. Shain (58) Assistant Secretary | | Vice President and Corporate Counsel (since August 1998) of Prudential; Vice President and Assistant Secretary (since May 2001) of Prudential Investments LLC; Vice President and Assistant Secretary (since February 2001) of Prudential Mutual Fund Services LLC; formerly Vice President and Assistant Secretary (May 2003-June 2005) of AST Investment Services, Inc. | | Since 2005 |
Visit our website at prudentialfunds.com
| | | | |
| Fund Officers(a) |
Name, Address and Age Position with Fund | | Principal Occupation(s) During Past Five Years | | Length of Service as Fund Officer |
Claudia DiGiacomo (42) Assistant Secretary | | Vice President and Corporate Counsel (since January 2005) of Prudential; Vice President and Assistant Secretary of Prudential Investments LLC (since December 2005); Associate at Sidley Austin Brown & Wood LLP (1999-2004). | | Since 2005 |
Andrew R. French (53) Assistant Secretary | | Vice President and Corporate Counsel (since February 2010) of Prudential; formerly Director and Corporate Counsel (2006-2010) of Prudential; Vice President and Assistant Secretary (since January 2007) of Prudential Investments LLC; Vice President and Assistant Secretary (since January 2007) of Prudential Mutual Fund Services LLC. | | Since 2006 |
Theresa C. Thompson (54) Deputy Chief Compliance Officer | | Vice President, Compliance, Prudential Investments LLC (since April 2004); and Director, Compliance, Prudential Investments LLC (2001-2004). | | Since 2008 |
Charles H. Smith (43) Anti-Money Laundering Compliance Officer | | Vice President, Corporate Compliance, Anti-Money Laundering Unit (since January 2015) of Prudential; committee member of the American Council of Life Insurers Anti-Money Laundering and Critical Infrastructure Committee (since January 2016); formerly Global Head of Economic Sanctions Compliance at AIG Property Casualty (February 2007 – December 2014); Assistant Attorney General at the New York State Attorney General’s Office, Division of Public Advocacy. (August 1998 —January 2007). | | Since 2016 |
M. Sadiq Peshimam (52) Treasurer and Principal Financial and Accounting Officer | | Vice President (since 2005) of Prudential Investments LLC; formerly Assistant Treasurer of funds in the Prudential Mutual Fund Complex (2006-2014). | | Since 2006 |
Peter Parrella (58) Assistant Treasurer | | Vice President (since 2007) and Director (2004-2007) within Prudential Mutual Fund Administration; formerly Tax Manager at SSB Citi Fund Management LLC (1997-2004). | | Since 2007 |
Lana Lomuti (49) Assistant Treasurer | | Vice President (since 2007) and Director (2005-2007), within Prudential Mutual Fund Administration; formerly Assistant Treasurer (December 2007-February 2014) of The Greater China Fund, Inc. | | Since 2014 |
Linda McMullin (55) Assistant Treasurer | | Vice President (since 2011) and Director (2008-2011) within Prudential Mutual Fund Administration. | | Since 2014 |
Kelly A. Coyne (48) Assistant Treasurer | | Director, Investment Operations of Prudential Mutual Fund Services LLC (since 2010). | | Since 2015 |
Prudential QMA International Equity Fund
| (a) | Excludes Mr. Parker and Mr. Benjamin, interested Board Members who also serve as President and Vice President, respectively. |
Explanatory Notes to Tables:
| • | | Board Members are deemed to be “Interested,” as defined in the 1940 Act, by reason of their affiliation with Prudential Investments LLC and/or an affiliate of Prudential Investments LLC. |
| • | | Unless otherwise noted, the address of all Board Members and Officers is c/o Prudential Investments LLC, 655 Broad Street, Newark, New Jersey 07102-4410. |
| • | | There is no set term of office for Board Members or Officers. The Board Members have adopted a retirement policy, which calls for the retirement of Board Members on December 31 of the year in which they reach the age of 75. |
| • | | “Other Directorships Held” includes only directorships of companies required to register or file reports with the SEC under the 1934 Act (that is, “public companies”) or other investment companies registered under the 1940 Act. |
| • | | “Portfolios Overseen” includes all investment companies managed by Prudential Investments LLC. The investment companies for which Prudential Investments LLC serves as manager include the Prudential Investments Mutual Funds, The Prudential Variable Contract Accounts, Target Mutual Funds, Prudential Short Duration High Yield Fund, Inc., Prudential Global Short Duration High Yield Fund, Inc., The Prudential Series Fund, Prudential’s Gibraltar Fund, Inc. and the Advanced Series Trust. |
Visit our website at prudentialfunds.com
Approval of Advisory Agreements (unaudited)
The Fund’s Board of Directors
The Board of Directors (the “Board”) of Prudential QMA International Equity Fund (the “Fund”)1 consists of ten individuals, seven of whom are not “interested persons” of the Fund, as defined in the Investment Company Act of 1940, as amended (the “1940 Act”) (the “Independent Directors”). The Board is responsible for the oversight of the Fund and its operations, and performs the various duties imposed on the directors of investment companies by the 1940 Act. The Independent Directors have retained independent legal counsel to assist them in connection with their duties. The Chair of the Board is an Independent Director. The Board has established three standing committees: the Audit Committee, the Nominating and Governance Committee, and the Investment Committee. Each committee is chaired by, and composed of, Independent Directors.
Annual Approval of the Fund’s Advisory Agreements
As required under the 1940 Act, the Board determines annually whether to renew the Fund’s management agreement with Prudential Investments LLC (“PI”) and the Fund’s subadvisory agreement with Quantitative Management Associates LLC (“QMA”). In considering the renewal of the agreements, the Board, including all of the Independent Directors, met on June 7-9, 2016 and approved the renewal of the agreements through July 31, 2017, after concluding that the renewal of the agreements was in the best interests of the Fund and its shareholders.
In advance of the meetings, the Board requested and received materials relating to the agreements, and had the opportunity to ask questions and request further information in connection with their consideration. Among other things, the Board considered comparative fee information from PI and QMA. Also, the Board considered comparisons with other mutual funds in relevant Peer Universes and Peer Groups, as is further discussed below.
In approving the agreements, the Board, including the Independent Directors advised by independent legal counsel, considered the factors it deemed relevant, including the nature, quality and extent of services provided by PI and the subadviser, the performance of the Fund, the profitability of PI and its affiliates, expenses and fees, and the potential for economies of scale that may be shared with the Fund and its shareholders as the Fund’s assets grow. In their deliberations, the Directors did not identify any single factor which alone was responsible for the Board’s decision to approve the agreements with respect to the Fund. In connection with its deliberations, the Board considered information provided by PI throughout the year at regular Board meetings, presentations from portfolio managers and other information, as well as information furnished at or in advance of the meetings on June 7-9, 2016.
| 1 | Prudential QMA International Equity Fund is a series of Prudential World Fund, Inc. |
| | |
| Prudential QMA International Equity Fund |
Approval of Advisory Agreements (continued)
The Directors determined that the overall arrangements between the Fund and PI, which serves as the Fund’s investment manager pursuant to a management agreement, and between PI and QMA, which serves as the Fund’s subadviser pursuant to the terms of a subadvisory agreement with PI, are in the best interests of the Fund and its shareholders in light of the services performed, fees charged and such other matters as the Directors considered relevant in the exercise of their business judgment.
The material factors and conclusions that formed the basis for the Directors’ reaching their determinations to approve the continuance of the agreements are separately discussed below.
Nature, Quality, and Extent of Services
The Board received and considered information regarding the nature, quality and extent of services provided to the Fund by PI and QMA. The Board considered the services provided by PI, including but not limited to the oversight of the subadviser for the Fund, as well as the provision of fund recordkeeping, compliance, and other services to the Fund. With respect to PI’s oversight of the subadviser, the Board noted that PI’s Strategic Investment Research Group (“SIRG”), which is a business unit of PI, is responsible for monitoring and reporting to PI’s senior management on the performance and operations of the subadviser. The Board also considered that PI pays the salaries of all of the officers and interested Directors of the Fund who are part of Fund management. The Board also considered the investment subadvisory services provided by QMA, as well as adherence to the Fund’s investment restrictions and compliance with applicable Fund policies and procedures. The Board considered PI’s evaluation of the subadviser, as well as PI’s recommendation, based on its review of the subadviser, to renew the subadvisory agreements.
The Board considered the qualifications, backgrounds and responsibilities of PI’s senior management responsible for the oversight of the Fund and QMA, and also considered the qualifications, backgrounds and responsibilities of QMA’s portfolio managers who are responsible for the day-to-day management of the Fund’s portfolio. The Board was provided with information pertaining to PI’s and QMA’s organizational structure, senior management, investment operations, and other relevant information pertaining to both PI and QMA. The Board also noted that it received favorable compliance reports from the Fund’s Chief Compliance Officer (“CCO”) as to both PI and QMA. The Board noted that QMA is affiliated with PI.
The Board concluded that it was satisfied with the nature, extent and quality of the investment management services provided by PI and the subadvisory services provided to the Fund by QMA, and that there was a reasonable basis on which to conclude that the Fund benefits from the services provided by PI and QMA under the management and subadvisory agreements.
| | |
| Visit our website at prudentialfunds.com | | |
Costs of Services and Profits Realized by PI
The Board was provided with information on the profitability of PI and its affiliates in serving as the Fund’s investment manager. The Board discussed with PI the methodology utilized in assembling the information regarding profitability and considered its reasonableness. The Board recognized that it is difficult to make comparisons of profitability from fund management contracts because comparative information is not generally publicly available and is affected by numerous factors, including the structure of the particular adviser, the types of funds it manages, its business mix, numerous assumptions regarding allocations and the adviser’s capital structure and cost of capital. The Board further noted that the subadviser is affiliated with PI and that its profitability is reflected in PI’s profitability report. Taking these factors into account, the Board concluded that the profitability of PI and its affiliates in relation to the services rendered was not unreasonable.
Economies of Scale
PI and the Board previously retained an outside business consulting firm to review management fee breakpoint usage and trends in management fees across the mutual fund industry. The consulting firm presented its analysis and conclusions as to the Funds’ management fee structures to the Board and PI. The Board and PI have discussed these conclusions extensively since that presentation.
The Board received and discussed information concerning economies of scale that PI may realize as the Fund’s assets grow beyond current levels. The Board noted that the management fee schedule for the Fund includes breakpoints, which have the effect of decreasing the fee rate as assets increase, and that at its current level of assets the Fund’s effective fee rate reflected those rate reductions. The Board took note that the Fund’s fee structure currently results in benefits to Fund shareholders whether or not PI realizes any economies of scale. The Board noted that economies of scale can be shared with the Fund in other ways, including low management fees from inception, additional technological and personnel investments to enhance shareholder services, and maintaining existing expense structures in the face of a rising cost environment. The Board also considered PI’s assertion that it continually evaluates the management fee schedule of the Fund and the potential to share economies of scale through breakpoints or fee waivers as asset levels increase.
The Board recognized the inherent limitations of any analysis of economies of scale, stemming largely from the Board’s understanding that most of PI’s costs are not specific to individual funds, but rather are incurred across a variety of products and services.
| | |
| Prudential QMA International Equity Fund |
Approval of Advisory Agreements (continued)
Other Benefits to PI and QMA
The Board considered potential ancillary benefits that might be received by PI and QMA and their affiliates as a result of their relationship with the Fund. The Board concluded that potential benefits to be derived by PI included transfer agency fees received by the Fund’s transfer agent (which is affiliated with PI), and benefits to its reputation as well as other intangible benefits resulting from PI’s association with the Fund. The Board concluded that the potential benefits to be derived by QMA included its ability to use soft dollar credits, as well as the potential benefits consistent with those generally resulting from an increase in assets under management, specifically, potential access to additional research resources and benefits to its reputation. The Board concluded that the benefits derived by PI and QMA were consistent with the types of benefits generally derived by investment managers and subadvisers to mutual funds.
Performance of the Fund / Fees and Expenses
The Board considered certain additional specific factors and made related conclusions relating to the historical performance of the Fund for the one-, three-, five-, and ten-year periods ended December 31, 2015.
The Board also considered the Fund’s actual management fee, as well as the Fund’s net total expense ratio, for the fiscal year ended October 31, 2015. The Board considered the management fee for the Fund as compared to the management fee charged by PI to other funds and the fee charged by other advisers to comparable mutual funds in a Peer Group. The actual management fee represents the fee rate actually paid by Fund shareholders and includes any fee waivers or reimbursements. The net total expense ratio for the Fund represents the actual expense ratio incurred by Fund shareholders.
The mutual funds included in the Peer Universe (the Lipper International Multi-Cap Core Funds Performance Universe) and the Peer Group were objectively determined by Broadridge, an independent provider of mutual fund data. The comparisons placed the Fund in various quartiles, with the first quartile being the best 25% of the mutual funds (for performance, the best performing mutual funds and, for expenses, the lowest cost mutual funds).
The section below summarizes key factors considered by the Board and the Board’s conclusions regarding the Fund’s performance, fees and overall expenses. The table sets forth gross performance comparisons (which do not reflect the impact on performance of fund expenses, or any subsidies, expense caps or waivers that may be applicable) with the Peer Universe, actual management fees with the Peer Group (which reflect the impact of
| | |
| Visit our website at prudentialfunds.com | | |
any subsidies or fee waivers), and net total expenses with the Peer Group, each of which were key factors considered by the Board.
| | | | | | | | |
| Performance | | 1 Year | | 3 Years | | 5 Years | | 10 Years |
| | 4th Quartile | | 4th Quartile | | 2nd Quartile | | 4th Quartile |
| Actual Management Fees: 4th Quartile |
| Net Total Expenses: 4th Quartile |
| | • | | The Board considered PI’s representation that, because the Fund is more heavily weighted towards emerging markets than its peers, the Fund’s benchmark is a better comparative source against which to evaluate the Fund’s performance. |
| | • | | In this regard, the Board noted that the Fund outperformed its benchmark index over the one-, three- and five-year periods, although it underperformed over the ten-year period. |
| | • | | The Board also noted that because emerging markets performed well in the first part of 2016, the Fund’s ranking in its Peer Universe had risen to the 2nd quartile through the first quarter. |
| | • | | The Board considered information provided by PI indicating that, although the Fund’s actual management fee and net total expenses both ranked in the fourth quartile, the Fund’s actual management fee was within nine basis points of the median of all funds in the Peer Group, and the Fund’s net total expenses ranking in the Peer Group was affected by the fact that the Fund had a large number of small balance accounts resulting in relatively high transfer agency fees. |
| | • | | The Board concluded that, in light of the above, it would be in the best interests of the Fund and its shareholders to renew the agreements. |
| | • | | The Board concluded that the management fees (including subadvisory fees) and total expenses were reasonable in light of the services provided. |
* * *
After full consideration of these factors, the Board concluded that approval of the agreements was in the best interests of the Fund and its shareholders.
| | |
| Prudential QMA International Equity Fund |
| | | | |
| ∎ MAIL | | ∎ TELEPHONE | | ∎ WEBSITE |
655 Broad Street Newark, NJ 07102 | | (800) 225-1852 | | www.prudentialfunds.com |
|
| PROXY VOTING |
| The Board of Directors of the Fund has delegated to the Fund’s investment subadviser the responsibility for voting any proxies and maintaining proxy recordkeeping with respect to the Fund. A description of these proxy voting policies and procedures is available without charge, upon request, by calling (800) 225-1852 or by visiting the Securities and Exchange Commission’s website at www.sec.gov. Information regarding how the Fund voted proxies relating to portfolio securities during the most recent 12-month period ended June 30 is available on the Fund’s website and on the Securities and Exchange Commission’s website. |
|
| DIRECTORS |
| Ellen S. Alberding • Kevin J. Bannon • Scott E. Benjamin • Linda W. Bynoe • Keith F. Hartstein • Michael S. Hyland • Stuart S. Parker • Richard A. Redeker • Stephen G. Stoneburn • Grace C. Torres |
|
| OFFICERS |
| Stuart S. Parker, President • Scott E. Benjamin, Vice President • M. Sadiq Peshimam, Treasurer and Principal Financial and Accounting Officer • Raymond A. O’Hara, Chief Legal Officer • Deborah A. Docs, Secretary • Chad A. Earnst, Chief Compliance Officer • Theresa C. Thompson, Deputy Chief Compliance Officer • Charles H. Smith, Anti-Money Laundering Compliance Officer • Jonathan D. Shain, Assistant Secretary • Claudia DiGiacomo, Assistant Secretary • Andrew R. French, Assistant Secretary • Peter Parrella, Assistant Treasurer • Lana Lomuti, Assistant Treasurer • Linda McMullin, Assistant Treasurer • Kelly A. Coyne, Assistant Treasurer |
| | | | |
| MANAGER | | Prudential Investments LLC | | 655 Broad Street
Newark, NJ 07102 |
|
| INVESTMENT SUBADVISER | | Quantitative Management Associates LLC | | Gateway Center Two
100 Mulberry Street
Newark, NJ 07102 |
|
| DISTRIBUTOR | | Prudential Investment
Management Services LLC | | 655 Broad Street
Newark, NJ 07102 |
|
| CUSTODIAN | | The Bank of New York Mellon | | One Wall Street
New York, NY 10286 |
|
| TRANSFER AGENT | | Prudential Mutual Fund
Services LLC | | PO Box 9658
Providence, RI 02940 |
|
| INDEPENDENT REGISTERED PUBLIC ACCOUNTING FIRM | | KPMG LLP | | 345 Park Avenue New York, NY 10154 |
|
| FUND COUNSEL | | Willkie Farr & Gallagher LLP | | 787 Seventh Avenue
New York, NY 10019 |
|
|
| An investor should consider the investment objectives, risks, charges, and expenses of the Fund carefully before investing. The prospectus and summary prospectus contain this and other information about the Fund. An investor may obtain a prospectus and summary prospectus by visiting our website at www.prudentialfunds.com or by calling (800) 225-1852. The prospectus and summary prospectus should be read carefully before investing. |
|
| E-DELIVERY |
| To receive your mutual fund documents online, go to www.prudentialfunds.com/edelivery and enroll. Instead of receiving printed documents by mail, you will receive notification via email when new materials are available. You can cancel your enrollment or change your email address at any time by visiting the website address above. |
|
| SHAREHOLDER COMMUNICATIONS WITH DIRECTORS |
| Shareholders can communicate directly with the Board of Directors by writing to the Chair of the Board, Prudential QMA International Equity Fund, Prudential Investments, Attn: Board of Directors, 655 Broad Street, Newark, NJ 07102. Shareholders can communicate directly with an individual Director by writing to the same address. Communications are not screened before being delivered to the addressee. |
|
| AVAILABILITY OF PORTFOLIO SCHEDULE |
| The Fund files its complete schedule of portfolio holdings with the Securities and Exchange Commission for the first and third quarters of each fiscal year on Form N-Q. The Fund’s Forms N-Q are available on the Commission’s website at www.sec.gov. The Fund’s Forms N-Q may also be reviewed and copied at the Commission’s Public Reference Room in Washington, D.C. Information on the operation and location of the Public Reference Room may be obtained by calling (202) 551-8090. The Fund’s schedule of portfolio holdings is also available on the Fund’s website as of the end of each month no sooner than 15 days after the end of the month. |
|
| The Fund’s Statement of Additional Information contains additional information about the Fund’s Directors and is available without charge, upon request, by calling (800) 225-1852. |
Mutual Funds:
| | | | |
ARE NOT INSURED BY THE FDIC OR ANY
FEDERAL GOVERNMENT AGENCY | | MAY LOSE VALUE | | ARE NOT A DEPOSIT OF OR GUARANTEED
BY ANY BANK OR ANY BANK AFFILIATE |
PRUDENTIAL QMA INTERNATIONAL EQUITY FUND
| | | | | | | | |
| SHARE CLASS | | A | | B | | C | | Z |
| NASDAQ | | PJRAX | | PJRBX | | PJRCX | | PJIZX |
| CUSIP | | 743969859 | | 743969867 | | 743969875 | | 743969883 |
MF190E 0300066-00001-00
PRUDENTIAL INVESTMENTS, A PGIM BUSINESS | MUTUAL FUNDS
Prudential Emerging Markets Debt Local Currency Fund
| | |
| ANNUAL REPORT | | OCTOBER 31, 2016 |

| | |
To enroll in e-delivery, go to prudentialfunds.com/edelivery | |  |
|
Objective: Total return, through a combination of current income and
capital appreciation |
Highlights
PRUDENTIAL EMERGING MARKETS DEBT LOCAL CURRENCY FUND
| • | | The Fund underperformed the JP Morgan GBI-EM Global Diversified Index due primarily to foreign currency selection and yield curve positioning. (For a complete list of holdings, refer to the Portfolio of Investments section of this report.) |
| • | | Within foreign currency selection, the Fund was hurt most by its overweights in the Mexican peso, Chilean peso, and Turkish lira as well as its underweight in the Brazilian real. |
| • | | Local duration positioning contributed positively to the Fund’s returns. |
This report is not authorized for distribution to prospective investors unless preceded or accompanied by a current prospectus.
The views expressed in this report and information about the Fund’s portfolio holdings are for the period covered by this report and are subject to change thereafter.
Mutual funds are distributed by Prudential Investment Management Services LLC (PIMS), member SIPC. PGIM Fixed Income is a unit of PGIM, Inc. (PGIM), a registered investment adviser. PIMS and PGIM are Prudential Financial companies. © 2016 Prudential Financial, Inc. and its related entities. The Prudential logo and the Rock symbol are service marks of Prudential Financial, Inc. and its related entities, registered in many jurisdictions worldwide.
| | |
| 2 | | Visit our website at prudentialfunds.com |
Letter from the President

Dear Shareholder:
We hope you find the annual report for the Prudential Emerging Markets Debt Local Currency Fund informative and useful. The report covers performance for the 12-month period that ended October 31, 2016.
During the reporting period, the US economy experienced modest growth. Labor markets were healthy, and consumer confidence rose. The housing market brightened somewhat, as momentum continued for the new home market. The Federal Reserve kept interest rates unchanged at its September meeting, but pointed to the strong possibility of a rate hike in December. Internationally, concerns over Brexit—the term used to represent Britain’s decision to leave the European Union—remained in the spotlight.
Equity markets in the US were firmly in positive territory at the end of the reporting period, as US stocks posted strong gains. European stocks struggled earlier, but found some traction in the third quarter. Asian markets also advanced, and emerging markets rose sharply.
US fixed income markets experienced overall gains. High yield bonds posted very strong results. Corporate bonds and Treasuries also performed well. Accommodative monetary policy by central banks helped lift global bond markets.
Given the uncertainty in today’s investment environment, we believe that active professional portfolio management offers a potential advantage. Active managers often have the knowledge and flexibility to find the best investment opportunities in the most challenging markets.
Even so, it’s best if investment decisions are based on your long-term goals rather than on short-term market and economic developments. We also encourage you to work with an experienced financial advisor who can help you set goals, determine your tolerance for risk, build a diversified plan that’s right for you, and make adjustments when necessary.
By having Prudential Investments help you address your goals, you gain the advantage of asset managers that also manage money for many major corporations and pension funds around the world. That means you benefit from the same expertise, innovation, and attention to risk demanded by today’s most sophisticated investors.
Thank you for choosing our family of funds.
Sincerely,

Stuart S. Parker, President
Prudential Emerging Markets Debt Local Currency Fund
December 15, 2016
| | | | |
| Prudential Emerging Markets Debt Local Currency Fund | | | 3 | |
Your Fund’s Performance (unaudited)
Performance data quoted represent past performance. Past performance does not guarantee future results. The investment return and principal value of an investment will fluctuate, so that an investor’s shares, when redeemed, may be worth more or less than their original cost. Current performance may be lower or higher than the past performance data quoted. An investor may obtain performance data as of the most recent month-end by visiting our website at www.prudentialfunds.com or by calling (800) 225-1852.
| | | | | | | | | | | | |
| Cumulative Total Returns (Without Sales Charges) as of 10/31/16 | |
| | | One Year (%) | | | | Five Years (%) | | | | Since Inception (%) | |
| Class A | | | 9.29 | | | | –6.42 | | | | –9.36 (3/30/11) | |
| Class C | | | 8.61 | | | | –9.77 | | | | –12.22 (3/30/11) | |
| Class Q | | | 9.55 | | | | –4.35 | | | | –7.35 (3/30/11) | |
| Class Z | | | 9.31 | | | | –4.65 | | | | –7.64 (3/30/11) | |
| JP Morgan Government Bond Index-Emerging Markets Global Diversified Index | | | 11.04 | | | | –5.82 | | | | –5.48 | |
| Lipper Emerging Markets Local Currency Debt Funds Average | | | 9.63 | | | | –6.34 | | | | –7.12 | |
| | | | | | | | | | | | |
| Average Annual Total Returns (With Sales Charges) as of 9/30/16 | |
| | | One Year (%) | | | | Five Years (%) | | | | Since Inception (%) | |
| Class A | | | 9.91 | | | | –0.82 | | | | –2.43 (3/30/11) | |
| Class C | | | 13.33 | | | | –0.66 | | | | –2.17 (3/30/11) | |
| Class Q | | | 15.48 | | | | 0.53 | | | | –1.22 (3/30/11) | |
| Class Z | | | 15.41 | | | | 0.50 | | | | –1.25 (3/30/11) | |
| JP Morgan Government Bond Index-Emerging Markets Global Diversified Index | | | 17.06 | | | | 0.06 | | | | –0.87 | |
| Lipper Emerging Markets Local Currency Debt Funds Average | | | 14.81 | | | | –0.12 | | | | –1.23 | |
| | | | | | | | | | | | | |
| | | | | | | | | | |
| Average Annual Total Returns (With Sales Charges) as of 10/31/16 | |
| | One Year (%) | | | Five Years (%) | | | | Since Inception (%) | |
| Class A | | 4.38 | | | –2.22 | | | | –2.55 (3/30/11) | |
| Class C | | 7.61 | | | –2.03 | | | | –2.30 (3/30/11) | |
| Class Q | | 9.55 | | | –0.89 | | | | –1.36 (3/30/11) | |
| Class Z | | 9.31 | | | –0.95 | | | | –1.41 (3/30/11) | |
| | | | | | | | | | |
| Average Annual Total Returns (Without Sales Charges) as of 10/31/16 | |
| | One Year (%) | | | Five Years (%) | | | | Since Inception (%) | |
| Class A | | 9.29 | | | –1.32 | | | | –1.74 (3/30/11) | |
| Class C | | 8.61 | | | –2.03 | | | | –2.30 (3/30/11) | |
| Class Q | | 9.55 | | | –0.89 | | | | –1.36 (3/30/11) | |
| Class Z | | 9.31 | | | –0.95 | | | | –1.41 (3/30/11) | |
| | |
| 4 | | Visit our website at prudentialfunds.com |
Growth of a $10,000 Investment
The graph compares a $10,000 investment in the Prudential Emerging Markets Debt Local Currency Fund (Class A shares) with a similar investment in the JP Morgan Government Bond Index-Emerging Markets Global Diversified Index by portraying the initial account values at the commencement of operations for Class A shares (March 30, 2011) and the account values at the end of the current fiscal year (October 31, 2016), as measured on a quarterly basis. For purposes of the graph, and unless otherwise indicated, it has been assumed that (a) the maximum applicable front-end sales charge was deducted from the initial $10,000 investment in Class A shares; (b) all recurring fees (including management fees) were deducted; and (c) all dividends and distributions were reinvested. The line graph provides information for Class A shares only. As indicated in the tables provided earlier, performance for Class C, Class Q, and Class Z shares will vary due to the differing charges and expenses applicable to each share class (as indicated in the following paragraphs). Without waiver of fees and/or expense reimbursement, if any, the Fund’s returns would have been lower.
Past performance does not predict future performance. Total returns and the ending account values in the graph include changes in share price and reinvestment of dividends and capital gains distributions in a hypothetical investment for the periods shown. The Fund’s total returns do not reflect the deduction of income taxes on an individual’s investment. Taxes may reduce your actual investment returns on income or gains paid by the Fund or any gains you may realize if you sell your shares.
Source: Prudential Investments LLC and Lipper Inc.
Inception returns are provided for any share class with less than 10 calendar years of returns.
| | | | |
| Prudential Emerging Markets Debt Local Currency Fund | | | 5 | |
Your Fund’s Performance (continued)
The returns in the tables do not reflect the deduction of taxes that a shareholder would pay on Fund distributions or following the redemption of Fund shares. The average annual total returns take into account applicable sales charges, which are described for each share class in the table below.
| | | | | | | | |
| | | Class A | | Class C | | Class Q | | Class Z |
| Maximum initial sales charge | | 4.50% of the public offering price | | None | | None | | None |
| Contingent deferred sales charge (CDSC) (as a percentage of the lower of original purchase price or net asset value at redemption) | | 1% on sales of $1 million or more made within 12 months of purchase | | 1% on sales made within 12 months of purchase | | None | | None |
| Annual distribution and service (12b-1) fees (shown as a percentage of average daily net assets) | | .25% | | 1% | | None | | None |
Benchmark Definitions
JP Morgan Government Bond Index-Emerging Markets Global Diversified Index—The JP Morgan Government Bond Index-Emerging Markets Global Diversified Index (JP Morgan GBI-EM Global Diversified Index), an unmanaged index, is a comprehensive emerging markets debt benchmark that tracks local currency bonds issued by emerging market governments.
Lipper Emerging Markets Local Currency Debt Funds Average—The Lipper Emerging Markets Local Currency Debt Funds Average (Lipper Average) is based on the average return of all funds in the Lipper Emerging Markets Local Currency Debt Funds category for the periods noted. Funds in the Lipper Average seek either current income or total return by investing at least 65% of total assets in debt issues denominated in the currency of their market of issuance. “Emerging market” is defined by a country’s GNP per capita or other economic measures.
Investors cannot invest directly in an index or average. The returns for the Index would be lower if they included the effects of sales charges, operating expenses of a mutual fund, or taxes. Returns for the Lipper Average reflect the deduction of operating expenses, but not sales charges or taxes. The Since Inception returns for the Index and the Lipper Average are measured from the closest month-end to the inception date for the indicated share class.
| | |
| 6 | | Visit our website at prudentialfunds.com |
| | | | | | |
| Distributions and Yields as of 10/31/16 |
| | Total Distributions
Paid for
12 Months ($) | | SEC 30-Day
Subsidized
Yield* (%) | | SEC 30-Day
Unsubsidized
Yield** (%) |
| Class A | | 0.36 | | 4.99 | | 3.95 |
| Class C | | 0.32 | | 4.41 | | 3.34 |
| Class Q | | 0.38 | | 5.52 | | 4.25 |
| Class Z | | 0.38 | | 5.40 | | 4.34 |
*SEC 30-Day Subsidized Yield (%)—A standardized yield calculation created by the Securities and Exchange Commission, it reflects the income earned during a 30-day period, after the deduction of the Fund’s net expenses (net of any expense waivers or reimbursements).
**SEC 30-Day Unsubsidized Yield (%)— A standardized yield calculation created by the Securities and Exchange Commission, it reflects the income earned during a 30-day period, after the deduction of the Fund’s gross expenses.
| | | | |
| Credit Quality expressed as a percentage of total investments as of 10/31/16 (%) | |
| AA | | | 0.3 | |
| A | | | 25.2 | |
| BBB | | | 50.3 | |
| BB | | | 13.5 | |
| B | | | 4.1 | |
| C | | | 0.1 | |
| Cash/Cash Equivalents | | | 6.4 | |
| Total Investments | | | 100.0 | |
Source: PGIM, Inc.
Credit ratings reflect the highest rating assigned by a nationally recognized statistical rating organization (NRSRO) such as Moody’s Investor Service, Inc. (Moody’s), Standard & Poor’s (S&P), or Fitch, Inc. (Fitch). Credit ratings reflect the common nomenclature used by both S&P and Fitch. Where applicable, ratings are converted to the comparable S&P/Fitch rating tier nomenclature. These rating agencies are independent and are widely used. The Not Rated category consists of securities that have not been rated by a NRSRO. Credit ratings are subject to change. Values may not sum to 100.0% due to rounding.
| | | | |
| Prudential Emerging Markets Debt Local Currency Fund | | | 7 | |
Strategy and Performance Overview
How did the Fund perform?
The Prudential Emerging Markets Debt Local Currency Fund’s Class A shares returned 9.29% for the 12-month period ended October 31, 2016, underperforming the 11.04% return of the JP Morgan GBI-EM Global Diversified Index (the Index). The Fund modestly underperformed the 9.63% return of the Lipper Emerging Markets Local Currency Debt Funds Average.
What were market conditions?
| • | | During the fourth quarter of 2015, emerging markets debt generated flat to slightly positive returns. Hard currency sovereign bonds recorded gains, while local currency bonds and emerging markets currencies ended the quarter about where they started. Within local currency bonds, deteriorating credit stories dominated, as many emerging markets countries were negatively affected by commodity price declines and the poor performance of their currencies versus a strong US dollar. |
| • | | Local currency bonds advanced during the first quarter of 2016, supported by the accommodative monetary policies of developed markets’ central banks, recovery in emerging markets currencies, higher commodity prices, and improving investor sentiment. Emerging markets currencies appreciated versus the US dollar on a more dovish stance by the Federal Reserve (Fed), along with negative interest rates and quantitative easing by the European Central Bank and Bank of Japan. (A dovish stance generally implies lower interest rates.) |
| • | | In the second quarter, emerging markets debt overall performed well, benefiting from investors’ search for higher yields in the low-interest-rate environment. In late June, the UK’s surprise vote to leave the European Union, commonly known as “Brexit,” increased market volatility. |
| • | | Local currency bonds and emerging markets currencies generated marginally positive returns during the third quarter, shaking off the negative impact of the Brexit vote. With a few exceptions, inflation remained well contained in most emerging markets countries, which helped the performance of local currency bonds. Meanwhile, emerging markets currencies strengthened amid improving economic growth, significant adjustments in many countries’ current account balances, attractive yields, and developed markets’ accommodative monetary policies and low yields. |
What worked?
| • | | Local duration positioning was a positive contributor to performance. The largest contributor was a long position in Brazil, which performed well on the back of the impeachment of former President Dilma Rousseff and the transition to President Temer which was well received by the market. Long-duration positions in Indonesia, which performed well on the back of rate cuts and improving sentiment, and Russia also added to performance. |
| | |
| 8 | | Visit our website at prudentialfunds.com |
| • | | A flattener in Thailand along with security selection in Mexico added to performance. Hard currency, off-index allocations to Argentina and Venezuela also helped performance. |
What didn’t work?
| • | | EM FX hurt performance. Overweights to the Mexican peso, Turkish lira, and Chilean peso, along with an underweight to the Brazilian real detracted from performance. The recovery in EM FX reflected a more dovish stance from the Fed, along with negative interest rates and other ramifications of quantitative easing from the ECB and BOJ. This, combined with the rebound in commodity prices and stabilizing economic conditions in China, resulted in the US dollar weakening against higher-yielding and commodity currencies in particular. |
| • | | Yield curve positioning and issue selection detracted from performance. A position in off-index, inflation-linked paper in Brazil was the primary detractor as nominal bonds outperformed inflation-linked bonds. Security selection in South Africa also hurt performance. |
| • | | Short-duration positions in Colombia and Peru detracted from performance. |
Did the Fund use derivatives and how did they affect performance?
| • | | Currency positioning in the Fund was partially facilitated by the use of currency forward contracts. During the reporting period, the Fund’s currency positioning detracted from relative performance. |
| • | | The Fund also used interest rate swaps to help manage duration and yield curve exposure, which had a neutral impact on performance. |
Current outlook
| • | | PGIM Fixed Income expects to find attractive opportunities in long-duration securities in select countries and along their yield curves. |
| • | | In terms of Mexico, the steepness of its yield curve implies many more rate hikes than may actually occur. PGIM Fixed Income sees value mostly in the five-year segment of the curve. |
| • | | Regarding investments in Brazil, PGIM Fixed Income prefers a mix of nominal bonds and inflation-linked bonds as real interest rates remain high. In addition, more positive political and economic dynamics through the rest of 2016 should help temper the inflation and fiscal outlooks. |
| • | | PGIM Fixed Income considers the value and dynamics of Indonesian local currency bonds attractive. |
| | | | |
| Prudential Emerging Markets Debt Local Currency Fund | | | 9 | |
Fees and Expenses (unaudited)
As a shareholder of the Fund, you incur two types of costs: (1) transaction costs, including sales charges (loads) on purchase payments and redemptions, as applicable, and (2) ongoing costs, including management fees, distribution, and/or service (12b-1) fees, and other Fund expenses, as applicable. This example is intended to help you understand your ongoing costs (in dollars) of investing in the Fund and to compare these costs with the ongoing costs of investing in other mutual funds.
The example is based on an investment of $1,000 invested on May 1, 2016, at the beginning of the period, and held through the six-month period ended October 31, 2016. The example is for illustrative purposes only; you should consult the Prospectus for information on initial and subsequent minimum investment requirements.
Actual Expenses
The first line for each share class in the table on the following page provides information about actual account values and actual expenses. You may use the information on this line, together with the amount you invested, to estimate the expenses that you paid over the period. Simply divide your account value by $1,000 (for example, an $8,600 account value ÷ $1,000 = 8.6), then multiply the result by the number on the first line under the heading “Expenses Paid During the Six-Month Period” to estimate the expenses you paid on your account during this period.
Hypothetical Example for Comparison Purposes
The second line for each share class in the table on the following page provides information about hypothetical account values and hypothetical expenses based on the Fund’s actual expense ratio and an assumed rate of return of 5% per year before expenses, which is not the Fund’s actual return. The hypothetical account values and expenses may not be used to estimate the actual ending account balance or expenses you paid for the period. You may use this information to compare the ongoing costs of investing in the Fund and other funds. To do so, compare this 5% hypothetical example with the 5% hypothetical examples that appear in the shareholder reports of the other funds.
The Fund’s transfer agent may charge additional fees to holders of certain accounts that are not included in the expenses shown in the table on the following page. These fees apply to individual retirement accounts (IRAs) and Section 403(b) accounts. As of the close of the six-month period covered by the table, IRA fees included an annual maintenance fee of $15 per account (subject to a maximum annual maintenance fee of $25 for all accounts held by the same shareholder). Section 403(b) accounts are charged an annual $25 fiduciary maintenance fee. Some of the fees may vary in amount, or may be waived, based on your total account balance or the number of Prudential Investments funds, including the Fund, that you own. You should consider the additional fees that were charged to your
| | |
| 10 | | Visit our website at prudentialfunds.com |
Fund account over the six-month period when you estimate the total ongoing expenses paid over the period and the impact of these fees on your ending account value, as these additional expenses are not reflected in the information provided in the expense table. Additional fees have the effect of reducing investment returns.
Please note that the expenses shown in the table are meant to highlight your ongoing costs only and do not reflect any transactional costs such as sales charges (loads). Therefore, the second line for each share class in the table is useful in comparing ongoing costs only and will not help you determine the relative total costs of owning different funds. In addition, if these transactional costs were included, your costs would have been higher.
| | | | | | | | | | | | | | | | | | |
Prudential
Emerging Markets Debt
Local Currency Fund | | Beginning Account
Value
May 1, 2016 | | | Ending Account
Value
October 31, 2016 | | | Annualized
Expense Ratio
Based on the
Six-Month Period | | | Expenses Paid
During the
Six-Month Period* | |
| Class A | | Actual | | $ | 1,000.00 | | | $ | 1,010.80 | | | | 1.27 | % | | $ | 6.42 | |
| | Hypothetical | | $ | 1,000.00 | | | $ | 1,018.75 | | | | 1.27 | % | | $ | 6.44 | |
| Class C | | Actual | | $ | 1,000.00 | | | $ | 1,009.80 | | | | 2.02 | % | | $ | 10.20 | |
| | Hypothetical | | $ | 1,000.00 | | | $ | 1,014.98 | | | | 2.02 | % | | $ | 10.23 | |
| Class Q | | Actual | | $ | 1,000.00 | | | $ | 1,012.60 | | | | 1.01 | % | | $ | 5.11 | |
| | Hypothetical | | $ | 1,000.00 | | | $ | 1,020.06 | | | | 1.01 | % | | $ | 5.13 | |
| Class Z | | Actual | | $ | 1,000.00 | | | $ | 1,011.80 | | | | 1.02 | % | | $ | 5.16 | |
| | | Hypothetical | | $ | 1,000.00 | | | $ | 1,020.01 | | | | 1.02 | % | | $ | 5.18 | |
*Fund expenses (net of fee waivers or subsidies, if any) for each share class are equal to the annualized expense ratio for each share class (provided in the table), multiplied by the average account value over the period, multiplied by the 184 days in the six-month period ended October 31, 2016, and divided by the 366 days in the Fund’s fiscal year ended October 31, 2016 (to reflect the six-month period). Expenses presented in the table include the expenses of any underlying portfolios in which the Fund may invest.
| | | | |
| Prudential Emerging Markets Debt Local Currency Fund | | | 11 | |
Fees and Expenses (continued)
The Fund’s annual expense ratios for the 12-month period ended October 31, 2016, are as follows:
| | | | |
| Class | | Gross Operating Expenses (%) | | Net Operating Expenses (%) |
| A | | 2.33 | | 1.28 |
| C | | 3.07 | | 2.03 |
| Q | | 2.06 | | 1.03 |
| Z | | 2.06 | | 1.03 |
Net operating expenses shown above reflect any fee waivers and/or expense reimbursements. Additional information on Fund expenses and any fee waivers and/or expense reimbursements can be found in the “Financial Highlights” tables in this report and in the Notes to the Financial Statements in this report.
| | |
| 12 | | Visit our website at prudentialfunds.com |
Portfolio of Investments
as of October 31, 2016
| | | | | | | | | | | | | | | | |
| Description | | Interest
Rate | | | Maturity
Date | | | Principal
Amount (000)# | | | Value (Note 1) | |
LONG-TERM INVESTMENTS 91.2% | |
|
FOREIGN BONDS | |
|
Argentina 2.4% | |
Argentina Bonar Bonds, | | | | | | | | | | | | | | | | |
Bonds | | | 8.750 | % | | | 05/07/24 | | | | 150 | | | $ | 173,471 | |
Sr. Unsec’d. Notes, Ser. X | | | 7.000 | | | | 04/17/17 | | | | 575 | | | | 586,071 | |
| | | | | | | | | | | | | | | | |
| | | | | | | | | | | | | | | 759,542 | |
| | | | | | | | | | | | | | | | |
|
Brazil 12.2% | |
Brazil Notas do Tesouro Nacionalie, | | | | | | | | | | | | | | | | |
Notes, Ser. NTNB | | | 6.000 | | | | 08/15/50 | | | BRL | 335 | | | | 322,484 | |
Notes, Ser. NTNF | | | 10.000 | | | | 01/01/19 | | | BRL | 4,164 | | | | 1,270,575 | |
Notes, Ser. NTNF | | | 10.000 | | | | 01/01/21 | | | BRL | 2,729 | | | | 820,735 | |
Notes, Ser. NTNF | | | 10.000 | | | | 01/01/23 | | | BRL | 2,607 | | | | 771,264 | |
Notes, Ser. NTNF | | | 10.000 | | | | 01/01/25 | | | BRL | 1,541 | | | | 450,817 | |
Brazilian Government International Bond, | | | | | | | | | | | | | | | | |
Sr. Unsec’d. Notes | | | 8.500 | | | | 01/05/24 | | | BRL | 54 | | | | 15,987 | |
Sr. Unsec’d. Notes | | | 8.875 | | | | 10/14/19 | | | | 75 | | | | 88,313 | |
Petrobras Global Finance BV, Gtd. Notes | | | 8.375 | | | | 05/23/21 | | | | 175 | | | | 193,603 | |
| | | | | | | | | | | | | | | | |
| | | | | | | | | | | | | | | 3,933,778 | |
| | | | | | | | | | | | | | | | |
|
Colombia 4.7% | |
Colombian TES, | | | | | | | | | | | | | | | | |
Bonds, Ser. B | | | 6.000 | | | | 04/28/28 | | | COP | 2,928,700 | | | | 866,956 | |
Bonds, Ser. B | | | 7.500 | | | | 08/26/26 | | | COP | 400,800 | | | | 134,337 | |
Bonds, Ser. B | | | 10.000 | | | | 07/24/24 | | | COP | 1,253,500 | | | | 489,910 | |
Pacific Exploration and Production Corp., Gtd. Notes, RegS | | | 5.375 | (a) | | | 01/26/19 | | | | 125 | | | | 25,000 | |
| | | | | | | | | | | | | | | | |
| | | | | | | | | | | | | | | 1,516,203 | |
| | | | | | | | | | | | | | | | |
|
Dominican Republic 0.9% | |
Mestenio Ltd. For Dominican Republic, Pass Thru Certs, RegS | | | 8.500 | | | | 01/02/20 | | | | 276 | | | | 294,897 | |
|
Hungary 4.4% | |
Hungary Government Bond, | | | | | | | | | | | | | | | | |
Bonds, Ser. 19/A | | | 6.500 | | | | 06/24/19 | | | HUF | 194,430 | | | | 787,404 | |
Bonds, Ser. 23/A | | | 6.000 | | | | 11/24/23 | | | HUF | 59,970 | | | | 263,230 | |
Bonds, Ser. 25/B | | | 5.500 | | | | 06/24/25 | | | HUF | 14,180 | | | | 60,648 | |
Bonds, Ser. 31/A | | | 3.250 | | | | 10/22/31 | | | HUF | 40,000 | | | | 140,260 | |
Hungary Government International Bond, Sr. Unsec’d. Notes | | | 6.375 | | | | 03/29/21 | | | | 140 | | | | 161,511 | |
| | | | | | | | | | | | | | | | |
| | | | | | | | | | | | | | | 1,413,053 | |
| | | | | | | | | | | | | | | | |
See Notes to Financial Statements.
| | | | |
| Prudential Emerging Markets Debt Local Currency Fund | | | 13 | |
Portfolio of Investments (continued)
as of October 31, 2016
| | | | | | | | | | | | | | | | |
| Description | | Interest
Rate | | | Maturity
Date | | | Principal
Amount (000)# | | | Value (Note 1) | |
FOREIGN BONDS (Continued) | |
|
Indonesia 11.1% | |
Indonesia Treasury Bond, | | | | | | | | | | | | | | | | |
Sr. Unsec’d. Notes, Ser. FR53 | | | 8.250 | % | | | 07/15/21 | | | IDR | 8,966,000 | | | $ | 720,139 | |
Sr. Unsec’d. Notes, Ser. FR56 | | | 8.375 | | | | 09/15/26 | | | IDR | 4,610,000 | | | | 375,905 | |
Sr. Unsec’d. Notes, Ser. FR58 | | | 8.250 | | | | 06/15/32 | | | IDR | 1,700,000 | | | | 136,421 | |
Sr. Unsec’d. Notes, Ser. FR59 | | | 7.000 | | | | 05/15/27 | | | IDR | 3,600,000 | | | | 269,007 | |
Sr. Unsec’d. Notes, Ser. FR61 | | | 7.000 | | | | 05/15/22 | | | IDR | 2,300,000 | | | | 175,542 | |
Sr. Unsec’d. Notes, Ser. FR63 | | | 5.625 | | | | 05/15/23 | | | IDR | 3,100,000 | | | | 218,309 | |
Sr. Unsec’d. Notes, Ser. FR65 | | | 6.625 | | | | 05/15/33 | | | IDR | 5,700,000 | | | | 386,930 | |
Sr. Unsec’d. Notes, Ser. FR67 | | | 8.750 | | | | 02/15/44 | | | IDR | 600,000 | | | | 51,141 | |
Sr. Unsec’d. Notes, Ser. FR68 | | | 8.375 | | | | 03/15/34 | | | IDR | 10,000,000 | | | | 802,805 | |
Sr. Unsec’d. Notes, Ser. FR70 | | | 8.375 | | | | 03/15/24 | | | IDR | 2,300,000 | | | | 187,201 | |
Sr. Unsec’d. Notes, Ser. FR71 | | | 9.000 | | | | 03/15/29 | | | IDR | 2,920,000 | | | | 247,958 | |
| | | | | | | | | | | | | | | | |
| | | | | | | | | | | | | | | 3,571,358 | |
| | | | | | | | | | | | | | | | |
|
Kazakhstan 0.4% | |
KazMunayGas National Co. JSC, Sr. Unsec’d. Notes, MTN, RegS | | | 9.125 | | | | 07/02/18 | | | | 125 | | | | 137,067 | |
|
Malaysia 4.7% | |
Malaysia Government Bond, | | | | | | | | | | | | | | | | |
Sr. Unsec’d. Notes, Ser. 0115 | | | 3.955 | | | | 09/15/25 | | | MYR | 1,900 | | | | 459,608 | |
Sr. Unsec’d. Notes, Ser. 0116 | | | 3.800 | | | | 08/17/23 | | | MYR | 580 | | | | 140,408 | |
Sr. Unsec’d. Notes, Ser. 0216 | | | 4.736 | | | | 03/15/46 | | | MYR | 500 | | | | 122,658 | |
Sr. Unsec’d. Notes, Ser. 0310 | | | 4.498 | | | | 04/15/30 | | | MYR | 500 | | | | 123,453 | |
Sr. Unsec’d. Notes, Ser. 0313 | | | 3.480 | | | | 03/15/23 | | | MYR | 1,650 | | | | 392,912 | |
Sr. Unsec’d. Notes, Ser. 0316 | | | 3.900 | | | | 11/30/26 | | | MYR | 740 | | | | 180,537 | |
Sr. Unsec’d. Notes, Ser. 0412 | | | 4.127 | | | | 04/15/32 | | | MYR | 270 | | | | 63,489 | |
Sr. Unsec’d. Notes, Ser. 0413 | | | 3.844 | | | | 04/15/33 | | | MYR | 160 | | | | 36,203 | |
| | | | | | | | | | | | | | | | |
| | | | | | | | | | | | | | | 1,519,268 | |
| | | | | | | | | | | | | | | | |
|
Mexico 6.4% | |
America Movil SAB de CV, Sr. Unsec’d. Notes | | | 6.450 | | | | 12/05/22 | | | MXN | 7,500 | | | | 388,868 | |
Mexican Bonos, | | | | | | | | | | | | | | | | |
Bonds, Ser. M | | | 7.750 | | | | 05/29/31 | | | MXN | 6,805 | | | | 397,615 | |
Bonds, Ser. M-20 | | | 7.500 | | | | 06/03/27 | | | MXN | 10,090 | | | | 579,734 | |
Bonds, Ser. M-30 | | | 10.000 | | | | 11/20/36 | | | MXN | 4,645 | | | | 333,372 | |
Petroleos Mexicanos, | | | | | | | | | | | | | | | | |
Gtd. Notes | | | 4.875 | | | | 01/24/22 | | | | 30 | | | | 30,669 | |
Gtd. Notes | | | 5.500 | | | | 01/21/21 | | | | 115 | | | | 122,044 | |
Gtd. Notes, 144A | | | 7.650 | | | | 11/24/21 | | | MXN | 4,120 | | | | 210,240 | |
| | | | | | | | | | | | | | | | |
| | | | | | | | | | | | | | | 2,062,542 | |
| | | | | | | | | | | | | | | | |
See Notes to Financial Statements.
| | | | | | | | | | | | | | | | |
| Description | | Interest
Rate | | | Maturity
Date | | | Principal
Amount (000)# | | | Value (Note 1) | |
FOREIGN BONDS (Continued) | |
|
Pakistan 0.7% | |
Pakistan Government International Bond, Sr. Unsec’d. Notes | | | 7.250 | % | | | 04/15/19 | | | | 200 | | | $ | 211,999 | |
|
Peru 2.1% | |
Peruvian Government International Bond, | | | | | | | | | | | | | | | | |
Bonds | | | 6.950 | | | | 08/12/31 | | | PEN | 190 | | | | 61,402 | |
Sr, Unsec’d. Notes, 144A | | | 6.350 | | | | 08/12/28 | | | PEN | 520 | | | | 159,105 | |
Sr. Unsec’d. Notes, RegS | | | 6.950 | | | | 08/12/31 | | | PEN | 1,449 | | | | 468,267 | |
| | | | | | | | | | | | | | | | |
| | | | | | | | | | | | | | | 688,774 | |
| | | | | | | | | | | | | | | | |
|
Philippines 2.1% | |
Philippine Government International Bond, Sr. Unsec’d. Notes | | | 4.950 | | | | 01/15/21 | | | PHP | 32,000 | | | | 679,023 | |
| | | | |
Poland 8.3% | | | | | | | | | | | | | | | | |
Poland Government Bond, | | | | | | | | | | | | | | | | |
Bonds, Ser. 0718 | | | 2.500 | | | | 07/25/18 | | | PLN | 630 | | | | 162,781 | |
Bonds, Ser. 0721 | | | 1.750 | | | | 07/25/21 | | | PLN | 4,085 | | | | 1,007,709 | |
Bonds, Ser. 0725 | | | 3.250 | | | | 07/25/25 | | | PLN | 5,775 | | | | 1,496,576 | |
| | | | | | | | | | | | | | | | |
| | | | | | | | | | | | | | | 2,667,066 | |
| | | | | | | | | | | | | | | | |
|
Romania 4.7% | |
Romania Government Bond, | | | | | | | | | | | | | | | | |
Bonds, Ser. 3YR | | | 2.500 | | | | 04/29/19 | | | RON | 300 | | | | 74,983 | |
Bonds, Ser. 4YR | | | 3.250 | | | | 01/17/18 | | | RON | 1,480 | | | | 370,739 | |
Bonds, Ser. 10YR | | | 4.750 | | | | 02/24/25 | | | RON | 500 | | | | 136,515 | |
Bonds, Ser. 10YR | | | 5.850 | | | | 04/26/23 | | | RON | 280 | | | | 80,465 | |
Bonds, Ser. 10YR | | | 5.950 | | | | 06/11/21 | | | RON | 2,040 | | | | 576,768 | |
Bonds, Ser. 10YR | | | 6.750 | | | | 06/11/17 | | | RON | 1,130 | | | | 285,421 | |
| | | | | | | | | | | | | | | | |
| | | | | | | | | | | | | | | 1,524,891 | |
| | | | | | | | | | | | | | | | |
|
Russia 4.3% | |
Gazprom OAO Via Gaz Capital SA, Sr. Unsec’d. Notes, RegS | | | 9.250 | | | | 04/23/19 | | | | 230 | | | | 262,453 | |
Russian Federal Bond - OFZ, | | | | | | | | | | | | | | | | |
Bonds, Ser. 6211 | | | 7.000 | | | | 01/25/23 | | | RUB | 22,350 | | | | 326,546 | |
Bonds, Ser. 6218 | | | 8.500 | | | | 09/17/31 | | | RUB | 28,520 | | | | 450,058 | |
Vnesheconombank Via VEB Finance PLC, | | | | | | | | | | | | | | | | |
Sr. Unsec’d. Notes, RegS | | | 4.224 | | | | 11/21/18 | | | | 200 | | | | 202,336 | |
Sr. Unsec’d. Notes, RegS | | | 6.902 | | | | 07/09/20 | | | | 140 | | | | 150,850 | |
| | | | | | | | | | | | | | | | |
| | | | | | | | | | | | | | | 1,392,243 | |
| | | | | | | | | | | | | | | | |
See Notes to Financial Statements.
| | | | |
| Prudential Emerging Markets Debt Local Currency Fund | | | 15 | |
Portfolio of Investments (continued)
as of October 31, 2016
| | | | | | | | | | | | | | | | |
| Description | | Interest
Rate | | | Maturity
Date | | | Principal
Amount (000)# | | | Value (Note 1) | |
FOREIGN BONDS (Continued) | |
|
South Africa 9.4% | |
Eskom Holdings SOC Ltd., Govt. Gtd., Ser. ES23, MTN | | | 10.000 | % | | | 01/25/23 | | | ZAR | 7,500 | | | $ | 573,647 | |
South Africa Government Bond, | | | | | | | | | | | | | | | | |
Bonds, Ser. 2032 | | | 8.250 | | | | 03/31/32 | | | ZAR | 14,680 | | | | 1,002,035 | |
Bonds, Ser. 2040 | | | 9.000 | | | | 01/31/40 | | | ZAR | 5,720 | | | | 408,128 | |
Bonds, Ser. 2044 | | | 8.750 | | | | 01/31/44 | | | ZAR | 9,200 | | | | 638,499 | |
Bonds, Ser. R186 | | | 10.500 | | | | 12/21/26 | | | ZAR | 2,400 | | | | 197,132 | |
Bonds, Ser. R213 | | | 7.000 | | | | 02/28/31 | | | ZAR | 3,230 | | | | 199,284 | |
| | | | | | | | | | | | | | | | |
| | | | | | | | | | | | | | | 3,018,725 | |
| | | | | | | | | | | | | | | | |
|
South Korea 0.3% | |
Export-Import Bank Of Korea, Sr. Unsec’d. Notes, EMTN | | | 0.500 | | | | 01/25/17 | | | TRY | 300 | | | | 94,747 | |
|
Thailand 4.0% | |
Thailand Government Bond, | | | | | | | | | | | | | | | | |
Sr. Unsec’d. Notes | | | 3.400 | | | | 06/17/36 | | | THB | 2,200 | | | | 70,215 | |
Sr. Unsec’d. Notes | | | 3.625 | | | | 06/16/23 | | | THB | 900 | | | | 28,321 | |
Sr. Unsec’d. Notes | | | 3.775 | | | | 06/25/32 | | | THB | 600 | | | | 19,626 | |
Sr. Unsec’d. Notes | | | 3.850 | | | | 12/12/25 | | | THB | 2,700 | | | | 87,845 | |
Sr. Unsec’d. Notes | | | 4.875 | | | | 06/22/29 | | | THB | 29,575 | | | | 1,074,329 | |
| | | | | | | | | | | | | | | | |
| | | | | | | | | | | | | | | 1,280,336 | |
| | | | | | | | | | | | | | | | |
|
Turkey 8.1% | |
Turkey Government Bond, | | | | | | | | | | | | | | | | |
Bonds | | | 7.100 | | | | 03/08/23 | | | TRY | 1,098 | | | | 310,531 | |
Bonds | | | 8.000 | | | | 03/12/25 | | | TRY | 4,690 | | | | 1,361,112 | |
Bonds | | | 8.800 | | | | 09/27/23 | | | TRY | 1,728 | | | | 531,091 | |
Bonds | | | 9.000 | | | | 07/24/24 | | | TRY | 350 | | | | 108,362 | |
Bonds | | | 9.500 | | | | 01/12/22 | | | TRY | 215 | | | | 68,928 | |
Bonds | | | 10.600 | | | | 02/11/26 | | | TRY | 390 | | | | 131,901 | |
Turkey Government International Bond, Sr. Unsec’d. Notes | | | 7.000 | | | | 06/05/20 | | | | 100 | | | | 109,912 | |
| | | | | | | | | | | | | | | | |
| | | | | | | | | | | | | | | 2,621,837 | |
| | | | | | | | | | | | | | | | |
TOTAL LONG-TERM INVESTMENTS
(cost $30,899,804) | | | | | | | | | | | | | | | 29,387,349 | |
| | | | | | | | | | | | | | | | |
| | | | |
| | | | | | | | | Shares | | | | |
SHORT-TERM INVESTMENTS 6.1% | | | | | | | | | | | | | | | | |
| | | | |
AFFILIATED MUTUAL FUND 5.1% | | | | | | | | | | | | | | | | |
Prudential Investment Portfolios 2 - Prudential Core Ultra Short Bond Fund
(cost $1,637,992)(Note 3)(b) | | | | | | | | | | | 1,637,992 | | | | 1,637,992 | |
See Notes to Financial Statements.
| | | | | | | | | | | | | | | | |
| Description | | Interest
Rate | | | Maturity
Date | | | Principal
Amount (000)# | | | Value (Note 1) | |
FOREIGN TREASURY OBLIGATIONS 1.0% | | | | | | | | | | | | | | | | |
Letras Del Banco Central De La Republica Argentina, (Argentina), | | | | | | | | | | | | | | | | |
Bills | | | 23.815 | %(c) | | | 01/25/17 | | | ARS | 1,310 | | | $ | 81,645 | |
Bills | | | 24.648 | (c) | | | 11/23/16 | | | ARS | 3,895 | | | | 252,910 | |
| | | | | | | | | | | | | | | | |
TOTAL FOREIGN TREASURY OBLIGATIONS
(cost $335,716) | | | | | | | | | | | | | | | 334,555 | |
| | | | | | | | | | | | | | | | |
TOTAL SHORT-TERM INVESTMENTS
(cost $1,973,708) | | | | | | | | | | | | | | | 1,972,547 | |
| | | | | | | | | | | | | | | | |
| | | | |
TOTAL INVESTMENTS 97.3%
(cost $32,873,512) (Note 5) | | | | | | | | | | | | | | | 31,359,896 | |
Other assets in excess of liabilities(d) 2.7% | | | | | | | | | | | | | | | 879,984 | |
| | | | | | | | | | | | | | | | |
NET ASSETS 100.0% | | | | | | | | | | | | | | $ | 32,239,880 | |
| | | | | | | | | | | | | | | | |
The following abbreviations are used in the annual report.
144A—Security was purchased pursuant to Rule 144A under the Securities Act of 1933 and may not be resold subject to that rule except to qualified institutional buyers. Unless otherwise noted, 144A securities are deemed to be liquid.
EMTN—Euro Medium Term Note
LIBOR—London Interbank Offered Rate
MTN—Medium Term Note
OFZ—Obligatsyi Federal’novo Zaima (Federal Loan Obligations)
OTC—Over-the-counter
RegS—Regulation S. Security was purchased pursuant to Regulation S and may not be offered, sold or delivered within the United States or to, or for the account or benefit of, U.S. persons, except pursuant to an exemption from, or in a transaction not subject to, the registration requirements of the Securities Act of 1933.
ARS—Argentine Peso
AUD—Australian Dollar
BRL—Brazilian Real
CAD—Canadian Dollar
CHF—Swiss Franc
CLP—Chilean Peso
CNH—Chinese Renminbi
COP—Colombian Peso
CZK—Czech Koruna
EUR—Euro
HUF—Hungarian Forint
IDR—Indonesian Rupiah
ILS—Israeli Shekel
INR—Indian Rupee
JPY—Japanese Yen
KRW—South Korean Won
MXN—Mexican Peso
See Notes to Financial Statements.
| | | | |
| Prudential Emerging Markets Debt Local Currency Fund | | | 17 | |
Portfolio of Investments (continued)
as of October 31, 2016
MYR—Malaysian Ringgit
NZD—New Zealand Dollar
PEN—Peruvian Nuevo Sol
PHP—Philippine Peso
PLN—Polish Zloty
RON—Romanian Leu
RUB—Russian Ruble
SGD—Singapore Dollar
THB—Thai Baht
TRY—Turkish Lira
TWD—New Taiwanese Dollar
ZAR—South African Rand
| # | Principal or notional amount is shown in U.S. dollars unless otherwise stated. |
| (a) | Represents issuer in default on interest payments. Non-income producing security. |
| (b) | Prudential Investments LLC, the manager of the Series, also serves as manager of the Prudential Investment Portfolios 2 - Prudential Core Ultra Short Bond Fund. |
| (c) | Represents zero coupon bond or principal only securities. Rate represents yield to maturity at purchase date. |
| (d) | Includes net unrealized appreciation (depreciation) on the following derivative contracts held at reporting period end: |
Forward foreign currency exchange contracts outstanding at October 31, 2016:
| | | | | | | | | | | | | | | | | | |
Purchase Contracts | | Counterparty | | Notional
Amount
(000) | | | Value at
Settlement
Date | | | Current
Value | | | Unrealized
Appreciation
(Depreciation) | |
OTC forward foreign currency exchange contracts: | |
Australian Dollar, | | | | | | | | | | | | | | | | | | |
Expiring 01/13/2017 | | Citigroup Global Markets | | AUD | 215 | | | $ | 161,848 | | | $ | 162,931 | | | $ | 1,083 | |
Brazilian Real, | | | | | | | | | | | | | | | | | | |
Expiring 11/03/2016 | | Bank of America | | BRL | 153 | | | | 47,085 | | | | 47,836 | | | | 751 | |
Expiring 11/03/2016 | | Goldman Sachs & Co. | | BRL | 134 | | | | 42,719 | | | | 41,884 | | | | (835 | ) |
Expiring 11/03/2016 | | Goldman Sachs & Co. | | BRL | 212 | | | | 65,626 | | | | 66,345 | | | | 719 | |
Expiring 11/03/2016 | | Goldman Sachs & Co. | | BRL | 333 | | | | 102,294 | | | | 104,232 | | | | 1,938 | |
Expiring 11/03/2016 | | Goldman Sachs & Co. | | BRL | 586 | | | | 180,254 | | | | 183,449 | | | | 3,195 | |
Expiring 11/03/2016 | | JPMorgan Chase | | BRL | 47 | | | | 15,000 | | | | 14,678 | | | | (322 | ) |
Expiring 12/02/2016 | | Bank of America | | BRL | 510 | | | | 159,027 | | | | 158,190 | | | | (837 | ) |
Expiring 12/02/2016 | | Citigroup Global Markets | | BRL | 47 | | | | 14,765 | | | | 14,546 | | | | (219 | ) |
Canadian Dollar, | | | | | | | | | | | | | | | | | | |
Expiring 01/13/2017 | | Citigroup Global Markets | | CAD | 212 | | | | 161,116 | | | | 158,089 | | | | (3,027 | ) |
Chilean Peso, | | | | | | | | | | | | | | | | | | |
Expiring 01/23/2017 | | Hong Kong &
Shanghai Bank | | CLP | 45,214 | | | | 66,980 | | | | 68,775 | | | | 1,795 | |
Chinese Renminbi, | | | | | | | | | | | | | | | | | | |
Expiring 01/26/2017 | | Hong Kong &
Shanghai Bank | | CNH | 1,151 | | | | 168,607 | | | | 169,362 | | | | 755 | |
Colombian Peso, | | | | | | | | | | | | | | | | | | |
Expiring 11/10/2016 | | Bank of America | | COP | 277,692 | | | | 95,100 | | | | 92,202 | | | | (2,898 | ) |
Expiring 11/10/2016 | | Citigroup Global Markets | | COP | 100,342 | | | | 32,058 | | | | 33,316 | | | | 1,258 | |
Expiring 11/10/2016 | | JPMorgan Chase | | COP | 73,895 | | | | 25,304 | | | | 24,535 | | | | (769 | ) |
Expiring 01/23/2017 | | Citigroup Global Markets | | COP | 2,063,257 | | | | 691,904 | | | | 677,972 | | | | (13,932 | ) |
See Notes to Financial Statements.
| | | | | | | | | | | | | | | | | | |
Forward foreign currency exchange contracts outstanding at October 31, 2016 (continued): | |
Purchase Contracts | | Counterparty | | Notional
Amount
(000) | | | Value at
Settlement
Date | | | Current
Value | | | Unrealized
Appreciation
(Depreciation) | |
OTC forward foreign currency exchange contracts (cont’d.): | |
Czech Koruna, | | | | | | | | | | | | | | | | | | |
Expiring 01/25/2017 | | Morgan Stanley | | CZK | 187 | | | $ | 7,566 | | | $ | 7,634 | | | $ | 68 | |
Expiring 01/25/2017 | | Morgan Stanley | | CZK | 6,932 | | | | 283,748 | | | | 283,613 | | | | (135 | ) |
Euro, | | | | | | | | | | | | | | | | | | |
Expiring 01/27/2017 | | Barclays Capital Group | | EUR | 61 | | | | 67,000 | | | | 67,306 | | | | 306 | |
Expiring 01/27/2017 | | Barclays Capital Group | | EUR | 113 | | | | 124,000 | | | | 124,684 | | | | 684 | |
Expiring 01/27/2017 | | Goldman Sachs & Co. | | EUR | 516 | | | | 568,550 | | | | 568,971 | | | | 421 | |
Expiring 01/27/2017 | | UBS AG | | EUR | 58 | | | | 64,000 | | | | 64,050 | | | | 50 | |
Expiring 01/27/2017 | | UBS AG | | EUR | 61 | | | | 67,000 | | | | 67,371 | | | | 371 | |
Expiring 01/27/2017 | | UBS AG | | EUR | 62 | | | | 68,000 | | | | 68,106 | | | | 106 | |
Hungarian Forint, | | | | | | | | | | | | | | | | | | |
Expiring 01/25/2017 | | Citigroup Global Markets | | HUF | 1,300 | | | | 4,603 | | | | 4,629 | | | | 26 | |
Expiring 01/25/2017 | | Citigroup Global Markets | | HUF | 35,568 | | | | 126,730 | | | | 126,654 | | | | (76 | ) |
Expiring 01/25/2017 | | Citigroup Global Markets | | HUF | 46,467 | | | | 164,375 | | | | 165,464 | | | | 1,089 | |
Expiring 01/25/2017 | | UBS AG | | HUF | 6,503 | | | | 23,001 | | | | 23,158 | | | | 157 | |
Indian Rupee, | | | | | | | | | | | | | | | | | | |
Expiring 12/09/2016 | | Citigroup Global Markets | | INR | 10,996 | | | | 163,308 | | | | 163,675 | | | | 367 | |
Expiring 01/20/2017 | | Citigroup Global Markets | | INR | 24,320 | | | | 359,551 | | | | 359,786 | | | | 235 | |
Expiring 01/20/2017 | | Goldman Sachs & Co. | | INR | 10,870 | | | | 161,125 | | | | 160,802 | | | | (323 | ) |
Expiring 01/20/2017 | | Goldman Sachs & Co. | | INR | 14,073 | | | | 208,325 | | | | 208,196 | | | | (129 | ) |
Indonesian Rupiah, | | | | | | | | | | | | | | | | | | |
Expiring 11/22/2016 | | Bank of America | | IDR | 1,494,766 | | | | 111,800 | | | | 114,233 | | | | 2,433 | |
Expiring 11/22/2016 | | Barclays Capital Group | | IDR | 258,239 | | | | 19,250 | | | | 19,735 | | | | 485 | |
Expiring 11/22/2016 | | Barclays Capital Group | | IDR | 785,386 | | | | 58,480 | | | | 60,021 | | | | 1,541 | |
Expiring 11/22/2016 | | Citigroup Global Markets | | IDR | 234,702 | | | | 18,000 | | | | 17,936 | | | | (64 | ) |
Expiring 11/22/2016 | | Citigroup Global Markets | | IDR | 451,870 | | | | 34,000 | | | | 34,533 | | | | 533 | |
Expiring 11/22/2016 | | Citigroup Global Markets | | IDR | 549,564 | | | | 41,000 | | | | 41,999 | | | | 999 | |
Expiring 11/22/2016 | | Citigroup Global Markets | | IDR | 613,778 | | | | 46,000 | | | | 46,906 | | | | 906 | |
Expiring 11/22/2016 | | Citigroup Global Markets | | IDR | 2,987,864 | | | | 226,181 | | | | 228,338 | | | | 2,157 | |
Expiring 11/22/2016 | | Citigroup Global Markets | | IDR | 3,190,045 | | | | 242,589 | | | | 243,790 | | | | 1,201 | |
Expiring 11/22/2016 | | JPMorgan Chase | | IDR | 196,425 | | | | 15,000 | | | | 15,011 | | | | 11 | |
Expiring 11/22/2016 | | JPMorgan Chase | | IDR | 288,398 | | | | 22,000 | | | | 22,040 | | | | 40 | |
Expiring 11/22/2016 | | JPMorgan Chase | | IDR | 340,725 | | | | 26,250 | | | | 26,039 | | | | (211 | ) |
Expiring 11/22/2016 | | JPMorgan Chase | | IDR | 579,524 | | | | 44,000 | | | | 44,288 | | | | 288 | |
Expiring 11/22/2016 | | JPMorgan Chase | | IDR | 813,812 | | | | 62,000 | | | | 62,193 | | | | 193 | |
Expiring 11/22/2016 | | UBS AG | | IDR | 158,797 | | | | 12,000 | | | | 12,136 | | | | 136 | |
Expiring 11/22/2016 | | UBS AG | | IDR | 205,981 | | | | 15,581 | | | | 15,741 | | | | 160 | |
Expiring 11/22/2016 | | UBS AG | | IDR | 315,718 | | | | 24,000 | | | | 24,128 | | | | 128 | |
Expiring 11/22/2016 | | UBS AG | | IDR | 406,188 | | | | 31,000 | | | | 31,042 | | | | 42 | |
Expiring 11/22/2016 | | UBS AG | | IDR | 458,430 | | | | 35,000 | | | | 35,034 | | | | 34 | |
Expiring 11/22/2016 | | UBS AG | | IDR | 562,440 | | | | 43,000 | | | | 42,983 | | | | (17 | ) |
Expiring 01/20/2017 | | Citigroup Global Markets | | IDR | 2,745,328 | | | | 208,325 | | | | 207,791 | | | | (534 | ) |
See Notes to Financial Statements.
| | | | |
| Prudential Emerging Markets Debt Local Currency Fund | | | 19 | |
Portfolio of Investments (continued)
as of October 31, 2016
| | | | | | | | | | | | | | | | | | |
Forward foreign currency exchange contracts outstanding at October 31, 2016 (continued): | |
Purchase Contracts | | Counterparty | | Notional
Amount
(000) | | | Value at
Settlement
Date | | | Current
Value | | | Unrealized
Appreciation
(Depreciation) | |
OTC forward foreign currency exchange contracts (cont’d.): | |
Japanese Yen, | | | | | | | | | | | | | | | | | | |
Expiring 01/27/2017 | | Barclays Capital Group | | JPY | 1,450 | | | $ | 13,999 | | | $ | 13,883 | | | $ | (116 | ) |
Expiring 01/27/2017 | | UBS AG | | JPY | 26,942 | | | | 259,340 | | | | 257,883 | | | | (1,457 | ) |
Malaysian Ringgit, | | | | | | | | | | | | | | | | | | |
Expiring 11/10/2016 | | UBS AG | | MYR | 4,091 | | | | 990,448 | | | | 974,655 | | | | (15,793 | ) |
Expiring 12/09/2016 | | JPMorgan Chase | | MYR | 4,091 | | | | 987,818 | | | | 973,144 | | | | (14,674 | ) |
Expiring 12/21/2016 | | Bank of America | | MYR | 54 | | | | 13,000 | | | | 12,749 | | | | (251 | ) |
Expiring 12/21/2016 | | JPMorgan Chase | | MYR | 652 | | | | 155,212 | | | | 155,078 | | | | (134 | ) |
Expiring 12/21/2016 | | JPMorgan Chase | | MYR | 793 | | | | 190,317 | | | | 188,559 | | | | (1,758 | ) |
Expiring 12/21/2016 | | JPMorgan Chase | | MYR | 1,993 | | | | 479,646 | | | | 473,813 | | | | (5,833 | ) |
Mexican Peso, | | | | | | | | | | | | | | | | | | |
Expiring 01/20/2017 | | Goldman Sachs & Co. | | MXN | 3,219 | | | | 168,072 | | | | 168,752 | | | | 680 | |
Expiring 01/24/2017 | | Citigroup Global Markets | | MXN | 224 | | | | 12,000 | | | | 11,756 | | | | (244 | ) |
Expiring 01/24/2017 | | Goldman Sachs & Co. | | MXN | 26,379 | | | | 1,403,449 | | | | 1,382,412 | | | | (21,037 | ) |
Expiring 01/24/2017 | | Hong Kong & Shanghai Bank | | MXN | 4,244 | | | | 220,424 | | | | 222,399 | | | | 1,975 | |
New Taiwanese Dollar, | | | | | | | | | | | | | | | | | | |
Expiring 12/15/2016 | | Bank of America | | TWD | 624 | | | | 20,000 | | | | 19,805 | | | | (195 | ) |
Expiring 12/15/2016 | | Bank of America | | TWD | 22,523 | | | | 721,191 | | | | 714,403 | | | | (6,788 | ) |
Expiring 12/15/2016 | | Citigroup Global Markets | | TWD | 533 | | | | 17,000 | | | | 16,911 | | | | (89 | ) |
Expiring 12/15/2016 | | Citigroup Global Markets | | TWD | 538 | | | | 17,000 | | | | 17,077 | | | | 77 | |
Expiring 12/15/2016 | | Citigroup Global Markets | | TWD | 854 | | | | 27,000 | | | | 27,097 | | | | 97 | |
Expiring 12/15/2016 | | JPMorgan Chase | | TWD | 842 | | | | 27,000 | | | | 26,699 | | | | (301 | ) |
Expiring 12/15/2016 | | JPMorgan Chase | | TWD | 1,041 | | | | 33,000 | | | | 33,008 | | | | 8 | |
Expiring 12/15/2016 | | JPMorgan Chase | | TWD | 1,456 | | | | 46,000 | | | | 46,173 | | | | 173 | |
Expiring 12/15/2016 | | JPMorgan Chase | | TWD | 1,732 | | | | 55,000 | | | | 54,943 | | | | (57 | ) |
Expiring 12/15/2016 | | JPMorgan Chase | | TWD | 1,749 | | | | 55,000 | | | | 55,464 | | | | 464 | |
Expiring 12/15/2016 | | UBS AG | | TWD | 349 | | | | 11,000 | | | | 11,069 | | | | 69 | |
Expiring 12/15/2016 | | UBS AG | | TWD | 473 | | | | 15,000 | | | | 15,015 | | | | 15 | |
Expiring 12/15/2016 | | UBS AG | | TWD | 1,004 | | | | 32,000 | | | | 31,858 | | | | (142 | ) |
Expiring 12/15/2016 | | UBS AG | | TWD | 1,366 | | | | 43,001 | | | | 43,331 | | | | 330 | |
Expiring 12/15/2016 | | UBS AG | | TWD | 2,059 | | | | 65,000 | | | | 65,316 | | | | 316 | |
New Zealand Dollar, | | | | | | | | | | | | | | | | | | |
Expiring 01/13/2017 | | Goldman Sachs & Co. | | NZD | 115 | | | | 81,375 | | | | 82,306 | | | | 931 | |
Peruvian Nuevo Sol, | | | | | | | | | | | | | | | | | | |
Expiring 12/09/2016 | | Citigroup Global Markets | | PEN | 391 | | | | 115,187 | | | | 115,824 | | | | 637 | |
Expiring 01/23/2017 | | Citigroup Global Markets | | PEN | 1,006 | | | | 292,063 | | | | 296,088 | | | | 4,025 | |
Expiring 01/23/2017 | | Goldman Sachs & Co. | | PEN | 1,006 | | | | 292,615 | | | | 296,088 | | | | 3,473 | |
Expiring 01/23/2017 | | JPMorgan Chase | | PEN | 95 | | | | 28,000 | | | | 27,974 | | | | (26 | ) |
Philippine Peso, | | | | | | | | | | | | | | | | | | |
Expiring 12/21/2016 | | JPMorgan Chase | | PHP | 587 | | | | 12,000 | | | | 12,108 | | | | 108 | |
Expiring 12/21/2016 | | UBS AG | | PHP | 3,213 | | | | 65,999 | | | | 66,328 | | | | 329 | |
Expiring 01/20/2017 | | Citigroup Global Markets | | PHP | 6,281 | | | | 129,405 | | | | 129,582 | | | | 177 | |
See Notes to Financial Statements.
| | | | | | | | | | | | | | | | | | |
Forward foreign currency exchange contracts outstanding at October 31, 2016 (continued): | |
Purchase Contracts | | Counterparty | | Notional
Amount
(000) | | | Value at
Settlement
Date | | | Current
Value | | | Unrealized
Appreciation
(Depreciation) | |
OTC forward foreign currency exchange contracts (cont’d.): | |
Polish Zloty, | | | | | | | | | | | | | | | | | | |
Expiring 01/25/2017 | | Barclays Capital Group | | PLN | 48 | | | $ | 12,000 | | | $ | 12,121 | | | $ | 121 | |
Expiring 01/25/2017 | | Barclays Capital Group | | PLN | 68 | | | | 17,000 | | | | 17,236 | | | | 236 | |
Expiring 01/25/2017 | | Citigroup Global Markets | | PLN | 48 | | | | 11,980 | | | | 12,154 | | | | 174 | |
Expiring 01/25/2017 | | Goldman Sachs & Co. | | PLN | 4,790 | | | | 1,215,573 | | | | 1,218,969 | | | | 3,396 | |
Expiring 01/25/2017 | | UBS AG | | PLN | 357 | | | | 90,541 | | | | 90,819 | | | | 278 | |
Romanian Leu, | | | | | | | | | | | | | | | | | | |
Expiring 01/25/2017 | | UBS AG | | RON | 146 | | | | 35,570 | | | | 35,627 | | | | 57 | |
Russian Ruble, | | | | | | | | | | | | | | | | | | |
Expiring 12/09/2016 | | Bank of America | | RUB | 1,080 | | | | 17,000 | | | | 16,862 | | | | (138 | ) |
Expiring 12/09/2016 | | Bank of America | | RUB | 1,238 | | | | 19,402 | | | | 19,332 | | | | (70 | ) |
Expiring 12/09/2016 | | Bank of America | | RUB | 9,075 | | | | 143,500 | | | | 141,661 | | | | (1,839 | ) |
Expiring 12/09/2016 | | Bank of America | | RUB | 10,156 | | | | 160,013 | | | | 158,537 | | | | (1,476 | ) |
Expiring 12/09/2016 | | Bank of America | | RUB | 10,221 | | | | 160,968 | | | | 159,558 | | | | (1,410 | ) |
Expiring 12/09/2016 | | Bank of America | | RUB | 10,263 | | | | 162,025 | | | | 160,214 | | | | (1,811 | ) |
Expiring 12/09/2016 | | Bank of America | | RUB | 16,887 | | | | 263,249 | | | | 263,615 | | | | 366 | |
Expiring 12/09/2016 | | Bank of America | | RUB | 44,456 | | | | 701,138 | | | | 693,957 | | | | (7,181 | ) |
Expiring 12/09/2016 | | Citigroup Global Markets | | RUB | 100 | | | | 1,582 | | | | 1,561 | | | | (21 | ) |
Singapore Dollar, | | | | | | | | | | | | | | | | | | |
Expiring 12/21/2016 | | Bank of America | | SGD | 225 | | | | 162,638 | | | | 161,702 | | | | (936 | ) |
Expiring 12/21/2016 | | Barclays Capital Group | | SGD | 63 | | | | 45,000 | | | | 45,050 | | | | 50 | |
Expiring 12/21/2016 | | UBS AG | | SGD | 82 | | | | 59,000 | | | | 58,900 | | | | (100 | ) |
South African Rand, | | | | | | | | | | | | | | | | | | |
Expiring 01/13/2017 | | Citigroup Global Markets | | ZAR | 511 | | | | 35,283 | | | | 37,297 | | | | 2,014 | |
Expiring 01/13/2017 | | Citigroup Global Markets | | ZAR | 1,084 | | | | 78,000 | | | | 79,188 | | | | 1,188 | |
Expiring 01/13/2017 | | Citigroup Global Markets | | ZAR | 1,827 | | | | 133,622 | | | | 133,468 | | | | (154 | ) |
Expiring 01/13/2017 | | Citigroup Global Markets | | ZAR | 2,178 | | | | 154,000 | | | | 159,066 | | | | 5,066 | |
Expiring 01/13/2017 | | Hong Kong & Shanghai Bank | | ZAR | 359 | | | | 24,817 | | | | 26,188 | | | | 1,371 | |
Expiring 01/13/2017 | | UBS AG | | ZAR | 265 | | | | 19,402 | | | | 19,388 | | | | (14 | ) |
South Korean Won, | | | | | | | | | | | | | | | | | | |
Expiring 12/21/2016 | | Bank of America | | KRW | 19,831 | | | | 18,000 | | | | 17,328 | | | | (672 | ) |
Expiring 12/21/2016 | | UBS AG | | KRW | 34,052 | | | | 30,000 | | | | 29,754 | | | | (246 | ) |
Thai Baht, | | | | | | | | | | | | | | | | | | |
Expiring 11/22/2016 | | Citigroup Global Markets | | THB | 20,628 | | | | 591,016 | | | | 589,127 | | | | (1,889 | ) |
Expiring 12/09/2016 | | Hong Kong & Shanghai Bank | | THB | 4,597 | | | | 130,551 | | | | 131,241 | | | | 690 | |
Expiring 01/20/2017 | | Citigroup Global Markets | | THB | 596 | | | | 17,000 | | | | 17,019 | | | | 19 | |
Expiring 01/20/2017 | | Citigroup Global Markets | | THB | 664 | | | | 19,000 | | | | 18,966 | | | | (34 | ) |
Expiring 01/20/2017 | | Citigroup Global Markets | | THB | 1,731 | | | | 49,000 | | | | 49,412 | | | | 412 | |
Expiring 01/20/2017 | | Citigroup Global Markets | | THB | 5,026 | | | | 143,028 | | | | 143,454 | | | | 426 | |
Expiring 01/20/2017 | | Citigroup Global Markets | | THB | 19,983 | | | | 558,489 | | | | 570,355 | | | | 11,866 | |
Expiring 01/20/2017 | | Citigroup Global Markets | | THB | 19,983 | | | | 556,982 | | | | 570,366 | | | | 13,384 | |
See Notes to Financial Statements.
| | | | |
| Prudential Emerging Markets Debt Local Currency Fund | | | 21 | |
Portfolio of Investments (continued)
as of October 31, 2016
| | | | | | | | | | | | | | | | | | |
Forward foreign currency exchange contracts outstanding at October 31, 2016 (continued): | |
Purchase Contracts | | Counterparty | | Notional
Amount
(000) | | | Value at
Settlement
Date | | | Current
Value | | | Unrealized
Appreciation
(Depreciation) | |
OTC forward foreign currency exchange contracts (cont’d.): | |
Turkish Lira, | | | | | | | | | | | | | | | | | | |
Expiring 11/18/2016 | | Bank of America | | TRY | 345 | | | $ | 114,800 | | | $ | 111,111 | | | $ | (3,689 | ) |
Expiring 11/18/2016 | | Barclays Capital Group | | TRY | 99 | | | | 32,000 | | | | 31,850 | | | | (150 | ) |
Expiring 11/18/2016 | | Barclays Capital Group | | TRY | 105 | | | | 33,999 | | | | 33,650 | | | | (349 | ) |
Expiring 11/18/2016 | | Citigroup Global Markets | | TRY | 721 | | | | 242,492 | | | | 232,076 | | | | (10,416 | ) |
Expiring 11/18/2016 | | Credit Suisse First
Boston Corp. | | TRY | 2,145 | | | | 717,455 | | | | 690,714 | | | | (26,741 | ) |
Expiring 11/18/2016 | | Deutsche Bank AG | | TRY | 104 | | | | 34,861 | | | | 33,509 | | | | (1,352 | ) |
Expiring 11/18/2016 | | JPMorgan Chase | | TRY | 106 | | | | 34,118 | | | | 34,125 | | | | 7 | |
Expiring 11/18/2016 | | UBS AG | | TRY | 74 | | | | 24,000 | | | | 23,898 | | | | (102 | ) |
Expiring 11/18/2016 | | UBS AG | | TRY | 342 | | | | 109,942 | | | | 109,980 | | | | 38 | |
| | | | | | | | | | | | | | | | | | |
| | | | | | | | $ | 20,100,622 | | | $ | 20,028,313 | | | | (72,309 | ) |
| | | | | | | | | | | | | | | | | | |
| | | | | |
Sale Contracts | | Counterparty | | Notional
Amount
(000) | | | Value at
Settlement
Date | | | Current
Value | | | Unrealized
Appreciation
(Depreciation) | |
OTC forward foreign currency exchange contracts: | |
Australian Dollar, | | | | | | | | | | | | | | | | | | |
Expiring 01/13/2017 | | Goldman Sachs & Co. | | AUD | 108 | | | $ | 81,375 | | | $ | 81,840 | | | $ | (465 | ) |
Expiring 01/13/2017 | | Goldman Sachs & Co. | | AUD | 107 | | | | 81,400 | | | | 81,543 | | | | (143 | ) |
Brazilian Real, | | | | | | | | | | | | | | | | | | |
Expiring 11/03/2016 | | Citigroup Global Markets | | BRL | 47 | | | | 14,894 | | | | 14,678 | | | | 216 | |
Expiring 11/03/2016 | | Goldman Sachs & Co. | | BRL | 819 | | | | 250,502 | | | | 256,310 | | | | (5,808 | ) |
Expiring 11/03/2016 | | Goldman Sachs & Co. | | BRL | 534 | | | | 163,625 | | | | 167,150 | | | | (3,525 | ) |
Expiring 11/03/2016 | | Goldman Sachs & Co. | | BRL | 65 | | | | 19,777 | | | | 20,285 | | | | (508 | ) |
Expiring 12/02/2016 | | Bank of America | | BRL | 517 | | | | 161,680 | | | | 160,288 | | | | 1,392 | |
Expiring 12/02/2016 | | Goldman Sachs & Co. | | BRL | 134 | | | | 42,344 | | | | 41,507 | | | | 837 | |
Canadian Dollar, | | | | | | | | | | | | | | | | | | |
Expiring 01/13/2017 | | Bank of America | | CAD | 214 | | | | 161,116 | | | | 159,435 | | | | 1,681 | |
Expiring 01/13/2017 | | Bank of America | | CAD | 5 | | | | 3,735 | | | | 3,699 | | | | 36 | |
Expiring 01/13/2017 | | Citigroup Global Markets | | CAD | 109 | | | | 81,700 | | | | 81,442 | | | | 258 | |
Expiring 01/13/2017 | | Citigroup Global Markets | | CAD | 109 | | | | 81,670 | | | | 81,243 | | | | 427 | |
Expiring 01/13/2017 | | Goldman Sachs & Co. | | CAD | 215 | | | | 161,126 | | | | 160,034 | | | | 1,092 | |
Chilean Peso, | | | | | | | | | | | | | | | | | | |
Expiring 01/23/2017 | | Hong Kong & Shanghai Bank | | CLP | 17,468 | | | | 25,877 | | | | 26,571 | | | | (694 | ) |
Colombian Peso, | | | | | | | | | | | | | | | | | | |
Expiring 11/10/2016 | | Bank of America | | COP | 61,845 | | | | 21,000 | | | | 20,534 | | | | 466 | |
Expiring 11/10/2016 | | Bank of America | | COP | 50,337 | | | | 17,000 | | | | 16,713 | | | | 287 | |
Expiring 11/10/2016 | | JPMorgan Chase | | COP | 46,753 | | | | 16,000 | | | | 15,523 | | | | 477 | |
Expiring 11/10/2016 | | JPMorgan Chase | | COP | 25,726 | | | | 8,170 | | | | 8,542 | | | | (372 | ) |
Expiring 11/10/2016 | | UBS AG | | COP | 73,861 | | | | 25,000 | | | | 24,524 | | | | 476 | |
See Notes to Financial Statements.
| | | | | | | | | | | | | | | | | | |
Forward foreign currency exchange contracts outstanding at October 31, 2016 (continued): | |
Sale Contracts | | Counterparty | | Notional
Amount
(000) | | | Value at
Settlement
Date | | | Current
Value | | | Unrealized
Appreciation
(Depreciation) | |
OTC forward foreign currency exchange contracts (cont’d.): | |
Colombian Peso (cont’d.), | | | | | | | | | | | | | | | | | | |
Expiring 01/23/2017 | | Bank of America | | COP | 68,607 | | | $ | 22,635 | | | $ | 22,544 | | | $ | 91 | |
Czech Koruna, | | | | | | | | | | | | | | | | | | |
Expiring 01/25/2017 | | Hong Kong & Shanghai Bank | | CZK | 7,090 | | | | 289,916 | | | | 290,074 | | | | (158 | ) |
Euro, | | | | | | | | | | | | | | | | | | |
Expiring 01/27/2017 | | Barclays Capital Group | | EUR | 10 | | | | 11,000 | | | | 11,094 | | | | (94 | ) |
Expiring 01/27/2017 | | Citigroup Global Markets | | EUR | 184 | | | | 201,872 | | | | 202,996 | | | | (1,124 | ) |
Expiring 01/27/2017 | | Citigroup Global Markets | | EUR | 31 | | | | 33,993 | | | | 34,174 | | | | (181 | ) |
Expiring 01/27/2017 | | Goldman Sachs & Co. | | EUR | 1,798 | | | | 1,965,490 | | | | 1,982,058 | | | | (16,568 | ) |
Expiring 01/27/2017 | | Goldman Sachs & Co. | | EUR | 147 | | | | 160,705 | | | | 161,739 | | | | (1,034 | ) |
Expiring 01/27/2017 | | UBS AG | | EUR | 148 | | | | 161,498 | | | | 162,859 | | | | (1,361 | ) |
Hungarian Forint, | | | | | | | | | | | | | | | | | | |
Expiring 01/25/2017 | | Citigroup Global Markets | | HUF | 57,086 | | | | 204,500 | | | | 203,279 | | | | 1,221 | |
Expiring 01/25/2017 | | UBS AG | | HUF | 22,696 | | | | 80,840 | | | | 80,817 | | | | 23 | |
Indian Rupee, | | | | | | | | | | | | | | | | | | |
Expiring 12/09/2016 | | UBS AG | | INR | 3,304 | | | | 49,000 | | | | 49,185 | | | | (185 | ) |
Indonesian Rupiah, | | | | | | | | | | | | | | | | | | |
Expiring 11/22/2016 | | Bank of America | | IDR | 13,957,953 | | | | 1,041,250 | | | | 1,066,695 | | | | (25,445 | ) |
Expiring 11/22/2016 | | Bank of America | | IDR | 613,504 | | | | 46,000 | | | | 46,885 | | | | (885 | ) |
Expiring 11/22/2016 | | Citigroup Global Markets | | IDR | 348,166 | | | | 26,000 | | | | 26,608 | | | | (608 | ) |
Expiring 11/22/2016 | | Hong Kong & Shanghai Bank | | IDR | 734,550 | | | | 56,034 | | | | 56,136 | | | | (102 | ) |
Expiring 11/22/2016 | | JPMorgan Chase | | IDR | 656,000 | | | | 50,000 | | | | 50,133 | | | | (133 | ) |
Expiring 11/22/2016 | | JPMorgan Chase | | IDR | 260,700 | | | | 20,000 | | | | 19,923 | | | | 77 | |
Expiring 11/22/2016 | | UBS AG | | IDR | 2,084,023 | | | | 159,110 | | | | 159,265 | | | | (155 | ) |
Expiring 11/22/2016 | | UBS AG | | IDR | 661,527 | | | | 50,300 | | | | 50,555 | | | | (255 | ) |
Israeli Shekel, | | | | | | | | | | | | | | | | | | |
Expiring 01/19/2017 | | JPMorgan Chase | | ILS | 578 | | | | 151,365 | | | | 150,905 | | | | 460 | |
Japanese Yen, | | | | | | | | | | | | | | | | | | |
Expiring 01/27/2017 | | Barclays Capital Group | | JPY | 10,152 | | | | 97,000 | | | | 97,170 | | | | (170 | ) |
Expiring 01/27/2017 | | Barclays Capital Group | | JPY | 8,403 | | | | 80,000 | | | | 80,429 | | | | (429 | ) |
Expiring 01/27/2017 | | Citigroup Global Markets | | JPY | 23,046 | | | | 220,900 | | | | 220,599 | | | | 301 | |
Expiring 01/27/2017 | | Citigroup Global Markets | | JPY | 10,178 | | | | 96,900 | | | | 97,423 | | | | (523 | ) |
Expiring 01/27/2017 | | Citigroup Global Markets | | JPY | 3,544 | | | | 34,000 | | | | 33,920 | | | | 80 | |
Expiring 01/27/2017 | | UBS AG | | JPY | 6,387 | | | | 61,000 | | | | 61,137 | | | | (137 | ) |
Expiring 01/27/2017 | | UBS AG | | JPY | 6,138 | | | | 59,000 | | | | 58,750 | | | | 250 | |
Expiring 01/27/2017 | | UBS AG | | JPY | 3,000 | | | | 29,000 | | | | 28,715 | | | | 285 | |
Expiring 01/27/2017 | | UBS AG | | JPY | 2,470 | | | | 24,000 | | | | 23,641 | | | | 359 | |
Malaysian Ringgit, | | | | | | | | | | | | | | | | | | |
Expiring 12/21/2016 | | Bank of America | | MYR | 1,433 | | | | 345,350 | | | | 340,740 | | | | 4,610 | |
Expiring 12/21/2016 | | Bank of America | | MYR | 514 | | | | 122,575 | | | | 122,105 | | | | 470 | |
Expiring 12/21/2016 | | Bank of America | | MYR | 252 | | | | 60,508 | | | | 59,844 | | | | 664 | |
See Notes to Financial Statements.
| | | | |
| Prudential Emerging Markets Debt Local Currency Fund | | | 23 | |
Portfolio of Investments (continued)
as of October 31, 2016
| | | | | | | | | | | | | | | | | | |
Forward foreign currency exchange contracts outstanding at October 31, 2016 (continued): | |
Sale Contracts | | Counterparty | | Notional
Amount
(000) | | | Value at
Settlement
Date | | | Current
Value | | | Unrealized
Appreciation
(Depreciation) | |
OTC forward foreign currency exchange contracts (cont’d.): | |
Malaysian Ringgit (cont’d.), | | | | | | | | | | | | | | | | | | |
Expiring 12/21/2016 | | Bank of America | | MYR | 134 | | | $ | 32,000 | | | $ | 31,905 | | | $ | 95 | |
Expiring 12/21/2016 | | Citigroup Global Markets | | MYR | 1,755 | | | | 416,650 | | | | 417,253 | | | | (603 | ) |
Expiring 12/21/2016 | | Hong Kong & Shanghai Bank | | MYR | 82 | | | | 19,777 | | | | 19,463 | | | | 314 | |
Expiring 12/21/2016 | | UBS AG | | MYR | 139 | | | | 33,000 | | | | 33,093 | | | | (93 | ) |
Mexican Peso, | | | | | | | | | | | | | | | | | | |
Expiring 01/24/2017 | | UBS AG | | MXN | 2,332 | | | | 122,877 | | | | 122,221 | | | | 656 | |
Expiring 01/24/2017 | | UBS AG | | MXN | 395 | | | | 21,000 | | | | 20,715 | | | | 285 | |
New Taiwanese Dollar, | | | | | | | | | | | | | | | | | | |
Expiring 12/15/2016 | | Bank of America | | TWD | 406 | | | | 13,000 | | | | 12,873 | | | | 127 | |
Expiring 12/15/2016 | | Barclays Capital Group | | TWD | 34,702 | | | | 1,030,353 | | | | 1,100,725 | | | | (70,372 | ) |
Expiring 12/15/2016 | | UBS AG | | TWD | 5,139 | | | | 161,601 | | | | 163,002 | | | | (1,401 | ) |
Expiring 12/15/2016 | | UBS AG | | TWD | 505 | | | | 16,000 | | | | 16,026 | | | | (26 | ) |
New Zealand Dollar, | | | | | | | | | | | | | | | | | | |
Expiring 01/13/2017 | | UBS AG | | NZD | 264 | | | | 185,301 | | | | 188,142 | | | | (2,841 | ) |
Peruvian Nuevo Sol, | | | | | | | | | | | | | | | | | | |
Expiring 12/09/2016 | | Citigroup Global Markets | | PEN | 393 | | | | 115,500 | | | | 116,208 | | | | (708 | ) |
Expiring 12/09/2016 | | Citigroup Global Markets | | PEN | 113 | | | | 33,251 | | | | 33,528 | | | | (277 | ) |
Expiring 01/23/2017 | | Bank of America | | PEN | 110 | | | | 32,520 | | | | 32,389 | | | | 131 | |
Expiring 01/23/2017 | | Citigroup Global Markets | | PEN | 551 | | | | 160,038 | | | | 162,314 | | | | (2,276 | ) |
Philippine Peso, | | | | | | | | | | | | | | | | | | |
Expiring 11/29/2016 | | Citigroup Global Markets | | PHP | 3,804 | | | | 78,400 | | | | 78,542 | | | | (142 | ) |
Expiring 12/21/2016 | | Barclays Capital Group | | PHP | 16,044 | | | | 329,239 | | | | 331,176 | | | | (1,937 | ) |
Expiring 12/21/2016 | | Citigroup Global Markets | | PHP | 6,290 | | | | 130,000 | | | | 129,842 | | | | 158 | |
Expiring 12/21/2016 | | JPMorgan Chase | | PHP | 6,241 | | | | 129,000 | | | | 128,827 | | | | 173 | |
Expiring 12/21/2016 | | JPMorgan Chase | | PHP | 5,450 | | | | 112,000 | | | | 112,497 | | | | (497 | ) |
Expiring 12/21/2016 | | JPMorgan Chase | | PHP | 3,439 | | | | 71,000 | | | | 70,985 | | | | 15 | |
Expiring 12/21/2016 | | JPMorgan Chase | | PHP | 2,237 | | | | 46,000 | | | | 46,174 | | | | (174 | ) |
Expiring 12/21/2016 | | UBS AG | | PHP | 6,364 | | | | 131,000 | | | | 131,372 | | | | (372 | ) |
Expiring 01/20/2017 | | Citigroup Global Markets | | PHP | 1,502 | | | | 30,726 | | | | 30,990 | | | | (264 | ) |
Expiring 01/20/2017 | | JPMorgan Chase | | PHP | 4,447 | | | | 91,200 | | | | 91,739 | | | | (539 | ) |
Expiring 02/02/2017 | | Citigroup Global Markets | | PHP | 7,881 | | | | 161,500 | | | | 162,545 | | | | (1,045 | ) |
Polish Zloty, | | | | | | | | | | | | | | | | | | |
Expiring 01/25/2017 | | JPMorgan Chase | | PLN | 643 | | | | 163,532 | | | | 163,535 | | | | (3 | ) |
Romanian Leu, | | | | | | | | | | | | | | | | | | |
Expiring 01/27/2017 | | Hong Kong & Shanghai Bank | | RON | 1,294 | | | | 315,714 | | | | 315,800 | | | | (86 | ) |
Expiring 01/27/2017 | | Hong Kong & Shanghai Bank | | RON | 664 | | | | 162,165 | | | | 162,092 | | | | 73 | |
Expiring 01/27/2017 | | Hong Kong & Shanghai Bank | | RON | 340 | | | | 82,878 | | | | 83,088 | | | | (210 | ) |
See Notes to Financial Statements.
| | | | | | | | | | | | | | | | | | |
Forward foreign currency exchange contracts outstanding at October 31, 2016 (continued): | |
Sale Contracts | | Counterparty | | Notional
Amount
(000) | | | Value at
Settlement
Date | | | Current
Value | | | Unrealized
Appreciation
(Depreciation) | |
OTC forward foreign currency exchange contracts (cont’d.): | |
Russian Ruble, | | | | | | | | | | | | | | | | | | |
Expiring 12/09/2016 | | JPMorgan Chase | | RUB | 1,021 | | | $ | 16,000 | | | $ | 15,932 | | | $ | 68 | |
Expiring 12/09/2016 | | UBS AG | | RUB | 958 | | | | 14,999 | | | | 14,954 | | | | 45 | |
Singapore Dollar, | | | | | | | | | | | | | | | | | | |
Expiring 12/21/2016 | | Bank of America | | SGD | 210 | | | | 154,546 | | | | 151,301 | | | | 3,245 | |
Expiring 12/21/2016 | | Barclays Capital Group | | SGD | 54 | | | | 39,000 | | | | 38,495 | | | | 505 | |
Expiring 12/21/2016 | | Citigroup Global Markets | | SGD | 224 | | | | 162,638 | | | | 161,321 | | | | 1,317 | |
Expiring 12/21/2016 | | Citigroup Global Markets | | SGD | 31 | | | | 23,000 | | | | 22,542 | | | | 458 | |
Expiring 12/21/2016 | | JPMorgan Chase | | SGD | 48 | | | | 34,979 | | | | 34,296 | | | | 683 | |
Expiring 12/21/2016 | | UBS AG | | SGD | 223 | | | | 160,442 | | | | 160,274 | | | | 168 | |
South African Rand, | | | | | | | | | | | | | | | | | | |
Expiring 01/13/2017 | | Barclays Capital Group | | ZAR | 289 | | | | 20,000 | | | | 21,079 | | | | (1,079 | ) |
Expiring 01/13/2017 | | Citigroup Global Markets | | ZAR | 2,151 | | | | 154,000 | | | | 157,098 | | | | (3,098 | ) |
Expiring 01/13/2017 | | Citigroup Global Markets | | ZAR | 1,730 | | | | 118,615 | | | | 126,351 | | | | (7,736 | ) |
Expiring 01/13/2017 | | Citigroup Global Markets | | ZAR | 560 | | | | 38,863 | | | | 40,926 | | | | (2,063 | ) |
South Korean Won, | | | | | | | | | | | | | | | | | | |
Expiring 12/21/2016 | | Citigroup Global Markets | | KRW | 20,471 | | | | 18,000 | | | | 17,887 | | | | 113 | |
Expiring 12/21/2016 | | JPMorgan Chase | | KRW | 41,703 | | | | 37,000 | | | | 36,438 | | | | 562 | |
Expiring 12/21/2016 | | JPMorgan Chase | | KRW | 19,152 | | | | 17,000 | | | | 16,734 | | | | 266 | |
Expiring 12/21/2016 | | UBS AG | | KRW | 30,591 | | | | 27,000 | | | | 26,729 | | | | 271 | |
Swiss Franc, | | | | | | | | | | | | | | | | | | |
Expiring 01/27/2017 | | Goldman Sachs & Co. | | CHF | 80 | | | | 81,366 | | | | 81,721 | | | | (355 | ) |
Thai Baht, | | | | | | | | | | | | | | | | | | |
Expiring 01/20/2017 | | Citigroup Global Markets | | THB | 1,474 | | | | 42,037 | | | | 42,072 | | | | (35 | ) |
Expiring 01/20/2017 | | UBS AG | | THB | 631 | | | | 18,000 | | | | 18,015 | | | | (15 | ) |
Turkish Lira, | | | | | | | | | | | | | | | | | | |
Expiring 11/18/2016 | | Barclays Capital Group | | TRY | 83 | | | | 27,999 | | | | 26,816 | | | | 1,183 | |
Expiring 11/18/2016 | | Barclays Capital Group | | TRY | 78 | | | | 25,991 | | | | 25,175 | | | | 816 | |
Expiring 11/18/2016 | | Citigroup Global Markets | | TRY | 729 | | | | 241,689 | | | | 234,587 | | | | 7,102 | |
Expiring 11/18/2016 | | Citigroup Global Markets | | TRY | 272 | | | | 86,979 | | | | 87,693 | | | | (714 | ) |
Expiring 11/18/2016 | | Citigroup Global Markets | | TRY | 221 | | | | 73,919 | | | | 71,108 | | | | 2,811 | |
Expiring 11/18/2016 | | Citigroup Global Markets | | TRY | 81 | | | | 27,000 | | | | 25,948 | | | | 1,052 | |
Expiring 11/18/2016 | | Citigroup Global Markets | | TRY | 75 | | | | 25,000 | | | | 24,268 | | | | 732 | |
Expiring 11/18/2016 | | Citigroup Global Markets | | TRY | 54 | | | | 18,000 | | | | 17,319 | | | | 681 | |
Expiring 11/18/2016 | | Deutsche Bank AG | | TRY | 102 | | | | 33,850 | | | | 32,780 | | | | 1,070 | |
Expiring 11/18/2016 | | Goldman Sachs & Co. | | TRY | 315 | | | | 102,293 | | | | 101,435 | | | | 858 | |
Expiring 11/18/2016 | | JPMorgan Chase | | TRY | 725 | | | | 244,384 | | | | 233,492 | | | | 10,892 | |
Expiring 11/18/2016 | | UBS AG | | TRY | 18 | | | | 6,000 | | | | 5,808 | | | | 192 | |
| | | | | | | | | | | | | | | | | | |
| | | | | | | | $ | 13,947,543 | | | $ | 14,053,913 | | | | (106,370 | ) |
| | | | | | | | | | | | | | | | | | |
| | | | | | | | | | | | | | | | $ | (178,679 | ) |
| | | | | |
See Notes to Financial Statements.
| | | | |
| Prudential Emerging Markets Debt Local Currency Fund | | | 25 | |
Portfolio of Investments (continued)
as of October 31, 2016
Cross currency exchange contracts outstanding at October 31, 2016:
| | | | | | | | | | | | | | | | | | | | | | |
Settlement | | Type | | Notional
Amount
(000) | | | In Exchange
For (000) | | | Unrealized
Appreciation
(Depreciation) | | | Counterparty | |
OTC cross currency exchange contracts: | |
01/13/2017 | | Buy | | EUR | 148 | | | | ZAR | | | | 2,299 | | | $ | (4,362 | ) | | | Goldman Sachs & Co. | |
01/13/2017 | | Buy | | ZAR | 793 | | | | EUR | | | | 50 | | | | 2,836 | | | | Goldman Sachs & Co. | |
01/25/2017 | | Buy | | HUF | 27,644 | | | | EUR | | | | 90 | | | | (718 | ) | | | Citigroup Global Markets | |
01/27/2017 | | Buy | | EUR | 74 | | | | CHF | | | | 81 | | | | 114 | | | | JPMorgan Chase | |
11/18/2016 | | Buy | | TRY | 372 | | | | EUR | | | | 109 | | | | 73 | | | | Citigroup Global Markets | |
| | | | | | | | | |
| | | | | | | | | | | | | | | | $ | (2,057 | ) | | | | |
| | | | | | | | | |
Interest rate swap agreements outstanding at October 31, 2016:
| | | | | | | | | | | | | | | | | | | | | | | | | | |
Notional
Amount
(000)# | | | Termination
Date | | | Fixed
Rate | | | Floating
Rate | | Fair
Value | | | Upfront
Premiums
Paid
(Received) | | | Unrealized
Appreciation
(Depreciation) | | | Counterparty |
| OTC swap agreements: | | | | | | | |
| MYR | 1,650 | | | | 05/20/21 | | | | 3.770% | | | 3 Month Malaysia Bumiputra Rate(1) | | $ | 4,770 | | | $ | — | | | $ | 4,770 | | | JPMorgan Chase |
| THB | 9,000 | | | | 02/28/26 | | | | 2.300% | | | 6 Month Thailand Fixing Rate(1) | | | 2,116 | | | | — | | | | 2,116 | | | JPMorgan Chase |
| | | | | | | | | | | | | | | |
| | | | | | | | | | | | | | $ | 6,886 | | | $ | — | | | $ | 6,886 | | | |
| | | | | | | | | | | | | | | |
| | | | | | | | | | | | | | | | | | | | | | | | |
Notional
Amount
(000)# | | | Termination
Date | | | Fixed
Rate | | | Floating Rate | | Value at
Trade Date | | | Value at
October 31,
2016 | | | Unrealized
Appreciation
(Depreciation) | |
| Centrally cleared swap agreements: | |
| MXN | 4,500 | | | | 02/16/21 | | | | 5.400% | | | 28 Day Mexican Interbank Rate(1) | | $ | 9 | | | $ | (6,156 | ) | | $ | (6,165 | ) |
| MXN | 3,300 | | | | 02/21/22 | | | | 6.620% | | | 28 Day Mexican Interbank Rate(1) | | | 133 | | | | 3,726 | | | | 3,593 | |
| MXN | 20,650 | | | | 06/04/25 | | | | 6.470% | | | 28 Day Mexican Interbank Rate(1) | | | 330 | | | | 3,479 | | | | 3,149 | |
| MXN | 3,400 | | | | 01/05/26 | | | | 6.260% | | | 28 Day Mexican Interbank Rate(2) | | | 10 | | | | 2,679 | | | | 2,669 | |
| | | | | | | | | | | | | |
| | | | | | | | | | | | | | $ | 482 | | | $ | 3,728 | | | $ | 3,246 | |
| | | | | | | | | | | | | |
Cash of $170,000 has been segregated with Citigroup Global Markets to cover requirements for open centrally cleared interest rate swap contracts at October 31, 2016.
| (1) | The Series pays the floating rate and receives the fixed rate. |
| (2) | The Series pays the fixed rate and receives the floating rate. |
See Notes to Financial Statements.
Various inputs are used in determining the value of the Series’ investments. These inputs are summarized in the three broad levels listed below.
Level 1—quoted prices generally in active markets for identical securities.
Level 2—quoted prices for similar securities, interest rates and yield curves, prepayment speeds, foreign currency exchange rates and other observable inputs.
Level 3—unobservable inputs for securities valued in accordance with Board approved fair valuation procedures.
The following is a summary of the inputs used as of October 31, 2016 in valuing such portfolio securities:
| | | | | | | | | | | | |
| | | Level 1 | | | Level 2 | | | Level 3 | |
Investments in Securities | | | | | | | | | | | | |
Foreign Bonds | | | | | | | | | | | | |
Argentina | | $ | — | | | $ | 759,542 | | | $ | — | |
Brazil | | | — | | | | 3,933,778 | | | | — | |
Colombia | | | — | | | | 1,516,203 | | | | — | |
Dominican Republic | | | — | | | | 294,897 | | | | — | |
Hungary | | | — | | | | 1,413,053 | | | | — | |
Indonesia | | | — | | | | 3,571,358 | | | | — | |
Kazakhstan | | | — | | | | 137,067 | | | | — | |
Malaysia | | | — | | | | 1,519,268 | | | | — | |
Mexico | | | — | | | | 2,062,542 | | | | — | |
Pakistan | | | — | | | | 211,999 | | | | — | |
Peru | | | — | | | | 688,774 | | | | — | |
Philippines | | | — | | | | 679,023 | | | | — | |
Poland | | | — | | | | 2,667,066 | | | | — | |
Romania | | | — | | | | 1,524,891 | | | | — | |
Russia | | | — | | | | 1,392,243 | | | | — | |
South Africa | | | — | | | | 3,018,725 | | | | — | |
South Korea | | | — | | | | 94,747 | | | | — | |
Thailand | | | — | | | | 1,280,336 | | | | — | |
Turkey | | | — | | | | 2,621,837 | | | | — | |
Affiliated Mutual Fund | | | 1,637,992 | | | | — | | | | — | |
Foreign Treasury Obligations | | | — | | | | 334,555 | | | | — | |
Other Financial Instruments* | | | | | | | | | | | | |
OTC Forward Foreign Currency Exchange Contracts | | | — | | | | (178,679 | ) | | | — | |
OTC Cross Currency Exchange Contracts | | | — | | | | (2,057 | ) | | | — | |
OTC Interest Rate Swap Agreements | | | | | | | 6,886 | | | | | |
Centrally Cleared Interest Rate Swap Agreements | | | — | | | | 3,246 | | | | — | |
| | | | | | | | | | | | |
Total | | $ | 1,637,992 | | | $ | 29,551,300 | | | $ | — | |
| | | | | | | | | | | | |
| * | Other financial instruments are derivative instruments not reflected in the Portfolio of Investments, such as futures, forwards and centrally cleared swap contracts, which are recorded at the unrealized appreciation (depreciation) on the instrument, and OTC swap contracts which are recorded at fair value. |
See Notes to Financial Statements.
| | | | |
| Prudential Emerging Markets Debt Local Currency Fund | | | 27 | |
Portfolio of Investments (continued)
as of October 31, 2016
During the period, there were no transfers between Level 1 and Level 2 to report.
The industry classification of investments and other assets in excess of liabilities shown as a percentage of net assets as of October 31, 2016 were as follows (unaudited):
| | | | |
Foreign Government Obligations | | | 82.2 | % |
Foreign Agencies | | | 6.1 | |
Affiliated Mutual Fund | | | 5.1 | |
Foreign Corporations | | | 1.3 | |
U.S. Treasury Obligations | | | 1.0 | |
Sovereign Bonds | | | 1.0 | |
Foreign Government Bonds | | | 0.6 | |
| | | | |
| | | 97.3 | |
Other assets in excess of liabilities | | | 2.7 | |
| | | | |
| | | 100.0 | % |
| | | | |
The Series invested in derivative instruments during the reporting period. The primary types of risk associated with these derivative instruments are foreign exchange risk and interest rate risk. The effect of such derivative instruments on the Series’ financial position and financial performance as reflected in the Statement of Assets and Liabilities and Statement of Operations is presented in the summary below.
Fair values of derivative instruments as of October 31, 2016 as presented in the Statement of Assets and Liabilities:
| | | | | | | | | | | | |
Derivatives not accounted
for as hedging instruments,
carried at fair value | | Asset Derivatives | | | Liability Derivatives | |
| | Balance Sheet
Location | | Fair
Value | | | Balance Sheet
Location | | Fair
Value | |
| Foreign exchange contracts | | Unrealized appreciation on OTC forward foreign currency exchange contracts | | $ | 135,357 | | | Unrealized depreciation on OTC forward foreign currency exchange contracts | | $ | 314,036 | |
| Foreign exchange contracts | | Unrealized appreciation on OTC cross currency exchange contracts | | | 3,023 | | | Unrealized depreciation on OTC cross currency exchange contracts | | | 5,080 | |
| Interest rate contracts | | Due from/to broker—variation margin swaps | | | 9,411 | * | | Due from/to broker—variation margin swaps | | | 6,165 | * |
| Interest rate contracts | | Unrealized appreciation on OTC swap agreements | | | 6,886 | | | — | | | — | |
| | | | | | | | | | | | |
Total | | | | $ | 154,677 | | | | | $ | 325,281 | |
| | | | | | | | | | | | |
| * | Includes cumulative appreciation (depreciation) as reported in the schedule of open futures and centrally cleared swap contracts. Only unsettled variation margin receivable (payable) is reported within the Statement of Asset and Liabilities. |
See Notes to Financial Statements.
The effects of derivative instruments on the Statement of Operations for the year ended October 31, 2016 are as follows:
| | | | | | | | | | | | |
Amount of Realized Gain (Loss) on Derivatives Recognized in Income | |
Derivatives not accounted
for as hedging instruments,
carried at fair value | | Forward and
Cross Currency
Contracts* | | | Swaps | | | Total | |
Foreign exchange contracts | | $ | (556,355 | ) | | $ | — | | | $ | (556,355 | ) |
Interest rate contracts | | | — | | | | 38,726 | | | | 38,726 | |
| | | | | | | | | | | | |
| | $ | (556,355 | ) | | $ | 38,726 | | | $ | (517,629 | ) |
| | | | | | | | | | | | |
| * | Included in net realized gain (loss) on foreign currency transactions in the Statement of Operations. |
| | | | | | | | | | | | |
Change in Unrealized Appreciation (Depreciation) on Derivatives Recognized in Income | |
Derivatives not accounted
for as hedging instruments,
carried at fair value | | Forward and
Cross Currency
Contracts* | | | Swaps | | | Total | |
Foreign exchange contracts | | $ | (110,200 | ) | | $ | — | | | $ | (110,200 | ) |
Interest rate contracts | | | — | | | | (23,392 | ) | | | (23,392 | ) |
| | | | | | | | | | | | |
| | $ | (110,200 | ) | | $ | (23,392 | ) | | $ | (133,592 | ) |
| | | | | | | | | | | | |
| * | Included in net change in unrealized appreciation (depreciation) on foreign currencies in the Statement of Operations. |
For the year ended October 31, 2016, the Series’ average volume of derivative activities are as follows:
| | | | | | | | | | | | | | |
Forward Foreign
Currency Exchange
Contracts—Purchased(1) | | | Forward Foreign
Currency Exchange
Contracts—Sold(1) | | | Cross Currency
Exchange
Contracts(2) | | | Interest Rate
Swap
Agreements(3) | |
| $ | 20,411,549 | | | $ | 16,307,118 | | | $ | 465,255 | | | $ | 2,116,000 | |
| (1) | Value at Settlement Date. |
| (3) | Notional Amount in USD. |
See Notes to Financial Statements.
| | | | |
| Prudential Emerging Markets Debt Local Currency Fund | | | 29 | |
Portfolio of Investments (continued)
as of October 31, 2016
Offsetting of OTC derivative assets and liabilities:
The Series invested in OTC derivatives during the reporting period that are either offset in accordance with current requirements or are subject to enforceable master netting arrangements or similar agreements that permit offsetting. The information about offsetting and related netting arrangements for OTC derivatives, where the legal right to set-off exists, is presented in the summary below.
| | | | | | | | | | | | | | | | |
Counterparty | | Gross
amounts of
recognized
assets(1) | | | Gross
amounts
available
for offset | | | Collateral
Received | | | Net
Amount | |
Bank of America | | $ | 16,845 | | | $ | (16,845 | ) | | $ | — | | | $ | — | |
Barclays Capital Group | | | 5,927 | | | | (5,927 | ) | | | — | | | | — | |
Citigroup Global Markets | | | 66,416 | | | | (52,814 | ) | | | — | | | | 13,602 | |
Credit Suisse First Boston Corp. | | | — | | | | — | | | | — | | | | — | |
Deutsche Bank AG | | | 1,070 | | | | (1,070 | ) | | | — | | | | — | |
Goldman Sachs & Co. | | | 20,376 | | | | (20,376 | ) | | | — | | | | — | |
Hong Kong & Shanghai Bank | | | 6,973 | | | | (1,250 | ) | | | — | | | | 5,723 | |
JPMorgan Chase | | | 21,965 | | | | (21,965 | ) | | | — | | | | — | |
Morgan Stanley | | | 68 | | | | (68 | ) | | | — | | | | — | |
UBS AG | | | 5,626 | | | | (5,626 | ) | | | — | | | | — | |
| | | | | | | | | | | | | | | | |
| | $ | 145,266 | | | | | | | | | | | | | |
| | | | | | | | | | | | | | | | |
| | | | |
Counterparty | | Gross
amounts of
recognized
liabilities(2) | | | Gross
amounts
available
for offset | | | Collateral
Pledged | | | Net
Amount | |
Bank of America | | $ | (56,521 | ) | | $ | 16,845 | | | $ | — | | | $ | (39,676 | ) |
Barclays Capital Group | | | (74,696 | ) | | | 5,927 | | | | — | | | | (68,769 | ) |
Citigroup Global Markets | | | (52,814 | ) | | | 52,814 | | | | — | | | | — | |
Credit Suisse First Boston Corp. | | | (26,741 | ) | | | — | | | | — | | | | (26,741 | ) |
Deutsche Bank AG | | | (1,352 | ) | | | 1,070 | | | | — | | | | (282 | ) |
Goldman Sachs & Co. | | | (55,092 | ) | | | 20,376 | | | | — | | | | (34,716 | ) |
Hong Kong & Shanghai Bank | | | (1,250 | ) | | | 1,250 | | | | — | | | | — | |
JPMorgan Chase | | | (25,803 | ) | | | 21,965 | | | | — | | | | (3,838 | ) |
Morgan Stanley | | | (135 | ) | | | 68 | | | | — | | | | (67 | ) |
UBS AG | | | (24,712 | ) | | | 5,626 | | | | — | | | | (19,086 | ) |
| | | | | | | | | | | | | | | | |
| | $ | (319,116 | ) | | | | | | | | | | | | |
| | | | | | | | | | | | | | | | |
| (1) | Includes unrealized appreciation on swaps and forwards, premiums paid on swap agreements and market value of purchased options. |
| (2) | Includes unrealized depreciation on swaps and forwards, premiums received on swap agreements and market value of written options. |
See Notes to Financial Statements.
This Page Intentionally Left Blank
Statement of Assets & Liabilities
as of October 31, 2016
| | | | |
Assets | | | | |
Investments at value: | | | | |
Unaffiliated investments (cost $31,235,520) | | $ | 29,721,904 | |
Affiliated investments (cost $1,637,992) | | | 1,637,992 | |
Foreign currency, at value (cost $390,899) | | | 390,990 | |
Deposit with broker for centrally cleared swaps | | | 170,000 | |
Receivable for investments sold | | | 1,459,414 | |
Dividends and interest receivable | | | 528,878 | |
Unrealized appreciation on OTC forward foreign currency exchange contracts | | | 135,357 | |
Tax reclaim receivable | | | 34,488 | |
Due from Manager | | | 7,032 | |
Unrealized appreciation on OTC swap agreements | | | 6,886 | |
Receivable for Series shares sold | | | 6,360 | |
Unrealized appreciation on OTC cross currency exchange contracts | | | 3,023 | |
Prepaid expenses | | | 816 | |
| | | | |
Total Assets | | | 34,103,140 | |
| | | | |
| |
Liabilities | | | | |
Payable for investments purchased | | | 1,406,851 | |
Unrealized depreciation on OTC forward foreign currency exchange contracts | | | 314,036 | |
Accrued expenses and other liabilities | | | 74,956 | |
Foreign capital gains tax liability | | | 31,394 | |
Payable for Series shares reacquired | | | 20,933 | |
Dividends payable | | | 5,492 | |
Unrealized depreciation on OTC cross currency exchange contracts | | | 5,080 | |
Due to broker—variation margin swaps | | | 2,349 | |
Distribution fee payable | | | 1,505 | |
Affiliated transfer agent fee payable | | | 664 | |
| | | | |
Total Liabilities | | | 1,863,260 | |
| | | | |
| |
Net Assets | | $ | 32,239,880 | |
| | | | |
| | | | | |
Net assets were comprised of: | | | | |
Common stock, at par | | $ | 49,635 | |
Paid-in capital in excess of par | | | 37,690,760 | |
| | | | |
| | | 37,740,395 | |
Distributions in excess of net investment income | | | (853,485 | ) |
Accumulated net realized loss on investment and foreign currency transactions | | | (2,911,539 | ) |
Net unrealized depreciation on investments and foreign currencies | | | (1,735,491 | ) |
| | | | |
Net assets, October 31, 2016 | | $ | 32,239,880 | |
| | | | |
See Notes to Financial Statements.
| | | | |
Class A | | | | |
Net asset value and redemption price per share
($3,989,788 ÷ 619,764 shares of common stock issued and outstanding) | | $ | 6.44 | |
Maximum sales charge (4.50% of offering price) | | | 0.30 | |
| | | | |
Maximum offering price to public | | $ | 6.74 | |
| | | | |
| |
Class C | | | | |
Net asset value, offering price and redemption price per share
($786,884 ÷ 121,320 shares of common stock issued and outstanding) | | $ | 6.49 | |
| | | | |
| |
Class Q | | | | |
Net asset value, offering price and redemption price per share
($927 ÷ 142.516 shares of common stock issued and outstanding) | | $ | 6.50 | |
| | | | |
| |
Class Z | | | | |
Net asset value, offering price and redemption price per share
($27,462,281 ÷ 4,222,239 shares of common stock issued and outstanding) | | $ | 6.50 | |
| | | | |
See Notes to Financial Statements.
| | | | |
| Prudential Emerging Markets Debt Local Currency Fund | | | 33 | |
Statement of Operations
Year Ended October 31, 2016
| | | | |
Net Investment Income (Loss) | | | | |
Income | | | | |
Interest income (net of foreign withholding taxes of $48,436) | | $ | 1,919,260 | |
Affiliated dividend income | | | 5,324 | |
| | | | |
Total income | | | 1,924,584 | |
| | | | |
| |
Expenses | | | | |
Management fee | | | 240,473 | |
Distribution fee—Class A | | | 8,358 | |
Distribution fee—Class C | | | 7,206 | |
Custodian and accounting fees (net of $6,000 fee credit) | | | 162,000 | |
Audit fee | | | 66,000 | |
Registration fees | | | 62,000 | |
Shareholders’ reports | | | 28,000 | |
Legal fees and expenses | | | 20,000 | |
Transfer agent’s fees and expenses (including affiliated expense of $3,900) | | | 16,000 | |
Directors’ fees | | | 10,000 | |
Insurance expenses | | | 1,000 | |
Miscellaneous | | | 13,709 | |
| | | | |
Total expenses | | | 634,746 | |
Less: Expense reimbursement | | | (308,240 | ) |
| | | | |
Net expenses | | | 326,506 | |
| | | | |
Net investment income (loss) | | | 1,598,078 | |
| | | | |
| |
Realized And Unrealized Gain (Loss) On Investment And Foreign Currency Transactions | | | | |
Net realized gain (loss) on: | | | | |
Investment transactions | | | (75,890 | ) |
Swap agreement transactions | | | 38,726 | |
Foreign currency transactions | | | (5,114,022 | ) |
| | | | |
| | | (5,151,186 | ) |
| | | | |
Net change in unrealized appreciation (depreciation) on: | | | | |
Investments (net of change in foreign capital gains taxes $(46,016)) | | | 6,402,954 | |
Swap agreements | | | (23,392 | ) |
Foreign currencies | | | (113,692 | ) |
| | | | |
| | | 6,265,870 | |
| | | | |
Net gain (loss) on investment and foreign currency transactions | | | 1,114,684 | |
| | | | |
Net Increase (Decrease) In Net Assets Resulting From Operations | | $ | 2,712,762 | |
| | | | |
See Notes to Financial Statements.
Statement of Changes in Net Assets
| | | | | | | | |
| | | Year Ended October 31, | |
| | | 2016 | | | 2015 | |
Increase (Decrease) in Net Assets | | | | | | | | |
Operations | | | | | | | | |
Net investment income (loss) | | $ | 1,598,078 | | | $ | 1,694,341 | |
Net realized gain (loss) on investment and foreign currency transactions | | | (5,151,186 | ) | | | (3,023,649 | ) |
Net change in unrealized appreciation (depreciation) on investments and foreign currencies | | | 6,265,870 | | | | (4,322,521 | ) |
| | | | | | | | |
Net increase (decrease) in net assets resulting from operations | | | 2,712,762 | | | | (5,651,829 | ) |
| | | | | | | | |
| | |
Dividends and Distributions (Note 1) | | | | | | | | |
Dividends from net investment income* | | | | | | | | |
Class A | | | (264 | ) | | | (45,844 | ) |
Class C | | | (49 | ) | | | (7,298 | ) |
Class Q` | | | — | ** | | | (10 | ) |
Class Z | | | (2,125 | ) | | | (285,001 | ) |
| | | | | | | | |
| | | (2,438 | ) | | | (338,153 | ) |
| | | | | | | | |
Tax return of capital distributions | | | | | | | | |
Class A | | | (193,151 | ) | | | (210,631 | ) |
Class C | | | (36,091 | ) | | | (33,532 | ) |
Class Q | | | (53 | ) | | | (47 | ) |
Class Z | | | (1,553,499 | ) | | | (1,309,420 | ) |
| | | | | | | | |
| | | (1,782,794 | ) | | | (1,553,630 | ) |
| | | | | | | | |
| | |
Series share transactions (Net of share conversions) (Note 6) | | | | | | | | |
Net proceeds from shares sold | | | 4,264,777 | | | | 6,141,515 | |
Net asset value of shares issued in reinvestment of dividends and distributions | | | 1,752,892 | | | | 1,809,657 | |
Cost of shares reacquired | | | (3,435,696 | ) | | | (7,173,758 | ) |
| | | | | | | | |
Net increase (decrease) in net assets from Series share transactions | | | 2,581,973 | | | | 777,414 | |
| | | | | | | | |
Total increase (decrease) | | | 3,509,503 | | | | (6,766,198 | ) |
| | |
Net Assets: | | | | | | | | |
Beginning of year | | | 28,730,377 | | | | 35,496,575 | |
| | | | | | | | |
End of year | | $ | 32,239,880 | | | $ | 28,730,377 | |
| | | | | | | | |
| * | Dividends from net investment income may include other items that are ordinary income for tax purposes. |
See Notes to Financial Statements.
| | | | |
| Prudential Emerging Markets Debt Local Currency Fund | | | 35 | |
Notes to Financial Statements
Prudential World Fund, Inc. (the “Fund”) is an open-end management investment company, registered under the Investment Company Act of 1940, as amended (“1940 Act”) and currently consists of six series: Prudential QMA International Equity Fund, Prudential Jennison Global Infrastructure Fund, Prudential Jennison International Opportunities Fund, Prudential Emerging Markets Debt Local Currency Fund, Prudential Jennison Emerging Markets Equity Fund and Prudential Jennison Global Opportunities Fund. These financial statements relate to Prudential Emerging Markets Debt Local Currency Fund (the “Series”). The financial statements of the other series are not presented herein. The Series is non-diversified.
The investment objective of the Series is total return, through a combination of current income and capital appreciation.
Note 1. Accounting Policies
The Series follows investment company accounting and reporting guidance of the Financial Accounting Standards Board (“FASB”) Accounting Standard Codification Topic 946 Financial Services-Investment Companies. The following accounting policies conform to U.S. generally accepted accounting principles. The Series consistently follow such policies in the preparation of their financial statements.
Securities Valuation: The Series holds securities and other assets that are fair valued at the close of each day (generally, 4:00 PM Eastern time) the New York Stock Exchange (“NYSE”) is open for trading. Fair value is the price that would be received to sell an asset or paid to transfer a liability in an orderly transaction between market participants on the measurement date. The Board of Directors (the “Board”) has adopted Valuation Procedures for security valuation under which fair valuation responsibilities have been delegated to Prudential Investments LLC (“PI” or “Manager”). Under the current Valuation Procedures, the established Valuation Committee is responsible for supervising the valuation of portfolio securities and other assets. The Valuation Procedures permit the Series to utilize independent pricing vendor services, quotations from market makers, and alternative valuation methods when market quotations are either not readily available or not deemed representative of fair value. A record of the Valuation Committee’s actions is subject to the Board’s review, approval, and ratification at its next regularly-scheduled quarterly meeting.
Various inputs determine how the Series’ investments are valued, all of which are categorized according to the three broad levels (Level 1, 2, or 3) detailed in the table following the Portfolio of Investments.
Investments in open-end, non-exchange-traded mutual funds are valued at their net asset values as of the close of the NYSE on the date of valuation. These securities are classified as Level 1 in the fair value hierarchy since they may be purchased or sold at their net asset values on the date of valuation.
Fixed income securities traded in the OTC market are generally valued at prices provided by approved independent pricing vendors. The pricing vendors provide these prices after evaluating observable inputs including, but not limited to yield curves, yield spreads, credit ratings, deal terms, tranche level attributes, default rates, cash flows, prepayment speeds, broker/dealer quotations, and reported trades. Securities valued using such vendor prices are classified as Level 2 in the fair value hierarchy.
Bank loans are generally valued at prices provided by approved independent pricing vendors. The pricing vendors utilize broker/dealer quotations and provide prices based on the average of such quotations. Bank loans valued using such vendor prices are generally classified as Level 2 in the fair value hierarchy.
OTC derivative instruments are generally valued using pricing vendor services, which derive the valuation based on inputs such as underlying asset prices, indices, spreads, interest rates, and exchange rates. These instruments are categorized as Level 2 in the fair value hierarchy.
Centrally cleared swaps listed or traded on a multilateral or trade facility platform, such as a registered exchange, are generally valued at the daily settlement price determined by the respective exchange. These securities are classified as Level 2 in the fair value hierarchy, as the daily settlement price is not public.
Securities and other assets that cannot be priced according to the methods described above are valued based on pricing methodologies approved by the Board. In the event that unobservable inputs are used when determining such valuations, the securities will be classified as Level 3 in the fair value hierarchy.
When determining the fair value of securities, some of the factors influencing the valuation include: the nature of any restrictions on disposition of the securities; assessment of the general liquidity of the securities; the issuer’s financial condition and the markets in which it does business; the cost of the investment; the size of the holding and the capitalization of the issuer; the prices of any recent transactions or bids/offers for such securities or any comparable securities; any available analyst media or other reports or information deemed reliable by the investment adviser regarding the issuer or the markets or industry in which it operates. Using fair value to price securities may result in a value that is different from a security’s most recent closing price and from the price used by other mutual funds to calculate their net asset values.
Foreign Currency Translation: The books and records of the Series are maintained in U.S. dollars. Foreign currency amounts are translated into U.S. dollars on the following basis:
(i) market value of investment securities, other assets and liabilities—at the current rates of exchange;
(ii) purchases and sales of investment securities, income and expenses—at the rates of exchange prevailing on the respective dates of such transactions.
| | | | |
| Prudential Emerging Markets Debt Local Currency Fund | | | 37 | |
Notes to Financial Statements (continued)
Although the net assets of the Series are presented at the foreign exchange rates and market values at the close of the period, the Series does not generally isolate that portion of the results of operations arising as a result of changes in the foreign exchange rates from the fluctuations arising from changes in the market prices of long-term portfolio securities held at the end of the period. Similarly, the Series does not isolate the effect of changes in foreign exchange rates from the fluctuations arising from changes in the market prices of long-term portfolio securities sold during the period. Accordingly, holding period realized foreign currency gains (losses) are included in the reported net realized gains (losses) on investment transactions. Notwithstanding the above, the Series does isolate the effect of fluctuations in foreign currency exchange rates when determining the gain (loss) upon the sale or maturity of foreign currency denominated debt obligations; such amounts are included in net realized gains (losses) on foreign currency transactions.
Net realized gains (losses) on foreign currency transactions represent net foreign exchange gains (losses) from holdings of foreign currencies, forward currency contracts, disposition of foreign currencies, currency gains (losses) realized between the trade and settlement dates on securities transactions, and the difference between the amounts of interest, dividends and foreign withholding taxes recorded on the Series’ books and the U.S. dollar equivalent amounts actually received or paid. Net unrealized currency gains (losses) from valuing foreign currency denominated assets and liabilities (other than investments) at period end exchange rates are reflected as a component of net unrealized appreciation (depreciation) on foreign currency transactions.
Restricted and Illiquid Securities: Subject to guidelines adopted by the Board, the Series may invest up to 15% of its net assets in illiquid securities, including those which are restricted as to disposition under securities law (“restricted securities”). Restricted securities are valued pursuant to the valuation procedures noted above. Illiquid securities are those that, because of the absence of a readily available market or due to legal or contractual restrictions on resale, cannot be sold within seven days in the ordinary course of business at approximately the amount at which the Series has valued the investment. Therefore, the Series may find it difficult to sell illiquid securities at the time considered most advantageous by its Subadviser and may incur expenses that would not be incurred in the sale of securities that were freely marketable. Certain securities that would otherwise be considered illiquid because of legal restrictions on resale to the general public may be traded among qualified institutional buyers under Rule 144A of the Securities Act of 1933. These Rule 144A securities, as well as commercial paper that is sold in private placements under Section 4(2) of the Securities Act, may be deemed liquid by the Series’ Subadviser under the guidelines adopted by the Directors of the Series. However, the liquidity of the Series’ investments in Rule 144A securities could be impaired if trading does not develop or declines.
Concentration of Risk: The ability of debt securities issuers (other than those issued or guaranteed by the U.S. Government) held by the Series to meet its obligations may be affected by the economic or political developments in a specific industry, region or country. Foreign security and currency transactions may involve certain considerations and risks not typically associated with those of domestic origin as a result of, among other factors, the possibility of political or economic instability, or the level of governmental supervision and regulation of foreign securities markets.
Forward Currency Contracts: A forward currency contract is a commitment to purchase or sell a foreign currency at a future date at a negotiated forward rate. The Series enters into forward currency contracts in order to hedge its exposure to changes in foreign currency exchange rates on its foreign portfolio holdings or specific receivables and payables denominated in a foreign currency. The contracts are valued daily at current exchange rates and any unrealized gain (loss) is included in net unrealized appreciation (depreciation) on foreign currencies. Gain (loss) is realized on the settlement date of the contract equal to the difference between the settlement value of the original and negotiated forward contracts. This gain (loss), if any, is included in net realized gain (loss) on foreign currency transactions. Risks may arise upon entering into these contracts from the potential inability of the counterparties to meet the terms of their contracts. Forward currency contracts involve risks from currency exchange rate and credit risk in excess of the amounts reflected on the Statement of Assets and Liabilities. The Series’ maximum risk of loss from counterparty credit risk is the net value of the cash flows to be received from the counterparty at the end of the contract’s life.
Cross Currency Exchange Contracts: A cross currency contract is a forward contract where a specified amount of one foreign currency will be exchanged for a specified amount of another foreign currency.
Options: The Series may either purchase or write options in order to hedge against adverse market movements or fluctuations in value caused by changes in prevailing interest rates or foreign currency exchange rates, with respect to securities which the Series currently owns or intends to purchase. The Series may also use options to gain additional market exposure. The Series’ principal reason for writing options is to realize, through receipt of premiums, a greater current return than would be realized on the underlying security alone. When the Series purchases an option, it pays a premium and an amount equal to that premium is recorded as an asset. When the Series writes an option, it receives a premium and an amount equal to that premium is recorded as a liability. The asset or liability is adjusted daily to reflect the current market value of the option. If an option expires unexercised, the Series realizes a gain (loss) to the extent of the premium received or paid. If an option is exercised, the premium received or paid is recorded as an adjustment to the proceeds from the sale or the cost of the purchase in determining whether the Series has realized a gain (loss). The difference between the premium and the amount received or paid at the closing of a purchase or sale transaction is also treated as a realized gain (loss). Gain (loss) on purchased options is included in net realized gain (loss) on investment transactions. Gain (loss) on written options is presented separately as net realized gain (loss) on options written transactions.
| | | | |
| Prudential Emerging Markets Debt Local Currency Fund | | | 39 | |
Notes to Financial Statements (continued)
The Series, as writer of an option, may have no control over whether the underlying securities may be sold (called) or purchased (put). As a result, the Series bears the market risk of an unfavorable change in the price of the security underlying the written option. OTC options also involve the risk of the potential inability of the counterparties to meet the terms of their contracts. With exchange-traded options contracts, there is minimal counterparty credit risk to the Series since the exchanges’ clearinghouse acts as counterparty to all exchange-traded options and guarantees the options contracts against default.
Swap Agreements: The Series entered into interest rate swap agreements. A swap agreement is an agreement to exchange the return generated by one instrument for the return generated by another instrument. Swap agreements are negotiated in the OTC market and may be executed either directly with counterparty (“OTC-traded”) or through a central clearing facility, such as a registered commodities exchange. Swap agreements are valued daily at current market value and any change in value is included in the net unrealized appreciation (depreciation) on investments. Centrally cleared swaps pay or receive an amount known as “variation margin”, based on daily changes in the valuation of the swap contract. Payments received or paid by the Series are recorded as realized gains (losses) upon termination or maturity of the swap. Risk of loss may exceed amounts recognized on the Statement of Assets and Liabilities. Swap agreements outstanding at period end, if any, are listed on the Portfolio of Investments.
Interest Rate Swaps: Interest rate swaps represent an agreement between counterparties to exchange cash flows based on the difference between two interest rates, applied to a notional principal amount for a specified period. The Series is subject to interest rate risk exposure in the normal course of pursuing its investment objectives. The Series used interest rate swaps to maintain its ability to generate steady cash flow by receiving a stream of fixed-rate payments and to increase exposure to prevailing market rates by receiving floating rate payments. The Series’ maximum risk of loss from counterparty credit risk is the discounted net value of the cash flows to be received from the counterparty over the contract’s remaining life.
Master Netting Arrangements: The Series is subject to various Master Agreements, or netting arrangements, with select counterparties. These are agreements which a subadviser may have negotiated and entered into on behalf of the Series. A master netting arrangement between the Series and the counterparty permits the Series to offset amounts payable by the Series to the same counterparty against amounts to be received; and by the receipt of collateral from the counterparty by the Series to cover the Series’ exposure to the counterparty. However, there is no assurance that such mitigating factors are easily enforceable. In addition to master netting arrangements, the right to set-off exists when all the conditions are met such that each of the parties owes the other determinable amounts, the reporting party has the right to set-off the amount owed with the amount owed by the
other party, the reporting party intends to set-off and the right of set-off is enforceable by law. During the reporting period, there was no intention to settle on a net basis and all amounts are presented on a gross basis on the Statement of Assets and Liabilities.
The Series is a party to ISDA (International Swaps and Derivatives Association, Inc.) Master Agreements with certain counterparties that govern OTC derivative and foreign exchange contracts entered into from time to time. The Master Agreements may contain provisions regarding, among other things, the parties’ general obligations, representations, agreements, collateral requirements, events of default and early termination. With respect to certain counterparties, in accordance with the terms of the Master Agreements, collateral posted to the Series is held in a segregated account by the Series’ custodian and with respect to those amounts which can be sold or re-pledged, is presented in the Portfolio of Investments. Collateral pledged by the Series is segregated by the Series’ custodian and identified in the Portfolio of Investments. Collateral can be in the form of cash or debt securities issued by the U.S. Government or related agencies or other securities as agreed to by the Series and the applicable counterparty. Collateral requirements are determined based on the Series’ net position with each counterparty. Termination events applicable to the Series may occur upon a decline in the Series’ net assets below a specified threshold over a certain period of time. Termination events applicable to counterparties may occur upon a decline in the counterparty’s long-term and short term credit ratings below a specified level. In each case, upon occurrence, the other party may elect to terminate early and cause settlement of all derivative and foreign exchange contracts outstanding, including the payment of any losses and costs resulting from such early termination, as reasonably determined by the terminating party. Any decision by one or more of the Series’ counterparties to elect early termination could impact the Series’ future derivative activity.
In addition to each instrument’s primary underlying risk exposure (e.g. interest rate, credit, equity or foreign exchange, etc.), swap agreements involve, to varying degrees, elements of credit, market and documentation risk. Such risks involve the possibility that no liquid market for these agreements will exist, the counterparty to the agreement may default on its obligation to perform or disagree on the contractual terms of the agreement, and changes in net interest rates will be unfavorable. In connection with these agreements, securities in the portfolio may be identified or received as collateral from the counterparty in accordance with the terms of the respective swap agreements to provide or receive assets of value and to serve as recourse in the event of default or bankruptcy/insolvency of either party. Such OTC derivative agreements include conditions which, when materialized, give the counterparty the right to cause an early termination of the transactions under those agreements. Any election by the counterparty for early termination of the contract(s) may impact the amounts reported on financial statements.
As of October 31, 2016, the Series has not met conditions under such agreements which give the counterparty the right to call for an early termination.
| | | | |
| Prudential Emerging Markets Debt Local Currency Fund | | | 41 | |
Notes to Financial Statements (continued)
Forward currency contracts, written options and swaps involve elements of both market and credit risk in excess of the amounts reflected on the Statement of Assets and Liabilities. Such risks may be mitigated by engaging in master netting arrangements.
Securities Transactions and Net Investment Income: Securities transactions are recorded on the trade date. Realized gains (losses) from investment and currency transactions are calculated on the identified cost basis. Dividend income is recorded on the ex-date. Interest income, including amortization of premium and accretion of discount on debt securities, as required, is recorded on an accrual basis. Expenses are recorded on an accrual basis, which may require the use of certain estimates by management that may differ from actual.
Net investment income or loss (other than distribution fees, which are charged directly to the respective class and transfer agency fees specific to Class Q shares which are charged to that share class) and unrealized and realized gains (losses) are allocated daily to each class of shares based upon the relative proportion of adjusted net assets of each class at the beginning of the day.
Dividends and Distributions: The Series declares dividends from net investment income daily and payment is made monthly. Distributions from net realized capital and currency gains, if any, are paid annually. Dividends and distributions to shareholders, which are determined in accordance with federal income tax regulations and which may differ from generally accepted accounting principles, are recorded on the ex-date. Permanent book/tax differences relating to income and gain (loss) are reclassified amongst undistributed net investment income, accumulated net realized gain (loss) and paid-in capital in excess of par, as appropriate.
Taxes: For federal income tax purposes, each Series in the Fund is treated as a separate taxpaying entity. It is each Series’ policy to continue to meet the requirements of the Internal Revenue Code applicable to regulated investment companies and to distribute all of its taxable net investment income and capital gains, if any, to its shareholders. Therefore, no federal income tax provision is required. Withholding taxes on foreign interest are recorded, net of reclaimable amounts, at the time the related income is earned.
Estimates: The preparation of the financial statements requires management to make estimates and assumptions that affect the reported amounts and disclosures in the financial statements. Actual results could differ from those estimates.
Note 2. Agreements
The Series has a management agreement with PI. Pursuant to this agreement, PI has responsibility for all investment advisory services and supervises the subadviser’s
performance of such services. PI has entered into a subadvisory agreement with PGIM, Inc., which provides subadvisory services to the Series through its Prudential Fixed Income (“PFI”) unit. The subadvisory agreement provides that PFI will furnish investment advisory services in connection with the management of the Series. In connection therewith, PFI is obligated to keep certain books and records of the Series. PI pays for the services of PFI, the cost of compensation of officers of the Series, occupancy and certain clerical and bookkeeping costs of the Series. The Series bears all other costs and expenses. Prior to January 4, 2016, PGIM, Inc. was known as Prudential Investment Management, Inc. (“PIM”).
The management fee paid to PI is accrued daily and payable monthly at an annual rate of .80% on average daily net assets up to and including $1 billion; .78% on the next $2 billion of average daily net assets; .76% on the next $2 billion of average daily net assets; ..75% on the next $5 billion of average daily net assets; and .74% on average daily net assets exceeding $10 billion. The effective management fee rate before any waivers and/or expense reimbursement was .80% for the year ended October 31, 2016. For the year ended October 31, 2016, the expense reimbursement exceeded the effective management fee.
Effective October 1, 2016, PI has contractually agreed through February 28, 2018 to limit the net annual operating expenses (exclusive of distribution and service (12b-1) fees, taxes (such as income and foreign withholdings taxes, stamp duty and deferred tax expenses), interest, underlying funds, brokerage, extraordinary and certain other expenses such as dividend, broker charges and interest expense on short sales) of each class of shares of the Series to ..88% of the Series’ average daily net assets. Prior to October 1, 2016, PI had contractually agreed to limit the net annual operating expenses (exclusive of distribution and service (12b-1) fees, taxes (such as income and foreign withholdings taxes, stamp duty and deferred tax expenses), interest, underlying funds, brokerage, extraordinary and certain other expenses such as dividend, broker charges and interest expense on short sales) of each class of shares of the Series to 1.05% of the Series’ average daily net assets. Expenses waived/reimbursed by the Manager in accordance with this agreement may be recouped by the Manager within the same fiscal year during which such waiver/reimbursement is made if such recoupment can be realized without exceeding the expense limit in effect at the time of the recoupment for that fiscal year.
The Series has a distribution agreement with Prudential Investment Management Services LLC (“PIMS”) who acts as the distributor of the Class A, Class C, Class Q and Class Z shares. The Series compensates PIMS for distributing and servicing the Series’ Class A and Class C, pursuant to plans of distribution (the “Distribution Plans”), regardless of expenses actually incurred by PIMS. The distribution fees are accrued daily and payable monthly. No distribution or service fees are paid to PIMS as distributor of the Class Q and Z shares of the Series.
Pursuant to the Distribution Plans, the Series compensates PIMS for distribution related activities at an annual rate of up to .25% and 1% of the average daily net assets of the Class A and C shares, respectively.
| | | | |
| Prudential Emerging Markets Debt Local Currency Fund | | | 43 | |
Notes to Financial Statements (continued)
PIMS has advised the Series that it has received $37,572 in front-end sales charges resulting from sales of Class A shares during the year ended October 31, 2016. From these fees, PIMS paid such sales charges to affiliated broker-dealers, which in turn paid commissions to salespersons and incurred other distribution costs.
PIMS has advised the Series that for the year ended October 31, 2016 it has received $161 in contingent deferred sales charges imposed upon redemptions by certain Class C shareholders.
PI, PGIM, Inc. and PIMS are indirect, wholly-owned subsidiaries of Prudential Financial, Inc. (“Prudential”).
Note 3. Other Transactions with Affiliates
Prudential Mutual Fund Services LLC (“PMFS”), an affiliate of PI and an indirect, wholly-owned subsidiary of Prudential, serves as the Series’ transfer agent. Transfer agent’s fees and expenses in the Statement of Operations include certain out-of-pocket expenses paid to non-affiliates, where applicable.
The Series may enter into certain securities purchase or sale transactions under Board approved Rule 17a-7 procedures. Rule 17a-7 is an exemptive rule under the 1940 Act, that permits purchase and sale transactions among affiliated investment companies, or between an investment company and a person that is affiliated solely by reason of having a common (or affiliated) investment adviser, common directors, and/or common officers. Such transactions are subject to ratification by the Board.
The Series invests its overnight sweep cash in the Prudential Core Ultra Short Bond Fund, (formerly known as Prudential Core Taxable Money Market Fund), (the “Core Fund”), a portfolio of the Prudential Investment Portfolios 2, registered under the 1940 Act and managed by PI. Earnings from the Core Fund are disclosed on the Statement of Operations as “Affiliated dividend income”.
Note 4. Portfolio Securities
The cost of purchases and proceeds from sales of portfolio securities, other than short-term investments and U.S. Government securities, for the year ended October 31, 2016, were $55,727,235 and $55,053,110, respectively.
Note 5. Distributions and Tax Information
Distributions to shareholders, which are determined in accordance with federal income tax regulations and which may differ from generally accepted accounting principles, are
recorded on the ex-date. In order to present distributions in excess of net investment income, accumulated net realized loss on investment and foreign currency transactions and paid-in capital in excess of par on the Statement of Assets and Liabilities that more closely represent their tax character, certain adjustments have been made to distributions in excess of net investment income, accumulated net realized loss on investment and foreign currency transactions and paid-in capital in excess of par. For the year ended October 31, 2016, the adjustments were to increase distributions in excess of net investment income by $2,360,956, decrease accumulated net realized loss on investment and foreign currency transactions by $4,916,890 and decrease paid-in capital in excess of par by $2,555,934 due to the differences in the treatment for book and tax purposes of certain transactions involving foreign currencies, swaps, paydown gains/losses, differences in the treatment of premium amortization, net operating loss and other book to tax differences. Net investment income, net realized gain (loss) on investment and foreign currency transactions and net assets were not affected by this change.
For the year ended October 31, 2016, the tax character of dividends paid by the Series were $2,438 of ordinary income and $1,782,794 of tax return of capital. For the year ended October 31, 2015, the tax character of dividends paid by the Series were $338,153 of ordinary income and $1,553,630 of tax return of capital.
As of October 31, 2016, the Series had no undistributed earnings on a tax basis.
The United States federal income tax basis of the Series’ investments and the net unrealized depreciation as of October 31, 2016 were as follows:
| | | | | | | | | | |
Tax Basis | | Appreciation | | Depreciation | | Net
Unrealized
Depreciation | | Other Cost Basis
Adjustments | | Total Net
Unrealized
Depreciation |
| $33,976,481 | | $984,743 | | $(3,601,328) | | $(2,616,585) | | $(137,038) | | $(2,753,623) |
The difference between book basis and tax basis is primarily attributable to the difference in the treatment of amortization of premiums, wash sales, straddle loss deferrals and other cost basis differences between financial and tax accounting. The other cost basis adjustments are primarily attributable to appreciation (depreciation) of foreign currencies, swaps and mark-to-market of receivables and payables.
For federal income tax purposes, the Series had a capital loss carryforward as of October 31, 2016 of approximately $2,737,000 which can be carried forward for an unlimited period. No capital gains distributions are expected to be paid to shareholders until net gains have been realized in excess of such losses.
Management has analyzed the Series’ tax positions taken on federal, state and local income tax returns for all open tax years and has concluded that no provision for income tax is required in the Series’ financial statements for the current reporting period. The Series’ federal, state and local income and federal excise tax returns for tax years for which the applicable statutes of limitations have not expired are subject to examination by the Internal Revenue Service and state departments of revenue.
| | | | |
| Prudential Emerging Markets Debt Local Currency Fund | | | 45 | |
Notes to Financial Statements (continued)
Note 6. Capital
The Series offers Class A, Class C, Class Q and Class Z shares. Class A shares are sold with a front-end sales charge of up to 4.50%. Investors who purchase Class A shares in an amount of $1 million or more and sell these shares within 12 months of purchase are subject to a contingent deferred sales charge (“CDSC”) of 1%. The Class A CDSC is waived for purchases by certain retirement and/or benefit plans. Class C shares are sold with a CDSC of 1% on shares redeemed within the first 12 months after purchase. A special exchange privilege is also available for shareholders who qualified to purchase Class A shares at net asset value. Class Q and Z shares are not subject to any sales or redemption charge and are offered exclusively for sale to a limited group of investors.
Under certain circumstances, an exchange may be made from specified share classes of the Series to one or more other share classes of the Series as presented in the table of transactions in shares of common stock. For the year ended October 31, 2016, no such exchanges were made.
There are 425 million shares of common stock at $0.01 par value per share, designated Class A, Class C, Class Q and Class Z common stock, each of which consists of 75 million, 50 million, 50 million and 250 million authorized shares, respectively.
As of October 31, 2016, Prudential, through its affiliates, owned 143 Class Q shares and 3,359,921 Class Z shares of the Series. At reporting period end, 2 shareholders of record held 77% of the Series’ outstanding shares on behalf of multiple beneficial owners.
Transactions in shares of common stock were as follows:
| | | | | | | | |
Class A | | Shares | | | Amount | |
Year ended October 31, 2016: | | | | | | | | |
Shares sold | | | 264,798 | | | $ | 1,692,459 | |
Shares issued in reinvestment of dividends and distributions | | | 26,404 | | | | 166,092 | |
Shares reacquired | | | (160,699 | ) | | | (999,854 | ) |
| | | | | | | | |
Net increase (decrease) in shares outstanding before conversion | | | 130,503 | | | | 858,697 | |
Shares reacquired upon conversion into other share class(es) | | | (24,656 | ) | | | (157,311 | ) |
| | | | | | | | |
Net increase (decrease) in shares outstanding | | | 105,847 | | | $ | 701,386 | |
| | | | | | | | |
Year ended October 31, 2015: | | | | | | | | |
Shares sold | | | 185,886 | | | $ | 1,291,306 | |
Shares issued in reinvestment of dividends and distributions | | | 25,398 | | | | 175,719 | |
Shares reacquired | | | (453,659 | ) | | | (3,168,756 | ) |
| | | | | | | | |
Net increase (decrease) in shares outstanding before conversion | | | (242,375 | ) | | | (1,701,731 | ) |
Shares reacquired upon conversion into other share class(es) | | | (262 | ) | | | (1,855 | ) |
| | | | | | | | |
Net increase (decrease) in shares outstanding | | | (242,637 | ) | | $ | (1,703,586 | ) |
| | | | | | | | |
| | | | | | | | |
Class C | | Shares | | | Amount | |
Year ended October 31, 2016: | | | | | | | | |
Shares sold | | | 28,487 | | | $ | 180,763 | |
Shares issued in reinvestment of dividends and distributions | | | 5,373 | | | | 33,925 | |
Shares reacquired | | | (24,063 | ) | | | (148,044 | ) |
| | | | | | | | |
Net increase (decrease) in shares outstanding | | | 9,797 | | | $ | 66,644 | |
| | | | | | | | |
Year ended October 31, 2015: | | | | | | | | |
Shares sold | | | 31,763 | | | $ | 222,194 | |
Shares issued in reinvestment of dividends and distributions | | | 5,619 | | | | 38,860 | |
Shares reacquired | | | (42,223 | ) | | | (299,638 | ) |
| | | | | | | | |
Net increase (decrease) in shares outstanding | | | (4,841 | ) | | $ | (38,584 | ) |
| | | | | | | | |
Class Q | | | | | | |
Year ended October 31, 2016: | | | | | | | | |
Shares issued in reinvestment of dividends and distributions | | | 8 | | | $ | 53 | |
| | | | | | | | |
Net increase (decrease) in shares outstanding | | | 8 | | | $ | 53 | |
| | | | | | | | |
Year ended October 31, 2015: | | | | | | | | |
Shares issued in reinvestment of dividends and distributions | | | 8 | | | $ | 57 | |
| | | | | | | | |
Net increase (decrease) in shares outstanding | | | 8 | | | $ | 57 | |
| | | | | | | | |
Class Z | | | | | | |
Year ended October 31, 2016: | | | | | | | | |
Shares sold | | | 373,514 | | | $ | 2,391,555 | |
Shares issued in reinvestment of dividends and distributions | | | 244,902 | | | | 1,552,822 | |
Shares reacquired | | | (357,213 | ) | | | (2,287,798 | ) |
| | | | | | | | |
Net increase (decrease) in shares outstanding before conversion | | | 261,203 | | | | 1,656,579 | |
Shares issued upon conversion from other share class(es) | | | 24,432 | | | | 157,311 | |
| | | | | | | | |
Net increase (decrease) in shares outstanding | | | 285,635 | | | $ | 1,813,890 | |
| | | | | | | | |
Year ended October 31, 2015: | | | | | | | | |
Shares sold | | | 643,090 | | | $ | 4,628,015 | |
Shares issued in reinvestment of dividends and distributions | | | 230,457 | | | | 1,595,021 | |
Shares reacquired | | | (516,937 | ) | | | (3,705,364 | ) |
| | | | | | | | |
Net increase (decrease) in shares outstanding before conversion | | | 356,610 | | | | 2,517,672 | |
Shares issued upon conversion from other shares class(es) | | | 261 | | | | 1,855 | |
| | | | | | | | |
Net increase (decrease) in shares outstanding | | | 356,871 | | | $ | 2,519,527 | |
| | | | | | | | |
Note 7. Borrowings
The Series, along with other affiliated registered investment companies (the “Funds”), is a party to a Syndicated Credit Agreement (“SCA”) with a group of banks. The purpose of the SCA is to provide an alternative source of temporary funding for capital share redemptions. The SCA provides for a commitment of $900 million for the period October 6, 2016 through October 5, 2017. The Funds pay an annualized commitment fee of .15% of the unused portion of the SCA. The interest rate on borrowings under the SCA is paid monthly and at a per annum rate based upon the higher of 0.0%, the effective federal funds rate, or the One-Month LIBOR rate, plus a contractual spread. Prior to October 6, 2016, the Funds had another SCA that provided a commitment of $900 million and the
| | | | |
| Prudential Emerging Markets Debt Local Currency Fund | | | 47 | |
Notes to Financial Statements (continued)
Funds paid an annualized commitment fee of .11% of the unused portion of the SCA. The interest rate on borrowings was substantially the same. The Series’ portion of the commitment fee for the unused amount is accrued daily and paid quarterly.
The Series did not utilize the SCA during the year ended October 31, 2016.
Note 8. Recent Accounting Pronouncements and Reporting Updates
In January 2016, the FASB issued Accounting Standards Update (“ASU”) No. 2016-01 regarding “Recognition and Measurement of Financial Assets and Financial Liabilities”. The new guidance is intended to enhance the reporting model for financial instruments to provide users of financial statements with more decision-useful information and addresses certain aspects of the recognition, measurement, presentation, and disclosure of financial instruments. The new standard affects all entities that hold financial assets or owe financial liabilities. The new guidance is effective for public companies for fiscal years beginning after December 15, 2017, including interim periods within those fiscal years. At this time, management is evaluating the implications of ASU No. 2016-01 and its impact on the financial statements and disclosures has not yet been determined.
On October 13, 2016, the Securities and Exchange Commission (the “SEC”) adopted new rules and forms and amended existing rules and forms which are intended to modernize and enhance the reporting and disclosure of information by registered investment companies and to improve the quality of information that funds provide to investors, including modifications to Regulation S-X which would require standardized, enhanced disclosure about derivatives in investment company financial statements. In an effort to enhance monitoring and regulation, the new rules and forms will allow the SEC to more effectively collect and use data reported by funds. The new rules also enhance disclosure regarding fund liquidity and redemption practices. Also under the new rules, the SEC will permit open-end funds, with the exception of money market funds, to offer swing pricing, subject to board approval and review. The compliance dates of the modifications to Regulation S-X are August 1, 2017 and other amendments and rules are generally June 1, 2018 and December 1, 2018. Management is currently evaluating the impacts to the financial statement disclosures, if any.
Financial Highlights
| | | | | | | | | | | | | | | | | | | | |
| Class A Shares | | | | | | | | | | | | | | | |
| | | Year Ended October 31, | |
| | | 2016 | | | 2015 | | | 2014 | | | 2013 | | | 2012 | |
| Per Share Operating Performance(a): | | | | | | | | | | | | | | | | | | | | |
| Net Asset Value, Beginning Of Year | | | $6.24 | | | | $7.92 | | | | $8.67 | | | | $9.61 | | | | $9.36 | |
| Income (loss) from investment operations: | | | | | | | | | | | | | | | | | | | | |
| Net investment income (loss) | | | .33 | | | | .37 | | | | .49 | | | | .47 | | | | .42 | |
| Net realized and unrealized gain (loss) on investment transactions | | | .23 | | | | (1.64 | ) | | | (.71 | ) | | | (.76 | ) | | | .35 | |
| Total from investment operations | | | .56 | | | | (1.27 | ) | | | (.22 | ) | | | (.29 | ) | | | .77 | |
| Less Dividends and Distributions: | | | | | | | | | | | | | | | | | | | | |
| Dividends from net investment income(f) | | | - | (e) | | | (.06 | ) | | | (.07 | ) | | | (.30 | ) | | | (.52 | ) |
| Distributions from net realized gains | | | - | | | | - | | | | - | | | | (.05 | ) | | | - | |
| Tax return of capital distributions | | | (.36 | ) | | | (.35 | ) | | | (.46 | ) | | | (.30 | ) | | | - | |
| Total dividends and distributions | | | (.36 | ) | | | (.41 | ) | | | (.53 | ) | | | (.65 | ) | | | (.52 | ) |
| Net asset value, end of year | | | $6.44 | | | | $6.24 | | | | $7.92 | | | | $8.67 | | | | $9.61 | |
| Total Return(b): | | | 9.29% | | | | (16.41)% | | | | (2.47)% | | | | (3.23)% | | | | 8.53% | |
| |
| Ratios/Supplemental Data: | | | | | | | | | | | | | | | |
| Net assets, end of year (000) | | | $3,990 | | | | $3,208 | | | | $5,991 | | | | $10,862 | | | | $5,985 | |
| Average net assets (000) | | | $3,343 | | | | $4,341 | | | | $6,701 | | | | $12,797 | | | | $2,721 | |
| Ratios to average net assets(c): | | | | | | | | | | | | | | | | | | | | |
| Expenses after advisory fee waivers and/or expense reimbursement | | | 1.28% | | | | 1.30% | (d) | | | 1.30% | | | | 1.30% | | | | 1.30% | |
| Expenses before advisory fee waivers and/or expense reimbursement | | | 2.33% | | | | 2.39% | (d) | | | 2.13% | | | | 1.78% | | | | 2.09% | |
| Net investment income (loss) | | | 5.20% | | | | 5.32% | (d) | | | 5.99% | | | | 5.07% | | | | 4.73% | |
| Portfolio turnover rate | | | 196% | | | | 101% | | | | 110% | | | | 102% | | | | 70% | |
| (a) | Calculated based on average shares outstanding during the year. |
| (b) | Total return does not consider the effects of sales loads. Total return is calculated assuming a purchase of a share on the first day and a sale on the last day of each year reported and includes reinvestment of dividends and distributions, if any. Total return may reflect adjustments to conform to generally accepted accounting principles. |
| (c) | Does not include expenses of the underlying fund in which the Series invests. |
| (d) | Effective March 9, 2015, the contractual distribution and service (12b-1) fees were reduced from .30% to .25% of the average daily net assets and the .05% contractual 12b-1 fee waiver was terminated. |
| (f) | Dividends from net investment income may include other items that are ordinary income for tax purposes. |
See Notes to Financial Statements.
| | | | |
| Prudential Emerging Markets Debt Local Currency Fund | | | 49 | |
Financial Highlights (continued)
| | | | | | | | | | | | | | | | | | | | |
| Class C Shares | | | | | | | | | | | | | | | |
| | | Year Ended October 31, | |
| | | 2016 | | | 2015 | | | 2014 | | | 2013 | | | 2012 | |
| Per Share Operating Performance(a): | | | | | | | | | | | | | | | | | | | | |
| Net Asset Value, Beginning Of Year | | | $6.28 | | | | $7.97 | | | | $8.72 | | | | $9.65 | | | | $9.41 | |
| Income (loss) from investment operations: | | | | | | | | | | | | | | | | | | | | |
| Net investment income (loss) | | | .28 | | | | .32 | | | | .43 | | | | .40 | | | | .37 | |
| Net realized and unrealized gain (loss) on investment transactions | | | .25 | | | | (1.65 | ) | | | (.71 | ) | | | (.75 | ) | | | .32 | |
| Total from investment operations | | | .53 | | | | (1.33 | ) | | | (.28 | ) | | | (.35 | ) | | | .69 | |
| Less Dividends and Distributions: | | | | | | | | | | | | | | | | | | | | |
| Dividends from net investment income(e) | | | - | (d) | | | (.01 | ) | | | (.01 | ) | | | (.23 | ) | | | (.45 | ) |
| Distributions from net realized gains | | | - | | | | - | | | | - | | | | (.05 | ) | | | - | |
| Tax return of capital distributions | | | (.32 | ) | | | (.35 | ) | | | (.46 | ) | | | (.30 | ) | | | - | |
| Total dividends and distributions | | | (.32 | ) | | | (.36 | ) | | | (.47 | ) | | | (.58 | ) | | | (.45 | ) |
| Net asset value, end of year | | | $6.49 | | | | $6.28 | | | | $7.97 | | | | $8.72 | | | | $9.65 | |
| Total Return(b): | | | 8.61% | | | | (17.00)% | | | | (3.21)% | | | | (3.85)% | | | | 7.55% | |
| |
| Ratios/Supplemental Data: | | | | | | | | | | | | | | | |
| Net assets, end of year (000) | | | $787 | | | | $701 | | | | $927 | | | | $1,469 | | | | $1,025 | |
| Average net assets (000) | | | $721 | | | | $789 | | | | $1,207 | | | | $1,585 | | | | $786 | |
| Ratios to average net assets(c): | | | | | | | | | | | | | | | | | | | | |
| Expenses after advisory fee waivers and/or expense reimbursement | | | 2.03% | | | | 2.05% | | | | 2.05% | | | | 2.05% | | | | 2.05% | |
| Expenses before advisory fee waivers and/or expense reimbursement | | | 3.07% | | | | 3.11% | | | | 2.82% | | | | 2.47% | | | | 2.78% | |
| Net investment income (loss) | | | 4.40% | | | | 4.52% | | | | 5.17% | | | | 4.26% | | | | 3.89% | |
| Portfolio turnover rate | | | 196% | | | | 101% | | | | 110% | | | | 102% | | | | 70% | |
| (a) | Calculated based on average shares outstanding during the year. |
| (b) | Total return does not consider the effects of sales loads. Total return is calculated assuming a purchase of a share on the first day and a sale on the last day of each year reported and includes reinvestment of dividends and distributions, if any. Total return may reflect adjustments to conform to generally accepted accounting principles. |
| (c) | Does not include expenses of the underlying fund in which the Series invests. |
| (e) | Dividends from net investment income may include other items that are ordinary income for tax purposes. |
See Notes to Financial Statements.
| | | | | | | | | | | | | | | | | | | | |
| Class Q Shares | | | | | | | | | | | | | | | |
| | | Year Ended October 31, | |
| | | 2016 | | | 2015 | | | 2014 | | | 2013 | | | 2012 | |
| Per Share Operating Performance(a): | | | | | | | | | | | | | | | | | | | | |
| Net Asset Value, Beginning Of Year | | | $6.30 | | | | $7.98 | | | | $8.71 | | | | $9.66 | | | | $9.37 | |
| Income (loss) from investment operations: | | | | | | | | | | | | | | | | | | | | |
| Net investment income (loss) | | | .35 | | | | .39 | | | | .51 | | | | .58 | | | | .47 | |
| Net realized and unrealized gain (loss) on investment transactions | | | .23 | | | | (1.63 | ) | | | (.69 | ) | | | (.86 | ) | | | .37 | |
| Total from investment operations | | | .58 | | | | (1.24 | ) | | | (.18 | ) | | | (.28 | ) | | | .84 | |
| Less Dividends and Distributions: | | | | | | | | | | | | | | | | | | | | |
| Dividends from net investment income(e) | | | - | (d) | | | (.09 | ) | | | (.09 | ) | | | (.32 | ) | | | (.55 | ) |
| Distributions from net realized gains | | | - | | | | - | | | | - | | | | (.05 | ) | | | - | |
| Tax return of capital distributions | | | (.38 | ) | | | (.35 | ) | | | (.46 | ) | | | (.30 | ) | | | - | |
| Total dividends and distributions | | | (.38 | ) | | | (.44 | ) | | | (.55 | ) | | | (.67 | ) | | | (.55 | ) |
| Net asset value, end of year | | | $6.50 | | | | $6.30 | | | | $7.98 | | | | $8.71 | | | | $9.66 | |
| Total Return(b): | | | 9.55% | | | | (15.94)% | | | | (1.97)% | | | | (3.06)% | | | | 9.31% | |
| |
| Ratios/Supplemental Data: | | | | | | | | | | | | | | | |
| Net assets, end of year (000) | | | $1 | | | | $1 | | | | $1 | | | | $1 | | | | $1 | |
| Average net assets (000) | | | $1 | | | | $1 | | | | $1 | | | | $1 | | | | $1 | |
| Ratios to average net assets(c): | | | | | | | | | | | | | | | | | | | | |
| Expenses after advisory fee waivers and/or expense reimbursement | | | 1.03% | | | | 1.05% | | | | 1.05% | | | | 1.05% | | | | 1.05% | |
| Expenses before advisory fee waivers and/or expense reimbursement | | | 2.06% | | | | 2.01% | | | | 1.69% | | | | 1.39% | | | | 1.71% | |
| Net investment income (loss) | | | 5.47% | | | | 5.60% | | | | 6.17% | | | | 6.22% | | | | 5.06% | |
| Portfolio turnover rate | | | 196% | | | | 101% | | | | 110% | | | | 102% | | | | 70% | |
| (a) | Calculated based on average shares outstanding during the year. |
| (b) | Total return is calculated assuming a purchase of a share on the first day and a sale on the last day of each year reported and includes reinvestment of dividends and distributions, if any. Total return may reflect adjustments to conform to generally accepted accounting principles. |
| (c) | Does not include expenses of the underlying fund in which the Series invests. |
| (e) | Dividends from net investment income may include other items that are ordinary income for tax purposes. |
See Notes to Financial Statements.
| | | | |
| Prudential Emerging Markets Debt Local Currency Fund | | | 51 | |
Financial Highlights (continued)
| | | | | | | | | | | | | | | | | | | | |
| Class Z Shares | | | | | | | | | | | | | | | |
| | | Year Ended October 31, | |
| | | 2016 | | | 2015 | | | 2014 | | | 2013 | | | 2012 | |
| Per Share Operating Performance(a): | | | | | | | | | | | | | | | | | | | | |
| Net Asset Value, Beginning Of Year | | | $6.31 | | | | $7.98 | | | | $8.72 | | | | $9.66 | | | | $9.37 | |
| Income (loss) from investment operations: | | | | | | | | | | | | | | | | | | | | |
| Net investment income (loss) | | | .34 | | | | .38 | | | | .51 | | | | .49 | | | | .47 | |
| Net realized and unrealized gain (loss) on investment transactions | | | .23 | | | | (1.62 | ) | | | (.70 | ) | | | (.76 | ) | | | .36 | |
| Total from investment operations | | | .57 | | | | (1.24 | ) | | | (.19 | ) | | | (.27 | ) | | | .83 | |
| Less Dividends and Distributions: | | | | | | | | | | | | | | | | | | | | |
| Dividends from net investment income(e) | | | - | (d) | | | (.08 | ) | | | (.09 | ) | | | (.32 | ) | | | (.54 | ) |
| Distributions from net realized gains | | | - | | | | - | | | | - | | | | (.05 | ) | | | - | |
| Tax return of capital distributions | | | (.38 | ) | | | (.35 | ) | | | (.46 | ) | | | (.30 | ) | | | - | |
| Total dividends and distributions | | | (.38 | ) | | | (.43 | ) | | | (.55 | ) | | | (.67 | ) | | | (.54 | ) |
| Net asset value, end of year | | | $6.50 | | | | $6.31 | | | | $7.98 | | | | $8.72 | | | | $9.66 | |
| Total Return(b): | | | 9.31% | | | | (15.90)% | | | | (2.12)% | | | | (2.98)% | | | | 9.21% | |
| |
| Ratios/Supplemental Data: | | | | | | | | | | | | | | | |
| Net assets, end of year (000) | | | $27,462 | | | | $24,821 | | | | $28,578 | | | | $31,330 | | | | $33,559 | |
| Average net assets (000) | | | $25,994 | | | | $25,969 | | | | $30,288 | | | | $35,341 | | | | $30,441 | |
| Ratios to average net assets(c): | | | | | | | | | | | | | | | | | | | | |
| Expenses after advisory fee waivers and/or expense reimbursement | | | 1.03% | | | | 1.05% | | | | 1.05% | | | | 1.05% | | | | 1.05% | |
| Expenses before advisory fee waivers and/or expense reimbursement | | | 2.06% | | | | 2.11% | | | | 1.82% | | | | 1.49% | | | | 1.81% | |
| Net investment income (loss) | | | 5.36% | | | | 5.50% | | | | 6.14% | | | | 5.25% | | | | 4.96% | |
| Portfolio turnover rate | | | 196% | | | | 101% | | | | 110% | | | | 102% | | | | 70% | |
| (a) | Calculated based on average shares outstanding during the year. |
| (b) | Total return is calculated assuming a purchase of a share on the first day and a sale on the last day of each year reported and includes reinvestment of dividends and distributions, if any. Total return may reflect adjustments to conform to generally accepted accounting principles. |
| (c) | Does not include expenses of the underlying fund in which the Series invests. |
| (e) | Dividends from net investment income may include other items that are ordinary income for tax purposes. |
See Notes to Financial Statements.
Report of Independent Registered Public Accounting Firm
The Board of Directors and Shareholders
Prudential World Fund, Inc.:
We have audited the accompanying statement of assets and liabilities of Prudential Emerging Markets Debt Local Currency Fund, one of the series constituting Prudential World Fund, Inc. (hereafter referred to as the “Fund”), including the portfolio of investments, as of October 31, 2016, and the related statement of operations for the year then ended, the statements of changes in net assets for each of the years in the two-year period then ended, and the financial highlights for each of the years in the five-year period then ended. These financial statements and financial highlights are the responsibility of the Fund’s management. Our responsibility is to express an opinion on these financial statements and financial highlights based on our audits.
We conducted our audits in accordance with the standards of the Public Company Accounting Oversight Board (United States). Those standards require that we plan and perform the audit to obtain reasonable assurance about whether the financial statements and financial highlights are free of material misstatement. An audit includes examining, on a test basis, evidence supporting the amounts and disclosures in the financial statements. Our procedures included confirmation of securities owned as of October 31, 2016, by correspondence with the custodian, transfer agent and brokers or by other appropriate auditing procedures when replies from brokers were not received. An audit also includes assessing the accounting principles used and significant estimates made by management, as well as evaluating the overall financial statement presentation. We believe that our audits provide a reasonable basis for our opinion.
In our opinion, the financial statements and financial highlights referred to above present fairly, in all material respects, the financial position of the Fund as of October 31, 2016, and the results of its operations for the year then ended, the changes in its net assets for each of the years in the two-year period then ended, and the financial highlights for each of the years in the five-year period then ended, in conformity with U.S. generally accepted accounting principles.

New York, New York
December 19, 2016
| | | | |
| Prudential Emerging Markets Debt Local Currency Fund | | | 53 | |
INFORMATION ABOUT BOARD MEMBERS AND OFFICERS
(Unaudited)
Information about Board Members and Officers of the Fund is set forth below. Board Members who are not deemed to be “interested persons” of the Fund, as defined in the 1940 Act, are referred to as “Independent Board Members.” Board Members who are deemed to be “interested persons” of the Fund are referred to as “Interested Board Members.” The Board Members are responsible for the overall supervision of the operations of the Fund and perform the various duties imposed on the directors of investment companies by the 1940 Act. The Board in turn elects the Officers, who are responsible for administering the day-to-day operations of the Fund.
| | | | |
| Independent Board Members(1) |
Name, Address, Age Position(s) Portfolios Overseen | | Principal Occupation(s) During Past Five Years | | Other Directorships Held During Past Five Years |
Ellen S. Alberding (58) Board Member Portfolios Overseen: 67 | | President and Board Member, The Joyce Foundation (charitable foundation) (since 2002); Vice Chair, City Colleges of Chicago (community college system) (since 2011); Trustee, Skills for America’s Future (national initiative to connect employers to community colleges) (since 2011); Trustee, National Park Foundation (charitable foundation for national park system) (since 2009); Trustee, Economic Club of Chicago (since 2009). | | None. |
Kevin J. Bannon (64) Board Member Portfolios Overseen: 67 | | Managing Director (April 2008-May 2015) and Chief Investment Officer (October 2008-November 2013) of Highmount Capital LLC (registered investment adviser); formerly Executive Vice President and Chief Investment Officer (April 1993-August 2007) of Bank of New York Company; President (May 2003-May 2007) of BNY Hamilton Family of Mutual Funds. | | Director of Urstadt Biddle Properties (equity real estate investment trust) (since September 2008). |
Linda W. Bynoe (64) Board Member Portfolios Overseen: 67 | | President and Chief Executive Officer (since March 1995) and formerly Chief Operating Officer (December 1989-February 1995) of Telemat Ltd. (management consulting); formerly Vice President (January 1985-June 1989) at Morgan Stanley & Co. (broker-dealer). | | Director of Simon Property Group, Inc. (retail real estate) (May 2003-May 2012); Director of Anixter International, Inc. (communication products distributor) (since January 2006); Director of Northern Trust Corporation (financial services) (since April 2006); Trustee of Equity Residential (residential real estate) (since December 2009). |
Prudential Emerging Markets Debt Local Currency Fund
| | | | |
| Independent Board Members(1) |
Name, Address, Age Position(s) Portfolios Overseen | | Principal Occupation(s) During Past Five Years | | Other Directorships Held During Past Five Years |
Keith F. Hartstein (60) Board Member Portfolios Overseen: 67 | | Retired; Member (since November 2014) of the Governing Council of the Independent Directors Council (organization of independent mutual fund directors); formerly President and Chief Executive Officer (2005-2012), Senior Vice President
(2004-2005), Senior Vice President of Sales and Marketing (1997-2004), and various executive management positions (1990-1997), John Hancock Funds, LLC (asset management); Chairman, Investment Company Institute’s Sales Force Marketing Committee (2003-2008). | | None. |
Michael S. Hyland, CFA (71) Board Member Portfolios Overseen: 67 | | Retired (since February 2005); formerly Senior Managing Director (July 2001-February 2005) of Bear Stearns & Co, Inc.; Global Partner, INVESCO (1999-2001); Managing Director and President of Salomon Brothers Asset Management (1989-1999). | | None. |
Richard A. Redeker (73) Board Member & Independent Chair Portfolios Overseen: 67 | | Retired Mutual Fund Senior Executive (47 years); Management Consultant; Director, Mutual Fund Directors Forum (since 2014); Independent Directors Council (organization of independent mutual fund directors)-Executive Committee, Chair of Policy Steering Committee, Governing Council. | | None. |
Stephen G. Stoneburn (73) Board Member Portfolios Overseen: 67 | | Chairman (since July 2011), President and Chief Executive Officer (since June 1996) of Quadrant Media Corp. (publishing company); formerly President (June 1995-June 1996) of Argus Integrated Media, Inc.; Senior Vice President and Managing Director (January 1993-1995) of Cowles Business Media; Senior Vice President of Fairchild Publications, Inc. (1975-1989). | | None. |
Visit our website at prudentialfunds.com
| | | | |
| Interested Board Members(1) |
Name, Address, Age Position(s) Portfolios Overseen | | Principal Occupation(s) During Past Five Years | | Other Directorships Held During Past Five Years |
Stuart S. Parker (54) Board Member & President Portfolios Overseen: 67 | | President of Prudential Investments LLC (since January 2012); Executive Vice President of Prudential Investment Management Services LLC (since December 2012); Executive Vice President of Jennison Associates LLC and Head of Retail Distribution of Prudential Investments LLC (June 2005-December 2011). | | None. |
Scott E. Benjamin (43) Board Member & Vice President Portfolios Overseen: 67 | | Executive Vice President (since June 2009) of Prudential Investments LLC; Executive Vice President (June 2009-June 2012) and Vice President (since June 2012) of Prudential Investment Management Services LLC; Executive Vice President (since September 2009) of AST Investment Services, Inc.; Senior Vice President of Product Development and Marketing, Prudential Investments (since February 2006); Vice President of Product Development and Product Management, Prudential Investments (2003-2006). | | None. |
Grace C. Torres* (57) Board Member Portfolios Overseen: 65 | | Retired; formerly Treasurer and Principal Financial and Accounting Officer of the Prudential Investments Funds, Target Funds, Advanced Series Trust, Prudential Variable Contract Accounts and The Prudential Series Fund (1998-June 2014); Assistant Treasurer (March 1999-June 2014) and Senior Vice President (September 1999-June 2014) of Prudential Investments LLC; Assistant Treasurer (May 2003-June 2014) and Vice President (June 2005-June 2014) of AST Investment Services, Inc.; Senior Vice President and Assistant Treasurer (May 2003-June 2014) of Prudential Annuities Advisory Services, Inc. | | Director (since July 2015) of Sun Bancorp, Inc. N.A. |
| * | Note: Prior to her retirement in 2014, Ms. Torres was employed by Prudential Investments LLC. Due to her prior employment, she is considered to be an “interested person” under the 1940 Act. Ms. Torres is a Non-Management Interested Board Member. |
| (1) | The year that each Board Member joined the Board is as follows: |
Ellen S. Alberding; 2013; Kevin J. Bannon, 2008; Linda W. Bynoe, 2005; Keith F. Hartstein, 2013; Michael S. Hyland, 2008; Richard A. Redeker, 2003; Stephen G. Stoneburn, 1996; Grace C. Torres, 2014; Stuart S. Parker, Board Member and President since 2012; Scott E. Benjamin, Board Member since 2010 and Vice President since 2009.
Prudential Emerging Markets Debt Local Currency Fund
| | | | |
| Fund Officers(a) |
Name, Address and Age Position with Fund | | Principal Occupation(s) During Past Five Years | | Length of Service as Fund Officer |
Raymond A. O’Hara (61) Chief Legal Officer | | Vice President and Corporate Counsel (since July 2010) of Prudential Insurance Company of America (Prudential); Vice President (March 2011-Present) of Pruco Life Insurance Company and Pruco Life Insurance Company of New Jersey; Vice President and Corporate Counsel (March 2011-Present) of Prudential Annuities Life Assurance Corporation; Chief Legal Officer of Prudential Investments LLC (since June 2012); Chief Legal Officer of Prudential Mutual Fund Services LLC (since June 2012) and Corporate Counsel of AST Investment Services, Inc. (since June 2012); formerly Assistant Vice President and Corporate Counsel (September 2008-July 2010) of The Hartford Financial Services Group, Inc.; formerly Associate (September 1980-December 1987) and Partner (January 1988–August 2008) of Blazzard & Hasenauer, P.C. (formerly, Blazzard, Grodd & Hasenauer, P.C.). | | Since 2012 |
Chad A. Earnst (41) Chief Compliance Officer | | Chief Compliance Officer (September 2014-Present) of Prudential Investments LLC; Chief Compliance Officer (September 2014-Present) of the Prudential Investments Funds, Target Funds, Advanced Series Trust, The Prudential Series Fund, Prudential’s Gibraltar Fund, Inc., Prudential Global Short Duration High Yield Income Fund, Inc., Prudential Short Duration High Yield Fund, Inc. and Prudential Jennison MLP Income Fund, Inc.; formerly Assistant Director (March 2010-August 2014) of the Asset Management Unit, Division of Enforcement, US Securities & Exchange Commission; Assistant Regional Director (January 2010-August 2014), Branch Chief (June 2006–December 2009) and Senior Counsel (April 2003-May 2006) of the Miami Regional Office, Division of Enforcement, US Securities & Exchange Commission. | | Since 2014 |
Deborah A. Docs (58) Secretary | | Vice President and Corporate Counsel (since January 2001) of Prudential; Vice President (since December 1996) and Assistant Secretary (since March 1999) of Prudential Investments LLC; formerly Vice President and Assistant Secretary (May 2003-June 2005) of AST Investment Services, Inc. | | Since 2004 |
Jonathan D. Shain (58) Assistant Secretary | | Vice President and Corporate Counsel (since August 1998) of Prudential; Vice President and Assistant Secretary (since May 2001) of Prudential Investments LLC; Vice President and Assistant Secretary (since February 2001) of Prudential Mutual Fund Services LLC; formerly Vice President and Assistant Secretary (May 2003-June 2005) of AST Investment Services, Inc. | | Since 2005 |
Visit our website at prudentialfunds.com
| | | | |
| Fund Officers(a) |
Name, Address and Age Position with Fund | | Principal Occupation(s) During Past Five Years | | Length of Service as Fund Officer |
Claudia DiGiacomo (42) Assistant Secretary | | Vice President and Corporate Counsel (since January 2005) of Prudential; Vice President and Assistant Secretary of Prudential Investments LLC (since December 2005); Associate at Sidley Austin Brown & Wood LLP (1999-2004). | | Since 2005 |
Andrew R. French (53) Assistant Secretary | | Vice President and Corporate Counsel (since February 2010) of Prudential; formerly Director and Corporate Counsel (2006-2010) of Prudential; Vice President and Assistant Secretary (since January 2007) of Prudential Investments LLC; Vice President and Assistant Secretary (since January 2007) of Prudential Mutual Fund Services LLC. | | Since 2006 |
Theresa C. Thompson (54) Deputy Chief Compliance Officer | | Vice President, Compliance, Prudential Investments LLC (since April 2004); and Director, Compliance, Prudential Investments LLC (2001-2004). | | Since 2008 |
Charles H. Smith (43) Anti-Money Laundering Compliance Officer | | Vice President, Corporate Compliance, Anti-Money Laundering Unit (since January 2015) of Prudential; committee member of the American Council of Life Insurers Anti-Money Laundering and Critical Infrastructure Committee (since January 2016); formerly Global Head of Economic Sanctions Compliance at AIG Property Casualty (February 2007–December 2014); Assistant Attorney General at the New York State Attorney General’s Office, Division of Public Advocacy. (August 1998—January 2007). | | Since 2016 |
M. Sadiq Peshimam (52) Treasurer and Principal Financial and Accounting Officer | | Vice President (since 2005) of Prudential Investments LLC; formerly Assistant Treasurer of funds in the Prudential Mutual Fund Complex (2006-2014). | | Since 2006 |
Peter Parrella (58) Assistant Treasurer | | Vice President (since 2007) and Director (2004-2007) within Prudential Mutual Fund Administration; formerly Tax Manager at SSB Citi Fund Management LLC (1997-2004). | | Since 2007 |
Lana Lomuti (49) Assistant Treasurer | | Vice President (since 2007) and Director (2005-2007), within Prudential Mutual Fund Administration; formerly Assistant Treasurer (December 2007-February 2014) of The Greater China Fund, Inc. | | Since 2014 |
Linda McMullin (55) Assistant Treasurer | | Vice President (since 2011) and Director (2008-2011) within Prudential Mutual Fund Administration. | | Since 2014 |
Kelly A. Coyne (48) Assistant Treasurer | | Director, Investment Operations of Prudential Mutual Fund Services LLC (since 2010). | | Since 2015 |
Prudential Emerging Markets Debt Local Currency Fund
| (a) | Excludes Mr. Parker and Mr. Benjamin, interested Board Members who also serve as President and Vice President, respectively. |
Explanatory Notes to Tables:
| • | | Board Members are deemed to be “Interested,” as defined in the 1940 Act, by reason of their affiliation with Prudential Investments LLC and/or an affiliate of Prudential Investments LLC. |
| • | | Unless otherwise noted, the address of all Board Members and Officers is c/o Prudential Investments LLC, 655 Broad Street, Newark, New Jersey 07102-4410. |
| • | | There is no set term of office for Board Members or Officers. The Board Members have adopted a retirement policy, which calls for the retirement of Board Members on December 31 of the year in which they reach the age of 75. |
| • | | “Other Directorships Held” includes only directorships of companies required to register or file reports with the SEC under the 1934 Act (that is, “public companies”) or other investment companies registered under the 1940 Act. |
| • | | “Portfolios Overseen” includes all investment companies managed by Prudential Investments LLC. The investment companies for which Prudential Investments LLC serves as manager include the Prudential Investments Mutual Funds, The Prudential Variable Contract Accounts, Target Mutual Funds, Prudential Short Duration High Yield Fund, Inc., Prudential Global Short Duration High Yield Fund, Inc., The Prudential Series Fund, Prudential’s Gibraltar Fund, Inc. and the Advanced Series Trust. |
Visit our website at prudentialfunds.com
Approval of Advisory Agreements (unaudited)
The Fund’s Board of Directors
The Board of Directors (the “Board”) of Prudential Emerging Markets Debt Local Currency Fund (the “Fund”)1 consists of ten individuals, seven of whom are not “interested persons” of the Fund, as defined in the Investment Company Act of 1940, as amended (the “1940 Act”) (the “Independent Directors”). The Board is responsible for the oversight of the Fund and its operations, and performs the various duties imposed on the directors of investment companies by the 1940 Act. The Independent Directors have retained independent legal counsel to assist them in connection with their duties. The Chair of the Board is an Independent Director. The Board has established three standing committees: the Audit Committee, the Nominating and Governance Committee, and the Investment Committee. Each committee is chaired by, and composed of, Independent Directors.
Annual Approval of the Fund’s Advisory Agreements
As required under the 1940 Act, the Board determines annually whether to renew the Fund’s management agreement with Prudential Investments LLC (“PI”), the Fund’s subadvisory agreement with PGIM, Inc. (“PGIM”) on behalf of its Prudential Fixed Income (“PGIM Fixed Income”) unit, and the Fund’s sub-subadvisory agreement with PGIM Limited (“PGIML”). In considering the renewal of the agreements, the Board, including all of the Independent Directors, met on June 7-9, 2016 and approved the renewal of the agreements through July 31, 2017, after concluding that the renewal of the agreements was in the best interests of the Fund and its shareholders.
In advance of the meetings, the Board requested and received materials relating to the agreements, and had the opportunity to ask questions and request further information in connection with its consideration. Among other things, the Board considered comparative fee information from PI and PGIM. Also, the Board considered comparisons with other mutual funds in relevant Peer Universes and Peer Groups, as is further discussed below.
In approving the agreements, the Board, including the Independent Directors advised by independent legal counsel, considered the factors it deemed relevant, including the nature, quality and extent of services provided by PI and the subadviser, the performance of the Fund, the profitability of PI and its affiliates, expenses and fees, and the potential for economies of scale that may be shared with the Fund and its shareholders as the Fund’s assets grow. In their deliberations, the Directors did not identify any single factor which alone was responsible for the Board’s decision to approve the agreements with respect to the Fund. In connection with its deliberations, the Board considered information provided by PI throughout the year at regular Board meetings, presentations from portfolio managers and other information, as well as information furnished at or in advance of the meetings on June 7-9, 2016.
| 1 | Prudential Emerging Markets Debt Local Currency Fund is a series of Prudential World Fund, Inc. |
| | |
| Prudential Emerging Markets Debt Local Currency Fund |
Approval of Advisory Agreements (continued)
The Directors determined that the overall arrangements between the Fund and PI, which serves as the Fund’s investment manager pursuant to a management agreement, between PI and PGIM, which, through its PGIM Fixed Income unit, serves as the Fund’s subadviser pursuant to the terms of a subadvisory agreement with PI, and between PGIM and PGIML, which serves as the Fund’s sub-subadviser pursuant to the terms of a sub-subadvisory agreement with PGIM, are in the best interests of the Fund and its shareholders in light of the services performed, fees charged and such other matters as the Directors considered relevant in the exercise of their business judgment.
The material factors and conclusions that formed the basis for the Directors’ reaching their determinations to approve the continuance of the agreements are separately discussed below.
Nature, Quality, and Extent of Services
The Board received and considered information regarding the nature, quality and extent of services provided to the Fund by PI, PGIM Fixed Income, and PGIML. The Board considered the services provided by PI, including but not limited to the oversight of the subadviser and sub-subadviser for the Fund, as well as the provision of fund recordkeeping, compliance, and other services to the Fund. With respect to PI’s oversight of the subadviser and sub-subadviser, the Board noted that PI’s Strategic Investment Research Group (“SIRG”), which is a business unit of PI, is responsible for monitoring and reporting to PI’s senior management on the performance and operations of the subadviser and sub-subadviser. The Board also considered that PI pays the salaries of all of the officers and interested Directors of the Fund who are part of Fund management. The Board also considered the investment subadvisory services provided by PGIM Fixed Income and PGIML, including investment research and security selection, as well as adherence to the Fund’s investment restrictions and compliance with applicable Fund policies and procedures. The Board considered PI’s evaluation of the subadviser and sub-subadviser, as well as PI’s recommendation, based on its review of the subadviser and sub-subadviser, to renew the subadvisory and sub-subadvisory agreements.
The Board considered the qualifications, backgrounds and responsibilities of PI’s senior management responsible for the oversight of the Fund, PGIM, and PGIML, and also considered the qualifications, backgrounds and responsibilities of PGIM’s portfolio managers who are responsible for the day-to-day management of the Fund’s portfolio. The Board was provided with information pertaining to PI’s, PGIM’s, and PGIML’s organizational structure, senior management, investment operations, and other relevant information pertaining to PI, PGIM Fixed Income, and PGIML. The Board also noted that it received favorable compliance reports from the Fund’s Chief Compliance Officer (“CCO”) as to PI, PGIM Fixed Income, and PGIML. The Board noted that PGIM Fixed Income and PGIML are affiliated with PI.
| | |
| Visit our website at prudentialfunds.com | | |
The Board concluded that it was satisfied with the nature, extent and quality of the investment management services provided by PI, the subadvisory services provided to the Fund by PGIM Fixed Income, and the sub-subadvisory services provided by PGIML, and that there was a reasonable basis on which to conclude that the Fund benefits from the services provided by PI, PGIM Fixed Income, and PGIML under the management and subadvisory agreements.
Costs of Services and Profits Realized by PI
The Board was provided with information on the profitability of PI and its affiliates in serving as the Fund’s investment manager. The Board discussed with PI the methodology utilized in assembling the information regarding profitability and considered its reasonableness. The Board recognized that it is difficult to make comparisons of profitability from fund management contracts because comparative information is not generally publicly available and is affected by numerous factors, including the structure of the particular adviser, the types of funds it manages, its business mix, numerous assumptions regarding allocations and the adviser’s capital structure and cost of capital. However, the Board considered that the cost of services provided by PI for the year ended December 31, 2015 exceeded the management fees received by PI, resulting in an operating loss to PI. The Board further noted that the subadviser is affiliated with PI and that its profitability is reflected in PI’s profitability report. Taking these factors into account, the Board concluded that the profitability of PI and its affiliates in relation to the services rendered was not unreasonable.
Economies of Scale
PI and the Board previously retained an outside business consulting firm to review management fee breakpoint usage and trends in management fees across the mutual fund industry. The consulting firm presented its analysis and conclusions as to the Funds’ management fee structures to the Board and PI. The Board and PI have discussed these conclusions extensively since that presentation.
The Board received and discussed information concerning economies of scale that PI may realize as the Fund’s assets grow beyond current levels. The Board considered information provided by PI regarding the launch date of the Fund, the management fees of the Fund compared to those of similarly managed funds and PI’s investment in the Fund over time. The Board noted that economies of scale, if any, may be shared with the Fund in several ways, including low management fees from inception, additional technological and personnel investments to enhance shareholder services, and maintaining existing expense structures in the face of a rising cost environment. The Board considered PI’s assertion that it continually evaluates the management fee schedule of the Fund and the potential to share economies of scale through breakpoints or fee waivers as asset levels increase.
| | |
| Prudential Emerging Markets Debt Local Currency Fund |
Approval of Advisory Agreements (continued)
The Board recognized the inherent limitations of any analysis of economies of scale, stemming largely from the Board’s understanding that most of PI’s costs are not specific to individual funds, but rather are incurred across a variety of products and services.
Other Benefits to PI, PGIM Fixed Income, and PGIML
The Board considered potential ancillary benefits that might be received by PI, PGIM Fixed Income, and PGIML and their affiliates as a result of their relationship with the Fund. The Board concluded that potential benefits to be derived by PI included transfer agency fees received by the Fund’s transfer agent (which is affiliated with PI), as well as benefits to its reputation or other intangible benefits resulting from PI’s association with the Fund. The Board concluded that the potential benefits to be derived by PGIM Fixed Income and PGIML included the ability to use soft dollar credits, as well as the potential benefits consistent with those generally resulting from an increase in assets under management, specifically, potential access to additional research resources and benefits to their reputations. The Board concluded that the benefits derived by PI, PGIM Fixed Income, and PGIML were consistent with the types of benefits generally derived by investment managers and subadvisers to mutual funds.
Performance of the Fund / Fees and Expenses
The Board considered certain additional specific factors and made related conclusions relating to the historical performance of the Fund for the one- and three-year periods ended December 31, 2015. The Board considered that the Fund commenced operations on March 30, 2011 and that longer-term performance was not yet available.
The Board also considered the Fund’s actual management fee, as well as the Fund’s net total expense ratio, for the fiscal year ended October 31, 2015. The Board considered the management fee for the Fund as compared to the management fee charged by PI to other funds and the fee charged by other advisers to comparable mutual funds in a Peer Group. The actual management fee represents the fee rate actually paid by Fund shareholders and includes any fee waivers or reimbursements. The net total expense ratio for the Fund represents the actual expense ratio incurred by Fund shareholders.
The mutual funds included in the Peer Universe (the Lipper Emerging Markets Local Currency Debt Funds Performance Universe) and the Peer Group were objectively determined by Broadridge, an independent provider of mutual fund data. The comparisons placed the Fund in various quartiles, with the first quartile being the best 25% of the mutual funds (for performance, the best performing mutual funds and, for expenses, the lowest cost mutual funds).
The section below summarizes key factors considered by the Board and the Board’s conclusions regarding the Fund’s performance, fees and overall expenses. The table sets
| | |
| Visit our website at prudentialfunds.com | | |
forth gross performance comparisons (which do not reflect the impact on performance of fund expenses, or any subsidies, expense caps or waivers that may be applicable) with the Peer Universe, actual management fees with the Peer Group (which reflect the impact of any subsidies or fee waivers), and net total expenses with the Peer Group, each of which were key factors considered by the Board.
| | | | | | | | |
| Performance | | 1 Year | | 3 Years | | 5 Years | | 10 Years |
| | | 2nd Quartile | | 2nd Quartile | | N/A | | N/A |
| Actual Management Fees: 1st Quartile |
| Net Total Expenses: 4th Quartile |
| | • | | The Board noted that the Fund outperformed its benchmark index for all periods. |
| | • | | The Board also noted information provided by PI which indicated that, although the Fund’s net total expenses were in the fourth quartile, the Fund’s net total expenses were within six basis points of the median of all funds in the Peer Group. |
| | • | | The Board and PI agreed to continue the existing expense cap of 1.05% (exclusive of 12b-1 fees and certain other fees) through February 28, 2017. |
| | • | | The Board concluded that, in light of the above, it would be in the best interests of the Fund and its shareholders to renew the agreements. |
| | • | | The Board concluded that the management fees (including subadvisory fees) and total expenses were reasonable in light of the services provided. |
* * *
After full consideration of these factors, the Board concluded that the approval of the agreements was in the best interests of the Fund and its shareholders.
| | |
| Prudential Emerging Markets Debt Local Currency Fund |
| | | | |
| n MAIL | | n TELEPHONE | | n WEBSITE |
655 Broad Street Newark, NJ 07102 | | (800) 225-1852 | | www.prudentialfunds.com |
|
| PROXY VOTING |
| The Board of Directors of the Fund has delegated to the Fund’s investment subadviser the responsibility for voting any proxies and maintaining proxy recordkeeping with respect to the Fund. A description of these proxy voting policies and procedures is available without charge, upon request, by calling (800) 225-1852 or by visiting the Securities and Exchange Commission’s website at www.sec.gov. Information regarding how the Fund voted proxies relating to portfolio securities during the most recent 12-month period ended June 30 is available on the Fund’s website and on the Securities and Exchange Commission’s website. |
|
| DIRECTORS |
| Ellen S. Alberding • Kevin J. Bannon • Scott E. Benjamin • Linda W. Bynoe • Keith F. Hartstein • Michael S. Hyland • Stuart S. Parker • Richard A. Redeker • Stephen G. Stoneburn • Grace C. Torres |
|
| OFFICERS |
| Stuart S. Parker, President • Scott E. Benjamin, Vice President • M. Sadiq Peshimam, Treasurer and Principal Financial and Accounting Officer • Raymond A. O’Hara, Chief Legal Officer • Deborah A. Docs, Secretary • Chad A. Earnst, Chief Compliance Officer • Theresa C. Thompson, Deputy Chief Compliance Officer • Charles H. Smith, Anti-Money Laundering Compliance Officer • Jonathan D. Shain, Assistant Secretary • Claudia DiGiacomo, Assistant Secretary • Andrew R. French, Assistant Secretary • Peter Parrella, Assistant Treasurer • Lana Lomuti, Assistant Treasurer • Linda McMullin, Assistant Treasurer • Kelly A. Coyne, Assistant Treasurer |
| | | | |
| MANAGER | | Prudential Investments LLC | | 655 Broad Street
Newark, NJ 07102 |
|
| INVESTMENT SUBADVISER | | PGIM Fixed Income | | 655 Broad Street
Newark, NJ 07102 |
|
| DISTRIBUTOR | | Prudential Investment
Management Services LLC | | 655 Broad Street
Newark, NJ 07102 |
|
| CUSTODIAN | | The Bank of New York Mellon | | One Wall Street
New York, NY 10286 |
|
| TRANSFER AGENT | | Prudential Mutual Fund
Services LLC | | PO Box 9658
Providence, RI 02940 |
|
INDEPENDENT REGISTERED
PUBLIC ACCOUNTING FIRM | | KPMG LLP | | 345 Park Avenue
New York, NY 10154 |
|
| FUND COUNSEL | | Willkie Farr & Gallagher LLP | | 787 Seventh Avenue
New York, NY 10019 |
|
|
| An investor should consider the investment objectives, risks, charges, and expenses of the Fund carefully before investing. The prospectus and summary prospectus contain this and other information about the Fund. An investor may obtain a prospectus and summary prospectus by visiting our website at www.prudentialfunds.com or by calling (800) 225-1852. The prospectus and summary prospectus should be read carefully before investing. |
|
| E-DELIVERY |
| To receive your mutual fund documents online, go to www.prudentialfunds.com/edelivery and enroll. Instead of receiving printed documents by mail, you will receive notification via email when new materials are available. You can cancel your enrollment or change your email address at any time by visiting the website address above. |
|
| SHAREHOLDER COMMUNICATIONS WITH DIRECTORS |
| Shareholders can communicate directly with the Board of Directors by writing to the Chair of the Board, Prudential Emerging Markets Debt Local Currency Fund, Prudential Investments, Attn: Board of Directors, 655 Broad Street, Newark, NJ 07102. Shareholders can communicate directly with an individual Director by writing to the same address. Communications are not screened before being delivered to the addressee. |
|
| AVAILABILITY OF PORTFOLIO SCHEDULE |
| The Fund files its complete schedule of portfolio holdings with the Securities and Exchange Commission for the first and third quarters of each fiscal year on Form N-Q. The Fund’s Forms N-Q are available on the Commission’s website at www.sec.gov. The Fund’s Forms N-Q may also be reviewed and copied at the Commission’s Public Reference Room in Washington, D.C. Information on the operation and location of the Public Reference Room may be obtained by calling 1-800-SEC-0330. The Fund’s schedule of portfolio holdings is also available on the Fund’s website as of the end of each month no sooner than 15 days after the end of the month. |
|
| The Fund’s Statement of Additional Information contains additional information about the Fund’s Directors and is available without charge, upon request, by calling (800) 225-1852. |
Mutual Funds:
| | | | |
| ARE NOT INSURED BY THE FDIC OR ANY FEDERAL GOVERNMENT AGENCY | | MAY LOSE VALUE | | ARE NOT A DEPOSIT OF OR GUARANTEED BY ANY BANK OR ANY BANK AFFILIATE |
PRUDENTIAL EMERGING MARKETS DEBT LOCAL CURRENCY FUND
| | | | | | | | |
| SHARE CLASS | | A | | C | | Q | | Z |
| NASDAQ | | EMDAX | | EMDCX | | EMDQX | | EMDZX |
| CUSIP | | 743969750 | | 743969743 | | 743969735 | | 743969727 |
MF212E 0300097-00001-00
PRUDENTIAL INVESTMENTS, A PGIM BUSINESS | MUTUAL FUNDS
Prudential Jennison Emerging Markets Equity Fund
| | |
| ANNUAL REPORT | | OCTOBER 31, 2016 |

| | |
To enroll in e-delivery, go to prudentialfunds.com/edelivery | |  |
|
| Objective: Long-term growth of capital |
Highlights
PRUDENTIAL JENNISON EMERGING MARKETS EQUITY FUND
| • | | The Fund’s information technology holdings were strong contributors to positive returns. These stocks included Tencent, China’s largest and most visited Internet service portal, and Buenos Aires-based online trading service MercadoLibre. (For a complete list of holdings, refer to the Portfolio of Investments section of this report.) |
| • | | One of the world’s largest e-commerce companies, Alibaba, reported better-than-expected revenue, earnings, user metrics, gross merchandise value, monetization revenue, and margins. Jennison believes Alibaba, with its dominant market share, offers an attractive opportunity to invest in the long-term growth of the Chinese e-commerce market. |
| • | | Stock selection in consumer discretionary hurt Fund performance. Vipshop fell on lowered revenue forecasts. The company is a leading online discount retailer that sells domestic and international branded products via flash sales to Chinese consumers. Jennison eliminated the Fund’s position in Vipshop. |
This report is not authorized for distribution to prospective investors unless preceded or accompanied by a current prospectus.
The views expressed in this report and information about the Fund’s portfolio holdings are for the period covered by this report and are subject to change thereafter.
Mutual funds are distributed by Prudential Investment Management Services LLC, member SIPC. Jennison Associates LLC is a registered investment adviser. Both are Prudential Financial companies. © 2016 Prudential Financial, Inc. and its related entities. Jennison Associates, Jennison, the Prudential logo, and the Rock symbol are service marks of Prudential Financial, Inc. and its related entities, registered in many jurisdictions worldwide.
| | |
| 2 | | Visit our website at prudentialfunds.com |
Letter from the President

Dear Shareholder:
We hope you find the annual report for the Prudential Jennison Emerging Markets Equity Fund informative and useful. The report covers performance for the 12-month period that ended October 31, 2016.
During the reporting period, the US economy experienced modest growth.
Labor markets were healthy, and consumer confidence rose. The housing market brightened somewhat, as momentum continued for the new home market. The Federal Reserve kept interest rates unchanged at its September meeting, but pointed to the strong possibility of a rate hike in December. Internationally, concerns over Brexit—the term used to represent Britain’s decision to leave the European Union—remained in the spotlight.
Equity markets in the US were firmly in positive territory at the end of the reporting period, as US stocks posted strong gains. European stocks struggled earlier, but found some traction in the third quarter. Asian markets also advanced, and emerging markets rose sharply.
US fixed income markets experienced overall gains. High yield bonds posted very strong results. Corporate bonds and Treasuries also performed well. Accommodative monetary policy by central banks helped lift global bond markets.
Given the uncertainty in today’s investment environment, we believe that active professional portfolio management offers a potential advantage. Active managers often have the knowledge and flexibility to find the best investment opportunities in the most challenging markets.
Even so, it’s best if investment decisions are based on your long-term goals rather than on short-term market and economic developments. We also encourage you to work with an experienced financial advisor who can help you set goals, determine your tolerance for risk, build a diversified plan that’s right for you, and make adjustments when necessary.
By having Prudential Investments help you address your goals, you gain the advantage of asset managers that also manage money for many major corporations and pension funds around the world. That means you benefit from the same expertise, innovation, and attention to risk demanded by today’s most sophisticated investors.
Thank you for choosing our family of funds.
Sincerely,

Stuart S. Parker, President
Prudential Jennison Emerging Markets Equity Fund
December 15, 2016
| | | | |
| Prudential Jennison Emerging Markets Equity Fund | | | 3 | |
Your Fund’s Performance (unaudited)
Performance data quoted represent past performance. Past performance does not guarantee future results. The investment return and principal value of an investment will fluctuate, so that an investor’s shares, when redeemed, may be worth more or less than their original cost. Current performance may be lower or higher than the past performance data quoted. An investor may obtain performance data as of the most recent month-end by visiting our website at www.prudentialfunds.com or by calling (800) 225-1852.
| | | | | | |
| Cumulative Total Returns (Without Sales Charges) as of 10/31/16 | |
| | One Year (%) | | | Since Inception (%) | |
| Class A | | 6.02 | | | –6.60 (9/16/14) | |
| Class C | | 5.26 | | | –8.00 (9/16/14) | |
| Class Q | | 6.34 | | | –6.05 (9/16/14) | |
| Class Z | | 6.46 | | | –6.10 (9/16/14) | |
| MSCI Emerging Markets Index | | 9.27 | | | –5.51 | |
| Lipper Emerging Markets Funds Average | | 7.88 | | | –7.22 | |
| | | | | | |
| Average Annual Total Returns (With Sales Charges) as of 9/30/16 | |
| | One Year (%) | | | Since Inception (%) | |
| Class A | | 10.17 | | | –5.54 (9/16/14) | |
| Class C | | 14.71 | | | –3.59 (9/16/14) | |
| Class Q | | 16.91 | | | –2.61 (9/16/14) | |
| Class Z | | 16.79 | | | –2.68 (9/16/14) | |
| MSCI Emerging Markets Index | | 16.78 | | | –2.91 | |
| Lipper Emerging Markets Funds Average | | 14.91 | | | –3.62 | |
| | | | | | |
| Average Annual Total Returns (With Sales Charges) as of 10/31/16 | |
| | One Year (%) | | | Since Inception (%) | |
| Class A | | 0.19 | | | –5.70 (9/16/14) | |
| Class C | | 4.26 | | | –3.84 (9/16/14) | |
| Class Q | | 6.34 | | | –2.89 (9/16/14) | |
| Class Z | | 6.46 | | | –2.92 (9/16/14) | |
| | | | | | |
| Average Annual Total Returns (Without Sales Charges) as of 10/31/16 | |
| | One Year (%) | | | Since Inception (%) | |
| Class A | | 6.02 | | | –3.16 (9/16/14) | |
| Class C | | 5.26 | | | –3.84 (9/16/14) | |
| Class Q | | 6.34 | | | –2.89 (9/16/14) | |
| Class Z | | 6.46 | | | –2.92 (9/16/14) | |
| | |
| 4 | | Visit our website at prudentialfunds.com |
Growth of a $10,000 Investment
The graph compares a $10,000 investment in the Prudential Jennison Emerging Markets Equity Fund (Class A shares) with a similar investment in the MSCI Emerging Markets Index, by portraying the initial account values at the commencement of operations for Class A shares (September 16, 2014) and the account values at the end of the current fiscal year (October 31, 2016) as measured on a quarterly basis. For purposes of the graph, and unless otherwise indicated, it has been assumed that (a) the maximum applicable front-end sales charge was deducted from the initial $10,000 investment in Class A shares; (b) all recurring fees (including management fees) were deducted; and (c) all dividends and distributions were reinvested. The line graph provides information for Class A shares only. As indicated in the tables provided earlier, performance for Class C, Class Q, and Class Z shares will vary due to the differing charges and expenses applicable to each share class (as explained in the following paragraphs). Without waiver of fees and/or expense reimbursements, if any, the Fund’s returns would have been lower.
Past performance does not predict future performance. Total returns and the ending account values in the graph include changes in share price and reinvestment of dividends and capital gains distributions in a hypothetical investment for the periods shown. The Fund’s total returns do not reflect the deduction of income taxes on an individual’s investment. Taxes may reduce your actual investment returns on income or gains paid by the Fund or any gains you may realize if you sell your shares.
Source: Prudential Investments LLC and Lipper Inc.
Inception returns are provided for any share class with less than 10 calendar years of returns.
| | | | |
| Prudential Jennison Emerging Markets Equity Fund | | | 5 | |
Your Fund’s Performance (continued)
The returns in the tables do not reflect the deduction of taxes that a shareholder would pay on Fund distributions or following the redemption of Fund shares. The average annual total returns take into account applicable sales charges, which are described for each share class in the table below.
| | | | | | | | |
| | | Class A | | Class C | | Class Q | | Class Z |
| Maximum initial sales charge | | 5.50% of the public offering price | | None | | None | | None |
| Contingent deferred sales charge (CDSC) (as a percentage of the lower of original purchase price or net asset value at redemption) | | 1% on sales of $1 million or more made within 12 months of purchase | | 1% on sales made within 12 months of purchase | | None | | None |
| Annual distribution and service (12b-1) fees (shown as a percentage of average daily net assets) | | .30% (.25% currently) | | 1% | | None | | None |
Benchmark Definitions
MSCI Emerging Markets Index—The MSCI Emerging Markets Index is an unmanaged free float-adjusted market capitalization index that is designed to measure equity market performance of emerging markets. The MSCI Emerging Markets Index consists of the following 23 emerging market country indexes: Brazil, Chile, China, Colombia, Czech Republic, Egypt, Greece, Hungary, India, Indonesia, Korea, Malaysia, Mexico, Peru, Philippines, Poland, Qatar, Russia, South Africa, Taiwan, Thailand, Turkey, and United Arab Emirates.
Lipper Emerging Markets Funds Average—The Lipper Emerging Markets Funds Average (Lipper Average) includes funds that seek long-term capital appreciation by investing at least 65% of total assets in emerging market equity securities, where “emerging market” is defined by a country’s GNP per capita or other economic measures.
Investors cannot invest directly in an index or average. The returns for the Index would be lower if they included the effects of sales charges, operating expenses of a mutual fund, or taxes. Returns for the Lipper Average reflect the deduction of operating expenses, but not sales charges or taxes. The Since Inception returns for the Index and Lipper Average are measured from the closest month-end to the inception date for the indicated share class.
| | |
| 6 | | Visit our website at prudentialfunds.com |
| | | | |
Five Largest Holdings expressed as a
percentage of net assets as of 10/31/16 (%) | |
Tencent Holdings Ltd., Internet Software & Services | | | 6.7 | |
MercadoLibre, Inc., Internet Software & Services | | | 5.2 | |
Alibaba Group Holding Ltd., Internet Software & Services | | | 4.8 | |
| Ctrip.com International Ltd., Internet & Catalog Retail | | | 4.0 | |
| Raia Drogasil SA, Food & Staples Retailing | | | 2.9 | |
Holdings reflect only long-term investments and are subject to change.
| | | | |
Five Largest Industries expressed as a
percentage of net assets as of 10/31/16 (%) | |
Internet Software & Services | | | 21.5 | |
Automobiles | | | 7.8 | |
Internet & Catalog Retail | | | 6.5 | |
Food & Staples Retailing | | | 5.4 | |
Biotechnology | | | 5.1 | |
Industry weightings reflect only long-term investments and are subject to change.
| | | | |
| Prudential Jennison Emerging Markets Equity Fund | | | 7 | |
Strategy and Performance Overview
How did the Fund perform?
The Prudential Jennison Emerging Markets Equity Fund’s Class A shares rose 6.02% in the 12 months ended October 31, 2016. The Fund underperformed the 9.27% return of the MSCI Emerging Markets Index (the Index) and the 7.88% return of the Lipper Emerging Markets Funds Average.
What was the market environment?
| • | | Numerous factors contributed to market volatility in the 12-month period, including decelerating economic growth in China; concerns that emerging economies might face balance sheet risks; the negative effect of lower energy prices on industrial sectors; fears of slowing economic growth in the US; uncertainty about the course of future Federal Reserve monetary tightening; Brexit, the United Kingdom’s vote to leave the European Union; and anxiety about the highly unconventional US presidential election. |
| • | | Risk aversion in this volatile global market environment affected how investors valued different securities. Low-volatility/high-dividend-paying and other “safety” stocks were significant drivers of market returns. Stocks of higher-growth companies generally underperformed. |
| • | | In the Index, the energy, materials, and information technology sectors posted double-digit advances; health care and industrials declined the most. |
What worked?
| • | | The Fund’s information technology holdings were strong contributors to positive returns. Tencent, China’s largest and most visited Internet service portal, continued to perform well, fundamentally driven by its dominant position in China’s online gaming and instant messaging markets and its growing advertising and payment service efforts. If a proposed merger with a standalone online music provider closes, Tencent could also become China’s leading online music provider. |
| • | | One of the world’s largest e-commerce companies, Alibaba, reported better-than-expected revenue, earnings, user metrics, gross merchandise value, monetization revenue, and margins. Jennison believes Alibaba, with its dominant market share, offers an attractive opportunity to invest in the long-term growth of the Chinese e-commerce market. |
| • | | Buenos Aires-based online trading service MercadoLibre advanced on strong execution and enhanced marketplace initiatives, including integrated shipping and payment systems. The company enables individuals and businesses to electronically sell and buy items in more than 2,000 categories. Jennison likes MercadoLibre’s exposure to Latin America’s expanding internet penetration rates and low e-commerce share of the retail market. |
| • | | Taiwan-based Largan Precision designs, manufactures, and sells optical lens modules, real image view finders, and optoelectronic parts. It provides optical lenses and lens sets, |
| | |
| 8 | | Visit our website at prudentialfunds.com |
| | which are incorporated in scanners, cameras, multifunctional office machines, liquid crystal display (LCD) projectors, digital cameras, mobile phone cameras, and DVD players. With expertise in phone camera plastic lens manufacturing, Largan benefitted from strong orders from customers that include Apple and major Chinese smart phone manufacturers. |
| | • | | Brazil’s largest drugstore chain Raia Drogasil reported strong revenue and earnings growth and opened new stores at a robust pace. Jennison believes the company’s improving execution, revenue management, and experienced management team position it for market share gains as Brazil’s highly fragmented retail drugstore market consolidates. Longer term, Brazil’s rising per capita income and demographic shifts are expected to foster solid and sustained growth in drug sales. Revenue growth, which has increased at a double-digit compound annual rate since 2012, has accelerated recently despite Brazilian economic headwinds. |
| | • | | CP All reported stronger-than-expected earnings and same-store-sales growth. The company operates more than 7,000 convenience stores under the 7-Eleven trademark and has a dominant market position in Thailand. Jennison expects the company to benefit from benign operating cost pressure, store expansion, and same-store-sales growth, driven by improving domestic consumption. |
What didn’t work?
| • | | Stock selection in consumer discretionary hurt Fund performance: |
| | • | | Vipshop fell on lowered revenue forecasts. The company is a leading online discount retailer that sells domestic and international branded products via flash sales to Chinese consumers. Jennison eliminated the Fund’s position in Vipshop. |
| | • | | Jennison also eliminated the Fund’s position in Eclat Textile on indications of decelerating revenue growth. The company is a vertically integrated producer of functional stretch-knit fabric sports and outdoor apparel. Eclat’s revenue growth had outpaced that of the global sports apparel industry through innovation, a higher mix of premium fabrics, capacity expansion, efficiency improvements, and average-selling-price (ASP) increases. |
| | • | | South Korean biotechnology company Medytox declined even as revenue and earnings grew robustly. The company makes and markets plastic surgery and facial wrinkle reduction products, as well as muscular contractive therapies. Medytox has expanded from a strong Korean market into China, Taiwan, Japan, Thailand, India, Brazil, and more than 40 other global markets. Jennison expects the company’s growth to be fueled by the aging of Korea’s population, new products, and export orders. |
| | | | |
| Prudential Jennison Emerging Markets Equity Fund | | | 9 | |
Strategy and Performance Overview (continued)
| | • | | Another South Korean company, Osstem Implant, was hurt by a temporary disruption in its Chinese operations. Osstem makes and distributes dental implants in 50 countries through more than 20 subsidiaries. It also provides a range of dental materials and equipment as well as products that enhance surgery safety, promote bone regeneration, and whiten teeth. |
| | • | | Jennison eliminated the Fund’s position in Shenzhen-based Ping An Insurance in February to reduce exposure to a broad sell-off in Chinese equities. The company is China’s second-largest insurance company with significant additional operations in banking and financial services. |
| | • | | Also affected by the sell-off in Chinese markets, 58.com was one of only a few information technology holdings to decline. A leading online marketplace in China, 58.com facilitates connections, information-sharing, and transactions between small and medium-sized local businesses and consumers in almost 400 cities. Jennison likes the company’s focus on the largely unaddressed small business market. |
The percentage points shown in the tables identify each security’s positive or negative contribution to the Fund’s return, which is the sum of all contributions by individual holdings.
| | | | | | |
| Top Contributors (%) | | Top Detractors (%) |
| Tencent Holdings | | 2.81 | | Vipshop Holding | | –1.47 |
| MercadoLibre | | 2.07 | | Ping An Insurance | | –0.83 |
| Raia Drogasil | | 2.03 | | 58.com | | –0.68 |
| Largan Precision | | 1.25 | | CGN Power | | –0.65 |
| Sands China | | 1.15 | | Medytox | | –0.62 |
Current outlook
| • | | Jennison’s overall view of the emerging markets macroeconomic environment is turning more positive, as currencies stabilize, GDP growth reaccelerates, commodities prices improve, inflationary pressures remain subdued, and central banks ease monetary policy. |
| • | | China’s struggle to drive economic growth through domestic consumer demand rather than exports and massive public works programs is a work in progress. A host of measures are designed to loosen monetary and fiscal policies and stimulate consumption. China continues to have a number of policy options to work with in the current environment, and heightened volatility may persist for a while. Although structural issues remain, high-frequency data suggest that conditions are improving and that the risk of a hard landing is fading. Jennison’s work and the positions the Fund holds in Chinese equities continue to focus on the rapidly growing e-commerce and internet |
| | |
| 10 | | Visit our website at prudentialfunds.com |
| | platform opportunities that have seen little, if any, impact from the pressures surrounding the broader economy. |
| • | | Jennison is increasingly constructive on Brazil, as structural reforms are finally implemented after a long economic struggle. |
| • | | In countries of the Association of Southeast Asian Nations (ASEAN), cyclical recovery has become more apparent in recent months, fed in part by increased fiscal spending. |
| • | | Jennison believes overall conditions favor its strategy over a reasonable investment horizon. Jennison focuses on identifying businesses that can generate organic growth and that continue to offer secular growth opportunities. The strategy is heavily invested in consumer discretionary, technology, and health care stocks offering these characteristics, while energy and materials exposures are small. |
| | | | |
| Prudential Jennison Emerging Markets Equity Fund | | | 11 | |
Fees and Expenses (unaudited)
As a shareholder of the Fund, you incur two types of costs: (1) transaction costs, including sales charges (loads) on purchase payments and redemptions, as applicable, and (2) ongoing costs, including management fees, distribution, and/or service (12b-1) fees, and other Fund expenses, as applicable. This example is intended to help you understand your ongoing costs (in dollars) of investing in the Fund and to compare these costs with the ongoing costs of investing in other mutual funds.
The example is based on an investment of $1,000 invested on May 1, 2016, at the beginning of the period, and held through the six-month period ended October 31, 2016. The example is for illustrative purposes only; you should consult the Prospectus for information on initial and subsequent minimum investment requirements.
Actual Expenses
The first line for each share class in the table on the following page provides information about actual account values and actual expenses. You may use the information on this line, together with the amount you invested, to estimate the expenses that you paid over the period. Simply divide your account value by $1,000 (for example, an $8,600 account value ÷ $1,000 = 8.6), then multiply the result by the number on the first line under the heading “Expenses Paid During the Six-Month Period” to estimate the expenses you paid on your account during this period.
Hypothetical Example for Comparison Purposes
The second line for each share class in the table on the following page provides information about hypothetical account values and hypothetical expenses based on the Fund’s actual expense ratio and an assumed rate of return of 5% per year before expenses, which is not the Fund’s actual return. The hypothetical account values and expenses may not be used to estimate the actual ending account balance or expenses you paid for the period. You may use this information to compare the ongoing costs of investing in the Fund and other funds. To do so, compare this 5% hypothetical example with the 5% hypothetical examples that appear in the shareholder reports of the other funds.
The Fund’s transfer agent may charge additional fees to holders of certain accounts that are not included in the expenses shown in the table on the following page. These fees apply to individual retirement accounts (IRAs) and Section 403(b) accounts. As of the close of the six-month period covered by the table, IRA fees included an annual maintenance fee of $15 per account (subject to a maximum annual maintenance fee of $25 for all accounts held by the same shareholder). Section 403(b) accounts are charged an annual $25 fiduciary maintenance fee. Some of the fees may vary in amount, or may be waived, based on your total account balance or the number of Prudential Investments funds, including the Fund, that you own. You should consider the additional fees that were charged to your Fund account over the six-month period when you estimate the total ongoing expenses
| | |
| 12 | | Visit our website at prudentialfunds.com |
paid over the period and the impact of these fees on your ending account value, as these additional expenses are not reflected in the information provided in the expense table. Additional fees have the effect of reducing investment returns.
Please note that the expenses shown in the table are meant to highlight your ongoing costs only and do not reflect any transactional costs such as sales charges (loads). Therefore, the second line for each share class in the table is useful in comparing ongoing costs only and will not help you determine the relative total costs of owning different funds. In addition, if these transactional costs were included, your costs would have been higher.
| | | | | | | | | | | | | | | | | | |
Prudential
Jennison Emerging
Markets Equity Fund | | Beginning Account
Value
May 1, 2016 | | | Ending Account
Value
October 31, 2016 | | | Annualized
Expense Ratio
Based on the
Six-Month Period | | | Expenses Paid
During the
Six-Month Period* | |
| Class A | | Actual | | $ | 1,000.00 | | | $ | 1,092.40 | | | | 1.45 | % | | $ | 7.63 | |
| | Hypothetical | | $ | 1,000.00 | | | $ | 1,017.85 | | | | 1.45 | % | | $ | 7.35 | |
| Class C | | Actual | | $ | 1,000.00 | | | $ | 1,088.80 | | | | 2.20 | % | | $ | 11.55 | |
| | Hypothetical | | $ | 1,000.00 | | | $ | 1,014.08 | | | | 2.20 | % | | $ | 11.14 | |
| Class Q | | Actual | | $ | 1,000.00 | | | $ | 1,094.40 | | | | 1.20 | % | | $ | 6.32 | |
| | Hypothetical | | $ | 1,000.00 | | | $ | 1,019.10 | | | | 1.20 | % | | $ | 6.09 | |
| Class Z | | Actual | | $ | 1,000.00 | | | $ | 1,094.40 | | | | 1.20 | % | | $ | 6.32 | |
| | | Hypothetical | | $ | 1,000.00 | | | $ | 1,019.10 | | | | 1.20 | % | | $ | 6.09 | |
*Fund expenses (net of fee waivers or subsidies, if any) for each share class are equal to the annualized expense ratio for each share class (provided in the table), multiplied by the average account value over the period, multiplied by the 184 days in the six-month period ended October 31, 2016, and divided by the 366 days in the Fund’s fiscal year ended October 31, 2016 (to reflect the six-month period). Expenses presented in the table include the expenses of any underlying portfolios in which the Fund may invest.
The Fund’s annual expense ratios for the 12-month period ended October 31, 2016, are as follows:
| | | | |
| Class | | Gross Operating Expenses (%) | | Net Operating Expenses (%) |
| A | | 3.87 | | 1.45 |
| C | | 4.62 | | 2.20 |
| Q | | 3.13 | | 1.20 |
| Z | | 3.55 | | 1.20 |
Net operating expenses shown above reflect any fee waivers and/or expense reimbursements. Additional information on Fund expenses and any fee waivers and/or expense reimbursements can be found in the “Financial Highlights” tables in this report and in the Notes to the Financial Statements in this report.
| | | | |
| Prudential Jennison Emerging Markets Equity Fund | | | 13 | |
Portfolio of Investments
as of October 31, 2016
| | | | | | | | |
| Description | | Shares | | | Value (Note 1) | |
LONG-TERM INVESTMENTS 96.1% | | | | | | | | |
| | |
COMMON STOCKS 82.0% | | | | | | | | |
| | |
Argentina 5.2% | | | | | | | | |
MercadoLibre, Inc. | | | 3,493 | | | $ | 586,859 | |
| | |
Brazil 9.2% | | | | | | | | |
BM&FBovespa SA - Bolsa de Valores Mercadorias e Futuros | | | 36,677 | | | | 215,443 | |
Cia de Saneamento Basico do Estado de Sao Paulo | | | 25,118 | | | | 265,187 | |
Lojas Renner SA | | | 26,122 | | | | 220,875 | |
Raia Drogasil SA | | | 14,719 | | | | 327,626 | |
| | | | | | | | |
| | | | | | | 1,029,131 | |
| | |
Chile 2.8% | | | | | | | | |
Sociedad Quimica Y Minera de Chile SA, ADR | | | 10,523 | | | | 307,903 | |
| | |
China 24.5% | | | | | | | | |
58.Com, Inc., ADR*(a) | | | 6,034 | | | | 252,523 | |
Alibaba Group Holding Ltd., ADR*(a) | | | 5,317 | | | | 540,686 | |
Baidu, Inc., ADR* | | | 1,597 | | | | 282,445 | |
China Biologic Products, Inc.* | | | 1,665 | | | | 196,653 | |
Ctrip.com International Ltd., ADR*(a) | | | 10,227 | | | | 451,522 | |
JD.com, Inc., ADR*(a) | | | 10,510 | | | | 272,734 | |
Tencent Holdings Ltd. | | | 28,040 | | | | 743,126 | |
| | | | | | | | |
| | | | | | | 2,739,689 | |
| | |
Hong Kong 2.6% | | | | | | | | |
Sands China Ltd. | | | 65,672 | | | | 285,001 | |
| | |
India 1.8% | | | | | | | | |
HDFC Bank Ltd., ADR | | | 2,903 | | | | 205,474 | |
| | |
Indonesia 8.1% | | | | | | | | |
Astra International Tbk PT | | | 518,201 | | | | 326,937 | |
Matahari Department Store Tbk PT | | | 188,392 | | | | 259,804 | |
Mitra Keluarga Karyasehat Tbk PT | | | 672,510 | | | | 143,268 | |
Waskita Karya Persero Tbk PT | | | 867,664 | | | | 174,157 | |
| | | | | | | | |
| | | | | | | 904,166 | |
| | |
Malaysia 1.6% | | | | | | | | |
IHH Healthcare Bhd | | | 118,829 | | | | 181,231 | |
| | |
Mexico 3.8% | | | | | | | | |
Alsea SAB de CV | | | 56,349 | | | | 210,239 | |
Grupo Aeroportuario Del Centro Norte SAB de CV | | | 37,157 | | | | 216,836 | |
| | | | | | | | |
| | | | | | | 427,075 | |
See Notes to Financial Statements.
| | | | |
| Prudential Jennison Emerging Markets Equity Fund | | | 15 | |
Portfolio of Investments (continued)
as of October 31, 2016
| | | | | | | | |
| Description | | Shares | | | Value (Note 1) | |
COMMON STOCKS (Continued) | | | | | | | | |
| | |
Philippines 3.3% | | | | | | | | |
Ayala Land, Inc. | | | 213,910 | | | $ | 160,003 | |
Universal Robina Corp. | | | 56,327 | | | | 211,665 | |
| | | | | | | | |
| | | | | | | 371,668 | |
| | |
South Korea 2.8% | | | | | | | | |
Medy-Tox, Inc. | | | 493 | | | | 174,915 | |
Osstem Implant Co. Ltd.* | | | 2,886 | | | | 137,300 | |
| | | | | | | | |
| | | | | | | 312,215 | |
| | |
Taiwan 4.3% | | | | | | | | |
Hota Industrial Manufacturing Co. Ltd. | | | 30,000 | | | | 125,373 | |
Largan Precision Co. Ltd. | | | 2,000 | | | | 235,951 | |
Tung Thih Electronic Co. Ltd. | | | 8,000 | | | | 116,722 | |
| | | | | | | | |
| | | | | | | 478,046 | |
| | |
Thailand 8.6% | | | | | | | | |
Airports of Thailand PCL | | | 11,797 | | | | 128,428 | |
Bangkok Dusit Medical Services PCL | | | 272,797 | | | | 177,686 | |
CP ALL PCL | | | 159,216 | | | | 276,373 | |
Group Lease PCL, ADR | | | 139,752 | | | | 183,439 | |
Group Lease PCL | | | 150,936 | | | | 198,387 | |
| | | | | | | | |
| | | | | | | 964,313 | |
| | |
Turkey 3.4% | | | | | | | | |
Tofas Turk Otomobil Fabrikasi A/S | | | 33,044 | | | | 249,001 | |
Ulker Biskuvi Sanayi A/S | | | 21,890 | | | | 135,925 | |
| | | | | | | | |
| | | | | | | 384,926 | |
| | | | | | | | |
TOTAL COMMON STOCKS
(cost $7,809,331) | | | | | | | 9,177,697 | |
| | | | | | | | |
| | |
| | | Units | | | | |
| | |
PARTICIPATORY NOTES† 12.5% | | | | | | | | |
| | |
India | | | | | | | | |
Ashok Leyland Ltd., expiring 10/29/17 144A | | | 166,555 | | | | 227,824 | |
Asian Paints Ltd., expiring 05/31/18 144A | | | 12,586 | | | | 202,737 | |
Biocon Ltd., expiring 06/08/21 144A | | | 13,981 | | | | 193,973 | |
Eicher Motors Ltd., expiring 08/27/18 144A | | | 590 | | | | 212,180 | |
Godrej Consumer Products Ltd., expiring 09/11/20 144A | | | 6,404 | | | | 153,759 | |
Lupin Ltd., expiring 10/29/17 144A | | | 4,496 | | | | 102,209 | |
Maruti Suzuki India Ltd., expiring 12/08/20 144A | | | 3,441 | | | | 303,800 | |
| | | | | | | | |
TOTAL PARTICIPATORY NOTES
(cost $1,179,244) | | | | | | | 1,396,482 | |
| | | | | | | | |
See Notes to Financial Statements.
| | | | | | | | |
| Description | | Shares | | | Value (Note 1) | |
PREFERRED STOCK 1.5% | | | | | | | | |
| | |
Brazil | | | | | | | | |
Itau Unibanco Holding SA (PRFC)
(cost $169,257) | | | 14,647 | | | $ | 176,572 | |
| | | | | | | | |
| | |
| | | Units | | | | |
| | |
WARRANTS* 0.1% | | | | | | | | |
| | |
Thailand | | | | | | | | |
Group Lease PCL, expiring 07/31/18
(cost $0) | | | 14,459 | | | | 6,239 | |
| | | | | | | | |
TOTAL LONG-TERM INVESTMENTS
(cost $9,157,832) | | | | | | | 10,756,990 | |
| | | | | | | | |
| | |
| | | Shares | | | | |
| | |
SHORT-TERM INVESTMENTS 19.0% | | | | | | | | |
| | |
AFFILIATED MUTUAL FUNDS | | | | | | | | |
Prudential Investment Portfolios 2 - Prudential Core Ultra Short Bond Fund(b) | | | 567,613 | | | | 567,613 | |
Prudential Investment Portfolios 2 - Prudential Institutional Money
Market Fund
(cost $1,558,815; includes $1,558,090 of cash collateral for securities on loan)(b)(c) | | | 1,558,656 | | | | 1,558,968 | |
| | | | | | | | |
TOTAL SHORT-TERM INVESTMENTS
(cost $2,126,428) (Note 3) | | | | | | | 2,126,581 | |
| | | | | | | | |
TOTAL INVESTMENTS 115.1%
(cost $11,284,260) (Note 5) | | | | | | $ | 12,883,571 | |
Liabilities in excess of other assets (15.1)% | | | | | | | (1,693,459 | ) |
| | | | | | | | |
NET ASSETS 100.0% | | | | | | $ | 11,190,112 | |
| | | | | | | | |
The following abbreviations are used in the annual report:
144A—Security was purchased pursuant to Rule 144A under the Securities Act of 1933 and may not be resold subject to that rule except to qualified institutional buyers. Unless otherwise noted, 144A securities are deemed to be liquid.
ADR—American Depositary Receipt
PRFC—Preference Shares
| † | Participatory notes represented 12.5% of net assets, of which the Series attributed 3.7% to Bank of America, 1.4% to Deutsche Bank AG, 3.0% to Goldman Sachs & Co., and 4.4% to JPMorgan Chase as counterparties to the securities. |
| * | Non-income producing security. |
| (a) | All or a portion of security is on loan. The aggregate market value of such securities, including those sold and pending settlement, is $1,524,325; cash collateral of $1,558,090 (included in liabilities) was received with which the Series purchased highly liquid short-term investments. Securities on loan are subject to contractual netting arrangements. |
| (b) | Prudential Investments LLC, the manager of the Series, also serves as manager of the Prudential Investment Portfolios 2 - Prudential Core Ultra Short Bond Fund and the Prudential Investment Portfolios 2 - Prudential Institutional Money Market Fund. |
| (c) | Represents security purchased with cash collateral received for securities on loan and includes dividend reinvestment. |
See Notes to Financial Statements.
| | | | |
| Prudential Jennison Emerging Markets Equity Fund | | | 17 | |
Portfolio of Investments (continued)
as of October 31, 2016
Various inputs are used in determining the value of the Series’ investments. These inputs are summarized in the three broad levels listed below.
Level 1—quoted prices generally in active markets for identical securities.
Level 2—quoted prices for similar securities, interest rates and yield curves, prepayment speeds, foreign currency exchange rates and other observable inputs.
Level 3—unobservable inputs for securities valued in accordance with Board approved fair valuation procedures.
The following is a summary of the inputs used as of October 31, 2016 in valuing such portfolio securities:
| | | | | | | | | | | | |
| | | Level 1 | | | Level 2 | | | Level 3 | |
Investments in Securities | | | | | | | | | | | | |
Common Stocks | | | | | | | | | | | | |
Argentina | | $ | 586,859 | | | $ | — | | | $ | — | |
Brazil | | | 1,029,131 | | | | — | | | | — | |
Chile | | | 307,903 | | | | — | | | | — | |
China | | | 1,996,563 | | | | 743,126 | | | | — | |
Hong Kong | | | — | | | | 285,001 | | | | — | |
India | | | 205,474 | | | | — | | | | — | |
Indonesia | | | — | | | | 904,166 | | | | — | |
Malaysia | | | — | | | | 181,231 | | | | — | |
Mexico | | | 427,075 | | | | — | | | | — | |
Philippines | | | — | | | | 371,668 | | | | — | |
South Korea | | | — | | | | 312,215 | | | | — | |
Taiwan | | | — | | | | 478,046 | | | | — | |
Thailand | | | 603,188 | | | | 361,125 | | | | — | |
Turkey | | | — | | | | 384,926 | | | | — | |
Participatory Notes | | | | | | | | | | | | |
India | | | — | | | | 1,396,482 | | | | — | |
Preferred Stock | | | | | | | | | | | | |
Brazil | | | 176,572 | | | | — | | | | — | |
Warrants | | | | | | | | | | | | |
Thailand | | | 6,239 | | | | — | | | | — | |
Affiliated Mutual Funds | | | 2,126,581 | | | | — | | | | — | |
| | | | | | | | | | | | |
Total | | $ | 7,465,585 | | | $ | 5,417,986 | | | $ | — | |
| | | | | | | | | | | | |
During the period, there were no transfers between Level 1 and Level 2 to report.
See Notes to Financial Statements.
The industry classification of investments and liabilities in excess of other assets shown as a percentage of net assets as of October 31, 2016 were as follows (unaudited):
| | | | |
Internet Software & Services | | | 21.5 | % |
Affiliated Mutual Funds (including 13.9% of collateral for securities on loan) | | | 19.0 | |
Automobiles | | | 7.8 | |
Internet & Catalog Retail | | | 6.5 | |
Food & Staples Retailing | | | 5.4 | |
Biotechnology | | | 5.1 | |
Chemicals | | | 4.6 | |
Health Care Providers & Services | | | 4.5 | |
Hotels, Restaurants & Leisure | | | 4.4 | |
Multiline Retail | | | 4.3 | |
Machinery | | | 3.9 | |
Consumer Finance | | | 3.5 | |
Banks | | | 3.4 | |
Food Products | | | 3.1 | |
Transportation Infrastructure | | | 3.1 | |
Water Utilities | | | 2.4 | % |
Auto Components | | | 2.2 | |
Electronic Equipment, Instruments & Components | | | 2.1 | |
Diversified Financial Services | | | 1.9 | |
Construction & Engineering | | | 1.5 | |
Real Estate Management & Development | | | 1.4 | |
Personal Products | | | 1.4 | |
Health Care Equipment & Supplies | | | 1.2 | |
Pharmaceuticals | | | 0.9 | |
| | | | |
| | | 115.1 | |
Liabilities in excess of other assets | | | (15.1 | ) |
| | | | |
| | | 100.0 | % |
| | | | |
The Series invested in derivative instruments during the reporting period. The primary type of risk associated with these derivative instruments is equity risk. The effect of such derivative instruments on the Series’s financial position and financial performance as reflected in the Statement of Assets and Liabilities and Statement of Operations is presented in the summary below.
Fair values of derivative instruments as of October 31, 2016 as presented in the Statement of Assets and Liabilities:
| | | | | | | | | | | | |
Derivatives not accounted for
as hedging instruments,
carried at fair value | | Asset Derivatives | | | Liability Derivatives | |
| | Balance Sheet
Location | | Fair
Value | | | Balance Sheet
Location | | Fair
Value | |
| Equity contracts | | Unaffiliated investments | | $ | 6,239 | | | — | | $ | — | |
| | | | | | | | | | | | |
See Notes to Financial Statements.
| | | | |
| Prudential Jennison Emerging Markets Equity Fund | | | 19 | |
Portfolio of Investments (continued)
as of October 31, 2016
The effects of derivative instruments on the Statement of Operations for the year ended October 31, 2016 are as follows:
For the year ended October 31, 2016, the Series did not have any realized gain (loss) on derivatives recognized in income.
| | | | |
Change in Unrealized Appreciation or (Depreciation) on Derivatives Recognized in Income | |
Derivatives not accounted for as hedging
instruments, carried at fair value | | Warrants(1) | |
Equity contracts | | $ | 6,239 | |
| | | | |
| (1) | Included in net change in unrealized appreciation (depreciation) on investments in the Statement of Operations. |
See Notes to Financial Statements.
This Page Intentionally Left Blank
Statement of Assets & Liabilities
as of October 31, 2016
| | | | |
Assets | | | | |
Investments at value, including securities on loan of $1,524,325: | | | | |
Unaffiliated investments (cost $9,157,832) | | $ | 10,756,990 | |
Affiliated investments (cost $2,126,428) | | | 2,126,581 | |
Due from Manager | | | 8,530 | |
Dividends and interest receivable | | | 3,283 | |
Receivable for Series shares sold | | | 726 | |
Prepaid expenses | | | 816 | |
| | | | |
Total assets | | | 12,896,926 | |
| | | | |
| |
Liabilities | | | | |
Payable to broker for collateral for securities on loan | | | 1,558,090 | |
Payable for investments purchased | | | 118,816 | |
Accrued expenses and other liabilities | | | 28,750 | |
Distribution fee payable | | | 806 | |
Affiliated transfer agent fee payable | | | 352 | |
| | | | |
Total liabilities | | | 1,706,814 | |
| | | | |
| |
Net Assets | | $ | 11,190,112 | |
| | | | |
| | | | | |
Net assets were comprised of: | | | | |
Common stock, at par | | $ | 11,937 | |
Paid-in capital in excess of par | | | 11,722,473 | |
| | | | |
| | | 11,734,410 | |
Accumulated net investment loss | | | (18,489 | ) |
Accumulated net realized loss on investment and foreign currency transactions | | | (2,125,235 | ) |
Net unrealized appreciation on investments and foreign currencies | | | 1,599,426 | |
| | | | |
Net assets, October 31, 2016 | | $ | 11,190,112 | |
| | | | |
See Notes to Financial Statements.
| | | | |
Class A | | | | |
Net asset value and redemption price per share,
($869,001 ÷ 92,998 shares of common stock issued and outstanding) | | $ | 9.34 | |
Maximum sales charge (5.50% of offering price) | | | 0.54 | |
| | | | |
Maximum offering price to public | | $ | 9.88 | |
| | | | |
| |
Class C | | | | |
Net asset value, offering price and redemption price per share,
($733,768 ÷ 79,739 shares of common stock issued and outstanding) | | $ | 9.20 | |
| | | | |
| |
Class Q | | | | |
Net asset value, offering price and redemption price per share,
($9,404,467 ÷ 1,001,515 shares of common stock issued and outstanding) | | $ | 9.39 | |
| | | | |
| |
Class Z | | | | |
Net asset value, offering price and redemption price per share,
($182,876 ÷ 19,482 shares of common stock issued and outstanding) | | $ | 9.39 | |
| | | | |
See Notes to Financial Statements.
| | | | |
| Prudential Jennison Emerging Markets Equity Fund | | | 23 | |
Statement of Operations
Year Ended October 31, 2016
| | | | |
Net Investment Income (Loss) | | | | |
Income | | | | |
Unaffiliated dividend income (net of foreign withholding taxes of $11,335) | | $ | 86,312 | |
Income from securities lending, net (including affiliated income of $421) | | | 4,016 | |
Affiliated dividend income | | | 1,419 | |
| | | | |
Total income | | | 91,747 | |
| | | | |
| |
Expenses | | | | |
Management fee | | | 105,249 | |
Distribution fee—Class A | | | 1,584 | |
Distribution fee—Class C | | | 6,719 | |
Custodian and accounting fees | | | 59,000 | |
Registration fees | | | 57,000 | |
Audit fee | | | 30,000 | |
Shareholders’ reports | | | 21,000 | |
Legal fees and expenses | | | 15,000 | |
Directors’ fees | | | 9,000 | |
Transfer agent’s fees and expenses (including affiliated expense of $1,900) | | | 6,000 | |
Insurance expenses | | | 1,000 | |
Miscellaneous | | | 16,105 | |
| | | | |
Total expenses | | | 327,657 | |
Less: Management fee waiver and/or expense reimbursement | | | (199,070 | ) |
Distribution fee waiver—Class A | | | (264 | ) |
| | | | |
Net expenses | | | 128,323 | |
| | | | |
Net investment income (loss) | | | (36,576 | ) |
| | | | |
| |
Realized And Unrealized Gain (Loss) On Investments And Foreign Currency Transactions | | | | |
Net realized gain (loss) on: | | | | |
Investment transactions (including affiliated of $125) | | | (1,045,697 | ) |
Foreign currency transactions | | | (8,547 | ) |
| | | | |
| | | (1,054,244 | ) |
| | | | |
Net change in unrealized appreciation (depreciation) on: | | | | |
Investments (including affiliated of $153) | | | 1,752,017 | |
Foreign currencies | | | 181 | |
| | | | |
| | | 1,752,198 | |
| | | | |
Net gain (loss) on investment and foreign currency transactions | | | 697,954 | |
| | | | |
Net Increase (Decrease) In Net Assets Resulting From Operations | | $ | 661,378 | |
| | | | |
See Notes to Financial Statements.
Statement of Changes in Net Assets
as of October 31, 2016
| | | | | | | | |
| | | Year Ended
October 31, 2016 | | | Year Ended
October 31, 2015 | |
Increase (Decrease) in Net Assets | | | | | | | | |
Operations | | | | | | | | |
Net investment income (loss) | | $ | (36,576 | ) | | $ | (48,688 | ) |
Net realized gain (loss) on investment and foreign currency transactions | | | (1,054,244 | ) | | | (1,035,669 | ) |
Net change in unrealized appreciation (depreciation) on investments and foreign currencies | | | 1,752,198 | | | | (298,727 | ) |
| | | | | | | | |
Net increase (decrease) in net assets resulting from operations | | | 661,378 | | | | (1,383,084 | ) |
| | | | | | | | |
| | |
Dividends from net investment income (Note 1) | | | | | | | | |
Class Q | | | — | | | | (5,005 | ) |
| | | | | | | | |
| | |
Series share transactions (Net of share conversions) (Note 6) | | | | | | | | |
Net proceeds from shares sold | | | 1,120,407 | | | | 955,438 | |
Net asset value of shares issued in reinvestment of dividends | | | — | | | | 5,005 | |
Cost of shares reacquired | | | (464,853 | ) | | | (328,954 | ) |
| | | | | | | | |
Net increase (decrease) in net assets from Series share transactions | | | 655,554 | | | | 631,489 | |
| | | | | | | | |
Total increase (decrease) | | | 1,316,932 | | | | (756,600 | ) |
| | |
Net Assets: | | | | | | | | |
Beginning of year | | | 9,873,180 | | | | 10,629,780 | |
| | | | | | | | |
End of year | | $ | 11,190,112 | | | $ | 9,873,180 | |
| | | | | | | | |
See Notes to Financial Statements.
| | | | |
| Prudential Jennison Emerging Markets Equity Fund | | | 25 | |
Notes to Financial Statements
Prudential World Fund, Inc. (the “Fund”), is an open-end management investment company, registered under the Investment Company Act of 1940, as amended (“1940 Act”). The Fund currently consists of six series: Prudential Jennison Emerging Markets Equity Fund, (the “Series”), Prudential Jennison Global Infrastructure Fund, Prudential QMA International Equity Fund, Prudential Emerging Markets Debt Local Currency Fund, Prudential Jennison Global Opportunities Fund and Prudential Jennison International Opportunities Fund. These financial statements relate to Prudential Jennison Emerging Markets Equity Fund. The financial statements of the other series are not presented herein.
The investment objective of the Series is to seek long-term growth of capital.
Note 1. Accounting Policies
The Series follows investment company accounting and reporting guidance of the Financial Accounting Standards Board (“FASB”) Accounting Standard Codification Topic 946 Financial Services—Investment Companies. The following accounting policies conform to U.S. generally accepted accounting principles. The Series consistently follows such policies in the preparation of their financial statements.
Securities Valuation: The Series holds securities and other assets that are fair valued at the close of each day (generally, 4:00 PM Eastern time) the New York Stock Exchange (“NYSE”) is open for trading. Fair value is the price that would be received to sell an asset or paid to transfer a liability in an orderly transaction between market participants on the measurement date. The Board of Directors (the “Board”) has adopted Valuation Procedures for security valuation under which fair valuation responsibilities have been delegated to Prudential Investments LLC (“PI” or “Manager”). Under the current Valuation Procedures, the established Valuation Committee is responsible for supervising the valuation of portfolio securities and other assets. The Valuation Procedures permit the Series to utilize independent pricing vendor services, quotations from market makers, and alternative valuation methods when market quotations are either not readily available or not deemed representative of fair value. A record of the Valuation Committee’s actions is subject to the Board’s review, approval, and ratification at its next regularly-scheduled quarterly meeting.
Various inputs determine how the Series’ investments are valued, all of which are categorized according to the three broad levels (Level 1, 2, or 3) detailed in the table following the Portfolio of Investments.
Common and preferred stocks, exchange-traded funds, and derivative instruments such as futures or options that are traded on a national securities exchange are valued at the last
sale price as of the close of trading on the applicable exchange where the security principally trades. Securities traded via NASDAQ are valued at the NASDAQ official closing price. To the extent these securities are valued at the last sale price or NASDAQ official closing price, they are classified as Level 1 in the fair value hierarchy.
In the event that no sale or official closing price on valuation date exists, these securities are generally valued at the mean between the last reported bid and ask prices, or at the last bid price in the absence of an ask price. These securities are classified as Level 2 in the fair value hierarchy.
Common and preferred stocks traded on foreign securities exchanges are valued using pricing vendor services that provide model prices derived using adjustment factors based on information such as local closing price, relevant general and sector indices, currency fluctuations, depositary receipts, and futures, as applicable. Securities valued using such model prices are classified as Level 2 in the fair value hierarchy. The models generate an evaluated adjustment factor for each security, which is applied to the local closing price to adjust it for post closing market movements. Utilizing that evaluated adjustment factor, the vendor provides an evaluated price for each security. If the vendor does not provide an evaluated price, securities are valued in accordance with exchange-traded common and preferred stocks discussed above.
Participatory notes (“P-notes”) are generally valued based upon the value of a related underlying security that trades actively in the market and are classified as Level 2 in the fair value hierarchy.
Investments in open-end, non-exchange-traded mutual funds are valued at their net asset values as of the close of the NYSE on the date of valuation. These securities are classified as Level 1 in the fair value hierarchy since they may be purchased or sold at their net asset values on the date of valuation.
Securities and other assets that cannot be priced according to the methods described above are valued based on pricing methodologies approved by the Board. In the event that unobservable inputs are used when determining such valuations, the securities will be classified as Level 3 in the fair value hierarchy.
When determining the fair value of securities, some of the factors influencing the valuation include: the nature of any restrictions on disposition of the securities; assessment of the general liquidity of the securities; the issuer’s financial condition and the markets in which it does business; the cost of the investment; the size of the holding and the capitalization of the issuer; the prices of any recent transactions or bids/offers for such securities or any comparable securities; any available analyst media or other reports or information deemed reliable by the investment adviser regarding the issuer or the markets or industry in which it operates. Using fair value to price securities may result in a value that is different from a security’s most recent closing price and from the price used by other mutual funds to calculate their net asset values.
| | | | |
| Prudential Jennison Emerging Markets Equity Fund | | | 27 | |
Notes to Financial Statements (continued)
Restricted and Illiquid Securities: Subject to guidelines adopted by the Board, the Series may invest up to 15% of its net assets in illiquid securities, including those which are restricted as to disposition under securities law (“restricted securities”). Restricted securities are valued pursuant to the valuation procedures noted above. Illiquid securities are those that, because of the absence of a readily available market or due to legal or contractual restrictions on resale, cannot be sold within seven days in the ordinary course of business at approximately the amount at which the Series has valued the investment. Therefore, the Series may find it difficult to sell illiquid securities at the time considered most advantageous by its Subadviser and may incur expenses that would not be incurred in the sale of securities that were freely marketable. Certain securities that would otherwise be considered illiquid because of legal restrictions on resale to the general public may be traded among qualified institutional buyers under Rule 144A of the Securities Act of 1933. These Rule 144A securities, as well as commercial paper that is sold in private placements under Section 4(2) of the Securities Act, may be deemed liquid by the Series’ Subadviser under the guidelines adopted by the Directors of the Series. However, the liquidity of the Series’ investments in Rule 144A securities could be impaired if trading does not develop or declines.
Foreign Currency Translation: The books and records of the Series are maintained in U.S. dollars. Foreign currency amounts are translated into U.S. dollars on the following basis:
(i) market value of investment securities, other assets and liabilities—at the current rates of exchange;
(ii) Purchases and sales of investment securities, income and expenses—at the rates of exchange prevailing on the respective dates of such transactions.
Although the net assets of the Series are presented at the foreign exchange rates and market values at the close of the period, the Series does not generally isolate that portion of the results of operations arising as a result of changes in the foreign exchange rates from the fluctuations arising from changes in the market prices of long-term portfolio securities held at the end of the period. Similarly, the Series does not isolate the effect of changes in foreign exchange rates from the fluctuations arising from changes in the market prices of long-term portfolio securities sold during the period. Accordingly, holding period realized foreign currency gains (losses) are included in the reported net realized gains (losses) on investment transactions. Notwithstanding the above, the Series does isolate the effect of fluctuations in foreign currency exchange rates when determining the gain (loss) upon the sale or maturity of foreign currency denominated debt obligations: such amounts are included in net realized gain (loss) on foreign currency transactions.
Net realized gains (losses) on foreign currency transactions represent net foreign exchange gains (losses) from the holding of foreign currencies, forward currency contracts disposition
of foreign currencies, currency gains (losses) realized between the trade date and settlement date on securities transactions, and the difference between the amounts of dividends, interest and foreign withholding taxes recorded on the Series’ books and the U.S. dollar equivalent amounts actually received or paid. Net unrealized currency gains (losses) from valuing foreign currency denominated assets and liabilities (other than investments) at period end exchange rates are reflected as a component of net unrealized appreciation (depreciation) on foreign currency transactions.
Master Netting Arrangements: The Series is subject to various Master Agreements, or netting arrangements, with select counterparties. These are agreements which a subadviser may have negotiated and entered into on behalf of the Series. A master netting arrangement between the Series and the counterparty permits the Series to offset amounts payable by the Series to the same counterparty against amounts to be received; and by the receipt of collateral from the counterparty by the Series to cover the Series’s exposure to the counterparty. However, there is no assurance that such mitigating factors are easily enforceable. In addition to master netting arrangements, the right to set-off exists when all the conditions are met such that each of the parties owes the other determinable amounts, the reporting party has the right to set-off the amount owed with the amount owed by the other party, the reporting party intends to set-off and the right of set-off is enforceable by law. During the reporting period, there was no intention to settle on a net basis and all amounts are presented on a gross basis on the Statement of Assets and Liabilities.
Securities Lending: The Series may lend its portfolio securities to banks and broker-dealers. The loans are secured by collateral at least equal to the market value of the securities loaned. Collateral pledged by each borrower is invested in a money market fund and is marked to market daily, based on the previous day’s market value, such that the value of the collateral exceeds the value of the loaned securities. For the period March 31, 2016 through July 18, 2016 the collateral was invested in an ultra-short bond fund. Loans are subject to termination at the option of the borrower or the Series. Upon termination of the loan, the borrower will return to the Series securities identical to the loaned securities. Should the borrower of the securities fail financially, the Series has the right to repurchase the securities in the open market using the collateral. The Series recognizes income, net of any rebate and securities lending agent fees, for lending its securities in the form of fees or interest on the investment of any cash received as collateral. The borrower receives all interest and dividends from the securities loaned and such payments are passed back to the lender in amounts equivalent thereto. The Series also continues to recognize any unrealized gain (loss) in the market price of the securities loaned and on the change in the value of the collateral invested that may occur during the term of the loan. In addition, realized gain (loss) is recognized on changes in the value of the collateral invested that may occur during the term of the loan.
Concentration of Risk: Foreign security and currency transactions may involve certain considerations and risks not typically associated with those of domestic origin as a result of, among other factors, the possibility of political and economic instability or the level of the governmental supervision and regulation of foreign securities markets.
| | | | |
| Prudential Jennison Emerging Markets Equity Fund | | | 29 | |
Notes to Financial Statements (continued)
Securities Transactions and Net Investment Income: Securities transactions are recorded on the trade date. Realized gains (losses) from investment and currency transactions are calculated on the identified cost basis. Dividend income is recorded on the ex-date. Interest income, including amortization of premium and accretion of discount on debt securities, as required, is recorded on an accrual basis. Expenses are recorded on the accrual basis, which may require the use of certain estimates by management that may differ from actual.
Net investment income or loss, (other than distribution fees, which are charged directly to the respective class and transfer agency fees specific to Class Q shares which are charged to that share class) and unrealized and realized gains (losses) are allocated daily to each class of shares based upon the relative proportion of adjusted net assets of each class at the beginning of the day.
Participatory notes/Warrants: The Series may gain exposure to securities in certain foreign markets through investments in P-notes. The Series may purchase P-notes due to restrictions applicable to foreign investors when investing directly in a foreign market. P-notes are generally issued by banks or brokerdealers and are designed to offer a return linked to a particular underlying security. P-notes involve transaction costs, which may be higher than those applicable to the equity securities. An investment in a P-note may involve risks, including counter-party risk, beyond those normally associated with a direct investment in the underlying security. The Series must rely on the creditworthiness of the counterparty and would have no rights against the issuer of the underlying security. Furthermore, the P-note’s performance may differ from that of the underlying security. The holder of a P-note is entitled to receive from the bank or broker-dealer, an amount equal to dividends paid by the issuer of the underlying security; however, the holder is not entitled to the same rights (e.g., dividends, voting rights) as an owner of the underlying security. There is also no assurance that there will be a secondary trading market for a P-note or that the trading price of a P-note will equal the value of the underlying security.
Warrants and Rights: The Series may hold warrants and rights acquired either through a direct purchase, included as part of a private placement, or pursuant to corporate actions. Warrants and rights entitle the holder to buy a proportionate amount of common stock at a specific price and time through the expiration dates. Such warrants and rights are held as long positions by the Series until exercised, sold or expired. Warrants and rights are valued at fair value in accordance with the Board’s approved fair valuation procedures.
Dividends and Distributions: The Series expects to pay dividends of net investment income and distributions of net realized capital gains, if any, annually. Dividends and distributions to shareholders, which are determined in accordance with federal income tax regulations and which may differ from generally accepted accounting principles, are recorded on the
ex-date. Permanent book/tax differences relating to income and gain (loss) are reclassified amongst undistributed net investment income, accumulated net realized gain (loss) and paid in capital in excess of par, as appropriate.
Taxes: For federal income tax purposes, each series in the Fund is treated as a separate taxpaying entity. It is the Series’ policy to continue to meet the requirements of the Internal Revenue Code applicable to regulated investment companies and to distribute all of its taxable net income and capital gains, if any, to shareholders. Therefore, no federal income tax provision is required. Withholding taxes on foreign dividends are recorded, net of reclaimable amounts, at the time the related income is earned.
Estimates: The preparation of the financial statements requires management to make estimates and assumptions that affect the reported amounts and disclosures in the financial statements. Actual results could differ from those estimates.
Note 2. Agreements
The Fund has a management agreement for the Series with Prudential Investments LLC (“PI”). Pursuant to this agreement, PI has responsibility for all investment advisory services and supervises the subadviser’s performance of such services. PI has entered into a subadvisory agreement with Jennison Associates LLC (“Jennison”). The subadvisory agreement provides that Jennison furnishes investment advisory services in connection with the management of the Series. In connection therewith, Jennison is obligated to keep certain books and records of the Series. PI pays for the services of Jennison, the cost of compensation of officers of the Series, occupancy and certain clerical and bookkeeping costs of the Series. The Series bears all other costs and expenses.
The management fee paid to PI is accrued daily and payable monthly, at an annual rate of 1.05% of the Series’ average daily net assets up to $5 billion and 1.025% of the Series’ average daily net assets in excess of $5 billion. For the year ended October 31, 2016, the effective management fee rate before any waivers and/or expense reimbursement was 1.05% and the waivers and/or expense reimbursements exceeded the effective management fee rate.
PI has contractually agreed through February 28, 2018 to limit the net annual operating expenses (exclusive of distribution and service (12b-1) fees, taxes (such as income and foreign withholdings taxes, stamp duty and deferred tax expenses), interest, underlying funds, brokerage, extraordinary and certain other expenses such as dividend, broker charges and interest expense on short sales) of each class of shares of the Fund to 1.20% of the Fund’s average daily net assets. Expenses waived/reimbursed by the Manager in accordance with this agreement may be recouped by the Manager within the same fiscal year during which such waiver/reimbursement is made if such recoupment can be realized without exceeding the expense limit in effect at the time of the recoupment for that fiscal year.
| | | | |
| Prudential Jennison Emerging Markets Equity Fund | | | 31 | |
Notes to Financial Statements (continued)
The Series has a distribution agreement with Prudential Investment Management Services LLC (“PIMS”), which acts as the distributor of the Class A, Class C, Class Q and Class Z shares of the Series. The Series compensates PIMS for distributing and servicing the Series’ Class A and Class C shares pursuant to plans of distribution (the “Distribution Plans”), regardless of expenses actually incurred by PIMS. The distribution fees are accrued daily and payable monthly. No distribution or service fees are paid to PIMS as distributor of the Class Q shares and Class Z shares of the Series.
Pursuant to the Distribution Plans, the Series compensates PIMS for distribution related activities at an annual rate of up to .30% and 1% of the average daily net assets of the Class A and C shares, respectively. PIMS has contractually agreed to limit such fee to .25% of the average daily net assets of the Class A shares through February 28, 2018.
PIMS has advised the Series that it received $13,561 in front-end sales charges resulting from sales of Class A shares, during the year ended October 31, 2016. From these fees, PIMS paid such sales charges to affiliated broker-dealers, which in turn paid commissions to salespersons and incurred other distribution costs.
PIMS has advised the Series that for the year ended October 31, 2016, it has received $95 in contingent deferred sales charges imposed upon redemptions by certain Class C shareholders.
PGIM, Inc., PI, PIMS and Jennison are indirect, wholly-owned subsidiaries of Prudential Financial, Inc. (“Prudential”).
Note 3. Other Transactions with Affiliates
Prudential Mutual Fund Services LLC (“PMFS”), an affiliate of PI and an indirect, whollyowned subsidiary of Prudential, serves as the Series’ transfer agent. The Transfer agent’s fees and expenses in the Statement of Operations also include certain out-of-pocket expenses paid to non-affiliates, where applicable.
Effective July 7, 2016, the Board replaced PGIM, Inc., an indirect wholly-owned subsidiary of Prudential, as securities lending agent with a third party agent. Prior to July 7, 2016, PGIM, Inc. was the Series’ securities lending agent. Net earnings from securities lending are disclosed on the Statement of Operations as “Income from securities lending, net”. Prior to January 4, 2016, PGIM, Inc. was known as Prudential Investment Management, Inc. (“PIM”).
The Series may enter into certain securities purchase or sale transactions under Board approved Rule 17a-7 procedures. Rule 17a-7 is an exemptive rule under the 1940 Act,
that permits purchase and sale transactions among affiliated investment companies, or between an investment company and a person that is affiliated solely by reason of having a common (or affiliated) investment adviser, common directors, and/or common officers. Such transactions are subject to ratification by the Board.
The Series invests its overnight sweep cash in the Prudential Core Ultra Short Bond Fund, (formerly known as Prudential Core Taxable Money Market Fund), (the “Core Fund”), and its securities lending cash collateral in the Prudential Institutional Money Market Fund, (the “Money Market Fund”) each a portfolio of Prudential Investment Portfolios 2, registered under the 1940 Act and managed by PI. Earnings from the Core and the Money Market Funds are disclosed on the Statement of Operations as “Affiliated dividend income” and “Income from securities lending, net”, respectively.
Note 4. Portfolio Securities
The cost of purchases and proceeds from sales of investment securities, other than short term investments, for the year ended October 31, 2016 were $4,822,526 and $4,332,366, respectively.
Note 5. Distributions and Tax Information
Distributions to shareholders, which are determined in accordance with federal income tax regulations, which may differ from generally accepted accounting principles, are recorded on the ex-date. In order to present accumulated net investment loss, accumulated net realized loss on investment and foreign currency transactions and paid-in capital in excess of par on the Statement of Assets and Liabilities that more closely represent their tax character, certain adjustments have been made to accumulated net investment loss, accumulated net realized loss on investment and foreign currency transactions and paid-in capital in excess of par. For the tax year ended October 31, 2016 the adjustments were to decrease accumulated net investment loss by $43,225, decrease accumulated net realized loss on investment and foreign currency transactions by $8,547 and decrease paid-in capital in excess of par by $51,772 due to the differences in the treatment for book and tax purposes of certain transactions involving foreign securities and a net operating loss. Net investment loss, net realized gain (loss) on investment and foreign currencies transactions and net assets were not affected by this change.
For the tax year ended October 31, 2016, there was no distribution paid by the Series. For the tax year ended October 31, 2015, the tax character of dividends paid by the Series was $5,005 of ordinary income.
As of October 31, 2016, the Series had no undistributed earnings on a tax basis.
| | | | |
| Prudential Jennison Emerging Markets Equity Fund | | | 33 | |
Notes to Financial Statements (continued)
The United States federal income tax basis of the Series’ investments and the net unrealized appreciation as of October 31, 2016 were as follows:
| | | | | | | | | | |
Tax Basis | | Appreciation | | Depreciation | | Net
Unrealized
Appreciation | | Other Cost Basis
Adjustment | | Total Net
Unrealized
Appreciation |
| $11,284,260 | | $1,886,236 | | $(286,925) | | $1,599,311 | | $115 | | $1,599,426 |
The other cost basis adjustments are primarily attributable to appreciation (depreciation) of foreign currencies and mark-to-market of receivables and payables.
For federal income tax purposes, the Series had a capital loss carryforward as of October 31, 2016 of approximately $2,125,000 which can be carried forward for an unlimited period. No capital gains distributions are expected to be paid to shareholders until net gains have been realized in excess of such losses.
The Series elected to treat certain late-year ordinary losses of approximately $18,000 as having been incurred in the following fiscal year (October 31, 2017).
Management has analyzed the Series’ tax positions taken on federal, state and local income tax returns for all open tax years and has concluded that no provision for income tax is required in the Series’ financial statements for the current reporting period. The Series’ federal, state and local income and federal excise tax returns for tax years for which the applicable statutes of limitations have not expired are subject to examination by the Internal Revenue Service and state departments of revenue.
Note 6. Capital
The Series offers Class A, Class C, Class Q and Class Z shares. Class A shares are subject to a maximum front-end sales charge of up to 5.50%. All investors who purchase Class A shares in an amount of $1 million or more and sell these shares within 12 months of purchase are subject to a contingent deferred sales charge (“CDSC”) of 1%, including investors who purchase their shares through broker-dealers affiliated with Prudential. The Class A CDSC is waived for purchases by certain retirement or benefit plans. Class C shares are sold with a CDSC of 1% during the first 12 months from the date of purchase. Class Z shares are not subject to any sales or redemption charge and are offered exclusively for sale to a limited group of investors. A special exchange privilege is also available for shareholders who qualify to purchase Class A shares at net asset value.
Under certain circumstances, an exchange may be made from specified share classes of the Series to one or more other share classes of the Series as presented in the table of transactions in shares of common stock.
There are 865 million authorized shares of $.01 par value common stock, divided into four classes, designated Class A, Class C, Class Q and Class Z common stock, each of which consists of 250 million, 65 million, 250 million and 300 million authorized shares, respectively.
As of October 31, 2016, Prudential, through its affiliates, owned 1,000 shares of Class A, 1,000 shares of Class C, 1,001,515 shares of Class Q and 1,000 shares of Class Z. At reporting end, 2 shareholders of record held 90% of the Fund’s outstanding shares on behalf of multiple beneficial owners.
Transactions in shares of common stock were as follows:
| | | | | | | | |
Class A | | Shares | | | Amount | |
Year ended October 31, 2016: | | | | | | | | |
Shares sold | | | 73,952 | | | $ | 650,175 | |
Shares reacquired | | | (13,892 | ) | | | (121,759 | ) |
| | | | | | | | |
Net increase (decrease) in shares outstanding before conversion | | | 60,060 | | | | 528,416 | |
Shares reacquired upon conversion into other class(es) | | | (2,403 | ) | | | (21,648 | ) |
| | | | | | | | |
Net increase (decrease) in shares outstanding | | | 57,657 | | | $ | 506,768 | |
| | | | | | | | |
Year ended October 31, 2015: | | | | | | | | |
Shares sold | | | 62,926 | | | $ | 591,480 | |
Shares reacquired | | | (25,927 | ) | | | (245,166 | ) |
| | | | | | | | |
Net increase (decrease) in shares outstanding before conversion | | | 36,999 | | | | 346,314 | |
Shares reacquired upon conversion into other class(es) | | | (3,444 | ) | | | (28,723 | ) |
| | | | | | | | |
Net increase (decrease) in shares outstanding | | | 33,555 | | | $ | 317,591 | |
| | | | | | | | |
Class C | | | | | | |
Year ended October 31, 2016: | | | | | | | | |
Shares sold | | | 18,264 | | | $ | 163,648 | |
Shares reacquired | | | (14,302 | ) | | | (127,007 | ) |
| | | | | | | | |
Net increase (decrease) in shares outstanding | | | 3,962 | | | $ | 36,641 | |
| | | | | | | | |
Year ended October 31, 2015: | | | | | | | | |
Shares sold | | | 31,697 | | | $ | 309,514 | |
Shares reacquired | | | (5,597 | ) | | | (50,302 | ) |
| | | | | | | | |
Net increase (decrease) in shares outstanding | | | 26,100 | | | $ | 259,212 | |
| | | | | | | | |
Class Q | | | | | | |
Year ended October 31, 2016: | | | | | | | | |
Shares sold | | | — | | | | — | |
Shares reacquired | | | — | | | | — | |
| | | | | | | | |
Net increase (decrease) in shares outstanding | | | — | | | | — | |
| | | | | | | | |
Year ended October 31, 2015: | | | | | | | | |
Shares sold | | | 515 | | | $ | 5,005 | |
| | | | | | | | |
Net increase (decrease) in shares outstanding | | | 515 | | | $ | 5,005 | |
| | | | | | | | |
| | | | |
| Prudential Jennison Emerging Markets Equity Fund | | | 35 | |
Notes to Financial Statements (continued)
| | | | | | | | |
Class Z | | Shares | | | Amount | |
Year ended October 31, 2016: | | | | | | | | |
Shares sold | | | 34,206 | | | $ | 306,584 | |
Shares reacquired | | | (23,906 | ) | | | (216,087 | ) |
| | | | | | | | |
Net increase (decrease) in shares outstanding before conversion | | | 10,300 | | | | 90,497 | |
Shares issued upon conversion into other class(es) | | | 2,400 | | | | 21,648 | |
| | | | | | | | |
Net increase (decrease) in shares outstanding | | | 12,700 | | | $ | 112,145 | |
| | | | | | | | |
Year ended October 31, 2015: | | | | | | | | |
Shares sold | | | 6,334 | | | $ | 54,444 | |
Shares reacquired | | | (3,988 | ) | | | (33,486 | ) |
| | | | | | | | |
Net increase (decrease) in shares outstanding | | | 2,346 | | | | 20,958 | |
Shares issued upon conversion from other share class(es) | | | 3,436 | | | | 28,723 | |
| | | | | | | | |
Net Increase (decrease) in shares outstanding | | | 5,782 | | | $ | 49,681 | |
| | | | | | | | |
Note 7. Borrowings
The Series, along with other affiliated registered investment companies (the “Funds”), is a party to a Syndicated Credit Agreement (“SCA”) with a group of banks. The purpose of the SCA is to provide an alternative source of temporary funding for capital share redemptions. The SCA provides for a commitment of $900 million for the period October 6, 2016 through October 5, 2017. The Funds pay an annualized commitment fee of .15% of the unused portion of the SCA. The interest rate on borrowings under the SCA is paid monthly and at a per annum rate based upon the higher of 0.0%, the effective federal funds rate, or the One-Month LIBOR rate, plus a contractual spread. Prior to October 6, 2016, the Funds had another SCA that provided a commitment of $900 million and the Funds paid an annualized commitment fee of .11% of the unused portion of the SCA. The interest rate on borrowings was substantially the same. The Fund’s portion of the commitment fee for the unused amount is accrued daily and paid quarterly.
The Series did not utilize the SCA during the year ended October 31, 2016.
Note 8. Recent Accounting Pronouncements and Reporting Updates
In January 2016, the FASB issued Accounting Standards Update (“ASU”) No. 2016-01 regarding “Recognition and Measurement of Financial Assets and Financial Liabilities”. The new guidance is intended to enhance the reporting model for financial instruments to provide users of financial statements with more decision-useful information and addresses certain aspects of the recognition, measurement, presentation, and disclosure of financial instruments. The new standard affects all entities that hold financial assets or owe financial liabilities. The new guidance is effective for public companies for fiscal years beginning after December 15, 2017, including interim periods within those fiscal years. At this time,
management is evaluating the implications of ASU No. 2016-01 and its impact on the financial statements and disclosures has not yet been determined.
On October 13, 2016, the Securities and Exchange Commission (the “SEC”) adopted new rules and forms and amended existing rules and forms which are intended to modernize and enhance the reporting and disclosure of information by registered investment companies and to improve the quality of information that funds provide to investors, including modifications to Regulation S-X which would require standardized, enhanced disclosure about derivatives in investment company financial statements. In an effort to enhance monitoring and regulation, the new rules and forms will allow the SEC to more effectively collect and use data reported by funds. The new rules also enhance disclosure regarding fund liquidity and redemption practices. Also under the new rules, the SEC will permit open-end funds, with the exception of money market funds, to offer swing pricing, subject to board approval and review. The compliance dates of the modifications to Regulation S-X are August 1, 2017 and other amendments and rules are generally June 1, 2018 and December 1, 2018. Management is currently evaluating the impacts to the financial statement disclosures, if any.
| | | | |
| Prudential Jennison Emerging Markets Equity Fund | | | 37 | |
Financial Highlights
| | | | | | | | | | | | | | | | |
| Class A Shares | |
| | | Year Ended
October 31, | | | | | | September 16,
2014(b)
through
October 31, | |
| | | 2016 | | | 2015 | | | | | | 2014 | |
| Per Share Operating Performance(c): | | | | | | | | | | | | | | | | |
| Net Asset Value, Beginning of Period | | | $8.81 | | | | $10.09 | | | | | | | | $10.00 | |
| Income (loss) from investment operations: | | | | | | | | | | | | | | | | |
| Net investment income (loss) | | | (.04 | ) | | | (.04 | ) | | | | | | | (.01 | ) |
| Net realized and unrealized gain (loss) on investments | | | .57 | | | | (1.24 | ) | | | | | | | .10 | |
| Total from investment operations | | | .53 | | | | (1.28 | ) | | | | | | | .09 | |
| Net asset value, end of period | | | $9.34 | | | | $8.81 | | | | | | | | $10.09 | |
| Total Return(a) | | | 6.02% | | | | (12.69)% | | | | | | | | .90% | |
| | | | | | | | | | | | | | | | |
| Ratios/Supplemental Data: | |
| Net assets, end of period (000) | | | $869 | | | | $311 | | | | | | | | $18 | |
| Average net assets (000) | | | $528 | | | | $208 | | | | | | | | $15 | |
| Ratios to average net assets(d): | | | | | | | | | | | | | | | | |
| Expenses after waiver and/or expense reimbursement | | | 1.45% | | | | 1.54% | | | | | | | | 1.55% | (e) |
| Expenses before waiver and/or expense reimbursement | | | 3.87% | | | | 3.40% | | | | | | | | 14.06% | (e) |
| Net investment loss | | | (.49)% | | | | (.48)% | | | | | | | | (.93)% | (e) |
| Portfolio turnover rate | | | 44% | | | | 67% | | | | | | | | 15% | (f) |
| (a) | Total return does not consider the effect of sales load. Total return is calculated assuming a purchase of a share on the first day and a sale on the last day of each period reported and includes reinvestment of dividends and distributions, if any. Total return may reflect adjustments to conform to generally accepted accounting principles. Total returns for periods less than one full year are not annualized. |
| (b) | Commencement of operations |
| (c) | Calculated based on average shares outstanding during the period. |
| (d) | Does not include expenses of the underlying portfolios in which the Series invests. |
See Notes to Financial Statements.
| | | | | | | | | | | | | | | | |
| Class C Shares | |
| | | Year Ended
October 31, | | | | | | September 16,
2014(b)
through
October 31, | |
| | | 2016 | | | 2015 | | | | | | 2014 | |
| Per Share Operating Performance(c): | | | | | | | | | | | | | | | | |
| Net Asset Value, Beginning of Period | | | $8.74 | | | | $10.08 | | | | | | | | $10.00 | |
| Income (loss) from investment operations: | | | | | | | | | | | | | | | | |
| Net investment income (loss) | | | (.11 | ) | | | (.13 | ) | | | | | | | (.02 | ) |
| Net realized and unrealized gain (loss) on investments | | | .57 | | | | (1.21 | ) | | | | | | | .10 | |
| Total from investment operations | | | .46 | | | | (1.34 | ) | | | | | | | .08 | |
| Net asset value, end of period | | | $9.20 | | | | $8.74 | | | | | | | | $10.08 | |
| Total Return(a) | | | 5.26% | | | | (13.29)% | | | | | | | | .80% | |
| | | | | | | | | | | | | | | | |
| Ratios/Supplemental Data: | |
| Net assets, end of period (000) | | | $734 | | | | $662 | | | | | | | | $501 | |
| Average net assets (000) | | | $672 | | | | $699 | | | | | | | | $296 | |
| Ratios to average net assets(d): | | | | | | | | | | | | | | | | |
| Expenses after waiver and/or expense reimbursement | | | 2.20% | | | | 2.29% | | | | | | | | 2.30% | (e) |
| Expenses before waiver and/or expense reimbursement | | | 4.62% | | | | 4.12% | | | | | | | | 15.19% | (e) |
| Net investment loss | | | (1.29)% | | | | (1.36)% | | | | | | | | (1.79)% | (e) |
| Portfolio turnover rate | | | 44% | | | | 67% | | | | | | | | 15% | (f) |
| (a) | Total return does not consider the effect of sales load. Total return is calculated assuming a purchase of a share on the first day and a sale on the last day of each period reported and includes reinvestment of dividends and distributions, if any. Total return may reflect adjustments to conform to generally accepted accounting principles. Total returns for periods less than one full year are not annualized. |
| (b) | Commencement of operations |
| (c) | Calculated based on average shares outstanding during the period. |
| (d) | Does not include expenses of the underlying portfolio in which the Series invests. |
See Notes to Financial Statements.
| | | | |
| Prudential Jennison Emerging Markets Equity Fund | | | 39 | |
Financial Highlights (continued)
| | | | | | | | | | | | | | | | |
| Class Q Shares | |
| | | Year Ended
October 31, | | | | | | September 16,
2014(b)
through
October 31, | |
| | | 2016 | | | 2015 | | | | | | 2014 | |
| Per Share Operating Performance(c): | | | | | | | | | | | | | | | | |
| Net Asset Value, Beginning of Period | | | $8.83 | | | | $10.09 | | | | | | | | $10.00 | |
| Income (loss) from investment operations: | | | | | | | | | | | | | | | | |
| Net investment income (loss) | | | (.03 | ) | | | (.04 | ) | | | | | | | (.01 | ) |
| Net realized and unrealized gain (loss) on investments | | | .59 | | | | (1.21 | ) | | | | | | | .10 | |
| Total from investment operations | | | .56 | | | | (1.25 | ) | | | | | | | .09 | |
| Less Dividends: | | | | | | | | | | | | | | | | |
| Dividends from net investment income | | | - | | | | (.01 | ) | | | | | | | - | |
| Net asset value, end of period | | | $9.39 | | | | $8.83 | | | | | | | | $10.09 | |
| Total Return(a) | | | 6.34% | | | | (12.44)% | | | | | | | | .90% | |
| | | | | | | | | | | | | | | | |
| Ratios/Supplemental Data: | |
| Net assets, end of period (000) | | | $9,404 | | | | $8,840 | | | | | | | | $10,101 | |
| Average net assets (000) | | | $8,722 | | | | $9,518 | | | | | | | | $9,785 | |
| Ratios to average net assets(d): | | | | | | | | | | | | | | | | |
| Expenses after waiver and/or expense reimbursement | | | 1.20% | | | | 1.29% | | | | | | | | 1.30% | (e) |
| Expenses before waiver and/or expense reimbursement | | | 3.13% | | | | 2.91% | | | | | | | | 13.37% | (e) |
| Net investment loss | | | (.29)% | | | | (.40)% | | | | | | | | (.68)% | (e) |
| Portfolio turnover rate | | | 44% | | | | 67% | | | | | | | | 15% | (f) |
| (a) | Total return is calculated assuming a purchase of a share on the first day and a sale on the last day of each period reported and includes reinvestment of dividends and distributions, if any. Total investment return may reflect adjustments to conform to generally accepted accounting principles. Total returns for periods less than one full year are not annualized. |
| (b) | Commencement of operations |
| (c) | Calculated based on average shares outstanding during the period. |
| (d) | Does not include expenses of the underlying portfolios in which the Series invests. |
See Notes to Financial Statements.
| | | | | | | | | | | | | | | | |
| Class Z Shares | |
| | | Year Ended
October 31, | | | | | | September 16,
2014(b)
through
October 31, | |
| | | 2016 | | | 2015 | | | | | | 2014 | |
| Per Share Operating Performance(c): | | | | | | | | | | | | | | | | |
| Net Asset Value, Beginning of Period | | | $8.82 | | | | $10.09 | | | | | | | | $10.00 | |
| Income (loss) from investment operations: | | | | | | | | | | | | | | | | |
| Net investment income (loss) | | | (.03 | ) | | | (.04 | ) | | | | | | | (.01 | ) |
| Net realized and unrealized gain (loss) on investments | | | .60 | | | | (1.23 | ) | | | | | | | .10 | |
| Total from investment operations | | | .57 | | | | (1.27 | ) | | | | | | | .09 | |
| Net asset value, end of period | | | $9.39 | | | | $8.82 | | | | | | | | $10.09 | |
| Total Return(a) | | | 6.46% | | | | (12.59)% | | | | | | | | .90% | |
| | | | | | | | | | | | | | | | |
| Ratios/Supplemental Data: | |
| Net assets, end of period (000) | | | $183 | | | | $60 | | | | | | | | $10 | |
| Average net assets (000) | | | $102 | | | | $17 | | | | | | | | $10 | |
| Ratios to average net assets(d): | | | | | | | | | | | | | | | | |
| Expenses after waiver and/or expense reimbursement | | | 1.20% | | | | 1.29% | | | | | | | | 1.30% | (e) |
| Expenses before waiver and/or expense reimbursement | | | 3.55% | | | | 3.48% | | | | | | | | 13.51% | (e) |
| Net investment loss | | | (.31)% | | | | (.44)% | | | | | | | | (.67)% | (e) |
| Portfolio turnover rate | | | 44% | | | | 67% | | | | | | | | 15% | (f) |
| (a) | Total return is calculated assuming a purchase of a share on the first day and a sale on the last day of each period reported and includes reinvestment of dividends and distributions, if any. Total investment return may reflect adjustments to conform to generally accepted accounting principles. Total returns for periods less than one full year are not annualized. |
| (b) | Commencement of operations |
| (c) | Calculated based on average shares outstanding during the period. |
| (d) | Does not include expenses of the underlying portfolios in which the Series invests. |
See Notes to Financial Statements.
| | | | |
| Prudential Jennison Emerging Markets Equity Fund | | | 41 | |
Report of Independent Registered Public
Accounting Firm
The Board of Directors and Shareholders
Prudential World Fund, Inc.:
We have audited the accompanying statement of assets and liabilities of Prudential Jennison Emerging Markets Equity Fund, one of the series constituting Prudential World Fund, Inc. (hereafter referred to as the “Fund”), including the portfolio of investments, as of October 31, 2016, and the related statement of operations for the year then ended, the statements of changes in net assets for each of the years in the two-year period then ended, and the financial highlights for each of the years in the two-year period then ended and the period from September 16, 2014 (commencement of operations) to October 31, 2014. These financial statements and financial highlights are the responsibility of the Fund’s management. Our responsibility is to express an opinion on these financial statements and financial highlights based on our audits.
We conducted our audits in accordance with the standards of the Public Company Accounting Oversight Board (United States). Those standards require that we plan and perform the audit to obtain reasonable assurance about whether the financial statements and financial highlights are free of material misstatement. An audit includes examining, on a test basis, evidence supporting the amounts and disclosures in the financial statements. Our procedures included confirmation of securities owned as of October 31, 2016, by correspondence with the custodian, transfer agent and brokers or by other appropriate auditing procedures when replies from brokers were not received. An audit also includes assessing the accounting principles used and significant estimates made by management, as well as evaluating the overall financial statement presentation. We believe that our audits provide a reasonable basis for our opinion.
In our opinion, the financial statements and financial highlights referred to above present fairly, in all material respects, the financial position of the Fund as of October 31, 2016, and the results of its operations, the changes in its net assets, and the financial highlights for each of the years or periods described in the first paragraph, in conformity with U.S. generally accepted accounting principles.

New York, New York
December 15, 2016
INFORMATION ABOUT BOARD MEMBERS AND OFFICERS
(Unaudited)
Information about Board Members and Officers of the Fund is set forth below. Board Members who are not deemed to be “interested persons” of the Fund, as defined in the 1940 Act, are referred to as “Independent Board Members.” Board Members who are deemed to be “interested persons” of the Fund are referred to as “Interested Board Members.” The Board Members are responsible for the overall supervision of the operations of the Fund and perform the various duties imposed on the directors of investment companies by the 1940 Act. The Board in turn elects the Officers, who are responsible for administering the day-to-day operations of the Fund.
| | | | |
| Independent Board Members(1) |
Name, Address, Age Position(s) Portfolios Overseen | | Principal Occupation(s) During Past Five Years | | Other Directorships Held During Past Five Years |
Ellen S. Alberding (58) Board Member Portfolios Overseen: 67 | | President and Board Member, The Joyce Foundation (charitable foundation) (since 2002); Vice Chair, City Colleges of Chicago (community college system) (since 2011); Trustee, Skills for America’s Future (national initiative to connect employers to community colleges) (since 2011); Trustee, National Park Foundation (charitable foundation for national park system) (since 2009); Trustee, Economic Club of Chicago (since 2009). | | None. |
Kevin J. Bannon (64) Board Member Portfolios Overseen: 67 | | Managing Director (April 2008-May 2015) and Chief Investment Officer (October 2008-November 2013) of Highmount Capital LLC (registered investment adviser); formerly Executive Vice President and Chief Investment Officer (April 1993-August 2007) of Bank of New York Company; President (May 2003-May 2007) of BNY Hamilton Family of Mutual Funds. | | Director of Urstadt Biddle Properties (equity real estate investment trust) (since September 2008). |
Linda W. Bynoe (64) Board Member Portfolios Overseen: 67 | | President and Chief Executive Officer (since March 1995) and formerly Chief Operating Officer (December 1989-February 1995) of Telemat Ltd. (management consulting); formerly Vice President (January 1985-June 1989) at Morgan Stanley & Co. (broker-dealer). | | Director of Simon Property Group, Inc. (retail real estate) (May 2003-May 2012); Director of Anixter International, Inc. (communication products distributor) (since January 2006); Director of Northern Trust Corporation (financial services) (since April 2006); Trustee of Equity Residential (residential real estate) (since December 2009). |
Prudential Jennison Emerging Markets Equity Fund
| | | | |
| Independent Board Members(1) |
Name, Address, Age Position(s) Portfolios Overseen | | Principal Occupation(s) During Past Five Years | | Other Directorships Held During Past Five Years |
Keith F. Hartstein (60) Board Member Portfolios Overseen: 67 | | Retired; Member (since November 2014) of the Governing Council of the Independent Directors Council (organization of independent mutual fund directors); formerly President and Chief Executive Officer (2005-2012), Senior Vice President (2004-2005), Senior Vice President of Sales and Marketing (1997-2004), and various executive management positions (1990-1997), John Hancock Funds, LLC (asset management); Chairman, Investment Company Institute’s Sales Force Marketing Committee (2003-2008). | | None. |
Michael S. Hyland, CFA (71) Board Member Portfolios Overseen: 67 | | Retired (since February 2005); formerly Senior Managing Director (July 2001-February 2005) of Bear Stearns & Co, Inc.; Global Partner, INVESCO (1999-2001); Managing Director and President of Salomon Brothers Asset Management (1989-1999). | | None. |
Richard A. Redeker (73) Board Member & Independent Chair Portfolios Overseen: 67 | | Retired Mutual Fund Senior Executive (47 years); Management Consultant; Director, Mutual Fund Directors Forum (since 2014); Independent Directors Council (organization of independent mutual fund directors)-Executive Committee, Chair of Policy Steering Committee, Governing Council. | | None. |
Stephen G. Stoneburn (73) Board Member Portfolios Overseen: 67 | | Chairman (since July 2011), President and Chief Executive Officer (since June 1996) of Quadrant Media Corp. (publishing company); formerly President (June 1995-June 1996) of Argus Integrated Media, Inc.; Senior Vice President and Managing Director (January 1993-1995) of Cowles Business Media; Senior Vice President of Fairchild Publications, Inc. (1975-1989). | | None. |
Visit our website at prudentialfunds.com
| | | | |
| Interested Board Members(1) |
Name, Address, Age Position(s) Portfolios Overseen | | Principal Occupation(s) During Past Five Years | | Other Directorships Held During Past Five Years |
Stuart S. Parker (54) Board Member & President Portfolios Overseen: 67 | | President of Prudential Investments LLC (since January 2012); Executive Vice President of Prudential Investment Management Services LLC (since December 2012); Executive Vice President of Jennison Associates LLC and Head of Retail Distribution of Prudential Investments LLC (June 2005-December 2011). | | None. |
Scott E. Benjamin (43) Board Member & Vice President Portfolios Overseen: 67 | | Executive Vice President (since June 2009) of Prudential Investments LLC; Executive Vice President (June 2009-June 2012) and Vice President (since June 2012) of Prudential Investment Management Services LLC; Executive Vice President (since September 2009) of AST Investment Services, Inc.; Senior Vice President of Product Development and Marketing, Prudential Investments (since February 2006); Vice President of Product Development and Product Management, Prudential Investments (2003-2006). | | None. |
Grace C. Torres* (57) Board Member Portfolios Overseen: 65 | | Retired; formerly Treasurer and Principal Financial and Accounting Officer of the Prudential Investments Funds, Target Funds, Advanced Series Trust, Prudential Variable Contract Accounts and The Prudential Series Fund (1998-June 2014); Assistant Treasurer (March 1999-June 2014) and Senior Vice President (September 1999-June 2014) of Prudential Investments LLC; Assistant Treasurer (May 2003-June 2014) and Vice President (June 2005-June 2014) of AST Investment Services, Inc.; Senior Vice President and Assistant Treasurer (May 2003-June 2014) of Prudential Annuities Advisory Services, Inc. | | Director (since July 2015) of Sun Bancorp, Inc. N.A. |
| * | Note: Prior to her retirement in 2014, Ms. Torres was employed by Prudential Investments LLC. Due to her prior employment, she is considered to be an “interested person” under the 1940 Act. Ms. Torres is a Non-Management Interested Board Member. |
| (1) | The year that each Board Member joined the Board is as follows: |
Ellen S. Alberding; 2013; Kevin J. Bannon, 2008; Linda W. Bynoe, 2005; Keith F. Hartstein, 2013; Michael S. Hyland, 2008; Richard A. Redeker, 2003; Stephen G. Stoneburn, 1996; Grace C. Torres, 2014; Stuart S. Parker, Board Member and President since 2012; Scott E. Benjamin, Board Member since 2010 and Vice President since 2009.
Prudential Jennison Emerging Markets Equity Fund
| | | | |
| Fund Officers(a) |
Name, Address and Age Position with Fund | | Principal Occupation(s) During Past Five Years | | Length of Service as Fund Officer |
Raymond A. O’Hara (61) Chief Legal Officer | | Vice President and Corporate Counsel (since July 2010) of Prudential Insurance Company of America (Prudential); Vice President (March 2011-Present) of Pruco Life Insurance Company and Pruco Life Insurance Company of New Jersey; Vice President and Corporate Counsel (March 2011-Present) of Prudential Annuities Life Assurance Corporation; Chief Legal Officer of Prudential Investments LLC (since June 2012); Chief Legal Officer of Prudential Mutual Fund Services LLC (since June 2012) and Corporate Counsel of AST Investment Services, Inc. (since June 2012); formerly Assistant Vice President and Corporate Counsel (September 2008-July 2010) of The Hartford Financial Services Group, Inc.; formerly Associate (September 1980-December 1987) and Partner (January 1988–August 2008) of Blazzard & Hasenauer, P.C. (formerly, Blazzard, Grodd & Hasenauer, P.C.). | | Since 2012 |
Chad A. Earnst (41) Chief Compliance Officer | | Chief Compliance Officer (September 2014-Present) of Prudential Investments LLC; Chief Compliance Officer (September 2014-Present) of the Prudential Investments Funds, Target Funds, Advanced Series Trust, The Prudential Series Fund, Prudential’s Gibraltar Fund, Inc., Prudential Global Short Duration High Yield Income Fund, Inc., Prudential Short Duration High Yield Fund, Inc. and Prudential Jennison MLP Income Fund, Inc.; formerly Assistant Director (March 2010-August 2014) of the Asset Management Unit, Division of Enforcement, US Securities & Exchange Commission; Assistant Regional Director (January 2010-August 2014), Branch Chief (June 2006–December 2009) and Senior Counsel (April 2003-May 2006) of the Miami Regional Office, Division of Enforcement, US Securities & Exchange Commission. | | Since 2014 |
Deborah A. Docs (58) Secretary | | Vice President and Corporate Counsel (since January 2001) of Prudential; Vice President (since December 1996) and Assistant Secretary (since March 1999) of Prudential Investments LLC; formerly Vice President and Assistant Secretary (May 2003-June 2005) of AST Investment Services, Inc. | | Since 2004 |
Jonathan D. Shain (58) Assistant Secretary | | Vice President and Corporate Counsel (since August 1998) of Prudential; Vice President and Assistant Secretary (since May 2001) of Prudential Investments LLC; Vice President and Assistant Secretary (since February 2001) of Prudential Mutual Fund Services LLC; formerly Vice President and Assistant Secretary (May 2003-June 2005) of AST Investment Services, Inc. | | Since 2005 |
Visit our website at prudentialfunds.com
| | | | |
| Fund Officers(a) |
Name, Address and Age Position with Fund | | Principal Occupation(s) During Past Five Years | | Length of Service as Fund Officer |
Claudia DiGiacomo (42) Assistant Secretary | | Vice President and Corporate Counsel (since January 2005) of Prudential; Vice President and Assistant Secretary of Prudential Investments LLC (since December 2005); Associate at Sidley Austin Brown & Wood LLP (1999-2004). | | Since 2005 |
Andrew R. French (53) Assistant Secretary | | Vice President and Corporate Counsel (since February 2010) of Prudential; formerly Director and Corporate Counsel (2006-2010) of Prudential; Vice President and Assistant Secretary (since January 2007) of Prudential Investments LLC; Vice President and Assistant Secretary (since January 2007) of Prudential Mutual Fund Services LLC. | | Since 2006 |
Theresa C. Thompson (54) Deputy Chief Compliance Officer | | Vice President, Compliance, Prudential Investments LLC (since April 2004); and Director, Compliance, Prudential Investments LLC (2001-2004). | | Since 2008 |
Charles H. Smith (43) Anti-Money Laundering Compliance Officer | | Vice President, Corporate Compliance, Anti-Money Laundering Unit (since January 2015) of Prudential; committee member of the American Council of Life Insurers Anti-Money Laundering and Critical Infrastructure Committee (since January 2016); formerly Global Head of Economic Sanctions Compliance at AIG Property Casualty (February 2007-December 2014); Assistant Attorney General at the New York State Attorney General’s Office, Division of Public Advocacy. (August 1998-January 2007). | | Since 2016 |
M. Sadiq Peshimam (52) Treasurer and Principal Financial and Accounting Officer | | Vice President (since 2005) of Prudential Investments LLC; formerly Assistant Treasurer of funds in the Prudential Mutual Fund Complex (2006-2014). | | Since 2006 |
Peter Parrella (58) Assistant Treasurer | | Vice President (since 2007) and Director (2004-2007) within Prudential Mutual Fund Administration; formerly Tax Manager at SSB Citi Fund Management LLC (1997-2004). | | Since 2007 |
Lana Lomuti (49) Assistant Treasurer | | Vice President (since 2007) and Director (2005-2007), within Prudential Mutual Fund Administration; formerly Assistant Treasurer (December 2007-February 2014) of The Greater China Fund, Inc. | | Since 2014 |
Linda McMullin (55) Assistant Treasurer | | Vice President (since 2011) and Director (2008-2011) within Prudential Mutual Fund Administration. | | Since 2014 |
Kelly A. Coyne (48) Assistant Treasurer | | Director, Investment Operations of Prudential Mutual Fund Services LLC (since 2010). | | Since 2015 |
Prudential Jennison Emerging Markets Equity Fund
| (a) | Excludes Mr. Parker and Mr. Benjamin, interested Board Members who also serve as President and Vice President, respectively. |
Explanatory Notes to Tables:
| • | | Board Members are deemed to be “Interested,” as defined in the 1940 Act, by reason of their affiliation with Prudential Investments LLC and/or an affiliate of Prudential Investments LLC. |
| • | | Unless otherwise noted, the address of all Board Members and Officers is c/o Prudential Investments LLC, 655 Broad Street, Newark, New Jersey 07102-4410. |
| • | | There is no set term of office for Board Members or Officers. The Board Members have adopted a retirement policy, which calls for the retirement of Board Members on December 31 of the year in which they reach the age of 75. |
| • | | “Other Directorships Held” includes only directorships of companies required to register or file reports with the SEC under the 1934 Act (that is, “public companies”) or other investment companies registered under the 1940 Act. |
| • | | “Portfolios Overseen” includes all investment companies managed by Prudential Investments LLC. The investment companies for which Prudential Investments LLC serves as manager include the Prudential Investments Mutual Funds, The Prudential Variable Contract Accounts, Target Mutual Funds, Prudential Short Duration High Yield Fund, Inc., Prudential Global Short Duration High Yield Fund, Inc., The Prudential Series Fund, Prudential’s Gibraltar Fund, Inc. and the Advanced Series Trust. |
Visit our website at prudentialfunds.com
Approval of Advisory Agreements (unaudited)
The Fund’s Board of Trustees
The Board of Directors (the “Board”) of Prudential Jennison Emerging Markets Equity Fund (the “Fund”)1 consists of ten individuals, seven of whom are not “interested persons” of the Fund, as defined in the Investment Company Act of 1940, as amended (the “1940 Act”) (the “Independent Directors”). The Board is responsible for the oversight of the Fund and its operations, and performs the various duties imposed on the directors of investment companies by the 1940 Act. The Independent Directors have retained independent legal counsel to assist them in connection with their duties. The Chair of the Board is an Independent Director. The Board has established three standing committees: the Audit Committee, the Nominating and Governance Committee, and the Investment Committee. Each committee is chaired by, and composed of, Independent Directors.
Annual Approval of the Fund’s Advisory Agreements
As required under the 1940 Act, the Board determines annually whether to renew the Fund’s management agreement with Prudential Investments LLC (“PI”) and the Fund’s subadvisory agreement with Jennison Associates LLC (“Jennison”). In considering the renewal of the agreements, the Board, including all of the Independent Trustees, met on June 7-9, 2016 and approved the renewal of the agreements through July 31, 2017, after concluding that the renewal of the agreements was in the best interests of the Fund and its shareholders.
In advance of the meetings, the Board requested and received materials relating to the agreements, and had the opportunity to ask questions and request further information in connection with its consideration. Among other things, the Board considered comparative fee information from PI and Jennison. Also, the Board considered comparisons with other mutual funds in relevant Peer Universes and Peer Groups, as is further discussed below.
In approving the agreements, the Board, including the Independent Directors advised by independent legal counsel, considered the factors it deemed relevant, including the nature, quality and extent of services provided by PI and the subadviser, the performance of the Fund, the profitability of PI and its affiliates, expenses and fees, and the potential for economies of scale that may be shared with the Fund and its shareholders as the Fund’s assets grow. In their deliberations, the Directors did not identify any single factor which alone was responsible for the Board’s decision to approve the agreements with respect to the Fund. In connection with its deliberations, the Board considered information provided by PI throughout the year at regular Board meetings, presentations from portfolio managers and other information, as well as information furnished at or in advance of the meetings on June 7-9, 2016.
| 1 | Prudential Jennison Emerging Markets Equity Fund is a series of Prudential World Fund, Inc. |
| | |
| Prudential Jennison Emerging Markets Equity Fund |
Approval of Advisory Agreements (continued)
The Directors determined that the overall arrangements between the Fund and PI, which serves as the Fund’s investment manager pursuant to a management agreement, and between PI and Jennison, which serves as the Fund’s subadviser pursuant to the terms of a subadvisory agreement with PI, are in the best interests of the Fund and its shareholders in light of the services performed, fees charged and such other matters as the Directors considered relevant in the exercise of their business judgment.
The material factors and conclusions that formed the basis for the Directors’ determinations to approve the renewal of the agreements are discussed separately below.
Nature, Quality, and Extent of Services
The Board received and considered information regarding the nature, quality and extent of services provided to the Fund by PI and Jennison. The Board considered the services provided by PI, including but not limited to the oversight of the subadviser for the Fund, as well as the provision of fund recordkeeping, compliance, and other services to the Fund. With respect to PI’s oversight of the subadviser, the Board noted that PI’s Strategic Investment Research Group (“SIRG”), a business unit of PI, is responsible for monitoring and reporting to PI’s senior management on the performance and operations of the subadviser. The Board also considered that PI pays the salaries of all of the officers and interested Directors of the Fund who are part of Fund management. The Board also considered the investment subadvisory services provided by Jennison, as well as compliance with the Fund’s investment restrictions, policies and procedures. The Board considered PI’s evaluation of Jennison as well as PI’s recommendation, based on its review of Jennison, to renew the subadvisory agreement.
The Board considered the qualifications, backgrounds and responsibilities of PI’s senior management responsible for the oversight of the Fund and Jennison, and also considered the qualifications, backgrounds and responsibilities of Jennison’s portfolio managers who are responsible for the day-to-day management of the Fund’s portfolio. The Board was provided with information pertaining to PI’s and Jennison’s organizational structure, senior management, investment operations, and other relevant information pertaining to both PI and Jennison. The Board also noted that it received favorable compliance reports from the Fund’s Chief Compliance Officer (“CCO”) as to both PI and Jennison. The Board noted that Jennison is affiliated with PI.
The Board concluded that it was satisfied with the nature, extent and quality of the investment management services provided by PI and the subadvisory services provided to the Fund by Jennison, and that there was a reasonable basis on which to conclude that the Fund benefits from the services provided by PI and Jennison under the management and subadvisory agreements.
| | |
| Visit our website at prudentialfunds.com | | |
Costs of Services and Profits Realized by PI
The Board was provided with information on the profitability of PI and its affiliates in serving as the Fund’s investment manager. The Board discussed with PI the methodology utilized in assembling the information regarding profitability and considered its reasonableness. The Board recognized that it is difficult to make comparisons of profitability from fund management contracts because comparative information is not generally publicly available and is affected by numerous factors, including the structure of the particular adviser, the types of funds it manages, its business mix, numerous assumptions regarding allocations and the adviser’s capital structure and cost of capital. However, the Board considered that the cost of services provided by PI for the year ended December 31, 2015 exceeded the management fees received by PI, resulting in an operating loss to PI. The Board further noted that the subadviser is affiliated with PI and that its profitability is reflected in PI’s profitability report. Taking these factors into account, the Board concluded that the profitability of PI and its affiliates in relation to the services rendered was not unreasonable.
Economies of Scale
PI and the Board previously retained an outside business consulting firm to review management fee breakpoint usage and trends in management fees across the mutual fund industry. The consulting firm presented its analysis and conclusions as to the Funds’ management fee structures to the Board and PI. The Board and PI have discussed these conclusions extensively since that presentation.
The Board received and discussed information concerning economies of scale that PI may realize as the Fund’s assets grow beyond current levels. The Board noted that the management fee schedule for the Fund includes breakpoints, which have the effect of decreasing the fee rate as assets increase, but that at its current level of assets the Fund does not realize the effect of those rate reductions. The Board took note that the Fund’s fee structure currently results in benefits to Fund shareholders whether or not PI realizes any economies of scale. The Board noted that economies of scale can be shared with the Fund in other ways, including low management fees from inception, additional technological and personnel investments to enhance shareholder services, and maintaining existing expense structures in the face of a rising cost environment. The Board also considered PI’s assertion that it continually evaluates the management fee schedule of the Fund and the potential to share economies of scale through breakpoints or fee waivers as asset levels increase.
The Board recognized the inherent limitations of any analysis of economies of scale, stemming largely from the Board’s understanding that most of PI’s costs are not specific to individual funds, but rather are incurred across a variety of products and services.
| | |
| Prudential Jennison Emerging Markets Equity Fund |
Approval of Advisory Agreements (continued)
Other Benefits to PI and Jennison
The Board considered potential ancillary benefits that might be received by PI and Jennison and their affiliates as a result of their relationship with the Fund. The Board concluded that potential benefits to be derived by PI included fees received by affiliates of PI for serving as the Fund’s securities lending agent, transfer agency fees received by the Fund’s transfer agent (which is affiliated with PI), as well as benefits to its reputation or other intangible benefits resulting from PI’s association with the Fund. The Board concluded that the potential benefits to be derived by Jennison included its ability to use soft dollar credits, as well as the potential benefits consistent with those generally resulting from an increase in assets under management, specifically, potential access to additional research resources and benefits to its reputation. The Board concluded that the benefits derived by PI and Jennison were consistent with the types of benefits generally derived by investment managers and subadvisers to mutual funds.
Performance of the Fund / Fees and Expenses
The Board considered certain additional specific factors and made related conclusions relating to the historical performance of the Fund for the one-year period ended December 31, 2015. The Board considered that the Fund commenced operations on September 16, 2014 and that longer-term performance was not yet available.
The Board also considered the Fund’s actual management fee, as well as the Fund’s net total expense ratio, for the fiscal year ended October 31, 2015. The Board considered the management fee for the Fund as compared to the management fee charged by PI to other funds and the fee charged by other advisers to comparable mutual funds in a Peer Group. The actual management fee represents the fee rate actually paid by Fund shareholders and includes any fee waivers or reimbursements. The net total expense ratio for the Fund represents the actual expense ratio incurred by Fund shareholders.
The mutual funds included in the Peer Universe (the Lipper Emerging Markets Funds Performance Universe) and the Peer Group were objectively determined by Broadridge, an independent provider of mutual fund data. The comparisons placed the Fund in various quartiles, with the first quartile being the best 25% of the mutual funds (for performance, the best performing mutual funds and, for expenses, the lowest cost mutual funds).
The section below summarizes key factors considered by the Board and the Board’s conclusions regarding the Fund’s performance, fees and overall expenses. The table sets forth gross performance comparisons (which do not reflect the impact on performance of fund expenses, or any subsidies, expense caps or waivers that may be applicable) with the Peer Universe, actual management fees with the Peer Group (which reflect the impact of
| | |
| Visit our website at prudentialfunds.com | | |
any subsidies or fee waivers), and net total expenses with the Peer Group, each of which were key factors considered by the Board.
| | | | | | | | |
| Performance | | 1 Year | | 3 Years | | 5 Years | | 10 Years |
| | | 1st Quartile | | N/A | | N/A | | N/A |
| Actual Management Fees: 1st Quartile |
| Net Total Expenses: 2nd Quartile |
| | • | | The Board noted that the Fund outperformed its benchmark index over the one-year period. |
| | • | | The Board noted that the Fund does not yet have a three-year performance record and that, therefore, the subadviser should have more time to develop that record. |
| | • | | The Board also noted information provided by PI that effective October 1, 2015, PI agreed to limit expenses so that the Fund’s annual operating expenses do not exceed 1.20% (exclusive of 12b-1 and certain other fees) and that this change was not fully reflected in the 2015 annual expense calculations for the Fund. The Board noted that if this change was reflected for the full fiscal year, the Fund’s net total expenses would rank in the first quartile of its Peer Group. |
| | • | | The Board and PI agreed to continue the Fund’s existing expense cap of 1.20% (exclusive of 12b-1 and certain other fees) through February 28, 2017. |
| | • | | The Board concluded that, in light of the above, it would be in the best interests of the Fund and its shareholders to renew the agreements. |
| | • | | The Board concluded that the management fees (including subadvisory fees) and total expenses were reasonable in light of the services provided. |
* * *
After full consideration of these factors, the Board concluded that approval of the agreements was in the best interests of the Fund and its shareholders.
| | |
| Prudential Jennison Emerging Markets Equity Fund |
| | | | |
| ∎ MAIL | | ∎ TELEPHONE | | ∎ WEBSITE |
655 Broad Street Newark, NJ 07102 | | (800) 225-1852 | | www.prudentialfunds.com |
|
| PROXY VOTING |
| The Board of Trustees of the Fund has delegated to the Fund’s investment subadviser the responsibility for voting any proxies and maintaining proxy recordkeeping with respect to the Fund. A description of these proxy voting policies and procedures is available without charge, upon request, by calling (800) 225-1852. Information regarding how the Fund voted proxies relating to portfolio securities during the most recent 12-month period ended June 30 is available on the Fund’s website and on the Securities and Exchange Commission’s website. |
|
| TRUSTEES |
| Ellen S. Alberding • Kevin J. Bannon • Scott E. Benjamin • Linda W. Bynoe • Keith F. Hartstein • Michael S. Hyland • Stuart S. Parker • Richard A. Redeker • Stephen G. Stoneburn • Grace C. Torres |
|
| OFFICERS |
| Stuart S. Parker, President • Scott E. Benjamin, Vice President • M. Sadiq Peshimam, Treasurer and Principal Financial and Accounting Officer • Raymond A. O’Hara, Chief Legal Officer • Chad A. Earnst, Chief Compliance Officer • Deborah A. Docs, Secretary • Theresa C. Thompson, Deputy Chief Compliance Officer • Charles H. Smith, Anti-Money Laundering Compliance Officer • Jonathan D. Shain, Assistant Secretary • Claudia DiGiacomo, Assistant Secretary • Andrew R. French, Assistant Secretary • Peter Parrella, Assistant Treasurer • Lana Lomuti, Assistant Treasurer • Linda McMullin, Assistant Treasurer • Kelly A. Coyne, Assistant Treasurer |
| | | | |
| MANAGER | | Prudential Investments LLC | | 655 Broad Street
Newark, NJ 07102 |
|
| INVESTMENT SUBADVISER | | Jennison Associates LLC | | 466 Lexington Avenue
New York, NY 10017 |
|
| DISTRIBUTOR | | Prudential Investment
Management Services LLC | | 655 Broad Street
Newark, NJ 07102 |
|
| CUSTODIAN | | The Bank of New York Mellon | | One Wall Street
New York, NY 10286 |
|
| TRANSFER AGENT | | Prudential Mutual Fund
Services LLC | | PO Box 9658
Providence, RI 02940 |
|
INDEPENDENT REGISTERED
PUBLIC ACCOUNTING FIRM | | KPMG LLP | | 345 Park Avenue
New York, NY 10154 |
|
| FUND COUNSEL | | Willkie Farr & Gallagher LLP | | 787 Seventh Avenue
New York, NY 10019 |
|
|
| An investor should consider the investment objectives, risks, charges, and expenses of the Fund carefully before investing. The prospectus and summary prospectus contain this and other information about the Fund. An investor may obtain a prospectus and summary prospectus by visiting our website at www.prudentialfunds.com or by calling (800) 225-1852. The prospectus and summary prospectus should be read carefully before investing. |
|
| E-DELIVERY |
| To receive your mutual fund documents online, go to www.prudentialfunds.com/edelivery and enroll. Instead of receiving printed documents by mail, you will receive notification via email when new materials are available. You can cancel your enrollment or change your email address at any time by visiting the website address above. |
|
| SHAREHOLDER COMMUNICATIONS WITH TRUSTEES |
| Shareholders can communicate directly with the Board of Trustees by writing to the Chair of the Board, Prudential Jennison Emerging Markets Equity Fund, Prudential Investments, Attn: Board of Trustees, 655 Broad Street, Newark, NJ 07102. Shareholders can communicate directly with an individual Director by writing to the same address. Communications are not screened before being delivered to the addressee. |
|
| AVAILABILITY OF PORTFOLIO SCHEDULE |
| The Fund files its complete schedule of portfolio holdings with the Securities and Exchange Commission for the first and third quarters of each fiscal year on Form N-Q. The Fund’s Forms N-Q are available on the Commission’s website at www.sec.gov. The Fund’s Forms N-Q may also be reviewed and copied at the Commission’s Public Reference Room in Washington, D.C. Information on the operation and location of the Public Reference Room may be obtained by calling (202) 551-8090. The Fund’s schedule of portfolio holdings is also available on the Fund’s website as of the end of each month no sooner than 15 days after the end of the month. |
|
| The Fund’s Statement of Additional Information contains additional information about the Fund’s Trustees and is available without charge, upon request, by calling (800) 225-1852. |
Mutual Funds:
| | | | |
| ARE NOT INSURED BY THE FDIC OR ANY FEDERAL GOVERNMENT AGENCY | | MAY LOSE VALUE | | ARE NOT A DEPOSIT OF OR GUARANTEED BY ANY BANK OR ANY BANK AFFILIATE |
PRUDENTIAL JENNISON EMERGING MARKETS EQUITY FUND
| | | | | | | | |
| SHARE CLASS | | A | | C | | Q | | Z |
| NASDAQ | | PDEAX | | PDECX | | PDEQX | | PDEZX |
| CUSIP | | 743969644 | | 743969636 | | 743969628 | | 743969610 |
MF225E 0300088-00001-00
PRUDENTIAL INVESTMENTS, A PGIM BUSINESS | MUTUAL FUNDS
Prudential Jennison Global Opportunities Fund
| | |
| ANNUAL REPORT | | OCTOBER 31, 2016 |

| | |
To enroll in e-delivery, go to prudentialfunds.com/edelivery | |  |
|
| Objective: To seek long-term growth of capital |
Highlights
PRUDENTIAL JENNISON GLOBAL OPPORTUNITIES FUND
| • | | The Fund’s information technology holdings were strong contributors to positive return. These stocks included Tencent, China’s largest and most visited Internet service portal, social media giant Facebook, and Buenos Aires-based online trading service MercadoLibre. (For a complete list of holdings, refer to the Portfolio of Investments section of this report.) |
| • | | In consumer discretionary, Amazon.com benefited from strong execution, long-term revenue growth, margin expansion, and development of a meaningfully important business opportunity in cloud infrastructure. The company continues to invest to drive unit growth in its core retail business and through the proliferation of digital commerce via the mobile market. |
| • | | On the negative side, higher-growth, and therefore higher-valuation, health care stocks were hurt by investor risk aversion and growing concerns about drug pricing. Companies that sell innovative, high-priced drugs sold off, among them holdings in Incyte (myelofibrosis, blood cancer), Regeneron Pharmaceuticals (eye diseases, high cholesterol), and BioMarin Pharmaceutical (neurometabolic degenerative diseases). |
This report is not authorized for distribution to prospective investors unless preceded or accompanied by a current prospectus.
The views expressed in this report and information about the Fund’s portfolio holdings are for the period covered by this report and are subject to change thereafter.
Mutual funds are distributed by Prudential Investment Management Services LLC, member SIPC. Jennison Associates is a registered investment adviser. Both are Prudential Financial companies. © 2016 Prudential Financial, Inc. and its related entities. Jennison Associates, Jennison, the Prudential logo, and the Rock symbol are service marks of Prudential Financial, Inc. and its related entities, registered in many jurisdictions worldwide.
| | |
| 2 | | Visit our website at prudentialfunds.com |
Letter from the President

Dear Shareholder:
We hope you find the annual report for the Prudential Jennison Global Opportunities Fund informative and useful. The report covers performance for the 12-month period that ended October 31, 2016.
During the reporting period, the US economy experienced modest growth. Labor markets were healthy, and consumer confidence rose. The housing market brightened somewhat, as momentum continued for the new home market. The Federal Reserve kept interest rates unchanged at its September meeting, but pointed to the strong possibility of a rate hike in December. Internationally, concerns over Brexit—the term used to represent Britain’s decision to leave the European Union—remained in the spotlight.
Equity markets in the US were firmly in positive territory at the end of the reporting period, as US stocks posted strong gains. European stocks struggled earlier, but found some traction in the third quarter. Asian markets also advanced, and emerging markets rose sharply.
US fixed income markets experienced overall gains. High yield bonds posted very strong results. Corporate bonds and Treasuries also performed well. Accommodative monetary policy by central banks helped lift global bond markets.
Given the uncertainty in today’s investment environment, we believe that active professional portfolio management offers a potential advantage. Active managers often have the knowledge and flexibility to find the best investment opportunities in the most challenging markets.
Even so, it’s best if investment decisions are based on your long-term goals rather than on short-term market and economic developments. We also encourage you to work with an experienced financial advisor who can help you set goals, determine your tolerance for risk, build a diversified plan that’s right for you, and make adjustments when necessary.
By having Prudential Investments help you address your goals, you gain the advantage of asset managers that also manage money for many major corporations and pension funds around the world. That means you benefit from the same expertise, innovation, and attention to risk demanded by today’s most sophisticated investors.
Thank you for choosing our family of funds.
Sincerely,

Stuart S. Parker, President
Prudential Jennison Global Opportunities Fund
December 15, 2016
| | | | |
| Prudential Jennison Global Opportunities Fund | | | 3 | |
Your Fund’s Performance (unaudited)
Performance data quoted represent past performance. Past performance does not guarantee future results. The investment return and principal value of an investment will fluctuate, so that an investor’s shares, when redeemed, may be worth more or less than their original cost. Current performance may be lower or higher than the past performance data quoted. An investor may obtain performance data as of the most recent month-end by visiting our website at www.prudentialfunds.com or by calling (800) 225-1852.
| | | | | | |
| Cumulative Total Returns (Without Sales Charges) as of 10/31/16 | |
| | One Year (%) | | | Since Inception (%) | |
| Class A | | –3.13 | | | 51.40 (3/14/12) | |
| Class C | | –3.88 | | | 46.10 (3/14/12) | |
| Class Q | | –2.85 | | | 8.34 (12/22/14) | |
| Class Z | | –2.92 | | | 53.10 (3/14/12) | |
| MSCI ACWI ND Index | | 2.05 | | | — | |
| Lipper Global Multi-Cap Growth Funds Average | | –0.18 | | | — | |
| | | | | | |
| Average Annual Total Returns (With Sales Charges) as of 9/30/16 | |
| | One Year (%) | | | Since Inception (%) | |
| Class A | | 3.46 | | | 9.07 (3/14/12) | |
| Class C | | 7.67 | | | 9.59 (3/14/12) | |
| Class Q | | 9.88 | | | 6.82 (12/22/14) | |
| Class Z | | 9.74 | | | 10.70 (3/14/12) | |
| MSCI ACWI ND Index | | 11.96 | | | — | |
| Lipper Global Multi-Cap Growth Funds Average | | 10.65 | | | — | |
| | | | | | |
| Average Annual Total Returns (With Sales Charges) as of 10/31/16 | |
| | One Year (%) | | | Since Inception (%) | |
| Class A | | –8.46 | | | 8.03 (3/14/12) | |
| Class C | | –4.84 | | | 8.52 (3/14/12) | |
| Class Q | | –2.85 | | | 4.40 (12/22/14) | |
| Class Z | | –2.92 | | | 9.62 (3/14/12) | |
| | |
| 4 | | Visit our website at prudentialfunds.com |
| | | | |
| Average Annual Total Returns (Without Sales Charges) as of 10/31/16 |
| | One Year (%) | | Since Inception (%) |
| Class A | | –3.13 | | 9.36 (3/14/12) |
| Class C | | –3.88 | | 8.52 (3/14/12) |
| Class Q | | –2.85 | | 4.40 (12/22/14) |
| Class Z | | –2.92 | | 9.62 (3/14/12) |
Growth of a $10,000 Investment
The graph compares a $10,000 investment in the Prudential Jennison Global Opportunities Fund (Class A shares) with a similar investment in the MSCI ACWI ND Index by portraying the initial account values at the commencement of operations for Class A shares (March 14, 2012) and the account values at the end of the current fiscal year (October 31, 2016), as measured on a quarterly basis. For purposes of the graph, and unless otherwise indicated, it has been assumed that (a) the maximum applicable front-end sales charge was deducted from the initial $10,000 investment in Class A shares; (b) all recurring fees (including management fees) were deducted; and (c) all dividends and distributions were reinvested. The line graph provides information for Class A shares only. As indicated in the tables provided earlier, performance for Class C, Class Q, and Class Z shares will vary due to the differing charges and expenses applicable to each share class (as indicated in the following paragraphs). Without waiver of fees and/or expense reimbursement, if any, the returns would have been lower.
| | | | |
| Prudential Jennison Global Opportunities Fund | | | 5 | |
Your Fund’s Performance (continued)
Past performance does not predict future performance. Total returns and the ending account values in the graph include changes in share price and reinvestment of dividends and capital gains distributions in a hypothetical investment for the periods shown. The Fund’s total returns do not reflect the deduction of income taxes on an individual’s investment. Taxes may reduce your actual investment returns on income or gains paid by the Fund or any gains you may realize if you sell your shares.
Source: Prudential Investments LLC and Lipper Inc.
Inception returns are provided for any share class with less than 10 calendar years of returns.
The returns in the tables do not reflect the deduction of taxes that a shareholder would pay on Fund distributions or following the redemption of Fund shares. The average annual total returns take into account applicable sales charges, which are described for each share class in the table below.
| | | | | | | | |
| | | Class A | | Class C | | Class Q | | Class Z |
| Maximum initial sales charge | | 5.50% of the public offering price | | None | | None | | None |
| Contingent deferred sales charge (CDSC) (as a percentage of the lower of original purchase price or net asset value at redemption) | | 1% on sales of $1 million or more made within 12 months of purchase | | 1% on sales made within 12 months of purchase | | None | | None |
| Annual distribution and service (12b-1) fees (shown as a percentage of average daily net assets) | | .30% (.25% currently) | | 1% | | None | | None |
Benchmark Definitions
MSCI ACWI ND Index—The Morgan Stanley Capital International All Country World Net Dividend Index (MSCI ACWI ND Index) is an unmanaged free float-adjusted market capitalization weighted index that is designed to measure the equity market performance of developed and emerging markets. The MSCI ACWI ND Index consists of 46 country indexes comprising 23 developed and 23 emerging market country indexes. The developed market country indexes included are: Australia, Austria, Belgium, Canada, Denmark, Finland, France, Germany, Hong Kong, Ireland, Israel, Italy, Japan, Netherlands, New Zealand, Norway, Portugal, Singapore, Spain, Sweden, Switzerland, the United Kingdom, and the United States. The emerging market country indexes included are: Brazil, Chile, China, Colombia, Czech Republic, Egypt, Greece, Hungary, India, Indonesia, Korea, Malaysia, Mexico, Peru, Philippines, Poland, Qatar, Russia, South Africa, Taiwan, Thailand, Turkey, and United Arab Emirates. The ND version of the MSCI ACWI Index reflects the impact of the maximum withholding taxes on reinvested dividends. The cumulative total returns for the Index measured from the month-end closest to the inception date through 10/31/16 are 36.74% for Class A, Class C, and Class Z shares and 2.31% for Class Q shares. The average annual total return for the Index measured from the month-end closest to the inception date through 9/30/16 is 7.47% for Class A, Class C, and Class Z shares and 2.31% for Class Q shares.
| | |
| 6 | | Visit our website at prudentialfunds.com |
Lipper Global Multi-Cap Growth Funds Average—The Lipper Global Multi-Cap Growth Funds Average (Lipper Average) is based on the average return of all funds in the Lipper Global Multi-Cap Growth Funds category for the periods noted. Funds in the Lipper Average are funds that, by portfolio practice, invest in a variety of market capitalization ranges without concentrating 75% of their equity assets in any one market capitalization range over an extended period of time. Global multi-cap growth funds typically have above-average characteristics compared to the MSCI World Index. The cumulative total returns for the Lipper Average measured from the month-end closest to the inception date through 10/31/16 are 38.65% for Class A, Class C, and Class Z shares and 2.14% for Class Q shares. The average annual total return for the Lipper Average measured from the month-end closest to the inception date through 9/30/16 is 8.04% for Class A, Class C, and Class Z shares and 2.97% for Class Q shares.
Investors cannot invest directly in an index or average. The returns for the Index would be lower if they included the effects of sales charges, operating expenses of a mutual fund, or taxes. Returns for the Lipper Averages reflect the deduction of operating expenses, but not sales charges or taxes. The Since Inception returns for the Index and the Lipper Average are measured from the closest month-end to the inception date for the indicated share class.
| | | | |
Five Largest Holdings expressed as a
percentage of net assets as of 10/31/16 (%) | |
| Tencent Holdings Ltd., Internet Software & Services | | | 6.0 | |
| Amazon.com, Inc., Internet & Direct Marketing Retail | | | 5.5 | |
| Alibaba Group Holding Ltd., Internet Software & Services | | | 5.4 | |
| Facebook, Inc. (Class A Stock), Internet Software & Services | | | 5.3 | |
| adidas AG, Textiles, Apparel & Luxury Goods | | | 5.0 | |
Holdings reflect only long-term investments and are subject to change.
| | | | |
Five Largest Industries expressed as a
percentage of net assets as of 10/31/16 (%) | |
| Internet Software & Services | | | 23.9 | |
| Internet & Direct Marketing Retail | | | 10.2 | |
| Software | | | 9.5 | |
| Specialty Retail | | | 8.9 | |
| Biotechnology | | | 6.6 | |
Industry weightings reflect only long-term investments and are subject to change.
| | | | |
| Prudential Jennison Global Opportunities Fund | | | 7 | |
Strategy and Performance Overview
How did the Fund perform?
The Prudential Jennison Global Opportunities Fund’s Class A shares returned –3.13% in the 12 months ended October 31, 2016. Over the same period, the MSCI ACWI ND Index (the Index) rose 2.05% and the Lipper Global Multi-Cap Growth Funds Average returned –0.18%.
What was the market environment?
| • | | Numerous factors contributed to market volatility in the 12-month period, including decelerating economic growth in China; concerns that emerging economies might face balance sheet risks; the negative effect of lower energy prices on industrial sectors; fears of slowing economic growth in the US; uncertainty about the course of future Federal Reserve monetary tightening; Brexit, the United Kingdom’s vote to leave the European Union; and anxiety about the highly unconventional US presidential election. |
| • | | Risk aversion in this volatile global market environment affected how investors valued different securities. Low-volatility/high-dividend-paying and other “safety” stocks were significant drivers of market returns. Stocks of higher-growth companies generally underperformed. |
| • | | In the Index, the materials and information technology sectors posted double-digit advances; health care and consumer discretionary declined the most. By region, emerging markets gained the most while Europe lost ground. |
What worked?
| • | | The Fund’s information technology holdings were strong contributors to positive return: |
| | • | | Tencent, China’s largest and most visited Internet service portal, continued to perform well, fundamentally driven by its dominant position in China’s online gaming and instant messaging markets and its growing advertising and payment service efforts. If a proposed merger with a standalone online music provider closes, Tencent could also become China’s leading online music provider. |
| | • | | Facebook rose on impressive revenue and margins, accelerating advertising revenue growth, and solid user growth and engagement. Jennison believes that as the Internet-based social platform solidifies its dominant position, it continues to increase its appeal to both users and advertisers. Long-term, largely untapped, growth drivers include Instagram, WhatsApp, and Messenger. |
| | • | | Buenos Aires-based online trading service MercadoLibre advanced on strong execution and enhanced marketplace initiatives, including integrated shipping and payment systems. The company enables individuals and businesses to electronically sell and buy items in more than 2,000 categories. Jennison likes MercadoLibre’s exposure to Latin America’s expanding Internet penetration rates and low e-commerce share of the retail market. |
| | |
| 8 | | Visit our website at prudentialfunds.com |
| | • | | Alibaba reported better-than-expected revenue, earnings, user metrics, gross merchandise value, monetization revenue, and margins. Jennison believes Alibaba, with its dominant market share, offers an attractive opportunity to invest in the long-term growth of the Chinese e-commerce market. |
| • | | In consumer discretionary: |
| | • | | Amazon.com benefited from strong execution, long-term revenue growth, margin expansion, and development of a meaningfully important business opportunity in cloud infrastructure. The company continues to invest to drive unit growth in its core retail business and through the proliferation of digital commerce via the mobile market. |
| | • | | Adidas’s growth accelerated as new management repositioned the Adidas brand in North America, leveraged its Boost technology, and restructured product lines such as Golf. Based in Germany, Adidas sells sports shoes, apparel, and equipment in 160 countries. It is the world’s No. 3 sporting goods manufacturer behind Nike and Under Armour. |
| | • | | CP All reported stronger-than-expected earnings and same-store-sales growth. The company operates more than 7,000 convenience stores under the 7-Eleven trademark and has a dominant market position in Thailand. Jennison expects the company to benefit from benign operating cost pressure, store expansion, and same-store-sales growth, driven by improving domestic consumption. |
What didn’t work?
| | • | | Higher-growth, and therefore higher-valuation, stocks were hurt by investor risk aversion and growing concerns about drug pricing. Companies that sell innovative, high-priced drugs sold off, among them holdings in Incyte (myelofibrosis, blood cancer), Regeneron Pharmaceuticals (eye diseases, high cholesterol), and BioMarin Pharmaceutical (neurometabolic degenerative diseases). Jennison eliminated the position in Incyte to realize profits and redeploy funds in more attractive investment opportunities. Jennison believes that the long-term fundamentals of Regeneron, BioMarin, and other biotechnology holdings remain intact and that current valuations underestimate the potential of pipeline drugs. |
| | • | | Companies where acquired growth plays a greater role, such as Allergan, declined as regulatory changes threatened to remove many of the tax benefits of mergers between US and offshore companies. |
| | | | |
| Prudential Jennison Global Opportunities Fund | | | 9 | |
Strategy and Performance Overview (continued)
| • | | In consumer discretionary: |
| | • | | Corporate governance concerns and slightly lower-than-expected financial results prompted Jennison to first trim, then eliminate the position in Luxottica, the world’s largest eyewear firm. Milan-based Luxottica vertically integrates design, manufacturing, and retailing. |
| | • | | Nike declined on inventory overhang, declining average selling prices, and increased competition. Jennison incrementally reduced, then eliminated the position. |
| • | | In information technology: |
| | • | | The decline in global online professional network LinkedIn reflected signs of significant deceleration in recent high growth rates. Jennison eliminated the position. |
Current outlook
| • | | With growth scarce in many sectors and businesses, companies that are able to generate longer-term, sustainable above-average growth should become increasingly attractive. This appeal is likely to be heightened by the muted nature of global growth, which is limiting opportunities to capitalize on a cyclical rebound, and the recent run-up in dividend-paying securities, which could suggest that yield substitutes are offering little additional relative appreciation potential at this point. |
| • | | While 2016 has seen considerable volatility and mixed results across global equity markets, Jennison believes overall conditions favor its global growth strategy over a reasonable investment horizon. Jennison remains focused on identifying businesses that can generate organic growth and that continue to offer secular growth opportunities. The strategy remains heavily invested in technology, consumer discretionary, and health care stocks offering these characteristics, while industrials, financials, energy, consumer staples, and materials exposures remain quite small. Jennison will continue to carefully evaluate the fundamental outlooks of the Fund’s holdings and make adjustments as necessary as the overall global environment evolves. |
| | |
| 10 | | Visit our website at prudentialfunds.com |
The percentage points shown in the tables identify each security’s positive or negative contribution to the Fund’s return, which is the sum of all contributions by individual holdings.
| | | | | | |
| Top Contributors (%) | | Top Detractors (%) |
| Tencent Holdings | | 2.37 | | Incyte | | –1.26 |
| Facebook | | 1.52 | | LinkedIn | | –1.22 |
| Amazon.com | | 1.34 | | Regeneron Pharmaceuticals | | –1.15 |
| MercadoLibre | | 0.95 | | BioMarin Pharmaceutical | | –0.95 |
| CP All | | 0.89 | | Luxottica | | –0.86 |
| | | | |
| Prudential Jennison Global Opportunities Fund | | | 11 | |
Fees and Expenses (unaudited)
As a shareholder of the Fund, you incur two types of costs: (1) transaction costs, including sales charges (loads) on purchase payments and redemptions, as applicable, and (2) ongoing costs, including management fees, distribution, and/or service (12b-1) fees, and other Fund expenses, as applicable. This example is intended to help you understand your ongoing costs (in dollars) of investing in the Fund and to compare these costs with the ongoing costs of investing in other mutual funds.
The example is based on an investment of $1,000 invested on May 1, 2016, at the beginning of the period, and held through the six-month period ended October 31, 2016. The example is for illustrative purposes only; you should consult the Prospectus for information on initial and subsequent minimum investment requirements.
Actual Expenses
The first line for each share class in the table on the following page provides information about actual account values and actual expenses. You may use the information on this line, together with the amount you invested, to estimate the expenses that you paid over the period. Simply divide your account value by $1,000 (for example, an $8,600 account value ÷ $1,000 = 8.6), then multiply the result by the number on the first line under the heading “Expenses Paid During the Six-Month Period” to estimate the expenses you paid on your account during this period.
Hypothetical Example for Comparison Purposes
The second line for each share class in the table on the following page provides information about hypothetical account values and hypothetical expenses based on the Fund’s actual expense ratio and an assumed rate of return of 5% per year before expenses, which is not the Fund’s actual return. The hypothetical account values and expenses may not be used to estimate the actual ending account balance or expenses you paid for the period. You may use this information to compare the ongoing costs of investing in the Fund and other funds. To do so, compare this 5% hypothetical example with the 5% hypothetical examples that appear in the shareholder reports of the other funds.
The Fund’s transfer agent may charge additional fees to holders of certain accounts that are not included in the expenses shown in the table on the following page. These fees apply to individual retirement accounts (IRAs) and Section 403(b) accounts. As of the close of the six-month period covered by the table, IRA fees included an annual maintenance fee of $15 per account (subject to a maximum annual maintenance fee of $25 for all accounts held by the same shareholder). Section 403(b) accounts are charged an annual $25 fiduciary maintenance fee. Some of the fees may vary in amount, or may be waived, based on your total account balance or the number of Prudential Investments funds, including the Fund, that you own. You should consider the additional fees that were charged to your
| | |
| 12 | | Visit our website at prudentialfunds.com |
Fund account over the six-month period when you estimate the total ongoing expenses paid over the period and the impact of these fees on your ending account value, as these additional expenses are not reflected in the information provided in the expense table. Additional fees have the effect of reducing investment returns.
Please note that the expenses shown in the table are meant to highlight your ongoing costs only and do not reflect any transactional costs such as sales charges (loads). Therefore, the second line for each share class in the table is useful in comparing ongoing costs only and will not help you determine the relative total costs of owning different funds. In addition, if these transactional costs were included, your costs would have been higher.
| | | | | | | | | | | | | | | | | | |
Prudential Jennison Global
Opportunities Fund | | Beginning Account
Value
May 1, 2016 | | | Ending Account
Value
October 31, 2016 | | | Annualized
Expense Ratio
Based on the
Six-Month Period | | | Expenses Paid
During the
Six-Month Period* | |
| Class A | | Actual | | $ | 1,000.00 | | | $ | 1,058.00 | | | | 1.24 | % | | $ | 6.41 | |
| | Hypothetical | | $ | 1,000.00 | | | $ | 1,018.90 | | | | 1.24 | % | | $ | 6.29 | |
| Class C | | Actual | | $ | 1,000.00 | | | $ | 1,053.40 | | | | 1.99 | % | | $ | 10.27 | |
| | Hypothetical | | $ | 1,000.00 | | | $ | 1,015.13 | | | | 1.99 | % | | $ | 10.08 | |
| Class Q | | Actual | | $ | 1,000.00 | | | $ | 1,059.40 | | | | 0.84 | % | | $ | 4.35 | |
| | Hypothetical | | $ | 1,000.00 | | | $ | 1,020.91 | | | | 0.84 | % | | $ | 4.27 | |
| Class Z | | Actual | | $ | 1,000.00 | | | $ | 1,058.80 | | | | 0.99 | % | | $ | 5.12 | |
| | | Hypothetical | | $ | 1,000.00 | | | $ | 1,020.16 | | | | 0.99 | % | | $ | 5.03 | |
*Fund expenses (net of fee waivers or subsidies, if any) for each share class are equal to the annualized expense ratio for each share class (provided in the table), multiplied by the average account value over the period, multiplied by the 184 days in the six-month period ended October 31, 2016, and divided by the 366 days in the Fund’s fiscal year ended October 31, 2016 (to reflect the six-month period). Expenses presented in the table include the expenses of any underlying portfolios in which the Fund may invest.
| | | | |
| Prudential Jennison Global Opportunities Fund | | | 13 | |
Fees and Expenses (continued)
The Fund’s annual expense ratios for the 12-month period ended October 31, 2016, are as follows:
| | | | |
| Class | | Gross Operating Expenses (%) | | Net Operating Expenses (%) |
| A | | 1.36 | | 1.20 |
| C | | 2.06 | | 1.95 |
| Q | | 0.95 | | 0.84 |
| Z | | 1.06 | | 0.95 |
Net operating expenses shown above reflect any fee waivers and/or expense reimbursements. Additional information on Fund expenses and any fee waivers and/or expense reimbursements can be found in the “Financial Highlights” tables in this report and in the Notes to the Financial Statements in this report.
| | |
| 14 | | Visit our website at prudentialfunds.com |
Portfolio of Investments
as of October 31, 2016
| | | | | | | | |
| Description | | Shares | | | Value (Note 1) | |
LONG-TERM INVESTMENTS 98.9% | | | | | | | | |
| | |
COMMON STOCKS | | | | | | | | |
| | |
Argentina 3.0% | | | | | | | | |
MercadoLibre, Inc. | | | 47,573 | | | $ | 7,992,740 | |
| | |
Australia 1.6% | | | | | | | | |
Atlassian Corp. PLC (Class A Stock)* | | | 152,172 | | | | 4,087,340 | |
| | |
Brazil 2.3% | | | | | | | | |
Raia Drogasil SA | | | 273,216 | | | | 6,081,452 | |
| | |
China 11.4% | | | | | | | | |
Alibaba Group Holding Ltd., ADR*(a) | | | 139,333 | | | | 14,168,773 | |
Tencent Holdings Ltd. | | | 602,482 | | | | 15,967,181 | |
| | | | | | | | |
| | | | | | | 30,135,954 | |
| | |
France 2.3% | | | | | | | | |
Dassault Systemes SA | | | 77,807 | | | | 6,158,656 | |
| | |
Germany 5.0% | | | | | | | | |
adidas AG | | | 80,418 | | | | 13,212,254 | |
| | |
Indonesia 2.1% | | | | | | | | |
Astra International Tbk PT | | | 8,927,115 | | | | 5,632,188 | |
| | |
Japan 5.9% | | | | | | | | |
Nintendo Co. Ltd. | | | 30,695 | | | | 7,399,343 | |
Shionogi & Co. Ltd. | | | 87,021 | | | | 4,285,612 | |
Sysmex Corp. | | | 57,730 | | | | 4,000,809 | |
| | | | | | | | |
| | | | | | | 15,685,764 | |
| | |
Singapore 2.0% | | | | | | | | |
Broadcom Ltd. | | | 30,343 | | | | 5,166,806 | |
| | |
Spain 6.7% | | | | | | | | |
Amadeus IT Holding SA (Class A Stock) | | | 106,226 | | | | 4,999,424 | |
Inditex SA | | | 360,537 | | | | 12,580,063 | |
| | | | | | | | |
| | | | | | | 17,579,487 | |
| | |
Thailand 2.5% | | | | | | | | |
CP ALL PCL | | | 3,822,278 | | | | 6,625,786 | |
| | |
United Kingdom 5.1% | | | | | | | | |
ASOS PLC* | | | 133,086 | | | | 8,543,310 | |
St. James’s Place PLC | | | 435,867 | | | | 5,033,766 | |
| | | | | | | | |
| | | | | | | 13,577,076 | |
See Notes to Financial Statements.
| | | | |
| Prudential Jennison Global Opportunities Fund | | | 15 | |
Portfolio of Investments (continued)
as of October 31, 2016
| | | | | | | | |
| Description | | Shares | | | Value (Note 1) | |
COMMON STOCKS (Continued) | | | | | | | | |
| | |
United States 49.0% | | | | | | | | |
Albemarle Corp. | | | 68,589 | | | $ | 5,730,611 | |
Allergan PLC* | | | 27,520 | | | | 5,750,029 | |
Alphabet Inc. (Class A Stock)* | | | 13,732 | | | | 11,121,547 | |
Amazon.com, Inc.* | | | 18,565 | | | | 14,663,008 | |
Apple, Inc. | | | 44,762 | | | | 5,082,277 | |
BioMarin Pharmaceutical, Inc.* | | | 64,223 | | | | 5,171,236 | |
Bristol-Myers Squibb Co. | | | 46,350 | | | | 2,359,678 | |
Celgene Corp.* | | | 20,666 | | | | 2,111,652 | |
Charter Communications, Inc. (Class A Stock)* | | | 20,832 | | | | 5,205,708 | |
Constellation Brands, Inc. (Class A Stock) | | | 29,018 | | | | 4,849,488 | |
Facebook, Inc. (Class A Stock)* | | | 108,020 | | | | 14,149,540 | |
Home Depot, Inc. (The) | | | 19,657 | | | | 2,398,351 | |
MasterCard, Inc. (Class A Stock) | | | 112,005 | | | | 11,986,775 | |
Mobileye NV*(a) | | | 115,661 | | | | 4,300,276 | |
Netflix, Inc.* | | | 31,657 | | | | 3,953,010 | |
NVIDIA Corp. | | | 93,980 | | | | 6,687,617 | |
Regeneron Pharmaceuticals, Inc.* | | | 9,206 | | | | 3,176,254 | |
salesforce.com, inc.* | | | 41,216 | | | | 3,097,795 | |
Shire PLC | | | 120,912 | | | | 6,827,047 | |
Tesla Motors, Inc.*(a) | | | 12,995 | | | | 2,569,501 | |
TJX Cos., Inc. (The) | | | 34,589 | | | | 2,550,939 | |
Ulta Salon Cosmetics & Fragrance, Inc.* | | | 24,360 | | | | 5,927,762 | |
| | | | | | | | |
| | | | | | | 129,670,101 | |
| | | | | | | | |
TOTAL LONG-TERM INVESTMENTS
(cost $226,677,480) | | | | | | | 261,605,604 | |
| | | | | | | | |
| | |
SHORT-TERM INVESTMENTS 6.3% | | | | | | | | |
| | |
AFFILIATED MUTUAL FUNDS | | | | | | | | |
Prudential Investment Portfolios 2 -
Prudential Core Ultra Short Bond Fund(b) | | | 3,046,626 | | | | 3,046,626 | |
Prudential Investment Portfolios 2 -
Prudential Institutional Money Market Fund
(cost $13,705,422; includes $13,696,580 of cash collateral for securities on loan)(b)(c) | | | 13,704,725 | | | | 13,707,466 | |
| | | | | | | | |
TOTAL SHORT-TERM INVESTMENTS
(cost $16,752,048) (Note 3) | | | | | | | 16,754,092 | |
| | | | | | | | |
TOTAL INVESTMENTS 105.2%
(cost $243,429,528) (Note 5) | | | | | | | 278,359,696 | |
Liabilities in excess of other assets (5.2)% | | | | | | | (13,660,173 | ) |
| | | | | | | | |
NET ASSETS 100.0% | | | | | | $ | 264,699,523 | |
| | | | | | | | |
See Notes to Financial Statements.
The following abbreviation is used in the annual report:
ADR—American Depositary Receipt
LIBOR—London Interbank Offered Rate
| * | Non-income producing security. |
| (a) | All or a portion of security is on loan. The aggregate market value of such securities, including those sold and pending settlement, is $13,425,206; cash collateral of $13,696,580 (included in liabilities) was received with which the Series purchased highly liquid short-term investments. Securities on loan are subject to contractual netting arrangements. |
| (b) | Prudential Investments LLC, the manager of the Series, also serves as manager of the Prudential Investment Portfolios 2 - Prudential Core Ultra Short Bond Fund and Prudential Investment Portfolios 2 - Prudential Institutional Money Market Fund. |
| (c) | Represents security purchased with cash collateral received for securities on loan and includes dividend reinvestment. |
Various inputs are used in determining the value of the Series’ investments. These inputs are summarized in the three broad levels listed below.
Level 1—quoted prices generally in active markets for identical securities.
Level 2—quoted prices for similar securities, interest rates and yield curves, prepayment speeds, foreign currency exchange rates and other observable inputs.
Level 3—unobservable inputs for securities valued in accordance with Board approved fair valuation procedures.
The following is a summary of the inputs used as of October 31, 2016 in valuing such portfolio securities:
| | | | | | | | | | | | |
| | | Level 1 | | | Level 2 | | | Level 3 | |
Investments in Securities | | | | | | | | | | | | |
Common Stocks | | | | | | | | | | | | |
Argentina | | $ | 7,992,740 | | | $ | — | | | $ | — | |
Australia | | | 4,087,340 | | | | — | | | | — | |
Brazil | | | 6,081,452 | | | | — | | | | — | |
China | | | 14,168,773 | | | | 15,967,181 | | | | — | |
France | | | — | | | | 6,158,656 | | | | — | |
Germany | | | — | | | | 13,212,254 | | | | — | |
Indonesia | | | — | | | | 5,632,188 | | | | — | |
Japan | | | — | | | | 15,685,764 | | | | — | |
Singapore | | | 5,166,806 | | | | — | | | | — | |
Spain | | | — | | | | 17,579,487 | | | | — | |
Thailand | | | — | | | | 6,625,786 | | | | — | |
United Kingdom | | | — | | | | 13,577,076 | | | | — | |
United States | | | 122,843,054 | | | | 6,827,047 | | | | — | |
Affiliated Mutual Funds | | | 16,754,092 | | | | — | | | | — | |
| | | | | | | | | | | | |
Total | | $ | 177,094,257 | | | $ | 101,265,439 | | | $ | — | |
| | | | | | | | | | | | |
During the period, there were no transfers between Level 1 and Level 2 to report.
See Notes to Financial Statements.
| | | | |
| Prudential Jennison Global Opportunities Fund | | | 17 | |
Portfolio of Investments (continued)
as of October 31, 2016
The industry classification of investments and liabilities in excess of other assets shown as a percentage of net assets as of October 31, 2016 were as follows (unaudited):
| | | | |
Internet Software & Services | | | 23.9 | % |
Internet & Direct Marketing Retail | | | 10.2 | |
Software | | | 9.5 | |
Specialty Retail | | | 8.9 | |
Biotechnology | | | 6.6 | |
IT Services | | | 6.4 | |
Affiliated Mutual Funds (including 5.2% of collateral for securities on loan) | | | 6.3 | |
Textiles, Apparel & Luxury Goods | | | 5.0 | |
Food & Staples Retailing | | | 4.8 | |
Pharmaceuticals | | | 4.7 | |
Semiconductors & Semiconductor Equipment | | | 4.5 | |
Automobiles | | | 3.1 | % |
Chemicals | | | 2.2 | |
Media | | | 2.0 | |
Technology Hardware, Storage & Peripherals | | | 1.9 | |
Insurance | | | 1.9 | |
Beverages | | | 1.8 | |
Health Care Equipment & Supplies | | | 1.5 | |
| | | | |
| | | 105.2 | |
Liabilities in excess of other assets | | | (5.2 | ) |
| | | | |
| | | 100.0 | % |
| | | | |
See Notes to Financial Statements.
This Page Intentionally Left Blank
Statement of Assets & Liabilities
as of October 31, 2016
| | | | |
Assets | | | | |
Investments at value, including securities on loan of $13,425,206: | | | | |
Unaffiliated investments (cost $226,677,480) | | $ | 261,605,604 | |
Affiliated investments (cost $16,752,048) | | | 16,754,092 | |
Receivable for investments sold | | | 5,189,613 | |
Receivable for Series shares sold | | | 466,422 | |
Dividends receivable | | | 199,326 | |
Tax reclaim receivable | | | 64,484 | |
Prepaid expenses | | | 2,749 | |
| | | | |
Total Assets | | | 284,282,290 | |
| | | | |
| |
Liabilities | | | | |
Payable to broker for collateral for securities on loan | | | 13,696,580 | |
Payable for investments purchased | | | 4,840,558 | |
Payable for Series shares reacquired | | | 711,948 | |
Management fee payable | | | 148,832 | |
Accrued expenses and other liabilities | | | 110,691 | |
Distribution fee payable | | | 65,315 | |
Affiliated transfer agent fee payable | | | 8,843 | |
| | | | |
Total Liabilities | | | 19,582,767 | |
| | | | |
| |
Net Assets | | $ | 264,699,523 | |
| | | | |
| | | | | |
Net assets were comprised of: | | | | |
Common stock, at par | | $ | 175,178 | |
Paid-in capital in excess of par | | | 260,006,311 | |
| | | | |
| | | 260,181,489 | |
Accumulated net investment loss | | | (730,095 | ) |
Accumulated net realized loss on investment and foreign currency transactions | | | (29,680,464 | ) |
Net unrealized appreciation on investments and foreign currencies | | | 34,928,593 | |
| | | | |
Net assets, October 31, 2016 | | $ | 264,699,523 | |
| | | | |
See Notes to Financial Statements.
| | | | |
Class A | | | | |
Net asset value and redemption price per share ($89,578,526 ÷ 5,917,322 shares of common stock issued and outstanding) | | $ | 15.14 | |
Maximum sales charge (5.50% of offering price) | | | 0.88 | |
| | | | |
Maximum offering price to public | | $ | 16.02 | |
| | | | |
| |
Class C | | | | |
Net asset value, offering price and redemption price per share ($52,245,740 ÷ 3,575,307 shares of common stock issued and outstanding) | | $ | 14.61 | |
| | | | |
| |
Class Q | | | | |
Net asset value, offering price and redemption price per share ($8,647,145 ÷ 563,911 shares of common stock issued and outstanding) | | $ | 15.33 | |
| | | | |
| |
Class Z | | | | |
Net asset value, offering price and redemption price per share ($114,228,112 ÷ 7,461,293 shares of common stock issued and outstanding) | | $ | 15.31 | |
| | | | |
See Notes to Financial Statements.
| | | | |
| Prudential Jennison Global Opportunities Fund | | | 21 | |
Statement of Operations
Year Ended October 31, 2016
| | | | |
Net Investment Income (Loss) | | | | |
Income | | | | |
Unaffiliated dividend income (net of foreign withholding taxes of $188,138) | | $ | 2,405,764 | |
Income from securities lending, net (including affiliated $7,461) | | | 132,363 | |
Affiliated dividend income | | | 19,165 | |
| | | | |
Total income | | | 2,557,292 | |
| | | | |
| |
Expenses | | | | |
Management fee | | | 2,385,288 | |
Distribution fee—Class A | | | 300,687 | |
Distribution fee—Class C | | | 501,161 | |
Transfer agent’s fees and expenses (including affiliated expense of $57,200) | | | 314,000 | |
Custodian and accounting fees (net of $6,000 fee credit) | | | 132,000 | |
Registration fees | | | 89,000 | |
Shareholders’ reports | | | 47,000 | |
Audit fee | | | 31,000 | |
Legal fees and expenses | | | 22,000 | |
Directors’ fees | | | 14,000 | |
Commitment fee on syndicated credit agreement | | | 7,000 | |
Loan interest expense | | | 2,537 | |
Insurance expenses | | | 2,000 | |
Miscellaneous | | | 15,164 | |
| | | | |
Total expenses | | | 3,862,837 | |
Less: Expense reimbursement | | | (315,926 | ) |
Distribution fee waiver—Class A | | | (50,110 | ) |
| | | | |
Net expenses | | | 3,496,801 | |
| | | | |
Net investment income (loss) | | | (939,509 | ) |
| | | | |
| |
Realized And Unrealized Gain (Loss) On Investments And Foreign Currency Transactions | | | | |
Net realized gain (loss) on: | | | | |
Investment transactions (including affiliated of $904) | | | (26,434,495 | ) |
Foreign currency transactions | | | (56,397 | ) |
| | | | |
| | | (26,490,892 | ) |
| | | | |
Net change in unrealized appreciation (depreciation) on: | | | | |
Investments (including affiliated of $2,044) | | | 12,313,407 | |
Foreign currencies | | | 2,920 | |
| | | | |
| | | 12,316,327 | |
| | | | |
Net gain (loss) on investment and foreign currency transactions | | | (14,174,565 | ) |
| | | | |
Net Increase (Decrease) In Net Assets Resulting From Operations | | $ | (15,114,074 | ) |
| | | | |
See Notes to Financial Statements.
Statement of Changes in Net Assets
| | | | | | | | |
| | | Year Ended October 31, | |
| | | 2016 | | | 2015 | |
Increase (Decrease) in Net Assets | | | | | | | | |
Operations | | | | | | | | |
Net investment income (loss) | | $ | (939,509 | ) | | $ | (585,924 | ) |
Net realized gain (loss) on investment and foreign currency transactions | | | (26,490,892 | ) | | | (2,115,700 | ) |
Net change in unrealized appreciation (depreciation) on investments and foreign currencies | | | 12,316,327 | | | | 10,587,386 | |
| | | | | | | | |
Net increase (decrease) in net assets resulting from operations | | | (15,114,074 | ) | | | 7,885,762 | |
| | | | | | | | |
| | |
Series share transactions (Net of share conversions) (Note 6) | | | | | | | | |
Net proceeds from shares sold | | | 270,276,394 | | | | 166,549,415 | |
Cost of shares reacquired | | | (196,305,393 | ) | | | (28,969,945 | ) |
| | | | | | | | |
Net increase (decrease) in net assets from Series share transactions | | | 73,971,001 | | | | 137,579,470 | |
| | | | | | | | |
Total increase (decrease) | | | 58,856,927 | | | | 145,465,232 | |
| | |
Net Assets: | | | | | | | | |
Beginning of year | | | 205,842,596 | | | | 60,377,364 | |
| | | | | | | | |
End of year | | $ | 264,699,523 | | | $ | 205,842,596 | |
| | | | | | | | |
See Notes to Financial Statements.
| | | | |
| Prudential Jennison Global Opportunities Fund | | | 23 | |
Notes to Financial Statements
Prudential World Fund, Inc. (the “Fund”) is an open-end management investment company, registered under the Investment Company Act of 1940, as amended (“1940 Act”) and currently consists of six series: Prudential Jennison Global Opportunities Fund (the “Series”), Prudential Jennison Global Infrastructure Fund, Prudential QMA International Equity Fund, Prudential Jennison International Opportunities Fund, Prudential Jennison Emerging Markets Equity Fund and Prudential Emerging Markets Debt Local Currency Fund. These financial statements relate to Prudential Jennison Global Opportunities Fund. The financial statements of the other series are not presented herein. The Series commenced investment operations on March 14, 2012. The Series is diversified and its investment objective is to seek long-term growth of capital.
Note 1. Accounting Policies
The Fund follows investment company accounting and reporting guidance of the Financial Accounting Standards Board (“FASB”) Accounting Standard Codification Topic 946 Financial Services—Investment Companies. The following accounting policies conform to U.S. generally accepted accounting principles. The Fund and the Series consistently follow such policies in the preparation of their financial statements.
Securities Valuation: The Series holds securities and other assets that are fair valued at the close of each day (generally, 4:00 PM Eastern time) the New York Stock Exchange (“NYSE”) is open for trading. Fair value is the price that would be received to sell an asset or paid to transfer a liability in an orderly transaction between market participants on the measurement date. The Board of Directors (the “Board”) has adopted Valuation Procedures for security valuation under which fair valuation responsibilities have been delegated to Prudential Investments LLC (“PI” or “Manager”). Under the current Valuation Procedures, the established Valuation Committee is responsible for supervising the valuation of portfolio securities and other assets. The Valuation Procedures permit the Series to utilize independent pricing vendor services, quotations from market makers, and alternative valuation methods when market quotations are either not readily available or not deemed representative of fair value. A record of the Valuation Committee’s actions is subject to the Board’s review, approval, and ratification at its next regularly-scheduled quarterly meeting.
Various inputs determine how the Series’ investments are valued, all of which are categorized according to the three broad levels (Level 1, 2, or 3) detailed in the table following the Portfolio of Investments.
Common and preferred stocks, exchange-traded funds and derivative instruments, such as futures or options, that are traded on a national securities exchange are valued at the last
sale price as of the close of trading on the applicable exchange where the security principally trades. Securities traded via NASDAQ are valued at the NASDAQ official closing price. To the extent these securities are valued at the last sale price or NASDAQ official closing price, they are classified as Level 1 in the fair value hierarchy.
In the event that no sale or official closing price on valuation date exists, these securities are generally valued at the mean between the last reported bid and ask prices, or at the last bid price in the absence of an ask price. These securities are classified as Level 2 in the fair value hierarchy.
Common and preferred stocks traded on foreign securities exchanges are valued using pricing vendor services that provide model prices derived using adjustment factors based on information such as local closing price, relevant general and sector indices, currency fluctuations, depositary receipts, and futures, as applicable. Securities valued using such model prices are classified as Level 2 in the fair value hierarchy. The models generate an evaluated adjustment factor for each security, which is applied to the local closing price to adjust it for post closing market movements. Utilizing that evaluated adjustment factor, the vendor provides an evaluated price for each security. If the vendor does not provide an evaluated price, securities are valued in accordance with exchange-traded common and preferred stocks discussed above.
Participatory notes (P-notes) are generally valued based upon the value of a related underlying security that trades actively in the market and are classified as Level 2 in the fair value hierarchy.
Investments in open-end, non-exchange-traded mutual funds are valued at their net asset values as of the close of the NYSE on the date of valuation. These securities are classified as Level 1 in the fair value hierarchy since they may be purchased or sold at their net asset values on the date of valuation.
Securities and other assets that cannot be priced according to the methods described above are valued based on pricing methodologies approved by the Board. In the event that unobservable inputs are used when determining such valuations, the securities will be classified as Level 3 in the fair value hierarchy.
When determining the fair value of securities, some of the factors influencing the valuation include: the nature of any restrictions on disposition of the securities; assessment of the general liquidity of the securities; the issuer’s financial condition and the markets in which it does business; the cost of the investment; the size of the holding and the capitalization of the issuer; the prices of any recent transactions or bids/offers for such securities or any comparable securities; any available analyst media or other reports or information deemed reliable by the investment adviser regarding the issuer or the markets or industry in which it operates. Using fair value to price securities may result in a value that is different from a security’s most recent closing price and from the price used by other mutual funds to calculate their net asset values.
| | | | |
| Prudential Jennison Global Opportunities Fund | | | 25 | |
Notes to Financial Statements (continued)
Restricted and Illiquid Securities: The Series may hold up to 15% of its net assets in illiquid securities, including those which are restricted as to disposition under securities law (“restricted securities”). Restricted securities are valued pursuant to the valuation procedures noted above. Illiquid securities are those that, because of the absence of a readily available market or due to legal or contractual restrictions on resale, cannot be sold within seven days in the ordinary course of business at approximately the amount at which the Series has valued the investment. Therefore, the Series may find it difficult to sell illiquid securities at the time considered most advantageous by its Subadviser and may incur expenses that would not be incurred in the sale of securities that were freely marketable. Certain securities that would otherwise be considered illiquid because of legal restrictions on resale to the general public may be traded among qualified institutional buyers under Rule 144A of the Securities Act of 1933. These Rule 144A securities, as well as commercial paper that is sold in private placements under Section 4(2) of the Securities Act, may be deemed liquid by the Series’ Subadviser under the guidelines adopted by the Directors of the Series. However, the liquidity of the Series’ investments in Rule 144A securities could be impaired if trading does not develop or declines.
Foreign Currency Translation: The books and records of the Series are maintained in U.S. dollars. Foreign currency amounts are translated into U.S. dollars on the following basis:
(i) market value of investment securities, other assets and liabilities—at the current rates of exchange;
(ii) purchases and sales of investment securities, income and expenses—at the rates of exchange prevailing on the respective dates of such transactions.
Although the net assets of the Series are presented at the foreign exchange rates and market values at the close of the period, the Series does not generally isolate that portion of the results of operations arising as a result of changes in the foreign exchange rates from the fluctuations arising from changes in the market prices of long-term portfolio securities held at the end of the period. Similarly, the Series does not generally isolate the effect of changes in foreign exchange rates from the fluctuations arising from changes in the market prices of long-term portfolio securities sold during the period. Accordingly, holding period realized foreign currency gains (losses) are included in the reported net realized gains (losses) on investment transactions. Notwithstanding the above, the Series does isolate the effect of fluctuations in foreign currency exchange rates when determining the gain (loss) upon the sale or maturity of foreign currency denominated debt obligations; such amounts are included in net realized gains (losses) on foreign currency transactions.
Net realized gains (losses) on foreign currency transactions represent net foreign exchange gains (losses) from holdings of foreign currencies, forward currency contracts, disposition
of foreign currencies, currency gains (losses) realized between the trade and settlement dates on securities transactions, and the difference between the amounts of interest, dividends and foreign withholding taxes recorded on the Series’ books and the U.S. dollar equivalent amounts actually received or paid. Net unrealized currency gains (losses) from valuing foreign currency denominated assets and liabilities (other than investments) at period-end exchange rates are reflected as a component of unrealized appreciation (depreciation) on investments and foreign currencies.
Master Netting Arrangements: The Series is subject to various Master Agreements, or netting arrangements, with select counterparties. These are agreements which a subadviser may have negotiated and entered into on behalf of the Series. A master netting arrangement between the Series and the counterparty permits the Series to offset amounts payable by the Series to the same counterparty against amounts to be received; and by the receipt of collateral from the counterparty by the Series to cover the Series’ exposure to the counterparty. However, there is no assurance that such mitigating factors are easily enforceable. In addition to master netting arrangements, the right to set-off exists when all the conditions are met such that each of the parties owes the other determinable amounts, the reporting party has the right to set-off the amount owed with the amount owed by the other party, the reporting party intends to set-off and the right of set-off is enforceable by law. During the reporting period, there was no intention to settle on a net basis and all amounts are presented on a gross basis on the Statement of Assets and Liabilities.
Securities Lending: The Series may lend its portfolio securities to banks and broker-dealers. The loans are secured by collateral at least equal to the market value of the securities loaned. Collateral pledged by each borrower is invested in a money market fund and is marked to market daily, based on the previous day’s market value, such that the value of the collateral exceeds the value of the loaned securities. For the period March 31, 2016 through July 18, 2016 the collateral was invested in an ultra-short bond fund. Loans are subject to termination at the option of the borrower or the Series. Upon termination of the loan, the borrower will return to the Series securities identical to the loaned securities. Should the borrower of the securities fail financially, the Series has the right to repurchase the securities in the open market using the collateral. The Series recognizes income, net of any rebate and securities lending agent fees, for lending its securities in the form of fees or interest on the investment of any cash received as collateral. The borrower receives all interest and dividends from the securities loaned and such payments are passed back to the lender in amounts equivalent thereto. The Series also continues to recognize any unrealized gain (loss) in the market price of the securities loaned and on the change in the value of the collateral invested that may occur during the term of the loan. In addition, realized gain (loss) is recognized on changes in the value of the collateral invested that may occur during the term of the loan.
Foreign security and currency transactions may involve certain considerations and risks not typically associated with those of domestic origin as a result of, among other factors, the possibility of political and economic instability or the level of governmental supervision and regulation of foreign securities markets.
| | | | |
| Prudential Jennison Global Opportunities Fund | | | 27 | |
Notes to Financial Statements (continued)
Securities Transactions and Net Investment Income: Securities transactions are recorded on the trade date. Realized gains (losses) from investment and currency transactions are calculated on the identified cost basis. Dividend income is recorded on the ex-date. Interest income, including amortization of premium and accretion of discount on debt securities, as required, is recorded on an accrual basis. Expenses are recorded on an accrual basis, which may require the use of certain estimates by management that may differ from actual.
Net investment income or loss (other than distribution fees, which are charged directly to the respective class and transfer agency fees specific to Class Q shares which are charged to that share class) and unrealized and realized gains (losses) are allocated daily to each class of shares based upon the relative proportion of adjusted net assets of each class at the beginning of the day.
Dividends and Distributions: The Series expects to pay dividends of net investment income and distributions from net realized capital and currency gains, if any, annually. Dividends and distributions to shareholders, which are determined in accordance with federal income tax regulations and may differ from generally accepted accounting principles, are recorded on the ex-date. Permanent book/tax differences relating to income and gain (loss) are reclassified amongst undistributed net investment income, accumulated net realized gain (loss) and paid-in capital in excess of par, as appropriate.
Taxes: For federal income tax purposes, each Series in the Fund is treated as a separate taxpaying entity. It is each Series’ policy to continue to meet the requirements of the Internal Revenue Code applicable to regulated investment companies and to distribute all of its taxable net investment income and capital gains, if any, to its shareholders. Therefore, no federal income tax provision is required. Withholding taxes on foreign dividends are recorded, net of reclaimable amounts, at the time the related income is earned.
Estimates: The preparation of the financial statements requires management to make estimates and assumptions that affect the reported amounts and disclosures in the financial statements. Actual results could differ from those estimates.
Note 2. Agreements
The Fund has a management agreement for the Series with PI. Pursuant to this agreement, PI has responsibility for all investment advisory services and supervises the subadviser’s performance of such services. PI has entered into a subadvisory agreement with Jennison Associates LLC (“Jennison”). The subadvisory agreement provides that Jennison furnishes investment advisory services in connection with the management of the Series. In connection therewith, Jennison is obligated to keep certain books and records of the Series. PI pays for the services of Jennison, the cost of compensation of officers of the Series,
occupancy and certain clerical and bookkeeping costs of the Series. The Series bears all other costs and expenses.
The management fee paid to PI is accrued daily and payable monthly at an annual rate of ..825% of the Series’ average daily net assets up to $1 billion and .80% of such assets in excess of $1 billion. The effective management fee rate before any waivers and/or expense reimbursement was .825% for the year ended October 31, 2016. The effective management fee rate net of waivers and/or expense reimbursement was .716%.
PI has contractually agreed through February 28, 2018 to limit the net annual operating expenses (exclusive of distribution and service (12b-1) fees, transfer agency expenses (including sub-transfer agency and networking fees), taxes (such as income and foreign withholdings taxes, stamp duty and deferred tax expenses), interest, underlying funds, brokerage, extraordinary and certain other expenses such as dividend, broker charges and interest expense on short sales) of each class of shares of the Series to .84% of the Series’ average daily net assets. Expenses waived/reimbursed by the Manager in accordance with this agreement may be recouped by the Manager within the same fiscal year during which such waiver/reimbursement is made if such recoupment can be realized without exceeding the expense limit in effect at the time of the recoupment for that fiscal year.
The Series has a distribution agreement with Prudential Investment Management Services LLC (“PIMS”), which acts as the distributor of the Class A, Class C, Class Q and Class Z shares of the Series. The Series compensates PIMS for distributing and servicing the Series’ Class A and Class C shares, pursuant to plans of distribution (the “Distribution Plans”), regardless of expenses actually incurred by PIMS. The distribution fees are accrued daily and payable monthly. No distribution or service fees are paid to PIMS as distributor of the Class Q and Class Z shares of the Series.
Pursuant to the Distribution Plans, the Series compensates PIMS for distribution related activities at an annual rate of up to .30% and 1% of the average daily net assets of the Class A and C shares, respectively. PIMS has contractually agreed to limit such fees to .25% of the average daily net assets of the Class A shares through February 28, 2018.
PIMS has advised the Series that it has received $623,483 in front-end sales charges resulting from sales of Class A shares during the year ended October 31, 2016. From these fees, PIMS paid such sales charges to affiliated broker-dealers, which in turn paid commissions to salespersons and incurred other distribution costs.
PIMS has advised the Series that for the year ended October 31, 2016 it has received $3,034 and $28,455 in contingent deferred sales charges imposed upon redemption by certain Class A and Class C shareholders, respectively.
PI, PIMS and Jennison are indirect, wholly-owned subsidiaries of Prudential Financial, Inc. (“Prudential”).
| | | | |
| Prudential Jennison Global Opportunities Fund | | | 29 | |
Notes to Financial Statements (continued)
Note 3. Other Transactions with Affiliates
Prudential Mutual Fund Services LLC (“PMFS”), an affiliate of PI and an indirect, wholly-owned subsidiary of Prudential, serves as the Series’ transfer agent. Transfer agent’s fees and expenses on the Statement of Operations include certain out-of-pocket expenses paid to non-affiliates, where applicable.
The Series may enter into certain securities purchase or sale transactions under Board approved Rule 17a-7 procedures. Rule 17a-7 is an exemptive rule under the 1940 Act, that permits purchase and sale transactions among affiliated investment companies, or between an investment company and a person that is affiliated solely by reason of having a common (or affiliated) investment adviser, common directors, and/or common officers. Such transactions are subject to ratification by the Board.
The Series invests its overnight sweep cash in the Prudential Core Ultra Short Bond Fund, (formerly known as Prudential Core Taxable Money Market Fund), (the “Core Fund”), and its securities lending cash collateral in the Prudential Institutional Money Market Fund, (the “Money Market Fund”), each a portfolio of the Prudential Investment Portfolios 2, registered under the 1940 Act and managed by PI. Earnings from the Core and the Money Market Funds are disclosed on the Statement of Operations as “Affiliated dividend income” and “Income from securities lending, net”, respectively.
Note 4. Portfolio Securities
The cost of purchases and proceeds from sales of portfolio securities, other than short-term investments, for the year ended October 31, 2016 were $324,924,846 and $247,468,274, respectively.
Note 5. Distributions and Tax Information
Distributions to shareholders, which are determined in accordance with federal income tax regulations and which may differ from generally accepted accounting principles, are recorded on the ex-date. In order to present accumulated net investment loss, accumulated net realized loss on investment and foreign currency transactions and paid-in capital in excess of par on the Statement of Assets and Liabilities that more closely represent their tax character, certain adjustments have been made to accumulated net investment loss, accumulated net realized loss on investment and foreign currency transactions and paid-in capital in excess of par. For the year ended October 31, 2016, the adjustments were to decrease accumulated net investment loss by $711,131, decrease accumulated net realized loss on investment and foreign currency transactions by $56,397 and decrease paid-in capital in excess of par by $767,528 due to a net operating loss and
certain transactions involving foreign currencies. Net investment loss, net realized gain (loss) on investment and foreign currency transactions and net assets were not affected by this change.
For the years ended October 31, 2016 and October 31, 2015, there were no distributions paid by the Series.
As of October 31, 2016, the Series had no undistributed earnings on a tax basis.
The United States federal income tax basis of the Series’ investments and the net unrealized appreciation as of October 31, 2016 were as follows:
| | | | | | | | | | |
Tax Basis | | Appreciation | | Depreciation | | Net
Unrealized
Appreciation | | Other Cost Basis
Adjustments | | Total Net
Unrealized
Appreciation |
| $245,631,808 | | $40,150,181 | | $(7,422,293) | | $32,727,888 | | $(1,575) | | $32,726,313 |
The difference between book basis and tax basis is primarily attributable to deferred losses on wash sales. The other cost basis adjustments are primarily attributable to appreciation (depreciation) of foreign currencies and mark-to-market of receivables and payables.
For federal income tax purposes, the Series had a capital loss carryforward as of October 31, 2016 of approximately $27,478,000 which can be carried forward for an unlimited period. No capital gains distributions are expected to be paid to shareholders until net gains have been realized in excess of such losses.
The Series elected to treat certain late-year ordinary income losses of approximately $723,000 as having been incurred in the following fiscal year (October 31, 2017).
Management has analyzed the Series’ tax positions taken on federal, state and local income tax returns for all open tax years and has concluded that no provision for income tax is required in the Series’ financial statements for the current reporting period. The Series’ federal, state and local income and federal excise tax returns for tax years for which the applicable statutes of limitations have not expired are subject to examination by the Internal Revenue Service and state departments of revenue.
Note 6. Capital
The Series offers Class A, Class C, Class Q and Class Z shares. Class A shares are subject to a maximum front-end sales charge of 5.50%. All investors who purchase Class A shares in an amount of $1 million or more and sell these shares within 12 months of purchase are subject to a contingent deferred sales charge (“CDSC”) of 1%. The Class A CDSC is waived for purchases by certain retirement or benefits plans. Class C shares are sold with a CDSC of 1% on shares redeemed within the first 12 months after purchase. Class Q and Class Z shares are not subject to any sales or redemption charge and are offered exclusively for
| | | | |
| Prudential Jennison Global Opportunities Fund | | | 31 | |
Notes to Financial Statements (continued)
sale to a limited group of investors. A special exchange privilege is also available for shareholders who qualified to purchase Class A shares at net asset value.
Under certain circumstances, an exchange may be made from specified share classes of the Series to one or more other share classes of the Series as presented in the table of transactions in shares of capital stock.
There are 675 million shares of common stock at $.01 par value per share, designated Class A, Class C, Class Q and Class Z common stock each of which consists of 150 million, 125 million, 200 million, and 200 million authorized shares, respectively.
As of October 31, 2016, Prudential through its affiliates, owned 707 Class Q shares of the Series. In addition, 4 shareholders of record held 49% of the Series’ outstanding shares on behalf of multiple beneficial owners.
Transactions in shares of common stock were as follows:
| | | | | | | | |
Class A | | Shares | | | Amount | |
Year ended October 31, 2016: | | | | | | | | |
Shares sold | | | 4,917,603 | | | $ | 74,099,622 | |
Shares reacquired | | | (3,588,967 | ) | | | (52,198,226 | ) |
| | | | | | | | |
Net increase (decrease) in shares outstanding before conversion | | | 1,328,636 | | | | 21,901,396 | |
Shares issued upon conversion from other share class(es) | | | 72,822 | | | | 1,078,878 | |
Shares reacquired upon conversion into other share class(es) | | | (221,310 | ) | | | (3,302,153 | ) |
| | | | | | | | |
Net increase (decrease) in shares outstanding | | | 1,180,148 | | | $ | 19,678,121 | |
| | | | | | | | |
Year ended October 31, 2015: | | | | | | | | |
Shares sold | | | 4,298,012 | | | $ | 66,366,441 | |
Shares reacquired | | | (766,765 | ) | | | (11,329,060 | ) |
| | | | | | | | |
Net increase (decrease) in shares outstanding before conversion | | | 3,531,247 | | | | 55,037,381 | |
Shares issued upon conversion from other share class(es) | | | 6,271 | | | | 97,035 | |
Shares reacquired upon conversion into other share class(es) | | | (302,683 | ) | | | (4,604,448 | ) |
| | | | | | | | |
Net increase (decrease) in shares outstanding | | | 3,234,835 | | | $ | 50,529,968 | |
| | | | | | | | |
| | | | | | | | |
Class C | | Shares | | | Amount | |
Year ended October 31, 2016: | | | | | | | | |
Shares sold | | | 2,729,452 | | | $ | 40,204,884 | |
Shares reacquired | | | (1,010,034 | ) | | | (14,223,430 | ) |
| | | | | | | | |
Net increase (decrease) in shares outstanding before conversion | | | 1,719,418 | | | | 25,981,454 | |
Shares reacquired upon conversion into other share class(es) | | | (50,695 | ) | | | (759,086 | ) |
| | | | | | | | |
Net increase (decrease) in shares outstanding | | | 1,668,723 | | | $ | 25,222,368 | |
| | | | | | | | |
Year ended October 31, 2015: | | | | | | | | |
Shares sold | | | 1,607,386 | | | $ | 24,055,556 | |
Shares reacquired | | | (105,939 | ) | | | (1,539,083 | ) |
| | | | | | | | |
Net increase (decrease) in shares outstanding before conversion | | | 1,501,447 | | | | 22,516,473 | |
Shares reacquired upon conversion into other share class(es) | | | (9,846 | ) | | | (143,223 | ) |
| | | | | | | | |
Net increase (decrease) in shares outstanding | | | 1,491,601 | | | $ | 22,373,250 | |
| | | | | | | | |
Class Q | | | | | | |
Year ended October 31, 2016: | | | | | | | | |
Shares sold | | | 563,204 | | | $ | 9,000,000 | |
| | | | | | | | |
Net increase (decrease) in shares outstanding | | | 563,204 | | | $ | 9,000,000 | |
| | | | | | | | |
Year ended October 31, 2015: | | | | | | | | |
Shares sold | | | 707 | | | $ | 10,000 | |
| | | | | | | | |
Net increase (decrease) in shares outstanding | | | 707 | | | $ | 10,000 | |
| | | | | | | | |
Class Z | | | | | | |
Year ended October 31, 2016: | | | | | | | | |
Shares sold | | | 9,732,772 | | | $ | 146,971,888 | |
Shares reacquired | | | (8,986,305 | ) | | | (129,883,737 | ) |
| | | | | | | | |
Net increase (decrease) in shares outstanding before conversion | | | 746,467 | | | | 17,088,151 | |
Shares issued upon conversion from other share class(es) | | | 247,411 | | | | 3,745,581 | |
Shares reacquired upon conversion into other share class(es) | | | (51,894 | ) | | | (763,220 | ) |
| | | | | | | | |
Net increase (decrease) in shares outstanding | | | 941,984 | | | $ | 20,070,512 | |
| | | | | | | | |
Year ended October 31, 2015: | | | | | | | | |
Shares sold | | | 4,928,215 | | | $ | 76,117,418 | |
Shares reacquired | | | (1,077,251 | ) | | | (16,101,802 | ) |
| | | | | | | | |
Net increase (decrease) in shares outstanding before conversion | | | 3,850,964 | | | | 60,015,616 | |
Shares issued upon conversion from other shares class(es) | | | 309,766 | | | | 4,747,671 | |
Shares reacquired upon conversion into other share class(es) | | | (6,222 | ) | | | (97,035 | ) |
| | | | | | | | |
Net increase (decrease) in shares outstanding | | | 4,154,508 | | | $ | 64,666,252 | |
| | | | | | | | |
Note 7. Borrowings
The Series, along with other affiliated registered investment companies (the “Funds”), is a party to a Syndicated Credit Agreement (“SCA”) with a group of banks. The purpose of the SCA is to provide an alternative source of temporary funding for capital share redemptions. The SCA provides for a commitment of $900 million for the period October 6, 2016 through October 5, 2017. The Funds pay an annualized commitment fee of .15% of the unused portion of the SCA. The interest rate on borrowings under the SCA is paid monthly and at a
| | | | |
| Prudential Jennison Global Opportunities Fund | | | 33 | |
Notes to Financial Statements (continued)
per annum rate based upon the higher of 0.0%, the effective federal funds rate, or the One-Month LIBOR rate, plus a contractual spread. Prior to October 6, 2016, the Funds had another SCA that provided a commitment of $900 million and the Funds paid an annualized commitment fee of .11% of the unused portion of the SCA. The interest rate on borrowings was substantially the same. The Series’ portion of the commitment fee for the unused amount is accrued daily and paid quarterly.
The Series utilized the SCA during the year ended October 31, 2016. The average daily balance for the 41 days the Series had loans outstanding during the period was $1,300,610, borrowed at a weighted average interest rate of 1.71%. The maximum loan balance outstanding during the period was $6,644,000. At October 31, 2016, the Series did not have an outstanding loan balance.
Note 8. Recent Accounting Pronouncements and Reporting Updates
In January 2016, the FASB issued Accounting Standards Update (“ASU”) No. 2016-01 regarding “Recognition and Measurement of Financial Assets and Financial Liabilities”. The new guidance is intended to enhance the reporting model for financial instruments to provide users of financial statements with more decision-useful information and addresses certain aspects of the recognition, measurement, presentation, and disclosure of financial instruments. The new standard affects all entities that hold financial assets or owe financial liabilities. The new guidance is effective for public companies for fiscal years beginning after December 15, 2017, including interim periods within those fiscal years. At this time, management is evaluating the implications of ASU No. 2016-01 and its impact on the financial statements and disclosures has not yet been determined.
On October 13, 2016, the Securities and Exchange Commission (the “SEC”) adopted new rules and forms and amended existing rules and forms which are intended to modernize and enhance the reporting and disclosure of information by registered investment companies and to improve the quality of information that funds provide to investors, including modifications to Regulation S-X which would require standardized, enhanced disclosure about derivatives in investment company financial statements. In an effort to enhance monitoring and regulation, the new rules and forms will allow the SEC to more effectively collect and use data reported by funds. The new rules also enhance disclosure regarding fund liquidity and redemption practices. Also under the new rules, the SEC will permit open-end funds, with the exception of money market funds, to offer swing pricing, subject to board approval and review. The compliance dates of the modifications to Regulation S-X are August 1, 2017 and other amendments and rules are generally June 1, 2018 and December 1, 2018. Management is currently evaluating the impacts to the financial statement disclosures, if any.
Financial Highlights
| | | | | | | | | | | | | | | | | | | | | | | | |
| Class A Shares | |
| | | Year Ended October 31, | | | | | | March 14,
2012(a)
through
October 31, | |
| | | 2016(b) | | | 2015(b) | | | 2014(b) | | | 2013(b) | | | | | | 2012 | |
| Per Share Operating Performance: | | | | | | | | | | | | | | | | | | | | | | | | |
| Net Asset Value, Beginning of Period | | | $15.63 | | | | $14.08 | | | | $12.94 | | | | $9.86 | | | | | | | | $10.00 | |
| Income (loss) from investment operations: | | | | | | | | | | | | | | | | | | | | | | | | |
| Net investment income (loss) | | | (.05) | | | | (.09 | ) | | | (.11 | ) | | | (.06 | ) | | | | | | | (.02 | ) |
| Net realized and unrealized gain (loss) on investment and foreign currency transactions | | | (.44) | | | | 1.64 | | | | 1.25 | | | | 3.14 | | | | | | | | (.12 | ) |
| Total from investment operations | | | (.49) | | | | 1.55 | | | | 1.14 | | | | 3.08 | | | | | | | | (.14 | ) |
| Net asset value, end of period | | | $15.14 | | | | $15.63 | | | | $14.08 | | | | $12.94 | | | | | | | | $9.86 | |
| Total Return(c): | | | (3.13)% | | | | 11.01% | | | | 8.81% | | | | 31.24% | | | | | | | | (1.40)% | |
| |
| Ratios/Supplemental Data: | |
| Net assets, end of period (000) | | | $89,579 | | | | $74,049 | | | | $21,150 | | | | $10,035 | | | | | | | | $3,898 | |
| Average net assets (000) | | | $100,220 | | | | $36,635 | | | | $19,352 | | | | $4,982 | | | | | | | | $2,967 | |
| Ratios to average net assets(d): | | | | | | | | | | | | | | | | | | | | | | | | |
| Expenses after waivers and/or expense reimbursement | | | 1.20% | | | | 1.38% | | | | 1.60% | | | | 1.60% | | | | | | | | 1.60% | (e) |
| Expenses before waivers and/or expense reimbursement | | | 1.36% | | | | 1.56% | | | | 1.71% | | | | 2.19% | | | | | | | | 3.10% | (e) |
| Net investment income (loss) | | | (.31)% | | | | (.63)% | | | | (.78)% | | | | (.54)% | | | | | | | | (.30)% | (e) |
| Portfolio turnover rate | | | 88% | | | | 58% | | | | 68% | | | | 70% | | | | | | | | 48% | (f) |
| (a) | Commencement of operations. |
| (b) | Calculated based on average shares outstanding during the period. |
| (c) | Total return does not consider the effects of sales loads. Total return is calculated assuming a purchase of a share on the first day and a sale on the last day of each period reported and includes reinvestment of dividends and distributions, if any. Total returns may reflect adjustments to conform to generally accepted accounting principles. Total returns for periods less than a full year are not annualized. |
| (d) | Does not include expenses of the underlying fund in which the Series invests. |
See Notes to Financial Statements.
| | | | |
| Prudential Jennison Global Opportunities Fund | | | 35 | |
Financial Highlights (continued)
| | | | | | | | | | | | | | | | | | | | | | | | |
| Class C Shares | |
| | | Year Ended October 31, | | | | | | March 14,
2012(a)
through
October 31, | |
| | | 2016(b) | | | 2015(b) | | | 2014(b) | | | 2013(b) | | | | | | 2012 | |
| Per Share Operating Performance: | | | | | | | | | | | | | | | | | | | | | | | | |
| Net Asset Value, Beginning of Period | | | $15.20 | | | | $13.79 | | | | $12.77 | | | | $9.81 | | | | | | | | $10.00 | |
| Income (loss) from investment operations: | | | | | | | | | | | | | | | | | | | | | | | | |
| Net investment income (loss) | | | (.15) | | | | (.20 | ) | | | (.21 | ) | | | (.14 | ) | | | | | | | (.06 | ) |
| Net realized and unrealized gain (loss) on investment and foreign currency transactions | | | (.44) | | | | 1.61 | | | | 1.23 | | | | 3.10 | | | | | | | | (.13 | ) |
| Total from investment operations | | | (.59) | | | | 1.41 | | | | 1.02 | | | | 2.96 | | | | | | | | (.19 | ) |
| Net asset value, end of period | | | $14.61 | | | | $15.20 | | | | $13.79 | | | | $12.77 | | | | | | | | $9.81 | |
| Total Return(c): | | | (3.88)% | | | | 10.22% | | | | 7.99% | | | | 30.17% | | | | | | | | (1.90)% | |
| | | | | |
| Ratios/Supplemental Data: | |
| Net assets, end of period (000) | | | $52,246 | | | | $28,982 | | | | $5,723 | | | | $1,659 | | | | | | | | $593 | |
| Average net assets (000) | | | $50,113 | | | | $11,330 | | | | $4,361 | | | | $950 | | | | | | | | $300 | |
| Ratios to average net assets(d): | | | | | | | | | | | | | | | | | | | | | | | | |
| Expenses after waivers and/or expense reimbursement | | | 1.95% | | | | 2.12% | | | | 2.35% | | | | 2.35% | | | | | | | | 2.35% | (e) |
| Expenses before waivers and/or expense reimbursement | | | 2.06% | | | | 2.27% | | | | 2.41% | | | | 2.89% | | | | | | | | 3.85% | (e) |
| Net investment income (loss) | | | (1.07)% | | | | (1.37)% | | | | (1.54)% | | | | (1.26)% | | | | | | | | (.97)% | (e) |
| Portfolio turnover rate | | | 88% | | | | 58% | | | | 68% | | | | 70% | | | | | | | | 48% | (f) |
| (a) | Commencement of operations. |
| (b) | Calculated based on average shares outstanding during the period. |
| (c) | Total return does not consider the effects of sales loads. Total return is calculated assuming a purchase of a share on the first day and a sale on the last day of each period reported and includes reinvestment of dividends and distributions, if any. Total returns may reflect adjustments to conform to generally accepted accounting principles. Total returns for periods less than a full year are not annualized. |
| (d) | Does not include expenses of the underlying fund in which the Series invests. |
See Notes to Financial Statements.
| | | | | | | | |
| Class Q Shares | |
| | | Year Ended
October 31,
2016(b) | | | December 22,
2014(a)
through
October 31, 2015 | |
| Per Share Operating Performance(b): | | | | | | | | |
| Net Asset Value, Beginning of Period | | | $15.78 | | | | $14.15 | |
| Income (loss) from investment operations: | | | | | | | | |
| Net investment income (loss) | | | .01 | | | | (.03 | ) |
| Net realized and unrealized gain (loss) on investment and foreign currency transactions | | | (.46 | ) | | | 1.66 | |
| Total from investment operations | | | (.45 | ) | | | 1.63 | |
| Net asset value, end of period | | | $15.33 | | | | $15.78 | |
| Total Return(c): | | | (2.85)% | | | | 11.52% | |
| |
| Ratios/Supplemental Data: | |
| Net assets, end of period (000) | | | $8,647 | | | | $11 | |
| Average net assets (000) | | | $7,736 | | | | $11 | |
| Ratios to average net assets(d): | | | | | | | | |
| Expenses after waivers and/or expense reimbursement | | | .84% | | | | 1.09% | (e) |
| Expenses before waivers and/or expense reimbursement | | | .95% | | | | 1.18% | (e) |
| Net investment income (loss) | | | .05% | | | | (.27)% | (e) |
| Portfolio turnover rate | | | 88% | | | | 58% | (f) |
| (a) | Commencement of operations. |
| (b) | Calculated based on average shares outstanding during the period. |
| (c) | Total return is calculated assuming a purchase of a share on the first day and a sale on the last day of each period reported and includes reinvestment of dividends and distributions, if any. Total returns may reflect adjustments to conform to generally accepted accounting principles. Total returns for periods of less than one full year are not annualized. |
| (d) | Does not include expenses of the underlying portfolio in which the Series invests. |
See Notes to Financial Statements.
| | | | |
| Prudential Jennison Global Opportunities Fund | | | 37 | |
Financial Highlights (continued)
| | | | | | | | | | | | | | | | | | | | | | | | |
| Class Z Shares | |
| | | Year Ended October 31, | | | | | | March 14,
2012(a)
through
October 31, | |
| | | 2016(b) | | | 2015(b) | | | 2014(b) | | | 2013(b) | | | | | | 2012 | |
| Per Share Operating Performance: | | | | | | | | | | | | | | | | | | | | | | | | |
| Net Asset Value, Beginning of Period | | | $15.77 | | | | $14.17 | | | | $12.99 | | | | $9.87 | | | | | | | | $10.00 | |
| Income (loss) from investment operations: | | | | | | | | | | | | | | | | | | | | | | | | |
| Net investment income (loss) | | | (.01) | | | | (.06 | ) | | | (.08 | ) | | | (.03 | ) | | | | | | | - | (e) |
| Net realized and unrealized gain (loss) on investment and foreign currency transactions | | | (.45) | | | | 1.66 | | | | 1.26 | | | | 3.15 | | | | | | | | (.13 | ) |
| Total from investment operations | | | (.46) | | | | 1.60 | | | | 1.18 | | | | 3.12 | | | | | | | | (.13 | ) |
| Net asset value, end of period | | | $15.31 | | | | $15.77 | | | | $14.17 | | | | $12.99 | | | | | | | | $9.87 | |
| Total Return(c): | | | (2.92)% | | | | 11.29% | | | | 9.08% | | | | 31.61% | | | | | | | | (1.30)% | |
| | | | | |
| Ratios/Supplemental Data: | |
| Net assets, end of period (000) | | | $114,228 | | | | $102,800 | | | | $33,504 | | | | $25,219 | | | | | | | | $15,002 | |
| Average net assets (000) | | | $131,042 | | | | $48,494 | | | | $30,965 | | | | $18,340 | | | | | | | | $14,655 | |
| Ratios to average net assets(d): | | | | | | | | | | | | | | | | | | | | | | | | |
| Expenses after waivers and/or expense reimbursement | | | .95% | | | | 1.15% | | | | 1.35% | | | | 1.35% | | | | | | | | 1.35% | (f) |
| Expenses before waivers and/or expense reimbursement | | | 1.06% | | | | 1.28% | | | | 1.42% | | | | 1.89% | | | | | | | | 2.72% | (f) |
| Net investment income (loss) | | | (.07)% | | | | (.41)% | | | | (.56)% | | | | (.25)% | | | | | | | | (.03)% | (f) |
| Portfolio turnover rate | | | 88% | | | | 58% | | | | 68% | | | | 70% | | | | | | | | 48% | (g) |
| (a) | Commencement of operations. |
| (b) | Calculated based on average shares outstanding during the period. |
| (c) | Total return is calculated assuming a purchase of a share on the first day and a sale on the last day of each period reported and includes reinvestment of dividends and distributions, if any. Total returns may reflect adjustments to conform to generally accepted accounting principles. Total returns for periods less than a full year are not annualized. |
| (d) | Does not include expenses of the underlying fund in which the Series invests. |
| (e) | Less than $.005 per share. |
See Notes to Financial Statements.
Report of Independent Registered Public Accounting Firm
The Board of Directors and Shareholders Prudential World Fund, Inc.:
We have audited the accompanying statement of assets and liabilities of Prudential Jennison Global Opportunities Fund, one of the series constituting Prudential World Fund, Inc. (hereafter referred to as the “Fund”), including the portfolio of investments, as of October 31, 2016, and the related statement of operations for the year then ended, the statements of changes in net assets for each of the years in the two-year period then ended, and the financial highlights for each of the years in the four-year period then ended and the period from March 14, 2012 (commencement of operations) to October 31, 2012. These financial statements and financial highlights are the responsibility of the Fund’s management. Our responsibility is to express an opinion on these financial statements and financial highlights based on our audits.
We conducted our audits in accordance with the standards of the Public Company Accounting Oversight Board (United States). Those standards require that we plan and perform the audit to obtain reasonable assurance about whether the financial statements and financial highlights are free of material misstatement. An audit includes examining, on a test basis, evidence supporting the amounts and disclosures in the financial statements. Our procedures included confirmation of securities owned as of October 31, 2016, by correspondence with the custodian, transfer agent and brokers or by other appropriate auditing procedures when replies from brokers were not received. An audit also includes assessing the accounting principles used and significant estimates made by management, as well as evaluating the overall financial statement presentation. We believe that our audits provide a reasonable basis for our opinion.
In our opinion, the financial statements and financial highlights referred to above present fairly, in all material respects, the financial position of the Fund as of October 31, 2016, and the results of its operations, the changes in its net assets, and the financial highlights for each of the years or periods described in the first paragraph, in conformity with U.S. generally accepted accounting principles.

New York, New York
December 15, 2016
| | | | |
| Prudential Jennison Global Opportunities Fund | | | 39 | |
INFORMATION ABOUT BOARD MEMBERS AND OFFICERS
(Unaudited)
Information about Board Members and Officers of the Fund is set forth below. Board Members who are not deemed to be “interested persons” of the Fund, as defined in the 1940 Act, are referred to as “Independent Board Members.” Board Members who are deemed to be “interested persons” of the Fund are referred to as “Interested Board Members.” The Board Members are responsible for the overall supervision of the operations of the Fund and perform the various duties imposed on the directors of investment companies by the 1940 Act. The Board in turn elects the Officers, who are responsible for administering the day-to-day operations of the Fund.
| | | | |
| Independent Board Members(1) |
Name, Address, Age Position(s) Portfolios Overseen | | Principal Occupation(s) During Past Five Years | | Other Directorships Held During Past Five Years |
Ellen S. Alberding (58) Board Member Portfolios Overseen: 67 | | President and Board Member, The Joyce Foundation (charitable foundation) (since 2002); Vice Chair, City Colleges of Chicago (community college system) (since 2011); Trustee, Skills for America’s Future (national initiative to connect employers to community colleges) (since 2011); Trustee, National Park Foundation (charitable foundation for national park system) (since 2009); Trustee, Economic Club of Chicago (since 2009). | | None. |
Kevin J. Bannon (64) Board Member Portfolios Overseen: 67 | | Managing Director (April 2008-May 2015) and Chief Investment Officer (October 2008-November 2013) of Highmount Capital LLC (registered investment adviser); formerly Executive Vice President and Chief Investment Officer (April 1993-August 2007) of Bank of New York Company; President (May 2003-May 2007) of BNY Hamilton Family of Mutual Funds. | | Director of Urstadt Biddle Properties (equity real estate investment trust) (since September 2008). |
Linda W. Bynoe (64) Board Member Portfolios Overseen: 67 | | President and Chief Executive Officer (since March 1995) and formerly Chief Operating Officer (December 1989-February 1995) of Telemat Ltd. (management consulting); formerly Vice President (January 1985-June 1989) at Morgan Stanley & Co. (broker-dealer). | | Director of Simon Property Group, Inc. (retail real estate) (May 2003-May 2012); Director of Anixter International, Inc. (communication products distributor) (since January 2006); Director of Northern Trust Corporation (financial services) (since April 2006); Trustee of Equity Residential (residential real estate) (since December 2009). |
Prudential Jennison Global Opportunities Fund
| | | | |
| Independent Board Members(1) |
Name, Address, Age Position(s) Portfolios Overseen | | Principal Occupation(s) During Past Five Years | | Other Directorships Held During Past Five Years |
Keith F. Hartstein (60) Board Member Portfolios Overseen: 67 | | Retired; Member (since November 2014) of the Governing Council of the Independent Directors Council (organization of independent mutual fund directors); formerly President and Chief Executive Officer (2005-2012), Senior Vice President (2004-2005), Senior Vice President of Sales and Marketing (1997-2004), and various executive management positions (1990-1997), John Hancock Funds, LLC (asset management); Chairman, Investment Company Institute’s Sales Force Marketing Committee (2003-2008). | | None. |
Michael S. Hyland, CFA (71) Board Member Portfolios Overseen: 67 | | Retired (since February 2005); formerly Senior Managing Director (July 2001-February 2005) of Bear Stearns & Co, Inc.; Global Partner, INVESCO (1999-2001); Managing Director and President of Salomon Brothers Asset Management (1989-1999). | | None. |
Richard A. Redeker (73) Board Member & Independent Chair Portfolios Overseen: 67 | | Retired Mutual Fund Senior Executive (47 years); Management Consultant; Director, Mutual Fund Directors Forum (since 2014); Independent Directors Council (organization of independent mutual fund directors)-Executive Committee, Chair of Policy Steering Committee, Governing Council. | | None. |
Stephen G. Stoneburn (73) Board Member Portfolios Overseen: 67 | | Chairman (since July 2011), President and Chief Executive Officer (since June 1996) of Quadrant Media Corp. (publishing company); formerly President (June 1995-June 1996) of Argus Integrated Media, Inc.; Senior Vice President and Managing Director (January 1993-1995) of Cowles Business Media; Senior Vice President of Fairchild Publications, Inc. (1975-1989). | | None. |
Visit our website at prudentialfunds.com
| | | | |
| Interested Board Members(1) |
Name, Address, Age Position(s) Portfolios Overseen | | Principal Occupation(s) During Past Five Years | | Other Directorships Held During Past Five Years |
Stuart S. Parker (54) Board Member & President Portfolios Overseen: 67 | | President of Prudential Investments LLC (since January 2012); Executive Vice President of Prudential Investment Management Services LLC (since December 2012); Executive Vice President of Jennison Associates LLC and Head of Retail Distribution of Prudential Investments LLC (June 2005-December 2011). | | None. |
Scott E. Benjamin (43) Board Member & Vice President Portfolios Overseen: 67 | | Executive Vice President (since June 2009) of Prudential Investments LLC; Executive Vice President (June 2009-June 2012) and Vice President (since June 2012) of Prudential Investment Management Services LLC; Executive Vice President (since September 2009) of AST Investment Services, Inc.; Senior Vice President of Product Development and Marketing, Prudential Investments (since February 2006); Vice President of Product Development and Product Management, Prudential Investments (2003-2006). | | None. |
Grace C. Torres* (57) Board Member Portfolios Overseen: 65 | | Retired; formerly Treasurer and Principal Financial and Accounting Officer of the Prudential Investments Funds, Target Funds, Advanced Series Trust, Prudential Variable Contract Accounts and The Prudential Series Fund (1998-June 2014); Assistant Treasurer (March 1999-June 2014) and Senior Vice President (September 1999-June 2014) of Prudential Investments LLC; Assistant Treasurer (May 2003-June 2014) and Vice President (June 2005-June 2014) of AST Investment Services, Inc.; Senior Vice President and Assistant Treasurer (May 2003-June 2014) of Prudential Annuities Advisory Services, Inc. | | Director (since July 2015) of Sun Bancorp, Inc. N.A. |
| * | Note: Prior to her retirement in 2014, Ms. Torres was employed by Prudential Investments LLC. Due to her prior employment, she is considered to be an “interested person” under the 1940 Act. Ms. Torres is a Non-Management Interested Board Member. |
| (1) | The year that each Board Member joined the Board is as follows: |
Ellen S. Alberding; 2013; Kevin J. Bannon, 2008; Linda W. Bynoe, 2005; Keith F. Hartstein, 2013; Michael S. Hyland, 2008; Richard A. Redeker, 2003; Stephen G. Stoneburn, 1996; Grace C. Torres, 2014; Stuart S. Parker, Board Member and President since 2012; Scott E. Benjamin, Board Member since 2010 and Vice President since 2009.
Prudential Jennison Global Opportunities Fund
| | | | |
| Fund Officers(a) |
Name, Address and Age Position with Fund | | Principal Occupation(s) During Past Five Years | | Length of Service as Fund Officer |
Raymond A. O’Hara (61) Chief Legal Officer | | Vice President and Corporate Counsel (since July 2010) of Prudential Insurance Company of America (Prudential); Vice President (March 2011-Present) of Pruco Life Insurance Company and Pruco Life Insurance Company of New Jersey; Vice President and Corporate Counsel (March 2011-Present) of Prudential Annuities Life Assurance Corporation; Chief Legal Officer of Prudential Investments LLC (since June 2012); Chief Legal Officer of Prudential Mutual Fund Services LLC (since June 2012) and Corporate Counsel of AST Investment Services, Inc. (since June 2012); formerly Assistant Vice President and Corporate Counsel (September 2008-July 2010) of The Hartford Financial Services Group, Inc.; formerly Associate (September 1980-December 1987) and Partner (January 1988–August 2008) of Blazzard & Hasenauer, P.C. (formerly, Blazzard, Grodd & Hasenauer, P.C.). | | Since 2012 |
Chad A. Earnst (41) Chief Compliance Officer | | Chief Compliance Officer (September 2014-Present) of Prudential Investments LLC; Chief Compliance Officer (September 2014-Present) of the Prudential Investments Funds, Target Funds, Advanced Series Trust, The Prudential Series Fund, Prudential’s Gibraltar Fund, Inc., Prudential Global Short Duration High Yield Income Fund, Inc., Prudential Short Duration High Yield Fund, Inc. and Prudential Jennison MLP Income Fund, Inc.; formerly Assistant Director (March 2010-August 2014) of the Asset Management Unit, Division of Enforcement, US Securities & Exchange Commission; Assistant Regional Director (January 2010-August 2014), Branch Chief (June 2006–December 2009) and Senior Counsel (April 2003-May 2006) of the Miami Regional Office, Division of Enforcement, US Securities & Exchange Commission. | | Since 2014 |
Deborah A. Docs (58) Secretary | | Vice President and Corporate Counsel (since January 2001) of Prudential; Vice President (since December 1996) and Assistant Secretary (since March 1999) of Prudential Investments LLC; formerly Vice President and Assistant Secretary (May 2003-June 2005) of AST Investment Services, Inc. | | Since 2004 |
Jonathan D. Shain (58) Assistant Secretary | | Vice President and Corporate Counsel (since August 1998) of Prudential; Vice President and Assistant Secretary (since May 2001) of Prudential Investments LLC; Vice President and Assistant Secretary (since February 2001) of Prudential Mutual Fund Services LLC; formerly Vice President and Assistant Secretary (May 2003-June 2005) of AST Investment Services, Inc. | | Since 2005 |
Visit our website at prudentialfunds.com
| | | | |
| Fund Officers(a) |
Name, Address and Age Position with Fund | | Principal Occupation(s) During Past Five Years | | Length of Service as Fund Officer |
Claudia DiGiacomo (42) Assistant Secretary | | Vice President and Corporate Counsel (since January 2005) of Prudential; Vice President and Assistant Secretary of Prudential Investments LLC (since December 2005); Associate at Sidley Austin Brown & Wood LLP (1999-2004). | | Since 2005 |
Andrew R. French (53) Assistant Secretary | | Vice President and Corporate Counsel (since February 2010) of Prudential; formerly Director and Corporate Counsel (2006-2010) of Prudential; Vice President and Assistant Secretary (since January 2007) of Prudential Investments LLC; Vice President and Assistant Secretary (since January 2007) of Prudential Mutual Fund Services LLC. | | Since 2006 |
Theresa C. Thompson (54) Deputy Chief Compliance Officer | | Vice President, Compliance, Prudential Investments LLC (since April 2004); and Director, Compliance, Prudential Investments LLC (2001-2004). | | Since 2008 |
Charles H. Smith (43) Anti-Money Laundering Compliance Officer | | Vice President, Corporate Compliance, Anti-Money Laundering Unit (since January 2015) of Prudential; committee member of the American Council of Life Insurers Anti-Money Laundering and Critical Infrastructure Committee (since January 2016); formerly Global Head of Economic Sanctions Compliance at AIG Property Casualty (February 2007-December 2014); Assistant Attorney General at the New York State Attorney General’s Office, Division of Public Advocacy. (August 1998-January 2007). | | Since 2016 |
M. Sadiq Peshimam (52) Treasurer and Principal Financial and Accounting Officer | | Vice President (since 2005) of Prudential Investments LLC; formerly Assistant Treasurer of funds in the Prudential Mutual Fund Complex (2006-2014). | | Since 2006 |
Peter Parrella (58) Assistant Treasurer | | Vice President (since 2007) and Director (2004-2007) within Prudential Mutual Fund Administration; formerly Tax Manager at SSB Citi Fund Management LLC (1997-2004). | | Since 2007 |
Lana Lomuti (49) Assistant Treasurer | | Vice President (since 2007) and Director (2005-2007), within Prudential Mutual Fund Administration; formerly Assistant Treasurer (December 2007-February 2014) of The Greater China Fund, Inc. | | Since 2014 |
| Linda McMullin (55) Assistant Treasurer | | Vice President (since 2011) and Director (2008-2011) within Prudential Mutual Fund Administration. | | Since 2014 |
Kelly A. Coyne (48) Assistant Treasurer | | Director, Investment Operations of Prudential Mutual Fund Services LLC (since 2010). | | Since 2015 |
Prudential Jennison Global Opportunities Fund
| (a) | Excludes Mr. Parker and Mr. Benjamin, interested Board Members who also serve as President and Vice President, respectively. |
Explanatory Notes to Tables:
| • | | Board Members are deemed to be “Interested,” as defined in the 1940 Act, by reason of their affiliation with Prudential Investments LLC and/or an affiliate of Prudential Investments LLC. |
| • | | Unless otherwise noted, the address of all Board Members and Officers is c/o Prudential Investments LLC, 655 Broad Street, Newark, New Jersey 07102-4410. |
| • | | There is no set term of office for Board Members or Officers. The Board Members have adopted a retirement policy, which calls for the retirement of Board Members on December 31 of the year in which they reach the age of 75. |
| • | | “Other Directorships Held” includes only directorships of companies required to register or file reports with the SEC under the 1934 Act (that is, “public companies”) or other investment companies registered under the 1940 Act. |
| • | | “Portfolios Overseen” includes all investment companies managed by Prudential Investments LLC. The investment companies for which Prudential Investments LLC serves as manager include the Prudential Investments Mutual Funds, The Prudential Variable Contract Accounts, Target Mutual Funds, Prudential Short Duration High Yield Fund, Inc., Prudential Global Short Duration High Yield Fund, Inc., The Prudential Series Fund, Prudential’s Gibraltar Fund, Inc. and the Advanced Series Trust. |
Visit our website at prudentialfunds.com
Approval of Advisory Agreements (unaudited)
The Fund’s Board of Directors
The Board of Directors (the “Board”) of Prudential Jennison Global Opportunities Fund (the “Fund”)1 consists of ten individuals, seven of whom are not “interested persons” of the Fund, as defined in the Investment Company Act of 1940, as amended (the “1940 Act”) (the “Independent Directors”). The Board is responsible for the oversight of the Fund and its operations, and performs the various duties imposed on the directors of investment companies by the 1940 Act. The Independent Directors have retained independent legal counsel to assist them in connection with their duties. The Chair of the Board is an Independent Director. The Board has established three standing committees: the Audit Committee, the Nominating and Governance Committee, and the Investment Committee. Each committee is chaired by, and composed of, Independent Directors.
Annual Approval of the Fund’s Advisory Agreements
As required under the 1940 Act, the Board determines annually whether to renew the Fund’s management agreement with Prudential Investments LLC (“PI”) and the Fund’s subadvisory agreement with Jennison Associates LLC (“Jennison”). In considering the renewal of the agreements, the Board, including all of the Independent Directors, met on June 7-9, 2016 and approved the renewal of the agreements through July 31, 2017, after concluding that the renewal of the agreements was in the best interests of the Fund and its shareholders.
In advance of the meetings, the Board requested and received materials relating to the agreements, and had the opportunity to ask questions and request further information in connection with its consideration. Among other things, the Board considered comparative fee information from PI and Jennison. Also, the Board considered comparisons with other mutual funds in relevant Peer Universes and Peer Groups, as is further discussed below.
In approving the agreements, the Board, including the Independent Directors advised by independent legal counsel, considered the factors it deemed relevant, including the nature, quality and extent of services provided by PI and the subadviser, the performance of the Fund, the profitability of PI and its affiliates, expenses and fees, and the potential for economies of scale that may be shared with the Fund and its shareholders as the Fund’s assets grow. In their deliberations, the Directors did not identify any single factor which alone was responsible for the Board’s decision to approve the agreements with respect to the Fund. In connection with its deliberations, the Board considered information provided by PI throughout the year at regular Board meetings, presentations from portfolio managers and other information, as well as information furnished at or in advance of the meetings on June 7-9, 2016.
| 1 | Prudential Jennison Global Opportunities Fund is a series of Prudential World Fund, Inc. |
| | |
| Prudential Jennison Global Opportunities Fund |
Approval of Advisory Agreements (continued)
The Directors determined that the overall arrangements between the Fund and PI, which serves as the Fund’s investment manager pursuant to a management agreement, and between PI and Jennison, which serves as the Fund’s subadviser pursuant to the terms of a subadvisory agreement with PI, are in the best interests of the Fund and its shareholders in light of the services performed, fees charged and such other matters as the Directors considered relevant in the exercise of their business judgment.
The material factors and conclusions that formed the basis for the Directors’ reaching their determinations to approve the continuance of the agreements are separately discussed below.
Nature, Quality, and Extent of Services
The Board received and considered information regarding the nature, quality and extent of services provided to the Fund by PI and Jennison. The Board considered the services provided by PI, including but not limited to the oversight of the subadviser for the Fund, as well as the provision of fund recordkeeping, compliance, and other services to the Fund. With respect to PI’s oversight of the subadviser, the Board noted that PI’s Strategic Investment Research Group (“SIRG”), which is a business unit of PI, is responsible for monitoring and reporting to PI’s senior management on the performance and operations of the subadviser. The Board also considered that PI pays the salaries of all of the officers and interested Directors of the Fund who are part of Fund management. The Board also considered the investment subadvisory services provided by Jennison, as well as adherence to the Fund’s investment restrictions and compliance with applicable Fund policies and procedures. The Board considered PI’s evaluation of the subadviser, as well as PI’s recommendation, based on its review of the subadviser, to renew the subadvisory agreement.
The Board considered the qualifications, backgrounds and responsibilities of PI’s senior management responsible for the oversight of the Fund and Jennison, and also considered the qualifications, backgrounds and responsibilities of Jennison’s portfolio managers who are responsible for the day-to-day management of the Fund’s portfolio. The Board was provided with information pertaining to PI’s and Jennison’s organizational structure, senior management, investment operations, and other relevant information pertaining to both PI and Jennison. The Board also noted that it received favorable compliance reports from the Fund’s Chief Compliance Officer (“CCO”) as to both PI and Jennison. The Board noted that Jennison is affiliated with PI.
The Board concluded that it was satisfied with the nature, extent and quality of the investment management services provided by PI and the subadvisory services provided to the Fund by Jennison, and that there was a reasonable basis on which to conclude that the Fund benefits from the services provided by PI and Jennison under the management and subadvisory agreements.
| | |
| Visit our website at prudentialfunds.com | | |
Costs of Services and Profits Realized by PI
The Board was provided with information on the profitability of PI and its affiliates in serving as the Fund’s investment manager. The Board discussed with PI the methodology utilized in assembling the information regarding profitability and considered its reasonableness. The Board recognized that it is difficult to make comparisons of profitability from fund management contracts because comparative information is not generally publicly available and is affected by numerous factors, including the structure of the particular adviser, the types of funds it manages, its business mix, numerous assumptions regarding allocations and the adviser’s capital structure and cost of capital. However, the Board considered that the cost of services provided by PI to the Fund during the year ended December 31, 2015 exceeded the management fees paid by the Fund, resulting in an operating loss to PI. The Board further noted that the subadviser is affiliated with PI and that its profitability is reflected in PI’s profitability report. Taking these factors into account, the Board concluded that the profitability of PI and its affiliates in relation to the services rendered was not unreasonable.
Economies of Scale
PI and the Board previously retained an outside business consulting firm to review management fee breakpoint usage and trends in management fees across the mutual fund industry. The consulting firm presented its analysis and conclusions as to the Funds’ management fee structures to the Board and PI. The Board and PI have discussed these conclusions extensively since that presentation.
The Board received and discussed information concerning economies of scale that PI may realize as the Fund’s assets grow beyond current levels. The Board considered information provided by PI regarding the launch date of the Fund, the management fees of the Fund compared to those of similarly managed Funds and PI’s investment in the Fund over time. The Board noted that economies of scale, if any, may be shared with the Fund in several ways, including low management fees from inception, additional technological and personnel investments to enhance shareholder services, and maintaining existing expense structures in the face of a rising cost environment. The Board considered PI’s assertion that it continually evaluates the management fee schedule of the Fund and the potential to share economies of scale through breakpoints or fee waivers as asset levels increase.
The Board recognized the inherent limitations of any analysis of economies of scale, stemming largely from the Board’s understanding that most of PI’s costs are not specific to individual funds, but rather are incurred across a variety of products and services.
| | |
| Prudential Jennison Global Opportunities Fund |
Approval of Advisory Agreements (continued)
Other Benefits to PI and Jennison
The Board considered potential ancillary benefits that might be received by PI and Jennison and their affiliates as a result of their relationship with the Fund. The Board concluded that potential benefits to be derived by PI included transfer agency fees received by the Fund’s transfer agent (which is affiliated with PI), as well as benefits to its reputation or other intangible benefits resulting from PI’s association with the Fund. The Board concluded that the potential benefits to be derived by Jennison included the ability to use soft dollar credits, as well as the potential benefits consistent with those generally resulting from an increase in assets under management, specifically, potential access to additional research resources and benefits to its reputation. The Board concluded that the benefits derived by PI and Jennison were consistent with the types of benefits generally derived by investment managers and subadvisers to mutual funds.
Performance of the Fund / Fees and Expenses
The Board considered certain additional specific factors and made related conclusions relating to the historical performance of the Fund for the one- and three-year periods ended December 31, 2015.
The Board also considered the Fund’s actual management fee, as well as the Fund’s net total expense ratio, for the fiscal year ended October 31, 2015. The Board considered the management fee for the Fund as compared to the management fee charged by PI to other funds and the fee charged by other advisers to comparable mutual funds in a Peer Group. The actual management fee represents the fee rate actually paid by Fund shareholders and includes any fee waivers or reimbursements. The net total expense ratio for the Fund represents the actual expense ratio incurred by Fund shareholders.
The mutual funds included in the Peer Universe (the Lipper Global Multi-Cap Growth Funds Performance Universe) and the Peer Group were objectively determined by Broadridge, an independent provider of mutual fund data. The comparisons placed the Fund in various quartiles, with the first quartile being the best 25% of the mutual funds (for performance, the best performing mutual funds and, for expenses, the lowest cost mutual funds).
The section below summarizes key factors considered by the Board and the Board’s conclusions regarding the Fund’s performance, fees and overall expenses. The table sets forth gross performance comparisons (which do not reflect the impact on performance of fund expenses, or any subsidies, expense caps or waivers that may be applicable) with the Peer Universe, actual management fees with the Peer Group (which reflect the impact of
| | |
| Visit our website at prudentialfunds.com | | |
any subsidies or fee waivers), and net total expenses with the Peer Group, each of which were key factors considered by the Board.
| | | | | | | | |
| Performance | | 1 Year | | 3 Years | | 5 Years | | 10 Years |
| | | 1st Quartile | | 1st Quartile | | N/A | | N/A |
| Actual Management Fees: 3rd Quartile |
| Net Total Expenses: 1st Quartile |
| | • | | The Board noted that Fund outperformed its benchmark index over all periods. |
| | • | | The Board and PI agreed to continue the Fund’s existing expense cap of 0.84% (exclusive of 12b-1, transfer agent, and certain other fees) through February 28, 2017. |
| | • | | The Board concluded that, in light of the above, it would be in the best interests of the Fund and its shareholders to continue to monitor performance and to renew the agreements. |
| | • | | The Board concluded that the management fees (including subadvisory fees) and total expenses were reasonable in light of the services provided. |
* * *
After full consideration of these factors, the Board concluded that the approval of the agreements was in the best interests of the Fund and its shareholders.
| | |
| Prudential Jennison Global Opportunities Fund |
| | | | |
| ∎ MAIL | | ∎ TELEPHONE | | ∎ WEBSITE |
655 Broad Street Newark, NJ 07102 | | (800) 225-1852 | | www.prudentialfunds.com |
|
| PROXY VOTING |
| The Board of Directors of the Fund has delegated to the Fund’s investment subadviser the responsibility for voting any proxies and maintaining proxy recordkeeping with respect to the Fund. A description of these proxy voting policies and procedures is available without charge, upon request, by calling (800) 225-1852 or by visiting the Securities and Exchange Commission’s website at www.sec.gov. Information regarding how the Fund voted proxies relating to portfolio securities during the most recent 12-month period ended June 30 is available on the Fund’s website and on the Securities and Exchange Commission’s website. |
|
| DIRECTORS |
| Ellen S. Alberding • Kevin J. Bannon • Scott E. Benjamin • Linda W. Bynoe • Keith F. Hartstein • Michael S. Hyland • Stuart S. Parker • Richard A. Redeker • Stephen G. Stoneburn • Grace C. Torres |
|
| OFFICERS |
| Stuart S. Parker, President • Scott E. Benjamin, Vice President • M. Sadiq Peshimam, Treasurer and Principal Financial and Accounting Officer • Raymond A. O’Hara, Chief Legal Officer • Deborah A. Docs, Secretary • Chad A. Earnst, Chief Compliance Officer • Theresa C. Thompson, Deputy Chief Compliance Officer • Charles H. Smith, Anti-Money Laundering Compliance Officer • Jonathan D. Shain, Assistant Secretary • Claudia DiGiacomo, Assistant Secretary • Andrew R. French, Assistant Secretary • Peter Parrella, Assistant Treasurer • Lana Lomuti, Assistant Treasurer • Linda McMullin, Assistant Treasurer • Kelly A. Coyne, Assistant Treasurer |
| | | | |
| MANAGER | | Prudential Investments LLC | | 655 Broad Street Newark, NJ 07102 |
|
| INVESTMENT SUBADVISER | | Jennison Associates LLC | | 466 Lexington Avenue
New York, NY 10017 |
|
| DISTRIBUTOR | | Prudential Investment
Management Services LLC | | 655 Broad Street Newark, NJ 07102 |
|
| CUSTODIAN | | The Bank of New York Mellon | | One Wall Street
New York, NY 10286 |
|
| TRANSFER AGENT | | Prudential Mutual Fund
Services LLC | | PO Box 9658
Providence, RI 02940 |
|
| INDEPENDENT REGISTERED PUBLIC ACCOUNTING FIRM | | KPMG LLP | | 345 Park Avenue New York, NY 10154 |
|
| FUND COUNSEL | | Willkie Farr & Gallagher LLP | | 787 Seventh Avenue
New York, NY 10019 |
|
|
| An investor should consider the investment objectives, risks, charges, and expenses of the Fund carefully before investing. The prospectus and summary prospectus contain this and other information about the Fund. An investor may obtain a prospectus and summary prospectus by visiting our website at www.prudentialfunds.com or by calling (800) 225-1852. The prospectus and summary prospectus should be read carefully before investing. |
|
| E-DELIVERY |
| To receive your mutual fund documents online, go to www.prudentialfunds.com/edelivery and enroll. Instead of receiving printed documents by mail, you will receive notification via email when new materials are available. You can cancel your enrollment or change your email address at any time by visiting the website address above. |
|
| SHAREHOLDER COMMUNICATIONS WITH DIRECTORS |
| Shareholders can communicate directly with the Board of Directors by writing to the Chair of the Board, Prudential Jennison Global Opportunities Fund, Prudential Investments, Attn: Board of Directors, 655 Broad Street, Newark, NJ 07102. Shareholders can communicate directly with an individual Director by writing to the same address. Communications are not screened before being delivered to the addressee. |
|
| AVAILABILITY OF PORTFOLIO SCHEDULE |
| The Fund files its complete schedule of portfolio holdings with the Securities and Exchange Commission for the first and third quarters of each fiscal year on Form N-Q. The Fund’s Forms N-Q are available on the Commission’s website at www.sec.gov. The Fund’s Forms N-Q may also be reviewed and copied at the Commission’s Public Reference Room in Washington, D.C. Information on the operation and location of the Public Reference Room may be obtained by calling 1-800-SEC-0330. The Fund’s schedule of portfolio holdings is also available on the Fund’s website as of the end of each month no sooner than 15 days after the end of the month. |
|
The Fund’s Statement of Additional Information contains additional information about the Fund’s Directors and is available without charge, upon request, by calling (800) 225-1852. |
Mutual Funds:
| | | | |
| ARE NOT INSURED BY THE FDIC OR ANY FEDERAL GOVERNMENT AGENCY | | MAY LOSE VALUE | | ARE NOT A DEPOSIT OF OR GUARANTEED BY ANY BANK OR ANY BANK AFFILIATE |
PRUDENTIAL JENNISON GLOBAL OPPORTUNITIES FUND
| | | | | | | | |
| SHARE CLASS | | A | | C | | Q | | Z |
| NASDAQ | | PRJAX | | PRJCX | | PRJQX | | PRJZX |
| CUSIP | | 743969719 | | 743969693 | | 743969594 | | 743969685 |
MF214E 0300094-00001-00
PRUDENTIAL INVESTMENTS, A PGIM BUSINESS | MUTUAL FUNDS
Prudential Jennison International Opportunities Fund
| | |
| ANNUAL REPORT | | OCTOBER 31, 2016 |

| | |
To enroll in e-delivery, go to prudentialfunds.com/edelivery | |  |
|
| Objective: To seek long-term growth of capital |
Highlights
PRUDENTIAL JENNISON INTERNATIONAL OPPORTUNITIES FUND
| • | | The Fund’s information technology holdings were strong contributors to positive return. These stocks included Tencent, China’s largest and most visited service portal, and social media giant Alibaba, and Buenos Aires-based online trading service MercadoLibre. (For a complete list of holdings, refer to the Portfolio of Investments section of this report.) (For a complete list of holdings, refer to the Portfolio of Investments section of this report.) |
| • | | On the negative side, health care companies where acquired growth plays a significant role, such as Allergan, declined as regulatory changes threatened to remove many of the tax benefits of mergers between US and offshore companies. |
| • | | Uncertainty about the UK’s post-Brexit economic outlook hurt select financials holdings based in Britain, including OneSavings Bank (a specialist lender focused on residential, commercial, and buy-to-rent mortgages), Aldermore (a diversified secured lender in both retail and commercial markets), and Hargreaves Lansdown (an online transaction-only retail discount broker). |
This report is not authorized for distribution to prospective investors unless preceded or accompanied by a current prospectus.
The views expressed in this report and information about the Fund’s portfolio holdings are for the period covered by this report and are subject to change thereafter.
Mutual funds are distributed by Prudential Investment Management Services LLC, member SIPC. Jennison Associates is a registered investment adviser. Both are Prudential Financial companies. © 2016 Prudential Financial, Inc. and its related entities. Jennison Associates, Jennison, the Prudential logo, and the Rock symbol are service marks of Prudential Financial, Inc. and its related entities, registered in many jurisdictions worldwide.
| | |
| 2 | | Visit our website at prudentialfunds.com |
Letter from the President

Dear Shareholder:
We hope you find the annual report for the Prudential Jennison International Opportunities Fund informative and useful. The report covers performance for the 12-month period that ended October 31, 2016.
During the reporting period, the US economy experienced modest growth. Labor markets were healthy, and consumer confidence rose. The housing market brightened somewhat, as momentum continued for the new home market. The Federal Reserve kept interest rates unchanged at its September meeting, but pointed to the strong possibility of a rate hike in December. Internationally, concerns over Brexit—the term used to represent Britain’s decision to leave the European Union—remained in the spotlight.
Equity markets in the US were firmly in positive territory at the end of the reporting period, as US stocks posted strong gains. European stocks struggled earlier, but found some traction in the third quarter. Asian markets also advanced, and emerging markets rose sharply.
US fixed income markets experienced overall gains. High yield bonds posted very strong results. Corporate bonds and Treasuries also performed well. Accommodative monetary policy by central banks helped lift global bond markets.
Given the uncertainty in today’s investment environment, we believe that active professional portfolio management offers a potential advantage. Active managers often have the knowledge and flexibility to find the best investment opportunities in the most challenging markets.
Even so, it’s best if investment decisions are based on your long-term goals rather than on short-term market and economic developments. We also encourage you to work with an experienced financial advisor who can help you set goals, determine your tolerance for risk, build a diversified plan that’s right for you, and make adjustments when necessary.
By having Prudential Investments help you address your goals, you gain the advantage of asset managers that also manage money for many major corporations and pension funds around the world. That means you benefit from the same expertise, innovation, and attention to risk demanded by today’s most sophisticated investors.
Thank you for choosing our family of funds.
Sincerely,

Stuart S. Parker, President
Prudential Jennison International Opportunities Fund
December 15, 2016
| | | | |
| Prudential Jennison International Opportunities Fund | | | 3 | |
Your Fund’s Performance (unaudited)
Performance data quoted represent past performance. Past performance does not guarantee future results. The investment return and principal value of an investment will fluctuate, so that an investor’s shares, when redeemed, may be worth more or less than their original cost. Current performance may be lower or higher than the past performance data quoted. An investor may obtain performance data as of the most recent month-end by visiting our website at www.prudentialfunds.com or by calling (800) 225-1852.
| | | | | | |
| Cumulative Total Returns (Without Sales Charges) as of 10/31/16 | |
| | One Year (%) | | | Since Inception (%) | |
| Class A | | –5.58 | | | 28.63 (6/5/12) | |
| Class C | | –6.34 | | | 24.52 (6/5/12) | |
| Class Q | | N/A | | | –5.66 (12/23/15) | |
| Class Z | | –5.30 | | | 30.13 (6/5/12) | |
| MSCI ACWI ex-US Index | | 0.22 | | | — | |
| Lipper International Multi-Cap Growth Funds Average | | –1.42 | | | — | |
| | | | | | |
| Average Annual Total Returns (With Sales Charges) as of 9/30/16 | |
| | One Year (%) | | | Since Inception (%) | |
| Class A | | 1.64 | | | 6.02 (6/5/12) | |
| Class C | | 5.65 | | | 6.62 (6/5/12) | |
| Class Q | | N/A | | | N/A (12/23/15) | |
| Class Z | | 7.82 | | | 7.69 (6/5/12) | |
| MSCI ACWI ex-US Index | | 9.26 | | | — | |
| Lipper International Multi-Cap Growth Funds Average | | 8.30 | | | — | |
| | | | | | |
| Average Annual Total Returns (With Sales Charges) as of 10/31/16 | |
| | One Year (%) | | | Since Inception (%) | |
| Class A | | –10.77 | | | 4.53 (6/5/12) | |
| Class C | | –7.28 | | | 5.10 (6/5/12) | |
| Class Q | | N/A | | | N/A (12/23/15) | |
| Class Z | | –5.30 | | | 6.16 (6/5/12) | |
| | |
| 4 | | Visit our website at prudentialfunds.com |
| | | | |
| Average Annual Total Returns (Without Sales Charges) as of 10/31/16 |
| | One Year (%) | | Since Inception (%) |
| Class A | | –5.58 | | 5.88 (6/5/12) |
| Class C | | –6.34 | | 5.10 (6/5/12) |
| Class Q | | N/A | | N/A (12/23/15) |
| Class Z | | –5.30 | | 6.16 (6/5/12) |
Growth of a $10,000 Investment
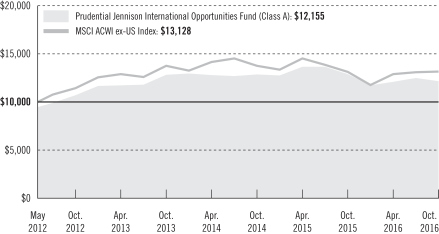
The graph compares a $10,000 investment in the Prudential Jennison International Opportunities Fund (Class A shares) with a similar investment in the MSCI ACWI ex-US Index by portraying the initial account values at the commencement of operations for Class A shares (June 5, 2012) and the account values at the end of the current fiscal year (October 31, 2016), as measured on a quarterly basis. For purposes of the graph, and unless otherwise indicated, it has been assumed that (a) the maximum applicable front-end sales charge was deducted from the initial $10,000 investment in Class A shares; (b) all recurring fees (including management fees) were deducted; and (c) all dividends and distributions were reinvested. The line graph provides information for Class A shares only. As indicated in the tables provided earlier, performance for Class C, Class Q, and Class Z shares will vary due to the differing charges and expenses applicable to each share class (as indicated in the following paragraphs). Without waiver of fees and/or expense reimbursement, if any, the Fund’s returns would have been lower.
| | | | |
| Prudential Jennison International Opportunities Fund | | | 5 | |
Your Fund’s Performance (continued)
Past performance does not predict future performance. Total returns and the ending account values in the graph include changes in share price and reinvestment of dividends and capital gains distributions in a hypothetical investment for the periods shown. The Fund’s total returns do not reflect the deduction of income taxes on an individual’s investment. Taxes may reduce your actual investment returns on income or gains paid by the Fund or any gains you may realize if you sell your shares.
Source: Prudential Investments LLC and Lipper Inc.
Inception returns are provided for any share class with less than 10 calendar years of returns.
The returns in the tables do not reflect the deduction of taxes that a shareholder would pay on Fund distributions or following the redemption of Fund shares. The average annual total returns take into account applicable sales charges, which are described for each share class in the table below.
| | | | | | | | |
| | | Class A | | Class C | | Class Q | | Class Z |
| Maximum initial sales charge | | 5.50% of the public offering price | | None | | None | | None |
Contingent deferred sales charge (CDSC)
(as a percentage of the lower of original purchase price or net asset value at redemption) | | 1% on sales of $1 million or more made within 12 months of purchase | | 1% on sales made within 12 months of purchase | | None | | None |
Annual distribution and service (12b-1) fees
(shown as a percentage of average daily net assets) | | .30%
(.25% currently) | | 1% | | None | | None |
Benchmark Definitions
MSCI All Country World Index ex-US Index—The Morgan Stanley Capital International All Country World Index ex-US Index (MSCI ACWI ex-US Index) is an unmanaged free float-adjusted market capitalization weighted index that is designed to measure the equity market performance of developed and emerging markets, excluding the US. The MSCI ACWI ex-US Index consists of 45 country indexes comprising 22 developed and 23 emerging market country indexes. The developed market country indexes included are: Australia, Austria, Belgium, Canada, Denmark, Finland, France, Germany, Hong Kong, Ireland, Israel, Italy, Japan, Netherlands, New Zealand, Norway, Portugal, Singapore, Spain, Sweden, Switzerland, and the United Kingdom. The emerging market country indexes included are: Brazil, Chile, China, Colombia, Czech Republic, Egypt, Greece, Hungary, India, Indonesia, Korea, Malaysia, Mexico, Peru, Philippines, Poland, Qatar, Russia, South Africa, Taiwan, Thailand, Turkey, and United Arab Emirates. The cumulative total returns for the MSCI ACWI ex-US Index measured from the month-end closest to the inception date through 10/31/16 are 31.28% for Class A,
| | |
| 6 | | Visit our website at prudentialfunds.com |
Class C, and Class Z shares and 4.30% for Class Q shares. The average annual total return for the MSCI ACWI ex-US Index measured from the month-end closest to the inception date through 9/30/16 is 6.84% for Class A, Class C, and Class Z shares. Class Q shares have been in existence for less than one year and have no average annual total return performance information available.
Lipper International Multi-Cap Growth Funds Average—The Lipper International Multi-Cap Growth Funds Average (Lipper Average) is based on the average return of all funds in the Lipper International Multi-Cap Growth Funds category for the periods noted. Funds in the Lipper Average, by portfolio practice, invest in a variety of market-capitalization ranges without concentrating 75% of their equity assets in any one market-capitalization range over an extended period of time. International multi-cap growth funds typically have above-average characteristics compared to the MSCI EAFE Index. The cumulative total returns for the Lipper Average measured from the month-end closest to the inception date through 10/31/16 are 36.11% for Class A, Class C, and Class Z shares and 0.60% for Class Q shares. The average annual total return for the Lipper Average measured from the month-end closest to the inception date through 9/30/16 is 8.10% for Class A, Class C, and Class Z shares. Class Q shares have been in existence for less than one year and have no average annual total return performance information available.
Investors cannot invest directly in an index or average. The returns for the Index would be lower if they included the effects of sales charges, operating expenses of a mutual fund, or taxes. Returns for the Lipper Average reflect the deduction of operating expenses, but not sales charges or taxes. The Since Inception returns for the Index and the Lipper Average are measured from the closest month-end to the inception date for the indicated share class.
| | | | |
Five Largest Holdings expressed as a
percentage of net assets as of 10/31/16 (%) | |
| Tencent Holdings Ltd., Internet Software & Services | | | 6.2 | |
| Alibaba Group Holding Ltd., Internet Software & Services | | | 5.5 | |
| Industria de Diseno Textil SA, Specialty Retail | | | 5.4 | |
| Dassault Systemes SA, Software | | | 5.2 | |
| adidas AG, Textiles, Apparel & Luxury Goods | | | 5.0 | |
Holdings reflect only long-term investments and are subject to change.
| | | | |
Five Largest Industries expressed as a
percentage of net assets as of 10/31/16 (%) | |
| Internet Software & Services | | | 14.7 | |
| Software | | | 12.9 | |
| Textiles, Apparel & Luxury Goods | | | 6.2 | |
| Specialty Retail | | | 5.4 | |
| IT Services | | | 5.4 | |
Industry weightings reflect only long-term investments and are subject to change.
| | | | |
| Prudential Jennison International Opportunities Fund | | | 7 | |
Strategy and Performance Overview
How did the Fund perform?
The Prudential Jennison International Opportunities Fund’s Class A shares returned –5.58% in the 12 months ended October 31, 2016. Over the same period, the MSCI ACWI ex-US Index (the Index) ticked up 0.22% and the Lipper International Multi-Cap Growth Funds Average returned –1.42%.
What was the market environment?
| • | | Numerous factors contributed to market volatility in the 12-month period, including decelerating economic growth in China; concerns that emerging economies might face balance sheet risks; the negative effect of lower energy prices on industrial sectors; fears of slowing economic growth in the US; uncertainty about the course of future Federal Reserve monetary tightening; Brexit, the United Kingdom’s vote to leave the European Union; and anxiety about the highly unconventional US presidential election. |
| • | | Risk aversion in this volatile global market environment affected how investors valued different securities. Low-volatility/high-dividend-paying and other “safety” stocks were significant drivers of market returns. Stocks of higher-growth companies generally underperformed. |
| • | | In the Index, the materials and information technology sectors posted double-digit advances; health care and consumer discretionary declined the most. By region, emerging markets gained the most while developed Europe lost ground. |
What worked?
| • | | The Fund’s information technology holdings were strong contributors to positive return: |
| | • | | Tencent, China’s largest and most visited internet service portal, continued to perform well, fundamentally driven by its dominant position in China’s online gaming and instant messaging markets and its growing advertising and payment service efforts. If a proposed merger closes, Tencent could also become China’s leading online music provider. |
| | • | | Buenos Aires-based online trading service MercadoLibre advanced on strong execution and enhanced marketplace initiatives, including integrated shipping and payment systems. The company enables individuals and businesses to electronically sell and buy items in more than 2,000 categories. Jennison likes MercadoLibre’s exposure to Latin America’s expanding internet penetration rates and low e-commerce share of the retail market. |
| | • | | Broadcom benefitted from a reacceleration of the iPhone build cycle and new Samsung smartphone product lines. Broadcom was formed in February 2016, when Avago Technologies completed its acquisition of Broadcom Corp. The company has |
| | |
| 8 | | Visit our website at prudentialfunds.com |
| | leading technologies and products in wireless connectivity (including combo-chips for smart phones, tablets, and the “Internet of things”) and broadband communications, infrastructure, and networking semiconductors. |
| | • | | Alibaba reported better-than-expected revenue, earnings, user metrics, gross merchandise value, monetization revenue, and margins. Jennison believes Alibaba, with its dominant market share, offers an attractive opportunity to invest in the long-term growth of the Chinese e-commerce market. |
| | • | | Videogame and videogame console maker Nintendo, which had been slow to adjust as the game industry extended to mobile platforms, advanced on strong mobile platform game launches. |
| • | | In consumer discretionary: |
| | • | | Adidas’s growth accelerated as new management repositioned the Adidas brand in North America, leveraged its Boost technology, and restructured product lines such as Golf. Based in Germany, Adidas sells sports shoes, apparel, and equipment in 160 countries. It is the world’s No. 3 sporting goods manufacturer behind Nike and Under Armour. |
| | • | | London-based global online apparel retailer ASOS benefitted from currency-translation tailwinds as the pound sterling weakened against the US dollar in the wake of the Brexit vote. Jennison likes the company’s strong revenue growth and international expansion opportunities and believes investment in warehouse operations and new markets positions the business for long-term growth. |
What didn’t work?
| | • | | Companies where acquired growth plays a significant role, such as Allergan, declined as regulatory changes threatened to remove many of the tax benefits of mergers between US and offshore companies. |
| | • | | Weakness in specialty pharmaceutical company Shire reflected concerns about potential competition in the hemophilia market. Shire has product franchises in neuroscience, gastrointestinal, and rare diseases. It has been transforming itself into a leading orphan disease company with a strong product pipeline and business development and acquisition opportunities. |
| | • | | Uncertainty about the UK’s post-Brexit economic outlook hurt select financials holdings based in Britain, including OneSavings Bank (a specialist lender focused on residential, commercial, and buy-to-rent mortgages), Aldermore (a diversified secured lender in both retail and commercial markets), and Hargreaves Lansdown (an online transaction-only retail discount broker). Jennison eliminated the Fund’s |
| | | | |
| Prudential Jennison International Opportunities Fund | | | 9 | |
Strategy and Performance Overview (continued)
| | positions in these three companies. It trimmed the Fund’s position in another Britain-based financials company, St. James’s Place, in early June to harvest some of the stock’s gain and to reduce exposure ahead of the Brexit referendum. It subsequently added to the position on indications that after the vote, flows continued to grow solidly. Jennison believes the asset manager, which is focused on the mass affluent market, is poised to grow sales and assets under management rapidly, helped by its strong competitive positioning, regulatory changes in the UK, and improved retail investor confidence. |
| • | | In consumer discretionary: |
| | • | | Corporate governance concerns and slightly lower-than-expected financial results prompted Jennison to first trim then eliminate the position in Luxottica, the world’s largest eyewear firm. Milan-based Luxottica vertically integrates design, manufacturing, and retailing. |
| | • | | Jennison also closed out the Fund’s position in ITV, the UK’s leading commercial broadcaster, as advertising revenue was expected to be hurt by post-Brexit economic uncertainty. |
The percentage points shown in the tables identify each security’s positive or negative contribution to the Fund’s return, which is the sum of all contributions by individual holdings.
| | | | | | |
| Top Contributors (%) | | Top Detractors (%) |
| Tencent Holdings | | 2.53 | | Allergan | | –1.11 |
| Adidas | | 1.47 | | OneSavings | | –1.04 |
| MercadoLibre | | 0.90 | | Shire | | –1.01 |
| ONO Pharmaceutical | | 0.75 | | ITV | | –1.01 |
| ASOS | | 0.50 | | Luxottica | | –0.95 |
Current outlook
| • | | With growth scarce in many sectors and businesses, companies that are able to generate longer-term, sustainable above-average growth should become increasingly attractive. This appeal is likely to be heightened by the muted nature of global growth, which is limiting opportunities to capitalize on a cyclical rebound, and the recent run-up in dividend-paying securities, which could suggest that yield substitutes are offering little additional relative appreciation potential at this point. |
| | |
| 10 | | Visit our website at prudentialfunds.com |
| • | | While 2016 has seen considerable volatility and mixed results across global equity markets, Jennison believes overall conditions favor its international growth strategy over a reasonable investment horizon. Jennison remains focused on identifying businesses that can generate organic growth and that continue to offer secular growth opportunities. The strategy remains heavily invested in technology, consumer discretionary, and health care stocks offering these characteristics, while industrials, financials, energy, consumer staples, and materials exposures remain quite small. Jennison will continue to carefully evaluate the fundamental outlooks of the Fund’s holdings and make adjustments as necessary as the overall global environment evolves. |
| | | | |
| Prudential Jennison International Opportunities Fund | | | 11 | |
Fees and Expenses (unaudited)
As a shareholder of the Fund, you incur two types of costs: (1) transaction costs, including sales charges (loads) on purchase payments and redemptions, as applicable, and (2) ongoing costs, including management fees, distribution, and/or service (12b-1) fees, and other Fund expenses, as applicable. This example is intended to help you understand your ongoing costs (in dollars) of investing in the Fund and to compare these costs with the ongoing costs of investing in other mutual funds.
The example is based on an investment of $1,000 invested on May 1, 2016, at the beginning of the period, and held through the six-month period ended October 31, 2016. The example is for illustrative purposes only; you should consult the Prospectus for information on initial and subsequent minimum investment requirements.
Actual Expenses
The first line for each share class in the table on the following page provides information about actual account values and actual expenses. You may use the information on this line, together with the amount you invested, to estimate the expenses that you paid over the period. Simply divide your account value by $1,000 (for example, an $8,600 account value ÷ $1,000 = 8.6), then multiply the result by the number on the first line under the heading “Expenses Paid During the Six-Month Period” to estimate the expenses you paid on your account during this period.
Hypothetical Example for Comparison Purposes
The second line for each share class in the table on the following page provides information about hypothetical account values and hypothetical expenses based on the Fund’s actual expense ratio and an assumed rate of return of 5% per year before expenses, which is not the Fund’s actual return. The hypothetical account values and expenses may not be used to estimate the actual ending account balance or expenses you paid for the period. You may use this information to compare the ongoing costs of investing in the Fund and other funds. To do so, compare this 5% hypothetical example with the 5% hypothetical examples that appear in the shareholder reports of the other funds.
The Fund’s transfer agent may charge additional fees to holders of certain accounts that are not included in the expenses shown in the table on the following page. These fees apply to individual retirement accounts (IRAs) and Section 403(b) accounts. As of the close of the six-month period covered by the table, IRA fees included an annual maintenance fee of $15 per account (subject to a maximum annual maintenance fee of $25 for all accounts held by the same shareholder). Section 403(b) accounts are charged an annual $25 fiduciary maintenance fee. Some of the fees may vary in amount, or may be waived, based on your total account balance or the number of Prudential Investments funds, including the Fund, that you own. You should consider the additional fees that were charged to your Fund account over the six-month period when you estimate the total ongoing expenses
| | |
| 12 | | Visit our website at prudentialfunds.com |
paid over the period and the impact of these fees on your ending account value, as these additional expenses are not reflected in the information provided in the expense table. Additional fees have the effect of reducing investment returns.
Please note that the expenses shown in the table are meant to highlight your ongoing costs only and do not reflect any transactional costs such as sales charges (loads). Therefore, the second line for each share class in the table is useful in comparing ongoing costs only and will not help you determine the relative total costs of owning different funds. In addition, if these transactional costs were included, your costs would have been higher.
| | | | | | | | | | | | | | | | | | |
Prudential
Jennison International
Opportunities Fund | | Beginning Account
Value
May 1, 2016 | | | Ending Account
Value
October 31, 2016 | | | Annualized
Expense Ratio
Based on the
Six-Month Period | | | Expenses Paid
During the
Six-Month Period* | |
| Class A | | Actual | | $ | 1,000.00 | | | $ | 1,005.70 | | | | 1.15 | % | | $ | 5.80 | |
| | Hypothetical | | $ | 1,000.00 | | | $ | 1,019.36 | | | | 1.15 | % | | $ | 5.84 | |
| Class C | | Actual | | $ | 1,000.00 | | | $ | 1,001.70 | | | | 1.90 | % | | $ | 9.56 | |
| | Hypothetical | | $ | 1,000.00 | | | $ | 1,015.58 | | | | 1.90 | % | | $ | 9.63 | |
| Class Q | | Actual | | $ | 1,000.00 | | | $ | 1,007.30 | | | | 0.84 | % | | $ | 4.24 | |
| | Hypothetical | | $ | 1,000.00 | | | $ | 1,020.91 | | | | 0.84 | % | | $ | 4.27 | |
| Class Z | | Actual | | $ | 1,000.00 | | | $ | 1,007.30 | | | | 0.90 | % | | $ | 4.54 | |
| | | Hypothetical | | $ | 1,000.00 | | | $ | 1,020.61 | | | | 0.90 | % | | $ | 4.57 | |
*Fund expenses (net of fee waivers or subsidies, if any) for each share class are equal to the annualized expense ratio for each share class (provided in the table), multiplied by the average account value over the period, multiplied by the 184 days in the six-month period ended October 31, 2016, and divided by the 366 days in the Fund’s fiscal year ended October 31, 2016 (to reflect the six-month period). Expenses presented in the table include the expenses of any underlying portfolios in which the Fund may invest.
| | | | |
| Prudential Jennison International Opportunities Fund | | | 13 | |
Fees and Expenses (continued)
The Fund’s annual expense ratios for the 12-month period ended October 31, 2016, are as follows:
| | | | |
| Class | | Gross Operating Expenses (%) | | Net Operating Expenses (%) |
| A | | 1.74 | | 1.15 |
| C | | 2.44 | | 1.90 |
| Q | | 1.43 | | 0.84 |
| Z | | 1.41 | | 0.90 |
Net operating expenses shown above reflect any fee waivers and/or expense reimbursements. Additional information on Fund expenses and any fee waivers and/or expense reimbursements can be found in the “Financial Highlights” tables in this report and in the Notes to the Financial Statements in this report.
| | |
| 14 | | Visit our website at prudentialfunds.com |
Portfolio of Investments
as of October 31, 2016
| | | | | | | | |
| Description | | Shares | | | Value (Note 1) | |
LONG-TERM INVESTMENTS 96.4% | | | | | | | | |
| | |
COMMON STOCKS 91.3% | | | | | | | | |
| | |
Argentina 3.0% | | | | | | | | |
MercadoLibre, Inc. | | | 8,118 | | | $ | 1,363,905 | |
| | |
Australia 1.6% | | | | | | | | |
Atlassian Corp. PLC (Class A Stock)* | | | 27,162 | | | | 729,571 | |
| | |
Brazil 2.1% | | | | | | | | |
Raia Drogasil SA | | | 42,736 | | | | 951,251 | |
| | |
China 11.7% | | | | | | | | |
Alibaba Group Holding Ltd., ADR*(a) | | | 24,548 | | | | 2,496,286 | |
Tencent Holdings Ltd. | | | 105,695 | | | | 2,801,165 | |
| | | | | | | | |
| | | | | | | 5,297,451 | |
| | |
France 6.4% | | | | | | | | |
Dassault Systemes SA | | | 29,784 | | | | 2,357,492 | |
Valeo SA | | | 9,962 | | | | 574,859 | |
| | | | | | | | |
| | | | | | | 2,932,351 | |
| | |
Germany 8.6% | | | | | | | | |
adidas AG | | | 13,789 | | | | 2,265,460 | |
Fresenius SE & Co. KGaA | | | 18,339 | | | | 1,355,024 | |
KUKA AG* | | | 2,434 | | | | 276,214 | |
| | | | | | | | |
| | | | | | | 3,896,698 | |
| | |
Hong Kong 1.8% | | | | | | | | |
Techtronic Industries Co. Ltd. | | | 221,976 | | | | 833,997 | |
| | |
India 2.6% | | | | | | | | |
HDFC Bank Ltd., ADR | | | 16,696 | | | | 1,181,743 | |
| | |
Indonesia 2.4% | | | | | | | | |
PT Astra International Tbk | | | 1,728,580 | | | | 1,090,575 | |
| | |
Italy 2.4% | | | | | | | | |
Brembo SpA | | | 8,920 | | | | 552,271 | |
Brunello Cucinelli SpA | | | 28,032 | | | | 555,266 | |
| | | | | | | | |
| | | | | | | 1,107,537 | |
| | |
Japan 10.1% | | | | | | | | |
LINE Corp., ADR*(a) | | | 17,939 | | | | 725,812 | |
Nintendo Co. Ltd. | | | 5,399 | | | | 1,301,484 | |
See Notes to Financial Statements.
| | | | |
| Prudential Jennison International Opportunities Fund | | | 15 | |
Portfolio of Investments (continued)
as of October 31, 2016
| | | | | | | | |
| Description | | Shares | | | Value (Note 1) | |
COMMON STOCKS (Continued) | | | | | | | | |
| | |
Japan (cont’d.) | | | | | | | | |
Ono Pharmaceutical Co. Ltd. | | | 16,088 | | | $ | 407,890 | |
Shionogi & Co. Ltd. | | | 15,097 | | | | 743,497 | |
Sysmex Corp. | | | 20,145 | | | | 1,396,091 | |
| | | | | | | | |
| | | | | | | 4,574,774 | |
| | |
Mexico 1.4% | | | | | | | | |
Alsea SAB de CV | | | 144,668 | | | | 539,759 | |
Alsea SAB de CV, 144A(b) | | | 23,432 | | | | 87,425 | |
| | | | | | | | |
| | | | | | | 627,184 | |
| | |
Netherlands 2.1% | | | | | | | | |
ASML Holding NV | | | 9,088 | | | | 961,460 | |
| | |
Singapore 2.2% | | | | | | | | |
Broadcom Ltd. | | | 5,959 | | | | 1,014,698 | |
| | |
Spain 8.6% | | | | | | | | |
Amadeus IT Holding SA | | | 30,396 | | | | 1,430,558 | |
Industria de Diseno Textil SA | | | 70,691 | | | | 2,466,591 | |
| | | | | | | | |
| | | | | | | 3,897,149 | |
| | |
Sweden 3.5% | | | | | | | | |
Atlas Copco AB (Class A Stock) | | | 30,630 | | | | 897,309 | |
Hexagon AB (Class B Stock) | | | 19,331 | | | | 676,432 | |
| | | | | | | | |
| | | | | | | 1,573,741 | |
| | |
Switzerland 2.0% | | | | | | | | |
Givaudan SA | | | 462 | | | | 893,540 | |
| | |
Thailand 2.2% | | | | | | | | |
CP ALL PCL | | | 580,430 | | | | 1,006,155 | |
| | |
United Kingdom 7.4% | | | | | | | | |
ASOS PLC* | | | 23,006 | | | | 1,476,845 | |
St. James’s Place PLC | | | 75,244 | | | | 868,982 | |
Worldpay Group PLC | | | 235,132 | | | | 817,189 | |
Worldpay Group PLC, 144A(b) | | | 53,118 | | | | 184,609 | |
| | | | | | | | |
| | | | | | | 3,347,625 | |
| | |
United States 9.2% | | | | | | | | |
Albemarle Corp. | | | 12,472 | | | | 1,042,035 | |
Allergan PLC* | | | 5,312 | | | | 1,109,889 | |
See Notes to Financial Statements.
| | | | | | | | |
| Description | | Shares | | | Value (Note 1) | |
COMMON STOCKS (Continued) | | | | | | | | |
| | |
United States (cont’d.) | | | | | | | | |
Mobileye NV* | | | 20,110 | | | $ | 747,690 | |
Shire PLC | | | 22,659 | | | | 1,279,394 | |
| | | | | | | | |
| | | | | | | 4,179,008 | |
| | | | | | | | |
TOTAL COMMON STOCKS
(cost $35,962,127) | | | | | | | 41,460,413 | |
| | | | | | | | |
| | |
PARTICIPATORY NOTES† 3.5% | | | | | | | | |
| | |
India | | | | | | | | |
Credit Suisse Bharti Infratel Ltd., expiring 06/18/20, Private Placement, 144A(b) | | | 112,214 | | | | 584,478 | |
Goldman Sachs Maruti Suzuki India, expiring 07/26/17, Private Placement, 144A(b) | | | 11,627 | | | | 1,027,837 | |
| | | | | | | | |
TOTAL PARTICIPATORY NOTES
(cost $1,548,039) | | | | | | | 1,612,315 | |
| | | | | | | | |
| | |
PREFERRED STOCK 1.6% | | | | | | | | |
| | |
Germany | | | | | | | | |
Sartorius AG (PRFC)
(cost $697,781) | | | 9,110 | | | | 717,111 | |
| | | | | | | | |
TOTAL LONG-TERM INVESTMENTS
(cost $38,207,947) | | | | | | | 43,789,839 | |
| | | | | | | | |
| | |
SHORT-TERM INVESTMENTS 6.8% | | | | | | | | |
| | |
AFFILIATED MUTUAL FUNDS | | | | | | | | |
Prudential Investment Portfolios 2 - Prudential Core Ultra Short Bond Fund(c) | | | 1,604,183 | | | | 1,604,183 | |
Prudential Investment Portfolios 2 - Prudential Institutional Money Market Fund
(cost $1,496,411; includes $1,494,675 of cash collateral for securities on loan)(c)(d) | | | 1,496,411 | | | | 1,496,710 | |
| | | | | | | | |
TOTAL SHORT-TERM INVESTMENTS
(cost $3,100,594)(Note 3) | | | | | | | 3,100,893 | |
| | | | | | | | |
TOTAL INVESTMENTS 103.2%
(cost $41,308,541)(Note 5) | | | | | | | 46,890,732 | |
Liabilities in excess of other assets (3.2)% | | | | | | | (1,454,576 | ) |
| | | | | | | | |
NET ASSETS 100.0% | | | | | | $ | 45,436,156 | |
| | | | | | | | |
See Notes to Financial Statements.
| | | | |
| Prudential Jennison International Opportunities Fund | | | 17 | |
Portfolio of Investments (continued)
as of October 31, 2016
The following abbreviations are used in the annual report.
144A—Security was purchased pursuant to Rule 144A under the Securities Act of 1933 and may not be resold subject to that rule except to qualified institutional buyers. Unless otherwise noted, 144A securities are deemed to be liquid.
ADR—American Depositary Receipt
LIBOR—London Interbank Offered Rate
PRFC—Preference Shares
| * | Non-income producing security. |
| † | Participatory notes represented 3.5% of net assets, of which the Series attributed 1.3% to Credit Suisse First Boston Corp. and 2.2% to Goldman Sachs & Co. as counterparties to the securities. |
| (a) | All or a portion of security is on loan. The aggregate market value of such securities, including those sold and pending settlement, is $1,464,405; cash collateral of $1,494,675 (included in liabilities) was received with which the Series purchased highly liquid short-term investments. Securities on loan are subject to contractual netting arrangements. |
| (b) | Indicates a security that has been deemed illiquid. (unaudited) |
| (c) | Prudential Investments LLC, the manager of the Series, also serves as manager of the Prudential Investment Portfolios 2 - Prudential Core Ultra Short Bond Fund and the Prudential Investment Portfolios 2 - Prudential Institutional Money Market Fund. |
| (d) | Represents security purchased with cash collateral received for securities on loan and includes dividend reinvestment. |
Various inputs are used in determining the value of the Series’ investments. These inputs are summarized in the three broad levels listed below.
Level 1—quoted prices generally in active markets for identical securities.
Level 2—quoted prices for similar securities, interest rates and yield curves, prepayment speeds, foreign currency exchange rates and other observable inputs.
Level 3—unobservable inputs for securities valued in accordance with Board approved fair valuation procedures.
The following is a summary of the inputs used as of October 31, 2016 in valuing such portfolio securities:
| | | | | | | | | | | | |
| | | Level 1 | | | Level 2 | | | Level 3 | |
Investments in Securities | | | | | | | | | | | | |
Common Stocks | | | | | | | | | | | | |
Argentina | | $ | 1,363,905 | | | $ | — | | | $ | — | |
Australia | | | 729,571 | | | | — | | | | — | |
Brazil | | | 951,251 | | | | — | | | | — | |
China | | | 2,496,286 | | | | 2,801,165 | | | | — | |
France | | | — | | | | 2,932,351 | | | | — | |
Germany | | | — | | | | 3,896,698 | | | | — | |
Hong Kong | | | — | | | | 833,997 | | | | — | |
India | | | 1,181,743 | | | | — | | | | — | |
Indonesia | | | — | | | | 1,090,575 | | | | — | |
Italy | | | — | | | | 1,107,537 | | | | — | |
Japan | | | 725,812 | | | | 3,848,962 | | | | — | |
See Notes to Financial Statements.
| | | | | | | | | | | | |
| | | Level 1 | | | Level 2 | | | Level 3 | |
Common Stocks (continued) | | | | | | | | | | | | |
Mexico | | $ | 539,759 | | | $ | 87,425 | | | $ | — | |
Netherlands | | | — | | | | 961,460 | | | | — | |
Singapore | | | 1,014,698 | | | | — | | | | — | |
Spain | | | — | | | | 3,897,149 | | | | — | |
Sweden | | | — | | | | 1,573,741 | | | | — | |
Switzerland | | | — | | | | 893,540 | | | | — | |
Thailand | | | — | | | | 1,006,155 | | | | — | |
United Kingdom | | | — | | | | 3,347,625 | | | | — | |
United States | | | 2,899,614 | | | | 1,279,394 | | | | — | |
Participatory Notes | | | | | | | | | | | | |
India | | | — | | | | 1,612,315 | | | | — | |
Preferred Stock | | | | | | | | | | | | |
Germany | | | — | | | | 717,111 | | | | — | |
Affiliated Mutual Funds | | | 3,100,893 | | | | — | | | | — | |
| | | | | | | | | | | | |
Total | | $ | 15,003,532 | | | $ | 31,887,200 | | | $ | — | |
| | | | | | | | | | | | |
During the period, there were no transfers between Level 1 and Level 2 to report.
The industry classification of investments and liabilities in excess of other assets shown as a percentage of net assets as of October 31, 2016 were as follows (unaudited):
| | | | |
Internet Software & Services | | | 14.7 | % |
Software | | | 12.9 | |
Affiliated Mutual Funds (including 3.3% of collateral for securities on loan) | | | 6.8 | |
Textiles, Apparel & Luxury Goods | | | 6.2 | |
Specialty Retail | | | 5.4 | |
IT Services | | | 5.4 | |
Pharmaceuticals | | | 5.0 | |
Automobiles | | | 4.7 | |
Health Care Equipment & Supplies | | | 4.6 | |
Semiconductors & Semiconductor Equipment | | | 4.3 | |
Food & Staples Retailing | | | 4.3 | |
Chemicals | | | 4.3 | |
Internet & Direct Marketing Retail | | | 3.2 | |
Health Care Providers & Services | | | 3.0 | % |
Biotechnology | | | 2.8 | |
Banks | | | 2.6 | |
Machinery | | | 2.6 | |
Auto Components | | | 2.5 | |
Insurance | | | 1.9 | |
Household Durables | | | 1.8 | |
Electronic Equipment, Instruments & Components | | | 1.5 | |
Hotels, Restaurants & Leisure | | | 1.4 | |
Diversified Telecommunication Services | | | 1.3 | |
| | | | |
| | | 103.2 | |
Liabilities in excess of other assets | | | (3.2 | ) |
| | | | |
| | | 100.0 | % |
| | | | |
See Notes to Financial Statements.
| | | | |
| Prudential Jennison International Opportunities Fund | | | 19 | |
Statement of Assets & Liabilities
as of October 31, 2016
| | | | |
Assets | | | | |
Investments at value, including securities on loan of $1,464,405: | | | | |
Unaffiliated investments (cost $38,207,947) | | $ | 43,789,839 | |
Affiliated investments (cost $3,100,594) | | | 3,100,893 | |
Tax reclaim receivable | | | 59,890 | |
Dividends receivable | | | 42,682 | |
Due from Manager | | | 2,609 | |
Receivable for Series shares sold | | | 49 | |
Prepaid expenses | | | 904 | |
| | | | |
Total Assets | | | 46,996,866 | |
| | | | |
| |
Liabilities | | | | |
Payable to broker for collateral for securities on loan | | | 1,494,675 | |
Accrued expenses and other liabilities | | | 62,316 | |
Distribution fee payable | | | 1,331 | |
Payable for Series shares reacquired | | | 1,200 | |
Affiliated transfer agent fee payable | | | 627 | |
Payable for investments purchased | | | 561 | |
| | | | |
Total Liabilities | | | 1,560,710 | |
| | | | |
| |
Net Assets | | $ | 45,436,156 | |
| | | | |
| | | | | |
Net assets were comprised of: | | | | |
Common stock, at par | | $ | 36,405 | |
Paid-in capital in excess of par | | | 44,566,911 | |
| | | | |
| | | 44,603,316 | |
Undistributed net investment income | | | 108,001 | |
Accumulated net realized loss on investment and foreign currency transactions | | | (4,853,431 | ) |
Net unrealized appreciation on investments and foreign currencies | | | 5,578,270 | |
| | | | |
Net assets, October 31, 2016 | | $ | 45,436,156 | |
| | | | |
See Notes to Financial Statements.
| | | | |
Class A | | | | |
Net asset value and redemption price per share
($2,917,569 ÷ 236,019 shares of common stock issued and outstanding) | | $ | 12.36 | |
Maximum sales charge (5.50% of offering price) | | | 0.72 | |
| | | | |
Maximum offering price to public | | $ | 13.08 | |
| | | | |
| |
Class C | | | | |
Net asset value, offering price and redemption price per share
($778,762 ÷ 65,092 shares of common stock issued and outstanding) | | $ | 11.96 | |
| | | | |
| |
Class Q | | | | |
Net asset value, offering price and redemption price per share
($23,073,301 ÷ 1,845,573 shares of common stock issued and outstanding) | | $ | 12.50 | |
| | | | |
| |
Class Z | | | | |
Net asset value, offering price and redemption price per share
($18,666,524 ÷ 1,493,787 shares of common stock issued and outstanding) | | $ | 12.50 | |
| | | | |
See Notes to Financial Statements.
| | | | |
| Prudential Jennison International Opportunities Fund | | | 21 | |
Statement of Operations
Year Ended October 31, 2016
| | | | |
Net Investment Income (Loss) | | | | |
Income | | | | |
Unaffiliated dividend income (net of foreign withholding taxes of $71,195) | | $ | 605,032 | |
Affiliated dividend income | | | 5,776 | |
Income from securities lending, net (including affiliated income of $1,329) | | | 5,742 | |
| | | | |
Total income | | | 616,550 | |
| | | | |
| |
Expenses | | | | |
Management fee | | | 395,905 | |
Distribution fee—Class A | | | 10,724 | |
Distribution fee—Class C | | | 8,949 | |
Custodian and accounting fees (net of $6,000 fee credit) | | | 94,000 | |
Registration fees | | | 67,000 | |
Audit fee | | | 31,000 | |
Shareholders’ reports | | | 27,000 | |
Legal fees and expenses | | | 19,000 | |
Transfer agent’s fees and expenses (including affiliated expense of $4,200) | | | 16,000 | |
Directors’ fees | | | 11,000 | |
Insurance expenses | | | 1,000 | |
Loan interest expense | | | 76 | |
Miscellaneous | | | 20,403 | |
| | | | |
Total expenses | | | 702,057 | |
Less: Expense reimbursement | | | (263,176 | ) |
Distribution fee waiver—Class A | | | (1,787 | ) |
| | | | |
Net expenses | | | 437,094 | |
| | | | |
Net investment income (loss) | | | 179,456 | |
| | | | |
| |
Realized And Unrealized Gain (Loss) On Investment And Foreign Currency Transactions | | | | |
Net realized gain (loss) on: | | | | |
Investment transactions (including affiliated of $253) | | | (2,716,468 | ) |
Foreign currency transactions | | | (38,106 | ) |
| | | | |
| | | (2,754,574 | ) |
| | | | |
Net change in unrealized appreciation (depreciation) on: | | | | |
Investments (including affiliated of $299) | | | 25,341 | |
Foreign currencies | | | 923 | |
| | | | |
| | | 26,264 | |
| | | | |
Net gain (loss) on investment and foreign currency transactions | | | (2,728,310 | ) |
| | | | |
Net Increase (Decrease) In Net Assets Resulting From Operations | | $ | (2,548,854 | ) |
| | | | |
See Notes to Financial Statements.
Statement of Changes in Net Assets
| | | | | | | | |
| | | Year Ended October 31, | |
| | | 2016 | | | 2015 | |
Increase (Decrease) in Net Assets | | | | | | | | |
Operations | | | | | | | | |
Net investment income (loss) | | $ | 179,456 | | | $ | (112,197 | ) |
Net realized gain (loss) on investment and foreign currency transactions | | | (2,754,574 | ) | | | (740,303 | ) |
Net change in unrealized appreciation (depreciation) on investments and foreign currencies | | | 26,264 | | | | 996,214 | |
| | | | | | | | |
Net increase (decrease) in net assets resulting from operations | | | (2,548,854 | ) | | | 143,714 | |
| | | | | | | | |
| | |
Series share transactions (Net of share conversions) (Note 6) | | | | | | | | |
Net proceeds from shares sold | | | 6,080,927 | | | | 10,063,474 | |
Cost of shares reacquired | | | (9,583,417 | ) | | | (8,013,441 | ) |
| | | | | | | | |
Net increase (decrease) in net assets from Series share transactions | | | (3,502,490 | ) | | | 2,050,033 | |
| | | | | | | | |
Total increase (decrease) | | | (6,051,344 | ) | | | 2,193,747 | |
| | |
Net Assets: | | | | | | | | |
Beginning of year | | | 51,487,500 | | | | 49,293,753 | |
| | | | | | | | |
End of year(a) | | $ | 45,436,156 | | | $ | 51,487,500 | |
| | | | | | | | |
(a) Includes undistributed net investment income of: | | $ | 108,001 | | | $ | — | |
| | | | | | | | |
See Notes to Financial Statements.
| | | | |
| Prudential Jennison International Opportunities Fund | | | 23 | |
Notes to Financial Statements
Prudential World Fund, Inc. (the “Fund”) is an open-end management investment company, registered under the Investment Company Act of 1940, as amended (“1940 Act”) and currently consists of six series: Prudential Jennison International Opportunities Fund (the “Series”), Prudential Jennison Global Infrastructure Fund, Prudential QMA International Equity Fund, Prudential Jennison Global Opportunities Fund, Prudential Emerging Markets Debt Local Currency Fund and Prudential Jennison Emerging Markets Equity Fund. These financial statements relate to the Prudential Jennison International Opportunities Fund. The financial statements of the other series are not presented herein. The Series commenced investment operations on June 5, 2012.
The investment objective of the Series is to seek long-term growth of capital.
Note 1. Accounting Policies
The Fund follows investment company accounting and reporting guidance of the Financial Accounting Standards Board (“FASB”) Accounting Standard Codification Topic 946 Financial Services—Investment Companies. The following accounting policies conform to U.S. generally accepted accounting principles. The Series consistently follows such policies in the preparation of its financial statements.
Securities Valuation: The Series holds securities and other assets that are fair valued at the close of each day (generally, 4:00 PM Eastern time) the New York Stock Exchange (“NYSE”) is open for trading. Fair value is the price that would be received to sell an asset or paid to transfer a liability in an orderly transaction between market participants on the measurement date. The Board of Directors (the “Board”) has adopted Valuation Procedures for security valuation under which fair valuation responsibilities have been delegated to Prudential Investments LLC (“PI” or “Manager”). Under the current Valuation Procedures, the established Valuation Committee is responsible for supervising the valuation of portfolio securities and other assets. The Valuation Procedures permit the Series to utilize independent pricing vendor services, quotations from market makers, and alternative valuation methods when market quotations are either not readily available or not deemed representative of fair value. A record of the Valuation Committee’s actions is subject to the Board’s review, approval, and ratification at its next regularly-scheduled quarterly meeting.
Various inputs determine how the Series’ investments are valued, all of which are categorized according to the three broad levels (Level 1, 2, or 3) detailed in the table following the Portfolio of Investments.
Common and preferred stocks, exchange-traded funds, and derivative instruments such as futures or options that are traded on a national securities exchange are valued at the last
sale price as of the close of trading on the applicable exchange where the security principally trades. Securities traded via NASDAQ are valued at the NASDAQ official closing price. To the extent these securities are valued at the last sale price or NASDAQ official closing price, they are classified as Level 1 in the fair value hierarchy.
In the event that no sale or official closing price on valuation date exists, these securities are generally valued at the mean between the last reported bid and ask prices, or at the last bid price in the absence of an ask price. These securities are classified as Level 2 in the fair value hierarchy.
Common and preferred stocks traded on foreign securities exchanges are valued using pricing vendor services that provide model prices derived using adjustment factors based on information such as local closing price, relevant general and sector indices, currency fluctuations, depositary receipts, and futures, as applicable. Securities valued using such model prices are classified as Level 2 in the fair value hierarchy. The models generate an evaluated adjustment factor for each security, which is applied to the local closing price to adjust it for post closing market movements. Utilizing that evaluated adjustment factor, the vendor provides an evaluated price for each security. If the vendor does not provide an evaluated price, securities are valued in accordance with exchange-traded common and preferred stocks discussed above.
Participatory notes (“P-notes”) are generally valued based upon the value of a related underlying security that trades actively in the market and are classified as Level 2 in the fair value hierarchy.
Investments in open-end, non-exchange-traded mutual funds are valued at their net asset values as of the close of the NYSE on the date of valuation. These securities are classified as Level 1 in the fair value hierarchy since they may be purchased or sold at their net asset values on the date of valuation.
Securities and other assets that cannot be priced according to the methods described above are valued based on pricing methodologies approved by the Board. In the event that unobservable inputs are used when determining such valuations, the securities will be classified as Level 3 in the fair value hierarchy.
When determining the fair value of securities, some of the factors influencing the valuation include: the nature of any restrictions on disposition of the securities; assessment of the general liquidity of the securities; the issuer’s financial condition and the markets in which it does business; the cost of the investment; the size of the holding and the capitalization of the issuer; the prices of any recent transactions or bids/offers for such securities or any comparable securities; any available analyst media or other reports or information deemed reliable by the investment adviser regarding the issuer or the markets or industry in which it operates. Using fair value to price securities may result in a value that is different from a security’s most recent closing price and from the price used by other mutual funds to calculate their net asset values.
| | | | |
| Prudential Jennison International Opportunities Fund | | | 25 | |
Notes to Financial Statements (continued)
Restricted and Illiquid Securities: The Series may hold up to 15% of its net assets in illiquid securities, including those which are restricted as to disposition under securities law (“restricted securities”). Restricted securities are valued pursuant to the valuation procedures noted above. Illiquid securities are those that, because of the absence of a readily available market or due to legal or contractual restrictions on resale, cannot be sold within seven days in the ordinary course of business at approximately the amount at which the Series has valued the investment. Therefore, the Series may find it difficult to sell illiquid securities at the time considered most advantageous by its Subadviser and may incur expenses that would not be incurred in the sale of securities that were freely marketable. Certain securities that would otherwise be considered illiquid because of legal restrictions on resale to the general public may be traded among qualified institutional buyers under Rule 144A of the Securities Act of 1933. These Rule 144A securities, as well as commercial paper that is sold in private placements under Section 4(2) of the Securities Act, may be deemed liquid by the Series’ Subadviser under the guidelines adopted by the Directors of the Series. However, the liquidity of the Series’ investments in Rule 144A securities could be impaired if trading does not develop or declines.
Warrants and Rights: The Series may hold warrants and rights acquired either through a direct purchase, included as part of a private placement, or pursuant to corporate actions. Warrants and rights entitle the holder to buy a proportionate amount of common stock, or such other security that the issuer may specify, at a specific price and time through the expiration dates. The Series holds such warrants and rights as long positions until exercised, sold or expired. Warrants and rights are valued at fair value in accordance with the Board of Directors’ approved fair valuation procedures.
Foreign Currency Translation: The books and records of the Series are maintained in U.S. dollars. Foreign currency amounts are translated into U.S. dollars on the following basis:
(i) market value of investment securities, other assets and liabilities—at the current rates of exchange;
(ii) purchases and sales of investment securities, income and expenses—at the rates of exchange prevailing on the respective dates of such transactions.
Although the net assets of the Series are presented at the foreign exchange rates and market values at the close of the period, the Series does not generally isolate that portion of the results of operations arising as a result of changes in the foreign exchange rates from the fluctuations arising from changes in the market prices of long-term portfolio securities held at the end of the period. Similarly, the Series does not isolate the effect of changes in foreign exchange rates from the fluctuations arising from changes in the market prices of long-term portfolio securities sold during the period. Accordingly, holding period realized
foreign currency gains (losses) are included in the reported net realized gains (losses) on investment transactions. Notwithstanding the above, the Series does isolate the effect of fluctuations in foreign currency exchange rates when determining the gain (loss) upon the sale or maturity of foreign currency denominated debt obligations; such amounts are included in net realized gains (losses) on foreign currency transactions.
Net realized gains (losses) on foreign currency transactions represent net foreign exchange gains (losses) from holdings of foreign currencies, forward currency contracts, disposition of foreign currencies, currency gains (losses) realized between the trade and settlement dates on securities transactions, and the difference between the amounts of interest, dividends and foreign withholding taxes recorded on the Series’ books and the U.S. dollar equivalent amounts actually received or paid. Net unrealized currency gains (losses) from valuing foreign currency denominated assets and liabilities (other than investments) at period-end exchange rates are reflected as a component of net unrealized appreciation (depreciation) on foreign currency transactions.
Participatory notes/Warrants: The Series may gain exposure to securities in certain foreign markets through investments in P-notes. The Series may purchase P-notes due to restrictions applicable to foreign investors when investing directly in a foreign market. P-notes are generally issued by banks or broker-dealers and are designed to offer a return linked to a particular underlying security. P-notes involve transaction costs, which may be higher than those applicable to the equity securities. An investment in a P-note may involve risks, including counterparty risk, beyond those normally associated with a direct investment in the underlying security. The Series must rely on the creditworthiness of the counterparty and would have no rights against the issuer of the underlying security. Furthermore, the P-note’s performance may differ from that of the underlying security. The holder of the P-note is entitled to receive from the bank or broker-dealer, an amount equal to dividends paid by the issuer of the underlying security; however, the holder is not entitled to the same rights (e.g., dividends, voting rights) as an owner of the underlying security. There is also no assurance that there will be a secondary trading market for a P-note or that the trading price of a P-note will equal the value of the underlying security.
Master Netting Arrangements: The Series is subject to various Master Agreements, or netting arrangements, with select counterparties. These are agreements which a subadviser may have negotiated and entered into on behalf of the Series. A master netting arrangement between the Series and the counterparty permits the Series to offset amounts payable by the Series to the same counterparty against amounts to be received; and by the receipt of collateral from the counterparty by the Series to cover the Series’ exposure to the counterparty. However, there is no assurance that such mitigating factors are easily enforceable. In addition to master netting arrangements, the right to set-off exists when all the conditions are met such that each of the parties owes the other determinable amounts, the reporting party has the right to set-off the amount owed with the amount owed by the other party, the reporting party intends to set-off and the right of set-off is enforceable by law. During the reporting period, there was no intention to settle on a net basis and all amounts are presented on a gross basis on the Statement of Assets and Liabilities.
| | | | |
| Prudential Jennison International Opportunities Fund | | | 27 | |
Notes to Financial Statements (continued)
Securities Lending: The Series may lend its portfolio securities to banks and broker-dealers. The loans are secured by collateral at least equal to the market value of the securities loaned. Collateral pledged by each borrower is invested in a money market fund and is marked to market daily, based on the previous day’s market value, such that the value of the collateral exceeds the value of the loaned securities. For the period March 31, 2016 through July 18, 2016 the collateral was invested in an ultra-short bond fund. Loans are subject to termination at the option of the borrower or the Series. Upon termination of the loan, the borrower will return to the Series securities identical to the loaned securities. Should the borrower of the securities fail financially, the Series has the right to repurchase the securities in the open market using the collateral. The Series recognizes income, net of any rebate and securities lending agent fees, for lending its securities in the form of fees or interest on the investment of any cash received as collateral. The borrower receives all interest and dividends from the securities loaned and such payments are passed back to the lender in amounts equivalent thereto. The Series also continues to recognize any unrealized gain (loss) in the market price of the securities loaned and on the change in the value of the collateral invested that may occur during the term of the loan. In addition, realized gain (loss) is recognized on changes in the value of the collateral invested that may occur during the term of the loan.
Concentration of Risk: Foreign security and currency transactions may involve certain considerations and risks not typically associated with those of domestic origin as a result of, among other factors, the possibility of political and economic instability or the level of governmental supervision and regulation of foreign securities markets.
Securities Transactions and Net Investment Income: Securities transactions are recorded on the trade date. Realized gains (losses) from investment and currency transactions are calculated on the identified cost basis. Dividend income is recorded on the ex-date. Interest income, including amortization of premium and accretion of discount on debt securities, as required, is recorded on an accrual basis. Expenses are recorded on an accrual basis, which may require the use of certain estimates by management that may differ from actual.
Net investment income or loss (other than distribution fees, which are charged directly to the respective class and transfer agency fees specific to Class Q shares which are charged to that share class) and unrealized and realized gains (losses) are allocated daily to each class of shares based upon the relative proportion of adjusted net assets of each class at the beginning of the day.
Dividends and Distributions: The Series expects to pay dividends from net investment income and distributions from net realized capital and currency gains, if any, annually. Dividends and distributions to shareholders, which are determined in accordance with federal income tax regulations and which may differ from generally accepted accounting
principles, are recorded on the ex-date. Permanent book/tax differences relating to income and gain (loss) are reclassified amongst undistributed net investment income, accumulated net realized gain (loss) and paid-in capital in excess of par, as appropriate.
Taxes: For federal income tax purposes, each Series in the Fund is treated as a separate taxpaying entity. It is each Series’ policy to continue to meet the requirements of the Internal Revenue Code applicable to regulated investment companies and to distribute all of its taxable net investment income and capital gains, if any, to its shareholders. Therefore, no federal income tax provision is required. Withholding taxes on foreign dividends are recorded net of reclaimable amounts, at the time the related income is earned.
Estimates: The preparation of the financial statements requires management to make estimates and assumptions that affect the reported amounts and disclosures in the financial statements. Actual results could differ from those estimates.
Note 2. Agreements
The Fund has a management agreement for the Series with PI. Pursuant to this agreement, PI has responsibility for all investment advisory services and supervises the subadviser’s performance of such services. PI has entered into a subadvisory agreement with Jennison Associates LLC (“Jennison”). The subadvisory agreement provides that Jennison furnishes investment advisory services in connection with the management of the Series. In connection therewith, Jennison is obligated to keep certain books and records of the Series. PI pays for the services of Jennison, the cost of compensation of officers of the Series, occupancy and certain clerical and bookkeeping costs of the Series. The Series bears all other costs and expenses.
The management fee paid to PI is accrued daily and payable monthly at an annual rate of .825% of the Series’ average daily net assets up to $1 billion and .80% of such assets in excess of $1 billion. The effective management fee rate before any waivers and/or expense reimbursements was .825% for the year ended October 31, 2016. The effective management fee rate, net of waivers and/or expense reimbursements was .277%.
PI has contractually agreed through February 28, 2018 to limit the net annual operating expenses (exclusive of distribution and service (12b-1) fees, transfer agency expenses (including sub-transfer agency and networking fees), taxes (such as income and foreign withholdings taxes, stamp duty and deferred tax expenses), interest, underlying funds, brokerage, extraordinary and certain other expenses such as dividend, broker charges and interest expense on short sales) of each class of shares of the Series to .84% of the Series’ average daily net assets. Expenses waived/reimbursed by the Manager in accordance with this agreement may be recouped by the Manager within the same fiscal year during which such waiver/reimbursement is made if such recoupment can be realized without exceeding the expense limit in effect at the time of the recoupment for that fiscal year.
| | | | |
| Prudential Jennison International Opportunities Fund | | | 29 | |
Notes to Financial Statements (continued)
The Series has a distribution agreement with Prudential Investment Management Services LLC (“PIMS”), which acts as the distributor of the Class A, Class C, Class Q and Class Z shares of the Series. The Series compensates PIMS for distributing and servicing the Series’ Class A and Class C shares, pursuant to plans of distribution (the “Distribution Plans”), regardless of expenses actually incurred by PIMS. The distribution fees are accrued daily and payable monthly. No distribution or service fees are paid to PIMS as distributor of the Class Q and Class Z shares of the Series.
Pursuant to the Distribution Plans, the Series compensates PIMS for distribution related activities at an annual rate of up to .30% and 1% of the average daily net assets of the Class A and C shares, respectively. PIMS has contractually agreed to limit such fees to .25% of the average daily net assets of the Class A shares through February 28, 2018.
PIMS has advised the Series that it has received $15,699 in front-end sales charges resulting from sales of Class A shares during the year ended October 31, 2016. From these fees, PIMS paid such sales charges to affiliated broker-dealers, which in turn paid commissions to salespersons and incurred other distribution costs.
PIMS has advised the Series that for the year ended October 31, 2016 it has received $6 in contingent deferred sales charges imposed upon redemption by certain Class C shareholders.
PI, PIMS and Jennison are indirect, wholly-owned subsidiaries of Prudential Financial, Inc. (“Prudential”).
Note 3. Other Transactions with Affiliates
Prudential Mutual Fund Services LLC (“PMFS”), an affiliate of PI and an indirect, wholly-owned subsidiary of Prudential, serves as the Series’ transfer agent. Transfer agent’s fees and expenses on the Statement of Operations include certain out-of-pocket expenses paid to non-affiliates, where applicable.
Effective July 7, 2016, the Board replaced PGIM, Inc., an indirect wholly-owned subsidiary of Prudential, as securities lending agent with a third party agent. Prior to July 7, 2016, PGIM, Inc. was the Series’ securities lending agent. Net earnings from securities lending are disclosed on the Statement of Operations as “Income from securities lending, net”. Prior to January 4, 2016, PGIM, Inc. was known as Prudential Investment Management, Inc. (“PIM”).
The Series may enter into certain securities purchase or sale transactions under Board approved Rule 17a-7 procedures. Rule 17a-7 is an exemptive rule under the 1940 Act, that permits purchase and sale transactions among affiliated investment companies, or
between an investment company and a person that is affiliated solely by reason of having a common (or affiliated) investment adviser, common directors, and/or common officers. Such transactions are subject to ratification by the Board.
The Series invests its overnight sweep cash in the Prudential Core Ultra Short Bond Fund, (formerly known as Prudential Core Taxable Money Market Fund), (the “Core Fund”), and its securities lending cash collateral in the Prudential Institutional Money Market Fund, (the “Money Market Fund”), each a portfolio of the Prudential Investment Portfolios 2, registered under the 1940 Act and managed by PI. Earnings from the Core and the Money Market Funds are disclosed on the Statement of Operations as “Affiliated dividend income” and “Income from securities lending, net”, respectively.
Note 4. Portfolio Securities
The cost of purchases and proceeds from sales of portfolio securities, other than short-term investments, for the year ended October 31, 2016 were $30,678,836 and $35,521,370, respectively.
Note 5. Distributions and Tax Information
Distributions to shareholders, which are determined in accordance with federal income tax regulations and which may differ from generally accepted accounting principles, are recorded on the ex-date. In order to present undistributed net investment income, accumulated net realized loss on investment and foreign currency transactions and paid-in capital in excess of par on the Statement of Assets and Liabilities that more closely represent their tax character, certain adjustments have been made to undistributed net investment income and accumulated net realized loss on investment and foreign currency transactions. For the year ended October 31, 2016, the adjustments were to decrease undistributed net investment income and decrease accumulated net realized loss on investment and foreign currency transactions by $38,106 primarily due to the difference between certain transactions involving foreign currencies. Net investment income (loss), net realized gain (loss) on investment and foreign currency transactions and net assets were not affected by this change.
For the years ended October 31, 2016 and October 31, 2015, there were no distributions paid by the Series.
As of October 31, 2016, the accumulated undistributed earnings on a tax basis was $108,216 of ordinary income.
The United States federal income tax basis of the Series’ investments and the net unrealized appreciation as of October 31, 2016 were as follows:
| | | | | | | | | | |
Tax Basis | | Appreciation | | Depreciation | | Net
Unrealized
Appreciation | | Other Cost Basis
Adjustments | | Total Net
Unrealized
Appreciation |
| $41,330,138 | | $6,722,673 | | $(1,162,079) | | $5,560,594 | | $(3,921) | | $5,556,673 |
| | | | |
| Prudential Jennison International Opportunities Fund | | | 31 | |
Notes to Financial Statements (continued)
The difference between book basis and tax basis is primarily attributable to deferred losses on wash sales. The other cost basis adjustments are primarily attributable to appreciation (depreciation) of foreign currencies and mark-to-market of receivables and payables.
For federal income tax purposes, the Series had a capital loss carryforward as of October 31, 2016 of approximately $4,832,000 which can be carried forward for an unlimited period. No capital gains distributions are expected to be paid to shareholders until net gains have been realized in excess of such losses.
Management has analyzed the Series’ tax positions taken on federal, state and local income tax returns for all open tax years and has concluded that no provision for income tax is required in the Series’ financial statements for the current reporting period. The Series’ federal, state and local income and federal excise tax returns for tax years for which the applicable statutes of limitations have not expired are subject to examination by the Internal Revenue Service and state departments of revenue.
Note 6. Capital
The Series offers Class A, Class C, Class Q and Class Z shares. Class A shares are subject to a maximum front-end sales charge of 5.50%. Investors who purchase Class A shares in an amount of $1 million or more and sell these shares within 12 months of purchase are not subject to an initial sales charge but are subject to a contingent deferred sales charge (“CDSC”) of 1%. The Class A CDSC is waived for purchases by certain retirement or benefits plans. The CDSC for Class C shares is 1% for shares redeemed within 12 months of purchase. Class Q and Class Z shares are not subject to any sales or redemption charge and are offered exclusively for sale to a limited group of investors. A special exchange privilege is also available for shareholders who qualified to purchase Class A shares at net asset value.
Under certain circumstances, an exchange may be made from specified share classes of the Series to one or more other share classes of the Series as presented in the table of transactions in shares of capital stock.
There are 850 million shares of common stock, $.01 par value per share, designated Class A, Class C, Class Q and Class Z common stock, each of which consists of 200 million, 200 million, 250 million and 200 million authorized shares, respectively.
As of October 31, 2016, Prudential, through its affiliates, owned 1,041 of Class C, 755 of Class Q and 1,041,033 of Class Z shares of the Series, respectively. At reporting period end, 5 shareholders of record held 91% of the Series’ outstanding shares on behalf of multiple beneficial owners.
Transactions in shares of common stock were as follows:
| | | | | | | | |
Class A | | Shares | | | Amount | |
Year ended October 31, 2016: | | | | | | | | |
Shares sold | | | 70,653 | | | $ | 882,511 | |
Shares reacquired | | | (143,364 | ) | | | (1,778,347 | ) |
| | | | | | | | |
Net increase (decrease) in shares outstanding before conversion | | | (72,711 | ) | | | (895,836 | ) |
Shares reacquired upon conversion into other share class(es) | | | (9,512 | ) | | | (120,888 | ) |
| | | | | | | | |
Net increase (decrease) in shares outstanding | | | (82,223 | ) | | $ | (1,016,724 | ) |
| | | | | | | | |
Year ended October 31, 2015: | | | | | | | | |
Shares sold | | | 244,088 | | | $ | 3,370,573 | |
Shares reacquired | | | (61,632 | ) | | | (819,951 | ) |
| | | | | | | | |
Net increase (decrease) in shares outstanding before conversion | | | 182,456 | | | | 2,550,622 | |
Shares reacquired upon conversion into other share class(es) | | | (4,627 | ) | | | (60,515 | ) |
| | | | | | | | |
Net increase (decrease) in shares outstanding | | | 177,829 | | | $ | 2,490,107 | |
| | | | | | | | |
Class C | | | | | | |
Year ended October 31, 2016: | | | | | | | | |
Shares sold | | | 20,106 | | | $ | 248,644 | |
Shares reacquired | | | (50,156 | ) | | | (613,645 | ) |
| | | | | | | | |
Net increase (decrease) in shares outstanding | | | (30,050 | ) | | $ | (365,001 | ) |
| | | | | | | | |
Year ended October 31, 2015: | | | | | | | | |
Shares sold | | | 78,839 | | | $ | 1,061,115 | |
Shares reacquired | | | (19,930 | ) | | | (246,472 | ) |
| | | | | | | | |
Net increase (decrease) in shares outstanding | | | 58,909 | | | $ | 814,643 | |
| | | | | | | | |
Class Q | | | | | | |
Year ended October 31, 2016*: | | | | | | | | |
Shares sold | | | 269,177 | | | $ | 3,275,000 | |
Shares reacquired | | | (340,747 | ) | | | (4,355,000 | ) |
| | | | | | | | |
Net increase (decrease) in shares outstanding before conversion | | | (71,570 | ) | | | (1,080,000 | ) |
Shares issued upon conversion from other share class(es) | | | 1,917,143 | | | | 25,402,138 | |
| | | | | | | | |
Net increase (decrease) in shares outstanding | | | 1,845,573 | | | $ | 24,322,138 | |
| | | | | | | | |
Class Z | | | | | | |
Year ended October 31, 2016: | | | | | | | | |
Shares sold | | | 133,459 | | | $ | 1,674,772 | |
Shares reacquired | | | (224,120 | ) | | | (2,836,425 | ) |
| | | | | | | | |
Net increase (decrease) in shares outstanding before conversion | | | (90,661 | ) | | | (1,161,653 | ) |
Shares issued upon conversion from other share class(es) | | | 9,411 | | | | 120,888 | |
Shares reacquired upon conversion into other share class(es) | | | (1,917,143 | ) | | | (25,402,138 | ) |
| | | | | | | | |
Net increase (decrease) in shares outstanding | | | (1,998,393 | ) | | $ | (26,442,903 | ) |
| | | | | | | | |
Year ended October 31, 2015: | | | | | | | | |
Shares sold | | | 422,403 | | | $ | 5,631,786 | |
Shares reacquired | | | (514,187 | ) | | | (6,947,018 | ) |
| | | | | | | | |
Net increase (decrease) in shares outstanding before conversion | | | (91,784 | ) | | | (1,315,232 | ) |
Shares issued upon conversion from other shares class(es) | | | 4,591 | | | | 60,515 | |
| | | | | | | | |
Net increase (decrease) in shares outstanding | | | (87,193 | ) | | $ | (1,254,717 | ) |
| | | | | | | | |
| * | Commencement of offering was December 23, 2015. |
| | | | |
| Prudential Jennison International Opportunities Fund | | | 33 | |
Notes to Financial Statements (continued)
Note 7. Borrowings
The Series, along with other affiliated registered investment companies (the “Funds”), is a party to a Syndicated Credit Agreement (“SCA”) with a group of banks. The purpose of the SCA is to provide an alternative source of temporary funding for capital share redemptions. The SCA provides for a commitment of $900 million for the period October 6, 2016 through October 5, 2017. The Funds pay an annualized commitment fee of .15% of the unused portion of the SCA. The interest rate on borrowings under the SCA is paid monthly and at a per annum rate based upon the higher of 0.0%, the effective federal funds rate, or the One-Month LIBOR rate, plus a contractual spread. Prior to October 6, 2016, the Funds had another SCA that provided a commitment of $900 million and the Funds paid an annualized commitment fee of .11% of the unused portion of the SCA. The interest rate on borrowings was substantially the same. The Series’ portion of the commitment fee for the unused amount is accrued daily and paid quarterly.
The Series utilized the SCA during the year ended October 31, 2016. The average daily balance for the 9 days the Series had loans outstanding during the period was $183,889, borrowed at a weighted average interest rate of 1.65%. The maximum loan balance outstanding during the period was $285,000. At October 31, 2016, the Series did not have an outstanding loan balance.
Note 8. Recent Accounting Pronouncements and Reporting Updates
In January 2016, the FASB issued Accounting Standards Update (“ASU”) No. 2016-01 regarding “Recognition and Measurement of Financial Assets and Financial Liabilities”. The new guidance is intended to enhance the reporting model for financial instruments to provide users of financial statements with more decision-useful information and addresses certain aspects of the recognition, measurement, presentation, and disclosure of financial instruments. The new standard affects all entities that hold financial assets or owe financial liabilities. The new guidance is effective for public companies for fiscal years beginning after December 15, 2017, including interim periods within those fiscal years. At this time, management is evaluating the implications of ASU No. 2016-01 and its impact on the financial statements and disclosures has not yet been determined.
On October 13, 2016, the Securities and Exchange Commission (the “SEC”) adopted new rules and forms and amended existing rules and forms which are intended to modernize and enhance the reporting and disclosure of information by registered investment companies and to improve the quality of information that funds provide to investors, including modifications to Regulation S-X which would require standardized, enhanced disclosure about derivatives in investment company financial statements. In an effort to enhance monitoring and regulation, the new rules and forms will allow the SEC to more
effectively collect and use data reported by funds. The new rules also enhance disclosure regarding fund liquidity and redemption practices. Also under the new rules, the SEC will permit open-end funds, with the exception of money market funds, to offer swing pricing, subject to board approval and review. The compliance dates of the modifications to Regulation S-X are August 1, 2017 and other amendments and rules are generally June 1, 2018 and December 1, 2018. Management is currently evaluating the impacts to the financial statement disclosures, if any.
Note 9. Dividends and Distributions to Shareholders
Subsequent to the fiscal year end, the Series declared ordinary income dividends on December 1, 2016 to shareholders of record on December 2, 2016. The ex-date was December 5, 2016. The per share amounts declared were as follows:
| | | | |
| | | Ordinary Income | |
Class Q | | | 0.03662 | |
Class Z | | | 0.02821 | |
| | | | |
| Prudential Jennison International Opportunities Fund | | | 35 | |
Financial Highlights
| | | | | | | | | | | | | | | | | | | | | | | | |
| Class A Shares | | | | | | | | | | | | | | | | | | |
| | | Year Ended October 31, | | | | | | June 5,
2012(a)
through
October 31, | |
| | | 2016(b) | | | 2015(b) | | | 2014(b) | | | 2013(b) | | | | | | 2012 | |
| Per Share Operating Performance: | | | | | | | | | | | | | | | | | | | | | | | | |
| Net Asset Value, Beginning Of Period | | | $13.09 | | | | $13.06 | | | | $13.51 | | | | $11.30 | | | | | | | | $10.00 | |
| Income (loss) from investment operations: | | | | | | | | | | | | | | | | | | | | | | | | |
| Net investment income (loss) | | | .02 | | | | (.05 | ) | | | (.06 | ) | | | (.01 | ) | | | | | | | (.01 | ) |
| Net realized and unrealized gain (loss) on investment transactions | | | (.75 | ) | | | .08 | | | | .09 | | | | 2.27 | | | | | | | | 1.31 | |
| Total from investment operations | | | (.73 | ) | | | .03 | | | | .03 | | | | 2.26 | | | | | | | | 1.30 | |
| Less Dividends and Distributions: | | | | | | | | | | | | | | | | | | | | | | | | |
| Dividends from net investment income | | | - | | | | - | | | | - | | | | (.05 | ) | | | | | | | - | |
| Distributions from net realized gains | | | - | | | | - | | | | (.48 | ) | | | - | | | | | | | | - | |
| Total dividends and distributions | | | - | | | | - | | | | (.48 | ) | | | (.05 | ) | | | | | | | - | |
| Net asset value, end of period | | | $12.36 | | | | $13.09 | | | | $13.06 | | | | $13.51 | | | | | | | | $11.30 | |
| Total Return(c): | | | (5.58)% | | | | .23% | | | | .20% | | | | 20.04% | | | | | | | | 13.00% | |
| |
| Ratios/Supplemental Data: | |
| Net assets, end of period (000) | | | $2,918 | | | | $4,167 | | | | $1,833 | | | | $889 | | | | | | | | $94 | |
| Average net assets (000) | | | $3,575 | | | | $3,179 | | | | $1,467 | | | | $356 | | | | | | | | $32 | |
| Ratios to average net assets(d): | | | | | | | | | | | | | | | | | | | | | | | | |
| Expenses after waivers and/or expense reimbursement | | | 1.15% | | | | 1.55% | | | | 1.60% | | | | 1.60% | | | | | | | | 1.60% | (e) |
| Expenses before waivers and/or expense reimbursement | | | 1.74% | | | | 1.67% | | | | 1.90% | | | | 3.16% | | | | | | | | 4.42% | (e) |
| Net investment income (loss) | | | .15% | | | | (.39)% | | | | (.48)% | | | | (.08)% | | | | | | | | (.61)% | (e) |
| Portfolio turnover rate | | | 65% | | | | 75% | | | | 61% | | | | 86% | | | | | | | | 28% | (f) |
| (a) | Commencement of operations. |
| (b) | Calculated based on average shares outstanding during the period. |
| (c) | Total return does not consider the effects of sales loads. Total return is calculated assuming a purchase of a share on the first day and a sale on the last day of each period reported and includes reinvestment of dividends and distributions, if any. Total returns may reflect adjustments to conform to generally accepted accounting principles. Total returns for periods less than a full year are not annualized. |
| (d) | Does not include expenses of the underlying funds in which the Series invests. |
See Notes to Financial Statements.
| | | | | | | | | | | | | | | | | | | | | | | | |
| Class C Shares | |
| | | Year Ended October 31, | | | | | | June 5,
2012(a)
through
October 31, | |
| | | 2016(b) | | | 2015(b) | | | 2014(b) | | | 2013(b) | | | | | | 2012 | |
| Per Share Operating Performance: | | | | | | | | | | | | | | | | | | | | | | | | |
| Net Asset Value, Beginning Of Period | | | $12.77 | | | | $12.82 | | | | $13.37 | | | | $11.27 | | | | | | | | $10.00 | |
| Income (loss) from investment operations: | | | | | | | | | | | | | | | | | | | | | | | | |
| Net investment income (loss) | | | (.08 | ) | | | (.15 | ) | | | (.16 | ) | | | (.14 | ) | | | | | | | (.05 | ) |
| Net realized and unrealized gain (loss) on investment transactions | | | (.73 | ) | | | .10 | | | | .09 | | | | 2.29 | | | | | | | | 1.32 | |
| Total from investment operations | | | (.81 | ) | | | (.05 | ) | | | (.07 | ) | | | 2.15 | | | | | | | | 1.27 | |
| Less Dividends and Distributions: | | | | | | | | | | | | | | | | | | | | | | | | |
| Dividends from net investment income | | | - | | | | - | | | | - | | | | (.05 | ) | | | | | | | - | |
| Distributions from net realized gains | | | - | | | | - | | | | (.48 | ) | | | - | | | | | | | | - | |
| Total dividends and distributions | | | - | | | | - | | | | (.48 | ) | | | (.05 | ) | | | | | | | - | |
| Net asset value, end of period | | | $11.96 | | | | $12.77 | | | | $12.82 | | | | $13.37 | | | | | | | | $11.27 | |
| Total Return(c): | | | (6.34)% | | | | (.39)% | | | | (.57)% | | | | 19.11% | | | | | | | | 12.70% | |
| |
| Ratios/Supplemental Data: | | | | | | | | | | | | | | | | | | |
| Net assets, end of period (000) | | | $779 | | | | $1,215 | | | | $465 | | | | $181 | | | | | | | | $11 | |
| Average net assets (000) | | | $895 | | | | $903 | | | | $362 | | | | $38 | | | | | | | | $11 | |
| Ratios to average net assets(d): | | | | | | | | | | | | | | | | | | | | | | | | |
| Expenses after waivers and/or expense reimbursement | | | 1.90% | | | | 2.30% | | | | 2.35% | | | | 2.35% | | | | | | | | 2.35% | (e) |
| Expenses before waivers and/or expense reimbursement | | | 2.44% | | | | 2.37% | | | | 2.60% | | | | 4.09% | | | | | | | | 5.29% | (e) |
| Net investment income (loss) | | | (.67)% | | | | (1.15)% | | | | (1.21)% | | | | (1.12)% | | | | | | | | (1.16)% | (e) |
| Portfolio turnover rate | | | 65% | | | | 75% | | | | 61% | | | | 86% | | | | | | | | 28% | (f) |
| (a) | Commencement of operations. |
| (b) | Calculated based on average shares outstanding during the period. |
| (c) | Total return does not consider the effects of sales loads. Total return is calculated assuming a purchase of a share on the first day and a sale on the last day of each period reported and includes reinvestment of dividends and distributions, if any. Total returns may reflect adjustments to conform to generally accepted accounting principles. Total returns for periods less than a full year are not annualized. |
| (d) | Does not include expenses of the underlying funds in which the Series invests. |
See Notes to Financial Statements.
| | | | |
| Prudential Jennison International Opportunities Fund | | | 37 | |
Financial Highlights (continued)
| | | | |
| Class Q Shares | | | |
| | | December 23,
2015(a)
through
October 31,
2016 | |
| Per Share Operating Performance(b): | | | | |
| Net Asset Value, Beginning of Period | | | $13.25 | |
| Income (loss) from investment operations: | | | | |
| Net investment income (loss) | | | .06 | |
| Net realized and unrealized gain (loss) on investment transactions | | | (.81 | ) |
| Total from investment operations | | | (.75 | ) |
| Net asset value, end of period | | | $12.50 | |
| Total Return(c): | | | (5.66)% | |
| |
| Ratios/Supplemental Data: | | | |
| Net assets, end of period (000) | | | $23,073 | |
| Average net assets (000) | | | $23,677 | |
| Ratios to average net assets(d): | | | | |
| Expenses after waivers and/or expense reimbursement | | | .84% | (e) |
| Expenses before waivers and/or expense reimbursement | | | 1.43% | (e) |
| Net investment income (loss) | | | .60% | (e) |
| Portfolio turnover rate | | | 65% | |
| (a) | Commencement of operations. |
| (b) | Calculated based on average shares outstanding during the period. |
| (c) | Total return is calculated assuming a purchase of a share on the first day and a sale on the last day of each period reported and includes reinvestment of dividends and distributions, if any. Total returns may reflect adjustments to conform to generally accepted accounting principles. Total returns for periods of less than one full year are not annualized. |
| (d) | Does not include expenses of the underlying funds in which the Series invests. |
See Notes to Financial Statements.
| | | | | | | | | | | | | | | | | | | | | | | | |
| Class Z Shares | |
| | | Year Ended October 31, | | | | | | June 5,
2012(a)
through
October 31, | |
| | | 2016(b) | | | 2015(b) | | | 2014(b) | | | 2013(b) | | | | | | 2012 | |
| Per Share Operating Performance: | | | | | | | | | | | | | | | | | | | | | | | | |
| Net Asset Value, Beginning Of Period | | | $13.20 | | | | $13.13 | | | | $13.55 | | | | $11.32 | | | | | | | | $10.00 | |
| Income (loss) from investment operations: | | | | | | | | | | | | | | | | | | | | | | | | |
| Net investment income (loss) | | | .03 | | | | (.03 | ) | | | (.02 | ) | | | .02 | | | | | | | | (.01 | ) |
| Net realized and unrealized gain (loss) on investment transactions | | | (.73 | ) | | | .10 | | | | .08 | | | | 2.26 | | | | | | | | 1.33 | |
| Total from investment operations | | | (.70 | ) | | | .07 | | | | .06 | | | | 2.28 | | | | | | | | 1.32 | |
| Less Dividends and Distributions: | | | | | | | | | | | | | | | | | | | | | | | | |
| Dividends from net investment income | | | - | | | | - | | | | - | | | | (.05 | ) | | | | | | | - | |
| Distributions from net realized gains | | | - | | | | - | | | | (.48 | ) | | | - | | | | | | | | - | |
| Total dividends and distributions | | | - | | | | - | | | | (.48 | ) | | | (.05 | ) | | | | | | | - | |
| Net asset value, end of period | | | $12.50 | | | | $13.20 | | | | $13.13 | | | | $13.55 | | | | | | | | $11.32 | |
| Total Return(c): | | | (5.30)% | | | | .53% | | | | .42% | | | | 20.24% | | | | | | | | 13.20% | |
| |
| Ratios/Supplemental Data: | | | | | | | | | | | | | | | | | | |
| Net assets, end of period (000) | | | $18,667 | | | | $46,105 | | | | $46,996 | | | | $16,487 | | | | | | | | $11,962 | |
| Average net assets (000) | | | $23,274 | | | | $47,187 | | | | $38,835 | | | | $13,938 | | | | | | | | $11,061 | |
| Ratios to average net assets(d): | | | | | | | | | | | | | | | | | | | | | | | | |
| Expenses after waivers and/or expense reimbursement | | | .90% | | | | 1.31% | | | | 1.35% | | | | 1.35% | | | | | | | | 1.35% | (e) |
| Expenses before waivers and/or expense reimbursement | | | 1.41% | | | | 1.40% | | | | 1.54% | | | | 2.73% | | | | | | | | 4.28% | (e) |
| Net investment income (loss) | | | .25% | | | | (.19)% | | | | (.13)% | | | | .13% | | | | | | | | (.17)% | (e) |
| Portfolio turnover rate | | | 65% | | | | 75% | | | | 61% | | | | 86% | | | | | | | | 28% | (f) |
| (a) | Commencement of operations. |
| (b) | Calculated based on average shares outstanding during the period. |
| (c) | Total return is calculated assuming a purchase of a share on the first day and a sale on the last day of each period reported and includes reinvestment of dividends and distributions, if any. Total returns may reflect adjustments to conform to generally accepted accounting principles. Total returns for periods less than a full year are not annualized. |
| (d) | Does not include expenses of the underlying funds in which the Series invests. |
See Notes to Financial Statements.
| | | | |
| Prudential Jennison International Opportunities Fund | | | 39 | |
Report of Independent Registered Public Accounting Firm
The Board of Directors and Shareholders
Prudential World Fund, Inc.:
We have audited the accompanying statement of assets and liabilities of Prudential Jennison International Opportunities Fund, one of the series constituting Prudential World Fund, Inc. (hereafter referred to as the “Fund”), including the portfolio of investments, as of October 31, 2016, and the related statement of operations for the year then ended, the statements of changes in net assets for each of the years in the two-year period then ended, and the financial highlights for each of the years in the four-year period then ended and the period from June 5, 2012 (commencement of operations) to October 31, 2012. These financial statements and financial highlights are the responsibility of the Fund’s management. Our responsibility is to express an opinion on these financial statements and financial highlights based on our audits.
We conducted our audits in accordance with the standards of the Public Company Accounting Oversight Board (United States). Those standards require that we plan and perform the audit to obtain reasonable assurance about whether the financial statements and financial highlights are free of material misstatement. An audit includes examining, on a test basis, evidence supporting the amounts and disclosures in the financial statements. Our procedures included confirmation of securities owned as of October 31, 2016, by correspondence with the custodian, transfer agent and brokers or by other appropriate auditing procedures when replies from brokers were not received. An audit also includes assessing the accounting principles used and significant estimates made by management, as well as evaluating the overall financial statement presentation. We believe that our audits provide a reasonable basis for our opinion.
In our opinion, the financial statements and financial highlights referred to above present fairly, in all material respects, the financial position of the Fund as of October 31, 2016, and the results of its operations for the year then ended, the changes in its net assets for each of the years in the two-year period then ended, and the financial highlights for each of the years or periods described in the first paragraph, in conformity with U.S. generally accepted accounting principles.

New York, New York
December 15, 2016
Federal Income Tax Information (unaudited)
For the fiscal year ended October 31, 2016, the Series made an election to pass through the maximum amount of the portion of the ordinary income dividends paid derived from foreign source income as well as any foreign taxes paid by the Series in accordance with Section 853 of the Internal Revenue Code of the following amounts: $60,486 foreign tax credit from recognized foreign source income of $672,440.
In January 2017, you will be advised on IRS Form 1099-DIV or substitute 1099-DIV as to the federal tax status of dividends received by you in calendar year 2016.
| | | | |
| Prudential Jennison International Opportunities Fund | | | 41 | |
INFORMATION ABOUT BOARD MEMBERS AND OFFICERS
(Unaudited)
Information about Board Members and Officers of the Fund is set forth below. Board Members who are not deemed to be “interested persons” of the Fund, as defined in the 1940 Act, are referred to as “Independent Board Members.” Board Members who are deemed to be “interested persons” of the Fund are referred to as “Interested Board Members.” The Board Members are responsible for the overall supervision of the operations of the Fund and perform the various duties imposed on the directors of investment companies by the 1940 Act. The Board in turn elects the Officers, who are responsible for administering the day-to-day operations of the Fund.
| | | | |
| Independent Board Members(1) |
Name, Address, Age Position(s) Portfolios Overseen | | Principal Occupation(s) During Past Five Years | | Other Directorships Held During Past Five Years |
Ellen S. Alberding (58) Board Member Portfolios Overseen: 67 | | President and Board Member, The Joyce Foundation (charitable foundation) (since 2002); Vice Chair, City Colleges of Chicago (community college system) (since 2011); Trustee, Skills for America’s Future (national initiative to connect employers to community colleges) (since 2011); Trustee, National Park Foundation (charitable foundation for national park system) (since 2009); Trustee, Economic Club of Chicago (since 2009). | | None. |
Kevin J. Bannon (64) Board Member Portfolios Overseen: 67 | | Managing Director (April 2008-May 2015) and Chief Investment Officer (October 2008-November 2013) of Highmount Capital LLC (registered investment adviser); formerly Executive Vice President and Chief Investment Officer (April 1993-August 2007) of Bank of New York Company; President (May 2003-May 2007) of BNY Hamilton Family of Mutual Funds. | | Director of Urstadt Biddle Properties (equity real estate investment trust) (since September 2008). |
Linda W. Bynoe (64) Board Member Portfolios Overseen: 67 | | President and Chief Executive Officer (since March 1995) and formerly Chief Operating Officer (December 1989-February 1995) of Telemat Ltd. (management consulting); formerly Vice President (January 1985-June 1989) at Morgan Stanley & Co. (broker-dealer). | | Director of Simon Property Group, Inc. (retail real estate) (May 2003-May 2012); Director of Anixter International, Inc. (communication products distributor) (since January 2006); Director of Northern Trust Corporation (financial services) (since April 2006); Trustee of Equity Residential (residential real estate) (since December 2009). |
Prudential Jennison International Opportunities Fund
| | | | |
| Independent Board Members(1) |
Name, Address, Age Position(s) Portfolios Overseen | | Principal Occupation(s) During Past Five Years | | Other Directorships Held During Past Five Years |
Keith F. Hartstein (60) Board Member Portfolios Overseen: 67 | | Retired; Member (since November 2014) of the Governing Council of the Independent Directors Council (organization of independent mutual fund directors); formerly President and Chief Executive Officer (2005-2012), Senior Vice President (2004-2005), Senior Vice President of Sales and Marketing (1997-2004), and various executive management positions (1990-1997), John Hancock Funds, LLC (asset management); Chairman, Investment Company Institute’s Sales Force Marketing Committee (2003-2008). | | None. |
Michael S. Hyland, CFA (71) Board Member Portfolios Overseen: 67 | | Retired (since February 2005); formerly Senior Managing Director (July 2001-February 2005) of Bear Stearns & Co, Inc.; Global Partner, INVESCO (1999-2001); Managing Director and President of Salomon Brothers Asset Management (1989-1999). | | None. |
Richard A. Redeker (73) Board Member & Independent Chair Portfolios Overseen: 67 | | Retired Mutual Fund Senior Executive (47 years); Management Consultant; Director, Mutual Fund Directors Forum (since 2014); Independent Directors Council (organization of independent mutual fund directors)-Executive Committee, Chair of Policy Steering Committee, Governing Council. | | None. |
Stephen G. Stoneburn (73) Board Member Portfolios Overseen: 67 | | Chairman (since July 2011), President and Chief Executive Officer (since June 1996) of Quadrant Media Corp. (publishing company); formerly President (June 1995-June 1996) of Argus Integrated Media, Inc.; Senior Vice President and Managing Director (January 1993-1995) of Cowles Business Media; Senior Vice President of Fairchild Publications, Inc. (1975-1989). | | None. |
Visit our website at prudentialfunds.com
| | | | |
| Interested Board Members(1) |
Name, Address, Age Position(s) Portfolios Overseen | | Principal Occupation(s) During Past Five Years | | Other Directorships Held During Past Five Years |
Stuart S. Parker (54) Board Member & President Portfolios Overseen: 67 | | President of Prudential Investments LLC (since January 2012); Executive Vice President of Prudential Investment Management Services LLC (since December 2012); Executive Vice President of Jennison Associates LLC and Head of Retail Distribution of Prudential Investments LLC (June 2005-December 2011). | | None. |
Scott E. Benjamin (43) Board Member & Vice President Portfolios Overseen: 67 | | Executive Vice President (since June 2009) of Prudential Investments LLC; Executive Vice President (June 2009-June 2012) and Vice President (since June 2012) of Prudential Investment Management Services LLC; Executive Vice President (since September 2009) of AST Investment Services, Inc.; Senior Vice President of Product Development and Marketing, Prudential Investments (since February 2006); Vice President of Product Development and Product Management, Prudential Investments (2003-2006). | | None. |
Grace C. Torres* (57) Board Member Portfolios Overseen: 65 | | Retired; formerly Treasurer and Principal Financial and Accounting Officer of the Prudential Investments Funds, Target Funds, Advanced Series Trust, Prudential Variable Contract Accounts and The Prudential Series Fund (1998-June 2014); Assistant Treasurer (March 1999-June 2014) and Senior Vice President (September 1999-June 2014) of Prudential Investments LLC; Assistant Treasurer (May 2003-June 2014) and Vice President (June 2005-June 2014) of AST Investment Services, Inc.; Senior Vice President and Assistant Treasurer (May 2003-June 2014) of Prudential Annuities Advisory Services, Inc. | | Director (since July 2015) of Sun Bancorp, Inc. N.A. |
| * | Note: Prior to her retirement in 2014, Ms. Torres was employed by Prudential Investments LLC. Due to her prior employment, she is considered to be an “interested person” under the 1940 Act. Ms. Torres is a Non-Management Interested Board Member. |
| (1) | The year that each Board Member joined the Board is as follows: |
Ellen S. Alberding; 2013; Kevin J. Bannon, 2008; Linda W. Bynoe, 2005; Keith F. Hartstein, 2013; Michael S. Hyland, 2008; Richard A. Redeker, 2003; Stephen G. Stoneburn, 1996; Grace C. Torres, 2014; Stuart S. Parker, Board Member and President since 2012; Scott E. Benjamin, Board Member since 2010 and Vice President since 2009.
Prudential Jennison International Opportunities Fund
| | | | |
| Fund Officers(a) |
Name, Address and Age Position with Fund | | Principal Occupation(s) During Past Five Years | | Length of Service as Fund Officer |
Raymond A. O’Hara (61) Chief Legal Officer | | Vice President and Corporate Counsel (since July 2010) of Prudential Insurance Company of America (Prudential); Vice President (March 2011-Present) of Pruco Life Insurance Company and Pruco Life Insurance Company of New Jersey; Vice President and Corporate Counsel (March 2011-Present) of Prudential Annuities Life Assurance Corporation; Chief Legal Officer of Prudential Investments LLC (since June 2012); Chief Legal Officer of Prudential Mutual Fund Services LLC (since June 2012) and Corporate Counsel of AST Investment Services, Inc. (since June 2012); formerly Assistant Vice President and Corporate Counsel (September 2008-July 2010) of The Hartford Financial Services Group, Inc.; formerly Associate (September 1980-December 1987) and Partner (January 1988–August 2008) of Blazzard & Hasenauer, P.C. (formerly, Blazzard, Grodd & Hasenauer, P.C.). | | Since 2012 |
Chad A. Earnst (41) Chief Compliance Officer | | Chief Compliance Officer (September 2014-Present) of Prudential Investments LLC; Chief Compliance Officer (September 2014-Present) of the Prudential Investments Funds, Target Funds, Advanced Series Trust, The Prudential Series Fund, Prudential’s Gibraltar Fund, Inc., Prudential Global Short Duration High Yield Income Fund, Inc., Prudential Short Duration High Yield Fund, Inc. and Prudential Jennison MLP Income Fund, Inc.; formerly Assistant Director (March 2010-August 2014) of the Asset Management Unit, Division of Enforcement, US Securities & Exchange Commission; Assistant Regional Director (January 2010-August 2014), Branch Chief (June 2006–December 2009) and Senior Counsel (April 2003-May 2006) of the Miami Regional Office, Division of Enforcement, US Securities & Exchange Commission. | | Since 2014 |
Deborah A. Docs (58) Secretary | | Vice President and Corporate Counsel (since January 2001) of Prudential; Vice President (since December 1996) and Assistant Secretary (since March 1999) of Prudential Investments LLC; formerly Vice President and Assistant Secretary (May 2003-June 2005) of AST Investment Services, Inc. | | Since 2004 |
Jonathan D. Shain (58) Assistant Secretary | | Vice President and Corporate Counsel (since August 1998) of Prudential; Vice President and Assistant Secretary (since May 2001) of Prudential Investments LLC; Vice President and Assistant Secretary (since February 2001) of Prudential Mutual Fund Services LLC; formerly Vice President and Assistant Secretary (May 2003-June 2005) of AST Investment Services, Inc. | | Since 2005 |
Visit our website at prudentialfunds.com
| | | | |
| Fund Officers(a) |
Name, Address and Age Position with Fund | | Principal Occupation(s) During Past Five Years | | Length of Service as Fund Officer |
| Claudia DiGiacomo (42) Assistant Secretary | | Vice President and Corporate Counsel (since January 2005) of Prudential; Vice President and Assistant Secretary of Prudential Investments LLC (since December 2005); Associate at Sidley Austin Brown & Wood LLP (1999-2004). | | Since 2005 |
| Andrew R. French (53) Assistant Secretary | | Vice President and Corporate Counsel (since February 2010) of Prudential; formerly Director and Corporate Counsel (2006-2010) of Prudential; Vice President and Assistant Secretary (since January 2007) of Prudential Investments LLC; Vice President and Assistant Secretary (since January 2007) of Prudential Mutual Fund Services LLC. | | Since 2006 |
| Theresa C. Thompson (54) Deputy Chief Compliance Officer | | Vice President, Compliance, Prudential Investments LLC (since April 2004); and Director, Compliance, Prudential Investments LLC (2001-2004). | | Since 2008 |
| Charles H. Smith (43) Anti-Money Laundering Compliance Officer | | Vice President, Corporate Compliance, Anti-Money Laundering Unit (since January 2015) of Prudential; committee member of the American Council of Life Insurers Anti-Money Laundering and Critical Infrastructure Committee (since January 2016); formerly Global Head of Economic Sanctions Compliance at AIG Property Casualty (February 2007 – December 2014); Assistant Attorney General at the New York State Attorney General’s Office, Division of Public Advocacy. (August 1998 —January 2007). | | Since 2016 |
| M. Sadiq Peshimam (52) Treasurer and Principal Financial and Accounting Officer | | Vice President (since 2005) of Prudential Investments LLC; formerly Assistant Treasurer of funds in the Prudential Mutual Fund Complex (2006-2014). | | Since 2006 |
Peter Parrella (58) Assistant Treasurer | | Vice President (since 2007) and Director (2004-2007) within Prudential Mutual Fund Administration; formerly Tax Manager at SSB Citi Fund Management LLC (1997-2004). | | Since 2007 |
Lana Lomuti (49) Assistant Treasurer | | Vice President (since 2007) and Director (2005-2007), within Prudential Mutual Fund Administration; formerly Assistant Treasurer (December 2007-February 2014) of The Greater China Fund, Inc. | | Since 2014 |
| Linda McMullin (55) Assistant Treasurer | | Vice President (since 2011) and Director (2008-2011) within Prudential Mutual Fund Administration. | | Since 2014 |
| Kelly A. Coyne (48) Assistant Treasurer | | Director, Investment Operations of Prudential Mutual Fund Services LLC (since 2010). | | Since 2015 |
Prudential Jennison International Opportunities Fund
| (a) | Excludes Mr. Parker and Mr. Benjamin, interested Board Members who also serve as President and Vice President, respectively. |
Explanatory Notes to Tables:
| • | | Board Members are deemed to be “Interested,” as defined in the 1940 Act, by reason of their affiliation with Prudential Investments LLC and/or an affiliate of Prudential Investments LLC. |
| • | | Unless otherwise noted, the address of all Board Members and Officers is c/o Prudential Investments LLC, 655 Broad Street, Newark, New Jersey 07102-4410. |
| • | | There is no set term of office for Board Members or Officers. The Board Members have adopted a retirement policy, which calls for the retirement of Board Members on December 31 of the year in which they reach the age of 75. |
| • | | “Other Directorships Held” includes only directorships of companies required to register or file reports with the SEC under the 1934 Act (that is, “public companies”) or other investment companies registered under the 1940 Act. |
| • | | “Portfolios Overseen” includes all investment companies managed by Prudential Investments LLC. The investment companies for which Prudential Investments LLC serves as manager include the Prudential Investments Mutual Funds, The Prudential Variable Contract Accounts, Target Mutual Funds, Prudential Short Duration High Yield Fund, Inc., Prudential Global Short Duration High Yield Fund, Inc., The Prudential Series Fund, Prudential’s Gibraltar Fund, Inc. and the Advanced Series Trust. |
Visit our website at prudentialfunds.com
Approval of Advisory Agreements (unaudited)
The Fund’s Board of Directors
The Board of Directors (the “Board”) of Prudential Jennison International Opportunities Fund (the “Fund”)1 consists of ten individuals, seven of whom are not “interested persons” of the Fund, as defined in the Investment Company Act of 1940, as amended (the “1940 Act”) (the “Independent Directors”). The Board is responsible for the oversight of the Fund and its operations, and performs the various duties imposed on the directors of investment companies by the 1940 Act. The Independent Directors have retained independent legal counsel to assist them in connection with their duties. The Chair of the Board is an Independent Director. The Board has established three standing committees: the Audit Committee, the Nominating and Governance Committee, and the Investment Committee. Each committee is chaired by, and composed of, Independent Directors.
Annual Approval of the Fund’s Advisory Agreements
As required under the 1940 Act, the Board determines annually whether to renew the Fund’s management agreement with Prudential Investments LLC (“PI”) and the Fund’s subadvisory agreement with Jennison Associates LLC (“Jennison”). In considering the renewal of the agreements, the Board, including all of the Independent Directors, met on June 7-9, 2016 and approved the renewal of the agreements through July 31, 2017, after concluding that the renewal of the agreements was in the best interests of the Fund and its shareholders.
In advance of the meetings, the Board requested and received materials relating to the agreements, and had the opportunity to ask questions and request further information in connection with its consideration. Among other things, the Board considered comparative fee information from PI and Jennison. Also, the Board considered comparisons with other mutual funds in relevant Peer Universes and Peer Groups, as is further discussed below.
In approving the agreements, the Board, including the Independent Directors advised by independent legal counsel, considered the factors it deemed relevant, including the nature, quality and extent of services provided by PI and the subadviser, the performance of the Fund, the profitability of PI and its affiliates, expenses and fees, and the potential for economies of scale that may be shared with the Fund and its shareholders as the Fund’s assets grow. In their deliberations, the Directors did not identify any single factor which alone was responsible for the Board’s decision to approve the agreements with respect to the Fund. In connection with its deliberations, the Board considered information provided by PI throughout the year at regular Board meetings, presentations from portfolio managers and other information, as well as information furnished at or in advance of the meetings on June 7-9, 2016.
| 1 | Prudential Jennison International Opportunities Fund is a series of Prudential World Fund, Inc. |
| | |
| Prudential Jennison International Opportunities Fund |
Approval of Advisory Agreements (continued)
The Directors determined that the overall arrangements between the Fund and PI, which serves as the Fund’s investment manager pursuant to a management agreement, and between PI and Jennison, which serves as the Fund’s subadviser pursuant to the terms of a subadvisory agreement with PI, are in the best interests of the Fund and its shareholders in light of the services performed, fees charged and such other matters as the Directors considered relevant in the exercise of their business judgment.
The material factors and conclusions that formed the basis for the Directors’ reaching their determinations to approve the continuance of the agreements are separately discussed below.
Nature, Quality, and Extent of Services
The Board received and considered information regarding the nature, quality and extent of services provided to the Fund by PI and Jennison. The Board considered the services provided by PI, including but not limited to the oversight of the subadviser for the Fund, as well as the provision of fund recordkeeping, compliance, and other services to the Fund. With respect to PI’s oversight of the subadviser, the Board noted that PI’s Strategic Investment Research Group (“SIRG”), which is a business unit of PI, is responsible for monitoring and reporting to PI’s senior management on the performance and operations of the subadviser. The Board also considered that PI pays the salaries of all of the officers and interested Directors of the Fund who are part of Fund management. The Board also considered the investment subadvisory services provided by Jennison, as well as adherence to the Fund’s investment restrictions and compliance with applicable Fund policies and procedures. The Board considered PI’s evaluation of the subadviser, as well as PI’s recommendation, based on its review of the subadviser, to renew the subadvisory agreement.
The Board considered the qualifications, backgrounds and responsibilities of PI’s senior management responsible for the oversight of the Fund and Jennison, and also considered the qualifications, backgrounds and responsibilities of Jennison’s portfolio managers who are responsible for the day-to-day management of the Fund’s portfolio. The Board was provided with information pertaining to PI’s and Jennison’s organizational structure, senior management, investment operations, and other relevant information pertaining to both PI and Jennison. The Board also noted that it received favorable compliance reports from the Fund’s Chief Compliance Officer (“CCO”) as to both PI and Jennison. The Board noted that Jennison is affiliated with PI.
The Board concluded that it was satisfied with the nature, extent and quality of the investment management services provided by PI and the subadvisory services provided to the Fund by Jennison, and that there was a reasonable basis on which to conclude that the Fund benefits from the services provided by PI and Jennison under the management and subadvisory agreements.
| | |
| Visit our website at prudentialfunds.com | | |
Costs of Services and Profits Realized by PI
The Board was provided with information on the profitability of PI and its affiliates in serving as the Fund’s investment manager. The Board discussed with PI the methodology utilized in assembling the information regarding profitability and considered its reasonableness. The Board recognized that it is difficult to make comparisons of profitability from fund management contracts because comparative information is not generally publicly available and is affected by numerous factors, including the structure of the particular adviser, the types of funds it manages, its business mix, numerous assumptions regarding allocations and the adviser’s capital structure and cost of capital. However, the Board considered that the cost of services provided by PI to the Fund during the year ended December 31, 2015 exceeded the management fees paid by the Fund, resulting in an operating loss to PI. The Board further noted that the subadviser is affiliated with PI and that its profitability is reflected in PI’s profitability report. Taking these factors into account, the Board concluded that the profitability of PI and its affiliates in relation to the services rendered was not unreasonable.
Economies of Scale
PI and the Board previously retained an outside business consulting firm to review management fee breakpoint usage and trends in management fees across the mutual fund industry. The consulting firm presented its analysis and conclusions as to the Funds’ management fee structures to the Board and PI. The Board and PI have discussed these conclusions extensively since that presentation.
The Board received and discussed information concerning economies of scale that PI may realize as the Fund’s assets grow beyond current levels. The Board considered information provided by PI regarding the launch date of the Fund, the management fees of the Fund compared to those of similarly managed funds and PI’s investment in the Fund over time. The Board noted that economies of scale, if any, may be shared with the Fund in several ways, including low management fees from inception, additional technological and personnel investments to enhance shareholder services, and maintaining existing expense structures in the face of a rising cost environment. The Board considered PI’s assertion that it continually evaluates the management fee schedule of the Fund and the potential to share economies of scale through breakpoints or fee waivers as asset levels increase.
The Board recognized the inherent limitations of any analysis of economies of scale, stemming largely from the Board’s understanding that most of PI’s costs are not specific to individual funds, but rather are incurred across a variety of products and services.
| | |
| Prudential Jennison International Opportunities Fund |
Approval of Advisory Agreements (continued)
Other Benefits to PI and Jennison
The Board considered potential ancillary benefits that might be received by PI and Jennison and their affiliates as a result of their relationship with the Fund. The Board concluded that potential benefits to be derived by PI included fees received by affiliates of PI for serving as the Fund’s securities lending agent, transfer agency fees received by the Fund’s transfer agent (which is affiliated with PI), as well as benefits to its reputation or other intangible benefits resulting from PI’s association with the Fund. The Board concluded that the potential benefits to be derived by Jennison included the ability to use soft dollar credits, as well as the potential benefits consistent with those generally resulting from an increase in assets under management, specifically, potential access to additional research resources and benefits to its reputation. The Board concluded that the benefits derived by PI and Jennison were consistent with the types of benefits generally derived by investment managers and subadvisers to mutual funds.
Performance of the Fund / Fees and Expenses
The Board considered certain additional specific factors and made related conclusions relating to the historical performance of the Fund for the one- and three-year periods ended December 31, 2015.
The Board also considered the Fund’s actual management fee, as well as the Fund’s net total expense ratio, for the fiscal year ended October 31, 2015. The Board considered the management fee for the Fund as compared to the management fee charged by PI to other funds and the fee charged by other advisers to comparable mutual funds in a Peer Group. The actual management fee represents the fee rate actually paid by Fund shareholders and includes any fee waivers or reimbursements. The net total expense ratio for the Fund represents the actual expense ratio incurred by Fund shareholders.
The mutual funds included in the Peer Universe (the Lipper International Multi-Cap Growth Funds Performance Universe) and the Peer Group were objectively determined by Broadridge, an independent provider of mutual fund data. The comparisons placed the Fund in various quartiles, with the first quartile being the best 25% of the mutual funds (for performance, the best performing mutual funds and, for expenses, the lowest cost mutual funds).
The section below summarizes key factors considered by the Board and the Board’s conclusions regarding the Fund’s performance, fees and overall expenses. The table sets forth gross performance comparisons (which do not reflect the impact on performance of fund expenses, or any subsidies, expense caps or waivers that may be applicable) with the Peer Universe, actual management fees with the Peer Group (which reflect the impact of
| | |
| Visit our website at prudentialfunds.com | | |
any subsidies or fee waivers), and net total expenses with the Peer Group, each of which were key factors considered by the Board.
| | | | | | | | |
| Performance | | 1 Year | | 3 Years | | 5 Years | | 10 Years |
| | | 1st Quartile | | 3rd Quartile | | N/A | | N/A |
| Actual Management Fees: 4th Quartile |
| Net Total Expenses: 4th Quartile |
| | • | | The Board noted that Fund outperformed its benchmark index over all periods. |
| | • | | The Board noted information provided by PI indicating that the Fund’s net total expense ratio was thirteen basis points higher than the median of all funds in the Peer Group. |
| | • | | The Board also considered information provided by PI to the effect that effective October 1, 2015, PI agreed to limit expenses so that the Fund’s annual operating expenses do not exceed 0.84% (exclusive of 12b-1, transfer agent, and certain other fees) and that this change was not fully reflected in the 2015 annual expense calculations for the Fund. The Board noted that if this change was reflected for the full fiscal year, the Fund’s net total expenses would rank in the first quartile of its Peer Group, and in the first quartile of its Peer Universe. |
| | • | | The Board and PI agreed to continue the existing expense cap of 0.84% (exclusive of 12b-1, transfer agent, and certain other fees) through February 28, 2017. |
| | • | | The Board concluded that, in light of the above, it would be in the best interests of the Fund and its shareholders to continue to monitor performance and to renew the agreements. |
| | • | | The Board concluded that the management fees (including subadvisory fees) and total expenses were reasonable in light of the services provided. |
* * *
After full consideration of these factors, the Board concluded that the approval of the agreements was in the best interests of the Fund and its shareholders.
| | |
| Prudential Jennison International Opportunities Fund |
| | | | |
| ∎ MAIL | | ∎ TELEPHONE | | ∎ WEBSITE |
655 Broad Street Newark, NJ 07102 | | (800) 225-1852 | | www.prudentialfunds.com |
|
| PROXY VOTING |
| The Board of Directors of the Fund has delegated to the Fund’s investment subadviser the responsibility for voting any proxies and maintaining proxy recordkeeping with respect to the Fund. A description of these proxy voting policies and procedures is available without charge, upon request, by calling (800) 225-1852 or by visiting the Securities and Exchange Commission’s website at www.sec.gov. Information regarding how the Fund voted proxies relating to portfolio securities during the most recent 12-month period ended June 30 is available on the Fund’s website and on the Securities and Exchange Commission’s website. |
|
| DIRECTORS |
| Ellen S. Alberding • Kevin J. Bannon • Scott E. Benjamin • Linda W. Bynoe • Keith F. Hartstein • Michael S. Hyland • Stuart S. Parker • Richard A. Redeker • Stephen G. Stoneburn • Grace C. Torres |
|
| OFFICERS |
| Stuart S. Parker, President • Scott E. Benjamin, Vice President • M. Sadiq Peshimam, Treasurer and Principal Financial and Accounting Officer • Raymond A. O’Hara, Chief Legal Officer • Deborah A. Docs, Secretary • Chad A. Earnst, Chief Compliance Officer • Theresa C. Thompson, Deputy Chief Compliance Officer • Charles H. Smith, Anti-Money Laundering Compliance Officer • Jonathan D. Shain, Assistant Secretary • Claudia DiGiacomo, Assistant Secretary • Andrew R. French, Assistant Secretary • Peter Parrella, Assistant Treasurer • Lana Lomuti, Assistant Treasurer • Linda McMullin, Assistant Treasurer • Kelly A. Coyne, Assistant Treasurer |
| | | | |
| MANAGER | | Prudential Investments LLC | | 655 Broad Street Newark, NJ 07102 |
|
| INVESTMENT SUBADVISER | | Jennison Associates LLC | | 466 Lexington Avenue
New York, NY 10017 |
|
| DISTRIBUTOR | | Prudential Investment
Management Services LLC | | 655 Broad Street Newark, NJ 07102 |
|
| CUSTODIAN | | The Bank of New York Mellon | | One Wall Street
New York, NY 10286 |
|
| TRANSFER AGENT | | Prudential Mutual Fund
Services LLC | | PO Box 9658
Providence, RI 02940 |
|
| INDEPENDENT REGISTERED PUBLIC ACCOUNTING FIRM | | KPMG LLP | | 345 Park Avenue New York, NY 10154 |
|
| FUND COUNSEL | | Willkie Farr & Gallagher LLP | | 787 Seventh Avenue
New York, NY 10019 |
|
|
| An investor should consider the investment objectives, risks, charges, and expenses of the Fund carefully before investing. The prospectus and summary prospectus contain this and other information about the Fund. An investor may obtain a prospectus and summary prospectus by visiting our website at www.prudentialfunds.com or by calling (800) 225-1852. The prospectus and summary prospectus should be read carefully before investing. |
|
| E-DELIVERY |
| To receive your mutual fund documents online, go to www.prudentialfunds.com/edelivery and enroll. Instead of receiving printed documents by mail, you will receive notification via email when new materials are available. You can cancel your enrollment or change your email address at any time by visiting the website address above. |
|
| SHAREHOLDER COMMUNICATIONS WITH DIRECTORS |
| Shareholders can communicate directly with the Board of Directors by writing to the Chair of the Board, Prudential Jennison International Opportunities Fund, Prudential Investments, Attn: Board of Directors, 655 Broad Street, Newark, NJ 07102. Shareholders can communicate directly with an individual Director by writing to the same address. Communications are not screened before being delivered to the addressee. |
|
| AVAILABILITY OF PORTFOLIO SCHEDULE |
| The Fund files its complete schedule of portfolio holdings with the Securities and Exchange Commission for the first and third quarters of each fiscal year on Form N-Q. The Fund’s Forms N-Q are available on the Commission’s website at www.sec.gov. The Fund’s Forms N-Q may also be reviewed and copied at the Commission’s Public Reference Room in Washington, D.C. Information on the operation and location of the Public Reference Room may be obtained by calling 1-800-SEC-0330. The Fund’s schedule of portfolio holdings is also available on the Fund’s website as of the end of each month no sooner than 15 days after the end of the month. |
|
| The Fund’s Statement of Additional Information contains additional information about the Fund’s Directors and is available without charge, upon request, by calling (800) 225-1852. |
Mutual Funds:
| | | | |
| ARE NOT INSURED BY THE FDIC OR ANY FEDERAL GOVERNMENT AGENCY | | MAY LOSE VALUE | | ARE NOT A DEPOSIT OF OR GUARANTEED BY ANY BANK OR ANY BANK AFFILIATE |
PRUDENTIAL JENNISON INTERNATIONAL OPPORTUNITIES FUND
| | | | | | | | |
| SHARE CLASS | | A | | C | | Q | | Z |
| NASDAQ | | PWJAX | | PWJCX | | PWJQX | | PWJZX |
| CUSIP | | 743969677 | | 743969669 | | 743969586 | | 743969651 |
MF215E 0300092-00001-00
PRUDENTIAL INVESTMENTS, A PGIM BUSINESS | MUTUAL FUNDS
Prudential Jennison Global Infrastructure Fund
| | |
| ANNUAL REPORT | | OCTOBER 31, 2016 |

| | |
To enroll in e-delivery, go to prudentialfunds.com/edelivery | |  |
Highlights
PRUDENTIAL JENNISON GLOBAL INFRASTRUCTURE FUND
| • | | The Prudential Jennison Global Infrastructure Fund’s oil & gas storage & transportation and electric utilities holdings were among the main drivers of performance during the period. (For a complete list of holdings, refer to the Portfolio of Investments section of this report.) |
| • | | Positions within the specialized real estate investment trusts (REITs) segment also helped. |
| • | | Conversely, diversified telecommunication services holdings hurt, as well as commercial services & supplies and highways & rail holdings, all of which detracted from performance during the period. |
This report is not authorized for distribution to prospective investors unless preceded or accompanied by a current prospectus.
The views expressed in this report and information about the Fund’s portfolio holdings are for the period covered by this report and are subject to change thereafter.
Mutual funds are distributed by Prudential Investment Management Services LLC, member SIPC. Jennison Associates LLC is a registered investment adviser. Both are Prudential Financial companies. © 2016 Prudential Financial, Inc. and its related entities. Jennison Associates, Jennison, the Prudential logo, and the Rock symbol are service marks of Prudential Financial, Inc. and its related entities, registered in many jurisdictions worldwide.
| | |
| 2 | | Visit our website at prudentialfunds.com |
Letter from the President

Dear Shareholder:
We hope you find the annual report for the Prudential Jennison Global Infrastructure Fund informative and useful. The report covers performance for the 12-month period that ended October 31, 2016.
During the reporting period, the US economy experienced modest growth. Labor markets were healthy, and consumer confidence rose. The housing market brightened somewhat, as momentum continued for the new home market. The Federal Reserve kept interest rates unchanged at its September meeting, but pointed to the strong possibility of a rate hike in December. Internationally, concerns over Brexit—the term used to represent Britain’s decision to leave the European Union—remained in the spotlight.
Equity markets in the US were firmly in positive territory at the end of the reporting period, as US stocks posted strong gains. European stocks struggled earlier, but found some traction in the third quarter. Asian markets also advanced, and emerging markets rose sharply.
US fixed income markets experienced overall gains. High yield bonds posted very strong results. Corporate bonds and Treasuries also performed well. Accommodative monetary policy by central banks helped lift global bond markets.
Given the uncertainty in today’s investment environment, we believe that active professional portfolio management offers a potential advantage. Active managers often have the knowledge and flexibility to find the best investment opportunities in the most challenging markets.
Even so, it’s best if investment decisions are based on your long-term goals rather than on short-term market and economic developments. We also encourage you to work with an experienced financial advisor who can help you set goals, determine your tolerance for risk, build a diversified plan that’s right for you, and make adjustments when necessary.
By having Prudential Investments help you address your goals, you gain the advantage of asset managers that also manage money for many major corporations and pension funds around the world. That means you benefit from the same expertise, innovation, and attention to risk demanded by today’s most sophisticated investors.
Thank you for choosing our family of funds.
Sincerely,

Stuart S. Parker, President
Prudential Jennison Global Infrastructure Fund
December 15, 2016
| | | | |
| Prudential Jennison Global Infrastructure Fund | | | 3 | |
Your Fund’s Performance (unaudited)
Performance data quoted represent past performance. Past performance does not guarantee future results. The investment return and principal value of an investment will fluctuate, so that an investor’s shares, when redeemed, may be worth more or less than their original cost. Current performance may be lower or higher than the past performance data quoted. An investor may obtain performance data as of the most recent month-end by visiting our website at www.prudentialfunds.com or by calling (800) 225-1852.
| | | | | | |
| Cumulative Total Returns (Without Sales Charges) as of 10/31/16 | |
| | One Year (%) | | | Since Inception (%) | |
| Class A | | 2.62 | | | 20.07 (9/25/13) | |
| Class C | | 1.88 | | | 17.25 (9/25/13) | |
| Class Z | | 2.96 | | | 20.94 (9/25/13) | |
| S&P Global Infrastructure Index | | 5.34 | | | 16.18 | |
| S&P 500 Index | | 4.49 | | | 34.80 | |
| Lipper Global Infrastructure Funds Average | | 4.49 | | | 16.60 | |
| | | | | | |
| Average Annual Total Returns (With Sales Charges) as of 9/30/16 | |
| | One Year (%) | | | Since Inception (%) | |
| Class A | | 5.51 | | | 5.37 (9/25/13) | |
| Class C | | 9.82 | | | 6.56 (9/25/13) | |
| Class Z | | 12.01 | | | 7.63 (9/25/13) | |
| S&P Global Infrastructure Index | | 13.59 | | | 6.14 | |
| S&P 500 Index | | 15.41 | | | 11.15 | |
| Lipper Global Infrastructure Funds Average | | 13.58 | | | 6.22 | |
| | | | | | |
| Average Annual Total Returns (With Sales Charges) as of 10/31/16 | |
| | One Year (%) | | | Since Inception (%) | |
| Class A | | –3.03 | | | 4.16 (9/25/13) | |
| Class C | | 0.88 | | | 5.26 (9/25/13) | |
| Class Z | | 2.96 | | | 6.32 (9/25/13) | |
| | |
| 4 | | Visit our website at prudentialfunds.com |
| | | | |
| Average Annual Total Returns (Without Sales Charges) as of 10/31/16 |
| | One Year (%) | | Since Inception (%) |
| Class A | | 2.62 | | 6.08 (9/25/13) |
| Class C | | 1.88 | | 5.26 (9/25/13) |
| Class Z | | 2.96 | | 6.32 (9/25/13) |
Growth of a $10,000 Investment
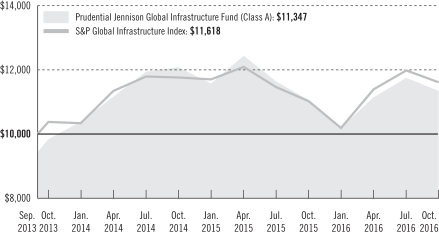
The graph compares a $10,000 investment in the Fund’s Class A shares with a similar investment in the S&P Global Infrastructure Index by portraying the initial account values at the commencement of operations of Class A shares (September 25, 2013) and the account values at the end of the current fiscal year (October 31, 2016), as measured on a quarterly basis. For purposes of the graph, and unless otherwise indicated, it has been assumed that (a) the maximum applicable front-end sales charge was deducted from the initial $10,000 investment in Class A shares; (b) all recurring fees (including management fees) were deducted; and (c) all dividends and distributions were reinvested. The line graph provides information for Class A shares only. As indicated in the tables provided earlier, performance for Class C and Class Z shares will vary due to the differing charges and expenses applicable to each share class (as indicated in the following paragraphs). Without waiver of fees and/or expense reimbursements, if any, the Fund’s returns would have been lower.
Past performance does not predict future performance. Total returns and the ending account values in the graphs include changes in share price and reinvestment of dividends and capital gains distributions in a
| | | | |
| Prudential Jennison Global Infrastructure Fund | | | 5 | |
Your Fund’s Performance (continued)
hypothetical investment for the periods shown. The Fund’s total returns do not reflect the deduction of income taxes on an individual’s investment. Taxes may reduce your actual investment returns on income or gains paid by the Fund or any gains you may realize if you sell your shares.
Source: Prudential Investments LLC and Lipper Inc.
Inception returns are provided for any share class with less than 10 calendar years of returns.
The returns in the tables do not reflect the deduction of taxes that a shareholder would pay on Fund distributions or following the redemption of Fund shares. The average annual total returns take into account applicable sales charges, which are described for each share class in the table below.
| | | | | | |
| | | Class A | | Class C | | Class Z |
| Maximum initial sales charge | | 5.50% of the public offering price | | None | | None |
| Contingent deferred sales charge (CDSC) (as a percentage of the lower of original purchase price or net asset value at redemption) | | 1% on sales of $1 million or more made within 12 months of purchase | | 1% on sales made within 12 months of purchase | | None |
| Annual distribution and service (12b-1) fees (shown as a percentage of average daily net assets) | | .30% (.25% currently) | | 1% | | None |
Benchmark Definitions
S&P Global Infrastructure Index—The S&P Global Infrastructure Index is an unmanaged index that consists of 75 companies from around the world that represent the listed infrastructure universe. To create diversified exposure across the global listed infrastructure market, the Index has balanced weights across three distinct infrastructure clusters: Utilities, Transportation, and Energy.
S&P 500 Index—The Standard & Poor’s 500 Composite Stock Price Index (S&P 500 Index) is an unmanaged index of over 500 stocks of large US public companies. It gives a broad look at how stock prices in the United States have performed.
Lipper Global Infrastructure Funds Average—The Lipper Global Infrastructure Funds Average (Lipper Average) is based on the average return of all funds in the Lipper Global Infrastructure Funds category for the periods noted. Funds in the Lipper Average invest primarily in equity securities of domestic and foreign companies engaged in an infrastructure industry, including but not limited to transportation, communication, and waste management.
Investors cannot invest directly in an index or average. The returns for the Indexes would be lower if they included the effects of sales charges, operating expenses of a mutual fund, or taxes. Returns for the Lipper
| | |
| 6 | | Visit our website at prudentialfunds.com |
Average reflect the deduction of operating expenses, but not sales charges or taxes. The Since Inception returns for the Indexes and the Lipper Average are measured from the closest month-end to the inception date for the indicated share class.
| | | | |
Five Largest Holdings expressed as a
percentage of net assets as of 10/31/16 (%) | |
| NextEra Energy, Inc., Electric Utilities | | | 4.2 | |
| PG&E Corp., Electric Utilities | | | 4.0 | |
Transurban Group,
Transportation Infrastructure | | | 3.6 | |
| Atlantia SpA, Transportation Infrastructure | | | 3.2 | |
| Eiffage SA, Construction & Engineering | | | 3.1 | |
Holdings reflect only long-term investments and are subject to change.
| | | | |
Five Largest Industries expressed as a
percentage of net assets as of 10/31/16 (%) | |
| Oil, Gas & Consumable Fuels | | | 21.5 | |
| Transportation Infrastructure | | | 20.6 | |
| Electric Utilities | | | 20.5 | |
| Construction & Engineering | | | 7.3 | |
| Multi-Utilities | | | 5.7 | |
Industry weightings reflect only long-term investments and are subject to change.
| | | | |
| Prudential Jennison Global Infrastructure Fund | | | 7 | |
Strategy and Performance Overview
How did the Fund perform?
The Prudential Jennison Global Infrastructure Fund’s Class A shares rose 2.62% for the 12 months ended October 31, 2016. Over the same period, the S&P Global Infrastructure Index (the Index) climbed 5.34% and the Lipper Global Infrastructure Funds Average returned 4.49%.
The Fund’s oil & gas storage & transportation and electric utilities holdings were among the main drivers of performance during the period. Positions within the specialized REITs segment also helped. Conversely, diversified telecommunication services holdings hurt, as well as commercial services & supplies and highways & rail holdings, all of which detracted from performance during the period.
What was the market environment?
| • | | Risk aversion in this volatile global market environment affected how investors valued different securities. Increased market sentiment around the potential for the Fed’s September rate hike towards the end of July and through August caused a sell-off in “bond proxy” or “dividend-yielding” sectors and/or stocks (e.g., Utilities, Telecom, REITs, etc.). |
| • | | Numerous factors contributed to overall market volatility in the 12-month period, including decelerating economic growth in China; concerns that emerging economies might face balance sheet risks; the negative effect of lower energy prices on industrial sectors; fears of slowing economic growth in the US; uncertainty about the course of future Federal Reserve monetary tightening; Brexit, the United Kingdom’s vote to leave the European Union; and anxiety about the highly unconventional US presidential election. |
| • | | During the period, uncertainty with Iran and the market showing bearish led to extreme volatility. Prices double dipped in early 2016 after hitting multi-year lows, but recovered during the spring. In the second half of 2016, OPEC’s agreement to cut production following oil production restarts in Libya and Nigeria whipsawed oil prices. |
What worked?
In utilities:
| • | | NextEra Energy is an electric power company in North America which operates through its wholly owned subsidiaries, Florida Power & Light Company and NextEra Energy Resources, LLC. The company has electric generating facilities located in 27 states in the United States and four provinces in Canada. Shares of the company performed well during the period as recent acquisitions, accelerating renewables growth, and strong quarterly earnings results drove shares higher. Jennison likes the company for its above-average rate base and customer growth potential along with its preeminent status as a leading renewable energy player in the US. |
| | |
| 8 | | Visit our website at prudentialfunds.com |
| • | | PG&E Corporation is an electric utility company whose primary operating subsidiary is Pacific Gas and Electric company (the Utility). The company, through its subsidiary, includes electric and natural gas utility operations in northern and central California. The Utility generates electricity and provides electricity transmission and distribution services throughout its service territory in northern and central California to residential, commercial, industrial, and agricultural customers. Despite the sell-off in “bond-proxy” stocks around the third quarter, shares managed to perform well, as the company raised its quarterly dividend during the period. Jennison likes the company for its long-term rate base growth that should prove reasonably durable. |
In real estate, specifically within specialized REITs:
| • | | CyrusOne is an owner, operator and developer of enterprise-class, carrier-neutral, multi-tenant data center properties. Operating as a specialized REIT, the company’s data centers are purpose-built facilities, which have access to a range of telecommunications carriers and provide mission-critical data center facilities that protect the information technology (IT) infrastructure for its clients. Shares of the company performed well during the period as strong leasing and healthy sales demand, along with raised earnings guidance by management, have pushed shares higher. While Jennison maintain a positive outlook on the data center industry, and likes CyrusOne for its flexible product offering, speed to market, as well as for its above-average growth rate potential, the Fund has been taking profits and trimming the position over the past few months as “bond-proxy” stocks have sold off. |
What didn’t work?
In industrials:
| • | | Spotless Group Holdings Ltd is a provider of facility services, and laundry and linen services in Australia and New Zealand. The company provides a range of facility services, including facility management, asset maintenance, catering and food solutions, cleaning and hygiene services, security, utility infrastructure services, technical and engineering services, as well as refrigeration solutions. Shares fell during the period as weak results and the company’s inability to sell its laundry business weighed on its share price. Jennison believes the company stands to benefit from increased outsourcing from public and private customers looking for cost savings. |
| • | | Groupe Eurotunnel SE is a France-based holding company, engaged in the fields of infrastructure management and transport operations. The company owns and operates the Channel Tunnel (or Chunnel) beneath the English Channel. It has exposure to the railway system providing passenger and freight transport between continental Europe and the UK. Shares underperformed during the period as the company lowered its earnings guidance due to Brexit and its impact to revenues from foreign exchanges. With its |
| | | | |
| Prudential Jennison Global Infrastructure Fund | | | 9 | |
Strategy and Performance Overview (continued)
| | longer-term prospects in light of plans to expand the Eurotunnel/Eurostar routes to Germany and the Netherlands, Jennison believes the company has good growth trajectory for generating significant free cash flow. |
| • | | Ferrovial S.A., a Spanish-based infrastructure and construction company, operates and runs infrastructure-related assets and services across the globe. The company operates through its four business segments; Toll Roads, Construction, Airports, and Services. Market fears on how a Brexit would affect its UK business segment along with earnings coming in below expectations, all pushed shares lower during the period, despite positive traffic trends. Jennison continue to see Ferrovial’s two most attractive assets as Canada’s 407 ETR (express toll route), just north of Toronto, and BAA (British Airports Authority). Both, in Jennison’s opinion, have a favorable regulatory environment and good long-term growth prospects. |
The percentage points shown in the tables identify each security’s positive or negative contribution to the Fund’s return, which is the sum of all contributions by individual holdings.
| | | | | | |
| Top Contributors (%) | | Top Detractors (%) |
| NextEra Energy | | 1.18 | | Spotless Group Holdings Ltd | | –1.20 |
| CyrusOne, Inc. | | 1.01 | | Groupe Eurotunnel SE | | –1.06 |
| PG&E Corporation | | 0.86 | | Ferrovial SA | | –0.87 |
| Plains All American Pipeline, LP | | 0.68 | | Energy Transfer Equity LP | | –0.82 |
| American Water Works Company | | 0.68 | | SBA Communications | | –0.61 |
Current outlook
| • | | Within the utility sector, Jennison continues to prefer regulated electric utilities with solid dividend yields, above-average projected earnings and/or dividend growth, and which operate in constructive regulatory environments. Jennison believes there is a secular trend of rising global demand for renewable energy supply and subsequent transmission investment needed to tie those cleaner resources into the grid, as well as to modernize the aging grid infrastructure to absorb the intermittent nature of renewable generation. |
| • | | In Jennison’s opinion, the trend for increased investment in renewable energy is supported by two broad and enduring themes: (1) pronounced reductions in the cost of renewable energy driven by continued technological advancement, and (2) increasing public policy support—on a global scale—for renewable investment driven by concerns over greenhouse gas emissions, energy security, and most recently, job creation. |
| • | | Regarding energy infrastructure, oil and natural gas prices have rebounded from their early-2016 lows and North American oil & gas producers (who represent a very |
| | |
| 10 | | Visit our website at prudentialfunds.com |
| | significant portion of the customer base for energy infrastructure companies) are in a much stronger financial position today than they were at the beginning of the year. Such developments bode well for the prospects of the North American midstream industry and we believe that outlook will improve further still in 2017 and beyond as supply and demand for oil and natural gas move closer to equilibrium. Through a reduction in field service costs and improvements in drilling & completion techniques, we believe oil & gas producers are quickly recalibrating their operating cost structures so they can grow production profitably at lower commodity prices—production growth which, in turn, will drive demand for incremental infrastructure investment. |
| • | | Due to the greater degree of uncertainty and volatility, Jennison is focusing on energy infrastructure companies which exhibit many of the following characteristics: a very high degree of fee-based gross margins, with little to no direct commodity price sensitivity; asset platforms in the core areas of the lower-cost production basins with a current preference for natural gas over oil; under-levered balance sheets; and a high degree of visibility and transparency into their backlog of growth projects. |
| • | | In telecommunications services, Jennison likes wireless tower operators and believes they are an attractive investment opportunity given their ability to generate free cash flow and the relative potential of earnings. Jennison also likes cable broadband providers. Additionally, Jennison believes cable broadband providers can also generate attractive levels of free cash flow which can be returned to shareholders through dividends and share repurchases. |
| | | | |
| Prudential Jennison Global Infrastructure Fund | | | 11 | |
Fees and Expenses (unaudited)
As a shareholder of the Fund, you incur two types of costs: (1) transaction costs, including sales charges (loads) on purchase payments and redemptions, as applicable, and (2) ongoing costs, including management fees, distribution, and/or service (12b-1) fees, and other Fund expenses, as applicable. This example is intended to help you understand your ongoing costs (in dollars) of investing in the Fund and to compare these costs with the ongoing costs of investing in other mutual funds.
The example is based on an investment of $1,000 invested on May 1, 2016, at the beginning of the period, and held through the six-month period ended October 31, 2016. The example is for illustrative purposes only; you should consult the Prospectus for information on initial and subsequent minimum investment requirements.
Actual Expenses
The first line for each share class in the table on the following page provides information about actual account values and actual expenses. You may use the information on this line, together with the amount you invested, to estimate the expenses that you paid over the period. Simply divide your account value by $1,000 (for example, an $8,600 account value ÷ $1,000 = 8.6), then multiply the result by the number on the first line under the heading “Expenses Paid During the Six-Month Period” to estimate the expenses you paid on your account during this period.
Hypothetical Example for Comparison Purposes
The second line for each share class in the table on the following page provides information about hypothetical account values and hypothetical expenses based on the Fund’s actual expense ratio and an assumed rate of return of 5% per year before expenses, which is not the Fund’s actual return. The hypothetical account values and expenses may not be used to estimate the actual ending account balance or expenses you paid for the period. You may use this information to compare the ongoing costs of investing in the Fund and other funds. To do so, compare this 5% hypothetical example with the 5% hypothetical examples that appear in the shareholder reports of the other funds.
The Fund’s transfer agent may charge additional fees to holders of certain accounts that are not included in the expenses shown in the table on the following page. These fees apply to individual retirement accounts (IRAs) and Section 403(b) accounts. As of the close of the six-month period covered by the table, IRA fees included an annual maintenance fee of $15 per account (subject to a maximum annual maintenance fee of $25 for all accounts held by the same shareholder). Section 403(b) accounts are charged an annual $25 fiduciary maintenance fee. Some of the fees may vary in amount, or may be waived, based on your total account balance or the number of Prudential Investments funds, including the Fund, that you own. You should consider the additional fees that were charged to your
| | |
| 12 | | Visit our website at prudentialfunds.com |
Fund account over the six-month period when you estimate the total ongoing expenses paid over the period and the impact of these fees on your ending account value, as these additional expenses are not reflected in the information provided in the expense table. Additional fees have the effect of reducing investment returns.
Please note that the expenses shown in the table are meant to highlight your ongoing costs only and do not reflect any transactional costs such as sales charges (loads). Therefore, the second line for each share class in the table is useful in comparing ongoing costs only and will not help you determine the relative total costs of owning different funds. In addition, if these transactional costs were included, your costs would have been higher.
| | | | | | | | | | | | | | | | | | |
Prudential
Jennison Global
Infrastructure Fund | | Beginning Account
Value
May 1, 2016 | | | Ending Account
Value
October 31, 2016 | | | Annualized
Expense Ratio
Based on the
Six-Month Period | | | Expenses Paid
During the
Six-Month Period* | |
| Class A | | Actual | | $ | 1,000.00 | | | $ | 1,018.10 | | | | 1.50 | % | | $ | 7.61 | |
| | Hypothetical | | $ | 1,000.00 | | | $ | 1,017.60 | | | | 1.50 | % | | $ | 7.61 | |
| Class C | | Actual | | $ | 1,000.00 | | | $ | 1,014.30 | | | | 2.25 | % | | $ | 11.39 | |
| | Hypothetical | | $ | 1,000.00 | | | $ | 1,013.83 | | | | 2.25 | % | | $ | 11.39 | |
| Class Z | | Actual | | $ | 1,000.00 | | | $ | 1,020.00 | | | | 1.25 | % | | $ | 6.35 | |
| | | Hypothetical | | $ | 1,000.00 | | | $ | 1,018.85 | | | | 1.25 | % | | $ | 6.34 | |
*Fund expenses (net of fee waivers or subsidies, if any) for each share class are equal to the annualized expense ratio for each share class (provided in the table), multiplied by the average account value over the period, multiplied by the 184 days in the six-month period ended October 31, 2016, and divided by the 366 days in the Fund’s fiscal year ended October 31, 2016 (to reflect the six-month period). Expenses presented in the table include the expenses of any underlying portfolios in which the Fund may invest.
The Fund’s annual expense ratios for the 12-month period ended October 31, 2016, are as follows:
| | | | |
| Class | | Gross Operating Expenses (%) | | Net Operating Expenses (%) |
| A | | 1.79 | | 1.50 |
| C | | 2.49 | | 2.25 |
| Z | | 1.49 | | 1.25 |
Net operating expenses shown above reflect any fee waivers and/or expense reimbursements. Additional information on Fund expenses and any fee waivers and/or expense reimbursements can be found in the “Financial Highlights” tables in this report and in the Notes to the Financial Statements in this report.
| | | | |
| Prudential Jennison Global Infrastructure Fund | | | 13 | |
Portfolio of Investments
as of October 31, 2016
| | | | | | | | |
| Description | | Shares | | | Value (Note 1) | |
LONG-TERM INVESTMENTS 97.6% | | | | | | | | |
| | |
COMMON STOCKS 97.6% | | | | | | | | |
| | |
Australia 5.6% | | | | | | | | |
Sydney Airport | | | 238,745 | | | $ | 1,134,943 | |
Transurban Group | | | 265,714 | | | | 2,096,621 | |
Transurban Group, 144A(a) | | | 7,822 | | | | 61,720 | |
| | | | | | | | |
| | | | | | | 3,293,284 | |
| | |
Brazil 4.3% | | | | | | | | |
CCR SA | | | 136,014 | | | | 740,578 | |
Ecorodovias Infraestrutura e Logistica SA* | | | 231,694 | | | | 684,484 | |
Transmissora Alianca De Energia Eletrica SA | | | 175,375 | | | | 1,131,806 | |
| | | | | | | | |
| | | | | | | 2,556,868 | |
| | |
Canada 8.0% | | | | | | | | |
Enbridge, Inc. (NYSE) | | | 19,360 | | | | 835,771 | |
Enbridge, Inc. (TSX) | | | 20,775 | | | | 897,106 | |
Fortis, Inc. | | | 17,647 | | | | 580,866 | |
Pembina Pipeline Corp. | | | 19,448 | | | | 598,220 | |
Transcanada Corp. (NYSE) | | | 14,798 | | | | 670,053 | |
Transcanada Corp. (TSX) | | | 24,903 | | | | 1,127,347 | |
| | | | | | | | |
| | | | | | | 4,709,363 | |
| | |
China 2.5% | | | | | | | | |
China Longyuan Power Group Corp. Ltd. (Class H Stock) | | | 542,063 | | | | 413,295 | |
Guangdong Investment Ltd. | | | 345,194 | | | | 520,460 | |
Huaneng Renewables Corp. Ltd. (Class H Stock) | | | 1,586,691 | | | | 531,671 | |
| | | | | | | | |
| | | | | | | 1,465,426 | |
| | |
Denmark 1.1% | | | | | | | | |
DONG Energy A/S* | | | 12,850 | | | | 509,184 | |
DONG Energy A/S, 144A*(a) | | | 2,955 | | | | 117,092 | |
| | | | | | | | |
| | | | | | | 626,276 | |
| | |
France 6.7% | | | | | | | | |
Eiffage SA | | | 24,846 | | | | 1,839,472 | |
Groupe Eurotunnel SE | | | 25,857 | | | | 242,006 | |
Veolia Environnement SA, 144A(a) | | | 4,913 | | | | 107,337 | |
Veolia Environnement SA | | | 19,011 | | | | 415,342 | |
Vinci SA | | | 18,393 | | | | 1,332,018 | |
| | | | | | | | |
| | | | | | | 3,936,175 | |
See Notes to Financial Statements.
| | | | |
| Prudential Jennison Global Infrastructure Fund | | | 15 | |
Portfolio of Investments (continued)
as of October 31, 2016
| | | | | | | | |
| Description | | Shares | | | Value (Note 1) | |
COMMON STOCKS (Continued) | | | | | | | | |
| | |
Germany 2.0% | | | | | | | | |
Innogy SE, 144A*(a) | | | 16,878 | | | $ | 670,247 | |
Innogy SE* | | | 13,330 | | | | 529,352 | |
| | | | | | | | |
| | | | | | | 1,199,599 | |
| | |
Hong Kong 0.5% | | | | | | | | |
HKBN Ltd. | | | 257,951 | | | | 304,170 | |
| | |
India 1.0% | | | | | | | | |
Power Grid Corp. of India Ltd. | | | 225,801 | | | | 592,186 | |
| | |
Italy 8.0% | | | | | | | | |
Atlantia SpA | | | 77,784 | | | | 1,904,470 | |
Enav SpA, 144A*(a) | | | 217,265 | | | | 809,258 | |
Enel SpA | | | 159,822 | | | | 687,132 | |
Infrastrutture Wireless Italiane SpA | | | 109,028 | | | | 515,431 | |
Infrastrutture Wireless Italiane SpA, 144A(a) | | | 54,971 | | | | 259,876 | |
Snam SpA | | | 107,606 | | | | 566,959 | |
| | | | | | | | |
| | | | | | | 4,743,126 | |
| | |
Japan 0.4% | | | | | | | | |
Kyushu Railway Co., 144A*(a) | | | 7,260 | | | | 213,916 | |
| | |
Mexico 5.0% | | | | | | | | |
Grupo Aeroportuario del Pacifico SAB de CV (Class B Stock) | | | 114,286 | | | | 1,104,101 | |
Infraestructura Energetica Nova SAB de CV, 144A(a) | | | 17,329 | | | | 76,555 | |
Infraestructura Energetica Nova SAB de CV | | | 216,957 | | | | 958,463 | |
Promotora y Operadora de Infraestructura SAB de CV | | | 72,534 | | | | 809,153 | |
| | | | | | | | |
| | | | | | | 2,948,272 | |
| | |
Philippines 0.5% | | | | | | | | |
International Container Terminal Services, Inc. | | | 179,867 | | | | 288,766 | |
| | |
Spain 5.1% | | | | | | | | |
Aena SA, 144A | | | 5,016 | | | | 735,026 | |
Atlantica Yield PLC | | | 30,780 | | | | 553,425 | |
Cellnex Telecom SA, 144A | | | 37,406 | | | | 613,424 | |
Ferrovial SA | | | 56,516 | | | | 1,097,989 | |
| | | | | | | | |
| | | | | | | 2,999,864 | |
| | |
Switzerland 2.5% | | | | | | | | |
Flughafen Zuerich AG | | | 7,922 | | | | 1,456,254 | |
See Notes to Financial Statements.
| | | | | | | | |
| Description | | Shares | | | Value (Note 1) | |
COMMON STOCKS (Continued) | | | | | | | | |
| | |
United States 44.4% | | | | | | | | |
American Electric Power Co., Inc. | | | 18,835 | | | $ | 1,221,261 | |
American Tower Corp., REIT | | | 10,338 | | | | 1,211,510 | |
American Water Works Co., Inc. | | | 11,163 | | | | 826,509 | |
Atmos Energy Corp. | | | 15,916 | | | | 1,183,991 | |
Cheniere Energy Partners LP Holdings LLC | | | 37,589 | | | | 749,525 | |
Cheniere Energy, Inc.* | | | 14,684 | | | | 553,587 | |
Crown Castle International Corp., REIT | | | 11,440 | | | | 1,040,926 | |
Edison International | | | 20,861 | | | | 1,532,866 | |
Energy Transfer Partners LP, MLP | | | 32,119 | | | | 1,123,523 | |
Exelon Corp. | | | 24,536 | | | | 835,942 | |
FedEx Corp. | | | 5,270 | | | | 918,666 | |
Genesee & Wyoming, Inc. (Class A Stock)* | | | 4,466 | | | | 303,420 | |
Kinder Morgan, Inc. | | | 41,063 | | | | 838,917 | |
NextEra Energy, Inc. | | | 19,123 | | | | 2,447,744 | |
Noble Midstream Partners LP* | | | 18,601 | | | | 558,030 | |
Norfolk Southern Corp. | | | 10,705 | | | | 995,565 | |
ONEOK Partners LP, MLP | | | 20,366 | | | | 809,345 | |
PG&E Corp. | | | 38,193 | | | | 2,372,549 | |
Plains All American Pipeline LP, MLP | | | 40,601 | | | | 1,232,646 | |
SemGroup Corp. (Class A Stock) | | | 20,232 | | | | 652,482 | |
Sempra Energy | | | 15,164 | | | | 1,624,064 | |
Targa Resources Corp. | | | 16,538 | | | | 726,018 | |
Union Pacific Corp. | | | 11,009 | | | | 970,774 | |
Williams Cos., Inc. (The) | | | 47,120 | | | | 1,375,904 | |
| | | | | | | | |
| | | | | | | 26,105,764 | |
| | | | | | | | |
TOTAL COMMON STOCKS
(cost $52,453,819) | | | | | | | 57,439,309 | |
| | | | | | | | |
| | |
| | | Units | | | | |
| | |
RIGHTS* | | | | | | | | |
| | |
Spain | | | | | | | | |
Ferrovial SA (Spain), expiring 11/14/16
(cost $25,277) | | | 56,516 | | | | 24,196 | |
| | | | | | | | |
TOTAL LONG-TERM INVESTMENTS
(cost $52,479,096) | | | | | | | 57,463,505 | |
| | | | | | | | |
See Notes to Financial Statements.
| | | | |
| Prudential Jennison Global Infrastructure Fund | | | 17 | |
Portfolio of Investments (continued)
as of October 31, 2016
| | | | | | | | |
| Description | | Shares | | | Value (Note 1) | |
SHORT-TERM INVESTMENTS 2.6% | | | | | | | | |
| | |
AFFILIATED MUTUAL FUNDS | | | | | | | | |
Prudential Investment Portfolios 2 - Prudential Core
Ultra Short Bond Fund(b) | | | 1,501,742 | | | $ | 1,501,742 | |
Prudential Investment Portfolios 2 - Prudential Institutional
Money Market Fund
(cost $219)(b) | | | 219 | | | | 219 | |
| | | | | | | | |
TOTAL SHORT-TERM INVESTMENTS
(cost $1,501,961)(Note 3) | | | | | | | 1,501,961 | |
| | | | | | | | |
TOTAL INVESTMENTS 100.2%
(cost $53,981,057) (Note 5) | | | | | | | 58,965,466 | |
Liabilities in excess of other assets (0.2)% | | | | | | | (139,086 | ) |
| | | | | | | | |
NET ASSETS 100.0% | | | | | | $ | 58,826,380 | |
| | | | | | | | |
The following abbreviations are used in the annual report:
144A—Security was purchased pursuant to Rule 144A under the Securities Act of 1933 and may not be resold subject to that rule except to qualified institutional buyers. Unless otherwise noted, 144A securities are deemed to be liquid.
LIBOR—London Interbank Offered Rate
MLP—Master Limited Partnership
NYSE—New York Stock Exchange
OTC—Over-the-counter
REIT—Real Estate Investment Trust
TSX—Toronto Stock Exchange
| * | Non-income producing security. |
| (a) | Indicates a security or securities that have been deemed illiquid. (unaudited) |
| (b) | Prudential Investments LLC, the manager of the Series, also serves as manager of the Prudential Investment Portfolios 2—Prudential Core Ultra Short Bond Fund and the Prudential Investment Portfolios 2—Prudential Institutional Money Market Fund. |
Various inputs are used in determining the value of the Series’ investments. These inputs are summarized in the three broad levels listed below.
Level 1—quoted prices generally in active markets for identical securities.
Level 2—quoted prices for similar securities, interest rates and yield curves, prepayment speeds, foreign currency exchange rates and other observable inputs.
Level 3—unobservable inputs for securities valued in accordance with Board approved fair valuation procedures.
See Notes to Financial Statements.
The following is a summary of the inputs used as of October 31, 2016 in valuing such portfolio securities:
| | | | | | | | | | | | |
| | | Level 1 | | | Level 2 | | | Level 3 | |
Investments in Securities | | | | | | | | | | | | |
Common Stocks | | | | | | | | | | | | |
Australia | | $ | — | | | $ | 3,293,284 | | | $ | — | |
Brazil | | | 2,556,868 | | | | — | | | | — | |
Canada | | | 4,709,363 | | | | — | | | | — | |
China | | | — | | | | 1,465,426 | | | | — | |
Denmark | | | — | | | | 626,276 | | | | — | |
France | | | — | | | | 3,936,175 | | | | — | |
Germany | | | 529,352 | | | | 670,247 | | | | — | |
Hong Kong | | | — | | | | 304,170 | | | | — | |
India | | | — | | | | 592,186 | | | | — | |
Italy | | | — | | | | 4,743,126 | | | | — | |
Japan | | | 213,916 | | | | — | | | | — | |
Mexico | | | 2,871,717 | | | | 76,555 | | | | — | |
Philippines | | | — | | | | 288,766 | | | | — | |
Spain | | | 553,425 | | | | 2,446,439 | | | | — | |
Switzerland | | | — | | | | 1,456,254 | | | | — | |
United States | | | 26,105,764 | | | | — | | | | — | |
Rights | | | | | | | | | | | | |
Spain | | | 24,196 | | | | — | | | | — | |
Affiliated Mutual Funds | | | 1,501,961 | | | | — | | | | — | |
| | | | | | | | | | | | |
Total | | $ | 39,066,562 | | | $ | 19,898,904 | | | $ | — | |
| | | | | | | | | | | | |
During the period, there were no transfers between Level 1 and Level 2 to report.
The industry classification of investments and liabilities in excess of other assets shown as a percentage of net assets as of October 31, 2016 were as follows (Unaudited):
| | | | |
Oil, Gas & Consumable Fuels | | | 21.5 | % |
Transportation Infrastructure | | | 20.6 | |
Electric Utilities | | | 20.5 | |
Construction & Engineering | | | 7.3 | |
Multi-Utilities | | | 5.7 | |
Gas Utilities | | | 4.6 | |
Road & Rail | | | 4.3 | |
Equity Real Estate Investment Trusts (REITs) | | | 3.9 | |
Diversified Telecommunication Services | | | 2.8 | |
Affiliated Mutual Funds | | | 2.6 | % |
Independent Power & Renewable
Electricity Producers | | | 2.5 | |
Water Utilities | | | 2.3 | |
Air Freight & Logistics | | | 1.6 | |
| | | | |
| | | 100.2 | |
Liabilities in excess of other assets | | | (0.2 | ) |
| | | | |
| | | 100.0 | % |
| | | | |
See Notes to Financial Statements.
| | | | |
| Prudential Jennison Global Infrastructure Fund | | | 19 | |
Portfolio of Investments (continued)
as of October 31, 2016
The Series invested in derivative instruments during the reporting period. The primary type of risk associated with these derivative instruments is equity risk. The effect of such derivative instruments on the Series’ financial position and financial performance as reflected in the Statement of Assets and Liabilities and Statement of Operations is presented in the summary below.
Fair values of derivative instruments as of October 31, 2016 as presented in the Statement of Assets and Liabilities:
| | | | | | | | | | | | |
Derivatives not accounted
for as hedging instruments,
carried at fair value | | Asset Derivatives | | | Liability Derivatives | |
| | Balance
Sheet
Location | | Fair
Value | | | Balance
Sheet
Location | | Fair
Value | |
| Equity contracts | | Unaffiliated investments | | $ | 24,196 | | | — | | $ | — | |
| | | | | | | | | | | | |
The effects of derivative instruments on the Statement of Operations for the year ended October 31, 2016 are as follows:
For the year ended October 31, 2016, the Series did not have any realized gain (loss) on derivatives recognized in income.
| | | | |
Change in Unrealized Appreciation (Depreciation) on Derivatives Recognized in Income | |
Derivatives not accounted for as hedging
instruments, carried at fair value | | Rights(1) | |
Equity contracts | | $ | (1,081 | ) |
| | | | |
| (1) | Included in net change in unrealized appreciation (depreciation) on investments in the Statement of Operations. |
See Notes to Financial Statements.
This Page Intentionally Left Blank
Statement of Assets & Liabilities
as of October 31, 2016
| | | | |
Assets | | | | |
Investments at value: | | | | |
Unaffiliated investments (cost $52,479,096) | | $ | 57,463,505 | |
Affiliated investments (cost $1,501,961) | | | 1,501,961 | |
Cash | | | 5,299 | |
Receivable for investments sold | | | 1,115,199 | |
Dividends and interest receivable | | | 76,928 | |
Receivable for Series shares sold | | | 67,242 | |
Tax reclaim receivable | | | 29,152 | |
Prepaid expenses | | | 1,010 | |
| | | | |
Total assets | | | 60,260,296 | |
| | | | |
| |
Liabilities | | | | |
Payable for investments purchased | | | 1,244,063 | |
Payable for Series shares reacquired | | | 78,565 | |
Accrued expenses | | | 61,133 | |
Management fee payable | | | 40,348 | |
Distribution fee payable | | | 7,632 | |
Affiliated transfer agent fee payable | | | 2,175 | |
| | | | |
Total liabilities | | | 1,433,916 | |
| | | | |
| |
Net Assets | | $ | 58,826,380 | |
| | | | |
| | | | | |
Net assets were comprised of: | | | | |
Common stock, at par | | $ | 50,696 | |
Paid-in capital in excess of par | | | 62,343,108 | |
| | | | |
| | | 62,393,804 | |
Accumulated net realized loss on investment and foreign currency transactions | | | (8,553,812 | ) |
Net unrealized appreciation on investments and foreign currencies | | | 4,986,388 | |
| | | | |
Net assets, October 31, 2016 | | $ | 58,826,380 | |
| | | | |
See Notes to Financial Statements.
| | | | |
Class A | | | | |
Net asset value and redemption price per share, | | | | |
($12,276,662 ÷ 1,057,547 shares of common stock issued and outstanding) | | $ | 11.61 | |
Maximum sales charge (5.50% of offering price) | | | 0.68 | |
| | | | |
Maximum offering price to public | | $ | 12.29 | |
| | | | |
| |
Class C | | | | |
Net asset value, offering price and redemption price per share, | | | | |
($5,738,349 ÷ 496,711 shares of common stock issued and outstanding) | | $ | 11.55 | |
| | | | |
| |
Class Z | | | | |
Net asset value, offering price and redemption price per share, | | | | |
($40,811,369 ÷ 3,515,313 shares of common stock issued and outstanding) | | $ | 11.61 | |
| | | | |
See Notes to Financial Statements.
| | | | |
| Prudential Jennison Global Infrastructure Fund | | | 23 | |
Statement of Operations
Year Ended October 31, 2016
| | | | |
Net Investment Income (Loss) | | | | |
Income | | | | |
Unaffiliated dividend income (net of foreign withholding taxes of $94,350) | | $ | 1,378,653 | |
Affiliated dividend income | | | 6,662 | |
Income from securities lending, net (including affiliated of $219) | | | 1,552 | |
Interest income | | | 60 | |
| | | | |
Total income | | | 1,386,927 | |
| | | | |
| |
Expenses | | | | |
Management fee | | | 627,132 | |
Distribution fee—Class A | | | 50,082 | |
Distribution fee—Class C | | | 57,830 | |
Custodian and accounting fees | | | 82,000 | |
Transfer agent’s fees and expenses (including affiliated expense of $13,400) | | | 56,000 | |
Registration fees | | | 55,000 | |
Shareholders’ reports | | | 36,000 | |
Audit fee | | | 25,000 | |
Legal fees and expenses | | | 16,000 | |
Directors’ fees | | | 11,000 | |
Commitment fee on syndicated credit agreement | | | 6,000 | |
Loan interest expense | | | 1,937 | |
Insurance expenses | | | 1,000 | |
Miscellaneous | | | 19,748 | |
| | | | |
Total expenses | | | 1,044,729 | |
Less: Management fee waiver and/or expense reimbursement | | | (150,964 | ) |
Distribution fee waiver—Class A | | | (8,347 | ) |
| | | | |
Net expenses | | | 885,418 | |
| | | | |
Net investment income (loss) | | | 501,509 | |
| | | | |
| |
Realized And Unrealized Gain (Loss) On Investments And Foreign Currency Transactions | | | | |
Net realized gain (loss) on: | | | | |
Investment transactions | | | (3,622,144 | ) |
Foreign currency transactions | | | (5,663 | ) |
| | | | |
| | | (3,627,807 | ) |
| | | | |
Net change in unrealized appreciation (depreciation) on: | | | | |
Investments | | | 3,459,364 | |
Foreign currencies | | | 6,723 | |
| | | | |
| | | 3,466,087 | |
| | | | |
Net gain (loss) on investment and foreign currency transactions | | | (161,720 | ) |
| | | | |
Net Increase (Decrease) In Net Assets Resulting From Operations | | $ | 339,789 | |
| | | | |
See Notes to Financial Statements.
Statement of Changes in Net Assets
| | | | | | | | |
| | | Year Ended October 31, | |
| | | 2016 | | | 2015 | |
Increase (Decrease) in Net Assets | | | | | | | | |
Operations | | | | | | | | |
Net investment income (loss) | | $ | 501,509 | | | $ | 420,933 | |
Net realized gain (loss) on investment and foreign currency transactions | | | (3,627,807 | ) | | | (4,609,595 | ) |
Net change in unrealized appreciation (depreciation) on investments and
foreign currencies | | | 3,466,087 | | | | (2,374,141 | ) |
| | | | | | | | |
Net increase (decrease) in net assets resulting from operations | | | 339,789 | | | | (6,562,803 | ) |
| | | | | | | | |
| | |
Dividends and Distributions (Note 1) | | | | | | | | |
Dividends from net investment income | | | | | | | | |
Class A | | | (115,375 | ) | | | (99,616 | ) |
Class C | | | (20,095 | ) | | | (703 | ) |
Class Z | | | (340,326 | ) | | | (285,862 | ) |
| | | | | | | | |
| | | (475,796 | ) | | | (386,181 | ) |
| | | | | | | | |
Tax return of capital distributions | | | | | | | | |
Class A | | | (132,272 | ) | | | (43,879 | ) |
Class C | | | (23,038 | ) | | | (309 | ) |
Class Z | | | (390,170 | ) | | | (125,915 | ) |
| | | | | | | | |
| | | (545,480 | ) | | | (170,103 | ) |
| | | | | | | | |
| | |
Series share transactions (Net of share conversions) (Note 6) | | | | | | | | |
Net proceeds from shares sold | | | 17,321,482 | | | | 56,052,307 | |
Net asset value of shares issued in reinvestment of dividends, distributions and tax return of capital | | | 979,002 | | | | 534,566 | |
Cost of shares reacquired | | | (35,225,219 | ) | | | (24,178,576 | ) |
| | | | | | | | |
Net increase (decrease) in net assets from Series share transactions | | | (16,924,735 | ) | | | 32,408,297 | |
| | | | | | | | |
Total increase (decrease) | | | (17,606,222 | ) | | | 25,289,210 | |
| | |
Net Assets: | | | | | | | | |
Beginning of year | | | 76,432,602 | | | | 51,143,392 | |
| | | | | | | | |
End of year | | $ | 58,826,380 | | | $ | 76,432,602 | |
| | | | | | | | |
See Notes to Financial Statements.
| | | | |
| Prudential Jennison Global Infrastructure Fund | | | 25 | |
Notes to Financial Statements
Prudential World Fund, Inc. (the “Fund”) is an open-end management investment company, registered under the Investment Company Act of 1940, as amended (“1940 Act”) and currently consists of six series: Prudential QMA International Equity Fund, Prudential Jennison Global Infrastructure Fund (the “Series”), Prudential Jennison Emerging Markets Equity Fund, Prudential Jennison Global Opportunities Fund, Prudential Jennison International Opportunities Fund and Prudential Emerging Markets Debt Local Currency Fund. These financial statements relate to the Prudential Jennison Global Infrastructure Fund. The financial statements of the other series are not presented herein.
The investment objective of the Series is to achieve total return.
Note 1. Accounting Policies
The Series follows investment company accounting and reporting guidance of the Financial Accounting Standards Board (“FASB”) Accounting Standard Codification Topic 946 Financial Services—Investment Companies. The following accounting policies conform to U.S. generally accepted accounting principles. The Series consistently follows such policies in the preparation of its financial statements.
Securities Valuation: The Series holds securities and other assets that are fair valued at the close of each day (generally, 4:00 PM Eastern time) the New York Stock Exchange (“NYSE”) is open for trading. Fair value is the price that would be received to sell an asset or paid to transfer a liability in an orderly transaction between market participants on the measurement date. The Board of Directors (the “Board”) has adopted Valuation Procedures for security valuation under which fair valuation responsibilities have been delegated to Prudential Investments LLC (“PI”). Under the current Valuation Procedures, the established Valuation Committee is responsible for supervising the valuation of portfolio securities and other assets. The Valuation Procedures permit the Series to utilize independent pricing vendor services, quotations from market makers, and alternative valuation methods when market quotations are either not readily available or not deemed representative of fair value. A record of the Valuation Committee’s actions is subject to the Board’s review, approval, and ratification at its next regularly scheduled quarterly meeting.
Various inputs determine how the Series’ investments are valued, all of which are categorized according to the three broad levels (Level 1, 2, or 3) detailed in the table following the Portfolio of Investments.
Common and preferred stocks, exchange-traded funds, and derivative instruments such as futures or options that are traded on a national securities exchange are valued at the last sale price as of the close of trading on the applicable exchange where the security principally trades. Securities traded via NASDAQ are valued at the NASDAQ official closing
price. To the extent these securities are valued at the last sale price or NASDAQ official closing price, they are classified as Level 1 in the fair value hierarchy.
In the event that no sale or official closing price on valuation date exists, these securities are generally valued at the mean between the last reported bid and ask prices, or at the last bid price in the absence of an ask price. These securities are classified as Level 2 in the fair value hierarchy.
Common and preferred stocks traded on foreign securities exchanges are valued using pricing vendor services that provide model prices derived using adjustment factors based on information such as local closing price, relevant general and sector indices, currency fluctuations, depositary receipts, and futures, as applicable. Securities valued using such model prices are classified as Level 2 in the fair value hierarchy. The models generate an evaluated adjustment factor for each security, which is applied to the local closing price to adjust it for post closing market movements. Utilizing that evaluated adjustment factor, the vendor provides an evaluated price for each security. If the vendor does not provide a model price, securities are valued in accordance with exchange-traded common and preferred stocks discussed above.
Participatory notes (“P-notes”) are generally valued based upon the value of a related underlying security that trades actively in the market and are classified as Level 2 in the fair value hierarchy.
Investments in open-end, non-exchange-traded mutual funds are generally valued at their net asset values as of the close of the NYSE on the date of valuation. These securities are classified as Level 1 in the fair value hierarchy since they may be purchased or sold at their net asset values on the date of valuation.
Securities and other assets that cannot be priced according to the methods described above are valued based on pricing methodologies approved by the Board. In the event that unobservable inputs are used when determining such valuations, the securities will be classified as Level 3 in the fair value hierarchy.
When determining the fair value of securities, some of the factors influencing the valuation include: the nature of any restrictions on disposition of the securities; assessment of the general liquidity of the securities; the issuer’s financial condition and the markets in which it does business; the cost of the investment; the size of the holding and the capitalization of the issuer; the prices of any recent transactions or bids/offers for such securities or any comparable securities; any available analyst media or other reports or information deemed reliable by the investment adviser regarding the issuer or the markets or industry in which it operates. Using fair value to price securities may result in a value that is different from a security’s most recent closing price and from the price used by other mutual funds to calculate their net asset values.
| | | | |
| Prudential Jennison Global Infrastructure Fund | | | 27 | |
Notes to Financial Statements (continued)
Restricted and Illiquid Securities: Subject to guidelines adopted by the Board, the Series may invest up to 15% of its net assets in illiquid securities, including those which are restricted as to disposition under securities law (“restricted securities”). Restricted securities are valued pursuant to the valuation procedures noted above. Illiquid securities are those that, because of the absence of a readily available market or due to legal or contractual restrictions on resale, cannot be sold within seven days in the ordinary course of business at approximately the amount at which the Series has valued the investment. Therefore, the Series may find it difficult to sell illiquid securities at the time considered most advantageous by its Subadviser and may incur expenses that would not be incurred in the sale of securities that were freely marketable. Certain securities that would otherwise be considered illiquid because of legal restrictions on resale to the general public may be traded among qualified institutional buyers under Rule 144A of the Securities Act of 1933. These Rule 144A securities, as well as commercial paper that is sold in private placements under Section 4(2) of the Securities Act, may be deemed liquid by the Series’ Subadviser under the guidelines adopted by the Directors of the Series. However, the liquidity of the Series’ investments in Rule 144A securities could be impaired if trading does not develop or declines.
Foreign Currency Translation: The books and records of the Series are maintained in U.S. dollars. Foreign currency amounts are translated into U.S. dollars on the following basis:
(i) market value of investment securities, other assets and liabilities at the current rates of exchange;
(ii) purchases and sales of investment securities, income and expenses at the rates of exchange prevailing on the respective dates of such transactions.
Although the net assets of the Series are presented at the foreign exchange rates and market values at the close of the period, the Series does not generally isolate that portion of the results of operations arising as a result of changes in the foreign exchange rates from the fluctuations arising from changes in the market prices of long-term portfolio securities held at the end of the period. Similarly, the Series does not isolate the effect of changes in foreign exchange rates from the fluctuations arising from changes in the market prices of long-term portfolio securities sold during the period. Accordingly, holding period realized foreign currency gains (losses) are included in the reported net realized gains (losses) on investment transactions. Notwithstanding the above, the Fund does isolate the effect of fluctuations in foreign currency exchange rates when determining the gain (loss) upon the sale or maturity of foreign currency denominated debt obligations; such amounts are included in net realized gains (losses) on foreign currency transactions.
Net realized gains (losses) on foreign currency transactions represent net foreign exchange gains or losses from holdings of foreign currencies, forward currency contracts, disposition
of foreign currencies, currency gains or losses realized between the trade date and settlement date on securities transactions, and the difference between the amounts of dividends, interest and foreign withholding taxes recorded on the Series’ books and the U.S. dollar equivalent amounts actually received or paid. Net unrealized currency gains (losses) from valuing foreign currency denominated assets and liabilities (other than investments) at period end exchange rates are reflected as a component of net unrealized appreciation (depreciation) on foreign currency transactions.
Warrants and Rights: The Series may hold warrants and rights acquired either through a direct purchase, included as part of a private placement, or pursuant to corporate actions. Warrants and rights entitle the holder to buy a proportionate amount of common stock, or such other security that the issuer may specify, at a specific price and time through the expiration dates. Such warrants and rights are held as long positions until exercised, sold or expired. Warrants and rights are valued at fair value in accordance with the Board of Directors’ approved fair valuation procedures.
MLPs: The Series invests in MLPs. Distributions received from the Series’ investments in MLPs generally are comprised of income and return of capital. The Series records investment income and return of capital based on estimates made at the time such distributions are received. Such estimates are based on historical information available from each MLP and other industry sources. These estimates may subsequently be revised based on information received from MLPs after their respective tax reporting periods have concluded.
REITs: The Series invests in REITs, which report information on the source of their distributions annually. Based on current and historical information, a portion of distributions received from REITs during the year is estimated to be dividend income, capital gain or return of capital and is recorded accordingly. These estimates are adjusted periodically when the actual source of distributions is disclosed by the REITs.
Master Netting Arrangements: The Series is subject to various Master Agreements, or netting arrangements, with select counterparties. These are agreements which a subadviser may have negotiated and entered into on behalf of the Series. A master netting arrangement between the Series and the counterparty permits the Series to offset amounts payable by the Series to the same counterparty against amounts to be received; and by the receipt of collateral from the counterparty by the Series to cover the Series’ exposure to the counterparty. However, there is no assurance that such mitigating factors are easily enforceable. In addition to master netting arrangements, the right to set-off exists when all the conditions are met such that each of the parties owes the other determinable amounts, the reporting party has the right to set-off the amount owed with the amount owed by the other party, the reporting party intends to set-off, and the right of set-off is enforceable by law. During the reporting period, there was no intention to settle on a net basis and all amounts are presented on a gross basis on the Statement of Assets and Liabilities.
Securities Lending: The Series may lend its portfolio securities to banks and broker-dealers. The loans are secured by collateral at least equal to the market value of the securities loaned. Collateral pledged by each borrower is invested in a money market fund and is
| | | | |
| Prudential Jennison Global Infrastructure Fund | | | 29 | |
Notes to Financial Statements (continued)
marked to market daily, based on the previous day’s market value, such that the value of the collateral exceeds the value of the loaned securities. For the period March 31, 2016 through July 18, 2016 the collateral was invested in an ultra-short bond fund. Loans are subject to termination at the option of the borrower or the Series. Upon termination of the loan, the borrower will return to the Series securities identical to the loaned securities. Should the borrower of the securities fail financially, the Series has the right to repurchase the securities in the open market using the collateral. The Series recognizes income, net of any rebate and securities lending agent fees, for lending its securities in the form of fees or interest on the investment of any cash received as collateral. The borrower receives all interest and dividends from the securities loaned and such payments are passed back to the lender in amounts equivalent thereto. The Series also continues to recognize any unrealized gain (loss) in the market price of the securities loaned and on the change in the value of the collateral invested that may occur during the term of the loan. In addition, realized gain (loss) is recognized on changes in the value of the collateral invested that may occur during the term of the loan.
Concentration of Risk: Foreign security and currency transactions may involve certain considerations and risks not typically associated with those of domestic origin as a result of, among other factors, the possibility of political and economic instability or the level of governmental supervision and regulation of foreign securities markets.
Securities Transactions and Net Investment Income: Securities transactions are recorded on the trade date. Realized gains (losses) from investment and currency transactions are calculated on the identified cost basis. Dividend income is recorded on the ex-date. Interest income, including amortization of premium and accretion of discount on debt securities, as required, is recorded on an accrual basis. Expenses are recorded on the accrual basis, which may require the use of certain estimates by management that may differ from actual.
Net investment income or loss (other than distribution fees which are charged directly to the respective class) and unrealized and realized gains or losses are allocated daily to each class of shares based upon the relative proportion of adjusted net assets of each class at the beginning of the day.
Dividends and Distributions: The Series expects to pay dividends from net investment income quarterly and distributions from net realized capital gains, if any, annually. Dividends and distributions to shareholders, which are determined in accordance with federal income tax regulations and which may differ from generally accepted accounting principles, are recorded on the ex-date. Permanent book/tax differences relating to income and gains are reclassified amongst undistributed net investment income, accumulated net realized gain (loss) and paid in capital in excess of par, as appropriate.
Taxes: For federal income tax purposes, each Series in the Fund is treated as a separate taxpaying entity. It is each Series’ policy to continue to meet the requirements of the
Internal Revenue Code applicable to regulated investment companies and to distribute all of its taxable net investment income and capital gains, if any, to its shareholders. Therefore, no federal income tax provision is required. Withholding taxes on foreign dividends are recorded, net of reclaimable amounts, at the time the related income is earned.
Estimates: The preparation of the financial statements requires management to make estimates and assumptions that affect the reported amounts and disclosures in the financial statements. Actual results could differ from those estimates.
Note 2. Agreements
The Fund has a management agreement for the Series with PI. Pursuant to this agreement, PI has responsibility for all investment advisory services and supervises the subadvisor’s performance of such services. PI has entered into a subadvisory agreement with Jennison Associates LLC (“Jennison”). The subadvisory agreement provides that Jennison furnishes investment advisory services in connection with the management of the Series. In connection therewith, Jennison is obligated to keep certain books and records of the Series. PI pays for the services of Jennison, the cost of compensation of officers of the Series, occupancy and certain clerical and bookkeeping costs of the Series. The Series bears all other costs and expenses.
The management fee paid to PI is accrued daily and payable monthly, at an annual rate of 1.00% of the average daily net assets of the Series. The effective management fee rate, net of waivers and/or expense reimbursement, was .76%.
PI has contractually agreed through February 28, 2018 to limit the net annual operating expenses (exclusive of distribution and service (12b-1) fees, taxes (such as income and foreign withholdings taxes, stamp duty and deferred tax expenses), interest, underlying funds, brokerage, extraordinary and certain other expenses such as dividend, broker charges and interest expense on short sales) of each class of shares of the Series to 1.25% of the Series’ average daily net assets. Expenses waived/reimbursed by the Manager in accordance with this agreement may be recouped by the Manager within the same fiscal year during which such waiver/reimbursement is made if such recoupment can be realized without exceeding the expense limit in effect at the time of the recoupment for that fiscal year.
The Series has a distribution agreement with Prudential Investment Management Services LLC (“PIMS”) which acts as the distributor of the Class A, C, and Z shares of the Series. The Series compensates PIMS for distributing and servicing the Fund’s Class A and C shares, pursuant to plans of distribution (the “Distribution Plans”) regardless of expenses actually incurred by PIMS. The distribution fees are accrued daily and payable monthly. No distribution or service fees are paid to PIMS as distributor for Class Z shares of the Series.
Pursuant to the Distribution Plans, the Series compensates PIMS for distribution related activities at an annual rate of up to .30% and 1% of the average daily net assets of the Class A and C shares, respectively. PIMS has contractually agreed through February 28, 2018 to limit such fees to .25% of the average daily net assets of the Class A shares.
PIMS has advised the Series that it has received $17,458 in front-end sales charges resulting from sales of Class A shares during the year ended October 31, 2016. From these
| | | | |
| Prudential Jennison Global Infrastructure Fund | | | 31 | |
Notes to Financial Statements (continued)
fees, PIMS paid such sales charges to affiliated broker-dealers, which in turn paid commissions to salespersons and incurred other distribution costs.
PIMS has advised the Series that for the year ended October 31, 2016, it has received $298 in contingent deferred sales charges imposed upon redemptions by certain Class C shareholders.
PI, Jennison and PIMS are indirect, wholly-owned subsidiaries of Prudential Financial, Inc. (“Prudential”).
Note 3. Other Transactions with Affiliates
Prudential Mutual Fund Services LLC (“PMFS”), an affiliate of PI and an indirect, wholly-owned subsidiary of Prudential, serves as the Series’ transfer agent. Transfer agent’s fees and expenses in the Statement of Operations include certain out-of-pocket expenses paid to non-affiliates, where applicable.
Effective July 7, 2016, the Board replaced PGIM, Inc., an indirect wholly-owned subsidiary of Prudential, as securities lending agent with a third party agent. Prior to July 7, 2016, PGIM, Inc. was the Series’ securities lending agent. Net earnings from securities lending are disclosed on the Statement of Operations as “Income from securities lending, net”. Prior to January 4, 2016, PGIM, Inc. was known as Prudential Investment Management, Inc. (“PIM”).
The Series may enter into certain securities purchase or sale transactions under Board approved Rule 17a-7 procedures. Rule 17a-7 is an exemptive rule under the 1940 Act, that permits purchase and sale transactions among affiliated investment companies, or between an investment company and a person that is affiliated solely by reason of having a common (or affiliated) investment adviser, common directors, and/or common officers. Such transactions are subject to ratification by the Board.
The Series invests its overnight sweep cash in the Prudential Core Ultra Short Bond Fund, (formerly known as Prudential Core Taxable Money Market Fund), (the “Core Fund”), and its securities lending cash collateral in the Prudential Institutional Money Market Fund, (the “Money Market Fund”), each a portfolio of Prudential Investment Portfolios 2, registered under the 1940 Act and managed by PI. Earnings from the Core and the Money Market Funds are disclosed on the Statement of Operations as “Affiliated dividend income” and “Income from securities lending, net”, respectively.
Note 4. Portfolio Securities
The cost of purchases and proceeds from sales of portfolio securities, other than short-term investments, for the year ended October 31, 2016, aggregated $51,118,869 and $67,038,943, respectively.
Note 5. Tax Information
Distributions to shareholders, which are determined in accordance with federal income tax regulations and which may differ from generally accepted accounting principles, are recorded on the ex-date. In order to present undistributed net investment income, accumulated net realized loss on investment and foreign currency transactions and paid-in capital in excess of par on the Statement of Assets and Liabilities that more closely represent their tax character, certain adjustments have been made to undistributed net investment income, accumulated net realized loss on investment and foreign currency transactions and paid-in capital in excess of par. For the year ended October 31, 2016, the adjustments were to decrease undistributed net investment income by $25,713, increase accumulated net realized loss on investment and foreign currency transactions by $144,027 and increase paid-in capital in excess of par by $169,740 due to differences in the treatment for book and tax purposes of certain transactions involving foreign currencies, partnership investments, and other book to tax differences. Net investment income, net realized loss on investment and foreign currencies transactions and net assets were not affected by this change.
For the year ended October 31, 2016, the tax character of dividends paid by the Series was $475,796 of ordinary income and $545,480 of tax return of capital. For the year ended October 31, 2015, the tax character of dividends paid by the Series was $386,181 of ordinary income and $170,103 of tax return of capital.
As of October 31, 2016, the Series had no undistributed earnings on a tax basis.
The United States federal income tax basis of the Series’ investments and the net unrealized appreciation as of October 31, 2016 were as follows:
| | | | | | | | | | |
Tax Basis | | Appreciation | | Depreciation | | Net
Unrealized
Appreciation | | Other Cost Basis
Adjustment | | Total Net
Unrealized
Appreciation |
| $54,744,962 | | $5,959,086 | | $(1,738,582) | | $4,220,504 | | $1,979 | | $4,222,483 |
The difference between book basis and tax basis is primarily attributable to deferred losses on wash sales and investments in partnerships. The other cost basis adjustments are primarily attributable to appreciation (depreciation) of foreign currencies and mark-to-market of receivables and payables.
For federal income tax purposes, the Series had a capital loss carryforward as of October 31, 2016 of approximately $7,790,000 which can be carried forward for an unlimited period. No capital gains distributions are expected to be paid to shareholders until net gains have been realized in excess of such losses.
Management has analyzed the Series’ tax positions taken on federal, state and local income tax returns for all open tax years and has concluded that no provision for income tax is required in the Series’ financial statements for the current reporting period. The Series’ federal, state and local income and federal excise tax returns for tax years for which the applicable statutes of limitations have not expired are subject to examination by the Internal Revenue Service and state departments of revenue.
| | | | |
| Prudential Jennison Global Infrastructure Fund | | | 33 | |
Notes to Financial Statements (continued)
Note 6. Capital
The Series offers Class A, C and Z shares. Class A shares are sold with a front-end sales charge of up to 5.50%. All investors who purchase Class A shares in an amount of $1 million or more and sell these shares within 12 months of purchase are subject to a contingent deferred sales charge (CDSC) of 1%. The Class A CDSC is waived for purchases by certain retirement and/or benefit plans. Class C shares are sold with a CDSC of 1% on shares redeemed within the first 12 months after purchase. A special exchange privilege is also available for shareholders who qualify to purchase Class A shares at net asset value. Class Z shares are not subject to any sales or redemption charge and are offered exclusively for sale to a limited group of investors.
Under certain circumstances, an exchange may be made from specified share classes of the Series to one or more other share classes of the Series as presented in the table of transactions in shares of common stock.
There are 525 million authorized shares of common stock at $.01 par value per share, designated Class A, Class C and Class Z, each of which consists of 200 million, 100 million, and 225 million authorized shares, respectively.
As of October 31, 2016, Prudential, through its affiliates, owned 520,852 Class Z shares of the Series. At reporting period end, 5 shareholders of record held 73% of the Fund’s outstanding shares on behalf of multiple beneficial owners.
Transactions in shares of common stock were as follows:
| | | | | | | | |
Class A | | Shares | | | Amount | |
Year ended October 31, 2016: | | | | | | | | |
Shares sold | | | 168,191 | | | $ | 1,888,675 | |
Shares issued in reinvestment of dividends, distributions and tax return of capital | | | 18,936 | | | | 214,780 | |
Shares reacquired* | | | (843,748 | ) | | | (9,350,430 | ) |
| | | | | | | | |
Net increase (decrease) in shares outstanding before conversion | | | (656,621 | ) | | | (7,246,975 | ) |
Shares issued upon conversion from other share class(es) | | | 2,208 | | | | 26,057 | |
Shares reacquired upon conversion into other share class(es) | | | (235,790 | ) | | | (2,823,216 | ) |
| | | | | | | | |
Net increase (decrease) in shares outstanding | | | (890,203 | ) | | $ | (10,044,134 | ) |
| | | | | | | | |
Year ended October 31, 2015: | | | | | | | | |
Shares sold | | | 1,595,465 | | | $ | 19,553,250 | |
Shares issued in reinvestment of dividends, distributions and tax return of capital | | | 10,216 | | | | 122,173 | |
Shares reacquired | | | (863,175 | ) | | | (10,381,343 | ) |
| | | | | | | | |
Net increase (decrease) in shares outstanding before conversion | | | 742,506 | | | | 9,294,080 | |
Shares reacquired upon conversion into other share class(es) | | | (24,630 | ) | | | (295,257 | ) |
| | | | | | | | |
Net increase (decrease) in shares outstanding | | | 717,876 | | | $ | 8,998,823 | |
| | | | | | | | |
| | | | | | | | |
Class C | | Shares | | | Amount | |
Year ended October 31, 2016: | | | | | | | | |
Shares sold | | | 101,212 | | | $ | 1,168,296 | |
Shares issued in reinvestment of dividends, distributions and tax return of capital | | | 3,649 | | | | 40,323 | |
Shares reacquired* | | | (197,310 | ) | | | (2,185,953 | ) |
| | | | | | | | |
Net increase (decrease) in shares outstanding before conversion | | | (92,449 | ) | | | (977,334 | ) |
Shares reacquired upon conversion into other share class(es) | | | (3,951 | ) | | | (46,048 | ) |
| | | | | | | | |
Net increase (decrease) in shares outstanding | | | (96,400 | ) | | $ | (1,023,382 | ) |
| | | | | | | | |
Year ended October 31, 2015: | | | | | | | | |
Shares sold | | | 425,583 | | | $ | 5,219,036 | |
Shares issued in reinvestment of dividends, distributions and tax return of capital | | | 83 | | | | 957 | |
Shares reacquired | | | (137,452 | ) | | | (1 ,634,771 | ) |
| | | | | | | | |
Net increase (decrease) in shares outstanding | | | 288,214 | | | $ | 3,585,222 | |
| | | | | | | | |
Class Z | | | | | | |
Year ended October 31, 2016: | | | | | | | | |
Shares sold | | | 1,234,281 | | | $ | 14,264,511 | |
Shares issued in reinvestment of dividends, distributions and tax return of capital | | | 63,614 | | | | 723,899 | |
Shares reacquired* | | | (2,142,501 | ) | | | (23,688,836 | ) |
| | | | | | | | |
Net increase (decrease) in shares outstanding before conversion | | | (844,606 | ) | | | (8,700,426 | ) |
Shares issued upon conversion from other share class(es) | | | 238,917 | | | | 2,860,137 | |
Shares reacquired upon conversion into other share class(es) | | | (1,431 | ) | | | (16,930 | ) |
| | | | | | | | |
Net increase (decrease) in shares outstanding | | | (607,120 | ) | | $ | (5,857,219 | ) |
| | | | | | | | |
Year ended October 31, 2015: | | | | | | | | |
Shares sold | | | 2,545,641 | | | $ | 31,280,021 | |
Shares issued in reinvestment of dividends, distributions and tax return of capital | | | 34,390 | | | | 411,436 | |
Shares reacquired | | | (1,000,815 | ) | | | (12,162,462 | ) |
| | | | | | | | |
Net increase (decrease) in shares outstanding before conversion | | | 1,579,216 | | | | 19,528,995 | |
Shares issued upon conversion from other share class(es) | | | 24,614 | | | | 295,257 | |
| | | | | | | | |
Net increase (decrease) in shares outstanding | | | 1,603,830 | | | $ | 19,824,252 | |
| | | | | | | | |
| * | Includes affiliated redemption of 1,019 shares with a value of $11,243 for Class A shares, 1,008 shares with a value of $11,065 for Class C shares and 1,024 shares with a value of $11,296 for Class Z shares. |
Note 7. Borrowings
The Series, along with other affiliated registered investment companies (the “Funds”), is a party to a Syndicated Credit Agreement (“SCA”) with a group of banks. The purpose of the SCA is to provide an alternative source of temporary funding for capital share redemptions. The SCA provides for a commitment of $900 million for the period October 6, 2016 through October 5, 2017. The Funds pay an annualized commitment fee of .15% of the unused portion of the SCA. The interest rate on borrowings under the SCA is paid monthly and at a per annum rate based upon the higher of 0.0%, the effective federal funds rate, or the One-Month LIBOR rate, plus a contractual spread. Prior to October 6, 2016, the Funds had another SCA that provided a commitment of $900 million and the Funds paid an annualized commitment fee of .11% of the unused portion of the SCA. The interest rate on borrowings was substantially the same. The Series’ portion of the commitment fee for the unused amount is accrued daily and paid quarterly.
| | | | |
| Prudential Jennison Global Infrastructure Fund | | | 35 | |
Notes to Financial Statements (continued)
The Series utilized the SCA during the year ended October 31, 2016. The average daily balance for the 21 days that the Series had loans outstanding during the period was $1,958,524 borrowed at a weighted average interest rate of 1.70%. The maximum loan balance outstanding during the period was $3,583,000. At October 31, 2016, the Series did not have an outstanding loan balance.
Note 8. Recent Accounting Pronouncements and Reporting Updates
In January 2016, the FASB issued ASU No. 2016-01 regarding “Recognition and Measurement of Financial Assets and Financial Liabilities”. The new guidance is intended to enhance the reporting model for financial instruments to provide users of financial statements with more decision-useful information and addresses certain aspects of the recognition, measurement, presentation, and disclosure of financial instruments. The new standard affects all entities that hold financial assets or owe financial liabilities. The new guidance is effective for public companies for fiscal years beginning after December 15, 2017, including interim periods within those fiscal years. At this time, management is evaluating the implications of ASU No. 2016-01 and its impact on the financial statements and disclosures has not yet been determined.
On October 13, 2016, the Securities and Exchange Commission (the “SEC”) adopted new rules and forms and amended existing rules and forms which are intended to modernize and enhance the reporting and disclosure of information by registered investment companies and to improve the quality of information that funds provide to investors, including modifications to Regulation S-X which would require standardized, enhanced disclosure about derivatives in investment company financial statements. In an effort to enhance monitoring and regulation, the new rules and forms will allow the SEC to more effectively collect and use data reported by funds. The new rules also enhance disclosure regarding fund liquidity and redemption practices. Also under the new rules, the SEC will permit open-end funds, with the exception of money market funds, to offer swing pricing, subject to board approval and review. The compliance dates of the modifications to Regulation S-X are August 1, 2017 and other amendments and rules are generally June 1, 2018 and December 1, 2018. Management is currently evaluating the impacts to the financial statement disclosures, if any.
Note 9. Dividends and Distributions to Shareholders
Subsequent to the fiscal year end, the Series declared ordinary income dividends on December 14, 2016 to shareholders of record on December 15, 2016. The ex-date was December 16, 2016. The per share amounts declared were as follows:
| | | | |
| | | Ordinary Income | �� |
Class A | | | 0.06722 | |
Class C | | | 0.05323 | |
Class Z | | | 0.07193 | |
| | | | |
| Prudential Jennison Global Infrastructure Fund | | | 37 | |
Financial Highlights
| | | | | | | | | | | | | | | | | | | | | | | | | | | | |
| Class A Shares | |
| | | Year Ended October 31, | | | | | | September 25,
2013(b)
through
October 31,
2013 | |
| | | 2016 | | | | | | 2015 | | | | | | 2014 | | | | | |
| Per Share Operating Performance(c): | | | | | | | | | | | | | | | | | | | | | | | | | | | | |
| Net Asset Value, Beginning of Period | | | $11.48 | | | | | | | | $12.62 | | | | | | | | $10.42 | | | | | | | | $10.00 | |
| Income (loss) from investment operations: | | | | | | | | | | | | | | | | | | | | | | | | | | | | |
| Net investment income (loss) | | | .09 | | | | | | | | .06 | | | | | | | | .09 | | | | | | | | - | (g) |
| Net realized and unrealized gain (loss) on investments | | | .21 | | | | | | | | (1.12 | ) | | | | | | | 2.26 | | | | | | | | .42 | |
| Total from investment operations | | | .30 | | | | | | | | (1.06 | ) | | | | | | | 2.35 | | | | | | | | .42 | |
| Less Dividends and Distributions: | | | | | | | | | | | | | | | | | | | | | | | | | | | | |
| Dividends from net investment income | | | (.08 | ) | | | | | | | (.05 | ) | | | | | | | (.14 | ) | | | | | | | - | |
| Tax return of capital distributions | | | (.09 | ) | | | | | | | (.03 | ) | | | | | | | - | | | | | | | | - | |
| Distributions from net realized gains | | | - | | | | | | | | - | | | | | | | | (.01 | ) | | | | | | | - | |
| Total dividends and distributions | | | (.17 | ) | | | | | | | (.08 | ) | | | | | | | (.15 | ) | | | | | | | - | |
| Net Asset Value, end of period | | | $11.61 | | | | | | | | $11.48 | | | | | | | | $12.62 | | | | | | | | $10.42 | |
| Total Return(a): | | | 2.62% | | | | | | | | (8.46 | )% | | | | | | | 22.67% | | | | | | | | 4.20% | |
| | | | | | | | | | | | | | | | | | | | | | | | | | | | |
| Ratios/Supplemental Data: | |
| Net assets, end of period (000) | | | $12,277 | | | | | | | | $22,353 | | | | | | | | $15,521 | | | | | | | | $21 | |
| Average net assets (000) | | | $16,694 | | | | | | | | $22,695 | | | | | | | | $4,906 | | | | | | | | $17 | |
| Ratios to average net assets(d): | | | | | | | | | | | | | | | | | | | | | | | | | | | | |
| Expenses after waivers and/or expense reimbursement | | | 1.50% | | | | | | | | 1.50% | | | | | | | | 1.50% | | | | | | | | 1.50% | (e) |
| Expenses before waivers and/or expense reimbursement | | | 1.79% | | | | | | | | 1.78% | | | | | | | | 1.95% | | | | | | | | 25.87% | (e) |
| Net investment income (loss) | | | .76% | | | | | | | | .52% | | | | | | | | .73% | | | | | | | | .28% | (e) |
| Portfolio turnover rate | | | 82% | | | | | | | | 94% | | | | | | | | 49% | | | | | | | | 10% | (f) |
| (a) | Total return does not consider the effect of sales loads. Total return is calculated assuming a purchase of a share on the first day and a sale on the last day of each period reported and includes reinvestment of dividends and distributions, if any. Total returns may reflect adjustments to conform to generally accepted accounting principles. Total returns for periods less than one full year are not annualized. |
| (b) | Commencement of operations. |
| (c) | Calculated based on the average shares outstanding during the period. |
| (d) | Does not include expenses of the underlying portfolio in which the Series invests. |
See Notes to Financial Statements.
| | | | | | | | | | | | | | | | | | | | | | | | | | | | |
| Class C Shares | |
| | | Year Ended October 31, | | | | | | September 25,
2013(b)
through
October 31,
2013 | |
| | | 2016 | | | | | | 2015 | | | | | | 2014 | | | | | |
| Per Share Operating Performance(c): | | | | | | | | | | | | | | | | | | | | | | | | | | | | |
| Net Asset Value, Beginning of Period | | | $11.42 | | | | | | | | $12.58 | | | | | | | | $10.41 | | | | | | | | $10.00 | |
| Income (loss) from investment operations: | | | | | | | | | | | | | | | | | | | | | | | | | | | | |
| Net investment income (loss) | | | - | (g) | | | | | | | (.03 | ) | | | | | | | .01 | | | | | | | | .01 | |
| Net realized and unrealized gain (loss) on investments | | | .21 | | | | | | | | (1.13 | ) | | | | | | | 2.25 | | | | | | | | .40 | |
| Total from investment operations | | | .21 | | | | | | | | (1.16 | ) | | | | | | | 2.26 | | | | | | | | .41 | |
| Less Dividends and Distributions: | | | | | | | | | | | | | | | | | | | | | | | | | | | | |
| Dividends from net investment income | | | (.04 | ) | | | | | | | - | (g) | | | | | | | (.08 | ) | | | | | | | - | |
| Tax return of capital distributions | | | (.04 | ) | | | | | | | - | (g) | | | | | | | - | | | | | | | | - | |
| Distributions from net realized gains | | | - | | | | | | | | - | | | | | | | | (.01 | ) | | | | | | | - | |
| Total dividends and distributions | | | (.08 | ) | | | | | | | - | | | | | | | | (.09 | ) | | | | | | | - | |
| Net Asset Value, end of period | | | $11.55 | | | | | | | | $11.42 | | | | | | | | $12.58 | | | | | | | | $10.41 | |
| Total Return(a): | | | 1.88% | | | | | | | | (9.21 | )% | | | | | | | 21.76% | | | | | | | | 4.10% | |
| | | | | | | | | | | | | | | | | | | | | | | | | | | | |
| Ratios/Supplemental Data: | |
| Net assets, end of period (000) | | | $5,738 | | | | | | | | $6,775 | | | | | | | | $3,835 | | | | | | | | $40 | |
| Average net assets (000) | | | $5,783 | | | | | | | | $6,353 | | | | | | | | $1,104 | | | | | | | | $17 | |
| Ratios to average net assets(d): | | | | | | | | | | | | | | | | | | | | | | | | | | | | |
| Expenses after waivers and/or expense reimbursement | | | 2.25% | | | | | | | | 2.25% | | | | | | | | 2.25% | | | | | | | | 2.25% | (e) |
| Expenses before waivers and/or expense reimbursement | | | 2.49% | | | | | | | | 2.48% | | | | | | | | 2.70% | | | | | | | | 38.05% | (e) |
| Net investment income (loss) | | | (.02)% | | | | | | | | (.22)% | | | | | | | | .12% | | | | | | | | .52% | (e) |
| Portfolio turnover rate | | | 82% | | | | | | | | 94% | | | | | | | | 49% | | | | | | | | 10% | (f) |
| (a) | Total return does not consider the effect of sales loads. Total return is calculated assuming a purchase of a share on the first day and a sale on the last day of each period reported and includes reinvestment of dividends and distributions, if any. Total returns may reflect adjustments to conform to generally accepted accounting principles. Total returns for periods less than one full year are not annualized. |
| (b) | Commencement of operations. |
| (c) | Calculated based on the average shares outstanding during the period. |
| (d) | Does not include expenses of the underlying portfolio in which the Series invests. |
See Notes to Financial Statements.
| | | | |
| Prudential Jennison Global Infrastructure Fund | | | 39 | |
Financial Highlights (continued)
| | | | | | | | | | | | | | | | | | | | | | | | | | | | |
| Class Z Shares | |
| | | Year Ended October 31, | | | | | | September 25,
2013(b)
through
October 31,
2013 | |
| | | 2016 | | | | | | 2015 | | | | | | 2014 | | | | | |
| Per Share Operating Performance(c): | | | | | | | | | | | | | | | | | | | | | | | | | | | | |
| Net Asset Value, Beginning of Period | | | $11.47 | | | | | | | | $12.62 | | | | | | | | $10.42 | | | | | | | | $10.00 | |
| Income (loss) from investment operations: | | | | | | | | | | | | | | | | | | | | | | | | | | | | |
| Net investment income (loss) | | | .11 | | | | | | | | .09 | | | | | | | | .22 | | | | | | | | .01 | |
| Net realized and unrealized gain (loss) on investments | | | .23 | | | | | | | | (1.13 | ) | | | | | | | 2.15 | | | | | | | | .41 | |
| Total from investment operations | | | .34 | | | | | | | | (1.04 | ) | | | | | | | 2.37 | | | | | | | | .42 | |
| Less Dividends and Distributions: | | | | | | | | | | | | | | | | | | | | | | | | | | | | |
| Dividends from net investment income | | | (.09 | ) | | | | | | | (.08 | ) | | | | | | | (.16 | ) | | | | | | | - | |
| Tax return of capital distributions | | | (.11 | ) | | | | | | | (.03 | ) | | | | | | | - | | | | | | | | - | |
| Distributions from net realized gains | | | - | | | | | | | | - | | | | | | | | (.01 | ) | | | | | | | - | |
| Total dividends and distributions | | | (.20 | ) | | | | | | | (.11 | ) | | | | | | | (.17 | ) | | | | | | | - | |
| Net Asset Value, end of period | | | $11.61 | | | | | | | | $11.47 | | | | | | | | $12.62 | | | | | | | | $10.42 | |
| Total Return(a): | | | 2.96% | | | | | | | | (8.28 | )% | | | | | | | 22.91% | | | | | | | | 4.20% | |
| | | | | | | | | | | | | | | | | | | | | | | | | | | | |
| Ratios/Supplemental Data: | |
| Net assets, end of period (000) | | | $40,811 | | | | | | | | $47,305 | | | | | | | | $31,788 | | | | | | | | $5,247 | |
| Average net assets (000) | | | $40,236 | | | | | | | | $42,210 | | | | | | | | $20,117 | | | | | | | | $5,113 | |
| Ratios to average net assets(d): | | | | | | | | | | | | | | | | | | | | | | | | | | | | |
| Expenses after waivers and/or expense reimbursement | | | 1.25% | | | | | | | | 1.25% | | | | | | | | 1.25% | | | | | | | | 1.25% | (e) |
| Expenses before waivers and/or expense reimbursement | | | 1.49% | | | | | | | | 1.48% | | | | | | | | 2.08% | | | | | | | | 22.65% | (e) |
| Net investment income (loss) | | | .94% | | | | | | | | .75% | | | | | | | | 1.79% | | | | | | | | .56% | (e) |
| Portfolio turnover rate | | | 82% | | | | | | | | 94% | | | | | | | | 49% | | | | | | | | 10% | (f) |
| (a) | Total return is calculated assuming a purchase of a share on the first day and a sale on the last day of each period reported and includes reinvestment of dividends and distributions, if any. Total returns may reflect adjustments to conform to generally accepted accounting principles. Total returns for periods less than one full year are not annualized. |
| (b) | Commencement of operations. |
| (c) | Calculated based on the average shares outstanding during the period. |
| (d) | Does not include expenses of the underlying portfolio in which the Series invests. |
See Notes to Financial Statements.
Report of Independent Registered Public
Accounting Firm
The Board of Directors and Shareholders
Prudential World Fund, Inc.:
We have audited the accompanying statement of assets and liabilities of Prudential Jennison Global Infrastructure Fund, one of the series constituting Prudential World Fund, Inc. (hereafter referred to as the “Fund”), including the portfolio of investments, as of October 31, 2016, and the related statement of operations for the year then ended, the statements of changes in net assets for each of the years in the two-year period then ended, and the financial highlights for each of the years in the three-year period then ended and the period from September 25, 2013 (commencement of operations) to October 31, 2013. These financial statements and financial highlights are the responsibility of the Fund’s management. Our responsibility is to express an opinion on these financial statements and financial highlights based on our audits.
We conducted our audits in accordance with the standards of the Public Company Accounting Oversight Board (United States). Those standards require that we plan and perform the audit to obtain reasonable assurance about whether the financial statements and financial highlights are free of material misstatement. An audit includes examining, on a test basis, evidence supporting the amounts and disclosures in the financial statements. Our procedures included confirmation of securities owned as of October 31, 2016, by correspondence with the custodian, transfer agent and brokers or by other appropriate auditing procedures when replies from brokers were not received. An audit also includes assessing the accounting principles used and significant estimates made by management, as well as evaluating the overall financial statement presentation. We believe that our audits provide a reasonable basis for our opinion.
In our opinion, the financial statements and financial highlights referred to above present fairly, in all material respects, the financial position of the Fund as of October 31, 2016, and the results of its operations, the changes in its net assets, and the financial highlights for each of the years or periods described in the first paragraph, in conformity with U.S. generally accepted accounting principles.

New York, New York
December 19, 2016
| | | | |
| Prudential Jennison Global Infrastructure Fund | | | 41 | |
Federal Income Tax Information (unaudited)
For the year ended October 31, 2016, the Series reports under Section 854 of the Internal Revenue Code, the following percentages of the ordinary income dividends paid as 1) qualified dividend income (QDI); and 2) eligible for corporate dividends received deduction (DRD):
| | | | | | | | |
| | | QDI | | | DRD | |
Prudential Jennison Global Infrastructure Fund | | | 100.00 | % | | | 100.00 | % |
For the year ended October 31, 2016, the Series made an election to pass through the maximum amount of the portion of the ordinary income dividends paid derived from foreign source income as well as any foreign taxes paid by the Series in accordance with Section 853 of the Internal Revenue Code of the following amounts: $79,016 foreign tax credit from recognized foreign source income of $849,027.
In January 2017, you will be advised on IRS Form 1099-DIV or substitute 1099-DIV, as to the federal tax status of dividends and distributions received by you in calendar year 2016.
INFORMATION ABOUT BOARD MEMBERS AND OFFICERS
(Unaudited)
Information about Board Members and Officers of the Fund is set forth below. Board Members who are not deemed to be “interested persons” of the Fund, as defined in the 1940 Act, are referred to as “Independent Board Members.” Board Members who are deemed to be “interested persons” of the Fund are referred to as “Interested Board Members.” The Board Members are responsible for the overall supervision of the operations of the Fund and perform the various duties imposed on the directors of investment companies by the 1940 Act. The Board in turn elects the Officers, who are responsible for administering the day-to-day operations of the Fund.
| | | | |
| Independent Board Members(1) |
Name, Address, Age Position(s) Portfolios Overseen | | Principal Occupation(s) During Past Five Years | | Other Directorships Held During Past Five Years |
Ellen S. Alberding (58) Board Member Portfolios Overseen: 67 | | President and Board Member, The Joyce Foundation (charitable foundation) (since 2002); Vice Chair, City Colleges of Chicago (community college system) (since 2011); Trustee, Skills for America’s Future (national initiative to connect employers to community colleges) (since 2011); Trustee, National Park Foundation (charitable foundation for national park system) (since 2009); Trustee, Economic Club of Chicago (since 2009). | | None. |
Kevin J. Bannon (64) Board Member Portfolios Overseen: 67 | | Managing Director (April 2008-May 2015) and Chief Investment Officer (October 2008-November 2013) of Highmount Capital LLC (registered investment adviser); formerly Executive Vice President and Chief Investment Officer (April 1993-August 2007) of Bank of New York Company; President (May 2003-May 2007) of BNY Hamilton Family of Mutual Funds. | | Director of Urstadt Biddle Properties (equity real estate investment trust) (since September 2008). |
Linda W. Bynoe (64) Board Member Portfolios Overseen: 67 | | President and Chief Executive Officer (since March 1995) and formerly Chief Operating Officer (December 1989-February 1995) of Telemat Ltd. (management consulting); formerly Vice President (January 1985-June 1989) at Morgan Stanley & Co. (broker-dealer). | | Director of Simon Property Group, Inc. (retail real estate) (May 2003-May 2012); Director of Anixter International, Inc. (communication products distributor) (since January 2006); Director of Northern Trust Corporation (financial services) (since April 2006); Trustee of Equity Residential (residential real estate) (since December 2009). |
Prudential Jennison Global Infrastructure Fund
| | | | |
| Independent Board Members(1) |
Name, Address, Age Position(s) Portfolios Overseen | | Principal Occupation(s) During Past Five Years | | Other Directorships Held During Past Five Years |
Keith F. Hartstein (60) Board Member Portfolios Overseen: 67 | | Retired; Member (since November 2014) of the Governing Council of the Independent Directors Council (organization of independent mutual fund directors); formerly President and Chief Executive Officer (2005-2012), Senior Vice President (2004-2005), Senior Vice President of Sales and Marketing (1997-2004), and various executive management positions (1990-1997), John Hancock Funds, LLC (asset management); Chairman, Investment Company Institute’s Sales Force Marketing Committee (2003-2008). | | None. |
Michael S. Hyland, CFA (71) Board Member Portfolios Overseen: 67 | | Retired (since February 2005); formerly Senior Managing Director (July 2001-February 2005) of Bear Stearns & Co, Inc.; Global Partner, INVESCO (1999-2001); Managing Director and President of Salomon Brothers Asset Management (1989-1999). | | None. |
Richard A. Redeker (73) Board Member & Independent Chair Portfolios Overseen: 67 | | Retired Mutual Fund Senior Executive (47 years); Management Consultant; Director, Mutual Fund Directors Forum (since 2014); Independent Directors Council (organization of independent mutual fund directors)-Executive Committee, Chair of Policy Steering Committee, Governing Council. | | None. |
Stephen G. Stoneburn (73) Board Member Portfolios Overseen: 67 | | Chairman (since July 2011), President and Chief Executive Officer (since June 1996) of Quadrant Media Corp. (publishing company); formerly President (June 1995-June 1996) of Argus Integrated Media, Inc.; Senior Vice President and Managing Director (January 1993-1995) of Cowles Business Media; Senior Vice President of Fairchild Publications, Inc. (1975-1989). | | None. |
Visit our website at prudentialfunds.com
| | | | |
| Interested Board Members(1) |
Name, Address, Age Position(s) Portfolios Overseen | | Principal Occupation(s) During Past Five Years | | Other Directorships Held During Past Five Years |
Stuart S. Parker (54) Board Member & President Portfolios Overseen: 67 | | President of Prudential Investments LLC (since January 2012); Executive Vice President of Prudential Investment Management Services LLC (since December 2012); Executive Vice President of Jennison Associates LLC and Head of Retail Distribution of Prudential Investments LLC (June 2005-December 2011). | | None. |
Scott E. Benjamin (43) Board Member & Vice President Portfolios Overseen: 67 | | Executive Vice President (since June 2009) of Prudential Investments LLC; Executive Vice President (June 2009-June 2012) and Vice President (since June 2012) of Prudential Investment Management Services LLC; Executive Vice President (since September 2009) of AST Investment Services, Inc.; Senior Vice President of Product Development and Marketing, Prudential Investments (since February 2006); Vice President of Product Development and Product Management, Prudential Investments (2003-2006). | | None. |
Grace C. Torres* (57) Board Member Portfolios Overseen: 65 | | Retired; formerly Treasurer and Principal Financial and Accounting Officer of the Prudential Investments Funds, Target Funds, Advanced Series Trust, Prudential Variable Contract Accounts and The Prudential Series Fund (1998-June 2014); Assistant Treasurer (March 1999-June 2014) and Senior Vice President (September 1999-June 2014) of Prudential Investments LLC; Assistant Treasurer (May 2003-June 2014) and Vice President (June 2005-June 2014) of AST Investment Services, Inc.; Senior Vice President and Assistant Treasurer (May 2003-June 2014) of Prudential Annuities Advisory Services, Inc. | | Director (since July 2015) of Sun Bancorp, Inc. N.A. |
| * | Note: Prior to her retirement in 2014, Ms. Torres was employed by Prudential Investments LLC. Due to her prior employment, she is considered to be an “interested person” under the 1940 Act. Ms. Torres is a Non-Management Interested Board Member. |
| (1) | The year that each Board Member joined the Board is as follows: |
Ellen S. Alberding; 2013; Kevin J. Bannon, 2008; Linda W. Bynoe, 2005; Keith F. Hartstein, 2013; Michael S. Hyland, 2008; Richard A. Redeker, 2003; Stephen G. Stoneburn, 1996; Grace C. Torres, 2014; Stuart S. Parker, Board Member and President since 2012; Scott E. Benjamin, Board Member since 2010 and Vice President since 2009.
Prudential Jennison Global Infrastructure Fund
| | | | |
| Fund Officers(a) |
Name, Address and Age Position with Fund | | Principal Occupation(s) During Past Five Years | | Length of Service as Fund Officer |
Raymond A. O’Hara (61) Chief Legal Officer | | Vice President and Corporate Counsel (since July 2010) of Prudential Insurance Company of America (Prudential); Vice President (March 2011-Present) of Pruco Life Insurance Company and Pruco Life Insurance Company of New Jersey; Vice President and Corporate Counsel (March 2011-Present) of Prudential Annuities Life Assurance Corporation; Chief Legal Officer of Prudential Investments LLC (since June 2012); Chief Legal Officer of Prudential Mutual Fund Services LLC (since June 2012) and Corporate Counsel of AST Investment Services, Inc. (since June 2012); formerly Assistant Vice President and Corporate Counsel (September 2008-July 2010) of The Hartford Financial Services Group, Inc.; formerly Associate (September 1980-December 1987) and Partner (January 1988–August 2008) of Blazzard & Hasenauer, P.C. (formerly, Blazzard, Grodd & Hasenauer, P.C.). | | Since 2012 |
Chad A. Earnst (41) Chief Compliance Officer | | Chief Compliance Officer (September 2014-Present) of Prudential Investments LLC; Chief Compliance Officer (September 2014-Present) of the Prudential Investments Funds, Target Funds, Advanced Series Trust, The Prudential Series Fund, Prudential’s Gibraltar Fund, Inc., Prudential Global Short Duration High Yield Income Fund, Inc., Prudential Short Duration High Yield Fund, Inc. and Prudential Jennison MLP Income Fund, Inc.; formerly Assistant Director (March 2010-August 2014) of the Asset Management Unit, Division of Enforcement, US Securities & Exchange Commission; Assistant Regional Director (January 2010-August 2014), Branch Chief (June 2006–December 2009) and Senior Counsel (April 2003-May 2006) of the Miami Regional Office, Division of Enforcement, US Securities & Exchange Commission. | | Since 2014 |
Deborah A. Docs (58) Secretary | | Vice President and Corporate Counsel (since January 2001) of Prudential; Vice President (since December 1996) and Assistant Secretary (since March 1999) of Prudential Investments LLC; formerly Vice President and Assistant Secretary (May 2003-June 2005) of AST Investment Services, Inc. | | Since 2004 |
Jonathan D. Shain (58) Assistant Secretary | | Vice President and Corporate Counsel (since August 1998) of Prudential; Vice President and Assistant Secretary (since May 2001) of Prudential Investments LLC; Vice President and Assistant Secretary (since February 2001) of Prudential Mutual Fund Services LLC; formerly Vice President and Assistant Secretary (May 2003-June 2005) of AST Investment Services, Inc. | | Since 2005 |
Visit our website at prudentialfunds.com
| | | | |
| Fund Officers(a) |
Name, Address and Age Position with Fund | | Principal Occupation(s) During Past Five Years | | Length of Service as Fund Officer |
Claudia DiGiacomo (42) Assistant Secretary | | Vice President and Corporate Counsel (since January 2005) of Prudential; Vice President and Assistant Secretary of Prudential Investments LLC (since December 2005); Associate at Sidley Austin Brown & Wood LLP (1999-2004). | | Since 2005 |
Andrew R. French (53) Assistant Secretary | | Vice President and Corporate Counsel (since February 2010) of Prudential; formerly Director and Corporate Counsel (2006-2010) of Prudential; Vice President and Assistant Secretary (since January 2007) of Prudential Investments LLC; Vice President and Assistant Secretary (since January 2007) of Prudential Mutual Fund Services LLC. | | Since 2006 |
Theresa C. Thompson (54) Deputy Chief Compliance Officer | | Vice President, Compliance, Prudential Investments LLC (since April 2004); and Director, Compliance, Prudential Investments LLC (2001-2004). | | Since 2008 |
Charles H. Smith (43) Anti-Money Laundering Compliance Officer | | Vice President, Corporate Compliance, Anti-Money Laundering Unit (since January 2015) of Prudential; committee member of the American Council of Life Insurers Anti-Money Laundering and Critical Infrastructure Committee (since January 2016); formerly Global Head of Economic Sanctions Compliance at AIG Property Casualty (February 2007–December 2014); Assistant Attorney General at the New York State Attorney General’s Office, Division of Public Advocacy. (August 1998—January 2007). | | Since 2016 |
M. Sadiq Peshimam (52) Treasurer and Principal Financial and Accounting Officer | | Vice President (since 2005) of Prudential Investments LLC; formerly Assistant Treasurer of funds in the Prudential Mutual Fund Complex (2006-2014). | | Since 2006 |
Peter Parrella (58) Assistant Treasurer | | Vice President (since 2007) and Director (2004-2007) within Prudential Mutual Fund Administration; formerly Tax Manager at SSB Citi Fund Management LLC (1997-2004). | | Since 2007 |
Lana Lomuti (49) Assistant Treasurer | | Vice President (since 2007) and Director (2005-2007), within Prudential Mutual Fund Administration; formerly Assistant Treasurer (December 2007-February 2014) of The Greater China Fund, Inc. | | Since 2014 |
Linda McMullin (55) Assistant Treasurer | | Vice President (since 2011) and Director (2008-2011) within Prudential Mutual Fund Administration. | | Since 2014 |
Kelly A. Coyne (48) Assistant Treasurer | | Director, Investment Operations of Prudential Mutual Fund Services LLC (since 2010). | | Since 2015 |
Prudential Jennison Global Infrastructure Fund
| (a) | Excludes Mr. Parker and Mr. Benjamin, interested Board Members who also serve as President and Vice President, respectively. |
Explanatory Notes to Tables:
| • | | Board Members are deemed to be “Interested,” as defined in the 1940 Act, by reason of their affiliation with Prudential Investments LLC and/or an affiliate of Prudential Investments LLC. |
| • | | Unless otherwise noted, the address of all Board Members and Officers is c/o Prudential Investments LLC, 655 Broad Street, Newark, New Jersey 07102-4410. |
| • | | There is no set term of office for Board Members or Officers. The Board Members have adopted a retirement policy, which calls for the retirement of Board Members on December 31 of the year in which they reach the age of 75. |
| • | | “Other Directorships Held” includes only directorships of companies required to register or file reports with the SEC under the 1934 Act (that is, “public companies”) or other investment companies registered under the 1940 Act. |
| • | | “Portfolios Overseen” includes all investment companies managed by Prudential Investments LLC. The investment companies for which Prudential Investments LLC serves as manager include the Prudential Investments Mutual Funds, The Prudential Variable Contract Accounts, Target Mutual Funds, Prudential Short Duration High Yield Fund, Inc., Prudential Global Short Duration High Yield Fund, Inc., The Prudential Series Fund, Prudential’s Gibraltar Fund, Inc. and the Advanced Series Trust. |
Visit our website at prudentialfunds.com
Approval of Advisory Agreements (unaudited)
The Fund’s Board of Directors
The Board of Directors (the “Board”) of Prudential Jennison Global Infrastructure Fund (the “Fund”)1 consists of ten individuals, seven of whom are not “interested persons” of the Fund, as defined in the Investment Company Act of 1940, as amended (the “1940 Act”) (the “Independent Directors”). The Board is responsible for the oversight of the Fund and its operations, and performs the various duties imposed on the directors of investment companies by the 1940 Act. The Independent Directors have retained independent legal counsel to assist them in connection with their duties. The Chair of the Board is an Independent Director. The Board has established three standing committees: the Audit Committee, the Nominating and Governance Committee, and the Investment Committee. Each committee is chaired by, and composed of, Independent Directors.
Annual Approval of the Fund’s Advisory Agreements
As required under the 1940 Act, the Board determines annually whether to renew the Fund’s management agreement with Prudential Investments LLC (“PI”) and the Fund’s subadvisory agreement with Jennison Associates LLC (“Jennison”). In considering the renewal of the agreements, the Board, including all of the Independent Directors, met on June 7-9, 2016 and approved the renewal of the agreements through July 31, 2017, after concluding that the renewal of the agreements was in the best interests of the Fund and its shareholders.
In advance of the meetings, the Board requested and received materials relating to the agreements, and had the opportunity to ask questions and request further information in connection with their consideration. Among other things, the Board considered comparative fee information from PI and Jennison. Also, the Board considered comparisons with other mutual funds in relevant Peer Universes and Peer Groups, as is further discussed below.
In approving the agreements, the Board, including the Independent Directors advised by independent legal counsel, considered the factors it deemed relevant, including the nature, quality and extent of services provided by PI and the subadviser, the performance of the Fund, the profitability of PI and its affiliates, expenses and fees, and the potential for economies of scale that may be shared with the Fund and its shareholders as the Fund’s assets grow. In their deliberations, the Directors did not identify any single factor which alone was responsible for the Board’s decision to approve the agreements with respect to the Fund. In connection with its deliberations, the Board considered information provided
| 1 | Prudential Jennison Global Infrastructure Fund is a series of Prudential World Fund, Inc. |
| | |
| Prudential Jennison Global Infrastructure Fund |
Approval of Advisory Agreements (continued)
by PI throughout the year at regular Board meetings, presentations from portfolio managers and other information, as well as information furnished at or in advance of the meetings on June 7-9, 2016.
The Directors determined that the overall arrangements between the Fund and PI, which serves as the Fund’s investment manager pursuant to a management agreement, and between PI and Jennison, which serves as the Fund’s subadviser pursuant to the terms of a subadvisory agreement with PI, are in the best interests of the Fund and its shareholders in light of the services performed, fees charged and such other matters as the Directors considered relevant in the exercise of their business judgment.
The material factors and conclusions that formed the basis for the Directors’ reaching their determinations to approve the continuance of the agreements are separately discussed below.
Nature, Quality, and Extent of Services
The Board received and considered information regarding the nature, quality and extent of services provided to the Fund by PI and Jennison. The Board considered the services provided by PI, including but not limited to the oversight of the subadviser for the Fund, as well as the provision of fund recordkeeping, compliance, and other services to the Fund. With respect to PI’s oversight of the subadviser, the Board noted that PI’s Strategic Investment Research Group (“SIRG”), which is a business unit of PI, is responsible for monitoring and reporting to PI’s senior management on the performance and operations of the subadviser. The Board also considered that PI pays the salaries of all of the officers and interested Directors of the Fund who are part of Fund management. The Board also considered the investment subadvisory services provided by Jennison, as well as adherence to the Fund’s investment restrictions and compliance with applicable Fund policies and procedures. The Board considered PI’s evaluation of the subadviser, as well as PI’s recommendation, based on its review of the subadviser, to renew the subadvisory agreement.
The Board considered the qualifications, backgrounds and responsibilities of PI’s senior management responsible for the oversight of the Fund and Jennison, and also considered the qualifications, backgrounds and responsibilities of Jennison’s portfolio managers who are responsible for the day-to-day management of the Fund’s portfolio. The Board was provided with information pertaining to PI’s and Jennison’s organizational structure, senior management, investment operations, and other relevant information pertaining to both PI and Jennison. The Board also noted that it received favorable compliance reports from the Fund’s Chief Compliance Officer (“CCO”) as to both PI and Jennison. The Board noted that Jennison is affiliated with PI.
| | |
| Visit our website at prudentialfunds.com | | |
The Board concluded that it was satisfied with the nature, extent and quality of the investment management services provided by PI and the subadvisory services provided to the Fund by Jennison, and that there was a reasonable basis on which to conclude that the Fund benefits from the services provided by PI and Jennison under the management and subadvisory agreements.
Costs of Services and Profits Realized by PI
The Board was provided with information on the profitability of PI and its affiliates in serving as the Fund’s investment manager. The Board discussed with PI the methodology utilized in assembling the information regarding profitability and considered its reasonableness. The Board recognized that it is difficult to make comparisons of profitability from fund management contracts because comparative information is not generally publicly available and is affected by numerous factors, including the structure of the particular adviser, the types of funds it manages, its business mix, numerous assumptions regarding allocations and the adviser’s capital structure and cost of capital. However, the Board considered that the cost of services provided by PI to the Fund during the year ended December 31, 2015 exceeded the management fees paid by the Fund, resulting in an operating loss to PI. The Board further noted that the subadviser is affiliated with PI and that its profitability is reflected in PI’s profitability report. Taking these factors into account, the Board concluded that the profitability of PI and its affiliates in relation to the services rendered was not unreasonable.
Economies of Scale
PI and the Board previously retained an outside business consulting firm to review management fee breakpoint usage and trends in management fees across the mutual fund industry. The consulting firm presented its analysis and conclusions as to the Funds’ management fee structures to the Board and PI. The Board and PI have discussed these conclusions extensively since that presentation.
The Board received and discussed information concerning economies of scale that PI may realize as the Fund’s assets grow beyond current levels. The Board considered information provided by PI regarding the launch date of the Fund, the management fees of the Fund compared to those of similarly managed funds and PI’s investment in the Fund over time. The Board noted that economies of scale, if any, may be shared with the Fund in several ways, including low management fees from inception, additional technological and personnel investments to enhance shareholder services, and maintaining existing expense structures in the face of a rising cost environment. The Board considered PI’s assertion that it continually evaluates the management fee schedule of the Fund and the potential to share economies of scale through breakpoints or fee waivers as asset levels increase.
| | |
| Prudential Jennison Global Infrastructure Fund |
Approval of Advisory Agreements (continued)
The Board recognized the inherent limitations of any analysis of economies of scale, stemming largely from the Board’s understanding that most of PI’s costs are not specific to individual funds, but rather are incurred across a variety of products and services.
Other Benefits to PI and Jennison
The Board considered potential ancillary benefits that might be received by PI and Jennison and their affiliates as a result of their relationship with the Fund. The Board concluded that potential benefits to be derived by PI included transfer agency fees received by the Fund’s transfer agent (which is affiliated with PI), benefits to its reputation as well as other intangible benefits resulting from PI’s association with the Fund. The Board concluded that the potential benefits to be derived by Jennison included its ability to use soft dollar credits, as well as the potential benefits consistent with those generally resulting from an increase in assets under management, specifically, potential access to additional research resources and benefits to its reputation. The Board concluded that the benefits derived by PI and Jennison were consistent with the types of benefits generally derived by investment managers and subadvisers to mutual funds.
Performance of the Fund / Fees and Expenses
The Board considered certain additional specific factors and made related conclusions relating to the historical performance of the Fund for the one-year period ended December 31, 2015. The Board considered that the Fund commenced operations on September 25, 2013 and that longer-term performance was not yet available.
The Board also considered the Fund’s actual management fee, as well as the Fund’s net total expense ratio, for the fiscal year ended October 31, 2015. The Board considered the management fee for the Fund as compared to the management fee charged by PI to other funds and the fee charged by other advisers to comparable mutual funds in a Peer Group. The actual management fee represents the fee rate actually paid by Fund shareholders and includes any fee waivers or reimbursements. The net total expense ratio for the Fund represents the actual expense ratio incurred by Fund shareholders.
The mutual funds included in the Peer Universe (the Lipper Global Infrastructure Performance Universe) and the Peer Group were objectively determined by Broadridge, an independent provider of mutual fund data. The comparisons placed the Fund in various quartiles, with the first quartile being the best 25% of the mutual funds (for performance, the best performing mutual funds and, for expenses, the lowest cost mutual funds).
The section below summarizes key factors considered by the Board and the Board’s conclusions regarding the Fund’s performance, fees and overall expenses. The table sets
| | |
| Visit our website at prudentialfunds.com | | |
forth gross performance comparisons (which do not reflect the impact on performance of fund expenses, or any subsidies, expense caps or waivers that may be applicable) with the Peer Universe, actual management fees with the Peer Group (which reflect the impact of any subsidies or fee waivers), and net total expenses with the Peer Group, each of which were key factors considered by the Board.
| | | | | | | | |
| Performance | | 1 Year | | 3 Years | | 5 Years | | 10 Years |
| | 3rd Quartile | | N/A | | N/A | | N/A |
| Actual Management Fees: 2nd Quartile |
| Net Total Expenses: 3rd Quartile |
| | • | | The Board noted that the Fund outperformed its benchmark index over the one-year period. |
| | • | | The Board noted that the Fund does not yet have a three-year performance record and that, therefore, the subadviser should have more time to develop that record. |
| | • | | The Board noted information provided by PI indicating that the Fund’s net total expense ratio was within six basis points of the median of all funds included in the Peer Group. |
| | • | | The Board and PI agreed to continue the Fund’s existing expense cap of 1.25% (exclusive of 12b-1 and certain other fees) through February 28, 2017. |
| | • | | The Board concluded that, in light of the above, it would be in the best interests of the Fund and its shareholders to renew the agreements. |
| | • | | The Board concluded that the management fees (including subadvisory fees) and total expenses were reasonable in light of the services provided. |
* * *
After full consideration of these factors, the Board concluded that approval of the agreements was in the best interests of the Fund and its shareholders.
| | |
| Prudential Jennison Global Infrastructure Fund |
| | | | |
| ∎ MAIL | | ∎ TELEPHONE | | ∎ WEBSITE |
655 Broad Street Newark, NJ 07102 | | (800) 225-1852 | | www.prudentialfunds.com |
|
| PROXY VOTING |
| The Board of Directors of the Fund has delegated to the Fund’s investment subadviser the responsibility for voting any proxies and maintaining proxy recordkeeping with respect to the Fund. A description of these proxy voting policies and procedures is available without charge, upon request, by calling (800) 225-1852 or by visiting the Securities and Exchange Commission’s website at www.sec.gov. Information regarding how the Fund voted proxies relating to portfolio securities during the most recent 12-month period ended June 30 is available on the Fund’s website and on the Securities and Exchange Commission’s website. |
|
| DIRECTORS |
| Ellen S. Alberding • Kevin J. Bannon • Scott E. Benjamin • Linda W. Bynoe • Keith F. Hartstein • Michael S. Hyland • Stuart S. Parker • Richard A. Redeker • Stephen G. Stoneburn • Grace C. Torres |
|
| OFFICERS |
| Stuart S. Parker, President • Scott E. Benjamin, Vice President • M. Sadiq Peshimam, Treasurer and Principal Financial and Accounting Officer • Raymond A. O’Hara, Chief Legal Officer • Deborah A. Docs, Secretary • Chad A. Earnst, Chief Compliance Officer • Theresa C. Thompson, Deputy Chief Compliance Officer • Charles H. Smith, Anti-Money Laundering Compliance Officer • Jonathan D. Shain, Assistant Secretary • Claudia DiGiacomo, Assistant Secretary • Andrew R. French, Assistant Secretary • Peter Parrella, Assistant Treasurer • Lana Lomuti, Assistant Treasurer • Linda McMullin, Assistant Treasurer • Kelly A. Coyne, Assistant Treasurer |
| | | | |
| MANAGER | | Prudential Investments LLC | | 655 Broad Street
Newark, NJ 07102 |
|
| INVESTMENT SUBADVISER | | Jennison Associates LLC | | 466 Lexington Avenue
New York, NY 10017 |
|
| DISTRIBUTOR | | Prudential Investment
Management Services LLC | | 655 Broad Street
Newark, NJ 07102 |
|
| CUSTODIAN | | The Bank of New York Mellon | | One Wall Street
New York, NY 10286 |
|
| TRANSFER AGENT | | Prudential Mutual Fund
Services LLC | | PO Box 9658
Providence, RI 02940 |
|
| INDEPENDENT REGISTERED PUBLIC ACCOUNTING FIRM | | KPMG LLP | | 345 Park Avenue New York, NY 10154 |
|
| FUND COUNSEL | | Willkie Farr & Gallagher LLP | | 787 Seventh Avenue
New York, NY 10019 |
|
|
| An investor should consider the investment objectives, risks, charges, and expenses of the Fund carefully before investing. The prospectus and summary prospectus contain this and other information about the Fund. An investor may obtain a prospectus and summary prospectus by visiting our website at www.prudentialfunds.com or by calling (800) 225-1852. The prospectus and summary prospectus should be read carefully before investing. |
|
| E-DELIVERY |
| To receive your mutual fund documents online, go to www.prudentialfunds.com/edelivery and enroll. Instead of receiving printed documents by mail, you will receive notification via email when new materials are available. You can cancel your enrollment or change your email address at any time by visiting the website address above. |
|
| SHAREHOLDER COMMUNICATIONS WITH DIRECTORS |
| Shareholders can communicate directly with the Board of Directors by writing to the Chair of the Board, Prudential Jennison Global Infrastructure Fund, Prudential Investments, Attn: Board of Directors, 655 Broad Street, Newark, NJ 07102. Shareholders can communicate directly with an individual Director by writing to the same address. Communications are not screened before being delivered to the addressee. |
|
| AVAILABILITY OF PORTFOLIO SCHEDULE |
| The Fund files its complete schedule of portfolio holdings with the Securities and Exchange Commission for the first and third quarters of each fiscal year on Form N-Q. The Fund’s Forms N-Q are available on the Commission’s website at www.sec.gov. The Fund’s Forms N-Q may also be reviewed and copied at the Commission’s Public Reference Room in Washington, D.C. Information on the operation and location of the Public Reference Room may be obtained by calling (202) 551-8090. The Fund’s schedule of portfolio holdings is also available on the Fund’s website as of the end of each month no sooner than 15 days after the end of the month. |
|
| The Fund’s Statement of Additional Information contains additional information about the Fund’s Directors and is available without charge, upon request, by calling (800) 225-1852. |
Mutual Funds:
| | | | |
| ARE NOT INSURED BY THE FDIC OR ANY FEDERAL GOVERNMENT AGENCY | | MAY LOSE VALUE | | ARE NOT A DEPOSIT OF OR GUARANTEED BY ANY BANK OR ANY BANK AFFILIATE |
PRUDENTIAL JENNISON GLOBAL INFRASTRUCTURE FUND
| | | | | | |
| SHARE CLASS | | A | | C | | Z |
| NASDAQ | | PGJAX | | PGJCX | | PGJZX |
| CUSIP | | 743969792 | | 743969784 | | 743969776 |
MF217E 0300091-00001-00
Item 2 – Code of Ethics — See Exhibit (a)
As of the end of the period covered by this report, the registrant has adopted a code of ethics (the “Section 406 Standards for Investment Companies – Ethical Standards for Principal Executive and Financial Officers”) that applies to the registrant’s Principal Executive Officer and Principal Financial Officer; the registrant’s Principal Financial Officer also serves as the Principal Accounting Officer. During the period covered by this report, there have been no amendments to
any provision of the code of ethics nor have any waivers been granted from any provision of the code of ethics.
The registrant hereby undertakes to provide any person, without charge, upon request, a copy of the code of ethics. To request a copy of the code of ethics, contact the registrant 800-225-1852, and ask for a copy of the Section 406 Standards for Investment Companies - Ethical Standards for Principal Executive and Financial Officers.
Item 3 – Audit Committee Financial Expert –
The registrant’s Board has determined that Mr. Kevin J. Bannon, member of the Board’s Audit Committee is an “audit committee financial expert,” and that he is “independent,” for purposes of this Item.
Item 4 – Principal Accountant Fees and Services –
(a) Audit Fees
For the fiscal years ended October 31, 2016 and October 31, 2015, KPMG LLP (“KPMG”), the Registrant’s principal accountant, billed the Registrant $218,104 and $195,675 respectively, for professional services rendered for the audit of the Registrant’s annual financial statements or services that are normally provided in connection with statutory and regulatory filings.
(b) Audit-Related Fees
For the fiscal years ended October 31, 2016 and October 31, 2015: none.
(c) Tax Fees
For the fiscal years ended October 31, 2016 and October 31, 2015: none.
(d) All Other Fees
For the fiscal years ended October 31, 2016 and October 31, 2015: none.
(e) (1) Audit Committee Pre-Approval Policies and Procedures
THE PRUDENTIAL MUTUAL FUNDS
AUDIT COMMITTEE POLICY
on
Pre-Approval of Services Provided by the Independent Accountants
The Audit Committee of each Prudential Mutual Fund is charged with the responsibility to monitor the independence of the Fund’s independent accountants. As part of this responsibility, the Audit Committee must pre-approve the independent accounting firm’s engagement to render audit and/or permissible non-audit services, as required by law. In evaluating a proposed engagement of the independent accountants, the Audit Committee will assess the effect that the engagement might reasonably be expected to have on the accountant’s independence. The Committee’s evaluation will be based on:
| | • | | a review of the nature of the professional services expected to be provided, |
| | • | | a review of the safeguards put into place by the accounting firm to safeguard independence, and |
| | • | | periodic meetings with the accounting firm. |
Policy for Audit and Non-Audit Services Provided to the Funds
On an annual basis, the scope of audits for each Fund, audit fees and expenses, and audit-related and non-audit services (and fees proposed in respect thereof) proposed to be performed by the Fund’s independent accountants will be presented by the Treasurer and the independent accountants to the Audit Committee for review and, as appropriate, approval prior to the initiation of such services. Such presentation shall be accompanied by confirmation by both the Treasurer and the independent accountants that the proposed non-audit services will not adversely affect the independence of the independent accountants. Such proposed non-audit services shall be described in sufficient detail to enable the Audit Committee to assess the appropriateness of such services and fees, and the compatibility of the provision of such services with the auditor’s independence. The Committee shall receive periodic reports on the progress of the audit and other services which are approved by the Committee or by the Committee Chair pursuant to authority delegated in this Policy.
The categories of services enumerated under “Audit Services”, “Audit-related Services”, and “Tax Services” are intended to provide guidance to the Treasurer and the independent accountants as to those categories of services which the Committee believes are generally consistent with the independence of the independent accountants and which the Committee (or the Committee Chair) would expect upon the presentation of specific proposals to pre-approve. The enumerated categories are not intended as an exclusive list of audit, audit-related or tax services, which the Committee (or the Committee Chair) would consider for pre-approval.
Audit Services
The following categories of audit services are considered to be consistent with the role of the Fund’s independent accountants:
| | Ø | Annual Fund financial statement audits |
| | Ø | Seed audits (related to new product filings, as required) |
| | Ø | SEC and regulatory filings and consents |
Audit-related Services
The following categories of audit-related services are considered to be consistent with the role of the Fund’s independent accountants:
| | Ø | Accounting consultations |
| | Ø | Fund merger support services |
| | Ø | Agreed Upon Procedure Reports |
| | Ø | Other Internal Control Reports |
Individual audit-related services that fall within one of these categories (except for fund merger support services) and are not presented to the Audit Committee as part of the annual pre-approval process are subject to an authorized pre-approval by the Audit Committee so long as the estimated fee for those services does not exceed $30,000. Any services provided under such pre-approval will be reported to the Audit Committee at its next regular meeting. Should the amount of such services exceed $30,000, any additional fees will be subject to pre-approval by the Committee Chair (or any other Committee member on whom this responsibility has been delegated). Fees related to fund merger support services are subject to a separate authorized pre-approval by the Audit Committee with fees determined on a per occurrence and merger complexity basis.
Tax Services
The following categories of tax services are considered to be consistent with the role of the Fund’s independent accountants:
| | Ø | Tax compliance services related to the filing or amendment of the following: |
| | | ∎ Federal, state and local income tax compliance; and, |
| | | ∎ Sales and use tax compliance |
| | Ø | Timely RIC qualification reviews |
| | Ø | Tax distribution analysis and planning |
| | Ø | Tax authority examination services |
| | Ø | Tax appeals support services |
| | Ø | Accounting methods studies |
| | Ø | Fund merger support services |
| | Ø | Tax consulting services and related projects |
Individual tax services that fall within one of these categories and are not presented to the Audit Committee as part of the annual pre-approval process are subject to an authorized pre-approval by the Audit Committee so long as the estimated fee for those services does not exceed $30,000. Any services provided under such pre-approval will be reported to the Audit Committee at its next regular meeting. Should the amount of such services exceed $30,000, any additional fees will be subject to pre-approval by the Committee Chair (or any other Committee member on whom this responsibility has been delegated).
Other Non-audit Services
Certain non-audit services that the independent accountants are legally permitted to render will be subject to pre-approval by the Committee or by one or more Committee members to whom the Committee has delegated this authority and who will report to the full Committee any pre-approval decisions made pursuant to this Policy. Non-audit services presented for pre-approval pursuant to this paragraph will be accompanied by a confirmation from both the Treasurer and the independent accountants that the proposed services will not adversely affect the independence of the independent accountants.
Proscribed Services
The Fund’s independent accountants will not render services in the following categories of non-audit services:
| | Ø | Bookkeeping or other services related to the accounting records or financial statements of the Fund |
| | Ø | Financial information systems design and implementation |
| | Ø | Appraisal or valuation services, fairness opinions, or contribution-in-kind reports |
| | Ø | Internal audit outsourcing services |
| | Ø | Management functions or human resources |
| | Ø | Broker or dealer, investment adviser, or investment banking services |
| | Ø | Legal services and expert services unrelated to the audit |
| | Ø | Any other service that the Public Company Accounting Oversight Board determines, by regulation, is impermissible. |
Pre-approval of Non-Audit Services Provided to Other Entities Within the Prudential Fund Complex
Certain non-audit services provided to Prudential Investments LLC or any of its affiliates that also provide ongoing services to the Prudential Mutual Funds will be subject to pre-approval by the Audit Committee. The only non-audit services provided to these entities that will require pre-approval are those related directly to the operations and financial reporting of the Funds. Individual projects that are not presented to the Audit Committee as part of the annual pre-approval process will be subject to pre-approval by the Committee Chair (or any other Committee
member on whom this responsibility has been delegated) so long as the estimated fee for those services does not exceed $30,000. Services presented for pre-approval pursuant to this paragraph will be accompanied by a confirmation from both the Treasurer and the independent accountants that the proposed services will not adversely affect the independence of the independent accountants.
Although the Audit Committee will not pre-approve all services provided to Prudential Investments LLC and its affiliates, the Committee will receive an annual report from the Fund’s independent accounting firm showing the aggregate fees for all services provided to Prudential Investments and its affiliates.
(e) (2) Percentage of services referred to in 4(b) – 4(d) that were approved by the audit committee –
For the fiscal years ended October 31, 2016 and October 31, 2015: none.
(f) Percentage of hours expended attributable to work performed by other than full time employees of principal accountant if greater than 50%.
The percentage of hours expended on the principal accountant’s engagement to audit the registrant’s financial statements for the most recent fiscal year that were attributed to work performed by persons other than the principal accountant’s full-time, permanent employees was 0%.
(g) Non-Audit Fees
The aggregate non-audit fees billed by KPMG for services rendered to the registrant’s investment adviser and any entity controlling, controlled by, or under common control with the investment adviser that provides ongoing services to the registrant for the fiscal years ended October 31, 2016 and October 31, 2015 were $0 and $0, respectively.
(h) Principal Accountant’s Independence
Not applicable as KPMG has not provided non-audit services to the registrant’s investment adviser and any entity controlling, controlled by, or under common control with the investment adviser that provides ongoing services to the registrant that were not pre-approved pursuant to Rule 2-01(c)(7)(ii) of Regulation S-X.
| | |
Item 5 – | | Audit Committee of Listed Registrants – Not applicable. |
| |
Item 6 – | | Schedule of Investments – The schedule is included as part of the report to shareholders filed under Item 1 of this Form. |
| |
Item 7 – | | Disclosure of Proxy Voting Policies and Procedures for Closed-End Management Investment Companies – Not applicable. |
| |
Item 8 – | | Portfolio Managers of Closed-End Management Investment Companies – Not applicable. |
| |
Item 9 – | | Purchases of Equity Securities by Closed-End Management Investment Company and Affiliated Purchasers – Not applicable. |
Item 10 – Submission of Matters to a Vote of Security Holders – Not applicable.
Item 11 – Controls and Procedures
| | (a) | It is the conclusion of the registrant’s principal executive officer and principal financial officer that the effectiveness of the registrant’s current disclosure controls and procedures (such disclosure controls and procedures having been evaluated within 90 days of the date of this filing) provide reasonable assurance that the information required to be disclosed by the registrant has been recorded, processed, summarized and reported within the time period specified in the Commission’s rules and forms and that the information required to be disclosed by the registrant has been accumulated and communicated to the registrant’s principal executive officer and principal financial officer in order to allow timely decisions regarding required disclosure. |
| | (b) | There has been no significant change in the registrant’s internal control over financial reporting that occurred during the registrant’s most recent fiscal quarter of the period covered by this report that has materially affected, or is likely to materially affect, the registrant’s internal control over financial reporting. |
Item 12 – Exhibits
| | (a) | (1) Code of Ethics – Attached hereto as Exhibit EX-99.CODE-ETH |
| | (2) | Certifications pursuant to Section 302 of the Sarbanes-Oxley Act – Attached hereto as Exhibit EX-99.CERT. |
| | (3) | Any written solicitation to purchase securities under Rule 23c-1. – Not applicable. |
| | (b) | Certifications pursuant to Section 906 of the Sarbanes-Oxley Act – Attached hereto as Exhibit EX-99.906CERT. |
SIGNATURES
Pursuant to the requirements of the Securities Exchange Act of 1934 and the Investment Company Act of 1940, the registrant has duly caused this report to be signed on its behalf by the undersigned, thereunto duly authorized.
| | |
Registrant: | | Prudential World Fund, Inc. |
| |
By: | | /s/ Deborah A. Docs |
| | Deborah A. Docs |
| | Secretary |
| |
Date: | | December 20, 2016 |
Pursuant to the requirements of the Securities Exchange Act of 1934 and the Investment Company Act of 1940, this report has been signed below by the following persons on behalf of the registrant and in the capacities and on the dates indicated.
| | |
By: | | /s/ Stuart S. Parker |
| | Stuart S. Parker |
| | President and Principal Executive Officer |
| |
Date: | | December 20, 2016 |
| |
By: | | /s/ M. Sadiq Peshimam |
| | M. Sadiq Peshimam |
| | Treasurer and Principal Financial and Accounting Officer |
| |
Date: | | December 20, 2016 |