UNITED STATES
SECURITIES AND EXCHANGE COMMISSION
Washington, D.C. 20549
FORMN-CSR
CERTIFIED SHAREHOLDER REPORT OF REGISTERED MANAGEMENT INVESTMENT
COMPANIES
| | |
| Investment Company Act file number: | | 811-03981 |
| |
| Exact name of registrant as specified in charter: | | Prudential World Fund, Inc. |
| |
| Address of principal executive offices: | | 655 Broad Street, 17th Floor |
| | | Newark, New Jersey 07102 |
| |
| Name and address of agent for service: | | Andrew R. French |
| | | 655 Broad Street, 17th Floor |
| | | Newark, New Jersey 07102 |
| |
| Registrant’s telephone number, including area code: | | 800-225-1852 |
| |
| Date of fiscal year end: | | 10/31/2019 |
| |
| Date of reporting period: | | 10/31/2019 |
Item 1 – Reports to Stockholders

PGIM QMA INTERNATIONAL EQUITY FUND
ANNUAL REPORT
OCTOBER 31, 2019
COMING SOON: PAPERLESS SHAREHOLDER REPORTS
Beginning on January 1, 2021, as permitted by regulations adopted by the Securities and Exchange Commission, paper copies of the Fund’s annual and semiannual shareholder reports will no longer be sent by mail, unless you specifically request paper copies of the reports. Instead, the reports will be made available on the Fund’s website (pgiminvestments.com), and you will be notified by mail each time a report is posted and provided with a website link to access the report.
If you already elected to receive shareholder reports electronically, you will not be affected by this change and you need not take any action. You may elect to receive shareholder reports and other communications from the Fund electronically anytime by contacting your financial intermediary (such as a broker-dealer or bank) or, if you are a direct investor, by calling 1-800-225-1852 or by sending an email request to PGIM Investments at shareholderreports@pgim.com.
You may elect to receive all future reports in paper free of charge. If you invest through a financial intermediary, you can contact your financial intermediary or follow instructions included with this notice to elect to continue to receive paper copies of your shareholder reports. If you invest directly with the Fund, you can call 1-800-225-1852 or send an email request to shareholderreports@pgim.com to let the Fund know you wish to continue receiving paper copies of your shareholder reports. Your election to receive reports in paper will apply to all funds held in your account if you invest through your financial intermediary or all funds held with the fund complex if you invest directly with the Fund.

To enroll in e-delivery, go to pgiminvestments.com/edelivery
|
| Objective:Long-term growth of capital |
Highlights(unaudited)
| • | | Quality financial factors were mixed but positive overall during the reporting period and helped soften the challenging environment for value and growth. |
| • | | By market, the Fund’s gains during the period were led by the United Kingdom, driven by stock selection in the consumer discretionary (retailing) and materials (metals & mining) sectors. |
| • | | Valuation-factor performance was challenged and volatile during the reporting period. Although late efficacy helped soften the overall value weakness, generally the most relatively expensive stocks (which the Fund seeks to avoid) were, on average, the best performers. Mixed-but-negative growth returns were also detrimental. |
| • | | Weakness in the financial sector was an overarching theme in the worst-performing markets. Japan led the losses, driven by stock selection in consumer discretionary and the Fund’s favoring of energy and financials. |
This report is not authorized for distribution to prospective investors unless preceded or accompanied by a current prospectus.
The views expressed in this report and information about the Fund’s portfolio holdings are for the period covered by this report and are subject to change thereafter.
Mutual funds are distributed by Prudential Investment Management Services LLC, a Prudential Financial company, member SIPC. QMA is the primary business name of QMA LLC, a wholly owned subsidiary of PGIM, Inc. (PGIM), a Prudential Financial company.© 2019 Prudential Financial, Inc. and its related entities. PGIM and the PGIM logo are service marks of Prudential Financial, Inc. and its related entities, registered in many jurisdictions worldwide.
| | |
| 2 | | Visit our website at pgiminvestments.com |
Table of Contents
| | | | |
| PGIM QMA International Equity Fund | | | 3 | |
This Page Intentionally Left Blank
Letter from the President

Dear Shareholder:
We hope you find the annual report for the PGIM QMA International Equity Fund informative and useful. The report covers performance for the 12-month period that ended October 31, 2019.
While the US economy remained healthy, with rising corporate profits and strong job growth, the Federal Reserve cut interest rates three times in the latter half of the period. The cuts were a proactive attempt by the Fed to extend the longest domestic economic expansion on record as growth in many regions weakened. China in particular showed signs of slowing amid trade tensions with the US, and turmoil in the United Kingdom continued as it negotiates an exit from the European Union.
The interest-rate cuts helped boost the performance of stocks globally. For the period overall, large-cap US equities along with stocks in developed and emerging foreign markets all rose by double digits. Small-cap US stocks posted a single-digit gain. This positive performance came despite significant volatility early in the period. Equities plunged at the end of 2018 on concerns about China’s economy, a potential global trade war, higher interest rates, and worries that profit growth might slow. Stocks reversed course early in 2019, rising sharply after the Fed moderated its position on additional rate hikes for the remainder of the year.
The overall US bond market posted strong returns during the period on a significant rally in interest rates that saw the 10-year US Treasury yield decline from over 3% to under 2%. Investment-grade corporate bonds led the way with a double-digit gain, while corporate high yield and municipal bonds each had a return in the high single digits. Globally, bonds in developed markets delivered strong returns, and emerging markets debt rose by double digits.
Regarding your investments with PGIM, we believe it is important to maintain a diversified portfolio of funds consistent with your tolerance for risk, time horizon, and financial goals. Your financial advisor can help you create a diversified investment plan that may include funds covering all the basic asset classes and that reflects your personal investor profile and risk tolerance. However, diversification and asset allocation strategies do not assure a profit or protect against loss in declining markets.
At PGIM Investments, we consider it a great privilege and responsibility to help investors participate in opportunities across global markets while meeting their toughest investment challenges. PGIM is a top-10 global investment manager with more than $1 trillion in assets under management. This scale and investment expertise allow us to deliver actively managed funds and strategies to meet the needs of investors around the globe.
Thank you for choosing our family of funds.
Sincerely,

Stuart S. Parker, President
PGIM QMA International Equity Fund
December 16, 2019
| | | | |
| PGIM QMA International Equity Fund | | | 5 | |
Your Fund’s Performance(unaudited)
Performance data quoted represents past performance. Past performance does not guarantee future results. The investment return and principal value of an investment will fluctuate, so that an investor’s shares, when redeemed, may be worth more or less than their original cost. Current performance may be lower or higher than the past performance data quoted. An investor may obtain performance data as of the most recent month-end by visiting our website atpgiminvestments.com or by calling (800) 225-1852.
| | | | | | | | | | | | | | |
| |
| | | Average Annual Total Returns as of 10/31/19 (with sales charges) | |
| | | One Year (%) | | Five Years (%) | | | Ten Years (%) | | | Since Inception (%) | |
| Class A | | 0.67 | | | 0.62 | | | | 3.77 | | | | — | |
| Class B | | 0.55 | | | 0.71 | | | | 3.55 | | | | — | |
| Class C | | 4.77 | | | 1.03 | | | | 3.62 | | | | — | |
| Class Z | | 7.05 | | | 2.11 | | | | 4.68 | | | | — | |
| Class R6 | | 7.33 | | | N/A | | | | N/A | | | | 7.34 (12/28/16) | |
| MSCI All Country WorldEx-US Index | |
| | | 11.27 | | | 3.82 | | | | 4.94 | | | | — | |
| | | | | | | | | | | | | | |
| |
| | | Average Annual Total Returns as of 10/31/19 (without sales charges) | |
| | | One Year (%) | | Five Years (%) | | | Ten Years (%) | | | Since Inception (%) | |
| Class A | | 6.53 | | | 1.76 | | | | 4.36 | | | | — | |
| Class B | | 5.55 | | | 0.90 | | | | 3.55 | | | | — | |
| Class C | | 5.77 | | | 1.03 | | | | 3.62 | | | | — | |
| Class Z | | 7.05 | | | 2.11 | | | | 4.68 | | | | — | |
| Class R6 | | 7.33 | | | N/A | | | | N/A | | | | 7.34 (12/28/16) | |
| MSCI All Country WorldEx-US Index | |
| | | 11.27 | | | 3.82 | | | | 4.94 | | | | — | |
| | |
| 6 | | Visit our website at pgiminvestments.com |
Growth of a $10,000 Investment(unaudited)
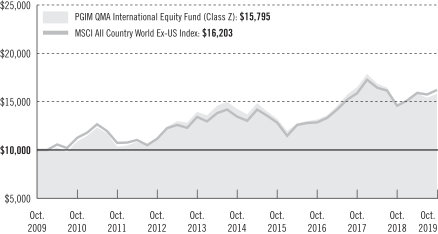
The graph compares a $10,000 investment in the Fund’s Class Z shares with a similar investment in the MSCI All Country World Ex-US Index by portraying the initial account values at the beginning of the 10-year period for Class Z shares (October 31, 2009) and the account values at the end of the current fiscal year (October 31, 2019) as measured on a quarterly basis. For purposes of the graph, and unless otherwise indicated, it has been assumed that (a) all recurring fees (including management fees) were deducted; and (b) all dividends and distributions were reinvested. The line graph provides information for Class Z shares only. As indicated in the tables provided earlier, performance for other share classes will vary due to the differing charges and expenses applicable to each share class (as indicated in the following paragraphs). Without waiver of fees and/or expense reimbursements, if any, the Fund’s returns would have been lower.
Past performance does not predict future performance. Total returns and the ending account values in the graph include changes in share price and reinvestment of dividends and capital gains distributions in a hypothetical investment for the periods shown. The Fund’s total returns do not reflect the deduction of income taxes on an individual’s investment. Taxes may reduce your actual investment returns on income or gains paid by the Fund or any gains you may realize if you sell your shares.
Source: PGIM Investments LLC and Lipper Inc.
Since Inception returns are provided for any share class with less than 10 fiscal years of returns. Since Inception returns for the Index are measured from the closest month-end to the class’ inception date.
| | | | |
| PGIM QMA International Equity Fund | | | 7 | |
Your Fund’s Performance(continued)
The returns in the tables do not reflect the deduction of taxes that a shareholder would pay on Fund distributions or following the redemption of Fund shares. The average annual total returns take into account applicable sales charges, which are described for each share class in the table below.
| | | | | | | | | | |
| | | | | | |
| | | Class A | | Class B* | | Class C | | Class Z | | Class R6 |
| Maximum initial sales charge | | 5.50% of the public offering price | | None | | None | | None | | None |
Contingent deferred sales charge (CDSC) (as a percentage of the lower of the original purchase
price or the net asset value at redemption) | | 1.00% on sales of $1 million or more made within 12 months of purchase | | 5.00% (Yr.1) 4.00% (Yr.2) 3.00% (Yr.3) 2.00% (Yr.4) 1.00% (Yr.5) 1.00% (Yr.6) 0.00% (Yr.7) | | 1.00% on sales made within 12 months of purchase | | None | | None |
Annual distribution and service (12b-1) fees
(shown as a percentage of average daily net assets) | | 0.30% | | 1.00% | | 1.00% | | None | | None |
*Class B shares are closed to all purchase activity and no additional Class B shares may be purchased or acquired except by exchange from Class B shares of another Fund or through dividend or capital gains reinvestment.
Benchmark Definitions
MSCI All Country World Ex-US Index—The Morgan Stanley Capital International All Country World ex-US Index (MSCI ACWI ex-US Index) is an unmanaged free float-adjusted market-capitalization-weighted index that is designed to measure the equity market performance of developed and emerging markets, excluding the US. The average annual total return for the Index measured from the month-end closest to the inception date of the Fund’s Class R6 shares is 8.50%.
Investors cannot invest directly in an index or average. The returns for the Index would be lower if they included the effects of sales charges, operating expenses of a mutual fund, or taxes.
| | |
| 8 | | Visit our website at pgiminvestments.com |
Presentation of Fund Holdingsas of 10/31/19
| | | | | | |
| | | |
| Ten Largest Holdings | | Line of Business | | Country | | % of Net Assets |
| Roche Holding AG | | Pharmaceuticals | | Switzerland | | 1.7% |
| Nestle SA | | Packaged Foods & Meats | | Switzerland | | 1.6% |
| Novartis AG | | Pharmaceuticals | | Switzerland | | 1.5% |
| LVMH Moet Hennessy Louis Vuitton SE | | Apparel, Accessories & Luxury Goods | | France | | 1.2% |
| Allianz SE | | Multi-line Insurance | | Germany | | 1.2% |
| Alibaba Group Holding Ltd. | | Internet & Direct Marketing Retail | | China | | 1.1% |
| Airbus SE | | Aerospace & Defense | | France | | 1.1% |
| Sony Corp. | | Consumer Electronics | | Japan | | 1.0% |
| British American Tobacco PLC | | Tobacco | | United Kingdom | | 1.0% |
| Enel SpA | | Electric Utilities | | Italy | | 1.0% |
For a complete list of holdings, please refer to the Schedule of Investments section of this report. Holdings reflect only long-term Investments.
| | | | |
| PGIM QMA International Equity Fund | | | 9 | |
Strategy and Performance Overview(unaudited)
How did the Fund perform?
ThePGIM QMA International Equity Fund’s Class Z shares returned 7.05% in the 12-month reporting period that ended October 31, 2019, underperforming the 11.27% return of the MSCI All Country World Ex-US (MSCI ACWI Ex-US) Index (the Index).
What were the market conditions?
| • | | Global economic growth continued to be weak during the period, buffeted by the powerful crosscurrents of the US-China trade war and global monetary easing. |
| • | | The trade standoff took a toll on business confidence, industrial production, and trade flows. It weighed heavily on global manufacturing, hitting export-oriented economies—including China, Europe, and Japan—the hardest. |
| • | | Fortunately, weakness in manufacturing did not drag down the services sector, which remained resilient. The trade war also has had less of an impact on more domestic-oriented economies like the US. As a result, there has been a pronounced divergence in growth among sectors and regions within the global economy. |
| • | | Given the weak growth backdrop and elevated geopolitical risks, global central banks embarked on a fresh round of monetary easing during the period, aiming to stimulate growth and counter the negative effects of the trade war. |
| • | | However, with interest rates already at, near, or below zero in many countries, the power of monetary policy may have been muted. Thus, the focus shifted to using fiscal policy as a means of stimulating growth, especially in Europe. |
| • | | Powered by a healthy consumer, US economic growth remained resilient while eurozone growth was anemic, with Germany and Italy teetering on the edge of recession. Uncertainty over Brexit—the United Kingdom’s ongoing effort to exit the European Union—finally caught up with the UK economy, which contracted in the second quarter of 2019. Japanese growth was decent, but risks were tilted to the downside given weak global growth, yen appreciation, and a pending consumer tax hike. |
| • | | Emerging market growth remained hostage to trade tensions, especially for such export-dependent economies as China, Taiwan, and Korea. Although the economies of emerging market countries such as India and Brazil are less levered to the global export cycle, they also succumbed to a slowdown in growth amid weaker consumer spending and slow progress on much-needed reforms. |
| • | | Uncertainty surrounding a shifting global paradigm and its implications for global growth made for a challenging and volatile environment. |
| | |
| 10 | | Visit our website at pgiminvestments.com |
What worked?
| • | | Quality financial factors were mixed but positive overall during the reporting period and helped soften the challenging environment for value and growth. We rank stocks based on relative value, growth and financial health. |
| • | | By market, the Fund’s gains during the period were led by the United Kingdom, driven by stock selection in the consumer discretionary (retailing) and materials (metals & mining) sectors. An overweight in Italian utilities stocks, which rose 59%, and broadly effective securities selection in Germany furthered gains. |
| • | | From a sector perspective, top contributors included utilities (driven by overweights to Italy and Brazil) and health care (driven by stock selection in Japan and an overweight to Switzerland). |
What didn’t work?
| • | | Valuation-factor performance was challenged and volatile during the reporting period. Although late efficacy helped soften the overall value weakness, generally the most expensive stocks (which the Fund seeks to avoid) were, on average, the best performers. Mixed-but-negative growth returns were also detrimental. |
| • | | Weakness in the financial sector was an overarching theme in the worst-performing markets. Japan led the losses, driven by stock selection in consumer discretionary and the Fund’s favoring of energy and financials, which declined 26% and 5%, respectively, during the period. In the Netherlands, value loss from the Fund’s stock selection/overweight in financials, which was down 6%, was worsened by stock selection/underweight in information technology, which rose 51%. South Korea’s underperformance was led by overweights in financials and materials, which fell 11% and 13%, respectively. |
| • | | From a sector standpoint, broadly distributed losses were led by difficult stock selection in financials (South Korea, the Netherlands, and Hong Kong), information technology (the Netherlands, China, and South Korea), and materials (metals & mining—particularly an overweight in stocks of steel companies, which dropped 17%, and an underweight in gold companies, which rose 59%). |
Did the Fund use derivatives?
| • | | The Fund did not hold futures for the period. However, futures holdings are allowed. Futures positions are fully collateralized and used for the ease of cash management. |
Current outlook
| • | | Escalating geopolitical risks and increased monetary easing have elevated both the upside and downside risks for the global economy. As such, it is currently very difficult to determine which force will gain the upper hand. |
| | | | |
| PGIM QMA International Equity Fund | | | 11 | |
Strategy and Performance Overview(continued)
| • | | The greatest threat to the global economy is an escalation of the US-China trade war, which likely would lead to an even deeper downturn in global manufacturing. In turn, this could progressively weaken the healthier components of the global economy, namely the services sector and US consumer spending. |
| • | | A more constructive scenario for risky assets would involve a tamping down of these geopolitical risks and any sign that monetary stimulus has reaccelerated global growth. |
| • | | Given this backdrop, there is potential for significant market swings between now and year-end. |
| | |
| 12 | | Visit our website at pgiminvestments.com |
Fees and Expenses(unaudited)
As a shareholder of the Fund, you incur two types of costs: (1) transaction costs, including sales charges (loads) on purchase payments and redemptions, as applicable, and (2) ongoing costs, including management fees, distribution, and/or service (12b-1) fees, and other Fund expenses, as applicable. This example is intended to help you understand your ongoing costs (in dollars) of investing in the Fund and to compare these costs with the ongoing costs of investing in other mutual funds.
The example is based on an investment of $1,000 held through the six-month period ended October 31, 2019. The example is for illustrative purposes only; you should consult the Prospectus for information on initial and subsequent minimum investment requirements.
Actual Expenses
The first line for each share class in the table on the following page provides information about actual account values and actual expenses. You may use the information on this line, together with the amount you invested, to estimate the expenses that you paid over the period. Simply divide your account value by $1,000 (for example, an $8,600 account value ÷ $1,000 = 8.6), then multiply the result by the number on the first line under the heading “Expenses Paid During the Six-Month Period” to estimate the expenses you paid on your account during this period.
Hypothetical Example for Comparison Purposes
The second line for each share class in the table on the following page provides information about hypothetical account values and hypothetical expenses based on the Fund’s actual expense ratio and an assumed rate of return of 5% per year before expenses, which is not the Fund’s actual return. The hypothetical account values and expenses may not be used to estimate the actual ending account balance or expenses you paid for the period. You may use this information to compare the ongoing costs of investing in the Fund and other funds. To do so, compare this 5% hypothetical example with the 5% hypothetical examples that appear in the shareholder reports of the other funds.
The Fund’s transfer agent may charge additional fees to holders of certain accounts that are not included in the expenses shown in the table on the following page. These fees apply to individual retirement accounts (IRAs) and Section 403(b) accounts. As of the close of the six-month period covered by the table, IRA fees included an annual maintenance fee of $15 per account (subject to a maximum annual maintenance fee of $25 for all accounts held by the same shareholder). Section 403(b) accounts are charged an annual $25 fiduciary maintenance fee. Some of the fees may vary in amount, or may be waived, based on your total account balance or the number of PGIM funds, including the Fund, that you own. You should consider the additional fees that were charged to your Fund account over the six-month period when you estimate the total ongoing expenses paid over the
| | | | |
| PGIM QMA International Equity Fund | | | 13 | |
Fees and Expenses(continued)
period and the impact of these fees on your ending account value, as these additional expenses are not reflected in the information provided in the expense table. Additional fees have the effect of reducing investment returns.
Please note that the expenses shown in the table are meant to highlight your ongoing costs only and do not reflect any transactional costs such as sales charges (loads). Therefore, the second line for each share class in the table is useful in comparing ongoing costs only and will not help you determine the relative total costs of owning different funds. In addition, if these transactional costs were included, your costs would have been higher.
| | | | | | | | | | | | | | | | | | |
| | | | |
PGIM QMA
International
Equity Fund | | Beginning Account
Value
May 1, 2019 | | | Ending Account
Value
October 31, 2019 | | | Annualized
Expense Ratio
Based on the
Six-Month Period | | | Expenses Paid
During the
Six-Month Period* | |
| Class A | | Actual | | $ | 1,000.00 | | | $ | 994.50 | | | | 1.55 | % | | $ | 7.79 | |
| | Hypothetical | | $ | 1,000.00 | | | $ | 1,017.39 | | | | 1.55 | % | | $ | 7.88 | |
| Class B | | Actual | | $ | 1,000.00 | | | $ | 989.90 | | | | 2.54 | % | | $ | 12.74 | |
| | Hypothetical | | $ | 1,000.00 | | | $ | 1,012.40 | | | | 2.54 | % | | $ | 12.88 | |
| Class C | | Actual | | $ | 1,000.00 | | | $ | 992.80 | | | | 2.23 | % | | $ | 11.20 | |
| | Hypothetical | | $ | 1,000.00 | | | $ | 1,013.96 | | | | 2.23 | % | | $ | 11.32 | |
| Class Z | | Actual | | $ | 1,000.00 | | | $ | 997.30 | | | | 0.99 | % | | $ | 4.98 | |
| | Hypothetical | | $ | 1,000.00 | | | $ | 1,020.21 | | | | 0.99 | % | | $ | 5.04 | |
| Class R6 | | Actual | | $ | 1,000.00 | | | $ | 998.60 | | | | 0.78 | % | | $ | 3.93 | |
| | | Hypothetical | | $ | 1,000.00 | | | $ | 1,021.27 | | | | 0.78 | % | | $ | 3.97 | |
*Fund expenses (net of fee waivers or subsidies, if any) for each share class are equal to the annualized expense ratio for each share class (provided in the table), multiplied by the average account value over the period, multiplied by the 184 days in the six-month period ended October 31, 2019, and divided by the 365 days in the Fund’s fiscal year ended October 31, 2019 (to reflect the six-month period). Expenses presented in the table include the expenses of any underlying portfolios in which the Fund may invest.
| | |
| 14 | | Visit our website at pgiminvestments.com |
Schedule of Investments
as of October 31, 2019
| | | | | | | | |
| Description | | Shares | | | Value | |
LONG-TERM INVESTMENTS 99.5% | | | | | | | | |
| | |
COMMON STOCKS 96.8% | | | | | | | | |
| | |
Argentina 0.1% | | | | | | | | |
YPF SA, ADR(a) | | | 31,700 | | | $ | 296,712 | |
| | |
Australia 4.9% | | | | | | | | |
AGL Energy Ltd. | | | 47,980 | | | | 653,003 | |
Aristocrat Leisure Ltd. | | | 5,432 | | | | 117,696 | |
ASX Ltd. | | | 1,758 | | | | 99,356 | |
BHP Group Ltd. | | | 27,830 | | | | 684,974 | |
BHP Group PLC | | | 13,894 | | | | 294,493 | |
Coronado Global Resources, Inc., CDI, 144A | | | 209,694 | | | | 345,709 | |
CSL Ltd. | | | 1,883 | | | | 331,429 | |
Fortescue Metals Group Ltd. | | | 12,855 | | | | 78,450 | |
Goodman Group, REIT | | | 141,091 | | | | 1,399,817 | |
Magellan Financial Group Ltd. | | | 28,585 | | | | 942,702 | |
Rio Tinto Ltd. | | | 3,508 | | | | 217,929 | |
Rio Tinto PLC | | | 32,995 | | | | 1,717,824 | |
Santos Ltd. | | | 258,095 | | | | 1,438,792 | |
Woolworths Group Ltd. | | | 49,299 | | | | 1,266,641 | |
| | | | | | | | |
| | | | | | | 9,588,815 | |
| | |
Austria 0.8% | | | | | | | | |
BAWAG Group AG, 144A* | | | 16,295 | | | | 674,136 | |
Telekom Austria AG* | | | 28,429 | | | | 219,951 | |
Wienerberger AG | | | 23,821 | | | | 644,182 | |
| | | | | | | | |
| | | | | | | 1,538,269 | |
| | |
Brazil 1.9% | | | | | | | | |
B3 SA - Brasil Bolsa Balcao | | | 22,400 | | | | 270,386 | |
Banco Bradesco SA | | | 14,760 | | | | 121,083 | |
Banco do Brasil SA | | | 97,400 | | | | 1,165,983 | |
Banco Santander Brasil SA, UTS | | | 115,500 | | | | 1,365,668 | |
Cia de Saneamento do Parana, UTS | | | 5,600 | | | | 127,346 | |
Petroleo Brasileiro SA | | | 33,100 | | | | 269,719 | |
Transmissora Alianca de Energia Eletrica SA, UTS | | | 65,500 | | | | 468,895 | |
| | | | | | | | |
| | | | | | | 3,789,080 | |
| | |
Canada 5.6% | | | | | | | | |
BCE, Inc. | | | 1,600 | | | | 75,900 | |
Canadian Pacific Railway Ltd. | | | 6,000 | | | | 1,364,407 | |
CGI, Inc.* | | | 2,200 | | | | 171,009 | |
Cogeco Communications, Inc. | | | 8,000 | | | | 691,519 | |
See Notes to Financial Statements.
| | | | |
| PGIM QMA International Equity Fund | | | 15 | |
Schedule of Investments(continued)
as of October 31, 2019
| | | | | | | | |
| Description | | Shares | | | Value | |
COMMON STOCKS (Continued) | | | | | | | | |
| | |
Canada (cont’d.) | | | | | | | | |
Cogeco, Inc. | | | 4,900 | | | $ | 379,210 | |
Corus Entertainment, Inc. (Class B Stock) | | | 133,400 | | | | 512,493 | |
Genworth MI Canada, Inc. | | | 3,000 | | | | 121,175 | |
Magna International, Inc. | | | 2,800 | | | | 150,555 | |
Manulife Financial Corp. | | | 91,400 | | | | 1,702,256 | |
Onex Corp. | | | 12,400 | | | | 728,974 | |
Restaurant Brands International, Inc. | | | 2,200 | | | | 143,933 | |
Royal Bank of Canada | | | 1,200 | | | | 96,794 | |
Shopify, Inc. (Class A Stock)* | | | 900 | | | | 282,211 | |
Sun Life Financial, Inc. | | | 34,200 | | | | 1,534,339 | |
Suncor Energy, Inc. | | | 6,300 | | | | 187,312 | |
TC Energy Corp. | | | 26,800 | | | | 1,350,886 | |
Teck Resources Ltd. (Class B Stock) | | | 47,000 | | | | 742,950 | |
TFI International, Inc. | | | 21,700 | | | | 691,481 | |
Thomson Reuters Corp. | | | 1,800 | | | | 120,961 | |
| | | | | | | | |
| | | | | | | 11,048,365 | |
| | |
Chile 0.7% | | | | | | | | |
AES Gener SA | | | 873,417 | | | | 187,262 | |
Enel Americas SA | | | 6,150,754 | | | | 1,148,704 | |
| | | | | | | | |
| | | | | | | 1,335,966 | |
| | |
China 9.0% | �� | | | | | | | |
Alibaba Group Holding Ltd., ADR* | | | 12,500 | | | | 2,208,375 | |
Anhui Conch Cement Co. Ltd. (Class H Stock) | | | 143,000 | | | | 849,398 | |
Asia Cement China Holdings Corp. | | | 217,500 | | | | 263,720 | |
Bank of China Ltd. (Class H Stock) | | | 723,000 | | | | 294,834 | |
Bank of Communications Co. Ltd. (Class H Stock) | | | 112,000 | | | | 76,265 | |
Bank of Jiangsu Co. Ltd. (Class A Stock) | | | 83,400 | | | | 83,485 | |
Bank of Nanjing Co. Ltd. (Class A Stock) | | | 82,300 | | | | 100,517 | |
BOC Hong Kong Holdings Ltd. | | | 52,500 | | | | 179,679 | |
China BlueChemical Ltd. (Class H Stock) | | | 1,214,000 | | | | 295,309 | |
China Coal Energy Co. Ltd. (Class H Stock) | | | 1,167,000 | | | | 465,410 | |
China International Travel Service Corp. Ltd. (Class A Stock) | | | 7,700 | | | | 98,552 | |
China Minsheng Banking Corp. Ltd. (Class H Stock) | | | 1,414,500 | | | | 987,284 | |
China National Building Material Co. Ltd. (Class H Stock) | | | 230,000 | | | | 193,208 | |
China Telecom Corp. Ltd. (Class H Stock) | | | 174,000 | | | | 73,981 | |
CITIC Ltd. | | | 796,000 | | | | 1,041,570 | |
CNOOC Ltd. | | | 883,000 | | | | 1,311,321 | |
Industrial & Commercial Bank of China Ltd. (Class H Stock) | | | 1,638,000 | | | | 1,169,454 | |
JD.com, Inc., ADR* | | | 6,700 | | | | 208,705 | |
JinkoSolar Holding Co. Ltd., ADR*(a) | | | 43,400 | | | | 626,696 | |
Kweichow Moutai Co. Ltd. (Class A Stock) | | | 600 | | | | 100,114 | |
See Notes to Financial Statements.
| | | | | | | | |
| Description | | Shares | | | Value | |
COMMON STOCKS (Continued) | | | | | | | | |
| | |
China (cont’d.) | | | | | | | | |
Luzhou Laojiao Co. Ltd. (Class A Stock) | | | 8,300 | | | $ | 102,402 | |
Ping An Insurance Group Co. of China Ltd. (Class H Stock) | | | 132,500 | | | | 1,526,365 | |
Poly Property Group Co. Ltd. | | | 1,557,000 | | | | 562,062 | |
Sany Heavy Industry Co. Ltd. (Class A Stock) | | | 65,500 | | | | 124,576 | |
Shaanxi Coal Industry Co. Ltd. (Class A Stock) | | | 90,500 | | | | 107,282 | |
Shanghai International Airport Co. Ltd. (Class A Stock) | | | 8,700 | | | | 93,874 | |
Shanghai Pudong Development Bank Co. Ltd. (Class A Stock) | | | 67,200 | | | | 118,969 | |
Shougang Fushan Resources Group Ltd. | | | 878,000 | | | | 180,497 | |
Shui On Land Ltd. | | | 616,000 | | | | 123,944 | |
Sunac China Holdings Ltd. | | | 28,000 | | | | 126,556 | |
Tencent Holdings Ltd. | | | 29,500 | | | | 1,199,543 | |
Weichai Power Co. Ltd. (Class H Stock) | | | 861,000 | | | | 1,346,303 | |
Wens Foodstuffs Group Co. Ltd. (Class A Stock) | | | 19,700 | | | | 112,261 | |
Wuliangye Yibin Co. Ltd. (Class A Stock) | | | 6,600 | | | | 123,264 | |
XCMG Construction Machinery Co. Ltd. (Class A Stock) | | | 151,300 | | | | 96,830 | |
Xiamen C & D Inc. (Class A Stock) | | | 77,300 | | | | 93,050 | |
Yum China Holdings, Inc. | | | 20,000 | | | | 850,000 | |
Yunda Holding Co. Ltd. (Class A Stock) | | | 19,000 | | | | 88,528 | |
Zoomlion Heavy Industry Science & Technology Co. Ltd. (Class A Stock) | | | 119,000 | | | | 98,627 | |
| | | | | | | | |
| | | | | | | 17,702,810 | |
| | |
Denmark 1.0% | | | | | | | | |
Novo Nordisk A/S (Class B Stock) | | | 29,399 | | | | 1,608,152 | |
Scandinavian Tobacco Group A/S, 144A | | | 32,739 | | | | 387,390 | |
| | | | | | | | |
| | | | | | | 1,995,542 | |
| | |
Finland 0.2% | | | | | | | | |
Neste OYJ | | | 10,593 | | | | 382,882 | |
| | |
France 6.5% | | | | | | | | |
Airbus SE | | | 14,717 | | | | 2,107,260 | |
Alstom SA | | | 1,599 | | | | 69,037 | |
Arkema SA | | | 851 | | | | 86,941 | |
BNP Paribas SA | | | 31,157 | | | | 1,628,569 | |
Capgemini SE | | | 1,455 | | | | 163,815 | |
Credit Agricole SA | | | 12,749 | | | | 166,303 | |
Dassault Aviation SA | | | 290 | | | | 403,682 | |
Dassault Systemes SE | | | 1,544 | | | | 234,462 | |
Hermes International | | | 1,639 | | | | 1,179,070 | |
Klepierre SA, REIT | | | 2,413 | | | | 89,835 | |
Legrand SA | | | 2,408 | | | | 187,903 | |
LVMH Moet Hennessy Louis Vuitton SE | | | 5,745 | | | | 2,450,087 | |
See Notes to Financial Statements.
| | | | |
| PGIM QMA International Equity Fund | | | 17 | |
Schedule of Investments(continued)
as of October 31, 2019
| | | | | | | | |
| Description | | Shares | | | Value | |
COMMON STOCKS (Continued) | | | | | | | | |
| | |
France (cont’d.) | | | | | | | | |
Peugeot SA | | | 55,066 | | | $ | 1,389,225 | |
Safran SA | | | 4,506 | | | | 712,318 | |
Sanofi | | | 18,502 | | | | 1,703,630 | |
TOTAL SA | | | 3,502 | | | | 184,233 | |
| | | | | | | | |
| | | | | | | 12,756,370 | |
| | |
Germany 4.4% | | | | | | | | |
adidas AG | | | 4,865 | | | | 1,502,427 | |
Allianz SE | | | 9,393 | | | | 2,294,046 | |
Amadeus Fire AG | | | 1,263 | | | | 160,008 | |
Bayer AG | | | 3,609 | | | | 280,401 | |
CANCOM SE | | | 1,383 | | | | 73,912 | |
Deutsche Pfandbriefbank AG, 144A | | | 53,242 | | | | 728,249 | |
Deutsche Telekom AG | | | 30,613 | | | | 538,233 | |
Fresenius Medical Care AG & Co. KGaA | | | 2,093 | | | | 151,400 | |
Fresenius SE & Co. KGaA | | | 9,478 | | | | 498,266 | |
HeidelbergCement AG | | | 993 | | | | 73,830 | |
Henkel AG & Co. KGaA | | | 1,391 | | | | 133,887 | |
MTU Aero Engines AG | | | 5,172 | | | | 1,381,613 | |
Puma SE | | | 3,092 | | | | 232,842 | |
SAP SE | | | 891 | | | | 117,903 | |
Varta AG* | | | 5,025 | | | | 569,123 | |
| | | | | | | | |
| | | | | | | 8,736,140 | |
| | |
Greece 0.7% | | | | | | | | |
Hellenic Telecommunications Organization SA | | | 69,834 | | | | 1,056,884 | |
Piraeus Bank SA* | | | 106,303 | | | | 370,838 | |
| | | | | | | | |
| | | | | | | 1,427,722 | |
| | |
Hong Kong 1.3% | | | | | | | | |
AIA Group Ltd. | | | 33,600 | | | | 333,483 | |
Henderson Land Development Co. Ltd. | | | 210,000 | | | | 1,047,588 | |
Hongkong Land Holdings Ltd. | | | 17,100 | | | | 93,962 | |
K Wah International Holdings Ltd. | | | 389,000 | | | | 212,371 | |
Shun Tak Holdings Ltd. | | | 1,564,000 | | | | 641,017 | |
Swire Pacific Ltd. (Class A Stock) | | | 17,000 | | | | 161,416 | |
| | | | | | | | |
| | | | | | | 2,489,837 | |
| | |
India 1.3% | | | | | | | | |
Bajaj Finance Ltd. | | | 1,625 | | | | 92,366 | |
Balrampur Chini Mills Ltd. | | | 262,161 | | | | 603,045 | |
See Notes to Financial Statements.
| | | | | | | | |
| Description | | Shares | | | Value | |
COMMON STOCKS (Continued) | | | | | | | | |
| | |
India (cont’d.) | | | | | | | | |
Bata India Ltd. | | | 4,405 | | | $ | 112,261 | |
NTPC Ltd. | | | 39,307 | | | | 67,900 | |
Oil & Natural Gas Corp. Ltd. | | | 530,005 | | | | 1,059,482 | |
Power Grid Corp. of India Ltd. | | | 200,968 | | | | 562,720 | |
| | | | | | | | |
| | | | | | | 2,497,774 | |
| | |
Ireland 0.1% | | | | | | | | |
CRH PLC | | | 7,350 | | | | 267,993 | |
| | |
Israel 0.4% | | | | | | | | |
Bank LeumiLe-Israel BM | | | 13,665 | | | | 99,471 | |
Israel Discount Bank Ltd. (Class A Stock) | | | 117,153 | | | | 535,047 | |
Nice Ltd. | | | 597 | | | | 94,396 | |
| | | | | | | | |
| | | | | | | 728,914 | |
| | |
Italy 1.7% | | | | | | | | |
Buzzi Unicem SpA | | | 3,470 | | | | 83,840 | |
Enel SpA | | | 251,466 | | | | 1,948,933 | |
Ferrari NV | | | 825 | | | | 132,232 | |
Poste Italiane SpA, 144A | | | 93,396 | | | | 1,133,428 | |
Snam SpA | | | 19,642 | | | | 100,791 | |
| | | | | | | | |
| | | | | | | 3,399,224 | |
| | |
Japan 17.4% | | | | | | | | |
77 Bank Ltd. (The) | | | 39,400 | | | | 621,239 | |
Advantest Corp. | | | 1,800 | | | | 80,762 | |
Asahi Group Holdings Ltd. | | | 6,600 | | | | 329,936 | |
Astellas Pharma, Inc. | | | 101,100 | | | | 1,728,634 | |
Bandai Namco Holdings, Inc. | | | 2,300 | | | | 141,007 | |
Central Japan Railway Co. | | | 1,300 | | | | 266,916 | |
Chubu Electric Power Co., Inc. | | | 5,900 | | | | 88,518 | |
Chugai Pharmaceutical Co. Ltd. | | | 2,800 | | | | 236,206 | |
Daiwa House Industry Co. Ltd. | | | 6,400 | | | | 220,490 | |
EDION Corp. | | | 66,700 | | | | 661,970 | |
Eisai Co. Ltd. | | | 2,800 | | | | 202,969 | |
Hikari Tsushin, Inc. | | | 500 | | | | 109,413 | |
Hitachi Ltd. | | | 31,100 | | | | 1,158,671 | |
Hoya Corp. | | | 18,900 | | | | 1,667,951 | |
ITOCHU Corp. | | | 74,900 | | | | 1,565,064 | |
Japan Petroleum Exploration Co. Ltd. | | | 14,600 | | | | 371,969 | |
Japan Post Holdings Co. Ltd. | | | 14,300 | | | | 130,972 | |
Japan Tobacco, Inc. | | | 44,200 | | | | 1,001,883 | |
See Notes to Financial Statements.
| | | | |
| PGIM QMA International Equity Fund | | | 19 | |
Schedule of Investments(continued)
as of October 31, 2019
| | | | | | | | |
| Description | | Shares | | | Value | |
COMMON STOCKS (Continued) | | | | | | | | |
| | |
Japan (cont’d.) | | | | | | | | |
Kansai Electric Power Co., Inc. (The) | | | 8,300 | | | $ | 96,649 | |
KDDI Corp. | | | 56,800 | | | | 1,568,333 | |
Medipal Holdings Corp. | | | 24,400 | | | | 556,836 | |
Mitsubishi Estate Co. Ltd. | | | 60,300 | | | | 1,169,492 | |
Mitsubishi UFJ Financial Group, Inc. | | | 359,800 | | | | 1,876,863 | |
NEC Corp. | | | 2,200 | | | | 87,115 | |
Nippon Building Fund, Inc., REIT | | | 12 | | | | 90,960 | |
Nippon Telegraph & Telephone Corp. | | | 32,684 | | | | 1,619,902 | |
Nishi-Nippon Financial Holdings, Inc. | | | 98,500 | | | | 730,416 | |
Nomura Research Institute Ltd. | | | 51,800 | | | | 1,101,511 | |
NTT DOCOMO, Inc. | | | 44,400 | | | | 1,217,338 | |
Obayashi Corp. | | | 41,400 | | | | 425,650 | |
Obic Co. Ltd. | | | 10,700 | | | | 1,340,011 | |
Oriental Land Co. Ltd. | | | 8,300 | | | | 1,215,817 | |
Otsuka Corp. | | | 26,200 | | | | 1,053,853 | |
Rakuten, Inc. | | | 8,000 | | | | 76,067 | |
Recruit Holdings Co. Ltd. | | | 42,800 | | | | 1,418,558 | |
Resona Holdings, Inc. | | | 18,400 | | | | 80,121 | |
Seibu Holdings, Inc. | | | 4,900 | | | | 86,230 | |
Shimizu Corp. | | | 9,500 | | | | 88,453 | |
Shionogi & Co. Ltd. | | | 10,900 | | | | 655,308 | |
Softbank Corp. | | | 15,300 | | | | 209,658 | |
Sony Corp. | | | 34,000 | | | | 2,065,587 | |
Subaru Corp. | | | 5,600 | | | | 160,590 | |
Sumitomo Mitsui Financial Group, Inc. | | | 39,800 | | | | 1,412,070 | |
Sumitomo Realty & Development Co. Ltd. | | | 3,100 | | | | 112,612 | |
Taisei Corp. | | | 28,500 | | | | 1,124,964 | |
TIS, Inc. | | | 8,500 | | | | 511,916 | |
Tokio Marine Holdings, Inc. | | | 5,900 | | | | 318,068 | |
Tokuyama Corp. | | | 13,300 | | | | 355,921 | |
Tokyo Electron Ltd. | | | 1,500 | | | | 301,448 | |
Torii Pharmaceutical Co. Ltd. | | | 5,200 | | | | 138,682 | |
Toyota Motor Corp. | | | 5,733 | | | | 397,717 | |
West Japan Railway Co. | | | 1,500 | | | | 130,243 | |
| | | | | | | | |
| | | | | | | 34,379,529 | |
| | |
Luxembourg 0.5% | | | | | | | | |
ArcelorMittal | | | 62,645 | | | | 925,694 | |
| | |
Macau 0.0% | | | | | | | | |
Galaxy Entertainment Group Ltd. | | | 402 | | | | 2,753 | |
See Notes to Financial Statements.
| | | | | | | | |
| Description | | Shares | | | Value | |
COMMON STOCKS (Continued) | | | | | | | | |
| | |
Mexico 0.5% | | | | | | | | |
America Movil SAB de CV (Class L Stock) | | | 761,400 | | | $ | 602,819 | |
Grupo Aeroportuario del Sureste SAB de CV (Class B Stock) | | | 4,755 | | | | 77,864 | |
Wal-Mart de Mexico SAB de CV | | | 78,800 | | | | 236,156 | |
| | | | | | | | |
| | | | | | | 916,839 | |
| | |
Netherlands 2.7% | | | | | | | | |
Adyen NV, 144A* | | | 1,113 | | | | 780,920 | |
ASR Nederland NV | | | 16,777 | | | | 614,089 | |
EXOR NV | | | 1,087 | | | | 83,311 | |
Koninklijke Ahold Delhaize NV | | | 62,612 | | | | 1,559,237 | |
NN Group NV | | | 21,422 | | | | 815,673 | |
Royal Dutch Shell PLC (Class A Stock) | | | 39,707 | | | | 1,148,337 | |
Royal Dutch Shell PLC (Class B Stock) | | | 6,509 | | | | 186,977 | |
Wolters Kluwer NV | | | 3,399 | | | | 250,140 | |
| | | | | | | | |
| | | | | | | 5,438,684 | |
| | |
Norway 0.4% | | | | | | | | |
DNB ASA | | | 9,212 | | | | 167,520 | |
Telenor ASA | | | 37,895 | | | | 708,140 | |
| | | | | | | | |
| | | | | | | 875,660 | |
| | |
Pakistan 0.7% | | | | | | | | |
Engro Corp. Ltd. | | | 196,700 | | | | 374,767 | |
Engro Fertilizers Ltd. | | | 484,500 | | | | 222,075 | |
Fauji Fertilizer Co. Ltd. | | | 290,500 | | | | 175,855 | |
Oil & Gas Development Co. Ltd. | | | 703,300 | | | | 583,283 | |
| | | | | | | | |
| | | | | | | 1,355,980 | |
| | |
Peru 0.1% | | | | | | | | |
Credicorp Ltd. | | | 600 | | | | 128,424 | |
| | |
Philippines 0.3% | | | | | | | | |
SM Prime Holdings, Inc. | | | 747,500 | | | | 573,848 | |
| | |
Poland 0.6% | | | | | | | | |
Powszechna Kasa Oszczednosci Bank Polski SA | | | 99,939 | | | | 997,729 | |
Powszechny Zaklad Ubezpieczen SA | | | 28,505 | | | | 275,682 | |
| | | | | | | | |
| | | | | | | 1,273,411 | |
See Notes to Financial Statements.
| | | | |
| PGIM QMA International Equity Fund | | | 21 | |
Schedule of Investments(continued)
as of October 31, 2019
| | | | | | | | |
| Description | | Shares | | | Value | |
COMMON STOCKS (Continued) | | | | | | | | |
| | |
Portugal 0.3% | | | | | | | | |
Sonae SGPS SA | | | 657,492 | | | $ | 663,171 | |
| | |
Qatar 0.1% | | | | | | | | |
Qatar Navigation QSC | | | 93,325 | | | | 166,169 | |
| | |
Russia 1.4% | | | | | | | | |
Gazprom PJSC, ADR | | | 102,260 | | | | 820,282 | |
LUKOIL PJSC, ADR | | | 7,998 | | | | 737,216 | |
MMC Norilsk Nickel PJSC, ADR | | | 5,788 | | | | 160,447 | |
Novatek PJSC, GDR | | | 3,128 | | | | 663,136 | |
Tatneft PJSC, ADR | | | 4,631 | | | | 324,684 | |
| | | | | | | | |
| | | | | | | 2,705,765 | |
| | |
Singapore 1.5% | | | | | | | | |
CapitaLand Mall Trust, REIT | | | 220,300 | | | | 410,728 | |
DBS Group Holdings Ltd. | | | 55,700 | | | | 1,061,690 | |
Singapore Exchange Ltd. | | | 162,200 | | | | 1,065,238 | |
United Overseas Bank Ltd. | | | 17,500 | | | | 344,017 | |
| | | | | | | | |
| | | | | | | 2,881,673 | |
| | |
South Africa 1.6% | | | | | | | | |
Anglo American Platinum Ltd. | | | 13,482 | | | | 1,004,193 | |
Anglo American PLC | | | 60,058 | | | | 1,546,660 | |
Kumba Iron Ore Ltd. | | | 20,568 | | | | 500,576 | |
Telkom SA SOC Ltd. | | | 12,190 | | | | 55,764 | |
| | | | | | | | |
| | | | | | | 3,107,193 | |
| | |
South Korea 3.9% | | | | | | | | |
Daishin Securities Co. Ltd. | | | 35,515 | | | | 378,746 | |
Hana Financial Group, Inc. | | | 39,805 | | | | 1,150,783 | |
Hyundai Mobis Co. Ltd. | | | 5,326 | | | | 1,081,253 | |
Kia Motors Corp. | | | 35,244 | | | | 1,285,276 | |
KT&G Corp. | | | 940 | | | | 80,701 | |
POSCO | | | 4,108 | | | | 742,678 | |
Samsung Electronics Co. Ltd. | | | 32,201 | | | | 1,385,965 | |
Shinhan Financial Group Co. Ltd. | | | 34,923 | | | | 1,272,191 | |
Taekwang Industrial Co. Ltd. | | | 355 | | | | 334,255 | |
| | | | | | | | |
| | | | | | | 7,711,848 | |
See Notes to Financial Statements.
| | | | | | | | |
| Description | | Shares | | | Value | |
COMMON STOCKS (Continued) | | | | | | | | |
| | |
Spain 0.9% | | | | | | | | |
ACS Actividades de Construccion y Servicios SA | | | 18,996 | | | $ | 771,382 | |
Aena SME SA, 144A | | | 5,800 | | | | 1,063,643 | |
| | | | | | | | |
| | | | | | | 1,835,025 | |
| | |
Sweden 2.8% | | | | | | | | |
Atlas Copco AB (Class B Stock) | | | 5,159 | | | | 159,646 | |
Epiroc AB (Class A Stock) | | | 6,817 | | | | 76,582 | |
Essity AB (Class B Stock) | | | 6,953 | | | | 216,797 | |
Evolution Gaming Group AB, 144A | | | 30,968 | | | | 739,944 | |
Hennes & Mauritz AB (Class B Stock) | | | 31,675 | | | | 661,803 | |
Sandvik AB | | | 44,989 | | | | 792,275 | |
Skandinaviska Enskilda Banken AB (Class A Stock) | | | 138,344 | | | | 1,325,386 | |
Volvo AB (Class B Stock) | | | 100,392 | | | | 1,499,088 | |
| | | | | | | | |
| | | | | | | 5,471,521 | |
| | |
Switzerland 5.1% | | | | | | | | |
Landis+Gyr Group AG* | | | 823 | | | | 76,160 | |
Logitech International SA | | | 16,437 | | | | 672,730 | |
Nestle SA | | | 28,620 | | | | 3,054,454 | |
Novartis AG | | | 34,003 | | | | 2,964,206 | |
Roche Holding AG | | | 10,860 | | | | 3,269,043 | |
| | | | | | | | |
| | | | | | | 10,036,593 | |
| | |
Taiwan 3.4% | | | | | | | | |
Accton Technology Corp. | | | 50,000 | | | | 297,797 | |
Chipbond Technology Corp. | | | 331,000 | | | | 653,583 | |
International Games System Co. Ltd. | | | 40,000 | | | | 515,932 | |
MediaTek, Inc. | | | 92,000 | | | | 1,228,887 | |
Radiant Opto-Electronics Corp. | | | 166,000 | | | | 659,326 | |
Realtek Semiconductor Corp. | | | 11,000 | | | | 81,486 | |
Taiwan Semiconductor Manufacturing Co. Ltd. | | | 99,000 | | | | 962,854 | |
Tripod Technology Corp. | | | 177,000 | | | | 685,937 | |
Unimicron Technology Corp. | | | 177,000 | | | | 273,120 | |
Yuanta Financial Holding Co. Ltd. | | | 1,976,000 | | | | 1,233,390 | |
Zhen Ding Technology Holding Ltd. | | | 37,000 | | | | 174,788 | |
| | | | | | | | |
| | | | | | | 6,767,100 | |
| | |
Thailand 1.2% | | | | | | | | |
Advanced Info Service PCL | | | 136,700 | | | | 1,036,398 | |
See Notes to Financial Statements.
| | | | |
| PGIM QMA International Equity Fund | | | 23 | |
Schedule of Investments(continued)
as of October 31, 2019
| | | | | | | | |
| Description | | Shares | | | Value | |
COMMON STOCKS (Continued) | | | | | | | | |
| | |
Thailand (cont’d.) | | | | | | | | |
Com7 PCL (Class F Stock) | | | 771,300 | | | $ | 734,223 | |
Thanachart Capital PCL | | | 382,800 | | | | 672,133 | |
| | | | | | | | |
| | | | | | | 2,442,754 | |
| | |
Turkey 1.1% | | | | | | | | |
Coca-Cola Icecek A/S | | | 98,320 | | | | 538,000 | |
EIS Eczacibasi Ilac ve Sinai ve Finansal Yatirimlar Sanayi ve Ticaret A/S | | | 293,044 | | | | 154,049 | |
Enerjisa Enerji A/S, 144A | | | 416,363 | | | | 450,920 | |
Eregli Demir ve Celik Fabrikalari TAS | | | 610,246 | | | | 699,258 | |
Tekfen Holding A/S | | | 146,785 | | | | 436,041 | |
| | | | | | | | |
| | | | | | | 2,278,268 | |
| | |
United Arab Emirates 0.2% | | | | | | | | |
Aldar Properties PJSC | | | 620,500 | | | | 396,398 | |
| | |
United Kingdom 9.0% | | | | | | | | |
3i Group PLC | | | 106,899 | | | | 1,562,369 | |
Ashtead Group PLC | | | 22,501 | | | | 684,815 | |
AstraZeneca PLC | | | 1,387 | | | | 134,935 | |
Barclays PLC | | | 157,124 | | | | 341,492 | |
Berkeley Group Holdings PLC | | | 1,683 | | | | 96,021 | |
BP PLC | | | 37,856 | | | | 239,873 | |
British American Tobacco PLC | | | 56,377 | | | | 1,975,601 | |
Burberry Group PLC | | | 3,335 | | | | 88,402 | |
Coca-Cola European Partners PLC | | | 13,300 | | | | 711,683 | |
Compass Group PLC | | | 48,269 | | | | 1,286,464 | |
Diageo PLC | | | 29,378 | | | | 1,200,274 | |
Dialog Semiconductor PLC* | | | 14,019 | | | | 628,455 | |
Fiat Chrysler Automobiles NV | | | 16,743 | | | | 257,818 | |
GlaxoSmithKline PLC | | | 46,577 | | | | 1,064,952 | |
Halma PLC | | | 3,545 | | | | 86,093 | |
HSBC Holdings PLC | | | 62,434 | | | | 471,648 | |
Imperial Brands PLC | | | 49,831 | | | | 1,093,296 | |
J Sainsbury PLC | | | 113,562 | | | | 299,371 | |
JD Sports Fashion PLC | | | 66,953 | | | | 667,719 | |
Legal & General Group PLC | | | 438,760 | | | | 1,500,207 | |
Mitchells & Butlers PLC* | | | 49,461 | | | | 273,614 | |
RELX PLC | | | 18,325 | | | | 440,455 | |
Tesco PLC | | | 91,806 | | | | 279,736 | |
See Notes to Financial Statements.
| | | | | | | | |
| Description | | Shares | | | Value | |
COMMON STOCKS (Continued) | | | | | | | | |
| | |
United Kingdom (cont’d.) | | | | | | | | |
Unilever NV | | | 29,902 | | | $ | 1,769,382 | |
Unilever PLC | | | 10,499 | | | | 629,130 | |
| | | | | | | | |
| | | | | | | 17,783,805 | |
| | |
United States 0.5% | | | | | | | | |
CyberArk Software Ltd.* | | | 9,400 | | | | 954,852 | |
| | | | | | | | |
TOTAL COMMON STOCKS
(cost $169,373,946) | | | | | | | 191,055,372 | |
| | | | | | | | |
| | |
EXCHANGE-TRADED FUNDS 1.3% | | | | | | | | |
| | |
United States | | | | | | | | |
iShares MSCI EAFE ETF | | | 22,900 | | | | 1,543,918 | |
iShares MSCI Emerging Markets ETF | | | 12,000 | | | | 510,960 | |
iShares MSCI Saudi Arabia ETF(a) | | | 19,300 | | | | 556,226 | |
| | | | | | | | |
TOTAL EXCHANGE-TRADED FUNDS
(cost $2,505,794) | | | | | | | 2,611,104 | |
| | | | | | | | |
| | |
PREFERRED STOCKS 1.4% | | | | | | | | |
| | |
Brazil 1.2% | | | | | | | | |
Banco do Estado do Rio Grande do Sul SA (PRFC) (Class B Stock) | | | 93,400 | | | | 521,671 | |
Cia de Saneamento do Parana (PRFC) | | | 76,600 | | | | 347,617 | |
Itausa - Investimentos Itau SA (PRFC) | | | 41,400 | | | | 141,424 | |
Petroleo Brasileiro SA (PRFC) | | | 184,700 | | | | 1,399,124 | |
| | | | | | | | |
| | | | | | | 2,409,836 | |
| | |
Germany 0.1% | | | | | | | | |
Sartorius AG (PRFC) | | | 387 | | | | 75,138 | |
| | |
South Korea 0.1% | | | | | | | | |
Samsung Electronics Co. Ltd. (PRFC) | | | 7,630 | | | | 267,480 | |
| | | | | | | | |
TOTAL PREFERRED STOCKS
(cost $1,996,613) | | | | | | | 2,752,454 | |
| | | | | | | | |
TOTAL LONG-TERM INVESTMENTS
(cost $173,876,353) | | | | | | | 196,418,930 | |
| | | | | | | | |
See Notes to Financial Statements.
| | | | |
| PGIM QMA International Equity Fund | | | 25 | |
Schedule of Investments(continued)
as of October 31, 2019
| | | | | | | | |
| Description | | Shares | | | Value | |
SHORT-TERM INVESTMENTS 0.7% | | | | | | | | |
| | |
AFFILIATED MUTUAL FUNDS | | | | | | | | |
PGIM Core Ultra Short Bond Fund(w) | | | 101,823 | | | $ | 101,823 | |
PGIM Institutional Money Market Fund
(cost $1,221,820; includes $1,219,579 of cash collateral for securities on loan)(b)(w) | | | 1,221,744 | | | | 1,221,989 | |
| | | | | | | | |
TOTAL SHORT-TERM INVESTMENTS
(cost $1,323,643) | | | | | | | 1,323,812 | |
| | | | | | | | |
TOTAL INVESTMENTS 100.2%
(cost $175,199,996) | | | | | | | 197,742,742 | |
Liabilities in excess of other assets (0.2)% | | | | | | | (422,666 | ) |
| | | | | | | | |
NET ASSETS 100.0% | | | | | | $ | 197,320,076 | |
| | | | | | | | |
Below is a list of the abbreviation(s) used in the annual report:
144A—Security was purchased pursuant to Rule 144A under the Securities Act of 1933 and, pursuant to the requirements of Rule 144A, may not be resold except to qualified institutional buyers.
ADR—American Depositary Receipt
CDI—Chess Depository Interest
EAFE—Europe, Australasia, Far East
ETF—Exchange-Traded Fund
GDR—Global Depositary Receipt
LIBOR—London Interbank Offered Rate
MSCI—Morgan Stanley Capital International
PJSC—Public Joint-Stock Company
PRFC—Preference Shares
REITs—Real Estate Investment Trust
UTS—Unit Trust Security
| * | Non-income producing security. |
| (a) | All or a portion of security is on loan. The aggregate market value of such securities, including those sold and pending settlement, is $1,179,796; cash collateral of $1,219,579 (included in liabilities) was received with which the Series purchased highly liquid short-term investments. |
| (b) | Represents security purchased with cash collateral received for securities on loan and includes dividend reinvestment. |
| (w) | PGIM Investments LLC, the manager of the Series, also serves as manager of the PGIM Core Ultra Short Bond Fund and PGIM Institutional Money Market Fund. |
Fair Value Measurements:
Various inputs are used in determining the value of the Series’ investments. These inputs are summarized in the three broad levels listed below.
Level 1—unadjusted quoted prices generally in active markets for identical securities.
Level 2—quoted prices for similar securities, interest rates and yield curves, prepayment speeds, foreign currency exchange rates and other observable inputs.
Level 3—unobservable inputs for securities valued in accordance with Board approved fair valuation procedures.
See Notes to Financial Statements.
The following is a summary of the inputs used as of October 31, 2019 in valuing such portfolio securities:
| | | | | | | | | | | | |
| | | Level 1 | | | Level 2 | | | Level 3 | |
Investments in Securities | | | | | | | | | | | | |
Assets | | | | | | | | | | | | |
Common Stocks | | | | | | | | | | | | |
Argentina | | $ | 296,712 | | | $ | — | | | $ | — | |
Australia | | | — | | | | 9,588,815 | | | | — | |
Austria | | | — | | | | 1,538,269 | | | | — | |
Brazil | | | 3,789,080 | | | | — | | | | — | |
Canada | | | 11,048,365 | | | | — | | | | — | |
Chile | | | 1,335,966 | | | | — | | | | — | |
China | | | 3,893,776 | | | | 13,809,034 | | | | — | |
Denmark | | | — | | | | 1,995,542 | | | | — | |
Finland | | | — | | | | 382,882 | | | | — | |
France | | | — | | | | 12,756,370 | | | | — | |
Germany | | | — | | | | 8,736,140 | | | | — | |
Greece | | | — | | | | 1,427,722 | | | | — | |
Hong Kong | | | — | | | | 2,489,837 | | | | — | |
India | | | — | | | | 2,497,774 | | | | — | |
Ireland | | | — | | | | 267,993 | | | | — | |
Israel | | | — | | | | 728,914 | | | | — | |
Italy | | | — | | | | 3,399,224 | | | | — | |
Japan | | | — | | | | 34,379,529 | | | | — | |
Luxembourg | | | — | | | | 925,694 | | | | — | |
Macau | | | — | | | | 2,753 | | | | — | |
Mexico | | | 916,839 | | | | — | | | | — | |
Netherlands | | | — | | | | 5,438,684 | | | | — | |
Norway | | | — | | | | 875,660 | | | | — | |
Pakistan | | | — | | | | 1,355,980 | | | | — | |
Peru | | | 128,424 | | | | — | | | | — | |
Philippines | | | — | | | | 573,848 | | | | — | |
Poland | | | — | | | | 1,273,411 | | | | — | |
Portugal | | | — | | | | 663,171 | | | | — | |
Qatar | | | — | | | | 166,169 | | | | — | |
Russia | | | 663,136 | | | | 2,042,629 | | | | — | |
Singapore | | | — | | | | 2,881,673 | | | | — | |
South Africa | | | — | | | | 3,107,193 | | | | — | |
South Korea | | | — | | | | 7,711,848 | | | | — | |
Spain | | | — | | | | 1,835,025 | | | | — | |
Sweden | | | — | | | | 5,471,521 | | | | — | |
Switzerland | | | — | | | | 10,036,593 | | | | — | |
Taiwan | | | — | | | | 6,767,100 | | | | — | |
Thailand | | | — | | | | 2,442,754 | | | | — | |
Turkey | | | — | | | | 2,278,268 | | | | — | |
United Arab Emirates | | | — | | | | 396,398 | | | | — | |
United Kingdom | | | 711,683 | | | | 17,072,122 | | | | — | |
United States | | | 954,852 | | | | — | | | | — | |
Exchange-Traded Funds | | | | | | | | | | | | |
United States | | | 2,611,104 | | | | — | | | | — | |
See Notes to Financial Statements.
| | | | |
| PGIM QMA International Equity Fund | | | 27 | |
Schedule of Investments(continued)
as of October 31, 2019
| | | | | | | | | | | | |
| | | Level 1 | | | Level 2 | | | Level 3 | |
Investments in Securities (continued) | | | | | | | | | | | | |
Assets (continued) | | | | | | | | | | | | |
Preferred Stocks | | | | | | | | | | | | |
Brazil | | $ | 2,409,836 | | | $ | — | | | $ | — | |
Germany | | | — | | | | 75,138 | | | | — | |
South Korea | | | — | | | | 267,480 | | | | — | |
Affiliated Mutual Funds | | | 1,323,812 | | | | — | | | | — | |
| | | | | | | | | | | | |
Total | | $ | 30,083,585 | | | $ | 167,659,157 | | | $ | — | |
| | | | | | | | | | | | |
Industry Classification:
The industry classification of investments and liabilities in excess of other assets shown as a percentage of net assets as of October 31, 2019 were as follows (unaudited):
| | | | |
Banks | | | 11.5 | % |
Pharmaceuticals | | | 7.1 | |
Oil, Gas & Consumable Fuels | | | 6.8 | |
Insurance | | | 6.4 | |
Metals & Mining | | | 5.1 | |
Capital Markets | | | 2.9 | |
Textiles, Apparel & Luxury Goods | | | 2.8 | |
IT Services | | | 2.8 | |
Real Estate Management & Development | | | 2.6 | |
Semiconductors & Semiconductor Equipment | | | 2.5 | |
Hotels, Restaurants & Leisure | | | 2.5 | |
Electric Utilities | | | 2.4 | |
Aerospace & Defense | | | 2.4 | |
Wireless Telecommunication Services | | | 2.3 | |
Tobacco | | | 2.3 | |
Machinery | | | 2.2 | |
Food & Staples Retailing | | | 2.1 | |
Diversified Telecommunication Services | | | 2.0 | |
Food Products | | | 2.0 | |
Automobiles | | | 1.9 | |
Beverages | | | 1.8 | |
Construction & Engineering | | | 1.4 | |
Specialty Retail | | | 1.4 | |
Exchange-Traded Funds | | | 1.3 | |
Personal Products | | | 1.3 | |
Road & Rail | | | 1.2 | |
Internet & Direct Marketing Retail | | | 1.2 | |
Electronic Equipment, Instruments & Components | | | 1.2 | |
Professional Services | | | 1.2 | |
Trading Companies & Distributors | | | 1.2 | |
Technology Hardware, Storage & Peripherals | | | 1.1 | |
Household Durables | | | 1.1 | |
| | | | |
Construction Materials | | | 1.0 | % |
Equity Real Estate Investment Trusts (REITs) | | | 1.0 | |
Chemicals | | | 0.9 | |
Health Care Equipment & Supplies | | | 0.9 | |
Industrial Conglomerates | | | 0.8 | |
Media | | | 0.7 | |
Affiliated Mutual Funds (0.6% represents investments purchased with collateral from securities on loan) | | | 0.7 | |
Software | | | 0.6 | |
Transportation Infrastructure | | | 0.6 | |
Auto Components | | | 0.6 | |
Health Care Providers & Services | | | 0.6 | |
Interactive Media & Services | | | 0.6 | |
Thrifts & Mortgage Finance | | | 0.5 | |
Diversified Financial Services | | | 0.4 | |
Electrical Equipment | | | 0.4 | |
Multi-Utilities | | | 0.3 | |
Entertainment | | | 0.3 | |
Water Utilities | | | 0.3 | |
Household Products | | | 0.2 | |
Biotechnology | | | 0.2 | |
Communications Equipment | | | 0.2 | |
Independent Power & Renewable Electricity Producers | | | 0.1 | |
Marine | | | 0.1 | |
Leisure Products | | | 0.1 | |
Consumer Finance | | | 0.1 | |
Gas Utilities | | | 0.0 | * |
See Notes to Financial Statements.
| | | | |
Industry Classification (continued): | | | |
Air Freight & Logistics | | | 0.0 | *% |
| | | | |
| | | 100.2 | |
Liabilities in excess of other assets | | | (0.2 | ) |
| | | | |
| | | 100.0 | % |
| | | | |
Effects of Derivative Instruments on the Financial Statements and Primary Underlying Risk Exposure:
The Series invested in derivative instruments during the reporting period. The primary type of risk associated with these derivative instruments is equity contracts risk. See the Notes to Financial Statements for additional detail regarding these derivative instruments and their risks. The effect of such derivative instruments on the Series’ financial position and financial performance as reflected in the Statement of Assets and Liabilities and Statement of Operations is presented in the summary below.
The Series did not hold any derivative instruments as of October 31, 2019, accordingly, no derivative positions were presented in the Statement of Assets and Liabilities.
The effects of derivative instruments on the Statement of Operations for the year ended October 31, 2019 are as follows:
| | | | |
Amount of Realized Gain (Loss) on Derivatives Recognized in Income | |
Derivatives not accounted for as hedging
instruments, carried at fair value | | Rights(1) | |
Equity contracts | | $ | 1,371 | |
| | | | |
| (1) | Included in net realized gain (loss) on investment transactions in the Statement of Operations. |
For the year ended October, 31, 2019, the Series did not have any net change in unrealized appreciation (depreciation) on derivatives in the Statement of Operations.
Financial Instruments/Transactions—Summary of Offsetting and Netting Arrangements:
The Series entered into financial instruments/transactions during the reporting period that are either offset in accordance with current requirements or are subject to enforceable master netting arrangements or similar agreements that permit offsetting. The information about offsetting and related netting arrangements for financial instruments/transactions where the legal right toset-off exists is presented in the summary below.
Offsetting of financial instrument/transaction assets and liabilities:
See Notes to Financial Statements.
| | | | |
| PGIM QMA International Equity Fund | | | 29 | |
Schedule of Investments(continued)
as of October 31, 2019
| | | | | | | | | | | | |
Description | | Gross Market
Value of
Recognized
Assets/(Liabilities) | | | Collateral
Pledged/(Received)(1) | | | Net Amount | |
Securities on Loan | | $ | 1,179,796 | | | $ | (1,179,796 | ) | | $ | — | |
| | | | | | | | | | | | |
| (1) | Collateral amount disclosed by the Series is limited to the market value of financial instruments/transactions. |
See Notes to Financial Statements.
Statement of Assets and Liabilities
as of October 31, 2019
| | | | |
Assets | | | | |
Investments at value, including securities on loan of $1,179,796: | | | | |
Unaffiliated investments (cost $173,876,353) | | $ | 196,418,930 | |
Affiliated investments (cost $1,323,643) | | | 1,323,812 | |
Foreign currency, at value (cost $81,454) | | | 81,174 | |
Tax reclaim receivable | | | 897,801 | |
Dividends receivable | | | 429,137 | |
Receivable for Series shares sold | | | 169,639 | |
Prepaid expenses and other assets | | | 3,089 | |
| | | | |
Total Assets | | | 199,323,582 | |
| | | | |
| |
Liabilities | | | | |
Payable to broker for collateral for securities on loan | | | 1,219,579 | |
Payable for Series shares reacquired | | | 377,591 | |
Transfer agent’s fees and expenses payable | | | 118,381 | |
Management fee payable | | | 107,462 | |
Affiliated transfer agent fee payable | | | 74,343 | |
Distribution fee payable | | | 46,597 | |
Accrued expenses and other liabilities | | | 35,021 | |
Foreign capital gains tax liability accrued | | | 24,532 | |
| | | | |
Total Liabilities | | | 2,003,506 | |
| | | | |
| |
Net Assets | | $ | 197,320,076 | |
| | | | |
| | | | | |
Net assets were comprised of: | | | | |
Common stock, at par | | $ | 274,405 | |
Paid-in capital in excess of par | | | 177,300,999 | |
Total distributable earnings (loss) | | | 19,744,672 | |
| | | | |
Net assets, October 31, 2019 | | $ | 197,320,076 | |
| | | | |
See Notes to Financial Statements.
| | | | |
| PGIM QMA International Equity Fund | | | 31 | |
Statement of Assets and Liabilities
as of October 31, 2019
| | | | |
Class A | | | | |
Net asset value and redemption price per share,
($173,102,594 ÷ 24,074,464 shares of common stock issued and outstanding) | | $ | 7.19 | |
Maximum sales charge (5.50% of offering price) | | | 0.42 | |
| | | | |
Maximum offering price to public | | $ | 7.61 | |
| | | | |
| |
Class B | | | | |
Net asset value, offering price and redemption price per share,
($1,049,130 ÷ 152,980 shares of common stock issued and outstanding) | | $ | 6.86 | |
| | | | |
| |
Class C | | | | |
Net asset value, offering price and redemption price per share,
($2,928,084 ÷ 427,007 shares of common stock issued and outstanding) | | $ | 6.86 | |
| | | | |
| |
Class Z | | | | |
Net asset value, offering price and redemption price per share,
($14,753,119 ÷ 2,031,470 shares of common stock issued and outstanding) | | $ | 7.26 | |
| | | | |
| |
Class R6 | | | | |
Net asset value, offering price and redemption price per share,
($5,487,149 ÷ 754,583 shares of common stock issued and outstanding) | | $ | 7.27 | |
| | | | |
See Notes to Financial Statements.
Statement of Operations
Year Ended October 31, 2019
| | | | |
Net Investment Income (Loss) | | | | |
Income | | | | |
Unaffiliated dividend income (net of $838,990 foreign withholding tax) | | $ | 7,938,831 | |
Income from securities lending, net (including affiliated income of $4,739) | | | 41,664 | |
Affiliated dividend income | | | 4,526 | |
| | | | |
Total income | | | 7,985,021 | |
| | | | |
| |
Expenses | | | | |
Management fee | | | 1,631,949 | |
Distribution fee(a) | | | 601,414 | |
Transfer agent’s fees and expenses (including affiliated expense of $420,416)(a) | | | 715,052 | |
Custodian and accounting fees | | | 202,910 | |
Shareholders’ reports | | | 70,110 | |
Audit fee | | | 30,924 | |
Registration fees(a) | | | 30,013 | |
Legal fees and expenses | | | 18,037 | |
Directors’ fees | | | 14,751 | |
Miscellaneous | | | 87,715 | |
| | | | |
Total expenses | | | 3,402,875 | |
Less: Fee waiver and/or expense reimbursement(a) | | | (337,742 | ) |
| | | | |
Net expenses | | | 3,065,133 | |
| | | | |
Net investment income (loss) | | | 4,919,888 | |
| | | | |
| |
Realized And Unrealized Gain (Loss) On Investment And Foreign Currency Transactions | | | | |
Net realized gain (loss) on: | | | | |
Investment transactions (including affiliated of $1,203) (net of foreign capital gains taxes $(71,718)) | | | (5,894,603 | ) |
Foreign currency transactions | | | (37,628 | ) |
| | | | |
| | | (5,932,231 | ) |
| | | | |
Net change in unrealized appreciation (depreciation) on: | | | | |
Investments (including affiliated of $62) (net of change in foreign capital gains taxes $4,110) | | | 15,278,307 | |
Foreign currencies | | | 25,560 | |
| | | | |
| | | 15,303,867 | |
| | | | |
Net gain (loss) on investment and foreign currency transactions | | | 9,371,636 | |
| | | | |
Net Increase (Decrease) In Net Assets Resulting From Operations | | $ | 14,291,524 | |
| | | | |
| (a) | Class specific expenses and waivers were as follows: |
| | | | | | | | | | | | | | | | | | | | |
| | | Class A | | | Class B | | | Class C | | | Class Z | | | Class R6 | |
Distribution fee | | | 516,098 | | | | 13,683 | | | | 71,633 | | | | — | | | | — | |
Transfer agent’s fees and expenses | | | 641,207 | | | | 21,839 | | | | 26,696 | | | | 24,942 | | | | 368 | |
Registration fees | | | 6,326 | | | | 5,965 | | | | 6,043 | | | | 6,031 | | | | 5,648 | |
Fee waiver and/or expense reimbursement | | | (248,230 | ) | | | (19,727 | ) | | | (10,336 | ) | | | (19,934 | ) | | | (39,515 | ) |
See Notes to Financial Statements.
| | | | |
| PGIM QMA International Equity Fund | | | 33 | |
Statements of Changes in Net Assets
| | | | | | | | |
| |
| | | Year Ended October 31, | |
| | |
| | | 2019 | | | 2018 | |
Increase (Decrease) in Net Assets | | | | | | | | |
Operations | | | | | | | | |
Net investment income (loss) | | $ | 4,919,888 | | | $ | 5,818,341 | |
Net realized gain (loss) on investment and foreign currency transactions | | | (5,932,231 | ) | | | 12,752,884 | |
Net change in unrealized appreciation (depreciation) on investments and foreign currencies | | | 15,303,867 | | | | (47,076,008 | ) |
| | | | | | | | |
Net increase (decrease) in net assets resulting from operations | | | 14,291,524 | | | | (28,504,783 | ) |
| | | | | | | | |
| | |
Dividends and Distributions | | | | | | | | |
Distributions from distributable earnings | | | | | | | | |
Class A | | | (4,863,764 | ) | | | (3,767,555 | ) |
Class B | | | (27,709 | ) | | | (34,288 | ) |
Class C | | | (271,975 | ) | | | (206,355 | ) |
Class Z | | | (443,611 | ) | | | (363,326 | ) |
Class R6 | | | (1,275,473 | ) | | | (939,275 | ) |
| | | | | | | | |
| | | (6,882,532 | ) | | | (5,310,799 | ) |
| | | | | | | | |
| | |
Series share transactions (Net of share conversions) | | | | | | | | |
Net proceeds from shares sold | | | 9,994,692 | | | | 15,948,974 | |
Net asset value of shares issued in reinvestment of dividends and distributions | | | 6,792,808 | | | | 5,229,466 | |
Cost of shares reacquired | | | (62,908,505 | ) | | | (35,360,628 | ) |
| | | | | | | | |
Net increase (decrease) in net assets from Series share transactions | | | (46,121,005 | ) | | | (14,182,188 | ) |
| | | | | | | | |
Total increase (decrease) | | | (38,712,013 | ) | | | (47,997,770 | ) |
| | |
Net Assets: | | | | | | | | |
Beginning of year | | | 236,032,089 | | | | 284,029,859 | |
| | | | | | | | |
End of year | | $ | 197,320,076 | | | $ | 236,032,089 | |
| | | | | | | | |
See Notes to Financial Statements.
Notes to Financial Statements
Prudential World Fund, Inc. (the “Fund”) is registered under the Investment Company Act of 1940, as amended (“1940 Act”), as anopen-end management investment company and currently consists of seven series: PGIM Jennison Emerging Markets Equity Opportunities Fund, PGIM Jennison Global Opportunities Fund, PGIM Jennison International Opportunities Fund and PGIM QMA International Equity Fund, each of which are diversified funds and PGIM Jennison Global Infrastructure Fund, PGIM Emerging Markets Debt Hard Currency Fund and PGIM Emerging Markets Debt Local Currency Fund, each of which arenon-diversified funds for purposes of the 1940 Act and may invest a greater percentage of their assets in the securities of a single company or other issuer than a diversified fund. Investing in anon-diversified fund involves greater risk than investing in a diversified fund because a loss resulting from the decline in value of any one security may represent a greater portion of the total assets of anon-diversified fund. These financial statements relate only to the PGIM QMA International Equity Fund (the “Series”).
The investment objective of the Series is to seek long-term growth of capital.
1. Accounting Policies
The Series follows the investment company accounting and reporting guidance of the Financial Accounting Standards Board (“FASB”) Accounting Standard Codification (“ASC”) Topic 946 Financial Services —Investment Companies.The following accounting policies conform to U.S. generally accepted accounting principles. The Series consistently follows such policies in the preparation of its financial statements.
Securities Valuation:The Series holds securities and other assets and liabilities that are fair valued at the close of each day (generally, 4:00 PM Eastern time) the New York Stock Exchange (“NYSE”) is open for trading. Fair value is the price that would be received to sell an asset or paid to transfer a liability in an orderly transaction between market participants on the measurement date. The Fund’s Board of Directors (the “Board”) has adopted valuation procedures for security valuation under which fair valuation responsibilities have been delegated to PGIM Investments LLC (“PGIM Investments” or the “Manager”). Pursuant to the Board’s delegation, the Manager has established a Valuation Committee responsible for supervising the fair valuation of portfolio securities and other assets and liabilities. The valuation procedures permit the Series to utilize independent pricing vendor services, quotations from market makers, and alternative valuation methods when market quotations are either not readily available or not deemed representative of fair value. A record of the Valuation Committee’s actions is subject to the Board’s review, approval, and ratification at its next regularly scheduled quarterly meeting.
For the fiscal reportingyear-end, securities and other assets and liabilities were fair valued at the close of the last U.S. business day. Trading in certain foreign securities may occur when
| | | | |
| PGIM QMA International Equity Fund | | | 35 | |
Notes to Financial Statements(continued)
the NYSE is closed (including weekends and holidays). Because such foreign securities trade in markets that are open on weekends and U.S. holidays, the values of some of the Series’ foreign investments may change on days when investors cannot purchase or redeem Series shares.
Various inputs determine how the Series’ investments are valued, all of which are categorized according to the three broad levels (Level 1, 2, or 3) detailed in the Schedule of Investments and referred to herein as the “fair value hierarchy” in accordance with FASB ASC Topic 820—Fair Value Measurements and Disclosures.
Common and preferred stocks, exchange-traded funds, and derivative instruments, such as futures or options, that are traded on a national securities exchange are valued at the last sale price as of the close of trading on the applicable exchange where the security principally trades. Securities traded via NASDAQ are valued at the NASDAQ official closing price. To the extent these securities are valued at the last sale price or NASDAQ official closing price, they are classified as Level 1 in the fair value hierarchy. In the event that no sale or official closing price on valuation date exists, these securities are generally valued at the mean between the last reported bid and ask prices, or at the last bid price in the absence of an ask price. These securities are classified as Level 2 in the fair value hierarchy.
Foreign equities traded on foreign securities exchanges are generally valued using pricing vendor services that provide model prices derived using adjustment factors based on information such as local closing price, relevant general and sector indices, currency fluctuations, depositary receipts, and futures, as applicable. Securities valued using such model prices are classified as Level 2 in the fair value hierarchy. The models generate an evaluated adjustment factor for each security, which is applied to the local closing price to adjust it for post closing market movements up to the time the Series is valued. Utilizing that evaluated adjustment factor, the vendor provides an evaluated price for each security. If the vendor does not provide an evaluated price, securities are valued in accordance with exchange-traded common and preferred stock valuation policies discussed above.
Investments inopen-end,non-exchange-traded mutual funds are valued at their net asset values as of the close of the NYSE on the date of valuation. These securities are classified as Level 1 in the fair value hierarchy since they may be purchased or sold at their net asset values on the date of valuation.
Securities and other assets that cannot be priced according to the methods described above are valued based on pricing methodologies approved by the Board. In the event that unobservable inputs are used when determining such valuations, the securities will be classified as Level 3 in the fair value hierarchy.
When determining the fair value of securities, some of the factors influencing the valuation include: the nature of any restrictions on disposition of the securities; assessment of the general liquidity of the securities; the issuer’s financial condition and the markets in which it does business; the cost of the investment; the size of the holding and the capitalization of the issuer; the prices of any recent transactions or bids/offers for such securities or any comparable securities; any available analyst media or other reports or information deemed reliable by the Manager regarding the issuer or the markets or industry in which it operates. Using fair value to price securities may result in a value that is different from a security’s most recent closing price and from the price used by other unaffiliated mutual funds to calculate their net asset values.
Illiquid Securities:Pursuant to Rule22e-4 under the 1940 Act, the Series has adopted a Board approved Liquidity Risk Management Program (“LRMP”) that requires, among other things, that the Series limit its illiquid investments that are assets to no more than 15% of net assets. Illiquid securities are those that, because of the absence of a readily available market or due to legal or contractual restrictions on resale, may not reasonably be expected to be sold or disposed of in current market conditions in seven calendar days or less without the sale or disposition significantly changing the market value of the investment. The Series may find it difficult to sell illiquid securities at the time considered most advantageous by its subadviser and may incur transaction costs that would not be incurred in the sale of securities that were freely marketable.
Restricted Securities:Securities acquired in unregistered, private sales from the issuing company or from an affiliate of the issuer are considered restricted as to disposition under federal securities law (“restricted securities”). Such restricted securities are valued pursuant to the valuation procedures noted above. Restricted securities that would otherwise be considered illiquid investments pursuant to the Series’ LRMP because of legal restrictions on resale to the general public may be traded among qualified institutional buyers under Rule 144A of the Securities Act of 1933. Therefore, these Rule 144A securities, as well as commercial paper that is sold in private placements under Section 4(2) of the Securities Act of 1933, may be classified higher than “illiquid” under the LRMP (i.e. “moderately liquid” or “less liquid” investments). However, the liquidity of the Series’ investments in restricted securities could be impaired if trading does not develop or declines.
Foreign Currency Translation:The books and records of the Series are maintained in U.S. dollars. Foreign currency amounts are translated into U.S. dollars on the following basis:
(i) market value of investment securities, other assets and liabilities — at the current rates of exchange;
(ii) purchases and sales of investment securities, income and expenses — at the rates of exchange prevailing on the respective dates of such transactions.
Although the net assets of the Series are presented at the foreign exchange rates and market values at the close of the period, the Series does not generally isolate that portion of
| | | | |
| PGIM QMA International Equity Fund | | | 37 | |
Notes to Financial Statements(continued)
the results of operations arising as a result of changes in the foreign exchange rates from the fluctuations arising from changes in the market prices of long-term portfolio securities held at the end of the period. Similarly, the Series does not isolate the effect of changes in foreign exchange rates from the fluctuations arising from changes in the market prices of long-term portfolio securities sold during the period. Accordingly, holding period realized foreign currency gains (losses) are included in the reported net realized gains (losses) on investment transactions.
Net realized gains (losses) on foreign currency transactions represent net foreign exchange gains (losses) from the disposition of holdings of foreign currencies, currency gains (losses) realized between the trade and settlement dates on forward currency transactions, and the difference between the amounts of interest, dividends and foreign withholding taxes recorded on the Series’ books and the U.S. dollar equivalent amounts actually received or paid. Net unrealized currency gains (losses) arise from valuing foreign currency denominated assets and liabilities (other than investments) at period end exchange rates.
Master Netting Arrangements:The Fund, on behalf of the Series, is subject to various Master Agreements, or netting arrangements, with select counterparties. These are agreements which a subadviser may have negotiated and entered into on behalf of all or a portion of the Series. A master netting arrangement between the Series and the counterparty permits the Series to offset amounts payable by the Series to the same counterparty against amounts to be received; and by the receipt of collateral from the counterparty by the Series to cover the Series’ exposure to the counterparty. However, there is no assurance that such mitigating factors are easily enforceable. In addition to master netting arrangements, the right toset-off exists when all the conditions are met such that each of the parties owes the other determinable amounts, the reporting party has the right toset-off the amount owed with the amount owed by the other party, the reporting party intends toset-off and the right ofset-off is enforceable by law. During the reporting period, there was no intention to settle on a net basis and all amounts are presented on a gross basis on the Statement of Assets and Liabilities.
Rights:The Series held rights acquired either through a direct purchase or pursuant to corporate actions. Rights entitle the holder to buy a proportionate amount of common stock, or such other security that the issuer may specify, at a specific price and time through the expiration dates. Such rights are held as long positions by the Series until exercised, sold or expired. Rights are valued at fair value in accordance with the Board approved fair valuation procedures.
Securities Lending:The Series lends its portfolio securities to banks and broker-dealers. The loans are secured by collateral at least equal to the market value of the securities loaned. Collateral pledged by each borrower is invested in an affiliated money market fund and is
marked to market daily, based on the previous day’s market value, such that the value of the collateral exceeds the value of the loaned securities. In the event of significant appreciation in value of securities on loan on the last business day of the reporting period, the financial statements may reflect a collateral value that is less than the market value of the loaned securities. Such shortfall is remedied as described above. Loans are subject to termination at the option of the borrower or the Series. Upon termination of the loan, the borrower will return to the Series securities identical to the loaned securities. Should the borrower of the securities fail financially, the Series has the right to repurchase the securities in the open market using the collateral.
The Series recognizes income, net of any rebate and securities lending agent fees, for lending its securities in the form of fees or interest on the investment of any cash received as collateral. The borrower receives all interest and dividends from the securities loaned and such payments are passed back to the lender in amounts equivalent thereto. The Series also continues to recognize any unrealized gain (loss) in the market price of the securities loaned and on the change in the value of the collateral invested that may occur during the term of the loan. In addition, realized gain (loss) is recognized on changes in the value of the collateral invested upon liquidation of the collateral. Net earnings from securities lending are disclosed on the Statement of Operations as “Income from securities lending, net”.
Securities Transactions and Net Investment Income:Securities transactions are recorded on the trade date. Realized gains (losses) from investment and currency transactions are calculated on the specific identification method. Dividend income is recorded on theex-date, or for certain foreign securities, when the Series becomes aware of such dividends. Expenses are recorded on an accrual basis, which may require the use of certain estimates by management that may differ from actual. Net investment income or loss (other than class specific expenses and waivers, which are allocated as noted below) and unrealized and realized gains (losses) are allocated daily to each class of shares based upon the relative proportion of adjusted net assets of each class at the beginning of the day. Class specific expenses and waivers, where applicable, are charged to the respective share classes. Class specific expenses include distribution fees and distribution fee waivers, shareholder servicing fees, transfer agent’s fees and expenses, registration fees and fee waivers and/or expense reimbursements, as applicable.
Taxes:It is the Series’ policy to continue to meet the requirements of the Internal Revenue Code applicable to regulated investment companies and to distribute all of its taxable net investment income and capital gains, if any, to its shareholders. Therefore, no federal income tax provision is required. Withholding taxes on foreign dividends, interest and capital gains, if any, are recorded, net of reclaimable amounts, at the time the related income is earned.
Dividends and Distributions:The Series expects to pay dividends from net investment income and distributions from net realized capital and currency gains, if any, annually. Dividends and distributions to shareholders, which are determined in accordance with federal income tax regulations and which may differ from generally accepted accounting
| | | | |
| PGIM QMA International Equity Fund | | | 39 | |
Notes to Financial Statements(continued)
principles, are recorded on theex-date. Permanent book/tax differences relating to income and gain (loss) are reclassified between total distributable earnings (loss) andpaid-in capital in excess of par, as appropriate.
Estimates:The preparation of financial statements requires management to make estimates and assumptions that affect the reported amounts and disclosures in the financial statements. Actual results could differ from those estimates.
2. Agreements
The Fund, on behalf of the Series, has a management agreement with the Manager. Pursuant to this agreement, the Manager has responsibility for all investment advisory services and supervises the subadviser’s performance of such services. In addition, under the management agreement, the Manager provides all of the administrative functions necessary for the organization, operation and management of the Series. The Manager administers the corporate affairs of the Series and, in connection therewith, furnishes the Series with office facilities, together with those ordinary clerical and bookkeeping services which are not being furnished by the Series’ custodian and the Series’ transfer agent. The Manager is also responsible for the staffing and management of dedicated groups of legal, marketing, compliance and related personnel necessary for the operation of the Series. The legal, marketing, compliance and related personnel are also responsible for the management and oversight of the various service providers to the Series, including, but not limited to, the custodian, transfer agent, and accounting agent.
The Manager has entered into a subadvisory agreement with QMA LLC (“QMA”) (formerly known as Quantitative Management Associates LLC). The subadvisory agreement provides that QMA will furnish investment advisory services in connection with the management of the Series. In connection therewith, QMA is obligated to keep certain books and records of the Series. The Manager pays for the services of QMA, the cost of compensation of officers of the Series, occupancy and certain clerical and bookkeeping costs of the Series. The Series bears all other costs and expenses.
The management fee paid to the Manager is accrued daily and payable monthly at an annual rate of 0.75% of the Series’ average daily net assets up to $2 billion, 0.70% of the next $3 billion and 0.69% of the average daily net assets over $5 billion. The effective management fee rate before any waivers and/or expense reimbursements was 0.75% for the year ended October 31, 2019.
The Manager has contractually agreed, through February 28, 2021, to limit total annual operating expenses after fee waivers and/or expense reimbursements to 2.53% of average daily net assets for Class B shares, and 0.78% of average daily net assets for Class R6
shares. This contractual waiver excludes interest, brokerage, taxes (such as income and foreign withholding taxes, stamp duty and deferred tax expenses), acquired fund fees and expenses, extraordinary expenses, and certain other Series expenses such as dividend and interest expense and broker charges on short sales. Where applicable, the Manager agrees to waive management fees or shared operating expenses on any share class to the same extent that it waives similar expenses on any other share class and, in addition, total annual operating expenses for Class R6 shares will not exceed total annual operating expenses for Class Z shares. Fees and/or expenses waived and/or reimbursed by the Manager may be recouped by the Manager within the same fiscal year during which such waiver/reimbursement is made if such recoupment can be realized without exceeding the expense limit in effect at the time of the recoupment for that fiscal year.
The Fund, on behalf of the Series, has a distribution agreement with Prudential Investment Management Services LLC (“PIMS”), which acts as the distributor of the Class A, Class B, Class C, Class Z and Class R6 shares of the Series. The Series compensates PIMS for distributing and servicing the Series’ Class A, Class B and Class C shares, pursuant to the plans of distribution (the “Distribution Plans”), regardless of expenses actually incurred by PIMS. The distribution fees are accrued daily and payable monthly. No distribution or service fees are paid to PIMS as distributor of the Class Z and Class R6 shares of the Series.
Pursuant to the Distribution Plans, the Series compensates PIMS for distribution related activities at an annual rate of up to 0.30%, 1% and 1% of the average daily net assets of the Class A, Class B and Class C shares, respectively.
For the year ended October 31, 2019, PIMS received $40,767 infront-end sales charges resulting from sales of Class A shares. Additionally, for the year ended October 31, 2019, PIMS received $562 and $142 in contingent deferred sales charges imposed upon redemptions by certain Class B and Class C shareholders, respectively. From these fees, PIMS paid such sales charges to broker-dealers, who in turn paid commissions to salespersons and incurred other distribution costs.
PGIM Investments, PIMS and QMA are indirect, wholly-owned subsidiaries of Prudential Financial, Inc. (“Prudential”).
3. Other Transactions with Affiliates
Prudential Mutual Fund Services LLC (“PMFS”), an affiliate of PGIM Investments and an indirect, wholly-owned subsidiary of Prudential, serves as the Fund’s transfer agent. Transfer agent’s fees and expenses in the Statement of Operations include certainout-of-pocket expenses paid tonon-affiliates, where applicable.
The Series may invest its overnight sweep cash in the PGIM Core Ultra Short Bond Fund (the “Core Fund”), and its securities lending cash collateral in the PGIM Institutional Money Market Fund (the “Money Market Fund”), each a series of Prudential Investment Portfolios 2, registered under the 1940 Act and managed by PGIM Investments. Through the Fund’s
| | | | |
| PGIM QMA International Equity Fund | | | 41 | |
Notes to Financial Statements(continued)
investments in the mentioned underlying funds, PGIM Investments and/or its affiliates are paid fees or reimbursed for providing their services. In addition to the realized and unrealized gains on investments in the Core Fund and Money Market Fund, earnings from such investments are disclosed on the Statement of Operations as “Affiliated dividend income” and “Income from securities lending, net”, respectively.
The Series may enter into certain securities purchase or sale transactions under Board approved Rule17a-7 procedures. Rule17a-7 is an exemptive rule under the 1940 Act, that subject to certain conditions, permits purchase and sale transactions among affiliated investment companies, or between an investment company and a person that is affiliated solely by reason of having a common (or affiliated) investment adviser, common directors, and/or common officers. Pursuant to the Rule17a-7 procedures and consistent with guidance issued by the SEC, the Fund’s Chief Compliance Officer (“CCO”) prepares a quarterly summary of all such transactions for submission to the Board, together with the CCO’s written representation that all such17a-7 transactions were effected in accordance with the Series’ Rule17a-7 procedures. For the year ended October 31, 2019, no17a-7 transactions were entered into by the Series.
4. Portfolio Securities
The aggregate cost of purchases and proceeds from sales of portfolio securities (excluding short-term investments and U.S. Government securities) for the year ended October 31, 2019, were $203,124,221 and $250,500,270, respectively.
A summary of the cost of purchases and proceeds from sales of shares of affiliated investments for the year ended October 31, 2019, is presented as follows:
| | | | | | | | | | | | | | | | | | | | | | | | | | | | | | |
Value,
Beginning
of Year | | | Cost of
Purchases | | | Proceeds
from Sales | | | Change in
Unrealized
Gain
(Loss) | | | Realized
Gain
(Loss) | | | Value,
End of
Year | | | Shares,
End of
Year | | | Income | |
| | PGIM Core Ultra Short Bond Fund* | | | | | | | | | | | | | | | | | |
| $ | 101,342 | | | $ | 24,918,426 | | | $ | 24,917,945 | | | $ | — | | | $ | — | | | $ | 101,823 | | | | 101,823 | | | $ | 4,526 | |
| | PGIM Institutional Money Market Fund* | |
| | 1,092,213 | | | | 36,084,481 | | | | 35,955,970 | | | | 62 | | | | 1,203 | | | | 1,221,989 | | | | 1,221,744 | | | | 4,739 | ** |
| | | | | | | | | | | | | | | | | | | | | | | | | | | | | | |
| $ | 1,193,555 | | | $ | 61,002,907 | | | $ | 60,873,915 | | | $ | 62 | | | $ | 1,203 | | | $ | 1,323,812 | | | | | | | $ | 9,265 | |
| | | | | | | | | | | | | | | | | | | | | | | | | | | | | | |
| * | The Fund did not have any capital gain distributions during the reporting period. |
| ** | This amount is included in “Income from securities lending, net” on the Statement of Operations. |
5. Distributions and Tax Information
Distributions to shareholders, which are determined in accordance with federal income tax regulations and which may differ from generally accepted accounting principles, are recorded on theex-date.
For the year ended October 31, 2019, the tax character of dividends paid by the Series were $6,008,360 of ordinary income and $874,172 of long-term capital gains. For the year ended October 31, 2018, the tax character of dividends paid by the Series was $5,310,799 of ordinary income.
As of October 31, 2019, the accumulated undistributed earnings on a tax basis was $4,665,837 of ordinary income.
The United States federal income tax basis of the Series’ investments and the net unrealized appreciation as of October 31, 2019 were as follows:
| | | | | | |
Tax Basis | | Gross
Unrealized
Appreciation | | Gross
Unrealized
Depreciation | | Net
Unrealized
Appreciation |
| $176,354,364 | | $28,705,921 | | $(7,317,543) | | $21,388,378 |
The difference between book and tax basis was primarily due to deferred losses on wash sales and investments in passive foreign investment companies.
For federal income tax purposes, the Series had a capital loss carryforward as of October 31, 2019 of approximately $6,310,000 which can be carried forward for an unlimited period. No capital gains distributions are expected to be paid to shareholders until net gains have been realized in excess of such losses.
The Manager has analyzed the Series’ tax positions taken on federal, state and local income tax returns for all open tax years and has concluded that no provision for income tax is required in the Series’ financial statements for the current reporting period. Since tax authorities can examine previously filed tax returns, the Series’ U.S. federal and state tax returns for each of the four fiscal years up to the most recent fiscal year ended October 31, 2019 are subject to such review.
6. Capital and Ownership
The Series offers Class A, Class B, Class C, Class Z and Class R6 shares. Class A shares are sold with a maximumfront-end sales charge of 5.50%. Investors who purchase $1 million or more of Class A shares and sell these shares within 12 months of purchase are subject to a contingent deferred sales charge (“CDSC”) of 1%, although they are not subject to an initial sales charge. The Class A CDSC is waived for certain retirement and/or benefit plans. A special exchange privilege is also available for shareholders who qualified to purchase Class A shares at net asset value. Class B shares are sold with a CDSC which declines from 5% to zero depending on the period of time the shares are held. Class B shares will
| | | | |
| PGIM QMA International Equity Fund | | | 43 | |
Notes to Financial Statements(continued)
automatically convert to Class A shares on a monthly basis approximately seven years after purchase. Class B shares are closed to new purchases. Class C shares are sold with a CDSC of 1% on sales made within 12 months of purchase. Class C shares will automatically convert to Class A shares on a monthly basis approximately 10 years after purchase. Class Z and Class R6 shares are not subject to any sales or redemption charge and are available exclusively for sale to a limited group of investors.
Under certain circumstances, an exchange may be made from specified share classes of the Series to one or more other share classes of the Series as presented in the table of transactions in shares of common stock.
The Fund is authorized to issue 5.075 billion shares of common stock, with a par value of $0.01 per share, which is divided into seven series. There are 700 million shares authorized for the Series, divided into six classes, designated Class A, Class B, Class C, Class Z, Class R6 and Class T common stock, each of which consists of 100 million, 5 million, 100 million, 180 million, 180 million and 135 million authorized shares, respectively. The Series currently does not have any Class T shares outstanding.
As of October 31, 2019, Prudential, through its affiliated entities, including affiliated funds (if applicable), owned 46,198 Class Z shares and 436,938 Class R6 shares of the Series. At reporting period end, two shareholders of record, each holding greater than 5% of the Series, held 33% of the Series’ outstanding shares.
Transactions in shares of common stock were as follows:
| | | | | | | | |
Class A | | Shares | | | Amount | |
Year ended October 31, 2019: | | | | | | | | |
Shares sold | | | 405,337 | | | $ | 2,805,726 | |
Shares issued in reinvestment of dividends and distributions | | | 745,110 | | | | 4,783,606 | |
Shares reacquired | | | (2,958,509 | ) | | | (20,532,579 | ) |
| | | | | | | | |
Net increase (decrease) in shares outstanding before conversion | | | (1,808,062 | ) | | | (12,943,247 | ) |
Shares issued upon conversion from other share class(es) | | | 1,414,906 | | | | 10,165,814 | |
Shares reacquired upon conversion into other share class(es) | | | (163,486 | ) | | | (1,157,670 | ) |
| | | | | | | | |
Net increase (decrease) in shares outstanding | | | (556,642 | ) | | $ | (3,935,103 | ) |
| | | | | | | | |
Year ended October 31, 2018: | | | | | | | | |
Shares sold | | | 804,151 | | | $ | 6,370,219 | |
Shares issued in reinvestment of dividends and distributions | | | 477,661 | | | | 3,697,101 | |
Shares reacquired | | | (2,740,309 | ) | | | (21,405,716 | ) |
| | | | | | | | |
Net increase (decrease) in shares outstanding before conversion | | | (1,458,497 | ) | | | (11,338,396 | ) |
Shares issued upon conversion from other share class(es) | | | 98,091 | | | | 763,413 | |
Shares reacquired upon conversion into other share class(es) | | | (125,149 | ) | | | (987,877 | ) |
| | | | | | | | |
Net increase (decrease) in shares outstanding | | | (1,485,555 | ) | | $ | (11,562,860 | ) |
| | | | | | | | |
| | | | | | | | |
Class B | | Shares | | | Amount | |
Year ended October 31, 2019: | | | | | | | | |
Shares sold | | | 456 | | | $ | 3,200 | |
Shares issued in reinvestment of dividends and distributions | | | 4,465 | | | | 27,594 | |
Shares reacquired | | | (24,678 | ) | | | (162,098 | ) |
| | | | | | | | |
Net increase (decrease) in shares outstanding before conversion | | | (19,757 | ) | | | (131,304 | ) |
Shares reacquired upon conversion into other share class(es) | | | (87,433 | ) | | | (579,597 | ) |
| | | | | | | | |
Net increase (decrease) in shares outstanding | | | (107,190 | ) | | $ | (710,901 | ) |
| | | | | | | | |
Year ended October 31, 2018: | | | | | | | | |
Shares sold | | | 28,928 | | | $ | 223,860 | |
Shares issued in reinvestment of dividends and distributions | | | 4,495 | | | | 33,444 | |
Shares reacquired | | | (86,909 | ) | | | (647,663 | ) |
| | | | | | | | |
Net increase (decrease) in shares outstanding before conversion | | | (53,486 | ) | | | (390,359 | ) |
Shares reacquired upon conversion into other share class(es) | | | (83,891 | ) | | | (627,742 | ) |
| | | | | | | | |
Net increase (decrease) in shares outstanding | | | (137,377 | ) | | $ | (1,018,101 | ) |
| | | | | | | | |
Class C | | | | | | |
Year ended October 31, 2019: | | | | | | | | |
Shares sold | | | 45,851 | | | $ | 295,704 | |
Shares issued in reinvestment of dividends and distributions | | | 43,387 | | | | 267,695 | |
Shares reacquired | | | (200,703 | ) | | | (1,325,590 | ) |
| | | | | | | | |
Net increase (decrease) in shares outstanding before conversion | | | (111,465 | ) | | | (762,191 | ) |
Shares reacquired upon conversion into other share class(es) | | | (1,349,552 | ) | | | (9,308,179 | ) |
| | | | | | | | |
Net increase (decrease) in shares outstanding | | | (1,461,017 | ) | | $ | (10,070,370 | ) |
| | | | | | | | |
Year ended October 31, 2018: | | | | | | | | |
Shares sold | | | 97,298 | | | $ | 737,280 | |
Shares issued in reinvestment of dividends and distributions | | | 27,319 | | | | 202,979 | |
Shares reacquired | | | (422,142 | ) | | | (3,144,588 | ) |
| | | | | | | | |
Net increase (decrease) in shares outstanding before conversion | | | (297,525 | ) | | | (2,204,329 | ) |
Shares reacquired upon conversion into other share class(es) | | | (7,107 | ) | | | (54,450 | ) |
| | | | | | | | |
Net increase (decrease) in shares outstanding | | | (304,632 | ) | | $ | (2,258,779 | ) |
| | | | | | | | |
Class Z | | | | | | |
Year ended October 31, 2019: | | | | | | | | |
Shares sold | | | 184,066 | | | $ | 1,296,403 | |
Shares issued in reinvestment of dividends and distributions | | | 67,870 | | | | 438,440 | |
Shares reacquired | | | (320,357 | ) | | | (2,232,317 | ) |
| | | | | | | | |
Net increase (decrease) in shares outstanding before conversion | | | (68,421 | ) | | | (497,474 | ) |
Shares issued upon conversion from other share class(es) | | | 166,439 | | | | 1,187,596 | |
Shares reacquired upon conversion into other share class(es) | | | (46,515 | ) | | | (328,493 | ) |
| | | | | | | | |
Net increase (decrease) in shares outstanding | | | 51,503 | | | $ | 361,629 | |
| | | | | | | | |
Year ended October 31, 2018: | | | | | | | | |
Shares sold | | | 201,211 | | | $ | 1,579,542 | |
Shares issued in reinvestment of dividends and distributions | | | 45,785 | | | | 356,667 | |
Shares reacquired | | | (539,404 | ) | | | (4,190,995 | ) |
| | | | | | | | |
Net increase (decrease) in shares outstanding before conversion | | | (292,408 | ) | | | (2,254,786 | ) |
Shares issued upon conversion from other share class(es) | | | 125,908 | | | | 1,001,643 | |
Shares reacquired upon conversion into other share class(es) | | | (16,340 | ) | | | (125,981 | ) |
| | | | | | | | |
Net increase (decrease) in shares outstanding | | | (182,840 | ) | | $ | (1,379,124 | ) |
| | | | | | | | |
| | | | |
| PGIM QMA International Equity Fund | | | 45 | |
Notes to Financial Statements(continued)
| | | | | | | | |
Class R6 | | Shares | | | Amount | |
Year ended October 31, 2019: | | | | | | | | |
Shares sold | | | 797,936 | | | $ | 5,593,659 | |
Shares issued in reinvestment of dividends and distributions | | | 197,442 | | | | 1,275,473 | |
Shares reacquired | | | (5,440,241 | ) | | | (38,655,921 | ) |
| | | | | | | | |
Net increase (decrease) in shares outstanding before conversion | | | (4,444,863 | ) | | | (31,786,789 | ) |
Shares issued upon conversion from other share class(es) | | | 2,916 | | | | 20,529 | |
| | | | | | | | |
Net increase (decrease) in shares outstanding | | | (4,441,947 | ) | | $ | (31,766,260 | ) |
| | | | | | | | |
Year ended October 31, 2018: | | | | | | | | |
Shares sold | | | 917,539 | | | $ | 7,038,073 | |
Shares issued in reinvestment of dividends and distributions | | | 120,574 | | | | 939,275 | |
Shares reacquired | | | (744,222 | ) | | | (5,971,666 | ) |
| | | | | | | | |
Net increase (decrease) in shares outstanding before conversion | | | 293,891 | | | | 2,005,682 | |
Shares issued upon conversion from other share class(es) | | | 3,823 | | | | 30,994 | |
| | | | | | | | |
Net increase (decrease) in shares outstanding | | | 297,714 | | | $ | 2,036,676 | |
| | | | | | | | |
7. Borrowings
The Fund, on behalf of the Series, along with other affiliated registered investment companies (the “Funds”), is a party to a Syndicated Credit Agreement (“SCA”) with a group of banks. The purpose of the SCA is to provide an alternative source of temporary funding for capital share redemptions. The table below provides details of the current SCA in effect at the reportingperiod-end as well as the prior SCA.
| | | | |
| | | Current SCA | | Prior SCA |
| Term of Commitment | | 10/3/2019 – 10/1/2020 | | 10/4/2018 – 10/2/2019 |
| Total Commitment | | $ 900 million | | $ 900 million |
| Annualized Commitment Fee on the Unused Portion of the SCA | | 0.15% | | 0.15% |
| Annualized Interest Rate on Borrowings | | 1.20% plus the higher of (1) the effective federal funds rate, (2) theone-month LIBOR rate or (3) zero percent | | 1.25% plus the higher of (1) the effective federal funds rate, (2) theone-month LIBOR rate or (3) zero percent |
Certain affiliated registered investment companies that are parties to the SCA include portfolios that are subject to a predetermined mathematical formula used to manage certain benefit guarantees offered under variable annuity contracts. The formula may result in large scale asset flows into and out of these portfolios. Consequently, these portfolios may be more likely to utilize the SCA for purposes of funding redemptions. It may be possible for those portfolios to fully exhaust the committed amount of the SCA, thereby requiring the Manager to allocate available funding per a Board-approved methodology designed to treat the Funds in the SCA equitably.
The Series utilized the SCA during the year ended October 31, 2019. The average daily balance for the 103 days that the Series had loans outstanding during the period was approximately $633,961, borrowed at a weighted average interest rate of 3.64%. The maximum loan outstanding amount during the period was $34,703,000. At October 31, 2019, the Series did not have an outstanding loan amount.
8. Risks of Investing in the Series
The Series’ risks include, but are not limited to, some or all of the risks discussed below:
Emerging Markets Risk:The risks of foreign investments are greater for investments in or exposed to emerging markets. Emerging market countries typically have economic and political systems that are less fully developed, and can be expected to be less stable, than those of more developed countries. For example, the economies of such countries can be subject to rapid and unpredictable rates of inflation or deflation. Low trading volumes may result in a lack of liquidity and price volatility.
Equity and Equity-Related Securities Risks:The value of a particular security could go down and you could lose money. In addition to an individual security losing value, the value of the equity markets or a sector in which the Series invests could go down. The Series’ holdings can vary significantly from broad market indexes and the performance of the Series can deviate from the performance of these indexes. Different parts of a market can react differently to adverse issuer, market, regulatory, political and economic developments.
Foreign Securities Risk:The Series’ investments in securities of foreign issuers or issuers with significant exposure to foreign markets involve additional risk. Foreign countries in which the Series may invest may have markets that are less liquid, less regulated and more volatile than US markets. The value of the Series’ investments may decline because of factors affecting the particular issuer as well as foreign markets and issuers generally, such as unfavorable government actions, and political or financial instability.
Market and Credit Risk:Securities markets may be volatile and the market prices of the Series’ securities may decline. Securities fluctuate in price based on changes in an issuer’s financial condition and overall market and economic conditions. If the market prices of the securities owned by the Series fall, the value of an investment in the Series will decline. Additionally, the Series may also be exposed to credit risk in the event that an issuer or guarantor fails to perform or that an institution or entity with which the Series has unsettled or open transactions defaults.
9. Recent Accounting Pronouncements and Reporting Updates
In August 2018, the FASB issued Accounting Standards Update (“ASU”)No. 2018-13, which changes certain fair value measurement disclosure requirements. The new ASU, in addition to other modifications and additions, removes the requirement to disclose the amount and reasons for transfers between Level 1 and Level 2 of the fair value hierarchy,
| | | | |
| PGIM QMA International Equity Fund | | | 47 | |
Notes to Financial Statements(continued)
and the Series’ policy for the timing of transfers between levels. The amendments are effective for financial statements issued for fiscal years beginning after December 15, 2019, and interim periods within those fiscal years. The Manager has evaluated the implications of certain provisions of the ASU and has determined to early adopt aspects related to the removal and modification of certain fair value measurement disclosures under the ASU effective immediately. The Manager continues to evaluate certain other provisions of the ASU and does not expect a material impact to financial statement disclosures.
Financial Highlights
| | | | | | | | | | | | | | | | | | | | |
| Class A Shares | |
| | | Year Ended October 31, | |
| | | 2019 | | | 2018 | | | 2017 | | | 2016 | | | 2015 | |
| Per Share Operating Performance(a): | | | | | | | | | | | | | | | | | | | | |
| Net Asset Value, Beginning of Year | | | $6.96 | | | | $7.95 | | | | $6.48 | | | | $6.65 | | | | $7.36 | |
| Income (loss) from investment operations: | | | | | | | | | | | | | | | | | | | | |
| Net investment income (loss) | | | 0.15 | | | | 0.16 | | | | 0.11 | | | | 0.11 | | | | 0.11 | |
| Net realized and unrealized gain (loss) on investment and foreign currency transactions | | | 0.28 | | | | (1.00 | ) | | | 1.49 | | | | (0.17 | ) | | | (0.65 | ) |
| Total from investment operations | | | 0.43 | | | | (0.84 | ) | | | 1.60 | | | | (0.06 | ) | | | (0.54 | ) |
| Less Dividends and Distributions: | | | | | | | | | | | | | | | | | | | | |
| Dividends from net investment income | | | (0.17 | ) | | | (0.15 | ) | | | (0.13 | ) | | | (0.11 | ) | | | (0.17 | ) |
| Distributions from net realized gains | | | (0.03 | ) | | | - | | | | - | | | | - | | | | - | |
| Total dividends and distributions | | | (0.20 | ) | | | (0.15 | ) | | | (0.13 | ) | | | (0.11 | ) | | | (0.17 | ) |
| Net asset value, end of year | | | $7.19 | | | | $6.96 | | | | $7.95 | | | | $6.48 | | | | $6.65 | |
| Total Return(b): | | | 6.53% | | | | (10.81)% | | | | 25.17% | | | | (0.93)% | | | | (7.37)% | |
| |
| Ratios/Supplemental Data: | |
| Net assets, end of year (000) | | | $173,103 | | | | $171,326 | | | | $207,626 | | | | $185,120 | | | | $211,314 | |
| Average net assets (000) | | | $172,031 | | | | $200,255 | | | | $192,517 | | | | $189,980 | | | | $229,598 | |
| Ratios to average net assets(c)(d): | | | | | | | | | | | | | | | | | | | | |
| Expenses after waivers and/or expense reimbursement | | | 1.48% | | | | 1.34% | | | | 1.58% | | | | 1.66% | | | | 1.62% | |
| Expenses before waivers and/or expense reimbursement | | | 1.62% | | | | 1.47% | | | | 1.59% | | | | 1.66% | | | | 1.62% | |
| Net investment income (loss) | | | 2.19% | | | | 2.08% | | | | 1.62% | | | | 1.69% | | | | 1.39% | |
| Portfolio turnover rate(e) | | | 94% | | | | 114% | | | | 105% | | | | 114% | | | | 111% | |
| (a) | Calculated based on average shares outstanding during the year. |
| (b) | Total return does not consider the effects of sales loads. Total return is calculated assuming a purchase of a share on the first day and a sale on the last day of each year reported and includes reinvestment of dividends and distributions, if any. Total returns may reflect adjustments to conform to generally accepted accounting principles. |
| (c) | Effective August 1, 2017, class specific expenses include transfer agent fees and expenses and registration fees, which are charged to their respective share class. |
| (d) | Does not include expenses of the underlying portfolios in which the Series invests. |
| (e) | The Series’ portfolio turnover rate is calculated in accordance with regulatory requirements, without regard to transactions involving short-term investments and certain derivatives. If such transactions were included, the Series’ portfolio turnover rate may be higher. |
See Notes to Financial Statements.
| | | | |
| PGIM QMA International Equity Fund | | | 49 | |
Financial Highlights(continued)
| | | | | | | | | | | | | | | | | | | | |
| Class B Shares | |
| | | Year Ended October 31, | |
| | | 2019 | | | 2018 | | | 2017 | | | 2016 | | | 2015 | |
| Per Share Operating Performance(a): | | | | | | | | | | | | | | | | | | | | |
| Net Asset Value, Beginning of Year | | | $6.62 | | | | $7.60 | | | | $6.21 | | | | $6.37 | | | | $7.05 | |
| Income (loss) from investment operations: | | | | | | | | | | | | | | | | | | | | |
| Net investment income (loss) | | | 0.05 | | | | 0.07 | | | | 0.05 | | | | 0.06 | | | | 0.05 | |
| Net realized and unrealized gain (loss) on investment and foreign currency transactions | | | 0.30 | | | | (0.96 | ) | | | 1.43 | | | | (0.16 | ) | | | (0.61 | ) |
| Total from investment operations | | | 0.35 | | | | (0.89 | ) | | | 1.48 | | | | (0.10 | ) | | | (0.56 | ) |
| Less Dividends and Distributions: | | | | | | | | | | | | | | | | | | | | |
| Dividends from net investment income | | | (0.08 | ) | | | (0.09 | ) | | | (0.09 | ) | | | (0.06 | ) | | | (0.12 | ) |
| Distributions from net realized gains | | | (0.03 | ) | | | - | | | | - | | | | - | | | | - | |
| Total dividends and distributions | | | (0.11 | ) | | | (0.09 | ) | | | (0.09 | ) | | | (0.06 | ) | | | (0.12 | ) |
| Net asset value, end of year | | | $6.86 | | | | $6.62 | | | | $7.60 | | | | $6.21 | | | | $6.37 | |
| Total Return(b): | | | 5.55% | | | | (11.90)% | | | | 24.12% | | | | (1.55)% | | | | (7.96)% | |
| |
| Ratios/Supplemental Data: | |
| Net assets, end of year (000) | | | $1,049 | | | | $1,723 | | | | $3,020 | | | | $3,080 | | | | $4,774 | |
| Average net assets (000) | | | $1,368 | | | | $2,556 | | | | $2,833 | | | | $3,710 | | | | $5,313 | |
| Ratios to average net assets(c)(d): | | | | | | | | | | | | | | | | | | | | |
| Expenses after waivers and/or expense reimbursement | | | 2.53% | | | | 2.53% | | | | 2.39% | | | | 2.36% | | | | 2.32% | |
| Expenses before waivers and/or expense reimbursement | | | 3.97% | | | | 3.21% | | | | 2.72% | | | | 2.36% | | | | 2.32% | |
| Net investment income (loss) | | | 0.77% | | | | 0.88% | | | | 0.75% | | | | 0.96% | | | | 0.68% | |
| Portfolio turnover rate(e) | | | 94% | | | | 114% | | | | 105% | | | | 114% | | | | 111% | |
| (a) | Calculated based on average shares outstanding during the year. |
| (b) | Total return does not consider the effects of sales loads. Total return is calculated assuming a purchase of a share on the first day and a sale on the last day of each year reported and includes reinvestment of dividends and distributions, if any. Total returns may reflect adjustments to conform to generally accepted accounting principles. |
| (c) | Effective August 1, 2017, class specific expenses include transfer agent fees and expenses and registration fees, which are charged to their respective share class. |
| (d) | Does not include expenses of the underlying portfolios in which the Series invests. |
| (e) | The Series’ portfolio turnover rate is calculated in accordance with regulatory requirements, without regard to transactions involving short-term investments and certain derivatives. If such transactions were included, the Series’ portfolio turnover rate may be higher. |
See Notes to Financial Statements.
| | | | | | | | | | | | | | | | | | | | |
| Class C Shares | |
| | | Year Ended October 31, | |
| | | 2019 | | | 2018 | | | 2017 | | | 2016 | | | 2015 | |
| Per Share Operating Performance(a): | | | | | | | | | | | | | | | | | | | | |
| Net Asset Value, Beginning of Year | | | $6.64 | | | | $7.60 | | | | $6.20 | | | | $6.37 | | | | $7.05 | |
| Income (loss) from investment operations: | | | | | | | | | | | | | | | | | | | | |
| Net investment income (loss) | | | 0.07 | | | | 0.10 | | | | 0.06 | | | | 0.06 | | | | 0.06 | |
| Net realized and unrealized gain (loss) on investment and foreign currency transactions | | | 0.30 | | | | (0.97 | ) | | | 1.43 | | | | (0.17 | ) | | | (0.62 | ) |
| Total from investment operations | | | 0.37 | | | | (0.87 | ) | | | 1.49 | | | | (0.11 | ) | | | (0.56 | ) |
| Less Dividends and Distributions: | | | | | | | | | | | | | | | | | | | | |
| Dividends from net investment income | | | (0.12 | ) | | | (0.09 | ) | | | (0.09 | ) | | | (0.06 | ) | | | (0.12 | ) |
| Distributions from net realized gains | | | (0.03 | ) | | | - | | | | - | | | | - | | | | - | |
| Total dividends and distributions | | | (0.15 | ) | | | (0.09 | ) | | | (0.09 | ) | | | (0.06 | ) | | | (0.12 | ) |
| Net asset value, end of year | | | $6.86 | | | | $6.64 | | | | $7.60 | | | | $6.20 | | | | $6.37 | |
| Total Return(b): | | | 5.77% | | | | (11.52)% | | | | 24.33% | | | | (1.71)% | | | | (7.96)% | |
| |
| Ratios/Supplemental Data: | |
| Net assets, end of year (000) | | | $2,928 | | | | $12,530 | | | | $16,661 | | | | $15,892 | | | | $18,209 | |
| Average net assets (000) | | | $7,163 | | | | $15,626 | | | | $15,736 | | | | $16,416 | | | | $20,086 | |
| Ratios to average net assets(c)(d): | | | | | | | | | | | | | | | | | | | | |
| Expenses after waivers and/or expense reimbursement | | | 2.25% | | | | 2.10% | | | | 2.32% | | | | 2.36% | | | | 2.32% | |
| Expenses before waivers and/or expense reimbursement | | | 2.39% | | | | 2.23% | | | | 2.33% | | | | 2.36% | | | | 2.32% | |
| Net investment income (loss) | | | 1.09% | | | | 1.32% | | | | 0.86% | | | | 0.98% | | | | 0.71% | |
| Portfolio turnover rate(e) | | | 94% | | | | 114% | | | | 105% | | | | 114% | | | | 111% | |
| (a) | Calculated based on average shares outstanding during the year. |
| (b) | Total return does not consider the effects of sales loads. Total return is calculated assuming a purchase of a share on the first day and a sale on the last day of each year reported and includes reinvestment of dividends and distributions, if any. Total returns may reflect adjustments to conform to generally accepted accounting principles. |
| (c) | Effective August 1, 2017, class specific expenses include transfer agent fees and expenses and registration fees, which are charged to their respective share class. |
| (d) | Does not include expenses of the underlying portfolios in which the Series invests. |
| (e) | The Series’ portfolio turnover rate is calculated in accordance with regulatory requirements, without regard to transactions involving short-term investments and certain derivatives. If such transactions were included, the Series’ portfolio turnover rate may be higher. |
See Notes to Financial Statements.
| | | | |
| PGIM QMA International Equity Fund | | | 51 | |
Financial Highlights(continued)
| | | | | | | | | | | | | | | | | | | | |
| Class Z Shares | |
| | | Year Ended October 31, | |
| | | 2019 | | | 2018 | | | 2017 | | | 2016 | | | 2015 | |
| Per Share Operating Performance(a): | | | | | | | | | | | | | | | | | | | | |
| Net Asset Value, Beginning of Year | | | $7.02 | | | | $8.02 | | | | $6.54 | | | | $6.70 | | | | $7.42 | |
| Income (loss) from investment operations: | | | | | | | | | | | | | | | | | | | | |
| Net investment income (loss) | | | 0.18 | | | | 0.19 | | | | 0.11 | | | | 0.13 | | | | 0.13 | |
| Net realized and unrealized gain (loss) on investment and foreign currency transactions | | | 0.29 | | | | (1.02 | ) | | | 1.52 | | | | (0.16 | ) | | | (0.66 | ) |
| Total from investment operations | | | 0.47 | | | | (0.83 | ) | | | 1.63 | | | | (0.03 | ) | | | (0.53 | ) |
| Less Dividends and Distributions: | | | | | | | | | | | | | | | | | | | | |
| Dividends from net investment income | | | (0.20 | ) | | | (0.17 | ) | | | (0.15 | ) | | | (0.13 | ) | | | (0.19 | ) |
| Distributions from net realized gains | | | (0.03 | ) | | | - | | | | - | | | | - | | | | - | |
| Total dividends and distributions | | | (0.23 | ) | | | (0.17 | ) | | | (0.15 | ) | | | (0.13 | ) | | | (0.19 | ) |
| Net asset value, end of year | | | $7.26 | | | | $7.02 | | | | $8.02 | | | | $6.54 | | | | $6.70 | |
| Total Return(b): | | | 7.05% | | | | (10.59)% | | | | 25.46% | | | | (0.44)% | | | | (7.15)% | |
| |
| Ratios/Supplemental Data: | |
| Net assets, end of year (000) | | | $14,753 | | | | $13,901 | | | | $17,344 | | | | $49,675 | | | | $54,726 | |
| Average net assets (000) | | | $13,815 | | | | $17,055 | | | | $21,567 | | | | $50,923 | | | | $55,405 | |
| Ratios to average net assets(c)(d): | | | | | | | | | | | | | | | | | | | | |
| Expenses after waivers and/or expense reimbursement | | | 1.03% | | | | 1.00% | | | | 1.31% | | | | 1.36% | | | | 1.32% | |
| Expenses before waivers and/or expense reimbursement | | | 1.17% | | | | 1.13% | | | | 1.32% | | | | 1.36% | | | | 1.32% | |
| Net investment income (loss) | | | 2.58% | | | | 2.44% | | | | 1.57% | | | | 1.99% | | | | 1.69% | |
| Portfolio turnover rate(e) | | | 94% | | | | 114% | | | | 105% | | | | 114% | | | | 111% | |
| (a) | Calculated based on average shares outstanding during the year. |
| (b) | Total return is calculated assuming a purchase of a share on the first day and a sale on the last day of each year reported and includes reinvestment of dividends and distributions, if any. Total returns may reflect adjustments to conform to generally accepted accounting principles. |
| (c) | Effective August 1, 2017, class specific expenses include transfer agent fees and expenses and registration fees, which are charged to their respective share class. |
| (d) | Does not include expenses of the underlying portfolios in which the Series invests. |
| (e) | The Series’ portfolio turnover rate is calculated in accordance with regulatory requirements, without regard to transactions involving short-term investments and certain derivatives. If such transactions were included, the Series’ portfolio turnover rate may be higher. |
See Notes to Financial Statements.
| | | | | | | | | | | | |
| Class R6 Shares | |
| | | Year Ended October 31, | | | December 28,
2016(a)
through
October 31, 2017 | |
| | | 2019 | | | 2018 | |
| Per Share Operating Performance(b): | | | | | | | | | | | | |
| Net Asset Value, Beginning of Period | | | $7.03 | | | | $8.04 | | | | $6.32 | |
| Income (loss) from investment operations: | | | | | | | | | | | | |
| Net investment income (loss) | | | 0.21 | | | | 0.21 | | | | 0.15 | |
| Net realized and unrealized gain (loss) on investment and foreign currency transactions | | | 0.27 | | | | (1.03 | ) | | | 1.57 | |
| Total from investment operations | | | 0.48 | | | | (0.82 | ) | | | 1.72 | |
| Less Dividends and Distributions: | | | | | | | | | | | | |
| Dividends from net investment income | | | (0.21 | ) | | | (0.19 | ) | | | - | |
| Distributions from net realized gains | | | (0.03 | ) | | | - | | | | - | |
| Total dividends and distributions | | | (0.24 | ) | | | (0.19 | ) | | | - | |
| Net asset value, end of period | | | $7.27 | | | | $7.03 | | | | $8.04 | |
| Total Return(c): | | | 7.33% | | | | (10.43)% | | | | 27.22% | |
| |
| Ratios/Supplemental Data: | |
| Net assets, end of period (000) | | | $5,487 | | | | $36,552 | | | | $39,379 | |
| Average net assets (000) | | | $23,216 | | | | $38,947 | | | | $37,891 | |
| Ratios to average net assets(d)(e): | | | | | | | | | | | | |
| Expenses after waivers and/or expense reimbursement | | | 0.78% | | | | 0.78% | | | | 0.95% | (f) |
| Expenses before waivers and/or expense reimbursement | | | 0.95% | | | | 0.95% | | | | 0.99% | (f) |
| Net investment income (loss) | | | 3.06% | | | | 2.61% | | | | 2.45% | (f) |
| Portfolio turnover rate(g) | | | 94% | | | | 114% | | | | 105% | |
| (a) | Commencement of offering. |
| (b) | Calculated based on average shares outstanding during the period. |
| (c) | Total return is calculated assuming a purchase of a share on the first day and a sale on the last day of each period reported and includes reinvestment of dividends and distributions, if any. Total returns may reflect adjustments to conform to generally accepted accounting principles. Total returns for periods less than one full year are not annualized. |
| (d) | Effective August 1, 2017, class specific expenses include transfer agent fees and expenses and registration fees, which are charged to their respective share class. |
| (e) | Does not include expenses of the underlying portfolios in which the Series invests. |
| (g) | The Series’ portfolio turnover rate is calculated in accordance with regulatory requirements, without regard to transactions involving short-term investments and certain derivatives. If such transactions were included, the Series’ portfolio turnover rate may be higher. |
See Notes to Financial Statements.
| | | | |
| PGIM QMA International Equity Fund | | | 53 | |
Report of Independent Registered Public Accounting Firm
To the Shareholders of PGIM QMA International Equity Fund and Board of Directors
Prudential World Fund, Inc.:
Opinion on the Financial Statements
We have audited the accompanying statement of assets and liabilities of PGIM QMA International Equity Fund, a series of Prudential World Fund, Inc., (the Fund), including the schedule of investments, as of October 31, 2019, the related statement of operations for the year then ended, the statements of changes in net assets for each of the years in the two-year period ended October 31, 2019, and the related notes (collectively, the financial statements) and the financial highlights for the years or period indicated therein. In our opinion, the financial statements and financial highlights present fairly, in all material respects, the financial position of the Fund as of October 31, 2019, the results of its operations for the year then ended, the changes in its net assets for each of the years in the two-year period ended October 31, 2019, and the financial highlights for the years or period indicated therein, in conformity with U.S. generally accepted accounting principles.
Basis for Opinion
These financial statements and financial highlights are the responsibility of the Fund’s management. Our responsibility is to express an opinion on these financial statements and financial highlights based on our audits. We are a public accounting firm registered with the Public Company Accounting Oversight Board (United States) (PCAOB) and are required to be independent with respect to the Fund in accordance with the U.S. federal securities laws and the applicable rules and regulations of the Securities and Exchange Commission and the PCAOB.
We conducted our audits in accordance with the standards of the PCAOB. Those standards require that we plan and perform the audit to obtain reasonable assurance about whether the financial statements and financial highlights are free of material misstatement, whether due to error or fraud. Our audits included performing procedures to assess the risks of material misstatement of the financial statements and financial highlights, whether due to error or fraud, and performing procedures that respond to those risks. Such procedures included examining, on a test basis, evidence regarding the amounts and disclosures in the financial statements and financial highlights. Such procedures also included confirmation of securities owned as of October 31, 2019, by correspondence with the custodian, transfer agent, and brokers, or by other appropriate auditing procedures when replies were not received. Our audits also included evaluating the accounting principles used and significant estimates made by management, as well as evaluating the overall presentation of the financial statements and financial highlights. We believe that our audits provide a reasonable basis for our opinion.

We have served as the auditor of one or more PGIM and/or Prudential Retail investment companies since 2003.
New York, New York
December 16, 2019
Federal Income Tax Information(unaudited)
We are advising you that during the fiscal year ended October 31, 2019, the Fund reports the maximum amount allowed per share, but not less than $0.03 for Class A, B, C, Z, and R6 shares as a capital gain distribution in accordance with Section 852(b)(3)(C) of the Internal Revenue Code.
For the year ended October 31, 2019, the Series reports, the maximum amount allowable under Section 854 of the Internal Revenue Code, but not less than, the following percentage of the ordinary income dividends paid as qualified dividend income (QDI):
| | | | |
| | | QDI | |
PGIM QMA International Equity Fund | | | 78.95 | % |
For the year ended October 31, 2019, the Series made an election to pass through the maximum amount of the portion of the ordinary income dividends paid derived from foreign source income as well as any foreign taxes paid by the Series in accordance with Section 853 of the Internal Revenue Code of the following amounts: $778,867 foreign tax credit from recognized foreign source income of $8,567,514.
In January 2020, you will be advised on IRS Form 1099-DIV or substitute 1099-DIV as to the federal tax status of dividends received by you in calendar year 2019.
| | | | |
| PGIM QMA International Equity Fund | | | 55 | |
INFORMATION ABOUT BOARD MEMBERS AND OFFICERS (unaudited)
Information about Board Members and Officers of the Fund is set forth below. Board Members who are not deemed to be “interested persons” of the Fund, as defined in the 1940 Act, are referred to as “Independent Board Members.” Board Members who are deemed to be “interested persons” of the Fund are referred to as “Interested Board Members.” The Board Members are responsible for the overall supervision of the operations of the Fund and perform the various duties imposed on the directors of investment companies by the 1940 Act. The Board in turn elects the Officers, who are responsible for administering theday-to-day operations of the Fund.
| | | | | | |
| Independent Board Members | | | | |
| | | | |
Name Date of Birth Position(s) Portfolios Overseen | | Principal Occupation(s) During Past Five Years | | Other Directorships
Held During
Past Five Years | | Length of
Board Service |
| | | | |
Ellen S. Alberding 3/11/58 Board Member Portfolios Overseen: 96 | | President and Board Member, The Joyce Foundation (charitable foundation) (since 2002); Vice Chair, City Colleges of Chicago (community college system) (2011-2015); Trustee, National Park Foundation (charitable foundation for national park system) (2009-2018); Trustee, Economic Club of Chicago (since 2009); Trustee, Loyola University (since 2018). | | None. | | Since September 2013 |
| | | | |
Kevin J. Bannon 7/13/52 Board Member Portfolios Overseen: 96 | | Retired; Managing Director (April2008-May 2015) and Chief Investment Officer (October 2008-November 2013) of Highmount Capital LLC (registered investment adviser); formerly Executive Vice President and Chief Investment Officer (April 1993-August 2007) of Bank of New York Company; President (May2003-May 2007) of BNY Hamilton Family of Mutual Funds. | | Director of Urstadt Biddle Properties (equity real estate investment trust) (since September 2008). | | Since July 2008 |
PGIM QMA International Equity Fund
| | | | | | |
| Independent Board Members | | | | |
| | | | |
Name Date of Birth Position(s) Portfolios Overseen | | Principal Occupation(s) During Past Five Years | | Other Directorships
Held During Past Five Years | | Length of
Board Service |
| | | | |
Linda W. Bynoe 7/9/52 Board Member Portfolios Overseen: 96 | | President and Chief Executive Officer (since March 1995) and formerly Chief Operating Officer (December 1989-February 1995) of Telemat Ltd. (management consulting); formerly Vice President (January 1985-June 1989) at Morgan Stanley & Co. (broker-dealer). | | Director of Anixter International, Inc. (communication products distributor) (since January 2006); Director of Northern Trust Corporation (financial services) (since April 2006); Trustee of Equity Residential (residential real estate) (since December 2009). | | Since March 2005 |
| | | | |
Barry H. Evans 11/2/60 Board Member Portfolios Overseen: 95 | | Retired; formerly President (2005 – 2016), Global Chief Operating Officer (2014– 2016), Chief Investment Officer – Global Head of Fixed Income (1998-2014), and various portfolio manager roles (1986-2006), Manulife Asset Management U.S. | | Formerly Director, Manulife Trust Company (2011-2018); formerly Director, Manulife Asset Management Limited (2015-2017); formerly Chairman of the Board of Directors of Manulife Asset Management U.S. (2005-2016); formerly Chairman of the Board, Declaration Investment Management and Research (2008-2016). | | Since September 2017 |
| | | | |
Keith F. Hartstein 10/13/56 Board Member & Independent Chair Portfolios Overseen: 96 | | Retired; Member (since November 2014) of the Governing Council of the Independent Directors Council (organization of independent mutual fund directors); formerly President and Chief Executive Officer (2005-2012), Senior Vice President (2004-2005), Senior Vice President of Sales and Marketing (1997-2004), and various executive management positions (1990-1997), John Hancock Funds, LLC (asset management); Chairman, Investment Company Institute’s Sales Force Marketing Committee (2003-2008). | | None. | | Since September 2013 |
Visit our website at pgiminvestments.com
| | | | | | |
| Independent Board Members | | | | |
| | | | |
Name Date of Birth Position(s) Portfolios Overseen | | Principal Occupation(s) During Past Five Years | | Other Directorships
Held During
Past Five Years | | Length of
Board Service |
| | | | |
Laurie Simon Hodrick 9/29/62 Board Member Portfolios Overseen: 95 | | A. Barton Hepburn Professor Emerita of Economics in the Faculty of Business, Columbia Business School (since 2018); Visiting Professor of Law, Stanford Law School (since 2015); Visiting Fellow at the Hoover Institution, Stanford University (since 2015); Sole Member, ReidCourt LLC (since 2008) (a consulting firm); formerly A. Barton Hepburn Professor of Economics in the Faculty of Business, Columbia Business School (1996-2017); formerly Managing Director, Global Head of Alternative Investment Strategies, Deutsche Bank (2006-2008). | | Independent Director, Synnex Corporation (since April 2019) (information technology); Independent Director, Kabbage, Inc. (since July 2018) (financial services); Independent Director, Corporate Capital Trust (2017-2018) (a business development company). | | Since September 2017 |
| | | | |
Michael S. Hyland, CFA 10/4/45 Board Member Portfolios Overseen: 96 | | Retired (since February 2005); formerly Senior Managing Director (July 2001-February 2005) of Bear Stearns & Co, Inc.; Global Partner, INVESCO (1999-2001); Managing Director and President of Salomon Brothers Asset Management (1989-1999). | | None. | | Since July 2008 |
| | | | |
Brian K. Reid 9/22/61 Board Member Portfolios Overseen: 95 | | Retired; formerly Chief Economist for the Investment Company Institute (ICI) (2005-2017); formerly Senior Economist and Director of Industry and Financial Analysis at the ICI (1998-2004); formerly Senior Economist, Industry and Financial Analysis at the ICI (1996-1998); formerly Staff Economist at the Federal Reserve Board (1989-1996); Director, ICI Mutual Insurance Company (2012-2017). | | None. | | Since March 2018 |
PGIM QMA International Equity Fund
| | | | | | |
Independent Board Members | | | | |
| | | | |
Name Date of Birth Position(s) Portfolios Overseen | | Principal Occupation(s)
During Past Five Years | | Other Directorships
Held During
Past Five Years | | Length of Board Service |
| | | | |
Grace C. Torres 6/28/59 Board Member Portfolios Overseen: 95 | | Retired; formerly Treasurer and Principal Financial and Accounting Officer of the PGIM Funds, Target Funds, Advanced Series Trust, Prudential Variable Contract Accounts and The Prudential Series Fund (1998-June 2014); Assistant Treasurer (March 1999-June 2014) and Senior Vice President (September 1999-June 2014) of PGIM Investments LLC; Assistant Treasurer (May 2003-June 2014) and Vice President (June 2005-June 2014) of AST Investment Services, Inc.; Senior Vice President and Assistant Treasurer (May 2003-June 2014) of Prudential Annuities Advisory Services, Inc. | | Formerly Director (July 2015-January 2018) of Sun Bancorp, Inc. N.A. and Sun National Bank; Director (since January 2018) of OceanFirst Financial Corp. and OceanFirst Bank. | | Since November 2014 |
| | | | | | |
Interested Board Members | | | | |
| | | | |
Name Date of Birth Position(s) Portfolios Overseen | | Principal Occupation(s) During Past Five Years | | Other Directorships
Held During Past Five Years | | Length of Board Service |
| | | | |
Stuart S. Parker 10/5/62 Board Member & President Portfolios Overseen: 96 | | President of PGIM Investments LLC (formerly known as Prudential Investments LLC) (since January 2012); Executive Vice President of Prudential Investment Management Services LLC (since December 2012); formerly Executive Vice President of Jennison Associates LLC and Head of Retail Distribution of PGIM Investments LLC (June 2005-December 2011). | | None. | | Since January 2012 |
Visit our website at pgiminvestments.com
| | | | | | |
Interested Board Members | | | | |
| | | | |
Name Date of Birth Position(s) Portfolios Overseen | | Principal Occupation(s) During Past Five Years | | Other Directorships
Held During
Past Five Years | | Length of
Board Service |
| | | | |
Scott E. Benjamin 5/21/73 Board Member & Vice President Portfolios Overseen:96 | | Executive Vice President (since June 2009) of PGIM Investments LLC; Executive Vice President (June 2009-June 2012) and Vice President (since June 2012) of Prudential Investment Management Services LLC; Executive Vice President (since September 2009) of AST Investment Services, Inc.; Senior Vice President of Product Development and Marketing, PGIM Investments (since February 2006); formerly Vice President of Product Development and Product Management, PGIM Investments LLC (2003-2006). | | None. | | Since March 2010 |
| | | | |
| Fund Officers(a) | | | | |
| | | |
Name Date of Birth Fund Position | | Principal Occupation(s) During Past Five Years | | Length of
Service as Fund Officer |
| | | |
Raymond A. O’Hara 9/11/55 Chief Legal Officer | | Vice President and Corporate Counsel (since July 2010) of Prudential Insurance Company of America (Prudential); Vice President (March 2011-Present) of Pruco Life Insurance Company and Pruco Life Insurance Company of New Jersey; Vice President and Corporate Counsel (March 2011-Present) of Prudential Annuities Life Assurance Corporation; Chief Legal Officer of PGIM Investments LLC (since June 2012); Chief Legal Officer of Prudential Mutual Fund Services LLC (since June 2012) and Corporate Counsel of AST Investment Services, Inc. (since June 2012); formerly Assistant Vice President and Corporate Counsel (September 2008-July 2010) of The Hartford Financial Services Group, Inc.; formerly Associate (September 1980-December 1987) and Partner (January 1988–August 2008) of Blazzard & Hasenauer, P.C. (formerly, Blazzard, Grodd & Hasenauer, P.C.). | | Since June 2012 |
PGIM QMA International Equity Fund
| | | | |
| Fund Officers(a) | | | | |
| | | |
Name Date of Birth Fund Position | | Principal Occupation(s) During Past Five Years | | Length of Service as Fund Officer |
| | | |
Dino Capasso 8/19/74 Chief Compliance Officer | | Chief Compliance Officer (July 2019-Present) of PGIM Investments LLC; Chief Compliance Officer (July 2019-Present) of the PGIM Funds, Target Funds, Advanced Series Trust, The Prudential Series Fund, Prudential’s Gibraltar Fund, Inc., PGIM Global High Yield Fund, Inc., and PGIM High Yield Bond Fund, Inc.; Vice President and Deputy Chief Compliance Officer (June 2017-2019) of PGIM Investments LLC; formerly, Senior Vice President and Senior Counsel (January 2016-June 2017), and Vice President and Counsel (February 2012-December 2015) of Pacific Investment Management Company LLC. | | Since March 2018 |
| | | |
Andrew R. French 12/22/62 Secretary | | Vice President of PGIM Investments LLC (December 2018-Present); formerly Vice President and Corporate Counsel (February 2010-December 2018) of Prudential; formerly Director and Corporate Counsel (2006-2010) of Prudential; Vice President and Assistant Secretary (since January 2007) of PGIM Investments LLC; Vice President and Assistant Secretary (since January 2007) of Prudential Mutual Fund Services LLC. | | Since October 2006 |
| | | |
Jonathan D. Shain 8/9/58 Assistant Secretary | | Vice President and Corporate Counsel (since August 1998) of Prudential; Vice President and Assistant Secretary (since May 2001) of PGIM Investments LLC; Vice President and Assistant Secretary (since February 2001) of Prudential Mutual Fund Services LLC; formerly Vice President and Assistant Secretary (May 2003-June 2005) of AST Investment Services, Inc. | | Since May 2005 |
| | | |
Claudia DiGiacomo 10/14/74 Assistant Secretary | | Vice President and Corporate Counsel (since January 2005) of Prudential; Vice President and Assistant Secretary of PGIM Investments LLC (since December 2005); formerly Associate at Sidley Austin Brown & Wood LLP (1999-2004). | | Since December 2005 |
| | | |
Diana N. Huffman 4/14/82 Assistant Secretary | | Vice President and Corporate Counsel (since September 2015) of Prudential; formerly Associate at Willkie Farr & Gallagher LLP (2009-2015). | | Since March 2019 |
| | | |
Kelly A. Coyne 8/8/68 Assistant Secretary | | Director, Investment Operations of Prudential Mutual Fund Services LLC (since 2010). | | Since March 2015 |
| | | |
Christian J. Kelly 5/5/75 Treasurer and Principal Financial and Accounting Officer | | Vice President, Head of Fund Administration of PGIM Investments LLC (since November 2018); formerly, Director of Fund Administration of Lord Abbett & Co. LLC (2009-2018), Treasurer and Principal Accounting Officer of the Lord Abbett Family of Funds (2017-2018); Director of Accounting, Avenue Capital Group (2008-2009); Senior Manager, Investment Management Practice of Deloitte & Touche LLP (1998-2007). | | Since January 2019 |
Visit our website at pgiminvestments.com
| | | | |
| Fund Officers(a) | | | | |
| | | |
Name Date of Birth Fund Position | | Principal Occupation(s) During Past Five Years | | Length of Service as Fund Officer |
| | | |
Lana Lomuti 6/7/67 Assistant Treasurer | | Vice President (since 2007) and Director (2005-2007), within PGIM Investments Fund Administration; formerly Assistant Treasurer (December 2007-February 2014) of The Greater China Fund, Inc. | | Since April 2014 |
| | | |
Russ Shupak 10/08/73 Assistant Treasurer | | Vice President (since 2017) and Director (2013-2017), within PGIM Investments Fund Administration. | | Since October 2019 |
| | | |
Deborah Conway 3/26/69 Assistant Treasurer | | Vice President (since 2017) and Director (2007-2017), within PGIM Investments Fund Administration. | | Since October 2019 |
| | | |
Elyse M. McLaughlin 1/20/74 Assistant Treasurer | | Vice President (since 2017) and Director (2011-2017), within PGIM Investments Fund Administration. | | Since October 2019 |
| | | |
Charles H. Smith 1/11/73 Anti-Money Laundering Compliance Officer | | Vice President, Corporate Compliance, Anti-Money Laundering Unit (since January 2015) of Prudential; committee member of the American Council of Life Insurers Anti-Money Laundering and Critical Infrastructure Committee (since January 2016); formerly Global Head of Economic Sanctions Compliance at AIG Property Casualty (February 2007-December 2014); Assistant Attorney General at the New York State Attorney General’s Office, Division of Public Advocacy. (August 1998-January 2007). | | Since January 2017 |
(a)Excludes Mr. Parker and Mr. Benjamin, interested Board Members who also serve as President and Vice President, respectively.
Explanatory Notes to Tables:
| ∎ | | Board Members are deemed to be “Interested,” as defined in the 1940 Act, by reason of their affiliation with PGIM Investments LLC and/or an affiliate of PGIM Investments LLC. |
| ∎ | | Unless otherwise noted, the address of all Board Members and Officers is c/o PGIM Investments LLC, 655 Broad Street, Newark, New Jersey 07102-4410. |
| ∎ | | There is no set term of office for Board Members or Officers. The Board Members have adopted a retirement policy, which calls for the retirement of Board Members on December 31 of the year in which they reach the age of 75. |
| ∎ | | “Other Directorships Held” includes only directorships of companies required to register or file reports with the SEC under the 1934 Act (that is, “public companies”) or other investment companies registered under the 1940 Act. |
| ∎ | | “Portfolios Overseen” includes all investment companies managed by PGIM Investments LLC. The investment companies for which PGIM Investments LLC serves as manager include the PGIM Funds, The Prudential Variable Contract Accounts, PGIM ETF Trust, PGIM High Yield Bond Fund, Inc., PGIM Global High Yield Fund, Inc., The Prudential Series Fund, Prudential’s Gibraltar Fund, Inc. and the Advanced Series Trust. |
PGIM QMA International Equity Fund
Approval of Advisory Agreements(unaudited)
The Fund’s Board of Directors
The Board of Directors (the “Board”) of PGIM QMA International Equity Fund (the “Fund”)1 consists of eleven individuals, nine of whom are not “interested persons” of the Fund, as defined in the Investment Company Act of 1940, as amended (the “1940 Act”) (the “Independent Directors”).2 The Board is responsible for the oversight of the Fund and its operations, and performs the various duties imposed on the directors of investment companies by the 1940 Act. The Independent Directors have retained independent legal counsel to assist them in connection with their duties. The Chair of the Board is an Independent Director. The Board has established four standing committees: the Audit Committee, the Nominating and Governance Committee, and two Investment Committees. Each committee is chaired by, and composed of, Independent Directors.
Annual Approval of the Fund’s Advisory Agreements
As required under the 1940 Act, the Board determines annually whether to renew the Fund’s management agreement with PGIM Investments LLC (“PGIM Investments”) and the Fund’s subadvisory agreement with QMA LLC (“QMA”). In considering the renewal of the agreements, the Board, including all of the Independent Directors, met on May 30, 2019 and on June11-13, 2019 and approved the renewal of the agreements through July 31, 2020, after concluding that the renewal of the agreements was in the best interests of the Fund and its shareholders.
In advance of the meetings, the Board requested and received materials relating to the agreements, and had the opportunity to ask questions and request further information in connection with its consideration. Among other things, the Board considered comparative fee information from PGIM Investments and QMA. Also, the Board considered comparisons with other mutual funds in relevant Peer Universes and Peer Groups, as is further discussed below.
In approving the agreements, the Board, including the Independent Directors advised by independent legal counsel, considered the factors it deemed relevant, including the nature, quality and extent of services provided by PGIM Investments and the subadviser, the performance of the Fund, the profitability of PGIM Investments and its affiliates, expenses and fees, and the potential for economies of scale that may be shared with the Fund and its shareholders as the Fund’s assets grow. In their deliberations, the Directors did not identify any single factor which alone was responsible for the Board’s decision to approve the agreements with respect to the Fund. In connection with its deliberations, the Board considered information provided by PGIM Investments throughout the year at regular Board
| 1 | PGIM QMA International Equity Fund is a series of Prudential World Fund, Inc. |
| 2 | Grace C. Torres was an Interested Director of the Fund at the time the Board considered and approved the renewal of the Fund’s advisory agreements, but has since become an Independent Director of the Fund. |
| | |
| PGIM QMA International Equity Fund |
Approval of Advisory Agreements(continued)
meetings, presentations from portfolio managers and other information, as well as information furnished at or in advance of the meetings on May 30, 2019 and on June11-13, 2019.
The Directors determined that the overall arrangements between the Fund and PGIM Investments, which serves as the Fund’s investment manager pursuant to a management agreement, and between PGIM Investments and QMA, which serves as the Fund’s subadviser pursuant to the terms of a subadvisory agreement with PGIM Investments, are in the best interests of the Fund and its shareholders in light of the services performed, fees charged and such other matters as the Directors considered relevant in the exercise of their business judgment.
The material factors and conclusions that formed the basis for the Directors’ reaching their determinations to approve the continuance of the agreements are separately discussed below.
Nature, Quality and Extent of Services
The Board received and considered information regarding the nature, quality and extent of services provided to the Fund by PGIM Investments and QMA. The Board noted that QMA is affiliated with PGIM Investments. The Board considered the services provided by PGIM Investments, including but not limited to the oversight of the subadviser for the Fund, as well as the provision of fund recordkeeping, compliance and other services to the Fund, and PGIM Investments’ role as administrator for the Fund’s liquidity risk management program. With respect to PGIM Investments’ oversight of the subadviser, the Board noted that PGIM Investments’ Strategic Investment Research Group (“SIRG”), which is a business unit of PGIM Investments, is responsible for monitoring and reporting to PGIM Investments’ senior management on the performance and operations of the subadviser. The Board also considered that PGIM Investments pays the salaries of all of the officers and interested Directors of the Fund who are part of Fund management. The Board also considered the investment subadvisory services provided by QMA, including investment research and security selection, as well as adherence to the Fund’s investment restrictions and compliance with applicable Fund policies and procedures. The Board considered PGIM Investments’ evaluation of the subadviser, as well as PGIM Investments’ recommendation, based on its review of the subadviser, to renew the subadvisory agreement.
The Board considered the qualifications, backgrounds and responsibilities of PGIM Investments’ senior management responsible for the oversight of the Fund and QMA, and also considered the qualifications, backgrounds and responsibilities of QMA’s portfolio managers who are responsible for theday-to-day management of the Fund’s portfolio. The Board was provided with information pertaining to PGIM Investments’ and QMA’s organizational structure, senior management, investment operations, and other relevant information pertaining to both PGIM Investments and QMA. The Board also noted that it received favorable compliance reports from the Fund’s Chief Compliance Officer (“CCO”) as to both PGIM Investments and QMA.
| | |
| Visit our website at pgiminvestments.com | | |
The Board concluded that it was satisfied with the nature, extent and quality of the investment management services provided by PGIM Investments and the subadvisory services provided to the Fund by QMA, and that there was a reasonable basis on which to conclude that the Fund benefits from the services provided by PGIM Investments and QMA under the management and subadvisory agreements.
Costs of Services and Profits Realized by PGIM Investments
The Board was provided with information on the profitability of PGIM Investments and its affiliates in serving as the Fund’s investment manager. The Board discussed with PGIM Investments the methodology utilized in assembling the information regarding profitability and considered its reasonableness. The Board recognized that it is difficult to make comparisons of profitability from fund management contracts because comparative information is not generally publicly available and is affected by numerous factors, including the structure of the particular adviser, the types of funds it manages, its business mix, numerous assumptions regarding allocations and the adviser’s capital structure and cost of capital. Taking these factors into account, the Board concluded that the profitability of PGIM Investments and its affiliates in relation to the services rendered was not unreasonable.
Economies of Scale
The Board received and discussed information concerning economies of scale that PGIM Investments may realize as the Fund’s assets grow beyond current levels. The Board noted that the management fee schedule for the Fund includes breakpoints. During the course of time, the Board has considered information regarding the launch date of the Fund, the management fees of the Fund compared to those of similarly managed funds and PGIM Investments’ investment in the Fund over time. The Board noted that economies of scale can be shared with the Fund in other ways, including low management fees from inception, additional technological and personnel investments to enhance shareholder services, and maintaining existing expense structures in the face of a rising cost environment. The Board also considered PGIM Investments’ assertion that it continually evaluates the management fee schedule of the Fund and the potential to share economies of scale through breakpoints or fee waivers as asset levels increase.
The Board recognized the inherent limitations of any analysis of economies of scale, stemming largely from the Board’s understanding that most of PGIM Investments’ costs are not specific to individual funds, but rather are incurred across a variety of products and services.
Other Benefits to PGIM Investments and QMA
The Board considered potential ancillary benefits that might be received by PGIM Investments, QMA and their affiliates as a result of their relationship with the Fund. The
| | |
| PGIM QMA International Equity Fund |
Approval of Advisory Agreements(continued)
Board concluded that potential benefits to be derived by PGIM Investments included transfer agency fees received by the Fund’s transfer agent (which is affiliated with PGIM Investments), and benefits to its reputation as well as other intangible benefits resulting from PGIM Investments’ association with the Fund. The Board concluded that the potential benefits to be derived by QMA included its ability to use soft dollar credits, as well as the potential benefits consistent with those generally resulting from an increase in assets under management, specifically, potential access to additional research resources and benefits to its reputation. The Board concluded that the benefits derived by PGIM Investments and QMA were consistent with the types of benefits generally derived by investment managers and subadvisers to mutual funds.
Performance of the Fund / Fees and Expenses
The Board considered certain additional factors and made related conclusions relating to the historical performance of the Fund for theone-, three-, five- andten-year periods ended December 31, 2018.
The Board also considered the Fund’s actual management fee, as well as the Fund’s net total expense ratio, for the fiscal year ended October 31, 2018. The Board considered the management fee for the Fund as compared to the management fee charged by PGIM Investments to other funds and the fee charged by other advisers to comparable mutual funds in a Peer Group. The actual management fee represents the fee rate actually paid by Fund shareholders and includes any fee waivers or reimbursements. The net total expense ratio for the Fund represents the actual expense ratio incurred by Fund shareholders.
The mutual funds included in the Peer Universe, which was used to consider performance, and the Peer Group, which was used to consider expenses and fees, were objectively determined by Broadridge, an independent provider of mutual fund data. In certain circumstances, PGIM Investments also provided supplemental Peer Universe or Peer Group information for reasons addressed with the Board. The comparisons placed the Fund in various quartiles over various periods, with the first quartile being the best 25% of the mutual funds (for performance, the best performing mutual funds and, for expenses, the lowest cost mutual funds).
The section below summarizes key factors considered by the Board and the Board’s conclusions regarding the Fund’s performance, fees and overall expenses. The table sets forth net performance comparisons (which reflect the impact on performance of fund expenses, or any subsidies, expense caps or waivers that may be applicable) with the Peer Universe, actual management fees with the Peer Group (which reflect the impact of any subsidies or fee waivers), and net total expenses with the Peer Group, each of which were key factors considered by the Board.
| | |
| Visit our website at pgiminvestments.com | | |
| | | | | | | | |
| Net Performance | | 1 Year | | 3 Years | | 5 Years | | 10 Years |
| | 4th Quartile | | 2nd Quartile | | 3rd Quartile | | 3rd Quartile |
| Actual Management Fees:2nd Quartile |
| Net Total Expenses: 3rd Quartile |
| | • | | The Board noted that the Fund underperformed its benchmark index over all periods. |
| | • | | The Board considered PGIM Investments’ assertion that the Fund’s underperformance against its benchmark index and Peer Universe reflected that the Fund was overweight in smaller capitalization growth and quality stocks, which underperformed. |
| | • | | In this regard, the Board considered information provided by PGIM Investments indicating that, for theone-year period ended December 31, 2017, when the stocks overweighted in the Fund were in favor, the Fund outperformed its benchmark index and ranked in the first quartile of its peer universe. |
| | • | | The Board and PGIM Investments agreed to retain the Fund’s existing contractual expense cap which (exclusive of certain fees and expenses) caps total annual operating expenses at 2.53% for Class B shares, and 0.78% for Class R6 shares through February 29, 2020. |
| | • | | In addition, PGIM Investments will waive management fees or shared operating expenses on any share class to the same extent that it waives such expenses on any other share class, and has agreed that total annual fund operating expenses for Class R6 shares will not exceed total annual fund operating expenses for Class Z shares. |
| | • | | The Board noted information provided by PGIM Investments indicating that the Fund’s net total expense ratio was four basis points from the median of the Peer Group. |
| | • | | The Board concluded that, in light of the above, it would be in the best interests of the Fund and its shareholders to renew the agreements. |
| | • | | The Board concluded that the management fees (including subadvisory fees) and total expenses were reasonable in light of the services provided. |
* * *
After full consideration of these factors, the Board concluded that approval of the agreements was in the best interests of the Fund and its shareholders.
| | |
| PGIM QMA International Equity Fund |
Supplement dated December 18, 2019
to the Currently Effective Summary Prospectus, Prospectus
and Statement of Additional Information of the Funds Listed Below
This supplement should be read in conjunction with your Summary Prospectus, Statutory Prospectus and Statement of Additional Information, be retained for future reference and is in addition to any existing Fund supplements.
The Board of Directors/Trustees for each Fund listed below has approved the conversion of all issued and outstanding Class B shares of the Funds to Class A shares of the same Fund, effective on or about June 26, 2020.
As a result, effective on or about the close of business on June 26, 2020, all of the issued and outstanding Class B shares of a Fund will be converted into Class A shares of that Fund with the same relative aggregate net asset value as the Class B shares held immediately prior to the conversion. Class A shares currently have lower total expense ratios, and equal or lower distribution fees and shareholder servicing fees payable under the Fund’s 12b-1 plan than Class B shares. No sales load, fee, or other charge will be imposed on the conversion of these shares. Class A shares are not subject to the contingent deferred sales charge (if any) currently charged on the redemption of Class B shares. Please refer to your Fund’s Prospectus for more information regarding Class A shares. The conversion is not expected to be a taxable event for federal income tax purposes and should not result in recognition of gain or loss by converting shareholders.
LR1263
The Prudential Investment Portfolios, Inc.
PGIM Balanced Fund
PGIM Jennison Focused Value Fund
PGIM Jennison Growth Fund
Prudential Investment Portfolios 3
PGIM Jennison Focused Growth Fund
PGIM QMA Large-Cap Value Fund
PGIM Real Assets Fund
Prudential Investment Portfolios 4
PGIM Muni High Income Fund
Prudential Investment Portfolios 5
PGIM Jennison Diversified Growth Fund
Prudential Investment Portfolios 6
PGIM California Muni Income Fund
Prudential Investment Portfolios 7
PGIM Jennison Value Fund
Prudential Investment Portfolios 9
PGIM QMA Large-Cap Core Equity Fund
Prudential Investment Portfolios, Inc. 10
PGIM Jennison Global Equity Income Fund
PGIM QMA Mid-Cap Value Fund
Prudential Investment Portfolios 12
PGIM Global Real Estate Fund
PGIM US Real Estate Fund
Prudential Investment Portfolios, Inc. 14
PGIM Government Income Fund
Prudential Investment Portfolios, Inc. 15
PGIM High Yield Fund
Prudential Investment Portfolios 16
PGIM Income Builder Fund
Prudential Investment Portfolios, Inc. 17
PGIM Total Return Bond Fund
Prudential Investment Portfolios 18
PGIM Jennison 20/20 Focus Fund
Prudential Global Total Return Fund, Inc.
PGIM Global Total Return Fund
Prudential Jennison Blend Fund, Inc.
PGIM Jennison Blend Fund
Prudential Jennison Mid-Cap Growth Fund, Inc.
PGIM Jennison Mid-Cap Growth Fund
Prudential Jennison Natural Resources Fund, Inc.
PGIM Jennison Natural Resources Fund
Prudential Jennison Small Company Fund, Inc.
PGIM Jennison Small Company Fund
Prudential Government Money Market Fund, Inc.
PGIM Government Money Market Fund
Prudential National Muni Fund, Inc.
PGIM National Muni Fund
Prudential Sector Funds, Inc.
PGIM Jennison Financial Services Fund
PGIM Jennison Health Sciences Fund
PGIM Jennison Utility Fund
Prudential Short-Term Corporate Bond Fund, Inc.
PGIM Short-Term Corporate Bond Fund
Prudential World Fund, Inc.
PGIM QMA International Equity Fund
| | | | |
| | |
| ∎ MAIL | | ∎ TELEPHONE | | ∎ WEBSITE |
655 Broad Street Newark, NJ 07102 | | (800) 225-1852 | | pgiminvestments.com |
|
| PROXY VOTING |
| The Board of Directors of the Fund has delegated to the Fund’s subadviser the responsibility for voting any proxies and maintaining proxy recordkeeping with respect to the Fund. A description of these proxy voting policies and procedures is available without charge, upon request, by calling (800) 225-1852. Information regarding how the Fund voted proxies relating to portfolio securities during the most recent 12-month period ended June 30 is available on the Fund’s website and on the Securities and Exchange Commission’s website. |
|
| DIRECTORS |
| Ellen S. Alberding• Kevin J. Bannon• Scott E. Benjamin• Linda W. Bynoe• Barry H. Evans• Keith F. Hartstein • Laurie Simon Hodrick• Michael S. Hyland• Stuart S. Parker• Brian K. Reid• Grace C. Torres |
|
| OFFICERS |
| Stuart S. Parker,President• Scott E. Benjamin,Vice President• Christian J. Kelly,Treasurer and Principal Financial and Accounting Officer• Raymond A. O’Hara,Chief Legal Officer• Dino Capasso,Chief Compliance Officer• Charles H. Smith,Anti-Money Laundering Compliance Officer• Andrew R. French,Secretary• Jonathan D. Shain,Assistant Secretary• Claudia DiGiacomo,Assistant Secretary• Diana N. Huffman,Assistant Secretary• Kelly A. Coyne,Assistant Secretary• Lana Lomuti,Assistant Treasurer• Russ Shupak,Assistant Treasurer• Elyse McLaughlin,Assistant Treasurer• Deborah Conway,Assistant Treasurer |
| | | | |
| MANAGER | | PGIM Investments LLC | | 655 Broad Street
Newark, NJ 07102 |
|
| SUBADVISER | | QMA LLC | | Gateway Center Two
100 Mulberry Street
Newark, NJ 07102 |
|
| DISTRIBUTOR | | Prudential Investment
Management Services LLC | | 655 Broad Street
Newark, NJ 07102 |
|
| CUSTODIAN | | The Bank of New York Mellon | | 240 Greenwich Street
New York, NY 10286 |
|
| TRANSFER AGENT | | Prudential Mutual Fund
Services LLC | | PO Box 9658
Providence, RI 02940 |
|
| INDEPENDENT REGISTERED PUBLIC ACCOUNTING FIRM | | KPMG LLP | | 345 Park Avenue New York, NY 10154 |
|
| FUND COUNSEL | | Willkie Farr & Gallagher LLP | | 787 Seventh Avenue
New York, NY 10019 |
|
|
| An investor should consider the investment objectives, risks, charges, and expenses of the Fund carefully before investing. The prospectus and summary prospectus contain this and other information about the Fund. An investor may obtain the prospectus and summary prospectus by visiting our website atpgiminvestments.com or by calling(800) 225-1852. The prospectus and summary prospectus should be read carefully before investing. |
|
| E-DELIVERY |
| To receive your mutual fund documents online, go topgiminvestments.com/edelivery and enroll. Instead of receiving printed documents by mail, you will receive notification via email when new materials are available. You can cancel your enrollment or change your email address at any time byvisiting the website address above. |
|
| SHAREHOLDER COMMUNICATIONS WITH DIRECTORS |
| Shareholders can communicate directly with the Board of Directors by writing to the Chair of the Board, PGIM QMA International Equity Fund, PGIM Investments, Attn: Board of Directors, 655 Broad Street, Newark, NJ 07102. Shareholders can communicate directly with an individual Director by writing to the same address. Communications are not screened before being delivered to the addressee. |
|
| AVAILABILITY OF PORTFOLIO HOLDINGS |
| The Fund files its complete schedule of portfolio holdings with the Securities and Exchange Commission on Form N-PORT. The Fund’s Form N-PORT filings are available on the Commission’s website at sec.gov. Form N-PORT is filed with the Commission quarterly, and each Fund’s full portfolio holdings as of the first and third fiscal quarter-ends (as of the third month of the Fund’s fiscal quarter for reporting periods on or after September 30, 2019) will be made publicly available 60 days after the end of each quarter at sec.gov. |
|
| The Fund’s Statement of Additional Information contains additional information about the Fund’s Directors and is available without charge, upon request, by calling (800) 225-1852. |
Mutual Funds:
| | | | |
ARE NOT INSURED BY THE FDIC OR ANY
FEDERAL GOVERNMENT AGENCY | | MAY LOSE VALUE | | ARE NOT A DEPOSIT OF OR GUARANTEED
BY ANY BANK OR ANY BANK AFFILIATE |
PGIM QMA INTERNATIONAL EQUITY FUND
| | | | | | | | | | |
| SHARE CLASS | | A | | B | | C | | Z | | R6 |
| NASDAQ | | PJRAX | | PJRBX | | PJRCX | | PJIZX | | PJRQX |
| CUSIP | | 743969859 | | 743969867 | | 743969875 | | 743969883 | | 743969578 |
MF190E

PGIM EMERGING MARKETS DEBT
LOCAL CURRENCY FUND
ANNUAL REPORT
OCTOBER 31, 2019
COMING SOON: PAPERLESS SHAREHOLDER REPORTS
Beginning on January 1, 2021, as permitted by regulations adopted by the Securities and Exchange Commission, paper copies of the Fund’s annual and semiannual shareholder reports will no longer be sent by mail, unless you specifically request paper copies of the reports. Instead, the reports will be made available on the Fund’s website (pgiminvestments.com), and you will be notified by mail each time a report is posted and provided with a website link to access the report.
If you already elected to receive shareholder reports electronically, you will not be affected by this change and you need not take any action. You may elect to receive shareholder reports and other communications from the Fund electronically anytime by contacting your financial intermediary (such as a broker-dealer or bank) or, if you are a direct investor, by calling 1-800-225-1852 or by sending an email request to PGIM Investments at shareholderreports@pgim.com.
You may elect to receive all future reports in paper free of charge. If you invest through a financial intermediary, you can contact your financial intermediary or follow instructions included with this notice to elect to continue to receive paper copies of your shareholder reports. If you invest directly with the Fund, you can call 1-800-225-1852 or send an email request to shareholderreports@pgim.com to let the Fund know you wish to continue receiving paper copies of your shareholder reports. Your election to receive reports in paper will apply to all funds held in your account if you invest through your financial intermediary or all funds held with the fund complex if you invest directly with the Fund.

To enroll in e-delivery, go to pgiminvestments.com/edelivery
|
Objective:Total return, through a combination of current income and
capital appreciation |
Highlights(unaudited)
| • | | Duration positioning, security selection, and currency selection all added to the Fund’s performance over the reporting period. |
| • | | Long duration positioning in Mexico, Brazil, Indonesia, and Russia added value. |
| • | | Short duration positioning in Colombia and positioning in Turkey detracted from the Fund’s returns over the period. |
| • | | Although yield curve positioning and security selection overall added value, positioning in Indonesia and Turkey specifically hurt performance. |
This report is not authorized for distribution to prospective investors unless preceded or accompanied by a current prospectus.
The views expressed in this report and information about the Fund’s portfolio holdings are for the period covered by this report and are subject to change thereafter.
Mutual funds are distributed by Prudential Investment Management Services LLC (PIMS), member SIPC. PGIM Fixed Income is a unit of PGIM, Inc. (PGIM), a registered investment adviser. PIMS and PGIM are Prudential Financial companies.© 2019 Prudential Financial, Inc. and its related entities. PGIM and the PGIM logo are service marks of Prudential Financial, Inc. and its related entities, registered in many jurisdictions worldwide.
| | |
| 2 | | Visit our website at pgiminvestments.com |
Table of Contents
| | | | |
| PGIM Emerging Markets Debt Local Currency Fund | | | 3 | |
This Page Intentionally Left Blank
Letter from the President

Dear Shareholder:
We hope you find the annual report for the PGIM Emerging Markets Debt Local Currency Fund informative and useful. The report covers performance for the12-month period that ended October 31, 2019.
While the US economy remained healthy, with rising corporate profits and strong job growth, the Federal Reserve cut interest rates three times in the latter half of the period. The cuts were a proactive attempt by the Fed to extend the longest domestic economic expansion on record as growth in many regions weakened. China in particular showed signs of slowing amid trade tensions with the US, and turmoil in the United Kingdom continued as it negotiates an exit from the European Union.
The interest-rate cuts helped boost the performance of stocks globally. For the period overall, large-cap US equities along with stocks in developed and emerging foreign markets all rose by double digits. Small-cap US stocks posted a single-digit gain. This positive performance came despite significant volatility early in the period. Equities plunged at the end of 2018 on concerns about China’s economy, a potential global trade war, higher interest rates, and worries that profit growth might slow. Stocks reversed course early in 2019, rising sharply after the Fed moderated its position on additional rate hikes for the remainder of the year.
The overall US bond market posted strong returns during the period on a significant rally in interest rates that saw the 10-year US Treasury yield decline from over 3% to under 2%. Investment-grade corporate bonds led the way with a double-digit gain, while corporate high yield and municipal bonds each had a return in the high single digits. Globally, bonds in developed markets delivered strong returns, and emerging markets debt rose by double digits.
Regarding your investments with PGIM, we believe it is important to maintain a diversified portfolio of funds consistent with your tolerance for risk, time horizon, and financial goals. Your financial advisor can help you create a diversified investment plan that may include funds covering all the basic asset classes and that reflects your personal investor profile and risk tolerance. However, diversification and asset allocation strategies do not assure a profit or protect against loss in declining markets.
At PGIM Investments, we consider it a great privilege and responsibility to help investors participate in opportunities across global markets while meeting their toughest investment challenges. PGIM is atop-10 global investment manager with more than $1 trillion in assets under management. This scale and investment expertise allow us to deliver actively managed funds and strategies to meet the needs of investors around the globe.
Thank you for choosing our family of funds.
Sincerely,

Stuart S. Parker, President
PGIM Emerging Markets Debt Local Currency Fund
December 16, 2019
| | | | |
| PGIM Emerging Markets Debt Local Currency Fund | | | 5 | |
Your Fund’s Performance (unaudited)
Performance data quoted represents past performance. Past performance does not guarantee future results. The investment return and principal value of an investment will fluctuate, so that an investor’s shares, when redeemed, may be worth more or less than their original cost. Current performance may be lower or higher than the past performance data quoted. An investor may obtain performance data as of the most recent month-end by visiting our website at pgiminvestments.com or by calling (800) 225-1852.
| | | | | | |
| |
| | | Average Annual Total Returns as of 10/31/19
(with sales charges) |
| | | One Year (%) | | Five Years (%) | | Since Inception (%) |
| Class A | | 12.36 | | –0.25 | | –0.24 (3/30/11) |
| Class C | | 14.18 | | –0.36 | | –0.52 (3/30/11) |
| Class Z | | 16.50 | | 0.66 | | 0.44 (3/30/11) |
| Class R6 | | 16.41 | | 0.72 | | 0.49 (3/30/11) |
| JP Morgan Government Bond Index-Emerging Markets Global Diversified Index |
| | | 15.59 | | 0.82 | | 0.83 |
| | | | | | |
| |
| | | Average Annual Total Returns as of 10/31/19
(without sales charges) |
| | | One Year (%) | | Five Years (%) | | Since Inception (%) |
| Class A | | 16.14 | | 0.41 | | 0.15 (3/30/11) |
| Class C | | 15.18 | | –0.36 | | –0.52 (3/30/11) |
| Class Z | | 16.50 | | 0.66 | | 0.44 (3/30/11) |
| Class R6 | | 16.41 | | 0.72 | | 0.49 (3/30/11) |
| JP Morgan Government Bond Index-Emerging Markets Global Diversified Index |
| | | 15.59 | | 0.82 | | 0.83 |
| | |
| 6 | | Visit our website at pgiminvestments.com |
Growth of a $10,000 Investment(unaudited)
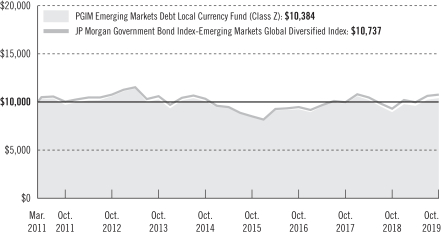
The graph compares a $10,000 investment in the Fund’s Class Z shares with a similar investment in the JP Morgan Government Bond Index-Emerging Markets Global Diversified Index by portraying the initial account values at the commencement of operations for Class Z shares (March 30, 2011) and the account values at the end of the current fiscal year (October 31, 2019), as measured on a quarterly basis. For purposes of the graph, and unless otherwise indicated, it has been assumed that (a) all recurring fees (including management fees) were deducted; and (b) all dividends and distributions were reinvested. The line graph provides information for Class Z shares only. As indicated in the tables provided earlier, performance for other share classes will vary due to the differing charges and expenses applicable to each share class (as indicated in the following paragraphs). Without waiver of fees and/or expense reimbursements, if any, the Fund’s returns would have been lower.
Past performance does not predict future performance. Total returns and the ending account values in the graph include changes in share price and reinvestment of dividends and capital gains distributions in a hypothetical investment for the periods shown. The Fund’s total returns do not reflect the deduction of income taxes on an individual’s investment. Taxes may reduce your actual investment returns on income or gains paid by the Fund or any gains you may realize if you sell your shares.
Source: PGIM Investments LLC, Lipper, Inc. and JP Morgan
Since Inception returns are provided since the Fund has less than 10 fiscal years of returns. Since Inception returns for the Index are measured from the closest month-end to the Fund’s inception date.
| | | | |
| PGIM Emerging Markets Debt Local Currency Fund | | | 7 | |
Your Fund’s Performance(continued)
The returns in the tables do not reflect the deduction of taxes that a shareholder would pay on Fund distributions or following the redemption of Fund shares. The average annual total returns take into account applicable sales charges, which are described for each share class in the table below.
| | | | | | | | |
| | | | | |
| | | Class A | | Class C | | Class Z | | Class R6 |
| Maximum initial sales charge | | For purchases on or after July 15, 2019: 3.25% of the public offering price. For purchases prior to July 15, 2019: 4.50% of the public offering price | | None | | None | | None |
| Contingent deferred sales charge (CDSC) (as a percentage of the lower of the original purchase price or the net asset value at redemption) | | For purchases on or after July 15, 2019: 1.00% on sales of $500,000 or more made within 12 months of purchase. For purchases prior to July 15, 2019: 1.00% on sales of $1 million or more made within 12 months of purchase. | | 1.00% on sales made within 12 months of purchase | | None | | None |
| Annual distribution and service(12b-1) fees (shown as a percentage of average daily net assets) | | 0.25% | | 1.00% | | None | | None |
Benchmark Definitions
JP Morgan Government Bond Index-Emerging Markets Global Diversified Index—The JP Morgan Government Bond Index-Emerging Markets Global Diversified Index, an unmanaged index, is a comprehensive emerging markets debt benchmark that tracks local currency bonds issued by emerging market governments.
Investors cannot invest directly in an index or average. The returns for the Index would be lower if they included the effects of sales charges, operating expenses of a mutual fund, or taxes.
| | | | | | |
|
| Distributions and Yields as of 10/31/19 |
| | Total Distributions
Paid for
12 Months ($) | | SEC 30-Day
Subsidized
Yield* (%) | | SEC 30-Day
Unsubsidized
Yield** (%) |
| Class A | | 0.32 | | 4.45 | | 4.54 |
| Class C | | 0.28 | | 3.85 | | 5.31 |
| Class Z | | 0.34 | | 4.85 | | 4.24 |
| Class R6 | | 0.33
| | 4.85 | | 44.53 |
*SEC 30-Day Subsidized Yield (%)—A standardized yield calculation created by the Securities and Exchange Commission, it reflects the income earned during a 30-day period, after the deduction of the Fund’s net expenses (net of any expense waivers or reimbursements). The investor experience is represented by the SEC 30-Day Subsidized Yield.
**SEC 30-Day Unsubsidized Yield (%)—A standardized yield calculation created by the Securities and Exchange Commission, it reflects the income earned during a 30-day period, after the deduction of the Fund’s gross expenses. The investor experience is represented by the SEC 30-Day Subsidized Yield.
| | |
| 8 | | Visit our website at pgiminvestments.com |
| | | | |
|
| Credit Quality expressed as a percentage of total investments as of 10/31/19 (%) | |
| AAA | | | 0.8 | |
| AA | | | 4.4 | |
| A | | | 28.7 | |
| BBB | | | 41.1 | |
| BB | | | 12.0 | |
| B | | | 7.2 | |
| CCC | | | 0.3 | |
| Not Rated | | | 1.4 | |
| Cash/Cash Equivalents | | | 4.1 | |
| Total Investments | | | 100.0 | |
Source: PGIM Fixed Income
Credit ratings reflect the highest rating assigned by a nationally recognized statistical rating organization (NRSRO) such as Moody’s Investors Service, Inc. (Moody’s), S&P Global Ratings (S&P), or Fitch, Inc. (Fitch). Credit ratings reflect the common nomenclature used by both S&P and Fitch. Where applicable, ratings are converted to the comparable S&P/Fitch rating tier nomenclature. These rating agencies are independent and are widely used. The Not Rated category consists of securities that have not been rated by a NRSRO. Credit ratings are subject to change.
| | | | |
| PGIM Emerging Markets Debt Local Currency Fund | | | 9 | |
Strategy and Performance Overview (unaudited)
How did the Fund perform?
ThePGIM Emerging Markets Debt Local Currency Fund’s Class Z shares returned 16.50% in the12-month reporting period that ended October 31, 2019, outperforming the 15.59% return of the JP Morgan Government Bond Index-Emerging Markets Global Diversified Index (the Index).
What were the market conditions?
| • | | In reviewing fourth-quarter 2018 emerging markets (EM) performance, EM hard currency assets underperformed EM local bond markets—particularly local hedged bonds and emerging markets foreign exchange (EMFX)—with much of the relative underperformance taking place in October and November. In local bonds, there was clearly dominant outperformance in select countries (e.g., Brazil and Turkey), while Mexico was the clear underperformer. Broader factors behind the performance in local EM consisted of a more benign global inflation outlook, lower oil prices (a result of President Trump’s flexibility regarding Iranian sanctions as well as supply dynamics), and a moderation in the US dollar’s foreign exchange (FX) dominance. The latter relates to a slowing of US growth, the outcome of the USmid-term elections, and a repricing of Federal Reserve (Fed) policy expectations. |
| • | | The turn of the year to 2019 roughly marked the bottom of the EM fixed income sell-off. Hedged local bonds and EM currencies lagged hard currency but had respectable positive returns. In hedged local bonds, the winners included previously unloved Mexico, the Philippines, and South Africa. The rally was driven by global macro and emerging market factors. The Fed’s and European Central Bank’s shift to a more accommodative stance was augmented by increased China stimulus, more positive news regarding Argentina’s external accounts and International Monetary Fund (IMF) program, and optimism that pension reform in Brazil may be passed in the third quarter of 2019. |
| • | | Each emerging market debtsub-sector posted positive returns in the second quarter of 2019. The sector continued to benefit from investors’ search for yield amid expectations for Fed rate cuts and ongoing, below-trend growth in most developed markets. The prospects for a global recession in the near to medium term also remained faint given the relatively healthy growth in the US and expectations for additional stimulus from China. The prospect for avoiding a full-blownUS-China trade war is key for EM as further slowing in global trade and EM growth would pose a headwind regardless of policy accommodation from central banks in developed markets. While the global backdrop for EM local rates remained constructive on the back of slowing inflation, below-trend global growth, and generally positive real rates, the recent rally in EM rates seemed over-extended as interest-rate cuts in many countries were priced in and the 5.7% yield on the Index was at a five-year low. Furthermore, almost every country experienced curve flattening as the global data surprised on the downside, central banks turned dovish, |
| | |
| 10 | | Visit our website at pgiminvestments.com |
| | and yield-hungry investors added duration. (Duration is a measure of the interest-rate sensitivity of a bond portfolio or debt securities that is expressed as a number of years.) That said, there are countries where rate cuts are not priced in, but may still materialize. |
| • | | Despite the various headwinds facing EM debt, the sector put forth a resilient performance in the third quarter of 2019. The lack of Argentina-related and Venezuela-related contagion in the quarter reflected the diversity in EM economies, particularly those with high yield ratings, as well as instances of prudent policy planning. For example, Ukraine should benefit from land reform that may be passed as early as the fourth quarter of 2019, while Turkey should continue to stabilize as the country’s external vulnerability diminishes. With PGIM Fixed Income’s expectation that global developed-market rates are likely to remain low, higher-quality credits will likely find support given their relatively strong balance sheets and investors’ demand for duration. EM debt flows generally appear balanced as investors have avoided growth-sensitive assets with modest positioning (excluding Argentina) across the sector. While the global rate backdrop appears constructive amid slowing inflation and below-trend growth, the recent rally in EM rates seems overextended — as most expected interest rate cuts are largely priced in. In a relatively rare occurrence, the correlation between EM local rates and EMFX turned negative and was primarily driven by a lack of FX pass-through to inflation, allowing many EM central banks to maintain their dovish stances. |
| • | | October 2019 was a positive month for EM assets with EM hard currency, hedged local rates, and EMFX all outperforming. In local currency hedged rates, the top performers were Argentina, Russia, and Turkey. After delivering steep rate cuts in July and September, the Turkish central bank followed suit with another sizable reduction of 250 basis points in October. (One basis point is 0.01%.) The bottom performers were Chile, South Africa, and Thailand. South Africa underperformed after its finance minister released a statement detailing the $9.4 billion in bailouts the country will extend to the state-owned utility, Eskom. The package is expected to increase South Africa’s government debt to 70% of gross domestic product over the next three years, which exceeds the previous projection of 60.2% in 2024. |
What worked?
| • | | Duration positioning, security selection, and currency selection all added to the Fund’s performance over the reporting period. |
| • | | Long duration positioning in Mexico, Brazil, Indonesia, and Russia added value. |
| • | | Positioning in Argentina and curve flatteners in Mexico and Czech Republic added to performance, along with the Fund’s allocation to off-benchmark hard currency bonds. |
| | | | |
| PGIM Emerging Markets Debt Local Currency Fund | | | 11 | |
Strategy and Performance Overview (continued)
| • | | Within foreign currencies, an underweight to the Chilean peso and overweights to the Egyptian pound and Russian ruble were positive. |
What didn’t work?
| • | | Short duration positioning in Colombia and positioning in Turkey detracted from the Fund’s returns over the period. |
| • | | Although yield curve positioning and security selection overall added value, positioning in Indonesia and Turkey specifically hurt performance. |
| • | | An overweight to the Turkish lira, coupled with underweights to the Taiwan dollar and South African rand, were negative. |
Did the Fund use derivatives?
| • | | Currency positioning in the Fund was partially facilitated by the use of currency forward and option contracts. During the reporting period, the Fund’s currency positioning added to relative performance. |
| • | | The Fund also used interest-rate swaps to help manage duration and yield curve exposure, which had a negligible impact on performance. |
Current outlook
| • | | Amid a somewhat gloomy outlook conveyed at the recent IMF meetings, PGIM Fixed Income feels that EM assets will continue to benefit from an accommodating monetary stance from global central banks. Moreover, PGIM Fixed Income thinks the IMF is perhaps looking through a rearview mirror. There is consensus that hard currency bonds and local rates will continue to do well, while the outlook for EM currencies is not as clear. A trade truce between China and the US and some clarity on Brexit will further lift sentiment for EM countries. While these countries continue to face headwinds from geopolitics, trade, and populism, digging deep into country-specific issues will likely remain key to alpha generation. |
| • | | In local bond positioning, the Fund features duration overweights to China, Mexico, Korea, and Russia while holding duration underweights in Colombia, Poland, and South Africa. Looking at FX positioning, the Fund features long positions in the Chinese yuan, Singapore dollar and Russian ruble, and is short the euro, Brazilian real, and Hungarian forint. |
| | |
| 12 | | Visit our website at pgiminvestments.com |
Fees and Expenses (unaudited)
As a shareholder of the Fund, you incur two types of costs: (1) transaction costs, including sales charges (loads) on purchase payments and redemptions, as applicable, and (2) ongoing costs, including management fees, distribution, and/or service (12b-1) fees, and other Fund expenses, as applicable. This example is intended to help you understand your ongoing costs (in dollars) of investing in the Fund and to compare these costs with the ongoing costs of investing in other mutual funds.
The example is based on an investment of $1,000 held through the six-month period ended October 31, 2019. The example is for illustrative purposes only; you should consult the Prospectus for information on initial and subsequent minimum investment requirements.
Actual Expenses
The first line for each share class in the table on the following page provides information about actual account values and actual expenses. You may use the information on this line, together with the amount you invested, to estimate the expenses that you paid over the period. Simply divide your account value by $1,000 (for example, an $8,600 account value ÷ $1,000 = 8.6), then multiply the result by the number on the first line under the heading “Expenses Paid During the Six-Month Period” to estimate the expenses you paid on your account during this period.
Hypothetical Example for Comparison Purposes
The second line for each share class in the table on the following page provides information about hypothetical account values and hypothetical expenses based on the Fund’s actual expense ratio and an assumed rate of return of 5% per year before expenses, which is not the Fund’s actual return. The hypothetical account values and expenses may not be used to estimate the actual ending account balance or expenses you paid for the period. You may use this information to compare the ongoing costs of investing in the Fund and other funds. To do so, compare this 5% hypothetical example with the 5% hypothetical examples that appear in the shareholder reports of the other funds.
The Fund’s transfer agent may charge additional fees to holders of certain accounts that are not included in the expenses shown in the table on the following page. These fees apply to individual retirement accounts (IRAs) and Section 403(b) accounts. As of the close of the six-month period covered by the table, IRA fees included an annual maintenance fee of $15 per account (subject to a maximum annual maintenance fee of $25 for all accounts held by the same shareholder). Section 403(b) accounts are charged an annual $25 fiduciary maintenance fee. Some of the fees may vary in amount, or may be waived, based on your total account balance or the number of PGIM funds, including the Fund, that you own. You should consider the additional fees that were charged to your Fund account over the six-month period when you estimate the total ongoing expenses paid over the period
| | | | |
| PGIM Emerging Markets Debt Local Currency Fund | | | 13 | |
Fees and Expenses (continued)
and the impact of these fees on your ending account value, as these additional expenses are not reflected in the information provided in the expense table. Additional fees have the effect of reducing investment returns.
Please note that the expenses shown in the table are meant to highlight your ongoing costs only and do not reflect any transactional costs such as sales charges (loads). Therefore, the second line for each share class in the table is useful in comparing ongoing costs only and will not help you determine the relative total costs of owning different funds. In addition, if these transactional costs were included, your costs would have been higher.
| | | | | | | | | | | | | | | | | | |
| | | | |
PGIM
Emerging Markets Debt
Local Currency Fund | | Beginning Account
Value
May 1, 2019 | | | Ending Account
Value
October 31, 2019 | | | Annualized
Expense Ratio
Based on the
Six-Month Period | | | Expenses Paid
During the
Six-Month Period* | |
| Class A | | Actual | | $ | 1,000.00 | | | $ | 1,081.90 | | | | 1.13 | % | | $ | 5.93 | |
| | Hypothetical | | $ | 1,000.00 | | | $ | 1,019.51 | | | | 1.13 | % | | $ | 5.75 | |
| Class C | | Actual | | $ | 1,000.00 | | | $ | 1,077.50 | | | | 1.88 | % | | $ | 9.84 | |
| | Hypothetical | | $ | 1,000.00 | | | $ | 1,015.73 | | | | 1.88 | % | | $ | 9.55 | |
| Class Z | | Actual | | $ | 1,000.00 | | | $ | 1,082.70 | | | | 0.88 | % | | $ | 4.62 | |
| | Hypothetical | | $ | 1,000.00 | | | $ | 1,020.77 | | | | 0.88 | % | | $ | 4.48 | |
| Class R6 | | Actual | | $ | 1,000.00 | | | $ | 1,082.70 | | | | 0.88 | % | | $ | 4.62 | |
| | | Hypothetical | | $ | 1,000.00 | | | $ | 1,020.77 | | | | 0.88 | % | | $ | 4.48 | |
*Fund expenses (net of fee waivers or subsidies, if any) for each share class are equal to the annualized expense ratio for each share class (provided in the table), multiplied by the average account value over the period, multiplied by the 184 days in the six-month period ended October 31, 2019, and divided by the 365 days in the Fund’s fiscal year ended October 31, 2019 (to reflect the six-month period). Expenses presented in the table include the expenses of any underlying portfolios in which the Fund may invest.
| | |
| 14 | | Visit our website at pgiminvestments.com |
Schedule of Investments
as of October 31, 2019
| | | | | | | | | | | | | | | | |
| | | | |
| Description | | Interest
Rate | | | Maturity
Date | | | Principal
Amount (000)# | | | Value | |
| | | | |
LONG-TERM INVESTMENTS 93.4% | | | | | | | | | | | | | | | | |
| | | | |
SOVEREIGN BONDS 84.9% | | | | | | | | | | | | | | | | |
| | | | |
Angola 0.3% | | | | | | | | | | | | | | | | |
Angolan Government International Bond,
Sr. Unsec’d. Notes | | | 9.500 | % | | | 11/12/25 | | | | 200 | | | $ | 224,988 | |
| | | | |
Argentina 0.3% | | | | | | | | | | | | | | | | |
Argentine Republic Government International Bond,
Sr. Unsec’d. Notes | | | 5.625 | | | | 01/26/22 | | | | 180 | | | | 76,322 | |
Provincia de Buenos Aires/Government Bonds, | | | | | | | | | | | | | | | | |
Sr. Unsec’d. Notes | | | 9.125 | | | | 03/16/24 | | | | 200 | | | | 68,500 | |
Sr. Unsec’d. Notes | | | 9.950 | | | | 06/09/21 | | | | 140 | | | | 53,201 | |
| | | | | | | | | | | | | | | | |
| | | | | | | | | | | | | | | 198,023 | |
| | | | |
Bahrain 0.3% | | | | | | | | | | | | | | | | |
Bahrain Government International Bond,
Sr. Unsec’d. Notes | | | 6.125 | | | | 07/05/22 | | | | 200 | | | | 213,128 | |
| | | | |
Brazil 4.9% | | | | | | | | | | | | | | | | |
Brazil Minas SPE via State of Minas Gerais,
Gov’t. Gtd. Notes | | | 5.333 | | | | 02/15/28 | | | | 392 | | | | 415,973 | |
Brazil Notas do Tesouro Nacional, | | | | | | | | | | | | | | | | |
Notes, Series NTNF | | | 10.000 | | | | 01/01/21 | | | BRL | 1,300 | | | | 344,291 | |
Notes, Series NTNF | | | 10.000 | | | | 01/01/23 | | | BRL | 3,011 | | | | 849,875 | |
Notes, Series NTNF | | | 10.000 | | | | 01/01/25 | | | BRL | 2,736 | | | | 800,901 | |
Notes, Series NTNF | | | 10.000 | | | | 01/01/27 | | | BRL | 3,820 | | | | 1,150,191 | |
Brazilian Government International Bond,
Sr. Unsec’d. Notes | | | 8.500 | | | | 01/05/24 | | | BRL | 54 | | | | 14,541 | |
| | | | | | | | | | | | | | | | |
| | | | | | | | | | | | | | | 3,575,772 | |
| | | | |
Chile 2.9% | | | | | | | | | | | | | | | | |
Bonos de la Tesoreria de la Republica en pesos, | | | | | | | | | | | | | | | | |
Bonds | | | 4.500 | | | | 03/01/26 | | | CLP | 755,000 | | | | 1,103,679 | |
Bonds | | | 5.000 | | | | 03/01/35 | | | CLP | 120,000 | | | | 190,167 | |
Bonds, Series 30YR | | | 6.000 | | | | 01/01/43 | | | CLP | 255,000 | | | | 465,520 | |
Unsec’d. Notes, 144A | | | 4.000 | | | | 03/01/23 | | | CLP | 250,000 | | | | 354,608 | |
| | | | | | | | | | | | | | | | |
| | | | | | | | | | | | | | | 2,113,974 | |
See Notes to Financial Statements.
| | | | |
| PGIM Emerging Markets Debt Local Currency Fund | | | 15 | |
Schedule of Investments(continued)
as of October 31, 2019
| | | | | | | | | | | | | | | | |
| | | | |
| Description | | Interest
Rate | | | Maturity
Date | | | Principal
Amount (000)# | | | Value | |
| | | | |
SOVEREIGN BONDS (Continued) | | | | | | | | | | | | | | | | |
| | | | |
China 0.6% | | | | | | | | | | | | | | | | |
China Government Bond,
Unsec’d. Notes, Series 1906 | | | 3.290 | % | | | 05/23/29 | | | CNH | 3,000 | | | $ | 425,920 | |
| | | | |
Colombia 4.6% | | | | | | | | | | | | | | | | |
Colombian TES, | | | | | | | | | | | | | | | | |
Bonds, Series B | | | 6.000 | | | | 04/28/28 | | | COP | 6,511,000 | | | | 1,950,430 | |
Bonds, Series B | | | 6.250 | | | | 11/26/25 | | | COP | 500,000 | | | | 153,735 | |
Bonds, Series B | | | 7.000 | | | | 06/30/32 | | | COP | 800,000 | | | | 253,877 | |
Bonds, Series B | | | 7.250 | | | | 10/18/34 | | | COP | 829,000 | | | | 269,847 | |
Bonds, Series B | | | 7.500 | | | | 08/26/26 | | | COP | 500,000 | | | | 163,778 | |
Bonds, Series B | | | 10.000 | | | | 07/24/24 | | | COP | 1,500,000 | | | | 532,191 | |
| | | | | | | | | | | | | | | | |
| | | | | | | | | | | | | | | 3,323,858 | |
| | | | |
Czech Republic 1.4% | | | | | | | | | | | | | | | | |
Czech Republic Government Bond, | | | | | | | | | | | | | | | | |
Bonds, Series 053 | | | 4.850 | | | | 11/26/57 | | | CZK | 3,740 | | | | 277,521 | |
Bonds, Series 100 | | | 0.250 | | | | 02/10/27 | | | CZK | 4,300 | | | | 173,038 | |
Bonds, Series 15YR | | | 2.000 | | | | 10/13/33 | | | CZK | 11,920 | | | | 559,009 | |
| | | | | | | | | | | | | | | | |
| | | | | | | | | | | | | | | 1,009,568 | |
| | | | |
Dominican Republic 0.6% | | | | | | | | | | | | | | | | |
Dominican Republic International Bond, | | | | | | | | | | | | | | | | |
Sr. Unsec’d. Notes | | | 5.875 | | | | 04/18/24 | | | | 250 | | | | 266,565 | |
Sr. Unsec’d. Notes | | | 9.750 | | | | 06/05/26 | | | DOP | 8,000 | | | | 154,016 | |
| | | | | | | | | | | | | | | | |
| | | | | | | | | | | | | | | 420,581 | |
| | | | |
Ecuador 0.4% | | | | | | | | | | | | | | | | |
Ecuador Government International Bond,
Sr. Unsec’d. Notes | | | 10.750 | | | | 03/28/22 | | | | 260 | | | | 275,928 | |
| | | | |
Egypt 0.4% | | | | | | | | | | | | | | | | |
Egypt Government International Bond, | | | | | | | | | | | | | | | | |
Sr. Unsec’d. Notes, 144A, MTN | | | 4.750 | | | | 04/11/25 | | | EUR | 175 | | | | 201,888 | |
Sr. Unsec’d. Notes, EMTN | | | 4.750 | | | | 04/11/25 | | | EUR | 100 | | | | 115,365 | |
| | | | | | | | | | | | | | | | |
| | | | | | | | | | | | | | | 317,253 | |
See Notes to Financial Statements.
| | | | | | | | | | | | | | | | |
| | | | |
| Description | | Interest
Rate | | | Maturity
Date | | | Principal
Amount (000)# | | | Value | |
| | | | |
SOVEREIGN BONDS (Continued) | | | | | | | | | | | | | | | | |
| | | | |
El Salvador 0.2% | | | | | | | | | | | | | | | | |
El Salvador Government International Bond,
Sr. Unsec’d. Notes | | | 7.750 | % | | | 01/24/23 | | | | 125 | | | $ | 136,564 | |
| | | | |
Gabon 0.3% | | | | | | | | | | | | | | | | |
Gabon Government International Bond,
Bonds | | | 6.375 | | | | 12/12/24 | | | | 200 | | | | 198,940 | |
| | | | |
Ghana 0.3% | | | | | | | | | | | | | | | | |
Ghana Government International Bond,
Sr. Unsec’d. Notes | | | 7.875 | | | | 08/07/23 | | | | 200 | | | | 217,651 | |
| | | | |
Greece 0.3% | | | | | | | | | | | | | | | | |
Hellenic Republic Government Bond,
Bonds | | | 3.500 | | | | 01/30/23 | | | EUR | 165 | | | | 202,988 | |
| | | | |
Hungary 3.5% | | | | | | | | | | | | | | | | |
Hungary Government Bond, | | | | | | | | | | | | | | | | |
Bonds, Series 22/A | | | 7.000 | | | | 06/24/22 | | | HUF | 154,840 | | | | 619,346 | |
Bonds, Series 25/B | | | 5.500 | | | | 06/24/25 | | | HUF | 276,280 | | | | 1,164,363 | |
Bonds, Series 27/A | | | 3.000 | | | | 10/27/27 | | | HUF | 42,680 | | | | 160,477 | |
Bonds, Series 28/A | | | 6.750 | | | | 10/22/28 | | | HUF | 99,680 | | | | 478,832 | |
Bonds, Series 38/A | | | 3.000 | | | | 10/27/38 | | | HUF | 21,890 | | | | 77,891 | |
| | | | | | | | | | | | | | | | |
| | | | | | | | | | | | | | | 2,500,909 | |
| | | | |
Indonesia 8.7% | | | | | | | | | | | | | | | | |
Indonesia Treasury Bond, | | | | | | | | | | | | | | | | |
Sr. Unsec’d. Notes, Series 056 | | | 8.375 | | | | 09/15/26 | | | IDR | 14,591,000 | | | | 1,135,637 | |
Sr. Unsec’d. Notes, Series 059 | | | 7.000 | | | | 05/15/27 | | | IDR | 7,765,000 | | | | 560,649 | |
Sr. Unsec’d. Notes, Series 063 | | | 5.625 | | | | 05/15/23 | | | IDR | 2,250,000 | | | | 156,946 | |
Sr. Unsec’d. Notes, Series 065 | | | 6.625 | | | | 05/15/33 | | | IDR | 8,200,000 | | | | 549,325 | |
Sr. Unsec’d. Notes, Series 068 | | | 8.375 | | | | 03/15/34 | | | IDR | 7,250,000 | | | | 558,359 | |
Sr. Unsec’d. Notes, Series 070 | | | 8.375 | | | | 03/15/24 | | | IDR | 7,910,000 | | | | 604,309 | |
Sr. Unsec’d. Notes, Series 071 | | | 9.000 | | | | 03/15/29 | | | IDR | 7,310,000 | | | | 588,514 | |
Sr. Unsec’d. Notes, Series 072 | | | 8.250 | | | | 05/15/36 | | | IDR | 10,260,000 | | | | 773,909 | |
Sr. Unsec’d. Notes, Series 073 | | | 8.750 | | | | 05/15/31 | | | IDR | 6,505,000 | | | | 516,092 | |
Sr. Unsec’d. Notes, Series 077 | | | 8.125 | | | | 05/15/24 | | | IDR | 3,500,000 | | | | 265,984 | |
Sr. Unsec’d. Notes, Series 078 | | | 8.250 | | | | 05/15/29 | | | IDR | 7,600,000 | | | | 588,671 | |
Sr. Unsec’d. Notes, Series 079 | | | 8.375 | | | | 04/15/39 | | | IDR | 500,000 | | | | 38,189 | |
| | | | | | | | | | | | | | | | |
| | | | | | | | | | | | | | | 6,336,584 | |
See Notes to Financial Statements.
| | | | |
| PGIM Emerging Markets Debt Local Currency Fund | | | 17 | |
Schedule of Investments(continued)
as of October 31, 2019
| | | | | | | | | | | | | | | | |
| | | | |
| Description | | Interest
Rate | | | Maturity
Date | | | Principal
Amount (000)# | | | Value | |
| | | | |
SOVEREIGN BONDS (Continued) | | | | | | | | | | | | | | | | |
| | | | |
Iraq 0.4% | | | | | | | | | | | | | | | | |
Iraq International Bond,
Sr. Unsec’d. Notes | | | 6.752 | % | | | 03/09/23 | | | | 280 | | | $ | 282,078 | |
| | | | |
Ivory Coast 0.4% | | | | | | | | | | | | | | | | |
Ivory Coast Government International Bond,
Sr. Unsec’d. Notes | | | 5.125 | | | | 06/15/25 | | | EUR | 265 | | | | 319,639 | |
| | | | |
Kenya 0.3% | | | | | | | | | | | | | | | | |
Kenya Government International Bond,
Sr. Unsec’d. Notes | | | 6.875 | | | | 06/24/24 | | | | 200 | | | | 212,203 | |
| | | | |
Malaysia 4.7% | | | | | | | | | | | | | | | | |
Malaysia Government Bond, | | | | | | | | | | | | | | | | |
Sr. Unsec’d. Notes, Series 116 | | | 3.800 | | | | 08/17/23 | | | MYR | 2,000 | | | | 487,415 | |
Sr. Unsec’d. Notes, Series 118 | | | 3.882 | | | | 03/14/25 | | | MYR | 1,977 | | | | 485,596 | |
Sr. Unsec’d. Notes, Series 217 | | | 4.059 | | | | 09/30/24 | | | MYR | 335 | | | | 82,755 | |
Sr. Unsec’d. Notes, Series 311 | | | 4.392 | | | | 04/15/26 | | | MYR | 285 | | | | 72,196 | |
Sr. Unsec’d. Notes, Series 313 | | | 3.480 | | | | 03/15/23 | | | MYR | 1,100 | | | | 265,075 | |
Sr. Unsec’d. Notes, Series 316 | | | 3.900 | | | | 11/30/26 | | | MYR | 3,070 | | | | 754,817 | |
Sr. Unsec’d. Notes, Series 317 | | | 4.762 | | | | 04/07/37 | | | MYR | 500 | | | | 134,711 | |
Sr. Unsec’d. Notes, Series 411 | | | 4.232 | | | | 06/30/31 | | | MYR | 1,770 | | | | 446,813 | |
Sr. Unsec’d. Notes, Series 413 | | | 3.844 | | | | 04/15/33 | | | MYR | 140 | | | | 33,888 | |
Sr. Unsec’d. Notes, Series 417 | | | 3.899 | | | | 11/16/27 | | | MYR | 1,370 | | | | 337,421 | |
Malaysia Government Investment Issue, | | | | | | | | | | | | | | | | |
Sr. Unsec’d. Notes, Series 416 | | | 3.226 | | | | 04/15/20 | | | MYR | 477 | | | | 114,248 | |
Sr. Unsec’d. Notes, Series 617 | | | 4.724 | | | | 06/15/33 | | | MYR | 600 | | | | 157,106 | |
| | | | | | | | | | | | | | | | |
| | | | | | | | | | | | | | | 3,372,041 | |
| | | | |
Mexico 5.7% | | | | | | | | | | | | | | | | |
Mexican Bonos, | | | | | | | | | | | | | | | | |
Bonds, Series M20 | | | 7.500 | | | | 06/03/27 | | | MXN | 34,595 | | | | 1,879,224 | |
Bonds, Series M20 | | | 7.750 | | | | 05/29/31 | | | MXN | 7,800 | | | | 433,632 | |
Bonds, Series M20 | | | 8.000 | | | | 11/07/47 | | | MXN | 16,410 | | | | 939,336 | |
Bonds, Series M30 | | | 10.000 | | | | 11/20/36 | | | MXN | 9,600 | | | | 646,072 | |
Sr. Unsec’d. Notes, Series M30 | | | 8.500 | | | | 11/18/38 | | | MXN | 3,700 | | | | 220,602 | |
| | | | | | | | | | | | | | | | |
| | | | | | | | | | | | | | | 4,118,866 | |
See Notes to Financial Statements.
| | | | | | | | | | | | | | | | |
| | | | |
| Description | | Interest
Rate | | | Maturity
Date | | | Principal
Amount (000)# | | | Value | |
| | | | |
SOVEREIGN BONDS (Continued) | | | | | | | | | | | | | | | | |
| | | | |
Mongolia 0.3% | | | | | | | | | | | | | | | | |
Mongolia Government International Bond,
Sr. Unsec’d. Notes, EMTN | | | 5.125 | % | | | 12/05/22 | | | | 230 | | | $ | 233,211 | |
| | | | |
Pakistan 0.6% | | | | | | | | | | | | | | | | |
Third Pakistan International Sukuk Co. Ltd. (The),
Sr. Unsec’d. Notes, 144A | | | 5.625 | | | | 12/05/22 | | | | 400 | | | | 401,000 | |
| | | | |
Peru 4.0% | | | | | | | | | | | | | | | | |
Peru Government Bond, | | | | | | | | | | | | | | | | |
Bonds | | | 6.950 | | | | 08/12/31 | | | PEN | 190 | | | | 69,469 | |
Sr. Unsec’d. Notes, 144A | | | 6.150 | | | | 08/12/32 | | | PEN | 2,180 | | | | 748,467 | |
Peruvian Government International Bond, | | | | | | | | | | | | | | | | |
Sr. Unsec’d. Notes | | | 6.350 | | | | 08/12/28 | | | PEN | 300 | | | | 104,499 | |
Sr. Unsec’d. Notes | | | 6.900 | | | | 08/12/37 | | | PEN | 871 | | | | 321,707 | |
Sr. Unsec’d. Notes | | | 6.950 | | | | 08/12/31 | | | PEN | 2,198 | | | | 803,644 | |
Sr. Unsec’d. Notes | | | 8.200 | | | | 08/12/26 | | | PEN | 1,797 | | | | 680,462 | |
Unsec’d. Notes | | | 5.700 | | | | 08/12/24 | | | PEN | 500 | | | | 166,452 | |
| | | | | | | | | | | | | | | | |
| | | | | | | | | | | | | | | 2,894,700 | |
| | | | |
Philippines 0.7% | | | | | | | | | | | | | | | | |
Philippine Government Bond, | | | | | | | | | | | | | | | | |
Sr. Unsec’d. Notes, Series 1060 | | | 3.625 | | | | 09/09/25 | | | PHP | 5,600 | | | | 105,035 | |
Sr. Unsec’d. Notes, Series 2023 | | | 6.750 | | | | 01/24/39 | | | PHP | 18,000 | | | | 424,646 | |
| | | | | | | | | | | | | | | | |
| | | | | | | | | | | | | | | 529,681 | |
| | | | |
Poland 4.4% | | | | | | | | | | | | | | | | |
Republic of Poland Government Bond, | | | | | | | | | | | | | | | | |
Bonds, Series 0725 | | | 3.250 | | | | 07/25/25 | | | PLN | 4,640 | | | | 1,307,646 | |
Bonds, Series 0726 | | | 2.500 | | | | 07/25/26 | | | PLN | 6,010 | | | | 1,632,711 | |
Bonds, Series 1024 | | | 2.250 | | | | 10/25/24 | | | PLN | 1,000 | | | | 267,791 | |
| | | | | | | | | | | | | | | | |
| | | | | | | | | | | | | | | 3,208,148 | |
| | | | |
Romania 2.0% | | | | | | | | | | | | | | | | |
Romania Government Bond, | | | | | | | | | | | | | | | | |
Bonds, Series 05YR | | | 4.250 | | | | 06/28/23 | | | RON | 3,770 | | | | 900,986 | |
Bonds, Series 07YR | | | 3.250 | | | | 04/29/24 | | | RON | 750 | | | | 171,935 | |
See Notes to Financial Statements.
| | | | |
| PGIM Emerging Markets Debt Local Currency Fund | | | 19 | |
Schedule of Investments(continued)
as of October 31, 2019
| | | | | | | | | | | | | | | | |
| | | | |
| Description | | Interest
Rate | | | Maturity
Date | | | Principal
Amount (000)# | | | Value | |
| | | | |
SOVEREIGN BONDS (Continued) | | | | | | | | | | | | | | | | |
| | | | |
Romania (cont’d.) | | | | | | | | | | | | | | | | |
Romania Government Bond, (cont’d.) | | | | | | | | | | | | | | | | |
Bonds, Series 10YR | | | 5.850 | % | | | 04/26/23 | | | RON | 960 | | | $ | 241,010 | |
Bonds, Series 15YR | | | 3.650 | | | | 09/24/31 | | | RON | 590 | | | | 127,926 | |
| | | | | | | | | | | | | | | | |
| | | | | | | | | | | | | | | 1,441,857 | |
| | | | |
Russia 5.5% | | | | | | | | | | | | | | | | |
Russian Federal Bond - OFZ, | | | | | | | | | | | | | | | | |
Bonds, Series 6218 | | | 8.500 | | | | 09/17/31 | | | RUB | 14,092 | | | | 255,815 | |
Bonds, Series 6219 | | | 7.750 | | | | 09/16/26 | | | RUB | 22,600 | | | | 382,233 | |
Bonds, Series 6221 | | | 7.700 | | | | 03/23/33 | | | RUB | 27,090 | | | | 465,142 | |
Bonds, Series 6223 | | | 6.500 | | | | 02/28/24 | | | RUB | 11,200 | | | | 177,511 | |
Bonds, Series 6226 | | | 7.950 | | | | 10/07/26 | | | RUB | 79,490 | | | | 1,355,579 | |
Bonds, Series 6228 | | | 7.650 | | | | 04/10/30 | | | RUB | 28,800 | | | | 491,494 | |
Bonds, Series 6229 | | | 7.150 | | | | 11/12/25 | | | RUB | 25,700 | | | | 419,232 | |
Bonds, Series 6230 | | | 7.700 | | | | 03/16/39 | | | RUB | 27,200 | | | | 473,195 | |
| | | | | | | | | | | | | | | | |
| | | | | | | | | | | | | | | 4,020,201 | |
| | | | |
South Africa 11.9% | | | | | | | | | | | | | | | | |
Republic of South Africa Government Bond, | | | | | | | | | | | | | | | | |
Sr. Unsec’d. Notes, Series 2023 | | | 7.750 | | | | 02/28/23 | | | ZAR | 1,500 | | | | 99,914 | |
Sr. Unsec’d. Notes, Series 2030 | | | 8.000 | | | | 01/31/30 | | | ZAR | 2,300 | | | | 139,952 | |
Sr. Unsec’d. Notes, Series 2032 | | | 8.250 | | | | 03/31/32 | | | ZAR | 30,600 | | | | 1,833,543 | |
Sr. Unsec’d. Notes, Series 2035 | | | 8.875 | | | | 02/28/35 | | | ZAR | 2,490 | | | | 152,983 | |
Sr. Unsec’d. Notes, Series 2037 | | | 8.500 | | | | 01/31/37 | | | ZAR | 12,850 | | | | 748,778 | |
Sr. Unsec’d. Notes, Series 2040 | | | 9.000 | | | | 01/31/40 | | | ZAR | 10,450 | | | | 629,306 | |
Sr. Unsec’d. Notes, Series 2044 | | | 8.750 | | | | 01/31/44 | | | ZAR | 10,485 | | | | 608,424 | |
Sr. Unsec’d. Notes, Series 2048 | | | 8.750 | | | | 02/28/48 | | | ZAR | 12,075 | | | | 696,107 | |
Sr. Unsec’d. Notes, Series R186 | | | 10.500 | | | | 12/21/26 | | | ZAR | 44,648 | | | | 3,241,364 | |
Sr. Unsec’d. Notes, Series R213 | | | 7.000 | | | | 02/28/31 | | | ZAR | 7,830 | | | | 431,957 | |
| | | | | | | | | | | | | | | | |
| | | | | | | | | | | | | | | 8,582,328 | |
| | | | |
Sri Lanka 0.6% | | | | | | | | | | | | | | | | |
Sri Lanka Government International Bond,
Sr. Unsec’d. Notes | | | 6.250 | | | | 07/27/21 | | | | 400 | | | | 406,800 | |
| | | | |
Thailand 7.4% | | | | | | | | | | | | | | | | |
Thailand Government Bond, | | | | | | | | | | | | | | | | |
Sr. Unsec’d. Notes | | | 2.125 | | | | 12/17/26 | | | THB | 19,520 | | | | 672,185 | |
Sr. Unsec’d. Notes | | | 2.875 | | | | 12/17/28 | | | THB | 22,100 | | | | 813,101 | |
See Notes to Financial Statements.
| | | | | | | | | | | | | | | | |
| | | | |
| Description | | Interest
Rate | | | Maturity
Date | | | Principal
Amount (000)# | | | Value | |
| | | | |
SOVEREIGN BONDS (Continued) | | | | | | | | | | | | | | | | |
| | | | |
Thailand (cont’d.) | | | | | | | | | | | | | | | | |
Thailand Government Bond, (cont’d.) | | | | | | | | | | | | | | | | |
Sr. Unsec’d. Notes | | | 2.875 | % | | | 06/17/46 | | | THB | 3,150 | | | $ | 128,219 | |
Sr. Unsec’d. Notes | | | 3.300 | | | | 06/17/38 | | | THB | 8,700 | | | | 362,368 | |
Sr. Unsec’d. Notes | | | 3.400 | | | | 06/17/36 | | | THB | 32,250 | | | | 1,335,187 | |
Sr. Unsec’d. Notes | | | 3.625 | | | | 06/16/23 | | | THB | 8,530 | | | | 304,232 | |
Sr. Unsec’d. Notes | | | 3.650 | | | | 06/20/31 | | | THB | 19,600 | | | | 789,902 | |
Sr. Unsec’d. Notes | | | 3.775 | | | | 06/25/32 | | | THB | 8,200 | | | | 338,514 | |
Sr. Unsec’d. Notes | | | 4.875 | | | | 06/22/29 | | | THB | 15,170 | | | | 650,066 | |
| | | | | | | | | | | | | | | | |
| | | | | | | | | | | | | | | 5,393,774 | |
| | | | |
Turkey 4.6% | | | | | | | | | | | | | | | | |
Export Credit Bank of Turkey, | | | | | | | | | | | | | | | | |
Sr. Unsec’d. Notes | | | 4.250 | | | | 09/18/22 | | | | 250 | | | | 240,000 | |
Sr. Unsec’d. Notes | | | 8.250 | | | | 01/24/24 | | | | 220 | | | | 234,652 | |
Turkey Government Bond, | | | | | | | | | | | | | | | | |
Bonds | | | 8.000 | | | | 03/12/25 | | | TRY | 2,770 | | | | 396,175 | |
Bonds | | | 8.800 | | | | 09/27/23 | | | TRY | 500 | | | | 77,791 | |
Bonds | | | 9.200 | | | | 09/22/21 | | | TRY | 3,745 | | | | 624,576 | |
Bonds | | | 10.500 | | | | 08/11/27 | | | TRY | 1,800 | | | | 283,353 | |
Bonds | | | 10.700 | | | | 02/17/21 | | | TRY | 175 | | | | 30,165 | |
Bonds | | | 11.000 | | | | 03/02/22 | | | TRY | 1,500 | | | | 255,752 | |
Bonds | | | 11.000 | | | | 02/24/27 | | | TRY | 1,600 | | | | 259,146 | |
Bonds | | | 12.200 | | | | 01/18/23 | | | TRY | 4,515 | | | | 788,136 | |
Turkey Government International Bond,
Sr. Unsec’d. Notes | | | 7.375 | | | | 02/05/25 | | | | 155 | | | | 166,237 | |
| | | | | | | | | | | | | | | | |
| | | | | | | | | | | | | | | 3,355,983 | |
| | | | |
Ukraine 1.2% | | | | | | | | | | | | | | | | |
Ukraine Government International Bond, | | | | | | | | | | | | | | | | |
Bonds | | | 15.879 | (s) | | | 04/01/20 | | | UAH | 5,330 | | | | 200,999 | |
Bonds | | | 16.000 | | | | 08/11/21 | | | UAH | 500 | | | | 20,313 | |
Bonds | | | 17.000 | | | | 05/11/22 | | | UAH | 500 | | | | 20,712 | |
Sr. Unsec’d. Notes | | | 7.750 | | | | 09/01/22 | | | | 325 | | | | 345,637 | |
Unsec’d. Notes | | | 15.700 | | | | 01/08/20 | | | UAH | 4,095 | | | | 165,111 | |
Unsec’d. Notes, 144A | | | 15.360 | | | | 09/29/21 | | | UAH | 2,070 | | | | 84,556 | |
| | | | | | | | | | | | | | | | |
| | | | | | | | | | | | | | | 837,328 | |
See Notes to Financial Statements.
| | | | |
| PGIM Emerging Markets Debt Local Currency Fund | | | 21 | |
Schedule of Investments(continued)
as of October 31, 2019
| | | | | | | | | | | | | | | | |
| | | | |
| Description | | Interest
Rate | | | Maturity
Date | | | Principal
Amount (000)# | | | Value | |
| | | | |
SOVEREIGN BONDS (Continued) | | | | | | | | | | | | | | | | |
| | | | |
Uruguay 0.2% | | | | | | | | | | | | | | | | |
Uruguay Government International Bond, | | | | | | | | | | | | | | | | |
Sr. Unsec’d. Notes | | | 9.875 | % | | | 06/20/22 | | | UYU | 3,260 | | | $ | 84,896 | |
Sr. Unsec’d. Notes, 144A | | | 8.500 | | | | 03/15/28 | | | UYU | 1,870 | | | | 41,460 | |
| | | | | | | | | | | | | | | | |
| | | | | | | | | | | | | | | 126,356 | |
| | | | | | | | | | | | | | | | |
TOTAL SOVEREIGN BONDS
(cost $60,175,652) | | | | | | | | | | | | | | | 61,428,823 | |
| | | | | | | | | | | | | | | | |
| | | | |
CORPORATE BONDS 8.5% | | | | | | | | | | | | | | | | |
| | | | |
Bahrain 0.3% | | | | | | | | | | | | | | | | |
Oil and Gas Holding Co. BSCC (The),
Sr. Unsec’d. Notes | | | 7.625 | | | | 11/07/24 | | | | 200 | | | | 226,500 | |
| | | | |
Belarus 0.3% | | | | | | | | | | | | | | | | |
Development Bank of the Republic of Belarus JSC,
Sr. Unsec’d. Notes, 144A | | | 6.750 | | | | 05/02/24 | | | | 200 | | | | 209,876 | |
| | | | |
Brazil 0.3% | | | | | | | | | | | | | | | | |
Petrobras Global Finance BV,
Gtd. Notes | | | 8.750 | | | | 05/23/26 | | | | 165 | | | | 211,200 | |
| | | | |
Indonesia 0.3% | | | | | | | | | | | | | | | | |
Saka Energi Indonesia PT,
Sr. Unsec’d. Notes | | | 4.450 | | | | 05/05/24 | | | | 225 | | | | 227,259 | |
| | | | |
Jamaica 0.2% | | | | | | | | | | | | | | | | |
Digicel Ltd.,
Gtd. Notes | | | 6.750 | | | | 03/01/23 | | | | 235 | | | | 123,377 | |
| | | | |
Kazakhstan 0.4% | | | | | | | | | | | | | | | | |
KazMunayGas National Co. JSC,
Sr. Unsec’d. Notes | | | 4.750 | | | | 04/24/25 | | | | 260 | | | | 283,707 | |
| | | | |
Mexico 1.8% | | | | | | | | | | | | | | | | |
America Movil SAB de CV,
Sr. Unsec’d. Notes | | | 6.450 | | | | 12/05/22 | | | MXN | 14,250 | | | | 718,852 | |
Petroleos Mexicanos,
Gtd. Notes, 144A | | | 6.490 | | | | 01/23/27 | | | | 55 | | | | 58,713 | |
See Notes to Financial Statements.
| | | | | | | | | | | | | | | | |
| | | | |
| Description | | Interest
Rate | | | Maturity
Date | | | Principal
Amount (000)# | | | Value | |
| | | | |
CORPORATE BONDS (Continued) | | | | | | | | | | | | | | | | |
| | | | |
Mexico (cont’d.) | | | | | | | | | | | | | | | | |
Petroleos Mexicanos, (cont’d.) | | | | | | | | | | | | | | | | |
Gtd. Notes, 144A | | | 7.650 | % | | | 11/24/21 | | | MXN | 4,120 | | | $ | 208,641 | |
Gtd. Notes, MTN | | | 6.875 | | | | 08/04/26 | | | | 315 | | | | 344,610 | |
| | | | | | | | | | | | | | | | |
| | | | | | | | | | | | | | | 1,330,816 | |
| | | | |
Oman 0.3% | | | | | | | | | | | | | | | | |
Lamar Funding Ltd.,
Gtd. Notes | | | 3.958 | | | | 05/07/25 | | | | 200 | | | | 186,737 | |
| | | | |
Russia 3.2% | | | | | | | | | | | | | | | | |
Gazprom Capital OOO, | | | | | | | | | | | | | | | | |
Gtd. Notes, Series BO03 | | | 7.150 | (cc) | | | 02/15/28 | | | RUB | 90,000 | | | | 1,403,844 | |
Gtd. Notes, Series BO05 | | | 8.900 | (cc) | | | 02/03/27 | | | RUB | 42,000 | | | | 708,706 | |
Vnesheconombank Via VEB Finance PLC,
Sr. Unsec’d. Notes | | | 5.942 | | | | 11/21/23 | | | | 200 | | | | 219,862 | |
| | | | | | | | | | | | | | | | |
| | | | | | | | | | | | | | | 2,332,412 | |
| | | | |
South Africa 0.3% | | | | | | | | | | | | | | | | |
Eskom Holdings SOC Ltd.,
Sr. Unsec’d. Notes, 144A, MTN | | | 6.750 | | | | 08/06/23 | | | | 200 | | | | 205,164 | |
| | | | |
Supranational Bank 0.7% | | | | | | | | | | | | | | | | |
European Bank for Reconstruction & Development,
Sr. Unsec’d. Notes, GMTN | | | 6.450 | | | | 12/13/22 | | | IDR | 7,500,000 | | | | 534,676 | |
| | | | |
Tunisia 0.4% | | | | | | | | | | | | | | | | |
Banque Centrale de Tunisie International Bond, | | | | | | | | | | | | | | | | |
Sr. Unsec’d. Notes | | | 5.625 | | | | 02/17/24 | | | EUR | 180 | | | | 196,173 | |
Sr. Unsec’d. Notes | | | 6.750 | | | | 10/31/23 | | | EUR | 100 | | | | 112,411 | |
| | | | | | | | | | | | | | | | |
| | | | | | | | | | | | | | | 308,584 | |
| | | | | | | | | | | | | | | | |
TOTAL CORPORATE BONDS
(cost $6,273,569) | | | | | | | | | | | | | | | 6,180,308 | |
| | | | | | | | | | | | | | | | |
TOTAL LONG-TERM INVESTMENTS
(cost $66,449,221) | | | | | | | | | | | | | | | 67,609,131 | |
| | | | | | | | | | | | | | | | |
See Notes to Financial Statements.
| | | | |
| PGIM Emerging Markets Debt Local Currency Fund | | | 23 | |
Schedule of Investments(continued)
as of October 31, 2019
| | | | | | | | | | | | | | | | |
| | | | |
| Description | | | | | | | | Shares | | | Value | |
| | | | |
SHORT-TERM INVESTMENT 3.4% | | | | | | | | | | | | | | | | |
| | | | |
AFFILIATED MUTUAL FUND | | | | | | | | | | | | | | | | |
PGIM Core Ultra Short Bond Fund
(cost $2,483,525)(w) | | | | | | | | | | | 2,483,525 | | | $ | 2,483,525 | |
| | | | | | | | | | | | | | | | |
| | | | |
TOTAL INVESTMENTS 96.8%
(cost $68,932,746) | | | | | | | | | | | | | | | 70,092,656 | |
Other assets in excess of liabilities(z) 3.2% | | | | | | | | | | | | | | | 2,308,399 | |
| | | | | | | | | | | | | | | | |
| | | | |
NET ASSETS 100.0% | | | | | | | | | | | | | | $ | 72,401,055 | |
| | | | | | | | | | | | | | | | |
Below is a list of the abbreviation(s) used in the annual report:
ARS—Argentine Peso
BRL—Brazilian Real
CAD—Canadian Dollar
CHF—Swiss Franc
CLP—Chilean Peso
CNH—Chinese Renminbi
COP—Colombian Peso
CZK—Czech Koruna
DOP—Dominican Peso
EGP—Egyptian Pound
EUR—Euro
HUF—Hungarian Forint
IDR—Indonesian Rupiah
ILS—Israeli Shekel
INR—Indian Rupee
JPY—Japanese Yen
KRW—South Korean Won
MXN—Mexican Peso
MYR—Malaysian Ringgit
NZD—New Zealand Dollar
PEN—Peruvian Nuevo Sol
PHP—Philippine Peso
PLN—Polish Zloty
RON—Romanian Leu
RUB—Russian Ruble
SGD—Singapore Dollar
THB—Thai Baht
TRY—Turkish Lira
TWD—New Taiwanese Dollar
UAH—Ukraine Hryvna
USD—US Dollar
UYU—Uruguayan Peso
ZAR—South African Rand
144A—Security was purchased pursuant to Rule 144A under the Securities Act of 1933 and, pursuant to the requirements of Rule 144A, may not be resold except to qualified institutional buyers.
A—Annual payment frequency for swaps
BROIS—Brazil Overnight Index Swap
See Notes to Financial Statements.
CLOIS—Sinacofi Chile Interbank Rate Average
COOIS—Colombia Overnight Interbank Reference Rate
EMTN—Euro Medium Term Note
GMTN—Global Medium Term Note
JIBAR—Johannesburg Interbank Agreed Rate
KLIBOR—Kuala Lumpur Interbank Offered Rate
KWCDC—Korean Won Certificate of Deposit
LIBOR—London Interbank Offered Rate
M—Monthly payment frequency for swaps
MTN—Medium Term Note
OFZ—Obligatsyi Federal’novo Zaima (Federal Loan Obligations)
OTC—Over-the-counter
Q—Quarterly payment frequency for swaps
S—Semiannual payment frequency for swaps
T—Swap payment upon termination
WIBOR—Warsaw Interbank Offered Rate
| # | Principal or notional amount is shown in U.S. dollars unless otherwise stated. |
| (cc) | Variable rate instrument. The rate shown is based on the latest available information as of October 31, 2019. Certain variable rate securities are not based on a published reference rate and spread but are determined by the issuer or agent and are based on current market conditions. These securities do not indicate a reference rate and spread in their description. |
| (s) | Represents zero coupon bond or principal only security. Rate represents yield to maturity at purchase date. |
| (w) | PGIM Investments LLC, the manager of the Series, also serves as manager of the PGIM Core Ultra Short Bond Fund. |
| (z) | Includes net unrealized appreciation/(depreciation) and/or market value of the below holdings which are excluded from the Schedule of Investments: |
Forward foreign currency exchange contracts outstanding at October 31, 2019:
| | | | | | | | | | | | | | | | | | | | | | |
Purchase Contracts | | Counterparty | | Notional
Amount
(000) | | | Value at
Settlement
Date | | | Current
Value | | | Unrealized
Appreciation | | | Unrealized
Depreciation | |
OTC Forward Foreign Currency Exchange Contracts: | | | | | |
Argentine Peso, | | | | | | | | | | | | | | | | | | | | | | |
Expiring 11/29/19 | | Citibank, N.A. | | ARS | 11,168 | | | $ | 212,731 | | | $ | 167,032 | | | $ | — | | | $ | (45,699 | ) |
Expiring 11/29/19 | | Citibank, N.A. | | ARS | 3,740 | | | | 71,574 | | | | 55,931 | | | | — | | | | (15,643 | ) |
Brazilian Real, | | | | | | | | | | | | | | | | | | | | | | |
Expiring 11/04/19 | | Citibank, N.A. | | BRL | 916 | | | | 220,526 | | | | 228,302 | | | | 7,776 | | | | — | |
Expiring 11/04/19 | | JPMorgan Chase Bank, N.A. | | BRL | 4,440 | | | | 1,090,400 | | | | 1,106,731 | | | | 16,331 | | | | — | |
Expiring 11/04/19 | | The Toronto-Dominion Bank | | BRL | 11,529 | | | | 2,765,989 | | | | 2,873,823 | | | | 107,834 | | | | — | |
Expiring 12/03/19 | | Barclays Bank PLC | | BRL | 254 | | | | 63,000 | | | | 63,082 | | | | 82 | | | | — | |
Expiring 12/03/19 | | BNP Paribas S.A. | | BRL | 15,005 | | | | 3,756,249 | | | | 3,733,756 | | | | — | | | | (22,493 | ) |
Expiring 12/03/19 | | Morgan Stanley & Co.
International PLC | | BRL | 826 | | | | 205,363 | | | | 205,528 | | | | 165 | | | | — | |
See Notes to Financial Statements.
| | | | |
| PGIM Emerging Markets Debt Local Currency Fund | | | 25 | |
Schedule of Investments (continued)
as of October 31, 2019
Forward foreign currency exchange contracts outstanding at October 31, 2019 (continued):
| | | | | | | | | | | | | | | | | | | | | | |
Purchase Contracts | | Counterparty | | Notional
Amount
(000) | | | Value at
Settlement
Date | | | Current
Value | | | Unrealized
Appreciation | | | Unrealized
Depreciation | |
OTC Forward Foreign Currency Exchange Contracts (cont’d.): | |
Chilean Peso, | | | | | | | | | | | | | | | | | | | | | | |
Expiring 12/18/19 | | Barclays Bank PLC | | CLP | 87,779 | | | $ | 123,000 | | | $ | 118,507 | | | $ | — | | | $ | (4,493 | ) |
Expiring 12/18/19 | | BNP Paribas S.A. | | CLP | 203,807 | | | | 280,980 | | | | 275,153 | | | | — | | | | (5,827 | ) |
Expiring 12/18/19 | | BNP Paribas S.A. | | CLP | 129,646 | | | | 179,362 | | | | 175,030 | | | | — | | | | (4,332 | ) |
Expiring 12/18/19 | | BNP Paribas S.A. | | CLP | 103,780 | | | | 144,050 | | | | 140,110 | | | | — | | | | (3,940 | ) |
Expiring 12/18/19 | | BNP Paribas S.A. | | CLP | 96,406 | | | | 133,600 | | | | 130,154 | | | | — | | | | (3,446 | ) |
Expiring 12/18/19 | | Credit Suisse International | | CLP | 58,442 | | | | 81,000 | | | | 78,900 | | | | — | | | | (2,100 | ) |
Expiring 12/18/19 | | Goldman Sachs
International | | CLP | 152,252 | | | | 213,000 | | | | 205,550 | | | | — | | | | (7,450 | ) |
Expiring 12/18/19 | | JPMorgan Chase Bank, N.A. | | CLP | 217,262 | | | | 304,267 | | | | 293,317 | | | | — | | | | (10,950 | ) |
Expiring 12/18/19 | | JPMorgan Chase Bank, N.A. | | CLP | 104,347 | | | | 144,688 | | | | 140,875 | | | | — | | | | (3,813 | ) |
Expiring 12/18/19 | | UBS AG | | CLP | 232,848 | | | | 321,550 | | | | 314,359 | | | | — | | | | (7,191 | ) |
Expiring 12/18/19 | | UBS AG | | CLP | 80,140 | | | | 113,000 | | | | 108,194 | | | | — | | | | (4,806 | ) |
Expiring 12/18/19 | | UBS AG | | CLP | 35,394 | | | | 48,900 | | | | 47,784 | | | | — | | | | (1,116 | ) |
Chinese Renminbi, | | | | | | | | | | | | | | | | | | | | | | |
Expiring 02/14/20 | | Bank of America, N.A. | | CNH | 258 | | | | 36,561 | | | | 36,535 | | | | — | | | | (26 | ) |
Expiring 02/14/20 | | BNP Paribas S.A. | | CNH | 4,104 | | | | 578,439 | | | | 580,568 | | | | 2,129 | | | | — | |
Expiring 02/14/20 | | Citibank, N.A. | | CNH | 1,175 | | | | 166,000 | | | | 166,217 | | | | 217 | | | | — | |
Expiring 02/14/20 | | HSBC Bank USA, N.A. | | CNH | 466 | | | | 65,904 | | | | 65,949 | | | | 45 | | | | — | |
Expiring 05/14/21 | | Citibank, N.A. | | CNH | 4,640 | | | | 664,965 | | | | 648,066 | | | | — | | | | (16,899 | ) |
Colombian Peso, | | | | | | | | | | | | | | | | | | | | | | |
Expiring 12/18/19 | | JPMorgan Chase Bank, N.A. | | COP | 2,467,400 | | | | 719,673 | | | | 728,682 | | | | 9,009 | | | | — | |
Czech Koruna, | | | | | | | | | | | | | | | | | | | | | | |
Expiring 01/17/20 | | Bank of America, N.A. | | CZK | 2,091 | | | | 91,619 | | | | 91,521 | | | | — | | | | (98 | ) |
See Notes to Financial Statements.
Forward foreign currency exchange contracts outstanding at October 31, 2019 (continued):
| | | | | | | | | | | | | | | | | | | | | | |
Purchase Contracts | | Counterparty | | Notional
Amount
(000) | | | Value at
Settlement
Date | | | Current
Value | | | Unrealized
Appreciation | | | Unrealized
Depreciation | |
OTC Forward Foreign Currency Exchange Contracts (cont’d.): | |
Czech Koruna (cont’d.), | | | | | | | | | | | | | | | | | | | | | | |
Expiring 01/17/20 | | Barclays Bank PLC | | CZK | 25,495 | | | $ | 1,091,224 | | | $ | 1,115,800 | | | $ | 24,576 | | | $ | — | |
Expiring 01/17/20 | | Barclays Bank PLC | | CZK | 2,930 | | | | 126,000 | | | | 128,239 | | | | 2,239 | | | | — | |
Expiring 01/17/20 | | BNP Paribas S.A. | | CZK | 5,835 | | | | 253,772 | | | | 255,357 | | | | 1,585 | | | | — | |
Expiring 01/17/20 | | Morgan Stanley & Co.
International PLC | | CZK | 2,713 | | | | 116,000 | | | | 118,738 | | | | 2,738 | | | | — | |
Expiring 01/17/20 | | Morgan Stanley & Co.
International PLC | | CZK | 2,622 | | | | 114,000 | | | | 114,758 | | | | 758 | | | | — | |
Expiring 01/17/20 | | Morgan Stanley & Co.
International PLC | | CZK | 2,313 | | | | 101,000 | | | | 101,242 | | | | 242 | | | | — | |
Expiring 01/17/20 | | UBS AG | | CZK | 3,544 | | | | 154,000 | | | | 155,091 | | | | 1,091 | | | | — | |
Egyptian Pound, | | | | | | | | | | | | | | | | | | | | | | |
Expiring 11/27/19 | | Citibank, N.A. | | EGP | 1,958 | | | | 113,576 | | | | 120,446 | | | | 6,870 | | | | — | |
Expiring 11/27/19 | | Citibank, N.A. | | EGP | 1,274 | | | | 73,936 | | | | 78,386 | | | | 4,450 | | | | — | |
Expiring 12/18/19 | | Citibank, N.A. | | EGP | 3,589 | | | | 206,814 | | | | 219,470 | | | | 12,656 | | | | — | |
Expiring 12/23/19 | | Citibank, N.A. | | EGP | 843 | | | | 50,000 | | | | 51,501 | | | | 1,501 | | | | — | |
Expiring 12/23/19 | | Morgan Stanley & Co.
International PLC | | EGP | 1,454 | | | | 86,007 | | | | 88,773 | | | | 2,766 | | | | — | |
Expiring 12/23/19 | | Morgan Stanley & Co.
International PLC | | EGP | 609 | | | | 36,007 | | | | 37,165 | | | | 1,158 | | | | — | |
Expiring 01/21/20 | | Citibank, N.A. | | EGP | 2,222 | | | | 127,239 | | | | 134,716 | | | | 7,477 | | | | — | |
Expiring 01/28/20 | | Citibank, N.A. | | EGP | 2,160 | | | | 127,159 | | | | 130,773 | | | | 3,614 | | | | — | |
Expiring 01/28/20 | | Citibank, N.A. | | EGP | 1,554 | | | | 90,881 | | | | 94,083 | | | | 3,202 | | | | — | |
Expiring 01/30/20 | | Citibank, N.A. | | EGP | 1,486 | | | | 85,274 | | | | 89,942 | | | | 4,668 | | | | — | |
Euro, | | | | | | | | | | | | | | | | | | | | | | |
Expiring 01/17/20 | | HSBC Bank USA, N.A. | | EUR | 36 | | | | 40,481 | | | | 40,594 | | | | 113 | | | | — | |
Hungarian Forint, | | | | | | | | | | | | | | | | | | | | | | |
Expiring 01/17/20 | | Bank of America, N.A. | | HUF | 10,788 | | | | 36,830 | | | | 36,782 | | | | — | | | | (48 | ) |
See Notes to Financial Statements.
| | | | |
| PGIM Emerging Markets Debt Local Currency Fund | | | 27 | |
Schedule of Investments(continued)
as of October 31, 2019
Forward foreign currency exchange contracts outstanding at October 31, 2019 (continued):
| | | | | | | | | | | | | | | | | | | | | | |
Purchase Contracts | | Counterparty | | Notional
Amount
(000) | | | Value at
Settlement
Date | | | Current
Value | | | Unrealized
Appreciation | | | Unrealized
Depreciation | |
OTC Forward Foreign Currency Exchange Contracts (cont’d.): | |
Hungarian Forint (cont’d.), | | | | | | | | | | | | | | | | | | | | |
Expiring 01/17/20 | | Citibank, N.A. | | HUF | 26,947 | | | $ | 90,000 | | | $ | 91,874 | | | $ | 1,874 | | | $ | — | |
Expiring 01/17/20 | | JPMorgan Chase Bank, N.A. | | HUF | 30,492 | | | | 102,000 | | | | 103,961 | | | | 1,961 | | | | — | |
Indian Rupee, | | | | | | | | | | | | | | | | | | | | | | |
Expiring 12/18/19 | | Citibank, N.A. | | INR | 45,964 | | | | 630,703 | | | | 643,044 | | | | 12,341 | | | | — | |
Expiring 12/18/19 | | Citibank, N.A. | | INR | 16,389 | | | | 227,000 | | | | 229,280 | | | | 2,280 | | | | — | |
Expiring 12/18/19 | | HSBC Bank USA, N.A. | | INR | 108,226 | | | | 1,489,588 | | | | 1,514,098 | | | | 24,510 | | | | — | |
Expiring 12/18/19 | | HSBC Bank USA, N.A. | | INR | 13,182 | | | | 185,000 | | | | 184,423 | | | | — | | | | (577 | ) |
Expiring 12/18/19 | | HSBC Bank USA, N.A. | | INR | 11,256 | | | | 155,000 | | | | 157,470 | | | | 2,470 | | | | — | |
Expiring 12/18/19 | | JPMorgan Chase Bank, N.A. | | INR | 8,340 | | | | 116,000 | | | | 116,675 | | | | 675 | | | | — | |
Expiring 12/18/19 | | Morgan Stanley & Co.
International PLC | | INR | 2,476 | | | | 34,713 | | | | 34,645 | | | | — | | | | (68 | ) |
Indonesian Rupiah, | | | | | | | | | | | | | | | | | | | | | | |
Expiring 12/18/19 | | BNP Paribas S.A. | | IDR | 1,706,100 | | | | 121,000 | | | | 120,511 | | | | — | | | | (489 | ) |
Expiring 12/18/19 | | Citibank, N.A. | | IDR | 1,716,960 | | | | 120,000 | | | | 121,278 | | | | 1,278 | | | | — | |
Expiring 12/18/19 | | HSBC Bank USA, N.A. | | IDR | 4,656,161 | | | | 330,000 | | | | 328,890 | | | | — | | | | (1,110 | ) |
Expiring 12/18/19 | | JPMorgan Chase Bank, N.A. | | IDR | 1,419,660 | | | | 99,000 | | | | 100,278 | | | | 1,278 | | | | — | |
Expiring 12/18/19 | | Morgan Stanley & Co.
International PLC | | IDR | 2,495,150 | | | | 175,000 | | | | 176,246 | | | | 1,246 | | | | — | |
Expiring 12/18/19 | | Morgan Stanley & Co.
International PLC | | IDR | 1,730,093 | | | | 122,371 | | | | 122,206 | | | | — | | | | (165 | ) |
Israeli Shekel, | | | | | | | | | | | | | | | | | | | | | | |
Expiring 12/18/19 | | Bank of America, N.A. | | ILS | 652 | | | | 187,000 | | | | 185,390 | | | | — | | | | (1,610 | ) |
Expiring 12/18/19 | | Barclays Bank PLC | | ILS | 605 | | | | 173,000 | | | | 172,096 | | | | — | | | | (904 | ) |
Expiring 12/18/19 | | Barclays Bank PLC | | ILS | 524 | | | | 151,000 | | | | 148,914 | | | | — | | | | (2,086 | ) |
Expiring 12/18/19 | | Barclays Bank PLC | | ILS | 418 | | | | 120,000 | | | | 118,927 | | | | — | | | | (1,073 | ) |
See Notes to Financial Statements.
Forward foreign currency exchange contracts outstanding at October 31, 2019 (continued):
| | | | | | | | | | | | | | | | | | | | | | |
Purchase Contracts | | Counterparty | | Notional
Amount
(000) | | | Value at
Settlement
Date | | | Current
Value | | | Unrealized
Appreciation | | | Unrealized
Depreciation | |
OTC Forward Foreign Currency Exchange Contracts (cont’d.): | | | | | | | | | |
Israeli Shekel (cont’d.), | | | | | | | | | | | | | | | | | | | | |
Expiring 12/18/19 | | Barclays Bank PLC | | ILS | 376 | | | $ | 107,433 | | | $ | 106,903 | | | $ | — | | | $ | (530 | ) |
Expiring 12/18/19 | | Barclays Bank PLC | | ILS | 225 | | | | 64,267 | | | | 63,869 | | | | — | | | | (398 | ) |
Expiring 12/18/19 | | Citibank, N.A. | | ILS | 651 | | | | 185,000 | | | | 185,234 | | | | 234 | | | | — | |
Expiring 12/18/19 | | Citibank, N.A. | | ILS | 625 | | | | 177,000 | | | | 177,734 | | | | 734 | | | | — | |
Expiring 12/18/19 | | Citibank, N.A. | | ILS | 599 | | | | 172,000 | | | | 170,446 | | | | — | | | | (1,554 | ) |
Expiring 12/18/19 | | JPMorgan Chase Bank, N.A. | | ILS | 409 | | | | 116,073 | | | | 116,216 | | | | 143 | | | | — | |
Expiring 12/18/19 | | JPMorgan Chase Bank, N.A. | | ILS | 246 | | | | 70,031 | | | | 69,953 | | | | — | | | | (78 | ) |
Expiring 12/18/19 | | Morgan Stanley & Co.
International PLC | | ILS | 500 | | | | 143,000 | | | | 142,235 | | | | — | | | | (765 | ) |
Japanese Yen, | | | | | | | | | | | | | | | | | | | | | | |
Expiring 01/17/20 | | Morgan Stanley & Co.
International PLC | | JPY | 36,262 | | | | 336,857 | | | | 337,599 | | | | 742 | | | | — | |
Malaysian Ringgit, | | | | | | | | | | | | | | | | | | | | |
Expiring 12/18/19 | | Goldman Sachs
International | | MYR | 3,156 | | | | 753,567 | | | | 757,222 | | | | 3,655 | | | | — | |
Expiring 12/18/19 | | Morgan Stanley & Co.
International PLC | | MYR | 665 | | | | 159,447 | | | | 159,666 | | | | 219 | | | | — | |
Expiring 12/18/19 | | Morgan Stanley & Co.
International PLC | | MYR | 353 | | | | 84,550 | | | | 84,605 | | | | 55 | | | | — | |
Mexican Peso, | | | | | | | | | | | | | | | | | | | | | | |
Expiring 12/18/19 | | Bank of America, N.A. | | MXN | 4,948 | | | | 256,372 | | | | 255,317 | | | | — | | | | (1,055 | ) |
Expiring 12/18/19 | | Barclays Bank PLC | | MXN | 2,389 | | | | 123,000 | | | | 123,290 | | | | 290 | | | | — | |
Expiring 12/18/19 | | Barclays Bank PLC | | MXN | 2,248 | | | | 116,473 | | | | 115,993 | | | | — | | | | (480 | ) |
Expiring 12/18/19 | | Barclays Bank PLC | | MXN | 2,118 | | | | 110,000 | | | | 109,306 | | | | — | | | | (694 | ) |
Expiring 12/18/19 | | Citibank, N.A. | | MXN | 7,564 | | | | 382,123 | | | | 390,299 | | | | 8,176 | | | | — | |
Expiring 12/18/19 | | Citibank, N.A. | | MXN | 4,726 | | | | 244,065 | | | | 243,832 | | | | — | | | | (233 | ) |
Expiring 12/18/19 | | HSBC Bank USA, N.A. | | MXN | 1,869 | | | | 96,000 | | | | 96,450 | | | | 450 | | | | — | |
See Notes to Financial Statements.
| | | | |
| PGIM Emerging Markets Debt Local Currency Fund | | | 29 | |
Schedule of Investments(continued)
as of October 31, 2019
Forward foreign currency exchange contracts outstanding at October 31, 2019 (continued):
| | | | | | | | | | | | | | | | | | | | | | |
Purchase Contracts | | Counterparty | | Notional
Amount
(000) | | | Value at
Settlement
Date | | | Current
Value | | | Unrealized
Appreciation | | | Unrealized
Depreciation | |
OTC Forward Foreign Currency Exchange Contracts (cont’d.): | | | | | | | | | | | | | |
Mexican Peso (cont’d.), | | | | | | | | | | | | | | | | | | | | |
Expiring 12/18/19 | | JPMorgan Chase Bank, N.A. | | MXN | 42,717 | | | $ | 2,116,970 | | | $ | 2,204,155 | | | $ | 87,185 | | | $ | — | |
Expiring 12/18/19 | | Morgan Stanley & Co.
International PLC | | MXN | 3,669 | | | | 190,000 | | | | 189,332 | | | | — | | | | (668 | ) |
Expiring 12/18/19 | | The Toronto-Dominion
Bank | | MXN | 3,323 | | | | 170,670 | | | | 171,446 | | | | 776 | | | | — | |
Expiring 12/18/19 | | UBS AG | | MXN | 5,165 | | | | 259,358 | | | | 266,511 | | | | 7,153 | | | | — | |
Expiring 12/18/19 | | UBS AG | | MXN | 2,123 | | | | 110,000 | | | | 109,518 | | | | — | | | | (482 | ) |
New Taiwanese Dollar, | | | | | | | | | | | | | | | | | | | | |
Expiring 12/18/19 | | Barclays Bank PLC | | TWD | 7,009 | | | | 232,000 | | | | 231,406 | | | | — | | | | (594 | ) |
Expiring 12/18/19 | | Barclays Bank PLC | | TWD | 6,606 | | | | 218,000 | | | | 218,104 | | | | 104 | | | | — | |
Expiring 12/18/19 | | Credit Suisse International | | TWD | 12,139 | | | | 396,000 | | | | 400,779 | | | | 4,779 | | | | — | |
Expiring 12/18/19 | | JPMorgan Chase Bank, N.A. | | TWD | 29,197 | | | | 953,560 | | | | 963,996 | | | | 10,436 | | | | — | |
Expiring 12/18/19 | | JPMorgan Chase Bank, N.A. | | TWD | 1,692 | | | | 55,171 | | | | 55,873 | | | | 702 | | | | — | |
Peruvian Nuevo Sol, | | | | | | | | | | | | | | | | | | | | |
Expiring 12/18/19 | | Bank of America, N.A. | | PEN | 526 | | | | 155,000 | | | | 156,901 | | | | 1,901 | | | | — | |
Expiring 12/18/19 | | BNP Paribas S.A. | | PEN | 2,673 | | | | 790,771 | | | | 797,918 | | | | 7,147 | | | | — | |
Expiring 12/18/19 | | BNP Paribas S.A. | | PEN | 764 | | | | 226,000 | | | | 228,093 | | | | 2,093 | | | | — | |
Expiring 12/18/19 | | BNP Paribas S.A. | | PEN | 688 | | | | 202,000 | | | | 205,321 | | | | 3,321 | | | | — | |
Expiring 12/18/19 | | HSBC Bank USA, N.A. | | PEN | 871 | | | | 261,131 | | | | 260,139 | | | | — | | | | (992 | ) |
Expiring 12/18/19 | | Morgan Stanley & Co.
International PLC | | PEN | 230 | | | | 68,530 | | | | 68,515 | | | | — | | | | (15 | ) |
Philippine Peso, | | | | | | | | | | | | | | | | | | | | | | |
Expiring 12/18/19 | | Barclays Bank PLC | | PHP | 14,631 | | | | 286,000 | | | | 287,643 | | | | 1,643 | | | | — | |
Expiring 12/18/19 | | Credit Suisse International | | PHP | 7,663 | | | | 150,000 | | | | 150,644 | | | | 644 | | | | — | |
Expiring 12/18/19 | | JPMorgan Chase Bank, N.A. | | PHP | 5,684 | | | | 108,813 | | | | 111,735 | | | | 2,922 | | | | — | |
See Notes to Financial Statements.
Forward foreign currency exchange contracts outstanding at October 31, 2019 (continued):
| | | | | | | | | | | | | | | | | | | | | | |
Purchase Contracts | | Counterparty | | Notional
Amount
(000) | | | Value at
Settlement
Date | | | Current
Value | | | Unrealized
Appreciation | | | Unrealized
Depreciation | |
OTC Forward Foreign Currency Exchange Contracts (cont’d.): | | | | | | | | | |
Philippine Peso (cont’d.), | | | | | | | | | | | | | | | | | | | | |
Expiring 12/18/19 | | Morgan Stanley & Co.
International PLC | | PHP | 7,516 | | | $ | 144,000 | | | $ | 147,760 | | | $ | 3,760 | | | $ | — | |
Polish Zloty, | | | | | | | | | | | | | | | | | | | | | | |
Expiring 01/17/20 | | Bank of America, N.A. | | PLN | 822 | | | | 215,663 | | | | 215,334 | | | | — | | | | (329 | ) |
Expiring 01/17/20 | | Barclays Bank PLC | | PLN | 368 | | | | 96,000 | | | | 96,362 | | | | 362 | | | | — | |
Expiring 01/17/20 | | BNP Paribas S.A. | | PLN | 645 | | | | 167,711 | | | | 168,961 | | | | 1,250 | | | | — | |
Expiring 01/17/20 | | Citibank, N.A. | | PLN | 510 | | | | 131,000 | | | | 133,496 | | | | 2,496 | | | | — | |
Expiring 01/17/20 | | Citibank, N.A. | | PLN | 416 | | | | 107,000 | | | | 108,816 | | | | 1,816 | | | | — | |
Expiring 01/17/20 | | HSBC Bank USA, N.A. | | PLN | 480 | | | | 125,000 | | | | 125,783 | | | | 783 | | | | — | |
Expiring 01/17/20 | | JPMorgan Chase Bank, N.A. | | PLN | 10,504 | | | | 2,702,459 | | | | 2,750,913 | | | | 48,454 | | | | — | |
Expiring 01/17/20 | | JPMorgan Chase Bank, N.A. | | PLN | 505 | | | | 131,000 | | | | 132,220 | | | | 1,220 | | | | — | |
Expiring 01/17/20 | | Morgan Stanley & Co.
International PLC | | PLN | 162 | | | | 42,365 | | | | 42,472 | | | | 107 | | | | — | |
Expiring 01/17/20 | | UBS AG | | PLN | 584 | | | | 152,000 | | | | 152,929 | | | | 929 | | | | — | |
Romanian Leu, | | | | | | | | | | | | | | | | | | | | | | |
Expiring 01/17/20 | | Bank of America, N.A. | | RON | 194 | | | | 45,577 | | | | 45,562 | | | | — | | | | (15 | ) |
Expiring 01/17/20 | | JPMorgan Chase Bank, N.A. | | RON | 570 | | | | 133,592 | | | | 133,575 | | | | — | | | | (17 | ) |
Expiring 01/17/20 | | JPMorgan Chase Bank, N.A. | | RON | 245 | | | | 56,760 | | | | 57,470 | | | | 710 | | | | — | |
Russian Ruble, | | | | | | | | | | | | | | | | | | | | | | |
Expiring 12/18/19 | | Barclays Bank PLC | | RUB | 8,848 | | | | 135,000 | | | | 137,012 | | | | 2,012 | | | | — | |
Expiring 12/18/19 | | Barclays Bank PLC | | RUB | 6,161 | | | | 93,000 | | | | 95,409 | | | | 2,409 | | | | — | |
Expiring 12/18/19 | | Barclays Bank PLC | | RUB | 5,919 | | | | 91,000 | | | | 91,651 | | | | 651 | | | | — | |
Expiring 12/18/19 | | Barclays Bank PLC | | RUB | 5,067 | | | | 78,000 | | | | 78,463 | | | | 463 | | | | — | |
Expiring 12/18/19 | | Barclays Bank PLC | | RUB | 3,441 | | | | 53,391 | | | | 53,288 | | | | — | | | | (103 | ) |
See Notes to Financial Statements.
| | | | |
| PGIM Emerging Markets Debt Local Currency Fund | | | 31 | |
Schedule of Investments(continued)
as of October 31, 2019
Forward foreign currency exchange contracts outstanding at October 31, 2019 (continued):
| | | | | | | | | | | | | | | | | | | | | | |
Purchase Contracts | | Counterparty | | Notional
Amount
(000) | | | Value at
Settlement
Date | | | Current
Value | | | Unrealized
Appreciation | | | Unrealized
Depreciation | |
OTC Forward Foreign Currency Exchange Contracts (cont’d.): | | | | | | | | | | | | | | | | | |
Russian Ruble (cont’d.), | | | | | | | | | | | | | | | | | | | | |
Expiring 12/18/19 | | Citibank, N.A. | | RUB | 8,547 | | | $ | 132,000 | | | $ | 132,349 | | | $ | 349 | | | $ | — | |
Expiring 12/18/19 | | Citibank, N.A. | | RUB | 6,784 | | | | 104,652 | | | | 105,052 | | | | 400 | | | | — | |
Expiring 12/18/19 | | Citibank, N.A. | | RUB | 5,886 | | | | 88,000 | | | | 91,149 | | | | 3,149 | | | | — | |
Expiring 12/18/19 | | Citibank, N.A. | | RUB | 3,151 | | | | 48,967 | | | | 48,794 | | | | — | | | | (173 | ) |
Expiring 12/18/19 | | Citibank, N.A. | | RUB | 2,688 | | | | 39,798 | | | | 41,620 | | | | 1,822 | | | | — | |
Expiring 12/18/19 | | Credit Suisse International | | RUB | 11,121 | | | | 172,408 | | | | 172,210 | | | | — | | | | (198 | ) |
Expiring 12/18/19 | | JPMorgan Chase Bank, N.A. | | RUB | 13,546 | | | | 209,300 | | | | 209,756 | | | | 456 | | | | — | |
Expiring 12/18/19 | | Morgan Stanley & Co.
International PLC | | RUB | 101,743 | | | | 1,497,321 | | | | 1,575,476 | | | | 78,155 | | | | — | |
Expiring 12/18/19 | | Morgan Stanley & Co.
International PLC | | RUB | 41,276 | | | | 610,000 | | | | 639,148 | | | | 29,148 | | | | — | |
Expiring 12/18/19 | | Morgan Stanley & Co.
International PLC | | RUB | 16,112 | | | | 249,887 | | | | 249,488 | | | | — | | | | (399 | ) |
Singapore Dollar, | | | | | | | | | | | | | | | | | | | | | | |
Expiring 12/18/19 | | Bank of America, N.A. | | SGD | 69 | | | | 50,466 | | | | 50,484 | | �� | | 18 | | | | — | |
Expiring 12/18/19 | | Barclays Bank PLC | | SGD | 238 | | | | 175,000 | | | | 175,294 | | | | 294 | | | | — | |
Expiring 12/18/19 | | Barclays Bank PLC | | SGD | 132 | | | | 96,000 | | | | 97,292 | | | | 1,292 | | | | — | |
Expiring 12/18/19 | | Citibank, N.A. | | SGD | 396 | | | | 288,428 | | | | 291,542 | | | | 3,114 | | | | — | |
Expiring 12/18/19 | | Citibank, N.A. | | SGD | 376 | | | | 276,000 | | | | 276,601 | | | | 601 | | | | — | |
Expiring 12/18/19 | | Citibank, N.A. | | SGD | 200 | | | | 145,000 | | | | 146,856 | | | | 1,856 | | | | — | |
Expiring 12/18/19 | | Goldman Sachs
International | | SGD | 1,271 | | | | 933,900 | | | | 934,856 | | | | 956 | | | | — | |
Expiring 12/18/19 | | Goldman Sachs
International | | SGD | 314 | | | | 231,000 | | | | 231,226 | | | | 226 | | | | — | |
Expiring 12/18/19 | | HSBC Bank USA, N.A. | | SGD | 240 | | | | 176,000 | | | | 176,325 | | | | 325 | | | | — | |
Expiring 12/18/19 | | JPMorgan Chase Bank, N.A. | | SGD | 287 | | | | 211,000 | | | | 211,280 | | | | 280 | | | | — | |
See Notes to Financial Statements.
Forward foreign currency exchange contracts outstanding at October 31, 2019 (continued):
| | | | | | | | | | | | | | | | | | | | | | |
Purchase Contracts | | Counterparty | | Notional
Amount
(000) | | | Value at
Settlement
Date | | | Current
Value | | | Unrealized
Appreciation | | | Unrealized
Depreciation | |
OTC Forward Foreign Currency Exchange Contracts (cont’d.): | |
Singapore Dollar (cont’d.), | | | | | | | | | | | | | | | | | | | | |
Expiring 12/18/19 | | JPMorgan Chase Bank, N.A. | | SGD | 279 | | | $ | 205,000 | | | $ | 205,205 | | | $ | 205 | | | $ | — | |
Expiring 12/18/19 | | JPMorgan Chase Bank, N.A. | | SGD | 165 | | | | 119,000 | | | | 121,079 | | | | 2,079 | | | | — | |
Expiring 12/18/19 | | Morgan Stanley & Co.
International PLC | | SGD | 341 | | | | 248,000 | | | | 250,907 | | | | 2,907 | | | | — | |
Expiring 12/18/19 | | Morgan Stanley & Co.
International PLC | | SGD | 226 | | | | 165,000 | | | | 166,444 | | | | 1,444 | | | | — | |
South African Rand, | | | | | | | | | | | | | | | | | | | | | | |
Expiring 12/18/19 | | Bank of America, N.A. | | ZAR | 2,589 | | | | 170,860 | | | | 170,205 | | | | — | | | | (655 | ) |
Expiring 12/18/19 | | Citibank, N.A. | | ZAR | 1,390 | | | | 93,000 | | | | 91,386 | | | | — | | | | (1,614 | ) |
Expiring 12/18/19 | | Citibank, N.A. | | ZAR | 1,262 | | | | 81,611 | | | | 82,989 | | | | 1,378 | | | | — | |
Expiring 12/18/19 | | HSBC Bank USA, N.A. | | ZAR | 1,804 | | | | 121,000 | | | | 118,622 | | | | — | | | | (2,378 | ) |
Expiring 12/18/19 | | JPMorgan Chase Bank, N.A. | | ZAR | 2,658 | | | | 172,719 | | | | 174,738 | | | | 2,019 | | | | — | |
Expiring 12/18/19 | | JPMorgan Chase Bank, N.A. | | ZAR | 2,650 | | | | 174,449 | | | | 174,196 | | | | — | | | | (253 | ) |
Expiring 12/18/19 | | JPMorgan Chase Bank, N.A. | | ZAR | 1,090 | | | | 74,000 | | | | 71,684 | | | | — | | | | (2,316 | ) |
Expiring 12/18/19 | | JPMorgan Chase Bank, N.A. | | ZAR | 924 | | | | 63,000 | | | | 60,776 | | | | — | | | | (2,224 | ) |
Expiring 12/18/19 | | JPMorgan Chase Bank, N.A. | | ZAR | 852 | | | | 55,641 | | | | 56,017 | | | | 376 | | | | — | |
Expiring 12/18/19 | | JPMorgan Chase Bank, N.A. | | ZAR | 732 | | | | 47,811 | | | | 48,130 | | | | 319 | | | | — | |
Expiring 12/18/19 | | JPMorgan Chase Bank, N.A. | | ZAR | 465 | | | | 29,928 | | | | 30,597 | | | | 669 | | | | — | |
Expiring 12/18/19 | | The Toronto-Dominion Bank | | ZAR | 929 | | | | 63,000 | | | | 61,107 | | | | — | | | | (1,893 | ) |
Expiring 12/18/19 | | UBS AG | | ZAR | 1,034 | | | | 68,000 | | | | 67,965 | | | | — | | | | (35 | ) |
South Korean Won, | | | | | | | | | | | | | | | | | | | | | | |
Expiring 12/18/19 | | Barclays Bank PLC | | KRW | 222,151 | | | | 189,000 | | | | 190,009 | | | | 1,009 | | | | — | |
Expiring 12/18/19 | | BNP Paribas S.A. | | KRW | 216,489 | | | | 182,000 | | | | 185,167 | | | | 3,167 | | | | — | |
Expiring 12/18/19 | | HSBC Bank USA, N.A. | | KRW | 367,231 | | | | 309,000 | | | | 314,099 | | | | 5,099 | | | | — | |
See Notes to Financial Statements.
| | | | |
| PGIM Emerging Markets Debt Local Currency Fund | | | 33 | |
Schedule of Investments(continued)
as of October 31, 2019
Forward foreign currency exchange contracts outstanding at October 31, 2019 (continued):
| | | | | | | | | | | | | | | | | | | | | | |
Purchase Contracts | | Counterparty | | Notional
Amount
(000) | | | Value at
Settlement
Date | | | Current
Value | | | Unrealized
Appreciation | | | Unrealized
Depreciation | |
OTC Forward Foreign Currency Exchange Contracts (cont’d.): | |
South Korean Won (cont’d.), | | | | | | | | | | | | | | | | | | | | |
Expiring 12/18/19 | | HSBC Bank USA, N.A. | | KRW | 262,592 | | | $ | 221,000 | | | $ | 224,600 | | | $ | 3,600 | | | $ | — | |
Expiring 12/18/19 | | HSBC Bank USA, N.A. | | KRW | 257,753 | | | | 216,000 | | | | 220,460 | | | | 4,460 | | | | — | |
Expiring 12/18/19 | | JPMorgan Chase Bank, N.A. | | KRW | 246,266 | | | | 211,026 | | | | 210,635 | | | | — | | | | (391 | ) |
Expiring 12/18/19 | | JPMorgan Chase Bank, N.A. | | KRW | 234,174 | | | | 197,000 | | | | 200,293 | | | | 3,293 | | | | — | |
Expiring 12/18/19 | | JPMorgan Chase Bank, N.A. | | KRW | 153,101 | | | | 130,000 | | | | 130,950 | | | | 950 | | | | — | |
Expiring 12/18/19 | | Morgan Stanley & Co.
International PLC | | KRW | 64,238 | | | | 54,977 | | | | 54,944 | | | | — | | | | (33 | ) |
Swiss Franc, | | | | | | | | | | | | | | | | | | | | | | |
Expiring 01/17/20 | | Morgan Stanley & Co.
International PLC | | CHF | 139 | | | | 140,900 | | | | 141,558 | | | | 658 | | | | — | |
Thai Baht, | | | | | | | | | | | | | | | | | | | | | | |
Expiring 12/18/19 | | Bank of America, N.A. | | THB | 1,194 | | | | 39,579 | | | | 39,570 | | | | — | | | | (9 | ) |
Expiring 12/18/19 | | Barclays Bank PLC | | THB | 4,718 | | | | 153,000 | | | | 156,325 | | | | 3,325 | | | | — | |
Expiring 12/18/19 | | BNP Paribas S.A. | | THB | 8,332 | | | | 274,000 | | | | 276,074 | | | | 2,074 | | | | — | |
Expiring 12/18/19 | | Citibank, N.A. | | THB | 9,725 | | | | 317,307 | | | | 322,258 | | | | 4,951 | | | | — | |
Expiring 12/18/19 | | Citibank, N.A. | | THB | 8,774 | | | | 287,000 | | | | 290,718 | | | | 3,718 | | | | — | |
Expiring 12/18/19 | | Citibank, N.A. | | THB | 6,300 | | | | 205,610 | | | | 208,757 | | | | 3,147 | | | | — | |
Expiring 12/18/19 | | Citibank, N.A. | | THB | 4,011 | | | | 131,000 | | | | 132,914 | | | | 1,914 | | | | — | |
Expiring 12/18/19 | | Credit Suisse International | | THB | 12,521 | | | | 407,000 | | | | 414,900 | | | | 7,900 | | | | — | |
Expiring 12/18/19 | | Goldman Sachs
International | | THB | 7,294 | | | | 239,000 | | | | 241,690 | | | | 2,690 | | | | — | |
Expiring 12/18/19 | | HSBC Bank USA, N.A. | | THB | 8,796 | | | | 288,000 | | | | 291,444 | | | | 3,444 | | | | — | |
Expiring 12/18/19 | | HSBC Bank USA, N.A. | | THB | 3,420 | | | | 112,000 | | | | 113,339 | | | | 1,339 | | | | — | |
Expiring 12/18/19 | | JPMorgan Chase Bank, N.A. | | THB | 32,253 | | | | 1,051,045 | | | | 1,068,734 | | | | 17,689 | | | | — | |
Expiring 12/18/19 | | JPMorgan Chase Bank, N.A. | | THB | 5,107 | | | | 167,000 | | | | 169,219 | | | | 2,219 | | | | — | |
See Notes to Financial Statements.
Forward foreign currency exchange contracts outstanding at October 31, 2019 (continued):
| | | | | | | | | | | | | | | | | | | | | | |
Purchase Contracts | | Counterparty | | Notional
Amount
(000) | | | Value at
Settlement
Date | | | Current
Value | | | Unrealized
Appreciation | | | Unrealized
Depreciation | |
OTC Forward Foreign Currency Exchange Contracts (cont’d.): | | | | | | | | | |
Thai Baht (cont’d.), | | | | | | | | | | | | | | | | | | | | |
Expiring 12/18/19 | | JPMorgan Chase Bank, N.A. | | THB | 4,952 | | | $ | 163,000 | | | $ | 164,085 | | | $ | 1,085 | | | $ | — | |
Expiring 12/18/19 | | JPMorgan Chase Bank, N.A. | | THB | 3,789 | | | | 123,947 | | | | 125,565 | | | | 1,618 | | | | — | |
Expiring 12/18/19 | | JPMorgan Chase Bank, N.A. | | THB | 3,703 | | | | 121,000 | | | | 122,700 | | | | 1,700 | | | | — | |
Expiring 12/18/19 | | Morgan Stanley & Co.
International PLC | | THB | 5,296 | | | | 173,000 | | | | 175,499 | | | | 2,499 | | | | — | |
Turkish Lira, | | | | | | | | | | | | | | | | | | | | | | |
Expiring 12/18/19 | | Bank of America, N.A. | | TRY | 466 | | | | 80,554 | | | | 80,415 | | | | — | | | | (139 | ) |
Expiring 12/18/19 | | Barclays Bank PLC | | TRY | 1,172 | | | | 200,125 | | | | 202,376 | | | | 2,251 | | | | — | |
Expiring 12/18/19 | | Barclays Bank PLC | | TRY | 1,028 | | | | 175,675 | | | | 177,450 | | | | 1,775 | | | | — | |
Expiring 12/18/19 | | Barclays Bank PLC | | TRY | 827 | | | | 141,471 | | | | 142,874 | | | | 1,403 | | | | — | |
Expiring 12/18/19 | | Barclays Bank PLC | | TRY | 817 | | | | 140,700 | | | | 141,002 | | | | 302 | | | | — | |
Expiring 12/18/19 | | Barclays Bank PLC | | TRY | 289 | | | | 49,000 | | | | 49,846 | | | | 846 | | | | — | |
Expiring 12/18/19 | | Citibank, N.A. | | TRY | 343 | | | | 59,000 | | | | 59,296 | | | | 296 | | | | — | |
Expiring 12/18/19 | | Citibank, N.A. | | TRY | 172 | | | | 29,646 | | | | 29,747 | | | | 101 | | | | — | |
Expiring 12/18/19 | | Goldman Sachs
International | | TRY | 1,011 | | | | 172,408 | | | | 174,660 | | | | 2,252 | | | | — | |
Expiring 12/18/19 | | Goldman Sachs
International | | TRY | 902 | | | | 154,800 | | | | 155,697 | | | | 897 | | | | — | |
Expiring 12/18/19 | | JPMorgan Chase Bank, N.A. | | TRY | 2,823 | | | | 472,647 | | | | 487,406 | | | | 14,759 | | | | — | |
Expiring 12/18/19 | | Morgan Stanley & Co.
International PLC | | TRY | 2,502 | | | | 422,276 | | | | 432,013 | | | | 9,737 | | | | — | |
Expiring 12/18/19 | | UBS AG | | TRY | 322 | | | | 55,000 | | | | 55,630 | | | | 630 | | | | — | |
Ukraine Hryvna, | | | | | | | | | | | | | | | | | | | | | | |
Expiring 01/16/20 | | Bank of America, N.A. | | UAH | 3,973 | | | | 154,956 | | | | 156,010 | | | | 1,054 | | | | — | |
Expiring 01/24/20 | | Citibank, N.A. | | UAH | 961 | | | | 37,164 | | | | 37,627 | | | | 463 | | | | — | |
| | | | | | | | | | | | | | | | | | | | | | |
| | | | | | | | $ | 51,938,674 | | | $ | 52,490,792 | | | | 742,282 | | | | (190,164 | ) |
| | | | | | | | | | | | | | | | | | | | | | |
See Notes to Financial Statements.
| | | | |
| PGIM Emerging Markets Debt Local Currency Fund | | | 35 | |
Schedule of Investments(continued)
as of October 31, 2019
Forward foreign currency exchange contracts outstanding at October 31, 2019 (continued):
| | | | | | | | | | | | | | | | | | | | | | |
Sale Contracts | | Counterparty | | Notional
Amount
(000) | | | Value at
Settlement
Date | | | Current
Value | | | Unrealized
Appreciation | | | Unrealized
Depreciation | |
OTC Forward Foreign Currency Exchange Contracts: | | | | | | | | | | | | | |
Argentine Peso, | | | | | | | | | | | | | | | | | | | | |
Expiring 11/29/19 | | Citibank, N.A. | | ARS | 4,927 | | | $ | 70,531 | | | $ | 73,681 | | | $ | — | | | $ | (3,150 | ) |
Brazilian Real, | | | | | | | | | | | | | | | | | | | | |
Expiring 11/04/19 | | Barclays Bank PLC | | BRL | 516 | | | | 123,000 | | | | 128,637 | | | | — | | | | (5,637 | ) |
Expiring 11/04/19 | | BNP Paribas S.A. | | BRL | 15,005 | | | | 3,762,277 | | | | 3,740,465 | | | | 21,812 | | | | — | |
Expiring 11/04/19 | | Citibank, N.A. | | BRL | 1,363 | | | | 331,689 | | | | 339,754 | | | | — | | | | (8,065 | ) |
Expiring 12/03/19 | | BNP Paribas S.A. | | BRL | 918 | | | | 228,322 | | | | 228,506 | | | | — | | | | (184 | ) |
Expiring 12/03/19 | | Citibank, N.A. | | BRL | 149 | | | | 37,182 | | | | 37,050 | | | | 132 | | | | — | |
Canadian Dollar, | | | | | | | | | | | | | | | | | | | | | | |
Expiring 01/22/20 | | Barclays Bank PLC | | CAD | 678 | | | | 516,085 | | | | 514,641 | | | | 1,444 | | | | — | |
Chilean Peso, | | | | | | | | | | | | | | | | | | | | | | |
Expiring 12/18/19 | | Bank of America, N.A. | | CLP | 151,000 | | | | 209,170 | | | | 203,859 | | | | 5,311 | | | | — | |
Expiring 12/18/19 | | Barclays Bank PLC | | CLP | 673,748 | | | | 947,940 | | | | 909,603 | | | | 38,337 | | | | — | |
Expiring 12/18/19 | | Barclays Bank PLC | | CLP | 87,296 | | | | 118,000 | | | | 117,856 | | | | 144 | | | | — | |
Expiring 12/18/19 | | JPMorgan Chase Bank, N.A. | | CLP | 1,347,496 | | | | 1,868,927 | | | | 1,819,206 | | | | 49,721 | | | | — | |
Expiring 12/18/19 | | JPMorgan Chase Bank, N.A. | | CLP | 57,316 | | | | 78,796 | | | | 77,381 | | | | 1,415 | | | | — | |
Expiring 12/18/19 | | Morgan Stanley & Co.
International PLC | | CLP | 673,748 | | | | 934,463 | | | | 909,603 | | | | 24,860 | | | | — | |
Chinese Renminbi, | | | | | | | | | | | | | | | | | | | | |
Expiring 05/14/21 | | JPMorgan Chase Bank, N.A. | | CNH | 4,640 | | | | 666,044 | | | | 648,067 | | | | 17,977 | | | | — | |
Colombian Peso, | | | | | | | | | | | | | | | | | | | | | | |
Expiring 12/18/19 | | Barclays Bank PLC | | COP | 371,914 | | | | 110,000 | | | | 109,835 | | | | 165 | | | | — | |
Expiring 12/18/19 | | Barclays Bank PLC | | COP | 335,364 | | | | 99,000 | | | | 99,041 | | | | — | | | | (41 | ) |
Expiring 12/18/19 | | Barclays Bank PLC | | COP | 229,928 | | | | 68,000 | | | | 67,903 | | | | 97 | | | | — | |
Expiring 12/18/19 | | Citibank, N.A. | | COP | 245,390 | | | | 71,000 | | | | 72,470 | | | | — | | | | (1,470 | ) |
See Notes to Financial Statements.
Forward foreign currency exchange contracts outstanding at October 31, 2019 (continued):
| | | | | | | | | | | | | | | | | | | | | | |
Sale Contracts | | Counterparty | | Notional
Amount
(000) | | | Value at
Settlement
Date | | | Current
Value | | | Unrealized
Appreciation | | | Unrealized
Depreciation | |
OTC Forward Foreign Currency Exchange Contracts (cont’d.): | | | | | | | | | | | | | |
Colombian Peso (cont’d.), | | | | | | | | | | | | | | | | | | | | |
Expiring 12/18/19 | | Goldman Sachs International | | COP | 718,007 | | | $ | 211,365 | | | $ | 212,045 | | | $ | — | | | $ | (680 | ) |
Expiring 12/18/19 | | Goldman Sachs International | | COP | 337,850 | | | | 100,000 | | | | 99,775 | | | | 225 | | | | — | |
Expiring 12/18/19 | | Goldman Sachs International | | COP | 325,920 | | | | 96,000 | | | | 96,252 | | | | — | | | | (252 | ) |
Expiring 12/18/19 | | JPMorgan Chase Bank, N.A. | | COP | 707,853 | | | | 209,300 | | | | 209,046 | | | | 254 | | | | — | |
Expiring 12/18/19 | | JPMorgan Chase Bank, N.A. | | COP | 203,857 | | | | 60,000 | | | | 60,204 | | | | — | | | | (204 | ) |
Expiring 12/18/19 | | UBS AG | | COP | 329,208 | | | | 95,000 | | | | 97,223 | | | | — | | | | (2,223 | ) |
Czech Koruna, | | | | | | | | | | | | | | | | | | | | | | |
Expiring 01/17/20 | | HSBC Bank USA, N.A. | | CZK | 1,088 | | | | 47,497 | | | | 47,624 | | | | — | | | | (127 | ) |
Egyptian Pound, | | | | | | | | | | | | | | | | | | | | | | |
Expiring 12/23/19 | | Citibank, N.A. | | EGP | 2,315 | | | | 139,122 | | | | 141,387 | | | | — | | | | (2,265 | ) |
Expiring 12/23/19 | | Citibank, N.A. | | EGP | 590 | | | | 35,554 | | | | 36,051 | | | | — | | | | (497 | ) |
Euro, | | | | | | | | | | | | | | | | | | | | | | |
Expiring 01/17/20 | | Bank of America, N.A. | | EUR | 82 | | | | 92,176 | | | | 92,178 | | | | — | | | | (2 | ) |
Expiring 01/17/20 | | HSBC Bank USA, N.A. | | EUR | 1,159 | | | | 1,287,138 | | | | 1,300,346 | | | | — | | | | (13,208 | ) |
Expiring 01/17/20 | | JPMorgan Chase Bank, N.A. | | EUR | 1,244 | | | | 1,381,550 | | | | 1,394,816 | | | | — | | | | (13,266 | ) |
Expiring 01/17/20 | | UBS AG | | EUR | 1,351 | | | | 1,496,569 | | | | 1,514,969 | | | | — | | | | (18,400 | ) |
Hungarian Forint, | | | | | | | | | | | | | | | | | | | | | | |
Expiring 01/17/20 | | Barclays Bank PLC | | HUF | 32,682 | | | | 111,000 | | | | 111,428 | | | | — | | | | (428 | ) |
Expiring 01/17/20 | | The Toronto-Dominion Bank | | HUF | 224,765 | | | | 753,046 | | | | 766,322 | | | | — | | | | (13,276 | ) |
Indian Rupee, | | | | | | | | | | | | | | | | | | | | | | |
Expiring 12/18/19 | | Bank of America, N.A. | | INR | 17,468 | | | | 243,000 | | | | 244,381 | | | | — | | | | (1,381 | ) |
Expiring 12/18/19 | | Citibank, N.A. | | INR | 13,255 | | | | 185,000 | | | | 185,443 | | | | — | | | | (443 | ) |
Expiring 12/18/19 | | HSBC Bank USA, N.A. | | INR | 26,003 | | | | 361,427 | | | | 363,784 | | | | — | | | | (2,357 | ) |
See Notes to Financial Statements.
| | | | |
| PGIM Emerging Markets Debt Local Currency Fund | | | 37 | |
Schedule of Investments(continued)
as of October 31, 2019
Forward foreign currency exchange contracts outstanding at October 31, 2019 (continued):
| | | | | | | | | | | | | | | | | | | | | | |
Sale Contracts | | Counterparty | | Notional
Amount
(000) | | | Value at
Settlement
Date | | | Current
Value | | | Unrealized
Appreciation | | | Unrealized
Depreciation | |
OTC Forward Foreign Currency Exchange Contracts (cont’d.): | | | | | | | | | | | | | |
Indian Rupee (cont’d.), | | | | | | | | | | | | | | | | | | | | |
Expiring 12/18/19 | | HSBC Bank USA, N.A. | | INR | 18,046 | | | $ | 252,000 | | | $ | 252,465 | | | $ | — | | | $ | (465 | ) |
Expiring 12/18/19 | | HSBC Bank USA, N.A. | | INR | 12,380 | | | | 172,408 | | | | 173,199 | | | | — | | | | (791 | ) |
Expiring 12/18/19 | | JPMorgan Chase Bank, N.A. | | INR | 3,978 | | | | 55,171 | | | | 55,654 | | | | — | | | | (483 | ) |
Indonesian Rupiah, | | | | | | | | | | | | | | | | | | | | |
Expiring 12/18/19 | | Barclays Bank PLC | | IDR | 1,438,750 | | | | 100,000 | | | | 101,627 | | | | — | | | | (1,627 | ) |
Expiring 12/18/19 | | Citibank, N.A. | | IDR | 2,834,954 | | | | 199,000 | | | | 200,248 | | | | — | | | | (1,248 | ) |
Expiring 12/18/19 | | Citibank, N.A. | | IDR | 1,909,980 | | | | 135,000 | | | | 134,912 | | | | 88 | | | | — | |
Expiring 12/18/19 | | HSBC Bank USA, N.A. | | IDR | 26,764,143 | | | | 1,860,688 | | | | 1,890,498 | | | | — | | | | (29,810 | ) |
Expiring 12/18/19 | | HSBC Bank USA, N.A. | | IDR | 2,193,560 | | | | 155,000 | | | | 154,943 | | | | 57 | | | | — | |
Expiring 12/18/19 | | JPMorgan Chase Bank, N.A. | | IDR | 2,523,135 | | | | 177,000 | | | | 178,223 | | | | — | | | | (1,223 | ) |
Expiring 12/18/19 | | JPMorgan Chase Bank, N.A. | | IDR | 2,124,293 | | | | 149,000 | | | | 150,050 | | | | — | | | | (1,050 | ) |
Israeli Shekel, | | | | | | | | | | | | | | | | | | | | | | |
Expiring 12/18/19 | | Barclays Bank PLC | | ILS | 2,472 | | | | 705,044 | | | | 703,156 | | | | 1,888 | | | | — | |
Expiring 12/18/19 | | Citibank, N.A. | | ILS | 572 | | | | 162,000 | | | | 162,826 | | | | — | | | | (826 | ) |
Expiring 12/18/19 | | Citibank, N.A. | | ILS | 539 | | | | 153,000 | | | | 153,396 | | | | — | | | | (396 | ) |
Malaysian Ringgit, | | | | | | | | | | | | | | | | | | | | |
Expiring 12/18/19 | | Morgan Stanley & Co.
International PLC | | MYR | 672 | | | | 159,740 | | | | 161,262 | | | | — | | | | (1,522 | ) |
Expiring 12/18/19 | | UBS AG | | MYR | 1,527 | | | | 363,630 | | | | 366,310 | | | | — | | | | (2,680 | ) |
Mexican Peso, | | | | | | | | | | | | | | | | | | | | | | |
Expiring 12/18/19 | | Citibank, N.A. | | MXN | 4,373 | | | | 227,000 | | | | 225,619 | | | | 1,381 | | | | — | |
Expiring 12/18/19 | | HSBC Bank USA, N.A. | | MXN | 1,546 | | | | 78,644 | | | | 79,777 | | | | — | | | | (1,133 | ) |
Expiring 12/18/19 | | HSBC Bank USA, N.A. | | MXN | 1,066 | | | | 55,190 | | | | 54,982 | | | | 208 | | | | — | |
Expiring 12/18/19 | | JPMorgan Chase Bank, N.A. | | MXN | 3,658 | | | | 185,830 | | | | 188,745 | | | | — | | | | (2,915 | ) |
See Notes to Financial Statements.
Forward foreign currency exchange contracts outstanding at October 31, 2019 (continued):
| | | | | | | | | | | | | | | | | | | | | | |
Sale Contracts | | Counterparty | | Notional
Amount
(000) | | | Value at
Settlement
Date | | | Current
Value | | | Unrealized
Appreciation | | | Unrealized
Depreciation | |
OTC Forward Foreign Currency Exchange Contracts (cont’d.): | | | | | | | | | | | | | |
Mexican Peso (cont’d.), | | | | | | | | | | | | | | | | | | | | |
Expiring 12/18/19 | | JPMorgan Chase Bank, N.A. | | MXN | 3,161 | | | $ | 158,111 | | | $ | 163,089 | | | $ | — | | | $ | (4,978 | ) |
Expiring 12/18/19 | | JPMorgan Chase Bank, N.A. | | MXN | 2,090 | | | �� | 106,000 | | | | 107,825 | | | | — | | | | (1,825 | ) |
Expiring 12/18/19 | | JPMorgan Chase Bank, N.A. | | MXN | 1,930 | | | | 99,985 | | | | 99,594 | | | | 391 | | | | — | |
Expiring 12/18/19 | | The Toronto-Dominion Bank | | MXN | 7,540 | | | | 376,190 | | | | 389,036 | | | | — | | | | (12,846 | ) |
New Taiwanese Dollar, | | | | | | | | | | | | | | | | | | | | |
Expiring 12/18/19 | | BNP Paribas S.A. | | TWD | 9,993 | | | | 324,000 | | | | 329,932 | | | | — | | | | (5,932 | ) |
Expiring 12/18/19 | | BNP Paribas S.A. | | TWD | 4,504 | | | | 147,000 | | | | 148,720 | | | | — | | | | (1,720 | ) |
Expiring 12/18/19 | | Credit Suisse International | | TWD | 81,725 | | | | 2,631,918 | | | | 2,698,309 | | | | — | | | | (66,391 | ) |
Expiring 12/18/19 | | Credit Suisse International | | TWD | 4,642 | | | | 150,000 | | | | 153,256 | | | | — | | | | (3,256 | ) |
Expiring 12/18/19 | | Goldman Sachs International | | TWD | 8,505 | | | | 280,000 | | | | 280,818 | | | | — | | | | (818 | ) |
Expiring 12/18/19 | | Goldman Sachs International | | TWD | 7,007 | | | | 226,000 | | | | 231,361 | | | | — | | | | (5,361 | ) |
Expiring 12/18/19 | | HSBC Bank USA, N.A. | | TWD | 12,180 | | | | 398,000 | | | | 402,146 | | | | — | | | | (4,146 | ) |
Expiring 12/18/19 | | HSBC Bank USA, N.A. | | TWD | 9,009 | | | | 291,000 | | | | 297,446 | | | | — | | | | (6,446 | ) |
Expiring 12/18/19 | | JPMorgan Chase Bank, N.A. | | TWD | 6,695 | | | | 220,000 | | | | 221,049 | | | | — | | | | (1,049 | ) |
Expiring 12/18/19 | | JPMorgan Chase Bank, N.A. | | TWD | 5,251 | | | | 170,000 | | | | 173,382 | | | | — | | | | (3,382 | ) |
Expiring 12/18/19 | | Morgan Stanley & Co.
International PLC | | TWD | 2,459 | | | | 81,168 | | | | 81,179 | | | | — | | | | (11 | ) |
New Zealand Dollar, | | | | | | | | | | | | | | | | | | | | |
Expiring 01/22/20 | | Morgan Stanley & Co.
International PLC | | NZD | 740 | | | | 469,527 | | | | 475,089 | | | | — | | | | (5,562 | ) |
Peruvian Nuevo Sol, | | | | | | | | | | | | | | | | | | | | |
Expiring 12/18/19 | | Bank of America, N.A. | | PEN | 815 | | | | 243,000 | | | | 243,383 | | | | — | | | | (383 | ) |
Expiring 12/18/19 | | Bank of America, N.A. | | PEN | 765 | | | | 227,000 | | | | 228,238 | | | | — | | | | (1,238 | ) |
Expiring 12/18/19 | | Bank of America, N.A. | | PEN | 530 | | | | 158,000 | | | | 158,301 | | | | — | | | | (301 | ) |
See Notes to Financial Statements.
| | | | |
| PGIM Emerging Markets Debt Local Currency Fund | | | 39 | |
Schedule of Investments(continued)
as of October 31, 2019
Forward foreign currency exchange contracts outstanding at October 31, 2019 (continued):
| | | | | | | | | | | | | | | | | | | | | | |
Sale Contracts | | Counterparty | | Notional
Amount
(000) | | | Value at
Settlement
Date | | | Current
Value | | | Unrealized
Appreciation | | | Unrealized
Depreciation | |
OTC Forward Foreign Currency Exchange Contracts (cont’d.): | | | | | | | | | | | | | |
Peruvian Nuevo Sol (cont’d.), | | | | | | | | | | | | | | | | | | | | |
Expiring 12/18/19 | | Deutsche Bank AG | | PEN | 335 | | | $ | 98,887 | | | $ | 99,934 | | | $ | — | | | $ | (1,047 | ) |
Expiring 12/18/19 | | Goldman Sachs International | | PEN | 415 | | | | 122,028 | | | | 123,823 | | | | — | | | | (1,795 | ) |
Expiring 12/18/19 | | JPMorgan Chase Bank, N.A. | | PEN | 776 | | | | 231,000 | | | | 231,536 | | | | — | | | | (536 | ) |
Expiring 12/18/19 | | JPMorgan Chase Bank, N.A. | | PEN | 720 | | | | 213,000 | | | | 214,830 | | | | — | | | | (1,830 | ) |
Expiring 12/18/19 | | JPMorgan Chase Bank, N.A. | | PEN | 448 | | | | 132,274 | | | | 133,667 | | | | — | | | | (1,393 | ) |
Expiring 12/18/19 | | JPMorgan Chase Bank, N.A. | | PEN | 414 | | | | 123,000 | | | | 123,532 | | | | — | | | | (532 | ) |
Expiring 12/18/19 | | JPMorgan Chase Bank, N.A. | | PEN | 354 | | | | 104,086 | | | | 105,695 | | | | — | | | | (1,609 | ) |
Philippine Peso, | | | | | | | | | | | | | | | | | | | | | | |
Expiring 12/18/19 | | Barclays Bank PLC | | PHP | 8,392 | | | | 161,000 | | | | 164,983 | | | | — | | | | (3,983 | ) |
Expiring 12/18/19 | | HSBC Bank USA, N.A. | | PHP | 11,964 | | | | 228,000 | | | | 235,201 | | | | — | | | | (7,201 | ) |
Expiring 12/18/19 | | HSBC Bank USA, N.A. | | PHP | 8,875 | | | | 169,000 | | | | 174,466 | | | | — | | | | (5,466 | ) |
Expiring 12/18/19 | | HSBC Bank USA, N.A. | | PHP | 8,374 | | | | 160,000 | | | | 164,634 | | | | — | | | | (4,634 | ) |
Expiring 12/18/19 | | JPMorgan Chase Bank, N.A. | | PHP | 9,862 | | | | 189,000 | | | | 193,880 | | | | — | | | | (4,880 | ) |
Expiring 12/18/19 | | Morgan Stanley & Co.
International PLC | | PHP | 8,714 | | | | 166,000 | | | | 171,314 | | | | — | | | | (5,314 | ) |
Polish Zloty, | | | | | | | | | | | | | | | | | | | | | | |
Expiring 01/17/20 | | JPMorgan Chase Bank, N.A. | | PLN | 227 | | | | 59,574 | | | | 59,489 | | | | 85 | | | | — | |
Romanian Leu, | | | | | | | | | | | | | | | | | | | | | | |
Expiring 01/17/20 | | HSBC Bank USA, N.A. | | RON | 177 | | | | 41,399 | | | | 41,582 | | | | — | | | | (183 | ) |
Russian Ruble, | | | | | | | | | | | | | | | | | | | | | | |
Expiring 12/18/19 | | Bank of America, N.A. | | RUB | 5,338 | | | | 81,000 | | | | 82,651 | | | | — | | | | (1,651 | ) |
Expiring 12/18/19 | | Barclays Bank PLC | | RUB | 5,442 | | | | 83,000 | | | | 84,267 | | | | — | | | | (1,267 | ) |
Expiring 12/18/19 | | Barclays Bank PLC | | RUB | 5,149 | | | | 78,000 | | | | 79,729 | | | | — | | | | (1,729 | ) |
Expiring 12/18/19 | | Citibank, N.A. | | RUB | 4,780 | | | | 73,000 | | | | 74,013 | | | | — | | | | (1,013 | ) |
See Notes to Financial Statements.
Forward foreign currency exchange contracts outstanding at October 31, 2019 (continued):
| | | | | | | | | | | | | | | | | | | | | | |
Sale Contracts | | Counterparty | | Notional
Amount
(000) | | | Value at
Settlement
Date | | | Current
Value | | | Unrealized
Appreciation | | | Unrealized
Depreciation | |
OTC Forward Foreign Currency Exchange Contracts (cont’d.): | | | | | | | | | | | | | |
Russian Ruble (cont’d.), | | | | | | | | | | | | | | | | | | | | |
Expiring 12/18/19 | | JPMorgan Chase Bank, N.A. | | RUB | 27,434 | | | $ | 423,364 | | | $ | 424,812 | | | $ | — | | | $ | (1,448 | ) |
Expiring 12/18/19 | | JPMorgan Chase Bank, N.A. | | RUB | 17,216 | | | | 258,711 | | | | 266,586 | | | | — | | | | (7,875 | ) |
Expiring 12/18/19 | | JPMorgan Chase Bank, N.A. | | RUB | 11,427 | | | | 173,602 | | | | 176,951 | | | | — | | | | (3,349 | ) |
Expiring 12/18/19 | | JPMorgan Chase Bank, N.A. | | RUB | 8,412 | | | | 124,949 | | | | 130,262 | | | | — | | | | (5,313 | ) |
Expiring 12/18/19 | | JPMorgan Chase Bank, N.A. | | RUB | 5,096 | | | | 79,000 | | | | 78,909 | | | | 91 | | | | — | |
Expiring 12/18/19 | | JPMorgan Chase Bank, N.A. | | RUB | 4,734 | | | | 72,927 | | | | 73,309 | | | | — | | | | (382 | ) |
Expiring 12/18/19 | | JPMorgan Chase Bank, N.A. | | RUB | 2,464 | | | | 37,588 | | | | 38,162 | | | | — | | | | (574 | ) |
Expiring 12/18/19 | | Morgan Stanley & Co.
International PLC | | RUB | 3,051 | | | | 47,345 | | | | 47,239 | | | | 106 | | | | — | |
Singapore Dollar, | | | | | | | | | | | | | | | | | | | | | | |
Expiring 12/18/19 | | Goldman Sachs International | | SGD | 840 | | | | 603,890 | | | | 618,061 | | | | — | | | | (14,171 | ) |
Expiring 12/18/19 | | HSBC Bank USA, N.A. | | SGD | 201 | | | | 147,000 | | | | 147,877 | | | | — | | | | (877 | ) |
Expiring 12/18/19 | | JPMorgan Chase Bank, N.A. | | SGD | 284 | | | | 208,000 | | | | 208,511 | | | | — | | | | (511 | ) |
South African Rand, | | | | | | | | | | | | | | | | | | | | |
Expiring 12/18/19 | | Bank of America, N.A. | | ZAR | 15,703 | | | | 1,030,114 | | | | 1,032,406 | | | | — | | | | (2,292 | ) |
Expiring 12/18/19 | | Bank of America, N.A. | | ZAR | 4,397 | | | | 289,863 | | | | 289,101 | | | | 762 | | | | — | |
Expiring 12/18/19 | | Barclays Bank PLC | | ZAR | 17,277 | | | | 1,126,785 | | | | 1,135,883 | | | | — | | | | (9,098 | ) |
Expiring 12/18/19 | | Barclays Bank PLC | | ZAR | 4,429 | | | | 295,400 | | | | 291,168 | | | | 4,232 | | | | — | |
Expiring 12/18/19 | | Barclays Bank PLC | | ZAR | 2,605 | | | | 172,401 | | | | 171,297 | | | | 1,104 | | | | — | |
Expiring 12/18/19 | | Barclays Bank PLC | | ZAR | 2,589 | | | | 171,771 | | | | 170,209 | | | | 1,562 | | | | — | |
Expiring 12/18/19 | | Barclays Bank PLC | | ZAR | 2,573 | | | | 172,408 | | | | 169,189 | | | | 3,219 | | | | — | |
Expiring 12/18/19 | | Barclays Bank PLC | | ZAR | 1,241 | | | | 81,000 | | | | 81,599 | | | | — | | | | (599 | ) |
Expiring 12/18/19 | | Citibank, N.A. | | ZAR | 2,611 | | | | 170,794 | | | | 171,652 | | | | — | | | | (858 | ) |
See Notes to Financial Statements.
| | | | |
| PGIM Emerging Markets Debt Local Currency Fund | | | 41 | |
Schedule of Investments(continued)
as of October 31, 2019
Forward foreign currency exchange contracts outstanding at October 31, 2019 (continued):
| | | | | | | | | | | | | | | | | | | | | | |
Sale Contracts | | Counterparty | | Notional
Amount
(000) | | | Value at
Settlement
Date | | | Current
Value | | | Unrealized
Appreciation | | | Unrealized
Depreciation | |
OTC Forward Foreign Currency Exchange Contracts (cont’d.): | | | | | | | | | | | | | |
South African Rand (cont’d.), | | | | | | | | | | | | | | | | | | | | |
Expiring 12/18/19 | | Goldman Sachs International | | ZAR | 2,191 | | | $ | 146,869 | | | $ | 144,052 | | | $ | 2,817 | | | $ | — | |
Expiring 12/18/19 | | HSBC Bank USA, N.A. | | ZAR | 1,104 | | | | 73,235 | | | | 72,586 | | | | 649 | | | | — | |
Expiring 12/18/19 | | HSBC Bank USA, N.A. | | ZAR | 919 | | | | 62,067 | | | | 60,389 | | | | 1,678 | | | | — | |
Expiring 12/18/19 | | JPMorgan Chase Bank, N.A. | | ZAR | 3,400 | | | | 228,876 | | | | 223,560 | | | | 5,316 | | | | — | |
Expiring 12/18/19 | | JPMorgan Chase Bank, N.A. | | ZAR | 3,103 | | | | 208,692 | | | | 204,023 | | | | 4,669 | | | | — | |
South Korean Won, | | | | | | | | | | | | | | | | | | | | |
Expiring 12/18/19 | | Citibank, N.A. | | KRW | 513,159 | | | | 426,939 | | | | 438,914 | | | | — | | | | (11,975 | ) |
Expiring 12/18/19 | | HSBC Bank USA, N.A. | | KRW | 161,143 | | | | 135,000 | | | | 137,828 | | | | — | | | | (2,828 | ) |
Expiring 12/18/19 | | JPMorgan Chase Bank, N.A. | | KRW | 128,272 | | | | 107,000 | | | | 109,713 | | | | — | | | | (2,713 | ) |
Expiring 12/18/19 | | JPMorgan Chase Bank, N.A. | | KRW | 125,790 | | | | 105,000 | | | | 107,590 | | | | — | | | | (2,590 | ) |
Swiss Franc, | | | | | | | | | | | | | | | | | | | | | | |
Expiring 01/17/20 | | UBS AG | | CHF | 137 | | | | 138,249 | | | | 139,812 | | | | — | | | | (1,563 | ) |
Thai Baht, | | | | | | | | | | | | | | | | | | | | | | |
Expiring 12/18/19 | | Bank of America, N.A. | | THB | 6,571 | | | | 212,236 | | | | 217,720 | | | | — | | | | (5,484 | ) |
Expiring 12/18/19 | | Barclays Bank PLC | | THB | 5,635 | | | | 183,000 | | | | 186,735 | | | | — | | | | (3,735 | ) |
Expiring 12/18/19 | | Citibank, N.A. | | THB | 4,370 | | | | 142,000 | | | | 144,804 | | | | — | | | | (2,804 | ) |
Expiring 12/18/19 | | Citibank, N.A. | | THB | 2,392 | | | | 78,123 | | | | 79,248 | | | | — | | | | (1,125 | ) |
Expiring 12/18/19 | | Citibank, N.A. | | THB | 1,493 | | | | 48,527 | | | | 49,459 | | | | — | | | | (932 | ) |
Expiring 12/18/19 | | Goldman Sachs International | | THB | 6,307 | | | | 205,000 | | | | 208,980 | | | | — | | | | (3,980 | ) |
Expiring 12/18/19 | | HSBC Bank USA, N.A. | | THB | 8,920 | | | | 295,000 | | | | 295,576 | | | | — | | | | (576 | ) |
Expiring 12/18/19 | | HSBC Bank USA, N.A. | | THB | 5,400 | | | | 176,000 | | | | 178,921 | | | | — | | | | (2,921 | ) |
Expiring 12/18/19 | | HSBC Bank USA, N.A. | | THB | 2,524 | | | | 82,756 | | | | 83,644 | | | | — | | | | (888 | ) |
See Notes to Financial Statements.
Forward foreign currency exchange contracts outstanding at October 31, 2019 (continued):
| | | | | | | | | | | | | | | | | | | | | | |
| | | | | | |
Sale Contracts | | Counterparty | | Notional
Amount
(000) | | | Value at
Settlement
Date | | | Current
Value | | | Unrealized
Appreciation | | | Unrealized
Depreciation | |
OTC Forward Foreign Currency Exchange Contracts (cont’d.): | | | | | | | | | |
Thai Baht (cont’d.), | | | | | | | | | | | | | | | | | | | | |
Expiring 12/18/19 | | JPMorgan Chase Bank, N.A. | | THB | 5,322 | | | $ | 176,000 | | | $ | 176,355 | | | $ | — | | | $ | (355 | ) |
Expiring 12/18/19 | | JPMorgan Chase Bank, N.A. | | THB | 3,634 | | | | 118,000 | | | | 120,428 | | | | — | | | | (2,428 | ) |
Expiring 12/18/19 | | JPMorgan Chase Bank, N.A. | | THB | 2,941 | | | | 96,056 | | | | 97,450 | | | | — | | | | (1,394 | ) |
Turkish Lira, | | | | | | | | | | | | | | | | | | | | | | |
Expiring 12/18/19 | | Barclays Bank PLC | | TRY | 1,194 | | | | 201,832 | | | | 206,165 | | | | — | | | | (4,333 | ) |
Expiring 12/18/19 | | Barclays Bank PLC | | TRY | 685 | | | | 113,000 | | | | 118,226 | | | | — | | | | (5,226 | ) |
Expiring 12/18/19 | | Barclays Bank PLC | | TRY | 459 | | | | 77,000 | | | | 79,214 | | | | — | | | | (2,214 | ) |
Expiring 12/18/19 | | Barclays Bank PLC | | TRY | 379 | | | | 63,000 | | | | 65,524 | | | | — | | | | (2,524 | ) |
Expiring 12/18/19 | | Barclays Bank PLC | | TRY | 304 | | | | 51,000 | | | | 52,508 | | | | — | | | | (1,508 | ) |
Expiring 12/18/19 | | Barclays Bank PLC | | TRY | 169 | | | | 28,000 | | | | 29,104 | | | | — | | | | (1,104 | ) |
Expiring 12/18/19 | | BNP Paribas S.A. | | TRY | 974 | | | | 163,278 | | | | 168,265 | | | | — | | | | (4,987 | ) |
Expiring 12/18/19 | | Citibank, N.A. | | TRY | 711 | | | | 120,546 | | | | 122,739 | | | | — | | | | (2,193 | ) |
Expiring 12/18/19 | | HSBC Bank USA, N.A. | | TRY | 242 | | | | 41,378 | | | | 41,733 | | | | — | | | | (355 | ) |
Expiring 12/18/19 | | JPMorgan Chase Bank, N.A. | | TRY | 3,530 | | | | 583,813 | | | | 609,554 | | | | — | | | | (25,741 | ) |
Expiring 12/18/19 | | JPMorgan Chase Bank, N.A. | | TRY | 841 | | | | 138,660 | | | | 145,217 | | | | — | | | | (6,557 | ) |
Expiring 12/18/19 | | JPMorgan Chase Bank, N.A. | | TRY | 556 | | | | 91,606 | | | | 95,928 | | | | — | | | | (4,322 | ) |
Expiring 12/18/19 | | JPMorgan Chase Bank, N.A. | | TRY | 555 | | | | 93,000 | | | | 95,886 | | | | — | | | | (2,886 | ) |
Expiring 12/18/19 | | JPMorgan Chase Bank, N.A. | | TRY | 326 | | | | 56,199 | | | | 56,219 | | | | — | | | | (20 | ) |
Expiring 12/18/19 | | Morgan Stanley & Co.
International PLC | | TRY | 829 | | | | 139,022 | | | | 143,190 | | | | — | | | | (4,168 | ) |
| | | | | | | | | | | | | | | | | | | | | | |
| | | | | | | | $ | 42,853,533 | | | $ | 43,130,545 | | | | 192,197 | | | | (469,209 | ) |
| | | | | | | | | | | | | | | | | | | | | | |
| | | | | | | | | | | | | | | | $ | 934,479 | | | $ | (659,373 | ) |
| | | | | | | | | | | | | | | | | | | | | | |
See Notes to Financial Statements.
| | | | |
| PGIM Emerging Markets Debt Local Currency Fund | | | 43 | |
Schedule of Investments(continued)
as of October 31, 2019
Interest rate swap agreements outstanding at October 31, 2019:
| | | | | | | | | | | | | | | | | | | | | | | | |
Notional
Amount
(000)# | | | Termination
Date | | | Fixed
Rate | | | Floating Rate | | Value at
Trade
Date | | | Value at
October 31,
2019 | | | Unrealized
Appreciation
(Depreciation) | |
| | Centrally Cleared Interest Rate Swap Agreements: | | | | | | | | | |
| BRL | 12,215 | | | | 01/04/21 | | | | 4.580 | %(T) | | 1 Day BROIS(1)(T) | | $ | — | | | $ | (1,935 | ) | | $ | (1,935 | ) |
| BRL | 8,389 | | | | 01/04/21 | | | | 5.600 | %(T) | | 1 Day BROIS(1)(T) | | | (1,052 | ) | | | (25,218 | ) | | | (24,166 | ) |
| BRL | 4,545 | | | | 01/02/23 | | | | 5.517 | %(T) | | 1 Day BROIS(2)(T) | | | — | | | | 6,114 | | | | 6,114 | |
| BRL | 10,296 | | | | 01/02/23 | | | | 5.690 | %(T) | | 1 Day BROIS(2)(T) | | | — | | | | 27,951 | | | | 27,951 | |
| BRL | 3,533 | | | | 01/02/23 | | | | 6.178 | %(T) | | 1 Day BROIS(2)(T) | | | — | | | | 23,834 | | | | 23,834 | |
| BRL | 2,837 | | | | 01/02/25 | | | | 5.840 | %(T) | | 1 Day BROIS(2)(T) | | | — | | | | (1,283 | ) | | | (1,283 | ) |
| BRL | 818 | | | | 01/02/25 | | | | 5.900 | %(T) | | 1 Day BROIS(1)(T) | | | — | | | | (267 | ) | | | (267 | ) |
| BRL | 1,294 | | | | 01/04/27 | | | | 7.330 | %(T) | | 1 Day BROIS(2)(T) | | | — | | | | 31,117 | | | | 31,117 | |
| CLP | 410,000 | | | | 10/24/22 | | | | 1.815 | %(S) | | 1 Day CLOIS(2)(S) | | | — | | | | 1,044 | | | | 1,044 | |
| CLP | 320,000 | | | | 10/29/24 | | | | 1.980 | %(S) | | 1 Day CLOIS(2)(S) | | | — | | | | (4,550 | ) | | | (4,550 | ) |
| CNH | 5,000 | | | | 03/11/24 | | | | 2.880 | %(Q) | | 7 Day China Fixing Repo Rates(2)(Q) | | | 32 | | | | (5,759 | ) | | | (5,791 | ) |
| CNH | 4,510 | | | | 03/13/24 | | | | 2.945 | %(Q) | | 7 Day China Fixing Repo Rates(2)(Q) | | | 5 | | | | (3,550 | ) | | | (3,555 | ) |
| CNH | 2,320 | | | | 04/10/24 | | | | 3.100 | %(Q) | | 7 Day China Fixing Repo Rates(2)(Q) | | | — | | | | 180 | | | | 180 | |
| CNH | 1,645 | | | | 04/22/24 | | | | 3.170 | %(Q) | | 7 Day China Fixing Repo Rates(2)(Q) | | | — | | | | 769 | | | | 769 | |
| CNH | 1,645 | | | | 04/23/24 | | | | 3.230 | %(Q) | | 7 Day China Fixing Repo Rates(2)(Q) | | | — | | | | 1,355 | | | | 1,355 | |
| CNH | 4,900 | | | | 05/15/24 | | | | 3.005 | %(Q) | | 7 Day China Fixing Repo Rates(2)(Q) | | | 4 | | | | (2,362 | ) | | | (2,366 | ) |
| CNH | 6,130 | | | | 06/05/24 | | | | 2.925 | %(Q) | | 7 Day China Fixing Repo Rates(2)(Q) | | | 7 | | | | (6,259 | ) | | | (6,266 | ) |
| CNH | 12,235 | | | | 06/19/24 | | | | 2.875 | %(Q) | | 7 Day China Fixing Repo Rates(2)(Q) | | | — | | | | (16,718 | ) | | | (16,718 | ) |
| CNH | 8,300 | | | | 08/06/24 | | | | 2.745 | %(Q) | | 7 Day China Fixing Repo Rates(2)(Q) | | | (10 | ) | | | (18,911 | ) | | | (18,901 | ) |
| COP | 950,000 | | | | 12/12/23 | | | | 5.530 | %(Q) | | 1 Day COOIS(2)(Q) | | | — | | | | 9,897 | | | | 9,897 | |
| COP | 3,145,000 | | | | 07/09/24 | | | | 4.510 | %(Q) | | 1 Day COOIS(1)(Q) | | | — | | | | 8,319 | | | | 8,319 | |
| COP | 1,746,000 | | | | 08/08/24 | | | | 4.560 | %(Q) | | 1 Day COOIS(1)(Q) | | | — | | | | 3,421 | | | | 3,421 | |
| COP | 833,120 | | | | 05/28/29 | | | | 5.840 | %(Q) | | 1 Day COOIS(2)(Q) | | | 9,908 | | | | 9,921 | | | | 13 | |
| KRW | 1,800,000 | | | | 06/26/24 | | | | 1.385 | %(Q) | | 3 Month KWCDC(2)(Q) | | | 12,695 | | | | 2,547 | | | | (10,148 | ) |
| KRW | 864,155 | | | | 07/26/24 | | | | 1.246 | %(Q) | | 3 Month KWCDC(2)(Q) | | | 18 | | | | (3,166 | ) | | | (3,184 | ) |
| KRW | 844,600 | | | | 08/05/24 | | | | 1.143 | %(Q) | | 3 Month KWCDC(2)(Q) | | | 7 | | | | (7,292 | ) | | | (7,299 | ) |
| KRW | 870,000 | | | | 08/05/24 | | | | 1.153 | %(Q) | | 3 Month KWCDC(2)(Q) | | | 7 | | | | (7,148 | ) | | | (7,155 | ) |
| MXN | 20,156 | | | | 03/20/24 | | | | 7.703 | %(M) | | 28 Day Mexican Interbank
Rate(2)(M) | | | 4,663 | | | | 56,604 | | | | 51,941 | |
See Notes to Financial Statements.
44
Interest rate swap agreements outstanding at October 31, 2019 (continued):
| | | | | | | | | | | | | | | | | | | | | | |
Notional
Amount
(000)# | | | Termination
Date | | | Fixed
Rate | | Floating Rate | | Value at
Trade
Date | | | Value at
October 31,
2019 | | | Unrealized
Appreciation
(Depreciation) | |
| | Centrally Cleared Interest Rate Swap Agreements (cont’d.): | | | | | | | | | | | | |
| MXN | 14,600 | | | | 05/16/29 | | | 7.980%(M) | | 28 Day Mexican Interbank Rate(2)(M) | | $ | — | | | $ | 76,408 | | | $ | 76,408 | |
| MXN | 16,810 | | | | 05/22/29 | | | 8.075%(M) | | 28 Day Mexican Interbank Rate(2)(M) | | | 4,049 | | | | 94,178 | | | | 90,129 | |
| PLN | 3,430 | | | | 09/21/22 | | | 2.312%(A) | | 6 Month WIBOR(2)(S) | | | — | | | | 15,253 | | | | 15,253 | |
| PLN | 2,700 | | | | 07/24/24 | | | 1.798%(A) | | 6 Month WIBOR(2)(S) | | | — | | | | 1,714 | | | | 1,714 | |
| PLN | 4,898 | | | | 11/22/24 | | | 2.125%(A) | | 6 Month WIBOR(1)(S) | | | (24,164 | ) | | | (23,381 | ) | | | 783 | |
| ZAR | 13,345 | | | | 08/07/24 | | | 7.080%(Q) | | 3 Month JIBAR(1)(Q) | | | 29 | | | | (353 | ) | | | (382 | ) |
| ZAR | 19,070 | | | | 08/07/24 | | | 7.090%(Q) | | 3 Month JIBAR(1)(Q) | | | 277 | | | | (1,047 | ) | | | (1,324 | ) |
| ZAR | 13,894 | | | | 10/17/24 | | | 6.890%(Q) | | 3 Month JIBAR(1)(Q) | | | (404 | ) | | | 8,560 | | | | 8,964 | |
| ZAR | 14,600 | | | | 10/09/26 | | | 7.190%(Q) | | 3 Month JIBAR(1)(Q) | | | 22 | | | | 11,204 | | | | 11,182 | |
| ZAR | 10,560 | | | | 10/30/29 | | | 7.759%(Q) | | 3 Month JIBAR(1)(Q) | | | 37 | | | | 1,964 | | | | 1,927 | |
| | | | | | | | | | | | | | | | | | | | | | |
| | | | | | | | | | | | $ | 6,130 | | | $ | 263,155 | | | $ | 257,025 | |
| | | | | | | | | | | | | | | | | | | | | | |
| | | | | | | | | | | | | | | | | | | | | | | | | | |
Notional
Amount
(000)# | | | Termination
Date | | | Fixed
Rate | | | Floating Rate | | Fair
Value | | | Upfront
Premiums
Paid(Received) | | | Unrealized
Appreciation
(Depreciation) | | | Counterparty |
| | OTC Interest Rate Swap Agreements: | | | | | | | | | | | |
| MYR | 2,000 | | | | 07/10/24 | | | | 3.368%(Q) | | | 3 Month KLIBOR(2)(Q) | | $ | 1,751 | | | $ | 2 | | | $ | 1,749 | | | JPMorgan Chase Bank, N.A. |
| MYR | 1,800 | | | | 10/29/24 | | | | 3.273%(Q) | | | 3 Month KLIBOR(2)(Q) | | | (1,350 | ) | | | 3 | | | | (1,353 | ) | | JPMorgan Chase Bank, N.A. |
| | | | | | | | | | | | | | | | | | | | | | | | | | |
| | | | | | | | | | | | | | $ | 401 | | | $ | 5 | | | $ | 396 | | | |
| | | | | | | | | | | | | | | | | | | | | | | | | | |
| (1) | The Series pays the fixed rate and receives the floating rate. |
| (2) | The Series pays the floating rate and receives the fixed rate. |
See Notes to Financial Statements.
| | | | |
| PGIM Emerging Markets Debt Local Currency Fund | | | 45 | |
Schedule of Investments(continued)
as of October 31, 2019
Balances Reported in the Statement of Assets and Liabilities for OTC Swap Agreements:
| | | | | | | | | | | | | | | | |
| | | Premiums Paid | | | Premiums Received | | | Unrealized
Appreciation | | | Unrealized
Depreciation | |
OTC Swap Agreements | | $ | 5 | | | $ | — | | | $ | 1,749 | | | $ | (1,353 | ) |
| | | | | | | | | | | | | | | | |
Summary of Collateral for Centrally Cleared/Exchange-traded Derivatives:
Cash and securities segregated as collateral, including pending settlement for closed positions, to cover requirements for centrally cleared/exchange-traded derivatives are listed by broker as follows:
| | | | | | | | |
Broker | | Cash and/or
Foreign Currency | | | Securities
Market Value | |
Citigroup Global Markets, Inc. | | $ | 735,000 | | | $ | — | |
| | | | | | | | |
Fair Value Measurements:
Various inputs are used in determining the value of the Series’ investments. These inputs are summarized in the three broad levels listed below.
Level 1—unadjusted quoted prices generally in active markets for identical securities.
Level 2—quoted prices for similar securities, interest rates and yield curves, prepayment speeds, foreign currency exchange rates and other observable inputs.
Level 3—unobservable inputs for securities valued in accordance with Board approved fair valuation procedures.
The following is a summary of the inputs used as of October 31, 2019 in valuing such portfolio securities:
| | | | | | | | | | | | |
| | | Level 1 | | | Level 2 | | | Level 3 | |
Investments in Securities | | | | | | | | | | | | |
Assets | | | | | | | | | | | | |
Sovereign Bonds | | | | | | | | | | | | |
Angola | | $ | — | | | $ | 224,988 | | | $ | — | |
Argentina | | | — | | | | 198,023 | | | | — | |
Bahrain | | | — | | | | 213,128 | | | | — | |
Brazil | | | — | | | | 3,575,772 | | | | — | |
Chile | | | — | | | | 2,113,974 | | | | — | |
China | | | — | | | | 425,920 | | | | — | |
Colombia | | | — | | | | 3,323,858 | | | | — | |
Czech Republic | | | — | | | | 1,009,568 | | | | — | |
Dominican Republic | | | — | | | | 420,581 | | | | — | |
Ecuador | | | — | | | | 275,928 | | | | — | |
Egypt | | | — | | | | 317,253 | | | | — | |
El Salvador | | | — | | | | 136,564 | | | | — | |
Gabon | | | — | | | | 198,940 | | | | — | |
Ghana | | | — | | | | 217,651 | | | | — | |
Greece | | | — | | | | 202,988 | | | | — | |
Hungary | | | — | | | | 2,500,909 | | | | — | |
Indonesia | | | — | | | | 6,336,584 | | | | — | |
See Notes to Financial Statements.
| | | | | | | | | | | | |
| | | Level 1 | | | Level 2 | | | Level 3 | |
Investments in Securities (continued) | | | | | | | | | | | | |
Assets (continued) | | | | | | | | | | | | |
Sovereign Bonds (continued) | | | | | | | | | | | | |
Iraq | | $ | — | | | $ | 282,078 | | | $ | — | |
Ivory Coast | | | — | | | | 319,639 | | | | — | |
Kenya | | | — | | | | 212,203 | | | | — | |
Malaysia | | | — | | | | 3,372,041 | | | | — | |
Mexico | | | — | | | | 4,118,866 | | | | — | |
Mongolia | | | — | | | | 233,211 | | | | — | |
Pakistan | | | — | | | | 401,000 | | | | — | |
Peru | | | — | | | | 2,894,700 | | | | — | |
Philippines | | | — | | | | 529,681 | | | | — | |
Poland | | | — | | | | 3,208,148 | | | | — | |
Romania | | | — | | | | 1,441,857 | | | | — | |
Russia | | | — | | | | 4,020,201 | | | | — | |
South Africa | | | — | | | | 8,582,328 | | | | — | |
Sri Lanka | | | — | | | | 406,800 | | | | — | |
Thailand | | | — | | | | 5,393,774 | | | | — | |
Turkey | | | — | | | | 3,355,983 | | | | — | |
Ukraine | | | — | | | | 837,328 | | | | — | |
Uruguay | | | — | | | | 126,356 | | | | — | |
Corporate Bonds | | | | | | | | | | | | |
Bahrain | | | — | | | | 226,500 | | | | — | |
Belarus | | | — | | | | 209,876 | | | | — | |
Brazil | | | — | | | | 211,200 | | | | — | |
Indonesia | | | — | | | | 227,259 | | | | — | |
Jamaica | | | — | | | | 123,377 | | | | — | |
Kazakhstan | | | — | | | | 283,707 | | | | — | |
Mexico | | | — | | | | 1,330,816 | | | | — | |
Oman | | | — | | | | 186,737 | | | | — | |
Russia | | | — | | | | 2,332,412 | | | | — | |
South Africa | | | — | | | | 205,164 | | | | — | |
Supranational Bank | | | — | | | | 534,676 | | | | — | |
Tunisia | | | — | | | | 308,584 | | | | — | |
Affiliated Mutual Fund | | | 2,483,525 | | | | — | | | | — | |
| | | | | | | | | | | | |
Total | | $ | 2,483,525 | | | $ | 67,609,131 | | | $ | — | |
| | | | | | | | | | | | |
| | | |
Other Financial Instruments* | | | | | | | | | | | | |
Assets | | | | | | | | | | | | |
OTC Forward Foreign Currency Exchange Contracts | | $ | — | | | $ | 934,479 | | | $ | — | |
Centrally Cleared Interest Rate Swap Agreements | | | — | | | | 372,315 | | | | — | |
OTC Interest Rate Swap Agreement | | | — | | | | 1,751 | | | | — | |
| | | | | | | | | | | | |
Total | | $ | — | | | $ | 1,308,545 | | | $ | — | |
| | | | | | | | | | | | |
| | | |
Liabilities | | | | | | | | | | | | |
OTC Forward Foreign Currency Exchange Contracts | | $ | — | | | $ | (659,373 | ) | | $ | — | |
See Notes to Financial Statements.
| | | | |
| PGIM Emerging Markets Debt Local Currency Fund | | | 47 | |
Schedule of Investments(continued)
as of October 31, 2019
| | | | | | | | | | | | |
| | | Level 1 | | | Level 2 | | | Level 3 | |
Other Financial Instruments* (continued) | | | | | | | | | | | | |
Liabilities (continued) | | | | | | | | | | | | |
Centrally Cleared Interest Rate Swap Agreements | | $ | — | | | $ | (115,290 | ) | | $ | — | |
OTC Interest Rate Swap Agreement | | | — | | | | (1,350 | ) | | | — | |
| | | | | | | | | | | | |
Total | | $ | — | | | $ | (776,013 | ) | | $ | — | |
| | | | | | | | | | | | |
| * | Other financial instruments are derivative instruments not reflected in the Schedule of Investments, such as futures, forwards and centrally cleared swap contracts, which are recorded at the unrealized appreciation (depreciation) on the instrument, and OTC swap contracts which are recorded at fair value. |
Industry Classification:
The industry classification of investments and other assets in excess of liabilities shown as a percentage of net assets as of October 31, 2019 were as follows (unaudited):
| | | | |
Sovereign Bonds | | | 84.9 | % |
Affiliated Mutual Fund | | | 3.4 | |
Investment Companies | | | 2.9 | |
Oil & Gas | | | 2.1 | |
Telecommunications | | | 1.2 | |
Banks | | | 1.0 | |
Multi-National | | | 0.7 | |
| | | | |
Electric | | | 0.6 | % |
| | | | |
| | | 96.8 | |
Other assets in excess of liabilities | | | 3.2 | |
| | | | |
| | | 100.0 | % |
| | | | |
Effects of Derivative Instruments on the Financial Statements and Primary Underlying Risk Exposure:
The Series invested in derivative instruments during the reporting period. The primary types of risk associated with these derivative instruments are foreign exchange contracts risk and interest rate contracts risk. See the Notes to Financial Statements for additional detail regarding these derivative instruments and their risks. The effect of such derivative instruments on the Series’ financial position and financial performance as reflected in the Statement of Assets and Liabilities and Statement of Operations is presented in the summary below.
Fair values of derivative instruments as of October 31, 2019 as presented in the Statement of Assets and Liabilities:
| | | | | | | | | | | | |
| | | Asset Derivatives | | | Liability Derivatives | |
Derivatives not accounted
for as hedging instruments,
carried at fair value | | Statement of
Assets and
Liabilities Location | | Fair
Value | | | Statement of
Assets and
Liabilities Location | | Fair
Value | |
| Foreign exchange contracts | | Unrealized appreciation on OTC forward foreign currency exchange contracts | | $ | 934,479 | | | Unrealized depreciation on OTC forward foreign currency exchange contracts | | $ | 659,373 | |
| Interest rate contracts | | Due from/to broker-variation margin swaps | | | 372,315 | * | | Due from/to broker-variation margin swaps | | | 115,290 | * |
See Notes to Financial Statements.
| | | | | | | | | | | | |
| | | Asset Derivatives | | | Liability Derivatives | |
Derivatives not accounted
for as hedging instruments,
carried at fair value | | Statement of
Assets and
Liabilities Location | | Fair
Value | | | Statement of
Assets and
Liabilities Location | | Fair
Value | |
| Interest rate contracts | | Premiums paid for OTC swap agreements | | $ | 5 | | | — | | $ | — | |
| Interest rate contracts | | Unrealized appreciation on OTC swap agreements | | | 1,749 | | | Unrealized depreciation on OTC swap agreements | | | 1,353 | |
| | | | | | | | | | | | |
| | | | $ | 1,308,548 | | | | | $ | 776,016 | |
| | | | | | | | | | | | |
| * | Includes cumulative appreciation (depreciation) as reported in the schedule of open futures and centrally cleared swap contracts. Only unsettled variation margin receivable (payable) is reported within the Statement of Assets and Liabilities. |
The effects of derivative instruments on the Statement of Operations for the year ended October 31, 2019 are as follows:
| | | | | | | | |
Amount of Realized Gain (Loss) on Derivatives Recognized in Income | |
Derivatives not accounted
for as hedging instruments,
carried at fair value | | Forward & Cross
Currency
Exchange
Contracts | | | Swaps | |
Foreign exchange contracts | | $ | 245,339 | | | $ | — | |
Interest rate contracts | | | — | | | | 153,982 | |
| | | | | | | | |
Total | | $ | 245,339 | | | $ | 153,982 | |
| | | | | | | | |
| | | | | | | | |
Change in Unrealized Appreciation (Depreciation) on Derivatives Recognized in Income | |
Derivatives not accounted
for as hedging instruments,
carried at fair value | | Forward & Cross
Currency
Exchange
Contracts | | | Swaps | |
Foreign exchange contracts | | $ | (63,796 | ) | | $ | — | |
Interest rate contracts | | | — | | | | 349,290 | |
| | | | | | | | |
Total | | $ | (63,796 | ) | | $ | 349,290 | |
| | | | | | | | |
For the year ended October 31, 2019, the Series’ average volume of derivative activities is as follows:
| | |
Forward
Foreign
Currency
Exchange
Contracts—
Purchased(1) | |
| $ | 45,316,043 | |
See Notes to Financial Statements.
| | | | |
| PGIM Emerging Markets Debt Local Currency Fund | | | 49 | |
Schedule of Investments(continued)
as of October 31, 2019
| | | | | | | | | | |
Forward
Foreign
Currency
Exchange
Contracts—
Sold(1) | | | Cross
Currency
Exchange
Contracts(2) | | | Interest
Rate
Swap
Agreements(3) | |
| $ | 35,637,313 | | | $ | 253,839 | | | $ | 14,049,664 | |
| (1) | Value at Settlement Date. |
| (3) | Notional Amount in USD. |
Financial Instruments/Transactions—Summary of Offsetting and Netting Arrangements:
The Series invested in OTC derivatives during the reporting period that are either offset in accordance with current requirements or are subject to enforceable master netting arrangements or similar agreements that permit offsetting. The information about offsetting and related netting arrangements for OTC derivatives where the legal right toset-off exists is presented in the summary below.
Offsetting of OTC derivative assets and liabilities:
| | | | | | | | | | | | | | | | | | | | |
Counterparty | | Gross
Amounts of
Recognized
Assets(1) | | | Gross
Amounts of
Recognized
Liabilities(1) | | | Net Amounts of
Recognized
Assets/(Liabilities) | | | Collateral
Pledged/
(Received)(2) | | | Net
Amount | |
Bank of America, N.A. | | $ | 9,046 | | | $ | (16,716 | ) | | $ | (7,670 | ) | | $ | — | | | $ | (7,670 | ) |
Barclays Bank PLC | | | 99,520 | | | | (56,408 | ) | | | 43,112 | | | | — | | | | 43,112 | |
BNP Paribas S.A. | | | 44,578 | | | | (53,350 | ) | | | (8,772 | ) | | | — | | | | (8,772 | ) |
Citibank, N.A. | | | 112,520 | | | | (121,075 | ) | | | (8,555 | ) | | | — | | | | (8,555 | ) |
Credit Suisse International | | | 13,323 | | | | (71,945 | ) | | | (58,622 | ) | | | — | | | | (58,622 | ) |
Deutsche Bank AG | | | — | | | | (1,047 | ) | | | (1,047 | ) | | | — | | | | (1,047 | ) |
Goldman Sachs International | | | 13,718 | | | | (34,507 | ) | | | (20,789 | ) | | | — | | | | (20,789 | ) |
HSBC Bank USA, N.A. | | | 49,230 | | | | (89,469 | ) | | | (40,239 | ) | | | — | | | | (40,239 | ) |
JPMorgan Chase Bank, N.A. | | | 312,415 | | | | (131,008 | ) | | | 181,407 | | | | — | | | | 181,407 | |
Morgan Stanley & Co. International PLC | | | 163,470 | | | | (18,690 | ) | | | 144,780 | | | | — | | | | 144,780 | |
The Toronto-Dominion Bank | | | 108,610 | | | | (28,015 | ) | | | 80,595 | | | | — | | | | 80,595 | |
UBS AG | | | 9,803 | | | | (38,496 | ) | | | (28,693 | ) | | | — | | | | (28,693 | ) |
| | | | | | | | | | | | | | | | | | | | |
| | $ | 936,233 | | | $ | (660,726 | ) | | $ | 275,507 | | | $ | — | | | $ | 275,507 | |
| | | | | | | | | | | | | | | | | | | | |
| (1) | Includes unrealized appreciation/(depreciation) on swaps and forwards, premiums paid/(received) on swap agreements and market value of purchased and written options, as represented on the Statement of Assets and Liabilities. |
See Notes to Financial Statements.
| (2) | Collateral amount disclosed by the Series is limited to the market value of financial instruments/transactions and the Series’ OTC derivative exposure by counterparty. |
See Notes to Financial Statements.
| | | | |
| PGIM Emerging Markets Debt Local Currency Fund | | | 51 | |
Statement of Assets and Liabilities
as of October 31, 2019
| | | | |
Assets | | | | |
Investments at value: | | | | |
Unaffiliated investments (cost $66,449,221) | | $ | 67,609,131 | |
Affiliated investments (cost $2,483,525) | | | 2,483,525 | |
Cash | | | 12,862 | |
Foreign currency, at value (cost $111,951) | | | 113,264 | |
Receivable for Series shares sold | | | 2,222,918 | |
Dividends and interest receivable | | | 1,242,542 | |
Unrealized appreciation on OTC forward foreign currency exchange contracts | | | 934,479 | |
Deposit with broker for centrally cleared/exchange-traded derivatives | | | 735,000 | |
Tax reclaim receivable | | | 81,826 | |
Due from broker—variation margin swaps | | | 35,226 | |
Receivable for investments sold | | | 7,844 | |
Unrealized appreciation on OTC swap agreements | | | 1,749 | |
Premiums paid for OTC swap agreements | | | 5 | |
Prepaid expenses | | | 923 | |
| | | | |
Total Assets | | | 75,481,294 | |
| | | | |
| |
Liabilities | | | | |
Payable for Series shares reacquired | | | 2,231,746 | |
Unrealized depreciation on OTC forward foreign currency exchange contracts | | | 659,373 | |
Payable for investments purchased | | | 92,946 | |
Accrued expenses and other liabilities | | | 76,936 | |
Management fee payable | | | 15,544 | |
Unrealized depreciation on OTC swap agreements | | | 1,353 | |
Distribution fee payable | | | 1,254 | |
Affiliated transfer agent fee payable | | | 685 | |
Dividends payable | | | 402 | |
| | | | |
Total Liabilities | | | 3,080,239 | |
| | | | |
| |
Net Assets | | $ | 72,401,055 | |
| | | | |
| | | | | |
Net assets were comprised of: | | | | |
Common stock, at par | | $ | 118,237 | |
Paid-in capital in excess of par | | | 77,280,618 | |
Total distributable earnings (loss) | | | (4,997,800 | ) |
| | | | |
Net assets, October 31, 2019 | | $ | 72,401,055 | |
| | | | |
See Notes to Financial Statements.
| | | | |
Class A | | | | |
Net asset value and redemption price per share,
($3,692,478 ÷ 608,334 shares of common stock issued and outstanding) | | $ | 6.07 | |
Maximum sales charge (3.25% of offering price) | | | 0.20 | |
| | | | |
Maximum offering price to public | | $ | 6.27 | |
| | | | |
| |
Class C | | | | |
Net asset value, offering price and redemption price per share,
($578,953 ÷ 94,722 shares of common stock issued and outstanding) | | $ | 6.11 | |
| | | | |
| |
Class Z | | | | |
Net asset value, offering price and redemption price per share,
($68,100,590 ÷ 11,115,895 shares of common stock issued and outstanding) | | $ | 6.13 | |
| | | | |
| |
Class R6 | | | | |
Net asset value, offering price and redemption price per share,
($29,034 ÷ 4,743 shares of common stock issued and outstanding) | | $ | 6.12 | |
| | | | |
See Notes to Financial Statements.
| | | | |
| PGIM Emerging Markets Debt Local Currency Fund | | | 53 | |
Statement of Operations
Year Ended October 31, 2019
| | | | |
Net Investment Income (Loss) | | | | |
Income | | | | |
Interest income (net of $75,774 foreign withholding tax) | | $ | 4,132,412 | |
Affiliated dividend income | | | 42,655 | |
Affiliated income from securities lending, net | | | 8 | |
| | | | |
Total income | | | 4,175,075 | |
| | | | |
| |
Expenses | | | | |
Management fee | | | 536,189 | |
Distribution fee(a) | | | 13,720 | |
Custodian and accounting fees | | | 114,864 | |
Audit fee | | | 64,839 | |
Transfer agent’s fees and expenses (including affiliated expense of $4,546)(a) | | | 64,048 | |
Registration fees(a) | | | 56,130 | |
Shareholders’ reports | | | 36,570 | |
Legal fees and expenses | | | 17,806 | |
Directors’ fees | | | 12,471 | |
Miscellaneous | | | 20,993 | |
| | | | |
Total expenses | | | 937,630 | |
Less: Fee waiver and/or expense reimbursement(a) | | | (334,090 | ) |
| | | | |
Net expenses | | | 603,540 | |
| | | | |
Net investment income (loss) | | | 3,571,535 | |
| | | | |
| |
Realized And Unrealized Gain (Loss) On Investment And Foreign Currency Transactions | | | | |
Net realized gain (loss) on: | | | | |
Investment transactions (including affiliated of $(16)) | | | (2,315,481 | ) |
Forward and cross currency contract transactions | | | 245,339 | |
Swap agreement transactions | | | 153,982 | |
Foreign currency transactions | | | (26,246 | ) |
| | | | |
| | | (1,942,406 | ) |
| | | | |
Net change in unrealized appreciation (depreciation) on: | | | | |
Investments (net of change in foreign capital gains taxes $(14,165)) | | | 8,078,497 | |
Forward and cross currency contracts | | | (63,796 | ) |
Swap agreements | | | 349,290 | |
Foreign currencies | | | 47,663 | |
| | | | |
| | | 8,411,654 | |
| | | | |
Net gain (loss) on investment and foreign currency transactions | | | 6,469,248 | |
| | | | |
Net Increase (Decrease) In Net Assets Resulting From Operations | | $ | 10,040,783 | |
| | | | |
| (a) | Class specific expenses and waivers were as follows: |
| | | | | | | | | | | | | | | | |
| | | Class A | | | Class C | | | Class Z | | | Class R6 | |
Distribution fee | | | 8,059 | | | | 5,661 | | | | — | | | | — | |
Transfer agent’s fees and expenses | | | 5,163 | | | | 1,400 | | | | 57,391 | | | | 94 | |
Registration fees | | | 13,440 | | | | 13,440 | | | | 15,810 | | | | 13,440 | |
Fee waiver and/or expense reimbursement | | | (28,993 | ) | | | (16,662 | ) | | | (274,862 | ) | | | (13,573 | ) |
See Notes to Financial Statements.
Statements of Changes in Net Assets
| | | | | | | | |
| |
| | | Year Ended October 31, | |
| | |
| | | 2019 | | | 2018 | |
Increase (Decrease) in Net Assets | | | | | | | | |
Operations | | | | | | | | |
Net investment income (loss) | | $ | 3,571,535 | | | $ | 2,978,357 | |
Net realized gain (loss) on investment and foreign currency transactions | | | (1,942,406 | ) | | | (5,671,246 | ) |
Net change in unrealized appreciation (depreciation) on investments and foreign currencies | | | 8,411,654 | | | | (5,528,151 | ) |
| | | | | | | | |
Net increase (decrease) in net assets resulting from operations | | | 10,040,783 | | | | (8,221,040 | ) |
| | | | | | | | |
| | |
Dividends and Distributions | | | | | | | | |
Distributions from distributable earnings | | | | | | | | |
Class A | | | (173,207 | ) | | | — | |
Class C | | | (26,238 | ) | | | — | |
Class Z | | | (3,540,771 | ) | | | — | |
Class R6 | | | (804 | ) | | | — | |
| | | | | | | | |
| | | (3,741,020 | ) | | | — | |
| | | | | | | | |
Tax return of capital distributions | | | | | | | | |
Class A | | | (3,312 | ) | | | (233,404 | ) |
Class C | | | (502 | ) | | | (32,950 | ) |
Class Z | | | (67,701 | ) | | | (2,899,199 | ) |
Class R6 | | | (15 | ) | | | (60 | ) |
| | | | | | | | |
| | | (71,530 | ) | | | (3,165,613 | ) |
| | | | | | | | |
| | |
Series share transactions (Net of share conversions) | | | | | | | | |
Net proceeds from shares sold | | | 18,954,796 | | | | 50,204,752 | |
Net asset value of shares issued in reinvestment of dividends and distributions | | | 3,793,522 | | | | 3,154,838 | |
Cost of shares reacquired | | | (15,260,204 | ) | | | (14,112,150 | ) |
| | | | | | | | |
Net increase (decrease) in net assets from Series share transactions | | | 7,488,114 | | | | 39,247,440 | |
| | | | | | | | |
Total increase (decrease) | | | 13,716,347 | | | | 27,860,787 | |
| | |
Net Assets: | | | | | | | | |
Beginning of year | | | 58,684,708 | | | | 30,823,921 | |
| | | | | | | | |
End of year | | $ | 72,401,055 | | | $ | 58,684,708 | |
| | | | | | | | |
See Notes to Financial Statements.
| | | | |
| PGIM Emerging Markets Debt Local Currency Fund | | | 55 | |
Notes to Financial Statements
Prudential World Fund, Inc. (the “Fund”) is registered under the Investment Company Act of 1940, as amended (“1940 Act”), as anopen-end management investment company and currently consists of seven series: PGIM Jennison Emerging Markets Equity Opportunities Fund, PGIM Jennison Global Opportunities Fund, PGIM Jennison International Opportunities Fund and PGIM QMA International Equity Fund, each of which are diversified funds and PGIM Jennison Global Infrastructure Fund, PGIM Emerging Markets Debt Hard Currency Fund and PGIM Emerging Markets Debt Local Currency Fund, each of which arenon-diversified funds for purposes of the 1940 Act. These financial statements relate only to the PGIM Emerging Markets Debt Local Currency Fund (the “Series”).
The investment objective of the Series is total return, through a combination of current income and capital appreciation.
1. Accounting Policies
The Series follows the investment company accounting and reporting guidance of the Financial Accounting Standards Board (“FASB”) Accounting Standard Codification (“ASC”) Topic 946 Financial Services—Investment Companies.The following accounting policies conform to U.S. generally accepted accounting principles. The Series consistently follows such policies in the preparation of its financial statements.
Securities Valuation:The Series holds securities and other assets and liabilities that are fair valued at the close of each day (generally, 4:00 PM Eastern time) the New York Stock Exchange (“NYSE”) is open for trading. Fair value is the price that would be received to sell an asset or paid to transfer a liability in an orderly transaction between market participants on the measurement date. The Fund’s Board of Directors (the “Board”) has adopted valuation procedures for security valuation under which fair valuation responsibilities have been delegated to PGIM Investments LLC (“PGIM Investments” or the “Manager”). Pursuant to the Board’s delegation, the Manager has established a Valuation Committee responsible for supervising the fair valuation of portfolio securities and other assets and liabilities. The valuation procedures permit the Series to utilize independent pricing vendor services, quotations from market makers, and alternative valuation methods when market quotations are either not readily available or not deemed representative of fair value. A record of the Valuation Committee’s actions is subject to the Board’s review, approval, and ratification at its next regularly scheduled quarterly meeting.
For the fiscal reportingyear-end, securities and other assets and liabilities were fair valued at the close of the last U.S. business day. Trading in certain foreign securities may occur when the NYSE is closed (including weekends and holidays). Because such foreign securities
trade in markets that are open on weekends and U.S. holidays, the values of some of the Series’ foreign investments may change on days when investors cannot purchase or redeem Series shares.
Various inputs determine how the Series’ investments are valued, all of which are categorized according to the three broad levels (Level 1, 2, or 3) detailed in the Schedule of Investments and referred to herein as the “fair value hierarchy” in accordance with FASB ASC Topic 820—Fair Value Measurements and Disclosures.
Investments inopen-end,non-exchange-traded mutual funds are valued at their net asset values as of the close of the NYSE on the date of valuation. These securities are classified as Level 1 in the fair value hierarchy since they may be purchased or sold at their net asset values on the date of valuation.
Fixed income securities traded in the OTC market are generally classified as Level 2 in the fair value hierarchy. Such fixed income securities are typically valued using the market approach which generally involves obtaining data from an approved independent third-party vendor source. The Series utilizes the market approach as the primary method to value securities when market prices of identical or comparable instruments are available. The third-party vendors’ valuation techniques used to derive the evaluated bid price are based on evaluating observable inputs, including but not limited to, yield curves, yield spreads, credit ratings, deal terms, tranche level attributes, default rates, cash flows, prepayment speeds, broker/dealer quotations and reported trades. Certain Level 3 securities are also valued using the market approach when obtaining a single broker quote or when utilizing transaction prices for identical securities that have been used in excess of five business days. During the reporting period, there were no changes to report with respect to the valuation approach and/or valuation techniques discussed above.
OTC and centrally cleared derivative instruments are generally classified as Level 2 in the fair value hierarchy. Such derivative instruments are typically valued using the market approach and/or income approach which generally involves obtaining data from an approved independent third-party vendor source. The Series utilizes the market approach when quoted prices in broker-dealer markets are available but also includes consideration of alternative valuation approaches, including the income approach. In the absence of reliable market quotations, the income approach is typically utilized for purposes of valuing derivatives such as interest rate swaps based on a discounted cash flow analysis whereby the value of the instrument is equal to the present value of its future cash inflows or outflows. Such analysis includes projecting future cash flows and determining the discount rate (including the present value factors that affect the discount rate) used to discount the future cash flows. In addition, the third-party vendors’ valuation techniques used to derive the evaluated derivative price is based on evaluating observable inputs, including but not limited to, underlying asset prices, indices, spreads, interest rates and exchange rates. Certain derivatives may be classified as Level 3 when valued using the market approach by obtaining a single broker quote or when utilizing unobservable inputs in the income
| | | | |
| PGIM Emerging Markets Debt Local Currency Fund | | | 57 | |
Notes to Financial Statements(continued)
approach. During the reporting period, there were no changes to report with respect to the valuation approach and/or valuation techniques discussed above.
Securities and other assets that cannot be priced according to the methods described above are valued based on pricing methodologies approved by the Board. In the event that unobservable inputs are used when determining such valuations, the securities will be classified as Level 3 in the fair value hierarchy.
When determining the fair value of securities, some of the factors influencing the valuation include: the nature of any restrictions on disposition of the securities; assessment of the general liquidity of the securities; the issuer’s financial condition and the markets in which it does business; the cost of the investment; the size of the holding and the capitalization of the issuer; the prices of any recent transactions or bids/offers for such securities or any comparable securities; any available analyst media or other reports or information deemed reliable by the Manager regarding the issuer or the markets or industry in which it operates. Using fair value to price securities may result in a value that is different from a security’s most recent closing price and from the price used by other unaffiliated mutual funds to calculate their net asset values.
Illiquid Securities: Pursuant to Rule22e-4 under the 1940 Act, the Series has adopted a Board approved Liquidity Risk Management Program (“LRMP”) that requires, among other things, that the Series limit its illiquid investments that are assets to no more than 15% of net assets. Illiquid securities are those that, because of the absence of a readily available market or due to legal or contractual restrictions on resale, may not reasonably be expected to be sold or disposed of in current market conditions in seven calendar days or less without the sale or disposition significantly changing the market value of the investment. The Series may find it difficult to sell illiquid securities at the time considered most advantageous by its subadviser and may incur transaction costs that would not be incurred in the sale of securities that were freely marketable.
Restricted Securities: Securities acquired in unregistered, private sales from the issuing company or from an affiliate of the issuer are considered restricted as to disposition under federal securities law (“restricted securities”). Such restricted securities are valued pursuant to the valuation procedures noted above. Restricted securities that would otherwise be considered illiquid investments pursuant to the Series’ LRMP because of legal restrictions on resale to the general public may be traded among qualified institutional buyers under Rule 144A of the Securities Act of 1933. Therefore, these Rule 144A securities, as well as commercial paper that is sold in private placements under Section 4(2) of the Securities Act of 1933, may be classified higher than “illiquid” under the LRMP (i.e. “moderately liquid” or “less liquid” investments). However, the liquidity of the Series’ investments in restricted securities could be impaired if trading does not develop or declines.
Foreign Currency Translation: The books and records of the Series are maintained in U.S. dollars. Foreign currency amounts are translated into U.S. dollars on the following basis:
(i) market value of investment securities, other assets and liabilities—at the current rates of exchange;
(ii) purchases and sales of investment securities, income and expenses—at the rates of exchange prevailing on the respective dates of such transactions.
Although the net assets of the Series are presented at the foreign exchange rates and market values at the close of the period, the Series does not generally isolate that portion of the results of operations arising as a result of changes in the foreign exchange rates from the fluctuations arising from changes in the market prices of long-term portfolio securities held at the end of the period. Similarly, the Series does not isolate the effect of changes in foreign exchange rates from the fluctuations arising from changes in the market prices of long-term portfolio securities sold during the period. Accordingly, holding period realized foreign currency gains (losses) are included in the reported net realized gains (losses) on investment transactions. Notwithstanding the above, the Series does isolate the effect of fluctuations in foreign currency exchange rates when determining the gain (loss) upon the sale or maturity of foreign currency denominated debt obligations; such amounts are included in net realized gains (losses) on foreign currency transactions.
Additionally, net realized gains (losses) on foreign currency transactions represent net foreign exchange gains (losses) from the disposition of holdings of foreign currencies, currency gains (losses) realized between the trade and settlement dates on forward currency transactions, and the difference between the amounts of interest, dividends and foreign withholding taxes recorded on the Series’ books and the U.S. dollar equivalent amounts actually received or paid. Net unrealized currency gains (losses) arise from valuing foreign currency denominated assets and liabilities (other than investments) at period end exchange rates.
Forward and Cross Currency Contracts: A forward currency contract is a commitment to purchase or sell a foreign currency at a future date at a negotiated forward rate. The Series enters into forward currency contracts, as defined in the prospectus, in order to hedge its exposure to changes in foreign currency exchange rates on its foreign portfolio holdings or on specific receivables and payables denominated in a foreign currency and to gain exposure to certain currencies. The contracts are valued daily at current forward exchange rates and any unrealized gain (loss) is included in net unrealized appreciation (depreciation) on forward and cross currency contracts. Gain (loss) is realized on the settlement date of the contract equal to the difference between the settlement value of the original and negotiated forward contracts. This gain (loss), if any, is included in net realized gain (loss) on forward and cross currency contract transactions. Risks may arise upon entering into these contracts from the potential inability of the counterparties to meet the terms of their contracts. Forward currency contracts involve risks from currency exchange rate and credit risk in excess of the amounts reflected on the Statement of Assets and Liabilities. The Series’
| | | | |
| PGIM Emerging Markets Debt Local Currency Fund | | | 59 | |
Notes to Financial Statements(continued)
maximum risk of loss from counterparty credit risk is the net value of the cash flows to be received from the counterparty at the end of the contract’s life. A cross currency contract is a forward contract where a specified amount of one foreign currency will be exchanged for a specified amount of another foreign currency.
Swap Agreements: The Series entered into certain types of swap agreements detailed in the disclosures below. A swap agreement is an agreement to exchange the return generated by one instrument for the return generated by another instrument. Swap agreements are negotiated in the OTC market and may be executed either directly with a counterparty(“OTC-traded”) or through a central clearing facility, such as a registered exchange. Swap agreements are valued daily at current market value and any change in value is included in the net unrealized appreciation (depreciation) on swap agreements. Centrally cleared swaps pay or receive an amount known as “variation margin”, based on daily changes in the valuation of the swap contract. Any upfront premiums paid and received are shown as swap premiums paid and swap premiums received in the Statement of Assets and Liabilities. Risk of loss may exceed amounts recognized on the Statement of Assets and Liabilities. Swap agreements outstanding at period end, if any, are listed on the Schedule of Investments.
Interest Rate Swaps: Interest rate swaps represent an agreement between counterparties to exchange cash flows based on the difference between two interest rates, applied to a notional principal amount for a specified period. The Series is subject to interest rate risk exposure in the normal course of pursuing its investment objective. The Series used interest rate swaps to maintain its ability to generate steady cash flow by receiving a stream of fixed rate payments or to increase exposure to prevailing market rates by receiving floating rate payments. The Series’ maximum risk of loss from counterparty credit risk is the discounted net present value of the cash flows to be received from the counterparty over the contract’s remaining life.
Master Netting Arrangements: The Fund, on behalf of the Series, is subject to various Master Agreements, or netting arrangements, with select counterparties. These are agreements which a subadviser may have negotiated and entered into on behalf of all or a portion of the Series. A master netting arrangement between the Series and the counterparty permits the Series to offset amounts payable by the Series to the same counterparty against amounts to be received; and by the receipt of collateral from the counterparty by the Series to cover the Series’ exposure to the counterparty. However, there is no assurance that such mitigating factors are easily enforceable. In addition to master netting arrangements, the right toset-off exists when all the conditions are met such that each of the parties owes the other determinable amounts, the reporting party has the right toset-off the amount owed with the amount owed by the other party, the reporting party intends toset-off and the right
ofset-off is enforceable by law. During the reporting period, there was no intention to settle on a net basis and all amounts are presented on a gross basis on the Statement of Assets and Liabilities.
The Fund, on behalf of the Series, is a party to International Swaps and Derivatives Association, Inc. (“ISDA”) Master Agreements with certain counterparties that govern OTC derivative and foreign exchange contracts entered into from time to time. The Master Agreements may contain provisions regarding, among other things, the parties’ general obligations, representations, agreements, collateral requirements, events of default and early termination. With respect to certain counterparties, in accordance with the terms of the Master Agreements, collateral posted to the Series is held in a segregated account by the Series’ custodian and with respect to those amounts which can be sold orre-pledged, is presented in the Schedule of Investments. Collateral pledged by the Series is segregated by the Series’ custodian and identified in the Schedule of Investments. Collateral can be in the form of cash or debt securities issued by the U.S. Government or related agencies or other securities as agreed to by the Series and the applicable counterparty. Collateral requirements are determined based on the Series’ net position with each counterparty. Termination events applicable to the Series may occur upon a decline in the Series’ net assets below a specified threshold over a certain period of time. Termination events applicable to counterparties may occur upon a decline in the counterparty’s long-term and short-term credit ratings below a specified level. In each case, upon occurrence, the other party may elect to terminate early and cause settlement of all derivative and foreign exchange contracts outstanding, including the payment of any losses and costs resulting from such early termination, as reasonably determined by the terminating party. Any decision by one or more of the Series’ counterparties to elect early termination could impact the Series’ future derivative activity.
In addition to each instrument’s primary underlying risk exposure (e.g. interest rate, credit, equity or foreign exchange, etc.), swap agreements involve, to varying degrees, elements of credit, market and documentation risk. Such risks involve the possibility that no liquid market for these agreements will exist, the counterparty to the agreement may default on its obligation to perform or disagree on the contractual terms of the agreement, and changes in net interest rates will be unfavorable. In connection with these agreements, securities in the portfolio may be identified or received as collateral from the counterparty in accordance with the terms of the respective swap agreements to provide or receive assets of value and to serve as recourse in the event of default or bankruptcy/insolvency of either party. Such OTC derivative agreements include conditions which, when materialized, give the counterparty the right to cause an early termination of the transactions under those agreements. Any election by the counterparty for early termination of the contract(s) may impact the amounts reported on financial statements.
As of October 31, 2019, the Series has not met conditions under such agreements which give the counterparty the right to call for an early termination.
| | | | |
| PGIM Emerging Markets Debt Local Currency Fund | | | 61 | |
Notes to Financial Statements(continued)
Forward currency contracts, forward rate agreements, written options, short sales, swaps and financial futures contracts involve elements of both market and credit risk in excess of the amounts reflected on the Statement of Assets and Liabilities. Such risks may be mitigated by engaging in master netting arrangements.
Securities Lending: The Series lends its portfolio securities to banks and broker-dealers. The loans are secured by collateral at least equal to the market value of the securities loaned. Collateral pledged by each borrower is invested in an affiliated money market fund and is marked to market daily, based on the previous day’s market value, such that the value of the collateral exceeds the value of the loaned securities. In the event of significant appreciation in value of securities on loan on the last business day of the reporting period, the financial statements may reflect a collateral value that is less than the market value of the loaned securities. Such shortfall is remedied as described above. Loans are subject to termination at the option of the borrower or the Series. Upon termination of the loan, the borrower will return to the Series securities identical to the loaned securities. Should the borrower of the securities fail financially, the Series has the right to repurchase the securities in the open market using the collateral.
The Series recognizes income, net of any rebate and securities lending agent fees, for lending its securities in the form of fees or interest on the investment of any cash received as collateral. The borrower receives all interest and dividends from the securities loaned and such payments are passed back to the lender in amounts equivalent thereto. The Series also continues to recognize any unrealized gain (loss) in the market price of the securities loaned and on the change in the value of the collateral invested that may occur during the term of the loan. In addition, realized gain (loss) is recognized on changes in the value of the collateral invested upon liquidation of the collateral. Net earnings from securities lending are disclosed on the Statement of Operations as “Income from securities lending, net”.
Securities Transactions and Net Investment Income: Securities transactions are recorded on the trade date. Realized gains (losses) from investment and currency transactions are calculated on the specific identification method. Dividend income is recorded on theex-date, or for certain foreign securities, when the Series becomes aware of such dividends. Interest income, including amortization of premium and accretion of discount on debt securities, as required, is recorded on the accrual basis. Expenses are recorded on an accrual basis, which may require the use of certain estimates by management that may differ from actual. Net investment income or loss (other than class specific expenses and waivers, which are allocated as noted below) and unrealized and realized gains (losses) are allocated daily to each class of shares based upon the relative proportion of adjusted net assets of each class at the beginning of the day. Class specific expenses and waivers, where applicable, are charged to the respective share classes. Class specific expenses include
distribution fees and distribution fee waivers, shareholder servicing fees, transfer agent’s fees and expenses, registration fees and fee waivers and/or expense reimbursements, as applicable.
Taxes: It is the Series’ policy to continue to meet the requirements of the Internal Revenue Code applicable to regulated investment companies and to distribute all of its taxable net investment income and capital gains, if any, to its shareholders. Therefore, no federal income tax provision is required. Withholding taxes on foreign dividends, interest and capital gains, if any, are recorded, net of reclaimable amounts, at the time the related income is earned.
Dividends and Distributions: The Series expects to declare dividends of its net investment income daily and pay such dividends monthly. Distributions of net realized capital and currency gains, if any, are declared and paid at least annually. Dividends and distributions to shareholders, which are determined in accordance with federal income tax regulations and which may differ from generally accepted accounting principles, are recorded on theex-date. Permanent book/tax differences relating to income and gain (loss) are reclassified between total distributable earnings (loss) andpaid-in capital in excess of par, as appropriate.
Estimates: The preparation of financial statements requires management to make estimates and assumptions that affect the reported amounts and disclosures in the financial statements. Actual results could differ from those estimates.
2. Agreements
The Fund, on behalf of the Series, has a management agreement with the Manager. Pursuant to this agreement, the Manager has responsibility for all investment advisory services and supervises the subadviser’s performance of such services. In addition, under the management agreement, the Manager provides all of the administrative functions necessary for the organization, operation and management of the Series. The Manager administers the corporate affairs of the Series and, in connection therewith, furnishes the Series with office facilities, together with those ordinary clerical and bookkeeping services which are not being furnished by the Series’ custodian and the Series’ transfer agent. The Manager is also responsible for the staffing and management of dedicated groups of legal, marketing, compliance and related personnel necessary for the operation of the Series. The legal, marketing, compliance and related personnel are also responsible for the management and oversight of the various service providers to the Series, including, but not limited to, the custodian, transfer agent, and accounting agent.
The Manager has entered into a subadvisory agreement with PGIM, Inc., which provides subadvisory services to the Series through its PGIM Fixed Income unit. The subadvisory agreement provides that PGIM, Inc. will furnish investment advisory services in connection with the management of the Series. In connection therewith, PGIM, Inc. is obligated to keep certain books and records of the Series. The Manager pays for the services of PGIM, Inc.,
| | | | |
| PGIM Emerging Markets Debt Local Currency Fund | | | 63 | |
Notes to Financial Statements(continued)
the cost of compensation of officers of the Series, occupancy and certain clerical and bookkeeping costs of the Series. The Series bears all other costs and expenses.
The management fee paid to the Manager is accrued daily and payable monthly at an annual rate of 0.80% of the Series’ average daily net assets up to and including $1 billion; 0.78% on the next $2 billion of average daily net assets; 0.76% on the next $2 billion of average daily net assets; 0.75% on the next $5 billion of average daily net assets; and 0.74% on average daily net assets exceeding $10 billion. The effective management fee rate before any waivers and/or expense reimbursements was 0.80% for the year ended October 31, 2019.
The Manager has contractually agreed, through February 29, 2020, to limit total annual perating expenses after fee waivers and/or expense reimbursements to 1.13% of average daily net assets for Class A shares, 1.88% of average daily net assets for Class C shares, 0.88% of average daily net assets for Class Z shares and 0.88% of average daily net assets for Class R6 shares. This contractual waiver excludes interest, brokerage, taxes (such as income and foreign withholding taxes, stamp duty and deferred tax expenses), acquired fund fees and expenses, extraordinary expenses, and certain other Series expenses such as dividend and interest expense and broker charges on short sales. Where applicable, the Manager agrees to waive management fees or shared operating expenses on any share class to the same extent that it waives similar expenses on any other share class. In addition, total annual operating expenses for Class R6 shares will not exceed total annual operating expenses for Class Z shares. Fees and/or expenses waived and/or reimbursed by the Manager may be recouped by the Manager within the same fiscal year during which such waiver and/or reimbursement is made if such recoupment can be realized without exceeding the expense limit in effect at the time of the recoupment for that fiscal year.
The Fund, on behalf of the Series, has a distribution agreement with Prudential Investment Management Services LLC (“PIMS”), which acts as the distributor of the Class A, Class C, Class Z and Class R6 shares of the Series. The Series compensates PIMS for distributing and servicing the Series’ Class A and Class C shares, pursuant to the plans of distribution (the “Distribution Plans”), regardless of expenses actually incurred by PIMS. The distribution fees are accrued daily and payable monthly. No distribution or service fees are paid to PIMS as distributor of the Class Z or Class R6 shares of the Series.
Pursuant to the Distribution Plans, the Series compensates PIMS for distribution related activities at an annual rate of up to 0.25% and 1% of the average daily net assets of the Class A and Class C shares, respectively.
For the year ended October 31, 2019, PIMS received $13,156 infront-end sales charges resulting from sales of Class A shares. Additionally, for the year ended October 31, 2019,
64
PIMS did not receive any contingent deferred sales charges imposed upon redemptions by certain Class A and Class C shareholders, respectively. From these fees, PIMS paid such sales charges to broker-dealers, who in turn paid commissions to salespersons and incurred other distribution costs.
PGIM Investments, PGIM, Inc. and PIMS are indirect, wholly-owned subsidiaries of Prudential Financial, Inc. (“Prudential”).
3. Other Transactions with Affiliates
Prudential Mutual Fund Services LLC (“PMFS”), an affiliate of PGIM Investments and an indirect, wholly-owned subsidiary of Prudential, serves as the Series’ transfer agent. Transfer agent’s fees and expenses in the Statement of Operations include certainout-of-pocket expenses paid tonon-affiliates, where applicable.
The Series may invest its overnight sweep cash in the PGIM Core Ultra Short Bond Fund (the “Core Fund”), and its securities lending cash collateral in the PGIM Institutional Money Market Fund (the “Money Market Fund”), each a series of Prudential Investment Portfolios 2, registered under the 1940 Act and managed by PGIM Investments. Through the Series’ investments in the mentioned underlying funds, PGIM Investments and/or its affiliates are paid fees or reimbursed for providing their services. In addition to the realized and unrealized gains on investments in the Core Fund and Money Market Fund, earnings from such investments are disclosed on the Statement of Operations as “Affiliated dividend income” and “Income from securities lending, net”, respectively.
The Series may enter into certain securities purchase or sale transactions under Board approved Rule17a-7 procedures. Rule17a-7 is an exemptive rule under the 1940 Act, that subject to certain conditions, permits purchase and sale transactions among affiliated investment companies, or between an investment company and a person that is affiliated solely by reason of having a common (or affiliated) investment adviser, common directors, and/or common officers. Pursuant to the Rule17a-7 procedures and consistent with guidance issued by the SEC, the Series’ Chief Compliance Officer (“CCO”) prepares a quarterly summary of all such transactions for submission to the Board, together with the CCO’s written representation that all such17a-7 transactions were effected in accordance with the Series’ Rule17a-7 procedures. For the year ended October 31, 2019, no17a-7 transactions were entered into by the Series.
4. Portfolio Securities
The aggregate cost of purchases and proceeds from sales of portfolio securities (excluding short-term investments and U.S. Government securities) for the year ended October 31, 2019, were $49,433,245 and $43,492,937, respectively.
A summary of the cost of purchases and proceeds from sales of shares of affiliated investments for the year ended October 31, 2019, is presented as follows:
| | | | |
| PGIM Emerging Markets Debt Local Currency Fund | | | 65 | |
Notes to Financial Statements (continued)
| | | | | | | | | | | | | | | | | | | | | | | | | | | | | | |
Value,
Beginning
of Year | | | Cost of
Purchases | | | Proceeds
from Sales | | | Change in
Unrealized
Gain
(Loss) | | | Realized
Gain
(Loss) | | | Value,
End of
Year | | | Shares,
End
of Year | | | Income | |
| | PGIM Core Ultra Short Bond Fund* | | | | | | | | | |
| $ | 1,473,311 | | | $ | 33,795,888 | | | $ | 32,785,674 | | | $ | — | | | $ | — | | | $ | 2,483,525 | | | | 2,483,525 | | | $ | 42,655 | |
| | PGIM Institutional Money Market Fund* | | | | | | | | | |
| | — | | | | 158,472 | | | | 158,456 | | | | — | | | | (16 | ) | | | — | | | | — | | | | 8 | ** |
| | | | | | | | | | | | | | | | | | | | | | | | | | | | | | |
| $ | 1,473,311 | | | $ | 33,954,360 | | | $ | 32,944,130 | | | $ | — | | | $ | (16 | ) | | $ | 2,483,525 | | | | | | | $ | 42,663 | |
| | | | | | | | | | | | | | | | | | | | | | | | | | | | | | |
| * | The Fund did not have any capital gain distributions during the reporting period. |
| ** | This amount is included in “Income from securities lending, net” on the Statement of Operations. |
5. Distributions and Tax Information
Distributions to shareholders, which are determined in accordance with federal income tax regulations and which may differ from generally accepted accounting principles, are recorded on theex-date.
For the year ended October 31, 2019, the tax character of dividends paid by the Series were $3,741,020 of ordinary income and $71,530 of tax return of capital. For the year ended October 31, 2018, the tax character of dividends paid by the Series was $3,165,613 of tax return of capital.
As of October 31, 2019, there were no undistributed earnings on a tax basis.
The United States federal income tax basis of the Series’ investments and the net unrealized depreciation as of October 31, 2019 were as follows:
| | | | | | |
Tax Basis | | Gross
Unrealized
Appreciation | | Gross
Unrealized
Depreciation | | Net
Unrealized
Depreciation |
| $71,788,127 | | $1,942,917 | | $(3,105,856) | | $(1,162,939) |
The difference between book basis and tax basis is primarily attributable to the difference in the treatment of amortization of premiums, wash sales, straddle loss deferrals and other cost basis differences between financial and tax accounting.
For federal income tax purposes, the Series had a capital loss carryforward as of October 31, 2019 of approximately $3,831,000 which can be carried forward for an unlimited period. No capital gains distributions are expected to be paid to shareholders until net gains have been realized in excess of such losses.
The Manager has analyzed the Series’ tax positions taken on federal, state and local income tax returns for all open tax years and has concluded that no provision for income tax is required in the Series’ financial statements for the current reporting period. Since tax authorities can examine previously filed tax returns, the Series’ U.S. federal and state tax returns for each of the four fiscal years up to the most recent fiscal year ended October 31, 2019 are subject to such review.
6. Capital and Ownership
The Series offers Class A, Class C, Class Z and Class R6 shares. Class A shares are sold with a maximumfront-end sales charge of 3.25%. Investors who purchase $1 million or more (prior to July 15, 2019, $500,000 or more on or after July 15, 2019) of Class A shares and sell those shares within 12 months of purchase are subject to a contingent deferred sales charge (“CDSC”) of 1.00% on sales although these purchases are not subject to afront-end sales charge. The Class A CDSC is waived for certain retirement and/or benefit plans. A special exchange privilege is also available for shareholders who qualified to purchase Class A shares at net asset value. Class C shares are sold with a CDSC of 1% on sales made within 12 months of purchase. Class C shares will automatically convert to Class A shares on a monthly basis approximately 10 years after purchase. Class Z and Class R6 shares are not subject to any sales or redemption charge and are available exclusively for sale to a limited group of investors.
Under certain circumstances, an exchange may be made from specified share classes of the Series to one or more other share classes of the Series as presented in the table of transactions in shares of common stock.
The Series is authorized to issue 5.075 billion shares of common stock, with a par value of $0.01 per share, which is divided into five series. There are 550 million shares authorized for the Series, divided into five classes, designated Class A, Class C, Class Z, Class R6 and Class T common stock, each of which consists of 10 million, 50 million, 250 million, 50 million and 190 million authorized shares, respectively. The Series currently does not have any Class T shares outstanding.
As of October 31, 2019, Prudential, through its affiliated entities, including affiliated funds (if applicable), owned 3,482,958 Class Z shares, and 170 Class R6 shares of the Series. At reporting period end, three shareholders of record, each holding greater than 5% of the Series, held 83% of the Series’ outstanding shares, of which 29% were held by an affiliate of Prudential.
| | | | |
| PGIM Emerging Markets Debt Local Currency Fund | | | 67 | |
Notes to Financial Statements(continued)
Transactions in shares of common stock were as follows:
| | | | | | | | |
Class A | | Shares | | | Amount | |
Year ended October 31, 2019: | | | | | | | | |
Shares sold | | | 139,070 | | | $ | 811,691 | |
Shares issued in reinvestment of dividends and distributions | | | 29,166 | | | | 171,313 | |
Shares reacquired | | | (136,489 | ) | | | (783,730 | ) |
| | | | | | | | |
Net increase (decrease) in shares outstanding before conversion | | | 31,747 | | | | 199,274 | |
Shares issued upon conversion from other share class(es) | | | 6,376 | | | | 37,347 | |
| | | | | | | | |
Net increase (decrease) in shares outstanding | | | 38,123 | | | $ | 236,621 | |
| | | | | | | | |
Year ended October 31, 2018: | | | | | | | | |
Shares sold | | | 378,543 | | | $ | 2,469,000 | |
Shares issued in reinvestment of dividends and distributions | | | 36,334 | | | | 224,308 | |
Shares reacquired | | | (313,047 | ) | | | (1,809,468 | ) |
| | | | | | | | |
Net increase (decrease) in shares outstanding before conversion | | | 101,830 | | | | 883,840 | |
Shares issued upon conversion from other share class(es) | | | 711 | | | | 4,557 | |
Shares reacquired upon conversion into other share class(es) | | | (14,303 | ) | | | (89,959 | ) |
| | | | | | | | |
Net increase (decrease) in shares outstanding | | | 88,238 | | | $ | 798,438 | |
| | | | | | | | |
Class C | | | | | | |
Year ended October 31, 2019: | | | | | | | | |
Shares sold | | | 24,117 | | | $ | 142,221 | |
Shares issued in reinvestment of dividends and distributions | | | 4,486 | | | | 26,541 | |
Shares reacquired | | | (24,338 | ) | | | (144,141 | ) |
| | | | | | | | |
Net increase (decrease) in shares outstanding before conversion | | | 4,265 | | | | 24,621 | |
Shares reacquired upon conversion into other share class(es) | | | (6,333 | ) | | | (37,347 | ) |
| | | | | | | | |
Net increase (decrease) in shares outstanding | | | (2,068 | ) | | $ | (12,726 | ) |
| | | | | | | | |
Year ended October 31, 2018: | | | | | | | | |
Shares sold | | | 13,391 | | | $ | 87,611 | |
Shares issued in reinvestment of dividends and distributions | | | 5,177 | | | | 32,470 | |
Shares reacquired | | | (32,864 | ) | | | (202,443 | ) |
| | | | | | | | |
Net increase (decrease) in shares outstanding | | | (14,296 | ) | | $ | (82,362 | ) |
| | | | | | | | |
Class Z | | | | | | |
Year ended October 31, 2019: | | | | | | | | |
Shares sold | | | 3,011,000 | | | $ | 17,974,545 | |
Shares issued in reinvestment of dividends and distributions | | | 606,181 | | | | 3,594,849 | |
Shares reacquired | | | (2,375,568 | ) | | | (14,332,305 | ) |
| | | | | | | | |
Net increase (decrease) in shares outstanding | | | 1,241,613 | | | $ | 7,237,089 | |
| | | | | | | | |
Year ended October 31, 2018: | | | | | | | | |
Shares sold | | | 7,175,606 | | | $ | 47,648,141 | |
Shares issued in reinvestment of dividends and distributions | | | 470,660 | | | | 2,898,000 | |
Shares reacquired | | | (1,956,209 | ) | | | (12,100,239 | ) |
| | | | | | | | |
Net increase (decrease) in shares outstanding before conversion | | | 5,690,057 | | | | 38,445,902 | |
Shares issued upon conversion from other share class(es) | | | 14,151 | | | | 89,959 | |
Shares reacquired upon conversion into other share class(es) | | | (704 | ) | | | (4,557 | ) |
| | | | | | | | |
Net increase (decrease) in shares outstanding | | | 5,703,504 | | | $ | 38,531,304 | |
| | | | | | | | |
| | | | | | | | |
Class R6 | | Shares | | | Amount | |
Year ended October 31, 2019: | | | | | | | | |
Shares sold | | | 4,450 | | | $ | 26,339 | |
Shares issued in reinvestment of dividends and distributions | | | 137 | | | | 819 | |
Shares reacquired | | | (5 | ) | | | (28 | ) |
| | | | | | | | |
Net increase (decrease) in shares outstanding | | | 4,582 | | | $ | 27,130 | |
| | | | | | | | |
Year ended October 31, 2018: | | | | | | | | |
Shares issued in reinvestment of dividends and distributions | | | 10 | | | $ | 60 | |
| | | | | | | | |
Net increase (decrease) in shares outstanding | | | 10 | | | $ | 60 | |
| | | | | | | | |
7. Borrowings
The Fund, on behalf of the Series, along with other affiliated registered investment companies (the “Funds”), is a party to a Syndicated Credit Agreement (“SCA”) with a group of banks. The purpose of the SCA is to provide an alternative source of temporary funding for capital share redemptions. The table below provides details of the current SCA in effect at the reportingperiod-end as well as the prior SCA.
| | | | |
| | | Current SCA | | Prior SCA |
Term of Commitment | | 10/3/2019 – 10/1/2020 | | 10/4/2018 – 10/2/2019 |
Total Commitment | | $ 900 million | | $ 900 million |
Annualized Commitment Fee on the Unused Portion of the SCA | | 0.15% | | 0.15% |
Annualized Interest Rate on Borrowings | | 1.20% plus the higher of (1) the effective federal funds rate, (2) theone-month LIBOR rate or (3) zero percent | | 1.25% plus the higher of (1) the effective federal funds rate, (2) theone-month LIBOR rate or (3) zero percent |
Certain affiliated registered investment companies that are parties to the SCA include portfolios that are subject to a predetermined mathematical formula used to manage certain benefit guarantees offered under variable annuity contracts. The formula may result in large scale asset flows into and out of these portfolios. Consequently, these portfolios may be more likely to utilize the SCA for purposes of funding redemptions. It may be possible for those portfolios to fully exhaust the committed amount of the SCA, thereby requiring the Manager to allocate available funding per a Board-approved methodology designed to treat the Funds in the SCA equitably.
The Series utilized the SCA during the year ended October 31, 2019. The average daily balance for the 1 days that the Series had loans outstanding during the period was approximately $160,000, borrowed at a weighted average interest rate of 3.10%. The maximum loan outstanding amount during the period was $160,000. At October 31, 2019, the Series did not have an outstanding loan amount.
8. Risks of Investing in the Series
The Series’ risks include, but are not limited to, some or all of the risks discussed below:
| | | | |
| PGIM Emerging Markets Debt Local Currency Fund | | | 69 | |
Notes to Financial Statements(continued)
Bond Obligations Risk:The Series’ holdings, share price, yield and total return may fluctuate in response to bond market movements. The value of bonds may decline for issuer-related reasons, including management performance, financial leverage and reduced demand for the issuer’s goods and services. Certain types of fixed-income obligations also may be subject to “call and redemption risk,” which is the risk that the issuer may call a bond held by the Series for redemption before it matures and the Series may not be able to reinvest at the same level and therefore would earn less income.
Derivatives Risk:Derivatives involve special risks and costs and may result in losses to the Series. The successful use of derivatives requires sophisticated management, and, to the extent that derivatives are used, the Series will depend on the subadviser’s ability to analyze and manage derivative transactions. The prices of derivatives may move in unexpected ways, especially in abnormal market conditions. Some derivatives are “leveraged” and therefore may magnify or otherwise increase investment losses to the Series. Other risks arise from the potential inability to terminate or sell derivatives positions. A liquid secondary market may not always exist for the Series’ derivatives positions. In fact, many OTC derivative instruments will not have liquidity beyond the counterparty to the instrument. OTC derivative instruments also involve the risk that the other party will not meet its obligations to the Series.
Emerging Markets Risk:The risks of foreign investments are greater for investments in or exposed to emerging markets. Emerging market countries typically have economic and political systems that are less fully developed, and can be expected to be less stable, than those of more developed countries. For example, the economies of such countries can be subject to rapid and unpredictable rates of inflation or deflation. Low trading volumes may result in a lack of liquidity and price volatility.
Interest Rate Risk:The value of an investment may go down when interest rates rise. A rise in rates tends to have a greater impact on the prices of longer term or duration securities. When interest rates fall, the issuers of debt obligations may prepay principal more quickly than expected, and the Series may be required to reinvest the proceeds at a lower interest rate. This is referred to as “prepayment risk.” When interest rates rise, debt obligations may be repaid more slowly than expected, and the value of the Series’ holdings may fall sharply. This is referred to as “extension risk. The Series may face a heightened level of interest rate risk as a result of the U.S. Federal Reserve Board’s policies. The Series’ investments may lose value if short-term or long-term interest rates rise sharply or in a manner not anticipated by the subadviser.
Liquidity Risk:The Series may invest in instruments that trade in lower volumes and are less liquid than other investments. Liquidity risk exists when particular investments made by the Series are difficult to purchase or sell. Liquidity risk includes the risk that the Series may
make investments that may become less liquid in response to market developments or adverse investor perceptions. Investments that are illiquid or that trade in lower volumes may be more difficult to value. If the Series is forced to sell these investments to pay redemption proceeds or for other reasons, the Series may lose money. In addition, when there is no willing buyer and investments may not reasonably be expected to be sold or disposed of in current market conditions in seven calendar days or less without the sale or disposition significantly changing the market value of the investment, the Series may incur higher transaction costs when executing trade orders of a given size. The reduction in dealer market-making capacity in the fixed-income markets that has occurred in recent years also has the potential to reduce liquidity. An inability to sell a portfolio position can adversely affect the Series’ value or prevent the Series from being able to take advantage of other investment opportunities.
Market and Credit Risk:Securities markets may be volatile and the market prices of the Series’ securities may decline. Securities fluctuate in price based on changes in an issuer’s financial condition and overall market and economic conditions. If the market prices of the securities owned by the Series fall, the value of an investment in the Series will decline. Additionally, the Series may also be exposed to credit risk in the event that an issuer or guarantor fails to perform or that an institution or entity with which the Series has unsettled or open transactions defaults.
Non-diversification Risk:Anon-diversified Series may invest a greater percentage of its assets in the securities of a single company or industry than a diversified fund. Investing in anon-diversified fund involves greater risk than investing in a diversified fund because a loss resulting from the decline in value of any one security may represent a greater portion of the total assets of anon-diversified fund.
9. Recent Accounting Pronouncements and Reporting Updates
In August 2018, the FASB issued Accounting Standards Update (“ASU”)No. 2018-13, which changes certain fair value measurement disclosure requirements. The new ASU, in addition to other modifications and additions, removes the requirement to disclose the amount and reasons for transfers between Level 1 and Level 2 of the fair value hierarchy, and the Series’ policy for the timing of transfers between levels. The amendments are effective for financial statements issued for fiscal years beginning after December 15, 2019, and interim periods within those fiscal years. The Manager has evaluated the implications of certain provisions of the ASU and has determined to early adopt aspects related to the removal and modification of certain fair value measurement disclosures under the ASU effective immediately. The Manager continues to evaluate certain other provisions of the ASU and does not expect a material impact to financial statement disclosures.
| | | | |
| PGIM Emerging Markets Debt Local Currency Fund | | | 71 | |
Financial Highlights
| | | | | | | | | | | | | | | | | | | | |
| Class A Shares | |
| | | Year Ended October 31, | |
| | | 2019 | | | 2018 | | | 2017 | | | 2016 | | | 2015 | |
| Per Share Operating Performance(a): | | | | | | | | | | | | | | | | | | | | |
| Net Asset Value, Beginning of Year | | | $5.52 | | | | $6.40 | | | | $6.44 | | | | $6.24 | | | | $7.92 | |
| Income (loss) from investment operations: | | | | | | | | | | | | | | | | | | | | |
| Net investment income (loss) | | | 0.30 | | | | 0.33 | | | | 0.35 | | | | 0.33 | | | | 0.37 | |
| Net realized and unrealized gain (loss) on investment and foreign currency transactions | | | 0.57 | | | | (0.86 | ) | | | (0.02 | ) | | | 0.23 | | | | (1.64 | ) |
| Total from investment operations | | | 0.87 | | | | (0.53 | ) | | | 0.33 | | | | 0.56 | | | | (1.27 | ) |
| Less Dividends and Distributions: | | | | | | | | | | | | | | | | | | | | |
| Dividends from net investment income* | | | (0.31 | ) | | | - | | | | (0.15 | ) | | | - | (b) | | | (0.06 | ) |
| Tax return of capital distributions | | | (0.01 | ) | | | (0.35 | ) | | | (0.22 | ) | | | (0.36 | ) | | | (0.35 | ) |
| Total dividends and distributions | | | (0.32 | ) | | | (0.35 | ) | | | (0.37 | ) | | | (0.36 | ) | | | (0.41 | ) |
| Net asset value, end of year | | | $6.07 | | | | $5.52 | | | | $6.40 | | | | $6.44 | | | | $6.24 | |
| Total Return(c): | | | 16.14% | | | | (8.68)% | | | | 5.36% | | | | 9.29% | | | | (16.41)% | |
| |
| Ratios/Supplemental Data: | |
| Net assets, end of year (000) | | | $3,692 | | | | $3,146 | | | | $3,085 | | | | $3,990 | | | | $3,208 | |
| Average net assets (000) | | | $3,223 | | | | $4,105 | | | | $3,639 | | | | $3,343 | | | | $4,341 | |
| Ratios to average net assets(d)(e): | | | | | | | | | | | | | | | | | | | | |
| Expenses after waivers and/or expense reimbursement | | | 1.13% | | | | 1.13% | | | | 1.13% | | | | 1.28% | | | | 1.30% | (f) |
| Expenses before waivers and/or expense reimbursement | | | 2.03% | | | | 2.16% | | | | 2.15% | | | | 2.33% | | | | 2.39% | (f) |
| Net investment income (loss) | | | 5.13% | | | | 5.34% | | | | 5.42% | | | | 5.20% | | | | 5.32% | (f) |
| Portfolio turnover rate(g) | | | 69% | | | | 113% | | | | 186% | | | | 196% | | | | 101% | |
| * | Dividends from net investment income may include other items that are ordinary income for tax purposes. |
| (a) | Calculated based on average shares outstanding during the year. |
| (b) | Less than $0.005 per share. |
| (c) | Total return does not consider the effects of sales loads. Total return is calculated assuming a purchase of a share on the first day and a sale on the last day of each year reported and includes reinvestment of dividends and distributions, if any. Total returns may reflect adjustments to conform to generally accepted accounting principles. |
| (d) | Does not include expenses of the underlying funds in which the Series invests. |
| (e) | Effective November 1, 2017, class specific expenses include transfer agent fees and expenses and registration fees, which are charged to their respective share class. |
| (f) | Effective March 9, 2015, the contractual distribution and service(12b-1) fees were reduced from 0.30% to 0.25% of the average daily net assets and the 0.05% contractual12b-1 fee waiver was terminated. |
| (g) | The Series’ portfolio turnover rate is calculated in accordance with regulatory requirements, without regard to transactions involving short-term investments and certain derivatives. If such transactions were included, the Series’ portfolio turnover rate may be higher. |
See Notes to Financial Statements.
| | | | | | | | | | | | | | | | | | | | |
| Class C Shares | |
| | | Year Ended October 31, | |
| | | 2019 | | | 2018 | | | 2017 | | | 2016 | | | 2015 | |
| Per Share Operating Performance(a): | | | | | | | | | | | | | | | | | | | | |
| Net Asset Value, Beginning of Year | | | $5.56 | | | | $6.46 | | | | $6.49 | | | | $6.28 | | | | $7.97 | |
| Income (loss) from investment operations: | | | | | | | | | | | | | | | | | | | | |
| Net investment income (loss) | | | 0.26 | | | | 0.29 | | | | 0.30 | | | | 0.28 | | | | 0.32 | |
| Net realized and unrealized gain (loss) on investment and foreign currency transactions | | | 0.57 | | | | (0.88 | ) | | | (0.01 | ) | | | 0.25 | | | | (1.65 | ) |
| Total from investment operations | | | 0.83 | | | | (0.59 | ) | | | 0.29 | | | | 0.53 | | | | (1.33 | ) |
| Less Dividends and Distributions: | | | | | | | | | | | | | | | | | | | | |
| Dividends from net investment income* | | | (0.27 | ) | | | - | | | | (0.13 | ) | | | - | (b) | | | (0.01 | ) |
| Tax return of capital distributions | | | (0.01 | ) | | | (0.31 | ) | | | (0.19 | ) | | | (0.32 | ) | | | (0.35 | ) |
| Total dividends and distributions | | | (0.28 | ) | | | (0.31 | ) | | | (0.32 | ) | | | (0.32 | ) | | | (0.36 | ) |
| Net asset value, end of year | | | $6.11 | | | | $5.56 | | | | $6.46 | | | | $6.49 | | | | $6.28 | |
| Total Return(c): | | | 15.18% | | | | (9.61)% | | | | 4.66% | | | | 8.61% | | | | (17.00)% | |
| |
| Ratios/Supplemental Data: | |
| Net assets, end of year (000) | | | $579 | | | | $538 | | | | $718 | | | | $787 | | | | $701 | |
| Average net assets (000) | | | $566 | | | | $672 | | | | $649 | | | | $721 | | | | $789 | |
| Ratios to average net assets(d)(e): | | | | | | | | | | | | | | | | | | | | |
| Expenses after waivers and/or expense reimbursement | | | 1.88% | | | | 1.88% | | | | 1.88% | | | | 2.03% | | | | 2.05% | |
| Expenses before waivers and/or expense reimbursement | | | 4.82% | | | | 4.89% | | | | 2.88% | | | | 3.07% | | | | 3.11% | |
| Net investment income (loss) | | | 4.37% | | | | 4.56% | | | | 4.63% | | | | 4.40% | | | | 4.52% | |
| Portfolio turnover rate(f) | | | 69% | | | | 113% | | | | 186% | | | | 196% | | | | 101% | |
| * | Dividends from net investment income may include other items that are ordinary income for tax purposes. |
| (a) | Calculated based on average shares outstanding during the year. |
| (b) | Less than $0.005 per share. |
| (c) | Total return does not consider the effects of sales loads. Total return is calculated assuming a purchase of a share on the first day and a sale on the last day of each year reported and includes reinvestment of dividends and distributions, if any. Total returns may reflect adjustments to conform to generally accepted accounting principles. |
| (d) | Does not include expenses of the underlying funds in which the Series invests. |
| (e) | Effective November 1, 2017, class specific expenses include transfer agent fees and expenses and registration fees, which are charged to their respective share class. |
| (f) | The Series’ portfolio turnover rate is calculated in accordance with regulatory requirements, without regard to transactions involving short-term investments and certain derivatives. If such transactions were included, the Series’ portfolio turnover rate may be higher. |
See Notes to Financial Statements.
| | | | |
| PGIM Emerging Markets Debt Local Currency Fund | | | 73 | |
Financial Highlights(continued)
| | | | | | | | | | | | | | | | | | | | |
| Class Z Shares | |
| | | Year Ended October 31, | |
| | | 2019 | | | 2018 | | | 2017 | | | 2016 | | | 2015 | |
| Per Share Operating Performance(a): | | | | | | | | | | | | | | | | | | | | |
| Net Asset Value, Beginning of Year | | | $5.57 | | | | $6.48 | | | | $6.50 | | | | $6.31 | | | | $7.98 | |
| Income (loss) from investment operations: | | | | | | | | | | | | | | | | | | | | |
| Net investment income (loss) | | | 0.32 | | | | 0.34 | | | | 0.36 | | | | 0.34 | | | | 0.38 | |
| Net realized and unrealized gain (loss) on investment and foreign currency transactions | | | 0.58 | | | | (0.88 | ) | | | 0.01 | | | | 0.23 | | | | (1.62 | ) |
| Total from investment operations | | | 0.90 | | | | (0.54 | ) | | | 0.37 | | | | 0.57 | | | | (1.24 | ) |
| Less Dividends and Distributions: | | | | | | | | | | | | | | | | | | | | |
| Dividends from net investment income* | | | (0.33 | ) | | | - | | | | (0.16 | ) | | | - | (b) | | | (0.08 | ) |
| Tax return of capital distributions | | | (0.01 | ) | | | (0.37 | ) | | | (0.23 | ) | | | (0.38 | ) | | | (0.35 | ) |
| Total dividends and distributions | | | (0.34 | ) | | | (0.37 | ) | | | (0.39 | ) | | | (0.38 | ) | | | (0.43 | ) |
| Net asset value, end of year | | | $6.13 | | | | $5.57 | | | | $6.48 | | | | $6.50 | | | | $6.31 | |
| Total Return(c): | | | 16.50% | | | | (8.83)% | | | | 5.85% | | | | 9.31% | | | | (15.90)% | |
| |
| Ratios/Supplemental Data: | |
| Net assets, end of year (000) | | | $68,101 | | | | $55,000 | | | | $27,020 | | | | $27,462 | | | | $24,821 | |
| Average net assets (000) | | | $63,219 | | | | $49,644 | | | | $26,437 | | | | $25,994 | | | | $25,969 | |
| Ratios to average net assets(d)(e): | | | | | | | | | | | | | | | | | | | | |
| Expenses after waivers and/or expense reimbursement | | | 0.88% | | | | 0.88% | | | | 0.88% | | | | 1.03% | | | | 1.05% | |
| Expenses before waivers and/or expense reimbursement | | | 1.31% | | | | 1.41% | | | | 1.88% | | | | 2.06% | | | | 2.11% | |
| Net investment income (loss) | | | 5.35% | | | | 5.50% | | | | 5.58% | | | | 5.36% | | | | 5.50% | |
| Portfolio turnover rate(f) | | | 69% | | | | 113% | | | | 186% | | | | 196% | | | | 101% | |
| * | Dividends from net investment income may include other items that are ordinary income for tax purposes. |
| (a) | Calculated based on average shares outstanding during the year. |
| (b) | Less than $0.005 per share. |
| (c) | Total return is calculated assuming a purchase of a share on the first day and a sale on the last day of each year reported and includes reinvestment of dividends and distributions, if any. Total returns may reflect adjustments to conform to generally accepted accounting principles. |
| (d) | Does not include expenses of the underlying funds in which the Series invests. |
| (e) | Effective November 1, 2017, class specific expenses include transfer agent fees and expenses and registration fees, which are charged to their respective share class. |
| (f) | The Series’ portfolio turnover rate is calculated in accordance with regulatory requirements, without regard to transactions involving short-term investments and certain derivatives. If such transactions were included, the Series’ portfolio turnover rate may be higher. |
See Notes to Financial Statements.
| | | | | | | | | | | | | | | | | | | | |
| Class R6 Shares | |
| | | | | | Year Ended October 31, | | | | |
| | | 2019 | | | 2018 | | | 2017 | | | 2016 | | | 2015 | |
| Per Share Operating Performance(a): | | | | | | | | | | | | | | | | | | | | |
| Net Asset Value, Beginning of Year | | | $5.56 | | | | $6.47 | | | | $6.50 | | | | $6.30 | | | | $7.98 | |
| Income (loss) from investment operations: | | | | | | | | | | | | | | | | | | | | |
| Net investment income (loss) | | | 0.31 | | | | 0.36 | | | | 0.37 | | | | 0.35 | | | | 0.39 | |
| Net realized and unrealized gain (loss) on investment and foreign currency transactions | | | 0.58 | | | | (0.89 | ) | | | - | (b) | | | 0.23 | | | | (1.63 | ) |
| Total from investment operations | | | 0.89 | | | | (0.53 | ) | | | 0.37 | | | | 0.58 | | | | (1.24 | ) |
| Less Dividends and Distributions: | | | | | | | | | | | | | | | | | | | | |
| Dividends from net investment income* | | | (0.32 | ) | | | - | | | | (0.16 | ) | | | - | (b) | | | (0.09 | ) |
| Tax return of capital distributions | | | (0.01 | ) | | | (0.38 | ) | | | (0.24 | ) | | | (0.38 | ) | | | (0.35 | ) |
| Total dividends and distributions | | | (0.33 | ) | | | (0.38 | ) | | | (0.40 | ) | | | (0.38 | ) | | | (0.44 | ) |
| Net asset value, end of year | | | $6.12 | | | | $5.56 | | | | $6.47 | | | | $6.50 | | | | $6.30 | |
| Total Return(c): | | | 16.41% | | | | (8.63 | )% | | | 5.82% | | | | 9.55% | | | | (15.94 | )% |
| |
| Ratios/Supplemental Data: | |
| Net assets, end of year (000) | | | $29 | | | | $1 | | | | $1 | | | | $1 | | | | $1 | |
| Average net assets (000) | | | $15 | | | | $1 | | | | $1 | | | | $1 | | | | $1 | |
| Ratios to average net assets(d)(e): | | | | | | | | | | | | | | | | | | | | |
| Expenses after waivers and/or expense reimbursement | | | 0.88% | | | | 0.88% | | | | 0.88% | | | | 1.03% | | | | 1.05% | |
| Expenses before waivers and/or expense reimbursement | | | 92.22% | | | | 1,595.87% | | | | 1.83% | | | | 2.06% | | | | 2.01% | |
| Net investment income (loss) | | | 5.20% | | | | 5.73% | | | | 5.73% | | | | 5.47% | | | | 5.60% | |
| Portfolio turnover rate(f) | | | 69% | | | | 113% | | | | 186% | | | | 196% | | | | 101% | |
| * | Dividends from net investment income may include other items that are ordinary income for tax purposes. |
| (a) | Calculated based on average shares outstanding during the year. |
| (b) | Less than $0.005 per share. |
| (c) | Total return is calculated assuming a purchase of a share on the first day and a sale on the last day of each year reported and includes reinvestment of dividends and distributions, if any. Total returns may reflect adjustments to conform to generally accepted accounting principles. |
| (d) | Does not include expenses of the underlying funds in which the Series invests. |
| (e) | Effective November 1, 2017, class specific expenses include transfer agent fees and expenses and registration fees, which are charged to their respective share class. |
| (f) | The Series’ portfolio turnover rate is calculated in accordance with regulatory requirements, without regard to transactions involving short-term investments and certain derivatives. If such transactions were included, the Series’ portfolio turnover rate may be higher. |
See Notes to Financial Statements.
| | | | |
| PGIM Emerging Markets Debt Local Currency Fund | | | 75 | |
Report of Independent Registered Public Accounting Firm
To the Shareholders of PGIM Emerging Markets Debt Local Currency Fund
and Board of Directors Prudential World Fund, Inc.:
Opinion on the Financial Statements
We have audited the accompanying statement of assets and liabilities of PGIM Emerging Markets Debt Local Currency Fund, a series of Prudential World Fund, Inc., (the Fund), including the schedule of investments, as of October 31, 2019, the related statement of operations for the year then ended, the statements of changes in net assets for each of the years in thetwo-year period ended October 31, 2019, and the related notes (collectively, the financial statements) and the financial highlights for the years indicated therein. In our opinion, the financial statements and financial highlights present fairly, in all material respects, the financial position of the Fund as of October 31, 2019, the results of its operations for the year then ended, the changes in its net assets for each of the years in thetwo-year period ended October 31, 2019, and the financial highlights for the years indicated therein, in conformity with U.S. generally accepted accounting principles.
Basis for Opinion
These financial statements and financial highlights are the responsibility of the Fund’s management. Our responsibility is to express an opinion on these financial statements and financial highlights based on our audits. We are a public accounting firm registered with the Public Company Accounting Oversight Board (United States) (PCAOB) and are required to be independent with respect to the Fund in accordance with the U.S. federal securities laws and the applicable rules and regulations of the Securities and Exchange Commission and the PCAOB.
We conducted our audits in accordance with the standards of the PCAOB. Those standards require that we plan and perform the audit to obtain reasonable assurance about whether the financial statements and financial highlights are free of material misstatement, whether due to error or fraud. Our audits included performing procedures to assess the risks of material misstatement of the financial statements and financial highlights, whether due to error or fraud, and performing procedures that respond to those risks. Such procedures included examining, on a test basis, evidence regarding the amounts and disclosures in the financial statements and financial highlights. Such procedures also included confirmation of securities owned as of October 31, 2019, by correspondence with the custodian, transfer agent, and brokers, or by other appropriate auditing procedures when replies were not received. Our audits also included evaluating the accounting principles used and significant estimates made by management, as well as evaluating the overall presentation of the financial statements and financial highlights. We believe that our audits provide a reasonable basis for our opinion.

We have served as the auditor of one or more PGIM and/or Prudential Retail investment companies since 2003.
New York, New York
December 19, 2019
Federal Income Tax Information(unaudited)
For the year ended October 31, 2019, the Fund reports the maximum amount allowable but not less than 2.46% as interest-related dividends in accordance with Section 871(k)(1) and 881(e)(1) of the Internal Revenue Code.
In January 2020, you will be advised on IRS Form 1099-DIV or substitute 1099-DIV, as to the federal tax status of the dividends received by you in calendar year 2019.
| | | | |
| PGIM Emerging Markets Debt Local Currency Fund | | | 77 | |
INFORMATION ABOUT BOARD MEMBERS AND OFFICERS(unaudited)
Information about Board Members and Officers of the Fund is set forth below. Board Members who are not deemed to be “interested persons” of the Fund, as defined in the 1940 Act, are referred to as “Independent Board Members.” Board Members who are deemed to be “interested persons” of the Fund are referred to as “Interested Board Members.” The Board Members are responsible for the overall supervision of the operations of the Fund and perform the various duties imposed on the directors of investment companies by the 1940 Act. The Board in turn elects the Officers, who are responsible for administering theday-to-day operations of the Fund.
| | | | | | |
| Independent Board Members | | | | |
| | | | |
Name
Date of Birth
Position(s)
Portfolios Overseen | | Principal Occupation(s)
During Past Five Years | | Other Directorships
Held During
Past Five Years | | Length of
Board Service |
| | | | |
Ellen S. Alberding 3/11/58 Board Member Portfolios Overseen: 96 | | President and Board Member, The Joyce Foundation (charitable foundation) (since 2002); Vice Chair, City Colleges of Chicago (community college system) (2011-2015); Trustee, National Park Foundation (charitable foundation for national park system) (2009-2018); Trustee, Economic Club of Chicago (since 2009); Trustee, Loyola University (since 2018). | | None. | | Since September 2013 |
| | | | |
Kevin J. Bannon 7/13/52 Board Member Portfolios Overseen: 96 | | Retired; Managing Director (April2008-May 2015) and Chief Investment Officer (October 2008-November 2013) of Highmount Capital LLC (registered investment adviser); formerly Executive Vice President and Chief Investment Officer (April 1993-August 2007) of Bank of New York Company; President (May2003-May 2007) of BNY Hamilton Family of Mutual Funds. | | Director of Urstadt Biddle Properties (equity real estate investment trust) (since September 2008). | | Since July 2008 |
PGIM Emerging Markets Debt Local Currency Fund
| | | | | | |
| Independent Board Members | | | | |
| | | | |
Name Date of Birth Position(s) Portfolios Overseen | | Principal Occupation(s) During Past Five Years | | Other Directorships Held During Past Five Years | | Length of Board Service |
| | | | |
Linda W. Bynoe 7/9/52 Board Member Portfolios Overseen: 96 | | President and Chief Executive Officer (since March 1995) and formerly Chief Operating Officer (December 1989-February 1995) of Telemat Ltd. (management consulting); formerly Vice President (January 1985-June 1989) at Morgan Stanley & Co. (broker-dealer). | | Director of Anixter International, Inc. (communication products distributor) (since January 2006); Director of Northern Trust Corporation (financial services) (since April 2006); Trustee of Equity Residential (residential real estate) (since December 2009). | | Since March 2005 |
| | | | |
Barry H. Evans 11/2/60 Board Member Portfolios Overseen: 95 | | Retired; formerly President (2005 – 2016), Global Chief Operating Officer (2014– 2016), Chief Investment Officer – Global Head of Fixed Income (1998-2014), and various portfolio manager roles (1986-2006), Manulife Asset Management U.S. | | Formerly Director, Manulife Trust Company (2011-2018); formerly Director, Manulife Asset Management Limited (2015-2017); formerly Chairman of the Board of Directors of Manulife Asset Management U.S. (2005-2016); formerly Chairman of the Board, Declaration Investment Management and Research (2008-2016). | | Since September 2017 |
| | | | |
Keith F. Hartstein 10/13/56 Board Member & Independent Chair Portfolios Overseen: 96 | | Retired; Member (since November 2014) of the Governing Council of the Independent Directors Council (organization of independent mutual fund directors); formerly President and Chief Executive Officer (2005-2012), Senior Vice President (2004-2005), Senior Vice President of Sales and Marketing (1997-2004), and various executive management positions (1990-1997), John Hancock Funds, LLC (asset management); Chairman, Investment Company Institute’s Sales Force Marketing Committee (2003-2008). | | None. | | Since September 2013 |
Visit our website at pgiminvestments.com
| | | | | | |
| Independent Board Members | | | | |
| | | | |
Name Date of Birth Position(s) Portfolios Overseen | | Principal Occupation(s) During Past Five Years | | Other Directorships Held During Past Five Years | | Length of Board Service |
| | | | |
Laurie Simon Hodrick 9/29/62 Board Member Portfolios Overseen: 95 | | A. Barton Hepburn Professor Emerita of Economics in the Faculty of Business, Columbia Business School (since 2018); Visiting Professor of Law, Stanford Law School (since 2015); Visiting Fellow at the Hoover Institution, Stanford University (since 2015); Sole Member, ReidCourt LLC (since 2008) (a consulting firm); formerly A. Barton Hepburn Professor of Economics in the Faculty of Business, Columbia Business School (1996-2017); formerly Managing Director, Global Head of Alternative Investment Strategies, Deutsche Bank (2006-2008). | | Independent Director, Synnex Corporation (since April 2019) (information technology); Independent Director, Kabbage, Inc. (since July 2018) (financial services); Independent Director, Corporate Capital Trust (2017-2018) (a business development company). | | Since September 2017 |
| | | | |
Michael S. Hyland, CFA 10/4/45 Board Member Portfolios Overseen: 96 | | Retired (since February 2005); formerly Senior Managing Director (July 2001-February 2005) of Bear Stearns & Co, Inc.; Global Partner, INVESCO (1999-2001); Managing Director and President of Salomon Brothers Asset Management (1989-1999). | | None. | | Since July 2008 |
| | | | |
Brian K. Reid 9/22/61 Board Member Portfolios Overseen: 95 | | Retired; formerly Chief Economist for the Investment Company Institute (ICI) (2005-2017); formerly Senior Economist and Director of Industry and Financial Analysis at the ICI (1998-2004); formerly Senior Economist, Industry and Financial Analysis at the ICI (1996-1998); formerly Staff Economist at the Federal Reserve Board (1989-1996); Director, ICI Mutual Insurance Company (2012-2017). | | None. | | Since March 2018 |
PGIM Emerging Markets Debt Local Currency Fund
| | | | | | |
Independent Board Members | | | | |
| | | | |
Name Date of Birth Position(s) Portfolios Overseen | | Principal Occupation(s) During Past Five Years | | Other Directorships Held During Past Five Years | | Length of Board Service |
| | | | |
Grace C. Torres 6/28/59 Board Member Portfolios Overseen: 95 | | Retired; formerly Treasurer and Principal Financial and Accounting Officer of the PGIM Funds, Target Funds, Advanced Series Trust, Prudential Variable Contract Accounts and The Prudential Series Fund (1998-June 2014); Assistant Treasurer (March 1999-June 2014) and Senior Vice President (September 1999-June 2014) of PGIM Investments LLC; Assistant Treasurer (May 2003-June 2014) and Vice President (June 2005-June 2014) of AST Investment Services, Inc.; Senior Vice President and Assistant Treasurer (May 2003-June 2014) of Prudential Annuities Advisory Services, Inc. | | Formerly Director (July 2015-January 2018) of Sun Bancorp, Inc. N.A. and Sun National Bank; Director (since January 2018) of OceanFirst Financial Corp. and OceanFirst Bank. | | Since November 2014 |
| | | | | | |
Interested Board Members | | | | |
| | | | |
Name Date of Birth Position(s) Portfolios Overseen | | Principal Occupation(s) During Past Five Years | | Other Directorships Held During Past Five Years | | Length of Board Service |
| | | | |
Stuart S. Parker 10/5/62 Board Member & President Portfolios Overseen: 96 | | President of PGIM Investments LLC (formerly known as Prudential Investments LLC) (since January 2012); Executive Vice President of Prudential Investment Management Services LLC (since December 2012); formerly Executive Vice President of Jennison Associates LLC and Head of Retail Distribution of PGIM Investments LLC (June 2005-December 2011). | | None. | | Since January 2012 |
Visit our website at pgiminvestments.com
| | | | | | |
Interested Board Members | | | | |
| | | | |
Name Date of Birth Position(s) Portfolios Overseen | | Principal Occupation(s) During Past Five Years | | Other Directorships Held During Past Five Years | | Length of
Board Service |
| | | | |
Scott E. Benjamin 5/21/73 Board Member & Vice President Portfolios Overseen:96 | | Executive Vice President (since June 2009) of PGIM Investments LLC; Executive Vice President (June 2009-June 2012) and Vice President (since June 2012) of Prudential Investment Management Services LLC; Executive Vice President (since September 2009) of AST Investment Services, Inc.; Senior Vice President of Product Development and Marketing, PGIM Investments (since February 2006); formerly Vice President of Product Development and Product Management, PGIM Investments LLC (2003-2006). | | None. | | Since March 2010 |
| | | | |
| Fund Officers(a) | | | | |
| | | |
Name Date of Birth Fund Position | | Principal Occupation(s) During Past Five Years | | Length of
Service as Fund
Officer |
| | | |
Raymond A. O’Hara 9/11/55 Chief Legal Officer | | Vice President and Corporate Counsel (since July 2010) of Prudential Insurance Company of America (Prudential); Vice President (March 2011-Present) of Pruco Life Insurance Company and Pruco Life Insurance Company of New Jersey; Vice President and Corporate Counsel (March 2011-Present) of Prudential Annuities Life Assurance Corporation; Chief Legal Officer of PGIM Investments LLC (since June 2012); Chief Legal Officer of Prudential Mutual Fund Services LLC (since June 2012) and Corporate Counsel of AST Investment Services, Inc. (since June 2012); formerly Assistant Vice President and Corporate Counsel (September 2008-July 2010) of The Hartford Financial Services Group, Inc.; formerly Associate (September 1980-December 1987) and Partner (January 1988–August 2008) of Blazzard & Hasenauer, P.C. (formerly, Blazzard, Grodd & Hasenauer, P.C.). | | Since June 2012 |
PGIM Emerging Markets Debt Local Currency Fund
| | | | |
| Fund Officers(a) | | | | |
| | | |
Name Date of Birth Fund Position | | Principal Occupation(s) During Past Five Years | | Length of Service as Fund Officer |
| | | |
Dino Capasso 8/19/74 Chief Compliance Officer | | Chief Compliance Officer (July 2019-Present) of PGIM Investments LLC; Chief Compliance Officer (July 2019-Present) of the PGIM Funds, Target Funds, Advanced Series Trust, The Prudential Series Fund, Prudential’s Gibraltar Fund, Inc., PGIM Global High Yield Fund, Inc., and PGIM High Yield Bond Fund, Inc.; Vice President and Deputy Chief Compliance Officer (June 2017-2019) of PGIM Investments LLC; formerly, Senior Vice President and Senior Counsel (January 2016-June 2017), and Vice President and Counsel (February 2012-December 2015) of Pacific Investment Management Company LLC. | | Since March 2018 |
| | | |
Andrew R. French 12/22/62 Secretary | | Vice President of PGIM Investments LLC (December 2018-Present); formerly Vice President and Corporate Counsel (February 2010-December 2018) of Prudential; formerly Director and Corporate Counsel (2006-2010) of Prudential; Vice President and Assistant Secretary (since January 2007) of PGIM Investments LLC; Vice President and Assistant Secretary (since January 2007) of Prudential Mutual Fund Services LLC. | | Since October 2006 |
| | | |
Jonathan D. Shain 8/9/58 Assistant Secretary | | Vice President and Corporate Counsel (since August 1998) of Prudential; Vice President and Assistant Secretary (since May 2001) of PGIM Investments LLC; Vice President and Assistant Secretary (since February 2001) of Prudential Mutual Fund Services LLC; formerly Vice President and Assistant Secretary (May 2003-June 2005) of AST Investment Services, Inc. | | Since May 2005 |
| | | |
Claudia DiGiacomo 10/14/74 Assistant Secretary | | Vice President and Corporate Counsel (since January 2005) of Prudential; Vice President and Assistant Secretary of PGIM Investments LLC (since December 2005); formerly Associate at Sidley Austin Brown & Wood LLP (1999-2004). | | Since December 2005 |
| | | |
Diana N. Huffman 4/14/82 Assistant Secretary | | Vice President and Corporate Counsel (since September 2015) of Prudential; formerly Associate at Willkie Farr & Gallagher LLP (2009-2015). | | Since March 2019 |
| | | |
Kelly A. Coyne 8/8/68 Assistant Secretary | | Director, Investment Operations of Prudential Mutual Fund Services LLC (since 2010). | | Since March 2015 |
| | | |
Christian J. Kelly 5/5/75 Treasurer and Principal Financial and Accounting Officer | | Vice President, Head of Fund Administration of PGIM Investments LLC (since November 2018); formerly, Director of Fund Administration of Lord Abbett & Co. LLC (2009-2018), Treasurer and Principal Accounting Officer of the Lord Abbett Family of Funds (2017-2018); Director of Accounting, Avenue Capital Group (2008-2009); Senior Manager, Investment Management Practice of Deloitte & Touche LLP (1998-2007). | | Since January 2019 |
Visit our website at pgiminvestments.com
| | | | |
| Fund Officers(a) | | | | |
| | | |
Name Date of Birth Fund Position | | Principal Occupation(s) During Past Five Years | | Length of Service as Fund Officer |
| | | |
Lana Lomuti 6/7/67 Assistant Treasurer | | Vice President (since 2007) and Director (2005-2007), within PGIM Investments Fund Administration; formerly Assistant Treasurer (December 2007-February 2014) of The Greater China Fund, Inc. | | Since April 2014 |
| | | |
Russ Shupak 10/08/73 Assistant Treasurer | | Vice President (since 2017) and Director (2013-2017), within PGIM Investments Fund Administration. | | Since October 2019 |
| | | |
Deborah Conway 3/26/69 Assistant Treasurer | | Vice President (since 2017) and Director (2007-2017), within PGIM Investments Fund Administration. | | Since October 2019 |
| | | |
Elyse M. McLaughlin 1/20/74 Assistant Treasurer | | Vice President (since 2017) and Director (2011-2017), within PGIM Investments Fund Administration. | | Since October 2019 |
| | | |
Charles H. Smith 1/11/73 Anti-Money Laundering Compliance Officer | | Vice President, Corporate Compliance, Anti-Money Laundering Unit (since January 2015) of Prudential; committee member of the American Council of Life Insurers Anti-Money Laundering and Critical Infrastructure Committee (since January 2016); formerly Global Head of Economic Sanctions Compliance at AIG Property Casualty (February 2007-December 2014); Assistant Attorney General at the New York State Attorney General’s Office, Division of Public Advocacy. (August 1998-January 2007). | | Since January 2017 |
(a) Excludes Mr. Parker and Mr. Benjamin, interested Board Members who also serve as President and Vice President, respectively.
Explanatory Notes to Tables:
| ∎ | | Board Members are deemed to be “Interested,” as defined in the 1940 Act, by reason of their affiliation with PGIM Investments LLC and/or an affiliate of PGIM Investments LLC. |
| ∎ | | Unless otherwise noted, the address of all Board Members and Officers is c/o PGIM Investments LLC, 655 Broad Street, Newark, New Jersey 07102-4410. |
| ∎ | | There is no set term of office for Board Members or Officers. The Board Members have adopted a retirement policy, which calls for the retirement of Board Members on December 31 of the year in which they reach the age of 75. |
| ∎ | | “Other Directorships Held” includes only directorships of companies required to register or file reports with the SEC under the 1934 Act (that is, “public companies”) or other investment companies registered under the 1940 Act. |
| ∎ | | “Portfolios Overseen” includes all investment companies managed by PGIM Investments LLC. The investment companies for which PGIM Investments LLC serves as manager include the PGIM Funds, The Prudential Variable Contract Accounts, PGIM ETF Trust, PGIM High Yield Bond Fund, Inc., PGIM Global High Yield Fund, Inc., The Prudential Series Fund, Prudential’s Gibraltar Fund, Inc. and the Advanced Series Trust. |
PGIM Emerging Markets Debt Local Currency Fund
Approval of Advisory Agreements(unaudited)
The Fund’s Board of Directors
The Board of Directors (the “Board”) of PGIM Emerging Markets Debt Local Currency Fund (the “Fund”)1 consists of eleven individuals, nine of whom are not “interested persons” of the Fund, as defined in the Investment Company Act of 1940, as amended (the “1940 Act”) (the “Independent Directors”).2 The Board is responsible for the oversight of the Fund and its operations, and performs the various duties imposed on the directors of investment companies by the 1940 Act. The Independent Directors have retained independent legal counsel to assist them in connection with their duties. The Chair of the Board is an Independent Director. The Board has established four standing committees: the Audit Committee, the Nominating and Governance Committee, and two Investment Committees. Each committee is chaired by, and composed of, Independent Directors.
Annual Approval of the Fund’s Advisory Agreements
As required under the 1940 Act, the Board determines annually whether to renew the Fund’s management agreement with PGIM Investments LLC (“PGIM Investments”), the Fund’s subadvisory agreement with PGIM, Inc. (“PGIM”) on behalf of its PGIM Fixed Income unit, and the Fund’s sub-subadvisory agreement with PGIM Limited (“PGIML”). In considering the renewal of the agreements, the Board, including all of the Independent Directors, met on May 30, 2019 and on June11-13, 2019 and approved the renewal of the agreements through July 31, 2020, after concluding that the renewal of the agreements was in the best interests of the Fund and its shareholders.
In advance of the meetings, the Board requested and received materials relating to the agreements, and had the opportunity to ask questions and request further information in connection with its consideration. Among other things, the Board considered comparative fee information from PGIM Investments, PGIM, and, where appropriate, affiliates of PGIM. Also, the Board considered comparisons with other mutual funds in relevant Peer Universes and Peer Groups, as is further discussed below.
In approving the agreements, the Board, including the Independent Directors advised by independent legal counsel, considered the factors it deemed relevant, including the nature, quality and extent of services provided by PGIM Investments, the subadviser, and, as relevant, its affiliates, the performance of the Fund, the profitability of PGIM Investments and its affiliates, expenses and fees, and the potential for economies of scale that may be shared with the Fund and its shareholders as the Fund’s assets grow. In their deliberations, the Directors did not identify any single factor which alone was responsible for the Board’s
| 1 | PGIM Emerging Markets Debt Local Currency Fund is a series of Prudential World Fund, Inc. |
| 2 | Grace C. Torres was an Interested Director of the Fund at the time the Board considered and approved the renewal of the Fund’s advisory agreements, but has since become an Independent Director of the Fund. |
| | |
| PGIM Emerging Markets Debt Local Currency Fund |
Approval of Advisory Agreements(continued)
decision to approve the agreements with respect to the Fund. In connection with its deliberations, the Board considered information provided by PGIM Investments throughout the year at regular Board meetings, presentations from portfolio managers and other information, as well as information furnished at or in advance of the meetings on May 30, 2019 and on June11-13, 2019.
The Directors determined that the overall arrangements between the Fund and PGIM Investments, which serves as the Fund’s investment manager pursuant to a management agreement, between PGIM Investments and PGIM, which, through its PGIM Fixed Income unit, serves as the Fund’s subadviser pursuant to the terms of a subadvisory agreement with PGIM Investments, and between PGIM and PGIML, which serves as the Fund’s sub-subadviser pursuant to the terms of a sub-subadvisory agreement with PGIM, are in the best interests of the Fund and its shareholders in light of the services performed, fees charged and such other matters as the Directors considered relevant in the exercise of their business judgment.
The material factors and conclusions that formed the basis for the Directors’ reaching their determinations to approve the continuance of the agreements are separately discussed below.
Nature, Quality and Extent of Services
The Board received and considered information regarding the nature, quality and extent of services provided to the Fund by PGIM Investments, PGIM Fixed Income, and PGIML. The Board noted that PGIM Fixed Income and PGIML are affiliated with PGIM Investments. The Board considered the services provided by PGIM Investments, including but not limited to the oversight of the subadviser and sub-subadviser for the Fund, as well as the provision of fund recordkeeping, compliance and other services to the Fund, and PGIM Investments’ role as administrator for the Fund’s liquidity risk management program. With respect to PGIM Investments’ oversight of the subadviser and sub-subadviser, the Board noted that PGIM Investments’ Strategic Investment Research Group (“SIRG”), which is a business unit of PGIM Investments, is responsible for monitoring and reporting to PGIM Investments’ senior management on the performance and operations of the subadviser and sub-subadviser. The Board also considered that PGIM Investments pays the salaries of all of the officers and interested Directors of the Fund who are part of Fund management. The Board also considered the investment subadvisory services provided by PGIM Fixed Income and PGIML, including investment research and security selection, as well as adherence to the Fund’s investment restrictions and compliance with applicable Fund policies and procedures. The Board considered PGIM Investments’ evaluation of the subadviser and sub-subadviser, as well as PGIM Investments’ recommendation, based on its review of the subadviser and sub-subadviser, to renew the subadvisory and sub-subadvisory agreements.
| | |
| Visit our website at pgiminvestments.com | | |
The Board considered the qualifications, backgrounds and responsibilities of PGIM Investments’ senior management responsible for the oversight of the Fund, PGIM, and PGIML, and also considered the qualifications, backgrounds and responsibilities of PGIM Fixed Income’s portfolio managers who are responsible for theday-to-day management of the Fund’s portfolio. The Board was provided with information pertaining to PGIM Investments, PGIM Fixed Income’s, and PGIML’s organizational structure, senior management, investment operations, and other relevant information pertaining to PGIM Investments, PGIM Fixed Income, and PGIML. The Board also noted that it received favorable compliance reports from the Fund’s Chief Compliance Officer (“CCO”) as to PGIM Investments, PGIM Fixed Income, and PGIML.
The Board concluded that it was satisfied with the nature, extent and quality of the investment management services provided by PGIM Investments, the subadvisory services provided to the Fund by PGIM Fixed Income, and the sub-subadvisory services provided by PGIML, and that there was a reasonable basis on which to conclude that the Fund benefits from the services provided by PGIM Investments, PGIM Fixed Income, and PGIML under the management, subadvisory and sub-subadvisory agreements.
Costs of Services and Profits Realized by PGIM Investments
The Board was provided with information on the profitability of PGIM Investments and its affiliates in serving as the Fund’s investment manager. The Board discussed with PGIM Investments the methodology utilized in assembling the information regarding profitability and considered its reasonableness. The Board recognized that it is difficult to make comparisons of profitability from fund management contracts because comparative information is not generally publicly available and is affected by numerous factors, including the structure of the particular adviser, the types of funds it manages, its business mix, numerous assumptions regarding allocations and the adviser’s capital structure and cost of capital. However, the Board considered that the cost of services provided by PGIM Investments for the year ended December 31, 2018 exceeded the management fees received by PGIM Investments, resulting in an operating loss to PGIM Investments. Taking these factors into account, the Board concluded that the profitability of PGIM Investments and its affiliates in relation to the services rendered was not unreasonable.
Economies of Scale
The Board received and discussed information concerning economies of scale that PGIM Investments may realize as the Fund’s assets grow beyond current levels. The Board noted that the management fee schedule for the Fund includes breakpoints, which have the effect of decreasing the fee rate as assets increase. During the course of time, the Board has considered information regarding the launch date of the Fund, the management fees of the Fund compared to those of similarly managed funds and PGIM Investments investment
| | |
| PGIM Emerging Markets Debt Local Currency Fund |
Approval of Advisory Agreements(continued)
in the Fund over time. The Board noted that economies of scale may be shared with the Fund in several ways, including low management fees from inception, additional technological and personnel investments to enhance shareholder services, and maintaining existing expense structures in the face of a rising cost environment. The Board considered PGIM Investments’ assertion that it continually evaluates the management fee schedule of the Fund and the potential to share economies of scale through breakpoints or fee waivers as asset levels increase.
The Board recognized the inherent limitations of any analysis of economies of scale, stemming largely from the Board’s understanding that most of PGIM Investments’ costs are not specific to individual funds, but rather are incurred across a variety of products and services.
Other Benefits to PGIM Investments, PGIM Fixed Income, and PGIML
The Board considered potential ancillary benefits that might be received by PGIM Investments, PGIM Fixed Income, PGIML and their affiliates as a result of their relationship with the Fund. The Board concluded that potential benefits to be derived by PGIM Investments included transfer agency fees received by the Fund’s transfer agent (which is affiliated with PGIM Investments), as well as benefits to its reputation or other intangible benefits resulting from PGIM Investments’ association with the Fund. The Board concluded that the potential benefits to be derived by PGIM Fixed Income and PGIML included the ability to use soft dollar credits, as well as the potential benefits consistent with those generally resulting from an increase in assets under management, specifically, potential access to additional research resources and benefits to their reputations. The Board concluded that the benefits derived by PGIM Investments, PGIM Fixed Income, and PGIML were consistent with the types of benefits generally derived by investment managers and subadvisers to mutual funds.
Performance of the Fund / Fees and Expenses
The Board considered certain additional factors and made related conclusions relating to the historical performance of the Fund for theone-, three- and five-year periods ended December 31, 2018.
The Board also considered the Fund’s actual management fee, as well as the Fund’s net total expense ratio, for the fiscal year ended October 31, 2018. The Board considered the management fee for the Fund as compared to the management fee charged by PGIM Investments to other funds and the fee charged by other advisers to comparable mutual funds in a Peer Group. The actual management fee represents the fee rate actually paid by Fund shareholders and includes any fee waivers or reimbursements. The net total expense ratio for the Fund represents the actual expense ratio incurred by Fund shareholders.
| | |
| Visit our website at pgiminvestments.com | | |
The mutual funds included in the Peer Universe, which was used to consider performance, and the Peer Group, which was used to consider fees and expenses, were objectively determined by Broadridge, an independent provider of mutual fund data. In certain circumstances, PGIM Investments also provided supplemental Peer Universe or Peer Group information, for reasons addressed with the Board. The comparisons placed the Fund in various quartiles over various periods, with the first quartile being the best 25% of the mutual funds (for performance, the best performing mutual funds and, for expenses, the lowest cost mutual funds).
The section below summarizes key factors considered by the Board and the Board’s conclusions regarding the Fund’s performance, fees and overall expenses. The table sets forth net performance comparisons (which reflect the impact on performance of fund expenses, or any subsidies, expense caps or waivers that may be applicable) with the Peer Universe, actual management fees with the Peer Group (which reflect the impact of any subsidies or fee waivers), and net total expenses with the Peer Group, each of which were key factors considered by the Board.
| | | | | | | | |
| Net Performance | | 1 Year | | 3 Years | | 5 Years | | 10 Years |
| | | 3rd Quartile | | 3rd Quartile | | 2nd Quartile | | N/A |
| Actual Management Fees:1st Quartile |
| Net Total Expenses: 1st Quartile |
| | • | | The Board noted that the Fund underperformed its benchmark index over all periods. |
| | • | | The Board considered information provided by PGIM Investments indicating that, although the Fund underperformed its benchmark index and Peer Universe over theone-and three-year periods ended December 31, 2018, the Fund had outperformed its benchmark index and Peer Universe over most of the rollingthree-and five-year periods since the Fund’s inception. |
| | • | | In this regard, the Board noted that, when it evaluated the Fund’s performance in the prior year, as of December 31, 2017, the Fund outperformed its benchmark index and ranked in the first quartile for theone- and three-year periods. |
| | • | | The Board also considered that, as of March 31, 2019, the Fund outperformed the benchmark index and Peer Universe over the trailing three- and five-year periods. |
| | • | | The Board and PGIM Investments agreed to retain the existing contractual expense cap, which caps the Fund’s annual operating expenses at 1.13% for Class A shares, 1.88% for Class C shares, 0.88% for Class R6 shares, and 0.88% for Class Z shares through February 29, 2020. |
| | • | | In addition, PGIM Investments will waive management fees or shared operating expenses on any share class to the same extent that it waives such expenses on any other share class, and has agreed that total annual fund operating expenses for Class R6 shares will not exceed total annual fund operating expenses for Class Z shares. |
| | |
| PGIM Emerging Markets Debt Local Currency Fund |
Approval of Advisory Agreements(continued)
| | • | | The Board concluded that, in light of the above, it would be in the best interests of the Fund and its shareholders to renew the agreements. |
| | • | | The Board concluded that the management fees (including subadvisory fees) and total expenses were reasonable in light of the services provided. |
* * *
After full consideration of these factors, the Board concluded that the approval of the agreements was in the best interests of the Fund and its shareholders.
| | |
| Visit our website at pgiminvestments.com | | |
| | | | |
| | |
| ∎ MAIL | | ∎ TELEPHONE | | ∎ WEBSITE |
655 Broad Street Newark, NJ 07102 | | (800) 225-1852 | | pgiminvestments.com |
|
| PROXY VOTING |
The Board of Directors of the Fund has delegated to the Fund’s subadviser the responsibility for voting any proxies and maintaining proxy recordkeeping with respect to the Fund. A description of these proxy voting policies and procedures is available without charge, upon request, by calling
(800) 225-1852. Information regarding how the Fund voted proxies relating to portfolio securities during the most recent 12-month period ended June 30 is available on the Fund’s website and on the Securities and Exchange Commission’s website. |
|
| DIRECTORS |
| Ellen S. Alberding • Kevin J. Bannon• Scott E. Benjamin• Linda W. Bynoe• Barry H. Evans • Keith F. Hartstein • Laurie Simon Hodrick• Michael S. Hyland • Stuart S. Parker • Brian K. Reid • Grace C. Torres |
|
| OFFICERS |
| Stuart S. Parker,President• Scott E. Benjamin,Vice President• Christian J. Kelly,Treasurer and Principal Financial and Accounting Officer• Raymond A. O’Hara,Chief Legal Officer• Dino Capasso,Chief Compliance Officer• Charles H. Smith,Anti-Money Laundering Compliance Officer• Andrew R. French,Secretary• Jonathan D. Shain,Assistant Secretary• Claudia DiGiacomo,Assistant Secretary• Diana N. Huffman,Assistant Secretary• Kelly A. Coyne,Assistant Secretary• Lana Lomuti,Assistant Treasurer• Russ Shupak,Assistant Treasurer• Elyse McLaughlin,Assistant Treasurer• Deborah Conway,Assistant Treasurer |
| | | | |
| MANAGER | | PGIM Investments LLC | | 655 Broad Street
Newark, NJ 07102 |
|
| SUBADVISER | | PGIM Fixed Income | | 655 Broad Street
Newark, NJ 07102 |
|
| DISTRIBUTOR | | Prudential Investment
Management Services LLC | | 655 Broad Street
Newark, NJ 07102 |
|
| CUSTODIAN | | The Bank of New York Mellon | | 240 Greenwich Street
New York, NY 10286 |
|
| TRANSFER AGENT | | Prudential Mutual Fund
Services LLC | | PO Box 9658
Providence, RI 02940 |
|
INDEPENDENT REGISTERED
PUBLIC ACCOUNTING FIRM | | KPMG LLP | | 345 Park Avenue
New York, NY 10154 |
|
| FUND COUNSEL | | Willkie Farr & Gallagher LLP | | 787 Seventh Avenue
New York, NY 10019 |
|
|
| An investor should consider the investment objectives, risks, charges, and expenses of the Fund carefully before investing. The prospectus and summary prospectus contain this and other information about the Fund. An investor may obtain the prospectus and summary prospectus by visiting our website atpgiminvestments.com or by calling(800) 225-1852. The prospectus and summary prospectus should be read carefully before investing. |
|
| E-DELIVERY |
| To receive your mutual fund documents online, go topgiminvestments.com/edelivery and enroll. Instead of receiving printed documents by mail, you will receive notification via email when new materials are available. You can cancel your enrollment or change your email address at any time byvisiting the website address above. |
|
| SHAREHOLDER COMMUNICATIONS WITH DIRECTORS |
| Shareholders can communicate directly with the Board of Directors by writing to the Chair of the Board, PGIM Emerging Markets Debt Local Currency Fund, PGIM Investments, Attn: Board of Directors, 655 Broad Street, Newark, NJ 07102. Shareholders can communicate directly with an individual Director by writing to the same address. Communications are not screened before being delivered to the addressee. |
|
| AVAILABILITY OF PORTFOLIO HOLDINGS |
| The Fund files its complete schedule of portfolio holdings with the Securities and Exchange Commission on Form N-PORT. The Fund’s Form N-PORT filings are available on the Commission’s website at sec.gov. Form N-PORT is filed with the Commission quarterly, and each Fund’s full portfolio holdings as of the first and third fiscal quarter-ends (as of the third month of the Fund’s fiscal quarter for reporting periods on or after September 30, 2019) will be made publicly available 60 days after the end of each quarter at sec.gov. |
|
| The Fund’s Statement of Additional Information contains additional information about the Fund’s Directors and is available without charge, upon request, by calling (800) 225-1852. |
Mutual Funds:
| | | | |
| ARE NOT INSURED BY THE FDIC OR ANY FEDERAL GOVERNMENT AGENCY | | MAY LOSE VALUE | | ARE NOT A DEPOSIT OF OR GUARANTEED BY ANY BANK OR ANY BANK AFFILIATE |
PGIM EMERGING MARKETS DEBT LOCAL CURRENCY FUND
| | | | | | | | |
| SHARE CLASS | | A | | C | | Z | | R6 |
| NASDAQ | | EMDAX | | EMDCX | | EMDZX | | EMDQX |
| CUSIP | | 743969750 | | 743969743 | | 743969727 | | 743969735 |
MF212E

PGIM JENNISON EMERGING MARKETS EQUITY OPPORTUNITIES FUND
ANNUAL REPORT
OCTOBER 31, 2019
COMING SOON: PAPERLESS SHAREHOLDER REPORTS
Beginning on January 1, 2021, as permitted by regulations adopted by the Securities and Exchange Commission, paper copies of the Fund’s annual and semiannual shareholder reports will no longer be sent by mail, unless you specifically request paper copies of the reports. Instead, the reports will be made available on the Fund’s website (pgiminvestments.com), and you will be notified by mail each time a report is posted and provided with a website link to access the report.
If you already elected to receive shareholder reports electronically, you will not be affected by this change and you need not take any action. You may elect to receive shareholder reports and other communications from the Fund electronically anytime by contacting your financial intermediary (such as a broker-dealer or bank) or, if you are a direct investor, by calling 1-800-225-1852 or by sending an email request to PGIM Investments at shareholderreports@pgim.com.
You may elect to receive all future reports in paper free of charge. If you invest through a financial intermediary, you can contact your financial intermediary or follow instructions included with this notice to elect to continue to receive paper copies of your shareholder reports. If you invest directly with the Fund, you can call 1-800-225-1852 or send an email request to shareholderreports@pgim.com to let the Fund know you wish to continue receiving paper copies of your shareholder reports. Your election to receive reports in paper will apply to all funds held in your account if you invest through your financial intermediary or all funds held with the fund complex if you invest directly with the Fund.

To enroll in e-delivery, go to pgiminvestments.com/edelivery
|
| Objective: Long-term growth of capital |
Highlights(unaudited)
| • | | The consumer discretionary sector contributed meaningfully to the Fund’s performance during the reporting period, led by holdings in internet retail companies, most notably MercdoLibre and Alibaba. |
| • | | Outperformance in the consumer staples sector was driven by Kweichow Moutai, a leading Chinese spirits maker, while two other Chinese holdings, Jiangsu Hengrui and WuXi Biologics, drove outperformance in health care. |
| • | | The industrials sector detracted from the Fund’s performance, in aggregate, during the reporting period due mostly to declines in Ashok Leyland. |
| • | | Other notable detractors were found in different sectors, including Sociedad Quimica y Minera de Chile, Biocon, YY, and Pinduoduo. |
This report is not authorized for distribution to prospective investors unless preceded or accompanied by a current prospectus.
The views expressed in this report and information about the Fund’s portfolio holdings are for the period covered by this report and are subject to change thereafter.
Mutual funds are distributed by Prudential Investment Management Services LLC, member SIPC. Jennison Associates LLC is a registered investment adviser. Both are Prudential Financial companies.© 2019 Prudential Financial, Inc. and its related entities. Jennison Associates, Jennison, PGIM, and the PGIM logo are service marks of Prudential Financial, Inc. and its related entities, registered in many jurisdictions worldwide.
| | |
| 2 | | Visit our website at pgiminvestments.com |
Table of Contents
| | | | |
| PGIM Jennison Emerging Markets Equity Opportunities Fund | | | 3 | |
This Page Intentionally Left Blank
Letter from the President

Dear Shareholder:
We hope you find the annual report for the PGIM Jennison Emerging Markets Equity Opportunities Fund informative and useful. The report covers performance for the 12-month period that ended October 31, 2019.
While the US economy remained healthy, with rising corporate profits and strong job growth, the Federal Reserve cut interest rates three times in the latter half of the period. The cuts were a proactive attempt by the Fed to extend the longest domestic economic expansion on record as growth in many regions weakened. China in particular showed signs of slowing amid trade tensions with the US, and turmoil in the United Kingdom continued as it negotiates an exit from the European Union.
The interest-rate cuts helped boost the performance of stocks globally. For the period overall, large-cap US equities along with stocks in developed and emerging foreign markets all rose by double digits. Small-cap US stocks posted a single-digit gain. This positive performance came despite significant volatility early in the period. Equities plunged at the end of 2018 on concerns about China’s economy, a potential global trade war, higher interest rates, and worries that profit growth might slow. Stocks reversed course early in 2019, rising sharply after the Fed moderated its position on additional rate hikes for the remainder of the year.
The overall US bond market posted strong returns during the period on a significant rally in interest rates that saw the 10-year US Treasury yield decline from over 3% to under 2%. Investment-grade corporate bonds led the way with a double-digit gain, while corporate high yield and municipal bonds each had a return in the high single digits. Globally, bonds in developed markets delivered strong returns, and emerging markets debt rose by double digits.
Regarding your investments with PGIM, we believe it is important to maintain a diversified portfolio of funds consistent with your tolerance for risk, time horizon, and financial goals. Your financial advisor can help you create a diversified investment plan that may include funds covering all the basic asset classes and that reflects your personal investor profile and risk tolerance. However, diversification and asset allocation strategies do not assure a profit or protect against loss in declining markets.
At PGIM Investments, we consider it a great privilege and responsibility to help investors participate in opportunities across global markets while meeting their toughest investment challenges. PGIM is a top-10 global investment manager with more than $1 trillion in assets under management. This scale and investment expertise allow us to deliver actively managed funds and strategies to meet the needs of investors around the globe.
Thank you for choosing our family of funds.
Sincerely,

Stuart S. Parker, President
PGIM Jennison Emerging Markets Equity Opportunities Fund
December 16, 2019
| | | | |
| PGIM Jennison Emerging Markets Equity Opportunities Fund | | | 5 | |
Your Fund’s Performance(unaudited)
Performance data quoted represents past performance. Past performance does not guarantee future results. The investment return and principal value of an investment will fluctuate, so that an investor’s shares, when redeemed, may be worth more or less than their original cost. Current performance may be lower or higher than the past performance data quoted. An investor may obtain performance data as of the most recent month-end by visiting our website atpgiminvestments.com or by calling (800) 225-1852.
| | | | | | | | | | |
| |
| | | Average Annual Total Returns as of 10/31/19
(with sales charges) | |
| | | One Year (%) | | Five Years (%) | | | Since Inception (%) | |
| Class A | | 19.95 | | | 2.63 | | | | 2.75 (9/16/14) | |
| Class C | | 25.05 | | | 3.04 | | | | 3.13 (9/16/14) | |
| Class Z | | 27.30 | | | 4.06 | | | | 4.14 (9/16/14) | |
| Class R6 | | 27.30 | | | 4.07 | | | | 4.15 (9/16/14) | |
| MSCI Emerging Markets Index | | | | | | | | | | |
| | 11.86 | | | 2.93 | | | | 3.12 | |
| | | | | | | | | | |
| |
| | | Average Annual Total Returns as of 10/31/19 (without sales charges) | |
| | | One Year (%) | | Five Years (%) | | | Since Inception (%) | |
| Class A | | 26.93 | | | 3.80 | | | | 3.89 (9/16/14) | |
| Class C | | 26.05 | | | 3.04 | | | | 3.13 (9/16/14) | |
| Class Z | | 27.30 | | | 4.06 | | | | 4.14 (9/16/14) | |
| Class R6 | | 27.30 | | | 4.07 | | | | 4.15 (9/16/14) | |
| MSCI Emerging Markets Index | | | | | | | | | | |
| | | 11.86 | | | 2.93 | | | | 3.12 | |
| | |
| 6 | | Visit our website at pgiminvestments.com |
Growth of a $10,000 Investment(unaudited)
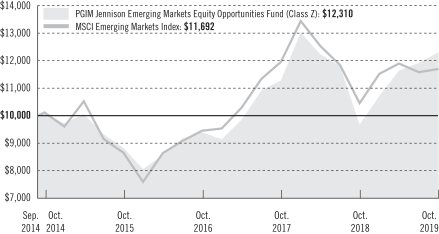
The graph compares a $10,000 investment in the Fund’s Class Z shares with a similar investment in the MSCI Emerging Markets Index, by portraying the initial account values at the commencement of operations for Class Z shares (September 16, 2014) and the account values at the end of the current fiscal year (October 31, 2019) as measured on a quarterly basis. For purposes of the graph, and unless otherwise indicated, it has been assumed that (a) all recurring fees (including management fees) were deducted; and (b) all dividends and distributions were reinvested. The line graph provides information for Class Z shares only. As indicated in the tables provided earlier, performance for other share classes will vary due to the differing charges and expenses applicable to each share class (as indicated in the following paragraphs). Without waiver of fees and/or expense reimbursements, if any, the Fund’s returns would have been lower.
Past performance does not predict future performance. Total returns and the ending account values in the graph include changes in share price and reinvestment of dividends and capital gains distributions in a hypothetical investment for the periods shown. The Fund’s total returns do not reflect the deduction of income taxes on an individual’s investment. Taxes may reduce your actual investment returns on income or gains paid by the Fund or any gains you may realize if you sell your shares.
Source: PGIM Investments LLC and Lipper Inc.
Since Inception returns are provided since the Fund has less than 10 fiscal years of returns. Since Inception returns for the Index are measured from the closest month-end to the Fund’s inception date.
| | | | |
| PGIM Jennison Emerging Markets Equity Opportunities Fund | | | 7 | |
Your Fund’s Performance(continued)
The returns in the tables do not reflect the deduction of taxes that a shareholder would pay on Fund distributions or following the redemption of Fund shares. The average annual total returns take into account applicable sales charges, which are described for each share class in the table below.
| | | | | | | | |
| | | | | |
| | | Class A | | Class C | | Class Z | | Class R6 |
| Maximum initial sales charge | | 5.50% of the public offering price | | None | | None | | None |
| Contingent deferred sales charge (CDSC) (as a percentage of the lower of the original purchase price or the net asset value at redemption) | | 1.00% on sales of $1 million or more made within 12 months of purchase | | 1.00% on sales made within 12 months of purchase | | None | | None |
| Annual distribution and service (12b-1) fees (shown as a percentage of average daily net assets) | | 0.30% (0.25% currently) | | 1.00% | | None | | None |
Benchmark Definitions
MSCI Emerging Markets Index—The MSCI Emerging Markets Index is an unmanaged free float-adjusted market capitalization index that is designed to measure equity market performance of emerging markets. The MSCI Emerging Markets Index consists of the following 24 emerging market country indexes: Brazil, Chile, China, Colombia, the Czech Republic, Egypt, Greece, Hungary, India, Indonesia, Korea, Malaysia, Mexico, Pakistan, Peru, the Philippines, Poland, Qatar, Russia, South Africa, Taiwan, Thailand, Turkey, and the United Arab Emirates.
Investors cannot invest directly in an index or average. The returns for the Index would be lower if they included the effects of sales charges, operating expenses of a mutual fund, or taxes.
| | |
| 8 | | Visit our website at pgiminvestments.com |
Presentation of Fund Holdingsas of 10/31/19
| | | | | | |
| | | |
| Ten Largest Holdings | | Line of Business | | Country | | % of Net Assets |
| Alibaba Group Holding Ltd. | | Internet & Direct Marketing Retail | | China | | 6.9% |
| Kweichow Moutai Co. Ltd. (Class A Stock) | | Beverages | | China | | 6.7% |
| Wuxi Biologics Cayman, Inc. | | Life Sciences Tools & Services | | China | | 5.3% |
Jiangsu Hengrui Medicine Co. Ltd. (Class A Stock) | | Pharmaceuticals | | China | | 4.8% |
| MercadoLibre, Inc. | | Internet & Direct Marketing Retail | | Argentina | | 4.5% |
| Tencent Holdings Ltd. | | Interactive Media & Services | | China | | 4.1% |
| WuXi AppTec Co. Ltd. (Class H Stock) | | Life Sciences Tools & Services | | China | | 3.9% |
| Ace Hardware Indonesia Tbk PT | | Specialty Retail | | Indonesia | | 3.3% |
| Meituan Dianping (Class B Stock) | | Internet & Direct Marketing Retail | | China | | 3.2% |
| CP ALL PCL | | Food & Staples Retailing | | Thailand | | 3.2% |
For a complete list of holdings, please refer to the Schedule of Investments section of this report. Holdings reflect only long-term Investments.
| | | | |
| PGIM Jennison Emerging Markets Equity Opportunities Fund | | | 9 | |
Strategy and Performance Overview(unaudited)
How did the Fund perform?
ThePGIM Jennison Emerging Markets Equity Opportunities Fund’s Class Z shares returned 27.30% in the12-month reporting period that ended October 31, 2019, outperforming the 11.86% return of the MSCI Emerging Markets Index (the Index).
What was the market environment?
| • | | Global equity markets were highly volatile during the reporting period. An abrupt sell-off in late 2018 reflected mounting investor concerns about the rising risk of a major trade war with China, the pace of US economic growth, decelerating expansion in non-US economies, US interest rate increases and their effect on US growth, the state of US alliances with other major trading partners, and discord and uncertainty about domestic policy. |
| • | | Equity markets rebounded early in 2019 as corporate earnings reports generally indicated continued strength, and sentiment grew that trade friction would be resolved. Markets fell again as the period ended on a re-escalation of trade tension. |
| • | | Within the Index, the information technology, consumer discretionary, and real estate sectors posted the largest gains. The materials and health care sectors declined. |
| • | | With respect to the Index’s largest countries, Taiwan, India, China, and Brazil generated solid gains. |
What worked?
| • | | The consumer discretionary sector contributed meaningfully to the Fund’s performance during the reporting period, led by holdings in internet retail companies: |
| | • | | MercadoLibre Inc. is a Buenos Aires-based online trading service that enables individuals and businesses to electronically sell and buy items. Jennison likes the company’s strong execution and enhanced marketplace initiatives, including integrated shipping and payment systems, as well as its exposure to Latin America’s expanding internet penetration rates and lowe-commerce share of the retail market. In addition, payment volume growth accelerated during the period. |
| | • | | Alibaba Group, one of the world’s leadinge-commerce companies, operates China’s largest global online wholesale platform for small businesses, largest online retail website, and largest online third-party platform for brands and retailers. The company’s various segments provide significant revenue synergies that lay the groundwork for durable, high,top-line growth, in Jennison’s view. Shares were volatile during the period but nevertheless added value to the Fund throughout the period, with earnings topping consensus forecasts in the fourth quarter of 2018. |
| • | | Outperformance in the consumer staples sector was driven byKweichow Moutai, a leading Chinese spirits maker. The company’s strong brand equity and healthy |
| | |
| 10 | | Visit our website at pgiminvestments.com |
| | distribution channels have helped the company expand its market share in the premium segment. Jennison believes Kweichow stands to benefit from rising demand for premium spirits and rapid growth in its “Series” products, which target themid-range tohigh-end market segment. Furthermore, Jennison likes the company’s strong profitability, return on capital, cash flow, and balance sheet. Financial results were solid during the period. Margin expansion was driven by product mix upgrades and operating leverage. |
| • | | In health care, two Chinese holdings drove strong sector performance: |
| | • | | Jiangsu Hengrui Medicine Co. Ltd. is a biopharmaceutical company dedicated to developing and commercializing innovative drugs to address unmet medical needs. Its current therapeutic areas of focus are oncology and endocrinology, with multiple clinical-stage assets for oncology/immune-oncology and diabetes/weight loss in the development pipeline. Jennison likes the international recognition the company receives for its innovation and believes that it will continue to transform into a successful drug innovator. First-half 2019 financial results were in line with market expectations. Oncology and radio-contrast agents delivered strong growth, while research and development pipelines made good progress with continued expansion into chronic diseases. |
| | • | | Based in Wuxi, China,WuXi Biologics is a provider of discovery, research, development, and manufacturing of biologics services. As a contract research organization, the company may benefit from several trends, in Jennison’s view, including drug companies’ increased research and development outsourcing activities, biologics being favored over chemical drugs, and a biotechnology boom in China. As more smaller biotechnology companies emerge, Jennison thinks WuXi Biologics’ expertise, open-access platform, technology, lower labor costs, clinical trials expertise, and its role as a gateway to China will increase investor demand for its stock. |
What didn’t work?
| • | | The industrials sector detracted from the Fund’s performance, in aggregate, during the reporting period. |
| | • | | Based in Chennai,Ashok Leyland is one of India’s leading commercial vehicle manufacturers, with a strong position in heavy- and medium-weight trucks and buses. Quarterly results during the period were below consensus estimates on all parameters. Jennison believes the company could be entering a downturn after several years of an up cycle. The Fund’ sold the position by the end of the period. |
| • | | Other notable detractors were found in several different sectors: |
| | • | | Based in Santiago, Chile,Sociedad Quimica y Minera de Chile makes and sells fertilizers and specialty chemicals. It has a more-than-50% global market share of nitrates, amore-than-25% global share of iodine and derivative production, and a |
| | | | |
| PGIM Jennison Emerging Markets Equity Opportunities Fund | | | 11 | |
Strategy and Performance Overview (continued)
| | 25% share of the global lithium market. Second-quarter 2019 results were weak on lower data points for lithium pricing. Jennison sold the Fund’s position in August 2019 based on the belief that the situation could persist. |
| | • | | Biocon Ltd. is India’s largest biopharmaceutical company. It has successfully developed and marketed a range of novel biologics, biosimilars, differentiated small molecules, and recombinant human insulin and analogs at prices that make them affordable and accessible for patients with diabetes, cancer, and autoimmune disease, as well as patients living in India and other emerging markets. Shares declined due to somewhat disappointing biologics revenue and margin guidance during the period. Jennison views Biocon as a beneficiary of a substantial and unfolding global biosimilar opportunity and has a favorable view of its monetization prospects and product pipeline. |
| | • | | YY Inc. is a Chinese video-based social network. It originally targeted gamers, but then broadened its offerings to include video streaming and chat features. Jennison believes the acquisition of Bigo Technology Pte. Ltd., a Singapore-based provider of video broadcast and voice-over-internet protocol-related products and services, offers a significant opportunity for YY, given that Bigo has a large and under-monetized user base outside China. During the period, YY’s margins were under pressure as the company ramped up investments to fuel growth, an effort that Jennison supports. |
| | • | | Pinduoduo is a Chinesee-commerce platform that allows users to participate in group buying deals. Although Jennison invested in Pinduoduo based on its thesis that the company had sizeable growth potential and a good social-media team purchase model, the position was sold in May 2019. |
Current outlook
| | • | | Jennison believes that Federal Reserve monetary policy decisions during the period—along with relative stock valuations, economic/earnings growth differentials, and a rising consumer middle class—bode well for emerging market equities going forward. Jennison remains cautiously optimistic about the asset class. |
| | • | | Moreover, Jennison sees favorable fundamentals and greater resilience in many emerging economies, but thinks it is paramount to focus on company-specific fundamentals that could help share prices during macroeconomic slowdowns. |
| | • | | Jennison is focused on identifying businesses that generate organic growth and continue to offer secular growth opportunities, which Jennison considers to be the best way to navigate emerging markets equity investing. The Fund remains heavily invested in consumer, health care, and communication services stocks with these characteristics. |
| | • | | China, the Fund’s largest weighting by country at the end of the period, continues on its path to drive economic growth through domestic consumer demand rather than exports |
| | |
| 12 | | Visit our website at pgiminvestments.com |
| | and massive public works programs. Jennison considers this approach to be a work in progress that should allow China to make inroads on high value-added economic activity. While there are risks on this journey, Jennison has observed more balanced and better-quality growth in the Chinese economy. Fund positions are focused on the rapidly growinge-commerce and internet platform opportunities that are less exposed to the more volatile sectors of China’s economy andUS-China trade friction. |
The percentage points shown in the tables below identify each security’s positive or negative contribution to the Fund’s return, which is the sum of all contributions by individual holdings during the Fund’s reporting period.
| | | | | | |
| |
| Top Contributors (%) | | Top Detractors (%) |
| MercadoLibre | | 4.92 | | Sociedad Quimica Y Minera | | –0.98 |
| Kweichow Moutai | | 4.12 | | Ashok Leyland | | –0.96 |
| Wuxi Biologics | | 2.04 | | Biocon | | –0.54 |
| Alibaba | | 1.99 | | YY | | –0.41 |
| Jiangsu Hengrui Medicine | | 1.93 | | Pinduoduo | | –0.33 |
| | | | |
| PGIM Jennison Emerging Markets Equity Opportunities Fund | | | 13 | |
Fees and Expenses(unaudited)
As a shareholder of the Fund, you incur two types of costs: (1) transaction costs, including sales charges (loads) on purchase payments and redemptions, as applicable, and (2) ongoing costs, including management fees, distribution, and/or service (12b-1) fees, and other Fund expenses, as applicable. This example is intended to help you understand your ongoing costs (in dollars) of investing in the Fund and to compare these costs with the ongoing costs of investing in other mutual funds.
The example is based on an investment of $1,000 held through the six-month period ended October 31, 2019. The example is for illustrative purposes only; you should consult the Prospectus for information on initial and subsequent minimum investment requirements.
Actual Expenses
The first line for each share class in the table on the following page provides information about actual account values and actual expenses. You may use the information on this line, together with the amount you invested, to estimate the expenses that you paid over the period. Simply divide your account value by $1,000 (for example, an $8,600 account value ÷ $1,000 = 8.6), then multiply the result by the number on the first line under the heading “Expenses Paid During the Six-Month Period” to estimate the expenses you paid on your account during this period.
Hypothetical Example for Comparison Purposes
The second line for each share class in the table on the following page provides information about hypothetical account values and hypothetical expenses based on the Fund’s actual expense ratio and an assumed rate of return of 5% per year before expenses, which is not the Fund’s actual return. The hypothetical account values and expenses may not be used to estimate the actual ending account balance or expenses you paid for the period. You may use this information to compare the ongoing costs of investing in the Fund and other funds. To do so, compare this 5% hypothetical example with the 5% hypothetical examples that appear in the shareholder reports of the other funds.
The Fund’s transfer agent may charge additional fees to holders of certain accounts that are not included in the expenses shown in the table on the following page. These fees apply to individual retirement accounts (IRAs) and Section 403(b) accounts. As of the close of the six-month period covered by the table, IRA fees included an annual maintenance fee of $15 per account (subject to a maximum annual maintenance fee of $25 for all accounts held by the same shareholder). Section 403(b) accounts are charged an annual $25 fiduciary maintenance fee. Some of the fees may vary in amount, or may be waived, based on your total account balance or the number of PGIM funds, including the Fund, that you own. You should consider the additional fees that were charged to your Fund account over the six-month period when you estimate the total ongoing expenses paid over the period
| | |
| 14 | | Visit our website at pgiminvestments.com |
and the impact of these fees on your ending account value, as these additional expenses are not reflected in the information provided in the expense table. Additional fees have the effect of reducing investment returns.
Please note that the expenses shown in the table are meant to highlight your ongoing costs only and do not reflect any transactional costs such as sales charges (loads). Therefore, the second line for each share class in the table is useful in comparing ongoing costs only and will not help you determine the relative total costs of owning different funds. In addition, if these transactional costs were included, your costs would have been higher.
| | | | | | | | | | | | | | | | | | |
| | | | |
PGIM
Jennison Emerging
Markets Equity
Opportunities Fund | | Beginning Account
Value
May 1, 2019 | | | Ending Account
Value
October 31, 2019 | | | Annualized
Expense Ratio
Based on the
Six-Month Period | | | Expenses Paid
During the
Six-Month Period* | |
| Class A | | Actual | | $ | 1,000.00 | | | $ | 1,057.40 | | | | 1.45 | % | | $ | 7.52 | |
| | Hypothetical | | $ | 1,000.00 | | | $ | 1,017.90 | | | | 1.45 | % | | $ | 7.38 | |
| Class C | | Actual | | $ | 1,000.00 | | | $ | 1,054.00 | | | | 2.20 | % | | $ | 11.39 | |
| | Hypothetical | | $ | 1,000.00 | | | $ | 1,014.12 | | | | 2.20 | % | | $ | 11.17 | |
| Class Z | | Actual | | $ | 1,000.00 | | | $ | 1,058.50 | | | | 1.20 | % | | $ | 6.23 | |
| | Hypothetical | | $ | 1,000.00 | | | $ | 1,019.16 | | | | 1.20 | % | | $ | 6.11 | |
| Class R6 | | Actual | | $ | 1,000.00 | | | $ | 1,058.50 | | | | 1.20 | % | | $ | 6.23 | |
| | | Hypothetical | | $ | 1,000.00 | | | $ | 1,019.16 | | | | 1.20 | % | | $ | 6.11 | |
*Fund expenses (net of fee waivers or subsidies, if any) for each share class are equal to the annualized expense ratio for each share class (provided in the table), multiplied by the average account value over the period, multiplied by the 184 days in the six-month period ended October 31, 2019, and divided by the 365 days in the Fund’s fiscal year ended October 31, 2019 (to reflect the six-month period). Expenses presented in the table include the expenses of any underlying portfolios in which the Fund may invest.
| | | | |
| PGIM Jennison Emerging Markets Equity Opportunities Fund | | | 15 | |
Schedule of Investments
as of October 31, 2019
| | | | | | | | |
| Description | | Shares | | | Value | |
LONG-TERM INVESTMENTS 95.7% | | | | | | | | |
| | |
COMMON STOCKS | | | | | | | | |
| | |
Argentina 4.5% | | | | | | | | |
MercadoLibre, Inc.* | | | 1,695 | | | $ | 883,976 | |
| | |
Brazil 7.4% | | | | | | | | |
Lojas Renner SA | | | 37,770 | | | | 479,271 | |
Notre Dame Intermedica Participacoes SA | | | 22,578 | | | | 336,939 | |
Pagseguro Digital Ltd. (Class A Stock)* | | | 8,188 | | | | 303,611 | |
Raia Drogasil SA | | | 11,756 | | | | 322,326 | |
| | | | | | | | |
| | | | | | | 1,442,147 | |
| | |
China 45.8% | | | | | | | | |
Alibaba Group Holding Ltd., ADR* | | | 7,625 | | | | 1,347,109 | |
Budweiser Brewing Co. APAC Ltd., 144A* | | | 67,771 | | | | 246,512 | |
Hangzhou Tigermed Consulting Co. Ltd. (Class A Stock) | | | 21,940 | | | | 212,390 | |
HUYA, Inc., ADR*(a) | | | 14,391 | | | | 320,056 | |
Innovent Biologics, Inc., 144A* | | | 30,917 | | | | 94,051 | |
Jiangsu Hengrui Medicine Co. Ltd. (Class A Stock) | | | 73,524 | | | | 945,453 | |
Jinxin Fertility Group Ltd., 144A* | | | 161,279 | | | | 295,065 | |
Kweichow Moutai Co. Ltd. (Class A Stock) | | | 7,831 | | | | 1,306,658 | |
Meituan Dianping (Class B Stock)* | | | 52,820 | | | | 628,834 | |
Shenzhou International Group Holdings Ltd. | | | 13,941 | | | | 192,626 | |
Tencent Holdings Ltd. | | | 19,662 | | | | 799,505 | |
Tencent Music Entertainment Group, ADR* | | | 13,597 | | | | 188,182 | |
WuXi AppTec Co. Ltd. (Class H Stock), 144A | | | 63,848 | | | | 767,331 | |
Wuxi Biologics Cayman, Inc., 144A* | | | 89,294 | | | | 1,048,929 | |
YY, Inc., ADR*(a) | | | 3,612 | | | | 205,306 | |
Zai Lab Ltd., ADR* | | | 11,031 | | | | 372,737 | |
| | | | | | | | |
| | | | | | | 8,970,744 | |
| | |
Hong Kong 1.6% | | | | | | | | |
AIA Group Ltd. | | | 31,963 | | | | 317,235 | |
| | |
India 16.9% | | | | | | | | |
Asian Paints Ltd. | | | 21,320 | | | | 544,373 | |
Biocon Ltd. | | | 102,122 | | | | 354,780 | |
Godrej Consumer Products Ltd. | | | 46,369 | | | | 484,554 | |
HDFC Bank Ltd., ADR | | | 8,402 | | | | 513,278 | |
MakeMyTrip Ltd.* | | | 25,070 | | | | 577,111 | |
Maruti Suzuki India Ltd. | | | 4,243 | | | | 452,334 | |
Titan Co. Ltd. | | | 20,012 | | | | 376,202 | |
| | | | | | | | |
| | | | | | | 3,302,632 | |
See Notes to Financial Statements.
| | | | |
| PGIM Jennison Emerging Markets Equity Opportunities Fund | | | 17 | |
Schedule of Investments(continued)
as of October 31, 2019
| | | | | | | | |
| Description | | Shares | | | Value | |
COMMON STOCKS (Continued) | | | | | | | | |
| | |
Indonesia 8.0% | | | | | | | | |
Ace Hardware Indonesia Tbk PT | | | 5,467,747 | | | $ | 658,044 | |
Indofood CBP Sukses Makmur Tbk PT | | | 447,418 | | | | 370,147 | |
Mitra Adiperkasa Tbk PT | | | 7,634,990 | | | | 543,825 | |
| | | | | | | | |
| | | | | | | 1,572,016 | |
| | |
Macau 1.6% | | | | | | | | |
Sands China Ltd. | | | 64,283 | | | | 315,166 | |
| | |
Malaysia 1.4% | | | | | | | | |
IHH Healthcare Bhd | | | 205,448 | | | | 279,018 | |
| | |
Peru 1.5% | | | | | | | | |
Credicorp Ltd. | | | 1,310 | | | | 280,392 | |
| | |
Russia 1.4% | | | | | | | | |
X5 Retail Group NV, GDR | | | 8,207 | | | | 275,249 | |
| | |
South Korea 0.9% | | | | | | | | |
Samsung SDI Co. Ltd. | | | 938 | | | | 182,119 | |
| | |
Taiwan 1.5% | | | | | | | | |
Sea Ltd., ADR*(a) | | | 10,055 | | | | 299,237 | |
| | |
Thailand 3.2% | | | | | | | | |
CP ALL PCL | | | 240,542 | | | | 621,413 | |
| | | | | | | | |
TOTAL LONG-TERM INVESTMENTS
(cost $13,280,634) | | | | | | | 18,741,344 | |
| | | | | | | | |
| | |
SHORT-TERM INVESTMENTS 9.3% | | | | | | | | |
| | |
AFFILIATED MUTUAL FUNDS | | | | | | | | |
PGIM Core Ultra Short Bond Fund(w) | | | 980,284 | | | | 980,284 | |
See Notes to Financial Statements.
| | | | | | | | |
| Description | | Shares | | | Value | |
AFFILIATED MUTUAL FUNDS (Continued) | | | | | | | | |
PGIM Institutional Money Market Fund
(cost $839,878; includes $837,862 of cash collateral for securities on loan)(b)(w) | | | 839,929 | | | $ | 840,097 | |
| | | | | | | | |
TOTAL SHORT-TERM INVESTMENTS
(cost $1,820,162) | | | | | | | 1,820,381 | |
| | | | | | | | |
TOTAL INVESTMENTS 105.0%
(cost $15,100,796) | | | | | | | 20,561,725 | |
Liabilities in excess of other assets (5.0)% | | | | | | | (973,070 | ) |
| | | | | | | | |
NET ASSETS 100.0% | | | | | | $ | 19,588,655 | |
| | | | | | | | |
Below is a list of the abbreviation(s) used in the annual report:
144A—Security was purchased pursuant to Rule 144A under the Securities Act of 1933 and, pursuant to the requirements of Rule 144A, may not be resold except to qualified institutional buyers.
ADR—American Depositary Receipt
GDR—Global Depositary Receipt
LIBOR—London Interbank Offered Rate
| * | Non-income producing security. |
| (a) | All or a portion of security is on loan. The aggregate market value of such securities, including those sold and pending settlement, is $820,256; cash collateral of $837,862 (included in liabilities) was received with which the Series purchased highly liquid short-term investments. |
| (b) | Represents security purchased with cash collateral received for securities on loan and includes dividend reinvestment. |
| (w) | PGIM Investments LLC, the manager of the Series, also serves as manager of the PGIM Core Ultra Short Bond Fund and PGIM Institutional Money Market Fund. |
Fair Value Measurements:
Various inputs are used in determining the value of the Series’ investments. These inputs are summarized in the three broad levels listed below.
Level 1—unadjusted quoted prices generally in active markets for identical securities.
Level 2—quoted prices for similar securities, interest rates and yield curves, prepayment speeds, foreign currency exchange rates and other observable inputs.
Level 3—unobservable inputs for securities valued in accordance with Board approved fair valuation procedures.
The following is a summary of the inputs used as of October 31, 2019 in valuing such portfolio securities:
| | | | | | | | | | | | |
| | | Level 1 | | | Level 2 | | | Level 3 | |
Investments in Securities | | | | | | | | | | | | |
Assets | | | | | | | | | | | | |
Common Stocks | | | | | | | | | | | | |
Argentina | | $ | 883,976 | | | $ | — | | | $ | — | |
Brazil | | | 1,442,147 | | | | — | | | | — | |
China | | | 2,433,390 | | | | 6,537,354 | | | | — | |
See Notes to Financial Statements.
| | | | |
| PGIM Jennison Emerging Markets Equity Opportunities Fund | | | 19 | |
Schedule of Investments(continued)
as of October 31, 2019
| | | | | | | | | | | | |
| | | Level 1 | | | Level 2 | | | Level 3 | |
Investments in Securities (continued) | | | | | | | | | | | | |
Assets (continued) | | | | | | | | | | | | |
Common Stocks (continued) | | | | | | | | | | | | |
Hong Kong | | $ | — | | | $ | 317,235 | | | $ | — | |
India | | | 1,090,389 | | | | 2,212,243 | | | | — | |
Indonesia | | | — | | | | 1,572,016 | | | | — | |
Macau | | | — | | | | 315,166 | | | | — | |
Malaysia | | | — | | | | 279,018 | | | | — | |
Peru | | | 280,392 | | | | — | | | | — | |
Russia | | | — | | | | 275,249 | | | | — | |
South Korea | | | — | | | | 182,119 | | | | — | |
Taiwan | | | 299,237 | | | | — | | | | — | |
Thailand | | | — | | | | 621,413 | | | | — | |
Affiliated Mutual Funds | | | 1,820,381 | | | | — | | | | — | |
| | | | | | | | | | | | |
Total | | $ | 8,249,912 | | | $ | 12,311,813 | | | $ | — | |
| | | | | | | | | | | | |
Industry Classification:
The industry classification of investments and liabilities in excess of other assets shown as a percentage of net assets as of October 31, 2019 were as follows (unaudited):
| | | | |
Internet & Direct Marketing Retail | | | 17.6 | % |
Life Sciences Tools & Services | | | 10.3 | |
Affiliated Mutual Funds (4.3% represents investments purchased with collateral from securities on loan) | | | 9.3 | |
Beverages | | | 8.0 | |
Food & Staples Retailing | | | 6.2 | |
Multiline Retail | | | 5.3 | |
Interactive Media & Services | | | 5.1 | |
Pharmaceuticals | | | 4.8 | |
Health Care Providers & Services | | | 4.6 | |
Biotechnology | | | 4.2 | |
Entertainment | | | 4.1 | |
Banks | | | 4.1 | |
Specialty Retail | | | 3.3 | |
| | | | |
Textiles, Apparel & Luxury Goods | | | 2.9 | % |
Chemicals | | | 2.8 | |
Personal Products | | | 2.5 | |
Automobiles | | | 2.3 | |
Food Products | | | 1.9 | |
Insurance | | | 1.6 | |
Hotels, Restaurants & Leisure | | | 1.6 | |
IT Services | | | 1.6 | |
Electronic Equipment, Instruments & Components | | | 0.9 | |
| | | | |
| | | 105.0 | |
Liabilities in excess of other assets | | | (5.0 | ) |
| | | | |
| | | 100.0 | % |
| | | | |
Financial Instruments/Transactions—Summary of Offsetting and Netting Arrangements:
The Series entered into financial instruments/transactions during the reporting period that are either offset in accordance with current requirements or are subject to enforceable master netting arrangements or similar agreements that permit offsetting. The information about offsetting and related netting arrangements for financial instruments/transactions where the legal right toset-off exists is presented in the summary below.
See Notes to Financial Statements.
Offsetting of financial instrument/transaction assets and liabilities:
| | | | | | | | | | | | |
Description | | Gross Market
Value of
Recognized
Assets/(Liabilities) | | | Collateral
Pledged/(Received)(1) | | | Net
Amount | |
Securities on Loan | | $ | 820,256 | | | $ | (820,256 | ) | | $ | — | |
| | | | | | | | | | | | |
| (1) | Collateral amount disclosed by the Series is limited to the market value of financial instruments/transactions. |
See Notes to Financial Statements.
| | | | |
| PGIM Jennison Emerging Markets Equity Opportunities Fund | | | 21 | |
Statement of Assets and Liabilities
as of October 31, 2019
| | | | |
Assets | | | | |
Investments at value, including securities on loan of $820,256: | | | | |
Unaffiliated investments (cost $13,280,634) | | $ | 18,741,344 | |
Affiliated investments (cost $1,820,162) | | | 1,820,381 | |
Foreign currency, at value (cost $12) | | | 13 | |
Due from Manager | | | 31,756 | |
Dividends receivable | | | 7,326 | |
Receivable for Series shares sold | | | 2,683 | |
Prepaid expenses | | | 1,622 | |
| | | | |
Total Assets | | | 20,605,125 | |
| | | | |
| |
Liabilities | | | | |
Payable to broker for collateral for securities on loan | | | 837,862 | |
Payable for Series shares reacquired | | | 94,096 | |
Accrued expenses and other liabilities | | | 51,967 | |
Foreign capital gains tax liability accrued | | | 29,630 | |
Distribution fee payable | | | 1,711 | |
Affiliated transfer agent fee payable | | | 1,204 | |
| | | | |
Total Liabilities | | | 1,016,470 | |
| | | | |
| |
Net Assets | | $ | 19,588,655 | |
| | | | |
| | | | | |
Net assets were comprised of: | | | | |
Common stock, at par | | $ | 15,995 | |
Paid-in capital in excess of par | | | 16,076,895 | |
Total distributable earnings (loss) | | | 3,495,765 | |
| | | | |
Net assets, October 31, 2019 | | $ | 19,588,655 | |
| | | | |
See Notes to Financial Statements.
| | | | |
Class A | | | | |
Net asset value and redemption price per share,
($3,806,473 ÷ 312,998 shares of common stock issued and outstanding) | | $ | 12.16 | |
Maximum sales charge (5.50% of offering price) | | | 0.71 | |
| | | | |
Maximum offering price to public | | $ | 12.87 | |
| | | | |
| |
Class C | | | | |
Net asset value, offering price and redemption price per share, | | | | |
($1,106,923 ÷ 94,566 shares of common stock issued and outstanding) | | $ | 11.71 | |
| | | | |
| |
Class Z | | | | |
Net asset value, offering price and redemption price per share, | | | | |
($2,356,716 ÷ 191,388 shares of common stock issued and outstanding) | | $ | 12.31 | |
| | | | |
| |
Class R6 | | | | |
Net asset value, offering price and redemption price per share, | | | | |
($12,318,543 ÷ 1,000,515 shares of common stock issued and outstanding) | | $ | 12.31 | |
| | | | |
See Notes to Financial Statements.
| | | | |
| PGIM Jennison Emerging Markets Equity Opportunities Fund | | | 23 | |
Statement of Operations
Year Ended October 31, 2019
| | | | |
Net Investment Income (Loss) | | | | |
Income | | | | |
Unaffiliated dividend income (net of $12,358 foreign withholding tax) | | $ | 141,154 | |
Income from securities lending, net (including affiliated income of $3,045) | | | 35,286 | |
Affiliated dividend income | | | 17,258 | |
| | | | |
Total income | | | 193,698 | |
| | | | |
| |
Expenses | | | | |
Management fee | | | 185,087 | |
Distribution fee(a) | | | 23,601 | |
Custodian and accounting fees | | | 69,867 | |
Fund data services | | | 55,587 | |
Registration fees(a) | | | 50,360 | |
Audit fee | | | 29,879 | |
Shareholders’ reports | | | 21,778 | |
Legal fees and expenses | | | 17,196 | |
Transfer agent’s fees and expenses (including affiliated expense of $7,713)(a) | | | 14,657 | |
Directors’ fees | | | 11,099 | |
Pricing fees | | | 980 | |
Miscellaneous | | | 13,859 | |
| | | | |
Total expenses | | | 493,950 | |
Less: Fee waiver and/or expense reimbursement(a) | | | (258,821 | ) |
Distribution fee waiver(a) | | | (1,537 | ) |
| | | | |
Net expenses | | | 233,592 | |
| | | | |
Net investment income (loss) | | | (39,894 | ) |
| | | | |
| |
Realized And Unrealized Gain (Loss) On Investment And Foreign Currency Transactions | | | | |
Net realized gain (loss) on: | | | | |
Investment transactions (including affiliated of $601) | | | 433,502 | |
Foreign currency transactions | | | 2,030 | |
| | | | |
| | | 435,532 | |
| | | | |
Net change in unrealized appreciation (depreciation) on: | | | | |
Investments (including affiliated of $219) (net of change in foreign capital gains taxes $(28,482)) | | | 3,689,894 | |
Foreign currencies | | | (134 | ) |
| | | | |
| | | 3,689,760 | |
| | | | |
Net gain (loss) on investment and foreign currency transactions | | | 4,125,292 | |
| | | | |
Net Increase (Decrease) In Net Assets Resulting From Operations | | $ | 4,085,398 | |
| | | | |
| (a) | Class specific expenses and waivers were as follows: |
| | | | | | | | | | | | | | | | |
| | | Class A | | | Class C | | | Class Z | | | Class R6 | |
Distribution fee | | | 9,221 | | | | 14,380 | | | | — | | | | — | |
Registration fees | | | 12,590 | | | | 12,590 | | | | 12,590 | | | | 12,590 | |
Transfer agent’s fees and expenses | | | 9,526 | | | | 1,832 | | | | 3,252 | | | | 47 | |
Fee waiver and/or expense reimbursement | | | (56,733 | ) | | | (29,186 | ) | | | (36,818 | ) | | | (136,084 | ) |
Distribution fee waiver | | | (1,537 | ) | | | — | | | | — | | | | — | |
See Notes to Financial Statements.
Statements of Changes in Net Assets
| | | | | | | | |
| |
| | | Year Ended
October 31, | |
| | |
| | | 2019 | | | 2018 | |
Increase (Decrease) in Net Assets | | | | | | | | |
Operations | | | | | | | | |
Net investment income (loss) | | $ | (39,894 | ) | | $ | (52,445 | ) |
Net realized gain (loss) on investment and foreign currency transactions | | | 435,532 | | | | (112,363 | ) |
Net change in unrealized appreciation (depreciation) on investments and foreign currencies | | | 3,689,760 | | | | (2,460,454 | ) |
| | | | | | | | |
Net increase (decrease) in net assets resulting from operations | | | 4,085,398 | | | | (2,625,262 | ) |
| | | | | | | | |
| | |
Series share transactions (Net of share conversions) | | | | | | | | |
Net proceeds from shares sold | | | 2,787,608 | | | | 3,466,110 | |
Cost of shares reacquired | | | (1,852,092 | ) | | | (2,244,237 | ) |
| | | | | | | | |
Net increase (decrease) in net assets from Series share transactions | | | 935,516 | | | | 1,221,873 | |
| | | | | | | | |
Total increase (decrease) | | | 5,020,914 | | | | (1,403,389 | ) |
| | |
Net Assets: | | | | | | | | |
Beginning of year | | | 14,567,741 | | | | 15,971,130 | |
| | | | | | | | |
End of year | | $ | 19,588,655 | | | $ | 14,567,741 | |
| | | | | | | | |
See Notes to Financial Statements.
| | | | |
| PGIM Jennison Emerging Markets Equity Opportunities Fund | | | 25 | |
Notes to Financial Statements
Prudential World Fund, Inc. (the “Fund”) is registered under the Investment Company Act of 1940, as amended (“1940 Act”), as anopen-end management investment company and currently consists of seven series: PGIM Jennison Emerging Markets Equity Opportunities Fund, PGIM Jennison Global Opportunities Fund, PGIM Jennison International Opportunities Fund and PGIM QMA International Equity Fund, each of which are diversified funds and PGIM Jennison Global Infrastructure Fund, PGIM Emerging Markets Debt Hard Currency Fund and PGIM Emerging Markets Debt Local Currency Fund, each of which arenon-diversified funds for purposes of the 1940 Act and may invest a greater percentage of their assets in the securities of a single company or other issuer than a diversified fund. Investing in anon-diversified fund involves greater risk than investing in a diversified fund because a loss resulting from the decline in value of any one security may represent a greater portion of the total assets of anon-diversified fund. These financial statements relate only to the PGIM Jennison Emerging Markets Equity Opportunities Fund (the “Series”).
The investment objective of the Series is to seek long-term growth of capital.
1. Accounting Policies
The Series follows the investment company accounting and reporting guidance of the Financial Accounting Standards Board (“FASB”) Accounting Standard Codification (“ASC”) Topic 946 Financial Services—Investment Companies. The following accounting policies conform to U.S. generally accepted accounting principles. The Series consistently follows such policies in the preparation of its financial statements.
Securities Valuation:The Series holds securities and other assets and liabilities that are fair valued at the close of each day (generally, 4:00 PM Eastern time) the New York Stock Exchange (“NYSE”) is open for trading. Fair value is the price that would be received to sell an asset or paid to transfer a liability in an orderly transaction between market participants on the measurement date. The Fund’s Board of Directors (the “Board”) has adopted valuation procedures for security valuation under which fair valuation responsibilities have been delegated to PGIM Investments LLC (“PGIM Investments” or the “Manager”). Pursuant to the Board’s delegation, the Manager has established a Valuation Committee responsible for supervising the fair valuation of portfolio securities and other assets and liabilities. The valuation procedures permit the Series to utilize independent pricing vendor services, quotations from market makers, and alternative valuation methods when market quotations are either not readily available or not deemed representative of fair value. A record of the Valuation Committee’s actions is subject to the Board’s review, approval, and ratification at its next regularly scheduled quarterly meeting.
For the fiscal reportingyear-end, securities and other assets and liabilities were fair valued at the close of the last U.S. business day. Trading in certain foreign securities may occur when
the NYSE is closed (including weekends and holidays). Because such foreign securities trade in markets that are open on weekends and U.S. holidays, the values of some of the Series’ foreign investments may change on days when investors cannot purchase or redeem Series shares.
Various inputs determine how the Series’ investments are valued, all of which are categorized according to the three broad levels (Level 1, 2, or 3) detailed in the Schedule of Investments and referred to herein as the “fair value hierarchy” in accordance with FASB ASC Topic 820—Fair Value Measurements and Disclosures.
Common and preferred stocks, exchange-traded funds, and derivative instruments, such as futures or options, that are traded on a national securities exchange are valued at the last sale price as of the close of trading on the applicable exchange where the security principally trades. Securities traded via NASDAQ are valued at the NASDAQ official closing price. To the extent these securities are valued at the last sale price or NASDAQ official closing price, they are classified as Level 1 in the fair value hierarchy. In the event that no sale or official closing price on valuation date exists, these securities are generally valued at the mean between the last reported bid and ask prices, or at the last bid price in the absence of an ask price. These securities are classified as Level 2 in the fair value hierarchy.
Foreign equities traded on foreign securities exchanges are generally valued using pricing vendor services that provide model prices derived using adjustment factors based on information such as local closing price, relevant general and sector indices, currency fluctuations, depositary receipts, and futures, as applicable. Securities valued using such model prices are classified as Level 2 in the fair value hierarchy. The models generate an evaluated adjustment factor for each security, which is applied to the local closing price to adjust it for post closing market movements up to the time the Series is valued. Utilizing that evaluated adjustment factor, the vendor provides an evaluated price for each security. If the vendor does not provide an evaluated price, securities are valued in accordance with exchange-traded common and preferred stock valuation policies discussed above.
Investments inopen-end,non-exchange-traded mutual funds are valued at their net asset values as of the close of the NYSE on the date of valuation. These securities are classified as Level 1 in the fair value hierarchy since they may be purchased or sold at their net asset values on the date of valuation.
Securities and other assets that cannot be priced according to the methods described above are valued based on pricing methodologies approved by the Board. In the event that unobservable inputs are used when determining such valuations, the securities will be classified as Level 3 in the fair value hierarchy.
When determining the fair value of securities, some of the factors influencing the valuation include: the nature of any restrictions on disposition of the securities; assessment of the general liquidity of the securities; the issuer’s financial condition and the markets in which it does business; the cost of the investment; the size of the holding and the capitalization of
| | | | |
| PGIM Jennison Emerging Markets Equity Opportunities Fund | | | 27 | |
Notes to Financial Statements(continued)
the issuer; the prices of any recent transactions or bids/offers for such securities or any comparable securities; any available analyst media or other reports or information deemed reliable by the Manager regarding the issuer or the markets or industry in which it operates. Using fair value to price securities may result in a value that is different from a security’s most recent closing price and from the price used by other unaffiliated mutual funds to calculate their net asset values.
Illiquid Securities:Pursuant to Rule22e-4 under the 1940 Act, the Series has adopted a Board approved Liquidity Risk Management Program (“LRMP”) that requires, among other things, that the Series limit its illiquid investments that are assets to no more than 15% of net assets. Illiquid securities are those that, because of the absence of a readily available market or due to legal or contractual restrictions on resale, may not reasonably be expected to be sold or disposed of in current market conditions in seven calendar days or less without the sale or disposition significantly changing the market value of the investment. The Series may find it difficult to sell illiquid securities at the time considered most advantageous by its subadviser and may incur transaction costs that would not be incurred in the sale of securities that were freely marketable.
Restricted Securities:Securities acquired in unregistered, private sales from the issuing company or from an affiliate of the issuer are considered restricted as to disposition under federal securities law (“restricted securities”). Such restricted securities are valued pursuant to the valuation procedures noted above. Restricted securities that would otherwise be considered illiquid investments pursuant to the Series’ LRMP because of legal restrictions on resale to the general public may be traded among qualified institutional buyers under Rule 144A of the Securities Act of 1933. Therefore, these Rule 144A securities, as well as commercial paper that is sold in private placements under Section 4(2) of the Securities Act of 1933, may be classified higher than “illiquid” under the LRMP (i.e. “moderately liquid” or “less liquid” investments). However, the liquidity of the Series’ investments in restricted securities could be impaired if trading does not develop or declines.
Foreign Currency Translation:The books and records of the Series are maintained in U.S. dollars. Foreign currency amounts are translated into U.S. dollars on the following basis:
(i) market value of investment securities, other assets and liabilities—at the current rates of exchange;
(ii) purchases and sales of investment securities, income and expenses—at the rates of exchange prevailing on the respective dates of such transactions.
Although the net assets of the Series are presented at the foreign exchange rates and market values at the close of the period, the Series does not generally isolate that portion of
the results of operations arising as a result of changes in the foreign exchange rates from the fluctuations arising from changes in the market prices of long-term portfolio securities held at the end of the period. Similarly, the Series does not isolate the effect of changes in foreign exchange rates from the fluctuations arising from changes in the market prices of long-term portfolio securities sold during the period. Accordingly, holding period realized foreign currency gains (losses) are included in the reported net realized gains (losses) on investment transactions.
Net realized gains (losses) on foreign currency transactions represent net foreign exchange gains (losses) from the disposition of holdings of foreign currencies, currency gains (losses) realized between the trade and settlement dates on forward currency transactions, and the difference between the amounts of interest, dividends and foreign withholding taxes recorded on the Series’ books and the U.S. dollar equivalent amounts actually received or paid. Net unrealized currency gains (losses) arise from valuing foreign currency denominated assets and liabilities (other than investments) at period end exchange rates.
Master Netting Arrangements:The Series is subject to various Master Agreements, or netting arrangements, with select counterparties. These are agreements which a subadviser may have negotiated and entered into on behalf of all or a portion of the Series. A master netting arrangement between the Series and the counterparty permits the Series to offset amounts payable by the Series to the same counterparty against amounts to be received; and by the receipt of collateral from the counterparty by the Series to cover the Series’ exposure to the counterparty. However, there is no assurance that such mitigating factors are easily enforceable. In addition to master netting arrangements, the right toset-off exists when all the conditions are met such that each of the parties owes the other determinable amounts, the reporting party has the right toset-off the amount owed with the amount owed by the other party, the reporting party intends toset-off and the right ofset-off is enforceable by law. During the reporting period, there was no intention to settle on a net basis and all amounts are presented on a gross basis on the Statement of Assets and Liabilities.
Securities Lending:The Series lends its portfolio securities to banks and broker-dealers. The loans are secured by collateral at least equal to the market value of the securities loaned. Collateral pledged by each borrower is invested in an affiliated money market fund and is marked to market daily, based on the previous day’s market value, such that the value of the collateral exceeds the value of the loaned securities. In the event of significant appreciation in value of securities on loan on the last business day of the reporting period, the financial statements may reflect a collateral value that is less than the market value of the loaned securities. Such shortfall is remedied as described above. Loans are subject to termination at the option of the borrower or the Series. Upon termination of the loan, the borrower will return to the Series securities identical to the loaned securities. Should the borrower of the securities fail financially, the Series has the right to repurchase the securities in the open market using the collateral.
The Series recognizes income, net of any rebate and securities lending agent fees, for lending its securities in the form of fees or interest on the investment of any cash received as
| | | | |
| PGIM Jennison Emerging Markets Equity Opportunities Fund | | | 29 | |
Notes to Financial Statements(continued)
collateral. The borrower receives all interest and dividends from the securities loaned and such payments are passed back to the lender in amounts equivalent thereto. The Series also continues to recognize any unrealized gain (loss) in the market price of the securities loaned and on the change in the value of the collateral invested that may occur during the term of the loan. In addition, realized gain (loss) is recognized on changes in the value of the collateral invested upon liquidation of the collateral. Net earnings from securities lending are disclosed on the Statement of Operations as “Income from securities lending, net”.
Securities Transactions and Net Investment Income:Securities transactions are recorded on the trade date. Realized gains (losses) from investment and currency transactions are calculated on the specific identification method. Dividend income is recorded on theex-date, or for certain foreign securities, when the Series becomes aware of such dividends. Expenses are recorded on an accrual basis, which may require the use of certain estimates by management that may differ from actual. Net investment income or loss (other than class specific expenses and waivers, which are allocated as noted below) and unrealized and realized gains (losses) are allocated daily to each class of shares based upon the relative proportion of adjusted net assets of each class at the beginning of the day. Class specific expenses and waivers, where applicable, are charged to the respective share classes. Class specific expenses include distribution fees and distribution fee waivers, shareholder servicing fees, transfer agent’s fees and expenses, registration fees and fee waivers and/or expense reimbursements, as applicable.
Taxes:It is the Series’ policy to continue to meet the requirements of the Internal Revenue Code applicable to regulated investment companies and to distribute all of its taxable net investment income and capital gains, if any, to its shareholders. Therefore, no federal income tax provision is required. Withholding taxes on foreign dividends, interest and capital gains, if any, are recorded, net of reclaimable amounts, at the time the related income is earned.
Dividends and Distributions:The Series expects to pay dividends from net investment income and distributions from net realized capital and currency gains, if any, annually. Dividends and distributions to shareholders, which are determined in accordance with federal income tax regulations and which may differ from generally accepted accounting principles, are recorded on theex-date. Permanent book/tax differences relating to income and gain (loss) are reclassified between total distributable earnings (loss) andpaid-in capital in excess of par, as appropriate.
Estimates:The preparation of financial statements requires management to make estimates and assumptions that affect the reported amounts and disclosures in the financial statements. Actual results could differ from those estimates.
2. Agreements
The Series has a management agreement with the Manager. Pursuant to this agreement, the Manager has responsibility for all investment advisory services and supervises the subadviser’s performance of such services. In addition, under the management agreement, the Manager provides all of the administrative functions necessary for the organization, operation and management of the Series. The Manager administers the corporate affairs of the Series and, in connection therewith, furnishes the Series with office facilities, together with those ordinary clerical and bookkeeping services which are not being furnished by the Series’ custodian and the Series’ transfer agent. The Manager is also responsible for the staffing and management of dedicated groups of legal, marketing, compliance and related personnel necessary for the operation of the Series. The legal, marketing, compliance and related personnel are also responsible for the management and oversight of the various service providers to the Series, including, but not limited to, the custodian, transfer agent, and accounting agent.
The Manager has entered into a subadvisory agreement with Jennison Associates LLC (“Jennison”). The subadvisory agreement provides that Jennison will furnish investment advisory services in connection with the management of the Series. In connection therewith, Jennison is obligated to keep certain books and records of the Series. The Manager pays for the services of Jennison, the cost of compensation of officers of the Series, occupancy and certain clerical and bookkeeping costs of the Series. The Series bears all other costs and expenses.
The management fee paid to the Manager is accrued daily and payable monthly at an annual rate of 1.05% of the Series’ average daily net assets up to $5 billion and 1.025% of the Series’ average daily net assets in excess of $5 billion. The effective management fee rate before any waivers and/or expense reimbursements was 1.05% for the year ended October 31, 2019.
The Manager has contractually agreed, through February 28, 2021, to limit total annual operating expenses after fee waivers and/or expense reimbursements to 1.45% of average daily net assets for Class A shares, 2.20% of average daily net assets for Class C shares, 1.20% of average daily net assets for Class Z shares and 1.20% of average daily net assets for Class R6 shares. The contractual waiver excludes interest, brokerage, taxes (such as income and foreign withholding taxes, stamp duty and deferred tax expenses), acquired fund fees and expenses, extra ordinary expenses and certain other Series expenses such as dividend and interest expense and broker charges on short sales. Where applicable, the Manager agrees to waive management fees or shared operating expenses on any share class to the same extent that it waives similar expenses on any other share class. In addition, total annual operating expenses for Class R6 shares will not exceed total annual operating expenses for Class Z shares. Fees and/or expenses waived and/or reimbursed by the Manager may be recouped by the Manager within the same fiscal year during which such waiver and/or reimbursement is made if such recoupment can be realized without exceeding the expense limit in effect at the time of the recoupment for that fiscal year.
| | | | |
| PGIM Jennison Emerging Markets Equity Opportunities Fund | | | 31 | |
Notes to Financial Statements(continued)
The Fund, on behalf of the Series, has a distribution agreement with Prudential Investment Management Services LLC (“PIMS”), which acts as the distributor of the Class A, Class C, Class Z and Class R6 shares of the Series. The Series compensates PIMS for distributing and servicing the Series’ Class A and Class C shares, pursuant to the plans of distribution (the “Distribution Plans”), regardless of expenses actually incurred by PIMS. The distribution fees are accrued daily and payable monthly. No distribution or service fees are paid to PIMS as distributor of the Class Z and Class R6 shares of the Series.
Pursuant to the Distribution Plans, the Series compensates PIMS for distribution related activities at an annual rate of up to 0.30% and 1% of the average daily net assets of the Class A and Class C shares, respectively. PIMS has contractually agreed through February 28, 2021 to limit such fee to 0.25% of the average daily net assets of the Class A.
For the year ended October 31, 2019, PIMS received $8,162 infront-end sales charges resulting from sales of Class A shares. Additionally, for the year ended October 31, 2019, PIMS received and $38 in contingent deferred sales charges imposed upon redemptions by certain Class C shareholders. From these fees, PIMS paid such sales charges to broker-dealers, who in turn paid commissions to salespersons and incurred other distribution costs.
PGIM Investments, PIMS and Jennison are indirect, wholly-owned subsidiaries of Prudential Financial, Inc. (“Prudential”).
3. Other Transactions with Affiliates
Prudential Mutual Fund Services LLC (“PMFS”), an affiliate of PGIM Investments and an indirect, wholly-owned subsidiary of Prudential, serves as the Fund’s transfer agent. Transfer agent’s fees and expenses in the Statement of Operations include certainout-of-pocket expenses paid tonon-affiliates, where applicable.
The Series may invest its overnight sweep cash in the PGIM Core Ultra Short Bond Fund (the “Core Fund”), and its securities lending cash collateral in the PGIM Institutional Money Market Fund (the “Money Market Fund”), each a series of Prudential Investment Portfolios 2, registered under the 1940 Act and managed by PGIM Investments. Through the Series’ investments in the mentioned underlying funds, PGIM Investments and/or its affiliates are paid fees or reimbursed for providing their services. In addition to the realized and unrealized gains on investments in the Core Fund and Money Market Fund, earnings from such investments are disclosed on the Statement of Operations as “Affiliated dividend income” and “Income from securities lending, net”, respectively.
The Series may enter into certain securities purchase or sale transactions under Board approved Rule17a-7 procedures. Rule17a-7 is an exemptive rule under the 1940 Act, that subject to certain conditions, permits purchase and sale transactions among affiliated investment companies, or between an investment company and a person that is affiliated solely by reason of having a common (or affiliated) investment adviser, common directors, and/or common officers. Pursuant to the Rule17a-7 procedures and consistent with guidance issued by the SEC, the Fund’s Chief Compliance Officer (“CCO”) prepares a quarterly summary of all such transactions for submission to the Board, together with the CCO’s written representation that all such17a-7 transactions were effected in accordance with the Series’ Rule17a-7 procedures. For the year ended October 31, 2019, no17a-7 transactions were entered into by the Series.
4. Portfolio Securities
The aggregate cost of purchases and proceeds from sales of portfolio securities (excluding short-term investments and U.S. Government securities) for the year ended October 31, 2019, were $5,907,408 and $5,592,894, respectively.
A summary of the cost of purchases and proceeds from sales of shares of affiliated investments for the year ended October 31, 2019, is presented as follows:
| | | | | | | | | | | | | | | | | | | | | | | | | | | | | | |
Value,
Beginning
of Year | | | Cost of
Purchases | | | Proceeds
from Sales | | | Change in
Unrealized
Gain
(Loss) | | | Realized
Gain
(Loss) | | | Value,
End of Year | | | Shares,
End
of Year | | | Income | |
| | PGIM Core Ultra Short Bond Fund* | |
| $ | 394,167 | | | $ | 5,948,954 | | | $ | 5,362,837 | | | $ | — | | | $ | — | | | $ | 980,284 | | | | 980,284 | | | $ | 17,258 | |
| | PGIM Institutional Money Market Fund* | |
| | 807,439 | | | | 28,254,059 | | | | 28,222,221 | | | | 219 | | | | 601 | | | | 840,097 | | | | 839,929 | | | | 3,045 | ** |
| | | | | | | | | | | | | | | | | | | | | | | | | | | | | | |
| $ | 1,201,606 | | | $ | 34,203,013 | | | $ | 33,585,058 | | | $ | 219 | | | $ | 601 | | | $ | 1,820,381 | | | | | | | $ | 20,303 | |
| | | | | | | | | | | | | | | | | | | | | | | | | | | | | | |
| * | The Fund did not have any capital gain distributions during the reporting period. |
| ** | This amount is included in “Income from securities lending, net” on the Statement of Operations. |
5. Distributions and Tax Information
Distributions to shareholders, which are determined in accordance with federal income tax regulations and which may differ from generally accepted accounting principles, are recorded on theex-date. In order to present total distributable earnings (loss) andpaid-in capital in excess of par on the Statement of Assets and Liabilities that more closely represent their tax character, certain adjustments have been made to total distributable earnings (loss) andpaid-in capital in excess of par. For the tax year ended October 31, 2019, the adjustments were to increase total distributable earnings and decreasepaid-in capital in excess of par by $51,587 due to a net operating loss. Net investment income, net realized gain (loss) on investments and foreign currency transactions and net assets were not affected by this change.
| | | | |
| PGIM Jennison Emerging Markets Equity Opportunities Fund | | | 33 | |
Notes to Financial Statements(continued)
For the fiscal years ended October 31, 2019 and October 31, 2018, there were no distributions paid by the Series.
As of October 31, 2019, there were no undistributed earnings on a tax basis.
The United States federal income tax basis of the Series’ investments and the net unrealized appreciation as of October 31, 2019 were as follows:
| | | | | | |
Tax Basis | | Gross Unrealized Appreciation | | Gross Unrealized Depreciation | | Net Unrealized Appreciation |
| $15,130,470 | | $6,101,368 | | $(670,113) | | $5,431,255 |
The book basis may differ from tax basis due to deferred losses on wash sales.
For federal income tax purposes, the Series had a capital loss carryforward as of October 31, 2019 of approximately $1,919,000 which can be carried forward for an unlimited period. The Fund utilized approximately $433,000 of its capital loss carryforward to offset net taxable gains realized in the fiscal year ended October 31, 2019. No capital gains distributions are expected to be paid to shareholders until net gains have been realized in excess of such losses.
The Series elected to treat late year ordinary income losses of approximately $17,000 as having been incurred in the following fiscal year (October 31, 2020).
The Manager has analyzed the Series’ tax positions taken on federal, state and local income tax returns for all open tax years and has concluded that no provision for income tax is required in the Series’ financial statements for the current reporting period. Since tax authorities can examine previously filed tax returns, the Series’ U.S. federal and state tax returns for each of the four fiscal years up to the most recent fiscal year ended October 31, 2019 are subject to such review.
6. Capital and Ownership
The Series offers Class A, Class C, Class Z and Class R6 shares. Class A shares are sold with a maximumfront-end sales charge of 5.50%. Investors who purchase $1 million or more of Class A shares and sell these shares within 12 months of purchase are subject to a contingent deferred sales charge (“CDSC”) of 1%, although they are not subject to an initial sales charge. The Class A CDSC is waived for certain retirement and/or benefit plans. A special exchange privilege is also available for shareholders who qualified to purchase Class A shares at net asset value. Class C shares are sold with a CDSC of 1% on sales made within 12 months of purchase. Class C shares will automatically convert to Class A shares on
a monthly basis approximately 10 years after purchase. Class Z and Class R6 shares are not subject to any sales or redemption charge and are available exclusively for sale to a limited group of investors.
Under certain circumstances, an exchange may be made from specified share classes of the Series to one or more other share classes of the Series as presented in the table of transactions in shares of common stock.
The Fund is authorized to issue 5.075 billion shares of common stock, with a par value of $0.01 per share, which is divided into seven series. There are 865 million shares authorized for the Series, divided into five classes, designated Class A, Class C, Class Z, Class R6 and Class T common stock, each of which consists of 25 million, 65 million, 300 million, 250 million and 225 million authorized shares, respectively. The Series currently does not have any Class T shares outstanding.
As of October 31, 2019, Prudential, through its affiliated entities, including affiliated funds (if applicable), owned 1,000,515 Class R6 shares of the Series. At reporting period end, three shareholders of record, each holding greater than 5% of the Series, held 80% of the Series’ outstanding shares, of which 63% were held by an affiliate of Prudential.
Transactions in shares of common stock were as follows:
| | | | | | | | |
Class A | | Shares | | | Amount | |
Year ended October 31, 2019: | | | | | | | | |
Shares sold | | | 68,342 | | | $ | 742,030 | |
Shares reacquired | | | (49,407 | ) | | | (551,008 | ) |
| | | | | | | | |
Net increase (decrease) in shares outstanding before conversion | | | 18,935 | | | | 191,022 | |
Shares issued upon conversion from other share class(es) | | | 54,791 | | | | 650,850 | |
Shares reacquired upon conversion into other share class(es) | | | (2,537 | ) | | | (29,217 | ) |
| | | | | | | | |
Net increase (decrease) in shares outstanding | | | 71,189 | | | $ | 812,655 | |
| | | | | | | | |
Year ended October 31, 2018: | | | | | | | | |
Shares sold | | | 155,646 | | | $ | 1,901,408 | |
Shares reacquired | | | (108,937 | ) | | | (1,274,373 | ) |
| | | | | | | | |
Net increase (decrease) in shares outstanding before conversion | | | 46,709 | | | | 627,035 | |
Shares reacquired upon conversion into other share class(es) | | | (1,943 | ) | | | (22,936 | ) |
| | | | | | | | |
Net increase (decrease) in shares outstanding | | | 44,766 | | | $ | 604,099 | |
| | | | | | | | |
| | | | |
| PGIM Jennison Emerging Markets Equity Opportunities Fund | | | 35 | |
Notes to Financial Statements(continued)
| | | | | | | | |
Class C | | Shares | | | Amount | |
Year ended October 31, 2019: | | | | | | | | |
Shares sold | | | 21,925 | | | $ | 221,071 | |
Shares reacquired | | | (16,064 | ) | | | (176,097 | ) |
| | | | | | | | |
Net increase (decrease) in shares outstanding before conversion | | | 5,861 | | | | 44,974 | |
Shares reacquired upon conversion into other share class(es) | | | (58,037 | ) | | | (663,567 | ) |
| | | | | | | | |
Net increase (decrease) in shares outstanding | | | (52,176 | ) | | $ | (618,593 | ) |
| | | | | | | | |
Year ended October 31, 2018: | | | | | | | | |
Shares sold | | | 30,840 | | | $ | 362,143 | |
Shares reacquired | | | (20,870 | ) | | | (229,131 | ) |
| | | | | | | | |
Net increase (decrease) in shares outstanding before conversion | | | 9,970 | | | | 133,012 | |
Shares reacquired upon conversion into other share class(es) | | | (1,961 | ) | | | (22,185 | ) |
| | | | | | | | |
Net increase (decrease) in shares outstanding | | | 8,009 | | | $ | 110,827 | |
| | | | | | | | |
Class Z | | | | | | |
Year ended October 31, 2019: | | | | | | | | |
Shares sold | | | 161,778 | | | $ | 1,824,507 | |
Shares reacquired | | | (99,711 | ) | | | (1,124,987 | ) |
| | | | | | | | |
Net increase (decrease) in shares outstanding before conversion | | | 62,067 | | | | 699,520 | |
Shares issued upon conversion from other share class(es) | | | 3,723 | | | | 41,934 | |
| | | | | | | | |
Net increase (decrease) in shares outstanding | | | 65,790 | | | $ | 741,454 | |
| | | | | | | | |
Year ended October 31, 2018: | | | | | | | | |
Shares sold | | | 99,645 | | | $ | 1,202,559 | |
Shares reacquired | | | (64,853 | ) | | | (740,733 | ) |
| | | | | | | | |
Net increase (decrease) in shares outstanding before conversion | | | 34,792 | | | | 461,826 | |
Shares issued upon conversion from other share class(es) | | | 3,814 | | | | 45,121 | |
| | | | | | | | |
Net increase (decrease) in shares outstanding | | | 38,606 | | | $ | 506,947 | |
| | | | | | | | |
Class R6 | | | | | | |
Year ended October 31, 2019: | | | | | | | | |
Net increase (decrease) in shares outstanding | | | — | | | $ | — | |
| | | | | | | | |
Year ended October 31, 2018: | | | | | | | | |
Net increase (decrease) in shares outstanding | | | — | | | $ | — | |
| | | | | | | | |
7. Borrowings
The Fund, on behalf of the Series, along with other affiliated registered investment companies (the “Funds”), is a party to a Syndicated Credit Agreement (“SCA”) with a group of banks. The purpose of the SCA is to provide an alternative source of temporary funding for capital share redemptions. The table below provides details of the current SCA in effect at the reportingperiod-end as well as the prior SCA.
| | | | |
| | | Current SCA | | Prior SCA |
| Term of Commitment | | 10/3/2019 – 10/1/2020 | | 10/4/2018 – 10/2/2019 |
| Total Commitment | | $ 900 million | | $ 900 million |
| Annualized Commitment Fee on the Unused Portion of the SCA | | 0.15% | | 0.15% |
| | | | |
| | | Current SCA | | Prior SCA |
| Annualized Interest Rate on Borrowings | | 1.20% plus the higher of (1) the effective federal funds rate, (2) theone-month LIBOR rate or (3) zero percent | | 1.25% plus the higher of (1) the effective federal funds rate, (2) theone-month LIBOR rate or (3) zero percent |
Certain affiliated registered investment companies that are parties to the SCA include portfolios that are subject to a predetermined mathematical formula used to manage certain benefit guarantees offered under variable annuity contracts. The formula may result in large scale asset flows into and out of these portfolios. Consequently, these portfolios may be more likely to utilize the SCA for purposes of funding redemptions. It may be possible for those portfolios to fully exhaust the committed amount of the SCA, thereby requiring the Manager to allocate available funding per a Board-approved methodology designed to treat the Funds in the SCA equitably.
The Series did not utilize the SCA during the year ended October 31, 2019.
8. Risks of Investing in the Series
The Series’ risks include, but are not limited to, some or all of the risks discussed below:
Emerging Markets Risk:The risks of foreign investments are greater for investments in or exposed to emerging markets. Emerging market countries typically have economic and political systems that are less fully developed, and can be expected to be less stable, than those of more developed countries. For example, the economies of such countries can be subject to rapid and unpredictable rates of inflation or deflation. Low trading volumes may result in a lack of liquidity and price volatility.
Equity and Equity-Related Securities Risks:The value of a particular security could go down and you could lose money. In addition to an individual security losing value, the value of the equity markets or a sector in which the Series invests could go down. The Series’ holdings can vary significantly from broad market indexes and the performance of the Series can deviate from the performance of these indexes. Different parts of a market can react differently to adverse issuer, market, regulatory, political and economic developments.
Foreign Securities Risk:The Series’ investments in securities of foreign issuers or issuers with significant exposure to foreign markets involve additional risk. Foreign countries in which the Series may invest may have markets that are less liquid, less regulated and more volatile than US markets. The value of the Series’ investments may decline because of factors affecting the particular issuer as well as foreign markets and issuers generally, such as unfavorable government actions, and political or financial instability.
Geographic Concentration Risk:The Series’ performance may be closely tied to the market, economic, political, regulatory or other conditions in the countries or regions in which the
| | | | |
| PGIM Jennison Emerging Markets Equity Opportunities Fund | | | 37 | |
Notes to Financial Statements(continued)
Series invests. This can result in more pronounced risks based upon conditions that impact one or more countries or regions more or less than other countries or regions.
Market and Credit Risk:Securities markets may be volatile and the market prices of the Series’ securities may decline. Securities fluctuate in price based on changes in an issuer’s financial condition and overall market and economic conditions. If the market prices of the securities owned by the Series fall, the value of an investment in the Series will decline. Additionally, the Series may also be exposed to credit risk in the event that an issuer or guarantor fails to perform or that an institution or entity with which the Series has unsettled or open transactions defaults.
9. Recent Accounting Pronouncements and Reporting Updates
In August 2018, the FASB issued Accounting Standards Update (“ASU”)No. 2018-13, which changes certain fair value measurement disclosure requirements. The new ASU, in addition to other modifications and additions, removes the requirement to disclose the amount and reasons for transfers between Level 1 and Level 2 of the fair value hierarchy, and the Series’ policy for the timing of transfers between levels. The amendments are effective for financial statements issued for fiscal years beginning after December 15, 2019, and interim periods within those fiscal years. The Manager has evaluated the implications of certain provisions of the ASU and has determined to early adopt aspects related to the removal and modification of certain fair value measurement disclosures under the ASU effective immediately. The Manager continues to evaluate certain other provisions of the ASU and does not expect a material impact to financial statement disclosures.
Financial Highlights
| | | | | | | | | | | | | | | | | | | | |
| Class A Shares | | | | | | | | | | | | | | | |
| | | Year Ended October 31, | |
| | | 2019 | | | 2018 | | | 2017 | | | 2016 | | | 2015 | |
| Per Share Operating Performance(a): | | | | | | | | | | | | | | | | | | | | |
| Net Asset Value, Beginning of Year | | | $9.58 | | | | $11.19 | | | | $9.34 | | | | $8.81 | | | | $10.09 | |
| Income (loss) from investment operations: | | | | | | | | | | | | | | | | | | | | |
| Net investment income (loss) | | | (0.04 | ) | | | (0.04 | ) | | | (0.04 | ) | | | (0.04 | ) | | | (0.04 | ) |
| Net realized and unrealized gain (loss) on investment and foreign currency transactions | | | 2.62 | | | | (1.57 | ) | | | 1.89 | | | | 0.57 | | | | (1.24 | ) |
| Total from investment operations | | | 2.58 | | | | (1.61 | ) | | | 1.85 | | | | 0.53 | | | | (1.28 | ) |
| Net asset value, end of year | | | $12.16 | | | | $9.58 | | | | $11.19 | | | | $9.34 | | | | $8.81 | |
| Total Return(b): | | | 26.93% | | | | (14.39)% | | | | 19.81% | | | | 6.02% | | | | (12.69)% | |
| |
| Ratios/Supplemental Data: | |
| Net assets, end of year (000) | | | $3,806 | | | | $2,316 | | | | $2,204 | | | | $869 | | | | $311 | |
| Average net assets (000) | | | $3,074 | | | | $2,956 | | | | $1,363 | | | | $528 | | | | $208 | |
| Ratios to average net assets(c)(d): | | | | | | | | | | | | | | | | | | | | |
| Expenses after waivers and/or expense reimbursement | | | 1.45% | | | | 1.45% | | | | 1.45% | | | | 1.45% | | | | 1.54% | |
| Expenses before waivers and/or expense reimbursement | | | 3.35% | | | | 3.27% | | | | 3.28% | | | | 3.87% | | | | 3.40% | |
| Net investment income (loss) | | | (0.37)% | | | | (0.35)% | | | | (0.35)% | | | | (0.49)% | | | | (0.48)% | |
| Portfolio turnover rate(e) | | | 33% | | | | 23% | | | | 45% | | | | 44% | | | | 67% | |
| (a) | Calculated based on average shares outstanding during the year. |
| (b) | Total return does not consider the effects of sales loads. Total return is calculated assuming a purchase of a share on the first day and a sale on the last day of each year reported and includes reinvestment of dividends and distributions, if any. Total returns may reflect adjustments to conform to generally accepted accounting principles. |
| (c) | Does not include expenses of the underlying funds in which the Series invests. |
| (d) | Effective November 1, 2017, class specific expenses include transfer agent fees and expenses and registration fees, which are charged to their respective share class. |
| (e) | The Series’ portfolio turnover rate is calculated in accordance with regulatory requirements, without regard to transactions involving short-term investments and certain derivatives. If such transactions were included, the Series’ portfolio turnover rate may be higher. |
See Notes to Financial Statements.
| | | | |
| PGIM Jennison Emerging Markets Equity Opportunities Fund | | | 39 | |
Financial Highlights (continued)
| | | | | | | | | | | | | | | | | | | | |
| Class C Shares | |
| | | Year Ended October 31, | |
| | | 2019 | | | 2018 | | | 2017 | | | 2016 | | | 2015 | |
| Per Share Operating Performance(a): | | | | | | | | | | | | | | | | | | | | |
| Net Asset Value, Beginning of Year | | | $9.29 | | | | $10.93 | | | | $9.20 | | | | $8.74 | | | | $10.08 | |
| Income (loss) from investment operations: | | | | | | | | | | | | | | | | | | | | |
| Net investment income (loss) | | | (0.11 | ) | | | (0.13 | ) | | | (0.11 | ) | | | (0.11 | ) | | | (0.13 | ) |
| Net realized and unrealized gain (loss) on investment and foreign currency transactions | | | 2.53 | | | | (1.51 | ) | | | 1.84 | | | | 0.57 | | | | (1.21 | ) |
| Total from investment operations | | | 2.42 | | | | (1.64 | ) | | | 1.73 | | | | 0.46 | | | | (1.34 | ) |
| Net asset value, end of year | | | $11.71 | | | | $9.29 | | | | $10.93 | | | | $9.20 | | | | $8.74 | |
| Total Return(b): | | | 26.05% | | | | (15.00)% | | | | 18.80% | | | | 5.26% | | | | (13.29)% | |
| |
| Ratios/Supplemental Data: | |
| Net assets, end of year (000) | | | $1,107 | | | | $1,363 | | | | $1,516 | | | | $734 | | | | $662 | |
| Average net assets (000) | | | $1,438 | | | | $1,775 | | | | $973 | | | | $672 | | | | $699 | |
| Ratios to average net assets(c)(d): | | | | | | | | | | | | | | | | | | | | |
| Expenses after waivers and/or expense reimbursement | | | 2.20% | | | | 2.20% | | | | 2.20% | | | | 2.20% | | | | 2.29% | |
| Expenses before waivers and/or expense reimbursement | | | 4.23% | | | | 4.20% | | | | 4.00% | | | | 4.62% | | | | 4.12% | |
| Net investment income (loss) | | | (1.05)% | | | | (1.14)% | | | | (1.17)% | | | | (1.29)% | | | | (1.36)% | |
| Portfolio turnover rate(e) | | | 33% | | | | 23% | | | | 45% | | | | 44% | | | | 67% | |
| (a) | Calculated based on average shares outstanding during the year. |
| (b) | Total return does not consider the effects of sales loads. Total return is calculated assuming a purchase of a share on the first day and a sale on the last day of each year reported and includes reinvestment of dividends and distributions, if any. Total returns may reflect adjustments to conform to generally accepted accounting principles. |
| (c) | Does not include expenses of the underlying funds in which the Series invests. |
| (d) | Effective November 1, 2017, class specific expenses include transfer agent fees and expenses and registration fees, which are charged to their respective share class. |
| (e) | The Series’ portfolio turnover rate is calculated in accordance with regulatory requirements, without regard to transactions involving short-term investments and certain derivatives. If such transactions were included, the Series’ portfolio turnover rate may be higher. |
See Notes to Financial Statements.
| | | | | | | | | | | | | | | | | | | | |
| Class Z Shares | |
| | | Year Ended October 31, | |
| | | 2019 | | | 2018 | | | 2017 | | | 2016 | | | 2015 | |
| Per Share Operating Performance(a): | | | | | | | | | | | | | | | | | | | | |
| Net Asset Value, Beginning of Year | | | $9.67 | | | | $11.27 | | | | $9.39 | | | | $8.82 | | | | $10.09 | |
| Income (loss) from investment operations: | | | | | | | | | | | | | | | | | | | | |
| Net investment income (loss) | | | (0.01 | ) | | | (0.01 | ) | | | (0.02 | ) | | | (0.03 | ) | | | (0.04 | ) |
| Net realized and unrealized gain (loss) on investment and foreign currency transactions | | | 2.65 | | | | (1.59 | ) | | | 1.90 | | | | 0.60 | | | | (1.23 | ) |
| Total from investment operations | | | 2.64 | | | | (1.60 | ) | | | 1.88 | | | | 0.57 | | | | (1.27 | ) |
| Net asset value, end of year | | | $12.31 | | | | $9.67 | | | | $11.27 | | | | $9.39 | | | | $8.82 | |
| Total Return(b): | | | 27.30% | | | | (14.20)% | | | | 20.02% | | | | 6.46% | | | | (12.59)% | |
| |
| Ratios/Supplemental Data: | |
| Net assets, end of year (000) | | | $2,357 | | | | $1,215 | | | | $980 | | | | $183 | | | | $60 | |
| Average net assets (000) | | | $1,866 | | | | $1,443 | | | | $490 | | | | $102 | | | | $17 | |
| Ratios to average net assets(c)(d): | | | | | | | | | | | | | | | | | | | | |
| Expenses after waivers and/or expense reimbursement | | | 1.20% | | | | 1.20% | | | | 1.20% | | | | 1.20% | | | | 1.29% | |
| Expenses before waivers and/or expense reimbursement | | | 3.17% | | | | 3.56% | | | | 2.94% | | | | 3.55% | | | | 3.48% | |
| Net investment income (loss) | | | (0.08)% | | | | (0.13)% | | | | (0.19)% | | | | (0.31)% | | | | (0.44)% | |
| Portfolio turnover rate(e) | | | 33% | | | | 23% | | | | 45% | | | | 44% | | | | 67% | |
| (a) | Calculated based on average shares outstanding during the year. |
| (b) | Total return is calculated assuming a purchase of a share on the first day and a sale on the last day of each year reported and includes reinvestment of dividends and distributions, if any. Total returns may reflect adjustments to conform to generally accepted accounting principles. |
| (c) | Does not include expenses of the underlying funds in which the Series invests. |
| (d) | Effective November 1, 2017, class specific expenses include transfer agent fees and expenses and registration fees, which are charged to their respective share class. |
| (e) | The Series’ portfolio turnover rate is calculated in accordance with regulatory requirements, without regard to transactions involving short-term investments and certain derivatives. If such transactions were included, the Series’ portfolio turnover rate may be higher. |
See Notes to Financial Statements.
| | | | |
| PGIM Jennison Emerging Markets Equity Opportunities Fund | | | 41 | |
Financial Highlights(continued)
| | | | | | | | | | | | | | | | | | | | |
| Class R6 Shares | |
| | | Year Ended October 31, | |
| | | 2019 | | | 2018 | | | 2017 | | | 2016 | | | 2015 | |
| Per Share Operating Performance(a): | | | | | | | | | | | | | | | | | | | | |
| Net Asset Value, Beginning of Year | | | $9.67 | | | | $11.27 | | | | $9.39 | | | | $8.83 | | | | $10.09 | |
| Income (loss) from investment operations: | | | | | | | | | | | | | | | | | | | | |
| Net investment income (loss) | | | (0.01 | ) | | | (0.02 | ) | | | (0.01 | ) | | | (0.03 | ) | | | (0.04 | ) |
| Net realized and unrealized gain (loss) on investment and foreign currency transactions | | | 2.65 | | | | (1.58 | ) | | | 1.89 | | | | 0.59 | | | | (1.21 | ) |
| Total from investment operations | | | 2.64 | | | | (1.60 | ) | | | 1.88 | | | | 0.56 | | | | (1.25 | ) |
| Less Dividends and Distributions: | | | | | | | | | | | | | | | | | | | | |
| Dividends from net investment income | | | - | | | | - | | | | - | | | | - | | | | (0.01 | ) |
| Net asset value, end of year | | | $12.31 | | | | $9.67 | | | | $11.27 | | | | $9.39 | | | | $8.83 | |
| Total Return(b): | | | 27.30% | | | | (14.20)% | | | | 20.02% | | | | 6.34% | | | | (12.44)% | |
| |
| Ratios/Supplemental Data: | |
| Net assets, end of year (000) | | | $12,319 | | | | $9,675 | | | | $11,271 | | | | $9,404 | | | | $8,840 | |
| Average net assets (000) | | | $11,249 | | | | $11,852 | | | | $9,893 | | | | $8,722 | | | | $9,518 | |
| Ratios to average net assets(c)(d): | | | | | | | | | | | | | | | | | | | | |
| Expenses after waivers and/or expense reimbursement | | | 1.20% | | | | 1.20% | | | | 1.20% | | | | 1.20% | | | | 1.29% | |
| Expenses before waivers and/or expense reimbursement | | | 2.41% | | | | 2.32% | | | | 2.78% | | | | 3.13% | | | | 2.91% | |
| Net investment income (loss) | | | (0.11)% | | | | (0.17)% | | | | (0.13)% | | | | (0.29)% | | | | (0.40)% | |
| Portfolio turnover rate(e) | | | 33% | | | | 23% | | | | 45% | | | | 44% | | | | 67% | |
| (a) | Calculated based on average shares outstanding during the year. |
| (b) | Total return is calculated assuming a purchase of a share on the first day and a sale on the last day of each year reported and includes reinvestment of dividends and distributions, if any. Total returns may reflect adjustments to conform to generally accepted accounting principles. |
| (c) | Does not include expenses of the underlying funds in which the Series invests. |
| (d) | Effective November 1, 2017, class specific expenses include transfer agent fees and expenses and registration fees, which are charged to their respective share class. |
| (e) | The Series’ portfolio turnover rate is calculated in accordance with regulatory requirements, without regard to transactions involving short-term investments and certain derivatives. If such transactions were included, the Series’ portfolio turnover rate may be higher. |
See Notes to Financial Statements.
Report of Independent Registered Public
Accounting Firm
To the Shareholders of PGIM Jennison Emerging Markets Equity Opportunities Fund and Board of Directors
Prudential World Fund, Inc.:
Opinion on the Financial Statements
We have audited the accompanying statement of assets and liabilities of PGIM Jennison Emerging Markets Equity Opportunities Fund, a series of Prudential World Fund, Inc., (the Fund), including the schedule of investments, as of October 31, 2019, the related statement of operations for the year then ended, the statements of changes in net assets for each of the years in thetwo-year period ended October 31, 2019, and the related notes (collectively, the financial statements) and the financial highlights for the years indicated therein. In our opinion, the financial statements and financial highlights present fairly, in all material respects, the financial position of the Fund as of October 31, 2019, the results of its operations for the year then ended, the changes in its net assets for each of the years in thetwo-year period ended October 31, 2019, and the financial highlights for the years indicated therein, in conformity with U.S. generally accepted accounting principles.
Basis for Opinion
These financial statements and financial highlights are the responsibility of the Fund’s management. Our responsibility is to express an opinion on these financial statements and financial highlights based on our audits. We are a public accounting firm registered with the Public Company Accounting Oversight Board (United States) (PCAOB) and are required to be independent with respect to the Fund in accordance with the U.S. federal securities laws and the applicable rules and regulations of the Securities and Exchange Commission and the PCAOB.
We conducted our audits in accordance with the standards of the PCAOB. Those standards require that we plan and perform the audit to obtain reasonable assurance about whether the financial statements and financial highlights are free of material misstatement, whether due to error or fraud. Our audits included performing procedures to assess the risks of material misstatement of the financial statements and financial highlights, whether due to error or fraud, and performing procedures that respond to those risks. Such procedures included examining, on a test basis, evidence regarding the amounts and disclosures in the financial statements and financial highlights. Such procedures also included confirmation of securities owned as of October 31, 2019, by correspondence with the custodian, transfer agent, and brokers, or by other appropriate auditing procedures when replies were not received. Our audits also included evaluating the accounting principles used and significant estimates made by management, as well as evaluating the overall presentation of the financial statements and financial highlights. We believe that our audits provide a reasonable basis for our opinion.

We have served as the auditor of one or more PGIM and/or Prudential Retail investment companies since 2003.
New York, New York
December 19, 2019
| | | | |
| PGIM Jennison Emerging Markets Equity Opportunities Fund | | | 43 | |
INFORMATION ABOUT BOARD MEMBERS AND OFFICERS(unaudited)
Information about Board Members and Officers of the Fund is set forth below. Board Members who are not deemed to be “interested persons” of the Fund, as defined in the 1940 Act, are referred to as “Independent Board Members.” Board Members who are deemed to be “interested persons” of the Fund are referred to as “Interested Board Members.” The Board Members are responsible for the overall supervision of the operations of the Fund and perform the various duties imposed on the directors of investment companies by the 1940 Act. The Board in turn elects the Officers, who are responsible for administering theday-to-day operations of the Fund.
| | | | | | |
| Independent Board Members | | | | |
| | | | |
Name Date of Birth Position(s) Portfolios Overseen | | Principal Occupation(s) During Past Five Years | | Other Directorships Held During Past Five Years | | Length of Board Service |
| | | | |
Ellen S. Alberding 3/11/58 Board Member Portfolios Overseen: 96 | | President and Board Member, The Joyce Foundation (charitable foundation) (since 2002); Vice Chair, City Colleges of Chicago (community college system) (2011-2015); Trustee, National Park Foundation (charitable foundation for national park system) (2009-2018); Trustee, Economic Club of Chicago (since 2009); Trustee, Loyola University (since 2018). | | None. | | Since September 2013 |
| | | | |
Kevin J. Bannon 7/13/52 Board Member Portfolios Overseen: 96 | | Retired; Managing Director (April2008-May 2015) and Chief Investment Officer (October 2008-November 2013) of Highmount Capital LLC (registered investment adviser); formerly Executive Vice President and Chief Investment Officer (April 1993-August 2007) of Bank of New York Company; President (May2003-May 2007) of BNY Hamilton Family of Mutual Funds. | | Director of Urstadt Biddle Properties (equity real estate investment trust) (since September 2008). | | Since July 2008 |
PGIM Jennison Emerging Markets Equity Opportunities Fund
| | | | | | |
| Independent Board Members | | | | |
| | | | |
Name Date of Birth Position(s) Portfolios Overseen | | Principal Occupation(s) During Past Five Years | | Other Directorships Held During Past Five Years | | Length of Board Service |
| | | | |
Linda W. Bynoe 7/9/52 Board Member Portfolios Overseen: 96 | | President and Chief Executive Officer (since March 1995) and formerly Chief Operating Officer (December 1989-February 1995) of Telemat Ltd. (management consulting); formerly Vice President (January 1985-June 1989) at Morgan Stanley & Co. (broker-dealer). | | Director of Anixter International, Inc. (communication products distributor) (since January 2006); Director of Northern Trust Corporation (financial services) (since April 2006); Trustee of Equity Residential (residential real estate) (since December 2009). | | Since March 2005 |
| | | | |
Barry H. Evans 11/2/60 Board Member Portfolios Overseen: 95 | | Retired; formerly President (2005 – 2016), Global Chief Operating Officer (2014– 2016), Chief Investment Officer – Global Head of Fixed Income (1998-2014), and various portfolio manager roles (1986-2006), Manulife Asset Management U.S. | | Formerly Director, Manulife Trust Company (2011-2018); formerly Director, Manulife Asset Management Limited (2015-2017); formerly Chairman of the Board of Directors of Manulife Asset Management U.S. (2005-2016); formerly Chairman of the Board, Declaration Investment Management and Research (2008-2016). | | Since September 2017 |
| | | | |
Keith F. Hartstein 10/13/56 Board Member & Independent Chair Portfolios Overseen: 96 | | Retired; Member (since November 2014) of the Governing Council of the Independent Directors Council (organization of independent mutual fund directors); formerly President and Chief Executive Officer (2005-2012), Senior Vice President (2004-2005), Senior Vice President of Sales and Marketing (1997-2004), and various executive management positions (1990-1997), John Hancock Funds, LLC (asset management); Chairman, Investment Company Institute’s Sales Force Marketing Committee (2003-2008). | | None. | | Since September 2013 |
Visit our website at pgiminvestments.com
| | | | | | |
| Independent Board Members | | | | |
| | | | |
Name Date of Birth Position(s) Portfolios Overseen | | Principal Occupation(s) During Past Five Years | | Other Directorships Held During Past Five Years | | Length of Board Service |
| | | | |
Laurie Simon Hodrick 9/29/62 Board Member Portfolios Overseen: 95 | | A. Barton Hepburn Professor Emerita of Economics in the Faculty of Business, Columbia Business School (since 2018); Visiting Professor of Law, Stanford Law School (since 2015); Visiting Fellow at the Hoover Institution, Stanford University (since 2015); Sole Member, ReidCourt LLC (since 2008) (a consulting firm); formerly A. Barton Hepburn Professor of Economics in the Faculty of Business, Columbia Business School (1996-2017); formerly Managing Director, Global Head of Alternative Investment Strategies, Deutsche Bank (2006-2008). | | Independent Director, Synnex Corporation (since April 2019) (information technology); Independent Director, Kabbage, Inc. (since July 2018) (financial services); Independent Director, Corporate Capital Trust (2017-2018) (a business development company). | | Since September 2017 |
| | | | |
Michael S. Hyland, CFA 10/4/45 Board Member Portfolios Overseen: 96 | | Retired (since February 2005); formerly Senior Managing Director (July 2001-February 2005) of Bear Stearns & Co, Inc.; Global Partner, INVESCO (1999-2001); Managing Director and President of Salomon Brothers Asset Management (1989-1999). | | None. | | Since July 2008 |
| | | | |
Brian K. Reid 9/22/61 Board Member Portfolios Overseen: 95 | | Retired; formerly Chief Economist for the Investment Company Institute (ICI) (2005-2017); formerly Senior Economist and Director of Industry and Financial Analysis at the ICI (1998-2004); formerly Senior Economist, Industry and Financial Analysis at the ICI (1996-1998); formerly Staff Economist at the Federal Reserve Board (1989-1996); Director, ICI Mutual Insurance Company (2012-2017). | | None. | | Since March 2018 |
PGIM Jennison Emerging Markets Equity Opportunities Fund
| | | | | | |
| Independent Board Members | | | | |
| | | | |
Name Date of Birth Position(s) Portfolios Overseen | | Principal Occupation(s) During Past Five Years | | Other Directorships Held During Past Five Years | | Length of Board Service |
| | | | |
Grace C. Torres 6/28/59 Board Member Portfolios Overseen: 95 | | Retired; formerly Treasurer and Principal Financial and Accounting Officer of the PGIM Funds, Target Funds, Advanced Series Trust, Prudential Variable Contract Accounts and The Prudential Series Fund (1998-June 2014); Assistant Treasurer (March 1999-June 2014) and Senior Vice President (September 1999-June 2014) of PGIM Investments LLC; Assistant Treasurer (May 2003-June 2014) and Vice President (June 2005-June 2014) of AST Investment Services, Inc.; Senior Vice President and Assistant Treasurer (May 2003-June 2014) of Prudential Annuities Advisory Services, Inc. | | Formerly Director (July 2015-January 2018) of Sun Bancorp, Inc. N.A. and Sun National Bank; Director (since January 2018) of OceanFirst Financial Corp. and OceanFirst Bank. | | Since November 2014 |
| | | | | | |
| Interested Board Members | | | | | | |
| | | | |
Name Date of Birth Position(s) Portfolios Overseen | | Principal Occupation(s) During Past Five Years | | Other Directorships Held During Past Five Years | | Length of Board Service |
| | | | |
Stuart S. Parker 10/5/62 Board Member & President Portfolios Overseen: 96 | | President of PGIM Investments LLC (formerly known as Prudential Investments LLC) (since January 2012); Executive Vice President of Prudential Investment Management Services LLC (since December 2012); formerly Executive Vice President of Jennison Associates LLC and Head of Retail Distribution of PGIM Investments LLC (June 2005-December 2011). | | None. | | Since January 2012 |
Visit our website at pgiminvestments.com
| | | | | | |
| Interested Board Members | | | | | | |
| | | | |
Name Date of Birth Position(s) Portfolios Overseen | | Principal Occupation(s) During Past Five Years | | Other Directorships Held During Past Five Years | | Length of Board Service |
| | | | |
Scott E. Benjamin 5/21/73 Board Member & Vice President Portfolios Overseen:96 | | Executive Vice President (since June 2009) of PGIM Investments LLC; Executive Vice President (June 2009-June 2012) and Vice President (since June 2012) of Prudential Investment Management Services LLC; Executive Vice President (since September 2009) of AST Investment Services, Inc.; Senior Vice President of Product Development and Marketing, PGIM Investments (since February 2006); formerly Vice President of Product Development and Product Management, PGIM Investments LLC (2003-2006). | | None. | | Since March 2010 |
| | | | |
| Fund Officers(a) | | | | |
| | | |
Name Date of Birth Fund Position | | Principal Occupation(s) During Past Five Years | | Length of Service as Fund Officer |
| | | |
Raymond A. O’Hara 9/11/55 Chief Legal Officer | | Vice President and Corporate Counsel (since July 2010) of Prudential Insurance Company of America (Prudential); Vice President (March 2011-Present) of Pruco Life Insurance Company and Pruco Life Insurance Company of New Jersey; Vice President and Corporate Counsel (March 2011-Present) of Prudential Annuities Life Assurance Corporation; Chief Legal Officer of PGIM Investments LLC (since June 2012); Chief Legal Officer of Prudential Mutual Fund Services LLC (since June 2012) and Corporate Counsel of AST Investment Services, Inc. (since June 2012); formerly Assistant Vice President and Corporate Counsel (September 2008-July 2010) of The Hartford Financial Services Group, Inc.; formerly Associate (September 1980-December 1987) and Partner (January 1988–August 2008) of Blazzard & Hasenauer, P.C. (formerly, Blazzard, Grodd & Hasenauer, P.C.). | | Since June 2012 |
PGIM Jennison Emerging Markets Equity Opportunities Fund
| | | | |
Fund Officers(a) | | | | |
| | | |
Name Date of Birth Fund Position | | Principal Occupation(s) During Past Five Years | | Length of Service as Fund Officer |
| | | |
Dino Capasso 8/19/74 Chief Compliance Officer | | Chief Compliance Officer (July 2019-Present) of PGIM Investments LLC; Chief Compliance Officer (July 2019-Present) of the PGIM Funds, Target Funds, Advanced Series Trust, The Prudential Series Fund, Prudential’s Gibraltar Fund, Inc., PGIM Global High Yield Fund, Inc., and PGIM High Yield Bond Fund, Inc.; Vice President and Deputy Chief Compliance Officer (June 2017-2019) of PGIM Investments LLC; formerly, Senior Vice President and Senior Counsel (January 2016-June 2017), and Vice President and Counsel (February 2012-December 2015) of Pacific Investment Management Company LLC. | | Since March 2018 |
| | | |
Andrew R. French 12/22/62 Secretary | | Vice President of PGIM Investments LLC (December 2018-Present); formerly Vice President and Corporate Counsel (February 2010-December 2018) of Prudential; formerly Director and Corporate Counsel (2006-2010) of Prudential; Vice President and Assistant Secretary (since January 2007) of PGIM Investments LLC; Vice President and Assistant Secretary (since January 2007) of Prudential Mutual Fund Services LLC. | | Since October 2006 |
| | | |
Jonathan D. Shain 8/9/58 Assistant Secretary | | Vice President and Corporate Counsel (since August 1998) of Prudential; Vice President and Assistant Secretary (since May 2001) of PGIM Investments LLC; Vice President and Assistant Secretary (since February 2001) of Prudential Mutual Fund Services LLC; formerly Vice President and Assistant Secretary (May 2003-June 2005) of AST Investment Services, Inc. | | Since May 2005 |
| | | |
Claudia DiGiacomo 10/14/74 Assistant Secretary | | Vice President and Corporate Counsel (since January 2005) of Prudential; Vice President and Assistant Secretary of PGIM Investments LLC (since December 2005); formerly Associate at Sidley Austin Brown & Wood LLP (1999-2004). | | Since December 2005 |
| | | |
Diana N. Huffman 4/14/82 Assistant Secretary | | Vice President and Corporate Counsel (since September 2015) of Prudential; formerly Associate at Willkie Farr & Gallagher LLP (2009-2015). | | Since March 2019 |
| | | |
Kelly A. Coyne 8/8/68 Assistant Secretary | | Director, Investment Operations of Prudential Mutual Fund Services LLC (since 2010). | | Since March 2015 |
| | | |
Christian J. Kelly 5/5/75 Treasurer and Principal Financial and Accounting Officer | | Vice President, Head of Fund Administration of PGIM Investments LLC (since November 2018); formerly, Director of Fund Administration of Lord Abbett & Co. LLC (2009-2018), Treasurer and Principal Accounting Officer of the Lord Abbett Family of Funds (2017-2018); Director of Accounting, Avenue Capital Group (2008-2009); Senior Manager, Investment Management Practice of Deloitte & Touche LLP (1998-2007). | | Since January 2019 |
Visit our website at pgiminvestments.com
| | | | |
Fund Officers(a) | | | | |
| | | |
Name Date of Birth Fund Position | | Principal Occupation(s) During Past Five Years | | Length of Service as Fund Officer |
| | | |
Lana Lomuti 6/7/67 Assistant Treasurer | | Vice President (since 2007) and Director (2005-2007), within PGIM Investments Fund Administration; formerly Assistant Treasurer (December 2007-February 2014) of The Greater China Fund, Inc. | | Since April 2014 |
| | | |
Russ Shupak 10/08/73 Assistant Treasurer | | Vice President (since 2017) and Director (2013-2017), within PGIM Investments Fund Administration. | | Since October 2019 |
| | | |
Deborah Conway 3/26/69 Assistant Treasurer | | Vice President (since 2017) and Director (2007-2017), within PGIM Investments Fund Administration. | | Since October 2019 |
| | | |
Elyse M. McLaughlin 1/20/74 Assistant Treasurer | | Vice President (since 2017) and Director (2011-2017), within PGIM Investments Fund Administration. | | Since October 2019 |
| | | |
Charles H. Smith 1/11/73 Anti-Money Laundering Compliance Officer | | Vice President, Corporate Compliance, Anti-Money Laundering Unit (since January 2015) of Prudential; committee member of the American Council of Life Insurers Anti-Money Laundering and Critical Infrastructure Committee (since January 2016); formerly Global Head of Economic Sanctions Compliance at AIG Property Casualty (February 2007-December 2014); Assistant Attorney General at the New York State Attorney General’s Office, Division of Public Advocacy. (August 1998-January 2007). | | Since January 2017 |
(a) Excludes Mr. Parker and Mr. Benjamin, interested Board Members who also serve as President and Vice President, respectively.
Explanatory Notes to Tables:
| ∎ | Board Members are deemed to be “Interested,” as defined in the 1940 Act, by reason of their affiliation with PGIM Investments LLC and/or an affiliate of PGIM Investments LLC. |
| ∎ | Unless otherwise noted, the address of all Board Members and Officers is c/o PGIM Investments LLC, 655 Broad Street, Newark, New Jersey 07102-4410. |
| ∎ | There is no set term of office for Board Members or Officers. The Board Members have adopted a retirement policy, which calls for the retirement of Board Members on December 31 of the year in which they reach the age of 75. |
| ∎ | “Other Directorships Held” includes only directorships of companies required to register or file reports with the SEC under the 1934 Act (that is, “public companies”) or other investment companies registered under the 1940 Act. |
| ∎ | “Portfolios Overseen” includes all investment companies managed by PGIM Investments LLC. The investment companies for which PGIM Investments LLC serves as manager include the PGIM Funds, The Prudential Variable Contract Accounts, PGIM ETF Trust, PGIM High Yield Bond Fund, Inc., PGIM Global High Yield Fund, Inc., The Prudential Series Fund, Prudential’s Gibraltar Fund, Inc. and the Advanced Series Trust. |
PGIM Jennison Emerging Markets Equity Opportunities Fund
Approval of Advisory Agreements(unaudited)
The Fund’s Board of Trustees
The Board of Directors (the “Board”) of PGIM Jennison Emerging Markets Equity Opportunities Fund (the “Fund”)1 consists of eleven individuals, nine of whom are not “interested persons” of the Fund, as defined in the Investment Company Act of 1940, as amended (the “1940 Act”) (the “Independent Directors”).2 The Board is responsible for the oversight of the Fund and its operations, and performs the various duties imposed on the directors of investment companies by the 1940 Act. The Independent Directors have retained independent legal counsel to assist them in connection with their duties. The Chair of the Board is an Independent Director. The Board has established four standing committees: the Audit Committee, the Nominating and Governance Committee, and two Investment Committees. Each committee is chaired by, and composed of, Independent Directors.
Annual Approval of the Fund’s Advisory Agreements
As required under the 1940 Act, the Board determines annually whether to renew the Fund’s management agreement with PGIM Investments LLC (“PGIM Investments”) and the Fund’s subadvisory agreement with Jennison Associates LLC (“Jennison”). In considering the renewal of the agreements, the Board, including all of the Independent Directors, met on May 30, 2019 and on June11-13, 2019 and approved the renewal of the agreements through July 31, 2020, after concluding that the renewal of the agreements was in the best interests of the Fund and its shareholders.
In advance of the meetings, the Board requested and received materials relating to the agreements, and had the opportunity to ask questions and request further information in connection with its consideration. Among other things, the Board considered comparative fee information from PGIM Investments and Jennison. Also, the Board considered comparisons with other mutual funds in relevant Peer Universes and Peer Groups, as is further discussed below.
In approving the agreements, the Board, including the Independent Directors advised by independent legal counsel, considered the factors it deemed relevant, including the nature, quality and extent of services provided by PGIM Investments and the subadviser, the performance of the Fund, the profitability of PGIM Investments and its affiliates, expenses and fees, and the potential for economies of scale that may be shared with the Fund and its shareholders as the Fund’s assets grow. In their deliberations, the Directors did not identify any single factor which alone was responsible for the Board’s decision to approve the agreements with respect to the Fund. In connection with its deliberations, the Board
| 1 | PGIM Jennison Emerging Markets Equity Opportunities Fund is a series of Prudential World Fund, Inc. |
| 2 | Grace C. Torres was an Interested Director of the Fund at the time the Board considered and approved the renewal of the Fund’s advisory agreements, but has since become an Independent Director of the Fund. |
| | |
| PGIM Jennison Emerging Markets Equity Opportunities Fund |
Approval of Advisory Agreements (continued)
considered information provided by PGIM Investments throughout the year at regular Board meetings, presentations from portfolio managers and other information, as well as information furnished at or in advance of the meetings on May 30, 2019 and on June11-13, 2019.
The Directors determined that the overall arrangements between the Fund and PGIM Investments, which serves as the Fund’s investment manager pursuant to a management agreement, and between PGIM Investments and Jennison, which serves as the Fund’s subadviser pursuant to the terms of a subadvisory agreement with PGIM Investments, are in the best interests of the Fund and its shareholders in light of the services performed, fees charged and such other matters as the Directors considered relevant in the exercise of their business judgment.
The material factors and conclusions that formed the basis for the Directors’ determinations to approve the renewal of the agreements are discussed separately below.
Nature, Quality and Extent of Services
The Board received and considered information regarding the nature, quality and extent of services provided to the Fund by PGIM Investments and Jennison. The Board noted that Jennison is affiliated with PGIM Investments. The Board considered the services provided by PGIM Investments, including but not limited to the oversight of the subadviser for the Fund, as well as the provision of fund recordkeeping, compliance and other services to the Fund, and PGIM Investments’ role as administrator for the Fund’s liquidity risk management program. With respect to PGIM Investments’ oversight of the subadviser, the Board noted that PGIM Investments’ Strategic Investment Research Group (“SIRG”), a business unit of PGIM Investments, is responsible for monitoring and reporting to PGIM Investments’ senior management on the performance and operations of the subadviser. The Board also considered that PGIM Investments pays the salaries of all of the officers and interested Directors of the Fund who are part of Fund management. The Board also considered the investment subadvisory services provided by Jennison, including investment research and security selection, as well as compliance with the Fund’s investment restrictions, policies and procedures. The Board considered PGIM Investments’ evaluation of Jennison as well as PGIM Investments’ recommendation, based on its review of Jennison, to renew the subadvisory agreement.
The Board considered the qualifications, backgrounds and responsibilities of PGIM Investments’ senior management responsible for the oversight of the Fund and Jennison, and also considered the qualifications, backgrounds and responsibilities of Jennison’s portfolio managers who are responsible for theday-to-day management of the Fund’s portfolio. The Board was provided with information pertaining to PGIM Investments’ and Jennison’s organizational structure, senior management, investment operations, and other
| | |
| Visit our website at pgiminvestments.com | | |
relevant information pertaining to both PGIM Investments and Jennison. The Board also noted that it received favorable compliance reports from the Fund’s Chief Compliance Officer (“CCO”) as to both PGIM Investments and Jennison.
The Board concluded that it was satisfied with the nature, extent and quality of the investment management services provided by PGIM Investments and the subadvisory services provided to the Fund by Jennison, and that there was a reasonable basis on which to conclude that the Fund benefits from the services provided by PGIM Investments and Jennison under the management and subadvisory agreements.
Costs of Services and Profits Realized by PGIM Investments
The Board was provided with information on the profitability of PGIM Investments and its affiliates in serving as the Fund’s investment manager. The Board discussed with PGIM Investments the methodology utilized in assembling the information regarding profitability and considered its reasonableness. The Board recognized that it is difficult to make comparisons of profitability from fund management contracts because comparative information is not generally publicly available and is affected by numerous factors, including the structure of the particular adviser, the types of funds it manages, its business mix, numerous assumptions regarding allocations and the adviser’s capital structure and cost of capital. However, the Board considered that the cost of services provided by PGIM Investments for the year ended December 31, 2018 exceeded the management fees received by PGIM Investments, resulting in an operating loss to PGIM Investments. Taking these factors into account, the Board concluded that the profitability of PGIM Investments and its affiliates in relation to the services rendered was not unreasonable.
Economies of Scale
The Board received and discussed information concerning economies of scale that PGIM Investments may realize as the Fund’s assets grow beyond current levels. The Board noted that the management fee schedule for the Fund includes breakpoints, which have the effect of decreasing the fee rate as assets increase. During the course of time, the Board has considered information regarding the launch date of the Fund, the management fees of the Fund compared to those of similarly managed funds and PGIM Investments’ investment in the Fund over time. The Board took note that the Fund’s fee structure currently results in benefits to Fund shareholders whether or not PGIM Investments realizes any economies of scale. The Board noted that economies of scale can be shared with the Fund in other ways, including low management fees from inception, additional technological and personnel investments to enhance shareholder services, and maintaining existing expense structures in the face of a rising cost environment. The Board also considered PGIM Investments’ assertion that it continually evaluates the management fee schedule of the Fund and the potential to share economies of scale through breakpoints or fee waivers as asset levels increase.
| | |
| PGIM Jennison Emerging Markets Equity Opportunities Fund |
Approval of Advisory Agreements (continued)
The Board recognized the inherent limitations of any analysis of economies of scale, stemming largely from the Board’s understanding that most of PGIM Investments’ costs are not specific to individual funds, but rather are incurred across a variety of products and services.
Other Benefits to PGIM Investments and Jennison
The Board considered potential ancillary benefits that might be received by PGIM Investments and Jennison and their affiliates as a result of their relationship with the Fund. The Board concluded that potential benefits to be derived by PGIM Investments included transfer agency fees received by the Fund’s transfer agent (which is affiliated with PGIM Investments), as well as benefits to its reputation or other intangible benefits resulting from PGIM Investments’ association with the Fund. The Board concluded that the potential benefits to be derived by Jennison included its ability to use soft dollar credits, as well as the potential benefits consistent with those generally resulting from an increase in assets under management, specifically, potential access to additional research resources and benefits to its reputation. The Board concluded that the benefits derived by PGIM Investments and Jennison were consistent with the types of benefits generally derived by investment managers and subadvisers to mutual funds.
Performance of the Fund / Fees and Expenses
The Board considered certain additional factors and made related conclusions relating to the historical performance of the Fund for theone-and three-year periods ended December 31, 2018. The Board considered that the Fund commenced operations on September 16, 2014 and that longer-term performance was not yet available.
The Board also considered the Fund’s actual management fee, as well as the Fund’s net total expense ratio, for the fiscal year ended October 31, 2018. The Board considered the management fee for the Fund as compared to the management fee charged by PGIM Investments to other funds and the fee charged by other advisers to comparable mutual funds in a Peer Group. The actual management fee represents the fee rate actually paid by Fund shareholders and includes any fee waivers or reimbursements. The net total expense ratio for the Fund represents the actual expense ratio incurred by Fund shareholders.
The mutual funds included in the Peer Universe, which was used to consider performance, and the Peer Group, which was used to consider fees and expenses, were objectively determined by Broadridge, an independent provider of mutual fund data. In certain circumstances, PGIM Investments also provided supplemental Peer Universe or Peer Group information, for reasons addressed with the Board. The comparisons placed the Fund in various quartiles over various periods, with the first quartile being the best 25% of the mutual funds (for performance, the best performing mutual funds and, for expenses, the lowest cost mutual funds).
| | |
| Visit our website at pgiminvestments.com | | |
The section below summarizes key factors considered by the Board and the Board’s conclusions regarding the Fund’s performance, fees and overall expenses. The table sets forth net performance comparisons (which reflect the impact on performance of fund expenses, or any subsidies, expense caps or waivers that may be applicable) with the Peer Universe, actual management fees with the Peer Group (which reflect the impact of any subsidies or fee waivers), and net total expenses with the Peer Group, each of which were key factors considered by the Board.
| | | | | | | | |
| Net Performance | | 1 Year | | 3 Years | | 5 Years | | 10 Years |
| | 3rd Quartile | | 4th Quartile | | N/A | | N/A |
| Actual Management Fees:1st Quartile |
| Net Total Expenses: 2nd Quartile |
| | • | | The Board noted that the Fund underperformed its benchmark index over all periods. |
| | • | | The Board considered PGIM Investments’ assertion that the Fund’s emphasis on emerging market growth stocks relative to the benchmark index and peer universe was the cause of much of the Fund’s underperformance, as emerging market value stocks were preferred by investors during the second half of 2018. |
| | • | | In this regard, the Board also considered information provided by PGIM Investments indicating that, for theone-year period ended December 31, 2017, when emerging markets growth stocks were favored in the market, the Fund outperformed its benchmark index and ranked in the second quartile of its Peer Universe. |
| | • | | The Board also considered that the Fund outperformed its benchmark index and Peer Universe over the three-year period ended March 31, 2019. |
| | • | | The Board and PGIM Investments agreed to retain the Fund’s existing contractual expense cap, which (exclusive of certain fees and expenses) caps the Fund’s annual operating expenses at 1.45% for Class A shares, 2.20% for Class C shares, 1.20% for Class R6 shares, and 1.20% for Class Z shares through February 29, 2020. |
| | • | | In addition, PGIM Investments will waive management fees or shared operating expenses on any share class to the same extent that it waives such expenses on any other share class, and has agreed that total annual fund operating expenses for Class R6 shares will not exceed total annual fund operating expenses for Class Z shares. |
| | • | | The Board concluded that in light of the above, it would be in the best interests of the Fund and its shareholders to renew the agreements. |
| | • | | The Board concluded that the management fees (including subadvisory fees) and total expenses were reasonable in light of the services provided. |
* * *
After full consideration of these factors, the Board concluded that approval of the agreements was in the best interests of the Fund and its shareholders.
| | |
| PGIM Jennison Emerging Markets Equity Opportunities Fund |
| | | | |
| | |
| ∎ MAIL | | ∎ TELEPHONE | | ∎ WEBSITE |
655 Broad Street Newark, NJ 07102 | | (800) 225-1852 | | pgiminvestments.com |
|
| PROXY VOTING |
| The Board of Trustees of the Fund has delegated to the Fund’s subadviser the responsibility for voting any proxies and maintaining proxy recordkeeping with respect to the Fund. A description of these proxy voting policies and procedures is available without charge, upon request, by calling (800) 225-1852. Information regarding how the Fund voted proxies relating to portfolio securities during the most recent 12-month period ended June 30 is available on the Fund’s website and on the Securities and Exchange Commission’s website. |
|
DIRECTORS |
| Ellen S. Alberding• Kevin J. Bannon• Scott E. Benjamin• Linda W. Bynoe• Barry H. Evans • Keith F. Hartstein • Laurie Simon Hodrick• Michael S. Hyland• Stuart S. Parker• Brian K. Reid• Grace C. Torres |
|
| OFFICERS |
| Stuart S. Parker,President• Scott E. Benjamin,Vice President• Christian J. Kelly,Treasurer and Principal Financial and Accounting Officer• Raymond A. O’Hara,Chief Legal Officer• Dino Capasso,Chief Compliance Officer• Charles H. Smith,Anti-Money Laundering Compliance Officer• Andrew R. French,Secretary• Jonathan D. Shain,Assistant Secretary• Claudia DiGiacomo,Assistant Secretary• Diana N. Huffman,Assistant Secretary• Kelly A. Coyne,Assistant Secretary• Lana Lomuti,Assistant Treasurer• Russ Shupak,Assistant Treasurer• Elyse McLaughlin,Assistant Treasurer• Deborah Conway,Assistant Treasurer |
| | | | |
| MANAGER | | PGIM Investments LLC | | 655 Broad Street
Newark, NJ 07102 |
|
| SUBADVISER | | Jennison Associates LLC | | 466 Lexington Avenue
New York, NY 10017 |
|
| DISTRIBUTOR | | Prudential Investment
Management Services LLC | | 655 Broad Street
Newark, NJ 07102 |
|
| CUSTODIAN | | The Bank of New York Mellon | | 240 Greenwich Street
New York, NY 10286 |
|
| TRANSFER AGENT | | Prudential Mutual Fund
Services LLC | | PO Box 9658
Providence, RI 02940 |
|
INDEPENDENT REGISTERED
PUBLIC ACCOUNTING FIRM | | KPMG LLP | | 345 Park Avenue
New York, NY 10154 |
|
| FUND COUNSEL | | Willkie Farr & Gallagher LLP | | 787 Seventh Avenue
New York, NY 10019 |
|
|
| An investor should consider the investment objectives, risks, charges, and expenses of the Fund carefully before investing. The prospectus and summary prospectus contain this and other information about the Fund. An investor may obtain the prospectus and summary prospectus by visiting our website atpgiminvestments.com or by calling(800) 225-1852. The prospectus and summary prospectus should be read carefully before investing. |
|
| E-DELIVERY |
| To receive your mutual fund documents online, go topgiminvestments.com/edelivery and enroll. Instead of receiving printed documents by mail, you will receive notification via email when new materials are available. You can cancel your enrollment or change your email address at any time byvisiting the website address above. |
|
| SHAREHOLDER COMMUNICATIONS WITH DIRECTORS |
| Shareholders can communicate directly with the Board of Trustees by writing to the Chair of the Board, PGIM Jennison Emerging Markets Equity Opportunities Fund, PGIM Investments, Attn: Board of Directors, 655 Broad Street, Newark, NJ 07102. Shareholders can communicate directly with an individual Director by writing to the same address. Communications are not screened before being delivered to the addressee. |
|
| AVAILABILITY OF PORTFOLIO HOLDINGS |
| The Fund files its complete schedule of portfolio holdings with the Securities and Exchange Commission on Form N-PORT. The Fund’s Form N-PORT filings are available on the Commission’s website at sec.gov. Form N-PORT is filed with the Commission quarterly, and each Fund’s full portfolio holdings as of the first and third fiscal quarter-ends (as of the third month of the Fund’s fiscal quarter for reporting periods on or after September 30, 2019) will be made publicly available 60 days after the end of each quarter at sec.gov. |
|
| The Fund’s Statement of Additional Information contains additional information about the Fund’s Directors and is available without charge, upon request, by calling (800) 225-1852. |
Mutual Funds:
| | | | |
| ARE NOT INSURED BY THE FDIC OR ANY FEDERAL GOVERNMENT AGENCY | | MAY LOSE VALUE | | ARE NOT A DEPOSIT OF OR GUARANTEED BY ANY BANK OR ANY BANK AFFILIATE |
PGIM JENNISON EMERGING MARKETS EQUITY OPPORTUNITIES FUND
| | | | | | | | |
| SHARE CLASS | | A | | C | | Z | | R6 |
| NASDAQ | | PDEAX | | PDECX | | PDEZX | | PDEQX |
| CUSIP | | 743969644 | | 743969636 | | 743969610 | | 743969628 |
MF225E

PGIM JENNISON GLOBAL OPPORTUNITIES FUND
ANNUAL REPORT
OCTOBER 31, 2019
COMING SOON: PAPERLESS SHAREHOLDER REPORTS
Beginning on January 1, 2021, as permitted by regulations adopted by the Securities and Exchange Commission, paper copies of the Fund’s annual and semiannual shareholder reports will no longer be sent by mail, unless you specifically request paper copies of the reports. Instead, the reports will be made available on the Fund’s website (pgiminvestments.com), and you will be notified by mail each time a report is posted and provided with a website link to access the report.
If you already elected to receive shareholder reports electronically, you will not be affected by this change and you need not take any action. You may elect to receive shareholder reports and other communications from the Fund electronically anytime by contacting your financial intermediary (such as a broker-dealer or bank) or, if you are a direct investor, by calling 1-800-225-1852 or by sending an email request to PGIM Investments at shareholderreports@pgim.com.
You may elect to receive all future reports in paper free of charge. If you invest through a financial intermediary, you can contact your financial intermediary or follow instructions included with this notice to elect to continue to receive paper copies of your shareholder reports. If you invest directly with the Fund, you can call 1-800-225-1852 or send an email request to shareholderreports@pgim.com to let the Fund know you wish to continue receiving paper copies of your shareholder reports. Your election to receive reports in paper will apply to all funds held in your account if you invest through your financial intermediary or all funds held with the fund complex if you invest directly with the Fund.

To enroll in e-delivery, go to pgiminvestments.com/edelivery
|
| Objective:To seek long-term growth of capital |
Highlights(unaudited)
| • | | Equity markets were highly volatile during the reporting period. Within the Index, defensive sectors like utilities, real estate, and consumer staples posted the largest gains. Energy was the worst-performing sector, followed distantly by health care. |
| • | | Holdings in consumer discretionary were strong contributors to performance over the period, led by Paris-based LVMH Moët Hennessy Louis Vuitton. Other top performers included Canadian e-commerce platform Shopify, health care equipment maker Edward Lifesciences, Mastercard, and Chinese Internet platform Tencent. |
| • | | Not having any positions in the real estate and utilities sectors hurt the Fund’s returns modestly during the period. |
| • | | Notable detractors in the period included German payment processor Wirecard, semiconductor company NVIDIA, Tesla, cloud-based communications platform Twilio, and software company The Trade Desk. |
This report is not authorized for distribution to prospective investors unless preceded or accompanied by a current prospectus.
The views expressed in this report and information about the Fund’s portfolio holdings are for the period covered by this report and are subject to change thereafter.
Mutual funds are distributed by Prudential Investment Management Services LLC, member SIPC. Jennison Associates LLC is a registered investment adviser. Both are Prudential Financial companies.© 2019 Prudential Financial, Inc. and its related entities. Jennison Associates, Jennison, PGIM, and the PGIM logo are service marks of Prudential Financial, Inc. and its related entities, registered in many jurisdictions worldwide.
| | |
| 2 | | Visit our website at pgiminvestments.com |
Table of Contents
| | | | |
| PGIM Jennison Global Opportunities Fund | | | 3 | |
This Page Intentionally Left Blank
Letter from the President

Dear Shareholder:
We hope you find the annual report for the PGIM Jennison Global Opportunities Fund informative and useful. The report covers performance for the 12-month period that ended October 31, 2019.
While the US economy remained healthy, with rising corporate profits and strong job growth, the Federal Reserve cut interest rates three times in the latter half of the period. The cuts were a proactive attempt by the Fed to extend the longest domestic economic expansion on record as growth in many regions weakened. China in particular showed signs of slowing amid trade tensions with the US, and turmoil in the United Kingdom continued as it negotiates an exit from the European Union.
The interest-rate cuts helped boost the performance of stocks globally. For the period overall, large-cap US equities along with stocks in developed and emerging foreign markets all rose by double digits. Small-cap US stocks posted a single-digit gain. This positive performance came despite significant volatility early in the period. Equities plunged at the end of 2018 on concerns about China’s economy, a potential global trade war, higher interest rates, and worries that profit growth might slow. Stocks reversed course early in 2019, rising sharply after the Fed moderated its position on additional rate hikes for the remainder of the year.
The overall US bond market posted strong returns during the period on a significant rally in interest rates that saw the 10-year US Treasury yield decline from over 3% to under 2%. Investment-grade corporate bonds led the way with a double-digit gain, while corporate high yield and municipal bonds each had a return in the high single digits. Globally, bonds in developed markets delivered strong returns, and emerging markets debt rose by double digits.
Regarding your investments with PGIM, we believe it is important to maintain a diversified portfolio of funds consistent with your tolerance for risk, time horizon, and financial goals. Your financial advisor can help you create a diversified investment plan that may include funds covering all the basic asset classes and that reflects your personal investor profile and risk tolerance. However, diversification and asset allocation strategies do not assure a profit or protect against loss in declining markets.
At PGIM Investments, we consider it a great privilege and responsibility to help investors participate in opportunities across global markets while meeting their toughest investment challenges. PGIM is atop-10 global investment manager with more than $1 trillion in assets under management. This scale and investment expertise allow us to deliver actively managed funds and strategies to meet the needs of investors around the globe.
Thank you for choosing our family of funds.
Sincerely,

Stuart S. Parker, President
PGIM Jennison Global Opportunities Fund
December 16, 2019
| | | | |
| PGIM Jennison Global Opportunities Fund | | | 5 | |
Your Fund’s Performance(unaudited)
Performance data quoted represents past performance. Past performance does not guarantee future results. The investment return and principal value of an investment will fluctuate, so that an investor’s shares, when redeemed, may be worth more or less than their original cost. Current performance may be lower or higher than the past performance data quoted. An investor may obtain performance data as of the most recent month-end by visiting our website atpgiminvestments.com or by calling (800) 225-1852.
| | | | | | | | | | |
| |
| | | Average Annual Total Returns as of 10/31/19
(with sales charges) | |
| | | One Year (%) | | Five Years (%) | | | Since Inception (%) | |
| Class A | | 8.19 | | | 10.53 | | | | 11.67 (3/14/12) | |
| Class C | | 12.47 | | | 10.93 | | | | 11.63 (3/14/12) | |
| Class Z | | 14.62 | | | 12.03 | | | | 12.76 (3/14/12) | |
| Class R2 | | N/A | | | N/A | | | | 21.52* (12/27/18) | |
| Class R4 | | N/A | | | N/A | | | | 21.81* (12/27/18) | |
| Class R6 | | 14.75 | | | N/A | | | | 12.55 (12/22/14) | |
| MSCI ACWI ND Index | |
| | | 12.59 | | | 7.08 | | | | — | |
| | | | | | | | | | |
| |
| | | Average Annual Total Returns as of 10/31/19
(without sales charges) | |
| | | One Year (%) | | Five Years (%) | | | Since Inception (%) | |
| Class A | | 14.49 | | | 11.79 | | | | 12.50 (3/14/12) | |
| Class C | | 13.47 | | | 10.93 | | | | 11.63 (3/14/12) | |
| Class Z | | 14.62 | | | 12.03 | | | | 12.76 (3/14/12) | |
| Class R2 | | N/A | | | N/A | | | | 21.52* (12/27/18) | |
| Class R4 | | N/A | | | N/A | | | | 21.81* (12/27/18) | |
| Class R6 | | 14.75 | | | N/A | | | | 12.55 (12/22/14) | |
| MSCI ACWI ND Index | | | | | | | | | | |
| | | 12.59 | | | 7.08 | | | | — | |
*Not annualized.
| | |
| 6 | | Visit our website at pgiminvestments.com |
Growth of a $10,000 Investment(unaudited)
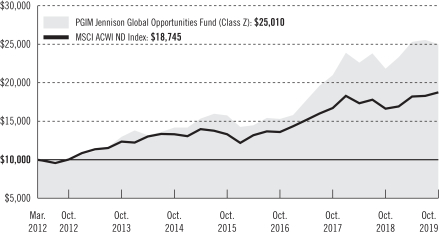
The graph compares a $10,000 investment in the Fund’s Class Z share with a similar investment in the MSCI ACWI ND Index by portraying the initial account values at the commencement of operations for Class Z shares (March 14, 2012) and the account values at the end of the current fiscal year (October 31, 2019), as measured on a quarterly basis. For purposes of the graph, and unless otherwise indicated, it has been assumed that (a) all recurring fees (including management fees) were deducted; and (b) all dividends and distributions were reinvested. The line graph provides information for Class Z shares only. As indicated in the tables provided earlier, performance for other share classes will vary due to the differing charges and expenses applicable to each share class (as indicated in the following paragraphs). Without waiver of fees and/or expense reimbursements, if any, the returns would have been lower.
Past performance does not predict future performance. Total returns and the ending account values in the graph include changes in share price and reinvestment of dividends and capital gains distributions in a hypothetical investment for the periods shown. The Fund’s total returns do not reflect the deduction of income taxes on an individual’s investment. Taxes may reduce your actual investment returns on income or gains paid by the Fund or any gains you may realize if you sell your shares.
Source: PGIM Investments LLC and Lipper Inc.
| | | | |
| PGIM Jennison Global Opportunities Fund | | | 7 | |
Your Fund’s Performance(continued)
The returns in the tables do not reflect the deduction of taxes that a shareholder would pay on Fund distributions or following the redemption of Fund shares. The average annual total returns take into account applicable sales charges, which are described for each share class in the table below.
| | | | | | | | | | | | |
| | | | | | | |
| | | Class A | | Class C | | Class Z | | Class R2 | | Class R4 | | Class R6 |
| Maximum initial sales charge | | 5.50% of the public offering price | | None | | None | | None | | None | | None |
| Contingent deferred sales charge (CDSC) (as a percentage of the lower of the original purchase price or the net asset value at redemption) | | 1.00% on sales of $1 million or more made within 12 months of purchase | | 1.00% on sales made within 12 months of purchase | | None | | None | | None | | None |
| Annual distribution and service (12b-1) fees (shown as a percentage of average daily net assets) | | 0.30% (0.25% currently) | | 1.00% | | None | | 0.25% | | None | | None |
| Shareholder services fees | | None | | None | | None | | 0.10% | | 0.10% | | None |
Benchmark Definitions
MSCI ACWI ND Index—The Morgan Stanley Capital International All Country World Net Dividend Index (MSCI ACWI ND Index) is an unmanaged free float-adjusted market capitalization-weighted index that is designed to measure the equity market performance of developed and emerging markets. The MSCI ACWI ND Index consists of 47 country indexes comprising 23 developed and 24 emerging market country indexes. The ND version of the MSCI ACWI Index reflects the impact of the maximum withholding taxes on reinvested dividends. The average annual total returns for the Index measured from the month-end closest to the inception date of the Fund’s Class A, Class C, and Class Z shares are 8.64% and 7.40% for Class R6 shares. The cumulative total return for the Index measured from the month-end closest to the inception date of the Fund’s Class R2 and Class R4 shares is 19.38%.
Investors cannot invest directly in an index or average. The returns for the Index would be lower if they included the effects of sales charges, operating expenses of a mutual fund, or taxes.
| | |
| 8 | | Visit our website at pgiminvestments.com |
Presentation of Fund Holdingsas of 10/31/19
| | | | | | |
| | | |
| Ten Largest Holdings | | Line of Business | | Country | | % of Net Assets |
| Amazon.com, Inc. | | Internet & Direct Marketing Retail | | United States | | 5.9% |
| Mastercard, Inc. (Class A Stock) | | IT Services | | United States | | 5.0% |
| Edwards Lifesciences Corp. | | Health Care Equipment & Supplies | | United States | | 4.2% |
| LVMH Moët Hennessy Louis Vuitton SE | | Textiles, Apparel & Luxury Goods | | France | | 4.0% |
| NIKE, Inc. (Class B Stock) | | Textiles, Apparel & Luxury Goods | | United States | | 3.9% |
| Alibaba Group Holding Ltd. | | Internet & Direct Marketing Retail | | China | | 3.8% |
| Safran SA | | Aerospace & Defense | | France | | 3.7% |
| Adyen NV | | IT Services | | Netherlands | | 3.6% |
| Ferrari NV | | Automobiles | | Italy | | 3.5% |
| Lululemon Athletica, Inc. | | Textiles, Apparel & Luxury Goods | | United States | | 3.4% |
For a complete list of holdings, please refer to the Schedule of Investments section of this report. Holdings reflect only long-term Investments.
| | | | |
| PGIM Jennison Global Opportunities Fund | | | 9 | |
Strategy and Performance Overview(unaudited)
How did the Fund perform?
ThePGIM Jennison Global Opportunities Fund’s Class Z shares returned 14.62% in the 12-month reporting period that ended October 31, 2019, outperforming the 12.59% return of the MSCI All Country World Index ND (the Index).
What was the market environment?
| • | | An abrupt sell-off in late 2018 reflected mounting investor concerns about the rising risk of a major trade war with China, the pace of US economic growth, decelerating expansion in non-US economies, US interest rate increases and their effect on US growth, the state of US alliances with other major trading partners, and discord and uncertainty about domestic policy. |
| • | | US equity markets rebounded early in 2019 as the Federal Reserve signaled a pause in federal funds rate hikes, corporate earnings reports generally indicated continued strength, and sentiment grew that trade friction would be resolved. Markets fell again as the period ended on a re-escalation of trade tension. |
| • | | Within the Index, defensive sectors like utilities, real estate, and consumer staples posted the largest gains. Energy was the worst-performing sector, followed distantly by health care. |
What worked?
| • | | Holdings in consumer discretionary were strong contributors to the Fund’s performance during the reporting period, led by Paris-basedLVMH Moët Hennessy Louis Vuitton SE. LVMH is the world’s largest luxury goods company with operations in wines, spirits, perfumes, cosmetics, fashion, leather goods, watches, jewelry, and selective retailing. The consistent performance of LVMH’s flagship Louis Vuitton brand, the company’s diversified portfolio, growth opportunities in emerging Asia, and what Jennison considers a strong management team are reasons the Fund owns the stock. The company enjoyed strong sales momentum throughout the period. |
| • | | No exposure to the energy sector was a source of relative gain given it was the only negative-performing sector within the Index during the period. An underweight position and stock selection in the financials sector added value, as did security choices in the communication services sector. |
| • | | Other notable contributors were found among multiple sectors: |
| | • | | Shopify, Inc.’s cloud-based, easy-to-use infrastructure tools position it well for the secular shift to digital commerce and accelerating demand for omnichannel e-commerce in the retail industry, in Jennison’s view. Recurring revenue and gross merchandise volume growth showed strength throughout the period as the company added both small and large merchants at a robust pace. |
| | |
| 10 | | Visit our website at pgiminvestments.com |
| | • | | Edwards Lifesciences Corp. is a leader in the global transcatheter valve market. Jennison liked the company’s innovation and growing portfolio of technologies to treat valve-related diseases. The company has a deep pipeline of mitral valve repair and replacement technologies that represent an additional multi-billion-dollar market opportunity. Transcatheter aortic valve replacement product sales accelerated significantly during the period, helping drive earnings growth. |
| | • | | Mastercard, Inc. continued to benefit from the long-term shift from cash to electronic credit-debit transactions. The company holds a strong market position with high barriers to entry, pricing power, and solid operating leverage potential. Revenue, expenses, operating income, and earnings exceeded expectations during the period, while gross dollar and transaction volume increased. |
| | • | | Tencent Holdings Ltd., China’s largest and most-visited internet service portal, performed fundamentally well during the period, driven by its dominant position in China’s online gaming and instant messaging markets and its growing advertising and payment-service efforts. Best known in China for its WeChat and QQ messaging along with its mobile-payment apps, the company is the world’s largest videogame publisher by revenue. Jennison expects advertising revenue gains and strong growth in its mobile-gaming and digital-content divisions to continue driving growth. |
What didn’t work?
| • | | Not having any positions in the real estate and utilities sectors hurt the Fund’s returns modestly during the period. Stock selections and an underweight position in the industrials sector also detracted. |
| • | | Other notable detractors included: |
| | • | | Based in Munich,Wirecard AG offers electronic payment and processing services in more than 120 currencies with more than 15,000 corporate customers. Its largest customer segment is e-commerce retailers in Germany and Western Europe, but it continues to expand in Asia and elsewhere. Shares declined on allegations of breaches in the company’s accounting procedures. Jennison eliminated the position in February 2019. |
| | • | | NVIDIA Corp. is focused on key high-growth markets where it can leverage its graphics semiconductor expertise to offer high-value-added solutions. Its stock price declined due to inventory issues that were exacerbated by a slowdown in the cryptocurrency mining boom. Jennison eliminated the position in December 2018. |
| | • | | Tesla, Inc. has a unique product cycle as it leverages its electric-vehicle powertrain and autonomous-driving capabilities to expand into more segments within the automotive industry, potentially driving strong growth, in Jennison’s view. Signs of weakening demand and concerns about profitability weighed on share prices during the period. |
| | | | |
| PGIM Jennison Global Opportunities Fund | | | 11 | |
Strategy and Performance Overview(continued)
| | • | | Twilio, Inc.’s cloud communications platform enables software developers to build, scale, and operate communications functions—phone calls, text messages, videos, and emails—within their mobile applications through the company’s web-service application programming interfaces. Jennison believes Twilio’s application-to-person communications technology is in the early stages of wide-scale adoption. The company has grown rapidly, and its dominance of the comprehensive mobile communications platform market suggests strong growth for the foreseeable future. Twilio reported what Jennison considered robust second-quarter 2019 revenue and customer growth as well as solid expansion rates. Yet the stock lost ground as investor sentiment toward high-growth software-as-a-service (SaaS) companies turned cold, affected by a highly uncertain macroeconomic backdrop. |
| | • | | Trade Desk (The), Inc. (TTD) provides a self-service omnichannel software platform that enables clients to purchase and manage data-driven digital advertising campaigns. Jennison likes TTD’s long-term outlook and growth potential. The company’s new trading platform, launched in 2018, has achieved widespread adoption and is helping TTD improve its marketing returns on investments. Jennison views TTD as a secular growth story at a time when advertising budgets are shifting from traditional to digital, and from digital to programmatic. Share prices were down during the period, even though company fundamentals were compelling and fiscal second-quarter financial results surpassed expectations. |
Current outlook
| • | | After months of trade friction between the US and China, both consumer and business sentiment show signs of fraying. The trade war has already claimed casualties in industries directly exposed to existing tariffs. Without clarity or a new agreement with China, the fallout from already-implemented trade restraints likely will increasingly weigh on business confidence and consumer spending, in Jennison’s view, as companies take steps to mitigate these restraints and pass on the higher costs of doing business. With this uncertainty, business planning and investing likely will be hampered, with delays and hesitancy in spending probable. The US political landscape is likewise unsettled and apt to weigh on confidence and activity, as impeachment proceedings against President Trump begin and the 2020 election cycle ramps up. |
| • | | The most powerful offset to these headwinds is the health of the US consumer, in Jennison’s view. Employment remains strong and incremental wage gains continue. |
| • | | Jennison expects the portfolio’s earnings growth to remain above market average for the balance of this year and next. Dramatic short-term moves in the market, driven by significant uncertainty in the macroeconomic environment, are leading to material near-term valuation swings. |
| | |
| 12 | | Visit our website at pgiminvestments.com |
| • | | Jennison continues to remain focused on the growth outlook of companies held in the Fund. Driven by powerful secular trends, Jennison believes the growing revenue streams of Fund holdings in industries such as e-commerce, SaaS, and payments should be durable against an uncertain backdrop. |
The percentage points shown in the tables below identify each security’s positive or negative contribution to the Fund’s return, which is the sum of all contributions by individual holdings during the reporting period.
| | | | | | |
| |
| Top Contributors (%) | | Top Detractors (%) |
| Shopify | | 2.50 | | Wirecard | | –1.34 |
| Edwards Lifesciences | | 1.60 | | NVIDIA | | –0.85 |
| Mastercard | | 1.50 | | Tesla | | –0.62 |
| Tencent Holdings | | 1.27 | | Twilio | | –0.49 |
| LVMH Moet Hennessy Louis Vuitton | | 1.10 | | Trade Desk (The) | | –0.38 |
| | | | |
| PGIM Jennison Global Opportunities Fund | | | 13 | |
Fees and Expenses(unaudited)
As a shareholder of the Fund, you incur two types of costs: (1) transaction costs, including sales charges (loads) on purchase payments and redemptions, as applicable, and (2) ongoing costs, including management fees, distribution, and/or service (12b-1) fees, and other Fund expenses, as applicable. This example is intended to help you understand your ongoing costs (in dollars) of investing in the Fund and to compare these costs with the ongoing costs of investing in other mutual funds.
The example is based on an investment of $1,000 held through the six-month period ended October 31, 2019. The example is for illustrative purposes only; you should consult the Prospectus for information on initial and subsequent minimum investment requirements.
Actual Expenses
The first line for each share class in the table on the following page provides information about actual account values and actual expenses. You may use the information on this line, together with the amount you invested, to estimate the expenses that you paid over the period. Simply divide your account value by $1,000 (for example, an $8,600 account value ÷ $1,000 = 8.6), then multiply the result by the number on the first line under the heading “Expenses Paid During the Six-Month Period” to estimate the expenses you paid on your account during this period.
Hypothetical Example for Comparison Purposes
The second line for each share class in the table on the following page provides information about hypothetical account values and hypothetical expenses based on the Fund’s actual expense ratio and an assumed rate of return of 5% per year before expenses, which is not the Fund’s actual return. The hypothetical account values and expenses may not be used to estimate the actual ending account balance or expenses you paid for the period. You may use this information to compare the ongoing costs of investing in the Fund and other funds. To do so, compare this 5% hypothetical example with the 5% hypothetical examples that appear in the shareholder reports of the other funds.
The Fund’s transfer agent may charge additional fees to holders of certain accounts that are not included in the expenses shown in the table on the following page. These fees apply to individual retirement accounts (IRAs) and Section 403(b) accounts. As of the close of the six-month period covered by the table, IRA fees included an annual maintenance fee of $15 per account (subject to a maximum annual maintenance fee of $25 for all accounts held by the same shareholder). Section 403(b) accounts are charged an annual $25 fiduciary maintenance fee. Some of the fees may vary in amount, or may be waived, based on your total account balance or the number of PGIM funds, including the Fund, that you own. You should consider the additional fees that were charged to your Fund account over the six-month period when you estimate the total ongoing expenses paid over the period
| | |
| 14 | | Visit our website at pgiminvestments.com |
and the impact of these fees on your ending account value, as these additional expenses are not reflected in the information provided in the expense table. Additional fees have the effect of reducing investment returns.
Please note that the expenses shown in the table are meant to highlight your ongoing costs only and do not reflect any transactional costs such as sales charges (loads). Therefore, the second line for each share class in the table is useful in comparing ongoing costs only and will not help you determine the relative total costs of owning different funds. In addition, if these transactional costs were included, your costs would have been higher.
| | | | | | | | | | | | | | | | | | |
| | | | |
PGIM Jennison Global
Opportunities Fund | | Beginning Account
Value
May 1, 2019 | | | Ending Account
Value
October 31, 2019 | | | Annualized
Expense Ratio
Based on the
Six-Month Period | | | Expenses Paid
During the
Six-Month Period* | |
| Class A | | Actual | | $ | 1,000.00 | | | $ | 987.90 | | | | 1.08 | % | | $ | 5.41 | |
| | Hypothetical | | $ | 1,000.00 | | | $ | 1,019.76 | | | | 1.08 | % | | $ | 5.50 | |
| Class C | | Actual | | $ | 1,000.00 | | | $ | 983.40 | | | | 1.95 | % | | $ | 9.75 | |
| | Hypothetical | | $ | 1,000.00 | | | $ | 1,015.38 | | | | 1.95 | % | | $ | 9.91 | |
| Class Z | | Actual | | $ | 1,000.00 | | | $ | 988.50 | | | | 0.94 | % | | $ | 4.71 | |
| | Hypothetical | | $ | 1,000.00 | | | $ | 1,020.47 | | | | 0.94 | % | | $ | 4.79 | |
| Class R2 | | Actual | | $ | 1,000.00 | | | $ | 986.60 | | | | 1.34 | % | | $ | 6.71 | |
| | Hypothetical | | $ | 1,000.00 | | | $ | 1,018.45 | | | | 1.34 | % | | $ | 6.82 | |
| Class R4 | | Actual | | $ | 1,000.00 | | | $ | 988.20 | | | | 0.97 | % | | $ | 4.86 | |
| | Hypothetical | | $ | 1,000.00 | | | $ | 1,020.32 | | | | 0.97 | % | | $ | 4.94 | |
| Class R6 | | Actual | | $ | 1,000.00 | | | $ | 989.00 | | | | 0.84 | % | | $ | 4.21 | |
| | | Hypothetical | | $ | 1,000.00 | | | $ | 1,020.97 | | | | 0.84 | % | | $ | 4.28 | |
*Fund expenses (net of fee waivers or subsidies, if any) for each share class are equal to the annualized expense ratio for each share class (provided in the table), multiplied by the average account value over the period, multiplied by the 184 days in the six-month period ended October 31, 2019, and divided by the 365 days in the Fund’s fiscal year ended October 31, 2019 (to reflect the six-month period). Expenses presented in the table include the expenses of any underlying portfolios in which the Fund may invest.
| | | | |
| PGIM Jennison Global Opportunities Fund | | | 15 | |
Schedule of Investments
as of October 31, 2019
| | | | | | | | |
| Description | | Shares | | | Value | |
LONG-TERM INVESTMENTS 99.2% | | | | | | | | |
| | |
COMMON STOCKS | | | | | | | | |
| | |
Argentina 2.4% | | | | | | | | |
MercadoLibre, Inc.*(a) | | | 120,488 | | | $ | 62,836,902 | |
| | |
Canada 2.5% | | | | | | | | |
Shopify, Inc. (Class A Stock)* | | | 200,750 | | | | 62,949,177 | |
| | |
China 9.5% | | | | | | | | |
Alibaba Group Holding Ltd., ADR* | | | 546,614 | | | | 96,570,295 | |
Meituan Dianping (Class B Stock)* | | | 6,598,016 | | | | 78,550,826 | |
Wuxi Biologics Cayman, Inc., 144A* | | | 5,715,887 | | | | 67,144,025 | |
| | | | | | | | |
| | | | | | | 242,265,146 | |
| | |
France 13.0% | | | | | | | | |
Kering SA | | | 97,695 | | | | 55,651,263 | |
LVMH Moet Hennessy Louis Vuitton SE | | | 240,687 | | | | 102,646,478 | |
Pernod Ricard SA | | | 234,919 | | | | 43,392,692 | |
Remy Cointreau SA(a) | | | 271,812 | | | | 36,384,402 | |
Safran SA | | | 597,616 | | | | 94,472,387 | |
| | | | | | | | |
| | | | | | | 332,547,222 | |
| | |
Germany 2.5% | | | | | | | | |
adidas AG | | | 204,635 | | | | 63,196,116 | |
| | |
Italy 3.5% | | | | | | | | |
Ferrari NV | | | 553,911 | | | | 88,781,203 | |
| | |
Netherlands 6.8% | | | | | | | | |
Adyen NV, 144A* | | | 132,195 | | | | 92,752,631 | |
ASML Holding NV | | | 306,726 | | | | 80,235,677 | |
| | | | | | | | |
| | | | | | | 172,988,308 | |
| | |
Switzerland 4.8% | | | | | | | | |
Givaudan SA | | | 20,028 | | | | 58,797,358 | |
Straumann Holding AG | | | 73,099 | | | | 65,270,456 | |
| | | | | | | | |
| | | | | | | 124,067,814 | |
| | |
United Kingdom 1.8% | | | | | | | | |
Experian PLC | | | 1,471,623 | | | | 46,284,609 | |
See Notes to Financial Statements.
| | | | |
| PGIM Jennison Global Opportunities Fund | | | 17 | |
Schedule of Investments(continued)
as of October 31, 2019
| | | | | | | | |
| Description | | Shares | | | Value | |
COMMON STOCKS (Continued) | | | | | | | | |
| | |
United States 52.4% | | | | | | | | |
Alphabet, Inc. (Class A Stock)* | | | 26,219 | | | $ | 33,004,477 | |
Amazon.com, Inc.* | | | 85,082 | | | | 151,161,786 | |
Boeing Co. (The) | | | 137,330 | | | | 46,679,840 | |
Coupa Software, Inc.*(a) | | | 296,155 | | | | 40,718,351 | |
DexCom, Inc.* | | | 243,879 | | | | 37,615,897 | |
Edwards Lifesciences Corp.* | | | 450,334 | | | | 107,350,619 | |
Exact Sciences Corp.*(a) | | | 411,313 | | | | 35,784,231 | |
Facebook, Inc. (Class A Stock)* | | | 452,191 | | | | 86,662,405 | |
Guardant Health, Inc.*(a) | | | 317,496 | | | | 22,065,972 | |
Intuitive Surgical, Inc.* | | | 131,026 | | | | 72,450,827 | |
Lululemon Athletica, Inc.* | | | 426,834 | | | | 87,189,381 | |
Mastercard, Inc. (Class A Stock) | | | 458,893 | | | | 127,026,171 | |
Microsoft Corp. | | | 296,363 | | | | 42,489,563 | |
Netflix, Inc.* | | | 263,878 | | | | 75,841,176 | |
NIKE, Inc. (Class B Stock) | | | 1,110,187 | | | | 99,417,246 | |
PayPal Holdings, Inc.* | | | 428,559 | | | | 44,612,992 | |
QUALCOMM, Inc. | | | 77,138 | | | | 6,204,981 | |
salesforce.com, Inc.* | | | 208,026 | | | | 32,553,989 | |
Tesla, Inc.*(a) | | | 81,243 | | | | 25,585,046 | |
Thermo Fisher Scientific, Inc. | | | 179,551 | | | | 54,220,811 | |
Trade Desk, Inc. (The) (Class A Stock)*(a) | | | 198,677 | | | | 39,894,342 | |
Twilio, Inc. (Class A Stock)*(a) | | | 471,895 | | | | 45,566,181 | |
Vertex Pharmaceuticals, Inc.* | | | 131,594 | | | | 25,723,995 | |
| | | | | | | | |
| | | | | | | 1,339,820,279 | |
| | | | | | | | |
TOTAL LONG-TERM INVESTMENTS
(cost $2,147,592,501) | | | | | | | 2,535,736,776 | |
| | | | | | | | |
| | |
SHORT-TERM INVESTMENTS 10.0% | | | | | | | | |
| | |
AFFILIATED MUTUAL FUNDS | | | | | | | | |
PGIM Core Ultra Short Bond Fund(w) | | | 39,563,382 | | | | 39,563,382 | |
PGIM Institutional Money Market Fund
(cost $216,461,633; includes $216,118,911 of cash collateral for securities on loan)(b)(w) | | | 216,464,046 | | | | 216,507,339 | |
| | | | | | | | |
TOTAL SHORT-TERM INVESTMENTS
(cost $256,025,015) | | | | | | | 256,070,721 | |
| | | | | | | | |
TOTAL INVESTMENTS 109.2%
(cost $2,403,617,516) | | | | | | | 2,791,807,497 | |
Liabilities in excess of other assets (9.2)% | | | | | | | (236,035,179 | ) |
| | | | | | | | |
NET ASSETS 100.0% | | | | | | $ | 2,555,772,318 | |
| | | | | | | | |
See Notes to Financial Statements.
Below is a list of the abbreviation(s) used in the annual report:
144A—Security was purchased pursuant to Rule 144A under the Securities Act of 1933 and, pursuant to the requirements of Rule 144A, may not be resold except to qualified institutional buyers.
ADR—American Depositary Receipt
LIBOR—London Interbank Offered Rate
| * | Non-income producing security. |
| (a) | All or a portion of security is on loan. The aggregate market value of such securities, including those sold and pending settlement, is $204,900,825; cash collateral of $216,118,911 (included in liabilities) was received with which the Series purchased highly liquid short-term investments. |
| (b) | Represents security purchased with cash collateral received for securities on loan and includes dividend reinvestment. |
| (w) | PGIM Investments LLC, the manager of the Series, also serves as manager of the PGIM Core Ultra Short Bond Fund and PGIM Institutional Money Market Fund. |
Fair Value Measurements:
Various inputs are used in determining the value of the Series’ investments. These inputs are summarized in the three broad levels listed below.
Level 1—unadjusted quoted prices generally in active markets for identical securities.
Level 2—quoted prices for similar securities, interest rates and yield curves, prepayment speeds, foreign currency exchange rates and other observable inputs.
Level 3—unobservable inputs for securities valued in accordance with Board approved fair valuation procedures.
The following is a summary of the inputs used as of October 31, 2019 in valuing such portfolio securities:
| | | | | | | | | | | | |
| | | Level 1 | | | Level 2 | | | Level 3 | |
Investments in Securities | | | | | | | | | | | | |
Assets | | | | | | | | | | | | |
Common Stocks | | | | | | | | | | | | |
Argentina | | $ | 62,836,902 | | | $ | — | | | $ | — | |
Canada | | | 62,949,177 | | | | — | | | | — | |
China | | | 96,570,295 | | | | 145,694,851 | | | | — | |
France | | | — | | | | 332,547,222 | | | | — | |
Germany | | | — | | | | 63,196,116 | | | | — | |
Italy | | | — | | | | 88,781,203 | | | | — | |
Netherlands | | | — | | | | 172,988,308 | | | | — | |
Switzerland | | | — | | | | 124,067,814 | | | | — | |
United Kingdom | | | — | | | | 46,284,609 | | | | — | |
United States | | | 1,339,820,279 | | | | — | | | | — | |
Affiliated Mutual Funds | | | 256,070,721 | | | | — | | | | — | |
| | | | | | | | | | | | |
Total | | $ | 1,818,247,374 | | | $ | 973,560,123 | | | $ | — | |
| | | | | | | | | | | | |
See Notes to Financial Statements.
| | | | |
| PGIM Jennison Global Opportunities Fund | | | 19 | |
Schedule of Investments(continued)
as of October 31, 2019
Industry Classification:
The industry classification of investments and liabilities in excess of other assets shown as a percentage of net assets as of October 31, 2019 were as follows (unaudited):
| | | | |
Textiles, Apparel & Luxury Goods | | | 16.0 | % |
Internet & Direct Marketing Retail | | | 15.2 | |
IT Services | | | 14.6 | |
Health Care Equipment & Supplies | | | 11.0 | |
Affiliated Mutual Funds (8.5% represents investments purchased with collateral from securities on loan) | | | 10.0 | |
Software | | | 6.1 | |
Aerospace & Defense | | | 5.5 | |
Life Sciences Tools & Services | | | 4.7 | |
Interactive Media & Services | | | 4.7 | |
Automobiles | | | 4.5 | |
Semiconductors & Semiconductor Equipment | | | 3.4 | |
| | | | |
Beverages | | | 3.1 | % |
Entertainment | | | 3.0 | |
Biotechnology | | | 2.4 | |
Chemicals | | | 2.3 | |
Professional Services | | | 1.8 | |
Health Care Providers & Services | | | 0.9 | |
| | | | |
| | | 109.2 | |
Liabilities in excess of other assets | | | (9.2 | ) |
| | | | |
| | | 100.0 | % |
| | | | |
Financial Instruments/Transactions—Summary of Offsetting and Netting Arrangements:
The Series entered into financial instruments/transactions during the reporting period that are either offset in accordance with current requirements or are subject to enforceable master netting arrangements or similar agreements that permit offsetting. The information about offsetting and related netting arrangements for financial instruments/transactions where the legal right to set-off exists is presented in the summary below.
Offsetting of financial instrument/transaction assets and liabilities:
| | | | | | | | | | | | |
Description | | Gross
Market
Value of
Recognized
Assets/
(Liabilities) | | | Collateral
Pledged/
(Received)(1) | | | Net Amount | |
Securities on Loan | | $ | 204,900,825 | | | $ | (204,900,825 | ) | | $ | — | |
| | | | | | | | | | | | |
| (1) | Collateral amount disclosed by the Series is limited to the market value of financial instruments/transactions. |
See Notes to Financial Statements.
Statement of Assets and Liabilities
as of October 31, 2019
| | | | |
Assets | | | | |
Investments at value, including securities on loan of $204,900,825: | | | | |
Unaffiliated investments (cost $2,147,592,501) | | $ | 2,535,736,776 | |
Affiliated investments (cost $256,025,015) | | | 256,070,721 | |
Foreign currency, at value (cost $840,784) | | | 842,987 | |
Receivable for investments sold | | | 21,394,815 | |
Receivable for Series shares sold | | | 10,244,622 | |
Tax reclaim receivable | | | 341,740 | |
Dividends receivable | | | 151,456 | |
Prepaid expenses | | | 17,372 | |
| | | | |
Total Assets | | | 2,824,800,489 | |
| | | | |
| |
Liabilities | | | | |
Payable to broker for collateral for securities on loan | | | 216,118,911 | |
Payable for investments purchased | | | 44,156,430 | |
Payable for Series shares reacquired | | | 6,058,758 | |
Management fee payable | | | 1,458,707 | |
Accrued expenses and other liabilities | | | 982,818 | |
Distribution fee payable | | | 224,809 | |
Affiliated transfer agent fee payable | | | 27,738 | |
| | | | |
Total Liabilities | | | 269,028,171 | |
| | | | |
| |
Net Assets | | $ | 2,555,772,318 | |
| | | | |
| | | | | |
Net assets were comprised of: | | | | |
Common stock, at par | | $ | 1,029,116 | |
Paid-in capital in excess of par | | | 2,243,920,880 | |
Total distributable earnings (loss) | | | 310,822,322 | |
| | | | |
Net assets, October 31, 2019 | | $ | 2,555,772,318 | |
| | | | |
See Notes to Financial Statements.
| | | | |
| PGIM Jennison Global Opportunities Fund | | | 21 | |
Statement of Assets and Liabilities
as of October 31, 2019
| | | | |
Class A | | | | |
Net asset value and redemption price per share,
($ 236,117,580 ÷ 9,607,055 shares of common stock issued and outstanding) | | $ | 24.58 | |
Maximum sales charge (5.50% of offering price) | | | 1.43 | |
| | | | |
Maximum offering price to public | | $ | 26.01 | |
| | | | |
| |
Class C | | | | |
Net asset value, offering price and redemption price per share, | | | | |
($ 211,290,326 ÷ 9,123,071 shares of common stock issued and outstanding) | | $ | 23.16 | |
| | | | |
| |
Class Z | | | | |
Net asset value, offering price and redemption price per share, | | | | |
($ 1,466,570,996 ÷ 58,639,036 shares of common stock issued and outstanding) | | $ | 25.01 | |
| | | | |
| |
Class R2 | | | | |
Net asset value, offering price and redemption price per share, | | | | |
($ 12,150 ÷ 486 shares of common stock issued and outstanding) | | $ | 25.02 | |
| | | | |
| |
Class R4 | | | | |
Net asset value, offering price and redemption price per share, | | | | |
($ 362,000 ÷ 14,436 shares of common stock issued and outstanding) | | $ | 25.08 | |
| | | | |
| |
Class R6 | | | | |
Net asset value, offering price and redemption price per share, | | | | |
($ 641,419,266 ÷ 25,527,488 shares of common stock issued and outstanding) | | $ | 25.13 | |
| | | | |
See Notes to Financial Statements.
Statement of Operations
Year Ended October 31, 2019
| | | | |
Net Investment Income (Loss) | | | | |
Income | | | | |
Unaffiliated dividend income (net of $980,360 foreign withholding tax) | | $ | 10,810,292 | |
Income from securities lending, net (including affiliated income of $388,176) | | | 1,336,373 | |
Affiliated dividend income | | | 870,089 | |
| | | | |
Total income | | | 13,016,754 | |
| | | | |
| |
Expenses | | | | |
Management fee | | | 16,896,866 | |
Distribution fee(a) | | | 2,602,248 | |
Shareholder servicing fees(a) | | | 113 | |
Transfer agent’s fees and expenses (including affiliated expense of $159,114)(a) | | | 1,684,685 | |
SEC registration fees | | | 337,848 | |
Custodian and accounting fees | | | 305,589 | |
Registration fees(a) | | | 226,596 | |
Shareholders’ reports | | | 158,449 | |
Directors’ fees | | | 45,523 | |
Audit fee | | | 27,875 | |
Legal fees and expenses | | | 27,413 | |
Miscellaneous | | | 50,518 | |
| | | | |
Total expenses | | | 22,363,723 | |
Less: Fee waiver and/or expense reimbursement(a) | | | (902,543 | ) |
Distribution fee waiver(a) | | | (102,830 | ) |
| | | | |
Net expenses | | | 21,358,350 | |
| | | | |
Net investment income (loss) | | | (8,341,596 | ) |
| | | | |
| |
Realized And Unrealized Gain (Loss) On Investment And Foreign Currency Transactions | | | | |
Net realized gain (loss) on: | | | | |
Investment transactions (including affiliated of $(10,511)) | | | (15,011,659 | ) |
Foreign currency transactions | | | (145,443 | ) |
| | | | |
| | | (15,157,102 | ) |
| | | | |
Net change in unrealized appreciation (depreciation) on: | | | | |
Investments (including affiliated of $57,304) | | | 265,885,680 | |
Foreign currencies | | | 2,520 | |
| | | | |
| | | 265,888,200 | |
| | | | |
Net gain (loss) on investment and foreign currency transactions | | | 250,731,098 | |
| | | | |
Net Increase (Decrease) In Net Assets Resulting From Operations | | $ | 242,389,502 | |
| | | | |
| (a) | Class specific expenses and waivers were as follows: |
| | | | | | | | | | | | | | | | | | | | | | | | |
| | | Class A | | | Class C | | | Class Z | | | Class R2 | | | Class R4 | | | Class R6 | |
Distribution fee | | | 616,977 | | | | 1,985,244 | | | | — | | | | 27 | | | | — | | | | — | |
Shareholder servicing fees | | | — | | | | — | | | | — | | | | 10 | | | | 103 | | | | — | |
Transfer agent’s fees and expenses | | | 235,169 | | | | 209,047 | | | | 1,236,305 | | | | 68 | | | | 137 | | | | 3,959 | |
Registration fees | | | 24,130 | | | | 23,612 | | | | 69,093 | | | | 23,303 | | | | 23,303 | | | | 63,155 | |
Fee waiver and/or expense reimbursement | | | (315,047 | ) | | | (56,166 | ) | | | (332,983 | ) | | | (23,355 | ) | | | (23,440 | ) | | | (151,552 | ) |
Distribution fee waiver | | | (102,830 | ) | | | — | | | | — | | | | — | | | | — | | | | — | |
See Notes to Financial Statements.
| | | | |
| PGIM Jennison Global Opportunities Fund | | | 23 | |
Statements of Changes in Net Assets
| | | | | | | | |
| |
| | | Year Ended October 31, | |
| | |
| | | 2019 | | | 2018 | |
Increase (Decrease) in Net Assets | | | | | | | | |
Operations | | | | | | | | |
Net investment income (loss) | | $ | (8,341,596 | ) | | $ | (5,397,731 | ) |
Net realized gain (loss) on investment and foreign currency transactions | | | (15,157,102 | ) | | | (31,754,951 | ) |
Net change in unrealized appreciation (depreciation) on investments and foreign currencies | | | 265,888,200 | | | | (9,911,236 | ) |
| | | | | | | | |
Net increase (decrease) in net assets resulting from operations | | | 242,389,502 | | | | (47,063,918 | ) |
| | | | | | | | |
| | |
Series share transactions (Net of share conversions) | | | | | | | | |
Net proceeds from shares sold | | | 1,382,201,174 | | | | 1,284,233,392 | |
Cost of shares reacquired | | | (582,671,951 | ) | | | (256,901,201 | ) |
| | | | | | | | |
Net increase (decrease) in net assets from Series share transactions | | | 799,529,223 | | | | 1,027,332,191 | |
| | | | | | | | |
Total increase (decrease) | | | 1,041,918,725 | | | | 980,268,273 | |
| | |
Net Assets: | | | | | | | | |
Beginning of year | | | 1,513,853,593 | | | | 533,585,320 | |
| | | | | | | | |
End of year | | $ | 2,555,772,318 | | | $ | 1,513,853,593 | |
| | | | | | | | |
See Notes to Financial Statements.
Notes to Financial Statements
Prudential World Fund, Inc. (the “Fund”) is registered under the Investment Company Act of 1940, as amended (“1940 Act”), as an open-end management investment company and currently consists of seven series: PGIM Jennison Emerging Markets Equity Opportunities Fund, PGIM Jennison Global Opportunities Fund, PGIM Jennison International Opportunities Fund and PGIM QMA International Equity Fund, each of which are diversified funds and PGIM Jennison Global Infrastructure Fund, PGIM Emerging Markets Debt Hard Currency Fund and PGIM Emerging Markets Debt Local Currency Fund, each of which are non-diversified funds for purposes of the 1940 Act and may invest a greater percentage of their assets in the securities of a single company or other issuer than a diversified fund. Investing in a non-diversified fund involves greater risk than investing in a diversified fund because a loss resulting from the decline in value of any one security may represent a greater portion of the total assets of a non-diversified fund. These financial statements relate only to the PGIM Jennison Global Opportunities Fund (the “Series”).
The investment objective of the Series is to seek long-term growth of capital.
1. Accounting Policies
The Series follows the investment company accounting and reporting guidance of the Financial Accounting Standards Board (“FASB”) Accounting Standard Codification (“ASC”) Topic 946 Financial Services—Investment Companies. The following accounting policies conform to U.S. generally accepted accounting principles. The Series consistently follows such policies in the preparation of its financial statements.
Securities Valuation:The Series holds securities and other assets and liabilities that are fair valued at the close of each day (generally, 4:00 PM Eastern time) the New York Stock Exchange (“NYSE”) is open for trading. Fair value is the price that would be received to sell an asset or paid to transfer a liability in an orderly transaction between market participants on the measurement date. The Fund’s Board of Directors (the “Board”) has adopted valuation procedures for security valuation under which fair valuation responsibilities have been delegated to PGIM Investments LLC (“PGIM Investments” or the “Manager”). Pursuant to the Board’s delegation, the Manager has established a Valuation Committee responsible for supervising the fair valuation of portfolio securities and other assets and liabilities. The valuation procedures permit the Series to utilize independent pricing vendor services, quotations from market makers, and alternative valuation methods when market quotations are either not readily available or not deemed representative of fair value. A record of the Valuation Committee’s actions is subject to the Board’s review, approval, and ratification at its next regularly scheduled quarterly meeting.
For the fiscal reporting year-end, securities and other assets and liabilities were fair valued at the close of the last U.S. business day. Trading in certain foreign securities may occur when
| | | | |
| PGIM Jennison Global Opportunities Fund | | | 25 | |
Notes to Financial Statements(continued)
the NYSE is closed (including weekends and holidays). Because such foreign securities trade in markets that are open on weekends and U.S. holidays, the values of some of the Series’ foreign investments may change on days when investors cannot purchase or redeem Series shares.
Various inputs determine how the Series’ investments are valued, all of which are categorized according to the three broad levels (Level 1, 2, or 3) detailed in the Schedule of Investments and referred to herein as the “fair value hierarchy” in accordance with FASB ASC Topic 820—Fair Value Measurements and Disclosures.
Common and preferred stocks, exchange-traded funds, and derivative instruments, such as futures or options, that are traded on a national securities exchange are valued at the last sale price as of the close of trading on the applicable exchange where the security principally trades. Securities traded via NASDAQ are valued at the NASDAQ official closing price. To the extent these securities are valued at the last sale price or NASDAQ official closing price, they are classified as Level 1 in the fair value hierarchy. In the event that no sale or official closing price on valuation date exists, these securities are generally valued at the mean between the last reported bid and ask prices, or at the last bid price in the absence of an ask price. These securities are classified as Level 2 in the fair value hierarchy.
Foreign equities traded on foreign securities exchanges are generally valued using pricing vendor services that provide model prices derived using adjustment factors based on information such as local closing price, relevant general and sector indices, currency fluctuations, depositary receipts, and futures, as applicable. Securities valued using such model prices are classified as Level 2 in the fair value hierarchy. The models generate an evaluated adjustment factor for each security, which is applied to the local closing price to adjust it for post closing market movements up to the time the Series is valued. Utilizing that evaluated adjustment factor, the vendor provides an evaluated price for each security. If the vendor does not provide an evaluated price, securities are valued in accordance with exchange-traded common and preferred stock valuation policies discussed above.
Investments in open-end, non-exchange-traded mutual funds are valued at their net asset values as of the close of the NYSE on the date of valuation. These securities are classified as Level 1 in the fair value hierarchy since they may be purchased or sold at their net asset values on the date of valuation.
Securities and other assets that cannot be priced according to the methods described above are valued based on pricing methodologies approved by the Board. In the event that unobservable inputs are used when determining such valuations, the securities will be classified as Level 3 in the fair value hierarchy.
When determining the fair value of securities, some of the factors influencing the valuation include: the nature of any restrictions on disposition of the securities; assessment of the general liquidity of the securities; the issuer’s financial condition and the markets in which it does business; the cost of the investment; the size of the holding and the capitalization of the issuer; the prices of any recent transactions or bids/offers for such securities or any comparable securities; any available analyst media or other reports or information deemed reliable by the Manager regarding the issuer or the markets or industry in which it operates. Using fair value to price securities may result in a value that is different from a security’s most recent closing price and from the price used by other unaffiliated mutual funds to calculate their net asset values.
Illiquid Securities:Pursuant to Rule 22e-4 under the 1940 Act, the Series has adopted a Board approved Liquidity Risk Management Program (“LRMP”) that requires, among other things, that the Series limit its illiquid investments that are assets to no more than 15% of net assets. Illiquid securities are those that, because of the absence of a readily available market or due to legal or contractual restrictions on resale, may not reasonably be expected to be sold or disposed of in current market conditions in seven calendar days or less without the sale or disposition significantly changing the market value of the investment. The Series may find it difficult to sell illiquid securities at the time considered most advantageous by its subadviser and may incur transaction costs that would not be incurred in the sale of securities that were freely marketable.
Restricted Securities:Securities acquired in unregistered, private sales from the issuing company or from an affiliate of the issuer are considered restricted as to disposition under federal securities law (“restricted securities”). Such restricted securities are valued pursuant to the valuation procedures noted above. Restricted securities that would otherwise be considered illiquid investments pursuant to the Series’ LRMP because of legal restrictions on resale to the general public may be traded among qualified institutional buyers under Rule 144A of the Securities Act of 1933. Therefore, these Rule 144A securities, as well as commercial paper that is sold in private placements under Section 4(2) of the Securities Act of 1933, may be classified higher than “illiquid” under the LRMP (i.e. “moderately liquid” or “less liquid” investments). However, the liquidity of the Series’ investments in restricted securities could be impaired if trading does not develop or declines.
Foreign Currency Translation:The books and records of the Series are maintained in U.S. dollars. Foreign currency amounts are translated into U.S. dollars on the following basis:
(i) market value of investment securities, other assets and liabilities—at the current rates of exchange;
(ii) purchases and sales of investment securities, income and expenses—at the rates of exchange prevailing on the respective dates of such transactions.
Although the net assets of the Series are presented at the foreign exchange rates and market values at the close of the period, the Series does not generally isolate that portion of
| | | | |
| PGIM Jennison Global Opportunities Fund | | | 27 | |
Notes to Financial Statements(continued)
the results of operations arising as a result of changes in the foreign exchange rates from the fluctuations arising from changes in the market prices of long-term portfolio securities held at the end of the period. Similarly, the Series does not isolate the effect of changes in foreign exchange rates from the fluctuations arising from changes in the market prices of long-term portfolio securities sold during the period. Accordingly, holding period realized foreign currency gains (losses) are included in the reported net realized gains (losses) on investment transactions.
Net realized gains (losses) on foreign currency transactions represent net foreign exchange gains (losses) from the disposition of holdings of foreign currencies, currency gains (losses) realized between the trade and settlement dates on forward currency transactions, and the difference between the amounts of interest, dividends and foreign withholding taxes recorded on the Series’ books and the U.S. dollar equivalent amounts actually received or paid. Net unrealized currency gains (losses) arise from valuing foreign currency denominated assets and liabilities (other than investments) at period end exchange rates.
Master Netting Arrangements:The Fund, on behalf of the Series, is subject to various Master Agreements, or netting arrangements, with select counterparties. These are agreements which a subadviser may have negotiated and entered into on behalf of all or a portion of the Series. A master netting arrangement between the Series and the counterparty permits the Series to offset amounts payable by the Series to the same counterparty against amounts to be received; and by the receipt of collateral from the counterparty by the Series to cover the Series’ exposure to the counterparty. However, there is no assurance that such mitigating factors are easily enforceable. In addition to master netting arrangements, the right to set-off exists when all the conditions are met such that each of the parties owes the other determinable amounts, the reporting party has the right to set-off the amount owed with the amount owed by the other party, the reporting party intends to set-off and the right of set-off is enforceable by law. During the reporting period, there was no intention to settle on a net basis and all amounts are presented on a gross basis on the Statement of Assets and Liabilities.
Securities Lending:The Series lends its portfolio securities to banks and broker-dealers. The loans are secured by collateral at least equal to the market value of the securities loaned. Collateral pledged by each borrower is invested in an affiliated money market fund and is marked to market daily, based on the previous day’s market value, such that the value of the collateral exceeds the value of the loaned securities. In the event of significant appreciation in value of securities on loan on the last business day of the reporting period, the financial statements may reflect a collateral value that is less than the market value of the loaned securities. Such shortfall is remedied as described above. Loans are subject to termination at the option of the borrower or the Series. Upon termination of the loan, the borrower will return to the Series securities identical to the loaned securities. Should the borrower of the
securities fail financially, the Series has the right to repurchase the securities in the open market using the collateral.
The Series recognizes income, net of any rebate and securities lending agent fees, for lending its securities in the form of fees or interest on the investment of any cash received as collateral. The borrower receives all interest and dividends from the securities loaned and such payments are passed back to the lender in amounts equivalent thereto. The Series also continues to recognize any unrealized gain (loss) in the market price of the securities loaned and on the change in the value of the collateral invested that may occur during the term of the loan. In addition, realized gain (loss) is recognized on changes in the value of the collateral invested upon liquidation of the collateral. Net earnings from securities lending are disclosed on the Statement of Operations as “Income from securities lending, net”.
Securities Transactions and Net Investment Income:Securities transactions are recorded on the trade date. Realized gains (losses) from investment and currency transactions are calculated on the specific identification method. Dividend income is recorded on the ex-date, or for certain foreign securities, when the Series becomes aware of such dividends. Expenses are recorded on an accrual basis, which may require the use of certain estimates by management that may differ from actual. Net investment income or loss (other than class specific expenses and waivers, which are allocated as noted below) and unrealized and realized gains (losses) are allocated daily to each class of shares based upon the relative proportion of adjusted net assets of each class at the beginning of the day. Class specific expenses and waivers, where applicable, are charged to the respective share classes. Class specific expenses include distribution fees and distribution fee waivers, shareholder servicing fees, transfer agent’s fees and expenses, registration fees and fee waivers and/or expense reimbursements, as applicable.
Taxes:It is the Series’ policy to continue to meet the requirements of the Internal Revenue Code applicable to regulated investment companies and to distribute all of its taxable net investment income and capital gains, if any, to its shareholders. Therefore, no federal income tax provision is required. Withholding taxes on foreign dividends, interest and capital gains, if any, are recorded, net of reclaimable amounts, at the time the related income is earned.
Dividends and Distributions:The Series expects to pay dividends from net investment income and distributions from net realized capital and currency gains, if any, annually. Dividends and distributions to shareholders, which are determined in accordance with federal income tax regulations and which may differ from generally accepted accounting principles, are recorded on the ex-date. Permanent book/tax differences relating to income and gain (loss) are reclassified between total distributable earnings (loss) and paid-in capital in excess of par, as appropriate.
Estimates:The preparation of financial statements requires management to make estimates and assumptions that affect the reported amounts and disclosures in the financial statements. Actual results could differ from those estimates.
| | | | |
| PGIM Jennison Global Opportunities Fund | | | 29 | |
Notes to Financial Statements(continued)
2. Agreements
The Fund, on behalf of the Series, has a management agreement with the Manager. Pursuant to this agreement, the Manager has responsibility for all investment advisory services and supervises the subadviser’s performance of such services. In addition, under the management agreement, the Manager provides all of the administrative functions necessary for the organization, operation and management of the Series. The Manager administers the corporate affairs of the Series and, in connection therewith, furnishes the Series with office facilities, together with those ordinary clerical and bookkeeping services which are not being furnished by the Series’ custodian and the Series’ transfer agent. The Manager is also responsible for the staffing and management of dedicated groups of legal, marketing, compliance and related personnel necessary for the operation of the Series. The legal, marketing, compliance and related personnel are also responsible for the management and oversight of the various service providers to the Series, including, but not limited to, the custodian, transfer agent, and accounting agent.
The Manager has entered into a subadvisory agreement with Jennison Associates LLC (“Jennison”). The subadvisory agreement provides that Jennison will furnish investment advisory services in connection with the management of the Series. In connection therewith, Jennison is obligated to keep certain books and records of the Series. The Manager pays for the services of Jennison, the cost of compensation of officers of the Series, occupancy and certain clerical and bookkeeping costs of the Series. The Series bears all other costs and expenses.
The management fee paid to the Manager is accrued daily and payable monthly at an annual rate of 0.825% of the Series’on average daily net assets up to $1 billion and 0.800% of such assets in excess of $1 billion. The effective management fee rate before any waivers and/or expense reimbursements was 0.812% for the year ended October 31, 2019.
The Manager has contractually agreed, through February 28, 2021, to limit net annual operating expenses (exclusive of distribution and service (12b-1) fees, and transfer agency expenses (including sub-transfer agency and networking fees), of each class of shares to 0.84% of the Series’ average daily net assets and to limit transfer agency, shareholder servicing, sub-transfer agency, and blue sky fees, as applicable, to the extent that such fees cause the net Series annual operating expenses to exceed 1.34% of average daily net assets for Class R2 shares and 1.09% of average daily net assets for Class R4 shares. Additionally, the Manager has contractually agreed, through February 28, 2021, to limit annual operating expenses after fee waivers and/or expense reimbursements to 1.08% of average daily net assets for Class A shares. These contractual waivers exclude interest, brokerage, taxes (such as income and foreign withholding taxes, stamp duty and deferred tax expenses), acquired fund fees and expenses, extraordinary expenses, and certain other Series expenses such as dividend and interest expense and broker charges on short sales. Where
applicable, the Manager agrees to waive management fees or shared operating expenses on any share class to the same extent that it waives similar expenses on any other share class and, in addition, total annual operating expenses for Class R6 shares will not exceed total annual operating expenses for Class Z shares. Fees and/or expenses waived and/or reimbursed by the Manager may be recouped by the Manager within the same fiscal year during which such waiver/reimbursement is made if such recoupment can be realized without exceeding the expense limit in effect at the time of the recoupment for that fiscal year.
The Fund, on behalf of the Series, has a distribution agreement with Prudential Investment Management Services LLC (“PIMS”), which acts as the distributor of the Class A, Class C, Class Z, Class R2, Class R4 and Class R6 shares of the Series. The Series compensates PIMS for distributing and servicing the Series’ Class A, Class C and Class R2 shares, pursuant to the plans of distribution (the “Distribution Plans”), regardless of expenses actually incurred by PIMS. The distribution fees are accrued daily and payable monthly. No distribution or service fees are paid to PIMS as distributor of the Class Z, Class R4 and Class R6 shares of the Series.
Pursuant to the Distribution Plans, the Series compensates PIMS for distribution related activities at an annual rate of up to 0.30%, 1% and 0.25% of the average daily net assets of the Class A, Class C and Class R2 shares, respectively. PIMS has contractually agreed to limit such fees to 0.25% of the average daily net assets of the Class A shares through February 28, 2021.
The Series has adopted a Shareholder Services Plan with respect to Class R2 and Class R4 shares. Under the terms of the Shareholder Services Plan, Class R2 and Class R4 shares are authorized to pay to Prudential Mutual Fund Services LLC (“PMFS”), its affiliates or third-party service providers, as compensation for services rendered to the shareholders of such Class R2 or Class R4 shares, a shareholder service fee at an annual rate of 0.10% of the average daily net assets attributable to Class R2 and Class R4 shares. The shareholder service fee is accrued daily and paid monthly.
For the year ended October 31, 2019, PIMS received $1,609,872 in front-end sales charges resulting from sales of Class A shares. Additionally, for the year ended October 31, 2019, PIMS received $166 and $48,917 in contingent deferred sales charges imposed upon redemptions by certain Class A and Class C shareholders, respectively. From these fees, PIMS paid such sales charges to broker-dealers, who in turn paid commissions to salespersons and incurred other distribution costs.
PGIM Investments, PIMS, PMFS and Jennison are indirect, wholly-owned subsidiaries of Prudential Financial, Inc. (“Prudential”).
| | | | |
| PGIM Jennison Global Opportunities Fund | | | 31 | |
Notes to Financial Statements(continued)
3. Other Transactions with Affiliates
PMFS serves as the Fund’s transfer agent. Transfer agent’s fees and expenses in the Statement of Operations include certain out-of-pocket expenses paid to non-affiliates, where applicable.
The Series may invest its overnight sweep cash in the PGIM Core Ultra Short Bond Fund (the “Core Fund”), and its securities lending cash collateral in the PGIM Institutional Money Market Fund (the “Money Market Fund”), each a series of Prudential Investment Portfolios 2, registered under the 1940 Act and managed by PGIM Investments. Through the Series’ investments in the mentioned underlying funds, PGIM Investments and/or its affiliates are paid fees or reimbursed for providing their services. In addition to the realized and unrealized gains on investments in the Core Fund and Money Market Fund, earnings from such investments are disclosed on the Statement of Operations as “Affiliated dividend income” and “Income from securities lending, net”, respectively.
The Series may enter into certain securities purchase or sale transactions under Board approved Rule 17a-7 procedures. Rule 17a-7 is an exemptive rule under the 1940 Act, that subject to certain conditions, permits purchase and sale transactions among affiliated investment companies, or between an investment company and a person that is affiliated solely by reason of having a common (or affiliated) investment adviser, common directors, and/or common officers. Pursuant to the Rule 17a-7 procedures and consistent with guidance issued by the SEC, the Fund’s Chief Compliance Officer (“CCO”) prepares a quarterly summary of all such transactions for submission to the Board, together with the CCO’s written representation that all such 17a-7 transactions were effected in accordance with the Series’ Rule 17a-7 procedures. For the year ended October 31, 2019, no 17a-7 transactions were entered into by the Series.
4. Portfolio Securities
The aggregate cost of purchases and proceeds from sales of portfolio securities (excluding short-term investments and U.S. Government securities) for the year ended October 31, 2019, were $1,862,563,647 and $1,073,326,498, respectively.
A summary of the cost of purchases and proceeds from sales of shares of affiliated investments for the year ended October 31, 2019, is presented as follows:
| | | | | | | | | | | | | | | | | | | | | | | | | | | | |
Value,
Beginning
of Year | | Cost of
Purchases | | | Proceeds
from Sales | | | Change in
Unrealized
Gain
(Loss) | | | Realized
Gain
(Loss) | | | Value,
End of
Year | | | Shares,
End of
Year | | | Income | |
PGIM Core Ultra Short Bond Fund* | | | | | | | | | | | | | |
| $ 15,403,571 | | $ | 843,510,586 | | | $ | 819,350,775 | | | $ | — | | | $ | — | | | $ | 39,563,382 | | | | 39,563,382 | | | $ | 870,089 | |
| | | |
PGIM Institutional Money Market Fund* | | | | | | | | | | | | | |
| 210,761,557 | | | 1,702,829,425 | | | | 1,697,130,436 | | | | 57,304 | | | | (10,511 | ) | | | 216,507,339 | | | | 216,464,046 | | | | 388,176 | ** |
| | | | | | | | | | | | | | | | | | | | | | | | | | | | |
| $ 226,165,128 | | $ | 2,546,340,011 | | | $ | 2,516,481,211 | | | $ | 57,304 | | | $ | (10,511 | ) | | $ | 256,070,721 | | | | | | | $ | 1,258,265 | |
| | | | | | | | | | | | | | | | | | | | | | | | | | | | |
| * | The Fund did not have any capital gain distributions during the reporting period. |
| ** | This amount is included in “Income from securities lending, net” on the Statement of Operations. |
5. Distributions and Tax Information
Distributions to shareholders, which are determined in accordance with federal income tax regulations and which may differ from generally accepted accounting principles, are recorded on the ex-date. In order to present total distributable earnings (loss) and paid-in capital in excess of par on the Statement of Assets and Liabilities that more closely represent their tax character, certain adjustments have been made to total distributable earnings (loss) and paid-in capital in excess of par. For the year ended October 31, 2019, the adjustments were to increase total distributable earnings and decrease paid-in capital in excess of par by $1,602,137 due to a net operating loss. Net investment income (loss), net realized gain (loss) on investment and foreign currency transactions and net assets were not affected by this change.
For the years ended October 31, 2019, and October 31, 2018, there were no distributions paid by the Series.
As of October 31, 2019, there were no undistributed earnings on a tax basis.
The United States federal income tax basis of the Series’ investments and the net unrealized appreciation as of October 31, 2019 were as follows:
| | | | | | |
Tax Basis | | Gross Unrealized
Appreciation | | Gross Unrealized
Depreciation | | Net Unrealized
Appreciation |
| $2,418,403,370 | | $431,735,604 | | $(58,331,477) | | $373,404,127 |
The difference between book basis and tax basis was primarily due to deferred losses on wash sales, corporate spin-off adjustment and mark-to-market of receivables and payables.
For federal income tax purposes, the Series had a capital loss carryforward as of October 31, 2019 of approximately $55,063,000 which can be carried forward for an unlimited period. No capital gains distributions are expected to be paid to shareholders until net gains have been realized in excess of such losses.
| | | | |
| PGIM Jennison Global Opportunities Fund | | | 33 | |
Notes to Financial Statements(continued)
The Series elected to treat certain late-year ordinary income losses of approximately $7,514,000 as having been incurred in the following fiscal year (October 31, 2020).
The Manager has analyzed the Series’ tax positions taken on federal, state and local income tax returns for all open tax years and has concluded that no provision for income tax is required in the Series’ financial statements for the current reporting period. Since tax authorities can examine previously filed tax returns, the Series’ U.S. federal and state tax returns for each of the four fiscal years up to the most recent fiscal year ended October 31, 2019 are subject to such review.
6. Capital and Ownership
The Series offers Class A, Class C, Class Z, Class R2, Class R4 and Class R6 shares. Class A shares are sold with a maximum front-end sales charge of 5.50%. Investors who purchase $1 million or more of Class A shares and sell these shares within 12 months of purchase are subject to a contingent deferred sales charge (“CDSC”) of 1%, although they are not subject to an initial sales charge. The Class A CDSC is waived for certain retirement and/or benefit plans. A special exchange privilege is also available for shareholders who qualified to purchase Class A shares at net asset value. Class C shares are sold with a CDSC of 1% on sales made within 12 months of purchase. Class C shares will automatically convert to Class A shares on a monthly basis approximately 10 years after purchase. Class Z, Class R2, Class R4 and Class R6 shares are not subject to any sales or redemption charge and are available exclusively for sale to a limited group of investors.
Under certain circumstances, an exchange may be made from specified share classes of the Series to one or more other share classes of the Series as presented in the table of transactions in shares of common stock.
The Fund is authorized to issue 5.075 billion shares of common stock, with a par value of $0.01 per share, which is divided into seven series. There are 950 million shares authorized for the Series, divided into seven classes, designated Class A, Class C, Class Z, Class R2, Class R4, and Class R6 and Class T common stock, each of which consists of 50 million, 70 million, 300 million, 75 million, 75 million, 255 million and 125 million authorized shares, respectively. The Series currently does not have any Class T shares outstanding.
As of October 31, 2019, Prudential, through its affiliated entities, including affiliated funds (if applicable), owned 486 Class R2 shares and 486 Class R4 shares of the Series. At reporting period end, seven shareholders of record, each holding greater than 5% of the Series, held 76% of the Series’ outstanding shares.
Transactions in shares of common stock were as follows:
| | | | | | | | |
Class A | | Shares | | | Amount | |
Year ended October 31, 2019: | | | | | | | | |
Shares sold | | | 3,574,488 | | | $ | 84,046,392 | |
Shares reacquired | | | (1,608,919 | ) | | | (37,497,401 | ) |
| | | | | | | | |
Net increase (decrease) in shares outstanding before conversion | | | 1,965,569 | | | | 46,548,991 | |
Shares issued upon conversion from other share class(es) | | | 474,149 | | | | 11,517,082 | |
Shares reacquired upon conversion into other share class(es) | | | (505,773 | ) | | | (12,200,682 | ) |
| | | | | | | | |
Net increase (decrease) in shares outstanding | | | 1,933,945 | | | $ | 45,865,391 | |
| | | | | | | | |
Year ended October 31, 2018: | | | | | | | | |
Shares sold | | | 5,248,520 | | | $ | 120,535,515 | |
Shares reacquired | | | (1,281,008 | ) | | | (28,827,088 | ) |
| | | | | | | | |
Net increase (decrease) in shares outstanding before conversion | | | 3,967,512 | | | | 91,708,427 | |
Shares issued upon conversion from other share class(es) | | | 145,935 | | | | 3,322,018 | |
Shares reacquired upon conversion into other share class(es) | | | (796,366 | ) | | | (18,356,167 | ) |
| | | | | | | | |
Net increase (decrease) in shares outstanding | | | 3,317,081 | | | $ | 76,674,278 | |
| | | | | | | | |
Class C | | | | | | |
Year ended October 31, 2019: | | | | | | | | |
Shares sold | | | 2,968,766 | | | $ | 65,835,812 | |
Shares reacquired | | | (1,453,589 | ) | | | (31,834,459 | ) |
| | | | | | | | |
Net increase (decrease) in shares outstanding before conversion | | | 1,515,177 | | | | 34,001,353 | |
Shares reacquired upon conversion into other share class(es) | | | (651,781 | ) | | | (14,977,319 | ) |
| | | | | | | | |
Net increase (decrease) in shares outstanding | | | 863,396 | | | $ | 19,024,034 | |
| | | | | | | | |
Year ended October 31, 2018: | | | | | | | | |
Shares sold | | | 5,122,386 | | | $ | 111,862,993 | |
Shares reacquired | | | (586,124 | ) | | | (12,752,680 | ) |
| | | | | | | | |
Net increase (decrease) in shares outstanding before conversion | | | 4,536,262 | | | | 99,110,313 | |
Shares reacquired upon conversion into other share class(es) | | | (283,448 | ) | | | (6,256,038 | ) |
| | | | | | | | |
Net increase (decrease) in shares outstanding | | | 4,252,814 | | | $ | 92,854,275 | |
| | | | | | | | |
Class Z | | | | | | |
Year ended October 31, 2019: | | | | | | | | |
Shares sold | | | 34,742,508 | | | $ | 829,611,273 | |
Shares reacquired | | | (19,222,576 | ) | | | (449,656,211 | ) |
| | | | | | | | |
Net increase (decrease) in shares outstanding before conversion | | | 15,519,932 | | | | 379,955,062 | |
Shares issued upon conversion from other share class(es) | | | 823,877 | | | | 20,194,422 | |
Shares reacquired upon conversion into other share class(es) | | | (211,940 | ) | | | (5,148,266 | ) |
| | | | | | | | |
Net increase (decrease) in shares outstanding | | | 16,131,869 | | | $ | 395,001,218 | |
| | | | | | | | |
Year ended October 31, 2018: | | | | | | | | |
Shares sold | | | 34,289,075 | | | $ | 799,365,247 | |
Shares reacquired | | | (8,598,020 | ) | | | (197,942,065 | ) |
| | | | | | | | |
Net increase (decrease) in shares outstanding before conversion | | | 25,691,055 | | | | 601,423,182 | |
Shares issued upon conversion from other share class(es) | | | 1,037,287 | | | | 24,312,057 | |
Shares reacquired upon conversion into other share class(es) | | | (160,174 | ) | | | (3,726,870 | ) |
| | | | | | | | |
Net increase (decrease) in shares outstanding | | | 26,568,168 | | | $ | 622,008,369 | |
| | | | | | | | |
Class R2 | | | | | | |
Period ended October 31, 2019*: | | | | | | | | |
Shares sold | | | 1,288 | | | $ | 30,000 | |
| | | | | | | | |
Net increase (decrease) in shares outstanding before conversion | | | 1,288 | | | | 30,000 | |
Shares reacquired upon conversion into other share class(es) | | | (802 | ) | | | (19,896 | ) |
| | | | | | | | |
Net increase (decrease) in shares outstanding | | | 486 | | | $ | 10,104 | |
| | | | | | | | |
| | | | |
| PGIM Jennison Global Opportunities Fund | | | 35 | |
Notes to Financial Statements(continued)
| | | | | | | | |
Class R4 | | Shares | | | Amount | |
Period ended October 31, 2019*: | | | | | | | | |
Shares sold | | | 15,428 | | | $ | 381,279 | |
Shares reacquired | | | — | ** | | | (4 | ) |
| | | | | | | | |
Net increase (decrease) in shares outstanding before conversion | | | 15,428 | | | | 381,275 | |
Shares reacquired upon conversion into other share class(es) | | | (992 | ) | | | (24,682 | ) |
| | | | | | | | |
Net increase (decrease) in shares outstanding | | | 14,436 | | | $ | 356,593 | |
| | | | | | | | |
Class R6 | | | | | | |
Year ended October 31, 2019: | | | | | | | | |
Shares sold | | | 16,578,431 | | | $ | 402,296,418 | |
Shares reacquired | | | (2,630,526 | ) | | | (63,683,876 | ) |
| | | | | | | | |
Net increase (decrease) in shares outstanding before conversion | | | 13,947,905 | | | | 338,612,542 | |
Shares issued upon conversion from other share class(es) | | | 26,917 | | | | 659,341 | |
| | | | | | | | |
Net increase (decrease) in shares outstanding | | | 13,974,822 | | | $ | 339,271,883 | |
| | | | | | | | |
Year ended October 31, 2018: | | | | | | | | |
Shares sold | | | 10,875,042 | | | $ | 252,469,637 | |
Shares reacquired | | | (729,939 | ) | | | (17,379,368 | ) |
| | | | | | | | |
Net increase (decrease) in shares outstanding before conversion | | | 10,145,103 | | | | 235,090,269 | |
Shares issued upon conversion from other share class(es) | | | 29,504 | | | | 705,000 | |
| | | | | | | | |
Net increase (decrease) in shares outstanding | | | 10,174,607 | | | $ | 235,795,269 | |
| | | | | | | | |
| * | Commencement of offering was December 27, 2018. |
| ** | Less than one full share. |
7. Borrowings
The Fund, on behalf of the Series, along with other affiliated registered investment companies (the “Funds”), is a party to a Syndicated Credit Agreement (“SCA”) with a group of banks. The purpose of the SCA is to provide an alternative source of temporary funding for capital share redemptions. The table below provides details of the current SCA in effect at the reporting period-end as well as the prior SCA.
| | | | |
| | | Current SCA | | Prior SCA |
| Term of Commitment | | 10/3/2019 – 10/1/2020 | | 10/4/2018 – 10/2/2019 |
| Total Commitment | | $ 900 million | | $ 900 million |
| Annualized Commitment Fee on the Unused Portion of the SCA | | 0.15% | | 0.15% |
| Annualized Interest Rate on Borrowings | | 1.20% plus the higher of (1) the effective federal funds rate, (2) the one-month LIBOR rate or (3) zero percent | | 1.25% plus the higher of (1) the effective federal funds rate, (2) the one-month LIBOR rate or (3) zero percent |
Certain affiliated registered investment companies that are parties to the SCA include portfolios that are subject to a predetermined mathematical formula used to manage certain benefit guarantees offered under variable annuity contracts. The formula may result in large
scale asset flows into and out of these portfolios. Consequently, these portfolios may be more likely to utilize the SCA for purposes of funding redemptions. It may be possible for those portfolios to fully exhaust the committed amount of the SCA, thereby requiring the Manager to allocate available funding per a Board-approved methodology designed to treat the Funds in the SCA equitably.
The Series did not utilize the SCA during the year ended October 31, 2019.
8. Risks of Investing in the Series
The Series’ risks include, but are not limited to, some or all of the risks discussed below:
Emerging Markets Risk:The risks of foreign investments are greater for investments in or exposed to emerging markets. Emerging market countries typically have economic and political systems that are less fully developed, and can be expected to be less stable, than those of more developed countries. For example, the economies of such countries can be subject to rapid and unpredictable rates of inflation or deflation. Low trading volumes may result in a lack of liquidity and price volatility.
Equity and Equity-Related Securities Risks:The value of a particular security could go down and you could lose money. In addition to an individual security losing value, the value of the equity markets or a sector in which the Series invests could go down. The Series’ holdings can vary significantly from broad market indexes and the performance of the Series can deviate from the performance of these indexes. Different parts of a market can react differently to adverse issuer, market, regulatory, political and economic developments.
Foreign Securities Risk:The Series’ investments in securities of foreign issuers or issuers with significant exposure to foreign markets involve additional risk. Foreign countries in which the Series may invest may have markets that are less liquid, less regulated and more volatile than US markets. The value of the Series’ investments may decline because of factors affecting the particular issuer as well as foreign markets and issuers generally, such as unfavorable government actions, and political or financial instability.
Market and Credit Risk:Securities markets may be volatile and the market prices of the Series’ securities may decline. Securities fluctuate in price based on changes in an issuer’s financial condition and overall market and economic conditions. If the market prices of the securities owned by the Series fall, the value of an investment in the Series will decline. Additionally, the Series may also be exposed to credit risk in the event that an issuer or guarantor fails to perform or that an institution or entity with which the Series has unsettled or open transactions defaults.
9. Recent Accounting Pronouncements and Reporting Updates
In August 2018, the FASB issued Accounting Standards Update (“ASU”) No. 2018-13, which changes certain fair value measurement disclosure requirements. The new ASU, in
| | | | |
| PGIM Jennison Global Opportunities Fund | | | 37 | |
Notes to Financial Statements(continued)
addition to other modifications and additions, removes the requirement to disclose the amount and reasons for transfers between Level 1 and Level 2 of the fair value hierarchy, and the Series’ policy for the timing of transfers between levels. The amendments are effective for financial statements issued for fiscal years beginning after December 15, 2019, and interim periods within those fiscal years. The Manager has evaluated the implications of certain provisions of the ASU and has determined to early adopt aspects related to the removal and modification of certain fair value measurement disclosures under the ASU effective immediately. The Manager continues to evaluate certain other provisions of the ASU and does not expect a material impact to financial statement disclosures.
Financial Highlights
| | | | | | | | | | | | | | | | | | | | |
| Class A Shares | |
| | | Year Ended October 31, | |
| | | 2019 | | | 2018 | | | 2017 | | | 2016 | | | 2015 | |
| Per Share Operating Performance(a): | | | | | | | | | | | | | | | | | | | | |
| Net Asset Value, Beginning of Year | | | $21.47 | | | | $20.72 | | | | $15.14 | | | | $15.63 | | | | $14.08 | |
| Income (loss) from investment operations: | | | | | | | | | | | | | | | | | | | | |
| Net investment income (loss) | | | (0.11 | ) | | | (0.13 | ) | | | (0.09 | ) | | | (0.05 | ) | | | (0.09 | ) |
| Net realized and unrealized gain (loss) on investment and foreign currency transactions | | | 3.22 | | | | 0.88 | | | | 5.67 | | | | (0.44 | ) | | | 1.64 | |
| Total from investment operations | | | 3.11 | | | | 0.75 | | | | 5.58 | | | | (0.49 | ) | | | 1.55 | |
| Net asset value, end of year | | | $24.58 | | | | $21.47 | | | | $20.72 | | | | $15.14 | | | | $15.63 | |
| Total Return(b): | | | 14.49% | | | | 3.62% | | | | 36.86% | | | | (3.13 | )% | | | 11.01% | |
| |
| Ratios/Supplemental Data: | |
| Net assets, end of year (000) | | | $236,118 | | | | $164,764 | | | | $90,247 | | | | $89,579 | | | | $74,049 | |
| Average net assets (000) | | | $205,653 | | | | $142,313 | | | | $70,810 | | | | $100,220 | | | | $36,635 | |
| Ratios to average net assets(c)(d): | | | | | | | | | | | | | | | | | | | | |
| Expenses after waivers and/or expense reimbursement | | | 1.08% | | | | 1.14% | | | | 1.19% | | | | 1.20% | | | | 1.38% | |
| Expenses before waivers and/or expense reimbursement | | | 1.28% | | | | 1.30% | | | | 1.33% | | | | 1.36% | | | | 1.56% | |
| Net investment income (loss) | | | (0.45)% | | | | (0.55)% | | | | (0.55)% | | | | (0.31)% | | | | (0.63)% | |
| Portfolio turnover rate(e) | | | 52% | | | | 62% | | | | 79% | | | | 88% | | | | 58% | |
| (a) | Calculated based on average shares outstanding during the year. |
| (b) | Total return does not consider the effects of sales loads. Total return is calculated assuming a purchase of a share on the first day and a sale on the last day of each year reported and includes reinvestment of dividends and distributions, if any. Total returns may reflect adjustments to conform to generally accepted accounting principles. |
| (c) | Does not include expenses of the underlying funds in which the Series invests. |
| (d) | Effective November 1, 2017, class specific expenses include transfer agent fees and expenses and registration fees, which are charged to their respective share class. |
| (e) | The Series’ portfolio turnover rate is calculated in accordance with regulatory requirements, without regard to transactions involving short-term investments and certain derivatives. If such transactions were included, the Series’ portfolio turnover rate may be higher. |
See Notes to Financial Statements.
| | | | |
| PGIM Jennison Global Opportunities Fund | | | 39 | |
Financial Highlights(continued)
| | | | | | | | | | | | | | | | | | | | |
| Class C Shares | |
| | | Year Ended October 31, | |
| | | 2019 | | | 2018 | | | 2017 | | | 2016 | | | 2015 | |
| Per Share Operating Performance(a): | | | | | | | | | | | | | | | | | | | | |
| Net Asset Value, Beginning of Year | | | $20.41 | | | | $19.85 | | | | $14.61 | | | | $15.20 | | | | $13.79 | |
| Income (loss) from investment operations: | | | | | | | | | | | | | | | | | | | | |
| Net investment income (loss) | | | (0.29 | ) | | | (0.30 | ) | | | (0.22 | ) | | | (0.15 | ) | | | (0.20 | ) |
| Net realized and unrealized gain (loss) on investment and foreign currency transactions | | | 3.04 | | | | 0.86 | | | | 5.46 | | | | (0.44 | ) | | | 1.61 | |
| Total from investment operations | | | 2.75 | | | | 0.56 | | | | 5.24 | | | | (0.59 | ) | | | 1.41 | |
| Net asset value, end of year | | | $23.16 | | | | $20.41 | | | | $19.85 | | | | $14.61 | | | | $15.20 | |
| Total Return(b): | | | 13.47% | | | | 2.82% | | | | 35.87% | | | | (3.88 | )% | | | 10.22% | |
| |
| Ratios/Supplemental Data: | |
| Net assets, end of year (000) | | | $211,290 | | | | $168,587 | | | | $79,531 | | | | $52,246 | | | | $28,982 | |
| Average net assets (000) | | | $198,518 | | | | $136,788 | | | | $55,922 | | | | $50,113 | | | | $11,330 | |
| Ratios to average net assets(c)(d): | | | | | | | | | | | | | | | | | | | | |
| Expenses after waivers and/or expense reimbursement | | | 1.94% | | | | 1.94% | | | | 1.94% | | | | 1.95% | | | | 2.12% | |
| Expenses before waivers and/or expense reimbursement | | | 1.97% | | | | 1.99% | | | | 2.03% | | | | 2.06% | | | | 2.27% | |
| Net investment income (loss) | | | (1.31)% | | | | (1.35)% | | | | (1.28)% | | | | (1.07)% | | | | (1.37)% | |
| Portfolio turnover rate(e) | | | 52% | | | | 62% | | | | 79% | | | | 88% | | | | 58% | |
| (a) | Calculated based on average shares outstanding during the year. |
| (b) | Total return does not consider the effects of sales loads. Total return is calculated assuming a purchase of a share on the first day and a sale on the last day of each year reported and includes reinvestment of dividends and distributions, if any. Total returns may reflect adjustments to conform to generally accepted accounting principles. |
| (c) | Does not include expenses of the underlying funds in which the Series invests. |
| (d) | Effective November 1, 2017, class specific expenses include transfer agent fees and expenses and registration fees, which are charged to their respective share class. |
| (e) | The Series’ portfolio turnover rate is calculated in accordance with regulatory requirements, without regard to transactions involving short-term investments and certain derivatives. If such transactions were included, the Series’ portfolio turnover rate may be higher. |
See Notes to Financial Statements.
| | | | | | | | | | | | | | | | | | | | |
| Class Z Shares | |
| | | Year Ended October 31, | |
| | | 2019 | | | 2018 | | | 2017 | | | 2016 | | | 2015 | |
| Per Share Operating Performance(a): | | | | | | | | | | | | | | | | | | | | |
| Net Asset Value, Beginning of Year | | | $21.82 | | | | $21.00 | | | | $15.31 | | | | $15.77 | | | | $14.17 | |
| Income (loss) from investment operations: | | | | | | | | | | | | | | | | | | | | |
| Net investment income (loss) | | | (0.07 | ) | | | (0.08 | ) | | | (0.05 | ) | | | (0.01 | ) | | | (0.06 | ) |
| Net realized and unrealized gain (loss) on investment and foreign currency transactions | | | 3.26 | | | | 0.90 | | | | 5.74 | | | | (0.45 | ) | | | 1.66 | |
| Total from investment operations | | | 3.19 | | | | 0.82 | | | | 5.69 | | | | (0.46 | ) | | | 1.60 | |
| Net asset value, end of year | | | $25.01 | | | | $21.82 | | | | $21.00 | | | | $15.31 | | | | $15.77 | |
| Total Return(b): | | | 14.62% | | | | 3.90% | | | | 37.17% | | | | (2.92 | )% | | | 11.29% | |
| |
| Ratios/Supplemental Data: | |
| Net assets, end of year (000) | | | $1,466,571 | | | | $927,492 | | | | $334,783 | | | | $114,228 | | | | $102,800 | |
| Average net assets (000) | | | $1,228,375 | | | | $693,749 | | | | $193,977 | | | | $131,042 | | | | $48,494 | |
| Ratios to average net assets(c)(d): | | | | | | | | | | | | | | | | | | | | |
| Expenses after waivers and/or expense reimbursement | | | 0.94% | | | | 0.93% | | | | 0.94% | | | | 0.95% | | | | 1.15% | |
| Expenses before waivers and/or expense reimbursement | | | 0.96% | | | | 0.97% | | | | 1.02% | | | | 1.06% | | | | 1.28% | |
| Net investment income (loss) | | | (0.31)% | | | | (0.35)% | | | | (0.28)% | | | | (0.07)% | | | | (0.41)% | |
| Portfolio turnover rate(e) | | | 52% | | | | 62% | | | | 79% | | | | 88% | | | | 58% | |
| (a) | Calculated based on average shares outstanding during the year. |
| (b) | Total return is calculated assuming a purchase of a share on the first day and a sale on the last day of each year reported and includes reinvestment of dividends and distributions, if any. Total returns may reflect adjustments to conform to generally accepted accounting principles. |
| (c) | Does not include expenses of the underlying funds in which the Series invests. |
| (d) | Effective November 1, 2017, class specific expenses include transfer agent fees and expenses and registration fees, which are charged to their respective share class. |
| (e) | The Series’ portfolio turnover rate is calculated in accordance with regulatory requirements, without regard to transactions involving short-term investments and certain derivatives. If such transactions were included, the Series’ portfolio turnover rate may be higher. |
See Notes to Financial Statements.
| | | | |
| PGIM Jennison Global Opportunities Fund | | | 41 | |
Financial Highlights(continued)
| | | | |
| Class R2 Shares | |
| | | December 27,
2018(a)
through
October 31,
2019 | |
| Per Share Operating Performance(b): | | | | |
| Net Asset Value, Beginning of Period | | | $20.59 | |
| Income (loss) from investment operations: | | | | |
| Net investment income (loss) | | | (0.12 | ) |
| Net realized and unrealized gain (loss) on investment and foreign currency transactions | | | 4.55 | |
| Total from investment operations | | | 4.43 | |
| Net asset value, end of period | | | $25.02 | |
| Total Return(c): | | | 21.52% | |
| | | | |
| Ratios/Supplemental Data: | | | |
| Net assets, end of period (000) | | | $12 | |
| Average net assets (000) | | | $13 | |
| Ratios to average net assets(d): | | | | |
| Expenses after waivers and/or expense reimbursement | | | 1.34% | (e) |
| Expenses before waivers and/or expense reimbursement | | | 216.05% | (e) |
| Net investment income (loss) | | | (0.58)% | (e) |
| Portfolio turnover rate(f) | | | 52% | |
| (a) | Commencement of offering. |
| (b) | Calculated based on average shares outstanding during the period. |
| (c) | Total return is calculated assuming a purchase of a share on the first day and a sale on the last day of each period reported and includes reinvestment of dividends and distributions, if any. Total returns may reflect adjustments to conform to generally accepted accounting principles. Total returns for periods less than one full year are not annualized. |
| (d) | Does not include expenses of the underlying funds in which the Series invests. |
| (f) | The Series’ portfolio turnover rate is calculated in accordance with regulatory requirements, without regard to transactions involving short-term investments and certain derivatives. If such transactions were included, the Series’ portfolio turnover rate may be higher. |
See Notes to Financial Statements.
| | | | |
| Class R4 Shares | |
| | | December 27,
2018(a)
through
October 31,
2019 | |
| Per Share Operating Performance(b): | | | | |
| Net Asset Value, Beginning of Period | | | $20.59 | |
| Income (loss) from investment operations: | | | | |
| Net investment income (loss) | | | (0.10 | ) |
| Net realized and unrealized gain (loss) on investment and foreign currency transactions | | | 4.59 | |
| Total from investment operations | | | 4.49 | |
| Net asset value, end of period | | | $25.08 | |
| Total Return(c): | | | 21.81% | |
| | | | |
| Ratios/Supplemental Data: | | | |
| Net assets, end of period (000) | | | $362 | |
| Average net assets (000) | | | $122 | |
| Ratios to average net assets(d): | | | | |
| Expenses after waivers and/or expense reimbursement | | | 0.97% | (e) |
| Expenses before waivers and/or expense reimbursement | | | 23.67% | (e) |
| Net investment income (loss) | | | (0.46)% | (e) |
| Portfolio turnover rate(f) | | | 52% | |
| (a) | Commencement of offering. |
| (b) | Calculated based on average shares outstanding during the period. |
| (c) | Total return is calculated assuming a purchase of a share on the first day and a sale on the last day of each period reported and includes reinvestment of dividends and distributions, if any. Total returns may reflect adjustments to conform to generally accepted accounting principles. Total returns for periods less than one full year are not annualized. |
| (d) | Does not include expenses of the underlying funds in which the Series invests. |
| (f) | The Series’ portfolio turnover rate is calculated in accordance with regulatory requirements, without regard to transactions involving short-term investments and certain derivatives. If such transactions were included, the Series’ portfolio turnover rate may be higher. |
See Notes to Financial Statements.
| | | | |
| PGIM Jennison Global Opportunities Fund | | | 43 | |
Financial Highlights(continued)
| | | | | | | | | | | | | | | | | | | | |
| Class R6 Shares | |
| | | Year Ended October 31, | | | December 22,
2014(a) through
October 31, | |
| | | 2019 | | | 2018 | | | 2017 | | | 2016 | | | 2015 | |
| Per Share Operating Performance(b): | | | | | | | | | | | | | | | | | | | | |
| Net Asset Value, Beginning of Period | | | $21.90 | | | | $21.06 | | | | $15.33 | | | | $15.78 | | | | $14.15 | |
| Income (loss) from investment operations: | | | | | | | | | | | | | | | | | | | | |
| Net investment income (loss) | | | (0.06 | ) | | | (0.06 | ) | | | (0.04 | ) | | | 0.01 | | | | (0.03 | ) |
| Net realized and unrealized gain (loss) on investment and foreign currency transactions | | | 3.29 | | | | 0.90 | | | | 5.77 | | | | (0.46 | ) | | | 1.66 | |
| Total from investment operations | | | 3.23 | | | | 0.84 | | | | 5.73 | | | | (0.45 | ) | | | 1.63 | |
| Net asset value, end of period | | | $25.13 | | | | $21.90 | | | | $21.06 | | | | $15.33 | | | | $15.78 | |
| Total Return(c): | | | 14.75% | | | | 3.99% | | | | 37.38% | | | | (2.85 | )% | | | 11.52% | |
| | | | | | | | | | | | | | | | | | | | |
| Ratios/Supplemental Data: | |
| Net assets, end of period (000) | | | $641,419 | | | | $253,010 | | | | $29,023 | | | | $8,647 | | | | $11 | |
| Average net assets (000) | | | $448,178 | | | | $133,984 | | | | $14,700 | | | | $7,736 | | | | $11 | |
| Ratios to average net assets(d)(e): | | | | | | | | | | | | | | | | | | | | |
| Expenses after waivers and/or expense reimbursement | | | 0.84% | | | | 0.84% | | | | 0.84% | | | | 0.84% | | | | 1.09% | (f) |
| Expenses before waivers and/or expense reimbursement | | | 0.87% | | | | 0.90% | | | | 0.92% | | | | 0.95% | | | | 1.18% | (f) |
| Net investment income (loss) | | | (0.23 | )% | | | (0.26 | )% | | | (0.23 | )% | | | 0.05% | | | | (0.27)% | (f) |
| Portfolio turnover rate(g) | | | 52% | | | | 62% | | | | 79% | | | | 88% | | | | 58% | |
| (a) | Commencement of offering. |
| (b) | Calculated based on average shares outstanding during the period. |
| (c) | Total return is calculated assuming a purchase of a share on the first day and a sale on the last day of each period reported and includes reinvestment of dividends and distributions, if any. Total returns may reflect adjustments to conform to generally accepted accounting principles. Total returns for periods less than one full year are not annualized. |
| (d) | Does not include expenses of the underlying funds in which the Series invests. |
| (e) | Effective November 1, 2017, class specific expenses include transfer agent fees and expenses and registration fees, which are charged to their respective share class. |
| (g) | The Series’ portfolio turnover rate is calculated in accordance with regulatory requirements, without regard to transactions involving short-term investments and certain derivatives. If such transactions were included, the Series’ portfolio turnover rate may be higher. |
See Notes to Financial Statements.
Report of Independent Registered Public Accounting Firm
To the Shareholders of PGIM Jennison Global Opportunities Fund and Board of Directors Prudential World Fund, Inc.:
Opinion on the Financial Statements
We have audited the accompanying statement of assets and liabilities of PGIM Jennison Global Opportunities Fund, a series of Prudential World Fund, Inc., (the Fund), including the schedule of investments, as of October 31, 2019, the related statement of operations for the year then ended, the statements of changes in net assets for each of the years in thetwo-year period ended October 31, 2019, and the related notes (collectively, the financial statements) and the financial highlights for the years or periods indicated therein. In our opinion, the financial statements and financial highlights present fairly, in all material respects, the financial position of the Fund as of October 31, 2019, the results of its operations for the year then ended, the changes in its net assets for each of the years in thetwo-year period ended October 31, 2019, and the financial highlights for the years or periods indicated therein, in conformity with U.S. generally accepted accounting principles.
Basis for Opinion
These financial statements and financial highlights are the responsibility of the Fund’s management. Our responsibility is to express an opinion on these financial statements and financial highlights based on our audits. We are a public accounting firm registered with the Public Company Accounting Oversight Board (United States) (PCAOB) and are required to be independent with respect to the Fund in accordance with the U.S. federal securities laws and the applicable rules and regulations of the Securities and Exchange Commission and the PCAOB.
We conducted our audits in accordance with the standards of the PCAOB. Those standards require that we plan and perform the audit to obtain reasonable assurance about whether the financial statements and financial highlights are free of material misstatement, whether due to error or fraud. Our audits included performing procedures to assess the risks of material misstatement of the financial statements and financial highlights, whether due to error or fraud, and performing procedures that respond to those risks. Such procedures included examining, on a test basis, evidence regarding the amounts and disclosures in the financial statements and financial highlights. Such procedures also included confirmation of securities owned as of October 31, 2019, by correspondence with the custodian, transfer agent, and brokers, or by other appropriate auditing procedures when replies were not received. Our audits also included evaluating the accounting principles used and significant estimates made by management, as well as evaluating the overall presentation of the financial statements and financial highlights. We believe that our audits provide a reasonable basis for our opinion.

We have served as the auditor of one or more PGIM and/or Prudential Retail investment companies since 2003.
New York, New York
December 16, 2019
| | | | |
| PGIM Jennison Global Opportunities Fund | | | 45 | |
INFORMATION ABOUT BOARD MEMBERS AND OFFICERS(unaudited)
Information about Board Members and Officers of the Fund is set forth below. Board Members who are not deemed to be “interested persons” of the Fund, as defined in the 1940 Act, are referred to as “Independent Board Members.” Board Members who are deemed to be “interested persons” of the Fund are referred to as “Interested Board Members.” The Board Members are responsible for the overall supervision of the operations of the Fund and perform the various duties imposed on the directors of investment companies by the 1940 Act. The Board in turn elects the Officers, who are responsible for administering theday-to-day operations of the Fund.
| | | | | | |
| Independent Board Members |
| | | | |
Name Date of Birth Position(s) Portfolios Overseen | | Principal Occupation(s) During Past Five Years | | Other Directorships Held During Past Five Years | | Length of Board Service |
| | | | |
Ellen S. Alberding 3/11/58 Board Member Portfolios Overseen: 96 | | President and Board Member, The Joyce Foundation (charitable foundation) (since 2002); Vice Chair, City Colleges of Chicago (community college system) (2011-2015); Trustee, National Park Foundation (charitable foundation for national park system) (2009-2018); Trustee, Economic Club of Chicago (since 2009); Trustee, Loyola University (since 2018). | | None. | | Since September 2013 |
| | | | |
Kevin J. Bannon 7/13/52 Board Member Portfolios Overseen: 96 | | Retired; Managing Director (April2008-May 2015) and Chief Investment Officer (October 2008-November 2013) of Highmount Capital LLC (registered investment adviser); formerly Executive Vice President and Chief Investment Officer (April 1993-August 2007) of Bank of New York Company; President (May2003-May 2007) of BNY Hamilton Family of Mutual Funds. | | Director of Urstadt Biddle Properties (equity real estate investment trust) (since September 2008). | | Since July 2008 |
PGIM Jennison Global Opportunities Fund
| | | | | | |
| Independent Board Members |
| | | | |
Name Date of Birth
Position(s) Portfolios Overseen | | Principal Occupation(s) During Past Five Years | | Other Directorships Held During Past Five Years | | Length of
Board Service |
| | | | |
Linda W. Bynoe 7/9/52 Board Member Portfolios Overseen: 96 | | President and Chief Executive Officer (since March 1995) and formerly Chief Operating Officer (December 1989-February 1995) of Telemat Ltd. (management consulting); formerly Vice President (January 1985-June 1989) at Morgan Stanley & Co. (broker-dealer). | | Director of Anixter International, Inc. (communication products distributor) (since January 2006); Director of Northern Trust Corporation (financial services) (since April 2006); Trustee of Equity Residential (residential real estate) (since December 2009). | | Since March 2005 |
| | | | |
Barry H. Evans 11/2/60 Board Member Portfolios Overseen: 95 | | Retired; formerly President (2005 – 2016), Global Chief Operating Officer (2014– 2016), Chief Investment Officer – Global Head of Fixed Income (1998-2014), and various portfolio manager roles (1986-2006), Manulife Asset Management U.S. | | Formerly Director, Manulife Trust Company (2011-2018); formerly Director, Manulife Asset Management Limited (2015-2017); formerly Chairman of the Board of Directors of Manulife Asset Management U.S. (2005-2016); formerly Chairman of the Board, Declaration Investment Management and Research (2008-2016). | | Since September 2017 |
| | | | |
Keith F. Hartstein 10/13/56 Board Member & Independent Chair Portfolios Overseen: 96 | | Retired; Member (since November 2014) of the Governing Council of the Independent Directors Council (organization of independent mutual fund directors); formerly President and Chief Executive Officer (2005-2012), Senior Vice President (2004-2005), Senior Vice President of Sales and Marketing (1997-2004), and various executive management positions (1990-1997), John Hancock Funds, LLC (asset management); Chairman, Investment Company Institute’s Sales Force Marketing Committee (2003-2008). | | None. | | Since September 2013 |
Visit our website at pgiminvestments.com
| | | | | | |
| Independent Board Members |
| | | | |
Name Date of Birth
Position(s) Portfolios Overseen | | Principal Occupation(s) During Past Five Years | | Other Directorships Held During Past Five Years | | Length of
Board Service |
| | | | |
Laurie Simon Hodrick 9/29/62 Board Member Portfolios Overseen: 95 | | A. Barton Hepburn Professor Emerita of Economics in the Faculty of Business, Columbia Business School (since 2018); Visiting Professor of Law, Stanford Law School (since 2015); Visiting Fellow at the Hoover Institution, Stanford University (since 2015); Sole Member, ReidCourt LLC (since 2008) (a consulting firm); formerly A. Barton Hepburn Professor of Economics in the Faculty of Business, Columbia Business School (1996-2017); formerly Managing Director, Global Head of Alternative Investment Strategies, Deutsche Bank (2006-2008). | | Independent Director, Synnex Corporation (since April 2019) (information technology); Independent Director, Kabbage, Inc. (since July 2018) (financial services); Independent Director, Corporate Capital Trust (2017-2018) (a business development company). | | Since September 2017 |
| | | | |
Michael S. Hyland, CFA 10/4/45 Board Member Portfolios Overseen: 96 | | Retired (since February 2005); formerly Senior Managing Director (July 2001-February 2005) of Bear Stearns & Co, Inc.; Global Partner, INVESCO (1999-2001); Managing Director and President of Salomon Brothers Asset Management (1989-1999). | | None. | | Since July 2008 |
| | | | |
Brian K. Reid 9/22/61 Board Member Portfolios Overseen: 95 | | Retired; formerly Chief Economist for the Investment Company Institute (ICI) (2005-2017); formerly Senior Economist and Director of Industry and Financial Analysis at the ICI (1998-2004); formerly Senior Economist, Industry and Financial Analysis at the ICI (1996-1998); formerly Staff Economist at the Federal Reserve Board (1989-1996); Director, ICI Mutual Insurance Company (2012-2017). | | None. | | Since March 2018 |
PGIM Jennison Global Opportunities Fund
| | | | | | |
| Independent Board Members |
| | | | |
Name Date of Birth Position(s) Portfolios Overseen | | Principal Occupation(s) During Past Five Years | | Other Directorships Held During Past Five Years | | Length of Board Service |
| | | | |
Grace C. Torres 6/28/59 Board Member Portfolios Overseen: 95 | | Retired; formerly Treasurer and Principal Financial and Accounting Officer of the PGIM Funds, Target Funds, Advanced Series Trust, Prudential Variable Contract Accounts and The Prudential Series Fund (1998-June 2014); Assistant Treasurer (March 1999-June 2014) and Senior Vice President (September 1999-June 2014) of PGIM Investments LLC; Assistant Treasurer (May 2003-June 2014) and Vice President (June 2005-June 2014) of AST Investment Services, Inc.; Senior Vice President and Assistant Treasurer (May 2003-June 2014) of Prudential Annuities Advisory Services, Inc. | | Formerly Director (July 2015-January 2018) of Sun Bancorp, Inc. N.A. and Sun National Bank; Director (since January 2018) of OceanFirst Financial Corp. and OceanFirst Bank. | | Since November 2014 |
| | | | | | |
| Interested Board Members |
| | | | |
Name Date of Birth
Position(s) Portfolios Overseen | | Principal Occupation(s) During Past Five Years | | Other Directorships Held During Past Five Years | | Length of
Board Service |
| | | | |
Stuart S. Parker 10/5/62 Board Member & President Portfolios Overseen: 96 | | President of PGIM Investments LLC (formerly known as Prudential Investments LLC) (since January 2012); Executive Vice President of Prudential Investment Management Services LLC (since December 2012); formerly Executive Vice President of Jennison Associates LLC and Head of Retail Distribution of PGIM Investments LLC (June 2005-December 2011). | | None. | | Since January 2012 |
Visit our website at pgiminvestments.com
| | | | | | |
| Interested Board Members |
| | | | |
Name Date of Birth
Position(s) Portfolios Overseen | | Principal Occupation(s) During Past Five Years | | Other Directorships Held During Past Five Years | | Length of
Board Service |
| | | | |
Scott E. Benjamin 5/21/73 Board Member & Vice President Portfolios Overseen:96 | | Executive Vice President (since June 2009) of PGIM Investments LLC; Executive Vice President (June 2009-June 2012) and Vice President (since June 2012) of Prudential Investment Management Services LLC; Executive Vice President (since September 2009) of AST Investment Services, Inc.; Senior Vice President of Product Development and Marketing, PGIM Investments (since February 2006); formerly Vice President of Product Development and Product Management, PGIM Investments LLC (2003-2006). | | None. | | Since March 2010 |
| | | | |
| Fund Officers(a) |
| | | |
Name Date of Birth Fund Position | | Principal Occupation(s) During Past Five Years | | Length of
Service as Fund
Officer |
| | | |
Raymond A. O’Hara 9/11/55 Chief Legal Officer | | Vice President and Corporate Counsel (since July 2010) of Prudential Insurance Company of America (Prudential); Vice President (March 2011-Present) of Pruco Life Insurance Company and Pruco Life Insurance Company of New Jersey; Vice President and Corporate Counsel (March 2011-Present) of Prudential Annuities Life Assurance Corporation; Chief Legal Officer of PGIM Investments LLC (since June 2012); Chief Legal Officer of Prudential Mutual Fund Services LLC (since June 2012) and Corporate Counsel of AST Investment Services, Inc. (since June 2012); formerly Assistant Vice President and Corporate Counsel (September 2008-July 2010) of The Hartford Financial Services Group, Inc.; formerly Associate (September 1980-December 1987) and Partner (January 1988–August 2008) of Blazzard & Hasenauer, P.C. (formerly, Blazzard, Grodd & Hasenauer, P.C.). | | Since June 2012 |
PGIM Jennison Global Opportunities Fund
| | | | |
| Fund Officers(a) |
| | | |
Name Date of Birth Fund Position | | Principal Occupation(s) During Past Five Years | | Length of
Service as Fund
Officer |
| | | |
Dino Capasso 8/19/74 Chief Compliance Officer | | Chief Compliance Officer (July 2019-Present) of PGIM Investments LLC; Chief Compliance Officer (July 2019-Present) of the PGIM Funds, Target Funds, Advanced Series Trust, The Prudential Series Fund, Prudential’s Gibraltar Fund, Inc., PGIM Global High Yield Fund, Inc., and PGIM High Yield Bond Fund, Inc.; Vice President and Deputy Chief Compliance Officer (June 2017-2019) of PGIM Investments LLC; formerly, Senior Vice President and Senior Counsel (January 2016-June 2017), and Vice President and Counsel (February 2012-December 2015) of Pacific Investment Management Company LLC. | | Since March
2018 |
| | | |
Andrew R. French 12/22/62 Secretary | | Vice President of PGIM Investments LLC (December 2018-Present); formerly Vice President and Corporate Counsel (February 2010-December 2018) of Prudential; formerly Director and Corporate Counsel (2006-2010) of Prudential; Vice President and Assistant Secretary (since January 2007) of PGIM Investments LLC; Vice President and Assistant Secretary (since January 2007) of Prudential Mutual Fund Services LLC. | | Since October
2006 |
| | | |
Jonathan D. Shain 8/9/58 Assistant Secretary | | Vice President and Corporate Counsel (since August 1998) of Prudential; Vice President and Assistant Secretary (since May 2001) of PGIM Investments LLC; Vice President and Assistant Secretary (since February 2001) of Prudential Mutual Fund Services LLC; formerly Vice President and Assistant Secretary (May 2003-June 2005) of AST Investment Services, Inc. | | Since May 2005 |
| | | |
Claudia DiGiacomo 10/14/74 Assistant Secretary | | Vice President and Corporate Counsel (since January 2005) of Prudential; Vice President and Assistant Secretary of PGIM Investments LLC (since December 2005); formerly Associate at Sidley Austin Brown & Wood LLP (1999-2004). | | Since December
2005 |
| | | |
Diana N. Huffman 4/14/82 Assistant Secretary | | Vice President and Corporate Counsel (since September 2015) of Prudential; formerly Associate at Willkie Farr & Gallagher LLP (2009-2015). | | Since March
2019 |
| | | |
Kelly A. Coyne 8/8/68 Assistant Secretary | | Director, Investment Operations of Prudential Mutual Fund Services LLC (since 2010). | | Since March
2015 |
| | | |
Christian J. Kelly 5/5/75 Treasurer and Principal Financial and Accounting Officer | | Vice President, Head of Fund Administration of PGIM Investments LLC (since November 2018); formerly, Director of Fund Administration of Lord Abbett & Co. LLC (2009-2018), Treasurer and Principal Accounting Officer of the Lord Abbett Family of Funds (2017-2018); Director of Accounting, Avenue Capital Group (2008-2009); Senior Manager, Investment Management Practice of Deloitte & Touche LLP (1998-2007). | | Since January
2019 |
Visit our website at pgiminvestments.com
| | | | |
| Fund Officers(a) |
| | | |
Name Date of Birth Fund Position | | Principal Occupation(s) During Past Five Years | | Length of
Service as Fund
Officer |
| | | |
Lana Lomuti 6/7/67 Assistant Treasurer | | Vice President (since 2007) and Director (2005-2007), within PGIM Investments Fund Administration; formerly Assistant Treasurer (December 2007-February 2014) of The Greater China Fund, Inc. | | Since April 2014 |
| | | |
Russ Shupak 10/08/73 Assistant Treasurer | | Vice President (since 2017) and Director (2013-2017), within PGIM Investments Fund Administration. | | Since October 2019 |
| | | |
Deborah Conway 3/26/69 Assistant Treasurer | | Vice President (since 2017) and Director (2007-2017), within PGIM Investments Fund Administration. | | Since October 2019 |
| | | |
Elyse M. McLaughlin 1/20/74 Assistant Treasurer | | Vice President (since 2017) and Director (2011-2017), within PGIM Investments Fund Administration. | | Since October 2019 |
| | | |
Charles H. Smith 1/11/73 Anti-Money Laundering Compliance Officer | | Vice President, Corporate Compliance, Anti-Money Laundering Unit (since January 2015) of Prudential; committee member of the American Council of Life Insurers Anti-Money Laundering and Critical Infrastructure Committee (since January 2016); formerly Global Head of Economic Sanctions Compliance at AIG Property Casualty (February 2007-December 2014); Assistant Attorney General at the New York State Attorney General’s Office, Division of Public Advocacy. (August 1998-January 2007). | | Since January 2017 |
| (a) | Excludes Mr. Parker and Mr. Benjamin, interested Board Members who also serve as President and Vice President, respectively. |
Explanatory Notes to Tables:
| ∎ | Board Members are deemed to be “Interested,” as defined in the 1940 Act, by reason of their affiliation with PGIM Investments LLC and/or an affiliate of PGIM Investments LLC. |
| ∎ | Unless otherwise noted, the address of all Board Members and Officers is c/o PGIM Investments LLC, 655 Broad Street, Newark, New Jersey07102-4410. |
| ∎ | There is no set term of office for Board Members or Officers. The Board Members have adopted a retirement policy, which calls for the retirement of Board Members on December 31 of the year in which they reach the age of 75. |
| ∎ | “Other Directorships Held” includes only directorships of companies required to register or file reports with the SEC under the 1934 Act (that is, “public companies”) or other investment companies registered under the 1940 Act. |
| ∎ | “Portfolios Overseen” includes all investment companies managed by PGIM Investments LLC. The investment companies for which PGIM Investments LLC serves as manager include the PGIM Funds, The Prudential Variable Contract Accounts, PGIM ETF Trust, PGIM High Yield Bond Fund, Inc., PGIM Global High Yield Fund, Inc., The Prudential Series Fund, Prudential’s Gibraltar Fund, Inc. and the Advanced Series Trust. |
PGIM Jennison Global Opportunities Fund
Approval of Advisory Agreements(unaudited)
The Fund’s Board of Directors
The Board of Directors (the “Board”) of PGIM Jennison Global Opportunities Fund (the “Fund”)1 consists of eleven individuals, nine of whom are not “interested persons” of the Fund, as defined in the Investment Company Act of 1940, as amended (the “1940 Act”) (the “Independent Directors”).2 The Board is responsible for the oversight of the Fund and its operations, and performs the various duties imposed on the directors of investment companies by the 1940 Act. The Independent Directors have retained independent legal counsel to assist them in connection with their duties. The Chair of the Board is an Independent Director. The Board has established four standing committees: the Audit Committee, the Nominating and Governance Committee, and two Investment Committees. Each committee is chaired by, and composed of, Independent Directors.
Annual Approval of the Fund’s Advisory Agreements
As required under the 1940 Act, the Board determines annually whether to renew the Fund’s management agreement with PGIM Investments LLC (“PGIM Investments”) and the Fund’s subadvisory agreement with Jennison Associates LLC (“Jennison”). In considering the renewal of the agreements, the Board, including all of the Independent Directors, met on May 30, 2019 and on June 11-13, 2019 and approved the renewal of the agreements through July 31, 2020, after concluding that the renewal of the agreements was in the best interests of the Fund and its shareholders.
In advance of the meetings, the Board requested and received materials relating to the agreements, and had the opportunity to ask questions and request further information in connection with its consideration. Among other things, the Board considered comparative fee information from PGIM Investments and Jennison. Also, the Board considered comparisons with other mutual funds in relevant Peer Universes and Peer Groups, as is further discussed below.
In approving the agreements, the Board, including the Independent Directors advised by independent legal counsel, considered the factors it deemed relevant, including the nature, quality and extent of services provided by PGIM Investments and the subadviser, the performance of the Fund, the profitability of PGIM Investments and its affiliates, expenses and fees, and the potential for economies of scale that may be shared with the Fund and its shareholders as the Fund’s assets grow. In their deliberations, the Directors did not identify any single factor which alone was responsible for the Board’s decision to approve the agreements with respect to the Fund. In connection with its deliberations, the Board
| 1 | PGIM Jennison Global Opportunities Fund is a series of Prudential World Fund, Inc. |
| 2 | Grace C. Torres was an Interested Director of the Fund at the time the Board considered and approved the renewal of the Fund’s advisory agreements, but has since become an Independent Director of the Fund. |
| | |
| PGIM Jennison Global Opportunities Fund |
Approval of Advisory Agreements(continued)
considered information provided by PGIM Investments throughout the year at regular Board meetings, presentations from portfolio managers and other information, as well as information furnished at or in advance of the meetings on May 30, 2019 and on June 11-13, 2019.
The Directors determined that the overall arrangements between the Fund and PGIM Investments, which serves as the Fund’s investment manager pursuant to a management agreement, and between PGIM Investments and Jennison, which serves as the Fund’s subadviser pursuant to the terms of a subadvisory agreement with PGIM Investments, are in the best interests of the Fund and its shareholders in light of the services performed, fees charged and such other matters as the Directors considered relevant in the exercise of their business judgment.
The material factors and conclusions that formed the basis for the Directors’ reaching their determinations to approve the continuance of the agreements are separately discussed below.
Nature, Quality and Extent of Services
The Board received and considered information regarding the nature, quality and extent of services provided to the Fund by PGIM Investments and Jennison. The Board noted that Jennison is affiliated with PGIM Investments. The Board considered the services provided by PGIM Investments, including but not limited to the oversight of the subadviser for the Fund, as well as the provision of fund recordkeeping, compliance and other services to the Fund, and PGIM Investments’ role as administrator for the Fund’s liquidity risk management program. With respect to PGIM Investments’ oversight of the subadviser, the Board noted that PGIM Investments’ Strategic Investment Research Group (“SIRG”), which is a business unit of PGIM Investments, is responsible for monitoring and reporting to PGIM Investments’ senior management on the performance and operations of the subadviser. The Board also considered that PGIM Investments pays the salaries of all of the officers and interested Directors of the Fund who are part of Fund management. The Board also considered the investment subadvisory services provided by Jennison, including investment research and security selection, as well as adherence to the Fund’s investment restrictions and compliance with applicable Fund policies and procedures. The Board considered PGIM Investments’ evaluation of the subadviser, as well as PGIM Investments’ recommendation, based on its review of the subadviser, to renew the subadvisory agreement.
The Board considered the qualifications, backgrounds and responsibilities of PGIM Investments’ senior management responsible for the oversight of the Fund and Jennison, and also considered the qualifications, backgrounds and responsibilities of Jennison’s portfolio managers who are responsible for the day-to-day management of the Fund’s portfolio. The Board was provided with information pertaining to PGIM Investments’ and Jennison’s organizational structure, senior management, investment operations, and other
| | |
| Visit our website at pgiminvestments.com | | |
relevant information pertaining to both PGIM Investments and Jennison. The Board also noted that it received favorable compliance reports from the Fund’s Chief Compliance Officer (“CCO”) as to both PGIM Investments and Jennison.
The Board concluded that it was satisfied with the nature, extent and quality of the investment management services provided by PGIM Investments and the subadvisory services provided to the Fund by Jennison, and that there was a reasonable basis on which to conclude that the Fund benefits from the services provided by PGIM Investments and Jennison under the management and subadvisory agreements.
Costs of Services and Profits Realized by PGIM Investments
The Board was provided with information on the profitability of PGIM Investments and its affiliates in serving as the Fund’s investment manager. The Board discussed with PGIM Investments the methodology utilized in assembling the information regarding profitability and considered its reasonableness. The Board recognized that it is difficult to make comparisons of profitability from fund management contracts because comparative information is not generally publicly available and is affected by numerous factors, including the structure of the particular adviser, the types of funds it manages, its business mix, numerous assumptions regarding allocations and the adviser’s capital structure and cost of capital. However, the Board considered that the cost of services provided by PGIM Investments to the Fund during the year ended December 31, 2018 exceeded the management fees paid by the Fund, resulting in an operating loss to PGIM Investments. Taking these factors into account, the Board concluded that the profitability of PGIM Investments and its affiliates in relation to the services rendered was not unreasonable.
Economies of Scale
The Board received and discussed information concerning economies of scale that PGIM Investments may realize as the Fund’s assets grow beyond current levels. The Board noted that the management fee schedule for the Fund includes breakpoints, which have the effect of decreasing the fee rate as assets increase. During the course of time, the Board has considered information regarding the launch date of the Fund, the management fees of the Fund compared to those of similarly managed funds and PGIM Investments’ investment in the Fund over time. The Board noted that economies of scale may be shared with the Fund in several ways, including low management fees from inception, additional technological and personnel investments to enhance shareholder services, and maintaining existing expense structures in the face of a rising cost environment. The Board considered PGIM Investments’ assertion that it continually evaluates the management fee schedule of the Fund and the potential to share economies of scale through breakpoints or fee waivers as asset levels increase.
| | |
| PGIM Jennison Global Opportunities Fund |
Approval of Advisory Agreements(continued)
The Board recognized the inherent limitations of any analysis of economies of scale, stemming largely from the Board’s understanding that most of PGIM Investments’ costs are not specific to individual funds, but rather are incurred across a variety of products and services.
Other Benefits to PGIM Investments and Jennison
The Board considered potential ancillary benefits that might be received by PGIM Investments, Jennison and their affiliates as a result of their relationship with the Fund. The Board concluded that potential benefits to be derived by PGIM Investments included transfer agency fees received by the Fund’s transfer agent (which is affiliated with PGIM Investments), as well as benefits to its reputation or other intangible benefits resulting from PGIM Investments’ association with the Fund. The Board concluded that the potential benefits to be derived by Jennison included the ability to use soft dollar credits, as well as the potential benefits consistent with those generally resulting from an increase in assets under management, specifically, potential access to additional research resources and benefits to its reputation. The Board concluded that the benefits derived by PGIM Investments and Jennison were consistent with the types of benefits generally derived by investment managers and subadvisers to mutual funds.
Performance of the Fund / Fees and Expenses
The Board considered certain additional factors and made related conclusions relating to the historical performance of the Fund for the one-, three- and five-year periods ended December 31, 2018.
The Board also considered the Fund’s actual management fee, as well as the Fund’s net total expense ratio, for the fiscal year ended October 31, 2018. The Board considered the management fee for the Fund as compared to the management fee charged by PGIM Investments to other funds and the fee charged by other advisers to comparable mutual funds in a Peer Group. The actual management fee represents the fee rate actually paid by Fund shareholders and includes any fee waivers or reimbursements. The net total expense ratio for the Fund represents the actual expense ratio incurred by Fund shareholders.
The mutual funds included in the Peer Universe, which was used to consider performance, and the Peer Group, which was used to consider fees and expenses, were objectively determined by Broadridge, an independent provider of mutual fund data. In certain circumstances, PGIM Investments also provided supplemental Peer Universe or Peer Group information for reasons addressed with the Board. The comparisons placed the Fund in various quartiles over various periods, with the first quartile being the best 25% of the mutual funds (for performance, the best performing mutual funds and, for expenses, the lowest cost mutual funds).
| | |
| Visit our website at pgiminvestments.com | | |
The section below summarizes key factors considered by the Board and the Board’s conclusions regarding the Fund’s performance, fees and overall expenses. The table sets forth net performance comparisons (which reflect the impact on performance of fund expenses, or any subsidies, expense caps or waivers that may be applicable) with the Peer Universe, actual management fees with the Peer Group (which reflect the impact of any subsidies or fee waivers), and net total expenses with the Peer Group, each of which were key factors considered by the Board.
| | | | | | | | |
| Net Performance | | 1 Year | | 3 Years | | 5 Years | | 10 Years |
| | 1st Quartile | | 1st Quartile | | 1st Quartile | | N/A |
| Actual Management Fees: 3rd Quartile |
| Net Total Expenses: 3rd Quartile |
| | • | | The Board noted that Fund outperformed its benchmark index over all periods. |
| | • | | The Board noted information provided by PGIM Investments indicating that the Fund’s net total expense ratio was less than half a basis point from the median of the Peer Group. |
| | • | | The Board and PGIM Investments agreed to retain the Fund’s existing contractual expense cap which (exclusive of certain fees and expenses) limits total annual operating expenses at 0.84% for Class C shares, Class R6 shares and Class Z shares, and limits transfer agency, shareholder servicing, sub-transfer agency and blue sky fees to the extent that such fees cause net annual Fund operating expenses to exceed 1.34% for Class R2 shares or 1.09% for Class R4 shares through February 29, 2020. |
| | • | | The Board and PGIM Investments has also agreed to retain the Fund’s existing contractual expense cap with respect to Class A shares, which (exclusive of certain fees and expenses) limits total annual fund operating expenses to 1.08% for Class A shares. |
| | • | | In addition, PGIM Investments will waive management fees or shared operating expenses on any share class to the same extent that it waives such expenses on any other share class, and has agreed that total annual fund operating expenses for Class R6 shares will not exceed total annual fund operating expenses for Class Z shares. |
| | • | | The Board concluded that, in light of the above, it would be in the best interests of the Fund and its shareholders to continue to monitor performance and to renew the agreements. |
| | • | | The Board concluded that the management fees (including subadvisory fees) and total expenses were reasonable in light of the services provided. |
* * *
After full consideration of these factors, the Board concluded that the approval of the agreements was in the best interests of the Fund and its shareholders.
| | |
| PGIM Jennison Global Opportunities Fund |
| | | | |
| | |
| ∎ MAIL | | ∎ TELEPHONE | | ∎ WEBSITE |
655 Broad Street Newark, NJ 07102 | | (800) 225-1852 | | pgiminvestments.com |
|
| PROXY VOTING |
| The Board of Directors of the Fund has delegated to the Fund’s subadviser the responsibility for voting any proxies and maintaining proxy recordkeeping with respect to the Fund. A description of these proxy voting policies and procedures is available without charge, upon request, by calling (800) 225-1852. Information regarding how the Fund voted proxies relating to portfolio securities during the most recent 12-month period ended June 30 is available on the Fund’s website and on the Securities and Exchange Commission’s website. |
|
| DIRECTORS |
| Ellen S. Alberding• Kevin J. Bannon• Scott E. Benjamin• Linda W. Bynoe• Barry H. Evans• Keith F. Hartstein• Laurie Simon Hodrick• Michael S. Hyland• Stuart S. Parker• Brian K. Reid• Grace C. Torres |
|
| OFFICERS |
Stuart S. Parker,President• Scott E. Benjamin,Vice President• Christian J. Kelly,Treasurer and Principal Financial and Accounting Officer• Raymond A. O’Hara,Chief Legal Officer• Dino Capasso,Chief Compliance Officer• Charles H. Smith,Anti-Money Laundering Compliance Officer• Andrew R. French,Secretary• Jonathan D. Shain,Assistant Secretary• Claudia DiGiacomo,Assistant Secretary• Diana N. Huffman,Assistant Secretary• Kelly A. Coyne,Assistant Secretary• Lana Lomuti,Assistant Treasurer• Russ Shupak,Assistant Treasurer• Elyse McLaughlin,Assistant Treasurer• Deborah Conway,Assistant Treasurer |
| | | | |
| MANAGER | | PGIM Investments LLC | | 655 Broad Street
Newark, NJ 07102 |
|
| SUBADVISER | | Jennison Associates LLC | | 466 Lexington Avenue
New York, NY 10017 |
|
| DISTRIBUTOR | | Prudential Investment
Management Services LLC | | 655 Broad Street
Newark, NJ 07102 |
|
| CUSTODIAN | | The Bank of New York Mellon | | 240 Greenwich Street
New York, NY 10286 |
|
| TRANSFER AGENT | | Prudential Mutual Fund
Services LLC | | PO Box 9658
Providence, RI 02940 |
|
| INDEPENDENT REGISTERED PUBLIC ACCOUNTING FIRM | | KPMG LLP | | 345 Park Avenue
New York, NY 10154 |
|
| FUND COUNSEL | | Willkie Farr & Gallagher LLP | | 787 Seventh Avenue
New York, NY 10019 |
|
|
| An investor should consider the investment objectives, risks, charges, and expenses of the Fund carefully before investing. The prospectus and summary prospectus contain this and other information about the Fund. An investor may obtain the prospectus and summary prospectus by visiting our website atpgiminvestments.com or by calling(800) 225-1852. The prospectus and summary prospectus should be read carefully before investing. |
|
| E-DELIVERY |
| To receive your mutual fund documents online, go topgiminvestments.com/edelivery and enroll. Instead of receiving printed documents by mail, you will receive notification via email when new materials are available. You can cancel your enrollment or change your email address at any time byvisiting the website address above. |
|
| SHAREHOLDER COMMUNICATIONS WITH DIRECTORS |
| Shareholders can communicate directly with the Board of Directors by writing to the Chair of the Board, PGIM Jennison Global Opportunities Fund, PGIM Investments, Attn: Board of Directors, 655 Broad Street, Newark, NJ 07102. Shareholders can communicate directly with an individual Director by writing to the same address. Communications are not screened before being delivered to the addressee. |
|
| AVAILABILITY OF PORTFOLIO HOLDINGS |
The Fund files its complete schedule of portfolio holdings with the Securities and Exchange Commission on Form N-PORT. The Fund’s Form N-PORT filings are available on the Commission’s website at sec.gov. Form N-PORT is filed with the Commission quarterly, and each Fund’s full portfolio holdings as of the first and third fiscal quarter-ends (as of the third month of the Fund’s fiscal quarter for reporting periods on or after September 30, 2019) will be made publicly available 60 days after the end of each quarter at sec.gov. |
|
| The Fund’s Statement of Additional Information contains additional information about the Fund’s Directors and is available without charge, upon request, by calling (800) 225-1852. |
Mutual Funds:
| | | | |
| ARE NOT INSURED BY THE FDIC OR ANY FEDERAL GOVERNMENT AGENCY | | MAY LOSE VALUE | | ARE NOT A DEPOSIT OF OR GUARANTEED BY ANY BANK OR ANY BANK AFFILIATE |
PGIM JENNISON GLOBAL OPPORTUNITIES FUND
| | | | | | | | | | | | |
| SHARE CLASS | | A | | C | | Z | | R2 | | R4 | | R6 |
| NASDAQ | | PRJAX | | PRJCX | | PRJZX | | PRJBX | | PRJDX | | PRJQX |
| CUSIP | | 743969719 | | 743969693 | | 743969685 | | 743969438 | | 743969420 | | 743969594 |
MF214E

PGIM JENNISON INTERNATIONAL OPPORTUNITIES FUND
ANNUAL REPORT
OCTOBER 31, 2019
COMING SOON: PAPERLESS SHAREHOLDER REPORTS
Beginning on January 1, 2021, as permitted by regulations adopted by the Securities and Exchange Commission, paper copies of the Fund’s annual and semiannual shareholder reports will no longer be sent by mail, unless you specifically request paper copies of the reports. Instead, the reports will be made available on the Fund’s website (pgiminvestments.com), and you will be notified by mail each time a report is posted and provided with a website link to access the report.
If you already elected to receive shareholder reports electronically, you will not be affected by this change and you need not take any action. You may elect to receive shareholder reports and other communications from the Fund electronically anytime by contacting your financial intermediary (such as a broker-dealer or bank) or, if you are a direct investor, by calling 1-800-225-1852 or by sending an email request to PGIM Investments at shareholderreports@pgim.com.
You may elect to receive all future reports in paper free of charge. If you invest through a financial intermediary, you can contact your financial intermediary or follow instructions included with this notice to elect to continue to receive paper copies of your shareholder reports. If you invest directly with the Fund, you can call 1-800-225-1852 or send an email request to shareholderreports@pgim.com to let the Fund know you wish to continue receiving paper copies of your shareholder reports. Your election to receive reports in paper will apply to all funds held in your account if you invest through your financial intermediary or all funds held with the fund complex if you invest directly with the Fund.

To enroll in e-delivery, go to pgiminvestments.com/edelivery
|
| Objective:To seek long-term growth of capital |
Highlights(unaudited)
| • | | Markets were highly volatile in the reporting period. In the index, information technology, utilities, real estate, and consumer discretionary posted the largest gains. Energy was the worst-performing sector and only negative sector. |
| • | | Holdings in the consumer discretionary sector were strong contributors to the Fund’s performance during the reporting period, led by Lululemon Athletica. |
| • | | On a sector level, stock selection in consumer staples, health care, information technology, communication services, and financials also contributed to performance. Having no exposure to the poor-performing energy sector was also beneficial. |
| • | | Other key contributors to total return included Canadian e-commerce platform Shopify, Chinese spirits maker Kweichow Moutai, Chinese Internet platform Tencent, and Paris-based beauty products company L’Oreal. |
| • | | Not having any holdings in the utilities and real estate sectors detracted from the Fund’s relative performance during the period, while stock selection in the materials sector also detracted modestly. |
| • | | Other detractors included Danish biotech company Novozymes, lithium-producer Albemarle, German payment processor Wirecard, Swedish music-streaming service Spotify Technology, and online retailer ASOS. |
This report is not authorized for distribution to prospective investors unless preceded or accompanied by a current prospectus.
The views expressed in this report and information about the Fund’s portfolio holdings are for the period covered by this report and are subject to change thereafter.
Mutual funds are distributed by Prudential Investment Management Services LLC, member SIPC. Jennison Associates LLC is a registered investment adviser. Both are Prudential Financial companies.© 2019 Prudential Financial, Inc. and its related entities. Jennison Associates, Jennison, PGIM, and the PGIM logo are service marks of Prudential Financial, Inc. and its related entities, registered in many jurisdictions worldwide.
| | |
| 2 | | Visit our website at pgiminvestments.com |
Table of Contents
| | | | |
| PGIM Jennison International Opportunities Fund | | | 3 | |
This Page Intentionally Left Blank
Letter from the President

Dear Shareholder:
We hope you find the annual report for the PGIM Jennison International Opportunities Fund informative and useful. The report covers performance for the12-month period that ended October 31, 2019.
While the US economy remained healthy, with rising corporate profits and strong job growth, the Federal Reserve cut interest rates three times in the
latter half of the period. The cuts were a proactive attempt by the Fed to extend the longest domestic economic expansion on record as growth in many regions weakened. China in particular showed signs of slowing amid trade tensions with the US, and turmoil in the United Kingdom continued as it negotiates an exit from the European Union.
The interest-rate cuts helped boost the performance of stocks globally. For the period overall, large-cap US equities along with stocks in developed and emerging foreign markets all rose by double digits. Small-cap US stocks posted a single-digit gain. This positive performance came despite significant volatility early in the period. Equities plunged at the end of 2018 on concerns about China’s economy, a potential global trade war, higher interest rates, and worries that profit growth might slow. Stocks reversed course early in 2019, rising sharply after the Fed moderated its position on additional rate hikes for the remainder of the year.
The overall US bond market posted strong returns during the period on a significant rally in interest rates that saw the 10-year US Treasury yield decline from over 3% to under 2%. Investment-grade corporate bonds led the way with a double-digit gain, while corporate high yield and municipal bonds each had a return in the high single digits. Globally, bonds in developed markets delivered strong returns, and emerging markets debt rose by double digits.
Regarding your investments with PGIM, we believe it is important to maintain a diversified portfolio of funds consistent with your tolerance for risk, time horizon, and financial goals. Your financial advisor can help you create a diversified investment plan that may include funds covering all the basic asset classes and that reflects your personal investor profile and risk tolerance. However, diversification and asset allocation strategies do not assure a profit or protect against loss in declining markets.
At PGIM Investments, we consider it a great privilege and responsibility to help investors participate in opportunities across global markets while meeting their toughest investment challenges. PGIM is a top-10 global investment manager with more than $1 trillion in assets under management. This scale and investment expertise allow us to deliver actively managed funds and strategies to meet the needs of investors around the globe.
Thank you for choosing our family of funds.
Sincerely,

Stuart S. Parker, President
PGIM Jennison International Opportunities Fund
December 16, 2019
| | | | |
| PGIM Jennison International Opportunities Fund | | | 5 | |
Your Fund’s Performance(unaudited)
Performance data quoted represents past performance. Past performance does not guarantee future results. The investment return and principal value of an investment will fluctuate, so that an investor’s shares, when redeemed, may be worth more or less than their original cost. Current performance may be lower or higher than the past performance data quoted. An investor may obtain performance data as of the most recent month-end by visiting our website atpgiminvestments.com or by calling (800) 225-1852.
| | | | | | | | | | | | |
| |
| | | Average Annual Total Returns as of 10/31/19 (with sales charges) | |
| | | One Year (%) | | | Five Years (%) | | | Since Inception (%) | |
| Class A | | | 16.60 | | | | 7.15 | | | | 9.21 (6/5/12) | |
| Class C | | | 21.28 | | | | 7.54 | | | | 9.21 (6/5/12) | |
| Class R | | | 22.89 | | |
| N/A
|
| | | 5.32 (11/20/17) | |
| Class Z | | | 23.56 | | | | 8.63 | | | | 10.31 (6/5/12) | |
| Class R2 | |
| N/A
|
| |
| N/A
|
| | | 30.46* (12/27/18) | |
| Class R4 | |
| N/A
|
| |
| N/A
|
| | | 30.79* (12/27/18) | |
| Class R6 | | | 23.72 | | |
| N/A
|
| | | 11.13 (12/23/15) | |
| MSCI ACWI ex-US Index | |
| | | | 11.27 | | | | 3.82 | | | | — | |
| | | | | | | | | | | | |
| |
| | | Average Annual Total Returns as of 10/31/19
(without sales charges) | |
| | | One Year (%) | | | Five Years (%) | | | Since Inception (%) | |
| Class A | | | 23.39 | | | | 8.37 | | | | 10.04 (6/5/12) | |
| Class C | | | 22.28 | | | | 7.54 | | | | 9.21 (6/5/12) | |
| Class R | | | 22.89 | | |
| N/A
|
| | | 5.32 (11/20/17) | |
| Class Z | | | 23.56 | | | | 8.63 | | | | 10.31 (6/5/12) | |
| Class R2 | | | N/A | | | | N/A | | | | 30.46* (12/27/18) | |
| Class R4 | | | N/A | | | | N/A | | | | 30.79* (12/27/18) | |
| Class R6 | |
| 23.72
|
| |
| N/A
|
| | | 11.13 (12/23/15) | |
| MSCI ACWI ex-US Index | |
| | |
| 11.27
|
| |
| 3.82
|
| | | — | |
*Not annualized.
| | |
| 6 | | Visit our website at pgiminvestments.com |
Growth of a $10,000 Investment(unaudited)
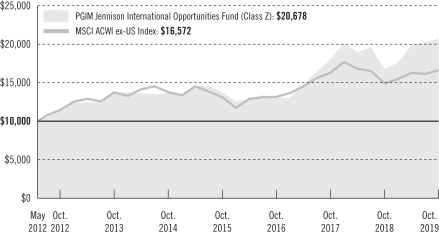
The graph compares a $10,000 investment in the Fund’s Class Z shares with a similar investment in the MSCI ACWI ex-US Index by portraying the initial account values at the commencement of operations for Class Z shares (June 5, 2012) and the account values at the end of the current fiscal year (October 31, 2019), as measured on a quarterly basis. For purposes of the graph, and unless otherwise indicated, it has been assumed that (a) all recurring fees (including management fees) were deducted; and (b) all dividends and distributions were reinvested. The line graph provides information for Class Z shares only. As indicated in the tables provided earlier, performance for other share classes will vary due to the differing charges and expenses applicable to each share class (as indicated in the following paragraphs). Without waiver of fees and/or expense reimbursements, if any, the Fund’s returns would have been lower.
Past performance does not predict future performance. Total returns and the ending account values in the graph include changes in share price and reinvestment of dividends and capital gains distributions in a hypothetical investment for the periods shown. The Fund’s total returns do not reflect the deduction of income taxes on an individual’s investment. Taxes may reduce your actual investment returns on income or gains paid by the Fund or any gains you may realize if you sell your shares.
Source: PGIM Investments LLC and Lipper Inc.
Since Inception returns are provided since the Fund has less than 10 fiscal years of returns. Since Inception returns for the Index are measured from the closest month-end to each class’ inception date.
| | | | |
| PGIM Jennison International Opportunities Fund | | | 7 | |
Your Fund’s Performance(continued)
The returns in the tables do not reflect the deduction of taxes that a shareholder would pay on Fund distributions or following the redemption of Fund shares. The average annual total returns take into account applicable sales charges, which are described for each share class in the table below.
| | | | | | | | | | | | | | |
| | | | | | | | |
| | | Class A | | Class C | | Class R | | Class Z | | Class R2 | | Class R4 | | Class R6 |
| Maximum initial sales charge | | 5.50% of the public offering price | | None | | None | | None | | None | | None | | None |
Contingent deferred sales charge (CDSC)
(as a percentage of the lower of the original purchase price or the net asset value at redemption) | | 1.00% on sales of $1 million or more made within 12 months of purchase | | 1.00% on sales made within 12 months of purchase | | None | | None | | None | | None | | None |
Annual distribution and service(12b-1) fees
(shown as a percentage of average daily net assets) | | 0.30%
(0.25% currently) | | 1.00% | | 0.75%
(0.50% currently) | | None | | 0.25% | | None | | None |
| Shareholder services fees | | None | | None | | None | | None | | 0.10% | | 0.10% | | None |
Benchmark Definitions
MSCI All Country World Index ex-US Index—The Morgan Stanley Capital International All Country Worldex-US Index (MSCI ACWI ex-US Index) is an unmanaged free float-adjusted market capitalization-weighted index that is designed to provide a broad measure of stock performance throughout the world, with the exception of US-based companies. The Index includes both developed and emerging markets. The average annual total returns for the Index measured from the month-end closest to the inception date of the Fund’s Class A, Class C, and Class Z shares are 7.05%, 0.66% for Class R shares, and 7.44% for Class R6 shares. The cumulative total return for the Index measured from the month-end closest to the inception date of the Fund’s Class R2 and Class R4 shares is 15.45%.
| | |
| 8 | | Visit our website at pgiminvestments.com |
Investors cannot invest directly in an index or average. The returns for the Index would be lower if they included the effects of sales charges, operating expenses of a mutual fund, or taxes.
Presentation of Fund Holdingsas of 10/31/19
| | | | | | |
| | | | |
| Ten Largest Holdings | | Line of Business | | Country | | % of Net Assets |
| Lululemon Athletica, Inc. | | Textiles, Apparel & Luxury Goods | | United States | | 5.0% |
| L’Oreal SA | | Personal Products | | France | | 4.5% |
| Safran SA | | Aerospace & Defense | | France | | 3.9% |
| LVMH Moet Hennessy Louis Vuitton SE | | Textiles, Apparel & Luxury Goods | | France | | 3.9% |
| Dassault Systemes SE | | Software | | France | | 3.9% |
| Ferrari NV | | Automobiles | | Italy | | 3.7% |
| Straumann Holding AG | | Health Care Equipment & Supplies | | Switzerland | | 3.7% |
| Adyen NV | | IT Services | | Netherlands | | 3.7% |
| Kweichow Moutai Co. Ltd. (Class A Stock) | | Beverages | | China | | 3.6% |
| Alibaba Group Holding Ltd. | | Internet & Direct Marketing Retail | | China | | 3.6% |
For a complete list of holdings, please refer to the Schedule of Investments section of this report. Holdings reflect only long-term Investments.
| | | | |
| PGIM Jennison International Opportunities Fund | | | 9 | |
Strategy and Performance Overview(unaudited)
How did the Fund perform?
ThePGIM Jennison International Opportunities Fund’s Class Z shares returned 23.56% in the12-month reporting period that ended October 31, 2019, outperforming the 11.27% return of the MSCI All Country Worldex-US Index (the Index).
What was the market environment?
| • | | Global equity markets were highly volatile during the reporting period. |
| • | | An abruptsell-off in late 2018 reflected mounting investor concerns about the rising risk of a major trade war with China, the pace of US economic growth, decelerating expansion innon-US economies, US interest rate increases and their effect on US growth, the state of US alliances with other major trading partners, and discord and uncertainty about domestic policy. |
| • | | US equity markets subsequently rebounded as the Federal Reserve signaled a pause in federal funds rate hikes, corporate earnings reports generally indicated continued strength, and sentiment grew that trade friction would be resolved. |
| • | | Markets fell again as the period ended on a re-escalation of trade tension. |
| • | | In the Index, information technology, utilities, real estate, and consumer discretionary posted the largest gains. Energy was the worst-performing sector and only negative sector. |
What worked?
| • | | Holdings in the consumer discretionary sector were strong contributors to the Fund’s performance during the reporting period, led byLululemon Athletica Inc. The company’s new products, integrated marketing, and online sales momentum—combined with ahigh-end customer base and “athleisure fashion trends”—drove strong customer traffic, sales conversion, and comparable store sales. The company also has strong brand positioning, international prospects, margin-expansion opportunities, and attractive return on invested capital, in Jennison’s view. |
| • | | On a sector level, stock selection in consumer staples, health care, information technology, communication services, and financials also contributed to performance. Having no exposure to the poor-performing energy sector was also beneficial. |
| • | | Other notable contributors were found among multiple sectors: |
| | • | | Shopify Inc.’s cloud-based,easy-to-use infrastructure tools position it well for the secular shift to digital commerce and accelerating demand for omnichannele-commerce in the retail industry, in Jennison’s view. Recurring revenue and gross merchandise volume growth showed strength throughout the period as the company added both small and large merchants at a robust pace. |
| | |
| 10 | | Visit our website at pgiminvestments.com |
| | • | | Kweichow Moutai is a leading Chinese spirits maker. The company’s strong brand equity and healthy distribution channels have helped it expand its market share in the premium segment. Jennison believes Kweichow stands to benefit from rising demand for premium spirits and rapid growth in its “Series” products, which target themid-range tohigh-end market segment. Furthermore, Jennison likes the company’s strong profitability, return on capital, cash flow, and balance sheet. Financial results were solid during the period. Margin expansion was driven by product mix upgrades and operating leverage. |
| | • | | Tencent Holdings Ltd., China’s largest and most-visited Internet service portal, performed fundamentally well during the period, driven by its dominant position in China’s online gaming and instant messaging markets and its growing advertising and payment-service efforts. Best known in China for its WeChat and QQ messaging along with its mobile-payment apps, the company is the world’s largest videogame publisher by revenue. Jennison expects advertising revenue gains and strong growth in its mobile-gaming and digital-content divisions to continue driving growth. |
| | • | | Paris-basedL’Oréal SA is the world’s largest beauty products company. It makes cosmetics, perfume, and hair and skin care products for the mass consumer market (L’Oréal Paris and Maybelline brands), the luxury consumer market (Lancôme), and the retail and salon markets (Redken and SoftSheen/Carson). The company generates abouttwo-thirds of its sales outside Europe, with the US and China its two largest markets. L’Oréal enjoyedtop-line momentum, market share gains, and margin expansion during the period, which Jennison believes may continue to drive superior earnings growth. |
What didn’t work?
| • | | Not having any holdings in the utilities and real estate sectors detracted from the Fund’s relative performance during the reporting period, while stock selection in the materials sector also detracted modestly. |
| | • | | Novozymes A/S is the world’s largest enzyme producer, operating across a wide range of industries to develop innovative solutions through biotechnology. Jennison’s investment thesis was that organic growth would accelerate driven by the BioAg Alliance and new product launches. Jennison sold the position by the end of the period when this thesis did not play out as expected. |
| | • | | As with other commodity-based stocks,Albemarle Corp. is exposed to supply-demand dynamics that drive underlying commodity prices. As demand for lithium has increased, so too have production levels, leading to increased supply. The resulting |
| | | | |
| PGIM Jennison International Opportunities Fund | | | 11 | |
Strategy and Performance Overview(continued)
| | drop in lithium prices made Jennison less constructive on Albemarle’s long-duration earnings power. Jennison sold the position in January 2019. |
| | • | | Based in Munich, Germany,Wirecard AG offers electronic payment and processing services in more than 120 currencies with more than 15,000 corporate customers. Its largest customer segment ise-commerce retailers in Germany and Western Europe, but it continues to expand in Asia and elsewhere. Shares declined on allegations of breaches in the company’s accounting procedures. Jennison eliminated the position in February 2019. |
| | • | | Headquartered in Sweden,Spotify Technology SA operates a music streaming platform that connects artists and music listeners, who can access the platform on an advertisement-supported basis or by paying a subscription fee. Second-quarter 2019 earnings included a slight subscriber mix. However, due to uncertainty involving long-term growth opportunities, Jennison sold the position in September 2019. |
| | • | | ASOS plc targets fashionable,Web-savvy16- to34-year-olds. Its websites offer hundreds of brands ofT-shirts, denim, dresses, footwear, lingerie, swimwear, beauty products, accessories, and jewelry. ASOS has local-language sites in France, Germany, Italy, Spain, Australia, Russia, the UK, and the US. However, after not seeing expected progress in ASOS fundamentals, Jennison sold the position in December 2018. |
Current outlook
| • | | After months of trade friction between the US and China, both consumer and business sentiment show signs of fraying. The trade war has already claimed casualties in industries directly exposed to existing tariffs. Without clarity or a new agreement with China, the fallout from already-implemented trade restraints likely will increasingly weigh on business confidence and consumer spending, in Jennison’s view, as companies take steps to mitigate these restraints and pass on the higher costs of doing business. With this uncertainty, business planning and investing likely will be hampered, with delays and hesitancy in spending probable. The US political landscape is likewise unsettled and apt to weigh on confidence and activity, as impeachment proceedings against President Trump begin and the 2020 election cycle ramps up. |
| • | | The most powerful offset to these headwinds is the health of the US consumer, in Jennison’s view. Employment remains strong, and incremental wage gains continue. |
| • | | Jennison expects the portfolio’s earnings growth to remain above market average for the balance of this year and next. Dramatic short-term moves in the market, driven by significant uncertainty in the macroeconomic environment, are leading to material near-term valuation swings. |
| | |
| 12 | | Visit our website at pgiminvestments.com |
| • | | Jennison continues to remain focused on the growth outlook of companies held in the Fund. Driven by powerful secular trends, Jennison believes the growing revenue streams of Fund holdings in industries such ase-commerce,software-as-a-service, and payments should be durable against an uncertain backdrop. |
The percentage points shown in the tables below identify each security’s positive or negative contribution to the Fund’s return, which is the sum of all contributions by individual holdings during the Fund’s reporting period.
| | | | | | |
| |
| Top Contributors (%) | | Top Detractors (%) |
| Shopify | | 2.99 | | Wirecard | | –1.98 |
| Kweichow Moutai | | 2.43 | | Novozymes | | –0.50 |
| Lululemon Athletica | | 2.06 | | Spotify Technology | | –0.48 |
| Tencent Holdings | | 1.61 | | ASOS | | –0.36 |
| L’Oreal | | 1.31 | | Albermarle | | –0.31 |
| | | | |
| PGIM Jennison International Opportunities Fund | | | 13 | |
Fees and Expenses(unaudited)
As a shareholder of the Fund, you incur two types of costs: (1) transaction costs, including sales charges (loads) on purchase payments and redemptions, as applicable, and (2) ongoing costs, including management fees, distribution, and/or service (12b-1) fees, and other Fund expenses, as applicable. This example is intended to help you understand your ongoing costs (in dollars) of investing in the Fund and to compare these costs with the ongoing costs of investing in other mutual funds.
The example is based on an investment of $1,000 held through the six-month period ended October 31, 2019. The example is for illustrative purposes only; you should consult the Prospectus for information on initial and subsequent minimum investment requirements.
Actual Expenses
The first line for each share class in the table on the following page provides information about actual account values and actual expenses. You may use the information on this line, together with the amount you invested, to estimate the expenses that you paid over the period. Simply divide your account value by $1,000 (for example, an $8,600 account value ÷ $1,000 = 8.6), then multiply the result by the number on the first line under the heading “Expenses Paid During the Six-Month Period” to estimate the expenses you paid on your account during this period.
Hypothetical Example for Comparison Purposes
The second line for each share class in the table on the following page provides information about hypothetical account values and hypothetical expenses based on the Fund’s actual expense ratio and an assumed rate of return of 5% per year before expenses, which is not the Fund’s actual return. The hypothetical account values and expenses may not be used to estimate the actual ending account balance or expenses you paid for the period. You may use this information to compare the ongoing costs of investing in the Fund and other funds. To do so, compare this 5% hypothetical example with the 5% hypothetical examples that appear in the shareholder reports of the other funds.
The Fund’s transfer agent may charge additional fees to holders of certain accounts that are not included in the expenses shown in the table on the following page. These fees apply to individual retirement accounts (IRAs) and Section 403(b) accounts. As of the close of the six-month period covered by the table, IRA fees included an annual maintenance fee of $15 per account (subject to a maximum annual maintenance fee of $25 for all accounts held by the same shareholder). Section 403(b) accounts are charged an annual $25 fiduciary maintenance fee. Some of the fees may vary in amount, or may be waived, based on your total account balance or the number of PGIM funds, including the Fund, that you own. You should consider the additional fees that were charged to your Fund account over the six-month period when you estimate the total ongoing expenses paid over the period
| | |
| 14 | | Visit our website at pgiminvestments.com |
and the impact of these fees on your ending account value, as these additional expenses are not reflected in the information provided in the expense table. Additional fees have the effect of reducing investment returns.
Please note that the expenses shown in the table are meant to highlight your ongoing costs only and do not reflect any transactional costs such as sales charges (loads). Therefore, the second line for each share class in the table is useful in comparing ongoing costs only and will not help you determine the relative total costs of owning different funds. In addition, if these transactional costs were included, your costs would have been higher.
| | | | | | | | | | | | | | | | | | |
| | | | |
PGIM
Jennison International
Opportunities Fund | | Beginning Account
Value
May 1, 2019 | | | Ending Account
Value
October 31, 2019 | | | Annualized
Expense Ratio
Based on the
Six-Month Period | | | Expenses Paid
During the
Six-Month Period* | |
| Class A | | Actual | | $ | 1,000.00 | | | $ | 1,040.50 | | | | 1.09 | % | | $ | 5.61 | |
| | Hypothetical | | $ | 1,000.00 | | | $ | 1,019.71 | | | | 1.09 | % | | $ | 5.55 | |
| Class C | | Actual | | $ | 1,000.00 | | | $ | 1,035.40 | | | | 1.92 | % | | $ | 9.85 | |
| | Hypothetical | | $ | 1,000.00 | | | $ | 1,015.53 | | | | 1.92 | % | | $ | 9.75 | |
| Class R | | Actual | | $ | 1,000.00 | | | $ | 1,038.40 | | | | 1.46 | % | | $ | 7.50 | |
| | Hypothetical | | $ | 1,000.00 | | | $ | 1,017.85 | | | | 1.46 | % | | $ | 7.43 | |
| Class Z | | Actual | | $ | 1,000.00 | | | $ | 1,041.10 | | | | 0.90 | % | | $ | 4.63 | |
| | Hypothetical | | $ | 1,000.00 | | | $ | 1,020.67 | | | | 0.90 | % | | $ | 4.58 | |
| Class R2 | | Actual | | $ | 1,000.00 | | | $ | 1,039.00 | | | | 1.26 | % | | $ | 6.48 | |
| | Hypothetical | | $ | 1,000.00 | | | $ | 1,018.85 | | | | 1.26 | % | | $ | 6.41 | |
| Class R4 | | Actual | | $ | 1,000.00 | | | $ | 1,040.60 | | | | 0.94 | % | | $ | 4.83 | |
| | Hypothetical | | $ | 1,000.00 | | | $ | 1,020.47 | | | | 0.94 | % | | $ | 4.79 | |
| Class R6 | | Actual | | $ | 1,000.00 | | | $ | 1,041.10 | | | | 0.84 | % | | $ | 4.32 | |
| | | Hypothetical | | $ | 1,000.00 | | | $ | 1,020.97 | | | | 0.84 | % | | $ | 4.28 | |
* Fund expenses (net of fee waivers or subsidies, if any) for each share class are equal to the annualized expense ratio for each share class (provided in the table), multiplied by the average account value over the period, multiplied by the 184 days in the six-month period ended October 31, 2019, and divided by the 365 days in the Fund’s fiscal year ended October 31, 2019 (to reflect the six-month period). Expenses presented in the table include the expenses of any underlying portfolios in which the Fund may invest.
| | | | |
| PGIM Jennison International Opportunities Fund | | | 15 | |
Schedule of Investments
as of October 31, 2019
| | | | | | | | |
| Description | | Shares | | | Value | |
LONG-TERM INVESTMENTS 98.4% | | | | | | | | |
| | |
COMMON STOCKS 94.9% | | | | | | | | |
| | |
Argentina 2.6% | | | | | | | | |
MercadoLibre, Inc.* | | | 30,740 | | | $ | 16,031,525 | |
| | |
Australia 2.1% | | | | | | | | |
Cochlear Ltd. | | | 90,543 | | | | 13,174,188 | |
| | |
Canada 2.4% | | | | | | | | |
Shopify, Inc. (Class A Stock)* | | | 47,542 | | | | 14,907,745 | |
| | |
China 14.5% | | | | | | | | |
Alibaba Group Holding Ltd., ADR* | | | 126,342 | | | | 22,320,841 | |
Jiangsu Hengrui Medicine Co. Ltd. (Class A Stock) | | | 940,105 | | | | 12,088,909 | |
Kweichow Moutai Co. Ltd. (Class A Stock) | | | 134,903 | | | | 22,509,531 | |
Meituan Dianping (Class B Stock)* | | | 1,338,513 | | | | 15,935,291 | |
Wuxi Biologics Cayman, Inc., 144A* | | | 1,495,636 | | | | 17,569,105 | |
| | | | | | | | |
| | | | | | | 90,423,677 | |
| | |
Denmark 1.5% | | | | | | | | |
Novo Nordisk A/S (Class B Stock) | | | 172,051 | | | | 9,411,344 | |
| | |
France 25.6% | | | | | | | | |
Airbus SE | | | 141,690 | | | | 20,287,943 | |
Dassault Systemes SE | | | 157,936 | | | | 23,983,108 | |
Kering SA | | | 19,083 | | | | 10,870,495 | |
L’Oreal SA | | | 96,770 | | | | 28,224,068 | |
LVMH Moet Hennessy Louis Vuitton SE | | | 57,232 | | | | 24,407,896 | |
Pernod Ricard SA | | | 100,975 | | | | 18,651,437 | |
Remy Cointreau SA(a) | | | 64,945 | | | | 8,693,454 | |
Safran SA | | | 155,559 | | | | 24,591,092 | |
| | | | | | | | |
| | | | | | | 159,709,493 | |
| | |
Germany 4.7% | | | | | | | | |
adidas AG | | | 52,988 | | | | 16,363,945 | |
SAP SE | | | 95,561 | | | | 12,645,312 | |
| | | | | | | | |
| | | | | | | 29,009,257 | |
| | |
Hong Kong 3.4% | | | | | | | | |
AIA Group Ltd. | | | 1,254,619 | | | | 12,452,193 | |
Techtronic Industries Co. Ltd. | | | 1,085,597 | | | | 8,501,051 | |
| | | | | | | | |
| | | | | | | 20,953,244 | |
See Notes to Financial Statements.
| | | | |
| PGIM Jennison International Opportunities Fund | | | 17 | |
Schedule of Investments(continued)
as of October 31, 2019
| | | | | | | | |
| Description | | Shares | | | Value | |
COMMON STOCKS (Continued) | | | | | | | | |
| | |
India 2.1% | | | | | | | | |
HDFC Bank Ltd., ADR | | | 218,357 | | | $ | 13,339,429 | |
| | |
Italy 5.9% | | | | | | | | |
Brunello Cucinelli SpA | | | 432,968 | | | | 13,571,810 | |
Ferrari NV | | | 146,309 | | | | 23,450,498 | |
| | | | | | | | |
| | | | | | | 37,022,308 | |
| | |
Netherlands 6.8% | | | | | | | | |
Adyen NV, 144A* | | | 32,792 | | | | 23,008,013 | |
ASML Holding NV | | | 73,480 | | | | 19,221,447 | |
| | | | | | | | |
| | | | | | | 42,229,460 | |
| | |
Switzerland 10.2% | | | | | | | | |
Alcon, Inc.* | | | 120,544 | | | | 7,120,420 | |
Givaudan SA | | | 6,227 | | | | 18,280,964 | |
Novartis AG | | | 173,805 | | | | 15,151,421 | |
Straumann Holding AG | | | 25,964 | | | | 23,183,383 | |
| | | | | | | | |
| | | | | | | 63,736,188 | |
| | |
Taiwan 1.4% | | | | | | | | |
Sea Ltd., ADR*(a) | | | 300,041 | | | | 8,929,220 | |
| | |
United Kingdom 6.7% | | | | | | | | |
Ashtead Group PLC | | | 286,491 | | | | 8,719,312 | |
AstraZeneca PLC | | | 148,291 | | | | 14,426,515 | |
Experian PLC | | | 591,604 | | | | 18,606,776 | |
| | | | | | | | |
| | | | | | | 41,752,603 | |
| | |
United States 5.0% | | | | | | | | |
Lululemon Athletica, Inc.* | | | 154,073 | | | | 31,472,492 | |
| | | | | | | | |
TOTAL COMMON STOCKS
(cost $481,223,498) | | | | | | | 592,102,173 | |
| | | | | | | | |
See Notes to Financial Statements.
| | | | | | | | |
| Description | | Shares | | | Value | |
PREFERRED STOCK 3.5% | | | | | | | | |
| | |
Germany | | | | | | | | |
Sartorius AG (PRFC)
(cost $13,598,252) | | | 114,395 | | | $ | 22,210,264 | |
| | | | | | | | |
TOTAL LONG-TERM INVESTMENTS
(cost $494,821,750) | | | | | | | 614,312,437 | |
| | | | | | | | |
| | |
SHORT-TERM INVESTMENTS 3.9% | | | | | | | | |
| | |
AFFILIATED MUTUAL FUNDS | | | | | | | | |
PGIM Core Ultra Short Bond Fund(w) | | | 11,654,389 | | | | 11,654,389 | |
PGIM Institutional Money Market Fund
(cost $12,382,600; includes $12,364,612 of cash collateral for securities on loan)(b)(w) | | | 12,381,254 | | | | 12,383,731 | |
| | | | | | | | |
TOTAL SHORT-TERM INVESTMENTS
(cost $24,036,989) | | | | | | | 24,038,120 | |
| | | | | | | | |
TOTAL INVESTMENTS 102.3%
(cost $518,858,739) | | | | | | | 638,350,557 | |
Liabilities in excess of other assets (2.3)% | | | | | | | (14,276,660 | ) |
| | | | | | | | |
NET ASSETS 100.0% | | | | | | $ | 624,073,897 | |
| | | | | | | | |
Below is a list of the abbreviation(s) used in the annual report:
144A—Security was purchased pursuant to Rule 144A under the Securities Act of 1933 and, pursuant to the requirements of Rule 144A, may not be resold except to qualified institutional buyers.
ADR—American Depositary Receipt
LIBOR—London Interbank Offered Rate
PRFC—Preference Shares
| * | Non-income producing security. |
| (a) | All or a portion of security is on loan. The aggregate market value of such securities, including those sold and pending settlement, is $12,004,657; cash collateral of $12,364,612 (included in liabilities) was received with which the Series purchased highly liquid short-term investments. |
| (b) | Represents security purchased with cash collateral received for securities on loan and includes dividend reinvestment. |
| (w) | PGIM Investments LLC, the manager of the Series, also serves as manager of the PGIM Core Ultra Short Bond Fund and PGIM Institutional Money Market Fund. |
Fair Value Measurements:
Various inputs are used in determining the value of the Series’ investments. These inputs are summarized in the three broad levels listed below.
Level 1—unadjusted quoted prices generally in active markets for identical securities.
Level 2—quoted prices for similar securities, interest rates and yield curves, prepayment speeds, foreign currency exchange rates and other observable inputs.
See Notes to Financial Statements.
| | | | |
| PGIM Jennison International Opportunities Fund | | | 19 | |
Schedule of Investments(continued)
as of October 31, 2019
Level 3—unobservable inputs for securities valued in accordance with Board approved fair valuation procedures.
The following is a summary of the inputs used as of October 31, 2019 in valuing such portfolio securities:
| | | | | | | | | | | | |
| | | Level 1 | | | Level 2 | | | Level 3 | |
Investments in Securities | | | | | | | | | | | | |
Assets | | | | | | | | | | | | |
Common Stocks | | | | | | | | | | | | |
Argentina | | $ | 16,031,525 | | | $ | — | | | $ | — | |
Australia | | | — | | | | 13,174,188 | | | | — | |
Canada | | | 14,907,745 | | | | — | | | | — | |
China | | | 22,320,841 | | | | 68,102,836 | | | | — | |
Denmark | | | — | | | | 9,411,344 | | | | — | |
France | | | — | | | | 159,709,493 | | | | — | |
Germany | | | — | | | | 29,009,257 | | | | — | |
Hong Kong | | | — | | | | 20,953,244 | | | | — | |
India | | | 13,339,429 | | | | — | | | | — | |
Italy | | | — | | | | 37,022,308 | | | | — | |
Netherlands | | | — | | | | 42,229,460 | | | | — | |
Switzerland | | | — | | | | 63,736,188 | | | | — | |
Taiwan | | | 8,929,220 | | | | — | | | | — | |
United Kingdom | | | — | | | | 41,752,603 | | | | — | |
United States | | | 31,472,492 | | | | — | | | | — | |
Preferred Stock | | | | | | | | | | | | |
Germany | | | — | | | | 22,210,264 | | | | — | |
Affiliated Mutual Funds | | | 24,038,120 | | | | — | | | | — | |
| | | | | | | | | | | | |
Total | | $ | 131,039,372 | | | $ | 507,311,185 | | | $ | — | |
| | | | | | | | | | | | |
Industry Classification:
The industry classification of investments and liabilities in excess of other assets shown as a percentage of net assets as of October 31, 2019 were as follows (unaudited):
| | | | |
Textiles, Apparel & Luxury Goods | | | 15.4 | % |
Health Care Equipment & Supplies | | | 10.5 | |
Internet & Direct Marketing Retail | | | 8.8 | |
Pharmaceuticals | | | 8.1 | |
Beverages | | | 8.0 | |
Aerospace & Defense | | | 7.2 | |
IT Services | | | 6.1 | |
Software | | | 6.0 | |
Personal Products | | | 4.5 | |
Affiliated Mutual Funds (2.0% represents investments purchased with collateral from securities on loan) | | | 3.9 | |
Automobiles | | | 3.7 | |
Semiconductors & Semiconductor Equipment | | | 3.1 | |
| | | | |
Professional Services | | | 3.0 | % |
Chemicals | | | 2.9 | |
Life Sciences Tools & Services | | | 2.8 | |
Banks | | | 2.1 | |
Insurance | | | 2.0 | |
Entertainment | | | 1.4 | |
Trading Companies & Distributors | | | 1.4 | |
Machinery | | | 1.4 | |
| | | | |
| | | 102.3 | |
Liabilities in excess of other assets | | | (2.3 | ) |
| | | | |
| | | 100.0 | % |
| | | | |
See Notes to Financial Statements.
Financial Instruments/Transactions—Summary of Offsetting and Netting Arrangements:
The Series entered into financial instruments/transactions during the reporting period that are either offset in accordance with current requirements or are subject to enforceable master netting arrangements or similar agreements that permit offsetting. The information about offsetting and related netting arrangements for financial instruments/transactions where the legal right toset-off exists is presented in the summary below.
Offsetting of financial instrument/transaction assets and liabilities:
| | | | | | | | | | | | |
Description | | Gross Market
Value of
Recognized
Assets/(Liabilities) | | | Collateral
Pledged/(Received)(1) | | | Net Amount | |
Securities on Loan | | $ | 12,004,657 | | | $ | (12,004,657 | ) | | $ | — | |
| | | | | | | | | | | | |
| (1) | Collateral amount disclosed by the Series is limited to the market value of financial instruments/transactions. |
See Notes to Financial Statements.
| | | | |
| PGIM Jennison International Opportunities Fund | | | 21 | |
Statement of Assets and Liabilities
as of October 31, 2019
| | | | |
Assets | | | | |
Investments at value, including securities on loan of $12,004,657: | | | | |
Unaffiliated investments (cost $494,821,750) | | $ | 614,312,437 | |
Affiliated investments (cost $24,036,989) | | | 24,038,120 | |
Foreign currency, at value (cost $79,464) | | | 79,732 | |
Receivable for Series shares sold | | | 3,345,632 | |
Tax reclaim receivable | | | 1,713,527 | |
Dividends receivable | | | 137 | |
Prepaid expenses and other assets | | | 5,361 | |
| | | | |
Total Assets | | | 643,494,946 | |
| | | | |
| |
Liabilities | | | | |
Payable to broker for collateral for securities on loan | | | 12,364,612 | |
Payable for investments purchased | | | 4,130,801 | |
Payable for Series shares reacquired | | | 2,272,943 | |
Management fee payable | | | 275,578 | |
Accrued expenses and other liabilities | | | 191,258 | |
Distribution fee payable | | | 125,280 | |
Affiliated transfer agent fee payable | | | 60,542 | |
Affiliated shareholder servicing fees payable | | | 35 | |
| | | | |
Total Liabilities | | | 19,421,049 | |
| | | | |
| |
Net Assets | | $ | 624,073,897 | |
| | | | |
| | | | | |
Net assets were comprised of: | | | | |
Common stock, at par | | $ | 318,071 | |
Paid-in capital in excess of par | | | 539,177,513 | |
Total distributable earnings (loss) | | | 84,578,313 | |
| | | | |
Net assets, October 31, 2019 | | $ | 624,073,897 | |
| | | | |
See Notes to Financial Statements.
| | | | |
Class A | | | | |
Net asset value and redemption price per share,
($26,777,854 ÷ 1,372,183 shares of common stock issued and outstanding) | | $ | 19.51 | |
Maximum sales charge (5.50% of offering price) | | | 1.14 | |
| | | | |
Maximum offering price to public | | $ | 20.65 | |
| | | | |
| |
Class C | | | | |
Net asset value, offering price and redemption price per share,
($5,301,826 ÷ 287,468 shares of common stock issued and outstanding) | | $ | 18.44 | |
| | | | |
| |
Class R | | | | |
Net asset value, offering price and redemption price per share,
($280,311,192 ÷ 14,386,364 shares of common stock issued and outstanding) | | $ | 19.48 | |
| | | | |
| |
Class Z | | | | |
Net asset value, offering price and redemption price per share,
($208,628,508 ÷ 10,551,582 shares of common stock issued and outstanding) | | $ | 19.77 | |
| | | | |
| |
Class R2 | | | | |
Net asset value, offering price and redemption price per share,
($233,112 ÷ 11,835 shares of common stock issued and outstanding) | | $ | 19.70 | |
| | | | |
| |
Class R4 | | | | |
Net asset value, offering price and redemption price per share,
($846,031 ÷ 42,844 shares of common stock issued and outstanding) | | $ | 19.75 | |
| | | | |
| |
Class R6 | | | | |
Net asset value, offering price and redemption price per share,
($101,975,374 ÷ 5,154,775 shares of common stock issued and outstanding) | | $ | 19.78 | |
| | | | |
See Notes to Financial Statements.
| | | | |
| PGIM Jennison International Opportunities Fund | | | 23 | |
Statement of Operations
Year Ended October 31, 2019
| | | | |
Net Investment Income (Loss) | | | | |
Income | | | | |
Unaffiliated dividend income (net of $603,845 foreign withholding tax) | | $ | 5,136,058 | |
Affiliated dividend income | | | 204,073 | |
Income from securities lending, net (including affiliated income of $22,536) | | | 48,438 | |
| | | | |
Total income | | | 5,388,569 | |
| | | | |
| |
Expenses | | | | |
Management fee | | | 4,113,335 | |
Distribution fee(a) | | | 2,194,423 | |
Shareholder servicing fees (including affiliated expense of $110)(a) | | | 247 | |
Transfer agent’s fees and expenses (including affiliated expense of $376,081)(a) | | | 535,365 | |
Custodian and accounting fees | | | 235,156 | |
Registration fees(a) | | | 142,515 | |
Shareholders’ reports | | | 69,469 | |
SEC registration fees | | | 54,619 | |
Audit fee | | | 27,875 | |
Legal fees and expenses | | | 19,505 | |
Directors’ fees | | | 19,441 | |
Miscellaneous | | | 73,254 | |
| | | | |
Total expenses | | | 7,485,204 | |
Less: Fee waiver and/or expense reimbursement(a) | | | (663,727 | ) |
Distribution fee waiver(a) | | | (705,532 | ) |
| | | | |
Net expenses | | | 6,115,945 | |
| | | | |
Net investment income (loss) | | | (727,376 | ) |
| | | | |
| |
Realized And Unrealized Gain (Loss) On Investment And Foreign Currency Transactions | | | | |
Net realized gain (loss) on: | | | | |
Investment transactions (including affiliated of $113) | | | (18,413,267 | ) |
Foreign currency transactions | | | (114,663 | ) |
| | | | |
| | | (18,527,930 | ) |
| | | | |
Net change in unrealized appreciation (depreciation) on: | | | | |
Investments (including affiliated of $3,553) | | | 124,074,160 | |
Foreign currencies | | | 59,130 | |
| | | | |
| | | 124,133,290 | |
| | | | |
Net gain (loss) on investment and foreign currency transactions | | | 105,605,360 | |
| | | | |
Net Increase (Decrease) In Net Assets Resulting From Operations | | $ | 104,877,984 | |
| | | | |
See Notes to Financial Statements.
| (a) | Class specific expenses and waivers were as follows: |
| | | | | | | | | | | | | | | | | | | | | | | | | | | | |
| | | Class A | | | Class C | | | Class R | | | Class Z | | | Class R2 | | | Class R4 | | | Class R6 | |
Distribution fee | | | 61,797 | | | | 46,836 | | | | 2,085,698 | | | | — | | | | 92 | | | | — | | | | — | |
Shareholder servicing fees | | | — | | | | — | | | | — | | | | — | | | | — | | | | 247 | | | | — | |
Transfer agent’s fees and expenses | | | 32,967 | | | | 6,173 | | | | 358,422 | | | | 136,938 | | | | 64 | | | | 280 | | | | 521 | |
Registration fees | | | 14,266 | | | | 12,975 | | | | 16,526 | | | | 25,041 | | | | 23,445 | | | | 23,445 | | | | 26,817 | |
Fee waiver and/or expense reimbursement | | | (65,139 | ) | | | (19,754 | ) | | | (253,123 | ) | | | (200,953 | ) | | | (23,491 | ) | | | (23,957 | ) | | | (77,310 | ) |
Distribution fee waiver | | | (10,299 | ) | | | — | | | | (695,233 | ) | | | — | | | | — | | | | — | | | | — | |
See Notes to Financial Statements.
| | | | |
| PGIM Jennison International Opportunities Fund | | | 25 | |
Statements of Changes in Net Assets
| | | | | | | | |
| |
| | | Year Ended October 31, | |
| | |
| | | 2019 | | | 2018 | |
Increase (Decrease) in Net Assets | | | | | | | | |
Operations | | | | | | | | |
Net investment income (loss) | | $ | (727,376 | ) | | $ | (1,656,517 | ) |
Net realized gain (loss) on investment and foreign currency transactions | | | (18,527,930 | ) | | | (6,397,062 | ) |
Net change in unrealized appreciation (depreciation) on investments and foreign currencies | | | 124,133,290 | | | | (30,907,640 | ) |
| | | | | | | | |
Net increase (decrease) in net assets resulting from operations | | | 104,877,984 | | | | (38,961,219 | ) |
| | | | | | | | |
| | |
Dividends and Distributions | | | | | | | | |
Distributions from distributable earnings | | | | | | | | |
Class Z | | | (60,708 | ) | | | (54,385 | ) |
Class R6 | | | (50,751 | ) | | | (54,898 | ) |
| | | | | | | | |
| | | (111,459 | ) | | | (109,283 | ) |
| | | | | | | | |
| | |
Series share transactions (Net of share conversions) | | | | | | | | |
Net proceeds from shares sold | | | 276,400,116 | | | | 140,754,250 | |
Net asset value of shares issued in reinvestment of dividends and distributions | | | 111,341 | | | | 109,173 | |
Net asset value of shares issued in merger | | | — | | | | 372,771,258 | |
Cost of shares reacquired | | | (181,047,151 | ) | | | (112,646,693 | ) |
| | | | | | | | |
Net increase (decrease) in net assets from Series share transactions | | | 95,464,306 | | | | 400,987,988 | |
| | | | | | | | |
Total increase (decrease) | | | 200,230,831 | | | | 361,917,486 | |
| | |
Net Assets: | | | | | | | | |
Beginning of year | | | 423,843,066 | | | | 61,925,580 | |
| | | | | | | | |
End of year | | $ | 624,073,897 | | | $ | 423,843,066 | |
| | | | | | | | |
See Notes to Financial Statements.
Notes to Financial Statements
Prudential World Fund, Inc. (the “Fund”) is registered under the Investment Company Act of 1940, as amended (“1940 Act”), as anopen-end management investment company and currently consists of seven series: PGIM Jennison Emerging Markets Equity Opportunities Fund, PGIM Jennison Global Opportunities Fund, PGIM Jennison International Opportunities Fund and PGIM QMA International Equity Fund, each of which are diversified funds and PGIM Jennison Global Infrastructure Fund, PGIM Emerging Markets Debt Hard Currency Fund and PGIM Emerging Markets Debt Local Currency Fund, each of which arenon-diversified funds for purposes of the 1940 Act and may invest a greater percentage of their assets in the securities of a single company or other issuer than a diversified fund. Investing in anon-diversified fund involves greater risk than investing in a diversified fund because a loss resulting from the decline in value of any one security may represent a greater portion of the total assets of anon-diversified fund. These financial statements relate only to the PGIM Jennison International Opportunities Fund (the “Series”).
The investment objective of the Series is to seek long-term growth of capital.
1. Accounting Policies
The Series follows the investment company accounting and reporting guidance of the Financial Accounting Standards Board (“FASB”) Accounting Standard Codification (“ASC”) Topic 946 Financial Services—Investment Companies.The following accounting policies conform to U.S. generally accepted accounting principles. The Series consistently follows such policies in the preparation of its financial statements.
Securities Valuation:The Series holds securities and other assets and liabilities that are fair valued at the close of each day (generally, 4:00 PM Eastern time) the New York Stock Exchange (“NYSE”) is open for trading. Fair value is the price that would be received to sell an asset or paid to transfer a liability in an orderly transaction between market participants on the measurement date. The Fund’s Board of Directors (the “Board”) has adopted valuation procedures for security valuation under which fair valuation responsibilities have been delegated to PGIM Investments LLC (“PGIM Investments” or the “Manager”). Pursuant to the Board’s delegation, the Manager has established a Valuation Committee responsible for supervising the fair valuation of portfolio securities and other assets and liabilities. The valuation procedures permit the Series to utilize independent pricing vendor services, quotations from market makers, and alternative valuation methods when market quotations are either not readily available or not deemed representative of fair value. A record of the Valuation Committee’s actions is subject to the Board’s review, approval, and ratification at its next regularly scheduled quarterly meeting.
For the fiscal reportingyear-end, securities and other assets and liabilities were fair valued at the close of the last U.S. business day. Trading in certain foreign securities may occur when
| | | | |
| PGIM Jennison International Opportunities Fund | | | 27 | |
Notes to Financial Statements(continued)
the NYSE is closed (including weekends and holidays). Because such foreign securities trade in markets that are open on weekends and U.S. holidays, the values of some of the Series’ foreign investments may change on days when investors cannot purchase or redeem Series shares.
Various inputs determine how the Series’ investments are valued, all of which are categorized according to the three broad levels (Level 1, 2, or 3) detailed in the Schedule of Investments and referred to herein as the “fair value hierarchy” in accordance with FASB ASC Topic 820—Fair Value Measurements and Disclosures.
Common and preferred stocks, exchange-traded funds, and derivative instruments, such as futures or options, that are traded on a national securities exchange are valued at the last sale price as of the close of trading on the applicable exchange where the security principally trades. Securities traded via NASDAQ are valued at the NASDAQ official closing price. To the extent these securities are valued at the last sale price or NASDAQ official closing price, they are classified as Level 1 in the fair value hierarchy. In the event that no sale or official closing price on valuation date exists, these securities are generally valued at the mean between the last reported bid and ask prices, or at the last bid price in the absence of an ask price. These securities are classified as Level 2 in the fair value hierarchy.
Foreign equities traded on foreign securities exchanges are generally valued using pricing vendor services that provide model prices derived using adjustment factors based on information such as local closing price, relevant general and sector indices, currency fluctuations, depositary receipts, and futures, as applicable. Securities valued using such model prices are classified as Level 2 in the fair value hierarchy. The models generate an evaluated adjustment factor for each security, which is applied to the local closing price to adjust it for post closing market movements up to the time the Series is valued. Utilizing that evaluated adjustment factor, the vendor provides an evaluated price for each security. If the vendor does not provide an evaluated price, securities are valued in accordance with exchange-traded common and preferred stock valuation policies discussed above.
Investments inopen-end,non-exchange-traded mutual funds are valued at their net asset values as of the close of the NYSE on the date of valuation. These securities are classified as Level 1 in the fair value hierarchy since they may be purchased or sold at their net asset values on the date of valuation.
Securities and other assets that cannot be priced according to the methods described above are valued based on pricing methodologies approved by the Board. In the event that unobservable inputs are used when determining such valuations, the securities will be classified as Level 3 in the fair value hierarchy.
When determining the fair value of securities, some of the factors influencing the valuation include: the nature of any restrictions on disposition of the securities; assessment of the general liquidity of the securities; the issuer’s financial condition and the markets in which it does business; the cost of the investment; the size of the holding and the capitalization of the issuer; the prices of any recent transactions or bids/offers for such securities or any comparable securities; any available analyst media or other reports or information deemed reliable by the Manager regarding the issuer or the markets or industry in which it operates. Using fair value to price securities may result in a value that is different from a security’s most recent closing price and from the price used by other unaffiliated mutual funds to calculate their net asset values.
Illiquid Securities:Pursuant to Rule22e-4 under the 1940 Act, the Series has adopted a Board approved Liquidity Risk Management Program (“LRMP”) that requires, among other things, that the Series limit its illiquid investments that are assets to no more than 15% of net assets. Illiquid securities are those that, because of the absence of a readily available market or due to legal or contractual restrictions on resale, may not reasonably be expected to be sold or disposed of in current market conditions in seven calendar days or less without the sale or disposition significantly changing the market value of the investment. The Series may find it difficult to sell illiquid securities at the time considered most advantageous by its subadviser and may incur transaction costs that would not be incurred in the sale of securities that were freely marketable.
Restricted Securities:Securities acquired in unregistered, private sales from the issuing company or from an affiliate of the issuer are considered restricted as to disposition under federal securities law (“restricted securities”). Such restricted securities are valued pursuant to the valuation procedures noted above. Restricted securities that would otherwise be considered illiquid investments pursuant to the Series’ LRMP because of legal restrictions on resale to the general public may be traded among qualified institutional buyers under Rule 144A of the Securities Act of 1933. Therefore, these Rule 144A securities, as well as commercial paper that is sold in private placements under Section 4(2) of the Securities Act of 1933, may be classified higher than “illiquid” under the LRMP (i.e. “moderately liquid” or “less liquid” investments). However, the liquidity of the Series’ investments in restricted securities could be impaired if trading does not develop or declines.
Foreign Currency Translation:The books and records of the Series are maintained in U.S. dollars. Foreign currency amounts are translated into U.S. dollars on the following basis:
(i) market value of investment securities, other assets and liabilities—at the current rates of exchange;
(ii) purchases and sales of investment securities, income and expenses—at the rates of exchange prevailing on the respective dates of such transactions.
Although the net assets of the Series are presented at the foreign exchange rates and market values at the close of the period, the Series does not generally isolate that portion of
| | | | |
| PGIM Jennison International Opportunities Fund | | | 29 | |
Notes to Financial Statements(continued)
the results of operations arising as a result of changes in the foreign exchange rates from the fluctuations arising from changes in the market prices of long-term portfolio securities held at the end of the period. Similarly, the Series does not isolate the effect of changes in foreign exchange rates from the fluctuations arising from changes in the market prices of long-term portfolio securities sold during the period. Accordingly, holding period realized foreign currency gains (losses) are included in the reported net realized gains (losses) on investment transactions.
Net realized gains (losses) on foreign currency transactions represent net foreign exchange gains (losses) from the disposition of holdings of foreign currencies, currency gains (losses) realized between the trade and settlement dates on forward currency transactions, and the difference between the amounts of interest, dividends and foreign withholding taxes recorded on the Series’ books and the U.S. dollar equivalent amounts actually received or paid. Net unrealized currency gains (losses) arise from valuing foreign currency denominated assets and liabilities (other than investments) at period end exchange rates.
Master Netting Arrangements:The Fund, on behalf of the Series, is subject to various Master Agreements, or netting arrangements, with select counterparties. These are agreements which a subadviser may have negotiated and entered into on behalf of all or a portion of the Series. A master netting arrangement between the Series and the counterparty permits the Series to offset amounts payable by the Series to the same counterparty against amounts to be received; and by the receipt of collateral from the counterparty by the Series to cover the Series’ exposure to the counterparty. However, there is no assurance that such mitigating factors are easily enforceable. In addition to master netting arrangements, the right toset-off exists when all the conditions are met such that each of the parties owes the other determinable amounts, the reporting party has the right toset-off the amount owed with the amount owed by the other party, the reporting party intends toset-off and the right ofset-off is enforceable by law. During the reporting period, there was no intention to settle on a net basis and all amounts are presented on a gross basis on the Statement of Assets and Liabilities.
Securities Lending:The Series lends its portfolio securities to banks and broker-dealers. The loans are secured by collateral at least equal to the market value of the securities loaned. Collateral pledged by each borrower is invested in an affiliated money market fund and is marked to market daily, based on the previous day’s market value, such that the value of the collateral exceeds the value of the loaned securities. In the event of significant appreciation in value of securities on loan on the last business day of the reporting period, the financial statements may reflect a collateral value that is less than the market value of the loaned securities. Such shortfall is remedied as described above. Loans are subject to termination at the option of the borrower or the Series. Upon termination of the loan, the borrower will return to the Series securities identical to the loaned securities. Should the borrower of the
securities fail financially, the Series has the right to repurchase the securities in the open market using the collateral.
The Series recognizes income, net of any rebate and securities lending agent fees, for lending its securities in the form of fees or interest on the investment of any cash received as collateral. The borrower receives all interest and dividends from the securities loaned and such payments are passed back to the lender in amounts equivalent thereto. The Series also continues to recognize any unrealized gain (loss) in the market price of the securities loaned and on the change in the value of the collateral invested that may occur during the term of the loan. In addition, realized gain (loss) is recognized on changes in the value of the collateral invested upon liquidation of the collateral. Net earnings from securities lending are disclosed on the Statement of Operations as “Income from securities lending, net”.
Securities Transactions and Net Investment Income:Securities transactions are recorded on the trade date. Realized gains (losses) from investment and currency transactions are calculated on the specific identification method. Dividend income is recorded on theex-date, or for certain foreign securities, when the Series becomes aware of such dividends. Expenses are recorded on an accrual basis, which may require the use of certain estimates by management that may differ from actual. Net investment income or loss (other than class specific expenses and waivers, which are allocated as noted below) and unrealized and realized gains (losses) are allocated daily to each class of shares based upon the relative proportion of adjusted net assets of each class at the beginning of the day. Class specific expenses and waivers, where applicable, are charged to the respective share classes. Class specific expenses include distribution fees and distribution fee waivers, shareholder servicing fees, transfer agent’s fees and expenses, registration fees and fee waivers and/or expense reimbursements, as applicable.
Taxes:It is the Series’ policy to continue to meet the requirements of the Internal Revenue Code applicable to regulated investment companies and to distribute all of its taxable net investment income and capital gains, if any, to its shareholders. Therefore, no federal income tax provision is required. Withholding taxes on foreign dividends, interest and capital gains, if any, are recorded, net of reclaimable amounts, at the time the related income is earned.
Dividends and Distributions:The Series expects to pay dividends from net investment income and distributions from net realized capital and currency gains, if any, annually. Dividends and distributions to shareholders, which are determined in accordance with federal income tax regulations and which may differ from generally accepted accounting principles, are recorded on theex-date. Permanent book/tax differences relating to income and gain (loss) are reclassified between total distributable earnings (loss) andpaid-in capital in excess of par, as appropriate.
Estimates:The preparation of financial statements requires management to make estimates and assumptions that affect the reported amounts and disclosures in the financial statements. Actual results could differ from those estimates.
| | | | |
| PGIM Jennison International Opportunities Fund | | | 31 | |
Notes to Financial Statements(continued)
2. Agreements
The Fund, on behalf of the Series, has a management agreement with the Manager. Pursuant to this agreement, the Manager has responsibility for all investment advisory services and supervises the subadviser’s performance of such services. In addition, under the management agreement, the Manager provides all of the administrative functions necessary for the organization, operation and management of the Series. The Manager administers the corporate affairs of the Series and, in connection therewith, furnishes the Series with office facilities, together with those ordinary clerical and bookkeeping services which are not being furnished by the Series’ custodian and the Series’ transfer agent. The Manager is also responsible for the staffing and management of dedicated groups of legal, marketing, compliance and related personnel necessary for the operation of the Series. The legal, marketing, compliance and related personnel are also responsible for the management and oversight of the various service providers to the Series, including, but not limited to, the custodian, transfer agent, and accounting agent.
The Manager has entered into a subadvisory agreement with Jennison Associates LLC (“Jennison”). The subadvisory agreement provides that Jennison will furnish investment advisory services in connection with the management of the Series. In connection therewith, Jennison is obligated to keep certain books and records of the Series. The Manager pays for the services of Jennison, the cost of compensation of officers of the Series, occupancy and certain clerical and bookkeeping costs of the Series. The Series bears all other costs and expenses.
The management fee paid to the Manager is accrued daily and payable monthly at an annual rate of 0.825% of the Series’ on average daily net assets up to and including $1 billion and 0.800% of such assets in excess of $1 billion. The effective management fee rate before any waivers and/or expense reimbursements was 0.825% for the year ended October 31, 2019.
The Manager has contractually agreed, through February 28, 2021, to reimburse and/or waive fees so that the Series’ net annual operating expenses of each share class does not exceed 0.84% of the Series’ average daily net assets (exclusive of distribution and service(12b-1) fees, and transfer agency expenses (includingsub-transfer agency and networking fees)) and to limit transfer agency, shareholder servicing,sub-transfer agency, and blue sky fees, as applicable, to the extent that such fees cause the net annual operating expenses to exceed 1.34% of average daily net assets for Class R2 shares or 1.09% of average daily net assets for Class R4 shares. Additionally, the Manager has contractually agreed, through February 28, 2021, to limit total annual operating expenses after fee waivers and/or expense reimbursements to 1.09% of average daily net assets for Class A shares. Separately, the Manager has contractually agreed to waive and/or reimburse up to 0.06% of certain other expenses on an annualized basis, through February 28, 2021, to the extent that the total net
annual operating expenses exceed 1.90% of average daily net assets for Class C shares, 1.48% of average daily net assets for Class R shares, 0.90% of average daily net assets for Class Z shares and 0.84% of average daily net assets for Class R6 shares. The contractual waivers and expense limitation above exclude interest, brokerage, taxes (such as income and foreign withholding taxes, stamp duty and deferred tax expenses), acquired fund fees and expenses, extraordinary expenses, and certain other Series expenses such as dividend and interest expense and broker charges on short sales. Where applicable, the Manager agrees to waive management fees or shared operating expenses on any share class to the same extent that it waives similar expenses on any other share class. In addition, total annual operating expenses for Class R6 shares will not exceed total annual operating expenses for Class Z shares. Fees and/or expenses waived and/or reimbursed by the Manager may be recouped by the Manager within the same fiscal year during which such waiver and/or reimbursement is made if such recoupment can be realized without exceeding the expense limit in effect at the time of the recoupment for the fiscal year.
The Fund, on behalf of the Series, has a distribution agreement with Prudential Investment Management Services LLC (“PIMS”), which acts as the distributor of the Class A, Class C, Class R, Class Z, Class R2, Class R4 and Class R6 shares of the Series. The Series compensates PIMS for distributing and servicing the Series’ Class A, Class C, Class R and Class R2 shares, pursuant to the plans of distribution (the “Distribution Plans”), regardless of expenses actually incurred by PIMS. The distribution fees are accrued daily and payable monthly. No distribution or service fees are paid to PIMS as distributor of the Class Z, Class R4 and Class R6 shares of the Series.
Pursuant to the Distribution Plans, the Series compensates PIMS for distribution related activities at an annual rate of up to 0.30%, 1%, 0.75% and 0.25% of the average daily net assets of the Class A, Class C, Class R and Class R2 shares, respectively. PIMS has contractually agreed through February 28, 2021 to limit such expenses to 0.25% and 0.50% of the average daily net assets of the Class A and Class R shares, respectively.
The Series has adopted a Shareholder Services Plan with respect to Class R2 and Class R4 shares. Under the terms of the Shareholder Services Plan, Class R2 and Class R4 shares are authorized to pay to Prudential Mutual Fund Services LLC (“PMFS”), its affiliates or third-party service providers, as compensation for services rendered to the shareholders of such Class R2 or Class R4 shares, a shareholder service fee at an annual rate of 0.10% of the average daily net assets attributable to Class R2 and Class R4 shares. The shareholder service fee is accrued daily and paid monthly.
For the year ended October 31, 2019, PIMS received $129,506 infront-end sales charges resulting from sales of Class A shares. Additionally, for the year ended October 31, 2019, PIMS received $909 and $1,295 in contingent deferred sales charges imposed upon redemptions by certain Class A and Class C shareholders. From these fees, PIMS paid such sales charges to broker-dealers, who in turn paid commissions to salespersons and incurred other distribution costs.
| | | | |
| PGIM Jennison International Opportunities Fund | | | 33 | |
Notes to Financial Statements(continued)
PGIM Investments, PIMS and Jennison are indirect, wholly-owned subsidiaries of Prudential Financial, Inc. (“Prudential”).
3. Other Transactions with Affiliates
Prudential Mutual Fund Services LLC (“PMFS”), an affiliate of PGIM Investments and an indirect, wholly-owned subsidiary of Prudential, serves as the Fund’s transfer agent. Transfer agent’s fees and expenses in the Statement of Operations include certainout-of-pocket expenses paid tonon-affiliates, where applicable.
The Series may invest its overnight sweep cash in the PGIM Core Ultra Short Bond Fund (the “Core Fund”), and its securities lending cash collateral in the PGIM Institutional Money Market Fund (the “Money Market Fund”), each a series of Prudential Investment Portfolios 2, registered under the 1940 Act and managed by PGIM Investments. Through the Fund’s investments in the mentioned underlying funds, PGIM Investments and/or its affiliates are paid fees or reimbursed for providing their services. In addition to the realized and unrealized gains on investments in the Core Fund and Money Market Fund, earnings from such investments are disclosed on the Statement of Operations as “Affiliated dividend income” and “Income from securities lending, net”, respectively.
The Series may enter into certain securities purchase or sale transactions under Board approved Rule17a-7 procedures. Rule17a-7 is an exemptive rule under the 1940 Act, that subject to certain conditions, permits purchase and sale transactions among affiliated investment companies, or between an investment company and a person that is affiliated solely by reason of having a common (or affiliated) investment adviser, common directors, and/or common officers. Pursuant to the Rule17a-7 procedures and consistent with guidance issued by the SEC, the Fund’s Chief Compliance Officer (“CCO”) prepares a quarterly summary of all such transactions for submission to the Board, together with the CCO’s written representation that all such17a-7 transactions were effected in accordance with the Series’ Rule17a-7 procedures. For the year ended October 31, 2019, no17a-7 transactions were entered into by the Series.
4. Portfolio Securities
The aggregate cost of purchases and proceeds from sales of portfolio securities (excluding short-term investments and U.S. Government securities) for the year ended October 31, 2019, were $353,014,956 and $260,482,790, respectively.
A summary of the cost of purchases and proceeds from sales of shares of affiliated investments for the year ended October 31, 2019, is presented as follows:
| | | | | | | | | | | | | | | | | | | | | | | | | | | | | | |
Value,
Beginning
of Year | | | Cost of
Purchases | | | Proceeds
from Sales | | | Change in
Unrealized
Gain
(Loss) | | | Realized
Gain
(Loss) | | | Value,
End of
Year | | | Shares,
End of
Year | | | Income | |
| | PGIM Core Ultra Short Bond Fund* | | | | | | | | | | | | | | | | | | | | | |
| $ | 16,359,986 | | | $ | 291,331,814 | | | $ | 296,037,411 | | | $ | — | | | $ | — | | | $ | 11,654,389 | | | | 11,654,389 | | | $ | 204,073 | |
| | | | | |
| | PGIM Institutional Money Market Fund* | | | | | | | | | | | | | | | | | | | | | |
| | 25,773,727 | | | | 178,831,336 | | | | 192,224,998 | | | | 3,553 | | | | 113 | | | | 12,383,731 | | | | 12,381,254 | | | | 22,536 | ** |
| | | | | | | | | | | | | | | | | | | | | | | | | | | | | | |
| $ | 42,133,713 | | | $ | 470,163,150 | | | $ | 488,262,409 | | | $ | 3,553 | | | $ | 113 | | | $ | 24,038,120 | | | | | | | $ | 226,609 | |
| | | | | | | | | | | | | | | | | | | | | | | | | | | | | | |
| * | The Fund did not have any capital gain distributions during the reporting period. |
| ** | This amount is included in “Income from securities lending, net” on the Statement of Operations. |
5. Distributions and Tax Information
Distributions to shareholders, which are determined in accordance with federal income tax regulations and which may differ from generally accepted accounting principles, are recorded on theex-date. In order to present total distributable earnings (loss) andpaid-in-capital in excess of par on the Statement of Assets and Liabilities that more closely represent their tax character, certain adjustments have been made to total distributable earnings (loss) andpaid-in capital in excess of par. For the year ended October 31, 2019, the adjustments were to increase total distributable earnings and decreasepaid-in capital in excess of par by $846,157 primarily due to a net operating loss. Net investment income, net realized gain (loss) on investments and foreign currency transactions and net assets were not affected by this change.
For the year ended October 31, 2019, the tax character of dividends paid by the Series was $111,459 of ordinary income. For the year ended October 31, 2018, the tax character of dividends paid by the Series was $109,283 of ordinary income.
As of October 31, 2019, there were no accumulated undistributed earnings on a tax basis.
The United States federal income tax basis of the Series’ investments and the net unrealized appreciation as of October 31, 2019 were as follows:
| | | | | | |
Tax Basis | | Gross Unrealized Appreciation | | Gross Unrealized Depreciation | | Net Unrealized Appreciation |
| $527,509,574 | | $114,392,436 | | $(3,551,453) | | $110,840,983 |
The difference between book basis and tax basis is primarily attributable to deferred losses on wash sales and other cost basis adjustments between financial and tax accounting.
For federal income tax purposes, the Series had a capital loss carryforward as of October 31, 2019 of approximately $26,263,000 which can be carried forward for an unlimited period.
| | | | |
| PGIM Jennison International Opportunities Fund | | | 35 | |
Notes to Financial Statements(continued)
No capital gains distributions are expected to be paid to shareholders until net gains have been realized in excess of such losses.
The Manager has analyzed the Series’ tax positions taken on federal, state and local income tax returns for all open tax years and has concluded that no provision for income tax is required in the Series’ financial statements for the current reporting period. Since tax authorities can examine previously filed tax returns, the Series’ U.S. federal and state tax returns for each of the four fiscal years up to the most recent fiscal year ended October 31, 2019 are subject to such review.
6. Capital and Ownership
The Series offers Class A, Class C, Class R, Class Z, Class R2, Class R4 and Class R6 shares. Class A shares are sold with a maximumfront-end sales charge of 5.50%. Investors who purchase $1 million or more of Class A shares and sell these shares within 12 months of purchase are subject to a contingent deferred sales charge (“CDSC”) of 1%, although they are not subject to an initial sales charge. The Class A CDSC is waived for certain retirement and/or benefit plans. A special exchange privilege is also available for shareholders who qualified to purchase Class A shares at net asset value. Class C shares are sold with a CDSC of 1% on sales made within 12 months of purchase. Class C shares will automatically convert to Class A shares on a monthly basis approximately 10 years after purchase. Class R, Class Z, Class R2, Class R4 and Class R6 shares are not subject to any sales or redemption charge and are available exclusively for sale to a limited group of investors.
Under certain circumstances, an exchange may be made from specified share classes of the Series to one or more other share classes of the Series as presented in the table of transactions in shares of common stock.
The Fund is authorized to issue 5.075 billion shares of common stock, with a par value of $0.01 per share, which is divided into seven series. There are 900 million shares authorized for the Series, divided into eight classes, designated Class A, Class C, Class R, Class Z, Class R2, Class R4, and Class R6 and Class T common stock, each of which consists of 50 million, 50 million, 150 million, 175 million, 75 million, 75 million, 200 million and 125 million authorized shares, respectively. The Series currently does not have any Class T shares outstanding.
As of October 31, 2019, Prudential, through its affiliated entities, including affiliated funds (if applicable), owned 14,153,009 Class R shares, 662 Class R2 shares, 11,825 Class R4 shares and 748 Class R6 shares of the Series. At reporting period end, five shareholders of
record, each holding greater than 5% of the Series, held 79% of the Series’ outstanding shares, of which 45% were held by an affiliate of Prudential.
Transactions in shares of common stock were as follows:
| | | | | | | | |
Class A | | Shares | | | Amount | |
Year ended October 31, 2019: | | | | | | | | |
Shares sold | | | 886,104 | | | $ | 15,632,195 | |
Shares reacquired | | | (462,602 | ) | | | (8,013,084 | ) |
| | | | | | | | |
Net increase (decrease) in shares outstanding before conversion | | | 423,502 | | | | 7,619,111 | |
Shares issued upon conversion from other share class(es) | | | 70,212 | | | | 1,217,757 | |
Shares reacquired upon conversion into other share class(es) | | | (37,544 | ) | | | (681,733 | ) |
| | | | | | | | |
Net increase (decrease) in shares outstanding | | | 456,170 | | | $ | 8,155,135 | |
| | | | | | | | |
Year ended October 31, 2018: | | | | | | | | |
Shares sold | | | 660,533 | | | $ | 11,796,123 | |
Shares reacquired | | | (104,212 | ) | | | (1,857,275 | ) |
| | | | | | | | |
Net increase (decrease) in shares outstanding before conversion | | | 556,321 | | | | 9,938,848 | |
Shares issued upon conversion from other share class(es) | | | 55,205 | | | | 1,034,432 | |
Shares reacquired upon conversion into other share class(es) | | | (5,627 | ) | | | (102,838 | ) |
| | | | | | | | |
Net increase (decrease) in shares outstanding | | | 605,899 | | | $ | 10,870,442 | |
| | | | | | | | |
Class C | | | | | | |
Year ended October 31, 2019: | | | | | | | | |
Shares sold | | | 161,032 | | | $ | 2,618,485 | |
Shares reacquired | | | (104,446 | ) | | | (1,712,809 | ) |
| | | | | | | | |
Net increase (decrease) in shares outstanding before conversion | | | 56,586 | | | | 905,676 | |
Shares reacquired upon conversion into other share class(es) | | | (21,102 | ) | | | (374,296 | ) |
| | | | | | | | |
Net increase (decrease) in shares outstanding | | | 35,484 | | | $ | 531,380 | |
| | | | | | | | |
Year ended October 31, 2018: | | | | | | | | |
Shares sold | | | 205,864 | | | $ | 3,575,262 | |
Shares reacquired | | | (56,955 | ) | | | (961,489 | ) |
| | | | | | | | |
Net increase (decrease) in shares outstanding before conversion | | | 148,909 | | | | 2,613,773 | |
Shares reacquired upon conversion into other share class(es) | | | (4,015 | ) | | | (65,643 | ) |
| | | | | | | | |
Net increase (decrease) in shares outstanding | | | 144,894 | | | $ | 2,548,130 | |
| | | | | | | | |
Class R | | | | | | |
Year ended October 31, 2019: | | | | | | | | |
Shares sold | | | 1,569,074 | | | $ | 25,316,140 | |
Shares reacquired | | | (3,973,963 | ) | | | (71,057,632 | ) |
| | | | | | | | |
Net increase (decrease) in shares outstanding | | | (2,404,889 | ) | | $ | (45,741,492 | ) |
| | | | | | | | |
Period ended October 31, 2018*: | | | | | | | | |
Shares sold | | | 824,982 | | | $ | 14,999,820 | |
Shares reacquired | | | (3,064,934 | ) | | | (55,429,940 | ) |
Shares issued in merger | | | 19,031,205 | | | | 329,810,775 | |
| | | | | | | | |
Net increase (decrease) in shares outstanding | | | 16,791,253 | | | $ | 289,380,655 | |
| | | | | | | | |
| | | | |
| PGIM Jennison International Opportunities Fund | | | 37 | |
Notes to Financial Statements(continued)
| | | | | | | | |
Class Z | | Shares | | | Amount | |
Year ended October 31, 2019: | | | | | | | | |
Shares sold | | | 7,751,651 | | | $ | 141,168,748 | |
Shares issued in reinvestment of dividends and distributions | | | 3,966 | | | | 60,590 | |
Shares reacquired | | | (3,691,880 | ) | | | (64,859,207 | ) |
| | | | | | | | |
Net increase (decrease) in shares outstanding before conversion | | | 4,063,737 | | | | 76,370,131 | |
Shares issued upon conversion from other share class(es) | | | 40,055 | | | | 738,030 | |
Shares reacquired upon conversion into other share class(es) | | | (54,165 | ) | | | (928,258 | ) |
| | | | | | | | |
Net increase (decrease) in shares outstanding | | | 4,049,627 | | | $ | 76,179,903 | |
| | | | | | | | |
Year ended October 31, 2018: | | | | | | | | |
Shares sold | | | 5,157,111 | | | $ | 93,161,083 | |
Shares issued in reinvestment of dividends and distributions | | | 3,125 | | | | 54,275 | |
Shares reacquired | | | (2,729,560 | ) | | | (48,279,119 | ) |
Shares issued in merger | | | 2,461,464 | | | | 42,854,094 | |
| | | | | | | | |
Net increase (decrease) in shares outstanding before conversion | | | 4,892,140 | | | | 87,790,333 | |
Shares issued upon conversion from other share class(es) | | | 6,420 | | | | 118,183 | |
Shares reacquired upon conversion into other share class(es) | | | (51,659 | ) | | | (984,134 | ) |
| | | | | | | | |
Net increase (decrease) in shares outstanding | | | 4,846,901 | | | $ | 86,924,382 | |
| | | | | | | | |
Class R2 | | | | | | |
Period ended October 31, 2019**: | | | | | | | | |
Shares sold | | | 11,835 | | | $ | 224,514 | |
Shares reacquired | | | — | | | | (1 | ) |
| | | | | | | | |
Net increase (decrease) in shares outstanding | | | 11,835 | | | $ | 224,513 | |
| | | | | | | | |
Class R4 | | | | | | |
Period ended October 31, 2019**: | | | | | | | | |
Shares sold | | | 44,181 | | | $ | 838,319 | |
Shares reacquired | | | (1,337 | ) | | | (25,439 | ) |
| | | | | | | | |
Net increase (decrease) in shares outstanding | | | 42,844 | | | $ | 812,880 | |
| | | | | | | | |
Class R6 | | | | | | |
Year ended October 31, 2019: | | | | | | | | |
Shares sold | | | 4,858,514 | | | $ | 90,601,715 | |
Shares issued in reinvestment of dividends and distributions | | | 3,322 | | | | 50,751 | |
Shares reacquired | | | (1,901,872 | ) | | | (35,378,979 | ) |
| | | | | | | | |
Net increase (decrease) in shares outstanding before conversion | | | 2,959,964 | | | | 55,273,487 | |
Shares issued upon conversion from other share class(es) | | | 1,565 | | | | 28,500 | |
| | | | | | | | |
Net increase (decrease) in shares outstanding | | | 2,961,529 | | | $ | 55,301,987 | |
| | | | | | | | |
Year ended October 31, 2018: | | | | | | | | |
Shares sold | | | 994,673 | | | $ | 17,221,962 | |
Shares issued in reinvestment of dividends and distributions | | | 3,160 | | | | 54,898 | |
Shares reacquired | | | (329,043 | ) | | | (6,118,870 | ) |
Shares issued in merger | | | 6,114 | | | | 106,389 | |
| | | | | | | | |
Net increase (decrease) in shares outstanding | | | 674,904 | | | $ | 11,264,379 | |
| | | | | | | | |
| * | Commencement of offering was November 20, 2017. |
| ** | Commencement of offering was December 27, 2018. |
7. Borrowings
The Fund, on behalf of the Series, along with other affiliated registered investment companies (the “Funds”), is a party to a Syndicated Credit Agreement (“SCA”) with a group of banks. The purpose of the SCA is to provide an alternative source of temporary funding for capital share redemptions. The table below provides details of the current SCA in effect at the reportingperiod-end as well as the prior SCA.
| | | | |
| | | Current SCA | | Prior SCA |
| Term of Commitment | | 10/3/2019 – 10/1/2020 | | 10/4/2018 – 10/2/2019 |
| Total Commitment | | $ 900 million | | $ 900 million |
| Annualized Commitment Fee on the Unused Portion of the SCA | | 0.15% | | 0.15% |
| Annualized Interest Rate on Borrowings | | 1.20% plus the higher of (1) the effective federal funds rate, (2) theone-month LIBOR rate or (3) zero percent | | 1.25% plus the higher of (1) the effective federal funds rate, (2) theone-month LIBOR rate or (3) zero percent |
Certain affiliated registered investment companies that are parties to the SCA include portfolios that are subject to a predetermined mathematical formula used to manage certain benefit guarantees offered under variable annuity contracts. The formula may result in large scale asset flows into and out of these portfolios. Consequently, these portfolios may be more likely to utilize the SCA for purposes of funding redemptions. It may be possible for those portfolios to fully exhaust the committed amount of the SCA, thereby requiring the Manager to allocate available funding per a Board-approved methodology designed to treat the Funds in the SCA equitably.
The Series did not utilize the SCA during the year ended October 31, 2019.
8. Risks of Investing in the Series
The Series’ risks include, but are not limited to, some or all of the risks discussed below:
Emerging Markets Risk:The risks of foreign investments are greater for investments in or exposed to emerging markets. Emerging market countries typically have economic and political systems that are less fully developed, and can be expected to be less stable, than those of more developed countries. For example, the economies of such countries can be subject to rapid and unpredictable rates of inflation or deflation. Low trading volumes may result in a lack of liquidity and price volatility.
Equity and Equity-Related Securities Risks:The value of a particular security could go down and you could lose money. In addition to an individual security losing value, the value of the equity markets or a sector in which the Series invests could go down. The Series’ holdings can vary significantly from broad market indexes and the performance of the Series can deviate from the performance of these indexes. Different parts of a market can react differently to adverse issuer, market, regulatory, political and economic developments.
| | | | |
| PGIM Jennison International Opportunities Fund | | | 39 | |
Notes to Financial Statements(continued)
Foreign Securities Risk:The Series’ investments in securities of foreign issuers or issuers with significant exposure to foreign markets involve additional risk. Foreign countries in which the Series may invest may have markets that are less liquid, less regulated and more volatile than US markets. The value of the Series’ investments may decline because of factors affecting the particular issuer as well as foreign markets and issuers generally, such as unfavorable government actions, and political or financial instability.
Market and Credit Risk:Securities markets may be volatile and the market prices of the Series’ securities may decline. Securities fluctuate in price based on changes in an issuer’s financial condition and overall market and economic conditions. If the market prices of the securities owned by the Series fall, the value of an investment in the Series will decline. Additionally, the Series may also be exposed to credit risk in the event that an issuer or guarantor fails to perform or that an institution or entity with which the Series has unsettled or open transactions defaults.
9. Reorganization
On June 7, 2017, the Board approved an Agreement and Plan of Reorganization (the “Plans”) which provided for the transfer of all the assets of Target International Equity Portfolio (the “Merged Portfolio”) for shares of Jennison International Opportunities Fund (the “Acquiring Fund”) and the assumption of the liabilities of the Merged Portfolio respectively. Shareholders approved the Plan at a meeting on November 28, 2017 and the reorganization took place on December 15, 2017.
On the reorganization date, the Merged Portfolio had the following total investment cost and value, representing the principal assets acquired by the Acquiring Fund:
| | | | | | | | |
Merged Portfolio | | Total Investment
Value | | | Total Investment
Cost | |
Target International Equity Portfolio | | $ | 325,193,997 | | | $ | 319,368,212 | |
The purpose of the transaction was to combine two funds with substantially similar investment objectives and policies.
The acquisition was accomplished by atax-free exchange of the following shares on December 15, 2017:
| | | | | | | | | | | | | | | | |
| Merged Portfolio | | | Acquiring Fund | | | | |
Target International
Equity Portfolio | | | Jennison International
Opportunities Fund | | | | |
Class | | Shares | | | Class | | | Shares | | | Value | |
| R | | | 28,199,749 | | | | R | | | | 19,031,205 | | | $ | 329,810,775 | |
| Z | | | 3,655,174 | | | | Z | | | | 2,461,464 | | | | 42,854,094 | |
| R6 | | | 9,077 | | | | R6 | | | | 6,114 | | | | 106,389 | |
For financial reporting purposes, assets received and shares issued by the Acquiring Fund were recorded at fair value; however, the cost basis of the investments received from the Merged Portfolio were carried forward to reflect thetax-free status of the acquisition.
The net assets and net unrealized appreciation on investments immediately before the acquisition were as follows:
| | | | | | | | | | | | | | | | |
| Merged Portfolio | | | | | | Acquiring Fund | |
Target International
Equity Portfolio | | | Unrealized Appreciation
on Investments | | | Jennison International
Opportunities Fund | |
Class | | Net assets | | | Class | | | Net assets | |
| R | | $ | 329,810,775 | | | $ | 5,154,385 | | | | R | | | $ | 9,834 | |
| Z | | | 42,854,094 | | | | 669,737 | | | | Z | | | | 31,606,586 | |
| R6 | | | 106,389 | | | | 1,663 | | | | R6 | | | | 26,367,768 | |
Assuming the acquisition had been completed on August 1, 2017, the Acquiring Fund’s unaudited pro forma results of operations for the year ended October 31, 2018 would have been as follows:
| | | | | | | | | | | | |
Acquiring Fund | | Net
Investment
loss (a) | | | Net realized
and unrealized
loss on
investments (b) | | | Net decrease
in net assets
resulting from
operations | |
Jennison International Opportunities Fund | | | (375,158 | ) | | | (23,698,604 | ) | | | (24,073,762 | ) |
| (a) | Net investment income (loss) as reported in the Statement of Operations (year ended October 31, 2018) of the Acquiring Fund, plus net investment income from the Merged Portfoliopre-merger as follows: Target International Equity Portfolio $1,281,359. |
| (b) | Net realized and unrealized gain (loss) on investments as reported in the Statement of Operations (year ended October 31, 2018) of the Acquiring Fund, plus net realized and unrealized gain (loss) on investments from the Merged Portfoliopre-merger as follows: Target International Equity Portfolio $13,606,098. |
Since both the Merged Portfolio and the Acquiring Fund sold and redeemed shares throughout the period, it is not practicable to providepro-forma information on aper-share basis.
| | | | |
| PGIM Jennison International Opportunities Fund | | | 41 | |
Notes to Financial Statements(continued)
10. Recent Accounting Pronouncements and Reporting Updates
In August 2018, the FASB issued Accounting Standards Update (“ASU”)No. 2018-13, which changes certain fair value measurement disclosure requirements. The new ASU, in addition to other modifications and additions, removes the requirement to disclose the amount and reasons for transfers between Level 1 and Level 2 of the fair value hierarchy, and the Series’ policy for the timing of transfers between levels. The amendments are effective for financial statements issued for fiscal years beginning after December 15, 2019, and interim periods within those fiscal years. The Manager has evaluated the implications of certain provisions of the ASU and has determined to early adopt aspects related to the removal and modification of certain fair value measurement disclosures under the ASU effective immediately. The Manager continues to evaluate certain other provisions of the ASU and does not expect a material impact to financial statement disclosures.
Financial Highlights
| | | | | | | | | | | | | | | | | | | | |
| Class A Shares | | | | | | | | | | | | | | | |
| | | | | | Year Ended October 31, | | | | |
| | | 2019 | | | 2018 | | | 2017 | | | 2016 | | | 2015 | |
| Per Share Operating Performance(a): | | | | | | | | | | | | | | | | | | | | |
| Net Asset Value, Beginning of Year | | | $15.82 | | | | $17.10 | | | | $12.36 | | | | $13.09 | | | | $13.06 | |
| Income (loss) from investment operations: | | | | | | | | | | | | | | | | | | | | |
| Net investment income (loss) | | | 0.01 | | | | (0.06 | ) | | | (0.01 | ) | | | 0.02 | | | | (0.05 | ) |
| Net realized and unrealized gain (loss) on investment and foreign currency transactions | | | 3.68 | | | | (1.22 | ) | | | 4.75 | | | | (0.75 | ) | | | 0.08 | |
| Total from investment operations | | | 3.69 | | | | (1.28 | ) | | | 4.74 | | | | (0.73 | ) | | | 0.03 | |
| Net asset value, end of year | | | $19.51 | | | | $15.82 | | | | $17.10 | | | | $12.36 | | | | $13.09 | |
| Total Return(b): | | | 23.39% | | | | (7.49)% | | | | 38.35% | | | | (5.58)% | | | | 0.23% | |
| |
| Ratios/Supplemental Data: | | | | | | | | | | | | | | | |
| Net assets, end of year (000) | | | $26,778 | | | | $14,496 | | | | $5,303 | | | | $2,918 | | | | $4,167 | |
| Average net assets (000) | | | $20,599 | | | | $10,393 | | | | $3,121 | | | | $3,575 | | | | $3,179 | |
| Ratios to average net assets(c)(d): | | | | | | | | | | | | | | | | | | | | |
| Expenses after waivers and/or expense reimbursement | | | 1.09% | | | | 1.13% | | | | 1.15% | | | | 1.15% | | | | 1.55% | |
| Expenses before waivers and/or expense reimbursement | | | 1.46% | | | | 1.55% | | | | 1.63% | | | | 1.74% | | | | 1.67% | |
| Net investment income (loss) | | | 0.04% | | | | (0.32)% | | | | (0.07)% | | | | 0.15% | | | | (0.39)% | |
| Portfolio turnover rate(e) | | | 53% | | | | 59% | | | | 69% | | | | 65% | | | | 75% | |
| (a) | Calculated based on average shares outstanding during the year. |
| (b) | Total return does not consider the effects of sales loads. Total return is calculated assuming a purchase of a share on the first day and a sale on the last day of each year reported and includes reinvestment of dividends and distributions, if any. Total returns may reflect adjustments to conform to generally accepted accounting principles. |
| (c) | Does not include expenses of the underlying funds in which the Series invests. |
| (d) | Effective November 1, 2017, class specific expenses include transfer agent fees and expenses and registration fees, which are charged to their respective share class. |
| (e) | The Series’ portfolio turnover rate is calculated in accordance with regulatory requirements, without regard to transactions involving short-term investments and certain derivatives. If such transactions were included, the Series’ portfolio turnover rate may be higher. |
See Notes to Financial Statements.
| | | | |
| PGIM Jennison International Opportunities Fund | | | 43 | |
Financial Highlights(continued)
| | | | | | | | | | | | | | | | | | | | |
| Class C Shares | | | | | | | | | | | | | | | |
| | | | | | Year Ended October 31, | | | | |
| | | 2019 | | | 2018 | | | 2017 | | | 2016 | | | 2015 | |
| Per Share Operating Performance(a): | | | | | | | | | | | | | | | | | | | | |
| Net Asset Value, Beginning of Year | | | $15.08 | | | | $16.43 | | | | $11.96 | | | | $12.77 | | | | $12.82 | |
| Income (loss) from investment operations: | | | | | | | | | | | | | | | | | | | | |
| Net investment income (loss) | | | (0.13 | ) | | | (0.18 | ) | | | (0.11 | ) | | | (0.08 | ) | | | (0.15 | ) |
| Net realized and unrealized gain (loss) on investment and foreign currency transactions | | | 3.49 | | | | (1.17 | ) | | | 4.58 | | | | (0.73 | ) | | | 0.10 | |
| Total from investment operations | | | 3.36 | | | | (1.35 | ) | | | 4.47 | | | | (0.81 | ) | | | (0.05 | ) |
| Net asset value, end of year | | | $18.44 | | | | $15.08 | | | | $16.43 | | | | $11.96 | | | | $12.77 | |
| Total Return(b): | | | 22.28% | | | | (8.22)% | | | | 37.37% | | | | (6.34)% | | | | (0.39)% | |
| |
| Ratios/Supplemental Data: | | | | | | | | | | | | | | | |
| Net assets, end of year (000) | | | $5,302 | | | | $3,800 | | | | $1,759 | | | | $779 | | | | $1,215 | |
| Average net assets (000) | | | $4,683 | | | | $3,449 | | | | $1,080 | | | | $895 | | | | $903 | |
| Ratios to average net assets(c)(d): | | | | | | | | | | | | | | | | | | | | |
| Expenses after waivers and/or expense reimbursement | | | 1.91% | | | | 1.92% | | | | 1.89% | | | | 1.90% | | | | 2.30% | |
| Expenses before waivers and/or expense reimbursement | | | 2.33% | | | | 2.54% | | | | 2.32% | | | | 2.44% | | | | 2.37% | |
| Net investment income (loss) | | | (0.80)% | | | | (1.05)% | | | | (0.80)% | | | | (0.67)% | | | | (1.15)% | |
| Portfolio turnover rate(e) | | | 53% | | | | 59% | | | | 69% | | | | 65% | | | | 75% | |
| (a) | Calculated based on average shares outstanding during the year. |
| (b) | Total return does not consider the effects of sales loads. Total return is calculated assuming a purchase of a share on the first day and a sale on the last day of each year reported and includes reinvestment of dividends and distributions, if any. Total returns may reflect adjustments to conform to generally accepted accounting principles. |
| (c) | Does not include expenses of the underlying funds in which the Series invests. |
| (d) | Effective November 1, 2017, class specific expenses include transfer agent fees and expenses and registration fees, which are charged to their respective share class. |
| (e) | The Series’ portfolio turnover rate is calculated in accordance with regulatory requirements, without regard to transactions involving short-term investments and certain derivatives. If such transactions were included, the Series’ portfolio turnover rate may be higher. |
See Notes to Financial Statements.
| | | | | | | | | | | | |
| Class R Shares | |
| | | Year Ended
October 31,
2019 | | | | | | November 20,
2017(a)
through
October 31,
2018 | |
| Per Share Operating Performance(b): | | | | | | | | | | | | |
| Net Asset Value, Beginning of Period | | | $15.86 | | | | | | | | $17.62 | |
| Income (loss) from investment operations: | | | | | | | | | | | | |
| Net investment income (loss) | | | (0.06 | ) | | | | | | | (0.09 | ) |
| Net realized and unrealized gain (loss) on investment and foreign currency transactions | | | 3.68 | | | | | | | | (1.67 | ) |
| Total from investment operations | | | 3.62 | | | | | | | | (1.76 | ) |
| Net asset value, end of period | | | $19.48 | | | | | | | | $15.86 | |
| Total Return(c): | | | 22.89% | | | | | | | | (9.99)% | |
| |
| Ratios/Supplemental Data: | |
| Net assets, end of period (000) | | | $280,311 | | | | | | | | $266,294 | |
| Average net assets (000) | | | $278,086 | | | | | | | | $299,955 | |
| Ratios to average net assets(d): | | | | | | | | | | | | |
| Expenses after waivers and/or expense reimbursement | | | 1.47% | | | | | | | | 1.46% | (e) |
| Expenses before waivers and/or expense reimbursement | | | 1.81% | | | | | | | | 1.80% | (e) |
| Net investment income (loss) | | | (0.36)% | | | | | | | | (0.53)% | (e) |
| Portfolio turnover rate(f) | | | 53% | | | | | | | | 59% | |
| (a) | Commencement of offering. |
| (b) | Calculated based on average shares outstanding during the period. |
| (c) | Total return is calculated assuming a purchase of a share on the first day and a sale on the last day of each period reported and includes reinvestment of dividends and distributions, if any. Total returns may reflect adjustments to conform to generally accepted accounting principles. Total returns for periods less than one full year are not annualized. |
| (d) | Does not include expenses of the underlying funds in which the Series invests. |
| (f) | The Series’ portfolio turnover rate is calculated in accordance with regulatory requirements, without regard to transactions involving short-term investments and certain derivatives. If such transactions were included, the Series’ portfolio turnover rate may be higher. |
See Notes to Financial Statements.
| | | | |
| PGIM Jennison International Opportunities Fund | | | 45 | |
Financial Highlights(continued)
| | | | | | | | | | | | | | | | | | | | |
| Class Z Shares | | | | | | | | | | | | | | | |
| | | | | | Year Ended October 31, | | | | |
| | | 2019 | | | 2018 | | | 2017 | | | 2016 | | | 2015 | |
| Per Share Operating Performance(a): | | | | | | | | | | | | | | | | | | | | |
| Net Asset Value, Beginning of Year | | | $16.01 | | | | $17.29 | | | | $12.50 | | | | $13.20 | | | | $13.13 | |
| Income (loss) from investment operations: | | | | | | | | | | | | | | | | | | | | |
| Net investment income (loss) | | | 0.03 | | | | (0.01 | ) | | | 0.03 | | | | 0.03 | | | | (0.03 | ) |
| Net realized and unrealized gain (loss) on investment and foreign currency transactions | | | 3.74 | | | | (1.24 | ) | | | 4.79 | | | | (0.73 | ) | | | 0.10 | |
| Total from investment operations | | | 3.77 | | | | (1.25 | ) | | | 4.82 | | | | (0.70 | ) | | | 0.07 | |
| Less Dividends and Distributions: | | | | | | | | | | | | | | | | | | | | |
| Dividends from net investment income | | | (0.01 | ) | | | (0.03 | ) | | | (0.03 | ) | | | - | | | | - | |
| Net asset value, end of year | | | $19.77 | | | | $16.01 | | | | $17.29 | | | | $12.50 | | | | $13.20 | |
| Total Return(b): | | | 23.56% | | | | (7.24)% | | | | 38.65% | | | | (5.30)% | | | | 0.53% | |
| |
| Ratios/Supplemental Data: | | | | | | | | | | | | | | | |
| Net assets, end of year (000) | | | $208,629 | | | | $104,113 | | | | $28,612 | | | | $18,667 | | | | $46,105 | |
| Average net assets (000) | | | $139,982 | | | | $75,711 | | | | $21,756 | | | | $23,274 | | | | $47,187 | |
| Ratios to average net assets(c)(d): | | | | | | | | | | | | | | | | | | | | |
| Expenses after waivers and/or expense reimbursement | | | 0.90% | | | | 0.89% | | | | 0.89% | | | | 0.90% | | | | 1.31% | |
| Expenses before waivers and/or expense reimbursement | | | 1.04% | | | | 1.04% | | | | 1.34% | | | | 1.41% | | | | 1.40% | |
| Net investment income (loss) | | | 0.15% | | | | (0.08)% | | | | 0.23% | | | | 0.25% | | | | (0.19)% | |
| Portfolio turnover rate(e) | | | 53% | | | | 59% | | | | 69% | | | | 65% | | | | 75% | |
| (a) | Calculated based on average shares outstanding during the year. |
| (b) | Total return is calculated assuming a purchase of a share on the first day and a sale on the last day of each year reported and includes reinvestment of dividends and distributions, if any. Total returns may reflect adjustments to conform to generally accepted accounting principles. |
| (c) | Does not include expenses of the underlying funds in which the Series invests. |
| (d) | Effective November 1, 2017, class specific expenses include transfer agent fees and expenses and registration fees, which are charged to their respective share class. |
| (e) | The Series’ portfolio turnover rate is calculated in accordance with regulatory requirements, without regard to transactions involving short-term investments and certain derivatives. If such transactions were included, the Series’ portfolio turnover rate may be higher. |
See Notes to Financial Statements.
| | | | |
| Class R2 Shares | | | |
| | | December 27, 2018(a)
through October 31, 2019 | |
| Per Share Operating Performance(b): | | | | |
| Net Asset Value, Beginning of Period | | | $15.10 | |
| Income (loss) from investment operations: | | | | |
| Net investment income (loss) | | | (0.12 | ) |
| Net realized and unrealized gain (loss) on investment and foreign currency transactions | | | 4.72 | |
| Total from investment operations | | | 4.60 | |
| Net asset value, end of period | | | $19.70 | |
| Total Return(c): | | | 30.46% | |
| |
| Ratios/Supplemental Data: | | | |
| Net assets, end of period (000) | | | $233 | |
| Average net assets (000) | | | $44 | |
| Ratios to average net assets(d): | | | | |
| Expenses after waivers and/or expense reimbursement | | | 1.26% | (e) |
| Expenses before waivers and/or expense reimbursement | | | 64.97% | (e) |
| Net investment income (loss) | | | (0.76)% | (e) |
| Portfolio turnover rate(f) | | | 53% | |
| (a) | Commencement of offering. |
| (b) | Calculated based on average shares outstanding during the period. |
| (c) | Total return is calculated assuming a purchase of a share on the first day and a sale on the last day of each period reported and includes reinvestment of dividends and distributions, if any. Total returns may reflect adjustments to conform to generally accepted accounting principles. Total returns for periods less than one full year are not annualized. |
| (d) | Does not include expenses of the underlying funds in which the Series invests. |
| (f) | The Series’ portfolio turnover rate is calculated in accordance with regulatory requirements, without regard to transactions involving short-term investments and certain derivatives. If such transactions were included, the Series’ portfolio turnover rate may be higher. |
See Notes to Financial Statements.
| | | | |
| PGIM Jennison International Opportunities Fund | | | 47 | |
Financial Highlights(continued)
| | | | |
| Class R4 Shares | | | |
| | | December 27,
2018(a)
through
October 31,
2019 | |
| Per Share Operating Performance(b): | | | | |
| Net Asset Value, Beginning of Period | | | $15.10 | |
| Income (loss) from investment operations: | | | | |
| Net investment income (loss) | | | (0.02 | ) |
| Net realized and unrealized gain (loss) on investment and foreign currency transactions | | | 4.67 | |
| Total from investment operations | | | 4.65 | |
| Net asset value, end of period | | | $19.75 | |
| Total Return(c): | | | 30.79% | |
| |
| Ratios/Supplemental Data: | | | |
| Net assets, end of period (000) | | | $846 | |
| Average net assets (000) | | | $293 | |
| Ratios to average net assets(d): | | | | |
| Expenses after waivers and/or expense reimbursement | | | 0.95% | (e) |
| Expenses before waivers and/or expense reimbursement | | | 10.65% | (e) |
| Net investment income (loss) | | | (0.11)% | (e) |
| Portfolio turnover rate(f) | | | 53% | |
| (a) | Commencement of offering. |
| (b) | Calculated based on average shares outstanding during the period. |
| (c) | Total return is calculated assuming a purchase of a share on the first day and a sale on the last day of each period reported and includes reinvestment of dividends and distributions, if any. Total returns may reflect adjustments to conform to generally accepted accounting principles. Total returns for periods less than one full year are not annualized. |
| (d) | Does not include expenses of the underlying funds in which the Series invests. |
| (f) | The Series’ portfolio turnover rate is calculated in accordance with regulatory requirements, without regard to transactions involving short-term investments and certain derivatives. If such transactions were included, the Series’ portfolio turnover rate may be higher. |
See Notes to Financial Statements.
| | | | | | | | | | | | | | | | | | | | |
| Class R6 Shares | | | | | | | | | | | | | | | |
| | | Year Ended October 31, | | | | | | December 23,
2015(a) through
October 31, 2016 | |
| | | | |
| | | 2019 | | | 2018 | | | 2017 | | | | |
| Per Share Operating Performance(b): | | | | | | | | | | | | | | | | | | | | |
| Net Asset Value, Beginning of Period | | | $16.02 | | | | $17.29 | | | | $12.50 | | | | | | | | $13.25 | |
| Income (loss) from investment operations: | | | | | | | | | | | | | | | | | | | | |
| Net investment income (loss) | | | 0.04 | | | | (0.01 | ) | | | 0.04 | | | | | | | | 0.06 | |
| Net realized and unrealized gain (loss) on investment and foreign currency transactions | | | 3.74 | | | | (1.22 | ) | | | 4.79 | | | | | | | | (0.81 | ) |
| Total from investment operations | | | 3.78 | | | | (1.23 | ) | | | 4.83 | | | | | | | | (0.75 | ) |
| Less Dividends and Distributions: | | | | | | | | | | | | | | | | | | | | |
| Dividends from net investment income | | | (0.02 | ) | | | (0.04 | ) | | | (0.04 | ) | | | | | | | - | |
| Net asset value, end of period | | | $19.78 | | | | $16.02 | | | | $17.29 | | | | | | | | $12.50 | |
| Total Return(c): | | | 23.72% | | | | (7.15)% | | | | 38.75% | | | | | | | | (5.66)% | |
| |
| Ratios/Supplemental Data: | | | | | | | | | | | | | | | |
| Net assets, end of period (000) | | | $101,975 | | | | $35,141 | | | | $26,252 | | | | | | | | $23,073 | |
| Average net assets (000) | | | $54,900 | | | | $26,736 | | | | $24,927 | | | | | | | | $23,677 | |
| Ratios to average net assets(d)(e): | | | | | | | | | | | | | | | | | | | | |
| Expenses after waivers and/or expense reimbursement | | | 0.84% | | | | 0.84% | | | | 0.84% | | | | | | | | 0.84% | (f) |
| Expenses before waivers and/or expense reimbursement | | | 0.98% | | | | 1.00% | | | | 1.30% | | | | | | | | 1.43% | (f) |
| Net investment income (loss) | | | 0.20% | | | | (0.05)% | | | | 0.28% | | | | | | | | 0.60% | (f) |
| Portfolio turnover rate(g) | | | 53% | | | | 59% | | | | 69% | | | | | | | | 65% | |
| (a) | Commencement of offering. |
| (b) | Calculated based on average shares outstanding during the period. |
| (c) | Total return is calculated assuming a purchase of a share on the first day and a sale on the last day of each period reported and includes reinvestment of dividends and distributions, if any. Total returns may reflect adjustments to conform to generally accepted accounting principles. Total returns for periods less than one full year are not annualized. |
| (d) | Does not include expenses of the underlying funds in which the Series invests. |
| (e) | Effective November 1, 2017, class specific expenses include transfer agent fees and expenses and registration fees, which are charged to their respective share class. |
| (g) | The Series’ portfolio turnover rate is calculated in accordance with regulatory requirements, without regard to transactions involving short-term investments and certain derivatives. If such transactions were included, the Series’ portfolio turnover rate may be higher. |
See Notes to Financial Statements.
| | | | |
| PGIM Jennison International Opportunities Fund | | | 49 | |
Report of Independent Registered Public Accounting Firm
To the Shareholders of PGIM Jennison International Opportunities Fund and Board of Directors Prudential World Fund, Inc.:
Opinion on the Financial Statements
We have audited the accompanying statement of assets and liabilities of PGIM Jennison International Opportunities Fund, a series of Prudential World Fund, Inc., (the Fund), including the schedule of investments, as of October 31, 2019, the related statement of operations for the year then ended, the statements of changes in net assets for each of the years in thetwo-year period ended October 31, 2019, and the related notes (collectively, the financial statements) and the financial highlights for the years or periods indicated therein. In our opinion, the financial statements and financial highlights present fairly, in all material respects, the financial position of the Fund as of October 31, 2019, the results of its operations for the year then ended, the changes in its net assets for each of the years in thetwo-year period ended October 31, 2019, and the financial highlights for the years or periods indicated therein, in conformity with U.S. generally accepted accounting principles.
Basis for Opinion
These financial statements and financial highlights are the responsibility of the Fund’s management. Our responsibility is to express an opinion on these financial statements and financial highlights based on our audits. We are a public accounting firm registered with the Public Company Accounting Oversight Board (United States) (PCAOB) and are required to be independent with respect to the Fund in accordance with the U.S. federal securities laws and the applicable rules and regulations of the Securities and Exchange Commission and the PCAOB.
We conducted our audits in accordance with the standards of the PCAOB. Those standards require that we plan and perform the audit to obtain reasonable assurance about whether the financial statements and financial highlights are free of material misstatement, whether due to error or fraud. Our audits included performing procedures to assess the risks of material misstatement of the financial statements and financial highlights, whether due to error or fraud, and performing procedures that respond to those risks. Such procedures included examining, on a test basis, evidence regarding the amounts and disclosures in the financial statements and financial highlights. Such procedures also included confirmation of securities owned as of October 31, 2019, by correspondence with the custodian, transfer agent, and brokers, or by other appropriate auditing procedures when replies were not received. Our audits also included evaluating the accounting principles used and significant estimates made by management, as well as evaluating the overall presentation of the financial statements and financial highlights. We believe that our audits provide a reasonable basis for our opinion.

We have served as the auditor of one or more PGIM and/or Prudential Retail investment companies since 2003.
New York, New York
December 16, 2019
Federal Income Tax Information(unaudited)
For the fiscal year ended October 31, 2019, the Series reports the maximum amount allowable under Section 854 of the Internal Revenue Code, but not less than, the following percentages of the ordinary income dividends paid as 1) qualified dividend income (QDI); 2) eligible for corporate dividend received deduction (DRD):
| | | | | | | | |
| | | QDI | | | DRD | |
PGIM Jennison International Opportunities Fund | | | 96.32 | % | | | 20.47 | % |
In January 2020, you will be advised on IRS Form 1099-DIV or substitute 1099-DIV as to the federal tax status of dividends received by you in calendar year 2019.
| | | | |
| PGIM Jennison International Opportunities Fund | | | 51 | |
INFORMATION ABOUT BOARD MEMBERS AND OFFICERS (unaudited)
Information about Board Members and Officers of the Fund is set forth below. Board Members who are not deemed to be “interested persons” of the Fund, as defined in the 1940 Act, are referred to as “Independent Board Members.” Board Members who are deemed to be “interested persons” of the Fund are referred to as “Interested Board Members.” The Board Members are responsible for the overall supervision of the operations of the Fund and perform the various duties imposed on the directors of investment companies by the 1940 Act. The Board in turn elects the Officers, who are responsible for administering theday-to-day operations of the Fund.
| | | | | | |
| Independent Board Members | | | | |
| | | | |
Name Date of Birth Position(s) Portfolios Overseen | | Principal Occupation(s) During Past Five Years | | Other Directorships Held During Past Five Years | | Length of Board Service |
| | | | |
Ellen S. Alberding 3/11/58 Board Member Portfolios Overseen: 96 | | President and Board Member, The Joyce Foundation (charitable foundation) (since 2002); Vice Chair, City Colleges of Chicago (community college system) (2011-2015); Trustee, National Park Foundation (charitable foundation for national park system) (2009-2018); Trustee, Economic Club of Chicago (since 2009); Trustee, Loyola University (since 2018). | | None. | | Since September 2013 |
| | | | |
Kevin J. Bannon 7/13/52 Board Member Portfolios Overseen: 96 | | Retired; Managing Director (April2008-May 2015) and Chief Investment Officer (October 2008-November 2013) of Highmount Capital LLC (registered investment adviser); formerly Executive Vice President and Chief Investment Officer (April 1993-August 2007) of Bank of New York Company; President (May2003-May 2007) of BNY Hamilton Family of Mutual Funds. | | Director of Urstadt Biddle Properties (equity real estate investment trust) (since September 2008). | | Since July 2008 |
PGIM Jennison International Opportunities Fund
| | | | | | |
| Independent Board Members | | | | |
| | | | |
Name Date of Birth Position(s) Portfolios Overseen | | Principal Occupation(s) During Past Five Years | | Other Directorships Held During Past Five Years | | Length of Board Service |
| | | | |
Linda W. Bynoe 7/9/52 Board Member Portfolios Overseen: 96 | | President and Chief Executive Officer (since March 1995) and formerly Chief Operating Officer (December 1989-February 1995) of Telemat Ltd. (management consulting); formerly Vice President (January 1985-June 1989) at Morgan Stanley & Co. (broker-dealer). | | Director of Anixter International, Inc. (communication products distributor) (since January 2006); Director of Northern Trust Corporation (financial services) (since April 2006); Trustee of Equity Residential (residential real estate) (since December 2009). | | Since March 2005 |
| | | | |
Barry H. Evans 11/2/60 Board Member Portfolios Overseen: 95 | | Retired; formerly President (2005 – 2016), Global Chief Operating Officer (2014– 2016), Chief Investment Officer – Global Head of Fixed Income (1998-2014), and various portfolio manager roles (1986-2006), Manulife Asset Management U.S. | | Formerly Director, Manulife Trust Company (2011-2018); formerly Director, Manulife Asset Management Limited (2015-2017); formerly Chairman of the Board of Directors of Manulife Asset Management U.S. (2005-2016); formerly Chairman of the Board, Declaration Investment Management and Research(2008-2016). | | Since September 2017 |
| | | | |
Keith F. Hartstein 10/13/56 Board Member & Independent Chair Portfolios Overseen: 96 | | Retired; Member (since November 2014) of the Governing Council of the Independent Directors Council (organization of independent mutual fund directors); formerly President and Chief Executive Officer (2005-2012), Senior Vice President (2004-2005), Senior Vice President of Sales and Marketing (1997-2004), and various executive management positions (1990-1997), John Hancock Funds, LLC (asset management); Chairman, Investment Company Institute’s Sales Force Marketing Committee (2003-2008). | | None. | | Since September 2013 |
Visit our website at pgiminvestments.com
| | | | | | |
| Independent Board Members | | | | |
| | | | |
Name Date of Birth Position(s) Portfolios Overseen | | Principal Occupation(s) During Past Five Years | | Other Directorships Held During Past Five Years | | Length of Board Service |
| | | | |
Laurie Simon Hodrick 9/29/62 Board Member Portfolios Overseen: 95 | | A. Barton Hepburn Professor Emerita of Economics in the Faculty of Business, Columbia Business School (since 2018); Visiting Professor of Law, Stanford Law School (since 2015); Visiting Fellow at the Hoover Institution, Stanford University (since 2015); Sole Member, ReidCourt LLC (since 2008) (a consulting firm); formerly A. Barton Hepburn Professor of Economics in the Faculty of Business, Columbia Business School (1996-2017); formerly Managing Director, Global Head of Alternative Investment Strategies, Deutsche Bank (2006-2008). | | Independent Director, Synnex Corporation (since April 2019) (information technology); Independent Director, Kabbage, Inc. (since July 2018) (financial services); Independent Director, Corporate Capital Trust (2017-2018) (a business development company). | | Since September 2017 |
| | | | |
Michael S. Hyland, CFA 10/4/45 Board Member Portfolios Overseen: 96 | | Retired (since February 2005); formerly Senior Managing Director (July 2001-February 2005) of Bear Stearns & Co, Inc.; Global Partner, INVESCO (1999-2001); Managing Director and President of Salomon Brothers Asset Management (1989-1999). | | None. | | Since July 2008 |
| | | | |
Brian K. Reid 9/22/61 Board Member Portfolios Overseen: 95 | | Retired; formerly Chief Economist for the Investment Company Institute (ICI) (2005-2017); formerly Senior Economist and Director of Industry and Financial Analysis at the ICI (1998-2004); formerly Senior Economist, Industry and Financial Analysis at the ICI (1996-1998); formerly Staff Economist at the Federal Reserve Board (1989-1996); Director, ICI Mutual Insurance Company (2012-2017). | | None. | | Since March 2018 |
PGIM Jennison International Opportunities Fund
| | | | | | |
| Independent Board Members | | | | |
| | | | |
Name Date of Birth Position(s) Portfolios Overseen | | Principal Occupation(s) During Past Five Years | | Other Directorships Held During Past Five Years | | Length of Board Service |
| | | | |
Grace C. Torres 6/28/59 Board Member Portfolios Overseen: 95 | | Retired; formerly Treasurer and Principal Financial and Accounting Officer of the PGIM Funds, Target Funds, Advanced Series Trust, Prudential Variable Contract Accounts and The Prudential Series Fund (1998-June 2014); Assistant Treasurer (March 1999-June 2014) and Senior Vice President (September 1999-June 2014) of PGIM Investments LLC; Assistant Treasurer (May 2003-June 2014) and Vice President (June 2005-June 2014) of AST Investment Services, Inc.; Senior Vice President and Assistant Treasurer (May 2003-June 2014) of Prudential Annuities Advisory Services, Inc. | | Formerly Director (July 2015-January 2018) of Sun Bancorp, Inc. N.A. and Sun National Bank; Director (since January 2018) of OceanFirst Financial Corp. and OceanFirst Bank. | | Since November 2014 |
| | | | | | |
| Interested Board Members | | | | | | |
| | | | |
Name Date of Birth Position(s) Portfolios Overseen | | Principal Occupation(s) During Past Five Years | | Other Directorships Held During Past Five Years | | Length of Board Service |
| | | | |
Stuart S. Parker 10/5/62 Board Member & President Portfolios Overseen: 96 | | President of PGIM Investments LLC (formerly known as Prudential Investments LLC) (since January 2012); Executive Vice President of Prudential Investment Management Services LLC (since December 2012); formerly Executive Vice President of Jennison Associates LLC and Head of Retail Distribution of PGIM Investments LLC (June 2005-December 2011). | | None. | | Since January 2012 |
Visit our website at pgiminvestments.com
| | | | | | |
| Interested Board Members | | | | | | |
| | | | |
Name Date of Birth Position(s) Portfolios Overseen | | Principal Occupation(s) During Past Five Years | | Other Directorships Held During Past Five Years | | Length of Board Service |
| | | | |
Scott E. Benjamin 5/21/73 Board Member & Vice President Portfolios Overseen: 96 | | Executive Vice President (since June 2009) of PGIM Investments LLC; Executive Vice President (June 2009-June 2012) and Vice President (since June 2012) of Prudential Investment Management Services LLC; Executive Vice President (since September 2009) of AST Investment Services, Inc.; Senior Vice President of Product Development and Marketing, PGIM Investments (since February 2006); formerly Vice President of Product Development and Product Management, PGIM Investments LLC (2003-2006). | | None. | | Since March 2010 |
| | | | |
| Fund Officers(a) | | | | |
| | | |
Name Date of Birth Fund Position | | Principal Occupation(s) During Past Five Years | | Length of Service as Fund Officer |
| | | |
Raymond A. O’Hara 9/11/55 Chief Legal Officer | | Vice President and Corporate Counsel (since July 2010) of Prudential Insurance Company of America (Prudential); Vice President (March 2011-Present) of Pruco Life Insurance Company and Pruco Life Insurance Company of New Jersey; Vice President and Corporate Counsel (March 2011-Present) of Prudential Annuities Life Assurance Corporation; Chief Legal Officer of PGIM Investments LLC (since June 2012); Chief Legal Officer of Prudential Mutual Fund Services LLC (since June 2012) and Corporate Counsel of AST Investment Services, Inc. (since June 2012); formerly Assistant Vice President and Corporate Counsel (September 2008-July 2010) of The Hartford Financial Services Group, Inc.; formerly Associate (September 1980-December 1987) and Partner (January 1988–August 2008) of Blazzard & Hasenauer, P.C. (formerly, Blazzard, Grodd & Hasenauer, P.C.). | | Since June 2012 |
PGIM Jennison International Opportunities Fund
| | | | |
Fund Officers(a) | | | | |
| | | |
Name Date of Birth Fund Position | | Principal Occupation(s) During Past Five Years | | Length of Service as Fund Officer |
| | | |
Dino Capasso 8/19/74 Chief Compliance Officer | | Chief Compliance Officer (July 2019-Present) of PGIM Investments LLC; Chief Compliance Officer (July 2019-Present) of the PGIM Funds, Target Funds, Advanced Series Trust, The Prudential Series Fund, Prudential’s Gibraltar Fund, Inc., PGIM Global High Yield Fund, Inc., and PGIM High Yield Bond Fund, Inc.; Vice President and Deputy Chief Compliance Officer (June 2017-2019) of PGIM Investments LLC; formerly, Senior Vice President and Senior Counsel (January 2016-June 2017), and Vice President and Counsel (February 2012-December 2015) of Pacific Investment Management Company LLC. | | Since March 2018 |
| | | |
Andrew R. French 12/22/62 Secretary | | Vice President of PGIM Investments LLC (December 2018-Present); formerly Vice President and Corporate Counsel (February 2010-December 2018) of Prudential; formerly Director and Corporate Counsel (2006-2010) of Prudential; Vice President and Assistant Secretary (since January 2007) of PGIM Investments LLC; Vice President and Assistant Secretary (since January 2007) of Prudential Mutual Fund Services LLC. | | Since October 2006 |
| | | |
Jonathan D. Shain 8/9/58 Assistant Secretary | | Vice President and Corporate Counsel (since August 1998) of Prudential; Vice President and Assistant Secretary (since May 2001) of PGIM Investments LLC; Vice President and Assistant Secretary (since February 2001) of Prudential Mutual Fund Services LLC; formerly Vice President and Assistant Secretary (May 2003-June 2005) of AST Investment Services, Inc. | | Since May 2005 |
| | | |
Claudia DiGiacomo 10/14/74 Assistant Secretary | | Vice President and Corporate Counsel (since January 2005) of Prudential; Vice President and Assistant Secretary of PGIM Investments LLC (since December 2005); formerly Associate at Sidley Austin Brown & Wood LLP (1999-2004). | | Since December 2005 |
| | | |
Diana N. Huffman 4/14/82 Assistant Secretary | | Vice President and Corporate Counsel (since September 2015) of Prudential; formerly Associate at Willkie Farr & Gallagher LLP (2009-2015). | | Since March 2019 |
| | | |
Kelly A. Coyne 8/8/68 Assistant Secretary | | Director, Investment Operations of Prudential Mutual Fund Services LLC (since 2010). | | Since March 2015 |
| | | |
Christian J. Kelly 5/5/75 Treasurer and Principal Financial and Accounting Officer | | Vice President, Head of Fund Administration of PGIM Investments LLC (since November 2018); formerly, Director of Fund Administration of Lord Abbett & Co. LLC (2009-2018), Treasurer and Principal Accounting Officer of the Lord Abbett Family of Funds (2017-2018); Director of Accounting, Avenue Capital Group (2008-2009); Senior Manager, Investment Management Practice of Deloitte & Touche LLP (1998-2007). | | Since January 2019 |
Visit our website at pgiminvestments.com
| | | | |
Fund Officers(a) | | | | |
| | | |
Name Date of Birth Fund Position | | Principal Occupation(s) During Past Five Years | | Length of Service as Fund Officer |
| | | |
Lana Lomuti 6/7/67 Assistant Treasurer | | Vice President (since 2007) and Director (2005-2007), within PGIM Investments Fund Administration; formerly Assistant Treasurer (December 2007-February 2014) of The Greater China Fund, Inc. | | Since April 2014 |
| | | |
Russ Shupak 10/08/73 Assistant Treasurer | | Vice President (since 2017) and Director (2013-2017), within PGIM Investments Fund Administration. | | Since October 2019 |
| | | |
Deborah Conway 3/26/69 Assistant Treasurer | | Vice President (since 2017) and Director (2007-2017), within PGIM Investments Fund Administration. | | Since October 2019 |
| | | |
Elyse M. McLaughlin 1/20/74 Assistant Treasurer | | Vice President (since 2017) and Director (2011-2017), within PGIM Investments Fund Administration. | | Since October 2019 |
| | | |
Charles H. Smith 1/11/73 Anti-Money Laundering Compliance Officer | | Vice President, Corporate Compliance, Anti-Money Laundering Unit (since January 2015) of Prudential; committee member of the American Council of Life Insurers Anti-Money Laundering and Critical Infrastructure Committee (since January 2016); formerly Global Head of Economic Sanctions Compliance at AIG Property Casualty (February 2007-December 2014); Assistant Attorney General at the New York State Attorney General’s Office, Division of Public Advocacy. (August 1998-January 2007). | | Since January 2017 |
(a) Excludes Mr. Parker and Mr. Benjamin, interested Board Members who also serve as President and Vice President, respectively.
Explanatory Notes to Tables:
| ∎ | Board Members are deemed to be “Interested,” as defined in the 1940 Act, by reason of their affiliation with PGIM Investments LLC and/or an affiliate of PGIM Investments LLC. |
| ∎ | Unless otherwise noted, the address of all Board Members and Officers is c/o PGIM Investments LLC, 655 Broad Street, Newark, New Jersey 07102-4410. |
| ∎ | There is no set term of office for Board Members or Officers. The Board Members have adopted a retirement policy, which calls for the retirement of Board Members on December 31 of the year in which they reach the age of 75. |
| ∎ | “Other Directorships Held” includes only directorships of companies required to register or file reports with the SEC under the 1934 Act (that is, “public companies”) or other investment companies registered under the 1940 Act. |
| ∎ | “Portfolios Overseen” includes all investment companies managed by PGIM Investments LLC. The investment companies for which PGIM Investments LLC serves as manager include the PGIM Funds, The Prudential Variable Contract Accounts, PGIM ETF Trust, PGIM High Yield Bond Fund, Inc., PGIM Global High Yield Fund, Inc., The Prudential Series Fund, Prudential’s Gibraltar Fund, Inc. and the Advanced Series Trust. |
PGIM Jennison International Opportunities Fund
Approval of Advisory Agreements(unaudited)
The Fund’s Board of Directors
The Board of Directors (the “Board”) of PGIM Jennison International Opportunities Fund (the “Fund”)1 consists of eleven individuals, nine of whom are not “interested persons” of the Fund, as defined in the Investment Company Act of 1940, as amended (the “1940 Act”) (the “Independent Directors”).2 The Board is responsible for the oversight of the Fund and its operations, and performs the various duties imposed on the directors of investment companies by the 1940 Act. The Independent Directors have retained independent legal counsel to assist them in connection with their duties. The Chair of the Board is an Independent Director. The Board has established four standing committees: the Audit Committee, the Nominating and Governance Committee, and two Investment Committees. Each committee is chaired by, and composed of, Independent Directors.
Annual Approval of the Fund’s Advisory Agreements
As required under the 1940 Act, the Board determines annually whether to renew the Fund’s management agreement with PGIM Investments LLC (“PGIM Investments”) and the Fund’s subadvisory agreement with Jennison Associates LLC (“Jennison”). In considering the renewal of the agreements, the Board, including all of the Independent Directors, met on May 30, 2019 and on June11-13, 2019 and approved the renewal of the agreements through July 31, 2020, after concluding that the renewal of the agreements was in the best interests of the Fund and its shareholders.
In advance of the meetings, the Board requested and received materials relating to the agreements, and had the opportunity to ask questions and request further information in connection with its consideration. Among other things, the Board considered comparative fee information from PGIM Investments and Jennison. Also, the Board considered comparisons with other mutual funds in relevant Peer Universes and Peer Groups, as is further discussed below.
In approving the agreements, the Board, including the Independent Directors advised by independent legal counsel, considered the factors it deemed relevant, including the nature, quality and extent of services provided by PGIM Investments and the subadviser, the performance of the Fund, the profitability of PGIM Investments and its affiliates, expenses and fees, and the potential for economies of scale that may be shared with the Fund and its shareholders as the Fund’s assets grow. In their deliberations, the Directors did not identify any single factor which alone was responsible for the Board’s decision to approve the agreements with respect to the Fund. In connection with its deliberations, the Board considered information provided by PGIM Investments throughout the year at regular Board
| 1 | PGIM Jennison International Opportunities Fund is a series of Prudential World Fund, Inc. |
| 2 | Grace C. Torres was an Interested Director of the Fund at the time the Board considered and approved the renewal of the Fund’s advisory agreements, but has since become an Independent Director of the Fund. |
| | |
| PGIM Jennison International Opportunities Fund |
Approval of Advisory Agreements(continued)
meetings, presentations from portfolio managers and other information, as well as information furnished at or in advance of the meetings on May 30, 2019 and onJune 11-13, 2019.
The Directors determined that the overall arrangements between the Fund and PGIM Investments, which serves as the Fund’s investment manager pursuant to a management agreement, and between PGIM Investments and Jennison, which serves as the Fund’s subadviser pursuant to the terms of a subadvisory agreement with PGIM Investments, are in the best interests of the Fund and its shareholders in light of the services performed, fees charged and such other matters as the Directors considered relevant in the exercise of their business judgment.
The material factors and conclusions that formed the basis for the Directors’ reaching their determinations to approve the continuance of the agreements are separately discussed below.
Nature, Quality and Extent of Services
The Board received and considered information regarding the nature, quality and extent of services provided to the Fund by PGIM Investments and Jennison. The Board noted that Jennison is affiliated with PGIM Investments. The Board considered the services provided by PGIM Investments, including but not limited to the oversight of the subadviser for the Fund, as well as the provision of fund recordkeeping, compliance and other services to the Fund, and PGIM Investments’ role as administrator for the Fund’s liquidity risk management program. With respect to PGIM Investments’ oversight of the subadviser, the Board noted that PGIM Investments’ Strategic Investment Research Group (“SIRG”), which is a business unit of PGIM Investments, is responsible for monitoring and reporting to PGIM Investments’ senior management on the performance and operations of the subadviser. The Board also considered that PGIM Investments pays the salaries of all of the officers and interested Directors of the Fund who are part of Fund management. The Board also considered the investment subadvisory services provided by Jennison, including investment research and security selection, as well as adherence to the Fund’s investment restrictions and compliance with applicable Fund policies and procedures. The Board considered PGIM Investments’ evaluation of the subadviser, as well as PGIM Investments’ recommendation, based on its review of the subadviser, to renew the subadvisory agreement.
The Board considered the qualifications, backgrounds and responsibilities of PGIM Investments’ senior management responsible for the oversight of the Fund and Jennison, and also considered the qualifications, backgrounds and responsibilities of Jennison’s portfolio managers who are responsible for theday-to-day management of the Fund’s portfolio. The Board was provided with information pertaining to PGIM Investments’ and Jennison’s organizational structure, senior management, investment operations, and other relevant information pertaining to both PGIM Investments and Jennison. The Board also
| | |
| Visit our website at pgiminvestments.com | | |
noted that it received favorable compliance reports from the Fund’s Chief Compliance Officer (“CCO”) as to both PGIM Investments and Jennison.
The Board concluded that it was satisfied with the nature, extent and quality of the investment management services provided by PGIM Investments and the subadvisory services provided to the Fund by Jennison, and that there was a reasonable basis on which to conclude that the Fund benefits from the services provided by PGIM Investments and Jennison under the management and subadvisory agreements.
Costs of Services and Profits Realized by PGIM Investments
The Board was provided with information on the profitability of PGIM Investments and its affiliates in serving as the Fund’s investment manager. The Board discussed with PGIM Investments the methodology utilized in assembling the information regarding profitability and considered its reasonableness. The Board recognized that it is difficult to make comparisons of profitability from fund management contracts because comparative information is not generally publicly available and is affected by numerous factors, including the structure of the particular adviser, the types of funds it manages, its business mix, numerous assumptions regarding allocations and the adviser’s capital structure and cost of capital. However, the Board considered that the cost of services provided by PGIM Investments to the Fund during the year ended December 31, 2018 exceeded the management fees paid by the Fund, resulting in an operating loss to PGIM Investments. Taking these factors into account, the Board concluded that the profitability of PGIM Investments and its affiliates in relation to the services rendered was not unreasonable.
Economies of Scale
The Board received and discussed information concerning economies of scale that PGIM Investments may realize as the Fund’s assets grow beyond current levels. The Board noted that the management fee schedule for the Fund includes breakpoints, which have the effect of reducing the fee rate as assets increase. During the course of time, the Board has considered information regarding the launch date of the Fund, the management fees of the Fund compared to those of similarly managed funds, and PGIM Investments’ investment in the Fund over time. The Board noted that economies of scale may be shared with the Fund in several ways, including low management fees from inception, additional technological and personnel investments to enhance shareholder services, and maintaining existing expense structures in the face of a rising cost environment. The Board considered PGIM Investments’ assertion that it continually evaluates the management fee schedule of the Fund and the potential to share economies of scale through breakpoints or fee waivers as asset levels increase.
The Board recognized the inherent limitations of any analysis of economies of scale, stemming largely from the Board’s understanding that most of PGIM Investments’ costs are not specific to individual funds, but rather are incurred across a variety of products and services.
| | |
| PGIM Jennison International Opportunities Fund |
Approval of Advisory Agreements(continued)
Other Benefits to PGIM Investments and Jennison
The Board considered potential ancillary benefits that might be received by PGIM Investments, Jennison and their affiliates as a result of their relationship with the Fund. The Board concluded that potential benefits to be derived by PGIM Investments included transfer agency fees received by the Fund’s transfer agent (which is affiliated with PGIM Investments), as well as benefits to its reputation or other intangible benefits resulting from PGIM Investments’ association with the Fund. The Board concluded that the potential benefits to be derived by Jennison included the ability to use soft dollar credits, as well as the potential benefits consistent with those generally resulting from an increase in assets under management, specifically, potential access to additional research resources and benefits to its reputation. The Board concluded that the benefits derived by PGIM Investments and Jennison were consistent with the types of benefits generally derived by investment managers and subadvisers to mutual funds.
Performance of the Fund / Fees and Expenses
The Board considered certain additional factors and made related conclusions relating to the historical performance of the Fund for theone-, three- and five-year periods ended December 31, 2018.
The Board also considered the Fund’s actual management fee, as well as the Fund’s net total expense ratio, for the fiscal year ended October 31, 2018. The Board considered the management fee for the Fund as compared to the management fee charged by PGIM Investments to other funds and the fee charged by other advisers to comparable mutual funds in a Peer Group. The actual management fee represents the fee rate actually paid by Fund shareholders and includes any fee waivers or reimbursements. The net total expense ratio for the Fund represents the actual expense ratio incurred by Fund shareholders.
The mutual funds included in the Peer Universe, which was used to consider performance, and the Peer Group, which was used to consider fees and expenses, were objectively determined by Broadridge, an independent provider of mutual fund data. In certain circumstances, PGIM Investments also provided supplemental Peer Universe or Peer Group information for reasons addressed with the Board. The comparisons placed the Fund in various quartiles over various periods, with the first quartile being the best 25% of the mutual funds (for performance, the best performing mutual funds and, for expenses, the lowest cost mutual funds).
The section below summarizes key factors considered by the Board and the Board’s conclusions regarding the Fund’s performance, fees and overall expenses. The table sets forth net performance comparisons (which reflect the impact on performance of fund expenses, or any subsidies, expense caps or waivers that may be applicable) with the Peer
| | |
| Visit our website at pgiminvestments.com | | |
Universe, actual management fees with the Peer Group (which reflect the impact of any subsidies or fee waivers), and net total expenses with the Peer Group, each of which were key factors considered by the Board.
| | | | | | | | |
| Net Performance | | 1 Year | | 3 Years | | 5 Years | | 10 Years |
| | 1st Quartile | | 1st Quartile | | 1st Quartile | | N/A |
| Actual Management Fees:2nd Quartile |
| Net Total Expenses: 1st Quartile |
| | • | | The Board noted that Fund outperformed its benchmark index over all periods. |
| | • | | The Board and PGIM Investments agreed to retain the Fund’s existing contractual expense cap which (exclusive of certain fees and expenses) caps net annual operating expenses at 0.84% for each class of the Fund’s shares, and which limits transfer agency, shareholder servicing,sub-transfer agency and blue sky fees, as applicable, to the extent that such fees cause the net annual operating expenses to exceed 1.34% of average daily net assets for Class R2 shares or 1.09% of average daily net assets for Class R4 shares through February 29, 2020. |
| | • | | The Board and PGIM Investments agreed to retain the Fund’s existing contractual expense cap with respect to Class A shares, pursuant to which PGIM Investments agrees to limit total annual operating expenses for Class A shares to 1.09% through February 29, 2020. |
| | • | | The Board and PGIM Investments agreed to retain the Fund’s existing contractual expense waiver, pursuant to which (exclusive of certain fees and expenses) PGIM Investments waives and/or reimburses up to 0.06% of certain other expenses through February 29, 2020 to the extent that total annual operating expenses exceed 1.09% for Class A shares, 1.90% for Class C shares, 1.48% for Class R shares, 0.90% for Class Z shares, and 0.84% for Class R6 shares. |
| | • | | In addition, PGIM Investments will waive management fees or shared operating expenses on any share class to the same extent that it waives such expenses on any other share class,and has agreed that total annual fund operating expenses for Class R6 shares will not exceed total annual fund operating expenses for Class Z shares. |
| | • | | The Board concluded that, in light of the above, it would be in the best interests of the Fund and its shareholders to renew the agreements. |
| | • | | The Board concluded that the management fees (including subadvisory fees) and total expenses were reasonable in light of the services provided. |
* * *
After full consideration of these factors, the Board concluded that the approval of the agreements was in the best interests of the Fund and its shareholders.
| | |
| PGIM Jennison International Opportunities Fund |
| | | | |
| | |
| ∎ MAIL | | ∎ TELEPHONE | | ∎ WEBSITE |
655 Broad Street Newark, NJ 07102 | | (800) 225-1852 | | pgiminvestments.com |
|
| PROXY VOTING |
| The Board of Directors of the Fund has delegated to the Fund’s subadviser the responsibility for voting any proxies and maintaining proxy recordkeeping with respect to the Fund. A description of these proxy voting policies and procedures is available without charge, upon request, by calling(800) 225-1852. Information regarding how the Fund voted proxies relating to portfolio securities during the most recent 12-month period ended June 30 is available on the Fund’s website and on the Securities and Exchange Commission’s website. |
|
| DIRECTORS |
| Ellen S. Alberding• Kevin J. Bannon• Scott E. Benjamin• Linda W. Bynoe• Barry H. Evans• Keith F. Hartstein• Laurie Simon Hodrick• Michael S. Hyland• Stuart S. Parker• Brian K. Reid• Grace C. Torres |
|
| OFFICERS |
Stuart S. Parker,President• Scott E. Benjamin,Vice President• Christian J. Kelly,Treasurer and Principal Financial and Accounting Officer• Raymond A. O’Hara,Chief Legal Officer• Dino Capasso,Chief Compliance Officer• Charles H. Smith,Anti-Money Laundering Compliance Officer• Andrew R. French,Secretary• Jonathan D. Shain,Assistant Secretary• Claudia DiGiacomo,Assistant Secretary• Diana N. Huffman,Assistant Secretary• Kelly A. Coyne,Assistant Secretary• Lana Lomuti,Assistant Treasurer• Russ Shupak,Assistant Treasurer• Elyse McLaughlin,Assistant Treasurer• Deborah Conway,Assistant Treasurer |
| | | | |
| MANAGER | | PGIM Investments LLC | | 655 Broad Street Newark, NJ 07102 |
|
| SUBADVISER | | Jennison Associates LLC | | 466 Lexington Avenue
New York, NY 10017 |
|
| DISTRIBUTOR | | Prudential Investment
Management Services LLC | | 655 Broad Street Newark, NJ 07102 |
|
| CUSTODIAN | | The Bank of New York Mellon | | 240 Greenwich Street
New York, NY 10286 |
|
| TRANSFER AGENT | | Prudential Mutual Fund
Services LLC | | PO Box 9658
Providence, RI 02940 |
|
| INDEPENDENT REGISTERED PUBLIC ACCOUNTING FIRM | | KPMG LLP | | 345 Park Avenue New York, NY 10154 |
|
| FUND COUNSEL | | Willkie Farr & Gallagher LLP | | 787 Seventh Avenue
New York, NY 10019 |
|
|
| An investor should consider the investment objectives, risks, charges, and expenses of the Fund carefully before investing. The prospectus and summary prospectus contain this and other information about the Fund. An investor may obtain the prospectus and summary prospectus by visiting our website atpgiminvestments.com or by calling(800) 225-1852. The prospectus and summary prospectus should be read carefully before investing. |
|
| E-DELIVERY |
| To receive your mutual fund documents online, go topgiminvestments.com/edelivery and enroll. Instead of receiving printed documents by mail, you will receive notification via email when new materials are available. You can cancel your enrollment or change your email address at any time byvisiting the website address above. |
|
| SHAREHOLDER COMMUNICATIONS WITH DIRECTORS |
| Shareholders can communicate directly with the Board of Directors by writing to the Chair of the Board, PGIM Jennison International Opportunities Fund, PGIM Investments, Attn: Board of Directors, 655 Broad Street, Newark, NJ 07102. Shareholders can communicate directly with an individual Director by writing to the same address. Communications are not screened before being delivered to the addressee. |
|
| AVAILABILITY OF PORTFOLIO HOLDINGS |
The Fund files its complete schedule of portfolio holdings with the Securities and Exchange Commission on Form N-PORT. The Fund’s Form N-PORT filings are available on the Commission’s website at sec.gov. Form N-PORT is filed with the Commission quarterly, and each Fund’s full portfolio holdings as of the first and third fiscal quarter-ends (as of the third month of the Fund’s fiscal quarter for reporting periods on or after September 30, 2019) will be made publicly available 60 days after the end of each quarter at sec.gov. |
|
| The Fund’s Statement of Additional Information contains additional information about the Fund’s Directors and is available without charge, upon request, by calling (800) 225-1852. |
Mutual Funds:
| | | | |
| ARE NOT INSURED BY THE FDIC OR ANY FEDERAL GOVERNMENT AGENCY | | MAY LOSE VALUE | | ARE NOT A DEPOSIT OF OR GUARANTEED BY ANY BANK OR ANY BANK AFFILIATE |
PGIM JENNISON INTERNATIONAL OPPORTUNITIES FUND
| | | | | | | | | | | | | | |
| SHARE CLASS | | A | | C | | R | | Z | | R2 | | R4 | | R6 |
| NASDAQ | | PWJAX | | PWJCX | | PWJRX | | PWJZX | | PWJBX | | PWJDX | | PWJQX |
| CUSIP | | 743969677 | | 743969669 | | 743969487 | | 743969651 | | 743969412 | | 743969396 | | 743969586 |
MF215E

PGIM JENNISON GLOBAL INFRASTRUCTURE FUND
ANNUAL REPORT
OCTOBER 31, 2019
COMING SOON: PAPERLESS SHAREHOLDER REPORTS
Beginning on January 1, 2021, as permitted by regulations adopted by the Securities and Exchange Commission, paper copies of the Fund’s annual and semiannual shareholder reports will no longer be sent by mail, unless you specifically request paper copies of the reports. Instead, the reports will be made available on the Fund’s website (pgiminvestments.com), and you will be notified by mail each time a report is posted and provided with a website link to access the report.
If you already elected to receive shareholder reports electronically, you will not be affected by this change and you need not take any action. You may elect to receive shareholder reports and other communications from the Fund electronically anytime by contacting your financial intermediary (such as a broker-dealer or bank) or, if you are a direct investor, by calling 1-800-225-1852 or by sending an email request to PGIM Investments at shareholderreports@pgim.com.
You may elect to receive all future reports in paper free of charge. If you invest through a financial intermediary, you can contact your financial intermediary or follow instructions included with this notice to elect to continue to receive paper copies of your shareholder reports. If you invest directly with the Fund, you can call 1-800-225-1852 or send an email request to shareholderreports@pgim.com to let the Fund know you wish to continue receiving paper copies of your shareholder reports. Your election to receive reports in paper will apply to all funds held in your account if you invest through your financial intermediary or all funds held with the fund complex if you invest directly with the Fund.

To enroll in e-delivery, go to pgiminvestments.com/edelivery
Highlights(unaudited)
| • | | Holdings within electric utilities, led by NextEra Energy, were strong contributors to the Fund’s performance during the reporting period. |
| • | | Allocations to integrated telecommunication services companies, such as Cellnex Telecom SA, bolstered relative and absolute performance. Stock selection within multi-utilities also helped. |
| • | | Stock selection within midstream energy infrastructure was a primary detractor from performance, as falling natural gas and natural gas liquid (e.g., ethane and propane) prices and overall negative sentiment within the energy sector hampered the performance of Targa Resources. |
| • | | The Fund was also hurt by stock selection and an underweight position relative to the S&P Global Infrastructure Index in highways & rail tracks. |
This report is not authorized for distribution to prospective investors unless preceded or accompanied by a current prospectus.
The views expressed in this report and information about the Fund’s portfolio holdings are for the period covered by this report and are subject to change thereafter.
Mutual funds are distributed by Prudential Investment Management Services LLC, member SIPC. Jennison Associates LLC is a registered investment adviser. Both are Prudential Financial companies.© 2019 Prudential Financial, Inc. and its related entities. Jennison Associates, Jennison, PGIM, and the PGIM logo are service marks of Prudential Financial, Inc. and its related entities, registered in many jurisdictions worldwide.
| | |
| 2 | | Visit our website at pgiminvestments.com |
Table of Contents
| | | | |
| PGIM Jennison Global Infrastructure Fund | | | 3 | |
This Page Intentionally Left Blank
Letter from the President

Dear Shareholder:
We hope you find the annual report for the PGIM Jennison Global Infrastructure Fund informative and useful. The report covers performance for the 12-month period that ended October 31, 2019.
While the US economy remained healthy, with rising corporate profits and strong job growth, the Federal Reserve cut interest rates three times in the latter half of the period. The cuts were a proactive attempt by the Fed to extend the longest domestic economic expansion on record as growth in many regions weakened. China in particular showed signs of slowing amid trade tensions with the US, and turmoil in the United Kingdom continued as it negotiates an exit from the European Union.
The interest-rate cuts helped boost the performance of stocks globally. For the period overall, large-cap US equities along with stocks in developed and emerging foreign markets all rose by double digits. Small-cap US stocks posted a single-digit gain. This positive performance came despite significant volatility early in the period. Equities plunged at the end of 2018 on concerns about China’s economy, a potential global trade war, higher interest rates, and worries that profit growth might slow. Stocks reversed course early in 2019, rising sharply after the Fed moderated its position on additional rate hikes for the remainder of the year.
The overall US bond market posted strong returns during the period on a significant rally in interest rates that saw the 10-year US Treasury yield decline from over 3% to under 2%. Investment-grade corporate bonds led the way with a double-digit gain, while corporate high yield and municipal bonds each had a return in the high single digits. Globally, bonds in developed markets delivered strong returns, and emerging markets debt rose by double digits.
Regarding your investments with PGIM, we believe it is important to maintain a diversified portfolio of funds consistent with your tolerance for risk, time horizon, and financial goals. Your financial advisor can help you create a diversified investment plan that may include funds covering all the basic asset classes and that reflects your personal investor profile and risk tolerance. However, diversification and asset allocation strategies do not assure a profit or protect against loss in declining markets.
At PGIM Investments, we consider it a great privilege and responsibility to help investors participate in opportunities across global markets while meeting their toughest investment challenges. PGIM is a top-10 global investment manager with more than $1 trillion in assets under management. This scale and investment expertise allow us to deliver actively managed funds and strategies to meet the needs of investors around the globe.
Thank you for choosing our family of funds.
Sincerely,

Stuart S. Parker, President
PGIM Jennison Global Infrastructure Fund
December 16, 2019
| | | | |
| PGIM Jennison Global Infrastructure Fund | | | 5 | |
Your Fund’s Performance(unaudited)
Performance data quoted represents past performance. Past performance does not guarantee future results. The investment return and principal value of an investment will fluctuate, so that an investor’s shares, when redeemed, may be worth more or less than their original cost. Current performance may be lower or higher than the past performance data quoted. An investor may obtain performance data as of the most recent month-end by visiting our website atpgiminvestments.com or by calling (800) 225-1852.
| | | | | | | | | | |
| |
| | | Average Annual Total Returns as of 10/31/19
(with sales charges) | |
| | | One Year (%) | | Five Years (%) | | | Since Inception (%) | |
| Class A | | 15.30 | | | 3.25 | | | | 6.87 (9/25/13) | |
| Class C | | 20.01 | | | 3.63 | | | | 7.05 (9/25/13) | |
| Class Z | | 22.30 | | | 4.70 | | | | 8.13 (9/25/13) | |
| Class R6 | | 22.40 | | | N/A | | | | 11.13 (12/28/16) | |
| S&P Global Infrastructure Index | | | | | |
| | 19.94 | | | 4.78 | | | | — | |
| S&P 500 Index | | | | | | | | | | |
| | | 14.31 | | | 10.77 | | | | — | |
| | | | | | | | | | |
| |
| | | Average Annual Total Returns as of 10/31/19
(without sales charges) | |
| | | One Year (%) | | Five Years (%) | | | Since Inception (%) | |
| Class A | | 22.01 | | | 4.42 | | | | 7.87 (9/25/13) | |
| Class C | | 21.01 | | | 3.63 | | | | 7.05 (9/25/13) | |
| Class Z | | 22.30 | | | 4.70 | | | | 8.13 (9/25/13) | |
| Class R6 | | 22.40 | | | N/A | | | | 11.13 (12/28/16) | |
| S&P Global Infrastructure Index | | | | | | | | | | |
| | 19.94 | | | 4.78 | | | | — | |
| S&P 500 Index | | | | | | | | | | |
| | | 14.31 | | | 10.77 | | | | — | |
| | |
| 6 | | Visit our website at pgiminvestments.com |
Growth of a $10,000 Investment(unaudited)
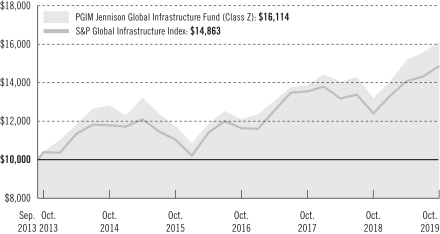
The graph compares a $10,000 investment in the Fund’s Class Z shares with a similar investment in the S&P Global Infrastructure Index by portraying the initial account values at the commencement of operations of Class Z shares (September 25, 2013) and the account values at the end of the current fiscal year (October 31, 2019), as measured on a quarterly basis. For purposes of the graph, and unless otherwise indicated, it has been assumed that (a) all recurring fees (including management fees) were deducted; and (b) all dividends and distributions were reinvested. The line graph provides information for Class Z shares only. As indicated in the tables provided earlier, performance for other share classes will vary due to the differing charges and expenses applicable to each share class (as indicated in the following paragraphs). Without waiver of fees and/or expense reimbursements, if any, the Fund’s returns would have been lower.
Past performance does not predict future performance. Total returns and the ending account values in the graphs include changes in share price and reinvestment of dividends and capital gains distributions in a hypothetical investment for the periods shown. The Fund’s total returns do not reflect the deduction of income taxes on an individual’s investment. Taxes may reduce your actual investment returns on income or gains paid by the Fund or any gains you may realize if you sell your shares.
Source: PGIM Investments LLC and Lipper Inc.
Since Inception returns are provided since the Fund has less than 10 fiscal years of returns. Since Inception returns for the Indexes are measured from the closest month-end to the class’ inception date.
| | | | |
| PGIM Jennison Global Infrastructure Fund | | | 7 | |
Your Fund’s Performance(continued)
The returns in the tables do not reflect the deduction of taxes that a shareholder would pay on Fund distributions or following the redemption of Fund shares. The average annual total returns take into account applicable sales charges, which are described for each share class in the table below.
| | | | | | | | |
| | | | | |
| | | Class A | | Class C | | Class Z | | Class R6 |
| Maximum initial sales charge | | 5.50% of the public offering price | | None | | None | | None |
| Contingent deferred sales charge (CDSC) (as a percentage of the lower of the original purchase price or the net asset value at redemption) | | 1.00% on sales of $1 million or more made within 12 months of purchase | | 1.00% on sales made within 12 months of purchase | | None | | None |
| Annual distribution and service (12b-1) fees (shown as a percentage of average daily net assets) | | 0.30% (0.25% currently) | | 1.00% | | None | | None |
Benchmark Definitions
S&P Global Infrastructure Index—The S&P Global Infrastructure Index is an unmanaged index that consists of 75 companies from around the world that represent the listed infrastructure universe. To create diversified exposure across the global listed infrastructure market, the Index has balanced weights across three distinct infrastructure clusters: Utilities, Transportation, and Energy. The average annual total returns for the Index measured from the month-end closest to the inception date of the Fund’s Class A, Class C, and Class Z shares are 6.73% and 9.66% for Class R6 shares.
S&P 500 Index—The S&P 500 Index is an unmanaged index of over 500 stocks of large US public companies. It gives a broad look at how stock prices in the United States have performed. The average annual total returns for the Index measured from the month-end closest to the inception date of the Fund’s Class A, Class C, and Class Z shares are 12.48% and 13.58% for Class R6 shares.
Investors cannot invest directly in an index or average. The returns for the Indexes would be lower if they included the effects of sales charges, operating expenses of a mutual fund, or taxes.
| | |
| 8 | | Visit our website at pgiminvestments.com |
Presentation of Fund Holdingsas of 10/31/19
| | | | | | |
| | | |
| Ten Largest Holdings | | Line of Business | | Country | | % of Net Assets |
| NextEra Energy, Inc. | | Electric Utilities | | United States | | 5.3% |
| FirstEnergy Corp. | | Electric Utilities | | United States | | 4.0% |
| RWE AG | | Multi-Utilities | | Germany | | 4.0% |
| Ferrovial SA | | Construction & Engineering | | Spain | | 3.8% |
| Cellnex Telecom SA | | Diversified Telecommunication Services | | Spain | | 3.8% |
| Vinci SA | | Construction & Engineering | | France | | 3.3% |
| Aqua America, Inc. | | Water Utilities | | United States | | 3.2% |
| American Electric Power Co., Inc. | | Electric Utilities | | United States | | 3.1% |
| Sempra Energy | | Multi-Utilities | | United States | | 2.8% |
| Eiffage SA | | Construction & Engineering | | France | | 2.6% |
For a complete list of holdings, please refer to the Schedule of Investments section of this report. Holdings reflect only long-term Investments.
| | | | |
| PGIM Jennison Global Infrastructure Fund | | | 9 | |
Strategy and Performance Overview(unaudited)
How did the Fund perform?
ThePGIM Jennison Global Infrastructure Fund’s Class Z shares returned 22.30% in the12-month reporting period that ended October 31, 2019, outperforming the 19.94% return of the S&P Global Infrastructure Index (the Index).
What was the market environment?
| • | | Equity markets were highly volatile during the reporting period. Initially, global economic growth was accelerating; US employment was strengthening; and lower US corporate tax rates were helping to boost wages and capital spending. Given the constructive macroeconomic landscape, investors overlooked uncertainty created by White House trade and other policy initiatives. |
| • | | An abruptsell-off in late 2018 reflected mounting investor concerns about the rising risk of a major trade war with China, the pace of US economic growth, decelerating expansion innon-US economies, US interest rate increases and their effect on US growth, the state of US alliances with other major trading partners, and discord and uncertainty about domestic policy. |
| • | | US equity markets rebounded early in 2019 as the Federal Reserve (the Fed) signaled a pause in federal funds rate hikes, but they fell again as the period ended on are-escalation of trade tension. Numerous central banks around the world subsequently lowered interest rates; the Fed cut rates three times during the period. |
| • | | West Texas Intermediate crude oil and natural gas prices were volatile during the period, declining 20.04% and 21.21%, respectively. Prices for natural gas liquids, such as ethane and propane, dropped more than 40%. |
| • | | Within the Index, the highways & rail tracks segment led performance, along with the overall utilities sector, specifically gas, water, and electric utilities. Utilities overall benefited from investors’“risk-off” sentiment during the period. Airport services and midstream energy infrastructure posted double-digit gains. Independent power producers & energy traders posted negative returns. |
What worked?
| • | | Holdings within electric utilities, led byNextEra Energy Inc., were strong contributors to the Fund’s performance during the reporting period. |
| • | | Allocations to integrated telecommunication services companies, such asCellnex Telecom SA, bolstered relative and absolute performance. Stock selection within multi-utilities also helped. |
| • | | Other notable contributors includedFerrovial SA, RWE AG, andFirstEnergy Corp. |
| | |
| 10 | | Visit our website at pgiminvestments.com |
What didn’t work?
| • | | Stock selection within midstream energy infrastructure was a primary detractor from the Fund’s performance during the period, as falling natural gas and natural gas liquid (e.g., ethane and propane) prices and overall negative sentiment within the energy sector hampered the performance ofTarga Resources Corp. |
| • | | The Fund was also hurt by stock selection and an underweight position relative to the Index in highways & rail tracks. |
| • | | The most notable detractors includedWestshore Terminals,Aeroports de Paris SA, andVistra Energy Corp., all of which were sold by the end of the period. Another key detractor wasLight SA, which had been purchased during the period. |
Current outlook
| • | | Within transportation, Jennison prefers exposure to toll road names in Europe and Australia that benefit from inflation-linked pricing, low interest rates, and stable free cash-flow growth. In general, Jennison is less constructive on the airports segment and prefers airport assets with stronger pricing power and an ability to grow revenue from their retail operations. Jennison continues to like the potential for increased margins and pricing within US rails that are rolling out precision-scheduled railroading. At the same time, Jennison has scaled back certain exposures to reflect risks tied to a weaker US industrial economy. While Jennison remains cautious in many emerging markets regions given political, currency, and economic headwinds, it has identified possible opportunities in the Brazilian rail industry that are the result of planned rail network expansion, service improvements, and the volume growth potential of grain exports. Possible fiscal reforms in Brazil could also aid the economic and interest rate backdrop, in Jennison’s view. Overall, Jennison continues to find many opportunities within the transportation infrastructure sector, focusing on companies that may benefit long term throughout the economic cycle and that canre-deploy growth capital at attractive returns while growing dividends for shareholders. |
| • | | Regarding utilities, the majority of the Fund’s exposure at the end of the period was composed of US holdings. These were primarily regulated investment opportunities with higher rates of return than the returns that foreign peers were generating (on average), along with better relative earnings and cash-flow growth. Jennison believes that higher-quality, faster-growth utilities should outperform lower-growth and/or lower-quality peers over time. As the fourth quarter of 2019 began, fundamentals for US utilities remained healthy, with highly visible capital expenditure trajectories and improving regulatory compacts. US utilities are projected to generatemid-single-digit earnings growth with commensurate dividend growth. Nevertheless, Jennison remains mindful that lower interest rates could lead to lower allowed returns on equity in rate cases and, therefore, continues to be selective. Jennison continues to prefer regulated utilities with solid and |
| | | | |
| PGIM Jennison Global Infrastructure Fund | | | 11 | |
Strategy and Performance Overview(continued)
| | sustainable dividend yields and above-average projected earnings and/or dividend growth driven by regulatory rate-base investment opportunities that extend well beyond their five-year planning horizons. In addition, Jennison favors utilities operating in constructive regulatory environments that support timely and attractive returns on capital deployed. It also seeks companies that can mitigate customer bill impacts by focusing on operating efficiencies versus the common strategy of serial rate-increase requests. |
| • | | Looking beyond US utilities, renewable energy continues to be a dominant theme in the utilities sector—both domestically and abroad—and most of the Fund’snon-US utility exposure is leveraged to the trend toward greater investment in renewable electric generation. Jennison believes there is continued momentum behind the secular trends of rising global demand for renewable energy supply and the subsequent grid infrastructure investment that would be needed to modernize aging networks and absorb the intermittent nature of renewable generation. In Jennison’s opinion, the trend for increased global investment in renewable energy is supported by two broad and enduring themes: (1) pronounced reductions in the cost of renewable energy, driven by continued technological advancement, and (2) increasing public policy support—on a global scale and at local levels—for renewable investments driven by concerns over greenhouse gas emissions, energy security, and most recently job creation. |
| • | | Moving to the Fund’s energy infrastructure exposure, fundamentals within the midstream group have continued to improve across the board, as the vast majority of midstream companies saw their overall balance sheet leverage ratios decline due to management teams exhibiting more capital discipline that resulted in better cash flows relative to market expectations. These improvements in capital discipline, along with the continuing trends of higher dividend coverage and less need for external equity, will ultimately benefit shareholders over the long term, in Jennison’s view. During the reporting period, there was a bifurcation in both the tone of earnings calls and earnings results—as well as stock price performance—as the large and more highly integrated companies (those with multiple touch points along the energy value chain) separated themselves from companies with less-competitive advantages and narrower asset bases. Jennison believes this trend supports its highly selective approach to the midstream energy sector and its continued focus on midstream companies with broad, highly integrated asset networks that have higher competitive barriers to entry and that exhibit significantly improved or improving financial metrics and corporate governance. |
| • | | Lastly, regarding communications infrastructure, Jennison continues to favor wireless towers and data center operators, as both industries capitalize on exponential data demand growth around the world. In data centers, Jennison sees opportunities to invest in infrastructure operations that can profit from secular global trends such as the shift by large corporations toward cloud computing. Tower operators also present attractive investment opportunities, in Jennison’s view, given their critical infrastructure, multi-year |
| | |
| 12 | | Visit our website at pgiminvestments.com |
| | contracts with their wireless operator customers, and strong free cash-flow generation. In addition, Jennison views the impending 5G wireless network upgrade cycle (financed by wireless carriers, not tower operators) as a positive inflection point for the revenue and free cash-flow of tower companies. |
The percentage points shown in the tables below identify each security’s positive or negative contribution to the Fund’s return, which is the sum of all contributions by individual holdings during the Fund’s reporting period.
| | | | | | |
| |
| Top Contributors (%) | | Top Detractors (%) |
| NextEra Energy Inc. | | 2.03 | | Targa Resources Corp. | | –0.57 |
| Cellnex Telecom SA | | 1.67 | | Westshore Terminals | | –0.24 |
| Ferrovial SA | | 1.47 | | Aeroports de Paris SA | | –0.23 |
| RWE AG | | 1.46 | | Vistra Energy Corp. | | –0.13 |
| FirstEnergy Corp. | | 1.23 | | Light SA | | –0.11 |
| | | | |
| PGIM Jennison Global Infrastructure Fund | | | 13 | |
Fees and Expenses(unaudited)
As a shareholder of the Fund, you incur two types of costs: (1) transaction costs, including sales charges (loads) on purchase payments and redemptions, as applicable, and (2) ongoing costs, including management fees, distribution, and/or service (12b-1) fees, and other Fund expenses, as applicable. This example is intended to help you understand your ongoing costs (in dollars) of investing in the Fund and to compare these costs with the ongoing costs of investing in other mutual funds.
The example is based on an investment of $1,000 held through the six-month period ended October 31, 2019. The example is for illustrative purposes only; you should consult the Prospectus for information on initial and subsequent minimum investment requirements.
Actual Expenses
The first line for each share class in the table on the following page provides information about actual account values and actual expenses. You may use the information on this line, together with the amount you invested, to estimate the expenses that you paid over the period. Simply divide your account value by $1,000 (for example, an $8,600 account value ÷ $1,000 = 8.6), then multiply the result by the number on the first line under the heading “Expenses Paid During the Six-Month Period” to estimate the expenses you paid on your account during this period.
Hypothetical Example for Comparison Purposes
The second line for each share class in the table on the following page provides information about hypothetical account values and hypothetical expenses based on the Fund’s actual expense ratio and an assumed rate of return of 5% per year before expenses, which is not the Fund’s actual return. The hypothetical account values and expenses may not be used to estimate the actual ending account balance or expenses you paid for the period. You may use this information to compare the ongoing costs of investing in the Fund and other funds. To do so, compare this 5% hypothetical example with the 5% hypothetical examples that appear in the shareholder reports of the other funds.
The Fund’s transfer agent may charge additional fees to holders of certain accounts that are not included in the expenses shown in the table on the following page. These fees apply to individual retirement accounts (IRAs) and Section 403(b) accounts. As of the close of the six-month period covered by the table, IRA fees included an annual maintenance fee of $15 per account (subject to a maximum annual maintenance fee of $25 for all accounts held by the same shareholder). Section 403(b) accounts are charged an annual $25 fiduciary maintenance fee. Some of the fees may vary in amount, or may be waived, based on your total account balance or the number of PGIM funds, including the Fund, that you own. You should consider the additional fees that were charged to your Fund account over the six-month period when you estimate the total ongoing expenses paid over the period
| | |
| 14 | | Visit our website at pgiminvestments.com |
and the impact of these fees on your ending account value, as these additional expenses are not reflected in the information provided in the expense table. Additional fees have the effect of reducing investment returns.
Please note that the expenses shown in the table are meant to highlight your ongoing costs only and do not reflect any transactional costs such as sales charges (loads). Therefore, the second line for each share class in the table is useful in comparing ongoing costs only and will not help you determine the relative total costs of owning different funds. In addition, if these transactional costs were included, your costs would have been higher.
| | | | | | | | | | | | | | | | | | |
| | | | |
PGIM
Jennison Global
Infrastructure Fund | | Beginning Account
Value
May 1, 2019 | | | Ending Account
Value
October 31, 2019 | | | Annualized
Expense Ratio
Based on the
Six-Month Period | | | Expenses Paid
During the
Six-Month Period* | |
| Class A | | Actual | | $ | 1,000.00 | | | $ | 1,061.90 | | | | 1.50 | % | | $ | 7.80 | |
| | Hypothetical | | $ | 1,000.00 | | | $ | 1,017.64 | | | | 1.50 | % | | $ | 7.63 | |
| Class C | | Actual | | $ | 1,000.00 | | | $ | 1,057.30 | | | | 2.25 | % | | $ | 11.67 | |
| | Hypothetical | | $ | 1,000.00 | | | $ | 1,013.86 | | | | 2.25 | % | | $ | 11.42 | |
| Class Z | | Actual | | $ | 1,000.00 | | | $ | 1,063.60 | | | | 1.17 | % | | $ | 6.09 | |
| | Hypothetical | | $ | 1,000.00 | | | $ | 1,019.31 | | | | 1.17 | % | | $ | 5.96 | |
| Class R6 | | Actual | | $ | 1,000.00 | | | $ | 1,063.60 | | | | 1.17 | % | | $ | 6.09 | |
| | | Hypothetical | | $ | 1,000.00 | | | $ | 1,019.31 | | | | 1.17 | % | | $ | 5.96 | |
*Fund expenses (net of fee waivers or subsidies, if any) for each share class are equal to the annualized expense ratio for each share class (provided in the table), multiplied by the average account value over the period, multiplied by the 184 days in the six-month period ended October 31, 2019, and divided by the 365 days in the Fund’s fiscal year ended October 31, 2019 (to reflect the six-month period). Expenses presented in the table include the expenses of any underlying portfolios in which the Fund may invest.
| | | | |
| PGIM Jennison Global Infrastructure Fund | | | 15 | |
Schedule of Investments
as of October 31, 2019
| | | | | | | | |
| Description | | Shares | | | Value | |
LONG-TERM INVESTMENTS 99.4% | | | | | | | | |
| | |
COMMON STOCKS | | | | | | | | |
| | |
Australia 7.1% | | | | | | | | |
APA Group | | | 91,271 | | | $ | 731,381 | |
Atlas Arteria Ltd. | | | 152,135 | | | | 840,020 | |
Cleanaway Waste Management Ltd. | | | 481,255 | | | | 612,256 | |
Transurban Group | | | 100,938 | | | | 1,034,654 | |
| | | | | | | | |
| | | | | | | 3,218,311 | |
| | |
Brazil 3.7% | | | | | | | | |
Light SA | | | 48,391 | | | | 239,874 | |
Neoenergia SA | | | 142,185 | | | | 744,517 | |
Rumo SA* | | | 121,816 | | | | 694,963 | |
| | | | | | | | |
| | | | | | | 1,679,354 | |
| | |
Canada 4.2% | | | | | | | | |
Enbridge, Inc. | | | 19,292 | | | | 702,632 | |
Pembina Pipeline Corp. | | | 21,794 | | | | 766,277 | |
TC Energy Corp. | | | 9,152 | | | | 461,318 | |
| | | | | | | | |
| | | | | | | 1,930,227 | |
| | |
China 0.9% | | | | | | | | |
Guangdong Investment Ltd. | | | 198,516 | | | | 429,309 | |
| | |
Denmark 1.5% | | | | | | | | |
Orsted A/S, 144A | | | 7,983 | | | | 700,383 | |
| | |
France 7.1% | | | | | | | | |
Eiffage SA | | | 11,184 | | | | 1,200,580 | |
Getlink SE | | | 32,441 | | | | 542,380 | |
Vinci SA | | | 13,278 | | | | 1,488,621 | |
| | | | | | | | |
| | | | | | | 3,231,581 | |
| | |
Germany 4.0% | | | | | | | | |
RWE AG | | | 60,223 | | | | 1,835,217 | |
| | |
India 0.5% | | | | | | | | |
NTPC Ltd. | | | 130,290 | | | | 225,067 | |
| | |
Italy 7.0% | | | | | | | | |
Atlantia SpA | | | 47,768 | | | | 1,179,605 | |
See Notes to Financial Statements.
| | | | |
| PGIM Jennison Global Infrastructure Fund | | | 17 | |
Schedule of Investments(continued)
as of October 31, 2019
| | | | | | | | |
| Description | | Shares | | | Value | |
COMMON STOCKS (Continued) | | | | | | | | |
| | |
Italy (cont’d.) | | | | | | | | |
Enav SpA, 144A | | | 146,015 | | | $ | 850,599 | |
Enel SpA | | | 148,337 | | | | 1,149,654 | |
| | | | | | | | |
| | | | | | | 3,179,858 | |
| | |
New Zealand 0.6% | | | | | | | | |
Auckland International Airport Ltd. | | | 44,658 | | | | 265,613 | |
| | |
Spain 10.2% | | | | | | | | |
Cellnex Telecom SA, 144A* | | | 39,701 | | | | 1,711,290 | |
Ferrovial SA | | | 58,966 | | | | 1,738,630 | |
Iberdrola SA | | | 115,621 | | | | 1,186,924 | |
| | | | | | | | |
| | | | | | | 4,636,844 | |
| | |
United Kingdom 2.3% | | | | | | | | |
National Grid PLC | | | 47,134 | | | | 549,749 | |
SSE PLC | | | 29,861 | | | | 496,493 | |
| | | | | | | | |
| | | | | | | 1,046,242 | |
| | |
United States 50.3% | | | | | | | | |
Alliant Energy Corp. | | | 12,872 | | | | 686,592 | |
American Electric Power Co., Inc. | | | 14,738 | | | | 1,391,120 | |
American Tower Corp., REIT | | | 3,958 | | | | 863,161 | |
Aqua America, Inc. | | | 32,431 | | | | 1,470,097 | |
Cheniere Energy, Inc.* | | | 15,244 | | | | 938,268 | |
Crown Castle International Corp., REIT | | | 3,226 | | | | 447,737 | |
Dominion Energy, Inc. | | | 8,747 | | | | 722,065 | |
Edison International | | | 18,305 | | | | 1,151,385 | |
Equinix, Inc., REIT | | | 1,922 | | | | 1,089,351 | |
Eversource Energy | | | 8,698 | | | | 728,371 | |
Exelon Corp. | | | 15,235 | | | | 693,040 | |
FirstEnergy Corp. | | | 37,994 | | | | 1,835,870 | |
Kinder Morgan, Inc. | | | 35,307 | | | | 705,434 | |
NextEra Energy, Inc. | | | 10,159 | | | | 2,421,296 | |
Norfolk Southern Corp. | | | 5,285 | | | | 961,870 | |
ONEOK, Inc. | | | 13,424 | | | | 937,398 | |
Sempra Energy | | | 8,764 | | | | 1,266,486 | |
Targa Resources Corp. | | | 10,666 | | | | 414,694 | |
Union Pacific Corp. | | | 6,990 | | | | 1,156,565 | |
Waste Connections, Inc. | | | 12,381 | | | | 1,144,004 | |
See Notes to Financial Statements.
| | | | | | | | |
| Description | | Shares | | | Value | |
COMMON STOCKS (Continued) | | | | | | | | |
| | |
United States (cont’d.) | | | | | | | | |
Waste Management, Inc. | | | 7,102 | | | $ | 796,915 | |
Williams Cos., Inc. (The) | | | 49,226 | | | | 1,098,232 | |
| | | | | | | | |
| | | | | | | 22,919,951 | |
| | | | | | | | |
TOTAL LONG-TERM INVESTMENTS
(cost $35,067,412) | | | | | | | 45,297,957 | |
| | | | | | | | |
| | |
SHORT-TERM INVESTMENT 1.3% | | | | | | | | |
| | |
AFFILIATED MUTUAL FUND | | | | | | | | |
PGIM Core Ultra Short Bond Fund
(cost $598,186)(w) | | | 598,186 | | | | 598,186 | |
| | | | | | | | |
TOTAL INVESTMENTS 100.7%
(cost $35,665,598) | | | | | | | 45,896,143 | |
Liabilities in excess of other assets (0.7)% | | | | | | | (301,401 | ) |
| | | | | | | | |
NET ASSETS 100.0% | | | | | | $ | 45,594,742 | |
| | | | | | | | |
Below is a list of the abbreviation(s) used in the annual report:
144A—Security was purchased pursuant to Rule 144A under the Securities Act of 1933 and, pursuant to the requirements of Rule 144A, may not be resold except to qualified institutional buyers.
LIBOR—London Interbank Offered Rate
REITs—Real Estate Investment Trust
| * | Non-income producing security. |
| (w) | PGIM Investments LLC, the manager of the Series, also serves as manager of the PGIM Core Ultra Short Bond Fund. |
Fair Value Measurements:
Various inputs are used in determining the value of the Series’ investments. These inputs are summarized in the three broad levels listed below.
Level 1—unadjusted quoted prices generally in active markets for identical securities.
Level 2—quoted prices for similar securities, interest rates and yield curves, prepayment speeds, foreign currency exchange rates and other observable inputs.
Level 3—unobservable inputs for securities valued in accordance with Board approved fair valuation procedures.
The following is a summary of the inputs used as of October 31, 2019 in valuing such portfolio securities:
| | | | | | | | | | | | |
| | | Level 1 | | | Level 2 | | | Level 3 | |
Investments in Securities | | | | | | | | | | | | |
Assets | | | | | | | | | | | | |
Common Stocks | | | | | | | | | | | | |
Australia | | $ | — | | | $ | 3,218,311 | | | $ | — | |
See Notes to Financial Statements.
| | | | |
| PGIM Jennison Global Infrastructure Fund | | | 19 | |
Schedule of Investments(continued)
as of October 31, 2019
| | | | | | | | | | | | |
| | | Level 1 | | | Level 2 | | | Level 3 | |
Investments in Securities (continued) | | | | | | | | | | | | |
Assets (continued) | | | | | | | | | | | | |
Common Stocks (continued) | | | | | | | | | | | | |
Brazil | | $ | 1,679,354 | | | $ | — | | | $ | — | |
Canada | | | 1,930,227 | | | | — | | | | — | |
China | | | — | | | | 429,309 | | | | — | |
Denmark | | | — | | | | 700,383 | | | | — | |
France | | | — | | | | 3,231,581 | | | | — | |
Germany | | | — | | | | 1,835,217 | | | | — | |
India | | | — | | | | 225,067 | | | | — | |
Italy | | | — | | | | 3,179,858 | | | | — | |
New Zealand | | | — | | | | 265,613 | | | | — | |
Spain | | | — | | | | 4,636,844 | | | | — | |
United Kingdom | | | — | | | | 1,046,242 | | | | — | |
United States | | | 22,919,951 | | | | — | | | | — | |
Affiliated Mutual Fund | | | 598,186 | | | | — | | | | — | |
| | | | | | �� | | | | | | |
Total | | $ | 27,127,718 | | | $ | 18,768,425 | | | $ | — | |
| | | | | | | | | | | | |
Industry Classification:
The industry classification of investments and liabilities in excess of other assets shown as a percentage of net assets as of October 31, 2019 were as follows (unaudited):
| | | | |
Electric Utilities | | | 29.4 | % |
Oil, Gas & Consumable Fuels | | | 13.2 | |
Transportation Infrastructure | | | 10.4 | |
Construction & Engineering | | | 9.7 | |
Multi-Utilities | | | 9.6 | |
Road & Rail | | | 6.1 | |
Commercial Services & Supplies | | | 5.7 | |
Equity Real Estate Investment Trusts (REITs) | | | 5.3 | |
Water Utilities | | | 4.1 | |
Diversified Telecommunication Services | | | 3.8 | |
| | | | |
Gas Utilities | | | 1.6 | % |
Affiliated Mutual Fund | | | 1.3 | |
Independent Power & Renewable Electricity Producers | | | 0.5 | |
| | | | |
| | | 100.7 | |
Liabilities in excess of other assets | | | (0.7 | ) |
| | | | |
| | | 100.0 | % |
| | | | |
See Notes to Financial Statements.
Statement of Assets and Liabilities
as of October 31, 2019
| | | | |
Assets | | | | |
Investments at value: | | | | |
Unaffiliated investments (cost $35,067,412) | | $ | 45,297,957 | |
Affiliated investments (cost $598,186) | | | 598,186 | |
Foreign currency, at value (cost $4,695) | | | 4,693 | |
Tax reclaim receivable | | | 42,512 | |
Receivable for Series shares sold | | | 42,362 | |
Dividends receivable | | | 36,236 | |
Prepaid expenses | | | 814 | |
| | | | |
Total Assets | | | 46,022,760 | |
| | | | |
| |
Liabilities | | | | |
Payable for investments purchased | | | 292,297 | |
Payable for Series shares reacquired | | | 41,480 | |
Management fee payable | | | 35,863 | |
Accrued expenses and other liabilities | | | 26,861 | |
Custodian and accounting fees payable | | | 24,502 | |
Distribution fee payable | | | 5,125 | |
Affiliated transfer agent fee payable | | | 1,890 | |
| | | | |
Total Liabilities | | | 428,018 | |
| | | | |
| |
Net Assets | | $ | 45,594,742 | |
| | | | |
| | | | | |
Net assets were comprised of: | | | | |
Common stock, at par | | $ | 31,127 | |
Paid-in capital in excess of par | | | 36,725,450 | |
Total distributable earnings (loss) | | | 8,838,165 | |
| | | | |
Net assets, October 31, 2019 | | $ | 45,594,742 | |
| | | | |
See Notes to Financial Statements.
| | | | |
| PGIM Jennison Global Infrastructure Fund | | | 21 | |
Statement of Assets and Liabilities
as of October 31, 2019
| | | | |
Class A | | | | |
Net asset value and redemption price per share,
($ 7,637,467 ÷ 521,029 shares of common stock issued and outstanding) | | $ | 14.66 | |
Maximum sales charge (5.50% of offering price) | | | 0.85 | |
| | | | |
Maximum offering price to public | | $ | 15.51 | |
| | | | |
| |
Class C | | | | |
Net asset value, offering price and redemption price per share, | | | | |
($4,135,203 ÷ 284,920 shares of common stock issued and outstanding) | | $ | 14.51 | |
| | | | |
| |
Class Z | | | | |
Net asset value, offering price and redemption price per share, | | | | |
($21,868,197 ÷ 1,491,353 shares of common stock issued and outstanding) | | $ | 14.66 | |
| | | | |
| |
Class R6 | | | | |
Net asset value, offering price and redemption price per share, | | | | |
($11,953,875 ÷ 815,350 shares of common stock issued and outstanding) | | $ | 14.66 | |
| | | | |
See Notes to Financial Statements.
Statement of Operations
Year Ended October 31, 2019
| | | | |
Net Investment Income (Loss) | | | | |
Income | | | | |
Unaffiliated dividend income (net of $89,614 foreign withholding tax) | | $ | 1,320,209 | |
Affiliated dividend income | | | 23,392 | |
Income from securities lending, net (including affiliated income of $214) | | | 1,869 | |
| | | | |
Total income | | | 1,345,470 | |
| | | | |
| |
Expenses | | | | |
Management fee | | | 472,450 | |
Distribution fee(a) | | | 64,469 | |
Custodian and accounting fees | | | 78,240 | |
Registration fees(a) | | | 46,346 | |
Transfer agent’s fees and expenses (including affiliated expense of $12,675)(a) | | | 40,104 | |
Shareholders’ reports | | | 40,056 | |
Audit fee | | | 28,315 | |
Legal fees and expenses | | | 17,443 | |
Directors’ fees | | | 11,427 | |
Miscellaneous | | | 27,684 | |
| | | | |
Total expenses | | | 826,534 | |
Less: Fee waiver and/or expense reimbursement(a) | | | (198,898 | ) |
Distribution fee waiver(a) | | | (3,859 | ) |
| | | | |
Net expenses | | | 623,777 | |
| | | | |
Net investment income (loss) | | | 721,693 | |
| | | | |
| |
Realized And Unrealized Gain (Loss) On Investment And Foreign Currency Transactions | | | | |
Net realized gain (loss) on: | | | | |
Investment transactions (including affiliated of $(55)) | | | 3,325,673 | |
Foreign currency transactions | | | (5,266 | ) |
| | | | |
| | | 3,320,407 | |
| | | | |
Net change in unrealized appreciation (depreciation) on: | | | | |
Investments | | | 5,354,079 | |
Foreign currencies | | | (358 | ) |
| | | | |
| | | 5,353,721 | |
| | | | |
Net gain (loss) on investment and foreign currency transactions | | | 8,674,128 | |
| | | | |
Net Increase (Decrease) In Net Assets Resulting From Operations | | $ | 9,395,821 | |
| | | | |
| (a) | Class specific expenses and waivers were as follows: |
| | | | | | | | | | | | | | | | |
| | | Class A | | | Class C | | | Class Z | | | Class R6 | |
Distribution fee | | | 23,155 | | | | 41,314 | | | | — | | | | — | |
Registration fees | | | 12,955 | | | | 12,955 | | | | 12,956 | | | | 7,480 | |
Transfer agent’s fees and expenses | | | 15,540 | | | | 6,695 | | | | 17,808 | | | | 61 | |
Fee waiver and/or expense reimbursement | | | (42,255 | ) | | | (27,021 | ) | | | (86,522 | ) | | | (43,100 | ) |
Distribution fee waiver | | | (3,859 | ) | | | — | | | | — | | | | — | |
See Notes to Financial Statements.
| | | | |
| PGIM Jennison Global Infrastructure Fund | | | 23 | |
Statements of Changes in Net Assets
| | | | | | | | |
| |
| | | Year Ended
October 31, | |
| | |
| | | 2019 | | | 2018 | |
Increase (Decrease) in Net Assets | | | | | | | | |
Operations | | | | | | | | |
Net investment income (loss) | | $ | 721,693 | | | $ | 795,099 | |
Net realized gain (loss) on investment and foreign currency transactions | | | 3,320,407 | | | | 2,501,155 | |
Net change in unrealized appreciation (depreciation) on investments and foreign currencies | | | 5,353,721 | | | | (5,963,009 | ) |
| | | | | | | | |
Net increase (decrease) in net assets resulting from operations | | | 9,395,821 | | | | (2,666,755 | ) |
| | | | | | | | |
| | |
Dividends and Distributions | | | | | | | | |
Distributions from distributable earnings | | | | | | | | |
Class A | | | (117,355 | ) | | | (141,368 | ) |
Class C | | | (40,973 | ) | | | (41,199 | ) |
Class Z | | | (388,838 | ) | | | (447,302 | ) |
Class R6 | | | (263,857 | ) | | | (232,070 | ) |
| | | | | | | | |
| | | (811,023 | ) | | | (861,939 | ) |
| | | | | | | | |
Tax return of capital distributions | | | | | | | | |
Class A | | | (6,757 | ) | | | — | |
Class C | | | (2,359 | ) | | | — | |
Class Z | | | (22,389 | ) | | | — | |
Class R6 | | | (15,193 | ) | | | — | |
| | | | | | | | |
| | | (46,698 | ) | | | — | |
| | | | | | | | |
| | |
Series share transactions (Net of share conversions) | | | | | | | | |
Net proceeds from shares sold | | | 7,794,683 | | | | 15,455,026 | |
Net asset value of shares issued in reinvestment of dividends and distributions | | | 852,911 | | | | 839,400 | |
Cost of shares reacquired | | | (20,811,750 | ) | | | (32,145,267 | ) |
| | | | | | | | |
Net increase (decrease) in net assets from Series share transactions | | | (12,164,156 | ) | | | (15,850,841 | ) |
| | | | | | | | |
Total increase (decrease) | | | (3,626,056 | ) | | | (19,379,535 | ) |
| | |
Net Assets: | | | | | | | | |
Beginning of year | | | 49,220,798 | | | | 68,600,333 | |
| | | | | | | | |
End of year | | $ | 45,594,742 | | | $ | 49,220,798 | |
| | | | | | | | |
See Notes to Financial Statements.
Notes to Financial Statements
Prudential World Fund, Inc. (the “Fund”) is registered under the Investment Company Act of 1940, as amended (“1940 Act”), as anopen-end management investment company and currently consists of seven series: PGIM Jennison Emerging Markets Equity Opportunities Fund, PGIM Jennison Global Opportunities Fund, PGIM Jennison International Opportunities Fund and PGIM QMA International Equity Fund, each of which are diversified funds and PGIM Jennison Global Infrastructure Fund, PGIM Emerging Markets Debt Hard Currency Fund and PGIM Emerging Markets Debt Local Currency Fund, each of which arenon-diversified funds for purposes of the 1940 Act. These financial statements relate only to the PGIM Jennison Global Infrastructure Fund (the “Series”).
The investment objective of the Series is to achieve total return.
1. Accounting Policies
The Series follows the investment company accounting and reporting guidance of the Financial Accounting Standards Board (“FASB”) Accounting Standard Codification (“ASC”) Topic 946 Financial Services—Investment Companies. The following accounting policies conform to U.S. generally accepted accounting principles. The Series consistently follows such policies in the preparation of its financial statements.
Securities Valuation:The Series holds securities and other assets and liabilities that are fair valued at the close of each day (generally, 4:00 PM Eastern time) the New York Stock Exchange (“NYSE”) is open for trading. Fair value is the price that would be received to sell an asset or paid to transfer a liability in an orderly transaction between market participants on the measurement date. The Fund’s Board of Directors (the “Board”) has adopted valuation procedures for security valuation under which fair valuation responsibilities have been delegated to PGIM Investments LLC (“PGIM Investments” or the “Manager”). Pursuant to the Board’s delegation, the Manager has established a Valuation Committee responsible for supervising the fair valuation of portfolio securities and other assets and liabilities. The valuation procedures permit the Series to utilize independent pricing vendor services, quotations from market makers, and alternative valuation methods when market quotations are either not readily available or not deemed representative of fair value. A record of the Valuation Committee’s actions is subject to the Board’s review, approval, and ratification at its next regularly scheduled quarterly meeting.
For the fiscal reportingyear-end, securities and other assets and liabilities were fair valued at the close of the last U.S. business day. Trading in certain foreign securities may occur when the NYSE is closed (including weekends and holidays). Because such foreign securities trade in markets that are open on weekends and U.S. holidays, the values of some of the Series’ foreign investments may change on days when investors cannot purchase or redeem Series shares.
| | | | |
| PGIM Jennison Global Infrastructure Fund | | | 25 | |
Notes to Financial Statements(continued)
Various inputs determine how the Series’ investments are valued, all of which are categorized according to the three broad levels (Level 1, 2, or 3) detailed in the Schedule of Investments and referred to herein as the “fair value hierarchy” in accordance with FASB ASC Topic 820—Fair Value Measurements and Disclosures.
Common and preferred stocks, exchange-traded funds, and derivative instruments, such as futures or options, that are traded on a national securities exchange are valued at the last sale price as of the close of trading on the applicable exchange where the security principally trades. Securities traded via NASDAQ are valued at the NASDAQ official closing price. To the extent these securities are valued at the last sale price or NASDAQ official closing price, they are classified as Level 1 in the fair value hierarchy. In the event that no sale or official closing price on valuation date exists, these securities are generally valued at the mean between the last reported bid and ask prices, or at the last bid price in the absence of an ask price. These securities are classified as Level 2 in the fair value hierarchy.
Foreign equities traded on foreign securities exchanges are generally valued using pricing vendor services that provide model prices derived using adjustment factors based on information such as local closing price, relevant general and sector indices, currency fluctuations, depositary receipts, and futures, as applicable. Securities valued using such model prices are classified as Level 2 in the fair value hierarchy. The models generate an evaluated adjustment factor for each security, which is applied to the local closing price to adjust it for post closing market movements up to the time the Series is valued. Utilizing that evaluated adjustment factor, the vendor provides an evaluated price for each security. If the vendor does not provide an evaluated price, securities are valued in accordance with exchange-traded common and preferred stock valuation policies discussed above.
Investments inopen-end,non-exchange-traded mutual funds are valued at their net asset values as of the close of the NYSE on the date of valuation. These securities are classified as Level 1 in the fair value hierarchy since they may be purchased or sold at their net asset values on the date of valuation.
Securities and other assets that cannot be priced according to the methods described above are valued based on pricing methodologies approved by the Board. In the event that unobservable inputs are used when determining such valuations, the securities will be classified as Level 3 in the fair value hierarchy.
When determining the fair value of securities, some of the factors influencing the valuation include: the nature of any restrictions on disposition of the securities; assessment of the general liquidity of the securities; the issuer’s financial condition and the markets in which it does business; the cost of the investment; the size of the holding and the capitalization of the issuer; the prices of any recent transactions or bids/offers for such securities or any
comparable securities; any available analyst media or other reports or information deemed reliable by the Manager regarding the issuer or the markets or industry in which it operates. Using fair value to price securities may result in a value that is different from a security’s most recent closing price and from the price used by other unaffiliated mutual funds to calculate their net asset values.
Illiquid Securities:Pursuant to Rule22e-4 under the 1940 Act, the Series has adopted a Board approved Liquidity Risk Management Program (“LRMP”) that requires, among other things, that the Series limit its illiquid investments that are assets to no more than 15% of net assets. Illiquid securities are those that, because of the absence of a readily available market or due to legal or contractual restrictions on resale, may not reasonably be expected to be sold or disposed of in current market conditions in seven calendar days or less without the sale or disposition significantly changing the market value of the investment. The Series may find it difficult to sell illiquid securities at the time considered most advantageous by its subadviser and may incur transaction costs that would not be incurred in the sale of securities that were freely marketable.
Restricted Securities:Securities acquired in unregistered, private sales from the issuing company or from an affiliate of the issuer are considered restricted as to disposition under federal securities law (“restricted securities”). Such restricted securities are valued pursuant to the valuation procedures noted above. Restricted securities that would otherwise be considered illiquid investments pursuant to the Series’ LRMP because of legal restrictions on resale to the general public may be traded among qualified institutional buyers under Rule 144A of the Securities Act of 1933. Therefore, these Rule 144A securities, as well as commercial paper that is sold in private placements under Section 4(2) of the Securities Act of 1933, may be classified higher than “illiquid” under the LRMP (i.e. “moderately liquid” or “less liquid” investments). However, the liquidity of the Series’ investments in restricted securities could be impaired if trading does not develop or declines.
Foreign Currency Translation:The books and records of the Series are maintained in U.S. dollars. Foreign currency amounts are translated into U.S. dollars on the following basis:
(i) market value of investment securities, other assets and liabilities—at the current rates of exchange;
(ii) purchases and sales of investment securities, income and expenses—at the rates of exchange prevailing on the respective dates of such transactions.
Although the net assets of the Series are presented at the foreign exchange rates and market values at the close of the period, the Series does not generally isolate that portion of the results of operations arising as a result of changes in the foreign exchange rates from the fluctuations arising from changes in the market prices of long-term portfolio securities held at the end of the period. Similarly, the Series does not isolate the effect of changes in foreign exchange rates from the fluctuations arising from changes in the market prices of long-term portfolio securities sold during the period. Accordingly, holding period realized foreign
| | | | |
| PGIM Jennison Global Infrastructure Fund | | | 27 | |
Notes to Financial Statements(continued)
currency gains (losses) are included in the reported net realized gains (losses) on investment transactions.
Net realized gains (losses) on foreign currency transactions represent net foreign exchange gains (losses) from the disposition of holdings of foreign currencies, currency gains (losses) realized between the trade and settlement dates on forward currency transactions, and the difference between the amounts of interest, dividends and foreign withholding taxes recorded on the Series’ books and the U.S. dollar equivalent amounts actually received or paid. Net unrealized currency gains (losses) arise from valuing foreign currency denominated assets and liabilities (other than investments) at period end exchange rates.
Master Netting Arrangements:The Fund, on behalf of the Series, is subject to various Master Agreements, or netting arrangements, with select counterparties. These are agreements which a subadviser may have negotiated and entered into on behalf of all or a portion of the Series. A master netting arrangement between the Series and the counterparty permits the Series to offset amounts payable by the Series to the same counterparty against amounts to be received; and by the receipt of collateral from the counterparty by the Series to cover the Series’ exposure to the counterparty. However, there is no assurance that such mitigating factors are easily enforceable. In addition to master netting arrangements, the right toset-off exists when all the conditions are met such that each of the parties owes the other determinable amounts, the reporting party has the right toset-off the amount owed with the amount owed by the other party, the reporting party intends toset-off and the right ofset-off is enforceable by law. During the reporting period, there was no intention to settle on a net basis and all amounts are presented on a gross basis on the Statement of Assets and Liabilities.
Securities Lending:The Series lends its portfolio securities to banks and broker-dealers. The loans are secured by collateral at least equal to the market value of the securities loaned. Collateral pledged by each borrower is invested in an affiliated money market fund and is marked to market daily, based on the previous day’s market value, such that the value of the collateral exceeds the value of the loaned securities. In the event of significant appreciation in value of securities on loan on the last business day of the reporting period, the financial statements may reflect a collateral value that is less than the market value of the loaned securities. Such shortfall is remedied as described above. Loans are subject to termination at the option of the borrower or the Series. Upon termination of the loan, the borrower will return to the Series securities identical to the loaned securities. Should the borrower of the securities fail financially, the Series has the right to repurchase the securities in the open market using the collateral.
The Series recognizes income, net of any rebate and securities lending agent fees, for lending its securities in the form of fees or interest on the investment of any cash received as
collateral. The borrower receives all interest and dividends from the securities loaned and such payments are passed back to the lender in amounts equivalent thereto. The Series also continues to recognize any unrealized gain (loss) in the market price of the securities loaned and on the change in the value of the collateral invested that may occur during the term of the loan. In addition, realized gain (loss) is recognized on changes in the value of the collateral invested upon liquidation of the collateral. Net earnings from securities lending are disclosed on the Statement of Operations as “Income from securities lending, net”.
Equity and Mortgage Real Estate Investment Trusts (collectively equity REITs):The Series invested in equity REITs, which report information on the source of their distributions annually. Based on current and historical information, a portion of distributions received from equity REITs during the period is estimated to be dividend income, capital gain or return of capital and recorded accordingly. When material, these estimates are adjusted periodically when the actual source of distributions is disclosed by the equity REITs.
Securities Transactions and Net Investment Income:Securities transactions are recorded on the trade date. Realized gains (losses) from investment and currency transactions are calculated on the specific identification method. Dividend income is recorded on theex-date, or for certain foreign securities, when the Series becomes aware of such dividends. Expenses are recorded on an accrual basis, which may require the use of certain estimates by management that may differ from actual. Net investment income or loss (other than class specific expenses and waivers, which are allocated as noted below) and unrealized and realized gains (losses) are allocated daily to each class of shares based upon the relative proportion of adjusted net assets of each class at the beginning of the day. Class specific expenses and waivers, where applicable, are charged to the respective share classes. Class specific expenses include distribution fees and distribution fee waivers, shareholder servicing fees, transfer agent’s fees and expenses, registration fees and fee waivers and/or expense reimbursements, as applicable.
Taxes:It is the Series’ policy to continue to meet the requirements of the Internal Revenue Code applicable to regulated investment companies and to distribute all of its taxable net investment income and capital gains, if any, to its shareholders. Therefore, no federal income tax provision is required. Withholding taxes on foreign dividends, interest and capital gains, if any, are recorded, net of reclaimable amounts, at the time the related income is earned.
Tax reform legislation commonly referred to as the Tax Cuts and Jobs Act permits a direct REIT shareholder to claim a 20% “qualified business income” deduction for ordinary REIT dividends. On January 18, 2019, the Internal Revenue Service issued final regulations that expressly permit RICs to pass through this “qualified business income” to their shareholders.
Dividends and Distributions:The Series expects to pay dividends from net investment income quarterly. Distributions from net realized capital and currency gains, if any, are declared and paid annually. Dividends and distributions to shareholders, which are
| | | | |
| PGIM Jennison Global Infrastructure Fund | | | 29 | |
Notes to Financial Statements(continued)
determined in accordance with federal income tax regulations and which may differ from generally accepted accounting principles, are recorded on theex-date. Permanent book/tax differences relating to income and gain (loss) are reclassified between total distributable earnings (loss) andpaid-in capital in excess of par, as appropriate.
Estimates:The preparation of financial statements requires management to make estimates and assumptions that affect the reported amounts and disclosures in the financial statements. Actual results could differ from those estimates.
2. Agreements
The Fund, on behalf of the Series, has a management agreement with the Manager. Pursuant to this agreement, the Manager has responsibility for all investment advisory services and supervises the subadviser’s performance of such services. In addition, under the management agreement, the Manager provides all of the administrative functions necessary for the organization, operation and management of the Series. The Manager administers the corporate affairs of the Series and, in connection therewith, furnishes the Series with office facilities, together with those ordinary clerical and bookkeeping services which are not being furnished by the Series’ custodian and the Series’ transfer agent. The Manager is also responsible for the staffing and management of dedicated groups of legal, marketing, compliance and related personnel necessary for the operation of the Series. The legal, marketing, compliance and related personnel are also responsible for the management and oversight of the various service providers to the Series, including, but not limited to, the custodian, transfer agent, and accounting agent.
The Manager has entered into a subadvisory agreement with Jennison Associates LLC (“Jennison”). The subadvisory agreement provides that Jennison will furnish investment advisory services in connection with the management of the Series. In connection therewith, Jennison is obligated to keep certain books and records of the Series. The Manager pays for the services of Jennison, the cost of compensation of officers of the Series, occupancy and certain clerical and bookkeeping costs of the Series. The Series bears all other costs and expenses.
The management fee paid to the Manager is accrued daily and payable monthly at an annual rate of 1.00% of the Series’ average daily net assets up to $1 billion, 0.98% of the next $2 billion, 0.96% of the next $2 billion, 0.95% of the next $5 billion and 0.94% of the Series’ average daily net assets in excess of $10 billion. The effective management fee rate before any waivers and/or expense reimbursements was 1.00% for the year ended October 31, 2019.
The Manager has contractually agreed, through February 28, 2021, to limit total annual operating expenses after fee waivers and/or expense reimbursements to 1.50% of average daily net assets for Class A shares, 2.25% of average daily net assets for Class C shares, 1.17% of average daily net assets for Class Z shares and 1.17% of average daily net assets for Class R6 shares. This contractual waiver excludes interest, brokerage, taxes (such as income and foreign withholding taxes, stamp duty and deferred tax expenses), acquired fund fees and expenses, extraordinary expenses, and certain other Series expenses such as dividend and interest expense and broker charges on short sales. Where applicable, the Manager agrees to waive management fees or shared operating expenses on any share class to the same extent that it waives similar expenses on any other share class. In addition, total annual operating expenses for Class R6 shares will not exceed total annual operating expenses for Class Z shares. Fees and/or expenses waived and/or reimbursed by the Manager may be recouped by the Manager within the same fiscal year during which such waiver and/or reimbursement is made if such recoupment can be realized without exceeding the expense limit in effect at the time of the recoupment for the fiscal year.
The Fund, on behalf of the Series, has a distribution agreement with Prudential Investment Management Services LLC (“PIMS”), which acts as the distributor of the Class A, Class C, Class Z and Class R6 shares of the Series. The Series compensates PIMS for distributing and servicing the Series’ Class A and Class C shares, pursuant to the plans of distribution (the “Distribution Plans”), regardless of expenses actually incurred by PIMS. The distribution fees are accrued daily and payable monthly. No distribution or service fees are paid to PIMS as distributor of the Class Z and Class R6 shares of the Series.
Pursuant to the Distribution Plans, the Series compensates PIMS for distribution related activities at an annual rate of up to 0.30% and 1% of the average daily net assets of the Class A and Class C shares, respectively. PIMS has contractually agreed through February 28, 2021 to limit such fees to 0.25% of the average daily net assets of the Class A shares.
For the year ended October 31, 2019, PIMS received $15,680 infront-end sales charges resulting from sales of Class A shares. Additionally, for the year ended October 31, 2019, PIMS received $14 and $607 in contingent deferred sales charges imposed upon redemptions by certain Class A and Class C shareholders, respectively. From these fees, PIMS paid such sales charges to broker-dealers, who in turn paid commissions to salespersons and incurred other distribution costs.
PGIM Investments, PIMS and Jennison are indirect, wholly-owned subsidiaries of Prudential Financial, Inc. (“Prudential”).
3. Other Transactions with Affiliates
Prudential Mutual Fund Services LLC (“PMFS”), an affiliate of PGIM Investments and an indirect, wholly-owned subsidiary of Prudential, serves as the Fund’s transfer agent. Transfer
| | | | |
| PGIM Jennison Global Infrastructure Fund | | | 31 | |
Notes to Financial Statements(continued)
agent’s fees and expenses in the Statement of Operations include certainout-of-pocket expenses paid tonon-affiliates, where applicable.
The Series may invest its overnight sweep cash in the PGIM Core Ultra Short Bond Fund (the “Core Fund”), and its securities lending cash collateral in the PGIM Institutional Money Market Fund (the “Money Market Fund”), each a series of Prudential Investment Portfolios 2, registered under the 1940 Act and managed by PGIM Investments. Through the Series’ investments in the mentioned underlying funds, PGIM Investments and/or its affiliates are paid fees or reimbursed for providing their services. In addition to the realized and unrealized gains on investments in the Core Fund and Money Market Fund, earnings from such investments are disclosed on the Statement of Operations as “Affiliated dividend income” and “Income from securities lending, net”, respectively.
The Series may enter into certain securities purchase or sale transactions under Board approved Rule17a-7 procedures. Rule17a-7 is an exemptive rule under the 1940 Act, that subject to certain conditions, permits purchase and sale transactions among affiliated investment companies, or between an investment company and a person that is affiliated solely by reason of having a common (or affiliated) investment adviser, common directors, and/or common officers. Pursuant to the Rule17a-7 procedures and consistent with guidance issued by the SEC, the Fund’s Chief Compliance Officer (“CCO”) prepares a quarterly summary of all such transactions for submission to the Board, together with the CCO’s written representation that all such17a-7 transactions were effected in accordance with the Series’ Rule17a-7 procedures. For the year ended October 31, 2019, no17a-7 transactions were entered into by the Series.
4. Portfolio Securities
The aggregate cost of purchases and proceeds from sales of portfolio securities (excluding short-term investments and U.S. Government securities) for the year ended October 31, 2019, were $28,661,015 and $39,035,522, respectively.
A summary of the cost of purchases and proceeds from sales of shares of affiliated investments for the year ended October 31, 2019, is presented as follows:
| | | | | | | | | | | | | | | | | | | | | | | | | | | | | | |
Value,
Beginning
of Year | | | Cost of
Purchases | | | Proceeds
from Sales | | | Change in
Unrealized
Gain
(Loss) | | | Realized
Gain
(Loss) | | | Value,
End of Year | | | Shares,
End
of Year | | | Income | |
| | PGIM Core Ultra Short Bond Fund* | |
| $ | 1,729,474 | | | $ | 28,526,834 | | | $ | 29,658,122 | | | $ | — | | | $ | — | | | $ | 598,186 | | | | 598,186 | | | $ | 23,392 | |
| | PGIM Institutional Money Market Fund* | |
| | — | | | | 1,156,166 | | | | 1,156,111 | | | | — | | | | (55 | ) | | | — | | | | — | | | | 214 | ** |
| | | | | | | | | | | | | | | | | | | | | | | | | | | | | | |
| $ | 1,729,474 | | | $ | 29,683,000 | | | $ | 30,814,233 | | | $ | — | | | $ | (55 | ) | | $ | 598,186 | | | | | | | $ | 23,606 | |
| | | | | | | | | | | | | | | | | | | | | | | | | | | | | | |
| * | The Fund did not have any capital gain distributions during the reporting period. |
| ** | This amount is included in “Income from securities lending, net” on the Statement of Operations. |
5. Distributions and Tax Information
Distributions to shareholders, which are determined in accordance with federal income tax regulations and which may differ from generally accepted accounting principles, are recorded on theex-date. In order to present total distributable earnings (loss) andpaid-in capital in excess of par on the Statement of Assets and Liabilities that more closely represent their tax character, certain adjustments have been made to total distributable earnings (loss) andpaid-in capital in excess of par. For the year ended October 31, 2019, the adjustments were to increase total distributable earnings and decreasepaid-in capital in excess of par by $37 due to differences in the treatment for book and tax purposes of certain transactions involving partnership investments. Net investment income, net realized gain (loss) on investments and foreign currency transactions and net assets were not affected by this change.
For the year ended October 31, 2019, the tax character of dividends paid by the Series was $811,023 of ordinary income and $46,698 of tax return of capital. For the year ended October 31, 2018, the tax character of dividends paid by the Series was $861,939 of ordinary income.
As of October 31, 2019, there were no undistributed earnings on a tax basis.
The United States federal income tax basis of the Series’ investments and the net unrealized appreciation as of October 31, 2019 were as follows:
| | | | | | |
Tax Basis | | Gross Unrealized Appreciation | | Gross Unrealized Depreciation | | Net Unrealized Appreciation |
| $35,788,614 | | $10,911,187 | | $(803,658) | | $10,107,529 |
The difference between book basis and tax basis was primarily due to deferred losses on wash sales.
| | | | |
| PGIM Jennison Global Infrastructure Fund | | | 33 | |
Notes to Financial Statements(continued)
For federal income tax purposes, the Series had a capital loss carryforward as of October 31, 2019 of approximately $1,269,000 which can be carried forward for an unlimited period. The Series utilized approximately $3,251,000 of its capital loss carryforward during the fiscal year ended October 31, 2019 to offset capital gains. No capital gains distributions are expected to be paid to shareholders until net gains have been realized in excess of such losses.
The Manager has analyzed the Series’ tax positions taken on federal, state and local income tax returns for all open tax years and has concluded that no provision for income tax is required in the Series’ financial statements for the current reporting period. Since tax authorities can examine previously filed tax returns, the Series’ U.S. federal and state tax returns for each of the four fiscal years up to the most recent fiscal year ended October 31, 2019 are subject to such review.
6. Capital and Ownership
The Series offers Class A, Class C, Class Z and Class R6 shares. Class A shares are sold with a maximumfront-end sales charge of 5.50%. Investors who purchase $1 million or more of Class A shares and sell these shares within 12 months of purchase are subject to a contingent deferred sales charge (“CDSC”) of 1%, although they are not subject to an initial sales charge. The Class A CDSC is waived for certain retirement and/or benefit plans. A special exchange privilege is also available for shareholders who qualified to purchase Class A shares at net asset value. Class C shares are sold with a CDSC of 1% on sales made within 12 months of purchase. Class C shares will automatically convert to Class A shares on a monthly basis approximately 10 years after purchase. Class Z and Class R6 shares are not subject to any sales or redemption charge and are available exclusively for sale to a limited group of investors.
Under certain circumstances, an exchange may be made from specified share classes of the Series to one or more other share classes of the Series as presented in the table of transactions in shares of common stock.
The Fund is authorized to issue 5.075 billion shares of common stock, with a par value of $0.01 per share, which is divided into seven series. There are 510 million shares authorized for the Series, divided into five classes, designated Class A, Class C, Class Z, Class R6 and Class T common stock, each of which consists of 20 million, 100 million, 150 million, 125 million and 115 million authorized shares, respectively. The Series currently does not have any Class T shares outstanding.
As of October 31, 2019, Prudential, through its affiliated entities, including affiliated funds (if applicable), owned 549,574 Class Z shares and 812,764 Class R6 shares of the Series. At
reporting period end, six shareholders of record, each holding greater than 5% of the Series, held 80% of the Series’ outstanding shares, of which 44% were held by an affiliate of Prudential.
Transactions in shares of common stock were as follows:
| | | | | | | | |
Class A | | Shares | | | Amount | |
Year ended October 31, 2019: | | | | | | | | |
Shares sold | | | 47,121 | | | $ | 656,918 | |
Shares issued in reinvestment of dividends and distributions | | | 9,224 | | | | 123,554 | |
Shares reacquired | | | (168,355 | ) | | | (2,251,714 | ) |
| | | | | | | | |
Net increase (decrease) in shares outstanding before conversion | | | (112,010 | ) | | | (1,471,242 | ) |
Shares issued upon conversion from other share class(es) | | | 8,917 | | | | 124,418 | |
Shares reacquired upon conversion into other share class(es) | | | (36,937 | ) | | | (502,336 | ) |
| | | | | | | | |
Net increase (decrease) in shares outstanding | | | (140,030 | ) | | $ | (1,849,160 | ) |
| | | | | | | | |
Year ended October 31, 2018: | | | | | | | | |
Shares sold | | | 150,283 | | | $ | 2,002,747 | |
Shares issued in reinvestment of dividends and distributions | | | 10,691 | | | | 139,976 | |
Shares reacquired | | | (270,926 | ) | | | (3,544,143 | ) |
| | | | | | | | |
Net increase (decrease) in shares outstanding before conversion | | | (109,952 | ) | | | (1,401,420 | ) |
Shares issued upon conversion from other share class(es) | | | 758 | | | | 10,337 | |
Shares reacquired upon conversion into other share class(es) | | | (125,190 | ) | | | (1,689,355 | ) |
| | | | | | | | |
Net increase (decrease) in shares outstanding | | | (234,384 | ) | | $ | (3,080,438 | ) |
| | | | | | | | |
Class C | | | | | | |
Year ended October 31, 2019: | | | | | | | | |
Shares sold | | | 20,243 | | | $ | 257,217 | |
Shares issued in reinvestment of dividends and distributions | | | 2,966 | | | | 39,509 | |
Shares reacquired | | | (60,723 | ) | | | (790,603 | ) |
| | | | | | | | |
Net increase (decrease) in shares outstanding before conversion | | | (37,514 | ) | | | (493,877 | ) |
Shares reacquired upon conversion into other share class(es) | | | (21,090 | ) | | | (289,346 | ) |
| | | | | | | | |
Net increase (decrease) in shares outstanding | | | (58,604 | ) | | $ | (783,223 | ) |
| | | | | | | | |
Year ended October 31, 2018: | | | | | | | | |
Shares sold | | | 29,037 | | | $ | 377,809 | |
Shares issued in reinvestment of dividends and distributions | | | 2,793 | | | | 36,467 | |
Shares reacquired | | | (154,412 | ) | | | (2,008,194 | ) |
| | | | | | | | |
Net increase (decrease) in shares outstanding before conversion | | | (122,582 | ) | | | (1,593,918 | ) |
Shares reacquired upon conversion into other share class(es) | | | (4,383 | ) | | | (57,241 | ) |
| | | | | | | | |
Net increase (decrease) in shares outstanding | | | (126,965 | ) | | $ | (1,651,159 | ) |
| | | | | | | | |
| | | | |
| PGIM Jennison Global Infrastructure Fund | | | 35 | |
Notes to Financial Statements(continued)
| | | | | | | | |
Class Z | | Shares | | | Amount | |
Year ended October 31, 2019: | | | | | | | | |
Shares sold | | | 82,330 | | | $ | 1,114,151 | |
Shares issued in reinvestment of dividends and distributions | | | 30,480 | | | | 410,798 | |
Shares reacquired | | | (559,502 | ) | | | (7,329,772 | ) |
| | | | | | | | |
Net increase (decrease) in shares outstanding before conversion | | | (446,692 | ) | | | (5,804,823 | ) |
Shares issued upon conversion from other share class(es) | | | 49,142 | | | | 670,622 | |
Shares reacquired upon conversion into other share class(es) | | | (232 | ) | | | (3,358 | ) |
| | | | | | | | |
Net increase (decrease) in shares outstanding | | | (397,782 | ) | | $ | (5,137,559 | ) |
| | | | | | | | |
Year ended October 31, 2018: | | | | | | | | |
Shares sold | | | 301,204 | | | $ | 3,928,359 | |
Shares issued in reinvestment of dividends and distributions | | | 32,956 | | | | 430,887 | |
Shares reacquired | | | (782,129 | ) | | | (10,173,430 | ) |
| | | | | | | | |
Net increase (decrease) in shares outstanding before conversion | | | (447,969 | ) | | | (5,814,184 | ) |
Shares issued upon conversion from other share class(es) | | | 129,445 | | | | 1,746,596 | |
Shares reacquired upon conversion into other share class(es) | | | (758 | ) | | | (10,337 | ) |
| | | | | | | | |
Net increase (decrease) in shares outstanding | | | (319,282 | ) | | $ | (4,077,925 | ) |
| | | | | | | | |
Class R6 | | | | | | |
Year ended October 31, 2019: | | | | | | | | |
Shares sold | | | 436,752 | | | $ | 5,766,397 | |
Shares issued in reinvestment of dividends and distributions | | | 20,791 | | | | 279,050 | |
Shares reacquired | | | (781,357 | ) | | | (10,439,661 | ) |
| | | | | | | | |
Net increase (decrease) in shares outstanding | | | (323,814 | ) | | $ | (4,394,214 | ) |
| | | | | | | | |
Year ended October 31, 2018: | | | | | | | | |
Shares sold | | | 693,401 | | | $ | 9,146,111 | |
Shares issued in reinvestment of dividends and distributions | | | 17,751 | | | | 232,070 | |
Shares reacquired | | | (1,255,493 | ) | | | (16,419,500 | ) |
| | | | | | | | |
Net increase (decrease) in shares outstanding | | | (544,341 | ) | | $ | (7,041,319 | ) |
| | | | | | | | |
7. Borrowings
The Fund, on behalf of the Series, along with other affiliated registered investment companies (the “Funds”), is a party to a Syndicated Credit Agreement (“SCA”) with a group of banks. The purpose of the SCA is to provide an alternative source of temporary funding for capital share redemptions. The table below provides details of the current SCA in effect at the reportingperiod-end as well as the prior SCA.
| | | | |
| | | Current SCA | | Prior SCA |
| Term of Commitment | | 10/3/2019 – 10/1/2020 | | 10/4/2018 – 10/2/2019 |
| Total Commitment | | $ 900 million | | $ 900 million |
| Annualized Commitment Fee on the Unused Portion of the SCA | | 0.15% | | 0.15% |
| Annualized Interest Rate on Borrowings | | 1.20% plus the higher of (1) the effective federal funds rate, (2) theone-month LIBOR rate or (3) zero percent | | 1.25% plus the higher of (1) the effective federal funds rate, (2) theone-month LIBOR rate or (3) zero percent |
Certain affiliated registered investment companies that are parties to the SCA include portfolios that are subject to a predetermined mathematical formula used to manage certain benefit guarantees offered under variable annuity contracts. The formula may result in large scale asset flows into and out of these portfolios. Consequently, these portfolios may be more likely to utilize the SCA for purposes of funding redemptions. It may be possible for those portfolios to fully exhaust the committed amount of the SCA, thereby requiring the Manager to allocate available funding per a Board-approved methodology designed to treat the Funds in the SCA equitably.
The Series utilized the SCA during the year ended October 31, 2019. The average daily balance for the 13 days that the Series had loans outstanding during the period was approximately $705,385, borrowed at a weighted average interest rate of 3.61%. The maximum loan outstanding amount during the period was $1,810,000. At October 31, 2019, the Series did not have an outstanding loan amount.
8. Risks of Investing in the Series
The Series’ risks include, but are not limited to, some or all of the risks discussed below:
Equity and Equity-Related Securities Risks:The value of a particular security could go down and you could lose money. In addition to an individual security losing value, the value of the equity markets or a sector in which the Series invests could go down. The Series’ holdings can vary significantly from broad market indexes and the performance of the Series can deviate from the performance of these indexes. Different parts of a market can react differently to adverse issuer, market, regulatory, political and economic developments.
Foreign Securities Risk:The Series’ investments in securities of foreign issuers or issuers with significant exposure to foreign markets involve additional risk. Foreign countries in which the Series may invest may have markets that are less liquid, less regulated and more volatile than US markets. The value of the Series’ investments may decline because of factors affecting the particular issuer as well as foreign markets and issuers generally, such as unfavorable government actions, and political or financial instability.
Market and Credit Risk:Securities markets may be volatile and the market prices of the Series’ securities may decline. Securities fluctuate in price based on changes in an issuer’s financial condition and overall market and economic conditions. If the market prices of the securities owned by the Series fall, the value of an investment in the Series will decline. Additionally, the Series may also be exposed to credit risk in the event that an issuer or guarantor fails to perform or that an institution or entity with which the Series has unsettled or open transactions defaults.
Non-diversification Risk:Anon-diversified Series may invest a greater percentage of its assets in the securities of a single company or industry than a diversified fund. Investing in anon-diversified fund involves greater risk than investing in a diversified fund because a loss
| | | | |
| PGIM Jennison Global Infrastructure Fund | | | 37 | |
Notes to Financial Statements(continued)
resulting from the decline in value of any one security may represent a greater portion of the total assets of anon-diversified fund.
Risks of Investing in Infrastructure Companies:Securities of infrastructure companies are more susceptible to adverse economic, social, political and regulatory occurrences affecting their industries. Infrastructure companies may be subject to a variety of factors that may adversely affect their business or operations, including high interest costs in connection with capital construction programs, high leverage, costs associated with environmental and other regulations, the effects of economic slowdown, surplus capacity, insufficient supply of necessary resources, increased competition from other providers of similar services, uncertainties concerning the availability of fuel at reasonable prices, the effects of energy conservation policies and other factors. Certain infrastructure companies may operate in limited areas or have few sources of revenue.
9. Recent Accounting Pronouncements and Reporting Updates
In August 2018, the FASB issued Accounting Standards Update (“ASU”)No. 2018-13, which changes certain fair value measurement disclosure requirements. The new ASU, in addition to other modifications and additions, removes the requirement to disclose the amount and reasons for transfers between Level 1 and Level 2 of the fair value hierarchy, and the Series’ policy for the timing of transfers between levels. The amendments are effective for financial statements issued for fiscal years beginning after December 15, 2019, and interim periods within those fiscal years. The Manager has evaluated the implications of certain provisions of the ASU and has determined to early adopt aspects related to the removal and modification of certain fair value measurement disclosures under the ASU effective immediately. The Manager continues to evaluate certain other provisions of the ASU and does not expect a material impact to financial statement disclosures.
Financial Highlights
| | | | | | | | | | | | | | | | | | | | |
| Class A Shares | |
| | | Year Ended October 31, | |
| | | 2019 | | | 2018 | | | 2017 | | | 2016 | | | 2015 | |
| Per Share Operating Performance(a): | | | | | | | | | | | | | | | | | | | | |
| Net Asset Value, Beginning of Year | | | $12.21 | | | | $13.05 | | | | $11.61 | | | | $11.48 | | | | $12.62 | |
| Income (loss) from investment operations: | | | | | | | | | | | | | | | | | | | | |
| Net investment income (loss) | | | 0.18 | | | | 0.16 | | | | 0.14 | | | | 0.09 | | | | 0.06 | |
| Net realized and unrealized gain (loss) on investment and foreign currency transactions | | | 2.49 | | | | (0.81 | ) | | | 1.49 | | | | 0.21 | | | | (1.12 | ) |
| Total from investment operations | | | 2.67 | | | | (0.65 | ) | | | 1.63 | | | | 0.30 | | | | (1.06 | ) |
| Less Dividends and Distributions: | | | | | | | | | | | | | | | | | | | | |
| Dividends from net investment income | | | (0.21 | ) | | | (0.19 | ) | | | (0.13 | ) | | | (0.08 | ) | | | (0.05 | ) |
| Tax return of capital distributions | | | (0.01 | ) | | | - | | | | (0.06 | ) | | | (0.09 | ) | | | (0.03 | ) |
| Total dividends and distributions | | | (0.22 | ) | | | (0.19 | ) | | | (0.19 | ) | | | (0.17 | ) | | | (0.08 | ) |
| Net asset value, end of year | | | $14.66 | | | | $12.21 | | | | $13.05 | | | | $11.61 | | | | $11.48 | |
| Total Return(b): | | | 22.01% | | | | (5.10)% | | | | 14.15% | | | | 2.62% | | | | (8.46)% | |
| |
| Ratios/Supplemental Data: | |
| Net assets, end of year (000) | | | $7,637 | | | | $8,073 | | | | $11,689 | | | | $12,277 | | | | $22,353 | |
| Average net assets (000) | | | $7,718 | | | | $10,218 | | | | $11,433 | | | | $16,694 | | | | $22,695 | |
| Ratios to average net assets(c)(d): | | | | | | | | | | | | | | | | | | | | |
| Expenses after waivers and/or expense reimbursement | | | 1.50% | | | | 1.50% | | | | 1.50% | | | | 1.50% | | | | 1.50% | |
| Expenses before waivers and/or expense reimbursement | | | 2.10% | | | | 2.00% | | | | 1.81% | | | | 1.79% | | | | 1.78% | |
| Net investment income (loss) | | | 1.34% | | | | 1.21% | | | | 1.10% | | | | 0.76% | | | | 0.52% | |
| Portfolio turnover rate(e) | | | 62% | | | | 75% | | | | 80% | | | | 82% | | | | 94% | |
| (a) | Calculated based on average shares outstanding during the year. |
| (b) | Total return does not consider the effects of sales loads. Total return is calculated assuming a purchase of a share on the first day and a sale on the last day of each year reported and includes reinvestment of dividends and distributions, if any. Total returns may reflect adjustments to conform to generally accepted accounting principles. |
| (c) | Does not include expenses of the underlying funds in which the Series invests. |
| (d) | Effective November 1, 2017, class specific expenses include transfer agent fees and expenses and registration fees, which are charged to their respective share class. |
| (e) | The Series’ portfolio turnover rate is calculated in accordance with regulatory requirements, without regard to transactions involving short-term investments and certain derivatives. If such transactions were included, the Series’ portfolio turnover rate may be higher. |
See Notes to Financial Statements.
| | | | |
| PGIM Jennison Global Infrastructure Fund | | | 39 | |
Financial Highlights(continued)
| | | | | | | | | | | | | | | | | | | | |
| Class C Shares | |
| | | Year Ended October 31, | |
| | | 2019 | | | 2018 | | | 2017 | | | 2016 | | | 2015 | |
| Per Share Operating Performance(a): | | | | | | | | | | | | | | | | | | | | |
| Net Asset Value, Beginning of Year | | | $12.12 | | | | $12.97 | | | | $11.55 | | | | $11.42 | | | | $12.58 | |
| Income (loss) from investment operations: | | | | | | | | | | | | | | | | | | | | |
| Net investment income (loss) | | | 0.08 | | | | 0.06 | | | | 0.04 | | | | - | (b) | | | (0.03 | ) |
| Net realized and unrealized gain (loss) on investment and foreign currency transactions | | | 2.45 | | | | (0.81 | ) | | | 1.50 | | | | 0.21 | | | | (1.13 | ) |
| Total from investment operations | | | 2.53 | | | | (0.75 | ) | | | 1.54 | | | | 0.21 | | | | (1.16 | ) |
| Less Dividends and Distributions: | | | | | | | | | | | | | | | | | | | | |
| Dividends from net investment income | | | (0.13 | ) | | | (0.10 | ) | | | (0.08 | ) | | | (0.04 | ) | | | - | (b) |
| Tax return of capital distributions | | | (0.01 | ) | | | - | | | | (0.04 | ) | | | (0.04 | ) | | | - | (b) |
| Total dividends and distributions | | | (0.14 | ) | | | (0.10 | ) | | | (0.12 | ) | | | (0.08 | ) | | | - | |
| Net asset value, end of year | | | $14.51 | | | | $12.12 | | | | $12.97 | | | | $11.55 | | | | $11.42 | |
| Total Return(c): | | | 21.01% | | | | (5.82)% | | | | 13.39% | | | | 1.88% | | | | (9.21)% | |
| |
| Ratios/Supplemental Data: | |
| Net assets, end of year (000) | | | $4,135 | | | | $4,162 | | | | $6,101 | | | | $5,738 | | | | $6,775 | |
| Average net assets (000) | | | $4,131 | | | | $5,464 | | | | $6,111 | | | | $5,783 | | | | $6,353 | |
| Ratios to average net assets(d)(e): | | | | | | | | | | | | | | | | | | | | |
| Expenses after waivers and/or expense reimbursement | | | 2.25% | | | | 2.25% | | | | 2.25% | | | | 2.25% | | | | 2.25% | |
| Expenses before waivers and/or expense reimbursement | | | 2.90% | | | | 2.81% | | | | 2.51% | | | | 2.49% | | | | 2.48% | |
| Net investment income (loss) | | | 0.59% | | | | 0.48% | | | | 0.34% | | | | (0.02)% | | | | (0.22)% | |
| Portfolio turnover rate(f) | | | 62% | | | | 75% | | | | 80% | | | | 82% | | | | 94% | |
| (a) | Calculated based on average shares outstanding during the year. |
| (b) | Less than $0.005 per share. |
| (c) | Total return does not consider the effects of sales loads. Total return is calculated assuming a purchase of a share on the first day and a sale on the last day of each year reported and includes reinvestment of dividends and distributions, if any. Total returns may reflect adjustments to conform to generally accepted accounting principles. |
| (d) | Does not include expenses of the underlying funds in which the Series invests. |
| (e) | Effective November 1, 2017, class specific expenses include transfer agent fees and expenses and registration fees, which are charged to their respective share class. |
| (f) | The Series’ portfolio turnover rate is calculated in accordance with regulatory requirements, without regard to transactions involving short-term investments and certain derivatives. If such transactions were included, the Series’ portfolio turnover rate may be higher. |
See Notes to Financial Statements.
| | | | | | | | | | | | | | | | | | | | |
| Class Z Shares | |
| | | Year Ended October 31, | |
| | | 2019 | | | 2018 | | | 2017 | | | 2016 | | | 2015 | |
| Per Share Operating Performance(a): | | | | | | | | | | | | | | | | | | | | |
| Net Asset Value, Beginning of Year | | | $12.21 | | | | $13.06 | | | | $11.61 | | | | $11.47 | | | | $12.62 | |
| Income (loss) from investment operations: | | | | | | | | | | | | | | | | | | | | |
| Net investment income (loss) | | | 0.23 | | | | 0.19 | | | | 0.18 | | | | 0.11 | | | | 0.09 | |
| Net realized and unrealized gain (loss) on investment and foreign currency transactions | | | 2.48 | | | | (0.82 | ) | | | 1.49 | | | | 0.23 | | | | (1.13 | ) |
| Total from investment operations | | | 2.71 | | | | (0.63 | ) | | | 1.67 | | | | 0.34 | | | | (1.04 | ) |
| Less Dividends and Distributions: | | | | | | | | | | | | | | | | | | | | |
| Dividends from net investment income | | | (0.25 | ) | | | (0.22 | ) | | | (0.14 | ) | | | (0.09 | ) | | | (0.08 | ) |
| Tax return of capital distributions | | | (0.01 | ) | | | - | | | | (0.08 | ) | | | (0.11 | ) | | | (0.03 | ) |
| Total dividends and distributions | | | (0.26 | ) | | | (0.22 | ) | | | (0.22 | ) | | | (0.20 | ) | | | (0.11 | ) |
| Net asset value, end of year | | | $14.66 | | | | $12.21 | | | | $13.06 | | | | $11.61 | | | | $11.47 | |
| Total Return(b): | | | 22.30% | | | | (4.94)% | | | | 14.51% | | | | 2.96% | | | | (8.28)% | |
| |
| Ratios/Supplemental Data: | |
| Net assets, end of year (000) | | | $21,868 | | | | $23,074 | | | | $28,831 | | | | $40,811 | | | | $47,305 | |
| Average net assets (000) | | | $21,608 | | | | $27,549 | | | | $29,597 | | | | $40,236 | | | | $42,210 | |
| Ratios to average net assets(c)(d): | | | | | | | | | | | | | | | | | | | | |
| Expenses after waivers and/or expense reimbursement | | | 1.17% | | | | 1.25% | | | | 1.25% | | | | 1.25% | | | | 1.25% | |
| Expenses before waivers and/or expense reimbursement | | | 1.57% | | | | 1.52% | | | | 1.51% | | | | 1.49% | | | | 1.48% | |
| Net investment income (loss) | | | 1.66% | | | | 1.45% | | | | 1.49% | | | | 0.94% | | | | 0.75% | |
| Portfolio turnover rate(e) | | | 62% | | | | 75% | | | | 80% | | | | 82% | | | | 94% | |
| (a) | Calculated based on average shares outstanding during the year. |
| (b) | Total return is calculated assuming a purchase of a share on the first day and a sale on the last day of each year reported and includes reinvestment of dividends and distributions, if any. Total returns may reflect adjustments to conform to generally accepted accounting principles. |
| (c) | Does not include expenses of the underlying funds in which the Series invests. |
| (d) | Effective November 1, 2017, class specific expenses include transfer agent fees and expenses and registration fees, which are charged to their respective share class. |
| (e) | The Series’ portfolio turnover rate is calculated in accordance with regulatory requirements, without regard to transactions involving short-term investments and certain derivatives. If such transactions were included, the Series’ portfolio turnover rate may be higher. |
See Notes to Financial Statements.
| | | | |
| PGIM Jennison Global Infrastructure Fund | | | 41 | |
Financial Highlights(continued)
| | | | | | | | | | | | |
| Class R6 Shares | | | | | | | | | | | | |
| | | Year Ended October 31, | | | December 28, 2016(a) through October 31, 2017 | |
| | | 2019 | | | 2018 | |
| Per Share Operating Performance(b): | | | | | | | | | | | | |
| Net Asset Value, Beginning of Period | | | $12.21 | | | | $13.06 | | | | $11.39 | |
| Income (loss) from investment operations: | | | | | | | | | | | | |
| Net investment income (loss) | | | 0.23 | | | | 0.18 | | | | 0.11 | |
| Net realized and unrealized gain (loss) on investment and foreign currency transactions | | | 2.48 | | | | (0.81 | ) | | | 1.71 | |
| Total from investment operations | | | 2.71 | | | | (0.63 | ) | | | 1.82 | |
| Less Dividends and Distributions: | | | | | | | | | | | | |
| Dividends from net investment income | | | (0.25 | ) | | | (0.22 | ) | | | (0.10 | ) |
| Tax return of capital distributions | | | (0.01 | ) | | | - | | | | (0.05 | ) |
| Total dividends and distributions | | | (0.26 | ) | | | (0.22 | ) | | | (0.15 | ) |
| Net asset value, end of period | | | $14.66 | | | | $12.21 | | | | $13.06 | |
| Total Return(c): | | | 22.40% | | | | (4.94)% | | | | 16.02% | |
| |
| Ratios/Supplemental Data: | |
| Net assets, end of period (000) | | | $11,954 | | | | $13,912 | | | | $21,979 | |
| Average net assets (000) | | | $13,787 | | | | $17,657 | | | | $19,274 | |
| Ratios to average net assets(d)(e): | | | | | | | | | | | | |
| Expenses after waivers and/or expense reimbursement | | | 1.17% | | | | 1.25% | | | | 1.25% | (f) |
| Expenses before waivers and/or expense reimbursement | | | 1.48% | | | | 1.44% | | | | 1.40% | (f) |
| Net investment income (loss) | | | 1.70% | | | | 1.39% | | | | 1.00% | (f) |
| Portfolio turnover rate(g) | | | 62% | | | | 75% | | | | 80% | |
| (a) | Commencement of offering. |
| (b) | Calculated based on average shares outstanding during the period. |
| (c) | Total return is calculated assuming a purchase of a share on the first day and a sale on the last day of each period reported and includes reinvestment of dividends and distributions, if any. Total returns may reflect adjustments to conform to generally accepted accounting principles. Total returns for periods less than one full year are not annualized. |
| (d) | Does not include expenses of the underlying funds in which the Series invests. |
| (e) | Effective November 1, 2017, class specific expenses include transfer agent fees and expenses and registration fees, which are charged to their respective share class. |
| (g) | The Series’ portfolio turnover rate is calculated in accordance with regulatory requirements, without regard to transactions involving short-term investments and certain derivatives. If such transactions were included, the Series’ portfolio turnover rate may be higher. |
See Notes to Financial Statements.
Report of Independent Registered Public
Accounting Firm
To the Shareholders of PGIM Jennison Global Infrastructure Fund and Board of Directors
Prudential World Fund, Inc.:
Opinion on the Financial Statements
We have audited the accompanying statement of assets and liabilities of PGIM Jennison Global Infrastructure Fund, a series of Prudential World Fund, Inc., (the Fund), including the schedule of investments, as of October 31, 2019, the related statement of operations for the year then ended, the statements of changes in net assets for each of the years in the two-year period ended October 31, 2019, and the related notes (collectively, the financial statements) and the financial highlights for the years or period indicated therein. In our opinion, the financial statements and financial highlights present fairly, in all material respects, the financial position of the Fund as of October 31, 2019, the results of its operations for the year then ended, the changes in its net assets for each of the years in the two-year period ended October 31, 2019, and the financial highlights for the years or period indicated therein, in conformity with U.S. generally accepted accounting principles.
Basis for Opinion
These financial statements and financial highlights are the responsibility of the Fund’s management. Our responsibility is to express an opinion on these financial statements and financial highlights based on our audits. We are a public accounting firm registered with the Public Company Accounting Oversight Board (United States) (PCAOB) and are required to be independent with respect to the Fund in accordance with the U.S. federal securities laws and the applicable rules and regulations of the Securities and Exchange Commission and the PCAOB.
We conducted our audits in accordance with the standards of the PCAOB. Those standards require that we plan and perform the audit to obtain reasonable assurance about whether the financial statements and financial highlights are free of material misstatement, whether due to error or fraud. Our audits included performing procedures to assess the risks of material misstatement of the financial statements and financial highlights, whether due to error or fraud, and performing procedures that respond to those risks. Such procedures included examining, on a test basis, evidence regarding the amounts and disclosures in the financial statements and financial highlights. Such procedures also included confirmation of securities owned as of October 31, 2019, by correspondence with the custodian, transfer agent, and brokers, or by other appropriate auditing procedures when replies were not received. Our audits also included evaluating the accounting principles used and significant estimates made by management, as well as evaluating the overall presentation of the financial statements and financial highlights. We believe that our audits provide a reasonable basis for our opinion.

We have served as the auditor of one or more PGIM and/or Prudential Retail investment companies since 2003.
New York, New York
December 19, 2019
| | | | |
| PGIM Jennison Global Infrastructure Fund | | | 43 | |
Federal Income Tax Information(unaudited)
For the year ended October 31, 2019, the Series reports under Section 854 of the Internal Revenue Code, the following percentages of the ordinary income dividends paid as 1) qualified dividend income (QDI); and 2) eligible for corporate dividends received deduction (DRD):
| | | | | | | | |
| | | QDI | | | DRD | |
PGIM Jennison Global Infrastructure Fund | | | 100.00 | % | | | 83.71 | % |
In January 2020, you will be advised on IRS Form 1099-DIV or substitute 1099-DIV, as to the federal tax status of dividends and distributions received by you in calendar year 2019.
INFORMATION ABOUT BOARD MEMBERS AND OFFICERS(unaudited)
Information about Board Members and Officers of the Fund is set forth below. Board Members who are not deemed to be “interested persons” of the Fund, as defined in the 1940 Act, are referred to as “Independent Board Members.” Board Members who are deemed to be “interested persons” of the Fund are referred to as “Interested Board Members.” The Board Members are responsible for the overall supervision of the operations of the Fund and perform the various duties imposed on the directors of investment companies by the 1940 Act. The Board in turn elects the Officers, who are responsible for administering theday-to-day operations of the Fund.
| | | | | | |
| Independent Board Members | | | | |
| | | | |
Name Date of Birth Position(s) Portfolios Overseen | | Principal Occupation(s) During Past Five Years | | Other Directorships
Held During
Past Five Years | | Length of Board Service |
| | | | |
Ellen S. Alberding 3/11/58 Board Member Portfolios Overseen: 96 | | President and Board Member, The Joyce Foundation (charitable foundation) (since 2002); Vice Chair, City Colleges of Chicago (community college system) (2011-2015); Trustee, National Park Foundation (charitable foundation for national park system) (2009-2018); Trustee, Economic Club of Chicago (since 2009); Trustee, Loyola University (since 2018). | | None. | | Since September 2013 |
| | | | |
Kevin J. Bannon 7/13/52 Board Member Portfolios Overseen: 96 | | Retired; Managing Director (April2008-May 2015) and Chief Investment Officer (October 2008-November 2013) of Highmount Capital LLC (registered investment adviser); formerly Executive Vice President and Chief Investment Officer (April 1993-August 2007) of Bank of New York Company; President (May2003-May 2007) of BNY Hamilton Family of Mutual Funds. | | Director of Urstadt Biddle Properties (equity real estate investment trust) (since September 2008). | | Since July 2008 |
PGIM Jennison Global Infrastructure Fund
| | | | | | |
| Independent Board Members | | | | |
| | | | |
Name Date of Birth Position(s) Portfolios Overseen | | Principal Occupation(s) During Past Five Years | | Other Directorships Held During Past Five Years | | Length of Board Service |
| | | | |
Linda W. Bynoe 7/9/52 Board Member Portfolios Overseen: 96 | | President and Chief Executive Officer (since March 1995) and formerly Chief Operating Officer (December 1989-February 1995) of Telemat Ltd. (management consulting); formerly Vice President (January 1985-June 1989) at Morgan Stanley & Co. (broker-dealer). | | Director of Anixter International, Inc. (communication products distributor) (since January 2006); Director of Northern Trust Corporation (financial services) (since April 2006); Trustee of Equity Residential (residential real estate) (since December 2009). | | Since March 2005 |
| | | | |
Barry H. Evans 11/2/60 Board Member Portfolios Overseen: 95 | | Retired; formerly President (2005 – 2016), Global Chief Operating Officer (2014– 2016), Chief Investment Officer – Global Head of Fixed Income (1998-2014), and various portfolio manager roles (1986-2006), Manulife Asset Management U.S. | | Formerly Director, Manulife Trust Company(2011-2018); formerly Director, Manulife Asset Management Limited (2015-2017); formerly Chairman of the Board of Directors of Manulife Asset Management U.S. (2005-2016); formerly Chairman of the Board, Declaration Investment Management and Research (2008-2016). | | Since September 2017 |
| | | | |
Keith F. Hartstein 10/13/56 Board Member & Independent Chair Portfolios Overseen: 96 | | Retired; Member (since November 2014) of the Governing Council of the Independent Directors Council (organization of independent mutual fund directors); formerly President and Chief Executive Officer (2005-2012), Senior Vice President(2004-2005), Senior Vice President of Sales and Marketing (1997-2004), and various executive management positions (1990-1997), John Hancock Funds, LLC (asset management); Chairman, Investment Company Institute’s Sales Force Marketing Committee (2003-2008). | | None. | | Since September 2013 |
Visit our website at pgiminvestments.com
| | | | | | |
| Independent Board Members | | | | |
| | | | |
Name Date of Birth Position(s) Portfolios Overseen | | Principal Occupation(s) During Past Five Years | | Other Directorships Held During Past Five Years | | Length of Board Service |
| | | | |
Laurie Simon Hodrick 9/29/62 Board Member Portfolios Overseen: 95 | | A. Barton Hepburn Professor Emerita of Economics in the Faculty of Business, Columbia Business School (since 2018); Visiting Professor of Law, Stanford Law School (since 2015); Visiting Fellow at the Hoover Institution, Stanford University (since 2015); Sole Member, ReidCourt LLC (since 2008) (a consulting firm); formerly A. Barton Hepburn Professor of Economics in the Faculty of Business, Columbia Business School (1996-2017); formerly Managing Director, Global Head of Alternative Investment Strategies, Deutsche Bank (2006-2008). | | Independent Director, Synnex Corporation (since April 2019) (information technology); Independent Director, Kabbage, Inc. (since July 2018) (financial services); Independent Director, Corporate Capital Trust (2017-2018) (a business development company). | | Since September 2017 |
| | | | |
Michael S. Hyland, CFA 10/4/45 Board Member Portfolios Overseen: 96 | | Retired (since February 2005); formerly Senior Managing Director (July 2001-February 2005) of Bear Stearns & Co, Inc.; Global Partner, INVESCO (1999-2001); Managing Director and President of Salomon Brothers Asset Management (1989-1999). | | None. | | Since July 2008 |
| | | | |
Brian K. Reid 9/22/61 Board Member Portfolios Overseen: 95 | | Retired; formerly Chief Economist for the Investment Company Institute (ICI) (2005-2017); formerly Senior Economist and Director of Industry and Financial Analysis at the ICI (1998-2004); formerly Senior Economist, Industry and Financial Analysis at the ICI (1996-1998); formerly Staff Economist at the Federal Reserve Board (1989-1996); Director, ICI Mutual Insurance Company (2012-2017). | | None. | | Since March 2018 |
PGIM Jennison Global Infrastructure Fund
| | | | | | |
Independent Board Members | | | | |
| | | | |
Name Date of Birth Position(s) Portfolios Overseen | | Principal Occupation(s) During Past Five Years | | Other Directorships Held During Past Five Years | | Length of Board Service |
| | | | |
Grace C. Torres 6/28/59 Board Member Portfolios Overseen: 95 | | Retired; formerly Treasurer and Principal Financial and Accounting Officer of the PGIM Funds, Target Funds, Advanced Series Trust, Prudential Variable Contract Accounts and The Prudential Series Fund (1998-June 2014); Assistant Treasurer (March 1999-June 2014) and Senior Vice President (September 1999-June 2014) of PGIM Investments LLC; Assistant Treasurer (May 2003-June 2014) and Vice President (June 2005-June 2014) of AST Investment Services, Inc.; Senior Vice President and Assistant Treasurer (May 2003-June 2014) of Prudential Annuities Advisory Services, Inc. | | Formerly Director (July 2015-January 2018) of Sun Bancorp, Inc. N.A. and Sun National Bank; Director (since January 2018) of OceanFirst Financial Corp. and OceanFirst Bank. | | Since November 2014 |
| | | | | | |
Interested Board Members | | | | |
| | | | |
Name Date of Birth Position(s) Portfolios Overseen | | Principal Occupation(s) During Past Five Years | | Other Directorships Held During Past Five Years | | Length of Board Service |
| | | | |
Stuart S. Parker 10/5/62 Board Member & President Portfolios Overseen: 96 | | President of PGIM Investments LLC (formerly known as Prudential Investments LLC) (since January 2012); Executive Vice President of Prudential Investment Management Services LLC (since December 2012); formerly Executive Vice President of Jennison Associates LLC and Head of Retail Distribution of PGIM Investments LLC (June 2005-December 2011). | | None. | | Since January 2012 |
Visit our website at pgiminvestments.com
| | | | | | |
Interested Board Members | | | | |
| | | | |
Name Date of Birth Position(s) Portfolios Overseen | | Principal Occupation(s) During Past Five Years | | Other Directorships Held During Past Five Years | | Length of Board Service |
| | | | |
Scott E. Benjamin 5/21/73 Board Member & Vice President Portfolios Overseen:96 | | Executive Vice President (since June 2009) of PGIM Investments LLC; Executive Vice President (June 2009-June 2012) and Vice President (since June 2012) of Prudential Investment Management Services LLC; Executive Vice President (since September 2009) of AST Investment Services, Inc.; Senior Vice President of Product Development and Marketing, PGIM Investments (since February 2006); formerly Vice President of Product Development and Product Management, PGIM Investments LLC (2003-2006). | | None. | | Since March 2010 |
| | | | |
| Fund Officers(a) | | | | |
| | | |
Name Date of Birth Fund Position | | Principal Occupation(s) During Past Five Years | | Length of Service as Fund Officer |
| | | |
Raymond A. O’Hara 9/11/55 Chief Legal Officer | | Vice President and Corporate Counsel (since July 2010) of Prudential Insurance Company of America (Prudential); Vice President (March 2011-Present) of Pruco Life Insurance Company and Pruco Life Insurance Company of New Jersey; Vice President and Corporate Counsel (March 2011-Present) of Prudential Annuities Life Assurance Corporation; Chief Legal Officer of PGIM Investments LLC (since June 2012); Chief Legal Officer of Prudential Mutual Fund Services LLC (since June 2012) and Corporate Counsel of AST Investment Services, Inc. (since June 2012); formerly Assistant Vice President and Corporate Counsel (September 2008-July 2010) of The Hartford Financial Services Group, Inc.; formerly Associate (September 1980-December 1987) and Partner (January 1988–August 2008) of Blazzard & Hasenauer, P.C. (formerly, Blazzard, Grodd & Hasenauer, P.C.). | | Since June 2012 |
PGIM Jennison Global Infrastructure Fund
| | | | |
| Fund Officers(a) | | | | |
| | | |
Name Date of Birth Fund Position | | Principal Occupation(s) During Past Five Years | | Length of Service as Fund Officer |
| | | |
Dino Capasso 8/19/74 Chief Compliance Officer | | Chief Compliance Officer (July 2019-Present) of PGIM Investments LLC; Chief Compliance Officer (July 2019-Present) of the PGIM Funds, Target Funds, Advanced Series Trust, The Prudential Series Fund, Prudential’s Gibraltar Fund, Inc., PGIM Global High Yield Fund, Inc., and PGIM High Yield Bond Fund, Inc.; Vice President and Deputy Chief Compliance Officer (June 2017-2019) of PGIM Investments LLC; formerly, Senior Vice President and Senior Counsel (January 2016-June 2017), and Vice President and Counsel (February 2012-December 2015) of Pacific Investment Management Company LLC. | | Since March 2018 |
| | | |
Andrew R. French 12/22/62 Secretary | | Vice President of PGIM Investments LLC (December 2018-Present); formerly Vice President and Corporate Counsel (February 2010-December 2018) of Prudential; formerly Director and Corporate Counsel (2006-2010) of Prudential; Vice President and Assistant Secretary (since January 2007) of PGIM Investments LLC; Vice President and Assistant Secretary (since January 2007) of Prudential Mutual Fund Services LLC. | | Since October 2006 |
| | | |
Jonathan D. Shain 8/9/58 Assistant Secretary | | Vice President and Corporate Counsel (since August 1998) of Prudential; Vice President and Assistant Secretary (since May 2001) of PGIM Investments LLC; Vice President and Assistant Secretary (since February 2001) of Prudential Mutual Fund Services LLC; formerly Vice President and Assistant Secretary (May 2003-June 2005) of AST Investment Services, Inc. | | Since May 2005 |
| | | |
Claudia DiGiacomo 10/14/74 Assistant Secretary | | Vice President and Corporate Counsel (since January 2005) of Prudential; Vice President and Assistant Secretary of PGIM Investments LLC (since December 2005); formerly Associate at Sidley Austin Brown & Wood LLP (1999-2004). | | Since December 2005 |
| | | |
Diana N. Huffman 4/14/82 Assistant Secretary | | Vice President and Corporate Counsel (since September 2015) of Prudential; formerly Associate at Willkie Farr & Gallagher LLP (2009-2015). | | Since March 2019 |
| | | |
Kelly A. Coyne 8/8/68 Assistant Secretary | | Director, Investment Operations of Prudential Mutual Fund Services LLC (since 2010). | | Since March 2015 |
| | | |
Christian J. Kelly 5/5/75 Treasurer and Principal Financial and Accounting Officer | | Vice President, Head of Fund Administration of PGIM Investments LLC (since November 2018); formerly, Director of Fund Administration of Lord Abbett & Co. LLC (2009-2018), Treasurer and Principal Accounting Officer of the Lord Abbett Family of Funds (2017-2018); Director of Accounting, Avenue Capital Group (2008-2009); Senior Manager, Investment Management Practice of Deloitte & Touche LLP (1998-2007). | | Since January 2019 |
Visit our website at pgiminvestments.com
| | | | |
| Fund Officers(a) | | | | |
| | | |
Name Date of Birth Fund Position | | Principal Occupation(s) During Past Five Years | | Length of Service as Fund Officer |
| | | |
Lana Lomuti 6/7/67 Assistant Treasurer | | Vice President (since 2007) and Director (2005-2007), within PGIM Investments Fund Administration; formerly Assistant Treasurer (December 2007-February 2014) of The Greater China Fund, Inc. | | Since April 2014 |
| | | |
Russ Shupak 10/08/73 Assistant Treasurer | | Vice President (since 2017) and Director (2013-2017), within PGIM Investments Fund Administration. | | Since October 2019 |
| | | |
Deborah Conway 3/26/69 Assistant Treasurer | | Vice President (since 2017) and Director (2007-2017), within PGIM Investments Fund Administration. | | Since October 2019 |
| | | |
Elyse M. McLaughlin 1/20/74 Assistant Treasurer | | Vice President (since 2017) and Director (2011-2017), within PGIM Investments Fund Administration. | | Since October 2019 |
| | | |
Charles H. Smith 1/11/73 Anti-Money Laundering Compliance Officer | | Vice President, Corporate Compliance, Anti-Money Laundering Unit (since January 2015) of Prudential; committee member of the American Council of Life Insurers Anti-Money Laundering and Critical Infrastructure Committee (since January 2016); formerly Global Head of Economic Sanctions Compliance at AIG Property Casualty (February 2007-December 2014); Assistant Attorney General at the New York State Attorney General’s Office, Division of Public Advocacy. (August 1998-January 2007). | | Since January 2017 |
(a) Excludes Mr. Parker and Mr. Benjamin, interested Board Members who also serve as President and Vice President, respectively.
Explanatory Notes to Tables:
| ∎ | | Board Members are deemed to be “Interested,” as defined in the 1940 Act, by reason of their affiliation with PGIM Investments LLC and/or an affiliate of PGIM Investments LLC. |
| ∎ | | Unless otherwise noted, the address of all Board Members and Officers is c/o PGIM Investments LLC, 655 Broad Street, Newark, New Jersey 07102-4410. |
| ∎ | | There is no set term of office for Board Members or Officers. The Board Members have adopted a retirement policy, which calls for the retirement of Board Members on December 31 of the year in which they reach the age of 75. |
| ∎ | | “Other Directorships Held” includes only directorships of companies required to register or file reports with the SEC under the 1934 Act (that is, “public companies”) or other investment companies registered under the 1940 Act. |
| ∎ | | “Portfolios Overseen” includes all investment companies managed by PGIM Investments LLC. The investment companies for which PGIM Investments LLC serves as manager include the PGIM Funds, The Prudential Variable Contract Accounts, PGIM ETF Trust, PGIM High Yield Bond Fund, Inc., PGIM Global High Yield Fund, Inc., The Prudential Series Fund, Prudential’s Gibraltar Fund, Inc. and the Advanced Series Trust. |
PGIM Jennison Global Infrastructure Fund
Approval of Advisory Agreements(unaudited)
The Fund’s Board of Directors
The Board of Directors (the “Board”) of PGIM Jennison Global Infrastructure Fund (the “Fund”)1 consists of eleven individuals, nine of whom are not “interested persons” of the Fund, as defined in the Investment Company Act of 1940, as amended (the “1940 Act”) (the “Independent Directors”).2 The Board is responsible for the oversight of the Fund and its operations, and performs the various duties imposed on the directors of investment companies by the 1940 Act. The Independent Directors have retained independent legal counsel to assist them in connection with their duties. The Chair of the Board is an Independent Director. The Board has established four standing committees: the Audit Committee, the Nominating and Governance Committee, and two Investment Committees. Each committee is chaired by, and composed of, Independent Directors.
Annual Approval of the Fund’s Advisory Agreements
As required under the 1940 Act, the Board determines annually whether to renew the Fund’s management agreement with PGIM Investments LLC (“PGIM Investments”) and the Fund’s subadvisory agreement with Jennison Associates LLC (“Jennison”). In considering the renewal of the agreements, the Board, including all of the Independent Directors, met on May 30, 2019 and on June11-13, 2019 and approved the renewal of the agreements through July 31, 2020, after concluding that the renewal of the agreements was in the best interests of the Fund and its shareholders.
In advance of the meetings, the Board requested and received materials relating to the agreements, and had the opportunity to ask questions and request further information in connection with its consideration. Among other things, the Board considered comparative fee information from PGIM Investments and Jennison. Also, the Board considered comparisons with other mutual funds in relevant Peer Universes and Peer Groups, as is further discussed below.
In approving the agreements, the Board, including the Independent Directors advised by independent legal counsel, considered the factors it deemed relevant, including the nature, quality and extent of services provided by PGIM Investments and the subadviser, the performance of the Fund, the profitability of PGIM Investments and its affiliates, expenses and fees, and the potential for economies of scale that may be shared with the Fund and its shareholders as the Fund’s assets grow. In their deliberations, the Directors did not identify any single factor which alone was responsible for the Board’s decision to approve the agreements with respect to the Fund. In connection with its deliberations, the Board
| 1 | PGIM Jennison Global Infrastructure Fund is a series of Prudential World Fund, Inc. |
| 2 | Grace C. Torres was an Interested Director of the Fund at the time the Board considered and approved the renewal of the Fund’s advisory agreements, but has since become an Independent Director of the Fund. |
| | |
| PGIM Jennison Global Infrastructure Fund |
Approval of Advisory Agreements(continued)
considered information provided by PGIM Investments throughout the year at regular Board meetings, presentations from portfolio managers and other information, as well as information furnished at or in advance of the meetings on May 30, 2019 and onJune 11-13, 2019.
The Directors determined that the overall arrangements between the Fund and PGIM Investments, which serves as the Fund’s investment manager pursuant to a management agreement, and between PGIM Investments and Jennison, which serves as the Fund’s subadviser pursuant to the terms of a subadvisory agreement with PGIM Investments, are in the best interests of the Fund and its shareholders in light of the services performed, fees charged and such other matters as the Directors considered relevant in the exercise of their business judgment.
The material factors and conclusions that formed the basis for the Directors’ reaching their determinations to approve the continuance of the agreements are separately discussed below.
Nature, Quality and Extent of Services
The Board received and considered information regarding the nature, quality and extent of services provided to the Fund by PGIM Investments and Jennison. The Board noted that Jennison is affiliated with PGIM Investments. The Board considered the services provided by PGIM Investments, including but not limited to the oversight of the subadviser for the Fund, as well as the provision of fund recordkeeping, compliance and other services to the Fund, and PGIM Investments’ role as administrator for the Fund’s liquidity risk management program. With respect to PGIM Investments’ oversight of the subadviser, the Board noted that PGIM Investments’ Strategic Investment Research Group (“SIRG”), which is a business unit of PGIM Investments, is responsible for monitoring and reporting to PGIM Investments’ senior management on the performance and operations of the subadviser. The Board also considered that PGIM Investments pays the salaries of all of the officers and interested Directors of the Fund who are part of Fund management. The Board also considered the investment subadvisory services provided by Jennison, including investment research and security selection, as well as adherence to the Fund’s investment restrictions and compliance with applicable Fund policies and procedures. The Board considered PGIM Investments’ evaluation of the subadviser, as well as PGIM Investments’ recommendation, based on its review of the subadviser, to renew the subadvisory agreement.
The Board considered the qualifications, backgrounds and responsibilities of PGIM Investments’ senior management responsible for the oversight of the Fund and Jennison, and also considered the qualifications, backgrounds and responsibilities of Jennison’s portfolio managers who are responsible for theday-to-day management of the Fund’s portfolio. The Board was provided with information pertaining to PGIM Investments’ and Jennison’s organizational structure, senior management, investment operations, and other
| | |
| Visit our website at pgiminvestments.com | | |
relevant information pertaining to both PGIM Investments and Jennison. The Board also noted that it received favorable compliance reports from the Fund’s Chief Compliance Officer (“CCO”) as to both PGIM Investments and Jennison.
The Board concluded that it was satisfied with the nature, extent and quality of the investment management services provided by PGIM Investments and the subadvisory services provided to the Fund by Jennison, and that there was a reasonable basis on which to conclude that the Fund benefits from the services provided by PGIM Investments and Jennison under the management and subadvisory agreements.
Costs of Services and Profits Realized by PGIM Investments
The Board was provided with information on the profitability of PGIM Investments and its affiliates in serving as the Fund’s investment manager. The Board discussed with PGIM Investments the methodology utilized in assembling the information regarding profitability and considered its reasonableness. The Board recognized that it is difficult to make comparisons of profitability from fund management contracts because comparative information is not generally publicly available and is affected by numerous factors, including the structure of the particular adviser, the types of funds it manages, its business mix, numerous assumptions regarding allocations and the adviser’s capital structure and cost of capital. However, the Board considered that the cost of services provided by PGIM Investments to the Fund during the year ended December 31, 2018 exceeded the management fees paid by the Fund, resulting in an operating loss to PGIM Investments. Taking these factors into account, the Board concluded that the profitability of PGIM Investments and its affiliates in relation to the services rendered was not unreasonable.
Economies of Scale
The Board received and discussed information concerning economies of scale that PGIM Investments may realize as the Fund’s assets grow beyond current levels. The Board noted that the management fee schedule for the Fund includes breakpoints, which have the effect of decreasing the fee rate as assets increase. During the course of time, the Board has considered information regarding the launch date of the Fund, the management fees of the Fund compared to those of similarly managed funds and PGIM Investments’ investment in the Fund over time. The Board noted that economies of scale may be shared with the Fund in several ways, including low management fees from inception, additional technological and personnel investments to enhance shareholder services, and maintaining existing expense structures in the face of a rising cost environment. The Board considered PGIM Investments’ assertion that it continually evaluates the management fee schedule of the Fund and the potential to share economies of scale through breakpoints or fee waivers as asset levels increase.
| | |
| PGIM Jennison Global Infrastructure Fund |
Approval of Advisory Agreements(continued)
The Board recognized the inherent limitations of any analysis of economies of scale, stemming largely from the Board’s understanding that most of PGIM Investments’ costs are not specific to individual funds, but rather are incurred across a variety of products and services.
Other Benefits to PGIM Investments and Jennison
The Board considered potential ancillary benefits that might be received by PGIM Investments and Jennison and their affiliates as a result of their relationship with the Fund. The Board concluded that potential benefits to be derived by PGIM Investments included transfer agency fees received by the Fund’s transfer agent (which is affiliated with PGIM Investments), benefits to its reputation as well as other intangible benefits resulting from PGIM Investments’ association with the Fund. The Board concluded that the potential benefits to be derived by Jennison included its ability to use soft dollar credits, as well as the potential benefits consistent with those generally resulting from an increase in assets under management, specifically, potential access to additional research resources and benefits to its reputation. The Board concluded that the benefits derived by PGIM Investments and Jennison were consistent with the types of benefits generally derived by investment managers and subadvisers to mutual funds.
Performance of the Fund / Fees and Expenses
The Board considered certain additional factors and made related conclusions relating to the historical performance of the Fund for theone-, three- and five-year periods ended December 31, 2018.
The Board also considered the Fund’s actual management fee, as well as the Fund’s net total expense ratio, for the fiscal year ended October 31, 2018. The Board considered the management fee for the Fund as compared to the management fee charged by PGIM Investments to other funds and the fee charged by other advisers to comparable mutual funds in a Peer Group. The actual management fee represents the fee rate actually paid by Fund shareholders and includes any fee waivers or reimbursements. The net total expense ratio for the Fund represents the actual expense ratio incurred by Fund shareholders.
The mutual funds included in the Peer Universe, which was used to consider performance, and the Peer Group, which was used to consider fees and expenses, were objectively determined by Broadridge, an independent provider of mutual fund data. In certain circumstances, PGIM Investments also provided supplemental Peer Universe or Peer Group information for reasons addressed with the Board. The comparisons placed the Fund in various quartiles over various periods, with the first quartile being the best 25% of the mutual funds (for performance, the best performing mutual funds and, for expenses, the lowest cost mutual funds).
| | |
| Visit our website at pgiminvestments.com | | |
The section below summarizes key factors considered by the Board and the Board’s conclusions regarding the Fund’s performance, fees and overall expenses. The table sets forth net performance comparisons (which reflect the impact on performance of fund expenses, or any subsidies, expense caps or waivers that may be applicable) with the Peer Universe, actual management fees with the Peer Group (which reflect the impact of any subsidies or fee waivers), and net total expenses with the Peer Group, each of which were key factors considered by the Board.
| | | | | | | | |
| Net Performance | | 1 Year | | 3 Years | | 5 Years | | 10 Years |
| | | 2nd Quartile | | 3rd Quartile | | 3rd Quartile | | N/A |
| Actual Management Fees: 2nd Quartile |
| Net Total Expenses: 4th Quartile |
| | • | | The Board noted that the Fund outperformed its benchmark index over theone- and five-year periods, though it underperformed over the three-year period. |
| | • | | The Board noted information provided by PGIM Investments indicating that, although the Fund’s net total expense ratio would continue to rank in the fourth quartile, if the Fund’s expense cap had been in effect for the full fiscal year (the cap was implemented after the end of the fiscal year), the Fund’s net total expense ratio would have been nine basis points from the median of all funds in the Peer Group. |
| | • | | The Board and PGIM Investments agreed to retain the Fund’s existing contractual expense cap which (exclusive of certain fees and expenses) caps total annual operating expenses at 1.50% for Class A shares, 2.25% for Class C shares, 1.25% for Class R6 shares, and 1.25% for Class Z shares through February 29, 2020. |
| | • | | In addition, PGIM Investments will waive management fees or shared operating expenses on any share class to the same extent that it waives such expenses on any other share class, and has agreed that total annual fund operating expenses for Class R6 shares will not exceed total annual fund operating expenses for Class Z shares. |
| | • | | The Board concluded that, in light of the above, it would be in the best interests of the Fund and its shareholders to renew the agreements. |
| | • | | The Board concluded that the management fees (including subadvisory fees) and total expenses were reasonable in light of the services provided. |
* * *
After full consideration of these factors, the Board concluded that approval of the agreements was in the best interests of the Fund and its shareholders.
| | |
| PGIM Jennison Global Infrastructure Fund |
| | | | |
| | |
| ∎ MAIL | | ∎ TELEPHONE | | ∎ WEBSITE |
655 Broad Street Newark, NJ 07102 | | (800) 225-1852 | | pgiminvestments.com |
|
| PROXY VOTING |
| The Board of Directors of the Fund has delegated to the Fund’s subadviser the responsibility for voting any proxies and maintaining proxy recordkeeping with respect to the Fund. A description of these proxy voting policies and procedures is available without charge, upon request, by calling(800) 225-1852. Information regarding how the Fund voted proxies relating to portfolio securities during the most recent 12-month period ended June 30 is available on the Fund’s website and on the Securities and Exchange Commission’s website. |
|
| DIRECTORS |
| Ellen S. Alberding• Kevin J. Bannon• Scott E. Benjamin• Linda W. Bynoe• Barry H. Evans• Keith F. Hartstein • Laurie Simon Hodrick• Michael S. Hyland• Stuart S. Parker• Brian K. Reid• Grace C. Torres |
|
| OFFICERS |
Stuart S. Parker,President• Scott E. Benjamin,Vice President• Christian J. Kelly,Treasurer and Principal Financial and Accounting Officer• Raymond A. O’Hara,Chief Legal Officer• Dino Capasso,Chief Compliance Officer• Charles H. Smith,Anti-Money Laundering Compliance Officer• Andrew R. French,Secretary• Jonathan D. Shain,Assistant Secretary• Claudia DiGiacomo,Assistant Secretary • Diana N. Huffman,Assistant Secretary• Kelly A. Coyne,Assistant Secretary• Lana Lomuti,Assistant Treasurer• Russ Shupak,Assistant Treasurer• Elyse McLaughlin,Assistant Treasurer• Deborah Conway,Assistant Treasurer |
| | | | |
| MANAGER | | PGIM Investments LLC | | 655 Broad Street
Newark, NJ 07102 |
|
| SUBADVISER | | Jennison Associates LLC | | 466 Lexington Avenue
New York, NY 10017 |
|
| DISTRIBUTOR | | Prudential Investment
Management Services LLC | | 655 Broad Street
Newark, NJ 07102 |
|
| CUSTODIAN | | The Bank of New York Mellon | | 240 Greenwich Street
New York, NY 10286 |
|
| TRANSFER AGENT | | Prudential Mutual Fund
Services LLC | | PO Box 9658
Providence, RI 02940 |
|
| INDEPENDENT REGISTERED PUBLIC ACCOUNTING FIRM | | KPMG LLP | | 345 Park Avenue New York, NY 10154 |
|
| FUND COUNSEL | | Willkie Farr & Gallagher LLP | | 787 Seventh Avenue
New York, NY 10019 |
|
|
| An investor should consider the investment objectives, risks, charges, and expenses of the Fund carefully before investing. The prospectus and summary prospectus contain this and other information about the Fund. An investor may obtain the prospectus and summary prospectus by visiting our website atpgiminvestments.com or by calling(800) 225-1852. The prospectus and summary prospectus should be read carefully before investing. |
|
| E-DELIVERY |
| To receive your mutual fund documents online, go topgiminvestments.com/edelivery and enroll. Instead of receiving printed documents by mail, you will receive notification via email when new materials are available. You can cancel your enrollment or change your email address at any time byvisiting the website address above. |
|
| SHAREHOLDER COMMUNICATIONS WITH DIRECTORS |
| Shareholders can communicate directly with the Board of Directors by writing to the Chair of the Board, PGIM Jennison Global Infrastructure Fund, PGIM Investments, Attn: Board of Directors, 655 Broad Street, Newark, NJ 07102. Shareholders can communicate directly with an individual Director by writing to the same address. Communications are not screened before being delivered to the addressee. |
|
| AVAILABILITY OF PORTFOLIO HOLDINGS |
| The Fund files its complete schedule of portfolio holdings with the Securities and Exchange Commission on Form N-PORT. The Fund’s Form N-PORT filings are available on the Commission’s website at sec.gov. Form N-PORT is filed with the Commission quarterly, and each Fund’s full portfolio holdings as of the first and third fiscal quarter-ends (as of the third month of the Fund’s fiscal quarter for reporting periods on or after September 30, 2019) will be made publicly available 60 days after the end of each quarter at sec.gov. |
|
| The Fund’s Statement of Additional Information contains additional information about the Fund’s Directors and is available without charge, upon request, by calling (800) 225-1852. |
Mutual Funds:
| | | | |
| ARE NOT INSURED BY THE FDIC OR ANY FEDERAL GOVERNMENT AGENCY | | MAY LOSE VALUE | | ARE NOT A DEPOSIT OF OR GUARANTEED BY ANY BANK OR ANY BANK AFFILIATE |
PGIM JENNISON GLOBAL INFRASTRUCTURE FUND
| | | | | | | | |
| SHARE CLASS | | A | | C | | Z | | R6 |
| NASDAQ | | PGJAX | | PGJCX | | PGJZX | | PGJQX |
| CUSIP | | 743969792 | | 743969784 | | 743969776 | | 743969560 |
MF217E

PGIM EMERGING MARKETS DEBT HARD
CURRENCY FUND
ANNUAL REPORT
OCTOBER 31, 2019
COMING SOON: PAPERLESS SHAREHOLDER REPORTS
Beginning on January 1, 2021, as permitted by regulations adopted by the Securities and Exchange Commission, paper copies of the Fund’s annual and semiannual shareholder reports will no longer be sent by mail, unless you specifically request paper copies of the reports. Instead, the reports will be made available on the Fund’s website (pgiminvestments.com), and you will be notified by mail each time a report is posted and provided with a website link to access the report.
If you already elected to receive shareholder reports electronically, you will not be affected by this change and you need not take any action. You may elect to receive shareholder reports and other communications from the Fund electronically anytime by contacting your financial intermediary (such as a broker-dealer or bank) or, if you are a direct investor, by calling 1-800-225-1852 or by sending an email request to PGIM Investments at shareholderreports@pgim.com.
You may elect to receive all future reports in paper free of charge. If you invest through a financial intermediary, you can contact your financial intermediary or follow instructions included with this notice to elect to continue to receive paper copies of your shareholder reports. If you invest directly with the Fund, you can call 1-800-225-1852 or send an email request to shareholderreports@pgim.com to let the Fund know you wish to continue receiving paper copies of your shareholder reports. Your election to receive reports in paper will apply to all funds held in your account if you invest through your financial intermediary or all funds held with the fund complex if you invest directly with the Fund.

To enroll in e-delivery, go to pgiminvestments.com/edelivery
|
| Objective: Total return, through a combination of current income and capital appreciation |
Highlights(unaudited)
| • | | Security selection and currency positioning added to the Fund’s performance over the reporting period. |
| • | | Although overall country selection was negative, overweight positions in Greece, Ukraine, Indonesia, and Poland added to performance. |
| • | | Overall country selection was the largest detractor from the Fund’s performance over the period, highlighted by an overweight to Argentina. An overweight to Venezuela was also negative. |
| • | | Security selection within El Salvador, Jamaica, and Venezuela detracted from returns over the period. |
This report is not authorized for distribution to prospective investors unless preceded or accompanied by a current prospectus.
The views expressed in this report and information about the Fund’s portfolio holdings are for the period covered by this report and are subject to change thereafter.
Mutual funds are distributed by Prudential Investment Management Services LLC (PIMS), member SIPC. PGIM Fixed Income is a unit of PGIM, Inc. (PGIM), a registered investment adviser. PIMS and PGIM are Prudential Financial companies.© 2019 Prudential Financial, Inc. and its related entities. PGIM and the PGIM logo are service marks of Prudential Financial, Inc. and its related entities, registered in many jurisdictions worldwide.
| | |
| 2 | | Visit our website at pgiminvestments.com |
Table of Contents
| | | | |
| PGIM Emerging Markets Debt Hard Currency Fund | | | 3 | |
This Page Intentionally Left Blank
Letter from the President

Dear Shareholder:
We hope you find the annual report for the PGIM Emerging Markets Debt Hard Currency Fund informative and useful. The report covers performance for the12-month period that ended October 31, 2019.
While the US economy remained healthy, with rising corporate profits and strong job growth, the Federal Reserve cut interest rates three times in the latter half of the period. The cuts were a proactive attempt by the Fed to extend the longest domestic economic expansion on record as growth in many regions weakened. China in particular showed signs of slowing amid trade tensions with the US, and turmoil in the United Kingdom continued as it negotiates an exit from the European Union.
The interest-rate cuts helped boost the performance of stocks globally. For the period overall,large-cap US equities along with stocks in developed and emerging foreign markets all rose by double digits.Small-cap US stocks posted a single-digit gain. This positive performance came despite significant volatility early in the period. Equities plunged at the end of 2018 on concerns about China’s economy, a potential global trade war, higher interest rates, and worries that profit growth might slow. Stocks reversed course early in 2019, rising sharply after the Fed moderated its position on additional rate hikes for the remainder of the year.
The overall US bond market posted strong returns during the period on a significant rally in interest rates that saw the10-year US Treasury yield decline from over 3% to under 2%. Investment-grade corporate bonds led the way with a double-digit gain, while corporate high yield and municipal bonds each had a return in the high single digits. Globally, bonds in developed markets delivered strong returns, and emerging markets debt rose by double digits.
Regarding your investments with PGIM, we believe it is important to maintain a diversified portfolio of funds consistent with your tolerance for risk, time horizon, and financial goals. Your financial advisor can help you create a diversified investment plan that may include funds covering all the basic asset classes and that reflects your personal investor profile and risk tolerance. However, diversification and asset allocation strategies do not assure a profit or protect against loss in declining markets.
At PGIM Investments, we consider it a great privilege and responsibility to help investors participate in opportunities across global markets while meeting their toughest investment challenges. PGIM is atop-10 global investment manager with more than $1 trillion in assets under management. This scale and investment expertise allow us to deliver actively managed funds and strategies to meet the needs of investors around the globe.
Thank you for choosing our family of funds.
Sincerely,

Stuart S. Parker, President
PGIM Emerging Markets Debt Hard Currency Fund
December 16, 2019
| | | | |
| PGIM Emerging Markets Debt Hard Currency Fund | | | 5 | |
Your Fund’s Performance(unaudited)
Performance data quoted represents past performance. Past performance does not guarantee future results. The investment return and principal value of an investment will fluctuate, so that an investor’s shares, when redeemed, may be worth more or less than their original cost. Current performance may be lower or higher than the past performance data quoted. An investor may obtain performance data as of the most recent month-end by visiting our website atpgiminvestments.com or by calling(800) 225-1852.
| | | | |
| |
| | | Average Annual Total Returns as of 10/31/19 (with sales charges) |
| | | One Year (%) | | Since Inception (%) |
| Class A | | 9.55 | | 1.01 (12/12/17) |
| Class C | | 11.40 | | 2.04 (12/12/17) |
| Class Z | | 13.51 | | 3.03 (12/12/17) |
| Class R6 | | 13.58 | | 3.11 (12/12/17) |
| JP Morgan Emerging Markets Bond Global Diversified Index |
| | | 14.35 | | 4.74 |
| | | | |
| |
| | | Average Annual Total Returns as of 10/31/19
(without sales charges) |
| | | One Year (%) | | Since Inception (%) |
| Class A | | 13.23 | | 2.80 (12/12/17) |
| Class C | | 12.40 | | 2.04 (12/12/17) |
| Class Z | | 13.51 | | 3.03 (12/12/17) |
| Class R6 | | 13.58 | | 3.11 (12/12/17) |
JP Morgan Emerging Markets Bond Global Diversified Index | | | | |
| | | 14.35 | | 4.74 |
| | |
| 6 | | Visit our website at pgiminvestments.com |
Growth of a $10,000 Investment (unaudited)
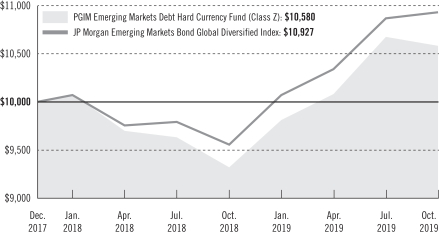
The graph compares a $10,000 investment in the Fund’s Class Z shares with a similar investment in the JP Morgan EMBI Global Diversified Index by portraying the initial account values at the commencement of operations for Class Z shares (December 12, 2017) and the account values at the end of the current fiscal period (October 31, 2019) as measured on a quarterly basis. For purposes of the graph, and unless otherwise indicated, it has been assumed that (a) all recurring fees (including management fees) were deducted; and (b) all dividends and distributions were reinvested. The line graph provides information for Class Z shares only. As indicated in the tables provided earlier, performance for other share classes will vary due to the differing charges and expenses applicable to each share class (as indicated in the following paragraphs). Without waiver of fees and/or expense reimbursements, if any, the Fund’s returns would have been lower.
Past performance does not predict future performance. Total returns and the ending account values in the graph include changes in share price and reinvestment of dividends and capital gains distributions in a hypothetical investment for the periods shown. The Fund’s total returns do not reflect the deduction of income taxes on an individual’s investment. Taxes may reduce your actual investment returns on income or gains paid by the Fund or any gains you may realize if you sell your shares.
Source: PGIM Investments LLC, Lipper Inc.
Since Inception returns are provided since the Fund has less than 10 fiscal years of returns. Since Inception returns for the Index are measured from closest month-end to the Fund’s inception date.
| | | | |
| PGIM Emerging Markets Debt Hard Currency Fund | | | 7 | |
Your Fund’s Performance(continued)
The returns in the tables do not reflect the deduction of taxes that a shareholder would pay on Fund distributions or following the redemption of Fund shares. The average annual total returns take into account applicable sales charges, which are described for each share class in the table below.
| | | | | | | | |
| | | | | |
| | | Class A | | Class C | | Class Z | | Class R6 |
| Maximum initial sales charge | | For purchases on or after July 15, 2019: 3.25% of the public offering price. For purchases prior to July 15, 2019: 4.50% of the public offering price | | None | | None | | None |
| Contingent deferred sales charge (CDSC) (as a percentage of the lower of the original purchase price or the net asset value at redemption) | | For purchases on or after July 15, 2019: 1.00% on sales of $500,000 or more made within 12 months of purchase. For purchases prior to July 15, 2019: 1.00% on sales of $1 million or more made within 12 months of purchase. | | 1.00% on sales made within 12 months of purchase | | None | | None |
| Annual distribution and service (12b-1) fees (shown as a percentage of average daily net assets) | | 0.25% | | 1.00% | | None | | None |
Benchmark Definitions
JP Morgan Emerging Markets Bond Global Diversified Index (EMBI)—The JP Morgan Emerging Markets Bond Global Diversified Index (EMBI) tracks total returns for USD-denominated debt instruments issued by emerging market sovereign and quasi-sovereign entities: Brady bonds, loans, and eurobonds. It limits the weights of those index countries with larger debt stocks by only including specified portions of these countries’ eligible current face amounts of debt outstanding.
Investors cannot invest directly in an index or average. The returns for the Index would be lower if they included the effects of sales charges, operating expenses of a mutual fund, or taxes.
| | |
| 8 | | Visit our website at pgiminvestments.com |
| | | | |
|
| Credit Quality expressed as a percentage of total investments as of 10/31/19 (%) | |
| AA | | | 2.4 | |
| A | | | 8.6 | |
| BBB | | | 25.7 | |
| BB | | | 23.5 | |
| B | | | 32.7 | |
| CCC | | | 3.5 | |
| C | | | 0.1 | |
| D | | | 0.2 | |
| Not Rated | | | 0.8 | |
| Cash & Equivalents | | | 2.5 | |
| Total | | | 100.0 | |
Source: PGIM Fixed Income
Credit ratings reflect the highest rating assigned by a nationally recognized statistical rating organization (NRSRO) such as Moody’s Investors Service, Inc. (Moody’s), S&P Global Ratings (S&P), or Fitch, Inc. (Fitch). Credit ratings reflect the common nomenclature used by both S&P and Fitch. Where applicable, ratings are converted to the comparable S&P/Fitch rating tier nomenclature. These rating agencies are independent and are widely used. The Not Rated category consists of securities that have not been rated by a NRSRO. Credit ratings are subject to change.
| | | | | | |
|
| Distributions and Yields as of 10/31/19 |
| | Total Distributions
Paid for
12 Months ($) | | SEC 30-Day
Subsidized
Yield* (%) | | SEC 30-Day
Unsubsidized
Yield** (%) |
| Class A | | 0.52 | | 5.28 | | –6.76 |
| Class C | | 0.45 | | 4.73 | | –8.33 |
| Class Z | | 0.54 | | 5.75 | | 4.75 |
| Class R6 | | 0.55 | | 5.80 | | 5.31 |
*SEC 30-Day Subsidized Yield (%)—A standardized yield calculation created by the Securities and Exchange Commission, it reflects the income earned during a 30-day period, after the deduction of the Fund’s net expenses (net of any expense waivers or reimbursements). The investor experience is represented by the SEC 30-Day Subsidized Yield.
**SEC 30-Day Unsubsidized Yield (%)—A standardized yield calculation created by the Securities and Exchange Commission, it reflects the income earned during a 30-day period, after the deduction of the Fund’s gross expenses. The investor experience is represented by the SEC 30-Day Subsidized Yield.
| | | | |
| PGIM Emerging Markets Debt Hard Currency Fund | | | 9 | |
Strategy and Performance Overview(unaudited)
How did the Fund perform?
ThePGIM Emerging Markets Debt Hard Currency Fund’s Class Z shares returned 13.51% in the12-month reporting period that ended October 31, 2019, underperforming the 14.35% return of the JP Morgan Emerging Markets Bond Global Diversified Index (the Index).
What were the market conditions?
| • | | In reviewing fourth-quarter 2018 emerging markets (EM) performance, EM hard currency assets underperformed EM local bond markets—particularly local hedged bonds and emerging markets foreign exchange (EMFX)—with much of the relative underperformance taking place in October and November. Not surprisingly,oil-sensitive and exporting countries underperformed (e.g., Mexico and Nigeria), while other underperformers included Argentina and Ukraine. Outperformers included Brazil, Turkey, and the country-specific stories of Mozambique and Zambia. EM hard currency assets have performed well since theG-20 meeting in early December 2018 and, specifically, since the initial signal that there was more scope for negotiations on tariffs between the US and China in 2019, which supported the broader tone across the sector. (The G20, or Group of 20, is comprised of finance ministers and central bank governors from 19 of the world’s largest economies, along with the European Union.) Hard currency spreads remained resilient, topping out at 400 basis points (bps) at the end of November 2018, subsequently tightening to 390 bps before ending the quarter slightly wider at 415 bps amid volatility in the US stock market and other risk assets. (One basis point is 0.01%.) One relevant positive development to end 2018 was the recovery in Mexico, with its government bonds rebounding about 2.3% in December. |
| • | | The turn of the year to 2019 roughly marked the bottom of the EM fixed income sell-off. In the first quarter of 2019, the Index outperformed, led by higher-risk countries such as Argentina, Ecuador, Venezuela, Iraq, and Angola. Hedged local bonds and EM currencies lagged hard currency but had respectable positive returns. The rally was driven by global macro and emerging market factors. The Federal Reserve’s (Fed’s) and European Central Bank’s shift to a more accommodative stance was augmented by increased China stimulus, more positive news regarding Argentina’s external accounts and International Monetary Fund (IMF) program, and optimism that pension reform in Brazil may be passed in the third quarter of 2019. |
| • | | Each emerging market debtsub-sector posted positive returns in the second quarter of 2019. The sector continued to benefit from investors’ search for yield amid expectations for Fed rate cuts and ongoing, below-trend growth in most developed markets. The prospects for a global recession in the near to medium term also remained faint given the relatively healthy growth in the US and expectations for additional stimulus from China. The prospect for avoiding a full-blownUS-China trade war is key for EM as further slowing in global trade and EM growth would pose a headwind regardless of policy |
| | |
| 10 | | Visit our website at pgiminvestments.com |
| | accommodation from central banks in developed markets. In EM sovereigns, the performance by country reflected the US Treasury rally and country-specific developments. Some higher-rated, more US Treasury-sensitive government bonds outperformed, including Qatar, Russia, and Romania, all returning over 6% and tightening between20-30 bps. The other outperformers were those with positive developments, including Ukraine, Mozambique, and Tunisia. |
| • | | Despite the various headwinds facing EM debt, the sector put forth a resilient performance in the third quarter of 2019. The lack of Argentina-related and Venezuela-related contagion in the quarter reflected the diversity in EM economies, particularly those with high yield ratings, as well as instances of prudent policy planning. For example, Ukraine should benefit from land reform that may be passed as early as the fourth quarter of 2019, while Turkey should continue to stabilize as the country’s external vulnerability diminishes. With PGIM Fixed Income’s expectation that global developed-market rates are likely to remain low, higher-quality credits will likely find support given their relatively strong balance sheets and investors’ demand for duration. (Duration is a measure of the interest-rate sensitivity of a bond portfolio or debt securities that is expressed as a number of years.) EM debt flows generally appear balanced as investors have avoided growth-sensitive assets with modest positioning (excluding Argentina) across the sector. That said, the total return in hard currency sovereigns continues to draw attention, and recent spreads of 337 bps generally remain attractive relative to the 2018 spread tights of 260 bps and to most US high yield spreads. On the supply side, financing needs for EM sovereigns and corporates are very low in the fourth quarter of 2019, with net financing needs close to zero. |
| • | | October 2019 was a positive month for EM assets with EM hard currency, hedged local rates, and EMFX all outperforming. Hard currency outperformers were higher-beta assets, as investors felt more comfortable taking on risk based on signs of progress inUS-China trade talks. Specifically, the top performers included Tunisia, Ukraine, and Kenya. Tunisia outperformed following the election of outsider candidate Kais Saied, who ran on an anti-corruption platform. The bottom performers were Lebanon, Venezuela, and Ecuador. Lebanon underperformed after Prime Minister Saad Hariri stepped down following two weeks of anti-government protests that descended into violence. Venezuela’s underperformance can be attributed to sanctions and the uncertain timeframe of a potential transition in government leadership. Ecuador underperformed after the government had to reverse a reduction in fuel subsidies after protests. |
What worked?
| • | | Security selection and currency positioning added to the Fund’s performance over the reporting period. |
| • | | Although overall country selection was negative, overweight positions in Greece, Ukraine, Indonesia, and Poland added to performance. |
| | | | |
| PGIM Emerging Markets Debt Hard Currency Fund | | | 11 | |
Strategy and Performance Overview(continued)
| • | | Strong security selection was highlighted by positioning in Romania, Saudi Arabia, China, and Hungary. |
| • | | Within foreign currencies, an underweight to the Chilean peso and overweights to the Indian rupee and Russian ruble were positive. |
What didn’t work?
| • | | Overall country selection was the largest detractor from the Fund’s performance over the period, highlighted by an overweight to Argentina. An overweight to Venezuela was also negative. |
| • | | Security selection within El Salvador, Jamaica, and Venezuela detracted from returns over the period. |
| • | | Within foreign currencies, underweights to the South African rand, Chinese yuan, and South Korean won all hurt performance. |
Did the Fund use derivatives?
Currency positioning in the Fund was partially facilitated by the use of currency forward and option contracts. During the reporting period, the Fund’s currency positioning added to relative performance.
Current outlook
| • | | Amid a somewhat gloomy outlook conveyed at the recent IMF meetings, PGIM Fixed Income feels that EM assets will continue to benefit from an accommodating monetary stance from global central banks. Moreover, PGIM Fixed Income thinks the IMF is perhaps looking through a rearview mirror. There’s consensus that hard currency bonds and local rates will continue to do well, while the outlook for EM currencies is not as clear. A trade truce between China and the US and some clarity on Brexit will further lift sentiment for EM countries. While these countries continue to face headwinds from geopolitics, trade, and populism, digging deep into country-specific issues will likely remain key to alpha generation. |
| • | | As of the end of the reporting period, the Fund featured overweights to Ukraine, Brazil, Argentina, and Indonesia, while holding underweight positions in United Arab Emirates, Chile, and Poland. Looking at foreign exchange (FX) positioning, the Fund holds long positions in the Singapore dollar, Russian ruble, and Thai baht, and is short in the euro, Taiwan dollar, and Indonesian rupiah. |
| | |
| 12 | | Visit our website at pgiminvestments.com |
Fees and Expenses(unaudited)
As a shareholder of the Fund, you incur two types of costs: (1) transaction costs, including sales charges (loads) on purchase payments and redemptions, as applicable, and (2) ongoing costs, including management fees, distribution, and/or service (12b-1) fees, and other Fund expenses, as applicable. This example is intended to help you understand your ongoing costs (in dollars) of investing in the Fund and to compare these costs with the ongoing costs of investing in other mutual funds.
The example is based on an investment of $1,000 held through the six-month period ended October 31, 2019. The example is for illustrative purposes only; you should consult the Prospectus for information on initial and subsequent minimum investment requirements.
Actual Expenses
The first line for each share class in the table on the following page provides information about actual account values and actual expenses. You may use the information on this line, together with the amount you invested, to estimate the expenses that you paid over the period. Simply divide your account value by $1,000 (for example, an $8,600 account value ÷ $1,000 = 8.6), then multiply the result by the number on the first line under the heading “Expenses Paid During the Six-Month Period” to estimate the expenses you paid on your account during this period.
Hypothetical Example for Comparison Purposes
The second line for each share class in the table on the following page provides information about hypothetical account values and hypothetical expenses based on the Fund’s actual expense ratio and an assumed rate of return of 5% per year before expenses, which is not the Fund’s actual return. The hypothetical account values and expenses may not be used to estimate the actual ending account balance or expenses you paid for the period. You may use this information to compare the ongoing costs of investing in the Fund and other funds. To do so, compare this 5% hypothetical example with the 5% hypothetical examples that appear in the shareholder reports of the other funds.
The Fund’s transfer agent may charge additional fees to holders of certain accounts that are not included in the expenses shown in the table on the following page. These fees apply to individual retirement accounts (IRAs) and Section 403(b) accounts. As of the close of the six-month period covered by the table, IRA fees included an annual maintenance fee of $15 per account (subject to a maximum annual maintenance fee of $25 for all accounts held by the same shareholder). Section 403(b) accounts are charged an annual $25 fiduciary maintenance fee. Some of the fees may vary in amount, or may be waived, based on your total account balance or the number of PGIM funds, including the Fund, that you own. You should consider the additional fees that were charged to your Fund account over the six-month period when you estimate the total ongoing expenses paid over the period
| | | | |
| PGIM Emerging Markets Debt Hard Currency Fund | | | 13 | |
Fees and Expenses(continued)
and the impact of these fees on your ending account value, as these additional expenses are not reflected in the information provided in the expense table. Additional fees have the effect of reducing investment returns.
Please note that the expenses shown in the table are meant to highlight your ongoing costs only and do not reflect any transactional costs such as sales charges (loads). Therefore, the second line for each share class in the table is useful in comparing ongoing costs only and will not help you determine the relative total costs of owning different funds. In addition, if these transactional costs were included, your costs would have been higher.
| | | | | | | | | | | | | | | | | | |
| | | | |
PGIM Emerging
Markets Debt Hard
Currency Fund | | Beginning Account
Value
May 1, 2019 | | | Ending Account
Value
October 31, 2019 | | | Annualized
Expense Ratio
Based on the
Six-Month Period | | | Expenses Paid
During the
Six-Month Period* | |
| Class A | | Actual | | $ | 1,000.00 | | | $ | 1,048.30 | | | | 1.05 | % | | $ | 5.42 | |
| | Hypothetical | | $ | 1,000.00 | | | $ | 1,019.91 | | | | 1.05 | % | | $ | 5.35 | |
| Class C | | Actual | | $ | 1,000.00 | | | $ | 1,044.40 | | | | 1.80 | % | | $ | 9.28 | |
| | Hypothetical | | $ | 1,000.00 | | | $ | 1,016.13 | | | | 1.80 | % | | $ | 9.15 | |
| Class Z | | Actual | | $ | 1,000.00 | | | $ | 1,049.50 | | | | 0.80 | % | | $ | 4.13 | |
| | Hypothetical | | $ | 1,000.00 | | | $ | 1,021.17 | | | | 0.80 | % | | $ | 4.08 | |
| Class R6 | | Actual | | $ | 1,000.00 | | | $ | 1,049.80 | | | | 0.74 | % | | $ | 3.82 | |
| | | Hypothetical | | $ | 1,000.00 | | | $ | 1,021.48 | | | | 0.74 | % | | $ | 3.77 | |
*Fund expenses (net of fee waivers or subsidies, if any) for each share class are equal to the annualized expense ratio for each share class (provided in the table), multiplied by the average account value over the period, multiplied by the 184 days in the six-month period ended October 31, 2019, and divided by the 365 days in the Fund’s fiscal year ended October 31, 2019 (to reflect the six-month period). Expenses presented in the table include the expenses of any underlying portfolios in which the Fund may invest.
| | |
| 14 | | Visit our website at pgiminvestments.com |
Schedule of Investments
as of October 31, 2019
| | | | | | | | | | | | | | | | |
| | | | |
| Description | | Interest
Rate | | | Maturity
Date | | | Principal
Amount (000)# | | | Value | |
| | | | |
LONG-TERM INVESTMENTS 95.5% | | | | | | | | | | | | | | | | |
| | | | |
CORPORATE BONDS 23.2% | | | | | | | | | | | | | | | | |
| | | | |
Argentina 0.4% | | | | | | | | | | | | | | | | |
YPF SA,
Sr. Unsec’d. Notes | | | 8.500 | % | | | 07/28/25 | | | | 155 | | | $ | 122,760 | |
| | | | |
Azerbaijan 0.7% | | | | | | | | | | | | | | | | |
State Oil Co. of the Azerbaijan Republic,
Sr. Unsec’d. Notes | | | 6.950 | | | | 03/18/30 | | | | 200 | | | | 240,000 | |
| | | | |
Brazil 1.0% | | | | | | | | | | | | | | | | |
Petrobras Global Finance BV, | | | | | | | | | | | | | | | | |
Gtd. Notes | | | 5.999 | | | | 01/27/28 | | | | 95 | | | | 107,071 | |
Gtd. Notes | | | 6.900 | | | | 03/19/49 | | | | 20 | | | | 23,246 | |
Gtd. Notes | | | 7.375 | | | | 01/17/27 | | | | 18 | | | | 21,798 | |
Gtd. Notes | | | 8.750 | | | | 05/23/26 | | | | 87 | | | | 111,360 | |
Gtd. Notes, 144A | | | 5.093 | | | | 01/15/30 | | | | 67 | | | | 71,053 | |
| | | | | | | | | | | | | | | | |
| | | | | | | | | | | | | | | 334,528 | |
| | | | |
Chile 0.7% | | | | | | | | | | | | | | | | |
Corp Nacional del Cobre de Chile,
Sr. Unsec’d. Notes, 144A | | | 4.875 | | | | 11/04/44 | | | | 200 | | | | 234,235 | |
| | | | |
China 2.7% | | | | | | | | | | | | | | | | |
CNAC HK Finbridge Co. Ltd.,
Gtd. Notes | | | 4.875 | | | | 03/14/25 | | | | 240 | | | | 260,459 | |
Country Garden Holdings Co. Ltd.,
Sr. Sec’d. Notes | | | 8.000 | | | | 01/27/24 | | | | 200 | | | | 218,704 | |
Sinochem Overseas Capital Co. Ltd.,
Gtd. Notes | | | 6.300 | | | | 11/12/40 | | | | 130 | | | | 179,565 | |
Sinopec Group Overseas Development 2018 Ltd.,
Gtd. Notes, 144A | | | 3.680 | | | | 08/08/49 | | | | 200 | | | | 208,097 | |
| | | | | | | | | | | | | | | | |
| | | | | | | | | | | | | | | 866,825 | |
| | | | |
India 0.6% | | | | | | | | | | | | | | | | |
HPCL-Mittal Energy Ltd.,
Sr. Unsec’d. Notes | | | 5.250 | | | | 04/28/27 | | | | 200 | | | | 198,564 | |
| | | | |
Indonesia 2.9% | | | | | | | | | | | | | | | | |
Indonesia Asahan Aluminium Persero PT,
Sr. Unsec’d. Notes | | | 6.530 | | | | 11/15/28 | | | | 200 | | | | 241,867 | |
See Notes to Financial Statements.
| | | | |
| PGIM Emerging Markets Debt Hard Currency Fund | | | 15 | |
Schedule of Investments(continued)
as of October 31, 2019
| | | | | | | | | | | | | | | | |
| | | | |
| Description | | Interest
Rate | | | Maturity
Date | | | Principal
Amount (000)# | | | Value | |
| | | | |
CORPORATE BONDS (Continued) | | | | | | | | | | | | | | | | |
| | | | |
Indonesia (cont’d.) | | | | | | | | | | | | | | | | |
Pelabuhan Indonesia III Persero PT,
Sr. Unsec’d. Notes | | | 4.875 | % | | | 10/01/24 | | | | 200 | | | $ | 216,602 | |
Pertamina Persero PT,
Sr. Unsec’d. Notes | | | 6.000 | | | | 05/03/42 | | | | 200 | | | | 239,932 | |
Saka Energi Indonesia PT,
Sr. Unsec’d. Notes | | | 4.450 | | | | 05/05/24 | | | | 250 | | | | 252,510 | |
| | | | | | | | | | | | | | | | |
| | | | | | | | | | | | | | | 950,911 | |
| | | | |
Kazakhstan 0.7% | | | | | | | | | | | | | | | | |
KazMunayGas National Co. JSC,
Sr. Unsec’d. Notes | | | 5.375 | | | | 04/24/30 | | | | 200 | | | | 230,004 | |
| | | | |
Malaysia 1.0% | | | | | | | | | | | | | | | | |
Petroliam Nasional Bhd,
Sr. Unsec’d. Notes | | | 7.625 | | | | 10/15/26 | | | | 250 | | | | 328,291 | |
| | | | |
Mexico 5.1% | | | | | | | | | | | | | | | | |
Nemak SAB de CV,
Sr. Unsec’d. Notes | | | 4.750 | | | | 01/23/25 | | | | 200 | | | | 206,500 | |
Orbia Advance Corp. SAB de CV,
Gtd. Notes | | | 5.500 | | | | 01/15/48 | | | | 200 | | | | 202,800 | |
Petroleos Mexicanos, | | | | | | | | | | | | | | | | |
Gtd. Notes | | | 6.350 | | | | 02/12/48 | | | | 50 | | | | 47,813 | |
Gtd. Notes | | | 6.500 | | | | 03/13/27 | | | | 275 | | | | 291,500 | |
Gtd. Notes | | | 6.500 | | | | 01/23/29 | | | | 65 | | | | 67,795 | |
Gtd. Notes | | | 6.500 | | | | 06/02/41 | | | | 435 | | | | 432,716 | |
Gtd. Notes, 144A | | | 6.490 | | | | 01/23/27 | | | | 20 | | | | 21,350 | |
Gtd. Notes, 144A | | | 6.840 | | | | 01/23/30 | | | | 143 | | | | 152,710 | |
Gtd. Notes, 144A | | | 7.690 | | | | 01/23/50 | | | | 75 | | | | 81,780 | |
Gtd. Notes, MTN | | | 6.875 | | | | 08/04/26 | | | | 140 | �� | | | 153,160 | |
| | | | | | | | | | | | | | | | |
| | | | | | | | | | | | | | | 1,658,124 | |
| | | | |
Russia 2.3% | | | | | | | | | | | | | | | | |
Gazprom OAO Via Gaz Capital SA, | | | | | | | | | | | | | | | | |
Sr. Unsec’d. Notes, EMTN | | | 7.288 | | | | 08/16/37 | | | | 100 | | | | 135,010 | |
Sr. Unsec’d. Notes, MTN | | | 8.625 | | | | 04/28/34 | | | | 255 | | | | 365,185 | |
Vnesheconombank Via VEB Finance PLC,
Sr. Unsec’d. Notes | | | 5.942 | | | | 11/21/23 | | | | 205 | | | | 225,359 | |
| | | | | | | | | | | | | | | | |
| | | | | | | | | | | | | | | 725,554 | |
See Notes to Financial Statements.
| | | | | | | | | | | | | | | | | | | | |
| | | | |
| Description | | Interest
Rate | | | Maturity
Date | | | Principal
Amount (000)# | | | Value | |
| | | | | |
CORPORATE BONDS (Continued) | | | | | | | | | | | | | | | | | | | | |
| | | | | |
Saudi Arabia 0.7% | | | | | | | | | | | | | | | | | | | | |
Saudi Arabian Oil Co.,
Sr. Unsec’d. Notes, MTN | | | 4.250 | % | | | 04/16/39 | | | | | | | | 200 | | | $ | 214,378 | |
| | | | | |
South Africa 2.0% | | | | | | | | | | | | | | | | | | | | |
Eskom Holdings SOC Ltd., | | | | | | | | | | | | | | | | | | | | |
Sr. Unsec’d. Notes | | | 7.125 | | | | 02/11/25 | | | | | | | | 200 | | | | 205,572 | |
Sr. Unsec’d. Notes, EMTN | | | 6.750 | | | | 08/06/23 | | | | | | | | 200 | | | | 205,164 | |
Sr. Unsec’d. Notes, MTN | | | 8.450 | | | | 08/10/28 | | | | | | | | 200 | | | | 218,817 | |
| | | | | | | | | | | | | | | | | | | | |
| | | | | | | | | | | | | | | | | | | 629,553 | |
| | | | | |
Trinidad & Tobago 0.3% | | | | | | | | | | | | | | | | | | | | |
Trinidad Petroleum Holdings Ltd.,
Sr. Sec’d. Notes, 144A | | | 9.750 | | | | 06/15/26 | | | | | | | | 91 | | | | 102,557 | |
| | | | | |
Tunisia 0.8% | | | | | | | | | | | | | | | | | | | | |
Banque Centrale de Tunisie International Bond, | | | | | | | | | | | | | | | | | | | | |
Sr. Unsec’d. Notes | | | 5.625 | | | | 02/17/24 | | | | EUR | | | | 140 | | | | 152,579 | |
Sr. Unsec’d. Notes | | | 6.750 | | | | 10/31/23 | | | | EUR | | | | 100 | | | | 112,411 | |
| | | | | | | | | | | | | | | | | | | | |
| | | | | | | | | | | | | | | | | | | 264,990 | |
| | | | | |
Ukraine 0.4% | | | | | | | | | | | | | | | | | | | | |
NAK Naftogaz Ukraine via Kondor Finance PLC,
Sr. Unsec’d. Notes | | | 7.125 | | | | 07/19/24 | | | | EUR | | | | 100 | | | | 116,585 | |
| | | | | |
United States 0.7% | | | | | | | | | | | | | | | | | | | | |
JBS Investments II GmbH,
Gtd. Notes, 144A | | | 5.750 | | | | 01/15/28 | | | | | | | | 200 | | | | 208,400 | |
| | | | | |
Venezuela 0.2% | | | | | | | | | | | | | | | | | | | | |
Petroleos de Venezuela SA, | | | | | | | | | | | | | | | | | | | | |
First Lien | | | 8.500 | | | | 10/27/20 | | | | | | | | 205 | | | | 57,400 | |
Sr. Unsec’d. Notes | | | 5.375 | | | | 04/12/27 | (d) | | | | | | | 205 | | | | 12,300 | |
Sr. Unsec’d. Notes | | | 6.000 | | | | 05/16/24 | (d) | | | | | | | 45 | | | | 2,700 | |
Sr. Unsec’d. Notes | | | 6.000 | | | | 11/15/26 | (d) | | | | | | | 65 | | | | 3,900 | |
| | | | | | | | | | | | | | | | | | | | |
| | | | | | | | | | | | | | | | | | | 76,300 | |
| | | | | | | | | | | | | | | | | | | | |
TOTAL CORPORATE BONDS
(cost $7,474,522) | | | | | | | | | | | | | | | | | | | 7,502,559 | |
| | | | | | | | | | | | | | | | | | | | |
See Notes to Financial Statements.
| | | | |
| PGIM Emerging Markets Debt Hard Currency Fund | | | 17 | |
Schedule of Investments(continued)
as of October 31, 2019
| | | | | | | | | | | | | | | | | | | | |
| | | | |
| Description | | Interest
Rate | | | Maturity
Date | | | Principal
Amount (000)# | | | Value | |
| | | | | |
SOVEREIGN BONDS 72.3% | | | | | | | | | | | | | | | | | | | | |
| | | | | |
Angola 1.3% | | | | | | | | | | | | | | | | | | | | |
Angolan Government International Bond, | | | | | | | | | | | | | | | | | | | | |
Sr. Unsec’d. Notes | | | 9.500 | % | | | 11/12/25 | | | | | | | | 200 | | | $ | 224,988 | |
Sr. Unsec’d. Notes, 144A | | | 9.375 | | | | 05/08/48 | | | | | | | | 200 | | | | 211,290 | |
| | | | | | | | | | | | | | | | | | | | |
| | | | | | | | | | | | | | | | | | | 436,278 | |
| | | | | |
Argentina 2.5% | | | | | | | | | | | | | | | | | | | | |
Argentine Republic Government International Bond, | | | | | | | | | | | | | | | | | | | | |
Sr. Unsec’d. Notes | | | 3.375 | | | | 01/15/23 | | | | EUR | | | | 200 | | | | 84,317 | |
Sr. Unsec’d. Notes | | | 3.380 | (cc) | | | 12/31/38 | | | | EUR | | | | 70 | | | | 30,448 | |
Sr. Unsec’d. Notes | | | 3.750 | (cc) | | | 12/31/38 | | | | | | | | 110 | | | | 44,001 | |
Sr. Unsec’d. Notes | | | 4.625 | | | | 01/11/23 | | | | | | | | 40 | | | | 16,040 | |
Sr. Unsec’d. Notes | | | 5.625 | | | | 01/26/22 | | | | | | | | 80 | | | | 33,921 | |
Sr. Unsec’d. Notes | | | 6.875 | | | | 04/22/21 | | | | | | | | 150 | | | | 67,502 | |
Sr. Unsec’d. Notes | | | 6.875 | | | | 01/11/48 | | | | | | | | 30 | | | | 11,625 | |
Sr. Unsec’d. Notes | | | 7.500 | | | | 04/22/26 | | | | | | | | 240 | | | | 101,402 | |
Sr. Unsec’d. Notes | | | 7.820 | | | | 12/31/33 | | | | EUR | | | | 138 | | | | 72,902 | |
Sr. Unsec’d. Notes | | | 7.820 | | | | 12/31/33 | | | | EUR | | | | 179 | | | | 93,595 | |
Sr. Unsec’d. Notes | | | 8.280 | | | | 12/31/33 | | | | | | | | 210 | | | | 107,258 | |
Sr. Unsec’d. Notes | | | 8.280 | | | | 12/31/33 | | | | | | | | 42 | | | | 21,031 | |
Provincia de Buenos Aires, | | | | | | | | | | | | | | | | | | | | |
Sr. Unsec’d. Notes | | | 5.375 | | | | 01/20/23 | | | | EUR | | | | 100 | | | | 36,693 | |
Sr. Unsec’d. Notes, 144A | | | 9.125 | | | | 03/16/24 | | | | | | | | 245 | | | | 83,912 | |
| | | | | | | | | | | | | | | | | | | | |
| | | | | | | | | | | | | | | | | | | 804,647 | |
| | | | | |
Bahrain 2.8% | | | | | | | | | | | | | | | | | | | | |
Bahrain Government International Bond, | | | | | | | | | | | | | | | | | | | | |
Sr. Unsec’d. Notes | | | 6.750 | | | | 09/20/29 | | | | | | | | 200 | | | | 228,000 | |
Sr. Unsec’d. Notes | | | 7.000 | | | | 01/26/26 | | | | | | | | 400 | | | | 457,345 | |
Sr. Unsec’d. Notes | | | 7.500 | | | | 09/20/47 | | | | | | | | 200 | | | | 234,000 | |
| | | | | | | | | | | | | | | | | | | | |
| | | | | | | | | | | | | | | | | | | 919,345 | |
| | | | | |
Belarus 0.7% | | | | | | | | | | | | | | | | | | | | |
Republic of Belarus International Bond,
Sr. Unsec’d. Notes | | | 6.875 | | | | 02/28/23 | | | | | | | | 200 | | | | 214,900 | |
| | | | | |
Brazil 3.2% | | | | | | | �� | | | | | | | | | | | | | |
Brazil Minas SPE via State of Minas Gerais,
Gov’t. Gtd. Notes | | | 5.333 | | | | 02/15/28 | | | | | | | | 437 | | | | 463,786 | |
Brazilian Government International Bond, | | | | | | | | | | | | | | | | | | | | |
Sr. Unsec’d. Notes | | | 5.625 | | | | 01/07/41 | | | | | | | | 120 | | | | 134,551 | |
See Notes to Financial Statements.
| | | | | | | | | | | | | | | | | | | | |
| | | | |
| Description | | Interest
Rate | | | Maturity
Date | | | Principal
Amount (000)# | | | Value | |
| | | | | |
SOVEREIGN BONDS (Continued) | | | | | | | | | | | | | | | | | | | | |
| | | | | |
Brazil (cont’d.) | | | | | | | | | | | | | | | | | | | | |
Brazilian Government International Bond, (cont’d.) | | | | | | | | | | | | | | | | | | | | |
Sr. Unsec’d. Notes | | | 7.125 | % | | | 01/20/37 | | | | | | | | 120 | | | $ | 154,051 | |
Sr. Unsec’d. Notes | | | 8.250 | | | | 01/20/34 | | | | | | | | 205 | | | | 283,415 | |
| | | | | | | | | | | | | | | | | | | | |
| | | | | | | | | | | | | | | | | | | 1,035,803 | |
| | | | | |
Colombia 1.7% | | | | | | | | | | | | | | | | | | | | |
Colombia Government International Bond, | | | | | | | | | | | | | | | | | | | | |
Sr. Unsec’d. Notes | | | 6.125 | | | | 01/18/41 | | | | | | | | 135 | | | | 174,825 | |
Sr. Unsec’d. Notes | | | 7.375 | | | | 09/18/37 | | | | | | | | 275 | | | | 389,815 | |
| | | | | | | | | | | | | | | | | | | | |
| | | | | | | | | | | | | | | | | | | 564,640 | |
| | | | | |
Congo (Republic) 0.2% | | | | | | | | | | | | | | | | | | | | |
Congolese International Bond,
Sr. Unsec’d. Notes | | | 6.000 | | | | 06/30/29 | | | | | | | | 84 | | | | 72,300 | |
| | | | | |
Costa Rica 1.2% | | | | | | | | | | | | | | | | | | | | |
Costa Rica Government International Bond, | | | | | | | | | | | | | | | | | | | | |
Sr. Unsec’d. Notes | | | 4.375 | | | | 04/30/25 | | | | | | | | 200 | | | | 191,502 | |
Sr. Unsec’d. Notes | | | 7.158 | | | | 03/12/45 | | | | | | | | 200 | | | | 199,002 | |
| | | | | | | | | | | | | | | | | | | | |
| | | | | | | | | | | | | | | | | | | 390,504 | |
| | | | | |
Dominican Republic 2.6% | | | | | | | | | | | | | | | | | | | | |
Dominican Republic International Bond, | | | | | | | | | | | | | | | | | | | | |
Sr. Unsec’d. Notes | | | 5.875 | | | | 04/18/24 | | | | | | | | 305 | | | | 325,209 | |
Sr. Unsec’d. Notes | | | 7.450 | | | | 04/30/44 | | | | | | | | 440 | | | | 526,905 | |
| | | | | | | | | | | | | | | | | | | | |
| | | | | | | | | | | | | | | | | | | 852,114 | |
| | | | | |
Ecuador 2.7% | | | | | | | | | | | | | | | | | | | | |
Ecuador Government International Bond, | | | | | | | | | | | | | | | | | | | | |
Sr. Unsec’d. Notes | | | 8.750 | | | | 06/02/23 | | | | | | | | 400 | | | | 404,504 | |
Sr. Unsec’d. Notes | | | 8.875 | | | | 10/23/27 | | | | | | | | 500 | | | | 465,750 | |
| | | | | | | | | | | | | | | | | | | | |
| | | | | | | | | | | | | | | | | | | 870,254 | |
| | | | | |
Egypt 2.9% | | | | | | | | | | | | | | | | | | | | |
Egypt Government International Bond, | | | | | | | | | | | | | | | | | | | | |
Sr. Unsec’d. Notes, 144A, MTN | | | 6.375 | | | | 04/11/31 | | | | EUR | | | | 200 | | | | 231,704 | |
Sr. Unsec’d. Notes, EMTN | | | 4.750 | | | | 04/16/26 | | | | EUR | | | | 200 | | | | 228,480 | |
See Notes to Financial Statements.
| | | | |
| PGIM Emerging Markets Debt Hard Currency Fund | | | 19 | |
Schedule of Investments(continued)
as of October 31, 2019
| | | | | | | | | | | | | | | | | | | | |
| | | | |
| Description | | Interest
Rate | | | Maturity
Date | | | Principal
Amount (000)# | | | Value | |
| | | | | |
SOVEREIGN BONDS (Continued) | | | | | | | | | | | | | | | | | | | | |
| | | | | |
Egypt (cont’d.) | | | | | | | | | | | | | | | | | | | | |
Egypt Government International Bond, (cont’d.) | | | | | | | | | | | | | | | | | | | | |
Sr. Unsec’d. Notes, MTN | | | 7.500 | % | | | 01/31/27 | | | | | | | | 200 | | | $ | 216,758 | |
Sr. Unsec’d. Notes, MTN | | | 8.500 | | | | 01/31/47 | | | | | | | | 250 | | | | 262,812 | |
| | | | | | | | | | | | | | | | | | | | |
| | | | | | | | | | | | | | | | | | | 939,754 | |
| | | | | |
El Salvador 1.6% | | | | | | | | | | | | | | | | | | | �� | |
El Salvador Government International Bond, | | | | | | | | | | | | | | | | | | | | |
Sr. Unsec’d. Notes | | | 6.375 | | | | 01/18/27 | | | | | | | | 175 | | | | 183,314 | |
Sr. Unsec’d. Notes | | | 7.750 | | | | 01/24/23 | | | | | | | | 250 | | | | 273,128 | |
Sr. Unsec’d. Notes | | | 8.250 | | | | 04/10/32 | | | | | | | | 45 | | | | 51,863 | |
| | | | | | | | | | | | | | | | | | | | |
| | | | | | | | | | | | | | | | | | | 508,305 | |
| | | | | |
Gabon 0.6% | | | | | | | | | | | | | | | | | | | | |
Gabon Government International Bond,
Bonds | | | 6.375 | | | | 12/12/24 | | | | | | | | 200 | | | | 198,940 | |
| | | | | |
Ghana 1.4% | | | | | | | | | | | | | | | | | | | | |
Ghana Government International Bond, | | | | | | | | | | | | | | | | | | | | |
Bank Gtd. Notes | | | 10.750 | | | | 10/14/30 | | | | | | | | 200 | | | | 252,133 | |
Sr. Unsec’d. Notes, 144A | | | 7.875 | | | | 03/26/27 | | | | | | | | 200 | | | | 207,574 | |
| | | | | | | | | | | | | | | | | | | | |
| | | | | | | | | | | | | | | | | | | 459,707 | |
| | | | | |
Greece 0.9% | | | | | | | | | | | | | | | | | | | | |
Hellenic Republic Government Bond,
Bonds | | | 3.000 | (cc) | | | 02/24/37 | | | | EUR | | | | 200 | | | | 284,396 | |
| | | | | |
Honduras 0.7% | | | | | | | | | | | | | | | | | | | | |
Honduras Government International Bond,
Sr. Unsec’d. Notes | | | 7.500 | | | | 03/15/24 | | | | | | | | 200 | | | | 220,002 | |
| | | | | |
Hungary 0.6% | | | | | | | | | | | | | | | | | | | | |
Hungary Government International Bond,
Sr. Unsec’d. Notes | | | 7.625 | | | | 03/29/41 | | | | | | | | 122 | | | | 200,433 | |
| | | | | |
Indonesia 2.7% | | | | | | | | | | | | | | | | | | | | |
Indonesia Government International Bond, | | | | | | | | | | | | | | | | | | | | |
Sr. Unsec’d. Notes | | | 1.450 | | | | 09/18/26 | | | | EUR | | | | 100 | | | | 115,294 | |
Sr. Unsec’d. Notes | | | 7.750 | | | | 01/17/38 | | | | | | | | 160 | | | | 238,414 | |
Sr. Unsec’d. Notes | | | 8.500 | | | | 10/12/35 | | | | | | | | 150 | | | | 234,387 | |
See Notes to Financial Statements.
| | | | | | | | | | | | | | | | | | | | |
| | | | |
| Description | | Interest
Rate | | | Maturity
Date | | | Principal
Amount (000)# | | | Value | |
| | | | | |
SOVEREIGN BONDS (Continued) | | | | | | | | | | | | | | | | | | | | |
| | | | | |
Indonesia (cont’d.) | | | | | | | | | | | | | | | | | | | | |
Indonesia Government International Bond, (cont’d.) | | | | | | | | | | | | | | | | | | | | |
Sr. Unsec’d. Notes, EMTN | | | 3.750 | % | | | 06/14/28 | | | | EUR | | | | 100 | | | $ | 135,286 | |
Sr. Unsec’d. Notes, EMTN | | | 6.750 | | | | 01/15/44 | | | | | | | | 100 | | | | 142,757 | |
| | | | | | | | | | | | | | | | | | | | |
| | | | | | | | | | | | | | | | | | | 866,138 | |
| | | | | |
Iraq 1.4% | | | | | | | | | | | | | | | | | | | | |
Iraq International Bond, | | | | | | | | | | | | | | | | | | | | |
Sr. Unsec’d. Notes | | | 5.800 | | | | 01/15/28 | | | | | | | | 250 | | | | 240,050 | |
Sr. Unsec’d. Notes | | | 6.752 | | | | 03/09/23 | | | | | | | | 200 | | | | 201,484 | |
| | | | | | | | | | | | | | | | | | | | |
| | | | | | | | | | | | | | | | | | | 441,534 | |
| | | | | |
Ivory Coast 1.0% | | | | | | | | | | | | | | | | | | | | |
Ivory Coast Government International Bond, | | | | | | | | | | | | | | | | | | | | |
Sr. Unsec’d. Notes | | | 6.375 | | | | 03/03/28 | | | | | | | | 200 | | | | 206,564 | |
Sr. Unsec’d. Notes | | | 6.625 | | | | 03/22/48 | | | | EUR | | | | 100 | | | | 109,893 | |
| | | | | | | | | | | | | | | | | | | | |
| | | | | | | | | | | | | | | | | | | 316,457 | |
| | | | | |
Jamaica 0.8% | | | | | | | | | | | | | | | | | | | | |
Jamaica Government International Bond,
Sr. Unsec’d. Notes | | | 7.625 | | | | 07/09/25 | | | | | | | | 225 | | | | 265,783 | |
| | | | | |
Jordan 0.7% | | | | | | | | | | | | | | | | | | | | |
Jordan Government International Bond,
Sr. Unsec’d. Notes | | | 7.375 | | | | 10/10/47 | | | | | | | | 200 | | | | 210,570 | |
| | | | | |
Kazakhstan 0.9% | | | | | | | | | | | | | | | | | | | | |
Kazakhstan Government International Bond,
Sr. Unsec’d. Notes, EMTN | | | 6.500 | | | | 07/21/45 | | | | | | | | 200 | | | | 290,000 | |
| | | | | |
Kenya 1.3% | �� | | | | | | | | | | | | | | | | | | | |
Kenya Government International Bond, | | | | | | | | | | | | | | | | | | | | |
Sr. Unsec’d. Notes | | | 6.875 | | | | 06/24/24 | | | | | | | | 200 | | | | 212,203 | |
Sr. Unsec’d. Notes | | | 8.250 | | | | 02/28/48 | | | | | | | | 200 | | | | 209,313 | |
| | | | | | | | | | | | | | | | | | | | |
| | | | | | | | | | | | | | | | | | | 421,516 | |
| | | | | |
Lebanon 1.2% | | | | | | | | | | | | | | | | | | | | |
Lebanon Government International Bond, | | | | | | | | | | | | | | | | | | | | |
Sr. Unsec’d. Notes | | | 6.000 | | | | 01/27/23 | | | | | | | | 102 | | | | 60,180 | |
Sr. Unsec’d. Notes | | | 6.650 | | | | 04/22/24 | | | | | | | | 52 | | | | 29,536 | |
See Notes to Financial Statements.
| | | | |
| PGIM Emerging Markets Debt Hard Currency Fund | | | 21 | |
Schedule of Investments(continued)
as of October 31, 2019
| | | | | | | | | | | | | | | | |
| | | | |
| Description | | Interest
Rate | | | Maturity
Date | | | Principal
Amount (000)# | | | Value | |
| | | | |
SOVEREIGN BONDS (Continued) | | | | | | | | | | | | | | | | |
| | | | |
Lebanon (cont’d.) | | | | | | | | | | | | | | | | |
Lebanon Government International Bond, (cont’d.) | | | | | | | | | | | | | | | | |
Sr. Unsec’d. Notes | | | 6.750 | % | | | 11/29/27 | | | | 20 | | | $ | 11,050 | |
Sr. Unsec’d. Notes, EMTN | | | 6.100 | | | | 10/04/22 | | | | 65 | | | | 38,538 | |
Sr. Unsec’d. Notes, EMTN | | | 6.250 | | | | 05/27/22 | | | | 75 | | | | 44,625 | |
Sr. Unsec’d. Notes, EMTN | | | 6.400 | | | | 05/26/23 | | | | 150 | | | | 88,155 | |
Sr. Unsec’d. Notes, EMTN | | | 6.850 | | | | 05/25/29 | | | | 40 | | | | 22,000 | |
Sr. Unsec’d. Notes, GMTN | | | 6.650 | | | | 02/26/30 | | | | 150 | | | | 82,275 | |
| | | | | | | | | | | | | | | | |
| | | | | | | | | | | | | | | 376,359 | |
| | | | |
Mexico 0.8% | | | | | | | | | | | | | | | | |
Mexico Government International Bond, | | | | | | | | | | | | | | | | |
Sr. Unsec’d. Notes, GMTN | | | 5.750 | | | | 10/12/2110 | | | | 126 | | | | 146,319 | |
Sr. Unsec’d. Notes, MTN | | | 6.050 | | | | 01/11/40 | | | | 92 | | | | 117,416 | |
| | | | | | | | | | | | | | | | |
| | | | | | | | | | | | | | | 263,735 | |
| | | | |
Mongolia 0.6% | | | | | | | | | | | | | | | | |
Mongolia Government International Bond,
Sr. Unsec’d. Notes, EMTN | | | 5.125 | | | | 12/05/22 | | | | 200 | | | | 202,792 | |
| | | | |
Namibia 0.6% | | | | | | | | | | | | | | | | |
Namibia International Bonds,
Sr. Unsec’d. Notes | | | 5.250 | | | | 10/29/25 | | | | 200 | | | | 202,924 | |
| | | | |
Nigeria 2.0% | | | | | | | | | | | | | | | | |
Nigeria Government International Bond, | | | | | | | | | | | | | | | | |
Sr. Unsec’d. Notes | | | 7.625 | | | | 11/21/25 | | | | 200 | | | | 217,742 | |
Sr. Unsec’d. Notes | | | 8.747 | | | | 01/21/31 | | | | 200 | | | | 220,040 | |
Sr. Unsec’d. Notes, 144A | | | 7.696 | | | | 02/23/38 | | | | 200 | | | | 199,984 | |
| | | | | | | | | | | | | | | | |
| | | | | | | | | | | | | | | 637,766 | |
| | | | |
Oman 1.2% | | | | | | | | | | | | | | | | |
Oman Government International Bond, | | | | | | | | | | | | | | | | |
Sr. Unsec’d. Notes | | | 6.500 | | | | 03/08/47 | | | | 225 | | | | 208,125 | |
Sr. Unsec’d. Notes, 144A | | | 6.750 | | | | 01/17/48 | | | | 200 | | | | 187,500 | |
| | | | | | | | | | | | | | | | |
| | | | | | | | | | | | | | | 395,625 | |
| | | | |
Pakistan 1.2% | | | | | | | | | | | | | | | | |
Pakistan Government International Bond,
Sr. Unsec’d. Notes | | | 8.250 | | | | 09/30/25 | | | | 370 | | | | 403,598 | |
See Notes to Financial Statements.
| | | | | | | | | | | | | | | | | | | | |
| | | | |
| Description | | Interest
Rate | | | Maturity
Date | | | Principal
Amount (000)# | | | Value | |
| | | | | |
SOVEREIGN BONDS (Continued) | | | | | | | | | | | | | | | | | | | | |
| | | | | |
Panama 1.5% | | | | | | | | | | | | | | | | | | | | |
Panama Government International Bond, | | | | | | | | | | | | | | | | | | | | |
Sr. Unsec’d. Notes | | | 6.700 | % | | | 01/26/36 | | | | | | | | 220 | | | $ | 309,652 | |
Sr. Unsec’d. Notes | | | 9.375 | | | | 04/01/29 | | | | | | | | 105 | | | | 160,389 | |
| | | | | | | | | | | | | | | | | | | | |
| | | | | | | | | | | | | | | | | | | 470,041 | |
| | | | | |
Papua New Guinea 0.7% | | | | | | | | | | | | | | | | | | | | |
Papua New Guinea Government International Bond,
Sr. Unsec’d. Notes, 144A | | | 8.375 | | | | 10/04/28 | | | | | | | | 200 | | | | 214,500 | |
| | | | | |
Peru 1.7% | | | | | | | | | | | | | | | | | | | | |
Peruvian Government International Bond, | | | | | | | | | | | | | | | | | | | | |
Sr. Unsec’d. Notes | | | 6.550 | | | | 03/14/37 | | | | | | | | 75 | | | | 109,407 | |
Sr. Unsec’d. Notes | | | 8.750 | | | | 11/21/33 | | | | | | | | 265 | | | | 436,921 | |
| | | | | | | | | | | | | | | | | | | | |
| | | | | | | | | | | | | | | | | | | 546,328 | |
| | | | | |
Philippines 1.4% | | | | | | | | | | | | | | | | | | | | |
Philippine Government International Bond, | | | | | | | | | | | | | | | | | | | | |
Sr. Unsec’d. Notes | | | 6.375 | | | | 10/23/34 | | | | | | | | 100 | | | | 140,971 | |
Sr. Unsec’d. Notes | | | 7.750 | | | | 01/14/31 | | | | | | | | 200 | | | | 295,956 | |
| | | | | | | | | | | | | | | | | | | | |
| | | | | | | | | | | | | | | | | | | 436,927 | |
| | | | | |
Qatar 2.4% | | | | | | | | | | | | | | | | | | | | |
Qatar Government International Bond, | | | | | | | | | | | | | | | | | | | | |
Sr. Unsec’d. Notes | | | 5.103 | | | | 04/23/48 | | | | | | | | 400 | | | | 509,840 | |
Sr. Unsec’d. Notes, 144A | | | 4.817 | | | | 03/14/49 | | | | | | | | 205 | | | | 252,113 | |
| | | | | | | | | | | | | | | | | | | | |
| | | | | | | | | | | | | | | | | | | 761,953 | |
| | | | | |
Romania 1.2% | | | | | | | | | | | | | | | | | | | | |
Romanian Government International Bond, | | | | | | | | | | | | | | | | | | | | |
Sr. Unsec’d. Notes | | | 5.125 | | | | 06/15/48 | | | | | | | | 42 | | | | 48,387 | |
Sr. Unsec’d. Notes, 144A | | | 5.125 | | | | 06/15/48 | | | | | | | | 44 | | | | 50,692 | |
Sr. Unsec’d. Notes, 144A, MTN | | | 4.625 | | | | 04/03/49 | | | | EUR | | | | 35 | | | | 50,785 | |
Sr. Unsec’d. Notes, EMTN | | | 4.125 | | | | 03/11/39 | | | | EUR | | | | 75 | | | | 100,804 | |
Sr. Unsec’d. Notes, EMTN | | | 6.125 | | | | 01/22/44 | | | | | | | | 96 | | | | 124,656 | |
| | | | | | | | | | | | | | | | | | | | |
| | | | | | | | | | | | | | | | | | | 375,324 | |
See Notes to Financial Statements.
| | | | |
| PGIM Emerging Markets Debt Hard Currency Fund | | | 23 | |
Schedule of Investments(continued)
as of October 31, 2019
| | | | | | | | | | | | | | | | |
| | | | |
| Description | | Interest
Rate | | | Maturity
Date | | | Principal
Amount (000)# | | | Value | |
| | | | |
SOVEREIGN BONDS (Continued) | | | | | | | | | | | | | | | | |
| | | | |
Russia 1.7% | | | | | | | | | | | | | | | | |
Russian Foreign Bond,
Sr. Unsec’d. Notes | | | 5.625 | % | | | 04/04/42 | | | | 200 | | | $ | 247,014 | |
Russian Foreign Bond - Eurobond,
Sr. Unsec’d. Notes | | | 12.750 | | | | 06/24/28 | | | | 175 | | | | 298,085 | |
| | | | | | | | | | | | | | | | |
| | | | | | | | | | | | | | | 545,099 | |
| | | | |
Saudi Arabia 1.5% | | | | | | | | | | | | | | | | |
Saudi Government International Bond, | | | | | | | | | | | | | | | | |
Sr. Unsec’d. Notes, 144A | | | 5.250 | | | | 01/16/50 | | | | 200 | | | | 246,300 | |
Sr. Unsec’d. Notes, EMTN | | | 5.000 | | | | 04/17/49 | | | | 200 | | | | 237,038 | |
| | | | | | | | | | | | | | | | |
| | | | | | | | | | | | | | | 483,338 | |
| | | | |
Senegal 0.6% | | | | | | | | | | | | | | | | |
Senegal Government International Bond,
Sr. Unsec’d. Notes, 144A | | | 6.750 | | | | 03/13/48 | | | | 205 | | | | 200,941 | |
| | | | |
South Africa 1.4% | | | | | | | | | | | | | | | | |
Republic of South Africa Government International Bond, | | | | | | | | | | | | | | | | |
Sr. Unsec’d. Notes | | | 4.875 | | | | 04/14/26 | | | | 200 | | | | 206,176 | |
Sr. Unsec’d. Notes | | | 6.250 | | | | 03/08/41 | | | | 230 | | | | 247,250 | |
| | | | | | | | | | | | | | | | |
| | | | | | | | | | | | | | | 453,426 | |
| | | | |
Sri Lanka 2.9% | | | | | | | | | | | | | | | | |
Sri Lanka Government International Bond, | | | | | | | | | | | | | | | | |
Sr. Unsec’d. Notes | | | 5.750 | | | | 01/18/22 | | | | 200 | | | | 202,015 | |
Sr. Unsec’d. Notes | | | 6.200 | | | | 05/11/27 | | | | 200 | | | | 192,175 | |
Sr. Unsec’d. Notes | | | 6.850 | | | | 11/03/25 | | | | 550 | | | | 557,656 | |
| | | | | | | | | | | | | | | | |
| | | | | | | | | | | | | | | 951,846 | |
| | | | |
Turkey 4.5% | | | | | | | | | | | | | | | | |
Export Credit Bank of Turkey,
Sr. Unsec’d. Notes | | | 5.375 | | | | 10/24/23 | | | | 200 | | | | 194,000 | |
Turkey Government International Bond, | | | | | | | | | | | | | | | | |
Sr. Unsec’d. Notes | | | 4.250 | | | | 04/14/26 | | | | 200 | | | | 182,230 | |
Sr. Unsec’d. Notes | | | 5.750 | | | | 05/11/47 | | | | 200 | | | | 171,250 | |
Sr. Unsec’d. Notes | | | 6.875 | | | | 03/17/36 | | | | 30 | | | | 29,555 | |
Sr. Unsec’d. Notes | | | 7.250 | | | | 12/23/23 | | | | 200 | | | | 213,000 | |
See Notes to Financial Statements.
| | | | | | | | | | | | | | | | | | | | |
| | | | |
| Description | | Interest
Rate | | | Maturity
Date | | | Principal
Amount (000)# | | | Value | |
| | | | | |
SOVEREIGN BONDS (Continued) | | | | | | | | | | | | | | | | | | | | |
| | | | | |
Turkey (cont’d.) | | | | | | | | | | | | | | | | | | | | |
Turkey Government International Bond, (cont’d.) | | | | | | | | | | | | | | | | | | | | |
Sr. Unsec’d. Notes | | | 7.375 | % | | | 02/05/25 | | | | | | | | 205 | | | $ | 219,862 | |
Sr. Unsec’d. Notes | | | 7.625 | | | | 04/26/29 | | | | | | | | 400 | | | | 429,000 | |
| | | | | | | | | | | | | | | | | | | | |
| | | | | | | | | | | | | | | | | | | 1,438,897 | |
| | | | | |
Ukraine 4.2% | | | | | | | | | | | | | | | | | | | | |
Ukraine Government International Bond, | | | | | | | | | | | | | | | | | | | | |
Sr. Unsec’d. Notes | | | 0.000 | (cc) | | | 05/31/40 | | | | | | | | 51 | | | | 47,877 | |
Sr. Unsec’d. Notes | | | 6.750 | | | | 06/20/26 | | | | EUR | | | | 100 | | | | 123,183 | |
Sr. Unsec’d. Notes | | | 7.750 | | | | 09/01/21 | | | | | | | | 205 | | | | 214,225 | |
Sr. Unsec’d. Notes | | | 7.750 | | | | 09/01/24 | | | | | | | | 135 | | | | 144,619 | |
Sr. Unsec’d. Notes | | | 7.750 | | | | 09/01/25 | | | | | | | | 215 | | | | 230,587 | |
Sr. Unsec’d. Notes | | | 7.750 | | | | 09/01/26 | | | | | | | | 150 | | | | 161,062 | |
Sr. Unsec’d. Notes | | | 9.750 | | | | 11/01/28 | | | | | | | | 200 | | | | 237,756 | |
Ukreximbank Via Biz Finance PLC,
Sr. Unsec’d. Notes | | | 9.750 | | | | 01/22/25 | | | | | | | | 200 | | | | 212,000 | |
| | | | | | | | | | | | | | | | | | | | |
| | | | | | | | | | | | | | | | | | | 1,371,309 | |
| | | | | |
United Arab Emirates 0.7% | | | | | | | | | | | | | | | | | | | | |
Emirate of Dubai Government International Bonds,
Sr. Unsec’d. Notes, EMTN | | | 5.250 | | | | 01/30/43 | | | | | | | | 200 | | | | 229,000 | |
| | | | | |
Uruguay 1.4% | | | | | | | | | | | | | | | | | | | | |
Uruguay Government International Bond, | | | | | | | | | | | | | | | | | | | | |
Sr. Unsec’d. Notes | | | 4.125 | | | | 11/20/45 | | | | | | | | 40 | | | | 42,650 | |
Sr. Unsec’d. Notes | | | 4.975 | | | | 04/20/55 | | | | | | | | 25 | | | | 29,250 | |
Sr. Unsec’d. Notes | | | 5.100 | | | | 06/18/50 | | | | | | | | 85 | | | | 101,788 | |
Sr. Unsec’d. Notes | | | 7.625 | | | | 03/21/36 | | | | | | | | 185 | | | | 273,571 | |
| | | | | | | | | | | | | | | | | | | | |
| | | | | | | | | | | | | | | | | | | 447,259 | |
| | | | | |
Venezuela 0.1% | | | | | | | | | | | | | | | | | | | | |
Venezuela Government International Bond,
Sr. Unsec’d. Notes | | | 12.750 | | | | 08/23/22 | (d) | | | | | | | 180 | | | | 18,675 | |
See Notes to Financial Statements.
| | | | |
| PGIM Emerging Markets Debt Hard Currency Fund | | | 25 | |
Schedule of Investments(continued)
as of October 31, 2019
| | | | | | | | | | | | | | | | |
| | | | |
| Description | | Interest
Rate | | | Maturity
Date | | | Principal
Amount (000)# | | | Value | |
| | | | |
SOVEREIGN BONDS (Continued) | | | | | | | | | | | | | | | | |
| | | | |
Zambia 0.4% | | | | | | | | | | | | | | | | |
Zambia Government International Bond,
Sr. Unsec’d. Notes | | | 8.500 | % | | | 04/14/24 | | | | 200 | | | $ | 140,676 | |
| | | | | | | | | | | | | | | | |
TOTAL SOVEREIGN BONDS
(cost $23,909,487) | | | | | | | | | | | | | | | 23,352,658 | |
| | | | | | | | | | | | | | | | |
TOTAL LONG-TERM INVESTMENTS
(cost $31,384,009) | | | | | | | | | | | | | | | 30,855,217 | |
| | | | | | | | | | | | | | | | |
| | | | |
| | | | | | | | | Shares | | | | |
| | | | |
SHORT-TERM INVESTMENT 3.9% | | | | | | | | | | | | | | | | |
| | | | |
AFFILIATED MUTUAL FUND | | | | | | | | | | | | | | | | |
PGIM Core Ultra Short Bond Fund
(cost $1,254,895)(w) | | | | | | | | | | | 1,254,895 | | | | 1,254,895 | |
| | | | | | | | | | | | | | | | |
| | | | |
TOTAL INVESTMENTS 99.4%
(cost $32,638,904) | | | | | | | | | | | | | | | 32,110,112 | |
| | | | | | | | | | | | | | | | |
Other assets in excess of liabilities(z) 0.6% | | | | | | | | | | | | | | | 187,677 | |
| | | | | | | | | | | | | | | | |
| | | | |
NET ASSETS 100.0% | | | | | | | | | | | | | | $ | 32,297,789 | |
| | | | | | | | | | | | | | | | |
Below is a list of the abbreviation(s) used in the annual report:
BRL—Brazilian Real
CAD—Canadian Dollar
CHF—Swiss Franc
CLP—Chilean Peso
CNH—Chinese Renminbi
COP—Colombian Peso
CZK—Czech Koruna
EGP—Egyptian Pound
EUR—Euro
HUF—Hungarian Forint
IDR—Indonesian Rupiah
ILS—Israeli Shekel
INR—Indian Rupee
JPY—Japanese Yen
KRW—South Korean Won
MXN—Mexican Peso
NZD—New Zealand Dollar
PEN—Peruvian Nuevo Sol
PHP—Philippine Peso
PLN—Polish Zloty
See Notes to Financial Statements.
RUB—Russian Ruble
SGD—Singapore Dollar
THB—Thai Baht
TRY—Turkish Lira
TWD—New Taiwanese Dollar
ZAR—South African Rand
144A—Security was purchased pursuant to Rule 144A under the Securities Act of 1933 and, pursuant to the requirements of Rule 144A, may not be resold except to qualified institutional buyers.
EMTN—Euro Medium Term Note
GMTN—Global Medium Term Note
LIBOR—London Interbank Offered Rate
MTN—Medium Term Note
OTC—Over-the-counter
| # | Principal amount is shown in U.S. dollars unless otherwise stated. |
| (cc) | Variable rate instrument. The rate shown is based on the latest available information as of October 31, 2019. Certain variable rate securities are not based on a published reference rate and spread but are determined by the issuer or agent and are based on current market conditions. These securities do not indicate a reference rate and spread in their description. |
| (d) | Represents issuer in default on interest payments and/or principal repayment.Non-income producing security. Such securities may be post-maturity. |
| (w) | PGIM Investments LLC, the manager of the Series, also serves as manager of the PGIM Core Ultra Short Bond Fund. |
| (z) | Includes net unrealized appreciation/(depreciation) and/or market value of the below holdings which are excluded from the Schedule of Investments: |
Forward foreign currency exchange contracts outstanding at October 31, 2019:
OTC Forward Foreign Currency Exchange Contracts:
| | | | | | | | | | | | | | | | | | | | | | | | | | |
Purchase Contracts | | Counterparty | | Notional
Amount
(000) | | | Value at
Settlement
Date | | | Current
Value | | | Unrealized
Appreciation | | | Unrealized
Depreciation | |
Brazilian Real, | | | | | | | | | | | | | | | | | | | | | | | | | | |
Expiring 11/04/19 | | BNP Paribas S.A. | | | BRL | | | | 184 | | | $ | 46,124 | | | $ | 45,858 | | | $ | — | | | $ | (266 | ) |
Expiring 11/04/19 | | JPMorgan Chase Bank, N.A. | | | BRL | | | | 1,043 | | | | 256,100 | | | | 259,936 | | | | 3,836 | | | | — | |
Chilean Peso, | | | | | | | | | | | | | | | | | | | | | | | | | | |
Expiring 12/18/19 | | BNP Paribas S.A. | | | CLP | | | | 41,780 | | | | 57,600 | | | | 56,405 | | | | — | | | | (1,195 | ) |
Expiring 12/18/19 | | BNP Paribas S.A. | | | CLP | | | | 26,265 | | | | 36,337 | | | | 35,459 | | | | — | | | | (878 | ) |
Expiring 12/18/19 | | BNP Paribas S.A. | | | CLP | | | | 24,243 | | | | 33,650 | | | | 32,730 | | | | — | | | | (920 | ) |
Expiring 12/18/19 | | BNP Paribas S.A. | | | CLP | | | | 23,236 | | | | 32,200 | | | | 31,369 | | | | — | | | | (831 | ) |
Expiring 12/18/19 | | Goldman Sachs International | | | CLP | | | | 53,610 | | | | 75,000 | | | | 72,377 | | | | — | | | | (2,623 | ) |
Expiring 12/18/19 | | JPMorgan Chase Bank, N.A. | | | CLP | | | | 21,140 | | | | 29,313 | | | | 28,540 | | | | — | | | | (773 | ) |
Expiring 12/18/19 | | UBS AG | | | CLP | | | | 47,504 | | | | 65,600 | | | | 64,133 | | | | — | | | | (1,467 | ) |
See Notes to Financial Statements.
| | | | |
| PGIM Emerging Markets Debt Hard Currency Fund 27 | | | 27 | |
Schedule of Investments(continued)
as of October 31, 2019
Forward foreign currency exchange contracts outstanding at October 31, 2019 (continued):
| | | | | | | | | | | | | | | | | | | | | | | | | | |
Purchase Contracts | | Counterparty | | Notional
Amount
(000) | | | Value at
Settlement
Date | | | Current
Value | | | Unrealized
Appreciation | | | Unrealized
Depreciation | |
OTC Forward Foreign Currency Exchange Contracts (cont’d.): | |
Chinese Renminbi, | | | | | | | | | | | | | | | | | | | | | | | | | | |
Expiring 02/14/20 | | BNP Paribas S.A. | | | CNH | | | | 1,603 | | | $ | 225,933 | | | $ | 226,765 | | | $ | 832 | | | $ | — | |
Expiring 05/14/21 | | Citibank, N.A. | | | CNH | | | | 994 | | | | 142,393 | | | | 138,774 | | | | — | | | | (3,619 | ) |
Czech Koruna, | | | | | | | | | | | | | | | | | | | | | | | | | | |
Expiring 01/17/20 | | Morgan Stanley & Co. International PLC | | | CZK | | | | 1,909 | | | | 83,000 | | | | 83,552 | | | | 552 | | | | — | |
Egyptian Pound, | | | | | | | | | | | | | | | | | | | | | | | | | | |
Expiring 11/27/19 | | Citibank, N.A. | | | EGP | | | | 254 | | | | 14,706 | | | | 15,596 | | | | 890 | | | | — | |
Expiring 11/27/19 | | Citibank, N.A. | | | EGP | | | | 165 | | | | 9,574 | | | | 10,150 | | | | 576 | | | | — | |
Expiring 12/23/19 | | Citibank, N.A. | | | EGP | | | | 169 | | | | 10,000 | | | | 10,300 | | | | 300 | | | | — | |
Expiring 12/23/19 | | Morgan Stanley & Co. International PLC | | | EGP | | | | 334 | | | | 19,788 | | | | 20,424 | | | | 636 | | | | — | |
Expiring 12/23/19 | | Morgan Stanley & Co. International PLC | | | EGP | | | | 165 | | | | 9,788 | | | | 10,103 | | | | 315 | | | | — | |
Expiring 01/21/20 | | Citibank, N.A. | | | EGP | | | | 177 | | | | 10,140 | | | | 10,736 | | | | 596 | | | | — | |
Expiring 01/28/20 | | Citibank, N.A. | | | EGP | | | | 456 | | | | 26,814 | | | | 27,576 | | | | 762 | | | | — | |
Expiring 01/28/20 | | Citibank, N.A. | | | EGP | | | | 308 | | | | 17,996 | | | | 18,630 | | | | 634 | | | | — | |
Expiring 01/30/20 | | Citibank, N.A. | | | EGP | | | | 1,236 | | | | 72,777 | | | | 74,824 | | | | 2,047 | | | | — | |
Expiring 01/30/20 | | Citibank, N.A. | | | EGP | | | | 300 | | | | 17,214 | | | | 18,157 | | | | 943 | | | | — | |
Hungarian Forint, | | | | | | | | | | | | | | | | | | | | | | | | | | |
Expiring 01/17/20 | | Citibank, N.A. | | | HUF | | | | 17,665 | | | | 59,000 | | | | 60,228 | | | | 1,228 | | | | — | |
Indian Rupee, | | | | | | | | | | | | | | | | | | | | | | | | | | |
Expiring 12/18/19 | | Citibank, N.A. | | | INR | | | | 9,492 | | | | 130,251 | | | | 132,800 | | | | 2,549 | | | | — | |
Expiring 12/18/19 | | HSBC BANK USA, N.A. | | | INR | | | | 22,351 | | | | 307,626 | | | | 312,689 | | | | 5,063 | | | | — | |
Expiring 12/18/19 | | JPMorgan Chase Bank, N.A. | | | INR | | | | 7,313 | | | | 101,000 | | | | 102,314 | | | | 1,314 | | | | — | |
Indonesian Rupiah, | | | | | | | | | | | | | | | | | | | | | | | | | | |
Expiring 12/18/19 | | HSBC BANK USA, N.A. | | | IDR | | | | 1,481,506 | | | | 105,000 | | | | 104,647 | | | | — | | | | (353 | ) |
See Notes to Financial Statements.
Forward foreign currency exchange contracts outstanding at October 31, 2019 (continued):
| | | | | | | | | | | | | | | | | | | | | | | | | | |
Purchase
Contracts | | Counterparty | | Notional
Amount
(000) | | | Value at
Settlement
Date | | | Current
Value | | | Unrealized
Appreciation | | | Unrealized
Depreciation | |
OTC Forward Foreign Currency Exchange Contracts (cont’d.): | |
Israeli Shekel, | | | | | | | | | | | | | | | | | | | | | | | | | | |
Expiring 12/18/19 | | Bank of America, N.A. | | | ILS | | | | 369 | | | $ | 106,000 | | | $ | 105,087 | | | $ | — | | | $ | (913 | ) |
Expiring 12/18/19 | | Barclays Bank PLC | | | ILS | | | | 294 | | | | 85,000 | | | | 83,761 | | | | — | | | | (1,239 | ) |
Expiring 12/18/19 | | Barclays Bank PLC | | | ILS | | | | 80 | | | | 22,775 | | | | 22,663 | | | | — | | | | (112 | ) |
Expiring 12/18/19 | | Barclays Bank PLC | | | ILS | | | | 48 | | | | 13,625 | | | | 13,541 | | | | — | | | | (84 | ) |
Expiring 12/18/19 | | Citibank, N.A. | | | ILS | | | | 121 | | | | 34,800 | | | | 34,486 | | | | — | | | | (314 | ) |
Expiring 12/18/19 | | JPMorgan Chase Bank, N.A. | | | ILS | | | | 176 | | | | 49,975 | | | | 50,037 | | | | 62 | | | | — | |
Expiring 12/18/19 | | JPMorgan Chase Bank, N.A. | | | ILS | | | | 106 | | | | 30,152 | | | | 30,118 | | | | — | | | | (34 | ) |
Japanese Yen, | | | | | | | | | | | | | | | | | | | | | | | | | | |
Expiring 01/17/20 | | Morgan Stanley & Co. International PLC | | | JPY | | | | 7,541 | | | | 70,048 | | | | 70,202 | | | | 154 | | | | — | |
Mexican Peso, | | | | | | | | | | | | | | | | | | | | | | | | | | |
Expiring 12/18/19 | | JPMorgan Chase Bank, N.A. | | | MXN | | | | 4,707 | | | | 233,258 | | | | 242,864 | | | | 9,606 | | | | — | |
Expiring 12/18/19 | | Morgan Stanley & Co. International PLC | | | MXN | | | | 1,333 | | | | 69,000 | | | | 68,758 | | | | — | | | | (242 | ) |
New Taiwanese Dollar, | | | | | | | | | | | | | | | | | | | | | | | | | | |
Expiring 12/18/19 | | Barclays Bank PLC | | | TWD | | | | 3,242 | | | | 107,000 | | | | 107,051 | | | | 51 | | | | — | |
Expiring 12/18/19 | | JPMorgan Chase Bank, N.A. | | | TWD | | | | 4,843 | | | | 158,160 | | | | 159,891 | | | | 1,731 | | | | — | |
Peruvian Nuevo Sol, | | | | | | | | | | | | | | | | | | | | | | | | | | |
Expiring 12/18/19 | | BNP Paribas S.A. | | | PEN | | | | 782 | | | | 231,297 | | | | 233,388 | | | | 2,091 | | | | — | |
Philippine Peso, | | | | | | | | | | | | | | | | | | | | | | | | | | |
Expiring 12/18/19 | | Credit Suisse International | | | PHP | | | | 5,109 | | | | 100,000 | | | | 100,429 | | | | 429 | | | | — | |
Expiring 12/18/19 | | JPMorgan Chase Bank, N.A. | | | PHP | | | | 4,344 | | | | 83,160 | | | | 85,393 | | | | 2,233 | | | | — | |
Polish Zloty, | | | | | | | | | | | | | | | | | | | | | | | | | | |
Expiring 01/17/20 | | Barclays Bank PLC | | | PLN | | | | 291 | | | | 76,000 | | | | 76,286 | | | | 286 | | | | — | |
Expiring 01/17/20 | | Citibank, N.A. | | | PLN | | | | 261 | | | | 67,000 | | | | 68,276 | | | | 1,276 | | | | — | |
Expiring 01/17/20 | | JPMorgan Chase Bank, N.A. | | | PLN | | | | 251 | | | | 65,000 | | | | 65,605 | | | | 605 | | | | — | |
See Notes to Financial Statements.
| | | | |
| PGIM Emerging Markets Debt Hard Currency Fund | | | 29 | |
Schedule of Investments(continued)
as of October 31, 2019
Forward foreign currency exchange contracts outstanding at October 31, 2019 (continued):
| | | | | | | | | | | | | | | | | | | | | | | | |
Purchase Contracts | | Counterparty | | Notional
Amount
(000) | | | Value at
Settlement
Date | | | Current
Value | | | Unrealized
Appreciation | | | Unrealized
Depreciation | |
OTC Forward Foreign Currency Exchange Contracts (cont’d.): | | | | | |
Russian Ruble, | | | | | | | | | | | | | | | | | | | | | | | | |
Expiring 12/18/19 | | Citibank, N.A. | | RUB | | | 4,662 | | | $ | 72,000 | | | $ | 72,190 | | | $ | 190 | | | $ | — | |
Expiring 12/18/19 | | Credit Suisse International | | RUB | | | 2,528 | | | | 39,186 | | | | 39,141 | | | | — | | | | (45 | ) |
Expiring 12/18/19 | | JPMorgan Chase Bank, N.A. | | RUB | | | 2,427 | | | | 37,500 | | | | 37,582 | | | | 82 | | | | — | |
Expiring 12/18/19 | | Morgan Stanley & Co. International PLC | | RUB | | | 13,579 | | | | 199,832 | | | | 210,262 | | | | 10,430 | | | | — | |
Expiring 12/18/19 | | Morgan Stanley & Co. International PLC | | RUB | | | 12,856 | | | | 190,000 | | | | 199,079 | | | | 9,079 | | | | — | |
Singapore Dollar, | | | | | | | | | | | | | | | | | | | | | | | | |
Expiring 12/18/19 | | Goldman Sachs International | | SGD | | | 314 | | | | 230,800 | | | | 231,036 | | | | 236 | | | | — | |
Expiring 12/18/19 | | JPMorgan Chase Bank, N.A. | | SGD | | | 165 | | | | 121,000 | | | | 121,121 | | | | 121 | | | | — | |
Expiring 12/18/19 | | JPMorgan Chase Bank, N.A. | | SGD | | | 162 | | | | 119,000 | | | | 119,078 | | | | 78 | | | | — | |
Expiring 12/18/19 | | JPMorgan Chase Bank, N.A. | | SGD | | | 120 | | | | 87,000 | | | | 88,520 | | | | 1,520 | | | | — | |
Expiring 12/18/19 | | Morgan Stanley & Co. International PLC | | SGD | | | 205 | | | | 149,000 | | | | 150,746 | | | | 1,746 | | | | — | |
South African Rand, | | | | | | | | | | | | | | | | | | | | | | |
Expiring 12/18/19 | | Barclays Bank PLC | | ZAR | | | 633 | | | | 43,000 | | | | 41,611 | | | | — | | | | (1,389 | ) |
Expiring 12/18/19 | | Barclays Bank PLC | | ZAR | | | 317 | | | | 20,699 | | | | 20,866 | | | | 167 | | | | — | |
Expiring 12/18/19 | | JPMorgan Chase Bank, N.A. | | ZAR | | | 614 | | | | 39,919 | | | | 40,386 | | | | 467 | | | | — | |
Expiring 12/18/19 | | JPMorgan Chase Bank, N.A. | | ZAR | | | 602 | | | | 41,000 | | | | 39,553 | | | | — | | | | (1,447 | ) |
Expiring 12/18/19 | | JPMorgan Chase Bank, N.A. | | ZAR | | | 585 | | | | 38,496 | | | | 38,440 | | | | — | | | | (56 | ) |
Expiring 12/18/19 | | JPMorgan Chase Bank, N.A. | | ZAR | | | 109 | | | | 6,987 | | | | 7,143 | | | | 156 | | | | — | |
South Korean Won, | | | | | | | | | | | | | | | | | | | | | | |
Expiring 12/18/19 | | Barclays Bank PLC | | KRW | | | 83,453 | | | | 71,000 | | | | 71,379 | | | | 379 | | | | — | |
Expiring 12/18/19 | | BNP Paribas S.A. | | KRW | | | 102,297 | | | | 86,000 | | | | 87,496 | | | | 1,496 | | | | — | |
Expiring 12/18/19 | | HSBC BANK USA, N.A. | | KRW | | | 117,632 | | | | 99,000 | | | | 100,612 | | | | 1,612 | | | | — | |
See Notes to Financial Statements.
Forward foreign currency exchange contracts outstanding at October 31, 2019 (continued):
| | | | | | | | | | | | | | | | | | | | | | | | | | |
Purchase Contracts | | Counterparty | | Notional
Amount
(000) | | | Value at
Settlement
Date | | | Current
Value | | | Unrealized
Appreciation | | | Unrealized
Depreciation | |
OTC Forward Foreign Currency Exchange Contracts (cont’d.): | | | | | |
South Korean Won (cont’d.), | | | | | | | | | | | | | | | | | | | | | | | | |
Expiring 12/18/19 | | HSBC BANK USA, N.A. | | | KRW | | | | 84,380 | | | $ | 71,000 | | | $ | 72,172 | | | $ | 1,172 | | | $ | — | |
Expiring 12/18/19 | | JPMorgan Chase Bank, N.A. | | | KRW | | | | 56,337 | | | | 48,275 | | | | 48,186 | | | | — | | | | (89 | ) |
Swiss Franc, | | | | | | | | | | | | | | | | | | | | | | | | | | |
Expiring 01/17/20 | | Morgan Stanley & Co. International PLC | | | CHF | | | | 32 | | | | 32,200 | | | | 32,350 | | | | 150 | | | | — | |
Thai Baht, | | | | | | | | | | | | | | | | | | | | | | | | | | |
Expiring 12/18/19 | | Citibank, N.A. | | | THB | | | | 3,240 | | | | 106,000 | | | | 107,373 | | | | 1,373 | | | | — | |
Expiring 12/18/19 | | Citibank, N.A. | | | THB | | | | 2,541 | | | | 83,000 | | | | 84,213 | | | | 1,213 | | | | — | |
Expiring 12/18/19 | | Credit Suisse International | | | THB | | | | 2,123 | | | | 69,000 | | | | 70,339 | | | | 1,339 | | | | — | |
Expiring 12/18/19 | | HSBC BANK USA, N.A. | | | THB | | | | 1,985 | | | | 65,000 | | | | 65,777 | | | | 777 | | | | — | |
Expiring 12/18/19 | | JPMorgan Chase Bank, N.A. | | | THB | | | | 3,068 | | | | 101,000 | | | | 101,672 | | | | 672 | | | | — | |
Expiring 12/18/19 | | JPMorgan Chase Bank, N.A. | | | THB | | | | 2,813 | | | | 92,000 | | | | 93,222 | | | | 1,222 | | | | — | |
Expiring 12/18/19 | | JPMorgan Chase Bank, N.A. | | | THB | | | | 1,126 | | | | 36,695 | | | | 37,313 | | | | 618 | | | | — | |
Turkish Lira, | | | | | | | | | | | | | | | | | | | | | | | | | | |
Expiring 12/18/19 | | Barclays Bank PLC | | | TRY | | | | 239 | | | | 40,875 | | | | 41,335 | | | | 460 | | | | — | |
Expiring 12/18/19 | | Barclays Bank PLC | | | TRY | | | | 234 | | | | 40,077 | | | | 40,482 | | | | 405 | | | | — | |
Expiring 12/18/19 | | Barclays Bank PLC | | | TRY | | | | 168 | | | | 28,950 | | | | 29,012 | | | | 62 | | | | — | |
Expiring 12/18/19 | | Barclays Bank PLC | | | TRY | | | | 161 | | | | 27,555 | | | | 27,828 | | | | 273 | | | | — | |
Expiring 12/18/19 | | Goldman Sachs International | | | TRY | | | | 230 | | | | 39,186 | | | | 39,698 | | | | 512 | | | | — | |
Expiring 12/18/19 | | Goldman Sachs International | | | TRY | | | | 169 | | | | 29,000 | | | | 29,168 | | | | 168 | | | | — | |
| | | | | | | | | | | | | | | | | | | | | | | | | | |
| | | | | | | | | | | | $ | 6,198,406 | | | $ | 6,259,289 | | | | 79,772 | | | | (18,889 | ) |
| | | | | | | | | | | | | | | | | | | | | | | | | | |
See Notes to Financial Statements.
| | | | |
| PGIM Emerging Markets Debt Hard Currency Fund | | | 31 | |
Schedule of Investments(continued)
as of October 31, 2019
Forward foreign currency exchange contracts outstanding at October 31, 2019 (continued):
| | | | | | | | | | | | | | | | | | | | | | | | | | |
Sale Contracts | | Counterparty | | Notional
Amount
(000) | | | Value at
Settlement
Date | | | Current
Value | | | Unrealized
Appreciation | | | Unrealized
Depreciation | |
OTC Forward Foreign Currency Exchange Contracts: | |
Brazilian Real, | | | | | | | | | | | | | | | | | | | | | | | | | | |
Expiring 11/04/19 | | Barclays Bank PLC | | | BRL | | | | 218 | | | $ | 52,000 | | | $ | 54,383 | | | $ | — | | | $ | (2,383 | ) |
Expiring 11/04/19 | | The Toronto-Dominion Bank | | | BRL | | | | 1,009 | | | | 241,975 | | | | 251,409 | | | | — | | | | (9,434 | ) |
Expiring 12/03/19 | | BNP Paribas S.A. | | | BRL | | | | 184 | | | | 46,050 | | | | 45,774 | | | | 276 | | | | — | |
Canadian Dollar, | | | | | | | | | | | | | | | | | | | | | | | | | | |
Expiring 01/22/20 | | Barclays Bank PLC | | | CAD | | | | 147 | | | | 112,068 | | | | 111,755 | | | | 313 | | | | — | |
Chilean Peso, | | | | | | | | | | | | | | | | | | | | | | | | | | |
Expiring 12/18/19 | | JPMorgan Chase Bank, N.A. | | | CLP | | | | 284,597 | | | | 394,726 | | | | 384,225 | | | | 10,501 | | | | — | |
Expiring 12/18/19 | | Morgan Stanley & Co. International PLC | | | CLP | | | | 142,299 | | | | 197,363 | | | | 192,112 | | | | 5,251 | | | | — | |
Expiring 12/18/19 | | Morgan Stanley & Co. International PLC | | | CLP | | | | 142,299 | | | | 200,068 | | | | 192,112 | | | | 7,956 | | | | — | |
Chinese Renminbi, | | | | | | | | | | | | | | | | | | | | | | | | |
Expiring 05/14/21 | | JPMorgan Chase Bank, N.A. | | | CNH | | | | 994 | | | | 142,624 | | | | 138,774 | | | | 3,850 | | | | — | |
Colombian Peso, | | | | | | | | | | | | | | | | | | | | | | | | | | |
Expiring 12/18/19 | | Bank of America, N.A. | | | COP | | | | 181,845 | | | | 54,000 | | | | 53,703 | | | | 297 | | | | — | |
Expiring 12/18/19 | | Barclays Bank PLC | | | COP | | | | 287,388 | | | | 85,000 | | | | 84,873 | | | | 127 | | | | — | |
Expiring 12/18/19 | | Goldman Sachs International | | | COP | | | | 164,109 | | | | 48,310 | | | | 48,465 | | | | — | | | | (155 | ) |
Expiring 12/18/19 | | JPMorgan Chase Bank, N.A. | | | COP | | | | 136,248 | | | | 40,101 | | | | 40,237 | | | | — | | | | (136 | ) |
Expiring 12/18/19 | | JPMorgan Chase Bank, N.A. | | | COP | | | | 126,825 | | | | 37,500 | | | | 37,454 | | | | 46 | | | | — | |
Expiring 12/18/19 | | JPMorgan Chase Bank, N.A. | | | COP | | | | 70,120 | | | | 20,452 | | | | 20,708 | | | | — | | | | (256 | ) |
Expiring 12/18/19 | | UBS AG | | | COP | | | | 171,988 | | | | 49,000 | | | | 50,792 | | | | — | | | | (1,792 | ) |
Czech Koruna, | | | | | | | | | | | | | | | | | | | | | | | | | | |
Expiring 01/17/20 | | Barclays Bank PLC | | | CZK | | | | 1,629 | | | | 69,714 | | | | 71,284 | | | | — | | | | (1,570 | ) |
Egyptian Pound, | | | | | | | | | | | | | | | | | | | | | | | | | | |
Expiring 12/23/19 | | Citibank, N.A. | | | EGP | | | | 530 | | | | 31,851 | | | | 32,369 | | | | — | | | | (518 | ) |
Expiring 12/23/19 | | Citibank, N.A. | | | EGP | | | | 138 | | | | 8,341 | | | | 8,458 | | | | — | | | | (117 | ) |
See Notes to Financial Statements.
Forward foreign currency exchange contracts outstanding at October 31, 2019 (continued):
| | | | | | | | | | | | | | | | | | | | | | | | | | |
Sale Contracts | | Counterparty | | Notional
Amount
(000) | | | Value at
Settlement
Date | | | Current
Value | | | Unrealized
Appreciation | | | Unrealized
Depreciation | |
OTC Forward Foreign Currency Exchange Contracts (cont’d.): | | | | | | | | | | | | | |
Euro, | | | | | | | | | | | | | | | | | | | | | | | | | | |
Expiring 01/17/20 | | Bank of America, N.A. | | | EUR | | | | 112 | | | $ | 125,614 | | | $ | 126,102 | | | $ | — | | | $ | (488 | ) |
Expiring 01/17/20 | | HSBC BANK USA, N.A. | | | EUR | | | | 790 | | | | 877,343 | | | | 886,346 | | | | — | | | | (9,003 | ) |
Expiring 01/17/20 | | JPMorgan Chase Bank, N.A. | | | EUR | | | | 848 | | | | 941,697 | | | | 950,739 | | | | — | | | | (9,042 | ) |
Expiring 01/17/20 | | UBS AG | | | EUR | | | | 921 | | | | 1,020,095 | | | | 1,032,637 | | | | — | | | | (12,542 | ) |
Hungarian Forint, | | | | | | | | | | | | | | | | | | | | | | | | | | |
Expiring 01/17/20 | | The Toronto-Dominion Bank | | | HUF | | | | 80,129 | | | | 268,462 | | | | 273,195 | | | | — | | | | (4,733 | ) |
Indian Rupee, | | | | | | | | | | | | | | | | | | | | | | | | | | |
Expiring 12/18/19 | | Bank of America, N.A. | | | INR | | | | 6,398 | | | | 89,000 | | | | 89,506 | | | | — | | | | (506 | ) |
Expiring 12/18/19 | | HSBC BANK USA, N.A. | | | INR | | | | 2,849 | | | | 39,604 | | | | 39,862 | | | | — | | | | (258 | ) |
Expiring 12/18/19 | | HSBC BANK USA, N.A. | | | INR | | | | 2,814 | | | | 39,186 | | | | 39,366 | | | | — | | | | (180 | ) |
Expiring 12/18/19 | | Morgan Stanley & Co. International PLC | | | INR | | | | 6,008 | | | | 84,000 | | | | 84,054 | | | | — | | | | (54 | ) |
Indonesian Rupiah, | | | | | | | | | | | | | | | | | | | | | | | | |
Expiring 12/18/19 | | Citibank, N.A. | | | IDR | | | | 1,310,632 | | | | 92,000 | | | | 92,577 | | | | — | | | | (577 | ) |
Expiring 12/18/19 | | HSBC BANK USA, N.A. | | | IDR | | | | 4,603,305 | | | | 320,029 | | | | 325,156 | | | | — | | | | (5,127 | ) |
Expiring 12/18/19 | | JPMorgan Chase Bank, N.A. | | | IDR | | | | 1,254,440 | | | | 88,000 | | | | 88,608 | | | | — | | | | (608 | ) |
Expiring 12/18/19 | | JPMorgan Chase Bank, N.A. | | | IDR | | | | 1,025,280 | | | | 72,000 | | | | 72,421 | | | | — | | | | (421 | ) |
Israeli Shekel, | | | | | | | | | | | | | | | | | | | | | | | | | | |
Expiring 12/18/19 | | Barclays Bank PLC | | | ILS | | | | 472 | | | | 134,487 | | | | 134,127 | | | | 360 | | | | — | |
Mexican Peso, | | | | | | | | | | | | | | | | | | | | | | | | | | |
Expiring 12/18/19 | | Citibank, N.A. | | | MXN | | | | 944 | | | | 49,000 | | | | 48,702 | | | | 298 | | | | — | |
Expiring 12/18/19 | | JPMorgan Chase Bank, N.A. | | | MXN | | | | 833 | | | | 42,335 | | | | 42,999 | | | | — | | | | (664 | ) |
New Taiwanese Dollar, | | | | | | | | | | | | | | | | | | | | | | | | |
Expiring 12/18/19 | | BNP Paribas S.A. | | | TWD | | | | 3,003 | | | | 98,000 | | | | 99,147 | | | | — | | | | (1,147 | ) |
Expiring 12/18/19 | | Credit Suisse International | | | TWD | | | | 17,838 | | | | 574,477 | | | | 588,968 | | | | — | | | | (14,491 | ) |
See Notes to Financial Statements.
| | | | |
| PGIM Emerging Markets Debt Hard Currency Fund | | | 33 | |
Schedule of Investments(continued)
as of October 31, 2019
Forward foreign currency exchange contracts outstanding at October 31, 2019 (continued):
| | | | | | | | | | | | | | | | | | | | | | | | | | |
Sale Contracts | | Counterparty | | Notional
Amount
(000) | | | Value at
Settlement
Date | | | Current
Value | | | Unrealized
Appreciation | | | Unrealized
Depreciation | |
OTC Forward Foreign Currency Exchange Contracts (cont’d.): | | | | | | | | | | | | | |
New Taiwanese Dollar (cont’d.), | | | | | | | | | | | | | | | | | | | | | | | | |
Expiring 12/18/19 | | Goldman Sachs International | | | TWD | | | | 3,463 | | | $ | 114,000 | | | $ | 114,333 | | | $ | — | | | $ | (333 | ) |
Expiring 12/18/19 | | HSBC BANK USA, N.A. | | | TWD | | | | 3,065 | | | | 99,000 | | | | 101,193 | | | | — | | | | (2,193 | ) |
Expiring 12/18/19 | | JPMorgan Chase Bank, N.A. | | | TWD | | | | 3,550 | | | | 116,000 | | | | 117,220 | | | | — | | | | (1,220 | ) |
New Zealand Dollar, | | | | | | | | | | | | | | | | | | | | | | | | |
Expiring 01/22/20 | | Morgan Stanley & Co. International PLC | | | NZD | | | | 164 | | | | 103,830 | | | | 105,060 | | | | — | | | | (1,230 | ) |
Peruvian Nuevo Sol, | | | | | | | | | | | | | | | | | | | | | | | | |
Expiring 12/18/19 | | Bank of America, N.A. | | | PEN | | | | 192 | | | | 57,000 | | | | 57,311 | | | | — | | | | (311 | ) |
Expiring 12/18/19 | | JPMorgan Chase Bank, N.A. | | | PEN | | | | 356 | | | | 106,000 | | | | 106,246 | | | | — | | | | (246 | ) |
Philippine Peso, | | | | | | | | | | | | | | | | | | | | | | | | | | |
Expiring 12/18/19 | | JPMorgan Chase Bank, N.A. | | | PHP | | | | 5,061 | | | | 97,000 | | | | 99,504 | | | | — | | | | (2,504 | ) |
Expiring 12/18/19 | | Morgan Stanley & Co. International PLC | | | PHP | | | | 5,512 | | | | 105,000 | | | | 108,361 | | | | — | | | | (3,361 | ) |
Polish Zloty, | | | | | | | | | | | | | | | | | | | | | | | | | | |
Expiring 01/17/20 | | Barclays Bank PLC | | | PLN | | | | 124 | | | | 31,971 | | | | 32,556 | | | | — | | | | (585 | ) |
Russian Ruble, | | | | | | | | | | | | | | | | | | | | | | | | | | |
Expiring 12/18/19 | | Barclays Bank PLC | | | RUB | | | | 3,324 | | | | 51,000 | | | | 51,471 | | | | — | | | | (471 | ) |
Singapore Dollar, | | | | | | | | | | | | | | | | | | | | | | | | | | |
Expiring 12/18/19 | | Goldman Sachs International | | | SGD | | | | 205 | | | | 147,466 | | | | 150,926 | | | | — | | | | (3,460 | ) |
South African Rand, | | | | | | | | | | | | | | | | | | | | | | | | |
Expiring 12/18/19 | | Barclays Bank PLC | | | ZAR | | | | 1,081 | | | | 72,100 | | | | 71,067 | | | | 1,033 | | | | — | |
Expiring 12/18/19 | | Barclays Bank PLC | | | ZAR | | | | 597 | | | | 39,470 | | | | 39,217 | | | | 253 | | | | — | |
Expiring 12/18/19 | | Barclays Bank PLC | | | ZAR | | | | 585 | | | | 39,186 | | | | 38,454 | | | | 732 | | | | — | |
Expiring 12/18/19 | | Citibank, N.A. | | | ZAR | | | | 607 | | | | 39,692 | | | | 39,892 | | | | — | | | | (200 | ) |
Expiring 12/18/19 | | JPMorgan Chase Bank, N.A. | | | ZAR | | | | 706 | | | | 47,467 | | | | 46,405 | | | | 1,062 | | | | — | |
South Korean Won, | | | | | | | | | | | | | | | | | | | | | | | | |
Expiring 12/18/19 | | Citibank, N.A. | | | KRW | | | | 103,799 | | | | 86,358 | | | | 88,781 | | | | — | | | | (2,423 | ) |
See Notes to Financial Statements.
Forward foreign currency exchange contracts outstanding at October 31, 2019 (continued):
| | | | | | | | | | | | | | | | | | | | | | | | | | |
Sale Contracts | | Counterparty | | Notional
Amount
(000) | | | Value at
Settlement
Date | | | Current
Value | | | Unrealized
Appreciation | | | Unrealized
Depreciation | |
OTC Forward Foreign Currency Exchange Contracts (cont’d.): | | | | | | | | | |
South Korean Won (cont’d.), | | | | | | | | | | | | | | | | | |
Expiring 12/18/19 | | JPMorgan Chase Bank, N.A. | | | KRW | | | | 94,642 | | | $ | 79,000 | | | $ | 80,949 | | | $ | — | | | $ | (1,949 | ) |
Swiss Franc, | | | | | | | | | | | | | | | | | | | | | | | | | | |
Expiring 01/17/20 | | UBS AG | | | CHF | | | | 31 | | | | 31,083 | | | | 31,434 | | | | — | | | | (351 | ) |
Thai Baht, | | | | | | | | | | | | | | | | | | | | | | | | | | |
Expiring 12/18/19 | | Barclays Bank PLC | | | THB | | | | 2,926 | | | | 95,000 | | | | 96,939 | | | | — | | | | (1,939 | ) |
Expiring 12/18/19 | | JPMorgan Chase Bank, N.A. | | | THB | | | | 3,266 | | | | 108,000 | | | | 108,218 | | | | — | | | | (218 | ) |
Turkish Lira, | | | | | | | | | | | | | | | | | | | | | | | | | | |
Expiring 12/18/19 | | Barclays Bank PLC | | | TRY | | | | 254 | | | | 42,000 | | | | 43,943 | | | | — | | | | (1,943 | ) |
Expiring 12/18/19 | | Barclays Bank PLC | | | TRY | | | | 36 | | | | 6,000 | | | | 6,237 | | | | — | | | | (237 | ) |
Expiring 12/18/19 | | JPMorgan Chase Bank, N.A. | | | TRY | | | | 588 | | | | 97,309 | | | | 101,600 | | | | — | | | | (4,291 | ) |
Expiring 12/18/19 | | JPMorgan Chase Bank, N.A. | | | TRY | | | | 188 | | | | 31,046 | | | | 32,514 | | | | — | | | | (1,468 | ) |
| | | | | | | | | | | | | | | | | | | | | | | | | | |
| | | | | | | | | | | | $ | 8,628,450 | | | $ | 8,703,230 | | | | 32,355 | | | | (107,135 | ) |
| | | | | | | | | | | | | | | | | | | | | | | | | | |
| | | | | | | | | | | | | | | | | | | | $ | 112,127 | | | $ | (126,024 | ) |
| | | | | | | | | | | | | | | | | | | | | | | | | | |
Fair Value Measurements:
Various inputs are used in determining the value of the Series’ investments. These inputs are summarized in the three broad levels listed below.
Level 1—unadjusted quoted prices generally in active markets for identical securities.
Level 2—quoted prices for similar securities, interest rates and yield curves, prepayment speeds, foreign currency exchange rates and other observable inputs.
Level 3—unobservable inputs for securities valued in accordance with Board approved fair valuation procedures.
The following is a summary of the inputs used as of October 31, 2019 in valuing such portfolio securities:
| | | | | | | | | | | | |
| | | Level 1 | | | Level 2 | | | Level 3 | |
Investments in Securities | | | | | | | | | | | | |
Assets | | | | | | | | | | | | |
Corporate Bonds | | | | | | | | | | | | |
Argentina | | $ | — | | | $ | 122,760 | | | $ | — | |
Azerbaijan | | | — | | | | 240,000 | | | | — | |
See Notes to Financial Statements.
| | | | |
| PGIM Emerging Markets Debt Hard Currency Fund | | | 35 | |
Schedule of Investments(continued)
as of October 31, 2019
| | | | | | | | | | | | |
| | | Level 1 | | | Level 2 | | | Level 3 | |
Investments in Securities (continued) | | | | | | | | | | | | |
Assets (continued) | | | | | | | | | | | | |
Corporate Bonds (continued) | | | | | | | | | | | | |
Brazil | | $ | — | | | $ | 334,528 | | | $ | — | |
Chile | | | — | | | | 234,235 | | | | — | |
China | | | — | | | | 866,825 | | | | — | |
India | | | — | | | | 198,564 | | | | — | |
Indonesia | | | — | | | | 950,911 | | | | — | |
Kazakhstan | | | — | | | | 230,004 | | | | — | |
Malaysia | | | — | | | | 328,291 | | | | — | |
Mexico | | | — | | | | 1,658,124 | | | | — | |
Russia | | | — | | | | 725,554 | | | | — | |
Saudi Arabia | | | — | | | | 214,378 | | | | — | |
South Africa | | | — | | | | 629,553 | | | | — | |
Trinidad & Tobago | | | — | | | | 102,557 | | | | — | |
Tunisia | | | — | | | | 264,990 | | | | — | |
Ukraine | | | — | | | | 116,585 | | | | — | |
United States | | | — | | | | 208,400 | | | | — | |
Venezuela | | | — | | | | 76,300 | | | | — | |
Sovereign Bonds | | | | | | | | | | | | |
Angola | | | — | | | | 436,278 | | | | — | |
Argentina | | | — | | | | 804,647 | | | | — | |
Bahrain | | | — | | | | 919,345 | | | | — | |
Belarus | | | — | | | | 214,900 | | | | — | |
Brazil | | | — | | | | 1,035,803 | | | | — | |
Colombia | | | — | | | | 564,640 | | | | — | |
Congo (Republic) | | | — | | | | 72,300 | | | | — | |
Costa Rica | | | — | | | | 390,504 | | | | — | |
Dominican Republic | | | — | | | | 852,114 | | | | — | |
Ecuador | | | — | | | | 870,254 | | | | — | |
Egypt | | | — | | | | 939,754 | | | | — | |
El Salvador | | | — | | | | 508,305 | | | | — | |
Gabon | | | — | | | | 198,940 | | | | — | |
Ghana | | | — | | | | 459,707 | | | | — | |
Greece | | | — | | | | 284,396 | | | | — | |
Honduras | | | — | | | | 220,002 | | | | — | |
Hungary | | | — | | | | 200,433 | | | | — | |
Indonesia | | | — | | | | 866,138 | | | | — | |
Iraq | | | — | | | | 441,534 | | | | — | |
Ivory Coast | | | — | | | | 316,457 | | | | — | |
Jamaica | | | — | | | | 265,783 | | | | — | |
Jordan | | | — | | | | 210,570 | | | | — | |
Kazakhstan | | | — | | | | 290,000 | | | | — | |
Kenya | | | — | | | | 421,516 | | | | — | |
Lebanon | | | — | | | | 376,359 | | | | — | |
Mexico | | | — | | | | 263,735 | | | | — | |
Mongolia | | | — | | | | 202,792 | | | | — | |
Namibia | | | — | | | | 202,924 | | | | — | |
Nigeria | | | — | | | | 637,766 | | | | — | |
See Notes to Financial Statements.
| | | | | | | | | | | | |
| | | Level 1 | | | Level 2 | | | Level 3 | |
Investments in Securities (continued) | | | | | | | | | | | | |
Assets (continued) | | | | | | | | | | | | |
Sovereign Bonds (continued) | | | | | | | | | | | | |
Oman | | $ | — | | | $ | 395,625 | | | $ | — | |
Pakistan | | | — | | | | 403,598 | | | | — | |
Panama | | | — | | | | 470,041 | | | | — | |
Papua New Guinea | | | — | | | | 214,500 | | | | — | |
Peru | | | — | | | | 546,328 | | | | — | |
Philippines | | | — | | | | 436,927 | | | | — | |
Qatar | | | — | | | | 761,953 | | | | — | |
Romania | | | — | | | | 375,324 | | | | — | |
Russia | | | — | | | | 545,099 | | | | — | |
Saudi Arabia | | | — | | | | 483,338 | | | | — | |
Senegal | | | — | | | | 200,941 | | | | — | |
South Africa | | | — | | | | 453,426 | | | | — | |
Sri Lanka | | | — | | | | 951,846 | | | | — | |
Turkey | | | — | | | | 1,438,897 | | | | — | |
Ukraine | | | — | | | | 1,371,309 | | | | — | |
United Arab Emirates | | | — | | | | 229,000 | | | | — | |
Uruguay | | | — | | | | 447,259 | | | | — | |
Venezuela | | | — | | | | 18,675 | | | | — | |
Zambia | | | — | | | | 140,676 | | | | — | |
Affiliated Mutual Fund | | | 1,254,895 | | | | — | | | | — | |
| | | | | | | | | | | | |
Total | | $ | 1,254,895 | | | $ | 30,855,217 | | | $ | — | |
| | | | | | | | | | | | |
Other Financial Instruments* | | | | | | | | | | | | |
Assets | | | | | | | | | | | | |
OTC Forward Foreign Currency Exchange Contracts | | $ | — | | | $ | 112,127 | | | $ | — | |
| | | | | | | | | | | | |
Liabilities | | | | | | | | | | | | |
OTC Forward Foreign Currency Exchange Contracts | | $ | — | | | $ | (126,024 | ) | | $ | — | |
| | | | | | | | | | | | |
| * | Other financial instruments are derivative instruments not reflected in the Schedule of Investments, such as futures, forwards and centrally cleared swap contracts, which are recorded at the unrealized appreciation (depreciation) on the instrument, and OTC swap contracts which are recorded at fair value. |
Industry Classification:
The industry classification of investments and other assets in excess of liabilities shown as a percentage of net assets as of October 31, 2019 were as follows (unaudited):
| | | | |
Sovereign Bonds | | | 72.3 | % |
Oil & Gas | | | 13.6 | |
Affiliated Mutual Fund | | | 3.9 | |
Electric | | | 2.0 | |
Banks | | | 1.5 | |
Mining | | | 1.4 | |
Chemicals | | | 1.4 | |
| | | | |
Real Estate | | | 1.3 | % |
Transportation | | | 0.7 | |
Agriculture | | | 0.7 | |
See Notes to Financial Statements.
| | | | |
| PGIM Emerging Markets Debt Hard Currency Fund | | | 37 | |
Schedule of Investments(continued)
as of October 31, 2019
Industry Classification (continued):
| | | | |
Auto Parts & Equipment | | | 0.6 | % |
| | | | |
| | | 99.4 | |
Other assets in excess of liabilities | | | 0.6 | |
| | | | |
| | | 100.0 | % |
| | | | |
Effects of Derivative Instruments on the Financial Statements and Primary Underlying Risk Exposure:
The Series invested in derivative instruments during the reporting period. The primary type of risk associated with these derivative instruments is foreign exchange contracts risk. See the Notes to Financial Statements for additional detail regarding these derivative instruments and their risks. The effect of such derivative instruments on the Series’ financial position and financial performance as reflected in the Statement of Assets and Liabilities and Statement of Operations is presented in the summary below.
Fair values of derivative instruments as of October 31, 2019 as presented in the Statement of Assets and Liabilities:
| | | | | | | | | | | | |
Derivatives not accounted for as hedging instruments, carried at fair value | | Asset Derivatives | | | Liability Derivatives | |
| | Statement of
Assets and
Liabilities Location | | Fair
Value | | | Statement of
Assets and
Liabilities Location | | Fair
Value | |
| Foreign exchange contracts | | Unrealized appreciation on OTC forward foreign currency exchange contracts | | $ | 112,127 | | | Unrealized depreciation on OTC forward foreign currency exchange contracts | | $ | 126,024 | |
| | | | | | | | | | �� | | |
The effects of derivative instruments on the Statement of Operations for the year ended October 31, 2019 are as follows:
| | | | |
Amount of Realized Gain (Loss) on Derivatives Recognized in Income | |
Derivatives not accounted for as hedging instruments, carried at fair value | | Forward
& Cross
Currency
Exchange
Contracts | |
Foreign exchange contracts | | $ | 107,626 | |
| | | | |
| | | | |
Change in Unrealized Appreciation (Depreciation) on Derivatives Recognized in Income | |
Derivatives not accounted for as hedging instruments, carried at fair value | | Forward
& Cross
Currency
Exchange
Contracts | |
Foreign exchange contracts | | $ | (58,533 | ) |
| | | | |
See Notes to Financial Statements.
For the year ended October 31, 2019, the Series’ average volume of derivative activities is as follows:
| | | | | | | | | | |
| | | | Forward Foreign
Currency Exchange
Contracts—Purchased(1) | | | | |
| | | | $ | 6,275,519 | | | | | |
Forward Foreign
Currency Exchange
Contracts—Sold(1) | | | | | | Cross Currency
Exchange
Contracts(2) | |
| $ | 7,648,123 | | | | | | | $ | 58,476 | |
| (1) | Value at Settlement Date. |
Financial Instruments/Transactions—Summary of Offsetting and Netting Arrangements:
The Series invested in OTC derivatives during the reporting period that are either offset in accordance with current requirements or are subject to enforceable master netting arrangements or similar agreements that permit offsetting. The information about offsetting and related netting arrangements for OTC derivatives where the legal right toset-off exists is presented in the summary below.
Offsetting of OTC derivative assets and liabilities:
| | | | | | | | | | | | | | | | | | | | |
Counterparty | | Gross
Amounts of
Recognized
Assets(1) | | | Gross
Amounts of
Recognized
Liabilities(1) | | | Net Amounts of
Recognized
Assets/(Liabilities) | | | Collateral
Pledged/
(Received)(2) | | | Net
Amount | |
Bank of America, N.A. | | $ | 297 | | | $ | (2,218 | ) | | $ | (1,921 | ) | | $ | — | | | $ | (1,921 | ) |
Barclays Bank PLC | | | 4,901 | | | | (11,952 | ) | | | (7,051 | ) | | | — | | | | (7,051 | ) |
BNP Paribas S.A. | | | 4,695 | | | | (5,237 | ) | | | (542 | ) | | | — | | | | (542 | ) |
Citibank, N.A. | | | 14,875 | | | | (7,768 | ) | | | 7,107 | | | | — | | | | 7,107 | |
Credit Suisse International | | | 1,768 | | | | (14,536 | ) | | | (12,768 | ) | | | — | | | | (12,768 | ) |
Goldman Sachs International | | | 916 | | | | (6,571 | ) | | | (5,655 | ) | | | — | | | | (5,655 | ) |
HSBC BANK USA, N.A. | | | 8,624 | | | | (17,114 | ) | | | (8,490 | ) | | | — | | | | (8,490 | ) |
JPMorgan Chase Bank, N.A. | | | 39,782 | | | | (25,422 | ) | | | 14,360 | | | | — | | | | 14,360 | |
Morgan Stanley & Co. International PLC | | | 36,269 | | | | (4,887 | ) | | | 31,382 | | | | — | | | | 31,382 | |
The Toronto-Dominion Bank | | | — | | | | (14,167 | ) | | | (14,167 | ) | | | — | | | | (14,167 | ) |
UBS AG | | | — | | | | (16,152 | ) | | | (16,152 | ) | | | — | | | | (16,152 | ) |
| | | | | | | | | | | | | | | | | | | | |
See Notes to Financial Statements.
| | | | |
| PGIM Emerging Markets Debt Hard Currency Fund | | | 39 | |
Schedule of Investments(continued)
as of October 31, 2019
| | | | | | | | | | | | | | | | | | | | |
Counterparty | | Gross
Amounts of
Recognized
Assets(1) | | | Gross
Amounts of
Recognized
Liabilities(1) | | | Net Amounts of
Recognized
Assets/(Liabilities) | | | Collateral
Pledged/
(Received)(2) | | | Net
Amount | |
| | $ | 112,127 | | | $ | (126,024 | ) | | $ | (13,897 | ) | | $ | — | | | $ | (13,897 | ) |
| | | | | | | | | | | | | | | | | | | | |
| (1) | Includes unrealized appreciation/(depreciation) on swaps and forwards, premiums paid/(received) on swap agreements and market value of purchased and written options, as represented on the Statement of Assets and Liabilities. |
| (2) | Collateral amount disclosed by the Series is limited to the Series’ OTC derivative exposure by counterparty. |
See Notes to Financial Statements.
Statement of Assets and Liabilities
as of October 31, 2019
| | | | |
Assets | | | | |
Investments at value: | | | | |
Unaffiliated investments (cost $31,384,009) | | $ | 30,855,217 | |
Affiliated investments (cost $1,254,895) | | | 1,254,895 | |
Foreign currency, at value (cost $75,690) | | | 75,968 | |
Dividends and interest receivable | | | 479,539 | |
Unrealized appreciation on OTC forward foreign currency exchange contracts | | | 112,127 | |
Receivable for Series shares sold | | | 44,233 | |
Prepaid expenses | | | 808 | |
| | | | |
Total Assets | | | 32,822,787 | |
| | | | |
| |
Liabilities | | | | |
Payable for investments purchased | | | 286,540 | |
Unrealized depreciation on OTC forward foreign currency exchange contracts | | | 126,024 | |
Registration fees payable | | | 35,423 | |
Custodian and accounting fees payable | | | 29,463 | |
Payable for Series shares reacquired | | | 21,931 | |
Accrued expenses and other liabilities | | | 20,458 | |
Management fee payable | | | 3,422 | |
Affiliated transfer agent fee payable | | | 1,567 | |
Dividends payable | | | 159 | |
Distribution fee payable | | | 11 | |
| | | | |
Total Liabilities | | | 524,998 | |
| | | | |
| |
Net Assets | | $ | 32,297,789 | |
| | | | |
| | | | | |
Net assets were comprised of: | | | | |
Common stock, at par | | $ | 33,966 | |
Paid-in capital in excess of par | | | 33,337,291 | |
Total distributable earnings (loss) | | | (1,073,468 | ) |
| | | | |
Net assets, October 31, 2019 | | $ | 32,297,789 | |
| | | | |
See Notes to Financial Statements.
| | | | |
| PGIM Emerging Markets Debt Hard Currency Fund | | | 41 | |
Statement of Assets and Liabilities
as of October 31, 2019
| | | | |
Class A | | | | |
Net asset value, offering price and redemption price per share,
($13,224 ÷ 1,391 shares of beneficial interest issued and outstanding) | | $ | 9.51 | |
Maximum sales charge (3.25% of offering price) | | | 0.32 | |
| | | | |
Maximum offering price to public | | $ | 9.83 | |
| | | | |
| |
Class C | | | | |
Net asset value, offering price and redemption price per share,
($10,384 ÷ 1,092 shares of beneficial interest issued and outstanding) | | $ | 9.51 | |
| | | | |
| |
Class Z | | | | |
Net asset value, offering price and redemption price per share,
($5,781,526 ÷ 607,805 shares of beneficial interest issued and outstanding) | | $ | 9.51 | |
| | | | |
| |
Class R6 | | | | |
Net asset value, offering price and redemption price per share,
($26,492,655 ÷ 2,786,329 shares of beneficial interest issued and outstanding) | | $ | 9.51 | |
| | | | |
See Notes to Financial Statements.
Statement of Operations
Year Ended October 31, 2019
| | | | |
Net Investment Income (Loss) | | | | |
Income | | | | |
Interest income | | $ | 1,707,731 | |
Affiliated dividend income | | | 11,808 | |
| | | | |
Total income | | | 1,719,539 | |
| | | | |
| |
Expenses | | | | |
Management fee | | | 206,381 | |
Distribution fee(a) | | | 128 | |
Custodian and accounting fees | | | 86,926 | |
Registration fees(a) | | | 53,858 | |
Audit fee | | | 35,000 | |
Shareholders’ reports | | | 31,554 | |
Transfer agent’s fees and expenses (including affiliated expense of $10,172)(a) | | | 21,517 | |
Legal fees and expenses | | | 17,548 | |
Directors’ fees | | | 11,220 | |
Miscellaneous | | | 21,322 | |
| | | | |
Total expenses | | | 485,454 | |
Less: Fee waiver and/or expense reimbursement(a) | | | (271,100 | ) |
| | | | |
Net expenses | | | 214,354 | |
| | | | |
Net investment income (loss) | | | 1,505,185 | |
| | | | |
| |
Realized And Unrealized Gain (Loss) On Investment And Foreign Currency Transactions | | | | |
Net realized gain (loss) on: | | | | |
Investment transactions | | | (1,986 | ) |
Forward and cross currency contract transactions | | | 107,626 | |
Foreign currency transactions | | | (22,756 | ) |
| | | | |
| | | 82,884 | |
| | | | |
Net change in unrealized appreciation (depreciation) on: | | | | |
Investments | | | 2,002,135 | |
Forward and cross currency contracts | | | (58,533 | ) |
Foreign currencies | | | 12,338 | |
| | | | |
| | | 1,955,940 | |
| | | | |
Net gain (loss) on investment and foreign currency transactions | | | 2,038,824 | |
| | | | |
Net Increase (Decrease) In Net Assets Resulting From Operations | | $ | 3,544,009 | |
| | | | |
| (a) | Class specific expenses and waivers were as follows: |
| | | | | | | | | | | | | | | | |
| | | Class A | | | Class C | | | Class Z | | | Class R6 | |
Distribution fee | | | 30 | | | | 98 | | | | — | | | | — | |
Registration fees | | | 13,490 | | | | 13,490 | | | | 13,789 | | | | 13,089 | |
Transfer agent’s fees and expenses | | | 94 | | | | 47 | | | | 21,284 | | | | 92 | |
Fee waiver and/or expense reimbursement | | | (13,657 | ) | | | (13,599 | ) | | | (56,467 | ) | | | (187,377 | ) |
See Notes to Financial Statements.
| | | | |
| PGIM Emerging Markets Debt Hard Currency Fund | | | 43 | |
Statements of Changes in Net Assets
| | | | | | | | |
| | |
| | | Year Ended
October 31, 2019 | | | December 12, 2017*
through
October 31, 2018 | |
Increase (Decrease) in Net Assets | | | | | | | | |
Operations | | | | | | | | |
Net investment income (loss) | | $ | 1,505,185 | | | $ | 1,060,283 | |
Net realized gain (loss) on investment and foreign currency transactions | | | 82,884 | | | | (292,634 | ) |
Net change in unrealized appreciation (depreciation) on investments and foreign currencies | | | 1,955,940 | | | | (2,498,241 | ) |
| | | | | | | | |
Net increase (decrease) in net assets resulting from operations | | | 3,544,009 | | | | (1,730,592 | ) |
| | | | | | | | |
| | |
Dividends and Distributions | | | | | | | | |
Distributions from distributable earnings | | | | | | | | |
Class A | | | (662 | ) | | | (440 | ) |
Class C | | | (480 | ) | | | (377 | ) |
Class Z | | | (200,243 | ) | | | (37,450 | ) |
Class R6 | | | (1,481,664 | ) | | | (1,168,133 | ) |
| | | | | | | | |
| | | (1,683,049 | ) | | | (1,206,400 | ) |
| | | | | | | | |
Tax return of capital distributions | | | | | | | | |
Class A | | | — | | | | (6 | ) |
Class C | | | — | | | | (5 | ) |
Class Z | | | — | | | | (497 | ) |
Class R6 | | | — | | | | (15,516 | ) |
| | | | | | | | |
| | | — | | | | (16,024 | ) |
| | | | | | | | |
| | |
Series share transactions | | | | | | | | |
Net proceeds from shares sold | | | 4,632,832 | | | | 27,488,719 | |
Net asset value of shares issued in reinvestment of dividends and distributions | | | 1,681,976 | | | | 1,220,322 | |
Cost of shares reacquired | | | (1,464,362 | ) | | | (169,642 | ) |
| | | | | | | | |
Net increase (decrease) in net assets from Series share transactions | | | 4,850,446 | | | | 28,539,399 | |
| | | | | | | | |
Total increase (decrease) | | | 6,711,406 | | | | 25,586,383 | |
| | |
Net Assets: | | | | | | | | |
Beginning of period | | | 25,586,383 | | | | — | |
| | | | | | | | |
End of period | | $ | 32,297,789 | | | $ | 25,586,383 | |
| | | | | | | | |
| * | Commencement of operations. |
See Notes to Financial Statements.
Notes to Financial Statements
Prudential World Fund, Inc. (the “Fund”) is registered under the Investment Company Act of 1940, as amended (“1940 Act”), as anopen-end management investment company and currently consists of seven series: PGIM Jennison Emerging Markets Equity Opportunities Fund, PGIM Jennison Global Opportunities Fund, PGIM Jennison International Opportunities Fund and PGIM QMA International Equity Fund, each of which are diversified funds and PGIM Jennison Global Infrastructure Fund, PGIM Emerging Markets Debt Hard Currency Fund and PGIM Emerging Markets Debt Local Currency Fund, each of which arenon-diversified funds for purposes of the 1940 Act. These financial statements relate only to the PGIM Emerging Markets Debt Hard Currency Fund (the “Series”).
The investment objective of the Series is total return, through a combination of current income and capital appreciation.
1. Accounting Policies
The Series follows the investment company accounting and reporting guidance of the Financial Accounting Standards Board (“FASB”) Accounting Standard Codification (“ASC”) Topic 946 Financial Services—Investment Companies. The following accounting policies conform to U.S. generally accepted accounting principles. The Series consistently follows such policies in the preparation of its financial statements.
Securities Valuation:The Series holds securities and other assets and liabilities that are fair valued at the close of each day (generally, 4:00 PM Eastern time) the New York Stock Exchange (“NYSE”) is open for trading. Fair value is the price that would be received to sell an asset or paid to transfer a liability in an orderly transaction between market participants on the measurement date. The Fund’s Board of Directors (the “Board”) has adopted valuation procedures for security valuation under which fair valuation responsibilities have been delegated to PGIM Investments LLC (“PGIM Investments” or the “Manager”). Pursuant to the Board’s delegation, the Manager has established a Valuation Committee responsible for supervising the fair valuation of portfolio securities and other assets and liabilities. The valuation procedures permit the Series to utilize independent pricing vendor services, quotations from market makers, and alternative valuation methods when market quotations are either not readily available or not deemed representative of fair value. A record of the Valuation Committee’s actions is subject to the Board’s review, approval, and ratification at its next regularly scheduled quarterly meeting.
For the fiscal reportingyear-end, securities and other assets and liabilities were fair valued at the close of the last U.S. business day. Trading in certain foreign securities may occur when the NYSE is closed (including weekends and holidays). Because such foreign securities
| | | | |
| PGIM Emerging Markets Debt Hard Currency Fund | | | 45 | |
Notes to Financial Statements(continued)
trade in markets that are open on weekends and U.S. holidays, the values of some of the Series’ foreign investments may change on days when investors cannot purchase or redeem Series shares.
Various inputs determine how the Series’ investments are valued, all of which are categorized according to the three broad levels (Level 1, 2, or 3) detailed in the Schedule of Investments and referred to herein as the “fair value hierarchy” in accordance with FASB ASC Topic 820—Fair Value Measurements and Disclosures.
Investments inopen-end,non-exchange-traded mutual funds are valued at their net asset values as of the close of the NYSE on the date of valuation. These securities are classified as Level 1 in the fair value hierarchy since they may be purchased or sold at their net asset values on the date of valuation.
Fixed income securities traded in the OTC market are generally classified as Level 2 in the fair value hierarchy. Such fixed income securities are typically valued using the market approach which generally involves obtaining data from an approved independent third-party vendor source. The Series utilizes the market approach as the primary method to value securities when market prices of identical or comparable instruments are available. The third-party vendors’ valuation techniques used to derive the evaluated bid price are based on evaluating observable inputs, including but not limited to, yield curves, yield spreads, credit ratings, deal terms, tranche level attributes, default rates, cash flows, prepayment speeds, broker/dealer quotations and reported trades. Certain Level 3 securities are also valued using the market approach when obtaining a single broker quote or when utilizing transaction prices for identical securities that have been used in excess of five business days. During the reporting period, there were no changes to report with respect to the valuation approach and/or valuation techniques discussed above.
OTC and centrally cleared derivative instruments are generally classified as Level 2 in the fair value hierarchy. Such derivative instruments are typically valued using the market approach and/or income approach which generally involves obtaining data from an approved independent third-party vendor source. The Series utilizes the market approach when quoted prices in broker-dealer markets are available but also includes consideration of alternative valuation approaches, including the income approach. In the absence of reliable market quotations, the income approach is typically utilized for purposes of valuing derivatives such as interest rate swaps based on a discounted cash flow analysis whereby the value of the instrument is equal to the present value of its future cash inflows or outflows. Such analysis includes projecting future cash flows and determining the discount rate (including the present value factors that affect the discount rate) used to discount the future cash flows. In addition, the third-party vendors’ valuation techniques used to derive the evaluated derivative price is based on evaluating observable inputs, including but not limited
to, underlying asset prices, indices, spreads, interest rates and exchange rates. Certain derivatives may be classified as Level 3 when valued using the market approach by obtaining a single broker quote or when utilizing unobservable inputs in the income approach. During the reporting period, there were no changes to report with respect to the valuation approach and/or valuation techniques discussed above.
Securities and other assets that cannot be priced according to the methods described above are valued based on pricing methodologies approved by the Board. In the event that unobservable inputs are used when determining such valuations, the securities will be classified as Level 3 in the fair value hierarchy.
When determining the fair value of securities, some of the factors influencing the valuation include: the nature of any restrictions on disposition of the securities; assessment of the general liquidity of the securities; the issuer’s financial condition and the markets in which it does business; the cost of the investment; the size of the holding and the capitalization of the issuer; the prices of any recent transactions or bids/offers for such securities or any comparable securities; any available analyst media or other reports or information deemed reliable by the Manager regarding the issuer or the markets or industry in which it operates. Using fair value to price securities may result in a value that is different from a security’s most recent closing price and from the price used by other unaffiliated mutual funds to calculate their net asset values.
Illiquid Securities:Pursuant to Rule22e-4 under the 1940 Act, the Series has adopted a Board approved Liquidity Risk Management Program (“LRMP”) that requires, among other things, that the Series limit its illiquid investments that are assets to no more than 15% of net assets. Illiquid securities are those that, because of the absence of a readily available market or due to legal or contractual restrictions on resale, may not reasonably be expected to be sold or disposed of in current market conditions in seven calendar days or less without the sale or disposition significantly changing the market value of the investment. The Series may find it difficult to sell illiquid securities at the time considered most advantageous by its subadviser and may incur transaction costs that would not be incurred in the sale of securities that were freely marketable.
Restricted Securities:Securities acquired in unregistered, private sales from the issuing company or from an affiliate of the issuer are considered restricted as to disposition under federal securities law (“restricted securities”). Such restricted securities are valued pursuant to the valuation procedures noted above. Restricted securities that would otherwise be considered illiquid investments pursuant to the Series’ LRMP because of legal restrictions on resale to the general public may be traded among qualified institutional buyers under Rule 144A of the Securities Act of 1933. Therefore, these Rule 144A securities, as well as commercial paper that is sold in private placements under Section 4(2) of the Securities Act of 1933, may be classified higher than “illiquid” under the LRMP (i.e. “moderately liquid” or “less liquid” investments). However, the liquidity of the Series’ investments in restricted securities could be impaired if trading does not develop or declines.
| | | | |
| PGIM Emerging Markets Debt Hard Currency Fund | | | 47 | |
Notes to Financial Statements(continued)
Foreign Currency Translation:The books and records of the Series are maintained in U.S. dollars. Foreign currency amounts are translated into U.S. dollars on the following basis:
(i) market value of investment securities, other assets and liabilities—at the current rates of exchange;
(ii) purchases and sales of investment securities, income and expenses—at the rates of exchange prevailing on the respective dates of such transactions.
Although the net assets of the Series are presented at the foreign exchange rates and market values at the close of the period, the Series does not generally isolate that portion of the results of operations arising as a result of changes in the foreign exchange rates from the fluctuations arising from changes in the market prices of long-term portfolio securities held at the end of the period. Similarly, the Series does not isolate the effect of changes in foreign exchange rates from the fluctuations arising from changes in the market prices of long-term portfolio securities sold during the period. Accordingly, holding period realized foreign currency gains (losses) are included in the reported net realized gains (losses) on investment transactions. Notwithstanding the above, the Series does isolate the effect of fluctuations in foreign currency exchange rates when determining the gain (loss) upon the sale or maturity of foreign currency denominated debt obligations; such amounts are included in net
Additionally, net realized gains (losses) on foreign currency transactions represent net foreign exchange gains (losses) from the disposition of holdings of foreign currencies, currency gains (losses) realized between the trade and settlement dates on forward currency transactions, and the difference between the amounts of interest, dividends and foreign withholding taxes recorded on the Series’ books and the U.S. dollar equivalent amounts actually received or paid. Net unrealized currency gains (losses) arise from valuing foreign currency denominated assets and liabilities (other than investments) at period end exchange rates.
Forward and Cross Currency Contracts:A forward currency contract is a commitment to purchase or sell a foreign currency at a future date at a negotiated forward rate. The Series enters into forward currency contracts, as defined in the prospectus, in order to hedge its exposure to changes in foreign currency exchange rates on its foreign portfolio holdings or on specific receivables and payables denominated in a foreign currency and to gain exposure to certain currencies. The contracts are valued daily at current forward exchange rates and any unrealized gain (loss) is included in net unrealized appreciation (depreciation) on forward and cross currency contracts. Gain (loss) is realized on the settlement date of the contract equal to the difference between the settlement value of the original and negotiated forward contracts. This gain (loss), if any, is included in net realized gain (loss) on forward
and cross currency contract transactions. Risks may arise upon entering into these contracts from the potential inability of the counterparties to meet the terms of their contracts. Forward currency contracts involve risks from currency exchange rate and credit risk in excess of the amounts reflected on the Statement of Assets and Liabilities. The Series’ maximum risk of loss from counterparty credit risk is the net value of the cash flows to be received from the counterparty at the end of the contract’s life. A cross currency contract is a forward contract where a specified amount of one foreign currency will be exchanged for a specified amount of another foreign currency.
Master Netting Arrangements:The Fund, on behalf of the Series, is subject to various Master Agreements, or netting arrangements, with select counterparties. These are agreements which a subadviser may have negotiated and entered into on behalf of all or a portion of the Series. A master netting arrangement between the Series and the counterparty permits the Series to offset amounts payable by the Series to the same counterparty against amounts to be received; and by the receipt of collateral from the counterparty by the Series to cover the Series’ exposure to the counterparty. However, there is no assurance that such mitigating factors are easily enforceable. In addition to master netting arrangements, the right toset-off exists when all the conditions are met such that each of the parties owes the other determinable amounts, the reporting party has the right toset-off the amount owed with the amount owed by the other party, the reporting party intends toset-off and the right ofset-off is enforceable by law. During the reporting period, there was no intention to settle on a net basis and all amounts are presented on a gross basis on the Statement of Assets and Liabilities.
The Fund, on behalf of the Series, is a party to International Swaps and Derivatives Association, Inc. (“ISDA”) Master Agreements with certain counterparties that govern OTC derivative and foreign exchange contracts entered into from time to time. The Master Agreements may contain provisions regarding, among other things, the parties’ general obligations, representations, agreements, collateral requirements, events of default and early termination. With respect to certain counterparties, in accordance with the terms of the Master Agreements, collateral posted to the Series is held in a segregated account by the Series’ custodian and with respect to those amounts which can be sold orre-pledged, is presented in the Schedule of Investments. Collateral pledged by the Series is segregated by the Series’ custodian and identified in the Schedule of Investments. Collateral can be in the form of cash or debt securities issued by the U.S. Government or related agencies or other securities as agreed to by the Series and the applicable counterparty. Collateral requirements are determined based on the Series’ net position with each counterparty. Termination events applicable to the Series may occur upon a decline in the Series’ net assets below a specified threshold over a certain period of time. Termination events applicable to counterparties may occur upon a decline in the counterparty’s long-term and short-term credit ratings below a specified level. In each case, upon occurrence, the other party may elect to terminate early and cause settlement of all derivative and foreign exchange contracts outstanding, including the payment of any losses and costs resulting from such early termination, as reasonably determined by the terminating party. Any
| | | | |
| PGIM Emerging Markets Debt Hard Currency Fund | | | 49 | |
Notes to Financial Statements(continued)
decision by one or more of the Series’ counterparties to elect early termination could impact the Series’ future derivative activity.
As of October 31, 2019, the Series has not met conditions under such agreements which give the counterparty the right to call for an early termination.
Securities Transactions and Net Investment Income:Securities transactions are recorded on the trade date. Realized gains (losses) from investment and currency transactions are calculated on the specific identification method. Dividend income is recorded on theex-date, or for certain foreign securities, when the Series becomes aware of such dividends. Interest income, including amortization of premium and accretion of discount on debt securities, as required, is recorded on the accrual basis. Expenses are recorded on an accrual basis, which may require the use of certain estimates by management that may differ from actual. Net investment income or loss (other than class specific expenses and waivers, which are allocated as noted below) and unrealized and realized gains (losses) are allocated daily to each class of shares based upon the relative proportion of adjusted net assets of each class at the beginning of the day. Class specific expenses and waivers, where applicable, are charged to the respective share classes. Class specific expenses include distribution fees and distribution fee waivers, shareholder servicing fees, transfer agent’s fees and expenses, registration fees and fee waivers and/or expense reimbursements, as applicable.
Taxes:It is the Series’ policy to continue to meet the requirements of the Internal Revenue Code applicable to regulated investment companies and to distribute all of its taxable net investment income and capital gains, if any, to its shareholders. Therefore, no federal income tax provision is required. Withholding taxes on foreign dividends, interest and capital gains, if any, are recorded, net of reclaimable amounts, at the time the related income is earned.
Dividends and Distributions:The Series expects to declare dividends of its net investment income daily and pay such dividends monthly. Distributions of net realized capital and currency gains, if any, are declared and paid at least annually. Dividends and distributions to shareholders, which are determined in accordance with federal income tax regulations and which may differ from generally accepted accounting principles, are recorded on theex-date. Permanent book/tax differences relating to income and gain (loss) are reclassified between total distributable earnings (loss) andpaid-in capital in excess of par, as appropriate.
Estimates:The preparation of financial statements requires management to make estimates and assumptions that affect the reported amounts and disclosures in the financial statements. Actual results could differ from those estimates.
2. Agreements
The Fund, on behalf of the Series, has a management agreement with the Manager. Pursuant to this agreement, the Manager has responsibility for all investment advisory services and supervises the subadviser’s performance of such services. In addition, under the management agreement, the Manager provides all of the administrative functions necessary for the organization, operation and management of the Series. The Manager administers the corporate affairs of the Series and, in connection therewith, furnishes the Series with office facilities, together with those ordinary clerical and bookkeeping services which are not being furnished by the Series’ custodian and the Series’ transfer agent. The Manager is also responsible for the staffing and management of dedicated groups of legal, marketing, compliance and related personnel necessary for the operation of the Series. The legal, marketing, compliance and related personnel are also responsible for the management and oversight of the various service providers to the Series, including, but not limited to, the custodian, transfer agent, and accounting agent.
The Manager has entered into a subadvisory agreement with PGIM, Inc., which provides subadvisory services to the Series through its PGIM Fixed Income unit. The subadvisory agreement provides that PGIM, Inc. will furnish investment advisory services in connection with the management of the Series. In connection therewith, PGIM, Inc. is obligated to keep certain books and records of the Series. The Manager pays for the services of PGIM, Inc., the cost of compensation of officers of the Series, occupancy and certain clerical and bookkeeping costs of the Series. The Series bears all other costs and expenses.
The management fee paid to the Manager is accrued daily and payable monthly at an annual rate of 0.72% of the Series’ average daily net assets up to and including $1 billion; 0.70% from $1 billion to $3 billion of average daily net assets; 0.68% from $3 billion to $5 billion of average daily net assets; 0.67% from $5 billion to $10 billion of average daily net assets; and 0.66% of the average daily net assets exceeding $10 billion. The effective management fee rate before any waivers and/or expense reimbursements was 0.72% for the year ended October 31, 2019.
The Manager has contractually agreed, through February 29, 2020, to limit total annual operating expenses after fee waivers and/or expense reimbursements to 1.05% of average daily net assets for Class A shares, 1.80% of average daily net assets for Class C shares, 0.80% of average daily net assets for Class Z shares and 0.74% of average daily net assets for Class R6 shares. This contractual waiver excludes interest, brokerage, taxes (such as income and foreign withholding taxes, stamp duty and deferred tax expenses), acquired fund fees and expenses, extraordinary expenses, and certain other Series expenses such as dividend and interest expense and broker charges on short sales. Where applicable, the Manager agrees to waive management fees or shared operating expenses on any share class to the same extent that it waives similar expenses on any other share class. In addition, total annual operating expenses for Class R6 shares will not exceed total annual operating expenses for Class Z shares. Fees and/or expenses waived and/or reimbursed by the Manager may be recouped by the Manager within the same fiscal year during which such
| | | | |
| PGIM Emerging Markets Debt Hard Currency Fund | | | 51 | |
Notes to Financial Statements(continued)
waiver/reimbursement is made if such recoupment can be realized without exceeding the expense limit in effect at the time of the recoupment for that fiscal year.
The Fund, on behalf of the Series, has a distribution agreement with Prudential Investment Management Services LLC (“PIMS”), which acts as the distributor of the Class A, Class C, Class Z and Class R6 shares of the Series. The Series compensates PIMS for distributing and servicing the Series’ Class A and Class C shares, pursuant to the plans of distribution (the “Distribution Plans”), regardless of expenses actually incurred by PIMS. The distribution fees are accrued daily and payable monthly. No distribution or service fees are paid to PIMS as distributor of the Class Z or Class R6 shares of the Series.
Pursuant to the Distribution Plans, the Series compensates PIMS for distribution related activities at an annual rate of up to 0.25% and 1% of the average daily net assets of the Class A and Class C shares, respectively.
For the year ended October 31, 2019, PIMS has not received anyfront-end sales charges resulting from sales of Class A shares. Additionally, for the year ended October 31, 2019, PIMS did not receive any contingent deferred sales charges imposed upon redemptions by certain Class A and Class C shareholders.
PGIM Investments, PGIM, Inc and PIMS are indirect, wholly-owned subsidiaries of Prudential Financial, Inc. (“Prudential”).
3. Other Transactions with Affiliates
Prudential Mutual Fund Services LLC (“PMFS”), an affiliate of PGIM Investments and an indirect, wholly-owned subsidiary of Prudential, serves as the Series’ transfer agent. Transfer agent’s fees and expenses in the Statement of Operations include certainout-of-pocket expenses paid tonon-affiliates, where applicable.
The Series may invest its overnight sweep cash in the PGIM Core Ultra Short Bond Fund (the “Core Fund”), a series of Prudential Investment Portfolios 2, registered under the 1940 Act and managed by PGIM Investments. Through the Series’ investments in the mentioned underlying funds, PGIM Investments and/or its affiliates are paid fees or reimbursed for providing their services. In addition to the realized and unrealized gains on investments in the Core Fund, earnings from such investments are disclosed on the Statement of Operations as “Affiliated dividend income”.
The Series may enter into certain securities purchase or sale transactions under Board approved Rule17a-7 procedures. Rule17a-7 is an exemptive rule under the 1940 Act, that subject to certain conditions, permits purchase and sale transactions among affiliated
investment companies, or between an investment company and a person that is affiliated solely by reason of having a common (or affiliated) investment adviser, common directors, and/or common officers. Pursuant to the Rule17a-7 procedures and consistent with guidance issued by the SEC, the Series’ Chief Compliance Officer (“CCO”) prepares a quarterly summary of all such transactions for submission to the Board, together with the CCO’s written representation that all such17a-7 transactions were effected in accordance with the Series’ Rule17a-7 procedures. For the year ended October 31, 2019, no17a-7 transactions were entered into by the Series.
4. Portfolio Securities
The aggregate cost of purchases and proceeds from sales of portfolio securities (excluding short-term investments and U.S. Government securities) for the year ended October 31, 2019, were $13,433,350 and $9,326,054, respectively.
A summary of the cost of purchases and proceeds from sales of shares of an affiliated investment for the year ended October 31, 2019, is presented as follows:
| | | | | | | | | | | | | | | | | | | | | | | | | | | | |
Value,
Beginning
of Year | | Cost of
Purchases | | | Proceeds
from Sales | | | Change in
Unrealized
Gain
(Loss) | | | Realized
Gain
(Loss) | | | Value,
End of
Year | | | Shares,
End of
Year | | | Income | |
PGIM Core Ultra Short Bond Fund* | |
| $267,048 | | $ | 8,222,518 | | | $ | 7,234,671 | | | $ | — | | | $ | — | | | $ | 1,254,895 | | | | 1,254,895 | | | $ | 11,808 | |
| | | | | | | | | | | | | | | | | | | | | | | | | | | | |
| * | The Fund did not have any capital gain distributions during the reporting period. |
5. Distributions and Tax Information
Distributions to shareholders, which are determined in accordance with federal income tax regulations and which may differ from generally accepted accounting principles, are recorded on theex-date.
For the year ended October 31, 2019, the tax character of dividends paid by the Series was $1,683,049 of ordinary income. For the period ended October 31, 2018, the tax character of dividends paid by the Series was $1,206,400 of ordinary income and $16,024 of tax return of capital.
As of October 31, 2019, the accumulated undistributed earnings on a tax basis was $95,844 of ordinary income.
| | | | |
| PGIM Emerging Markets Debt Hard Currency Fund | | | 53 | |
Notes to Financial Statements(continued)
The United States federal income tax basis of the Series’ investments and the net unrealized depreciation as of October 31, 2019 were as follows:
| | | | | | |
Tax Basis | | Gross
Unrealized
Appreciation | | Gross
Unrealized
Depreciation | | Net
Unrealized
Depreciation |
| $32,996,199 | | $1,500,747 | | $(2,400,731) | | $(899,984) |
The difference between book basis and tax basis was primarily due to deferred losses on wash sales, amortization of bond premium, foreign currency forwards and other book to tax differences.
For federal income tax purposes, the Series had a capital loss carryforward as of October 31, 2019 of approximately $269,000 which can be carried forward for an unlimited period. No capital gains distributions are expected to be paid to shareholders until net gains have been realized in excess of such losses.
The Manager has analyzed the Series’ tax positions taken on federal, state and local income tax returns for all open tax years and has concluded that no provision for income tax is required in the Series’ financial statements for the current reporting period. Since tax authorities can examine previously filed tax returns, the Series’ U.S. federal and state tax returns for each of the two fiscal years up to the most recent fiscal year ended October 31, 2019 are subject to such review.
6. Capital and Ownership
The Series offers Class A, Class C, Class Z and Class R6 shares. Class A shares are sold with a maximumfront-end sales charge of 3.25%. Investors who purchase $1 million or more (prior to July 15, 2019, $500,000 or more on or after July 15, 2019) of Class A shares and sell those shares within 12 months of purchase are subject to a contingent deferred sales charge (“CDSC”) of 1.00% on sales although these purchases are not subject to afront-end sales charge. The Class A CDSC is waived for certain retirement and/or benefit plans. A special exchange privilege is also available for shareholders who qualified to purchase Class A shares at net asset value. Class C shares are sold with a CDSC of 1% on sales made within 12 months of purchase. Class C shares will automatically convert to Class A shares on a monthly basis approximately 10 years after purchase. Class Z and Class R6 shares are not subject to any sales or redemption charge and are available exclusively for sale to a limited group of investors.
Under certain circumstances, an exchange may be made from specified share classes of the Series to one or more other share classes of the Series as presented in the table of transactions in shares of common stock.
The Fund is authorized to issue 5.075 billion shares of common stock, with a par value of $0.01 per share, which is divided into seven series. There are 600 million shares authorized for the Series, divided into four classes, designated Class A, Class C, Class Z and Class R6 common stock, each of which consists of 100 million, 100 million, 200 million and 200 million authorized shares, respectively.
As of October 31, 2019, Prudential, through its affiliated entities, including affiliated funds (if applicable), owned 1,108 Class A shares, 1,092 Class C shares, 1,113 Class Z shares and 2,786,329 Class R6 shares of the Series. At reporting period end, two shareholders of record, each holding greater than 5% of the Series, held 91% of the Series’ outstanding shares, of which 82% were held by an affiliate of Prudential.
Transactions in shares of common stock were as follows:
| | | | | | | | |
Class A | | Shares | | | Amount | |
Year ended October 31, 2019: | | | | | | | | |
Shares sold | | | 272 | | | $ | 2,501 | |
Shares issued in reinvestment of dividends and distributions | | | 71 | | | | 661 | |
| | | | | | | | |
Net increase (decrease) in shares outstanding | | | 343 | | | $ | 3,162 | |
| | | | | | | | |
Period ended October 31, 2018*: | | | | | | | | |
Shares sold | | | 1,000 | | | $ | 10,000 | |
Shares issued in reinvestment of dividends and distributions | | | 48 | | | | 446 | |
| | | | | | | | |
Net increase (decrease) in shares outstanding | | | 1,048 | | | $ | 10,446 | |
| | | | | | | | |
Class C | | | | | | |
Year ended October 31, 2019: | | | | | | | | |
Shares issued in reinvestment of dividends and distributions | | | 51 | | | $ | 480 | |
| | | | | | | | |
Net increase (decrease) in shares outstanding | | | 51 | | | $ | 480 | |
| | | | | | | | |
Period ended October 31, 2018*: | | | | | | | | |
Shares sold | | | 1,000 | | | $ | 10,000 | |
Shares issued in reinvestment of dividends and distributions | | | 41 | | | | 382 | |
| | | | | | | | |
Net increase (decrease) in shares outstanding | | | 1,041 | | | $ | 10,382 | |
| | | | | | | | |
Class Z | | | | | | |
Year ended October 31, 2019: | | | | | | | | |
Shares sold | | | 491,936 | | | $ | 4,630,331 | |
Shares issued in reinvestment of dividends and distributions | | | 21,227 | | | | 199,171 | |
Shares reacquired | | | (156,847 | ) | | | (1,464,362 | ) |
| | | | | | | | |
Net increase (decrease) in shares outstanding | | | 356,316 | | | $ | 3,365,140 | |
| | | | | | | | |
Period ended October 31, 2018*: | | | | | | | | |
Shares sold | | | 266,290 | | | $ | 2,458,719 | |
Shares issued in reinvestment of dividends and distributions | | | 3,945 | | | | 35,845 | |
Shares reacquired | | | (18,746 | ) | | | (169,642 | ) |
| | | | | | | | |
Net increase (decrease) in shares outstanding | | | 251,489 | | | $ | 2,324,922 | |
| | | | | | | | |
| | | | |
| PGIM Emerging Markets Debt Hard Currency Fund | | | 55 | |
Notes to Financial Statements(continued)
| | | | | | | | |
Class R6 | | Shares | | | Amount | |
Year ended October 31, 2019: | | | | | | | | |
Shares issued in reinvestment of dividends and distributions | | | 159,025 | | | $ | 1,481,664 | |
| | | | | | | | |
Net increase (decrease) in shares outstanding | | | 159,025 | | | $ | 1,481,664 | |
| | | | | | | | |
Period ended October 31, 2018*: | | | | | | | | |
Shares sold | | | 2,501,000 | | | $ | 25,010,000 | |
Shares issued in reinvestment of dividends and distributions | | | 126,304 | | | | 1,183,649 | |
| | | | | | | | |
Net increase (decrease) in shares outstanding | | | 2,627,304 | | | $ | 26,193,649 | |
| | | | | | | | |
| * | Commencement of operations was December 12, 2017. |
7. Borrowings
The Fund, on behalf of the Series, along with other affiliated registered investment companies (the “Funds”), is a party to a Syndicated Credit Agreement (“SCA”) with a group of banks. The purpose of the SCA is to provide an alternative source of temporary funding for capital share redemptions. The table below provides details of the current SCA in effect at the reportingperiod-end as well as the prior SCA.
| | | | |
| | | Current SCA | | Prior SCA |
Term of Commitment | | 10/3/2019 – 10/1/2020 | | 10/4/2018 – 10/2/2019 |
Total Commitment | | $ 900 million | | $ 900 million |
Annualized Commitment Fee on the Unused Portion of the SCA | | 0.15% | | 0.15% |
Annualized Interest Rate on Borrowings | | 1.20% plus the higher of (1) the effective federal funds rate, (2) theone-month LIBOR rate or (3) zero percent | | 1.25% plus the higher of (1) the effective federal funds rate, (2) theone-month LIBOR rate or (3) zero percent |
Certain affiliated registered investment companies that are parties to the SCA include portfolios that are subject to a predetermined mathematical formula used to manage certain benefit guarantees offered under variable annuity contracts. The formula may result in large scale asset flows into and out of these portfolios. Consequently, these portfolios may be more likely to utilize the SCA for purposes of funding redemptions. It may be possible for those portfolios to fully exhaust the committed amount of the SCA, thereby requiring the Manager to allocate available funding per a Board-approved methodology designed to treat the Funds in the SCA equitably.
The Series did not utilize the SCA during the year ended October 31, 2019.
8. Risks of Investing in the Series
The Series’ risks include, but are not limited to, some or all of the risks discussed below:
Bond Obligations Risk:The Series’ holdings, share price, yield and total return may fluctuate in response to bond market movements. The value of bonds may decline for issuer-related reasons, including management performance, financial leverage and reduced demand for the issuer’s goods and services. Certain types of fixed-income obligations also may be subject to “call and redemption risk,” which is the risk that the issuer may call a bond held by the Series for redemption before it matures and the Series may not be able to reinvest at the same level and therefore would earn less income.
Derivatives Risk:Derivatives involve special risks and costs and may result in losses to the Series. The successful use of derivatives requires sophisticated management, and, to the extent that derivatives are used, the Series will depend on the subadviser’s ability to analyze and manage derivative transactions. The prices of derivatives may move in unexpected ways, especially in abnormal market conditions. Some derivatives are “leveraged” and therefore may magnify or otherwise increase investment losses to the Series. Other risks arise from the potential inability to terminate or sell derivatives positions. A liquid secondary market may not always exist for the Series’ derivatives positions. In fact, many OTC derivative instruments will not have liquidity beyond the counterparty to the instrument. OTC derivative instruments also involve the risk that the other party will not meet its obligations to the Series.
Emerging Markets Risk:The risks of foreign investments are greater for investments in or exposed to emerging markets. Emerging market countries typically have economic and political systems that are less fully developed, and can be expected to be less stable, than those of more developed countries. For example, the economies of such countries can be subject to rapid and unpredictable rates of inflation or deflation. Low trading volumes may result in a lack of liquidity and price volatility.
Foreign Securities Risk:The Series’ investments in securities of foreign issuers or issuers with significant exposure to foreign markets involve additional risk. Foreign countries in which the Series may invest may have markets that are less liquid, less regulated and more volatile than US markets. The value of the Series’ investments may decline because of factors affecting the particular issuer as well as foreign markets and issuers generally, such as unfavorable government actions, and political or financial instability.
Interest Rate Risk:The value of an investment may go down when interest rates rise. A rise in rates tends to have a greater impact on the prices of longer term or duration securities. When interest rates fall, the issuers of debt obligations may prepay principal more quickly than expected, and the Series may be required to reinvest the proceeds at a lower interest rate. This is referred to as “prepayment risk.” When interest rates rise, debt obligations may be repaid more slowly than expected, and the value of the Series’ holdings may fall sharply. This is referred to as “extension risk. The Series may face a heightened level of interest rate risk as a result of the U.S. Federal Reserve Board’s policies. The Series’ investments may lose value if short-term or long-term interest rates rise sharply or in a manner not anticipated by the subadviser.
| | | | |
| PGIM Emerging Markets Debt Hard Currency Fund | | | 57 | |
Notes to Financial Statements(continued)
Liquidity Risk:The Series may invest in instruments that trade in lower volumes and are less liquid than other investments. Liquidity risk exists when particular investments made by the Series are difficult to purchase or sell. Liquidity risk includes the risk that the Series may make investments that may become less liquid in response to market developments or adverse investor perceptions. Investments that are illiquid or that trade in lower volumes may be more difficult to value. If the Series is forced to sell these investments to pay redemption proceeds or for other reasons, the Series may lose money. In addition, when there is no willing buyer and investments may not reasonably be expected to be sold or disposed of in current market conditions in seven calendar days or less without the sale or disposition significantly changing the market value of the investment, the Series may incur higher transaction costs when executing trade orders of a given size. The reduction in dealer market-making capacity in the fixed-income markets that has occurred in recent years also has the potential to reduce liquidity. An inability to sell a portfolio position can adversely affect the Series’ value or prevent the Series from being able to take advantage of other investment opportunities.
Market and Credit Risk:Securities markets may be volatile and the market prices of the Series’ securities may decline. Securities fluctuate in price based on changes in an issuer’s financial condition and overall market and economic conditions. If the market prices of the securities owned by the Series fall, the value of an investment in the Series will decline. Additionally, the Series may also be exposed to credit risk in the event that an issuer or guarantor fails to perform or that an institution or entity with which the Series has unsettled or open transactions defaults.
Non-diversification Risk:Anon-diversified Series may invest a greater percentage of its assets in the securities of a single company or industry than a diversified fund. Investing in anon-diversified fund involves greater risk than investing in a diversified fund because a loss resulting from the decline in value of any one security may represent a greater portion of the total assets of anon-diversified fund.
9. Recent Accounting Pronouncements and Reporting Updates
In August 2018, the FASB issued Accounting Standards Update (“ASU”)No. 2018-13, which changes certain fair value measurement disclosure requirements. The new ASU, in addition to other modifications and additions, removes the requirement to disclose the amount and reasons for transfers between Level 1 and Level 2 of the fair value hierarchy, and the Series’ policy for the timing of transfers between levels. The amendments are effective for financial statements issued for fiscal years beginning after December 15, 2019, and interim periods within those fiscal years. The Manager has evaluated the implications of certain provisions of the ASU and has determined to early adopt aspects related to the removal and modification of certain fair value measurement disclosures under the ASU
effective immediately. The Manager continues to evaluate certain other provisions of the ASU and does not expect a material impact to financial statement disclosures.
| | | | |
| PGIM Emerging Markets Debt Hard Currency Fund | | | 59 | |
Financial Highlights
| | | | | | | | | | | | |
| Class A Shares | |
| | | Year Ended October 31,
2019 | | | | | | December 12, 2017(a)
through October 31,
2018 | |
| Per Share Operating Performance(b): | | | | | | | | | | | | |
| Net Asset Value, Beginning of Period | | | $8.88 | | | | | | | | $10.00 | |
| Income (loss) from investment operations: | | | | | | | | | | | | |
| Net investment income (loss) | | | 0.46 | | | | | | | | 0.38 | |
| Net realized and unrealized gain (loss) on investment and foreign currency transactions | | | 0.69 | | | | | | | | (1.06 | ) |
| Total from investment operations | | | 1.15 | | | | | | | | (0.68 | ) |
| Less Dividends and Distributions: | | | | | | | | | | | | |
| Dividends from net investment income | | | (0.52 | ) | | | | | | | (0.43 | ) |
| Tax return of capital distributions | | | - | | | | | | | | (0.01 | ) |
| Total dividends and distributions | | | (0.52 | ) | | | | | | | (0.44 | ) |
| Net asset value, end of period | | | $9.51 | | | | | | | | $8.88 | |
| Total Return(c): | | | 13.23% | | | | | | | | (6.97)% | |
| |
| Ratios/Supplemental Data: | |
| Net assets, end of period (000) | | | $13 | | | | | | | | $9 | |
| Average net assets (000) | | | $12 | | | | | | | | $10 | |
| Ratios to average net assets(d): | | | | | | | | | | | | |
| Expenses after waivers and/or expense reimbursement | | | 1.05% | | | | | | | | 1.05% | (e) |
| Expenses before waivers and/or expense reimbursement | | | 115.95% | | | | | | | | 358.14% | (e) |
| Net investment income (loss) | | | 4.95% | | | | | | | | 4.49% | (e) |
| Portfolio turnover rate(f) | | | 33% | | | | | | | | 17% | |
| (a) | Commencement of operations. |
| (b) | Calculated based on average shares outstanding during the period. |
| (c) | Total return does not consider the effects of sales loads. Total return is calculated assuming a purchase of a share on the first day and a sale on the last day of each period reported and includes reinvestment of dividends and distributions, if any. Total returns may reflect adjustments to conform to generally accepted accounting principles. Total returns for periods less than one full year are not annualized. |
| (d) | Does not include expenses of the underlying funds in which the Series invests. |
| (f) | The Series’ portfolio turnover rate is calculated in accordance with regulatory requirements, without regard to transactions involving short-term investments and certain derivatives. If such transactions were included, the Series’ portfolio turnover rate may be higher. |
See Notes to Financial Statements.
| | | | | | | | | | | | |
| Class C Shares | | | | | | | | | |
| | | Year Ended October 31,
2019 | | | | | | December 12, 2017(a)
through October 31,
2018 | |
| Per Share Operating Performance(b): | | | | | | | | | | | | |
| Net Asset Value, Beginning of Period | | | $8.88 | | | | | | | | $10.00 | |
| Income (loss) from investment operations: | | | | | | | | | | | | |
| Net investment income (loss) | | | 0.39 | | | | | | | | 0.31 | |
| Net realized and unrealized gain (loss) on investment and foreign currency transactions | | | 0.69 | | | | | | | | (1.05 | ) |
| Total from investment operations | | | 1.08 | | | | | | | | (0.74 | ) |
| Less Dividends and Distributions: | | | | | | | | | | | | |
| Dividends from net investment income | | | (0.45 | ) | | | | | | | (0.37 | ) |
| Tax return of capital distributions | | | - | | | | | | | | (0.01 | ) |
| Total dividends and distributions | | | (0.45 | ) | | | | | | | (0.38 | ) |
| Net asset value, end of period | | | $9.51 | | | | | | | | $8.88 | |
| Total Return(c): | | | 12.40% | | | | | | | | (7.58)% | |
| |
| Ratios/Supplemental Data: | |
| Net assets, end of period (000) | | | $10 | | | | | | | | $9 | |
| Average net assets (000) | | | $10 | | | | | | | | $10 | |
| Ratios to average net assets(d): | | | | | | | | | | | | |
| Expenses after waivers and/or expense reimbursement | | | 1.80% | | | | | | | | 1.80% | (e) |
| Expenses before waivers and/or expense reimbursement | | | 139.02% | | | | | | | | 359.95% | (e) |
| Net investment income (loss) | | | 4.22% | | | | | | | | 3.73% | (e) |
| Portfolio turnover rate(f) | | | 33% | | | | | | | | 17% | |
| (a) | Commencement of operations. |
| (b) | Calculated based on average shares outstanding during the period. |
| (c) | Total return does not consider the effects of sales loads. Total return is calculated assuming a purchase of a share on the first day and a sale on the last day of each period reported and includes reinvestment of dividends and distributions, if any. Total returns may reflect adjustments to conform to generally accepted accounting principles. Total returns for periods less than one full year are not annualized. |
| (d) | Does not include expenses of the underlying funds in which the Series invests. |
| (f) | The Series’ portfolio turnover rate is calculated in accordance with regulatory requirements, without regard to transactions involving short-term investments and certain derivatives. If such transactions were included, the Series’ portfolio turnover rate may be higher. |
See Notes to Financial Statements.
| | | | |
| PGIM Emerging Markets Debt Hard Currency Fund | | | 61 | |
Financial Highlights(continued)
| | | | | | | | | | | | |
| Class Z Shares | |
| | | Year Ended October 31,
2019 | | | | | | December 12, 2017(a)
through October 31,
2018 | |
| Per Share Operating Performance(b): | | | | | | | | | | | | |
| Net Asset Value, Beginning of Period | | | $8.88 | | | | | | | | $10.00 | |
| Income (loss) from investment operations: | | | | | | | | | | | | |
| Net investment income (loss) | | | 0.48 | | | | | | | | 0.39 | |
| Net realized and unrealized gain (loss) on investment and foreign currency transactions | | | 0.69 | | | | | | | | (1.05 | ) |
| Total from investment operations | | | 1.17 | | | | | | | | (0.66 | ) |
| Less Dividends and Distributions: | | | | | | | | | | | | |
| Dividends from net investment income | | | (0.54 | ) | | | | | | | (0.45 | ) |
| Tax return of capital distributions | | | - | | | | | | | | (0.01 | ) |
| Total dividends and distributions | | | (0.54 | ) | | | | | | | (0.46 | ) |
| Net asset value, end of period | | | $9.51 | | | | | | | | $8.88 | |
| Total Return(c): | | | 13.51% | | | | | | | | (6.79)% | |
| |
| Ratios/Supplemental Data: | |
| Net assets, end of period (000) | | | $5,782 | | | | | | | | $2,234 | |
| Average net assets (000) | | | $3,498 | | | | | | | | $766 | |
| Ratios to average net assets(d): | | | | | | | | | | | | |
| Expenses after waivers and/or expense reimbursement | | | 0.80% | | | | | | | | 0.80% | (e) |
| Expenses before waivers and/or expense reimbursement | | | 2.41% | | | | | | | | 6.65% | (e) |
| Net investment income (loss) | | | 5.12% | | | | | | | | 4.83% | (e) |
| Portfolio turnover rate(f) | | | 33% | | | | | | | | 17% | |
| (a) | Commencement of operations. |
| (b) | Calculated based on average shares outstanding during the period. |
| (c) | Total return is calculated assuming a purchase of a share on the first day and a sale on the last day of each period reported and includes reinvestment of dividends and distributions, if any. Total returns may reflect adjustments to conform to generally accepted accounting principles. Total returns for periods less than one full year are not annualized. |
| (d) | Does not include expenses of the underlying funds in which the Series invests. |
| (f) | The Series’ portfolio turnover rate is calculated in accordance with regulatory requirements, without regard to transactions involving short-term investments and certain derivatives. If such transactions were included, the Series’ portfolio turnover rate may be higher. |
See Notes to Financial Statements.
| | | | | | | | | | | | |
| Class R6 Shares | |
| | | Year Ended October 31,
2019 | | | | | | December 12, 2017(a)
through October 31,
2018 | |
| Per Share Operating Performance(b): | | | | | | | | | | | | |
| Net Asset Value, Beginning of Period | | | $8.88 | | | | | | | | $10.00 | |
| Income (loss) from investment operations: | | | | | | | | | | | | |
| Net investment income (loss) | | | 0.49 | | | | | | | | 0.40 | |
| Net realized and unrealized gain (loss) on investment and foreign currency transactions | | | 0.69 | | | | | | | | (1.06 | ) |
| Total from investment operations | | | 1.18 | | | | | | | | (0.66 | ) |
| Less Dividends and Distributions: | | | | | | | | | | | | |
| Dividends from net investment income | | | (0.55 | ) | | | | | | | (0.45 | ) |
| Tax return of capital distributions | | | - | | | | | | | | (0.01 | ) |
| Total dividends and distributions | | | (0.55 | ) | | | | | | | (0.46 | ) |
| Net asset value, end of period | | | $9.51 | | | | | | | | $8.88 | |
| Total Return(c): | | | 13.58% | | | | | | | | (6.72)% | |
| |
| Ratios/Supplemental Data: | |
| Net assets, end of period (000) | | | $26,493 | | | | | | | | $23,333 | |
| Average net assets (000) | | | $25,144 | | | | | | | | $24,014 | |
| Ratios to average net assets(d): | | | | | | | | | | | | |
| Expenses after waivers and/or expense reimbursement | | | 0.74% | | | | | | | | 0.74% | (e) |
| Expenses before waivers and/or expense reimbursement | | | 1.49% | | | | | | | | 1.76% | (e) |
| Net investment income (loss) | | | 5.27% | | | | | | | | 4.82% | (e) |
| Portfolio turnover rate(f) | | | 33% | | | | | | | | 17% | |
| (a) | Commencement of operations. |
| (b) | Calculated based on average shares outstanding during the period. |
| (c) | Total return is calculated assuming a purchase of a share on the first day and a sale on the last day of each period reported and includes reinvestment of dividends and distributions, if any. Total returns may reflect adjustments to conform to generally accepted accounting principles. Total returns for periods less than one full year are not annualized. |
| (d) | Does not include expenses of the underlying funds in which the Series invests. |
| (f) | The Series’ portfolio turnover rate is calculated in accordance with regulatory requirements, without regard to transactions involving short-term investments and certain derivatives. If such transactions were included, the Series’ portfolio turnover rate may be higher. |
See Notes to Financial Statements.
| | | | |
| PGIM Emerging Markets Debt Hard Currency Fund | | | 63 | |
Report of Independent Registered Public Accounting Firm
To the Shareholders of PGIM Emerging Markets Debt Hard Currency Fund and Board of Directors Prudential World Fund, Inc.:
Opinion on the Financial Statements
We have audited the accompanying statement of assets and liabilities of PGIM Emerging Markets Debt Hard Currency Fund, a series of Prudential World Fund, Inc., (the Fund), including the schedule of investments, as of October 31, 2019, the related statement of operations for the year then ended, the statements of changes in net assets for the year ended October 31, 2019 and the period from December 12, 2017 (commencement of operations) to October 31, 2018, and the related notes (collectively, the financial statements) and the financial highlights for the year or period indicated therein. In our opinion, the financial statements and financial highlights present fairly, in all material respects, the financial position of the Fund as of October 31, 2019, the results of its operations for the year then ended, the changes in its net assets for the year ended October 31, 2019 and the period from December 12, 2017 to October 31, 2018, and the financial highlights for the year or period indicated therein, in conformity with U.S. generally accepted accounting principles.
Basis for Opinion
These financial statements and financial highlights are the responsibility of the Fund’s management. Our responsibility is to express an opinion on these financial statements and financial highlights based on our audits. We are a public accounting firm registered with the Public Company Accounting Oversight Board (United States) (PCAOB) and are required to be independent with respect to the Fund in accordance with the U.S. federal securities laws and the applicable rules and regulations of the Securities and Exchange Commission and the PCAOB.
We conducted our audits in accordance with the standards of the PCAOB. Those standards require that we plan and perform the audit to obtain reasonable assurance about whether the financial statements and financial highlights are free of material misstatement, whether due to error or fraud. Our audits included performing procedures to assess the risks of material misstatement of the financial statements and financial highlights, whether due to error or fraud, and performing procedures that respond to those risks. Such procedures included examining, on a test basis, evidence regarding the amounts and disclosures in the financial statements and financial highlights. Such procedures also included confirmation of securities owned as of October 31, 2019, by correspondence with the custodian, transfer agent, and brokers, or by other appropriate auditing procedures when replies were not received. Our audits also included evaluating the accounting principles used and significant estimates made by management, as well as evaluating the overall presentation of the financial statements and financial highlights. We believe that our audits provide a reasonable basis for our opinion.

We have served as the auditor of one or more PGIM and/or Prudential Retail investment companies since 2003.
New York, New York
December 19, 2019
INFORMATION ABOUT BOARD MEMBERS AND OFFICERS(unaudited)
Information about Board Members and Officers of the Fund is set forth below. Board Members who are not deemed to be “interested persons” of the Fund, as defined in the 1940 Act, are referred to as “Independent Board Members.” Board Members who are deemed to be “interested persons” of the Fund are referred to as “Interested Board Members.” The Board Members are responsible for the overall supervision of the operations of the Fund and perform the various duties imposed on the directors of investment companies by the 1940 Act. The Board in turn elects the Officers, who are responsible for administering theday-to-day operations of the Fund.
| | | | | | |
| Independent Board Members | | | | |
| | | | |
Name Date of Birth Position(s) Portfolios Overseen | | Principal Occupation(s) During Past Five Years | | Other Directorships Held During Past Five Years | | Length of
Board Service |
| | | | |
Ellen S. Alberding 3/11/58 Board Member Portfolios Overseen: 96 | | President and Board Member, The Joyce Foundation (charitable foundation) (since 2002); Vice Chair, City Colleges of Chicago (community college system) (2011-2015); Trustee, National Park Foundation (charitable foundation for national park system) (2009-2018); Trustee, Economic Club of Chicago (since 2009); Trustee, Loyola University (since 2018). | | None. | | Since September 2013 |
| | | | |
Kevin J. Bannon 7/13/52 Board Member Portfolios Overseen: 96 | | Retired; Managing Director (April2008-May 2015) and Chief Investment Officer (October 2008-November 2013) of Highmount Capital LLC (registered investment adviser); formerly Executive Vice President and Chief Investment Officer (April 1993-August 2007) of Bank of New York Company; President (May2003-May 2007) of BNY Hamilton Family of Mutual Funds. | | Director of Urstadt Biddle Properties (equity real estate investment trust) (since September 2008). | | Since July 2008 |
PGIM Emerging Markets Debt Hard Currency Fund
| | | | | | |
| Independent Board Members | | | | |
| | | | |
Name Date of Birth Position(s) Portfolios Overseen | | Principal Occupation(s) During Past Five Years | | Other Directorships Held During Past Five Years | | Length of
Board Service |
| | | | |
Linda W. Bynoe 7/9/52 Board Member Portfolios Overseen: 96 | | President and Chief Executive Officer (since March 1995) and formerly Chief Operating Officer (December 1989-February 1995) of Telemat Ltd. (management consulting); formerly Vice President (January 1985-June 1989) at Morgan Stanley & Co. (broker-dealer). | | Director of Anixter International, Inc. (communication products distributor) (since January 2006); Director of Northern Trust Corporation (financial services) (since April 2006); Trustee of Equity Residential (residential real estate) (since December 2009). | | Since March 2005 |
| | | | |
Barry H. Evans 11/2/60 Board Member Portfolios Overseen: 95 | | Retired; formerly President (2005 – 2016), Global Chief Operating Officer (2014– 2016), Chief Investment Officer – Global Head of Fixed Income (1998-2014), and various portfolio manager roles (1986-2006), Manulife Asset Management U.S. | | Formerly Director, Manulife Trust Company (2011-2018); formerly Director, Manulife Asset Management Limited (2015-2017); formerly Chairman of the Board of Directors of Manulife Asset Management U.S. (2005-2016); formerly Chairman of the Board, Declaration Investment Management and Research (2008-2016). | | Since September 2017 |
| | | | |
Keith F. Hartstein 10/13/56 Board Member & Independent Chair Portfolios Overseen: 96 | | Retired; Member (since November 2014) of the Governing Council of the Independent Directors Council (organization of independent mutual fund directors); formerly President and Chief Executive Officer (2005-2012), Senior Vice President (2004-2005), Senior Vice President of Sales and Marketing (1997-2004), and various executive management positions (1990-1997), John Hancock Funds, LLC (asset management); Chairman, Investment Company Institute’s Sales Force Marketing Committee (2003-2008). | | None. | | Since September 2013 |
Visit our website at pgiminvestments.com
| | | | | | |
| Independent Board Members | | | | |
| | | | |
Name Date of Birth Position(s) Portfolios Overseen | | Principal Occupation(s) During Past Five Years | | Other Directorships Held During Past Five Years | | Length of Board Service |
| | | | |
Laurie Simon Hodrick 9/29/62 Board Member Portfolios Overseen: 95 | | A. Barton Hepburn Professor Emerita of Economics in the Faculty of Business, Columbia Business School (since 2018); Visiting Professor of Law, Stanford Law School (since 2015); Visiting Fellow at the Hoover Institution, Stanford University (since 2015); Sole Member, ReidCourt LLC (since 2008) (a consulting firm); formerly A. Barton Hepburn Professor of Economics in the Faculty of Business, Columbia Business School (1996-2017); formerly Managing Director, Global Head of Alternative Investment Strategies, Deutsche Bank (2006-2008). | | Independent Director, Synnex Corporation (since April 2019) (information technology); Independent Director, Kabbage, Inc. (since July 2018) (financial services); Independent Director, Corporate Capital Trust (2017-2018) (a business development company). | | Since September 2017 |
| | | | |
Michael S. Hyland, CFA 10/4/45 Board Member Portfolios Overseen: 96 | | Retired (since February 2005); formerly Senior Managing Director (July 2001-February 2005) of Bear Stearns & Co, Inc.; Global Partner, INVESCO (1999-2001); Managing Director and President of Salomon Brothers Asset Management (1989-1999). | | None. | | Since July 2008 |
| | | | |
Brian K. Reid 9/22/61 Board Member Portfolios Overseen: 95 | | Retired; formerly Chief Economist for the Investment Company Institute (ICI) (2005-2017); formerly Senior Economist and Director of Industry and Financial Analysis at the ICI (1998-2004); formerly Senior Economist, Industry and Financial Analysis at the ICI (1996-1998); formerly Staff Economist at the Federal Reserve Board (1989-1996); Director, ICI Mutual Insurance Company (2012-2017). | | None. | | Since March 2018 |
PGIM Emerging Markets Debt Hard Currency Fund
| | | | | | |
Independent Board Members | | | | |
| | | | |
Name Date of Birth Position(s) Portfolios Overseen | | Principal Occupation(s) During Past Five Years | | Other Directorships Held During Past Five Years | | Length of
Board Service |
| | | | |
Grace C. Torres 6/28/59 Board Member Portfolios Overseen: 95 | | Retired; formerly Treasurer and Principal Financial and Accounting Officer of the PGIM Funds, Target Funds, Advanced Series Trust, Prudential Variable Contract Accounts and The Prudential Series Fund (1998-June 2014); Assistant Treasurer (March 1999-June 2014) and Senior Vice President (September 1999-June 2014) of PGIM Investments LLC; Assistant Treasurer (May 2003-June 2014) and Vice President (June 2005-June 2014) of AST Investment Services, Inc.; Senior Vice President and Assistant Treasurer (May 2003-June 2014) of Prudential Annuities Advisory Services, Inc. | | Formerly Director (July 2015-January 2018) of Sun Bancorp, Inc. N.A. and Sun National Bank; Director (since January 2018) of OceanFirst Financial Corp. and OceanFirst Bank. | | Since November 2014 |
| | | | | | |
Interested Board Members | | | | |
| | | | |
Name Date of Birth Position(s) Portfolios Overseen | | Principal Occupation(s) During Past Five Years | | Other Directorships Held During Past Five Years | | Length of
Board Service |
| | | | |
Stuart S. Parker 10/5/62 Board Member & President Portfolios Overseen: 96 | | President of PGIM Investments LLC (formerly known as Prudential Investments LLC) (since January 2012); Executive Vice President of Prudential Investment Management Services LLC (since December 2012); formerly Executive Vice President of Jennison Associates LLC and Head of Retail Distribution of PGIM Investments LLC (June 2005-December 2011). | | None. | | Since January 2012 |
Visit our website at pgiminvestments.com
| | | | | | |
Interested Board Members | | | | |
| | | | |
Name Date of Birth Position(s) Portfolios Overseen | | Principal Occupation(s) During Past Five Years | | Other Directorships Held During Past Five Years | | Length of
Board Service |
| | | | |
Scott E. Benjamin 5/21/73 Board Member & Vice President Portfolios Overseen:96 | | Executive Vice President (since June 2009) of PGIM Investments LLC; Executive Vice President (June 2009-June 2012) and Vice President (since June 2012) of Prudential Investment Management Services LLC; Executive Vice President (since September 2009) of AST Investment Services, Inc.; Senior Vice President of Product Development and Marketing, PGIM Investments (since February 2006); formerly Vice President of Product Development and Product Management, PGIM Investments LLC (2003-2006). | | None. | | Since March 2010 |
| | | | |
| Fund Officers(a) | | | | |
| | | |
Name Date of Birth Fund Position | | Principal Occupation(s) During Past Five Years | | Length of
Service as Fund
Officer |
| | | |
Raymond A. O’Hara 9/11/55 Chief Legal Officer | | Vice President and Corporate Counsel (since July 2010) of Prudential Insurance Company of America (Prudential); Vice President (March 2011-Present) of Pruco Life Insurance Company and Pruco Life Insurance Company of New Jersey; Vice President and Corporate Counsel (March 2011-Present) of Prudential Annuities Life Assurance Corporation; Chief Legal Officer of PGIM Investments LLC (since June 2012); Chief Legal Officer of Prudential Mutual Fund Services LLC (since June 2012) and Corporate Counsel of AST Investment Services, Inc. (since June 2012); formerly Assistant Vice President and Corporate Counsel (September 2008-July 2010) of The Hartford Financial Services Group, Inc.; formerly Associate (September 1980-December 1987) and Partner (January 1988–August 2008) of Blazzard & Hasenauer, P.C. (formerly, Blazzard, Grodd & Hasenauer, P.C.). | | Since June 2012 |
PGIM Emerging Markets Debt Hard Currency Fund
| | | | |
| Fund Officers(a) | | | | |
| | | |
Name Date of Birth Fund Position | | Principal Occupation(s) During Past Five Years | | Length of Service as Fund Officer |
| | | |
Dino Capasso 8/19/74 Chief Compliance Officer | | Chief Compliance Officer (July 2019-Present) of PGIM Investments LLC; Chief Compliance Officer (July 2019-Present) of the PGIM Funds, Target Funds, Advanced Series Trust, The Prudential Series Fund, Prudential’s Gibraltar Fund, Inc., PGIM Global High Yield Fund, Inc., and PGIM High Yield Bond Fund, Inc.; Vice President and Deputy Chief Compliance Officer (June 2017-2019) of PGIM Investments LLC; formerly, Senior Vice President and Senior Counsel (January 2016-June 2017), and Vice President and Counsel (February 2012-December 2015) of Pacific Investment Management Company LLC. | | Since March 2018 |
| | | |
Andrew R. French 12/22/62 Secretary | | Vice President of PGIM Investments LLC (December 2018-Present); formerly Vice President and Corporate Counsel (February 2010-December 2018) of Prudential; formerly Director and Corporate Counsel (2006-2010) of Prudential; Vice President and Assistant Secretary (since January 2007) of PGIM Investments LLC; Vice President and Assistant Secretary (since January 2007) of Prudential Mutual Fund Services LLC. | | Since October 2006 |
| | | |
Jonathan D. Shain 8/9/58 Assistant Secretary | | Vice President and Corporate Counsel (since August 1998) of Prudential; Vice President and Assistant Secretary (since May 2001) of PGIM Investments LLC; Vice President and Assistant Secretary (since February 2001) of Prudential Mutual Fund Services LLC; formerly Vice President and Assistant Secretary (May 2003-June 2005) of AST Investment Services, Inc. | | Since May 2005 |
| | | |
Claudia DiGiacomo 10/14/74 Assistant Secretary | | Vice President and Corporate Counsel (since January 2005) of Prudential; Vice President and Assistant Secretary of PGIM Investments LLC (since December 2005); formerly Associate at Sidley Austin Brown & Wood LLP (1999-2004). | | Since December 2005 |
| | | |
Diana N. Huffman 4/14/82 Assistant Secretary | | Vice President and Corporate Counsel (since September 2015) of Prudential; formerly Associate at Willkie Farr & Gallagher LLP (2009-2015). | | Since March 2019 |
| | | |
Kelly A. Coyne 8/8/68 Assistant Secretary | | Director, Investment Operations of Prudential Mutual Fund Services LLC (since 2010). | | Since March 2015 |
| | | |
Christian J. Kelly 5/5/75 Treasurer and Principal Financial and Accounting Officer | | Vice President, Head of Fund Administration of PGIM Investments LLC (since November 2018); formerly, Director of Fund Administration of Lord Abbett & Co. LLC (2009-2018), Treasurer and Principal Accounting Officer of the Lord Abbett Family of Funds (2017-2018); Director of Accounting, Avenue Capital Group (2008-2009); Senior Manager, Investment Management Practice of Deloitte & Touche LLP (1998-2007). | | Since January 2019 |
Visit our website at pgiminvestments.com
| | | | |
| Fund Officers(a) | | | | |
| | | |
Name Date of Birth Fund Position | | Principal Occupation(s) During Past Five Years | | Length of Service as Fund Officer |
| | | |
Lana Lomuti 6/7/67 Assistant Treasurer | | Vice President (since 2007) and Director (2005-2007), within PGIM Investments Fund Administration; formerly Assistant Treasurer (December 2007-February 2014) of The Greater China Fund, Inc. | | Since April 2014 |
| | | |
Russ Shupak 10/08/73 Assistant Treasurer | | Vice President (since 2017) and Director (2013-2017), within PGIM Investments Fund Administration. | | Since October 2019 |
| | | |
Deborah Conway 3/26/69 Assistant Treasurer | | Vice President (since 2017) and Director (2007-2017), within PGIM Investments Fund Administration. | | Since October 2019 |
| | | |
Elyse M. McLaughlin 1/20/74 Assistant Treasurer | | Vice President (since 2017) and Director (2011-2017), within PGIM Investments Fund Administration. | | Since October 2019 |
| | | |
Charles H. Smith 1/11/73 Anti-Money Laundering Compliance Officer | | Vice President, Corporate Compliance, Anti-Money Laundering Unit (since January 2015) of Prudential; committee member of the American Council of Life Insurers Anti-Money Laundering and Critical Infrastructure Committee (since January 2016); formerly Global Head of Economic Sanctions Compliance at AIG Property Casualty (February 2007-December 2014); Assistant Attorney General at the New York State Attorney General’s Office, Division of Public Advocacy. (August 1998-January 2007). | | Since January 2017 |
(a) Excludes Mr. Parker and Mr. Benjamin, interested Board Members who also serve as President and Vice President, respectively.
Explanatory Notes to Tables:
| ∎ | | Board Members are deemed to be “Interested,” as defined in the 1940 Act, by reason of their affiliation with PGIM Investments LLC and/or an affiliate of PGIM Investments LLC. |
| ∎ | | Unless otherwise noted, the address of all Board Members and Officers is c/o PGIM Investments LLC, 655 Broad Street, Newark, New Jersey 07102-4410. |
| ∎ | | There is no set term of office for Board Members or Officers. The Board Members have adopted a retirement policy, which calls for the retirement of Board Members on December 31 of the year in which they reach the age of 75. |
| ∎ | | “Other Directorships Held” includes only directorships of companies required to register or file reports with the SEC under the 1934 Act (that is, “public companies”) or other investment companies registered under the 1940 Act. |
| ∎ | | “Portfolios Overseen” includes all investment companies managed by PGIM Investments LLC. The investment companies for which PGIM Investments LLC serves as manager include the PGIM Funds, The Prudential Variable Contract Accounts, PGIM ETF Trust, PGIM High Yield Bond Fund, Inc., PGIM Global High Yield Fund, Inc., The Prudential Series Fund, Prudential’s Gibraltar Fund, Inc. and the Advanced Series Trust. |
PGIM Emerging Markets Debt Hard Currency Fund
Approval of Advisory Agreements(unaudited)
The Fund’s Board of Directors
The Board of Directors (the “Board”) of PGIM Emerging Markets Debt Hard Currency Fund (the “Fund”)1 consists of eleven individuals, nine of whom are not “interested persons” of the Fund, as defined in the Investment Company Act of 1940, as amended (the “1940 Act”) (the “Independent Directors”).2 The Board is responsible for the oversight of the Fund and its operations, and performs the various duties imposed on the directors of investment companies by the 1940 Act. The Independent Directors have retained independent legal counsel to assist them in connection with their duties. The Chair of the Board is an Independent Director. The Board has established four standing committees: the Audit Committee, the Nominating and Governance Committee, and two Investment Committees. Each committee is chaired by, and composed of, Independent Directors.
Annual Approval of the Fund’s Advisory Agreements
As required under the 1940 Act, the Board determines annually whether to renew the Fund’s management agreement with PGIM Investments LLC (“PGIM Investments”) and the Fund’s subadvisory agreements with each of PGIM, Inc. (“PGIM”) on behalf of its PGIM Fixed Income unit and PGIM Limited (“PGIML”). In considering the renewal of the agreements, the Board, including all of the Independent Directors, met on May 30, 2019 and on June11-13, 2019 and approved the renewal of the agreements through July 31, 2020, after concluding that the renewal of the agreements was in the best interests of the Fund and its shareholders.
In advance of the meetings, the Board requested and received materials relating to the agreements, and had the opportunity to ask questions and request further information in connection with its consideration. Among other things, the Board considered comparative fee information from PGIM Investments, PGIM and PGIML. Also, the Board considered comparisons with other mutual funds in relevant Peer Universes and Peer Groups, as is further discussed below.
In approving the agreements, the Board, including the Independent Directors advised by independent legal counsel, considered the factors it deemed relevant, including the nature, quality and extent of services provided by PGIM Investments and the subadvisers, the performance of the Fund, the profitability of PGIM Investments and its affiliates, expenses and fees, and the potential for economies of scale that may be shared with the Fund and its shareholders as the Fund’s assets grow. In their deliberations, the Directors did not identify any single factor which alone was responsible for the Board’s decision to approve the agreements with respect to the Fund. In connection with its deliberations, the Board
| | |
| PGIM Emerging Markets Debt Hard Currency Fund |
| 1 | PGIM Emerging Markets Debt Hard Currency Fund is a series of Prudential World Fund, Inc. |
| 2 | Grace C. Torres was an Interested Director of the Fund at the time the Board considered and approved the renewal of the Fund’s advisory agreements, but has since become an Independent Director of the Fund. |
Approval of Advisory Agreements(continued)
considered information provided by PGIM Investments throughout the year at regular Board meetings, presentations from portfolio managers and other information, as well as information furnished at or in advance of the meetings on May 30, 2019 and on June11-13, 2019.
The Directors determined that the overall arrangements between the Fund and PGIM Investments, which serves as the Fund’s investment manager pursuant to a management agreement, and between each of PGIM Investments and PGIM, which, through its PGIM Fixed Income unit, and PGIML, which serve as the Fund’s subadvisers pursuant to the terms of subadvisory agreements with PGIM Investments, are in the best interests of the Fund and its shareholders in light of the services performed, fees charged and such other matters as the Directors considered relevant in the exercise of their business judgment.
The material factors and conclusions that formed the basis for the Director’s reaching their determinations to approve the continuance of the agreements are separately discussed below.
Nature, Quality and Extent of Services
The Board received and considered information regarding the nature, quality and extent of services provided to the Fund by PGIM Investments, PGIM Fixed Income, and PGIML. The Board noted that PGIM Fixed Income and PGIML are affiliated with PGIM Investments. The Board considered the services provided by PGIM Investments, including but not limited to the oversight of the subadvisers for the Fund, as well as the provision of fund recordkeeping, compliance and other services to the Fund, and PGIM Investments’ role as administrator for the Fund’s liquidity risk management program. With respect to PGIM Investments’ oversight of the subadvisers, the Board noted that PGIM Investments’ Strategic Investment Research Group (“SIRG”), which is a business unit of PGIM Investments, is responsible for monitoring and reporting to PGIM Investments senior management on the performance and operations of the subadvisers. The Board also considered that PGIM Investments pays the salaries of all of the officers and interested Directors of the Fund who are part of Fund management. The Board also considered the investment subadvisory services provided by PGIM Fixed Income and PGIML, including investment research and security selection, as well as adherence to the Fund’s investment restrictions and compliance with applicable Fund policies and procedures. The Board considered PGIM Investments’ evaluation of the subadvisers, as well as PGIM Investments’ recommendation, based on its review of the subadvisers, to renew the subadvisory agreements.
The Board considered the qualifications, backgrounds and responsibilities of PGIM Investments’ senior management responsible for the oversight of the Fund, PGIM Fixed Income, and PGIML, and also considered the qualifications, backgrounds and responsibilities of PGIM Fixed Income’s portfolio managers who are responsible for theday-to-day management of the Fund’s portfolio. The Board was provided with information
| | |
| Visit our website at pgiminvestments.com | | |
pertaining to PGIM Investments’, PGIM Fixed Income’s, and PGIML’s organizational structure, senior management, investment operations, and other relevant information pertaining to PGIM Investments, PGIM Fixed Income, and PGIML. The Board also noted that it received favorable compliance reports from the Fund’s Chief Compliance Officer (“CCO”) as to PGIM Investments, PGIM Fixed Income, and PGIML.
The Board concluded that it was satisfied with the nature, extent and quality of the investment management services provided by PGIM Investments, the subadvisory services provided to the Fund by PGIM Fixed Income and PGIML, and that there was a reasonable basis on which to conclude that the Fund benefits from the services provided by PGIM Investments, PGIM Fixed Income, and PGIML under the management and subadvisory agreements.
Costs of Services and Profits Realized by PGIM Investments
The Board was provided with information on the profitability of PGIM Investments and its affiliates in serving as the Fund’s investment manager. The Board discussed with PGIM Investments the methodology utilized in assembling the information regarding profitability and considered its reasonableness. The Board recognized that it is difficult to make comparisons of profitability from fund management contracts because comparative information is not generally publicly available and is affected by numerous factors, including the structure of the particular adviser, the types of funds it manages, its business mix, numerous assumptions regarding allocations and the adviser’s capital structure and cost of capital. Taking these factors into account, the Board concluded that the profitability of PGIM Investments and its affiliates in relation to the services rendered was not unreasonable.
Economies of Scale
The Board received and discussed information concerning economies of scale that PGIM Investments may realize as the Fund’s assets grow beyond current levels. The Board noted that the management fee schedule for the Fund includes breakpoints, which have the effect of decreasing the fee rate as assets increase. During the course of time, the Board has considered information regarding the launch date of the Fund, the management fees of the Fund compared to those of similarly managed funds and PGIM Investments’ investment in the Fund over time. The Board noted that economies of scale can be shared with the Fund in other ways, including low management fees from inception, additional technological and personnel investments to enhance shareholder services, and maintaining existing expense structures in the face of a rising cost environment. The Board also considered PGIM Investments’ assertion that it continually evaluates the management fee schedule of the Fund and the potential to share economies of scale through breakpoints or fee waivers as asset levels increase.
The Board recognized the inherent limitations of any analysis of economies of scale, stemming largely from the Board’s understanding that most of PGIM Investments’ costs are not specific to individual funds, but rather are incurred across a variety of products and services.
| | |
| PGIM Emerging Markets Debt Hard Currency Fund |
Approval of Advisory Agreements(continued)
Other Benefits to PGIM Investments, PGIM Fixed Income, and PGIML
The Board considered potential ancillary benefits that might be received by PGIM Investments, PGIM Fixed Income, PGIML and their affiliates as a result of their relationship with the Fund. The Board concluded that potential benefits to be derived by PGIM Investments included transfer agency fees received by the Fund’s transfer agent (which is affiliated with PGIM Investments), as well as benefits to its reputation or other intangible benefits resulting from PGIM Investments’ association with the Fund. The Board concluded that the potential benefits to be derived by PGIM Fixed Income and PGIML included the ability to use soft dollar credits, as well as the potential benefits consistent with those generally resulting from an increase in assets under management, specifically, potential access to additional research resources and benefits to their reputations. The Board concluded that the benefits derived by PGIM Investments, PGIM Fixed Income, and PGIML were consistent with the types of benefits generally derived by investment managers and subadvisers to mutual funds.
Performance of the Fund / Fees and Expenses
The Board considered certain additional factors and made related conclusions relating to the historical performance of the Fund for theone-year period ended December 31, 2018. The Board considered that the Fund commenced operations on December 12, 2017 and that longer-term performance was not yet available.
The Board also considered the Fund’s actual management fee, as well as the Fund’s net total expense ratio, for the fiscal period ended October 31, 2018. The Board considered the management fee for the Fund as compared to the management fee charged by PGIM Investments to other funds and the fee charged by other advisers to comparable mutual funds in a Peer Group. The actual management fee represents the fee rate actually paid by Fund shareholders and includes any fee waivers or reimbursements. The net total expense ratio for the Fund represents the actual expense ratio incurred by Fund shareholders.
The mutual funds included in the Peer Universe, which was used to consider performance, and the Peer Group, which was used to consider expenses and fees, were objectively determined by Broadridge, an independent provider of mutual fund data. In certain circumstances, PGIM Investments also provided supplemental Peer Universe or Peer Group information, for reasons addressed with the Board. The comparisons placed the Fund in various quartiles over various periods, with the first quartile being the best 25% of the mutual funds (for performance, the best performing mutual funds and, for expenses, the lowest cost mutual funds).
The section below summarizes key factors considered by the Board and the Board’s conclusions regarding the Fund’s performance, fees and overall expenses. The table sets
| | |
| Visit our website at pgiminvestments.com | | |
forth net performance comparisons (which reflect the impact on performance of fund expenses, or any subsidies, expense caps or waivers that may be applicable) with the Peer Universe, actual management fees with the Peer Group (which reflect the impact of any subsidies or fee waivers), and net total expenses with the Peer Group, each of which were key factors considered by the Board.
| | | | | | | | |
| Net Performance | | 1 Year | | 3 Years | | 5 Years | | 10 Years |
| | 3rd Quartile | | N/A | | N/A | | N/A |
| Actual Management Fees:1st Quartile |
| Net Total Expenses: 1st Quartile |
| | • | | The Board noted that the Fund underperformed its benchmark index over theone-year period. |
| | • | | The Board noted that the Fund does not yet have a three-year performance record and that, therefore, the subadviser should have more time to develop that record. |
| | • | | The Board and PGIM Investments agreed to retain the existing contractual expense cap which (exclusive of certain fees and expenses) caps total annual operating expenses at 1.05% for Class A shares, 1.80% for Class C shares, 0.80% for Class Z shares, and 0.74% for Class R6 shares through February 29, 2020. |
| | • | | In addition, PGIM Investments will waive management fees or shared operating expenses on any share class to the same extent that it waives such expenses on any other share class, and has agreed that total annual fund operating expenses for Class R6 shares will not exceed total annual fund operating expenses for Class Z shares. |
| | • | | The Board concluded that in light of the above, it would be in the best interests of the Fund and its shareholders to continue to allow the Fund to create a longer-term performance record, and to renew the agreements. |
| | • | | The Board concluded that the management fees (including subadvisory fees) and total expenses were reasonable in light of the services provided. |
* * *
After full consideration of these factors, the Board concluded that the approval of the agreements was in the best interests of the Fund and its shareholders.
| | |
| PGIM Emerging Markets Debt Hard Currency Fund |
| | | | |
| | |
| ∎ MAIL | | ∎ TELEPHONE | | ∎ WEBSITE |
655 Broad Street Newark, NJ 07102 | | (800) 225-1852 | | pgiminvestments.com |
|
| PROXY VOTING |
| The Board of Directors of the Fund has delegated to the Fund’s subadviser the responsibility for voting any proxies and maintaining proxy recordkeeping with respect to the Fund. A description of these proxy voting policies and procedures is available without charge, upon request, by calling (800) 225-1852. Information regarding how the Fund voted proxies relating to portfolio securities during the most recent 12-month period ended June 30 is available on the Fund’s website and on the Securities and Exchange Commission’s website. |
|
| DIRECTORS |
| Ellen S. Alberding• Kevin J. Bannon• Scott E. Benjamin• Linda W. Bynoe• Barry H. Evans • Keith F. Hartstein • Laurie Simon Hodrick• Michael S. Hyland• Stuart S. Parker• Brian K. Reid• Grace C. Torres |
|
| OFFICERS |
| Stuart S. Parker,President• Scott E. Benjamin,Vice President• Christian J. Kelly,Treasurer and Principal Financial and Accounting Officer• Raymond A. O’Hara,Chief Legal Officer• Dino Capasso,Chief Compliance Officer• Charles H. Smith,Anti-Money Laundering Compliance Officer• Andrew R. French,Secretary• Jonathan D. Shain,Assistant Secretary• Claudia DiGiacomo,Assistant Secretary• Diana N. Huffman,Assistant Secretary• Kelly A. Coyne,Assistant Secretary• Lana Lomuti,Assistant Treasurer• Russ Shupak,Assistant Treasurer• Elyse McLaughlin,Assistant Treasurer• Deborah Conway,Assistant Treasurer |
| | | | |
| MANAGER | | PGIM Investments LLC | | 655 Broad Street
Newark, NJ 07102 |
|
| SUBADVISER | | PGIM Fixed Income | | 655 Broad Street
Newark, NJ 07102 |
|
| DISTRIBUTOR | | Prudential Investment
Management Services LLC | | 655 Broad Street
Newark, NJ 07102 |
|
| CUSTODIAN | | The Bank of New York Mellon | | 240 Greenwich Street
New York, NY 10286 |
|
| TRANSFER AGENT | | Prudential Mutual Fund
Services LLC | | PO Box 9658
Providence, RI 02940 |
|
INDEPENDENT REGISTERED
PUBLIC ACCOUNTING FIRM | | KPMG LLP | | 345 Park Avenue
New York, NY 10154 |
|
| FUND COUNSEL | | Willkie Farr & Gallagher LLP | | 787 Seventh Avenue
New York, NY 10019 |
|
|
| An investor should consider the investment objectives, risks, charges, and expenses of the Fund carefully before investing. The prospectus and summary prospectus contain this and other information about the Fund. An investor may obtain the prospectus and summary prospectus by visiting our website atpgiminvestments.com or by calling(800) 225-1852. The prospectus and summary prospectus should be read carefully before investing. |
|
| E-DELIVERY |
| To receive your mutual fund documents online, go topgiminvestments.com/edelivery and enroll. Instead of receiving printed documents by mail, you will receive notification via email when new materials are available. You can cancel your enrollment or change your email address at any time byvisiting the website address above. |
|
| SHAREHOLDER COMMUNICATIONS WITH DIRECTORS |
| Shareholders can communicate directly with the Board of Directors by writing to the Chair of the Board, PGIM Emerging Markets Debt Hard Currency Fund, PGIM Investments, Attn: Board of Directors, 655 Broad Street, Newark, NJ 07102. Shareholders can communicate directly with an individual Director by writing to the same address. Communications are not screened before being delivered to the addressee. |
|
| AVAILABILITY OF PORTFOLIO HOLDINGS |
| The Fund files its complete schedule of portfolio holdings with the Securities and Exchange Commission on Form N-PORT. The Fund’s Form N-PORT filings are available on the Commission’s website at sec.gov. Form N-PORT is filed with the Commission quarterly, and each Fund’s full portfolio holdings as of the first and third fiscal quarter-ends (as of the third month of the Fund’s fiscal quarter for reporting periods on or after September 30, 2019) will be made publicly available 60 days after the end of each quarter at sec.gov. |
|
| The Fund’s Statement of Additional Information contains additional information about the Fund’s Directors and is available without charge, upon request, by calling (800) 225-1852. |
Mutual Funds:
| | | | |
| ARE NOT INSURED BY THE FDIC OR ANY FEDERAL GOVERNMENT AGENCY | | MAY LOSE VALUE | | ARE NOT A DEPOSIT OF OR GUARANTEED BY ANY BANK OR ANY BANK AFFILIATE |
PGIM EMERGING MARKETS DEBT HARD CURRENCY FUND
| | | | | | | | |
| SHARE CLASS | | A | | C | | Z | | R6 |
| NASDAQ | | PDHAX | | PDHCX | | PDHVX | | PDHQX |
| CUSIP | | 743969479 | | 743969461 | | 743969446 | | 743969453 |
MF239E
Item 2 – Code of Ethics — See Exhibit (a)
As of the end of the period covered by this report, the registrant has adopted a code of ethics (the “Section 406 Standards for Investment Companies – Ethical Standards for Principal Executive and Financial Officers”) that applies to the registrant’s Principal Executive Officer and Principal Financial Officer; the registrant’s Principal Financial Officer also serves as the Principal Accounting Officer.
The registrant hereby undertakes to provide any person, without charge, upon request, a copy of the code of ethics. To request a copy of the code of ethics, contact the registrant800-225-1852, and ask for a copy of the Section 406 Standards for Investment Companies - Ethical Standards for Principal Executive and Financial Officers.
Item 3 – Audit Committee Financial Expert
The registrant’s Board has determined that Mr. Kevin J. Bannon, member of the Board’s Audit Committee is an “audit committee financial expert,” and that he is “independent,” for purposes of this Item.
Item 4 – Principal Accountant Fees and Services
(a) Audit Fees
For the fiscal years ended October 31, 2019 and October 31, 2018, KPMG LLP (“KPMG”), the Registrant’s principal accountant, billed the Registrant $244,707 and $242,631 respectively, for professional services rendered for the audit of the Registrant’s annual financial statements or services that are normally provided in connection with statutory and regulatory filings.
(b) Audit-Related Fees
For the fiscal year ended October 31, 2019, fees of $9,926 were billed to the Registrant for services rendered by KPMG in connection with an accounting system conversion and were paid by The Bank of New York Mellon. For the fiscal year ended October 31, 2018, there are no fees to report.
(c)Tax Fees
For the fiscal years ended October 31, 2019 and October 31, 2018: none.
(d)All Other Fees
For the fiscal years ended October 31, 2019 and October 31, 2018: none.
(e) (1)Audit CommitteePre-Approval Policies and Procedures
THE PGIM MUTUAL FUNDS
AUDIT COMMITTEE POLICY
on
Pre-Approval of Services Provided by the Independent
Accountants
The Audit Committee of each PGIM Mutual Fund is charged with the responsibility to monitor the independence of the Fund’s independent accountants. As part of this responsibility, the Audit Committee mustpre-approve the independent accounting firm’s engagement to render audit and/or permissiblenon-audit services, as required by law. In evaluating a proposed engagement of the independent accountants, the Audit Committee will assess the effect that the engagement might reasonably be expected to have on the accountant’s independence. The Committee’s evaluation will be based on:
| | • | | a review of the nature of the professional services expected to be provided, |
| | • | | a review of the safeguards put into place by the accounting firm to safeguard independence, and |
| | • | | periodic meetings with the accounting firm. |
Policy for Audit andNon-Audit Services Provided to the Funds
On an annual basis, the scope of audits for each Fund, audit fees and expenses, and audit-related andnon-audit services (and fees proposed in respect thereof) proposed to be performed by the Fund’s independent accountants will be presented by the Treasurer and the independent accountants to the Audit Committee for review and, as appropriate, approval prior to the initiation of such services.
Such presentation shall be accompanied by confirmation by both the Treasurer and the independent accountants that the proposednon-audit services will not adversely affect the independence of the independent accountants. Such proposednon-audit services shall be described in sufficient detail to enable the Audit Committee to assess the appropriateness of such services and fees, and the compatibility of the provision of such services with the auditor’s independence. The Committee shall receive periodic reports on the progress of the audit and other services which are approved by the Committee or by the Committee Chair pursuant to authority delegated in this Policy.
The categories of services enumerated under “Audit Services”, “Audit-related Services”, and “Tax Services” are intended to provide guidance to the Treasurer and the independent accountants as to those categories of services which the Committee believes are generally consistent with the independence of the independent accountants and which the Committee (or the Committee Chair) would expect upon the presentation of specific proposals topre-approve. The enumerated categories are not intended as an exclusive list of audit, audit-related or tax services, which the Committee (or the Committee Chair) would consider forpre-approval.
Audit Services
The following categories of audit services are considered to be consistent with the role of the Fund’s independent accountants:
| | • | | Annual Fund financial statement audits |
| | • | | Seed audits (related to new product filings, as required) |
| | • | | SEC and regulatory filings and consents |
Audit-related Services
The following categories of audit-related services are considered to be consistent with the role of the Fund’s independent accountants:
| | • | | Accounting consultations |
| | • | | Fund merger support services |
| | • | | Agreed Upon Procedure Reports |
| | • | | Other Internal Control Reports |
Individual audit-related services that fall within one of these categories (except for fund merger support services) and are not presented to the Audit Committee as part of the annualpre-approval process are subject to an authorizedpre-approval by the Audit Committee so long as the estimated fee for those services does not exceed $30,000. Any services provided under suchpre-approval will be reported to the Audit Committee at its next regular meeting. Should the amount of such services exceed $30,000 any additional fees will be subject topre-approval by the Committee Chair (or any other Committee member on whom this responsibility has been delegated). Fees related to fund merger support services are subject to a separate authorizedpre-approval by the Audit Committee with fees determined on a per occurrence and merger complexity basis.
Tax Services
The following categories of tax services are considered to be consistent with the role of the Fund’s independent accountants:
| | • | | Tax compliance services related to the filing or amendment of the following: |
| | • | | Federal, state and local income tax compliance; and, |
| | • | | Sales and use tax compliance |
| | • | | Timely RIC qualification reviews |
| | • | | Tax distribution analysis and planning |
| | • | | Tax authority examination services |
| | • | | Tax appeals support services |
| | • | | Accounting methods studies |
| | • | | Fund merger support services |
| | • | | Tax consulting services and related projects |
Individual tax services that fall within one of these categories and are not presented to the Audit Committee as part of the annualpre-approval process are subject to an authorizedpre-approval by the Audit Committee so long as the estimated fee for those services does not exceed $30,000. Any services provided under suchpre-approval will be reported to the Audit Committee at its next regular meeting. Should the amount of such services exceed $30,000 any additional fees will be subject topre-approval by the Committee Chair (or any other Committee member on whom this responsibility has been delegated).
OtherNon-Audit Services
Certainnon-audit services that the independent accountants are legally permitted to render will be subject topre-approval by the Committee or by one or more Committee members to whom the Committee has delegated this authority and who will report to the full Committee anypre-approval decisions made pursuant to this Policy.Non-audit services presented forpre-approval pursuant to this paragraph will be accompanied by a confirmation from both the Treasurer and the independent accountants that the proposed services will not adversely affect the independence of the independent accountants.
Proscribed Services
The Fund’s independent accountants will not render services in the following categories ofnon-audit services:
| | • | | Bookkeeping or other services related to the accounting records or financial statements of the Fund |
| | • | | Financial information systems design and implementation |
| | • | | Appraisal or valuation services, fairness opinions, orcontribution-in-kind reports |
| | • | | Internal audit outsourcing services |
| | • | | Management functions or human resources |
| | • | | Broker or dealer, investment adviser, or investment banking services |
| | • | | Legal services and expert services unrelated to the audit |
| | • | | Any other service that the Public Company Accounting Oversight Board determines, by regulation, is impermissible. |
Pre-approval ofNon-Audit Services Provided to Other Entities Within the PGIM Fund Complex
Certainnon-audit services provided to PGIM Investments LLC or any of its affiliates that also provide ongoing services to the PGIM Mutual Funds will be subject topre-approval by the Audit Committee. The onlynon-audit services provided to these entities that will requirepre-approval are thoserelated directly to the operations and financial reporting of the Funds. Individual projects that are not presented to the Audit Committee as part of the annualpre-approval process will be subject
topre-approval by the Committee Chair (or any other Committee member on whom this responsibility has been delegated) so long as the estimated fee for those services does not exceed $30,000. Services presented forpre-approval pursuant to this paragraph
will be accompanied by a confirmation from both the Treasurer and the independent accountants that the proposed services will not adversely affect the independence of the independent accountants.
Although the Audit Committee will notpre-approve all services provided to PGIM Investments LLC and its affiliates, the Committee will receive an annual report from the Fund’s independent accounting firm showing the aggregate fees for all services provided to PGIM Investments and its affiliates.
(e) (2)Percentageofservicesreferredtoin4(b)–4(d)thatwereapprovedbytheauditcommittee.
For the fiscal year ended October 31, 2019, 100% of the services referred to in Item 4(b) was approved by the audit committee. For the fiscal year ended October 31, 2018: none.
(f)Percentage of hours expended attributable to work performed by other than full time employees of principal accountant if greaterthan 50%.
The percentage of hours expended on the principal accountant’s engagement to audit the registrant’s financial statements for the most recent fiscal year that were attributed to work performed by persons other than the principal accountant’s full-time, permanent employees was 0%.
(g)Non-Audit Fees
The aggregatenon-audit fees billed by KPMG for services rendered to the registrant’s investment adviser and any entity controlling, controlled by, or under common control with the investment adviser that provides ongoing services to the registrant for the fiscal years ended October 31, 2019 and October 31, 2018 was $0 and $0, respectively.
(h)Principal Accountant’s Independence
Not applicable as KPMG has not providednon-audit services to the registrant’s investment adviser and any entity controlling, controlled by, or under common control with the investment adviser that provides ongoing services to the registrant that were notpre-approved pursuant to Rule2-01(c)(7)(ii) of RegulationS-X.
Item 5 – Audit Committee of Listed Registrants –
The registrant has a separately designated standing audit committee (the “Audit Committee”) established in accordance with Section 3(a)(58)(A) of the Securities Exchange Act of 1934. The members of the Audit Committee are Kevin J. Bannon (chair), Laurie Simon Hodrick, Michael S. Hyland, CFA, Brian K. Reid, and Keith F. Hartstein(ex-officio).
Item 6 – Schedule of Investments – The schedule is included as part of the report to shareholders filed under Item 1 of this Form.
Item 7 – Disclosure of Proxy Voting Policies and Procedures forClosed-End Management Investment Companies – Not applicable.
Item 8 – Portfolio Managers ofClosed-End Management Investment Companies – Not applicable.
Item 9 – Purchases of Equity Securities byClosed-End Management Investment Company and Affiliated Purchasers – Not applicable.
Item 10 – Submission of Matters to a Vote of Security Holders – There have been no material changes to these procedures.
Item 11 – Controls and Procedures
| | (a) | It is the conclusion of the registrant’s principal executive officer and principal financial officer that the effectiveness of the registrant’s current disclosure controls and procedures (such disclosure controls and |
| | procedures having been evaluated within 90 days of the date of this filing) provide reasonable assurance that the information required to be disclosed by the registrant has been recorded, processed, summarized and reported within the time period specified in the Commission’s rules and forms and that the information required to be disclosed by the registrant has been accumulated and communicated to the registrant’s principal executive officer and principal financial officer in order to allow timely decisions regarding required disclosure. |
| | (b) | There has been no significant change in the registrant’s internal control over financial reporting that occurred during the registrant’s most recent fiscal quarter of the period covered by this report that has materially affected, or is likely to materially affect, the registrant’s internal control over financial reporting. |
Item 12 – Controls and Procedures - Disclosure of Securities Lending Activities forClosed-End Management Investment Companies – Not applicable.
Item 13 – Exhibits
| | (a) | (1) Code of Ethics – Attached hereto as ExhibitEX-99.CODE-ETH |
| | (2) | Certifications pursuant to Section 302 of the Sarbanes-Oxley Act – Attached hereto as ExhibitEX-99.CERT. |
| | (3) | Any written solicitation to purchase securities under Rule23c-1. – Not applicable. |
| | (b) | Certifications pursuant to Section 906 of the Sarbanes-Oxley Act – Attached hereto as ExhibitEX-99.906CERT. |
SIGNATURES
Pursuant to the requirements of the Securities Exchange Act of 1934 and the Investment Company Act of 1940, the registrant has duly caused this report to be signed on its behalf by the undersigned, thereunto duly authorized.
| | |
| Registrant: | | Prudential World Fund, Inc. |
| |
| By: | | /s/ Andrew R. French |
| | Andrew R. French |
| | Secretary |
| |
| Date: | | December 19, 2019 |
Pursuant to the requirements of the Securities Exchange Act of 1934 and the Investment Company Act of 1940, this report has been signed below by the following persons on behalf of the registrant and in the capacities and on the dates indicated.
| | |
| By: | | /s/ Stuart S. Parker |
| | Stuart S. Parker |
| | President and Principal Executive Officer |
| |
| Date: | | December 19, 2019 |
| |
| By: | | /s/ Christian J. Kelly |
| | Christian J. Kelly |
| | Treasurer and Principal Financial and Accounting Officer |
| |
| Date: | | December 19, 2019 |