UNITED STATES
SECURITIES AND EXCHANGE COMMISSION
Washington, D.C. 20549
FORM N-CSR
CERTIFIED SHAREHOLDER REPORT OF REGISTERED MANAGEMENT INVESTMENT COMPANIES
| Investment Company Act file number: | 811-03981 | |
| Exact name of registrant as specified in charter: | Prudential World Fund, Inc. | |
| Address of principal executive offices: | 655 Broad Street, 17th Floor | |
| Newark, New Jersey 07102 | ||
| Name and address of agent for service: | Deborah A. Docs | |
| 655 Broad Street, 17th Floor | ||
| Newark, New Jersey 07102 | ||
| Registrant’s telephone number, including area code: | 800-225-1852 | |
| Date of fiscal year end: | 10/31/2017 | |
| Date of reporting period: | 10/31/2017 | |
Item 1 – Reports to Stockholders

PRUDENTIAL QMA INTERNATIONAL EQUITY FUND
ANNUAL REPORT
OCTOBER 31, 2017

To enroll in e-delivery, go to pgiminvestments.com/edelivery
| Objective: Long-term growth of capital |
Highlights
| • | Regionally, value was added to the Fund across most markets, led by Germany, Brazil, and Canada. The most significant detractions were in Japan, Spain, Chile, Switzerland and Norway. |
| • | At the sector level, value added was led by the most growth-centric segments: information technology, consumer discretionary, and energy. The only detraction was in telecommunications services. |
This report is not authorized for distribution to prospective investors unless preceded or accompanied by a current prospectus.
The views expressed in this report and information about the Fund’s portfolio holdings are for the period covered by this report and are subject to change thereafter.
Mutual funds are distributed by Prudential Investment Management Services LLC, a Prudential Financial company and member SIPC. QMA is the primary business name of Quantitative Management Associates LLC, a wholly owned subsidiary of PGIM, Inc. (PGIM), a Prudential Financial company. © 2017 Prudential Financial, Inc. and its related entities. PGIM and the PGIM logo are service marks of Prudential Financial, Inc. and its related entities, registered in many jurisdictions worldwide.
| 2 | Visit our website at pgiminvestments.com |
PRUDENTIAL FUNDS — UPDATE
The Board of Directors/Trustees for the Fund has approved renaming the Fund’s Class Q shares as Class R6 shares, effective on or about June 15, 2018. The renaming of Class Q shares as Class R6 shares will not result in any changes to pricing, eligibility, or shareholder rights and obligations. The renamed Class R6 shares will not be exchangeable with Class R6 shares of the Prudential Day One Funds or the Prudential 60/40 Allocation Fund.
LR993
| Prudential QMA International Equity Fund | 3 |
PRUDENTIAL FUNDS — UPDATE
Effective on or about June 1, 2018 (the “Effective Date”), the Fund’s Class A, Class C, Class R, and Class Z shares, as applicable, will be closed to investments by new group retirement plans, except as discussed below. Existing group retirement plans as of the Effective Date may keep their investments in their current share class and may continue to make additional purchases or exchanges of that class of shares. As of the Effective Date, all new group retirement plans wishing to add the Fund as a new addition to the plan generally will be into one of the available Class Q shares, Class R2 shares, or Class R4 shares of the Fund.
In addition, on or about the Effective Date, the Class R shares of the Fund will be closed to all new investors, except as discussed below. Due to the closing of the Class R shares to new investors, effective on or about the Effective Date new IRA investors may only purchase Class A, Class C, Class Z, or Class Q shares of the Fund, subject to share class eligibility. Following the Effective Date, no new accounts may be established in the Fund’s Class R shares and no Class R shares may be purchased or acquired by any new Class R shareholder, except as discussed below.
| Class A | Class C | Class Z | Class R | |||||
Existing Investors (Group Retirement Plans, IRAs, and all other investors) | No Change | No Change | No Change | No Change | ||||
| New Group Retirement Plans | Closed to group retirement plans wishing to add the share classes as new additions to plan menus on or about June 1, 2018, subject to certain exceptions below | |||||||
New IRAs | No Change | No Change | No Change | Closed to all new investors on or about June 1, 2018, subject to certain exceptions below | ||||
| All Other New Investors | No Change | No Change | No Change | |||||
| 4 | Visit our website at pgiminvestments.com |
However, the following new investors may continue to purchase Class A, Class C, Class R, and Class Z shares of the Fund, as applicable:
| • | Eligible group retirement plans who are exercising their one-time 90-day repurchase privilege in the Fund will be permitted to purchase such share classes. |
| • | Plan participants in a group retirement plan that offers Class A, Class C, Class R, or Class Z shares of the Fund as of the Effective Date will be permitted to purchase such share classes of the Fund, even if the plan participant did not own shares of that class of the Fund as of the Effective Date. |
| • | Certain new group retirement plans will be permitted to offer such share classes of the Fund after the Effective Date, provided that the plan has or is actively negotiating a contractual agreement with the Fund’s distributor or service provider to offer such share classes of the Fund prior to or on the Effective Date. |
| • | New group retirement plans that combine with, replace, or are otherwise affiliated with a current plan that invests in such share classes prior to or on the Effective Date will be permitted to purchase such share classes. |
The Fund also reserves the right to refuse any purchase order that might disrupt management of the Fund or to otherwise modify the closure policy at any time on a case-by-case basis.
| Prudential QMA International Equity Fund | 5 |
This Page Intentionally Left Blank
| 6 | Visit our website at pgiminvestments.com |
Letter from the President

Dear Shareholder:
We hope you find the annual report for the Prudential QMA International Equity Fund informative and useful. The report covers performance for the 12-month period ended October 31, 2017.
Significant events during the reporting period included a new US president, followed by uncertainty in Congress over implementing the Trump
administration’s policy initiatives. Elsewhere, Britain began its formal legal process to leave the European Union. France elected a more centrist president, which was viewed as a pro-euro referendum. North Korea’s missile launches escalated geopolitical tensions. Also, late in the period, a series of hurricanes caused damage in the US and the Caribbean.
Despite some turbulence in the macro-environment, solid economic fundamentals in the US economy included moderate gross domestic product expansion, robust employment, and accelerating corporate profit growth. Inflation remained tame. The Federal Reserve raised its federal funds rate twice in 2017, and is in the process of winding down its stimulus program.
Global economic growth remained mostly positive. Equities in the US reached new highs amid low volatility, while international equities posted strong gains. European stocks continued to gain. Asian markets were solid, and emerging markets outperformed most regions. Fixed income markets were mixed. High yield and emerging markets bonds were the top performers.
Given the uncertainty in today’s investment environment, we believe that active professional portfolio management offers a potential advantage. Active managers often have the knowledge and flexibility to find the best investment opportunities in the most challenging markets.
Even so, it’s best if investment decisions are based on your long-term goals rather than on short-term market and economic developments. We also encourage you to work with an experienced financial advisor who can help you set goals, determine your tolerance for risk, and build a diversified plan that’s right for you and make adjustments when necessary.
At PGIM Investments, we consider it a great privilege and responsibility to help investors participate in opportunities across global markets while meeting their toughest investment challenges. We’re part of PGIM, a top-10 global investment manager with more than $1 trillion in assets under management. This investment expertise allows us to deliver actively managed funds and strategies to meet the needs of investors around the globe.
Thank you for choosing our family of funds.
Sincerely,

Stuart S. Parker, President
Prudential QMA International Equity Fund
December 15, 2017
| Prudential QMA International Equity Fund | 7 |
Your Fund’s Performance (unaudited)
Performance data quoted represents past performance. Past performance does not guarantee future results. The investment return and principal value of an investment will fluctuate, so that an investor’s shares, when redeemed, may be worth more or less than their original cost. Current performance may be lower or higher than the past performance data quoted. An investor may obtain performance data as of the most recent month-end by visiting our website at www.pgiminvestments.com or by calling (800) 225-1852.
Average Annual Total Returns as of 10/31/17 (with sales charges) | ||||||||
| One Year (%) | Five Years (%) | Ten Years (%) | Since Inception (%) | |||||
| Class A | 18.28 | 6.69 | –0.89 | — | ||||
| Class B | 19.12 | 7.01 | –1.03 | — | ||||
| Class C | 23.33 | 7.16 | –1.02 | — | ||||
| Class Q | N/A | N/A | N/A | 27.22* (12/28/16) | ||||
| Class Z | 25.46 | 8.23 | –0.06 | — | ||||
| MSCI All Country World Ex-US Index | 23.64 | 7.29 | 0.92 | — | ||||
| Lipper International Multi-Cap Core Funds Average | 23.11 | 8.33 | 0.99 | — | ||||
Average Annual Total Returns as of 10/31/17 (without sales charges) | ||||||||
| One Year (%) | Five Years (%) | Ten Years (%) | Since Inception (%) | |||||
| Class A | 25.17 | 7.91 | –0.33 | — | ||||
| Class B | 24.12 | 7.16 | –1.03 | — | ||||
| Class C | 24.33 | 7.16 | –1.02 | — | ||||
| Class Q | N/A | N/A | N/A | 27.22* (12/28/16) | ||||
| Class Z | 25.46 | 8.23 | –0.06 | — | ||||
| MSCI All Country World Ex-US Index | 23.64 | 7.29 | 0.92 | — | ||||
| Lipper International Multi-Cap Core Funds Average | 23.11 | 8.33 | 0.99 | — | ||||
*Not annualized
| 8 | Visit our website at pgiminvestments.com |
Growth of a $10,000 Investment
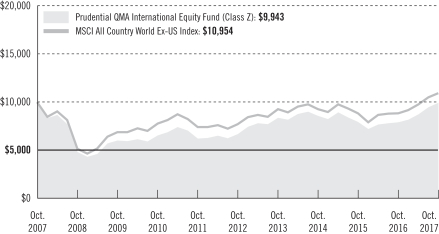
The graph compares a $10,000 investment in the Prudential QMA International Equity Fund (Class Z shares) with a similar investment in the MSCI All Country World Ex-US Index by portraying the initial account values at the beginning of the 10-year period for Class Z shares (October 31, 2007) and the account values at the end of the current fiscal year (October 31, 2017) as measured on a quarterly basis. For purposes of the graph, and unless otherwise indicated, it has been assumed that (a) all recurring fees (including management fees) were deducted; and (b) all dividends and distributions were reinvested. The line graph provides information for Class Z shares only. As indicated in the tables provided earlier, performance for Class A, Class B, Class C, and Class Q shares will vary due to the differing charges and expenses applicable to each share class (as indicated in the following paragraphs). Without waiver of fees and/or expense reimbursements, if any, the Fund’s returns would have been lower.
Past performance does not predict future performance. Total returns and the ending account values in the graph include changes in share price and reinvestment of dividends and capital gains distributions in a hypothetical investment for the periods shown. The Fund’s total returns do not reflect the deduction of income taxes on an individual’s investment. Taxes may reduce your actual investment returns on income or gains paid by the Fund or any gains you may realize if you sell your shares.
Source: PGIM Investments LLC and Lipper Inc.
Since Inception returns are provided for any share class with less than 10 fiscal years of returns. Since Inception returns for the Index and the Lipper Average are measured from the inception date for the indicated share class.
| Prudential QMA International Equity Fund | 9 |
Your Fund’s Performance (continued)
The returns in the tables do not reflect the deduction of taxes that a shareholder would pay on Fund distributions or following the redemption of Fund shares. The average annual total returns take into account applicable sales charges, which are described for each share class in the table below.
| Class A* | Class B** | Class C* | Class Q | Class Z* | ||||||
| Maximum initial sales charge | 5.50% of the public offering price | None | None | None | None | |||||
| Contingent deferred sales charge (CDSC) (as a percentage of the lower of original purchase price or net asset value at redemption) | 1.00% on sales of $1 million or more made within 12 months of purchase | 5.00% (Yr.1) 4.00% (Yr.2) 3.00% (Yr.3) 2.00% (Yr.4) 1.00% (Yr.5) 1.00% (Yr.6) 0.00% (Yr.7) | 1.00% on sales made within 12 months of purchase | None | None | |||||
| Annual distribution and service (12b-1) fees (shown as a percentage of average daily net assets) | 0.30% | 1.00% | 1.00% | None | None |
*Certain share classes will be generally closed to investments by new group retirement plans effective on or about June 1, 2018. Please see the “PRUDENTIAL FUNDS—UPDATE” on page 4 of this report for more information.
**Class B shares are closed to all purchase activity and no additional Class B shares may be purchased or acquired except by exchange from Class B shares of another Fund or through dividend or capital gains reinvestment.
Benchmark Definitions
MSCI All Country World Ex-US Index—The Morgan Stanley Capital International All Country World ex-US Index (MSCI ACWI ex-US Index) is an unmanaged free float-adjusted market-capitalization weighted index that is designed to measure the equity market performance of developed and emerging markets, excluding the US. The cumulative total return for the Index measured from the month-end closest to the inception date of the Fund’s Class Q shares through 10/31/17 is 23.41%.
Lipper International Multi-Cap Core Funds Average—The Lipper International Multi-Cap Core Funds Average (Lipper Average) is based on the average return of all funds in the Lipper International Multi-Cap Core Funds universe for the periods noted. Funds in the Lipper Average are funds that, by portfolio practice, invest in a variety of market-capitalization ranges without concentrating 75% of their equity assets in any one market-capitalization range over an extended period of time. International multi-cap core funds typically have above-average characteristics compared to the MSCI EAFE Index. The cumulative total return for the Lipper Average measured from the month-end closest to the inception date of the Fund’s Class Q shares through 10/31/17 is 22.41%.
| 10 | Visit our website at pgiminvestments.com |
Investors cannot invest directly in an index or average. The returns for the Index would be lower if they included the effects of sales charges, operating expenses of a mutual fund, or taxes. Returns for the Lipper Average reflect the deduction of operating expenses, but not sales charges or taxes.
Presentation of Fund Holdings
| Five Largest Holdings expressed as a percentage of net assets as of 10/31/17 (%) | ||||
| Samsung Electronics Co. Ltd., Technology Hardware, Storage & Peripherals | 1.9 | |||
| HSBC Holdings PLC, Banks | 1.4 | |||
| Roche Holding AG, Pharmaceuticals | 1.3 | |||
| Allianz SE, Insurance | 1.2 | |||
| Novartis AG, Pharmaceuticals | 1.2 | |||
Holdings reflect only long-term investments and are subject to change.
| Five Largest Industries expressed as a percentage of net assets as of 10/31/17 (%) | ||||
| Banks | 14.6 | |||
| Pharmaceuticals | 6.9 | |||
| Oil, Gas & Consumable Fuels | 6.9 | |||
| Insurance | 4.9 | |||
| Metals & Mining | 4.5 | |||
Industry weightings reflect only long-term investments and are subject to change.
| Prudential QMA International Equity Fund | 11 |
Strategy and Performance Overview
How did the Fund perform?
The Prudential QMA International Equity Fund’s Class Z shares gained 25.46% for the 12-month period ended October 31, 2017, outperforming the 23.64% gain of the MSCI All Country World Ex-US (MSCI ACWI Ex-US) Index (the Index) and outperforming the 23.11% gain of the Lipper International Multi-Cap Core Funds Average.
What were market conditions?
| • | Equity returns were strong in the 12-month period ended October 31, 2017, as global gross domestic product advanced at a healthy pace, long-term interest rates remained close to historical lows, and central banks tightened monetary policy prudently and gradually in light of subdued inflation. |
| • | In the US, solid economic fundamentals included stable and moderate economic expansion, robust employment, accelerating corporate profit growth, and accumulating cash on company balance sheets. |
| • | North Korean missile activity, ongoing investigations into Russia’s interference in the 2016 election, and turnover in key administration positions contributed to uncertainty. |
| • | Europe’s economic recovery proceeded, and emerging markets had their best performance since the aftermath of the financial crisis. Japan likewise showed healthier trends in economic activity. |
| • | Most sectors advanced, with information technology, financials, materials, and industrials posting the largest gains, while returns in telecommunications services and consumer staples were more modest. |
| • | Likewise, all regions were positive, with developed Europe and emerging markets leading the others. |
What worked?
| • | After finishing the fourth quarter of 2016 with positive returns in its underlying factors, the valuation component in the model struggled. However, strong performance from growth factors offset that weakness, particularly in emerging markets. |
| • | Although effective, the growth component was more mixed among developed countries as the more prominent earnings revisions factor was the weakest metric. The financial momentum and quality factors were also productive, with the latter posting a more variable performance in emerging markets. |
| • | The Fund’s positions in Germany performed well. More than half of the country’s gains stemmed from industrials; specifically, from an overweight in the airlines industry, which rose impressively. |
| 12 | Visit our website at pgiminvestments.com |
| • | Exposure to Canada also added to value and was broadly distributed, led most notably by an underweight in energy and security selection in consumer discretionary. |
| • | In Brazil, gains from security selection in consumer discretionary were furthered by security selection and an overweight in financials, which were up, and an underweight in energy, which was down. |
What didn’t work?
| • | The telecommunications services sector was a key detractor. It was the only segment that underperformed its target. The losses were driven predominantly by difficult selection in Japan and Korea. |
| • | In Japan, gains in industrials, materials, and information technology were eclipsed by selection and positioning against the Index in telecommunication services, consumer discretionary, and health care. |
| • | In Spain, difficult stock picking in industrials was exacerbated by an underweight in financials, which outperformed. Also, the Fund’s exposure to the consumer staples sector in Chile was not rewarded. |
The percentage points shown in the tables below identify each security’s positive or negative contribution to the Fund’s return relative to the benchmark, which is the sum of all contributions by individual holdings.
| Top Contributors (%) | Top Detractors (%) | |||||
| Deutsche Lufthansa AG | 0.48 | Tencent Holdings Ltd. | –0.32 | |||
| Magazine Luiza S.A. | 0.30 | Japan Tobacco Inc. | –0.21 | |||
Samsung Electronics Co., Ltd. | 0.28 | Siemens Gamesa Renewable Energy, S.A. | –0.19 | |||
SK Hynix Inc. | 0.23 | Astellas Pharma Inc. | –0.18 | |||
Societe Generale S.A. | 0.21 | KT Corporation | –0.17 | |||
Current outlook
QMA manages risk-controlled portfolios using a bottom-up process which focuses on factors within four broad groups: valuation, growth (analyst revisions), financial momentum, and quality. All overweight and underweight positions are the result of the Fund’s stock selection process and do not reflect sentiment on any particular market segment.
| Prudential QMA International Equity Fund | 13 |
Fees and Expenses (unaudited)
As a shareholder of the Fund, you incur two types of costs: (1) transaction costs, including sales charges (loads) on purchase payments and redemptions, as applicable, and (2) ongoing costs, including management fees, distribution, and/or service (12b-1) fees, and other Fund expenses, as applicable. This example is intended to help you understand your ongoing costs (in dollars) of investing in the Fund and to compare these costs with the ongoing costs of investing in other mutual funds.
The example is based on an investment of $1,000 held through the six-month period ended October 31, 2017. The example is for illustrative purposes only; you should consult the Prospectus for information on initial and subsequent minimum investment requirements.
Actual Expenses
The first line for each share class in the table on the following page provides information about actual account values and actual expenses. You may use the information on this line, together with the amount you invested, to estimate the expenses that you paid over the period. Simply divide your account value by $1,000 (for example, an $8,600 account value ÷ $1,000 = 8.6), then multiply the result by the number on the first line under the heading “Expenses Paid During the Six-Month Period” to estimate the expenses you paid on your account during this period.
Hypothetical Example for Comparison Purposes
The second line for each share class in the table on the following page provides information about hypothetical account values and hypothetical expenses based on the Fund’s actual expense ratio and an assumed rate of return of 5% per year before expenses, which is not the Fund’s actual return. The hypothetical account values and expenses may not be used to estimate the actual ending account balance or expenses you paid for the period. You may use this information to compare the ongoing costs of investing in the Fund and other funds. To do so, compare this 5% hypothetical example with the 5% hypothetical examples that appear in the shareholder reports of the other funds.
The Fund’s transfer agent may charge additional fees to holders of certain accounts that are not included in the expenses shown in the table on the following page. These fees apply to individual retirement accounts (IRAs) and Section 403(b) accounts. As of the close of the six-month period covered by the table, IRA fees included an annual maintenance fee of $15 per account (subject to a maximum annual maintenance fee of $25 for all accounts held by the same shareholder). Section 403(b) accounts are charged an annual $25 fiduciary maintenance fee. Some of the fees may vary in amount, or may be waived, based on your total account balance or the number of Prudential funds, including the Fund, that you own. You should consider the additional fees that were charged to your Fund account over the six-month period when you estimate the total ongoing expenses paid over the
| 14 | Visit our website at pgiminvestments.com |
period and the impact of these fees on your ending account value, as these additional expenses are not reflected in the information provided in the expense table. Additional fees have the effect of reducing investment returns.
Please note that the expenses shown in the table are meant to highlight your ongoing costs only and do not reflect any transactional costs such as sales charges (loads). Therefore, the second line for each share class in the table is useful in comparing ongoing costs only and will not help you determine the relative total costs of owning different funds. In addition, if these transactional costs were included, your costs would have been higher.
| Prudential QMA International Equity Fund | Beginning Account Value May 1, 2017 | Ending Account October 31, 2017 | Annualized Expense Ratio Based on the Six-Month Period | Expenses Paid During the Six-Month Period* | ||||||||||||||
| Class A | Actual | $ | 1,000.00 | $ | 1,134.10 | 1.48 | % | $ | 7.96 | |||||||||
| Hypothetical | $ | 1,000.00 | $ | 1,017.74 | 1.48 | % | $ | 7.53 | ||||||||||
| Class B | Actual | $ | 1,000.00 | $ | 1,129.30 | 2.39 | % | $ | 12.83 | |||||||||
| Hypothetical | $ | 1,000.00 | $ | 1,013.16 | 2.39 | % | $ | 12.13 | ||||||||||
| Class C | Actual | $ | 1,000.00 | $ | 1,129.30 | 2.26 | % | $ | 12.13 | |||||||||
| Hypothetical | $ | 1,000.00 | $ | 1,013.81 | 2.26 | % | $ | 11.47 | ||||||||||
| Class Q | Actual | $ | 1,000.00 | $ | 1,137.20 | 0.88 | % | $ | 4.74 | |||||||||
| Hypothetical | $ | 1,000.00 | $ | 1,020.77 | 0.88 | % | $ | 4.48 | ||||||||||
| Class Z | Actual | $ | 1,000.00 | $ | 1,134.40 | 1.20 | % | $ | 6.46 | |||||||||
| Hypothetical | $ | 1,000.00 | $ | 1,019.16 | 1.20 | % | $ | 6.11 | ||||||||||
*Fund expenses (net of fee waivers or subsidies, if any) for each share class are equal to the annualized expense ratio for each share class (provided in the table), multiplied by the average account value over the period, multiplied by the 184 days in the six-month period ended October 31, 2017, and divided by the 365 days in the Fund’s fiscal year ended October 31, 2017 (to reflect the six-month period). Expenses presented in the table include the expenses of any underlying funds in which the Fund may invest.
| Prudential QMA International Equity Fund | 15 |
Schedule of Investments
as of October 31, 2017
| Description | Shares | Value | ||||||
LONG-TERM INVESTMENTS 99.6% | ||||||||
COMMON STOCKS 97.6% | ||||||||
Australia 3.2% | ||||||||
Aristocrat Leisure Ltd. | 112,687 | $ | 2,037,190 | |||||
Aventus Retail Property Fund Ltd. | 297,485 | 528,863 | ||||||
Charter Hall Group | 207,967 | 924,622 | ||||||
CIMIC Group Ltd. | 31,261 | 1,159,750 | ||||||
Computershare Ltd. | 12,917 | 154,417 | ||||||
Fortescue Metals Group Ltd. | 349,581 | 1,242,974 | ||||||
Macquarie Group Ltd. | 24,094 | 1,817,651 | ||||||
Metcash Ltd. | 459,128 | 948,469 | ||||||
SmartGroup Corp. Ltd. | 39,130 | 291,470 | ||||||
|
| |||||||
| 9,105,406 | ||||||||
Austria 0.7% | ||||||||
OMV AG | 3,216 | 193,003 | ||||||
voestalpine AG | 34,859 | 1,916,490 | ||||||
|
| |||||||
| 2,109,493 | ||||||||
Belgium 0.6% | ||||||||
KBC Group NV | 19,811 | 1,645,679 | ||||||
Brazil 1.0% | ||||||||
Cia de Saneamento Basico do Estado de Sao Paulo | 142,600 | 1,304,685 | ||||||
Magazine Luiza SA | 41,600 | 811,323 | ||||||
Petroleo Brasileiro SA* | 40,600 | 215,827 | ||||||
Qualicorp SA | 15,100 | 161,464 | ||||||
Transmissora Alianca de Energia Eletrica SA, UTS | 25,600 | 160,817 | ||||||
Vale SA | 33,800 | 333,423 | ||||||
|
| |||||||
| 2,987,539 | ||||||||
Canada 5.9% | ||||||||
Bank of Nova Scotia (The) | 31,400 | 2,026,968 | ||||||
Barrick Gold Corp. | 15,500 | 223,952 | ||||||
Canadian Imperial Bank of Commerce | 20,100 | 1,769,286 | ||||||
CGI Group, Inc. (Class A Stock)* | 2,800 | 148,779 | ||||||
Cogeco Communications, Inc. | 13,100 | 941,807 | ||||||
Genworth MI Canada, Inc.(a) | 26,800 | 832,813 | ||||||
Magna International, Inc. | 31,000 | 1,691,171 | ||||||
Quebecor, Inc. (Class B Stock) | 4,300 | 162,254 | ||||||
Restaurant Brands International, Inc. | 2,200 | 142,136 | ||||||
Royal Bank of Canada | 34,900 | 2,728,752 | ||||||
Shopify, Inc. (Class A Stock)* | 1,100 | 109,361 | ||||||
Teck Resources Ltd. (Class B Stock) | 69,700 | 1,424,147 | ||||||
See Notes to Financial Statements.
| Prudential QMA International Equity Fund | 17 |
Schedule of Investments (continued)
as of October 31, 2017
| Description | Shares | Value | ||||||
COMMON STOCKS (Continued) | ||||||||
Canada (cont’d) | ||||||||
Toronto-Dominion Bank (The) | 56,300 | $ | 3,200,560 | |||||
TransCanada Corp. | 28,300 | 1,343,597 | ||||||
|
| |||||||
| 16,745,583 | ||||||||
Chile 0.1% | ||||||||
Enel Generacion Chile SA | 262,113 | 228,519 | ||||||
Inversiones La Construccion SA | 11,723 | 198,966 | ||||||
|
| |||||||
| 427,485 | ||||||||
China 7.7% | ||||||||
Agricultural Bank of China Ltd. (Class H Stock) | 3,109,000 | 1,464,318 | ||||||
Alibaba Group Holding Ltd., ADR*(a) | 13,600 | 2,514,504 | ||||||
Bank of Communications Co. Ltd. (Class H Stock) | 722,000 | 545,062 | ||||||
China Agri-Industries Holdings Ltd. | 1,144,000 | 559,098 | ||||||
China CITIC Bank Corp. Ltd. (Class H Stock) | 174,000 | 112,116 | ||||||
China Construction Bank Corp. (Class H Stock) | 2,742,000 | 2,450,569 | ||||||
China Minsheng Banking Corp. Ltd. (Class H Stock) | 106,000 | 102,684 | ||||||
China Telecom Corp. Ltd. (Class H Stock) | 2,918,000 | 1,463,373 | ||||||
China Vanke Co. Ltd. (Class H Stock) | 522,100 | 1,858,539 | ||||||
Citic Ltd. | 137,000 | 200,696 | ||||||
Geely Automobile Holdings Ltd. | 180,000 | 558,157 | ||||||
Guangzhou Automobile Group Co. Ltd. (Class H Stock) | 186,000 | 462,549 | ||||||
Huadian Fuxin Energy Corp. Ltd. (Class H Stock) | 562,000 | 146,341 | ||||||
Huaxin Cement Co. Ltd. (Class B Stock) | 559,400 | 646,666 | ||||||
Industrial & Commercial Bank of China Ltd. (Class H Stock) | 824,000 | 655,628 | ||||||
JD.com, Inc., ADR* | 25,300 | 949,256 | ||||||
Lao Feng Xiang Co. Ltd. (Class B Stock) | 183,700 | 688,508 | ||||||
Ping An Insurance Group Co. of China Ltd. (Class H Stock) | 245,500 | 2,157,441 | ||||||
Shanghai Industrial Holdings Ltd. | 190,000 | 583,674 | ||||||
Shanghai Pharmaceuticals Holding Co. Ltd. (Class H Stock) | 50,500 | 130,544 | ||||||
Shougang Fushan Resources Group Ltd. | 2,234,000 | 481,644 | ||||||
Sinopec Shanghai Petrochemical Co. Ltd. (Class H Stock) | 1,204,000 | 718,155 | ||||||
Sinotrans Ltd. (Class H Stock) | 1,413,000 | 679,233 | ||||||
Tencent Holdings Ltd. | 31,400 | 1,411,276 | ||||||
Yuzhou Properties Co. Ltd. | 651,000 | 321,570 | ||||||
|
| |||||||
| 21,861,601 | ||||||||
Denmark 1.2% | ||||||||
Novo Nordisk A/S (Class B Stock) | 25,422 | 1,265,732 | ||||||
Vestas Wind Systems A/S | 22,934 | 2,024,723 | ||||||
|
| |||||||
| 3,290,455 | ||||||||
See Notes to Financial Statements.
| 18 |
| Description | Shares | Value | ||||||
COMMON STOCKS (Continued) | ||||||||
Finland 0.2% | ||||||||
Finnair OYJ | 33,108 | $ | 431,784 | |||||
France 6.2% | ||||||||
AXA SA | 92,459 | 2,791,191 | ||||||
BNP Paribas SA | 32,504 | 2,536,921 | ||||||
Credit Agricole SA | 121,381 | 2,118,490 | ||||||
Faurecia | 13,894 | 1,010,030 | ||||||
LVMH Moet Hennessy Louis Vuitton SE | 7,093 | 2,115,581 | ||||||
Natixis SA | 198,898 | 1,559,787 | ||||||
Peugeot SA | 19,101 | 453,182 | ||||||
Sanofi | 31,563 | 2,988,593 | ||||||
Television Francaise 1 | 7,282 | 103,533 | ||||||
Total SA | 35,358 | 1,970,788 | ||||||
|
| |||||||
| 17,648,096 | ||||||||
Germany 5.5% | ||||||||
Adidas AG | 2,580 | 574,265 | ||||||
Allianz SE | 15,033 | 3,509,586 | ||||||
BASF SE | 13,654 | 1,493,111 | ||||||
Bayer AG | 22,070 | 2,870,842 | ||||||
Bayerische Motoren Werke AG | 17,919 | 1,837,778 | ||||||
Covestro AG, 144A | 2,443 | 234,845 | ||||||
Deutsche Lufthansa AG | 74,109 | 2,380,964 | ||||||
Deutsche Pfandbriefbank AG, 144A | 66,841 | 962,057 | ||||||
Henkel AG & Co. KGaA | 1,391 | 175,437 | ||||||
Siltronic AG* | 7,872 | 1,174,878 | ||||||
Uniper SE | 17,559 | 493,383 | ||||||
|
| |||||||
| 15,707,146 | ||||||||
Greece 0.4% | ||||||||
Hellenic Petroleum SA | 49,594 | 437,919 | ||||||
Motor Oil Hellas Corinth Refineries SA | 28,349 | 678,840 | ||||||
|
| |||||||
| 1,116,759 | ||||||||
Hong Kong 3.7% | ||||||||
AIA Group Ltd. | 163,600 | 1,232,804 | ||||||
CK Hutchison Holdings Ltd. | 70,000 | 889,120 | ||||||
Galaxy Entertainment Group Ltd. | 31,402 | 214,142 | ||||||
Hang Seng Bank Ltd. | 61,400 | 1,455,363 | ||||||
I-CABLE Communications Ltd.* | 62,085 | 1,945 | ||||||
Jardine Matheson Holdings Ltd. | 17,200 | 1,101,832 | ||||||
Kerry Properties Ltd. | 344,000 | 1,548,103 | ||||||
See Notes to Financial Statements.
| Prudential QMA International Equity Fund | 19 |
Schedule of Investments (continued)
as of October 31, 2017
| Description | Shares | Value | ||||||
COMMON STOCKS (Continued) | ||||||||
Hong Kong (cont’d) | ||||||||
Kingboard Chemical Holdings Ltd. | 41,500 | $ | 246,263 | |||||
Kingboard Laminates Holdings Ltd. | 598,000 | 1,004,950 | ||||||
Sun Hung Kai Properties Ltd. | 19,000 | 310,829 | ||||||
WH Group Ltd., 144A | 1,739,500 | 1,762,777 | ||||||
Wharf Holdings Ltd. (The) | 81,000 | 737,760 | ||||||
|
| |||||||
| 10,505,888 | ||||||||
Hungary 0.2% | ||||||||
Magyar Telekom Telecommunications PLC | 363,400 | 630,622 | ||||||
India 1.4% | ||||||||
Bharat Petroleum Corp. Ltd. | 15,281 | 127,853 | ||||||
Hindustan Petroleum Corp. Ltd. | 236,362 | 1,632,683 | ||||||
Indian Oil Corp. Ltd. | 121,056 | 777,276 | ||||||
Wipro Ltd. | 316,515 | 1,438,399 | ||||||
|
| |||||||
| 3,976,211 | ||||||||
Indonesia 0.0% | ||||||||
Japfa Comfeed Indones Tbk PT | 1,127,900 | 114,386 | ||||||
Ireland 0.1% | ||||||||
Kingspan Group PLC | 3,886 | 162,451 | ||||||
Israel 0.6% | ||||||||
Bank Leumi Le-Israel BM | 21,084 | 116,547 | ||||||
Check Point Software Technologies Ltd.* | 13,300 | 1,565,543 | ||||||
|
| |||||||
| 1,682,090 | ||||||||
Italy 1.5% | ||||||||
ACEA SpA | 7,116 | 115,847 | ||||||
Atlantia SpA | 5,994 | 195,408 | ||||||
Enel SpA | 110,951 | 688,081 | ||||||
GEDI Gruppo Editoriale SpA* | 710 | 632 | ||||||
Intesa Sanpaolo SpA-RSP | 169,232 | 568,942 | ||||||
Maire Tecnimont SpA(a) | 128,052 | 718,008 | ||||||
Recordati SpA | 9,584 | 445,395 | ||||||
Telecom Italia SpA* | 1,683,588 | 1,456,778 | ||||||
|
| |||||||
| 4,189,091 | ||||||||
Japan 17.3% | ||||||||
Aisin Seiki Co. Ltd. | 28,700 | 1,486,731 | ||||||
Astellas Pharma, Inc. | 123,100 | 1,638,320 | ||||||
See Notes to Financial Statements.
| 20 |
| Description | Shares | Value | ||||||
COMMON STOCKS (Continued) | ||||||||
Japan (cont’d.) | ||||||||
Canon, Inc. | 53,500 | $ | 2,009,840 | |||||
Daiichi Sankyo Co. Ltd. | 48,800 | 1,120,872 | ||||||
Daiwa House Industry Co. Ltd. | 46,300 | 1,697,030 | ||||||
Fujitsu Ltd. | 236,000 | 1,839,029 | ||||||
Hitachi Ltd. | 286,000 | 2,277,518 | ||||||
ITOCHU Corp. | 125,100 | 2,191,332 | ||||||
Japan Tobacco, Inc. | 55,900 | 1,850,301 | ||||||
Kajima Corp. | 201,000 | 2,084,670 | ||||||
Kansai Electric Power Co., Inc. (The) | 12,200 | 167,068 | ||||||
KDDI Corp. | 39,900 | 1,063,041 | ||||||
Keyence Corp. | 600 | 333,135 | ||||||
Marubeni Corp. | 22,400 | 150,193 | ||||||
Mitsubishi Chemical Holdings Corp. | 187,500 | 1,958,497 | ||||||
Mitsubishi Corp. | 81,500 | 1,908,562 | ||||||
Mitsui & Co. Ltd. | 64,200 | 958,786 | ||||||
Mitsui Chemicals, Inc. | 50,600 | 1,560,299 | ||||||
MS&AD Insurance Group Holdings, Inc. | 21,300 | 723,611 | ||||||
Nexon Co. Ltd.* | 27,000 | 726,277 | ||||||
Nippon Telegraph & Telephone Corp. | 47,484 | 2,295,734 | ||||||
Obayashi Corp. | 79,200 | 1,036,989 | ||||||
ORIX Corp. | 125,400 | 2,156,079 | ||||||
Sharp Corp.*(a) | 38,200 | 1,215,221 | ||||||
Shin-Etsu Chemical Co. Ltd. | 5,600 | 590,583 | ||||||
Showa Corp. | 78,600 | 1,030,273 | ||||||
Sony Corp. | 54,500 | 2,279,991 | ||||||
Sumitomo Chemical Co. Ltd. | 20,000 | 140,557 | ||||||
Sumitomo Corp. | 114,800 | 1,660,480 | ||||||
Suzuki Motor Corp. | 39,800 | 2,179,976 | ||||||
Taisei Corp. | 37,400 | 2,072,222 | ||||||
Tokyo Electron Ltd. | 11,700 | 2,060,133 | ||||||
Tosoh Corp. | 64,500 | 1,391,958 | ||||||
Toyota Motor Corp. | 15,433 | 957,249 | ||||||
Toyota Tsusho Corp. | 5,900 | 214,586 | ||||||
|
| |||||||
| 49,027,143 | ||||||||
Luxembourg 0.1% | ||||||||
ArcelorMittal* | 8,255 | 236,387 | ||||||
Malaysia 0.5% | ||||||||
CIMB Group Holdings Bhd | 953,100 | 1,382,316 | ||||||
Tenaga Nasional Bhd | 46,800 | 165,818 | ||||||
|
| |||||||
| 1,548,134 | ||||||||
See Notes to Financial Statements.
| Prudential QMA International Equity Fund | 21 |
Schedule of Investments (continued)
as of October 31, 2017
| Description | Shares | Value | ||||||
COMMON STOCKS (Continued) | ||||||||
Mexico 0.9% | ||||||||
Concentradora Fibra Hotelera Mexicana SA de CV, 144A | 268,600 | $ | 179,611 | |||||
Grupo Financiero Interacciones SA de CV (Class O Stock) | 29,100 | 132,327 | ||||||
Grupo Financiero Santander Mexico SAB de CV (Class B Stock) | 712,200 | 1,196,921 | ||||||
Wal-Mart de Mexico SAB de CV | 410,400 | 918,767 | ||||||
|
| |||||||
| 2,427,626 | ||||||||
Netherlands 2.5% | ||||||||
BE Semiconductor Industries NV | 9,464 | 743,702 | ||||||
ING Groep NV | 157,176 | 2,904,531 | ||||||
Royal Dutch Shell PLC (Class A Stock) | 59,102 | 1,860,511 | ||||||
Royal Dutch Shell PLC (Class B Stock) | 50,070 | 1,612,112 | ||||||
|
| |||||||
| 7,120,856 | ||||||||
New Zealand 0.3% | ||||||||
Air New Zealand Ltd. | 407,435 | 920,452 | ||||||
Norway 1.3% | ||||||||
Austevoll Seafood ASA | 92,812 | 928,988 | ||||||
DNB ASA | 13,085 | 252,533 | ||||||
Marine Harvest ASA* | 84,245 | 1,645,255 | ||||||
Salmar ASA | 33,476 | 998,086 | ||||||
|
| |||||||
| 3,824,862 | ||||||||
Poland 1.1% | ||||||||
Enea SA | 197,149 | 754,420 | ||||||
Polski Koncern Naftowy Orlen SA | 48,630 | 1,720,020 | ||||||
Powszechny Zaklad Ubezpieczen SA | 56,179 | 725,026 | ||||||
|
| |||||||
| 3,199,466 | ||||||||
Portugal 0.6% | ||||||||
EDP—Energias de Portugal SA | 168,845 | 602,138 | ||||||
Sonae SGPS SA | 854,309 | 1,022,768 | ||||||
|
| |||||||
| 1,624,906 | ||||||||
Qatar 0.2% | ||||||||
Ooredoo QPSC | 23,758 | 559,539 | ||||||
Russia 0.8% | ||||||||
Gazprom PJSC, ADR | 110,142 | 473,005 | ||||||
Lukoil PJSC, ADR | 8,089 | 429,526 | ||||||
Magnit PJSC, GDR | 4,083 | 115,549 | ||||||
Novatek PJSC, GDR | 1,185 | 135,729 | ||||||
RusHydro PJSC, ADR | 209,209 | 280,340 | ||||||
See Notes to Financial Statements.
| 22 |
| Description | Shares | Value | ||||||
COMMON STOCKS (Continued) | ||||||||
Russia (cont’d) | ||||||||
Sberbank of Russia PJSC, ADR | 51,257 | $ | 735,538 | |||||
|
| |||||||
| 2,169,687 | ||||||||
Singapore 0.8% | ||||||||
Genting Singapore PLC | 568,300 | 508,670 | ||||||
Oversea-Chinese Banking Corp. Ltd. | 211,300 | 1,845,415 | ||||||
|
| |||||||
| 2,354,085 | ||||||||
South Africa 0.6% | ||||||||
Mondi PLC | 4,106 | 99,300 | ||||||
Rebosis Property Fund Ltd. | 363,260 | 275,010 | ||||||
Shoprite Holdings Ltd. | 7,490 | 107,227 | ||||||
Standard Bank Group Ltd. | 17,875 | 207,571 | ||||||
Steinhoff International Holdings NV | 40,764 | 176,960 | ||||||
Tongaat Hulett Ltd. | 72,083 | 587,273 | ||||||
Wilson Bayly Holmes-Ovcon Ltd. | 21,488 | 230,034 | ||||||
|
| |||||||
| 1,683,375 | ||||||||
South Korea 4.6% | ||||||||
Hanil Cement Co. Ltd. | 1,592 | 190,579 | ||||||
KT Corp. | 53,617 | 1,407,230 | ||||||
LG Uplus Corp. | 107,390 | 1,233,122 | ||||||
Meritz Fire & Marine Insurance Co. Ltd. | 5,073 | 116,424 | ||||||
POSCO | 5,979 | 1,742,793 | ||||||
Samsung Electronics Co. Ltd. | 2,150 | 5,299,979 | ||||||
Shinhan Financial Group Co. Ltd. | 4,235 | 190,228 | ||||||
SK Hynix, Inc. | 34,647 | 2,554,618 | ||||||
SK Telecom Co. Ltd. | 518 | 122,289 | ||||||
Woori Bank | 7,117 | 104,152 | ||||||
|
| |||||||
| 12,961,414 | ||||||||
Spain 1.8% | ||||||||
Amadeus IT Group SA | 30,116 | 2,043,338 | ||||||
Endesa SA | 47,364 | 1,084,079 | ||||||
Repsol SA | 47,793 | 895,612 | ||||||
Siemens Gamesa Renewable Energy SA | 67,587 | 979,998 | ||||||
|
| |||||||
| 5,003,027 | ||||||||
Sweden 2.6% | ||||||||
Atlas Copco AB (Class B Stock) | 5,159 | 204,803 | ||||||
Evolution Gaming Group AB, 144A | 15,789 | 1,132,176 | ||||||
ICA Gruppen AB | 6,192 | 228,356 | ||||||
See Notes to Financial Statements.
| Prudential QMA International Equity Fund | 23 |
Schedule of Investments (continued)
as of October 31, 2017
| Description | Shares | Value | ||||||
COMMON STOCKS (Continued) | ||||||||
Sweden (cont’d) | ||||||||
Peab AB | 70,870 | $ | 687,725 | |||||
Skandinaviska Enskilda Banken AB (Class A Stock) | 9,987 | 123,076 | ||||||
Swedbank AB (Class A Stock) | 62,446 | 1,549,771 | ||||||
Swedish Match AB | 41,507 | 1,563,609 | ||||||
Volvo AB (Class B Stock) | 100,392 | 1,988,389 | ||||||
|
| |||||||
| 7,477,905 | ||||||||
Switzerland 4.6% | ||||||||
Georg Fischer AG | 819 | 1,009,065 | ||||||
Glencore PLC* | 77,031 | 371,534 | ||||||
Kuehne + Nagel International AG | 8,169 | 1,427,254 | ||||||
Nestle SA | 24,215 | 2,037,415 | ||||||
Novartis AG | 40,152 | 3,311,709 | ||||||
Orior AG | 1,819 | 142,262 | ||||||
Partners Group Holding AG | 757 | 509,149 | ||||||
Resurs Holding AB, 144A | 41,035 | 284,118 | ||||||
Roche Holding AG | 16,161 | 3,735,310 | ||||||
Swiss Life Holding AG* | 381 | 132,424 | ||||||
|
| |||||||
| 12,960,240 | ||||||||
Taiwan 2.5% | ||||||||
AU Optronics Corp. | 254,000 | 104,081 | ||||||
Chailease Holding Co. Ltd. | 45,000 | 116,080 | ||||||
CTBC Financial Holding Co. Ltd. | 231,000 | 147,901 | ||||||
Formosa Chemicals & Fibre Corp. | 93,000 | 282,535 | ||||||
Formosa Petrochemical Corp. | 474,000 | 1,659,272 | ||||||
General Interface Solution Holding Ltd. | 13,000 | 119,354 | ||||||
Gourmet Master Co. Ltd. | 9,385 | 107,730 | ||||||
Innolux Corp. | 3,171,000 | 1,389,869 | ||||||
Lien Hwa Industrial Corp. | 394,000 | 418,089 | ||||||
Merry Electronics Co. Ltd. | 17,000 | 130,043 | ||||||
Syncmold Enterprise Corp. | 211,000 | 489,230 | ||||||
Taiwan Semiconductor Manufacturing Co. Ltd. | 128,000 | 1,034,791 | ||||||
Tripod Technology Corp. | 264,000 | 972,263 | ||||||
Walsin Lihwa Corp. | 258,000 | 131,872 | ||||||
|
| |||||||
| 7,103,110 | ||||||||
Thailand 1.6% | ||||||||
Airports of Thailand PCL | 564,400 | 1,011,858 | ||||||
Beauty Community PCL | 2,122,852 | 1,143,586 | ||||||
Charoen Pokphand Foods PCL | 206,400 | 161,474 | ||||||
GFPT PCL | 1,133,300 | 630,764 | ||||||
See Notes to Financial Statements.
| 24 |
| Description | Shares | Value | ||||||
COMMON STOCKS (Continued) | ||||||||
Thailand (cont’d) | ||||||||
Mega Lifesciences PCL | 215,700 | $ | 272,678 | |||||
Thai Oil PCL(a) | 390,700 | 1,199,943 | ||||||
|
| |||||||
| 4,420,303 | ||||||||
Turkey 1.2% | ||||||||
Aygaz A/S(a) | 105,699 | 449,399 | ||||||
Eregli Demir ve Celik Fabrikalari TAS | 403,889 | 949,193 | ||||||
Tekfen Holding A/S | 82,229 | 278,185 | ||||||
Turkiye Garanti Bankasi A/S | 491,718 | 1,354,732 | ||||||
Turkiye Is Bankasi (Class C Stock) | 237,905 | 449,016 | ||||||
|
| |||||||
| 3,480,525 | ||||||||
United Kingdom 11.5% | ||||||||
Anglo American PLC | 99,768 | 1,881,919 | ||||||
AstraZeneca PLC | 10,852 | 734,254 | ||||||
Berkeley Group Holdings PLC | 7,957 | 395,387 | ||||||
BP PLC | 318,610 | 2,161,015 | ||||||
British American Tobacco PLC | 51,029 | 3,296,962 | ||||||
Britvic PLC | 84,628 | 850,633 | ||||||
Coca-Cola European Partners PLC | 2,877 | 118,011 | ||||||
esure Group PLC | 110,709 | 394,942 | ||||||
Fiat Chrysler Automobiles NV* | 14,364 | 248,372 | ||||||
GlaxoSmithKline PLC | 78,587 | 1,410,422 | ||||||
Hansteen Holdings PLC | 106,682 | 193,993 | ||||||
HSBC Holdings PLC | 419,091 | 4,092,457 | ||||||
Imperial Brands PLC | 20,924 | 853,101 | ||||||
J. Sainsbury PLC | 30,198 | 97,244 | ||||||
Legal & General Group PLC | 491,722 | 1,743,429 | ||||||
Lloyds Banking Group PLC | 1,739,053 | 1,576,327 | ||||||
NewRiver REIT PLC | 125,456 | 558,227 | ||||||
Persimmon PLC | 45,497 | 1,693,191 | ||||||
Prudential PLC | 11,054 | 271,323 | ||||||
Rentokil Initial PLC | 47,620 | 212,353 | ||||||
Rio Tinto Ltd. | 31,268 | 1,666,159 | ||||||
Smith & Nephew PLC | 89,212 | 1,682,673 | ||||||
Subsea 7 SA | 14,341 | 241,751 | ||||||
Taylor Wimpey PLC | 568,643 | 1,506,944 | ||||||
Unilever NV, CVA | 44,640 | 2,593,135 | ||||||
Unilever PLC | 16,909 | 958,297 | ||||||
Vodafone Group PLC | 458,174 | 1,310,527 | ||||||
|
| |||||||
| 32,743,048 | ||||||||
See Notes to Financial Statements.
| Prudential QMA International Equity Fund | 25 |
Schedule of Investments (continued)
as of October 31, 2017
| Description | Shares | Value | ||||||
COMMON STOCKS (Continued) | ||||||||
United States 0.0% | ||||||||
Lululemon Athletica, Inc.* | 48 | $ | 2,952 | |||||
|
| |||||||
TOTAL COMMON STOCKS | 277,186,807 | |||||||
|
| |||||||
EXCHANGE TRADED FUNDS 0.5% | ||||||||
United States | ||||||||
iShares MSCI EAFE Index Fund | 17,320 | 1,205,992 | ||||||
iShares MSCI Emerging Markets Index Fund(a) | 6,264 | 289,898 | ||||||
|
| |||||||
TOTAL EXCHANGE TRADED FUNDS | 1,495,890 | |||||||
|
| |||||||
PREFERRED STOCKS 1.5% | ||||||||
Brazil 0.4% | ||||||||
Cia de Saneamento do Parana (PRFC) | 281,900 | 934,985 | ||||||
Vale SA (PRFC) | 27,400 | 251,025 | ||||||
|
| |||||||
| 1,186,010 | ||||||||
Germany 0.9% | ||||||||
Volkswagen AG (PRFC) | 13,649 | 2,499,175 | ||||||
South Korea 0.2% | ||||||||
Samsung Electronics Co. Ltd. (PRFC) | 230 | 460,654 | ||||||
|
| |||||||
TOTAL PREFERRED STOCKS | 4,145,839 | |||||||
|
| |||||||
Units | ||||||||
RIGHTS* 0.0% | ||||||||
Taiwan | ||||||||
CTBC Financial Holding Co. Ltd., expiring 12/17/17 | 3,163 | — | ||||||
|
| |||||||
TOTAL LONG-TERM INVESTMENTS | $ | 282,828,536 | ||||||
|
| |||||||
See Notes to Financial Statements.
| 26 |
| Description | Shares | Value | ||||||
SHORT-TERM INVESTMENTS 2.5% | ||||||||
AFFILIATED MUTUAL FUNDS | ||||||||
Prudential Investment Portfolios 2 - Prudential Core Ultra Short Bond Fund(w) | 234,025 | $ | 234,025 | |||||
Prudential Investment Portfolios 2 - Prudential Institutional Money Market Fund | 7,028,802 | 7,029,505 | ||||||
|
| |||||||
TOTAL SHORT-TERM INVESTMENTS | 7,263,530 | |||||||
|
| |||||||
TOTAL INVESTMENTS 102.1% | 290,092,066 | |||||||
Liabilities in excess of other assets (2.1)% | (6,062,207 | ) | ||||||
|
| |||||||
NET ASSETS 100.0% | $ | 284,029,859 | ||||||
|
| |||||||
The following abbreviations are used in the annual report:
144A Security was purchased pursuant to Rule 144A under the Securities Act of 1933 and may not be resold subject to that rule except to qualified institutional buyers. Unless otherwise noted, 144A securities are deemed to be liquid.
ADR—American Depositary Receipt
CVA—Certificate Van Aandelen (Bearer)
EAFE—Europe, Australasia and Far East
GDR—Global Depositary Receipt
LIBOR—London Interbank Offered Rate
MSCI—Morgan Stanley Capital International
PRFC—Preference Shares
REIT(s)—Real Estate Investment Trust(s)
RSP—Risparimo (Savings Shares)
UTS—Unit Trust Security
| * | Non-income producing security. |
| (a) | All or a portion of security is on loan. The aggregate market value of such securities, including those sold and pending settlement, is $6,777,431; cash collateral of $7,023,024 (included in liabilities) was received with which the Portfolio purchased highly liquid short-term investments. |
| (b) | Represents security purchased with cash collateral received for securities on loan and includes dividend reinvestment. |
| (w) | PGIM Investments LLC, the manager of the Series, also serves as manager of the Prudential Investment Portfolios 2—Prudential Core Ultra Short Bond Fund and the Prudential Institutional Money Market Fund. |
Fair Value Measurements:
Various inputs are used in determining the value of the Series’ investments. These inputs are summarized in the three broad levels listed below.
Level 1 — unadjusted quoted prices generally in active markets for identical securities.
Level 2 — quoted prices for similar securities, interest rates and yield curves, prepayment speeds, foreign currency exchange rates and other observable inputs.
See Notes to Financial Statements.
| Prudential QMA International Equity Fund | 27 |
Schedule of Investments (continued)
as of October 31, 2017
Level 3 — unobservable inputs for securities valued in accordance with Board approved fair valuation procedures.
The following is a summary of the inputs used as of October 31, 2017 in valuing such portfolio securities:
| Level 1 | Level 2 | Level 3 | ||||||||||
Investments in Securities | ||||||||||||
Common Stocks | ||||||||||||
Australia | $ | — | $ | 9,105,406 | $ | — | ||||||
Austria | — | 2,109,493 | — | |||||||||
Belgium | — | 1,645,679 | — | |||||||||
Brazil | 2,987,539 | — | — | |||||||||
Canada | 16,745,583 | — | — | |||||||||
Chile | 427,485 | — | — | |||||||||
China | 4,798,934 | 17,062,667 | — | |||||||||
Denmark | — | 3,290,455 | — | |||||||||
Finland | — | 431,784 | — | |||||||||
France | — | 17,648,096 | — | |||||||||
Germany | — | 15,707,146 | — | |||||||||
Greece | — | 1,116,759 | — | |||||||||
Hong Kong | 1,101,832 | 9,404,056 | — | |||||||||
Hungary | — | 630,622 | — | |||||||||
India | — | 3,976,211 | — | |||||||||
Indonesia | — | 114,386 | — | |||||||||
Ireland | — | 162,451 | — | |||||||||
Israel | 1,565,543 | 116,547 | — | |||||||||
Italy | — | 4,189,091 | — | |||||||||
Japan | — | 49,027,143 | — | |||||||||
Luxembourg | — | 236,387 | — | |||||||||
Malaysia | — | 1,548,134 | — | |||||||||
Mexico | 2,427,626 | — | — | |||||||||
Netherlands | — | 7,120,856 | — | |||||||||
New Zealand | — | 920,452 | — | |||||||||
Norway | — | 3,824,862 | — | |||||||||
Poland | — | 3,199,466 | — | |||||||||
Portugal | — | 1,624,906 | — | |||||||||
Qatar | — | 559,539 | — | |||||||||
Russia | 2,169,687 | — | — | |||||||||
Singapore | — | 2,354,085 | — | |||||||||
South Africa | — | 1,683,375 | — | |||||||||
South Korea | — | 12,961,414 | — | |||||||||
Spain | — | 5,003,027 | — | |||||||||
Sweden | — | 7,477,905 | — | |||||||||
Switzerland | — | 12,960,240 | — | |||||||||
See Notes to Financial Statements.
| 28 |
| Level 1 | Level 2 | Level 3 | ||||||||||
Investments in Securities (continued) | ||||||||||||
Common Stocks (continued) | ||||||||||||
Taiwan | $ | — | $ | 7,103,110 | $ | — | ||||||
Thailand | — | 4,420,303 | — | |||||||||
Turkey | — | 3,480,525 | — | |||||||||
United Kingdom | — | 32,743,048 | — | |||||||||
United States | 2,952 | — | — | |||||||||
Exchange Traded Funds | ||||||||||||
United States | 1,495,890 | — | — | |||||||||
Preferred Stocks | ||||||||||||
Brazil | 1,186,010 | — | — | |||||||||
Germany | — | 2,499,175 | — | |||||||||
South Korea | — | 460,654 | — | |||||||||
Rights | ||||||||||||
Taiwan | — | — | — | |||||||||
Affiliated Mutual Funds | 7,263,530 | — | — | |||||||||
|
|
|
|
|
| |||||||
Total | $ | 42,172,611 | $ | 247,919,455 | $ | — | ||||||
|
|
|
|
|
| |||||||
During the period, there were no transfers between Level 1, Level 2 and Level 3 to report.
Industry Classification:
The industry classification of investments and liabilities in excess of other assets shown as a percentage of net assets as of October 31, 2017 were as follows (unaudited):
Banks | 14.6 | % | ||
Pharmaceuticals | 6.9 | |||
Oil, Gas & Consumable Fuels | 6.9 | |||
Insurance | 4.9 | |||
Metals & Mining | 4.5 | |||
Food Products | 3.5 | |||
Automobiles | 3.2 | |||
Diversified Telecommunication Services | 3.2 | |||
Chemicals | 2.9 | |||
Construction & Engineering | 2.9 | |||
Technology Hardware, Storage & Peripherals | 2.7 | |||
Semiconductors & Semiconductor Equipment | 2.7 | |||
Tobacco | 2.7 | |||
Household Durables | 2.6 | |||
Affiliated Mutual Funds (including 2.5% of collateral for securities on loan) | 2.6 | |||
Trading Companies & Distributors | 2.5 | |||
Real Estate Management & Development | 2.3 | |||
Electronic Equipment, Instruments & Components | 2.3 | |||
IT Services | 2.0 | |||
Auto Components | 1.8 | |||
Hotels, Restaurants & Leisure | 1.5 | % | ||
Internet Software & Services | 1.4 | |||
Electric Utilities | 1.4 | |||
Capital Markets | 1.4 | |||
Airlines | 1.3 | |||
Machinery | 1.3 | |||
Personal Products | 1.3 | |||
Food & Staples Retailing | 1.2 | |||
Textiles, Apparel & Luxury Goods | 1.2 | |||
Electrical Equipment | 1.1 | |||
Industrial Conglomerates | 1.0 | |||
Equity Real Estate Investment Trusts (REITs) | 0.9 | |||
Wireless Telecommunication Services | 0.9 | |||
Diversified Financial Services | 0.9 | |||
Software | 0.8 | |||
Water Utilities | 0.8 | |||
Thrifts & Mortgage Finance | 0.6 | |||
Health Care Equipment & Supplies | 0.6 | |||
Exchange Traded Funds | 0.5 | |||
Marine | 0.5 | |||
Media | 0.4 |
See Notes to Financial Statements.
| Prudential QMA International Equity Fund | 29 |
Schedule of Investments (continued)
as of October 31, 2017
Industry (cont’d)
Transportation Infrastructure | 0.4 | % | ||
Specialty Retail | 0.4 | |||
Beverages | 0.3 | |||
Internet & Direct Marketing Retail | 0.3 | |||
Independent Power & Renewable Electricity Producers | 0.3 | |||
Construction Materials | 0.3 | |||
Multiline Retail | 0.3 | |||
Air Freight & Logistics | 0.2 | |||
Commercial Services & Supplies | 0.2 | |||
Gas Utilities | 0.2 | |||
Health Care Providers & Services | 0.1 | |||
Consumer Finance | 0.1 | % | ||
Energy Equipment & Services | 0.1 | |||
Household Products | 0.1 | |||
Building Products | 0.1 | |||
Electronic Equipment, Instrument & Components | 0.0 | * | ||
Multi-Utilities | 0.0 | * | ||
Paper & Forest Products | 0.0 | * | ||
|
| |||
| 102.1 | ||||
Liabilities in excess of other assets | (2.1 | ) | ||
|
| |||
| 100.0 | % | |||
|
|
| * | Less than +/- 0.05% |
Effects of Derivative Instruments on the Financial Statements and Primary Underlying Risk Exposure:
The Series invested in derivative instruments during the reporting period. The primary types of risk associated with these derivative instruments is equity contracts risk. The effect of such derivative instruments on the Series's financial position and financial performance as reflected in the Statement of Assets and Liabilities and Statement of Operations is presented in the summary below.
Fair values of derivative instruments as of October 31, 2017 as presented in the Statement of Assets and Liabilities:
Asset Derivatives | Liability Derivatives | |||||||||||
Derivatives not accounted for as hedging | Balance Sheet | Fair Value | Balance Sheet | Fair Value | ||||||||
| Equity contracts | Unaffiliated investments | $ | — | — | $ | — | ||||||
|
|
|
| |||||||||
The effects of derivative instruments on the Statement of Operations for the year ended October 31, 2017 are as follows:
For the year ended October 31, 2017, the Series did not have any net realized gain (loss) on derivatives recognized in income.
Change in Unrealized Appreciation (Depreciation) on Derivatives Recognized in Income | ||||
Derivatives not accounted for as hedging | Rights(1) | |||
Equity contracts | $ | — | ||
|
| |||
| (1) | Included in net change in unrealized appreciation (depreciation) on investments in the Statement of Operations. |
See Notes to Financial Statements.
| 30 |
Financial Instruments/Transactions—Summary of Offsetting and Netting Arrangements:
The Series entered into financial instruments/transactions during the reporting period that are either offset in accordance with current requirements or are subject to enforceable master netting arrangements or similar agreements that permit offsetting. The information about offsetting and related netting arrangements for financial instruments/transactions, where the legal right to set-off exists, is presented in the summary below.
Offsetting of financial instruments/transactions assets and liabilities:
Description | Gross Market Value of Recognized Assets/(Liabilities) | Collateral Pledged/(Received)(1) | Net Amount | |||||||||
Securities on Loan | $ | 6,777,431 | $ | (6,777,431 | ) | $ | — | |||||
|
| |||||||||||
| (1) | Collateral amount disclosed by the Series is limited to the market value of financial instruments/transactions. |
See Notes to Financial Statements.
| Prudential QMA International Equity Fund | 31 |
Statement of Assets & Liabilities
as of October 31, 2017
Assets | ||||
Investments at value, including securities on loan of $6,777,431: | ||||
Unaffiliated investments (cost $228,503,806) | $ | 282,828,536 | ||
Affiliated investments (cost $7,263,521) | 7,263,530 | |||
Foreign currency, at value (cost $227,747) | 224,413 | |||
Tax reclaim receivable | 1,158,538 | |||
Dividends and interest receivable | 660,572 | |||
Receivable for Series shares sold | 119,715 | |||
Prepaid expenses | 2,399 | |||
|
| |||
Total Assets | 292,257,703 | |||
|
| |||
Liabilities | ||||
Payable to broker for collateral for securities on loan | 7,023,024 | |||
Payable for Series shares reacquired | 733,506 | |||
Management fee payable | 188,904 | |||
Accrued expenses and other liabilities | 144,317 | |||
Distribution fee payable | 69,499 | |||
Affiliated transfer agent fee payable | 68,594 | |||
|
| |||
Total Liabilities | 8,227,844 | |||
|
| |||
Net Assets | $ | 284,029,859 | ||
|
| |||
Net assets were comprised of: | ||||
Common stock, at par | $ | 357,685 | ||
Paid-in capital in excess of par | 237,520,912 | |||
|
| |||
| 237,878,597 | ||||
Undistributed net investment income | 3,897,086 | |||
Accumulated net realized loss on investment and foreign currency transactions | (12,032,717 | ) | ||
Net unrealized appreciation on investments and foreign currencies | 54,286,893 | |||
|
| |||
Net assets, October 31, 2017 | $ | 284,029,859 | ||
|
| |||
See Notes to Financial Statements.
| 32 |
Class A | ||||
Net asset value and redemption price per share | ||||
($207,625,626 ÷ 26,116,661 shares of common stock issued and outstanding) | $ | 7.95 | ||
Maximum sales charge (5.50% of offering price) | 0.46 | |||
|
| |||
Maximum offering price to public | $ | 8.41 | ||
|
| |||
Class B | ||||
Net asset value, offering price and redemption price per share | ||||
($3,020,165 ÷ 397,547 shares of common stock issued and outstanding) | $ | 7.60 | ||
|
| |||
Class C | ||||
Net asset value, offering price and redemption price per share | ||||
($16,661,349 ÷ 2,192,656 shares of common stock issued and outstanding) | $ | 7.60 | ||
|
| |||
Class Q | ||||
Net asset value, offering price and redemption price per share | ||||
($39,379,073 ÷ 4,898,816 shares of common stock issued and outstanding) | $ | 8.04 | ||
|
| |||
Class Z | ||||
Net asset value, offering price and redemption price per share | ||||
($17,343,646 ÷ 2,162,807 shares of common stock issued and outstanding) | $ | 8.02 | ||
|
| |||
See Notes to Financial Statements.
| Prudential QMA International Equity Fund | 33 |
Statement of Operations
Year Ended October 31, 2017
Net Investment Income (Loss) | ||||
Income | ||||
Unaffiliated dividend income (net of foreign withholding taxes of $929,673) | $ | 8,344,633 | ||
Income from securities lending, net (including affiliated income of $1,705) | 95,119 | |||
Affiliated dividend income | 3,819 | |||
|
| |||
Total income | 8,443,571 | |||
|
| |||
Expenses | ||||
Management fee | 2,176,964 | |||
Distribution fee(a) | 763,252 | |||
Transfer agent’s fees and expenses (including affiliated expense of $304,500)(a) | 706,000 | |||
Custodian and accounting fees | 194,000 | |||
Registration fees(a) | 80,000 | |||
Shareholders’ reports | 46,000 | |||
Audit fee | 30,000 | |||
Legal fees and expenses | 24,000 | |||
Directors’ fees | 13,000 | |||
Miscellaneous | 78,682 | |||
|
| |||
Total expenses | 4,111,898 | |||
Less: Management fee waiver and/or expense reimbursement(a) | (53,023 | ) | ||
|
| |||
Net expenses | 4,058,875 | |||
|
| |||
Net investment income (loss) | 4,384,696 | |||
|
| |||
Realized And Unrealized Gain (Loss) On Investments And Foreign Currency Transactions | ||||
Net realized gain (loss) on: | ||||
Investment transactions (including affiliated of $(148)) | 27,120,639 | |||
Foreign currency transactions | (95,446 | ) | ||
|
| |||
| 27,025,193 | ||||
|
| |||
Net change in unrealized appreciation (depreciation) on: | ||||
Investments (including affiliated of $(680)) | 28,332,103 | |||
Foreign currencies | 34,721 | |||
|
| |||
| 28,366,824 | ||||
|
| |||
Net gain (loss) on investment and foreign currency transactions | 55,392,017 | |||
|
| |||
Net Increase (Decrease) In Net Assets Resulting From Operations | $ | 59,776,713 | ||
|
| |||
| (a) | Class specific expenses and waivers were as follows: |
| Class A | Class B | Class C | Class Q | Class Z | ||||||||||||||||
Distribution fee | 577,559 | 28,329 | 157,364 | — | — | |||||||||||||||
Transfer Agency fees and expenses | 590,000 | 12,000 | 46,000 | — | 58,000 | |||||||||||||||
Including affiliated expenses | 254,300 | 6,300 | 19,700 | — | 24,200 | |||||||||||||||
Registration fees | 34,000 | 9,000 | 11,000 | 12,000 | 14,000 | |||||||||||||||
Management fee waiver and/or expense reimbursement | (25,801 | ) | (9,452 | ) | (2,077 | ) | (13,515 | ) | (2,178 | ) | ||||||||||
See Notes to Financial Statements.
| 34 |
Statement of Changes in Net Assets
| Year Ended October 31, | ||||||||
| 2017 | 2016 | |||||||
Increase (Decrease) in Net Assets | ||||||||
Operations | ||||||||
Net investment income (loss) | $ | 4,384,696 | $ | 4,419,582 | ||||
Net realized gain (loss) on investment and foreign currency transactions | 27,025,193 | (19,290,268 | ) | |||||
Net change in unrealized appreciation (depreciation) on investments and foreign currencies | 28,366,824 | 11,275,285 | ||||||
|
|
|
| |||||
Net increase (decrease) in net assets resulting from operations | 59,776,713 | (3,595,401 | ) | |||||
|
|
|
| |||||
Dividends from net investment income | ||||||||
Class A | (3,575,263 | ) | (3,287,114 | ) | ||||
Class B | (42,092 | ) | (41,536 | ) | ||||
Class C | (214,555 | ) | (170,911 | ) | ||||
Class Z | (1,161,844 | ) | (1,031,700 | ) | ||||
|
|
|
| |||||
| (4,993,754 | ) | (4,531,261 | ) | |||||
|
|
|
| |||||
Series share transactions (Net of share conversions) | ||||||||
Net proceeds from shares sold | 12,665,842 | 10,632,582 | ||||||
Net asset value of shares issued in reinvestment of dividends and distributions | 4,913,253 | 4,447,393 | ||||||
Cost of shares reacquired | (42,098,907 | ) | (42,209,977 | ) | ||||
|
|
|
| |||||
Net increase (decrease) in net assets from Series share transactions | (24,519,812 | ) | (27,130,002 | ) | ||||
|
|
|
| |||||
Total increase (decrease) | 30,263,147 | (35,256,664 | ) | |||||
Net Assets: | ||||||||
Beginning of year | 253,766,712 | 289,023,376 | ||||||
|
|
|
| |||||
End of year(a) | $ | 284,029,859 | $ | 253,766,712 | ||||
|
|
|
| |||||
(a) Includes undistributed net investment income of: | $ | 3,897,086 | $ | 3,525,631 | ||||
|
|
|
| |||||
See Notes to Financial Statements.
| Prudential QMA International Equity Fund | 35 |
Notes to Financial Statements
Prudential World Fund, Inc. (the “Fund”) is registered under the Investment Company Act of 1940, as amended (“1940 Act”), as an open-end management investment company and currently consists of seven investment portfolios: Prudential Emerging Markets Debt Hard Currency Fund and Prudential Emerging Markets Debt Local Currency Fund which are non-diversified funds and Prudential Jennison Emerging Markets Equity Fund, Prudential Jennison Global Infrastructure Fund, Prudential Jennison Global Opportunities Fund, Prudential Jennison International Opportunities Fund and Prudential QMA International Equity Fund which are diversified funds. These financial statements relate to the Prudential QMA International Equity Fund (the “Series”).
The investment objective of the Series is to seek long-term growth of capital.
1. Accounting Policies
The Series follows investment company accounting and reporting guidance of the Financial Accounting Standards Board (“FASB”) Accounting Standard Codification Topic 946 Financial Services—Investment Companies. The following accounting policies conform to U.S. generally accepted accounting principles. The Series consistently follows such policies in the preparation of its financial statements.
Securities Valuation: The Series holds securities and other assets and liabilities that are fair valued at the close of each day (generally, 4:00 PM Eastern time) the New York Stock Exchange (“NYSE”) is open for trading. Fair value is the price that would be received to sell an asset or paid to transfer a liability in an orderly transaction between market participants on the measurement date. The Board of Directors (the “Board”) has adopted valuation procedures for security valuation under which fair valuation responsibilities have been delegated to PGIM Investments LLC (“PGIM Investments” or “the Manager”) (formerly known as Prudential Investments LLC). Under the current valuation procedures, the Valuation Committee is responsible for supervising the valuation of portfolio securities and other assets and liabilities. The valuation procedures permit the Series to utilize independent pricing vendor services, quotations from market makers, and alternative valuation methods when market quotations are either not readily available or not deemed representative of fair value. A record of the Valuation Committee’s actions is subject to the Board’s review, approval, and ratification at its next regularly scheduled quarterly meeting.
Various inputs determine how the Series’ investments are valued, all of which are categorized according to the three broad levels (Level 1, 2, or 3) detailed in the Schedule of Investments.
Common and preferred stocks, exchange-traded funds, and derivative instruments, such as futures or options, that are traded on a national securities exchange are valued at the last sale price as of the close of trading on the applicable exchange where the security
| 36 |
principally trades. Securities traded via NASDAQ are valued at the NASDAQ official closing price. To the extent these securities are valued at the last sale price or NASDAQ official closing price, they are classified as Level 1 in the fair value hierarchy. In the event that no sale or official closing price on valuation date exists, these securities are generally valued at the mean between the last reported bid and ask prices, or at the last bid price in the absence of an ask price. These securities are classified as Level 2 in the fair value hierarchy.
Foreign equities traded on foreign securities exchanges are generally valued using pricing vendor services that provide model prices derived using adjustment factors based on information such as local closing price, relevant general and sector indices, currency fluctuations, depositary receipts, and futures, as applicable. Securities valued using such model prices are classified as Level 2 in the fair value hierarchy. The models generate an evaluated adjustment factor for each security, which is applied to the local closing price to adjust it for post closing market movements. Utilizing that evaluated adjustment factor, the vendor provides an evaluated price for each security. If the vendor does not provide an evaluated price, securities are valued in accordance with exchange-traded common and preferred stock valuation policies discussed above.
Investments in open-end, non-exchange-traded mutual funds are valued at their net asset values as of the close of the NYSE on the date of valuation. These securities are classified as Level 1 in the fair value hierarchy since they may be purchased or sold at their net asset values on the date of valuation.
Securities and other assets that cannot be priced according to the methods described above are valued based on pricing methodologies approved by the Board. In the event that unobservable inputs are used when determining such valuations, the securities will be classified as Level 3 in the fair value hierarchy.
When determining the fair value of securities, some of the factors influencing the valuation include: the nature of any restrictions on disposition of the securities; assessment of the general liquidity of the securities; the issuer’s financial condition and the markets in which it does business; the cost of the investment; the size of the holding and the capitalization of the issuer; the prices of any recent transactions or bids/offers for such securities or any comparable securities; any available analyst media or other reports or information deemed reliable by the investment manager regarding the issuer or the markets or industry in which it operates. Using fair value to price securities may result in a value that is different from a security’s most recent closing price and from the price used by other unaffiliated mutual funds to calculate their net asset values.
Restricted and Illiquid Securities: Subject to guidelines adopted by the Board, the Series may invest up to 15% of its net assets in illiquid securities, including those which are restricted as to disposition under securities law (“restricted securities”). Restricted securities are valued pursuant to the valuation procedures noted above. Illiquid securities are those that, because of the absence of a readily available market or due to legal or contractual restrictions on resale, cannot be sold within seven days in the ordinary course of business at approximately the amount at which the Series has valued the investment.
| Prudential QMA International Equity Fund | 37 |
Notes to Financial Statements (continued)
Therefore, the Series may find it difficult to sell illiquid securities at the time considered most advantageous by its Subadviser and may incur expenses that would not be incurred in the sale of securities that were freely marketable. Certain securities that would otherwise be considered illiquid because of legal restrictions on resale to the general public may be traded among qualified institutional buyers under Rule 144A of the Securities Act of 1933. These Rule 144A securities, as well as commercial paper that is sold in private placements under Section 4(2) of the Securities Act, may be deemed liquid by the Series’ Subadviser under the guidelines adopted by the Directors of the Series. However, the liquidity of the Series’ investments in Rule 144A securities could be impaired if trading does not develop or declines.
Foreign Currency Translation: The books and records of the Series are maintained in U.S. dollars. Foreign currency amounts are translated into U.S. dollars on the following basis:
(i) market value of investment securities, other assets and liabilities—at the current rates of exchange;
(ii) purchases and sales of investment securities, income and expenses—at the rates of exchange prevailing on the respective dates of such transactions.
Although the net assets of the Series are presented at the foreign exchange rates and market values at the close of the period, the Series does not generally isolate that portion of the results of operations arising as a result of changes in the foreign exchange rates from the fluctuations arising from changes in the market prices of long-term portfolio securities held at the end of the period. Similarly, the Series does not isolate the effect of changes in foreign exchange rates from the fluctuations arising from changes in the market prices of long-term portfolio securities sold during the period. Accordingly, holding period realized foreign currency gains (losses) are included in the reported net realized gains (losses) on investment transactions.
Net realized gains (losses) on foreign currency transactions represent net foreign exchange gains (losses) from the disposition of holdings of foreign currencies, forward currency contracts, currency gains (losses) realized between the trade and settlement dates on securities transactions, and the difference between the amounts of interest, dividends and foreign withholding taxes recorded on the Series’ books and the U.S. dollar equivalent amounts actually received or paid. Net unrealized currency gains (losses) from valuing foreign currency denominated assets and liabilities (other than investments) at period end exchange rates are reflected as a component of net unrealized appreciation (depreciation) on foreign currencies.
Master Netting Arrangements: The Series is subject to various Master Agreements, or netting arrangements, with select counterparties. These are agreements which a subadviser
| 38 |
may have negotiated and entered into on behalf of the Series. A master netting arrangement between the Series and the counterparty permits the Series to offset amounts payable by the Series to the same counterparty against amounts to be received; and by the receipt of collateral from the counterparty by the Series to cover the Series’ exposure to the counterparty. However, there is no assurance that such mitigating factors are easily enforceable. In addition to master netting arrangements, the right to set-off exists when all the conditions are met such that each of the parties owes the other determinable amounts, the reporting party has the right to set-off the amount owed with the amount owed by the other party, the reporting party intends to set-off and the right of set-off is enforceable by law. During the reporting period, there was no intention to settle on a net basis and all amounts are presented on a gross basis on the Statement of Assets and Liabilities.
Rights: The Series may hold rights acquired either through a direct purchase, included as part of a private placement, or pursuant to corporate actions. Rights entitle the holder to buy a proportionate amount of common stock, or such other security that the issuer may specify, at a specific price and time through the expiration dates. Such rights are held as long positions by the Series until exercised, sold or expired. Rights are valued at fair value in accordance with the Board approved fair valuation procedures.
Securities Lending: The Series may lend its portfolio securities to banks and broker-dealers. The loans are secured by collateral at least equal to the market value of the securities loaned. Collateral pledged by each borrower is invested in an affiliated money market fund and is marked to market daily, based on the previous day’s market value, such that the value of the collateral exceeds the value of the loaned securities. Loans are subject to termination at the option of the borrower or the Series. Upon termination of the loan, the borrower will return to the Series securities identical to the loaned securities. Should the borrower of the securities fail financially, the Series has the right to repurchase the securities in the open market using the collateral. The Series recognizes income, net of any rebate and securities lending agent fees, for lending its securities in the form of fees or interest on the investment of any cash received as collateral. The borrower receives all interest and dividends from the securities loaned and such payments are passed back to the lender in amounts equivalent thereto. The Series also continues to recognize any unrealized gain (loss) in the market price of the securities loaned and on the change in the value of the collateral invested that may occur during the term of the loan. In addition, realized gain (loss) is recognized on changes in the value of the collateral invested upon liquidation of the collateral. Net earnings from securities lending are disclosed on the Statement of Operations as “Income from securities lending, net”.
Concentration of Risk: Foreign security and currency transactions may involve certain considerations and risks not typically associated with those of domestic origin as a result of, among other factors, the possibility of political or economic instability or the level of governmental supervision and regulation of foreign securities markets.
| Prudential QMA International Equity Fund | 39 |
Notes to Financial Statements (continued)
Securities Transactions and Net Investment Income: Securities transactions are recorded on the trade date. Realized gains (losses) from investment and currency transactions are calculated on the specific identification method. Dividend income is recorded on the ex-date. Expenses are recorded on an accrual basis, which may require the use of certain estimates by management that may differ from actual. Net investment income or loss (other than class specific expenses and waivers, which are allocated as noted below) and unrealized and realized gains (losses) are allocated daily to each class of shares based upon the relative proportion of adjusted net assets of each class at the beginning of the day.
Class specific expenses and waivers, where applicable, are charged to the respective share classes. Class specific expenses include Distribution fees and Distribution fee waivers, and effective August 1, 2017, Transfer Agent’s fees and expenses, Registration fees and Management fee waivers. Prior to August 1, 2017 Transfer Agent’s fees and expenses, Registration fees and Management fee waivers were not designated as class specific expenses and were allocated daily to each class of shares based upon the relative proportion of adjusted net assets of each class at the beginning of the day.
Taxes: It is the Series’ policy to continue to meet the requirements of the Internal Revenue Code applicable to regulated investment companies and to distribute all of its taxable net investment income and capital gains, if any, to its shareholders. Therefore, no federal income tax provision is required. Withholding taxes on foreign dividends, interest and capital gains, if any, are recorded, net of reclaimable amounts, at the time the related income is earned.
Dividends and Distributions: The Series expects to pay dividends from net investment income and distributions from net realized capital and currency gains, if any, annually. Dividends and distributions to shareholders, which are determined in accordance with federal income tax regulations and which may differ from generally accepted accounting principles, are recorded on the ex-date. Permanent book/tax differences relating to income and gain (loss) are reclassified amongst undistributed net investment income, accumulated net realized gain (loss) and paid-in capital in excess of par, as appropriate.
Estimates: The preparation of financial statements requires management to make estimates and assumptions that affect the reported amounts and disclosures in the financial statements. Actual results could differ from those estimates.
2. Agreements
The Fund, on behalf of the Series, has a management agreement with PGIM Investments. Pursuant to this agreement, PGIM Investments has responsibility for all investment advisory services and supervises the subadviser’s performance of such services. PGIM Investments
| 40 |
has entered into a subadvisory agreement with Quantitative Management Associates LLC (“QMA”). The subadvisory agreement provides that QMA will furnish investment advisory services in connection with the management of the Series. In connection therewith, QMA is obligated to keep certain books and records of the Series. PGIM Investments pays for the services of QMA, the cost of compensation of officers of the Series, occupancy and certain clerical and bookkeeping costs of the Series. The Series bears all other costs and expenses.
Effective August 1, 2017, the management fee paid to PGIM Investments is accrued daily and payable monthly, at an annual rate of .75% of the average daily net assets of the Series up to and including $2 billion, .70% of the average daily net assets of the Series in excess of $2 billion up to and including $5 billion and .69% of the average daily net assets of the Series over $5 billion. Prior to August 1, 2017, the management fee paid to PGIM Investments was accrued daily and payable monthly, at an annual rate of .85% of the average daily net assets of the Series up to and including $300 million, .75% of the average daily net assets in excess of $300 million up to and including $1.5 billion and .70% of the Series’ average daily net assets over $1.5 billion. The effective management fee rate before any waivers and/or expense reimbursement was .82% for the year ended October 31, 2017. The effective management fee rate net of waivers and/or expense reimbursement was .80%.
Effective August 1, 2017, PGIM Investments has contractually agreed through February 28, 2019 to limit the net annual operating expenses (exclusive of taxes (such as income and foreign withholding taxes, stamp duty and deferred tax expenses), interest, underlying funds, brokerage, extraordinary and certain other expenses such as dividend, broker charges and interest expense on short sales) to 2.53% of average daily net assets for Class B shares and 0.78% of average daily net assets for Class Q shares. Due to the implementation of this contractual expense limitation, also effective August 1, 2017, the Manager has agreed to voluntarily waive certain other expenses as necessary for Class A, Class C and Class Z shares. For the year ended October 31, 2017, the Manager has voluntarily limited Total annual Fund operating expenses after fee waivers and/or reimbursements (excluding interest, brokerage, taxes (such as income and foreign withholding taxes, stamp duty and deferred tax expenses), acquired fund fees and expenses, extraordinary expenses, and certain other Fund expenses such as dividend, broker charges and interest expense on short sales) to 1.43% of average daily net assets for Class A shares, 2.28% of average daily net assets for Class C shares and 1.17% of average daily net assets for Class Z shares. Expenses waived/reimbursed by the Manager in accordance with this agreement may be recouped by the Manager within the same fiscal year during which such waiver/reimbursement is made if such recoupment can be realized without exceeding the expense limit in effect at the time of the recoupment for that fiscal year.
The Fund, on behalf of the Series, has a distribution agreement with Prudential Investment Management Services LLC (“PIMS”), which acts as the distributor of the Class A, Class B, Class C, Class Q and Class Z shares of the Series. The Series compensates PIMS for distributing and servicing the Series’ Class A, Class B and Class C shares, pursuant to plans of distribution (the “Distribution Plans”), regardless of expenses actually incurred by PIMS.
| Prudential QMA International Equity Fund | 41 |
Notes to Financial Statements (continued)
The distribution fees are accrued daily and payable monthly. No distribution or service fees are paid to PIMS as distributor of the Class Q and Class Z shares of the Series.
Pursuant to the Distribution Plans, the Series compensates PIMS for distribution related activities at an annual rate of up to .30%, 1% and 1% of the average daily net assets of the Class A, B and C shares, respectively.
PIMS has advised the Series that it has received $65,279 in front-end sales charges resulting from sales of Class A shares during the year ended October 31, 2017. From these fees, PIMS paid such sales charges to affiliated broker-dealers, which in turn paid commissions to salespersons and incurred other distribution costs.
PIMS has advised the Series that for the year ended October 31, 2017 it received $20, $1,971 and $353 in contingent deferred sales charges imposed upon redemptions by certain Class A, Class B and Class C shareholders, respectively.
PGIM Investments, PIMS and QMA are indirect, wholly-owned subsidiaries of Prudential Financial, Inc. (“Prudential”).
3. Other Transactions with Affiliates
Prudential Mutual Fund Services LLC (“PMFS”), an affiliate of PGIM Investments and an indirect, wholly-owned subsidiary of Prudential, serves as the Series’ transfer agent. Transfer agent’s fees and expenses in the Statement of Operations include certain out-of-pocket expenses paid to non-affiliates, where applicable.
The Series may enter into certain securities purchase or sale transactions under Board approved Rule 17a-7 procedures. Rule 17a-7 is an exemptive rule under the 1940 Act, that permits purchase and sale transactions among affiliated investment companies, or between an investment company and a person that is affiliated solely by reason of having a common (or affiliated) investment adviser, common directors, and/or common officers. Such transactions are subject to ratification by the Board. For the reporting period ended October 31, 2017 no such transactions were entered into by the Series.
The Series may invest its overnight sweep cash in the Prudential Core Ultra Short Bond Fund (the “Core Fund”), and its securities lending cash collateral in the Prudential Institutional Money Market Fund (the “Money Market Fund”), each a series of Prudential Investment Portfolios 2, registered under the 1940 Act and managed by PGIM Investments. For the reporting period ended October 31, 2017, PGIM, Inc. was compensated $2,568 by PGIM Investments for managing the Series’ securities lending cash collateral as subadviser to the Money Market Fund. Earnings from the Core Fund and Money Market Fund are
| 42 |
disclosed on the Statement of Operations as “Affiliated dividend income” and “Income from securities lending, net”, respectively.
4. Portfolio Securities
The aggregate cost of purchases and proceeds from sales of portfolio securities (excluding short-term investments and U.S. Government securities) for the year ended October 31, 2017, were $274,991,007 and $300,406,302, respectively.
5. Distributions and Tax Information
Distributions to shareholders, which are determined in accordance with federal income tax regulations and which may differ from generally accepted accounting principles, are recorded on the ex-date. In order to present undistributed net investment income, accumulated net realized loss on investment and foreign currency transactions and paid-in capital excess of par on the Statement of Assets and Liabilities that more closely represent their tax character, certain adjustments have been made to undistributed net investment income, accumulated net realized loss on investment and foreign currency transactions and paid-in capital in excess of par. For the year ended October 31, 2017, the adjustments were to increase undistributed net investment income by $980,513, decrease accumulated net realized loss on investment and foreign currency transactions by $179,345,602 and decrease paid-in capital in excess of par by $180,326,115, due to the differences in the treatment for book and tax purposes of certain transactions involving foreign securities and currencies, investments in passive foreign investment companies, and the expiration of a capital loss carryforward. Net investment income, net realized gain (loss) on investment and foreign currency transactions and net assets were not affected by this change.
For the years ended October 31, 2017 and October 31, 2016 the tax characters of dividends paid by the Series were $4,993,754 and $4,531,261 of ordinary income, respectively.
As of October 31, 2017, the accumulated undistributed earnings on a tax basis was $4,392,814 of ordinary income.
The United States federal income tax basis of the Series’ investments and the net unrealized appreciation as of October 31, 2017 were as follows:
Tax Basis | Gross | Gross | Net | |||
$237,555,325 | $55,793,577 | $(3,256,836) | $52,536,741 |
The difference between book and tax basis was primarily due to deferred losses on wash sales and other book to tax differences.
Under the Regulated Investment Company Modernization Act of 2010 (the “Act”), the Fund is permitted to carryforward capital losses realized on or after November 1, 2011
| Prudential QMA International Equity Fund | 43 |
Notes to Financial Statements (continued)
(“post-enactment losses”) for an unlimited period. Post-enactment losses are required to be utilized before the utilization of losses incurred prior to the effective date of the Act. As a result of this ordering rule, capital loss carryforwards related to taxable years ending before October 31, 2012 (“pre-enactment losses”) may have an increased likelihood to expire unused. Additionally, post-enactment capital losses that are carried forward will retain their character as either short-term or long-term capital losses rather than being considered all short-term as under previous law. Additionally, the Series had capital loss carryforwards of approximately $180,326,000 expire unused. Additionally, the Series utilized approximately $25,475,000 of its capital loss carryforward to offset capital gains during the fiscal year ended October 31, 2017. No capital gains distributions are expected to be paid to shareholders until net gains have been realized in excess of such losses. As of October 31, 2017, the pre and post-enactment losses were approximately:
Post-Enactment Losses: | $ | 2,441,000 | ||
|
| |||
Pre-Enactment Losses: | ||||
Expiring 2018 | $ | 8,337,000 | ||
|
|
Management has analyzed the Series’ tax positions taken on federal, state and local income tax returns for all open tax years and has concluded that no provision for income tax is required in the Series’ financial statements for the current reporting period. The Series’ federal, state and local income and federal excise tax returns for tax years for which the applicable statutes of limitations have not expired are subject to examination by the Internal Revenue Service and state departments of revenue.
6. Capital
The Series offers Class A, Class B, Class C, Class Q and Class Z shares. Class A shares are sold with a maximum front-end sales charge of 5.50%. Investors who purchase $1 million or more of Class A shares and sell these shares within 12 months of purchase are subject to a contingent deferred sales charge (“CDSC”) of 1%, although they are not subject to an initial sales charge. The Class A CDSC is waived for certain retirement and/or benefit plans. Class B shares are sold with a CDSC which declines from 5% to zero depending on the period of time the shares are held. Class B shares automatically convert to Class A shares on a quarterly basis approximately seven years after purchase. Class B shares are closed to new purchases. Class C shares are sold with a CDSC of 1% on sales made within 12 months of purchase. A special exchange privilege is also available for shareholders who qualified to purchase Class A shares at net asset value. Class Q and Class Z shares are not subject to any sales or redemption charge and are available exclusively for sale to a limited group of investors.
| 44 |
Under certain circumstances, an exchange may be made from specified share classes of the Series to one or more other share classes of the Series as presented in the table of transactions in shares of common stock.
The Fund is authorized to issue 4.8 billion shares of common stock, with a par value of $.01 per share, which is divided into seven series. There are 700 million shares authorized for the Series, divided into six classes, designated Class A, Class B, Class C, Class Q, Class Z and Class T common stock, each of which consists of 100 million, 5 million, 100 million, 180 million, 180 million and 135 million authorized shares, respectively. The Series currently does not have any Class T shares outstanding.
As of October 31, 2017, Prudential through its affiliate entities, including funds, owned 4,878,792 shares of Class Q. At reporting period end, four shareholders of record held 41% of the Series’ outstanding shares, of which 11% were held by the affiliates of Prudential.
Transactions in shares of common stock were as follows:
Class A | Shares | Amount | ||||||
Year ended October 31, 2017: | ||||||||
Shares sold | 752,431 | $ | 5,382,926 | |||||
Shares issued in reinvestment of dividends and distributions | 558,922 | 3,504,441 | ||||||
Shares reacquired | (3,695,192 | ) | (25,772,057 | ) | ||||
|
|
|
| |||||
Net increase (decrease) in shares outstanding before conversion | (2,383,839 | ) | (16,884,690 | ) | ||||
Shares issued upon conversion from other share class(es) | 184,434 | 1,286,550 | ||||||
Shares reacquired upon conversion into other share class(es) | (243,609 | ) | (1,688,042 | ) | ||||
|
|
|
| |||||
Net increase (decrease) in shares outstanding | (2,443,014 | ) | $ | (17,286,182 | ) | |||
|
|
|
| |||||
Year ended October 31, 2016: | ||||||||
Shares sold | 762,631 | $ | 4,732,434 | |||||
Shares issued in reinvestment of dividends and distributions | 512,660 | 3,219,500 | ||||||
Shares reacquired | (4,507,217 | ) | (28,182,837 | ) | ||||
|
|
|
| |||||
Net increase (decrease) in shares outstanding before conversion | (3,231,926 | ) | (20,230,903 | ) | ||||
Shares issued upon conversion from other share class(es) | 149,564 | 935,639 | ||||||
Shares reacquired upon conversion into other share class(es) | (142,045 | ) | (892,788 | ) | ||||
|
|
|
| |||||
Net increase (decrease) in shares outstanding | (3,224,407 | ) | $ | (20,188,052 | ) | |||
|
|
|
| |||||
| Prudential QMA International Equity Fund | 45 |
Notes to Financial Statements (continued)
Class B | Shares | Amount | ||||||
Year ended October 31, 2017: | ||||||||
Shares sold | 70,167 | $ | 511,080 | |||||
Shares issued in reinvestment of dividends and distributions | 6,760 | 40,832 | ||||||
Shares reacquired | (55,031 | ) | (363,862 | ) | ||||
|
|
|
| |||||
Net increase (decrease) in shares outstanding before conversion | 21,896 | 188,050 | ||||||
Shares reacquired upon conversion into other share class(es) | (120,582 | ) | (808,620 | ) | ||||
|
|
|
| |||||
Net increase (decrease) in shares outstanding | (98,686 | ) | $ | (620,570 | ) | |||
|
|
|
| |||||
Year ended October 31, 2016: | ||||||||
Shares sold | 10,670 | $ | 65,248 | |||||
Shares issued in reinvestment of dividends and distributions | 6,686 | 40,453 | ||||||
Shares reacquired | (121,431 | ) | (728,578 | ) | ||||
|
|
|
| |||||
Net increase (decrease) in shares outstanding before conversion | (104,075 | ) | (622,877 | ) | ||||
Shares reacquired upon conversion into other share class(es) | (149,541 | ) | (896,634 | ) | ||||
|
|
|
| |||||
Net increase (decrease) in shares outstanding | (253,616 | ) | $ | (1,519,511 | ) | |||
|
|
|
| |||||
Class C | ||||||||
Year ended October 31, 2017: | ||||||||
Shares sold | 151,352 | $ | 1,041,106 | |||||
Shares issued in reinvestment of dividends and distributions | 34,905 | 210,474 | ||||||
Shares reacquired | (470,230 | ) | (3,105,114 | ) | ||||
|
|
|
| |||||
Net increase (decrease) in shares outstanding before conversion | (283,973 | ) | (1,853,534 | ) | ||||
Shares reacquired upon conversion into other share class(es) | (84,714 | ) | (563,607 | ) | ||||
|
|
|
| |||||
Net increase (decrease) in shares outstanding | (368,687 | ) | $ | (2,417,141 | ) | |||
|
|
|
| |||||
Year ended October 31, 2016: | ||||||||
Shares sold | 200,289 | $ | 1,218,445 | |||||
Shares issued in reinvestment of dividends and distributions | 27,456 | 166,109 | ||||||
Shares reacquired | (522,460 | ) | (3,111,379 | ) | ||||
|
|
|
| |||||
Net increase (decrease) in shares outstanding before conversion | (294,715 | ) | (1,726,825 | ) | ||||
Shares reacquired upon conversion into other share class(es) | (4,615 | ) | (27,813 | ) | ||||
|
|
|
| |||||
Net increase (decrease) in shares outstanding | (299,330 | ) | $ | (1,754,638 | ) | |||
|
|
|
| |||||
Class Q | ||||||||
Period* ended October 31, 2017: | ||||||||
Shares sold | 201,769 | $ | 1,456,980 | |||||
Shares reacquired† | (1,003,132 | ) | (7,206,560 | ) | ||||
|
|
|
| |||||
Net increase (decrease) in shares outstanding before conversion | (801,363 | ) | (5,749,580 | ) | ||||
Shares issued upon conversion from other share class(es) | 5,700,179 | 36,042,494 | ||||||
|
|
|
| |||||
Net increase (decrease) in shares outstanding | 4,898,816 | $ | 30,292,914 | |||||
|
|
|
| |||||
| 46 |
Class Z | Shares | Amount | ||||||
Year ended October 31, 2017: | ||||||||
Shares sold | 650,610 | $ | 4,273,750 | |||||
Shares issued in reinvestment of dividends and distributions | 183,440 | 1,157,506 | ||||||
Shares reacquired | (825,492 | ) | (5,651,314 | ) | ||||
|
|
|
| |||||
Net increase (decrease) in shares outstanding before conversion | 8,558 | (220,058 | ) | |||||
Shares issued upon conversion from other share class(es) | 241,534 | 1,676,815 | ||||||
Shares reacquired upon conversion into other share class(es) | (5,687,349 | ) | (35,945,590 | ) | ||||
|
|
|
| |||||
Net increase (decrease) in shares outstanding | (5,437,257 | ) | $ | (34,488,833 | ) | |||
|
|
|
| |||||
Year ended October 31, 2016: | ||||||||
Shares sold | 751,142 | $ | 4,616,455 | |||||
Shares issued in reinvestment of dividends and distributions | 161,859 | 1,021,331 | ||||||
Shares reacquired | (1,614,319 | ) | (10,187,183 | ) | ||||
|
|
|
| |||||
Net increase (decrease) in shares outstanding before conversion | (701,318 | ) | (4,549,397 | ) | ||||
Shares issued upon conversion from other shares class(es) | 144,090 | 912,035 | ||||||
Shares reacquired upon conversion into other share class(es) | (4,675 | ) | (30,439 | ) | ||||
|
|
|
| |||||
Net increase (decrease) in shares outstanding | (561,903 | ) | $ | (3,667,801 | ) | |||
|
|
|
| |||||
| * | Commencement of offering was December 28, 2016. |
| † | Includes affiliated redemption of 1,582 shares with a value of $12,199 for Class Q shares. |
7. Borrowings
The Fund, on behalf of the Series, along with other affiliated registered investment companies (the “Funds”), is a party to a Syndicated Credit Agreement (“SCA”) with a group of banks. The purpose of the SCA is to provide an alternative source of temporary funding for capital share redemptions. The SCA provides for a commitment of $900 million for the period October 5, 2017 through October 4, 2018. The Funds pay an annualized commitment fee of .15% of the unused portion of the SCA. The Series’ portion of the commitment fee for the unused amount, allocated based upon a method approved by the Board, is accrued daily and paid quarterly. Prior to October 5, 2017, the Funds had another SCA that provided a commitment of $900 million and the Funds paid an annualized commitment fee of .15% of the unused portion of the SCA. The interest on borrowings under the SCAs is paid monthly and at a per annum interest rate based upon a contractual spread plus the higher of (1) the effective federal funds rate, (2) the 1-month LIBOR rate or (3) zero percent.
Other affiliated registered investment companies that are parties to the SCA include portfolios that are subject to a predetermined mathematical formula used to manage certain benefit guarantees offered under variable annuity contracts. The formula may result in large scale asset flows into and out of these portfolios. Consequently, these portfolios may be more likely to utilize the SCA for purposes of funding redemptions. It may be possible for those portfolios to fully exhaust the committed amount of the SCA, thereby requiring the Manager to allocate available funding per a Board-approved methodology designed to treat the Funds in the SCA equitably.
| Prudential QMA International Equity Fund | 47 |
Notes to Financial Statements (continued)
The Series utilized the SCA during the reporting period ended October 31, 2017. The average daily balance for the 148 days that the Series had loans outstanding during the period was $314,595, borrowed at a weighted average interest rate of 2.12%. The maximum loan balance outstanding during the period was $1,922,000. At October 31, 2017, the Series did not have an outstanding loan balance.
8. Dividends to Shareholders
Subsequent to the year ended October 31, 2017, the Series declared ordinary income dividends on December 4, 2017 to shareholders of record on December 5, 2017. The ex-date was December 6, 2017. The per share amounts declared were as follows:
| Ordinary Income | ||||
Class A | $ | 0.14533 | ||
Class B | $ | 0.08522 | ||
Class C | $ | 0.09469 | ||
Class Q | $ | 0.18990 | ||
Class Z | $ | 0.16739 | ||
| 48 |
Financial Highlights
| Class A Shares | ||||||||||||||||||||
Year Ended October 31, | ||||||||||||||||||||
| 2017 | 2016 | 2015 | 2014 | 2013 | ||||||||||||||||
| Per Share Operating Performance(a): | ||||||||||||||||||||
| Net Asset Value, Beginning of Year | $6.48 | $6.65 | $7.36 | $7.37 | $6.02 | |||||||||||||||
| Income (loss) from investment operations: | ||||||||||||||||||||
| Net investment income (loss) | .11 | .11 | .11 | .15 | .12 | |||||||||||||||
| Net realized and unrealized gain (loss) on investment and foreign currency transactions | 1.49 | (.17 | ) | (.65 | ) | (.02 | ) | 1.36 | ||||||||||||
| Total from investment operations | 1.60 | (.06 | ) | (.54 | ) | .13 | 1.48 | |||||||||||||
| Less Dividends: | ||||||||||||||||||||
| Dividends from net investment income | (.13 | ) | (.11 | ) | (.17 | ) | (.14 | ) | (.13 | ) | ||||||||||
| Net asset value, end of year | $7.95 | $6.48 | $6.65 | $7.36 | $7.37 | |||||||||||||||
| Total Return(b): | 25.17% | (.93)% | (7.37)% | 1.84% | 25.06% | |||||||||||||||
| Ratios/Supplemental Data: | ||||||||||||||||||||
| Net assets, end of year (000) | $207,626 | $185,120 | $211,314 | $218,909 | $234,668 | |||||||||||||||
| Average net assets (000) | $192,517 | $189,980 | $229,598 | $232,049 | $221,300 | |||||||||||||||
| Ratios to average net assets(c): | ||||||||||||||||||||
| Expenses after waivers and/or expense reimbursement | 1.58% | 1.66% | 1.62% | 1.59% | 1.59% | |||||||||||||||
| Expenses before waivers and/or expense reimbursement | 1.59% | 1.66% | 1.62% | 1.59% | 1.59% | |||||||||||||||
| Net investment income (loss) | 1.62% | 1.69% | 1.39% | 2.02% | 1.83% | |||||||||||||||
| Portfolio turnover rate | 105% | 114% | 111% | 134% | 114% | |||||||||||||||
| (a) | Calculated based on average shares outstanding during the year. |
| (b) | Total return does not consider the effects of sales loads. Total return is calculated assuming a purchase of a share on the first day and a sale on the last day of each year reported and includes reinvestment of dividends and distributions, if any. Total returns may reflect adjustments to conform to generally accepted accounting principles. |
| (c) | Does not include expenses of the underlying portfolios in which the Series invests. |
See Notes to Financial Statements.
| Prudential QMA International Equity Fund | 49 |
Financial Highlights (continued)
| Class B Shares | ||||||||||||||||||||
| Year Ended October 31, | ||||||||||||||||||||
2017 | 2016 | 2015 | 2014 | 2013 | ||||||||||||||||
| Per Share Operating Performance(a): | ||||||||||||||||||||
| Net Asset Value, Beginning of Year | $6.21 | $6.37 | $7.05 | $7.07 | $5.78 | |||||||||||||||
| Income (loss) from investment operations: | ||||||||||||||||||||
| Net investment income (loss) | .05 | .06 | .05 | .10 | .07 | |||||||||||||||
| Net realized and unrealized gain (loss) on investment and foreign currency transactions | 1.43 | (.16 | ) | (.61 | ) | (.03 | ) | 1.32 | ||||||||||||
| Total from investment operations | 1.48 | (.10 | ) | (.56 | ) | .07 | 1.39 | |||||||||||||
| Less Dividends: | ||||||||||||||||||||
| Dividends from net investment income | (.09 | ) | (.06 | ) | (.12 | ) | (.09 | ) | (.10 | ) | ||||||||||
| Net asset value, end of year | $7.60 | $6.21 | $6.37 | $7.05 | $7.07 | |||||||||||||||
| Total Return(b): | 24.12% | (1.55)% | (7.96)% | 1.10% | 24.26% | |||||||||||||||
| Ratios/Supplemental Data: | ||||||||||||||||||||
| Net assets, end of year (000) | $3,020 | $3,080 | $4,774 | $5,006 | $6,066 | |||||||||||||||
| Average net assets (000) | $2,833 | $3,710 | $5,313 | $5,868 | $5,690 | |||||||||||||||
| Ratios to average net assets(c): | ||||||||||||||||||||
| Expenses after waivers and/or expense reimbursement | 2.39% | 2.36% | 2.32% | 2.29% | 2.29% | |||||||||||||||
| Expenses before waivers and/or expense reimbursement | 2.72% | 2.36% | 2.32% | 2.29% | 2.29% | |||||||||||||||
| Net investment income (loss) | .75% | .96% | .68% | 1.35% | 1.13% | |||||||||||||||
| Portfolio turnover rate | 105% | 114% | 111% | 134% | 114% | |||||||||||||||
| (a) | Calculated based on average shares outstanding during the year. |
| (b) | Total return does not consider the effects of sales loads. Total return is calculated assuming a purchase of a share on the first day and a sale on the last day of each year reported and includes reinvestment of dividends and distributions, if any. Total returns may reflect adjustments to conform to generally accepted accounting principles. |
| (c) | Does not include expenses of the underlying portfolios in which the Series invests. |
See Notes to Financial Statements.
| 50 |
| Class C Shares | ||||||||||||||||||||
Year Ended October 31, | ||||||||||||||||||||
2017 | 2016 | 2015 | 2014 | 2013 | ||||||||||||||||
| Per Share Operating Performance(a): | ||||||||||||||||||||
| Net Asset Value, Beginning of Year | $6.20 | $6.37 | $7.05 | $7.07 | $5.78 | |||||||||||||||
| Income (loss) from investment operations: | ||||||||||||||||||||
| Net investment income (loss) | .06 | .06 | .06 | .10 | .07 | |||||||||||||||
| Net realized and unrealized gain (loss) on investment and foreign currency transactions | 1.43 | (.17 | ) | (.62 | ) | (.03 | ) | 1.32 | ||||||||||||
| Total from investment operations | 1.49 | (.11 | ) | (.56 | ) | .07 | 1.39 | |||||||||||||
| Less Dividends: | ||||||||||||||||||||
| Dividends from net investment income | (.09 | ) | (.06 | ) | (.12 | ) | (.09 | ) | (.10 | ) | ||||||||||
| Net asset value, end of year | $7.60 | $6.20 | $6.37 | $7.05 | $7.07 | |||||||||||||||
| Total Return(b): | 24.33% | (1.71)% | (7.96)% | 1.10% | 24.27% | |||||||||||||||
| Ratios/Supplemental Data: | ||||||||||||||||||||
| Net assets, end of year (000) | $16,661 | $15,892 | $18,209 | $18,146 | $19,472 | |||||||||||||||
| Average net assets (000) | $15,736 | $16,416 | $20,086 | $19,402 | $18,341 | |||||||||||||||
| Ratios to average net assets(c): | ||||||||||||||||||||
| Expenses after waivers and/or expense reimbursement | 2.32% | 2.36% | 2.32% | 2.29% | 2.29% | |||||||||||||||
| Expenses before waivers and/or expense reimbursement | 2.33% | 2.36% | 2.32% | 2.29% | 2.29% | |||||||||||||||
| Net investment income (loss) | .86% | .98% | .71% | 1.32% | 1.13% | |||||||||||||||
| Portfolio turnover rate | 105% | 114% | 111% | 134% | 114% | |||||||||||||||
| (a) | Calculated based on average shares outstanding during the year. |
| (b) | Total return does not consider the effects of sales loads. Total return is calculated assuming a purchase of a share on the first day and a sale on the last day of each year reported and includes reinvestment of dividends and distributions, if any. Total returns may reflect adjustments to conform to generally accepted accounting principles. |
| (c) | Does not include expenses of the underlying portfolios in which the Series invests. |
See Notes to Financial Statements.
| Prudential QMA International Equity Fund | 51 |
Financial Highlights (continued)
| Class Q Shares | ||||
| December 28, 2016(a) through October 31, 2017 | ||||
| Per Share Operating Performance(b): | ||||
| Net Asset Value, Beginning of Period | $6.32 | |||
| Income (loss) from investment operations: | ||||
| Net investment income (loss) | .15 | |||
| Net realized and unrealized gain (loss) on investment and foreign currency transactions | 1.57 | |||
| Total from investment operations | 1.72 | |||
| Net asset value, end of period | $8.04 | |||
| Total Return(c): | 27.22% | |||
| Ratios/Supplemental Data: | ||||
| Net assets, end of period (000) | $39,379 | |||
| Average net assets (000) | $37,891 | |||
| Ratios to average net assets(d): | ||||
| Expenses after waivers and/or expense reimbursement | .95% | (e) | ||
| Expenses before waivers and/or expense reimbursement | .99% | (e) | ||
| Net investment income (loss) | 2.45% | (e) | ||
| Portfolio turnover rate | 105% | (f) | ||
| (a) | Commencement of offering. |
| (b) | Calculated based on average shares outstanding during the period. |
| (c) | Total return is calculated assuming a purchase of a share on the first day and a sale on the last day of each period reported and includes reinvestment of dividends and distributions, if any. Total returns may reflect adjustments to conform to generally accepted accounting principles. Total returns for periods less than one full year are not annualized. |
| (d) | Does not include expenses of the underlying portfolios in which the Series invests. |
| (e) | Annualized. |
| (f) | Not annualized. |
See Notes to Financial Statements.
| 52 |
| Class Z Shares | ||||||||||||||||||||
Year Ended October 31, | ||||||||||||||||||||
| 2017 | 2016 | 2015 | 2014 | 2013 | ||||||||||||||||
| Per Share Operating Performance(a): | ||||||||||||||||||||
| Net Asset Value, Beginning of Year | $6.54 | $6.70 | $7.42 | $7.43 | $6.07 | |||||||||||||||
| Income (loss) from investment operations: | ||||||||||||||||||||
| Net investment income (loss) | .11 | .13 | .13 | .16 | .15 | |||||||||||||||
| Net realized and unrealized gain (loss) on investment and foreign currency transactions | 1.52 | (.16) | (.66) | (.01) | 1.36 | |||||||||||||||
| Total from investment operations | 1.63 | (.03) | (.53) | .15 | 1.51 | |||||||||||||||
| Less Dividends: | ||||||||||||||||||||
| Dividends from net investment income | (.15) | (.13) | (.19) | (.16) | (.15) | |||||||||||||||
| Net asset value, end of year | $8.02 | $6.54 | $6.70 | $7.42 | $7.43 | |||||||||||||||
| Total Return(b): | 25.46% | (.44)% | (7.15)% | 2.12% | 25.36% | |||||||||||||||
| Ratios/Supplemental Data: | ||||||||||||||||||||
| Net assets, end of year (000) | $17,344 | $49,675 | $54,726 | $48,064 | $71,753 | |||||||||||||||
| Average net assets (000) | $21,567 | $50,923 | $55,405 | $53,881 | $60,981 | |||||||||||||||
| Ratios to average net assets(c): | ||||||||||||||||||||
| Expenses after waivers and/or expense reimbursement | 1.31% | 1.36% | 1.32% | 1.29% | 1.29% | |||||||||||||||
| Expenses before waivers and/or expense reimbursement | 1.32% | 1.36% | 1.32% | 1.29% | 1.29% | |||||||||||||||
| Net investment income (loss) | 1.57% | 1.99% | 1.69% | 2.07% | 2.17% | |||||||||||||||
| Portfolio turnover rate | 105% | 114% | 111% | 134% | 114% | |||||||||||||||
| (a) | Calculated based on average shares outstanding during the year. |
| (b) | Total return is calculated assuming a purchase of a share on the first day and a sale on the last day of each year reported and includes reinvestment of dividends and distributions, if any. Total returns may reflect adjustments to conform to generally accepted accounting principles. |
| (c) | Does not include expenses of the underlying portfolios in which the Series invests. |
See Notes to Financial Statements.
| Prudential QMA International Equity Fund | 53 |
Report of Independent Registered Public Accounting Firm
The Board of Directors and Shareholders
Prudential World Fund, Inc.:
We have audited the accompanying statement of assets and liabilities of Prudential QMA International Equity Fund (the “Fund”), a series of Prudential World Fund, Inc., including the portfolio of investments, as of October 31, 2017, and the related statement of operations for the year then ended, the statements of changes in net assets for each of the years in the two-year period then ended, and the financial highlights for each of the years or periods in the five-year period then ended. These financial statements and financial highlights are the responsibility of the Fund’s management. Our responsibility is to express an opinion on these financial statements and financial highlights based on our audits.
We conducted our audits in accordance with the standards of the Public Company Accounting Oversight Board (United States). Those standards require that we plan and perform the audit to obtain reasonable assurance about whether the financial statements and financial highlights are free of material misstatement. An audit includes examining, on a test basis, evidence supporting the amounts and disclosures in the financial statements. Our procedures included confirmation of securities owned as of October 31, 2017, by correspondence with the custodian, transfer agent and brokers or by other appropriate auditing procedures when replies from brokers were not received. An audit also includes assessing the accounting principles used and significant estimates made by management, as well as evaluating the overall financial statement presentation. We believe that our audits provide a reasonable basis for our opinion.
In our opinion, the financial statements and financial highlights referred to above present fairly, in all material respects, the financial position of the Fund as of October 31, 2017, and the results of its operations for the year then ended, the changes in its net assets for each of the years in the two-year period then ended, and the financial highlights for each of the years or periods in the five-year period then ended, in conformity with U.S. generally accepted accounting principles.

New York, New York
December 15, 2017
| 54 |
Federal Income Tax Information (unaudited)
For the year ended October 31, 2017, the Series reports, the maximum amount allowable under Section 854 of the Internal Revenue Code, but not less than, the following percentage of the ordinary income dividends paid as qualified dividend income (QDI):
| QDI | ||||
Prudential QMA International Equity Fund | 88.22 | % | ||
For the year ended October 31, 2017, the Series made an election to pass through the maximum amount of the portion of the ordinary income dividends paid derived from foreign source income as well as any foreign taxes paid by the Series in accordance with Section 853 of the Internal Revenue Code of the following amounts: $778,462 foreign tax credit from recognized foreign source income of $9,182,175.
In January 2018, you will be advised on IRS Form 1099-DIV or substitute 1099-DIV as to the federal tax status of dividends received by you in calendar year 2017.
| Prudential QMA International Equity Fund | 55 |
INFORMATION ABOUT BOARD MEMBERS AND OFFICERS
(Unaudited)
Information about Board Members and Officers of the Fund is set forth below. Board Members who are not deemed to be “interested persons” of the Fund, as defined in the 1940 Act, are referred to as “Independent Board Members.” Board Members who are deemed to be “interested persons” of the Fund are referred to as “Interested Board Members.” The Board Members are responsible for the overall supervision of the operations of the Fund and perform the various duties imposed on the directors of investment companies by the 1940 Act. The Board in turn elects the Officers, who are responsible for administering the day-to-day operations of the Fund.
| Independent Board Members(1) | ||||
| Name, Address, Age Position(s) Portfolios Overseen | Principal Occupation(s) During Past Five Years | Other Directorships Held During Past Five Years | ||
Ellen S. Alberding (59) Board Member Portfolios Overseen: 89 | President and Board Member, The Joyce Foundation (charitable foundation) (since 2002); Vice Chair, City Colleges of Chicago (community college system) (since 2011); Trustee, Skills for America’s Future (national initiative to connect employers to community colleges) (since 2011); Trustee, National Park Foundation (charitable foundation for national park system) (since 2009); Trustee, Economic Club of Chicago (since 2009). | None. | ||
Kevin J. Bannon (65) Board Member Portfolios Overseen: 89 | Retired; Managing Director (April 2008-May 2015) and Chief Investment Officer (October 2008-November 2013) of Highmount Capital LLC (registered investment adviser); formerly Executive Vice President and Chief Investment Officer (April 1993-August 2007) of Bank of New York Company; President (May 2003-May 2007) of BNY Hamilton Family of Mutual Funds. | Director of Urstadt Biddle Properties (equity real estate investment trust) (since September 2008). | ||
Linda W. Bynoe (65) Board Member Portfolios Overseen: 89 | President and Chief Executive Officer (since March 1995) and formerly Chief Operating Officer (December 1989-February 1995) of Telemat Ltd. (management consulting); formerly Vice President (January 1985-June 1989) at Morgan Stanley & Co. (broker-dealer). | Director of Simon Property Group, Inc. (retail real estate) (May 2003-May 2012); Director of Anixter International, Inc. (communication products distributor) (since January 2006); Director of Northern Trust Corporation (financial services) (since April 2006); Trustee of Equity Residential (residential real estate) (since December 2009). | ||
Prudential QMA International Equity Fund
| Independent Board Members(1) | ||||
| Name, Address, Age Position(s) Portfolios Overseen | Principal Occupation(s) During Past Five Years | Other Directorships Held During Past Five Years | ||
Barry H. Evans (57)± Board Member Portfolios Overseen: 89 | Retired; Formerly President (2005-2016), Global Chief Operating Officer (2014-2016), Chief Investment Officer-Global Head of Fixed Income (1998-2014), and various portfolio manager roles (1986-2006), Manulife Asset Management U.S. | Director, Manulife Trust Company (2011-present); Director, Manulife Asset Management Limited (2015-present); Formerly Chairman of the Board of Directors of Manulife Asset Management U.S. (2005-2016); Formerly Chairman of the Board, Declaration Investment Management and Research (2008-2016). | ||
Keith F. Hartstein (61) Board Member & Portfolios Overseen: 89 | Retired; Member (since November 2014) of the Governing Council of the Independent Directors Council (organization of independent mutual fund directors); formerly President and Chief Executive Officer (2005-2012), Senior Vice President (2004-2005), Senior Vice President of Sales and Marketing (1997-2004), and various executive management positions (1990-1997), John Hancock Funds, LLC (asset management); Chairman, Investment Company Institute’s Sales Force Marketing Committee (2003-2008). | None. | ||
Laurie Simon Hodrick (55)± Board Member Portfolios Overseen: 89 | A. Barton Hepburn Professor of Economics in the Faculty of Business, Columbia Business School (since 1996); Visiting Professor of Law and Rock Center for Corporate Governance Fellow, Stanford Law School (since 2015); Visiting Fellow, Hoover Institution, Stanford University (since 2015); Sole Member, ReidCourt LLC (since 2008) (a consulting firm); Formerly Managing Director, Global Head of Alternative Investment Strategies, Deutsche Bank (2006-2008); Formerly Director/Trustee, Merrill Lynch Investment Managers Funds (1999-2006). | Independent Director, Corporate Capital Trust (since April 2017) (a business development company). | ||
Michael S. Hyland, CFA (72) Board Member Portfolios Overseen: 89 | Retired (since February 2005); formerly Senior Managing Director (July 2001-February 2005) of Bear Stearns & Co, Inc.; Global Partner, INVESCO (1999-2001); Managing Director and President of Salomon Brothers Asset Management (1989-1999). | None. | ||
Visit our website at pgiminvestments.com
| Independent Board Members(1) | ||||
| Name, Address, Age Position(s) Portfolios Overseen | Principal Occupation(s) During Past Five Years | Other Directorships Held During Past Five Years | ||
Richard A. Redeker (74) Board Member & Portfolios Overseen: 87 | Retired Mutual Fund Senior Executive (47 years); Management Consultant; Director, Mutual Fund Directors Forum (since 2014); Independent Directors Council (organization of independent mutual fund directors)-Executive Committee, Chair of Policy Steering Committee, Governing Council. | None. | ||
Stephen G. Stoneburn (74) Board Member Portfolios Overseen: 89 | Chairman (since July 2011), President and Chief Executive Officer (since June 1996) of Frontline Medical Communications (publishing company); formerly President (June 1995-June 1996) of Argus Integrated Media, Inc.; Senior Vice President and Managing Director (January 1993-1995) of Cowles Business Media; Senior Vice President of Fairchild Publications, Inc. (1975-1989). | None. | ||
± Mr. Evans and Ms. Hodrick joined the Board effective as of September 1, 2017.
| Interested Board Members(1) | ||||
| Name, Address, Age Position(s) Portfolios Overseen | Principal Occupation(s) During Past Five Years | Other Directorships Held During Past Five Years | ||
Stuart S. Parker (55) Board Member & President Portfolios Overseen: 89 | President of PGIM Investments LLC (formerly known as Prudential Investments LLC) (since January 2012); Executive Vice President of Prudential Investment Management Services LLC (since December 2012); Executive Vice President of Jennison Associates LLC and Head of Retail Distribution of PGIM Investments LLC (June 2005-December 2011). | None. | ||
Prudential QMA International Equity Fund
| Interested Board Members(1) | ||||
| Name, Address, Age Position(s) Portfolios Overseen | Principal Occupation(s) During Past Five Years | Other Directorships Held During Past Five Years | ||
Scott E. Benjamin (44) Board Member & Vice President Portfolios Overseen: 89 | Executive Vice President (since June 2009) of PGIM Investments LLC; Executive Vice President (June 2009-June 2012) and Vice President (since June 2012) of Prudential Investment Management Services LLC; Executive Vice President (since September 2009) of AST Investment Services, Inc.; Senior Vice President of Product Development and Marketing, PGIM Investments (since February 2006); Vice President of Product Development and Product Management, Prudential Investments (2003-2006). | None. | ||
Grace C. Torres* (58) Board Member Portfolios Overseen: 88 | Retired; formerly Treasurer and Principal Financial and Accounting Officer of the Prudential Funds, Target Funds, Advanced Series Trust, Prudential Variable Contract Accounts and The Prudential Series Fund (1998-June 2014); Assistant Treasurer (March 1999-June 2014) and Senior Vice President (September 1999-June 2014) of PGIM Investments LLC; Assistant Treasurer (May 2003-June 2014) and Vice President (June 2005-June 2014) of AST Investment Services, Inc.; Senior Vice President and Assistant Treasurer (May 2003-June 2014) of Prudential Annuities Advisory Services, Inc. | Director (since July 2015) of Sun Bancorp, Inc. N.A. and Sun National Bank | ||
* Note: Prior to her retirement in 2014, Ms. Torres was employed by PGIM Investments LLC. Due to her prior employment, she is considered to be an “interested person” under the 1940 Act. Ms. Torres is a Non-Management Interested Board Member.
(1) The year that each Board Member joined the Board is as follows:
Ellen S. Alberding; 2013; Kevin J. Bannon, 2008; Linda W. Bynoe, 2005; Barry H. Evans, 2017; Keith F. Hartstein, 2013; Laurie Simon Hodrick, 2017; Michael S. Hyland, 2008; Richard A. Redeker, 2003; Stephen G. Stoneburn, 1996; Grace C. Torres, 2014; Stuart S. Parker, Board Member and President since 2012; Scott E. Benjamin, Board Member since 2010 and Vice President since 2009.
Visit our website at pgiminvestments.com
| Fund Officers(a) | ||||
| Name, Address and Age Position with Fund | Principal Occupation(s) During Past Five Years | Length of Service as Fund Officer | ||
Raymond A. O’Hara (62) Chief Legal Officer | Vice President and Corporate Counsel (since July 2010) of Prudential Insurance Company of America (Prudential); Vice President (March 2011-Present) of Pruco Life Insurance Company and Pruco Life Insurance Company of New Jersey; Vice President and Corporate Counsel (March 2011-Present) of Prudential Annuities Life Assurance Corporation; Chief Legal Officer of PGIM Investments LLC (since June 2012); Chief Legal Officer of Prudential Mutual Fund Services LLC (since June 2012) and Corporate Counsel of AST Investment Services, Inc. (since June 2012); formerly Assistant Vice President and Corporate Counsel (September 2008-July 2010) of The Hartford Financial Services Group, Inc.; formerly Associate (September 1980-December 1987) and Partner (January 1988-August 2008) of Blazzard & Hasenauer, P.C. (formerly, Blazzard, Grodd & Hasenauer, P.C.). | Since 2012 | ||
Chad A. Earnst (42) Chief Compliance Officer | Chief Compliance Officer (September 2014-Present) of PGIM Investments LLC; Chief Compliance Officer (September 2014-Present) of the Prudential Funds, Target Funds, Advanced Series Trust, The Prudential Series Fund, Prudential’s Gibraltar Fund, Inc., Prudential Global Short Duration High Yield Income Fund, Inc., Prudential Short Duration High Yield Fund, Inc. and Prudential Jennison MLP Income Fund, Inc.; formerly Assistant Director (March 2010-August 2014) of the Asset Management Unit, Division of Enforcement, US Securities & Exchange Commission; Assistant Regional Director (January 2010-August 2014), Branch Chief (June 2006-December 2009) and Senior Counsel (April 2003-May 2006) of the Miami Regional Office, Division of Enforcement, US Securities & Exchange Commission. | Since 2014 | ||
Deborah A. Docs (59) Secretary | Vice President and Corporate Counsel (since January 2001) of Prudential; Vice President (since December 1996) and Assistant Secretary (since March 1999) of PGIM Investments LLC; formerly Vice President and Assistant Secretary (May 2003-June 2005) of AST Investment Services, Inc. | Since 2004 | ||
Jonathan D. Shain (59) Assistant Secretary | Vice President and Corporate Counsel (since August 1998) of Prudential; Vice President and Assistant Secretary (since May 2001) of PGIM Investments LLC; Vice President and Assistant Secretary (since February 2001) of Prudential Mutual Fund Services LLC; formerly Vice President and Assistant Secretary (May 2003-June 2005) of AST Investment Services, Inc. | Since 2005 | ||
Claudia DiGiacomo (43) Assistant Secretary | Vice President and Corporate Counsel (since January 2005) of Prudential; Vice President and Assistant Secretary of PGIM Investments LLC (since December 2005); Associate at Sidley Austin Brown & Wood LLP (1999-2004). | Since 2005 | ||
Prudential QMA International Equity Fund
| Fund Officers(a) | ||||
| Name, Address and Age Position with Fund | Principal Occupation(s) During Past Five Years | Length of Service as Fund Officer | ||
Andrew R. French (54) Assistant Secretary | Vice President and Corporate Counsel (since February 2010) of Prudential; formerly Director and Corporate Counsel (2006-2010) of Prudential; Vice President and Assistant Secretary (since January 2007) of PGIM Investments LLC; Vice President and Assistant Secretary (since January 2007) of Prudential Mutual Fund Services LLC. | Since 2006 | ||
Charles H. Smith (44) Anti-Money Laundering Compliance Officer | Vice President, Corporate Compliance, Anti-Money Laundering Unit (since January 2015) of Prudential; committee member of the American Council of Life Insurers Anti-Money Laundering and Critical Infrastructure Committee (since January 2016); formerly Global Head of Economic Sanctions Compliance at AIG Property Casualty (February 2007-December 2014); Assistant Attorney General at the New York State Attorney General’s Office, Division of Public Advocacy. (August 1998-January 2007). | Since 2016 | ||
M. Sadiq Peshimam (53) Treasurer and Principal Financial and Accounting Officer | Vice President (since 2005) of PGIM Investments LLC; formerly Assistant Treasurer of funds in the Prudential Mutual Fund Complex (2006-2014). | Since 2006 | ||
Peter Parrella (59) Assistant Treasurer | Vice President (since 2007) and Director (2004-2007) within Prudential Mutual Fund Administration; formerly Tax Manager at SSB Citi Fund Management LLC (1997-2004). | Since 2007 | ||
Lana Lomuti (50) Assistant Treasurer | Vice President (since 2007) and Director (2005-2007), within Prudential Mutual Fund Administration; formerly Assistant Treasurer (December 2007-February 2014) of The Greater China Fund, Inc. | Since 2014 | ||
Linda McMullin (56) Assistant Treasurer | Vice President (since 2011) and Director (2008-2011) within Prudential Mutual Fund Administration. | Since 2014 | ||
Kelly A. Coyne (49) Assistant Treasurer | Director, Investment Operations of Prudential Mutual Fund Services LLC (since 2010). | Since 2015 | ||
(a) Excludes Mr. Parker and Mr. Benjamin, interested Board Members who also serve as President and Vice President, respectively.
Explanatory Notes to Tables:
| ∎ | Board Members are deemed to be “Interested,” as defined in the 1940 Act, by reason of their affiliation with PGIM Investments LLC and/or an affiliate of PGIM Investments LLC. |
| ∎ | Unless otherwise noted, the address of all Board Members and Officers is c/o PGIM Investments LLC, 655 Broad Street, Newark, New Jersey 07102-4410. |
| ∎ | There is no set term of office for Board Members or Officers. The Board Members have adopted a retirement policy, which calls for the retirement of Board Members on December 31 of the year in which they reach the age of 75. |
| ∎ | “Other Directorships Held” includes only directorships of companies required to register or file reports with the SEC under the 1934 Act (that is, “public companies”) or other investment companies registered under the 1940 Act. |
| ∎ | “Portfolios Overseen” includes all investment companies managed by PGIM Investments LLC. The investment companies for which PGIM Investments LLC serves as manager include the Prudential Mutual Funds, The Prudential Variable Contract Accounts, Target Mutual Funds, Prudential Short Duration High Yield Fund, Inc., Prudential Global Short Duration High Yield Fund, Inc., The Prudential Series Fund, Prudential’s Gibraltar Fund, Inc. and the Advanced Series Trust. |
Visit our website at pgiminvestments.com
Approval of Advisory Agreements
The Fund’s Board of Directors
The Board of Directors (the “Board”) of Prudential QMA International Equity Fund (the “Fund”)1 consists of twelve individuals, nine of whom are not “interested persons” of the Fund, as defined in the Investment Company Act of 1940, as amended (the “1940 Act”) (the “Independent Directors”). The Board is responsible for the oversight of the Fund and its operations, and performs the various duties imposed on the directors of investment companies by the 1940 Act. The Independent Directors have retained independent legal counsel to assist them in connection with their duties. The Chair of the Board is an Independent Director. The Board has established four standing committees: the Audit Committee, the Nominating and Governance Committee, and two Investment Committees. Each committee is chaired by, and composed of, Independent Directors.
Annual Approval of the Fund’s Advisory Agreements
As required under the 1940 Act, the Board determines annually whether to renew the Fund’s management agreement with PGIM Investments LLC (“PGIM Investments”) and the Fund’s subadvisory agreement with Quantitative Management Associates LLC (“QMA”). In considering the renewal of the agreements, the Board, including all of the Independent Directors,2 met on June 6-8, 2017 and approved the renewal of the agreements through July 31, 2018, after concluding that the renewal of the agreements was in the best interests of the Fund and its shareholders.
In advance of the meetings, the Board requested and received materials relating to the agreements, and had the opportunity to ask questions and request further information in connection with its consideration. Among other things, the Board considered comparative fee information from PGIM Investments and QMA. Also, the Board considered comparisons with other mutual funds in relevant Peer Universes and Peer Groups, as is further discussed below.
In approving the agreements, the Board, including the Independent Directors advised by independent legal counsel, considered the factors it deemed relevant, including the nature, quality and extent of services provided by PGIM Investments and the subadviser, the performance of the Fund, the profitability of PGIM Investments and its affiliates, expenses and fees, and the potential for economies of scale that may be shared with the Fund and its shareholders as the Fund’s assets grow. In their deliberations, the Directors did not identify any single factor which alone was responsible for the Board’s decision to approve the agreements with respect to the Fund. In connection with its deliberations, the Board
| 1 | Prudential QMA International Equity Fund is a series of Prudential World Fund, Inc. |
| 2 | Barry H. Evans and Laurie Simon Hodrick joined the Board effective as of September 1, 2017. Neither Mr. Evans nor Ms. Hodrick participated in the consideration of the renewal of the advisory agreements. |
| Prudential QMA International Equity Fund | ||
Approval of Advisory Agreements (continued)
considered information provided by PGIM Investments throughout the year at regular Board meetings, presentations from portfolio managers and other information, as well as information furnished at or in advance of the meetings on June 6-8, 2017.
The Directors determined that the overall arrangements between the Fund and PGIM Investments, which serves as the Fund’s investment manager pursuant to a management agreement, and between PGIM Investments and QMA, which serves as the Fund’s subadviser pursuant to the terms of a subadvisory agreement with PGIM Investments, are in the best interests of the Fund and its shareholders in light of the services performed, fees charged and such other matters as the Directors considered relevant in the exercise of their business judgment.
The material factors and conclusions that formed the basis for the Directors’ reaching their determinations to approve the continuance of the agreements are separately discussed below.
Nature, Quality and Extent of Services
The Board received and considered information regarding the nature, quality and extent of services provided to the Fund by PGIM Investments and QMA. The Board considered the services provided by PGIM Investments, including but not limited to the oversight of the subadviser for the Fund, as well as the provision of fund recordkeeping, compliance, and other services to the Fund. With respect to PGIM Investments’ oversight of the subadviser, the Board noted that PGIM Investments’ Strategic Investment Research Group (“SIRG”), which is a business unit of PGIM Investments, is responsible for monitoring and reporting to PGIM Investments’ senior management on the performance and operations of the subadviser. The Board also considered that PGIM Investments pays the salaries of all of the officers and interested Directors of the Fund who are part of Fund management. The Board also considered the investment subadvisory services provided by QMA, as well as adherence to the Fund’s investment restrictions and compliance with applicable Fund policies and procedures. The Board considered PGIM Investments’ evaluation of the subadviser, as well as PGIM Investments’ recommendation, based on its review of the subadviser, to renew the subadvisory agreement.
The Board considered the qualifications, backgrounds and responsibilities of PGIM Investments’ senior management responsible for the oversight of the Fund and QMA, and also considered the qualifications, backgrounds and responsibilities of QMA’s portfolio managers who are responsible for the day-to-day management of the Fund’s portfolio. The Board was provided with information pertaining to PGIM Investments’ and QMA’s organizational structure, senior management, investment operations, and other relevant information pertaining to both PGIM Investments and QMA. The Board also noted that it received favorable compliance reports from the Fund’s Chief Compliance Officer (“CCO”) as to both PGIM Investments and QMA. The Board noted that QMA is affiliated with PGIM Investments.
| Visit our website at pgiminvestments.com |
The Board concluded that it was satisfied with the nature, extent and quality of the investment management services provided by PGIM Investments and the subadvisory services provided to the Fund by QMA, and that there was a reasonable basis on which to conclude that the Fund benefits from the services provided by PGIM Investments and QMA under the management and subadvisory agreements.
Costs of Services and Profits Realized by PGIM Investments
The Board was provided with information on the profitability of PGIM Investments and its affiliates in serving as the Fund’s investment manager. The Board discussed with PGIM Investments the methodology utilized in assembling the information regarding profitability and considered its reasonableness. The Board recognized that it is difficult to make comparisons of profitability from fund management contracts because comparative information is not generally publicly available and is affected by numerous factors, including the structure of the particular adviser, the types of funds it manages, its business mix, numerous assumptions regarding allocations and the adviser’s capital structure and cost of capital. The Board further noted that the subadviser is affiliated with PGIM Investments and that its profitability is reflected in PGIM Investments’ profitability report. Taking these factors into account, the Board concluded that the profitability of PGIM Investments and its affiliates in relation to the services rendered was not unreasonable.
Economies of Scale
The Board received and discussed information concerning economies of scale that PGIM Investments may realize as the Fund’s assets grow beyond current levels. The Board noted that the management fee schedule for the Fund includes breakpoints, which have the effect of decreasing the fee rate as assets increase, and that at its current level of assets the Fund’s effective fee rate will reflect those rate reductions following the reduction in breakpoints discussed below. The Board took note that the Fund’s fee structure currently results in benefits to Fund shareholders whether or not PGIM Investments realizes any economies of scale. The Board noted that economies of scale can be shared with the Fund in other ways, including low management fees from inception, additional technological and personnel investments to enhance shareholder services, and maintaining existing expense structures in the face of a rising cost environment. The Board also considered PGIM Investments’ assertion that it continually evaluates the management fee schedule of the Fund and the potential to share economies of scale through breakpoints or fee waivers as asset levels increase.
The Board recognized the inherent limitations of any analysis of economies of scale, stemming largely from the Board’s understanding that most of PGIM Investments’ costs are not specific to individual funds, but rather are incurred across a variety of products and services.
| Prudential QMA International Equity Fund | ||
Approval of Advisory Agreements (continued)
Other Benefits to PGIM Investments and QMA
The Board considered potential ancillary benefits that might be received by PGIM Investments and QMA and their affiliates as a result of their relationship with the Fund. The Board concluded that potential benefits to be derived by PGIM Investments included transfer agency fees received by the Fund’s transfer agent (which is affiliated with PGIM Investments), and benefits to its reputation as well as other intangible benefits resulting from PGIM Investments’ association with the Fund. The Board concluded that the potential benefits to be derived by QMA included its ability to use soft dollar credits, as well as the potential benefits consistent with those generally resulting from an increase in assets under management, specifically, potential access to additional research resources and benefits to its reputation. The Board concluded that the benefits derived by PGIM Investments and QMA were consistent with the types of benefits generally derived by investment managers and subadvisers to mutual funds.
Performance of the Fund / Fees and Expenses
The Board considered certain additional specific factors and made related conclusions relating to the historical performance of the Fund for the one-, three-, five- and ten-year periods ended December 31, 2016.
The Board also considered the Fund’s actual management fee, as well as the Fund’s net total expense ratio, for the fiscal year ended October 31, 2016. The Board considered the management fee for the Fund as compared to the management fee charged by PGIM Investments to other funds and the fee charged by other advisers to comparable mutual funds in a Peer Group. The actual management fee represents the fee rate actually paid by Fund shareholders and includes any fee waivers or reimbursements. The net total expense ratio for the Fund represents the actual expense ratio incurred by Fund shareholders.
The mutual funds included in the Peer Universe (the Lipper International Multi-Cap Core Funds Performance Universe), which was used to consider performance, and the Peer Group, which was used to consider expenses and fees, were objectively determined by Broadridge, an independent provider of mutual fund data. The comparisons placed the Fund in various quartiles, with the first quartile being the best 25% of the mutual funds (for performance, the best performing mutual funds and, for expenses, the lowest cost mutual funds).
The section below summarizes key factors considered by the Board and the Board’s conclusions regarding the Fund’s performance, fees and overall expenses. The table sets forth gross performance comparisons (which do not reflect the impact on performance of fund expenses, or any subsidies, expense caps or waivers that may be applicable) with the Peer Universe, actual management fees with the Peer Group (which reflect the impact of
| Visit our website at pgiminvestments.com |
any subsidies or fee waivers), and net total expenses with the Peer Group, each of which were key factors considered by the Board.
| Performance | 1 Year | 3 Years | 5 Years | 10 Years | ||||
2nd Quartile | 3rd Quartile | 3rd Quartile | 4th Quartile | |||||
| Actual Management Fees: 4th Quartile | ||||||||
| Net Total Expenses: 4th Quartile | ||||||||
| • | The Board noted that the Fund outperformed its benchmark index over the three- and five-year periods, although it slightly underperformed over the one- and ten-year periods. |
| • | The Board noted information provided by PGIM Investments which indicated that the Fund’s recent performance against its benchmark index had improved, with the Fund outperforming the benchmark index for the first quarter of 2017. |
| • | The Board and PGIM Investments agreed to cap the annual operating expenses of the Fund’s Class Q shares at 0.78% (exclusive of certain other fees and expenses), through February 28, 2019. |
| • | The Board and PGIM Investments also agreed to permanently reduce the Fund’s management fee schedule. The current management fee schedule is 0.85% of average daily net assets to $300 million, 0.75% of average daily net assets from $300 million to $1.5 billion, and 0.70% of average daily net assets over $1.5 billion. The new management fee schedule is 0.75% of average daily net assets to $2 billion, 0.70% of average daily net assets from $2 billion to $5 billion, and 0.69% of average daily net assets over $5 billion. |
| • | The Board considered information provided by PGIM Investments indicating that, if the reduced management fee were in effect for the full fiscal year, the Fund’s actual management fee would rank in the second quartile of its Peer Group. |
| • | The Board and PGIM Investments also agreed to contractually reduce the Fund’s subadvisory fee schedule. The current subadvisory fee is 0.425% of average daily net assets to $300 million; 0.375% of average daily net assets over $300 million to $1.5 billion; and 0.35% over $1.5 billion. The new subadvisory fee will be 0.375% of average daily net assets up to $2 billion; 0.35% over $2 billion to $5 billion; and 0.345% over $5 billion. |
| • | The Board concluded that, in light of the above, it would be in the best interests of the Fund and its shareholders to renew the agreements with the permanent management fee reduction. |
| • | The Board concluded that the management fees (including subadvisory fees) and total expenses were reasonable in light of the services provided. |
* * *
After full consideration of these factors, the Board concluded that approval of the agreements was in the best interests of the Fund and its shareholders.
| Prudential QMA International Equity Fund | ||
| ∎ TELEPHONE | ∎ WEBSITE | |||
655 Broad Street Newark, NJ 07102 | (800) 225-1852 | www.pgiminvestments.com |
| PROXY VOTING |
| The Board of Directors of the Fund has delegated to the Fund’s investment subadviser the responsibility for voting any proxies and maintaining proxy recordkeeping with respect to the Fund. A description of these proxy voting policies and procedures is available without charge, upon request, by calling (800) 225-1852. Information regarding how the Fund voted proxies relating to portfolio securities during the most recent 12-month period ended June 30 is available on the Fund’s website and on the Securities and Exchange Commission’s website. |
| DIRECTORS |
| Ellen S. Alberding • Kevin J. Bannon • Scott E. Benjamin • Linda W. Bynoe • Barry H. Evans • Keith F. Hartstein • Laurie Simon Hodrick • Michael S. Hyland • Stuart S. Parker • Richard A. Redeker • Stephen G. Stoneburn • Grace C. Torres |
| OFFICERS |
| Stuart S. Parker, President • Scott E. Benjamin, Vice President • M. Sadiq Peshimam, Treasurer and Principal Financial and Accounting Officer • Raymond A. O’Hara, Chief Legal Officer • Deborah A. Docs, Secretary • Chad A. Earnst, Chief Compliance Officer • Charles H. Smith, Anti-Money Laundering Compliance Officer • Jonathan D. Shain, Assistant Secretary • Claudia DiGiacomo, Assistant Secretary • Andrew R. French, Assistant Secretary • Peter Parrella, Assistant Treasurer • Lana Lomuti, Assistant Treasurer • Linda McMullin, Assistant Treasurer • Kelly A. Coyne, Assistant Treasurer |
| MANAGER | PGIM Investments LLC | 655 Broad Street Newark, NJ 07102 | ||
| ||||
| INVESTMENT SUBADVISER | Quantitative Management Associates LLC | Gateway Center Two 100 Mulberry Street Newark, NJ 07102 | ||
| ||||
| DISTRIBUTOR | Prudential Investment Management Services LLC | 655 Broad Street Newark, NJ 07102 | ||
| ||||
| CUSTODIAN | The Bank of New York Mellon | 225 Liberty Street New York, NY 10286 | ||
| ||||
| TRANSFER AGENT | Prudential Mutual Fund Services LLC | PO Box 9658 Providence, RI 02940 | ||
| ||||
| INDEPENDENT REGISTERED PUBLIC ACCOUNTING FIRM | KPMG LLP | 345 Park Avenue New York, NY 10154 | ||
| ||||
| FUND COUNSEL | Willkie Farr & Gallagher LLP | 787 Seventh Avenue New York, NY 10019 | ||
| ||||
| An investor should consider the investment objectives, risks, charges, and expenses of the Fund carefully before investing. The prospectus and summary prospectus contain this and other information about the Fund. An investor may obtain a prospectus and summary prospectus by visiting our website at www.pgiminvestments.com or by calling (800) 225-1852. The prospectus and summary prospectus should be read carefully before investing. |
| E-DELIVERY |
| To receive your mutual fund documents online, go to www.pgiminvestments.com/edelivery and enroll. Instead of receiving printed documents by mail, you will receive notification via email when new materials are available. You can cancel your enrollment or change your email address at any time by visiting the website address above. |
| SHAREHOLDER COMMUNICATIONS WITH DIRECTORS |
| Shareholders can communicate directly with the Board of Directors by writing to the Chair of the Board, Prudential QMA International Equity Fund, PGIM Investments, Attn: Board of Directors, 655 Broad Street, Newark, NJ 07102. Shareholders can communicate directly with an individual Director by writing to the same address. Communications are not screened before being delivered to the addressee. |
| AVAILABILITY OF PORTFOLIO SCHEDULE |
| The Fund files its complete schedule of portfolio holdings with the Securities and Exchange Commission for the first and third quarters of each fiscal year on Form N-Q. The Fund’s Forms N-Q are available on the Commission’s website at www.sec.gov. The Fund’s Forms N-Q may also be reviewed and copied at the Commission’s Public Reference Room in Washington, D.C. Information on the operation and location of the Public Reference Room may be obtained by calling 1-800-SEC-0330. The Fund’s schedule of portfolio holdings is also available on the Fund’s website as of the end of each month no sooner than 15 days after the end of the month. |
| The Fund’s Statement of Additional Information contains additional information about the Fund’s Directors and is available without charge, upon request, by calling (800) 225-1852. |
Mutual Funds:
| ARE NOT INSURED BY THE FDIC OR ANY FEDERAL GOVERNMENT AGENCY | MAY LOSE VALUE | ARE NOT A DEPOSIT OF OR GUARANTEED BY ANY BANK OR ANY BANK AFFILIATE |
PRUDENTIAL QMA INTERNATIONAL EQUITY FUND
| SHARE CLASS | A | B | C | Q | Z | |||||
| NASDAQ | PJRAX | PJRBX | PJRCX | PJRQX | PJIZX | |||||
| CUSIP | 743969859 | 743969867 | 743969875 | 743969578 | 743969883 |
MF190E

PRUDENTIAL EMERGING MARKETS DEBT
LOCAL CURRENCY FUND
ANNUAL REPORT
OCTOBER 31, 2017

To enroll in e-delivery, go to pgiminvestments.com/edelivery
| Objective: Total return, through a combination of current income and capital appreciation |
Highlights
| • | During the reporting period, the Fund benefited from its currency exposure, duration positioning, and yield curve positioning/security selection. |
| • | Foreign currency selection was the largest positive contributor to the Fund’s relative performance, as a more optimistic outlook for the emerging markets in general, combined with a global reach for yield, led to significant outperformance in certain currencies. |
| • | The Fund’s long duration positions in Turkey and Mexico detracted from Fund performance. |
This report is not authorized for distribution to prospective investors unless preceded or accompanied by a current prospectus.
The views expressed in this report and information about the Fund’s portfolio holdings are for the period covered by this report and are subject to change thereafter.
Mutual funds are distributed by Prudential Investment Management Services LLC (PIMS), member SIPC. PGIM Fixed Income is a unit of PGIM, Inc. (PGIM), a registered investment adviser. PIMS and PGIM are Prudential Financial companies. © 2017 Prudential Financial, Inc. and its related entities. PGIM and the PGIM logo are service marks of Prudential Financial, Inc. and its related entities, registered in many jurisdictions worldwide.
| 2 | Visit our website at pgiminvestments.com |
PRUDENTIAL FUNDS — UPDATE
The Board of Directors/Trustees for the Fund has approved renaming the Fund’s Class Q shares as Class R6 shares, effective on or about June 15, 2018. The renaming of Class Q shares as Class R6 shares will not result in any changes to pricing, eligibility, or shareholder rights and obligations. The renamed Class R6 shares will not be exchangeable with Class R6 shares of the Prudential Day One Funds or the Prudential 60/40 Allocation Fund.
LR993
| Prudential Emerging Markets Debt Local Currency Fund | 3 |
PRUDENTIAL FUNDS — UPDATE
Effective on or about June 1, 2018 (the “Effective Date”), the Fund’s Class A, Class C, Class R, and Class Z shares, as applicable, will be closed to investments by new group retirement plans, except as discussed below. Existing group retirement plans as of the Effective Date may keep their investments in their current share class and may continue to make additional purchases or exchanges of that class of shares. As of the Effective Date, all new group retirement plans wishing to add the Fund as a new addition to the plan generally will be into one of the available Class Q shares, Class R2 shares, or Class R4 shares of the Fund.
In addition, on or about the Effective Date, the Class R shares of the Fund will be closed to all new investors, except as discussed below. Due to the closing of the Class R shares to new investors, effective on or about the Effective Date new IRA investors may only purchase Class A, Class C, Class Z, or Class Q shares of the Fund, subject to share class eligibility. Following the Effective Date, no new accounts may be established in the Fund’s Class R shares and no Class R shares may be purchased or acquired by any new Class R shareholder, except as discussed below.
| Class A | Class C | Class Z | Class R | |||||
Existing Investors (Group Retirement Plans, IRAs, and all other investors) | No Change | No Change | No Change | No Change | ||||
| New Group Retirement Plans | Closed to group retirement plans wishing to add the share classes as new additions to plan menus on or about June 1, 2018, subject to certain exceptions below | |||||||
New IRAs | No Change | No Change | No Change | Closed to all new investors on or about June 1, 2018, subject to certain exceptions below | ||||
| All Other New Investors | No Change | No Change | No Change | |||||
| 4 | Visit our website at pgiminvestments.com |
However, the following new investors may continue to purchase Class A, Class C, Class R, and Class Z shares of the Fund, as applicable:
| • | Eligible group retirement plans who are exercising their one-time 90-day repurchase privilege in the Fund will be permitted to purchase such share classes. |
| • | Plan participants in a group retirement plan that offers Class A, Class C, Class R, or Class Z shares of the Fund as of the Effective Date will be permitted to purchase such share classes of the Fund, even if the plan participant did not own shares of that class of the Fund as of the Effective Date. |
| • | Certain new group retirement plans will be permitted to offer such share classes of the Fund after the Effective Date, provided that the plan has or is actively negotiating a contractual agreement with the Fund’s distributor or service provider to offer such share classes of the Fund prior to or on the Effective Date. |
| • | New group retirement plans that combine with, replace, or are otherwise affiliated with a current plan that invests in such share classes prior to or on the Effective Date will be permitted to purchase such share classes. |
The Fund also reserves the right to refuse any purchase order that might disrupt management of the Fund or to otherwise modify the closure policy at any time on a case-by-case basis.
| Prudential Emerging Markets Debt Local Currency Fund | 5 |
This Page Intentionally Left Blank
| 6 | Visit our website at pgiminvestments.com |
Letter from the President

Dear Shareholder:
We hope you find the annual report for the Prudential Emerging Markets Debt Local Currency Fund informative and useful. The report covers performance for the 12-month period ended October 31, 2017.
Significant events during the reporting period included a new US president, followed by uncertainty in Congress over implementing the Trump administration’s policy initiatives. Elsewhere, Britain began its formal legal process to leave the European Union. France elected a more centrist president, which was viewed as a pro-euro referendum. North Korea’s missile launches escalated geopolitical tensions. Also, late in the period, a series of hurricanes caused damage in the US and the Caribbean.
Despite some turbulence in the macro-environment, solid economic fundamentals in the US economy included moderate gross domestic product expansion, robust employment, and accelerating corporate profit growth. Inflation remained tame. The Federal Reserve raised its federal funds rate twice in 2017, and is in the process of winding down its stimulus program.
Global economic growth remained mostly positive. Equities in the US reached new highs amid low volatility, while international equities posted strong gains. European stocks continued to gain. Asian markets were solid, and emerging markets outperformed most regions. Fixed income markets were mixed. High yield and emerging markets bonds were the top performers.
Given the uncertainty in today’s investment environment, we believe that active professional portfolio management offers a potential advantage. Active managers often have the knowledge and flexibility to find the best investment opportunities in the most challenging markets.
Even so, it’s best if investment decisions are based on your long-term goals rather than on short-term market and economic developments. We also encourage you to work with an experienced financial advisor who can help you set goals, determine your tolerance for risk, and build a diversified plan that’s right for you and make adjustments when necessary.
At PGIM Investments, we consider it a great privilege and responsibility to help investors participate in opportunities across global markets while meeting their toughest investment challenges. We’re part of PGIM, a top-10 global investment manager with more than $1 trillion in assets under management. This investment expertise allows us to deliver actively managed funds and strategies to meet the needs of investors around the globe.
Thank you for choosing our family of funds.
Sincerely,

Stuart S. Parker, President
Prudential Emerging Markets Debt Local Currency Fund
December 15, 2017
| Prudential Emerging Markets Debt Local Currency Fund | 7 |
Your Fund’s Performance (unaudited)
Performance data quoted represents past performance. Past performance does not guarantee future results. The investment return and principal value of an investment will fluctuate, so that an investor’s shares, when redeemed, may be worth more or less than their original cost. Current performance may be lower or higher than the past performance data quoted. An investor may obtain performance data as of the most recent month-end by visiting our website at www.pgiminvestments.com or by calling (800) 225-1852.
| Average Annual Total Returns as of 10/31/17 (with sales charges) | ||||||||||
| One Year (%) | Five Years (%) | Since Inception (%) | ||||||||
| Class A | 0.61 | –2.80 | –1.39 (3/30/11) | |||||||
| Class C | 3.66 | –2.57 | –1.28 (3/30/11) | |||||||
| Class Q | 5.82 | –1.52 | –0.30 (3/30/11) | |||||||
| Class Z | 5.85 | –1.56 | –0.34 (3/30/11) | |||||||
| JP Morgan Government Bond Index-Emerging Markets Global Diversified Index | 5.18 | –1.58 | –0.09 | |||||||
| Lipper Emerging Markets Local Currency Debt Funds Average | 5.12 | –1.87 | –0.32 | |||||||
| Average Annual Total Returns as of 10/31/17 (without sales charges) | ||||||||||
| One Year (%) | Five Years (%) | Since Inception (%) | ||||||||
| Class A | 5.36 | –1.90 | –0.70 (3/30/11) | |||||||
| Class C | 4.66 | –2.57 | –1.28 (3/30/11) | |||||||
| Class Q | 5.82 | –1.52 | –0.30 (3/30/11) | |||||||
| Class Z | 5.85 | –1.56 | –0.34 (3/30/11) | |||||||
| JP Morgan Government Bond Index-Emerging Markets Global Diversified Index | 5.18 | –1.58 | –0.09 | |||||||
| Lipper Emerging Markets Local Currency Debt Funds Average | 5.12 | –1.87 | –0.32 | |||||||
| 8 | Visit our website at pgiminvestments.com |
Growth of a $10,000 Investment
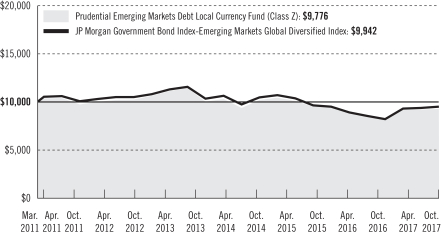
The graph compares a $10,000 investment in the Prudential Emerging Markets Debt Local Currency Fund (Class Z shares) with a similar investment in the JP Morgan Government Bond Index-Emerging Markets Global Diversified Index by portraying the initial account values at the commencement of operations for Class Z shares (March 30, 2011) and the account values at the end of the current fiscal year (October 31, 2017), as measured on a quarterly basis. For purposes of the graph, and unless otherwise indicated, it has been assumed that (a) all recurring fees (including management fees) were deducted; and (b) all dividends and distributions were reinvested. The line graph provides information for Class Z shares only. As indicated in the tables provided earlier, performance for Class A, Class C, and Class Q shares will vary due to the differing charges and expenses applicable to each share class (as indicated in the following paragraphs). Without waiver of fees and/or expense reimbursements, if any, the Fund’s returns would have been lower.
Past performance does not predict future performance. Total returns and the ending account values in the graph include changes in share price and reinvestment of dividends and capital gains distributions in a hypothetical investment for the periods shown. The Fund’s total returns do not reflect the deduction of income taxes on an individual’s investment. Taxes may reduce your actual investment returns on income or gains paid by the Fund or any gains you may realize if you sell your shares.
Source: PGIM Investments LLC, Lipper, and JP Morgan
Since Inception returns are provided since the Fund has less than 10 fiscal years of returns. Since Inception returns for the Index and the Lipper Average are measured from the closest month-end to the Fund’s inception date.
| Prudential Emerging Markets Debt Local Currency Fund | 9 |
Your Fund’s Performance (continued)
The returns in the tables do not reflect the deduction of taxes that a shareholder would pay on Fund distributions or following the redemption of Fund shares. The average annual total returns take into account applicable sales charges, which are described for each share class in the table below.
| Class A* | Class C* | Class Q | Class Z* | |||||
| Maximum initial sales charge | 4.50% of the public offering price | None | None | None | ||||
| Contingent deferred sales charge (CDSC) (as a percentage of the lower of original purchase price or net asset value at redemption) | 1.00% on sales of $1 million or more made within 12 months of purchase | 1.00% on sales made within 12 months of purchase | None | None | ||||
| Annual distribution and service (12b-1) fees (shown as a percentage of average daily net assets) | 0.25% | 1.00% | None | None |
*Certain share classes will be generally closed to investments by new group retirement plans effective on or about June 1, 2018. Please see the “PRUDENTIAL FUNDS—UPDATE” on page 4 of this report for more information.
Benchmark Definitions
JP Morgan Government Bond Index-Emerging Markets Global Diversified Index—The JP Morgan Government Bond Index-Emerging Markets Global Diversified Index, an unmanaged index, is a comprehensive emerging markets debt benchmark that tracks local currency bonds issued by emerging market governments.
Lipper Emerging Markets Local Currency Debt Funds Average—The Lipper Emerging Markets Local Currency Debt Funds Average (Lipper Average) is based on the average return of all funds in the Lipper Emerging Markets Local Currency Debt Funds universe for the periods noted. Funds in the Lipper Average seek either current income or total return by investing at least 65% of total assets in debt issues denominated in the currency of their market of issuance. “Emerging markets” are defined by a country’s GNP per capita or other economic measures.
Investors cannot invest directly in an index or average. The returns for the Index would be lower if they included the effects of sales charges, operating expenses of a mutual fund, or taxes. Returns for the Lipper Average reflect the deduction of operating expenses, but not sales charges or taxes.
| 10 | Visit our website at pgiminvestments.com |
| Distributions and Yields as of 10/31/17 | ||||||
| Total Distributions Paid for 12 Months ($) | SEC 30-Day Subsidized Yield* (%) | SEC 30-Day Unsubsidized Yield** (%) | ||||
| Class A | 0.37 | 5.64 | 5.63 | |||
| Class C | 0.32 | 5.07 | 5.07 | |||
| Class Q | 0.40 | 6.19 | 6.32 | |||
| Class Z | 0.39 | 6.08 | 6.08 | |||
*SEC 30-Day Subsidized Yield (%)—A standardized yield calculation created by the Securities and Exchange Commission, it reflects the income earned during a 30-day period, after the deduction of the Fund’s net expenses (net of any expense waivers or reimbursements).
**SEC 30-Day Unsubsidized Yield (%)—A standardized yield calculation created by the Securities and Exchange Commission, it reflects the income earned during a 30-day period, after the deduction of the Fund’s gross expenses.
| Credit Quality expressed as a percentage of total investments as of 10/31/17 (%) | ||||
| AAA | 1.2 | |||
| AA | 2.7 | |||
| A | 26.9 | |||
| BBB | 40.9 | |||
| BB | 15.6 | |||
| B | 10.0 | |||
| Not Rated | 0.1 | |||
| Cash/Cash Equivalents | 2.5 | |||
| Total Investments | 100.0 | |||
Source: PGIM Fixed Income
Credit ratings reflect the highest rating assigned by a nationally recognized statistical rating organization (NRSRO) such as Moody’s Investor Service, Inc. (Moody’s), S&P Global Ratings (S&P), or Fitch, Inc. (Fitch). Credit ratings reflect the common nomenclature used by both S&P and Fitch. Where applicable, ratings are converted to the comparable S&P/Fitch rating tier nomenclature. These rating agencies are independent and are widely used. The Not Rated category consists of securities that have not been rated by a NRSRO. Credit ratings are subject to change. Values may not sum to 100.0% due to rounding.
| Prudential Emerging Markets Debt Local Currency Fund | 11 |
Strategy and Performance Overview
How did the Fund perform?
The Prudential Emerging Markets Debt Local Currency Fund’s Class Z shares returned 5.85% for the 12-month period ended October 31, 2017, outperforming the 5.18% return of the JP Morgan GBI-EM Global Diversified Index (the Index) and the 5.12% return of the Lipper Emerging Markets Local Currency Debt Funds Average.
What were market conditions?
| • | 2016 was a year of recovery for emerging markets debt. Brazil seated a new president and the country’s assets posted double-digit gains, China re-initiated fiscal stimulus, commodities and emerging markets currencies rebounded, and emerging markets’ fundamentals generally strengthened. As the year concluded, a host of uncertainties emerged, including the possibility of a more protectionist US administration, higher US Treasury yields, and expectations for Federal Reserve (Fed) interest rate hikes in 2017. This backdrop brightened prospects for faster global growth, which, when combined with solid fundamentals and attractive valuations, suggested emerging markets debt could generate healthy returns in the new year. |
| • | During the first quarter of 2017, hedged local bonds lagged other emerging markets sectors due to moves in US Treasury yields, but remained attractive from an overall yield perspective. Brazil was amongst the top performers, as the central bank continued to cut interest rates and seemed likely to continue at an accelerated pace. Other top-performing local interest rate markets were Peru, Indonesia, and the Philippines. Turkey was the weakest performer during the quarter, with a return of only +0.46%. A number of central banks cut interest rates, including Brazil, Chile, Colombia, and Russia. In countries where the central bank’s policy rate was rising, investors generally found adequate premiums over the policy rate. In Mexico, the central bank raised rates and its local bond prices improved as the country’s local bond yield curve flattened. (Yield curves are single line graphs that illustrate the relationship between the yields and maturities of fixed income securities. They are created by plotting the yields of different maturities for the same type of bonds.) |
| • | Emerging markets debt continued its post-US election rebound during the second quarter, as an improving global growth outlook, diminished protectionism fears, and low interest rates in the developed markets supported strong demand for higher-yielding assets. The Index returned 1.22% on the quarter. In terms of currencies, outperformers were led by emerging European currencies, including the Czech koruna, Turkish lira, and Polish zloty, partly because of their higher correlation with the euro, which was approximately 5% stronger against the US dollar during the quarter. The Mexican peso also outperformed, continuing its rebound from a difficult 2016 on diminishing concerns about trade tensions with the US. Hedged local bond returns were more subdued, with Hungary and Peru outpacing higher-yielding countries, such as Brazil and Turkey. |
| 12 | Visit our website at pgiminvestments.com |
| • | Although tensions with North Korea escalated sharply in the third quarter, inflows into emerging markets debt, especially Asia, remained buoyant and allowed some decoupling of emerging markets’ monetary policy from that of advanced economies. In Asian emerging markets, this development was most evident in India and Indonesia, where central banks were able to ease rates as the Fed tightened. That said, monetary policy remained accommodative elsewhere in Asia. Another prevailing theme during the quarter was the strong performance of euro-related Central and Eastern European currencies, as the euro outpaced the US dollar. Local bonds posting the strongest returns were in markets where central banks were cutting rates—Brazil, Peru, Indonesia, and Hungary. At the end of the quarter, it appeared monetary policy conditions could support the performance of certain local bond markets, especially where policymakers are likely to cut rates over the next year or sooner, such as in Mexico, or where tight monetary policy presents very high nominal yield, such as in Turkey. |
| • | Local emerging markets bonds struggled in October, with a stronger US dollar and unsettled G4 bond markets (those in Brazil, Germany, India, and Japan). This served to undermine weaker emerging markets credits and those countries where policy rate hikes were considered imminent. The underperforming markets were fiscal-and-politically-challenged South Africa and Turkey, plus a booming Czech Republic. The outperformers were the higher-yielding European markets of Poland and Russia, plus Hungary with its steep yield curve. |
What worked?
| • | During the reporting period, the Fund benefited from its currency exposure, duration positioning, and yield curve positioning/security selection. Duration is a measure of the interest rate sensitivity of a bond portfolio or debt securities that is expressed as a number of years. |
| • | Foreign currency selection was the largest positive contributor to the Fund’s relative performance, as a more optimistic outlook for the emerging markets in general, combined with a global reach for yield, led to significant outperformance in certain currencies. The Fund’s overweights in the Russian ruble, Mexican peso, Indian rupee, Hungarian forint, and Brazilian real added most to relative returns. |
| • | Yield curve positioning and security selection also added to results, highlighted by positioning in Argentina, Turkey, Mexico, and Ukraine. |
| • | Duration positioning further bolstered performance. More specifically, the Fund’s long duration positioning in Indonesia, Brazil, and Peru added value. Brazil, in the midst of a policy rate cutting cycle, outperformed on a mostly supportive US dollar and G3 (the US, Japan, and the EU) interest rate backdrop, alongside an improving external balance picture and controlled inflation. Indonesian interest rates fell due to a policy rate cut by the central bank, along with lower than expected inflation. |
| Prudential Emerging Markets Debt Local Currency Fund | 13 |
Strategy and Performance Overview (continued)
What didn’t work?
| • | The Fund’s long duration positions in Turkey and Mexico detracted from Fund performance. Turkish assets sold off during the third quarter of 2017, as markets weighed the possible implications of the Kurdish referendum in Iraq. Mexico’s local bond yield curve underperformed in the fourth quarter of 2016 on the back of weakness among US Treasuries, a weaker peso, and a 50 basis-point rate hike by the central bank. (A basis point is 1/100th of a percent.) |
| • | The Fund’s underweights in the Chilean peso, Taiwanese dollar, and Malaysian ringgit also had a negative impact on performance during the period. |
| • | Security selection in Brazil and yield curve positioning in Poland also limited the Fund’s results. |
Did the Fund use derivatives and how did they affect performance?
| • | Currency positioning in the Fund was partially facilitated by the use of currency forward and option contracts. The Fund’s currency positioning contributed positively to relative performance during the period. |
| • | The Fund also used interest rate swaps to help manage duration and yield curve exposure, which added to performance. |
Outlook
| • | PGIM Fixed Income’s outlook on emerging market debt is positive. The relatively healthy fundamental backdrop in emerging countries—supported by rebounding economic growth, investment inflows, and attractive valuations—will likely help the asset class end 2017 with strong returns. Sell-offs could also be buying opportunities in lower-rated, hard currency assets, emerging markets currencies, and local bonds. |
| • | While acknowledging that local bonds have performed well year-to-date, PGIM Fixed Income continues to find opportunities to position the Fund with a long duration bias in select countries and on local bond yield curves. |
| • | PGIM Fixed Income believes the Mexico local bond yield curve embeds too much premium for the country’s improved internal and external balance profile and inflation outlook. Meanwhile, Brazilian interest rates remain high, and a supportive currency suggests a flatter curve. In PGIM Fixed Income’s view, the Indonesian local bond yield curve has attractive properties, while Turkey, as a large energy importer, is likely to benefit from improved headline inflation. |
| • | As the reporting period ended, 14.8% of the Fund’s assets were held in shorter-duration, high-yielding hard-currency bonds, including select emerging markets sovereign bonds, quasi-sovereign debt, and corporate bonds with yields that have recently widened versus many other local bond yields. |
| 14 | Visit our website at pgiminvestments.com |
| • | In terms of its EM local bond positioning, the Fund maintains overweight duration positions in Brazil, Indonesia, Malaysia, and Mexico and is underweight Chile, Czech Republic, Hungary, and Romania. |
| • | Regarding its EM currency positioning, the Fund holds long positions in the Brazil real, Indian rupee, Indonesian rupiah, Mexican peso, and select Central Eastern European currencies alongside shorts in the Israel shekel, Singapore dollar, and Taiwanese dollar. |
| Prudential Emerging Markets Debt Local Currency Fund | 15 |
Fees and Expenses (unaudited)
As a shareholder of the Fund, you incur two types of costs: (1) transaction costs, including sales charges (loads) on purchase payments and redemptions, as applicable, and (2) ongoing costs, including management fees, distribution, and/or service (12b-1) fees, and other Fund expenses, as applicable. This example is intended to help you understand your ongoing costs (in dollars) of investing in the Fund and to compare these costs with the ongoing costs of investing in other mutual funds.
The example is based on an investment of $1,000 held through the six-month period ended October 31, 2017. The example is for illustrative purposes only; you should consult the Prospectus for information on initial and subsequent minimum investment requirements.
Actual Expenses
The first line for each share class in the table on the following page provides information about actual account values and actual expenses. You may use the information on this line, together with the amount you invested, to estimate the expenses that you paid over the period. Simply divide your account value by $1,000 (for example, an $8,600 account value ÷ $1,000 = 8.6), then multiply the result by the number on the first line under the heading “Expenses Paid During the Six-Month Period” to estimate the expenses you paid on your account during this period.
Hypothetical Example for Comparison Purposes
The second line for each share class in the table on the following page provides information about hypothetical account values and hypothetical expenses based on the Fund’s actual expense ratio and an assumed rate of return of 5% per year before expenses, which is not the Fund’s actual return. The hypothetical account values and expenses may not be used to estimate the actual ending account balance or expenses you paid for the period. You may use this information to compare the ongoing costs of investing in the Fund and other funds. To do so, compare this 5% hypothetical example with the 5% hypothetical examples that appear in the shareholder reports of the other funds.
The Fund’s transfer agent may charge additional fees to holders of certain accounts that are not included in the expenses shown in the table on the following page. These fees apply to individual retirement accounts (IRAs) and Section 403(b) accounts. As of the close of the six-month period covered by the table, IRA fees included an annual maintenance fee of $15 per account (subject to a maximum annual maintenance fee of $25 for all accounts held by the same shareholder). Section 403(b) accounts are charged an annual $25 fiduciary maintenance fee. Some of the fees may vary in amount, or may be waived, based on your total account balance or the number of Prudential funds, including the Fund, that you own. You should consider the additional fees that were charged to your Fund account over the six-month period when you estimate the total ongoing expenses paid over the
| 16 | Visit our website at pgiminvestments.com |
period and the impact of these fees on your ending account value, as these additional expenses are not reflected in the information provided in the expense table. Additional fees have the effect of reducing investment returns.
Please note that the expenses shown in the table are meant to highlight your ongoing costs only and do not reflect any transactional costs such as sales charges (loads). Therefore, the second line for each share class in the table is useful in comparing ongoing costs only and will not help you determine the relative total costs of owning different funds. In addition, if these transactional costs were included, your costs would have been higher.
| Prudential Emerging Markets Debt Local Currency Fund | Beginning Account Value May 1, 2017 | Ending Account October 31, 2017 | Annualized Expense Ratio Based on the Six-Month Period | Expenses Paid During the Six-Month Period* | ||||||||||||||
| Class A | Actual | $ | 1,000.00 | $ | 1,026.70 | 1.13 | % | $ | 5.77 | |||||||||
| Hypothetical | $ | 1,000.00 | $ | 1,019.51 | 1.13 | % | $ | 5.75 | ||||||||||
| Class C | Actual | $ | 1,000.00 | $ | 1,022.50 | 1.88 | % | $ | 9.58 | |||||||||
| Hypothetical | $ | 1,000.00 | $ | 1,015.73 | 1.88 | % | $ | 9.55 | ||||||||||
| Class Q | Actual | $ | 1,000.00 | $ | 1,026.80 | 0.88 | % | $ | 4.50 | |||||||||
| Hypothetical | $ | 1,000.00 | $ | 1,020.77 | 0.88 | % | $ | 4.48 | ||||||||||
| Class Z | Actual | $ | 1,000.00 | $ | 1,027.60 | 0.88 | % | $ | 4.50 | |||||||||
| Hypothetical | $ | 1,000.00 | $ | 1,020.77 | 0.88 | % | $ | 4.48 | ||||||||||
*Fund expenses (net of fee waivers or subsidies, if any) for each share class are equal to the annualized expense ratio for each share class (provided in the table), multiplied by the average account value over the period, multiplied by the 184 days in the six-month period ended October 31, 2017, and divided by the 365 days in the Fund’s fiscal year ended October 31, 2017 (to reflect the six-month period). Expenses presented in the table include the expenses of any underlying funds in which the Fund may invest.
| Prudential Emerging Markets Debt Local Currency Fund | 17 |
Schedule of Investments
as of October 31, 2017
| Description | Interest Rate | Maturity Date | Principal Amount (000)# | Value | ||||||||||||
LONG-TERM INVESTMENTS 95.1% |
| |||||||||||||||
FOREIGN BONDS |
| |||||||||||||||
Argentina 3.2% |
| |||||||||||||||
Argentine Bonos del Tesoro, Bonds | 22.750 | % | 03/05/18 | ARS | 11,368 | $ | 637,090 | |||||||||
Provincia de Buenos Aires, Sr. Unsec’d. Notes | 9.950 | 06/09/21 | 300 | 348,795 | ||||||||||||
|
| |||||||||||||||
| 985,885 | ||||||||||||||||
Brazil 13.0% |
| |||||||||||||||
Brazil Loan Trust I, Gov’t. Gtd. Notes | 5.477 | 07/24/23 | 115 | 119,982 | ||||||||||||
Brazil Notas do Tesouro Nacionalie, | ||||||||||||||||
Notes, Ser. NTNF | 10.000 | 01/01/21 | BRL | 2,309 | 724,198 | |||||||||||
Notes, Ser. NTNF | 10.000 | 01/01/23 | BRL | 4,265 | 1,325,321 | |||||||||||
Notes, Ser. NTNF | 10.000 | 01/01/25 | BRL | 1,541 | 476,075 | |||||||||||
Notes, Ser. NTNF | 10.000 | 01/01/27 | BRL | 3,140 | 967,792 | |||||||||||
Brazilian Government International Bond, Sr. Unsec’d. Notes | 8.500 | 01/05/24 | BRL | 54 | 16,753 | |||||||||||
Petrobras Global Finance BV, | ||||||||||||||||
Gtd. Notes | 6.250 | 03/17/24 | 330 | 353,875 | ||||||||||||
Gtd. Notes, 144A | 5.299 | 01/27/25 | 20 | 20,065 | ||||||||||||
|
| |||||||||||||||
| 4,004,061 | ||||||||||||||||
Colombia 4.8% |
| |||||||||||||||
Colombian TES, | ||||||||||||||||
Bonds, Ser. B | 6.000 | 04/28/28 | COP | 4,339,800 | 1,349,795 | |||||||||||
Bonds, Ser. B | 10.000 | 07/24/24 | COP | 300,700 | 118,287 | |||||||||||
|
| |||||||||||||||
| 1,468,082 | ||||||||||||||||
Czech Republic 1.7% |
| |||||||||||||||
Czech Republic Government Bond, | ||||||||||||||||
Bonds, Ser. 78 | 2.500 | 08/25/28 | CZK | 3,830 | 188,000 | |||||||||||
Bonds, Ser. 95 | 1.000 | 06/26/26 | CZK | 6,270 | 274,810 | |||||||||||
Bonds, Ser. 97 | 0.450 | 10/25/23 | CZK | 1,360 | 59,977 | |||||||||||
|
| |||||||||||||||
| 522,787 | ||||||||||||||||
Ecuador 0.7% |
| |||||||||||||||
Ecuador Government International Bond, Sr. Unsec’d. Notes | 10.750 | 03/28/22 | 200 | 226,000 | ||||||||||||
Egypt 0.7% |
| |||||||||||||||
Egypt Government International Bond, Sr. Unsec’d. Notes, MTN | 6.125 | 01/31/22 | 215 | 224,186 | ||||||||||||
See Notes to Financial Statements.
| Prudential Emerging Markets Debt Local Currency Fund | 19 |
Schedule of Investments (continued)
as of October 31, 2017
| Description | Interest Rate | Maturity Date | Principal Amount (000)# | Value | ||||||||||||
FOREIGN BONDS (Continued) |
| |||||||||||||||
El Salvador 0.3% |
| |||||||||||||||
El Salvador Government International Bond, Sr. Unsec’d. Notes | 7.375 | % | 12/01/19 | 100 | $ | 103,750 | ||||||||||
Ghana 0.7% |
| |||||||||||||||
Ghana Government International Bond, Sr. Unsec’d. Notes | 9.250 | 09/15/22 | 200 | 225,760 | ||||||||||||
Greece 0.4% |
| |||||||||||||||
Hellenic Republic Government Bond, Sr. Unsec’d. Notes, 144A | 4.375 | 08/01/22 | EUR | 100 | 116,280 | |||||||||||
Hungary 1.3% |
| |||||||||||||||
Hungary Government Bond, | ||||||||||||||||
Bonds, Ser. 21/B | 2.500 | 10/27/21 | HUF | 21,600 | 85,899 | |||||||||||
Bonds, Ser. 23/A | 6.000 | 11/24/23 | HUF | 26,410 | 124,832 | |||||||||||
Bonds, Ser. 25/B | 5.500 | 06/24/25 | HUF | 22,900 | 105,899 | |||||||||||
Bonds, Ser. 31/A | 3.250 | 10/22/31 | HUF | 21,070 | 78,852 | |||||||||||
|
| |||||||||||||||
| 395,482 | ||||||||||||||||
Indonesia 11.1% |
| |||||||||||||||
Indonesia Treasury Bond, | ||||||||||||||||
Sr. Unsec’d. Notes, Ser. FR53 | 8.250 | 07/15/21 | IDR | 5,420,000 | 423,010 | |||||||||||
Sr. Unsec’d. Notes, Ser. FR56 | 8.375 | 09/15/26 | IDR | 750,000 | 60,691 | |||||||||||
Sr. Unsec’d. Notes, Ser. FR58 | 8.250 | 06/15/32 | IDR | 1,700,000 | 136,040 | |||||||||||
Sr. Unsec’d. Notes, Ser. FR59 | 7.000 | 05/15/27 | IDR | 3,600,000 | 269,818 | |||||||||||
Sr. Unsec’d. Notes, Ser. FR61 | 7.000 | 05/15/22 | IDR | 3,700,000 | 278,676 | |||||||||||
Sr. Unsec’d. Notes, Ser. FR63 | 5.625 | 05/15/23 | IDR | 3,100,000 | 217,345 | |||||||||||
Sr. Unsec’d. Notes, Ser. FR65 | 6.625 | 05/15/33 | IDR | 5,700,000 | 395,153 | |||||||||||
Sr. Unsec’d. Notes, Ser. FR67 | 8.750 | 02/15/44 | IDR | 600,000 | 51,060 | |||||||||||
Sr. Unsec’d. Notes, Ser. FR68 | 8.375 | 03/15/34 | IDR | 10,000,000 | 798,894 | |||||||||||
Sr. Unsec’d. Notes, Ser. FR70 | 8.375 | 03/15/24 | IDR | 4,410,000 | 352,194 | |||||||||||
Sr. Unsec’d. Notes, Ser. FR71 | 9.000 | 03/15/29 | IDR | 1,270,000 | 106,516 | |||||||||||
Sr. Unsec’d. Notes, Ser. FR72 | 8.250 | 05/15/36 | IDR | 2,750,000 | 218,986 | |||||||||||
Sr. Unsec’d. Notes, Ser. FR73 | 8.750 | 05/15/31 | IDR | 1,405,000 | 116,285 | |||||||||||
|
| |||||||||||||||
| 3,424,668 | ||||||||||||||||
Iraq 0.7% |
| |||||||||||||||
Iraq International Bond, Sr. Unsec’d. Notes, 144A | 6.752 | 03/09/23 | 200 | 200,385 | ||||||||||||
Kazakhstan 0.5% |
| |||||||||||||||
KazMunayGas National Co. JSC, Sr. Unsec’d. Notes | 7.000 | 05/05/20 | 130 | 141,787 | ||||||||||||
See Notes to Financial Statements.
| 20 |
| Description | Interest Rate | Maturity Date | Principal Amount (000)# | Value | ||||||||||||
FOREIGN BONDS (Continued) |
| |||||||||||||||
Lebanon 0.5% |
| |||||||||||||||
Lebanon Government International Bond, Sr. Unsec’d. Notes, MTN | 6.250 | % | 05/27/22 | 150 | $ | 148,836 | ||||||||||
Malaysia 4.6% |
| |||||||||||||||
Malaysia Government Bond, | ||||||||||||||||
Sr. Unsec’d. Notes, Ser. 0116 | 3.800 | 08/17/23 | MYR | 1,010 | 236,951 | |||||||||||
Sr. Unsec’d. Notes, Ser. 0216 | 4.736 | 03/15/46 | MYR | 500 | 113,659 | |||||||||||
Sr. Unsec’d. Notes, Ser. 0217 | 4.059 | 09/30/24 | MYR | 335 | 79,622 | |||||||||||
Sr. Unsec’d. Notes, Ser. 0311 | 4.392 | 04/15/26 | MYR | 660 | 159,111 | |||||||||||
Sr. Unsec’d. Notes, Ser. 0313 | 3.480 | 03/15/23 | MYR | 320 | 73,851 | |||||||||||
Sr. Unsec’d. Notes, Ser. 0316 | 3.900 | 11/30/26 | MYR | 1,930 | 449,045 | |||||||||||
Sr. Unsec’d. Notes, Ser. 0411 | 4.232 | 06/30/31 | MYR | 680 | 156,817 | |||||||||||
Sr. Unsec’d. Notes, Ser. 0515 | 3.759 | 03/15/19 | MYR | 600 | 142,742 | |||||||||||
|
| |||||||||||||||
| 1,411,798 | ||||||||||||||||
Mexico 11.2% |
| |||||||||||||||
America Movil SAB de CV, Sr. Unsec’d. Notes | 6.450 | 12/05/22 | MXN | 7,500 | 365,910 | |||||||||||
Mexican Bonos, | ||||||||||||||||
Bonds, Ser. M | 8.000 | 06/11/20 | MXN | 11,000 | 587,003 | |||||||||||
Bonds, Ser. M20 | 7.500 | 06/03/27 | MXN | 9,696 | 512,997 | |||||||||||
Bonds, Ser. M30 | 10.000 | 11/20/36 | MXN | 11,473 | 749,726 | |||||||||||
Sr. Unsec’d. Notes, Ser. M | 7.750 | 11/13/42 | MXN | 8,197 | 436,465 | |||||||||||
Sr. Unsec’d. Notes, Ser. M20 | 8.500 | 05/31/29 | MXN | 5,470 | 311,279 | |||||||||||
Petroleos Mexicanos, | ||||||||||||||||
Gtd. Notes, MTN | 6.875 | 08/04/26 | 125 | 140,438 | ||||||||||||
Gtd. Notes, 144A | 7.650 | 11/24/21 | MXN | 4,120 | 207,944 | |||||||||||
Gtd. Notes, 144A, MTN | 6.500 | 03/13/27 | 125 | 136,500 | ||||||||||||
|
| |||||||||||||||
| 3,448,262 | ||||||||||||||||
Mongolia 0.8% |
| |||||||||||||||
Mongolia Government International Bond, Sr. Unsec’d. Notes, MTN | 10.875 | 04/06/21 | 200 | 234,846 | ||||||||||||
Nigeria 0.6% |
| |||||||||||||||
Nigeria Government International Bond, Sr. Unsec’d. Notes | 5.625 | 06/27/22 | 195 | 199,631 | ||||||||||||
Peru 1.7% |
| |||||||||||||||
Peru Government Bond, | ||||||||||||||||
Bonds | 6.950 | 08/12/31 | PEN | 190 | 65,570 | |||||||||||
Sr. Unsec’d. Notes, 144A | 6.150 | 08/12/32 | PEN | 285 | 91,664 | |||||||||||
Peruvian Government International Bond, Sr. Unsec’d. Notes | 6.950 | 08/12/31 | PEN | 1,100 | 379,615 | |||||||||||
|
| |||||||||||||||
| 536,849 | ||||||||||||||||
See Notes to Financial Statements.
| Prudential Emerging Markets Debt Local Currency Fund | 21 |
Schedule of Investments (continued)
as of October 31, 2017
| Description | Interest Rate | Maturity Date | Principal Amount (000)# | Value | ||||||||||||
FOREIGN BONDS (Continued) |
| |||||||||||||||
Poland 4.8% |
| |||||||||||||||
Republic of Poland Government Bond, | ||||||||||||||||
Bonds, Ser. 0725 | 3.250 | % | 07/25/25 | PLN | 490 | $ | 134,550 | |||||||||
Bonds, Ser. 0726 | 2.500 | 07/25/26 | PLN | 1,645 | 422,283 | |||||||||||
Bonds, Ser. 0727 | 2.500 | 07/25/27 | PLN | 2,480 | 628,934 | |||||||||||
Bonds, Ser. 1023 | 4.000 | 10/25/23 | PLN | 999 | 290,290 | |||||||||||
|
| |||||||||||||||
| 1,476,057 | ||||||||||||||||
Romania 1.1% |
| |||||||||||||||
Romania Government Bond, Bonds, Ser. 5YR | 3.250 | 03/22/21 | RON | 1,315 | 336,463 | |||||||||||
Russia 6.5% |
| |||||||||||||||
Russian Federal Bond - OFZ, | ||||||||||||||||
Bonds, Ser. 6211 | 7.000 | 01/25/23 | RUB | 16,800 | 283,538 | |||||||||||
Bonds, Ser. 6218 | 8.500 | 09/17/31 | RUB | 34,655 | 641,485 | |||||||||||
Bonds, Ser. 6221 | 7.700 | 03/23/33 | RUB | 32,650 | 559,706 | |||||||||||
Sberbank of Russia Via SB Capital SA, Sr. Unsec’d. Notes | 6.125 | 02/07/22 | 205 | 224,200 | ||||||||||||
Vnesheconombank Via VEB Finance PLC, Sr. Unsec’d. Notes | 6.902 | 07/09/20 | 265 | 287,067 | ||||||||||||
|
| |||||||||||||||
| 1,995,996 | ||||||||||||||||
Singapore 1.2% |
| |||||||||||||||
Singapore Government Bond, | ||||||||||||||||
Sr. Unsec’d. Notes | 0.500 | 04/01/18 | SGD | 430 | 314,448 | |||||||||||
Sr. Unsec’d. Notes | 2.375 | 06/01/25 | SGD | 80 | 60,069 | |||||||||||
|
| |||||||||||||||
| 374,517 | ||||||||||||||||
South Africa 8.7% |
| |||||||||||||||
Eskom Holdings SOC Ltd., Sr. Unsec’d. Notes | 5.750 | 01/26/21 | 235 | 237,350 | ||||||||||||
Republic of South Africa Government Bond, | ||||||||||||||||
Bonds, Ser. 2040 | 9.000 | 01/31/40 | ZAR | 7,885 | 501,641 | |||||||||||
Bonds, Ser. 2044 | 8.750 | 01/31/44 | ZAR | 9,200 | 565,368 | |||||||||||
Bonds, Ser. 2048 | 8.750 | 02/28/48 | ZAR | 16,085 | 991,064 | |||||||||||
Bonds, Ser. R186 | 10.500 | 12/21/26 | ZAR | 4,955 | 379,653 | |||||||||||
|
| |||||||||||||||
| 2,675,076 | ||||||||||||||||
South Korea 1.0% |
| |||||||||||||||
Korea Treasury Bond, Sr. Unsec’d. Notes, Ser. 1906 | 1.500 | 06/10/19 | KRW | 350,000 | 309,929 | |||||||||||
See Notes to Financial Statements.
| 22 |
| Description | Interest Rate | Maturity Date | Principal Amount (000)# | Value | ||||||||||||
FOREIGN BONDS (Continued) |
| |||||||||||||||
Thailand 4.9% |
| |||||||||||||||
Thailand Government Bond, | ||||||||||||||||
Sr. Unsec’d. Notes | 2.125 | % | 12/17/26 | THB | 1,790 | $ | 52,868 | |||||||||
Sr. Unsec’d. Notes | 2.875 | 06/17/46 | THB | 3,150 | 90,615 | |||||||||||
Sr. Unsec’d. Notes | 3.400 | 06/17/36 | THB | 6,000 | 194,667 | |||||||||||
Sr. Unsec’d. Notes | 3.625 | 06/16/23 | THB | 2,900 | 95,079 | |||||||||||
Sr. Unsec’d. Notes | 3.775 | 06/25/32 | THB | 600 | 20,168 | |||||||||||
Sr. Unsec’d. Notes | 3.850 | 12/12/25 | THB | 1,900 | 63,781 | |||||||||||
Sr. Unsec’d. Notes | 3.875 | 06/13/19 | THB | 12,900 | 403,311 | |||||||||||
Sr. Unsec’d. Notes | 4.875 | 06/22/29 | THB | 16,000 | 595,097 | |||||||||||
|
| |||||||||||||||
| 1,515,586 | ||||||||||||||||
Turkey 7.1% |
| |||||||||||||||
Turkey Government Bond, | ||||||||||||||||
Bonds | 7.100 | 03/08/23 | TRY | 470 | 101,594 | |||||||||||
Bonds | 8.000 | 03/12/25 | TRY | 865 | 188,800 | |||||||||||
Bonds | 10.600 | 02/11/26 | TRY | 5,925 | 1,486,892 | |||||||||||
Turkey Government International Bond, | ||||||||||||||||
Sr. Unsec’d. Notes | 5.125 | 03/25/22 | 200 | 207,474 | ||||||||||||
Sr. Unsec’d. Notes | 5.750 | 03/22/24 | 200 | 210,603 | ||||||||||||
|
| |||||||||||||||
| 2,195,363 | ||||||||||||||||
Ukraine 1.1% |
| |||||||||||||||
Ukraine Government International Bond, Sr. Unsec’d. Notes | 7.750 | 09/01/22 | 330 | 352,673 | ||||||||||||
Uruguay 0.2% |
| |||||||||||||||
Uruguay Government International Bond, Sr. Unsec’d. Notes, 144A | 8.500 | 03/15/28 | UYU | 1,870 | 64,886 | |||||||||||
|
| |||||||||||||||
TOTAL LONG-TERM INVESTMENTS |
| 29,315,881 | ||||||||||||||
|
| |||||||||||||||
Shares | ||||||||||||||||
SHORT-TERM INVESTMENTS 1.9% |
| |||||||||||||||
AFFILIATED MUTUAL FUND 1.6% |
| |||||||||||||||
Prudential Investment Portfolios 2 - Prudential Core | 481,154 | 481,154 | ||||||||||||||
|
| |||||||||||||||
See Notes to Financial Statements.
| Prudential Emerging Markets Debt Local Currency Fund | 23 |
Schedule of Investments (continued)
as of October 31, 2017
| Description | Value | |||
OPTIONS PURCHASED* 0.3% | ||||
TOTAL OPTIONS PURCHASED | $ | 100,094 | ||
|
| |||
TOTAL SHORT-TERM INVESTMENTS | 581,248 | |||
|
| |||
TOTAL INVESTMENTS, BEFORE OPTIONS WRITTEN 97.0% | 29,897,129 | |||
|
| |||
OPTIONS WRITTEN* (0.1)% | ||||
TOTAL OPTIONS WRITTEN | (35,624 | ) | ||
|
| |||
TOTAL INVESTMENTS 96.9% | 29,861,505 | |||
Other assets in excess of liabilities(z) 3.1% | 962,416 | |||
|
| |||
NET ASSETS 100.0% | $ | 30,823,921 | ||
|
| |||
The following abbreviations are used in the annual report:
M—Monthly payment frequency for swaps
Q—Quarterly payment frequency for swaps
S—Semiannual payment frequency for swaps
144A—Security was purchased pursuant to Rule 144A under the Securities Act of 1933 and may not be resold subject to that rule except to qualified institutional buyers. Unless otherwise noted, 144A securities are deemed to be liquid.
BKIBOR—Thailand Fixing Rate
KLIBOR—Malaysia Bumiputra Bank Rate
LIBOR—London Interbank Offered Rate
MTN—Medium Term Note
OTC—Over-the-counter
ARS—Argentine Peso
AUD—Australian Dollar
BRL—Brazilian Real
CHF—Swiss Franc
CLP—Chilean Peso
CNH—Chinese Renminbi (offshore)
COP—Colombian Peso
CZK—Czech Koruna
EUR—Euro
HUF—Hungarian Forint
IDR—Indonesian Rupiah
ILS—Israeli Shekel
INR—Indian Rupee
JPY—Japanese Yen
KRW—South Korean Won
MXN—Mexican Peso
See Notes to Financial Statements.
| 24 |
MYR—Malaysian Ringgit
PEN—Peruvian Nuevo Sol
PHP—Philippine Peso
PLN—Polish Zloty
RON—Romanian Leu
RUB—Russian Ruble
SGD—Singapore Dollar
THB—Thai Baht
TRY—Turkish Lira
TWD—New Taiwanese Dollar
UYU—Uruguayan Peso
ZAR—South African Rand
| * | Non-income producing security. |
| # | Principal or notional amount is shown in U.S. dollars unless otherwise stated. |
| (w) | PGIM Investments LLC, the manager of the Fund also serves as manager of the Prudential Investment Portfolios 2 - Prudential Core Ultra Short Bond Fund. |
| (z) | Includes net unrealized appreciation (depreciation) on the following derivative contracts held at reporting period end, with the exception of options which are included in total investments, net of options written, at market value: |
OTC Options Purchased: |
| |||||||||||||||||||||||||
Description | Call/Put | Counterparty | Expiration Date | Strike Price | Contracts | Notional Amount (000)# | Value | |||||||||||||||||||
Currency Option EUR vs BRL | Call | Citigroup Global Markets | 04/04/18 | 3.40 | — | EUR | 300 | $ | 46,812 | |||||||||||||||||
Currency Option EUR vs ZAR | Call | Goldman Sachs & Co. | 04/04/18 | 15.00 | — | EUR | 200 | 29,507 | ||||||||||||||||||
Currency Option USD vs MXN | Call | Citigroup Global Markets | 03/23/18 | 19.25 | — | 600 | 23,775 | |||||||||||||||||||
|
| |||||||||||||||||||||||||
| $ | 100,094 | |||||||||||||||||||||||||
|
| |||||||||||||||||||||||||
OTC Options Written: |
| |||||||||||||||||||||||||
Description | Call/Put | Counterparty | Expiration Date | Strike Price | Contracts | Notional Amount (000)# | Value | |||||||||||||||||||
Currency Option EUR vs BRL | Call | Citigroup Global Markets | 04/04/18 | 3.80 | — | EUR | 300 | $ | (16,749 | ) | ||||||||||||||||
Currency Option EUR vs ZAR | Call | Goldman Sachs & Co. | 04/04/18 | 17.00 | — | EUR | 200 | (10,754 | ) | |||||||||||||||||
Currency Option USD vs MXN | Call | Citigroup Global Markets | 03/23/18 | 21.25 | — | 600 | (6,320 | ) | ||||||||||||||||||
Currency Option EUR vs BRL | Put | Citigroup Global Markets | 04/04/18 | 3.20 | — | EUR | 300 | (64 | ) | |||||||||||||||||
Currency Option EUR vs ZAR | Put | Goldman Sachs & Co. | 04/04/18 | 14.00 | — | EUR | 200 | (334 | ) | |||||||||||||||||
Currency Option USD vs MXN | Put | Citigroup Global Markets | 03/23/18 | 17.75 | — | 600 | (1,403 | ) | ||||||||||||||||||
|
| |||||||||||||||||||||||||
| $ | (35,624 | ) | ||||||||||||||||||||||||
|
| |||||||||||||||||||||||||
See Notes to Financial Statements.
| Prudential Emerging Markets Debt Local Currency Fund | 25 |
Schedule of Investments (continued)
as of October 31, 2017
Forward foreign currency exchange contracts outstanding at October 31, 2017:
Purchase Contracts | Counterparty | Notional Amount (000) | Value at Settlement Date | Current Value | Unrealized Appreciation (Depreciation) | |||||||||||||
OTC forward foreign currency exchange contracts: |
| |||||||||||||||||
Australian Dollar, | ||||||||||||||||||
Expiring 01/12/2018 | Citigroup Global Markets | AUD | 121 | $ | 92,500 | $ | 92,293 | $ | (207 | ) | ||||||||
Brazilian Real, |
| |||||||||||||||||
Expiring 11/03/2017 | Barclays Capital Group | BRL | 127 | 39,725 | 38,676 | (1,049 | ) | |||||||||||
Expiring 11/03/2017 | BNP Paribas | BRL | 74 | 23,040 | 22,612 | (428 | ) | |||||||||||
Expiring 11/03/2017 | BNP Paribas | BRL | 249 | 76,409 | 76,130 | (279 | ) | |||||||||||
Expiring 11/03/2017 | Citigroup Global Markets | BRL | 35 | 11,107 | 10,747 | (360 | ) | |||||||||||
Expiring 11/03/2017 | Citigroup Global Markets | BRL | 43 | 13,577 | 13,042 | (535 | ) | |||||||||||
Expiring 11/03/2017 | Citigroup Global Markets | BRL | 208 | 65,710 | 63,669 | (2,041 | ) | |||||||||||
Expiring 11/03/2017 | Citigroup Global Markets | BRL | 327 | 102,123 | 99,944 | (2,179 | ) | |||||||||||
Expiring 11/03/2017 | Citigroup Global Markets | BRL | 350 | 109,617 | 106,956 | (2,661 | ) | |||||||||||
Expiring 11/03/2017 | Citigroup Global Markets | BRL | 817 | 249,096 | 249,657 | 561 | ||||||||||||
Expiring 11/03/2017 | UBS AG | BRL | 245 | 77,440 | 75,002 | (2,438 | ) | |||||||||||
Expiring 11/03/2017 | UBS AG | BRL | 299 | 92,979 | 91,293 | (1,686 | ) | |||||||||||
Expiring 11/03/2017 | UBS AG | BRL | 415 | 133,803 | 126,857 | (6,946 | ) | |||||||||||
| Chilean Peso, | ||||||||||||||||||
Expiring 01/17/2018 | Citigroup Global Markets | CLP | 80,306 | 126,346 | 126,041 | (305 | ) | |||||||||||
Expiring 01/17/2018 | Citigroup Global Markets | CLP | 346,849 | 550,362 | 544,384 | (5,978 | ) | |||||||||||
Expiring 01/17/2018 | UBS AG | CLP | 6,508 | 10,276 | 10,215 | (61 | ) | |||||||||||
| Colombian Peso, | ||||||||||||||||||
Expiring 12/18/2017 | BNP Paribas | COP | 95,402 | 32,036 | 31,217 | (819 | ) | |||||||||||
Expiring 12/18/2017 | Citigroup Global Markets | COP | 93,284 | 31,801 | 30,524 | (1,277 | ) | |||||||||||
Expiring 12/18/2017 | Citigroup Global Markets | COP | 484,551 | 165,274 | 158,551 | (6,723 | ) | |||||||||||
Expiring 12/18/2017 | Citigroup Global Markets | COP | 2,408,205 | 814,959 | 787,993 | (26,966 | ) | |||||||||||
Expiring 12/18/2017 | JPMorgan Chase | COP | 188,311 | 62,273 | 61,618 | (655 | ) | |||||||||||
Expiring 12/18/2017 | UBS AG | COP | 143,172 | 48,423 | 46,847 | (1,576 | ) | |||||||||||
| Czech Koruna, | ||||||||||||||||||
Expiring 01/08/2018 | Citigroup Global Markets | CZK | 722 | 32,943 | 32,931 | (12 | ) | |||||||||||
Expiring 01/08/2018 | UBS AG | CZK | 540 | 24,653 | 24,630 | (23 | ) | |||||||||||
Expiring 01/08/2018 | UBS AG | CZK | 840 | 38,588 | 38,312 | (276 | ) | |||||||||||
Expiring 01/08/2018 | UBS AG | CZK | 12,065 | 552,468 | 550,263 | (2,205 | ) | |||||||||||
Expiring 01/08/2018 | UBS AG | CZK | 12,065 | 552,633 | 550,263 | (2,370 | ) | |||||||||||
| Hungarian Forint, | ||||||||||||||||||
Expiring 01/24/2018 | Goldman Sachs & Co. | HUF | 401,946 | 1,543,215 | 1,510,458 | (32,757 | ) | |||||||||||
Expiring 01/24/2018 | UBS AG | HUF | 13,934 | 52,726 | 52,360 | (366 | ) | |||||||||||
| Indian Rupee, | ||||||||||||||||||
Expiring 11/03/2017 | Barclays Capital Group | INR | 2,183 | 33,872 | 33,686 | (186 | ) | |||||||||||
Expiring 11/03/2017 | Citigroup Global Markets | INR | 1,904 | 29,000 | 29,390 | 390 | ||||||||||||
Expiring 11/03/2017 | Citigroup Global Markets | INR | 4,372 | 67,000 | 67,478 | 478 | ||||||||||||
Expiring 11/03/2017 | Citigroup Global Markets | INR | 40,304 | 627,332 | 621,996 | (5,336 | ) | |||||||||||
See Notes to Financial Statements.
| 26 |
Forward foreign currency exchange contracts outstanding at October 31, 2017 (continued):
Purchase Contracts | Counterparty | Notional Amount (000) | Value at Settlement Date | Current Value | Unrealized Appreciation (Depreciation) | |||||||||||||
OTC forward foreign currency exchange contracts (cont’d.): |
| |||||||||||||||||
Indian Rupee, (cont’d.) | ||||||||||||||||||
Expiring 11/03/2017 | JPMorgan Chase | INR | 1,609 | $ | 24,807 | $ | 24,834 | $ | 27 | |||||||||
Expiring 11/03/2017 | UBS AG | INR | 1,277 | 19,441 | 19,705 | 264 | ||||||||||||
Expiring 11/03/2017 | UBS AG | INR | 26,869 | 415,290 | 414,664 | (626 | ) | |||||||||||
Expiring 01/30/2018 | Bank of America | INR | 22,632 | 345,234 | 345,448 | 214 | ||||||||||||
Expiring 01/30/2018 | Citigroup Global Markets | INR | 15,982 | 243,251 | 243,944 | 693 | ||||||||||||
Expiring 01/30/2018 | Morgan Stanley | INR | 22,632 | 343,975 | 345,448 | 1,473 | ||||||||||||
Indonesian Rupiah, | ||||||||||||||||||
Expiring 11/16/2017 | Citigroup Global Markets | IDR | 563,125 | 41,987 | 41,465 | (522 | ) | |||||||||||
Expiring 11/16/2017 | Citigroup Global Markets | IDR | 1,323,682 | 100,325 | 97,467 | (2,858 | ) | |||||||||||
Expiring 11/16/2017 | Citigroup Global Markets | IDR | 5,591,174 | 414,130 | 411,695 | (2,435 | ) | |||||||||||
Expiring 11/16/2017 | JPMorgan Chase | IDR | 300,000 | 22,657 | 22,090 | (567 | ) | |||||||||||
Expiring 11/16/2017 | UBS AG | IDR | 1,045,518 | 77,041 | 76,985 | (56 | ) | |||||||||||
Expiring 02/12/2018 | JPMorgan Chase | IDR | 1,351,566 | 98,117 | 98,653 | 536 | ||||||||||||
Expiring 02/12/2018 | Morgan Stanley | IDR | 2,389,540 | 174,634 | 174,417 | (217 | ) | |||||||||||
Malaysian Ringgit, | ||||||||||||||||||
Expiring 12/13/2017 | UBS AG | MYR | 151 | 35,599 | 35,619 | 20 | ||||||||||||
Expiring 12/13/2017 | UBS AG | MYR | 2,342 | 556,926 | 552,225 | (4,701 | ) | |||||||||||
Mexican Peso, | ||||||||||||||||||
Expiring 11/10/2017 | Citigroup Global Markets | MXN | 414 | 22,679 | 21,575 | (1,104 | ) | |||||||||||
Expiring 11/10/2017 | Citigroup Global Markets | MXN | 900 | 50,055 | 46,853 | (3,202 | ) | |||||||||||
Expiring 11/10/2017 | Citigroup Global Markets | MXN | 1,038 | 56,944 | 54,038 | (2,906 | ) | |||||||||||
Expiring 11/10/2017 | Citigroup Global Markets | MXN | 1,248 | 69,787 | 64,973 | (4,814 | ) | |||||||||||
Expiring 11/10/2017 | Citigroup Global Markets | MXN | 1,367 | 73,252 | 71,154 | (2,098 | ) | |||||||||||
Expiring 11/10/2017 | Hong Kong & Shanghai Bank | MXN | 455 | 25,142 | 23,710 | (1,432 | ) | |||||||||||
Expiring 11/10/2017 | Hong Kong & Shanghai Bank | MXN | 2,964 | 165,302 | 154,333 | (10,969 | ) | |||||||||||
Expiring 11/10/2017 | Hong Kong & Shanghai Bank | MXN | 3,518 | 192,695 | 183,139 | (9,556 | ) | |||||||||||
Expiring 11/10/2017 | JPMorgan Chase | MXN | 355 | 19,713 | 18,484 | (1,229 | ) | |||||||||||
Expiring 11/10/2017 | JPMorgan Chase | MXN | 3,826 | 209,063 | 199,180 | (9,883 | ) | |||||||||||
Expiring 11/10/2017 | UBS AG | MXN | 199 | 10,982 | 10,383 | (599 | ) | |||||||||||
Expiring 11/10/2017 | UBS AG | MXN | 1,759 | 91,985 | 91,594 | (391 | ) | |||||||||||
Expiring 01/30/2018 | UBS AG | MXN | 2,453 | 126,346 | 125,873 | (473 | ) | |||||||||||
Expiring 03/27/2018 | Citigroup Global Markets | MXN | 4,973 | 250,000 | 252,989 | 2,989 | ||||||||||||
New Taiwanese Dollar, | ||||||||||||||||||
Expiring 11/08/2017 | Barclays Capital Group | TWD | 2,581 | 85,000 | 85,625 | 625 | ||||||||||||
Expiring 11/08/2017 | Barclays Capital Group | TWD | 5,063 | 167,000 | 167,923 | 923 | ||||||||||||
Expiring 11/08/2017 | Citigroup Global Markets | TWD | 965 | 32,000 | 32,001 | 1 | ||||||||||||
Expiring 11/08/2017 | Citigroup Global Markets | TWD | 970 | 31,983 | 32,162 | 179 | ||||||||||||
Expiring 11/08/2017 | Citigroup Global Markets | TWD | 1,178 | 39,000 | 39,067 | 67 | ||||||||||||
Expiring 11/08/2017 | UBS AG | TWD | 2,799 | 92,000 | 92,838 | 838 | ||||||||||||
See Notes to Financial Statements.
| Prudential Emerging Markets Debt Local Currency Fund | 27 |
Schedule of Investments (continued)
as of October 31, 2017
Forward foreign currency exchange contracts outstanding at October 31, 2017 (continued):
Purchase Contracts | Counterparty | Notional Amount (000) | Value at Settlement Date | Current Value | Unrealized Appreciation (Depreciation) | |||||||||||||
OTC forward foreign currency exchange contracts (cont’d.): |
| |||||||||||||||||
Peruvian Nuevo Sol, | ||||||||||||||||||
Expiring 01/12/2018 | Citigroup Global Markets | PEN | 714 | $ | 217,494 | $ | 218,951 | $ | 1,457 | |||||||||
Expiring 01/12/2018 | UBS AG | PEN | 53 | 16,254 | 16,305 | 51 | ||||||||||||
Philippine Peso, | ||||||||||||||||||
Expiring 12/15/2017 | Citigroup Global Markets | PHP | 5,005 | 97,518 | 96,662 | (856 | ) | |||||||||||
Expiring 12/15/2017 | UBS AG | PHP | 5,021 | 98,658 | 96,973 | (1,685 | ) | |||||||||||
Expiring 12/15/2017 | UBS AG | PHP | 6,115 | 118,000 | 118,117 | 117 | ||||||||||||
Expiring 01/25/2018 | Citigroup Global Markets | PHP | 11,661 | 228,408 | 224,660 | (3,748 | ) | |||||||||||
Polish Zloty, | ||||||||||||||||||
Expiring 01/24/2018 | Barclays Capital Group | PLN | 5,865 | 1,632,217 | 1,612,161 | (20,056 | ) | |||||||||||
Expiring 01/24/2018 | Citigroup Global Markets | PLN | 40 | 10,983 | 10,985 | 2 | ||||||||||||
Expiring 01/24/2018 | Hong Kong & Shanghai Bank | PLN | 181 | 50,501 | 49,791 | (710 | ) | |||||||||||
Expiring 01/24/2018 | UBS AG | PLN | 309 | 85,167 | 84,912 | (255 | ) | |||||||||||
Romanian Leu, | ||||||||||||||||||
Expiring 01/22/2018 | Citigroup Global Markets | RON | 2,643 | 677,990 | 668,865 | (9,125 | ) | |||||||||||
Expiring 01/22/2018 | UBS AG | RON | 102 | 26,050 | 25,892 | (158 | ) | |||||||||||
Russian Ruble, | ||||||||||||||||||
Expiring 11/17/2017 | Barclays Capital Group | RUB | 3,292 | 55,854 | 56,136 | 282 | ||||||||||||
Expiring 11/17/2017 | Citigroup Global Markets | RUB | 1,703 | 29,312 | 29,038 | (274 | ) | |||||||||||
Expiring 11/17/2017 | Citigroup Global Markets | RUB | 2,639 | 45,242 | 44,997 | (245 | ) | |||||||||||
Expiring 11/17/2017 | Citigroup Global Markets | RUB | 4,794 | 79,364 | 81,744 | 2,380 | ||||||||||||
Expiring 11/17/2017 | Citigroup Global Markets | RUB | 4,798 | 79,365 | 81,816 | 2,451 | ||||||||||||
Expiring 11/17/2017 | Citigroup Global Markets | RUB | 5,327 | 88,184 | 90,825 | 2,641 | ||||||||||||
Expiring 11/17/2017 | JPMorgan Chase | RUB | 1,996 | 34,330 | 34,033 | (297 | ) | |||||||||||
Expiring 01/12/2018 | Citigroup Global Markets | RUB | 3,254 | 55,557 | 54,934 | (623 | ) | |||||||||||
Expiring 01/12/2018 | Citigroup Global Markets | RUB | 4,705 | 80,502 | 79,423 | (1,079 | ) | |||||||||||
Expiring 01/12/2018 | JPMorgan Chase | RUB | 69,633 | 1,182,173 | 1,175,555 | (6,618 | ) | |||||||||||
Expiring 01/12/2018 | UBS AG | RUB | 3,702 | 62,679 | 62,504 | (175 | ) | |||||||||||
Singapore Dollar, | ||||||||||||||||||
Expiring 11/13/2017 | Citigroup Global Markets | SGD | 17 | 12,650 | 12,597 | (53 | ) | |||||||||||
Expiring 11/13/2017 | Citigroup Global Markets | SGD | 60 | 45,000 | 44,240 | (760 | ) | |||||||||||
Expiring 11/13/2017 | Citigroup Global Markets | SGD | 103 | 76,000 | 75,254 | (746 | ) | |||||||||||
Expiring 11/13/2017 | Citigroup Global Markets | SGD | 163 | 121,000 | 119,620 | (1,380 | ) | |||||||||||
Expiring 11/13/2017 | UBS AG | SGD | 243 | 181,225 | 178,583 | (2,642 | ) | |||||||||||
Expiring 11/13/2017 | UBS AG | SGD | 243 | 181,225 | 178,606 | (2,619 | ) | |||||||||||
Expiring 11/13/2017 | UBS AG | SGD | 340 | 251,600 | 249,321 | (2,279 | ) | |||||||||||
South African Rand, | ||||||||||||||||||
Expiring 11/10/2017 | JPMorgan Chase | ZAR | 1,109 | 81,325 | 78,296 | (3,029 | ) | |||||||||||
Expiring 12/15/2017 | Citigroup Global Markets | ZAR | 694 | 49,995 | 48,717 | (1,278 | ) | |||||||||||
See Notes to Financial Statements.
| 28 |
Forward foreign currency exchange contracts outstanding at October 31, 2017 (continued):
Purchase Contracts | Counterparty | Notional Amount (000) | Value at Settlement Date | Current Value | Unrealized Appreciation (Depreciation) | |||||||||||||
OTC forward foreign currency exchange contracts (cont’d.): |
| |||||||||||||||||
South African Rand, (cont’d.) | ||||||||||||||||||
Expiring 12/15/2017 | Citigroup Global Markets | ZAR | 841 | $ | 61,556 | $ | 58,995 | $ | (2,561 | ) | ||||||||
Expiring 12/15/2017 | Citigroup Global Markets | ZAR | 4,221 | 306,100 | 296,176 | (9,924 | ) | |||||||||||
Expiring 12/15/2017 | UBS AG | ZAR | 905 | 63,370 | 63,501 | 131 | ||||||||||||
Expiring 04/06/2018 | UBS AG | ZAR | 128 | 9,525 | 8,817 | (708 | ) | |||||||||||
South Korean Won, | ||||||||||||||||||
Expiring 11/17/2017 | JPMorgan Chase | KRW | 152,551 | 135,300 | 136,174 | 874 | ||||||||||||
Expiring 11/17/2017 | UBS AG | KRW | 102,234 | 91,000 | 91,259 | 259 | ||||||||||||
Thai Baht, | ||||||||||||||||||
Expiring 11/10/2017 | Citigroup Global Markets | THB | 434 | 13,066 | 13,055 | (11 | ) | |||||||||||
Expiring 11/10/2017 | Citigroup Global Markets | THB | 537 | 16,199 | 16,160 | (39 | ) | |||||||||||
Expiring 11/10/2017 | Citigroup Global Markets | THB | 626 | 18,830 | 18,835 | 5 | ||||||||||||
Expiring 11/10/2017 | Citigroup Global Markets | THB | 634 | 19,108 | 19,096 | (12 | ) | |||||||||||
Expiring 11/10/2017 | Citigroup Global Markets | THB | 872 | 26,284 | 26,253 | (31 | ) | |||||||||||
Expiring 11/10/2017 | Citigroup Global Markets | THB | 1,045 | 31,452 | 31,443 | (9 | ) | |||||||||||
Expiring 11/10/2017 | Citigroup Global Markets | THB | 1,187 | 35,638 | 35,731 | 93 | ||||||||||||
Expiring 11/10/2017 | Citigroup Global Markets | THB | 1,674 | 50,082 | 50,380 | 298 | ||||||||||||
Expiring 11/10/2017 | Citigroup Global Markets | THB | 2,218 | 66,844 | 66,767 | (77 | ) | |||||||||||
Expiring 11/10/2017 | Citigroup Global Markets | THB | 2,931 | 88,000 | 88,230 | 230 | ||||||||||||
Expiring 11/10/2017 | Citigroup Global Markets | THB | 3,650 | 110,000 | 109,883 | (117 | ) | |||||||||||
Expiring 11/10/2017 | Citigroup Global Markets | THB | 3,764 | 113,397 | 113,297 | (100 | ) | |||||||||||
Expiring 11/10/2017 | Citigroup Global Markets | THB | 34,744 | 1,045,400 | 1,045,893 | 493 | ||||||||||||
Expiring 11/10/2017 | Hong Kong & Shanghai Bank | THB | 2,631 | 78,708 | 79,204 | 496 | ||||||||||||
Turkish Lira, | ||||||||||||||||||
Expiring 12/15/2017 | Citigroup Global Markets | TRY | 48 | 13,370 | 12,484 | (886 | ) | |||||||||||
Expiring 12/15/2017 | Citigroup Global Markets | TRY | 82 | 22,679 | 21,425 | (1,254 | ) | |||||||||||
Expiring 12/15/2017 | Citigroup Global Markets | TRY | 204 | 55,257 | 52,991 | (2,266 | ) | |||||||||||
Expiring 12/15/2017 | Citigroup Global Markets | TRY | 291 | 79,870 | 75,617 | (4,253 | ) | |||||||||||
Expiring 12/15/2017 | Citigroup Global Markets | TRY | 574 | 160,495 | 149,261 | (11,234 | ) | |||||||||||
Expiring 12/15/2017 | Citigroup Global Markets | TRY | 581 | 159,210 | 151,238 | (7,972 | ) | |||||||||||
Expiring 12/15/2017 | Hong Kong & Shanghai Bank | TRY | 2,239 | 630,676 | 582,251 | (48,425 | ) | |||||||||||
Expiring 12/15/2017 | UBS AG | TRY | 178 | 46,224 | 46,234 | 10 | ||||||||||||
Expiring 12/15/2017 | UBS AG | TRY | 257 | 66,527 | 66,803 | 276 | ||||||||||||
|
|
|
|
|
| |||||||||||||
| $ | 20,873,637 | $ | 20,576,554 | $ | (297,083 | ) | ||||||||||||
|
|
|
|
|
| |||||||||||||
See Notes to Financial Statements.
| Prudential Emerging Markets Debt Local Currency Fund | 29 |
Schedule of Investments (continued)
as of October 31, 2017
Forward foreign currency exchange contracts outstanding at October 31, 2017 (continued):
Sale Contracts | Counterparty | Notional Amount (000) | Value at Settlement Date | Current Value | Unrealized Appreciation (Depreciation) | |||||||||||||
OTC forward foreign currency exchange contracts: |
| |||||||||||||||||
Australian Dollar, | ||||||||||||||||||
Expiring 01/12/2018 | Citigroup Global Markets | AUD | 120 | $ | 93,303 | $ | 92,046 | $ | 1,257 | |||||||||
Expiring 01/12/2018 | Citigroup Global Markets | AUD | 120 | 93,304 | 92,012 | 1,292 | ||||||||||||
Brazilian Real, | ||||||||||||||||||
Expiring 11/03/2017 | Barclays Capital Group | BRL | 498 | 153,405 | 152,321 | 1,084 | ||||||||||||
Expiring 11/03/2017 | Citigroup Global Markets | BRL | 599 | 188,358 | 182,940 | 5,418 | ||||||||||||
Expiring 11/03/2017 | Citigroup Global Markets | BRL | 495 | 154,056 | 151,281 | 2,775 | ||||||||||||
Expiring 11/03/2017 | Citigroup Global Markets | BRL | 209 | 66,635 | 63,955 | 2,680 | ||||||||||||
Expiring 11/03/2017 | Citigroup Global Markets | BRL | 150 | 47,000 | 45,698 | 1,302 | ||||||||||||
Expiring 11/03/2017 | Citigroup Global Markets | BRL | 123 | 38,878 | 37,733 | 1,145 | ||||||||||||
Expiring 11/03/2017 | Citigroup Global Markets | BRL | 87 | 27,542 | 26,722 | 820 | ||||||||||||
Expiring 11/03/2017 | Citigroup Global Markets | BRL | 76 | 24,451 | 23,187 | 1,264 | ||||||||||||
Expiring 11/03/2017 | Citigroup Global Markets | BRL | 54 | 16,987 | 16,540 | 447 | ||||||||||||
Expiring 11/03/2017 | Citigroup Global Markets | BRL | 51 | 16,208 | 15,724 | 484 | ||||||||||||
Expiring 11/03/2017 | Citigroup Global Markets | BRL | 33 | 10,401 | 10,061 | 340 | ||||||||||||
Expiring 11/03/2017 | Goldman Sachs & Co. | BRL | 399 | 123,281 | 121,788 | 1,493 | ||||||||||||
Expiring 11/03/2017 | Goldman Sachs & Co. | BRL | 340 | 107,149 | 103,805 | 3,344 | ||||||||||||
Expiring 11/03/2017 | UBS AG | BRL | 75 | 23,453 | 22,830 | 623 | ||||||||||||
Expiring 02/02/2018 | Barclays Capital Group | BRL | 61 | 18,536 | 18,519 | 17 | ||||||||||||
Expiring 02/02/2018 | Citigroup Global Markets | BRL | 817 | 246,265 | 246,744 | (479 | ) | |||||||||||
Chilean Peso, | ||||||||||||||||||
Expiring 01/17/2018 | Barclays Capital Group | CLP | 30,250 | 48,000 | 47,477 | 523 | ||||||||||||
Chinese Renminbi, | ||||||||||||||||||
Expiring 01/26/2018 | Citigroup Global Markets | CNH | 1,158 | 173,206 | 173,488 | (282 | ) | |||||||||||
Colombian Peso, | ||||||||||||||||||
Expiring 12/18/2017 | Barclays Capital Group | COP | 194,997 | 66,000 | 63,805 | 2,195 | ||||||||||||
Expiring 12/18/2017 | Barclays Capital Group | COP | 136,093 | 44,752 | 44,531 | 221 | ||||||||||||
Expiring 12/18/2017 | Citigroup Global Markets | COP | 457,240 | 154,057 | 149,615 | 4,442 | ||||||||||||
Expiring 12/18/2017 | Citigroup Global Markets | COP | 338,916 | 110,938 | 110,897 | 41 | ||||||||||||
Expiring 12/18/2017 | Citigroup Global Markets | COP | 274,198 | 92,635 | 89,721 | 2,914 | ||||||||||||
Expiring 12/18/2017 | Citigroup Global Markets | COP | 57,543 | 19,439 | 18,829 | 610 | ||||||||||||
Expiring 12/18/2017 | Citigroup Global Markets | COP | 47,727 | 16,072 | 15,617 | 455 | ||||||||||||
Expiring 12/18/2017 | Citigroup Global Markets | COP | 34,117 | 11,457 | 11,163 | 294 | ||||||||||||
Expiring 12/18/2017 | Citigroup Global Markets | COP | 25,211 | 8,521 | 8,249 | 272 | ||||||||||||
Expiring 12/18/2017 | UBS AG | COP | 48,543 | 16,318 | 15,884 | 434 | ||||||||||||
Czech Koruna, | ||||||||||||||||||
Expiring 01/08/2018 | Citigroup Global Markets | CZK | 1,974 | 90,000 | 90,048 | (48 | ) | |||||||||||
Expiring 01/08/2018 | Citigroup Global Markets | CZK | 128 | 5,882 | 5,824 | 58 | ||||||||||||
Expiring 01/08/2018 | Goldman Sachs & Co. | CZK | 1,319 | 60,321 | 60,179 | 142 | ||||||||||||
Expiring 01/08/2018 | Goldman Sachs & Co. | CZK | 196 | 8,998 | 8,953 | 45 | ||||||||||||
See Notes to Financial Statements.
| 30 |
Forward foreign currency exchange contracts outstanding at October 31, 2017 (continued):
Sale Contracts | Counterparty | Notional Amount (000) | Value at Settlement Date | Current Value | Unrealized Appreciation (Depreciation) | |||||||||||||
OTC forward foreign currency exchange contracts (cont’d.): |
| |||||||||||||||||
Czech Koruna, (cont’d.) | ||||||||||||||||||
Expiring 01/08/2018 | Hong Kong & Shanghai Bank | CZK | 338 | $ | 15,407 | $ | 15,405 | $ | 2 | |||||||||
Expiring 01/08/2018 | UBS AG | CZK | 529 | 24,410 | 24,126 | 284 | ||||||||||||
Expiring 01/08/2018 | UBS AG | CZK | 259 | 11,878 | 11,795 | 83 | ||||||||||||
Euro, | ||||||||||||||||||
Expiring 01/26/2018 | Citigroup Global Markets | EUR | 463 | 549,340 | 541,992 | 7,348 | ||||||||||||
Expiring 01/26/2018 | Citigroup Global Markets | EUR | 131 | 152,432 | 152,968 | (536 | ) | |||||||||||
Expiring 01/26/2018 | Citigroup Global Markets | EUR | 131 | 152,079 | 152,968 | (889 | ) | |||||||||||
Expiring 01/26/2018 | Citigroup Global Markets | EUR | 82 | 96,400 | 95,957 | 443 | ||||||||||||
Expiring 01/26/2018 | UBS AG | EUR | 463 | 549,477 | 541,993 | 7,484 | ||||||||||||
Expiring 01/26/2018 | UBS AG | EUR | 52 | 61,000 | 61,357 | (357 | ) | |||||||||||
Expiring 01/26/2018 | UBS AG | EUR | 47 | 55,000 | 55,112 | (112 | ) | |||||||||||
Expiring 01/26/2018 | UBS AG | EUR | 22 | 26,189 | 26,069 | 120 | ||||||||||||
Hungarian Forint, | ||||||||||||||||||
Expiring 01/24/2018 | JPMorgan Chase | HUF | 4,391 | 16,487 | 16,500 | (13 | ) | |||||||||||
Indian Rupee, | ||||||||||||||||||
Expiring 11/03/2017 | Bank of America | INR | 22,632 | 348,664 | 349,411 | (747 | ) | |||||||||||
Expiring 11/03/2017 | Citigroup Global Markets | INR | 15,982 | 245,649 | 246,643 | (994 | ) | |||||||||||
Expiring 11/03/2017 | Citigroup Global Markets | INR | 6,837 | 106,000 | 105,513 | 487 | ||||||||||||
Expiring 11/03/2017 | Citigroup Global Markets | INR | 6,311 | 98,000 | 97,393 | 607 | ||||||||||||
Expiring 11/03/2017 | Citigroup Global Markets | INR | 2,164 | 32,980 | 33,394 | (414 | ) | |||||||||||
Expiring 11/03/2017 | JPMorgan Chase | INR | 1,962 | 30,109 | 30,273 | (164 | ) | |||||||||||
Expiring 11/03/2017 | Morgan Stanley | INR | 22,632 | 347,433 | 349,269 | (1,836 | ) | |||||||||||
Indonesian Rupiah, | ||||||||||||||||||
Expiring 11/16/2017 | Barclays Capital Group | IDR | 857,537 | 63,559 | 63,143 | 416 | ||||||||||||
Expiring 11/16/2017 | Citigroup Global Markets | IDR | 2,136,732 | 158,841 | 157,334 | 1,507 | ||||||||||||
Expiring 11/16/2017 | Citigroup Global Markets | IDR | 1,926,642 | 142,608 | 141,864 | 744 | ||||||||||||
Expiring 11/16/2017 | Citigroup Global Markets | IDR | 437,697 | 32,398 | 32,229 | 169 | ||||||||||||
Expiring 11/16/2017 | Citigroup Global Markets | IDR | 365,502 | 27,014 | 26,913 | 101 | ||||||||||||
Expiring 11/16/2017 | Citigroup Global Markets | IDR | 200,839 | 14,815 | 14,788 | 27 | ||||||||||||
Expiring 11/16/2017 | Citigroup Global Markets | IDR | 196,104 | 14,438 | 14,440 | (2 | ) | |||||||||||
Expiring 11/16/2017 | Citigroup Global Markets | IDR | 169,089 | 12,549 | 12,451 | 98 | ||||||||||||
Expiring 11/16/2017 | Morgan Stanley | IDR | 1,470,928 | 109,306 | 108,309 | 997 | ||||||||||||
Expiring 11/16/2017 | UBS AG | IDR | 323,623 | 23,911 | 23,829 | 82 | ||||||||||||
Expiring 02/12/2018 | Citigroup Global Markets | IDR | 296,062 | 21,571 | 21,610 | (39 | ) | |||||||||||
Expiring 02/12/2018 | Citigroup Global Markets | IDR | 211,270 | 15,393 | 15,421 | (28 | ) | |||||||||||
Expiring 02/12/2018 | Citigroup Global Markets | IDR | 152,436 | 11,082 | 11,127 | (45 | ) | |||||||||||
Expiring 02/12/2018 | JPMorgan Chase | IDR | 424,821 | 31,025 | 31,009 | 16 | ||||||||||||
Israeli Shekel, | ||||||||||||||||||
Expiring 01/24/2018 | Citigroup Global Markets | ILS | 1,335 | 381,437 | 380,239 | 1,198 | ||||||||||||
Expiring 01/24/2018 | Citigroup Global Markets | ILS | 536 | 153,405 | 152,669 | 736 | ||||||||||||
See Notes to Financial Statements.
| Prudential Emerging Markets Debt Local Currency Fund | 31 |
Schedule of Investments (continued)
as of October 31, 2017
Forward foreign currency exchange contracts outstanding at October 31, 2017 (continued):
Sale Contracts | Counterparty | Notional Amount (000) | Value at Settlement Date | Current Value | Unrealized Appreciation (Depreciation) | |||||||||||||
OTC forward foreign currency exchange contracts (cont’d.): |
| |||||||||||||||||
Japanese Yen, | ||||||||||||||||||
Expiring 01/26/2018 | Citigroup Global Markets | JPY | 21,779 | $ | 192,142 | $ | 192,432 | $ | (290 | ) | ||||||||
Expiring 01/26/2018 | UBS AG | JPY | 10,776 | 95,000 | 95,210 | (210 | ) | |||||||||||
Malaysian Ringgit, | ||||||||||||||||||
Expiring 12/13/2017 | Barclays Capital Group | MYR | 430 | 101,693 | 101,446 | 247 | ||||||||||||
Expiring 12/13/2017 | Barclays Capital Group | MYR | 193 | 45,415 | 45,428 | (13 | ) | |||||||||||
Expiring 12/13/2017 | Citigroup Global Markets | MYR | 48 | 11,363 | 11,336 | 27 | ||||||||||||
Expiring 12/13/2017 | Morgan Stanley | MYR | 348 | 83,016 | 82,041 | 975 | ||||||||||||
Expiring 12/13/2017 | UBS AG | MYR | 289 | 68,381 | 68,183 | 198 | ||||||||||||
Mexican Peso, | ||||||||||||||||||
Expiring 11/10/2017 | Bank of America | MXN | 422 | 21,992 | 21,949 | 43 | ||||||||||||
Expiring 11/10/2017 | Citigroup Global Markets | MXN | 3,007 | 165,811 | 156,554 | 9,257 | ||||||||||||
Expiring 11/10/2017 | Citigroup Global Markets | MXN | 2,839 | 157,322 | 147,818 | 9,504 | ||||||||||||
Expiring 11/10/2017 | Citigroup Global Markets | MXN | 2,560 | 140,114 | 133,290 | 6,824 | ||||||||||||
Expiring 11/10/2017 | Citigroup Global Markets | MXN | 1,997 | 110,690 | 103,997 | 6,693 | ||||||||||||
Expiring 11/10/2017 | Citigroup Global Markets | MXN | 1,435 | 79,837 | 74,722 | 5,115 | ||||||||||||
Expiring 11/10/2017 | Citigroup Global Markets | MXN | 435 | 24,451 | 22,671 | 1,780 | ||||||||||||
Expiring 11/10/2017 | Citigroup Global Markets | MXN | 229 | 12,069 | 11,918 | 151 | ||||||||||||
Expiring 11/10/2017 | Goldman Sachs & Co. | MXN | 2,044 | 106,422 | 106,440 | (18 | ) | |||||||||||
Expiring 11/10/2017 | Hong Kong & Shanghai Bank | MXN | 1,175 | 65,443 | 61,177 | 4,266 | ||||||||||||
Expiring 11/10/2017 | JPMorgan Chase | MXN | 1,010 | 53,000 | 52,606 | 394 | ||||||||||||
Expiring 11/10/2017 | UBS AG | MXN | 637 | 33,000 | 33,160 | (160 | ) | |||||||||||
Expiring 11/10/2017 | UBS AG | MXN | 491 | 26,286 | 25,586 | 700 | ||||||||||||
Expiring 11/10/2017 | UBS AG | MXN | 277 | 14,705 | 14,431 | 274 | ||||||||||||
Expiring 11/10/2017 | UBS AG | MXN | 263 | 13,962 | 13,682 | 280 | ||||||||||||
Expiring 01/30/2018 | JPMorgan Chase | MXN | 584 | 29,982 | 29,943 | 39 | ||||||||||||
| New Taiwanese Dollar, | ||||||||||||||||||
Expiring 11/08/2017 | Barclays Capital Group | TWD | 1,719 | 57,000 | 57,031 | (31 | ) | |||||||||||
Expiring 11/08/2017 | Citigroup Global Markets | TWD | 20,072 | 665,074 | 665,771 | (697 | ) | |||||||||||
Expiring 11/08/2017 | Citigroup Global Markets | TWD | 2,870 | 94,808 | 95,190 | (382 | ) | |||||||||||
Expiring 11/08/2017 | Citigroup Global Markets | TWD | 625 | 20,655 | 20,721 | (66 | ) | |||||||||||
Expiring 11/08/2017 | JPMorgan Chase | TWD | 380 | 12,565 | 12,602 | (37 | ) | |||||||||||
Expiring 11/08/2017 | UBS AG | TWD | 3,987 | 133,000 | 132,231 | 769 | ||||||||||||
Peruvian Nuevo Sol, | ||||||||||||||||||
Expiring 01/12/2018 | Citigroup Global Markets | PEN | 59 | 18,000 | 18,031 | (31 | ) | |||||||||||
Expiring 01/12/2018 | JPMorgan Chase | PEN | 90 | 27,794 | 27,711 | 83 | ||||||||||||
Philippine Peso, | ||||||||||||||||||
Expiring 12/15/2017 | Citigroup Global Markets | PHP | 5,947 | 116,000 | 114,870 | 1,130 | ||||||||||||
Expiring 12/15/2017 | Citigroup Global Markets | PHP | 572 | 11,183 | 11,041 | 142 | ||||||||||||
Expiring 12/15/2017 | UBS AG | PHP | 6,854 | 133,000 | 132,387 | 613 | ||||||||||||
See Notes to Financial Statements.
| 32 |
Forward foreign currency exchange contracts outstanding at October 31, 2017 (continued):
Sale Contracts | Counterparty | Notional Amount (000) | Value at Settlement Date | Current Value | Unrealized Appreciation (Depreciation) | |||||||||||||
OTC forward foreign currency exchange contracts (cont’d.): |
| |||||||||||||||||
Polish Zloty, | ||||||||||||||||||
Expiring 01/24/2018 | Citigroup Global Markets | PLN | 555 | $ | 151,688 | $ | 152,498 | $ | (810 | ) | ||||||||
Expiring 01/24/2018 | JPMorgan Chase | PLN | 62 | 17,116 | 16,916 | 200 | ||||||||||||
Expiring 01/24/2018 | JPMorgan Chase | PLN | 43 | 11,670 | 11,700 | (30 | ) | |||||||||||
Expiring 01/24/2018 | UBS AG | PLN | 146 | 40,061 | 40,053 | 8 | ||||||||||||
Romanian Leu, | ||||||||||||||||||
Expiring 01/22/2018 | UBS AG | RON | 117 | 30,050 | 29,705 | 345 | ||||||||||||
Expiring 01/22/2018 | UBS AG | RON | 47 | 11,777 | 11,777 | — | ||||||||||||
Expiring 01/23/2018 | UBS AG | RON | 170 | 43,142 | 43,143 | (1 | ) | |||||||||||
Russian Ruble, | ||||||||||||||||||
Expiring 11/17/2017 | Citigroup Global Markets | RUB | 6,373 | 109,760 | 108,667 | 1,093 | ||||||||||||
Expiring 11/17/2017 | Citigroup Global Markets | RUB | 2,843 | 49,000 | 48,481 | 519 | ||||||||||||
Expiring 11/17/2017 | Citigroup Global Markets | RUB | 1,900 | 32,644 | 32,396 | 248 | ||||||||||||
Expiring 11/17/2017 | Citigroup Global Markets | RUB | 1,071 | 18,523 | 18,270 | 253 | ||||||||||||
Expiring 01/12/2018 | Barclays Capital Group | RUB | 12,776 | 217,965 | 215,687 | 2,278 | ||||||||||||
Expiring 01/12/2018 | Barclays Capital Group | RUB | 6,576 | 111,100 | 111,017 | 83 | ||||||||||||
Expiring 01/12/2018 | Barclays Capital Group | RUB | 6,547 | 111,100 | 110,528 | 572 | ||||||||||||
Expiring 01/12/2018 | Citigroup Global Markets | RUB | 1,293 | 22,062 | 21,824 | 238 | ||||||||||||
Expiring 01/12/2018 | Citigroup Global Markets | RUB | 1,191 | 20,258 | 20,115 | 143 | ||||||||||||
Expiring 01/12/2018 | Citigroup Global Markets | RUB | 771 | 13,154 | 13,008 | 146 | ||||||||||||
Expiring 01/12/2018 | Citigroup Global Markets | RUB | 631 | 10,742 | 10,661 | 81 | ||||||||||||
Expiring 01/12/2018 | JPMorgan Chase | RUB | 718 | 12,347 | 12,129 | 218 | ||||||||||||
Expiring 01/12/2018 | UBS AG | RUB | 1,046 | 17,951 | 17,659 | 292 | ||||||||||||
Singapore Dollar, | ||||||||||||||||||
Expiring 11/13/2017 | Citigroup Global Markets | SGD | 341 | 251,600 | 250,198 | 1,402 | ||||||||||||
Expiring 11/13/2017 | Citigroup Global Markets | SGD | 204 | 150,000 | 149,748 | 252 | ||||||||||||
Expiring 11/13/2017 | Citigroup Global Markets | SGD | 32 | 23,949 | 23,737 | 212 | ||||||||||||
Expiring 11/13/2017 | JPMorgan Chase | SGD | 81 | 59,379 | 59,468 | (89 | ) | |||||||||||
Expiring 11/13/2017 | Morgan Stanley | SGD | 1,480 | 1,086,803 | 1,085,507 | 1,296 | ||||||||||||
Expiring 11/13/2017 | UBS AG | SGD | 222 | 163,977 | 163,245 | 732 | ||||||||||||
South African Rand, | ||||||||||||||||||
Expiring 11/10/2017 | Bank of America | ZAR | 218 | 16,188 | 15,421 | 767 | ||||||||||||
Expiring 11/10/2017 | UBS AG | ZAR | 245 | 17,865 | 17,270 | 595 | ||||||||||||
Expiring 11/10/2017 | UBS AG | ZAR | 136 | 9,975 | 9,605 | 370 | ||||||||||||
Expiring 12/15/2017 | Bank of America | ZAR | 1,269 | 89,280 | 89,022 | 258 | ||||||||||||
Expiring 12/15/2017 | Citigroup Global Markets | ZAR | 1,304 | 95,469 | 91,498 | 3,971 | ||||||||||||
Expiring 12/15/2017 | Citigroup Global Markets | ZAR | 121 | 9,006 | 8,479 | 527 | ||||||||||||
Expiring 12/15/2017 | Goldman Sachs & Co. | ZAR | 4,372 | 319,741 | 306,743 | 12,998 | ||||||||||||
Expiring 12/15/2017 | JPMorgan Chase | ZAR | 202 | 14,605 | 14,186 | 419 | ||||||||||||
Expiring 12/15/2017 | UBS AG | ZAR | 412 | 30,669 | 28,890 | 1,779 | ||||||||||||
See Notes to Financial Statements.
| Prudential Emerging Markets Debt Local Currency Fund | 33 |
Schedule of Investments (continued)
as of October 31, 2017
Forward foreign currency exchange contracts outstanding at October 31, 2017 (continued):
Sale Contracts | Counterparty | Notional Amount (000) | Value at Settlement Date | Current Value | Unrealized Appreciation (Depreciation) | |||||||||||||
OTC forward foreign currency exchange contracts (cont’d.): |
| |||||||||||||||||
South African Rand, (cont’d.) | ||||||||||||||||||
Expiring 12/15/2017 | UBS AG | ZAR | 412 | $ | 30,669 | $ | 28,890 | $ | 1,779 | |||||||||
Expiring 12/15/2017 | UBS AG | ZAR | 375 | 27,103 | 26,280 | 823 | ||||||||||||
Expiring 12/15/2017 | UBS AG | ZAR | 304 | 21,310 | 21,303 | 7 | ||||||||||||
South Korean Won, | ||||||||||||||||||
Expiring 11/17/2017 | Citigroup Global Markets | KRW | 431,498 | 379,022 | 385,174 | (6,152 | ) | |||||||||||
Expiring 11/17/2017 | Citigroup Global Markets | KRW | 97,730 | 86,000 | 87,239 | (1,239 | ) | |||||||||||
Expiring 11/17/2017 | Citigroup Global Markets | KRW | 80,816 | 71,000 | 72,140 | (1,140 | ) | |||||||||||
Swiss Franc, | ||||||||||||||||||
Expiring 01/26/2018 | Bank of America | CHF | 44 | 45,108 | 44,799 | 309 | ||||||||||||
Expiring 01/26/2018 | JPMorgan Chase | CHF | 44 | 45,108 | 44,797 | 311 | ||||||||||||
Expiring 01/26/2018 | UBS AG | CHF | 89 | 90,084 | 89,596 | 488 | ||||||||||||
Thai Baht, | ||||||||||||||||||
Expiring 11/10/2017 | Citigroup Global Markets | THB | 3,834 | 115,983 | 115,409 | 574 | ||||||||||||
Expiring 11/10/2017 | Citigroup Global Markets | THB | 2,899 | 86,971 | 87,266 | (295 | ) | |||||||||||
Expiring 11/10/2017 | Citigroup Global Markets | THB | 2,718 | 82,153 | 81,833 | 320 | ||||||||||||
Expiring 11/10/2017 | Citigroup Global Markets | THB | 559 | 16,831 | 16,825 | 6 | ||||||||||||
Expiring 11/10/2017 | Citigroup Global Markets | THB | 538 | 16,219 | 16,181 | 38 | ||||||||||||
Expiring 11/10/2017 | Citigroup Global Markets | THB | 515 | 15,570 | 15,517 | 53 | ||||||||||||
Expiring 11/10/2017 | Citigroup Global Markets | THB | 506 | 15,222 | 15,234 | (12 | ) | |||||||||||
Expiring 11/10/2017 | Citigroup Global Markets | THB | 381 | 11,495 | 11,475 | 20 | ||||||||||||
Expiring 11/10/2017 | Citigroup Global Markets | THB | 381 | 11,514 | 11,468 | 46 | ||||||||||||
Expiring 11/10/2017 | Citigroup Global Markets | THB | 285 | 8,615 | 8,566 | 49 | ||||||||||||
Expiring 11/10/2017 | UBS AG | THB | 10,945 | 331,094 | 329,476 | 1,618 | ||||||||||||
Turkish Lira, | ||||||||||||||||||
Expiring 12/15/2017 | Citigroup Global Markets | TRY | 383 | 105,315 | 99,492 | 5,823 | ||||||||||||
Expiring 12/15/2017 | Citigroup Global Markets | TRY | 31 | 8,256 | 7,944 | 312 | ||||||||||||
Expiring 12/15/2017 | Goldman Sachs & Co. | TRY | 223 | 57,264 | 57,894 | (630 | ) | |||||||||||
Expiring 12/15/2017 | Hong Kong & Shanghai Bank | TRY | 3 | 716 | 696 | 20 | ||||||||||||
Expiring 12/15/2017 | JPMorgan Chase | TRY | 93 | 24,617 | 24,149 | 468 | ||||||||||||
Expiring 12/15/2017 | UBS AG | TRY | 581 | 154,057 | 151,126 | 2,931 | ||||||||||||
Expiring 12/15/2017 | UBS AG | TRY | 134 | 35,000 | 34,870 | 130 | ||||||||||||
Expiring 12/15/2017 | UBS AG | TRY | 127 | 35,000 | 33,149 | 1,851 | ||||||||||||
Expiring 12/15/2017 | UBS AG | TRY | 74 | 19,633 | 19,137 | 496 | ||||||||||||
Expiring 12/15/2017 | UBS AG | TRY | 59 | 15,245 | 15,248 | (3 | ) | |||||||||||
Expiring 12/15/2017 | UBS AG | TRY | 45 | 12,191 | 11,804 | 387 | ||||||||||||
Expiring 12/15/2017 | UBS AG | TRY | 37 | 9,992 | 9,734 | 258 | ||||||||||||
|
|
|
|
|
| |||||||||||||
| $ | 14,824,242 | $ | 14,681,267 | $ | 142,975 | |||||||||||||
|
|
|
|
|
| |||||||||||||
| $ | (154,108 | ) | ||||||||||||||||
|
| |||||||||||||||||
See Notes to Financial Statements.
| 34 |
Cross currency exchange contracts outstanding at October 31, 2017:
Settlement | Type | Notional Amount (000) | In Exchange For (000) | Unrealized Appreciation (Depreciation) | Counterparty | |||||||||||||||||
OTC cross currency exchange contracts: | ||||||||||||||||||||||
| Expiring 01/26/2018 | Buy | CHF | 88 | EUR | 76 | $ | (353 | ) | UBS AG | |||||||||||||
| Expiring 04/06/2018 | Buy | ZAR | 1,369 | EUR | 86 | (6,822 | ) | Goldman Sachs & Co. | ||||||||||||||
| Expiring 04/06/2018 | Buy | BRL | 450 | EUR | 124 | (10,812 | ) | Citigroup Global Markets | ||||||||||||||
|
| |||||||||||||||||||||
| $ | (17,987 | ) | ||||||||||||||||||||
|
| |||||||||||||||||||||
Interest rate swap agreements outstanding at October 31, 2017:
Notional | Termination Date | Fixed Rate | Floating Rate | Value at Trade Date | Value at October 31, 2017 | Unrealized Appreciation (Depreciation) | ||||||||||||||||||||
Centrally cleared swap agreements: | ||||||||||||||||||||||||||
| MXN | 14,650 | 06/04/25 | 6.470%(M) | | 28 Day Mexican Interbank Rate(2)(M) | | $ | 12 | $ | (40,721 | ) | $ | (40,733 | ) | ||||||||||||
| MXN | 3,400 | 01/05/26 | 6.260%(M) | | 28 Day Mexican Interbank Rate(1)(M) | | 9 | 12,585 | 12,576 | |||||||||||||||||
|
|
|
|
|
| |||||||||||||||||||||
| $ | 21 | $ | (28,136 | ) | $ | (28,157 | ) | |||||||||||||||||||
|
|
|
|
|
| |||||||||||||||||||||
Notional | Termination Date | Fixed Rate | Floating Rate | Fair Value | Upfront Premiums Paid (Received) | Unrealized Appreciation (Depreciation) | Counterparty | |||||||||||||||||||
OTC swap agreements: | ||||||||||||||||||||||||||
| MYR | 1,650 | 05/20/21 | 3.770%(Q) | 3 Month KLIBOR(2)(Q) | $ | 451 | $ | — | $ | 451 | JPMorgan Chase | |||||||||||||||
| THB | 9,000 | 02/28/26 | 2.300%(S) | 6 Month BKIBOR(2)(S) | 1,584 | — | 1,584 | JPMorgan Chase | ||||||||||||||||||
|
|
|
|
|
| |||||||||||||||||||||
| $ | 2,035 | $ | — | $ | 2,035 | |||||||||||||||||||||
|
|
|
|
|
| |||||||||||||||||||||
Cash of $170,000 has been segregated with Citigroup Global Markets to cover requirements for open centrally cleared swap contracts at October 31, 2017.
| (1) | The Series pays the fixed rate and receives the floating rate. |
| (2) | The Series pays the floating rate and receives the fixed rate. |
Fair Value Measurements:
Various inputs are used in determining the value of the Series’ investments. These inputs are summarized in the three broad levels listed below.
Level 1—unadjusted quoted prices generally in active markets for identical securities.
See Notes to Financial Statements.
| Prudential Emerging Markets Debt Local Currency Fund | 35 |
Schedule of Investments (continued)
as of October 31, 2017
Level 2—quoted prices for similar securities, interest rates and yield curves, prepayment speeds, foreign currency exchange rates and other observable inputs.
Level 3—unobservable inputs for securities valued in accordance with Board approved fair valuation procedures.
The following is a summary of the inputs used as of October 31, 2017 in valuing such portfolio securities:
| Level 1 | Level 2 | Level 3 | ||||||||||
Investments in Securities |
| |||||||||||
Foreign Bonds |
| |||||||||||
Argentina | $ | — | $ | 985,885 | $ | — | ||||||
Brazil | — | 4,004,061 | — | |||||||||
Colombia | — | 1,468,082 | — | |||||||||
Czech Republic | — | 522,787 | — | |||||||||
Ecuador | — | 226,000 | — | |||||||||
Egypt | — | 224,186 | — | |||||||||
El Salvador | — | 103,750 | — | |||||||||
Ghana | — | 225,760 | — | |||||||||
Greece | — | 116,280 | — | |||||||||
Hungary | — | 395,482 | — | |||||||||
Indonesia | — | 3,424,668 | — | |||||||||
Iraq | — | 200,385 | — | |||||||||
Kazakhstan | — | 141,787 | — | |||||||||
Lebanon | — | 148,836 | — | |||||||||
Malaysia | — | 1,411,798 | — | |||||||||
Mexico | — | 3,448,262 | — | |||||||||
Mongolia | — | 234,846 | — | |||||||||
Nigeria | — | 199,631 | — | |||||||||
Peru | — | 536,849 | — | |||||||||
Poland | — | 1,476,057 | — | |||||||||
Romania | — | 336,463 | — | |||||||||
Russia | — | 1,995,996 | — | |||||||||
Singapore | — | 374,517 | — | |||||||||
South Africa | — | 2,675,076 | — | |||||||||
South Korea | — | 309,929 | — | |||||||||
Thailand | — | 1,515,586 | — | |||||||||
Turkey | — | 2,195,363 | — | |||||||||
Ukraine | — | 352,673 | — | |||||||||
Uruguay | — | 64,886 | — | |||||||||
Affiliated Mutual Fund | 481,154 | — | — | |||||||||
Options Purchased | — | 100,094 | — | |||||||||
Options Written | — | (35,624 | ) | — | ||||||||
See Notes to Financial Statements.
| 36 |
| Level 1 | Level 2 | Level 3 | ||||||||||
Investments in Securities (continued) |
| |||||||||||
Other Financial Instruments* |
| |||||||||||
OTC Forward Foreign Currency Exchange Contracts | $ | — | $ | (154,108 | ) | $ | — | |||||
OTC Cross Currency Exchange Contracts | — | (17,987 | ) | — | ||||||||
Centrally Cleared Interest Rate Swap Agreements | — | (28,157 | ) | — | ||||||||
OTC Interest Rate Swap Agreements | — | 2,035 | — | |||||||||
|
|
|
|
|
| |||||||
Total | $ | 481,154 | $ | 29,182,134 | $ | — | ||||||
|
|
|
|
|
| |||||||
| * | Other financial instruments are derivative instruments not reflected in the Schedule of Investments, such as futures, forwards and centrally cleared swap contracts, which are recorded at the unrealized appreciation (depreciation) on the instrument, and OTC swap contracts which are recorded at fair value. |
During the period, there were no transfers between Level 1, Level 2 and Level 3 to report.
Industry Classification:
The industry classification of investments and other assets in excess of liabilities shown as a percentage of net assets as of October 31, 2017 were as follows (unaudited):
Foreign Government Obligations | 86.7 | % | ||
Oil & Gas | 3.2 | |||
Banks | 1.7 | |||
Affiliated Mutual Fund | 1.6 | |||
Sovereign Bonds | 1.5 | |||
Telecommunications | 1.2 | |||
Electric | 0.8 | % | ||
Options Purchased | 0.3 | |||
|
| |||
| 97.0 | ||||
Options Written | (0.1 | ) | ||
Other assets in excess of liabilities | 3.1 | |||
|
| |||
| 100.0 | % | |||
|
|
Effects of Derivative Instruments on the Financial Statements and Primary Underlying Risk Exposure:
The Series invested in derivative instruments during the reporting period. The primary types of risk associated with these derivative instruments are foreign exchange contracts risk and interest rate contracts risk. The effect of such derivative instruments on the Series’ financial position and financial performance as reflected in the Statement of Assets and Liabilities and Statement of Operations is presented in the summary below.
Fair values of derivative instruments as of October 31, 2017 as presented in the Statement of Assets and Liabilities:
Derivatives not accounted | Asset Derivatives | Liability Derivatives | ||||||||
Balance Sheet Location | Fair Value | Balance Sheet | Fair Value | |||||||
| Foreign exchange contracts | — | — | Unrealized depreciation on OTC cross currency exchange contracts | $ | 17,987 | |||||
See Notes to Financial Statements.
| Prudential Emerging Markets Debt Local Currency Fund | 37 |
Schedule of Investments (continued)
as of October 31, 2017
Derivatives not accounted | Asset Derivatives | Liability Derivatives | ||||||||||
Balance Sheet | Fair Value | Balance Sheet | Fair Value | |||||||||
| Foreign exchange contracts | Unrealized appreciation on OTC forward foreign currency exchange contracts | $ | 185,120 | Unrealized depreciation on OTC forward foreign currency exchange contracts | $ | 339,228 | ||||||
| Foreign exchange contracts | Unaffiliated investments | 100,094 | Options written outstanding, at value | 35,624 | ||||||||
| Interest rate contracts | Due from/to broker—variation margin swaps | 12,576 | * | Due from/to broker—variation margin swaps | 40,733 | * | ||||||
| Interest rate contracts | Unrealized appreciation on OTC swap agreements | 2,035 | — | — | ||||||||
|
|
|
| |||||||||
Total | $ | 299,825 | $ | 433,572 | ||||||||
|
|
|
| |||||||||
| * | Includes cumulative appreciation (depreciation) as reported in the schedule of open futures and centrally cleared swap contracts. Only unsettled variation margin receivable (payable) is reported within the Statement of Assets and Liabilities. |
The effects of derivative instruments on the Statement of Operations for the year ended October 31, 2017 are as follows:
Amount of Realized Gain (Loss) on Derivatives Recognized in Income | ||||||||||||
Derivatives not accounted | Forward & Cross Currency Contracts | Swaps | Total | |||||||||
Foreign exchange contracts | $ | 512,483 | $ | — | $ | 512,483 | ||||||
Interest rate contracts | — | (25,159 | ) | (25,159 | ) | |||||||
|
|
|
|
|
| |||||||
Total | $ | 512,483 | $ | (25,159 | ) | $ | 487,324 | |||||
|
|
|
|
|
| |||||||
Change in Unrealized Appreciation (Depreciation) on Derivatives Recognized in Income | ||||||||||||||||||||
Derivatives not accounted | Options Purchased(1) | Options Written | Forward & Cross Currency Contracts | Swaps | Total | |||||||||||||||
Foreign exchange contracts | $ | 8,301 | $ | 20,917 | $ | 8,641 | $ | — | $ | 37,859 | ||||||||||
Interest rate contracts | — | — | — | (36,254 | ) | (36,254 | ) | |||||||||||||
|
|
|
|
|
|
|
|
|
| |||||||||||
Total | $ | 8,301 | $ | 20,917 | $ | 8,641 | $ | (36,254 | ) | $ | 1,605 | |||||||||
|
|
|
|
|
|
|
|
|
| |||||||||||
| (1) | Included in net change in unrealized appreciation (depreciation) on investments in the Statement of Operations. |
See Notes to Financial Statements.
| 38 |
For the year ended October 31, 2017, the Series average volume of derivative activities is as follows:
Options Purchased(1) | Options Written(4) | Forward Foreign Currency Exchange Contracts— Purchased(3) | Forward Foreign Currency Exchange Contracts— Sold(3) | Cross Currency Exchange Contracts(2) | Interest Rate Swap Agreements(4) | |||||||||||||||||
| $ | 55,076 | $ | 1,407,589 | $ | 21,498,731 | $ | 16,098,970 | $ | 819,522 | $ | 2,175,726 | |||||||||||
| (1) | Cost. |
| (2) | Value at Trade Date. |
| (3) | Value at Settlement Date. |
| (4) | Notional Amount in USD. |
Financial Instruments/Transactions—Summary of Offsetting and Netting Arrangements:
The Series invested in OTC derivatives during the reporting period that are either offset in accordance with current requirements or are subject to enforceable master netting arrangements or similar agreements that permit offsetting. The information about offsetting and related netting arrangements for OTC derivatives, where the legal right to set-off exists, is presented in the summary below.
Offsetting of OTC derivative assets and liabilities:
Counterparty | Gross Amounts of Recognized Assets(1) | Gross Amounts of Recognized Liabilities(1) | Net Amounts of Recognized Assets/ (Liabilities) | Collateral Pledged/ (Received)(2) | Net Amount | |||||||||||||||
Bank of America | $ | 1,591 | $ | (747 | ) | $ | 844 | $ | — | $ | 844 | |||||||||
Barclays Capital Group | 9,466 | (21,335 | ) | (11,869 | ) | — | (11,869 | ) | ||||||||||||
BNP Paribas | — | (1,526 | ) | (1,526 | ) | — | (1,526 | ) | ||||||||||||
Citigroup Global Markets | 184,719 | (185,650 | ) | (931 | ) | — | (931 | ) | ||||||||||||
Goldman Sachs & Co. | 47,529 | (51,315 | ) | (3,786 | ) | — | (3,786 | ) | ||||||||||||
Hong Kong & Shanghai Bank | 4,784 | (71,092 | ) | (66,308 | ) | — | (66,308 | ) | ||||||||||||
JPMorgan Chase | 5,620 | (22,611 | ) | (16,991 | ) | — | (16,991 | ) | ||||||||||||
Morgan Stanley | 4,741 | (2,053 | ) | 2,688 | — | 2,688 | ||||||||||||||
UBS AG | 28,799 | (36,510 | ) | (7,711 | ) | — | (7,711 | ) | ||||||||||||
|
|
|
|
|
|
|
|
|
| |||||||||||
| $ | 287,249 | $ | (392,839 | ) | $ | (105,590 | ) | $ | — | $ | (105,590 | ) | ||||||||
|
|
|
|
|
|
|
|
|
| |||||||||||
| (1) | Includes unrealized appreciation/(depreciation) on swaps and forwards, premiums paid/(received) on swap agreements and market value of purchased and written options, as represented on the Statement of Assets and Liabilities. |
| (2) | Collateral amount disclosed by the Series is limited to the Series’ OTC derivative exposure by counterparty. |
See Notes to Financial Statements.
| Prudential Emerging Markets Debt Local Currency Fund | 39 |
Statement of Assets & Liabilities
as of October 31, 2017
Assets |
| |||
Investments at value: | ||||
Unaffiliated investments (cost $30,406,030) | $ | 29,415,975 | ||
Affiliated investments (cost $481,154) | 481,154 | |||
Foreign currency, at value (cost $34,687) | 34,925 | |||
Deposit with broker for centrally cleared swaps | 170,000 | |||
Receivable for investments sold | 745,252 | |||
Dividends and interest receivable | 582,484 | |||
Receivable for Series shares sold | 216,663 | |||
Unrealized appreciation on OTC forward foreign currency exchange contracts | 185,120 | |||
Tax reclaim receivable | 34,883 | |||
Unrealized appreciation on OTC swap agreements | 2,035 | |||
Prepaid expenses | 835 | |||
|
| |||
Total Assets | 31,869,326 | |||
|
| |||
Liabilities | ||||
Payable for investments purchased | 529,955 | |||
Unrealized depreciation on OTC forward foreign currency exchange contracts | 339,228 | |||
Accrued expenses and other liabilities | 37,383 | |||
Options written outstanding, at value (premiums received $56,541) | 35,624 | |||
Foreign capital gains tax liability | 32,215 | |||
Payable for Series shares reacquired | 29,254 | |||
Management fee payable | 20,188 | |||
Unrealized depreciation on OTC cross currency exchange contracts | 17,987 | |||
Dividends payable | 1,464 | �� | ||
Distribution fee payable | 1,348 | |||
Affiliated transfer agent fee payable | 714 | |||
Due to broker—variation margin swaps | 45 | |||
|
| |||
Total Liabilities | 1,045,405 | |||
|
| |||
Net Assets | $ | 30,823,921 | ||
|
| |||
Net assets were comprised of: | ||||
Common stock, at par | $ | 47,640 | ||
Paid-in capital in excess of par | 35,373,407 | |||
|
| |||
| 35,421,047 | ||||
Distributions in excess of net investment income | (380,602 | ) | ||
Accumulated net realized loss on investment and foreign currency transactions | (2,969,519 | ) | ||
Net unrealized depreciation on investments and foreign currencies | (1,247,005 | ) | ||
|
| |||
Net assets, October 31, 2017 | $ | 30,823,921 | ||
|
| |||
See Notes to Financial Statements.
| 40 |
Class A |
| |||
Net asset value and redemption price per share | $ | 6.40 | ||
Maximum sales charge (4.50% of offering price) | 0.30 | |||
|
| |||
Maximum offering price to public | $ | 6.70 | ||
|
| |||
Class C | ||||
Net asset value, offering price and redemption price per share | ||||
($718,022 ÷ 111,086 shares of common stock issued and outstanding) | $ | 6.46 | ||
|
| |||
Class Q | ||||
Net asset value, offering price and redemption price per share | ||||
($981 ÷ 151.541 shares of common stock issued and outstanding) | $ | 6.47 | ||
|
| |||
Class Z | ||||
Net asset value, offering price and redemption price per share | ||||
($27,019,641 ÷ 4,170,778 shares of common stock issued and outstanding) | $ | 6.48 | ||
|
| |||
See Notes to Financial Statements.
| Prudential Emerging Markets Debt Local Currency Fund | 41 |
Statement of Operations
Year Ended October 31, 2017
Net Investment Income (Loss) |
| |||
Income | ||||
Interest income (net of foreign withholding taxes of $60,867) | $ | 1,979,280 | ||
Affiliated dividend income | 8,275 | |||
|
| |||
Total income | 1,987,555 | |||
|
| |||
Expenses | ||||
Management fee | 245,794 | |||
Distribution fee—Class A | 9,096 | |||
Distribution fee—Class C | 6,486 | |||
Custodian and accounting fees | 140,000 | |||
Audit fee | 63,000 | |||
Registration fees | 47,000 | |||
Shareholders’ reports | 28,000 | |||
Legal fees and expenses | 20,000 | |||
Transfer agent’s fees and expenses (including affiliated expense of $4,000) | 11,000 | |||
Directors’ fees | 8,000 | |||
Miscellaneous | 14,416 | |||
|
| |||
Total expenses | 592,792 | |||
Less: Expense reimbursement | (306,650 | ) | ||
|
| |||
Net expenses | 286,142 | |||
|
| |||
Net investment income (loss) | 1,701,413 | |||
|
| |||
Realized And Unrealized Gain (Loss) On Investments And Foreign Currency Transactions | ||||
Net realized gain (loss) on: | ||||
Investment transactions | (929,539 | ) | ||
Swap agreement transactions | (25,159 | ) | ||
Forward and cross currency contract transactions | 512,483 | |||
Foreign currency transactions | (90,164 | ) | ||
|
| |||
| (532,379 | ) | |||
|
| |||
Net change in unrealized appreciation (depreciation) on: | ||||
Investments (net of change in foreign capital gain taxes $31,599) | 555,160 | |||
Options written | 20,917 | |||
Swap agreements | (36,254 | ) | ||
Forward and cross currency contracts | 8,641 | |||
Foreign currencies | (59,978 | ) | ||
|
| |||
| 488,486 | ||||
|
| |||
Net gain (loss) on investment and foreign currency transactions | (43,893 | ) | ||
|
| |||
Net Increase (Decrease) In Net Assets Resulting From Operations | $ | 1,657,520 | ||
|
| |||
See Notes to Financial Statements.
| 42 |
Statement of Changes in Net Assets
| Year Ended October 31, | ||||||||
| 2017 | 2016 | |||||||
Increase (Decrease) in Net Assets | ||||||||
Operations | ||||||||
Net investment income (loss) | $ | 1,701,413 | $ | 1,598,078 | ||||
Net realized gain (loss) on investment and foreign currency transactions | (532,379 | ) | (5,151,186 | ) | ||||
Net change in unrealized appreciation (depreciation) on investments and foreign currencies | 488,486 | 6,265,870 | ||||||
|
|
|
| |||||
Net increase (decrease) in net assets resulting from operations | 1,657,520 | 2,712,762 | ||||||
|
|
|
| |||||
Dividends and Distributions | ||||||||
Dividends from net investment income | ||||||||
Class A | (85,906 | ) | (264 | ) | ||||
Class C | (13,215 | ) | (49 | ) | ||||
Class Q | (23 | ) | — | * | ||||
Class Z | (640,570 | ) | (2,125 | ) | ||||
|
|
|
| |||||
| (739,714 | ) | (2,438 | ) | |||||
|
|
|
| |||||
Tax return of capital distributions | ||||||||
Class A | (127,487 | ) | (193,151 | ) | ||||
Class C | (19,611 | ) | (36,091 | ) | ||||
Class Q | (35 | ) | (53 | ) | ||||
Class Z | (950,614 | ) | (1,553,499 | ) | ||||
|
|
|
| |||||
| (1,097,747 | ) | (1,782,794 | ) | |||||
|
|
|
| |||||
Series share transactions (Net of share conversions) | ||||||||
Net proceeds from shares sold | 7,471,777 | 4,264,777 | ||||||
Net asset value of shares issued in reinvestment of dividends and distributions | 1,804,721 | 1,752,892 | ||||||
Cost of shares reacquired | (10,512,516 | ) | (3,435,696 | ) | ||||
|
|
|
| |||||
Net increase (decrease) in net assets from Series share transactions | (1,236,018 | ) | 2,581,973 | |||||
|
|
|
| |||||
Total increase (decrease) | (1,415,959 | ) | 3,509,503 | |||||
Net Assets: | ||||||||
Beginning of year | 32,239,880 | 28,730,377 | ||||||
|
|
|
| |||||
End of year | $ | 30,823,921 | $ | 32,239,880 | ||||
|
|
|
| |||||
| * | Less than $1. |
See Notes to Financial Statements.
| Prudential Emerging Markets Debt Local Currency Fund | 43 |
Notes to Financial Statements
Prudential World Fund, Inc. (the “Fund”) is registered under the Investment Company Act of 1940, as amended (“1940 Act”), as an open-end management investment company and currently consists of seven investment portfolios: Prudential Emerging Markets Debt Hard Currency Fund and Prudential Emerging Markets Debt Local Currency Fund which are non-diversified funds and Prudential Jennison Emerging Markets Equity Fund, Prudential Jennison Global Infrastructure Fund, Prudential Jennison Global Opportunities Fund, Prudential Jennison International Opportunities Fund and Prudential QMA International Equity Fund which are diversified funds. These financial statements relate to the Prudential Emerging Markets Debt Local Currency Fund (the “Series”).
The investment objective of the Series is total return, through a combination of current income and capital appreciation.
1. Accounting Policies
The Series follows investment company accounting and reporting guidance of the Financial Accounting Standards Board (“FASB”) Accounting Standard Codification Topic 946 Financial Services—Investment Companies. The following accounting policies conform to U.S. generally accepted accounting principles. The Series consistently follows such policies in the preparation of its financial statements.
Securities Valuation: The Series holds securities and other assets and liabilities that are fair valued at the close of each day (generally, 4:00 PM Eastern time) the New York Stock Exchange (“NYSE”) is open for trading. Fair value is the price that would be received to sell an asset or paid to transfer a liability in an orderly transaction between market participants on the measurement date. The Board of Directors (the “Board”) has adopted valuation procedures for security valuation under which fair valuation responsibilities have been delegated to PGIM Investments LLC (“PGIM Investments” or “the Manager”) (formerly known as Prudential Investments LLC). Under the current valuation procedures, the Valuation Committee is responsible for supervising the valuation of portfolio securities and other assets and liabilities. The valuation procedures permit the Series to utilize independent pricing vendor services, quotations from market makers, and alternative valuation methods when market quotations are either not readily available or not deemed representative of fair value. A record of the Valuation Committee’s actions is subject to the Board’s review, approval, and ratification at its next regularly scheduled quarterly meeting.
Various inputs determine how the Series’ investments are valued, all of which are categorized according to the three broad levels (Level 1, 2, or 3) detailed in the Schedule of Investments.
| 44 |
Investments in open-end, non-exchange-traded mutual funds are valued at their net asset values as of the close of the NYSE on the date of valuation. These securities are classified as Level 1 in the fair value hierarchy since they may be purchased or sold at their net asset values on the date of valuation.
Fixed income securities traded in the OTC market are generally classified as Level 2 in the fair value hierarchy. Such fixed income securities are typically valued using the market approach which generally involves obtaining data from an approved independent third-party vendor source. The Series utilizes the market approach as the primary method to value securities when market prices of identical or comparable instruments are available. The third-party vendors’ valuation techniques used to derive the evaluated bid price are based on evaluating observable inputs, including but not limited to, yield curves, yield spreads, credit ratings, deal terms, tranche level attributes, default rates, cash flows, prepayment speeds, broker/dealer quotations and reported trades. Certain Level 3 securities are also valued using the market approach when obtaining a single broker quote or when utilizing recent transaction prices for identical or comparable securities. During the reporting period, there were no changes to report with respect to the valuation approach and/or valuation techniques discussed above.
OTC derivative instruments are generally classified as Level 2 in the fair value hierarchy. Such derivative instruments are typically valued using the market approach and/or income approach which generally involves obtaining data from an approved independent third-party vendor source. The Series utilizes the market approach when quoted prices in broker-dealer markets are available but also includes consideration of alternative valuation approaches, including the income approach. In the absence of reliable market quotations, the income approach is typically utilized for purposes of valuing OTC derivatives such as interest rate swaps based on a discounted cash flow analysis whereby the value of the instrument is equal to the present value of its future cash inflows or outflows. Such analysis includes projecting future cash flows and determining the discount rate (including the present value factors that affect the discount rate) used to discount the future cash flows. In addition, the third-party vendors’ valuation techniques used to derive the evaluated OTC derivative price is based on evaluating observable inputs, including but not limited to, underlying asset prices, indices, spreads, interest rates and exchange rates. Certain OTC derivatives may be classified as Level 3 when valued using the market approach by obtaining a single broker quote or when utilizing unobservable inputs in the income approach. During the reporting period, there were no changes to report with respect to the valuation approach and/or valuation techniques discussed above.
Centrally cleared swaps listed or traded on a multilateral or trade facility platform, such as a registered exchange, are generally valued at the daily settlement price determined by the respective exchange. These securities are classified as Level 2 in the fair value hierarchy, as the daily settlement price is not public.
| Prudential Emerging Markets Debt Local Currency Fund | 45 |
Notes to Financial Statements (continued)
Securities and other assets that cannot be priced according to the methods described above are valued based on pricing methodologies approved by the Board. In the event that unobservable inputs are used when determining such valuations, the securities will be classified as Level 3 in the fair value hierarchy.
When determining the fair value of securities, some of the factors influencing the valuation include: the nature of any restrictions on disposition of the securities; assessment of the general liquidity of the securities; the issuer’s financial condition and the markets in which it does business; the cost of the investment; the size of the holding and the capitalization of the issuer; the prices of any recent transactions or bids/offers for such securities or any comparable securities; any available analyst media or other reports or information deemed reliable by the investment manager regarding the issuer or the markets or industry in which it operates. Using fair value to price securities may result in a value that is different from a security’s most recent closing price and from the price used by other unaffiliated mutual funds to calculate their net asset values.
Restricted and Illiquid Securities: Subject to guidelines adopted by the Board, the Series may invest up to 15% of its net assets in illiquid securities, including those which are restricted as to disposition under securities law (“restricted securities”). Restricted securities are valued pursuant to the valuation procedures noted above. Illiquid securities are those that, because of the absence of a readily available market or due to legal or contractual restrictions on resale, cannot be sold within seven days in the ordinary course of business at approximately the amount at which the Series has valued the investment. Therefore, the Series may find it difficult to sell illiquid securities at the time considered most advantageous by its Subadviser and may incur expenses that would not be incurred in the sale of securities that were freely marketable. Certain securities that would otherwise be considered illiquid because of legal restrictions on resale to the general public may be traded among qualified institutional buyers under Rule 144A of the Securities Act of 1933. These Rule 144A securities, as well as commercial paper that is sold in private placements under Section 4(2) of the Securities Act, may be deemed liquid by the Series’ Subadviser under the guidelines adopted by the Directors of the Series. However, the liquidity of the Series’ investments in Rule 144A securities could be impaired if trading does not develop or declines.
Foreign Currency Translation: The books and records of the Series are maintained in U.S. dollars. Foreign currency amounts are translated into U.S. dollars on the following basis:
(i) market value of investment securities, other assets and liabilities—at the current rates of exchange;
(ii) purchases and sales of investment securities, income and expenses—at the rates of exchange prevailing on the respective dates of such transactions.
| 46 |
Although the net assets of the Series are presented at the foreign exchange rates and market values at the close of the period, the Series does not generally isolate that portion of the results of operations arising as a result of changes in the foreign exchange rates from the fluctuations arising from changes in the market prices of long-term portfolio securities held at the end of the period. Similarly, the Series does not isolate the effect of changes in foreign exchange rates from the fluctuations arising from changes in the market prices of long-term portfolio securities sold during the period. Accordingly, holding period realized foreign currency gains (losses) are included in the reported net realized gains (losses) on investment transactions.
Net realized gains (losses) on foreign currency transactions represent net foreign exchange gains (losses) from the disposition of holdings of foreign currencies, currency gains (losses) realized between the trade and settlement dates on securities transactions, and the difference between the amounts of interest, dividends and foreign withholding taxes recorded on the Series’ books and the U.S. dollar equivalent amounts actually received or paid. Net unrealized currency gains (losses) from valuing foreign currency denominated assets and liabilities (other than investments) at period end exchange rates are reflected as a component of net unrealized appreciation (depreciation) on foreign currencies.
Forward and Cross Currency Contracts: A forward currency contract is a commitment to purchase or sell a foreign currency at a future date at a negotiated forward rate. The Series enters into forward currency contracts in order to hedge its exposure to changes in foreign currency exchange rates on its foreign portfolio holdings or specific receivables and payables denominated in a foreign currency and to gain exposure to certain currencies. The contracts are valued daily at current forward exchange rates and any unrealized gain (loss) is included in net unrealized appreciation (depreciation) on investments and foreign currencies. Gain (loss) is realized on the settlement date of the contract equal to the difference between the settlement value of the original and negotiated forward contracts. This gain (loss), if any, is included in net realized gain (loss) on forward and cross currency contract transactions. Risks may arise upon entering into these contracts from the potential inability of the counterparties to meet the terms of their contracts. Forward currency contracts involve risks from currency exchange rate and credit risk in excess of the amounts reflected on the Statement of Assets and Liabilities. The Series’ maximum risk of loss from counterparty credit risk is the net value of the cash flows to be received from the counterparty at the end of the contract’s life. A cross currency contract is a forward contract where a specified amount of one foreign currency will be exchanged for a specified amount of another foreign currency.
Options: The Series purchased or wrote options in order to hedge against adverse market movements or fluctuations in value caused by changes in prevailing interest rates, value of equities or foreign currency exchange rates with respect to securities or financial instruments which the Series currently owns or intends to purchase. The Series may also use options to gain additional market exposure. The Series’ principal reason for writing options is to realize, through receipt of premiums, a greater current return than would be realized on the underlying security alone. When the Series purchases an option, it pays a
| Prudential Emerging Markets Debt Local Currency Fund | 47 |
Notes to Financial Statements (continued)
premium and an amount equal to that premium is recorded as an asset. When the Series writes an option, it receives a premium and an amount equal to that premium is recorded as a liability. The asset or liability is adjusted daily to reflect the current market value of the option. If an option expires unexercised, the Series realizes a gain (loss) to the extent of the premium received or paid. If an option is exercised, the premium received or paid is recorded as an adjustment to the proceeds from the sale or the cost of the purchase in determining whether the Series has realized a gain (loss). The difference between the premium and the amount received or paid at the closing of a purchase or sale transaction is also treated as a realized gain (loss). Gain (loss) on purchased options is included in net realized gain (loss) on investment transactions. Gain (loss) on written options is presented separately as net realized gain (loss) on options written transactions.
The Series, as writer of an option, may have no control over whether the underlying securities or financial instruments may be sold (called) or purchased (put). As a result, the Series bears the market risk of an unfavorable change in the price of the security or financial instrument underlying the written option. The Series, as purchaser of an OTC option, bears the risk of the potential inability of the counterparties to meet the terms of their contracts. With exchange-traded options contracts, there is minimal counterparty credit risk to the Series since the exchanges’ clearinghouse acts as counterparty to all exchange-traded options and guarantees the options contracts against default.
When the Series writes an option on a swap, an amount equal to any premium received by the Series is recorded as a liability and is subsequently adjusted to the current market value of the written option on the swap. If a call option on a swap is exercised, the Series becomes obligated to pay a fixed interest rate (noted as the strike price) and receive a variable interest rate on a notional amount. If a put option on a swap is exercised, the Series becomes obligated to pay a variable interest rate and receive a fixed interest rate (noted as the strike price) on a notional amount. Premiums received from writing options on swaps that expire or are exercised are treated as realized gains upon the expiration or exercise of such options on swaps. The risk associated with writing put and call options on swaps is that the Series will be obligated to be party to a swap agreement if an option on a swap is exercised.
Swap Agreements: The Series may enter into credit default, interest rate and other types of swap agreements. A swap agreement is an agreement to exchange the return generated by one instrument for the return generated by another instrument. Swap agreements are negotiated in the OTC market and may be executed either directly with counterparty (“OTC-traded”) or through a central clearing facility, such as a registered exchange. Swap agreements are valued daily at current market value and any change in value is included in the net unrealized appreciation (depreciation) on swap agreements. Centrally cleared swaps pay or receive an amount known as “variation margin”, based on daily changes in the valuation of the swap contract. Any upfront premiums paid and received are shown as swap
| 48 |
premiums paid and swap premiums received in the Statement of Assets and Liabilities. Risk of loss may exceed amounts recognized on the Statement of Assets and Liabilities. Swap agreements outstanding at period end, if any, are listed on the Schedule of Investments.
Interest Rate Swaps: Interest rate swaps represent an agreement between counterparties to exchange cash flows based on the difference between two interest rates, applied to a notional principal amount for a specified period. The Series is subject to interest rate risk exposure in the normal course of pursuing its investment objectives. The Series used interest rate swaps to maintain its ability to generate steady cash flow by receiving a stream of fixed-rate payments and to increase exposure to prevailing market rates by receiving floating rate payments. The Series’ maximum risk of loss from counterparty credit risk is the discounted net present value of the cash flows to be received from the counterparty over the contract’s remaining life.
Master Netting Arrangements: The Series is subject to various Master Agreements, or netting arrangements, with select counterparties. These are agreements which a subadviser may have negotiated and entered into on behalf of the Series. A master netting arrangement between the Series and the counterparty permits the Series to offset amounts payable by the Series to the same counterparty against amounts to be received; and by the receipt of collateral from the counterparty by the Series to cover the Series’ exposure to the counterparty. However, there is no assurance that such mitigating factors are easily enforceable. In addition to master netting arrangements, the right to set-off exists when all the conditions are met such that each of the parties owes the other determinable amounts, the reporting party has the right to set-off the amount owed with the amount owed by the other party, the reporting party intends to set-off and the right of set-off is enforceable by law. During the reporting period, there was no intention to settle on a net basis and all amounts are presented on a gross basis on the Statement of Assets and Liabilities.
The Fund, on behalf of the Series, is a party to ISDA (International Swaps and Derivatives Association, Inc.) Master Agreements with certain counterparties that govern OTC derivative and foreign exchange contracts entered into from time to time. The Master Agreements may contain provisions regarding, among other things, the parties’ general obligations, representations, agreements, collateral requirements, events of default and early termination. With respect to certain counterparties, in accordance with the terms of the Master Agreements, collateral posted to the Series is held in a segregated account by the Series’s custodian and with respect to those amounts which can be sold or re-pledged, is presented in the Schedule of Investments. Collateral pledged by the Series is segregated by the Series’s custodian and identified in the Schedule of Investments. Collateral can be in the form of cash or debt securities issued by the U.S. Government or related agencies or other securities as agreed to by the Series and the applicable counterparty. Collateral requirements are determined based on the Series’s net position with each counterparty. Termination events applicable to the Series may occur upon a decline in the Series’s net assets below a specified threshold over a certain period of time. Termination events applicable to counterparties may occur upon a decline in the counterparty’s long-term and short-term credit ratings below a specified level. In each case, upon occurrence, the other
| Prudential Emerging Markets Debt Local Currency Fund | 49 |
Notes to Financial Statements (continued)
party may elect to terminate early and cause settlement of all derivative and foreign exchange contracts outstanding, including the payment of any losses and costs resulting from such early termination, as reasonably determined by the terminating party. Any decision by one or more of the Series’s counterparties to elect early termination could impact the Series’s future derivative activity.
In addition to each instrument’s primary underlying risk exposure (e.g. interest rate, credit, equity or foreign exchange, etc.), swap agreements involve, to varying degrees, elements of credit, market and documentation risk. Such risks involve the possibility that no liquid market for these agreements will exist, the counterparty to the agreement may default on its obligation to perform or disagree on the contractual terms of the agreement, and changes in net interest rates will be unfavorable. In connection with these agreements, securities in the portfolio may be identified or received as collateral from the counterparty in accordance with the terms of the respective swap agreements to provide or receive assets of value and to serve as recourse in the event of default or bankruptcy/insolvency of either party. Such OTC derivative agreements include conditions which, when materialized, give the counterparty the right to cause an early termination of the transactions under those agreements. Any election by the counterparty for early termination of the contract(s) may impact the amounts reported on financial statements.
As of October 31, 2017, the Series has not met conditions under such agreements which give the counterparty the right to call for an early termination.
Forward currency contracts, written options and swaps involve elements of both market and credit risk in excess of the amounts reflected on the Statement of Assets and Liabilities. Such risks may be mitigated by engaging in master netting arrangements.
Concentration of Risk: The ability of debt securities issuers (other than those issued or guaranteed by the U.S. Government) held by the Series to meet its obligations may be affected by the economic or political developments in a specific industry, region or country. Foreign security and currency transactions may involve certain considerations and risks not typically associated with those of domestic origin as a result of, among other factors, the possibility of political or economic instability or the level of the governmental supervision and regulation of foreign securities markets.
Securities Transactions and Net Investment Income: Securities transactions are recorded on the trade date. Realized gains (losses) from investment and currency transactions are calculated on the specific identification method. Dividend income is recorded on the ex-date. Interest income, including amortization of premium and accretion of discount on debt securities, as required, is recorded on the accrual basis. Expenses are recorded on an
| 50 |
accrual basis, which may require the use of certain estimates by management that may differ from actual.
Net investment income or loss (other than distribution fees which are charged directly to the respective class and transfer agency fees specific to Class Q shares which are charged to that share class) and unrealized and realized gains (losses) are allocated daily to each class of shares based upon the relative proportion of adjusted net assets of each class at the beginning of the day.
Taxes: It is the Series’ policy to continue to meet the requirements of the Internal Revenue Code applicable to regulated investment companies and to distribute all of its taxable net investment income and capital gains, if any, to its shareholders. Therefore, no federal income tax provision is required. Withholding taxes on foreign dividends, interest and capital gains, if any, are recorded, net of reclaimable amounts, at the time the related income is earned.
Dividends and Distributions: The Series expects to pay dividends from net investment income monthly and distributions from net realized capital gains, if any, annually. Dividends and distributions to shareholders, which are determined in accordance with federal income tax regulations and which may differ from generally accepted accounting principles, are recorded on the ex-date. Permanent book/tax differences relating to income and gain (loss) are reclassified amongst undistributed net investment income, accumulated net realized gain (loss) and paid-in capital in excess of par, as appropriate.
Estimates: The preparation of financial statements requires management to make estimates and assumptions that affect the reported amounts and disclosures in the financial statements. Actual results could differ from those estimates.
2. Agreements
The Fund, on behalf of the Series, has a management agreement with PGIM Investments. Pursuant to this agreement, PGIM Investments has responsibility for all investment advisory services and supervises the subadviser’s performance of such services. PGIM Investments has entered into a subadvisory agreement with PGIM, Inc., which provides subadvisory services to the Series through its PGIM Fixed Income unit. The subadvisory agreement provides that PGIM, Inc. will furnish investment advisory services in connection with the management of the Series. In connection therewith, PGIM, Inc. is obligated to keep certain books and records of the Series. PGIM Investments pays for the services of PGIM, Inc., the cost of compensation of officers of the Series, occupancy and certain clerical and bookkeeping costs of the Series. The Series bears all other costs and expenses.
The management fee paid to PGIM Investments is accrued daily and payable monthly at an annual rate of .80% on average daily net assets up to and including $1 billion; .78% on the next $2 billion of average daily net assets; .76% on the next $2 billion of average daily net assets; .75% on the next $5 billion of average daily net assets; and .74% on average daily
| Prudential Emerging Markets Debt Local Currency Fund | 51 |
Notes to Financial Statements (continued)
net assets exceeding $10 billion. The effective management fee rate before any waivers and/or expense reimbursement was .80% for the year ended October 31, 2017. For the year ended October 31, 2017, the expense reimbursement exceeded the effective management fee.
PGIM Investments has contractually agreed through February 28, 2019 to limit the net annual operating expenses (exclusive of distribution and service (12b-1) fees, taxes (such as income and foreign withholdings taxes, stamp duty and deferred tax expenses), interest, underlying funds, brokerage, extraordinary and certain other expenses such as dividend, broker charges and interest expense on short sales) of each class of shares of the Series to ..88% of the Series’ average daily net assets. Expenses waived/reimbursed by the Manager in accordance with this agreement may be recouped by the Manager within the same fiscal year during which such waiver/reimbursement is made if such recoupment can be realized without exceeding the expense limit in effect at the time of the recoupment for that fiscal year.
The Fund, on behalf of the Series, has a distribution agreement with Prudential Investment Management Services LLC (“PIMS”) who acts as the distributor of the Class A, Class C, Class Q and Class Z shares. The Series compensates PIMS for distributing and servicing the Series’ Class A and Class C, pursuant to plans of distribution (the “Distribution Plans”), regardless of expenses actually incurred by PIMS. The distribution fees are accrued daily and payable monthly. No distribution or service fees are paid to PIMS as distributor of the Class Q and Z shares of the Series.
Pursuant to the Distribution Plans, the Series compensates PIMS for distribution related activities at an annual rate of up to .25% and 1% of the average daily net assets of the Class A and C shares, respectively.
PIMS has advised the Series that it has received $14,160 in front-end sales charges resulting from sales of Class A shares during the year ended October 31, 2017. From these fees, PIMS paid such sales charges to affiliated broker-dealers, which in turn paid commissions to salespersons and incurred other distribution costs.
PIMS has advised the Series that for the year ended October 31, 2017 it received $309 in contingent deferred sales charges imposed upon redemptions by certain Class C shareholders.
PGIM Investments, PGIM, Inc. and PIMS are indirect, wholly-owned subsidiaries of Prudential Financial, Inc. (“Prudential”).
| 52 |
3. Other Transactions with Affiliates
Prudential Mutual Fund Services LLC (“PMFS”), an affiliate of PGIM Investments and an indirect, wholly-owned subsidiary of Prudential, serves as the Series’ transfer agent. Transfer agent’s fees and expenses in the Statement of Operations include certain out-of-pocket expenses paid to non-affiliates, where applicable.
The Series may enter into certain securities purchase or sale transactions under Board approved Rule 17a-7 procedures. Rule 17a-7 is an exemptive rule under the 1940 Act, that permits purchase and sale transactions among affiliated investment companies, or between an investment company and a person that is affiliated solely by reason of having a common (or affiliated) investment adviser, common directors, and/or common officers. Such transactions are subject to ratification by the Board. For the reporting period ended October 31, 2017 no such transactions were entered into by the Series.
The Series may invest its overnight sweep cash in the Prudential Core Ultra Short Bond Fund (the “Core Fund”), a series of Prudential Investment Portfolios 2, registered under the 1940 Act and managed by PGIM Investments. Earnings from the Core Fund are disclosed on the Statement of Operations as “Affiliated dividend income”.
4. Portfolio Securities
The aggregate cost of purchases and proceeds from sales of portfolio securities (excluding short-term investments and U.S. Government securities) for the year ended October 31, 2017 were $53,338,373 and $53,563,771, respectively.
5. Distributions and Tax Information
Distributions to shareholders, which are determined in accordance with federal income tax regulations and which may differ from generally accepted accounting principles, are recorded on the ex-date. In order to present distributions in excess of net investment income, accumulated net realized loss on investment and foreign currency transactions and paid-in capital in excess of par on the Statement of Assets and Liabilities that more closely represent their tax character, certain adjustments have been made to distributions in excess of net investment income, accumulated net realized loss on investment and foreign currency transactions and paid-in capital in excess of par. For the year ended October 31, 2017, the adjustments were to increase distributions in excess of net investment income by $488,816, decrease accumulated net realized loss on investment and foreign currency transactions by $474,399 and increase paid-in capital in excess of par by $14,417 due to the differences in the treatment for book and tax purposes of certain transactions involving foreign currencies, swaps, paydown gains/losses, differences in the treatment of premium amortization and other book to tax differences. Net investment income, net realized gain (loss) on investment and foreign currency transactions and net assets were not affected by this change.
| Prudential Emerging Markets Debt Local Currency Fund | 53 |
Notes to Financial Statements (continued)
For the year ended October 31, 2017, the tax character of dividends paid by the Series were $739,714 of ordinary income and $1,097,747 of tax return of capital. For the year ended October 31, 2016, the tax character of dividends paid by the Series were $2,438 of ordinary income and $1,782,794 of tax return of capital.
As of October 31, 2017, the Series had no undistributed earnings on a tax basis.
The United States federal income tax basis of the Series’ investments and the net unrealized depreciation as of October 31, 2017 were as follows:
Tax Basis | Gross | Gross | Net | |||
| $31,398,612 | $708,304 | $(2,443,628) | $(1,735,324) |
The difference between book basis and tax basis is primarily attributable to the difference in the treatment of amortization of premiums, wash sales, straddle loss deferrals and other cost basis differences between financial and tax accounting.
For federal income tax purposes, the Series had a capital loss carryforward as of October 31, 2017 of approximately $2,856,000 which can be carried forward for an unlimited period. No capital gains distributions are expected to be paid to shareholders until net gains have been realized in excess of such losses.
Management has analyzed the Series’ tax positions taken on federal, state and local income tax returns for all open tax years and has concluded that no provision for income tax is required in the Series’ financial statements for the current reporting period. The Series’ federal, state and local income and federal excise tax returns for tax years for which the applicable statutes of limitations have not expired are subject to examination by the Internal Revenue Service and state departments of revenue.
6. Capital
The Series offers Class A, Class C, Class Q and Class Z shares. Class A shares are sold with a maximum front-end sales charge of 4.50%. Investors who purchase $1 million or more of Class A shares and sell these shares within 12 months of purchase are subject to a contingent deferred sales charge (“CDSC”) of 1%, although they are not subject to an initial sales charge. The Class A CDSC is waived for certain retirement and/or benefit plans. Class C shares are sold with a CDSC of 1% on sales made within 12 months of purchase. A special exchange privilege is also available for shareholders who qualified to purchase Class A shares at net asset value. Class Q and Class Z shares are not subject to any sales or redemption charge and are offered exclusively for sale to a limited group of investors.
| 54 |
Under certain circumstances, an exchange may be made from specified share classes of the Series to one or more other share classes of the Series as presented in the table of transactions in shares of common stock.
The Fund is authorized to issue 4.8 billion shares of common stock, with a par value of $.01 per share, which is divided into seven series. There are 550 million shares authorized for the Series, divided into five classes, designated Class A, Class C, Class Q, Class Z and Class T common stock, each of which consists of 10 million, 50 million, 50 million, 250 million and 190 million authorized shares, respectively. The Series currently does not have any Class T shares outstanding.
As of October 31, 2017, Prudential, through its affiliate entities, including affiliated funds, owned 152 Class Q shares and 3,102,580 Class Z shares of the Series. At reporting period end, three shareholders of record held 86% of the Series’ outstanding shares, of which 66% were held by an affiliate of Prudential.
Transactions in shares of common stock were as follows:
Class A | Shares | Amount | ||||||
Year ended October 31, 2017: | ||||||||
Shares sold | 411,807 | $ | 2,625,583 | |||||
Shares issued in reinvestment of dividends and distributions | 30,171 | 192,867 | ||||||
Shares reacquired | (514,542 | ) | (3,279,092 | ) | ||||
|
|
|
| |||||
Net increase (decrease) in shares outstanding before conversion | (72,564 | ) | (460,642 | ) | ||||
Shares issued upon conversion from other share class(es) | 32,906 | 196,522 | ||||||
Shares reacquired upon conversion into other share class(es) | (98,133 | ) | (619,781 | ) | ||||
|
|
|
| |||||
Net increase (decrease) in shares outstanding | (137,791 | ) | $ | (883,901 | ) | |||
|
|
|
| |||||
Year ended October 31, 2016: | ||||||||
Shares sold | 264,798 | $ | 1,692,459 | |||||
Shares issued in reinvestment of dividends and distributions | 26,404 | 166,092 | ||||||
Shares reacquired | (160,699 | ) | (999,854 | ) | ||||
|
|
|
| |||||
Net increase (decrease) in shares outstanding before conversion | 130,503 | 858,697 | ||||||
Shares reacquired upon conversion into other share class(es) | (24,656 | ) | (157,311 | ) | ||||
|
|
|
| |||||
Net increase (decrease) in shares outstanding | 105,847 | $ | 701,386 | |||||
|
|
|
| |||||
Class C | ||||||||
Year ended October 31, 2017: | ||||||||
Shares sold | 35,784 | $ | 236,548 | |||||
Shares issued in reinvestment of dividends and distributions | 4,923 | 31,728 | ||||||
Shares reacquired | (50,941 | ) | (317,283 | ) | ||||
|
|
|
| |||||
Net increase (decrease) in shares outstanding | (10,234 | ) | $ | (49,007 | ) | |||
|
|
|
| |||||
Year ended October 31, 2016: | ||||||||
Shares sold | 28,487 | $ | 180,763 | |||||
Shares issued in reinvestment of dividends and distributions | 5,373 | 33,925 | ||||||
Shares reacquired | (24,063 | ) | (148,044 | ) | ||||
|
|
|
| |||||
Net increase (decrease) in shares outstanding | 9,797 | $ | 66,644 | |||||
|
|
|
| |||||
| Prudential Emerging Markets Debt Local Currency Fund | 55 |
Notes to Financial Statements (continued)
Class Q | Shares | Amount | ||||||
Year ended October 31, 2017: | ||||||||
Shares issued in reinvestment of dividends and distributions | 9.0 | $ | 58 | |||||
|
|
|
| |||||
Net increase (decrease) in shares outstanding | 9.0 | $ | 58 | |||||
|
|
|
| |||||
Year ended October 31, 2016: | ||||||||
Shares issued in reinvestment of dividends and distributions | 8.0 | $ | 53 | |||||
|
|
|
| |||||
Net increase (decrease) in shares outstanding | 8.0 | $ | 53 | |||||
|
|
|
| |||||
Class Z | ||||||||
Year ended October 31, 2017: | ||||||||
Shares sold | 698,617 | $ | 4,609,646 | |||||
Shares issued in reinvestment of dividends and distributions | 244,834 | 1,580,068 | ||||||
Shares reacquired† | (1,059,507 | ) | (6,916,141 | ) | ||||
|
|
|
| |||||
Net increase (decrease) in shares outstanding before conversion | (116,056 | ) | (726,427 | ) | ||||
Shares issued upon conversion from other share class(es) | 97,078 | 619,781 | ||||||
Shares reacquired upon conversion into other share class(es) | (32,483 | ) | (196,522 | ) | ||||
|
|
|
| |||||
Net increase (decrease) in shares outstanding | (51,461 | ) | $ | (303,168 | ) | |||
|
|
|
| |||||
Year ended October 31, 2016: | ||||||||
Shares sold | 373,514 | $ | 2,391,555 | |||||
Shares issued in reinvestment of dividends and distributions | 244,902 | 1,552,822 | ||||||
Shares reacquired | (357,213 | ) | (2,287,798 | ) | ||||
|
|
|
| |||||
Net increase (decrease) in shares outstanding before conversion | 261,203 | 1,656,579 | ||||||
Shares issued upon conversion from other shares class(es) | 24,432 | 157,311 | ||||||
|
|
| �� | |||||
Net increase (decrease) in shares outstanding | 285,635 | $ | 1,813,890 | |||||
|
|
|
| |||||
| † | Includes affiliated redemptions of 455,235 shares with a value of $3,000,000 for Class Z. |
7. Borrowings
The Fund, on behalf of the Series, along with other affiliated registered investment companies (the “Funds”), is a party to a Syndicated Credit Agreement (“SCA”) with a group of banks. The purpose of the SCA is to provide an alternative source of temporary funding for capital share redemptions. The SCA provides for a commitment of $900 million for the period October 5, 2017 through October 4, 2018. The Funds pay an annualized commitment fee of .15% of the unused portion of the SCA. The Series’ portion of the commitment fee for the unused amount, allocated based upon a method approved by the Board, is accrued daily and paid quarterly. Prior to October 5, 2017, the Funds had another SCA that provided a commitment of $900 million and the Funds paid an annualized commitment fee of .15% of the unused portion of the SCA. The interest on borrowings under the SCAs is paid monthly and at a per annum interest rate based upon a contractual spread plus the higher of (1) the effective federal funds rate, (2) the 1-month LIBOR rate or (3) zero percent.
| 56 |
Other affiliated registered investment companies that are parties to the SCA include portfolios that are subject to a predetermined mathematical formula used to manage certain benefit guarantees offered under variable annuity contracts. The formula may result in large scale asset flows into and out of these portfolios. Consequently, these portfolios may be more likely to utilize the SCA for purposes of funding redemptions. It may be possible for those portfolios to fully exhaust the committed amount of the SCA, thereby requiring the Manager to allocate available funding per a Board-approved methodology designed to treat the Funds in the SCA equitably.
The Series utilized the SCA during the reporting period ended October 31, 2017. The average daily balance for the 9 days that the Series had loans outstanding during the period was $232,889, borrowed at a weighted average interest rate of 2.48%. The maximum loan balance outstanding during the period was $442,000. At October 31, 2017, the Series did not have an outstanding loan balance.
8. Other
At the Fund’s Board meeting in March 2017, the Board approved a change in the methodology of allocating certain expenses, such as Transfer Agent fees (including
sub-transfer agent and networking fees) and Blue Sky fees. PGIM Investments implemented the changes effective November 1, 2017.
| Prudential Emerging Markets Debt Local Currency Fund | 57 |
Financial Highlights
| Class A Shares | ||||||||||||||||||||
| Year Ended October 31, | ||||||||||||||||||||
| 2017 | 2016 | 2015 | 2014 | 2013 | ||||||||||||||||
| Per Share Operating Performance(a): | ||||||||||||||||||||
| Net Asset Value, Beginning of Year | $6.44 | $6.24 | $7.92 | $8.67 | $9.61 | |||||||||||||||
| Income (loss) from investment operations: | ||||||||||||||||||||
| Net investment income (loss) | .35 | .33 | .37 | .49 | .47 | |||||||||||||||
| Net realized and unrealized gain (loss) on investment transactions | (.02 | ) | .23 | (1.64 | ) | (.71 | ) | (.76 | ) | |||||||||||
| Total from investment operations | .33 | .56 | (1.27 | ) | (.22 | ) | (.29 | ) | ||||||||||||
| Less Dividends and Distributions: | ||||||||||||||||||||
| Dividends from net investment income(f) | (.15 | ) | - | (e) | (.06 | ) | (.07 | ) | (.30 | ) | ||||||||||
| Distributions from net realized gains | - | - | - | - | (.05 | ) | ||||||||||||||
| Tax return of capital distributions | (.22 | ) | (.36 | ) | (.35 | ) | (.46 | ) | (.30 | ) | ||||||||||
| Total dividends and distributions | (.37 | ) | (.36 | ) | (.41 | ) | (.53 | ) | (.65 | ) | ||||||||||
| Net asset value, end of year | $6.40 | $6.44 | $6.24 | $7.92 | $8.67 | |||||||||||||||
| Total Return(b): | 5.36% | 9.29% | (16.41)% | (2.47)% | (3.23)% | |||||||||||||||
| Ratios/Supplemental Data: | ||||||||||||||||||||
| Net assets, end of year (000) | $3,085 | $3,990 | $3,208 | $5,991 | $10,862 | |||||||||||||||
| Average net assets (000) | $3,639 | $3,343 | $4,341 | $6,701 | $12,797 | |||||||||||||||
| Ratios to average net assets(c): | ||||||||||||||||||||
| Expenses after advisory fee waivers and/or expense reimbursement | 1.13% | 1.28% | 1.30% | (d) | 1.30% | 1.30% | ||||||||||||||
| Expenses before advisory fee waivers and/or expense reimbursement | 2.15% | 2.33% | 2.39% | (d) | 2.13% | 1.78% | ||||||||||||||
| Net investment income (loss) | 5.42% | 5.20% | 5.32% | (d) | 5.99% | 5.07% | ||||||||||||||
| Portfolio turnover rate | 186% | 196% | 101% | 110% | 102% | |||||||||||||||
| (a) | Calculated based on average shares outstanding during the year. |
| (b) | Total return does not consider the effects of sales loads. Total return is calculated assuming a purchase of a share on the first day and a sale on the last day of each year reported and includes reinvestment of dividends and distributions, if any. Total return may reflect adjustments to conform to generally accepted accounting principles. |
| (c) | Does not include expenses of the underlying funds in which the Series invests. |
| (d) | Effective March 9, 2015, the contractual distribution and service (12b-1) fees were reduced from .30% to .25% of the average daily net assets and the .05% contractual 12b-1 fee waiver was terminated. |
| (e) | Less than $.005. |
| (f) | Dividends from net investment income may include other items that are ordinary income for tax purposes. |
See Notes to Financial Statements.
| 58 |
| Class C Shares | ||||||||||||||||||||
| Year Ended October 31, | ||||||||||||||||||||
| 2017 | 2016 | 2015 | 2014 | 2013 | ||||||||||||||||
| Per Share Operating Performance(a): | ||||||||||||||||||||
| Net Asset Value, Beginning of Year | $6.49 | $6.28 | $7.97 | $8.72 | $9.65 | |||||||||||||||
| Income (loss) from investment operations: | ||||||||||||||||||||
| Net investment income (loss) | .30 | .28 | .32 | .43 | .40 | |||||||||||||||
| Net realized and unrealized gain (loss) on investment transactions | (.01 | ) | .25 | (1.65 | ) | (.71 | ) | (.75 | ) | |||||||||||
| Total from investment operations | .29 | .53 | (1.33 | ) | (.28 | ) | (.35 | ) | ||||||||||||
| Less Dividends and Distributions: | ||||||||||||||||||||
| Dividends from net investment income(e) | (.13 | ) | - | (d) | (.01 | ) | (.01 | ) | (.23 | ) | ||||||||||
| Distributions from net realized gains | - | - | - | - | (.05 | ) | ||||||||||||||
| Tax return of capital distributions | (.19 | ) | (.32 | ) | (.35 | ) | (.46 | ) | (.30 | ) | ||||||||||
| Total dividends and distributions | (.32 | ) | (.32 | ) | (.36 | ) | (.47 | ) | (.58 | ) | ||||||||||
| Net asset value, end of year | $6.46 | $6.49 | $6.28 | $7.97 | $8.72 | |||||||||||||||
| Total Return(b): | 4.66% | 8.61% | (17.00)% | (3.21)% | (3.85)% | |||||||||||||||
| Ratios/Supplemental Data: | ||||||||||||||||||||
| Net assets, end of year (000) | $718 | $787 | $701 | $927 | $1,469 | |||||||||||||||
| Average net assets (000) | $649 | $721 | $789 | $1,207 | $1,585 | |||||||||||||||
| Ratios to average net assets(c): | ||||||||||||||||||||
| Expenses after advisory fee waivers and/or expense reimbursement | 1.88% | 2.03% | 2.05% | 2.05% | 2.05% | |||||||||||||||
| Expenses before advisory fee waivers and/or expense reimbursement | 2.88% | 3.07% | 3.11% | 2.82% | 2.47% | |||||||||||||||
| Net investment income (loss) | 4.63% | 4.40% | 4.52% | 5.17% | 4.26% | |||||||||||||||
| Portfolio turnover rate | 186% | 196% | 101% | 110% | 102% | |||||||||||||||
| (a) | Calculated based on average shares outstanding during the year. |
| (b) | Total return does not consider the effects of sales loads. Total return is calculated assuming a purchase of a share on the first day and a sale on the last day of each year reported and includes reinvestment of dividends and distributions, if any. Total return may reflect adjustments to conform to generally accepted accounting principles. |
| (c) | Does not include expenses of the underlying funds in which the Series invests. |
| (d) | Less than $.005. |
| (e) | Dividends from net investment income may include other items that are ordinary income for tax purposes. |
See Notes to Financial Statements.
| Prudential Emerging Markets Debt Local Currency Fund | 59 |
Financial Highlights (continued)
| Class Q Shares | ||||||||||||||||||||
Year Ended October 31, | ||||||||||||||||||||
| 2017 | 2016 | 2015 | 2014 | 2013 | ||||||||||||||||
| Per Share Operating Performance(a): | ||||||||||||||||||||
| Net Asset Value, Beginning of Year | $6.50 | $6.30 | $7.98 | $8.71 | $9.66 | |||||||||||||||
| Income (loss) from investment operations: | ||||||||||||||||||||
| Net investment income (loss) | .37 | .35 | .39 | .51 | .58 | |||||||||||||||
| Net realized and unrealized gain (loss) on investment transactions | - | (d) | .23 | (1.63 | ) | (.69 | ) | (.86 | ) | |||||||||||
| Total from investment operations | .37 | .58 | (1.24 | ) | (.18 | ) | (.28 | ) | ||||||||||||
| Less Dividends and Distributions: | ||||||||||||||||||||
| Dividends from net investment income(e) | (.16 | ) | - | (d) | (.09 | ) | (.09 | ) | (.32 | ) | ||||||||||
| Distributions from net realized gains | - | - | - | - | (.05 | ) | ||||||||||||||
| Tax return of capital distributions | (.24 | ) | (.38 | ) | (.35 | ) | (.46 | ) | (.30 | ) | ||||||||||
| Total dividends and distributions | (.40 | ) | (.38 | ) | (.44 | ) | (.55 | ) | (.67 | ) | ||||||||||
| Net asset value, end of year | $6.47 | $6.50 | $6.30 | $7.98 | $8.71 | |||||||||||||||
| Total Return(b): | 5.82% | 9.55% | (15.94)% | (1.97)% | (3.06)% | |||||||||||||||
| Ratios/Supplemental Data: | ||||||||||||||||||||
| Net assets, end of year (000) | $1 | $1 | $1 | $1 | $1 | |||||||||||||||
| Average net assets (000) | $1 | $1 | $1 | $1 | $1 | |||||||||||||||
| Ratios to average net assets(c): | ||||||||||||||||||||
| Expenses after advisory fee waivers and/or expense reimbursement | .88% | 1.03% | 1.05% | 1.05% | 1.05% | |||||||||||||||
| Expenses before advisory fee waivers and/or expense reimbursement | 1.83% | 2.06% | 2.01% | 1.69% | 1.39% | |||||||||||||||
| Net investment income (loss) | 5.73% | 5.47% | 5.60% | 6.17% | 6.22% | |||||||||||||||
| Portfolio turnover rate | 186% | 196% | 101% | 110% | 102% | |||||||||||||||
| (a) | Calculated based on average shares outstanding during the year. |
| (b) | Total return is calculated assuming a purchase of a share on the first day and a sale on the last day of each year reported and includes reinvestment of dividends and distributions, if any. Total return may reflect adjustments to conform to generally accepted accounting principles. |
| (c) | Does not include expenses of the underlying funds in which the Series invests. |
| (d) | Less than $.005. |
| (e) | Dividends from net investment income may include other items that are ordinary income for tax purposes. |
See Notes to Financial Statements.
| 60 |
| Class Z Shares | ||||||||||||||||||||
Year Ended October 31, | ||||||||||||||||||||
| 2017 | 2016 | 2015 | 2014 | 2013 | ||||||||||||||||
| Per Share Operating Performance(a): | ||||||||||||||||||||
| Net Asset Value, Beginning of Year | $6.50 | $6.31 | $7.98 | $8.72 | $9.66 | |||||||||||||||
| Income (loss) from investment operations: | ||||||||||||||||||||
| Net investment income (loss) | .36 | .34 | .38 | .51 | .49 | |||||||||||||||
| Net realized and unrealized gain (loss) on investment transactions | .01 | .23 | (1.62 | ) | (.70 | ) | (.76 | ) | ||||||||||||
| Total from investment operations | .37 | .57 | (1.24 | ) | (.19 | ) | (.27 | ) | ||||||||||||
| Less Dividends and Distributions: | ||||||||||||||||||||
| Dividends from net investment income(e) | (.16 | ) | - | (d) | (.08 | ) | (.09 | ) | (.32 | ) | ||||||||||
| Distributions from net realized gains | - | - | - | - | (.05 | ) | ||||||||||||||
| Tax return of capital distributions | (.23 | ) | (.38 | ) | (.35 | ) | (.46 | ) | (.30 | ) | ||||||||||
| Total dividends and distributions | (.39 | ) | (.38 | ) | (.43 | ) | (.55 | ) | (.67 | ) | ||||||||||
| Net asset value, end of year | $6.48 | $6.50 | $6.31 | $7.98 | $8.72 | |||||||||||||||
| Total Return(b): | 5.85% | 9.31% | (15.90)% | (2.12)% | (2.98)% | |||||||||||||||
| Ratios/Supplemental Data: | ||||||||||||||||||||
| Net assets, end of year (000) | $27,020 | $27,462 | $24,821 | $28,578 | $31,330 | |||||||||||||||
| Average net assets (000) | $26,437 | $25,994 | $25,969 | $30,288 | $35,341 | |||||||||||||||
| Ratios to average net assets(c): | ||||||||||||||||||||
| Expenses after advisory fee waivers and/or expense reimbursement | .88% | 1.03% | 1.05% | 1.05% | 1.05% | |||||||||||||||
| Expenses before advisory fee waivers and/or expense reimbursement | 1.88% | 2.06% | 2.11% | 1.82% | 1.49% | |||||||||||||||
| Net investment income (loss) | 5.58% | 5.36% | 5.50% | 6.14% | 5.25% | |||||||||||||||
| Portfolio turnover rate | 186% | 196% | 101% | 110% | 102% | |||||||||||||||
| (a) | Calculated based on average shares outstanding during the year. |
| (b) | Total return is calculated assuming a purchase of a share on the first day and a sale on the last day of each year reported and includes reinvestment of dividends and distributions, if any. Total return may reflect adjustments to conform to generally accepted accounting principles. |
| (c) | Does not include expenses of the underlying funds in which the Series invests. |
| (d) | Less than $.005. |
| (e) | Dividends from net investment income may include other items that are ordinary income for tax purposes. |
See Notes to Financial Statements.
| Prudential Emerging Markets Debt Local Currency Fund | 61 |
Report of Independent Registered Public Accounting Firm
The Board of Directors and Shareholders
Prudential World Fund, Inc.:
We have audited the accompanying statement of assets and liabilities of Prudential Emerging Markets Debt Local Currency Fund (the “Fund”), a series of Prudential World Fund, Inc., including the portfolio of investments, as of October 31, 2017, and the related statement of operations for the year then ended, the statements of changes in net assets for each of the years in the two-year period then ended, and the financial highlights for each of the years in the five-year period then ended. These financial statements and financial highlights are the responsibility of the Fund’s management. Our responsibility is to express an opinion on these financial statements and financial highlights based on our audits.
We conducted our audits in accordance with the standards of the Public Company Accounting Oversight Board (United States). Those standards require that we plan and perform the audit to obtain reasonable assurance about whether the financial statements and financial highlights are free of material misstatement. An audit includes examining, on a test basis, evidence supporting the amounts and disclosures in the financial statements. Our procedures included confirmation of securities owned as of October 31, 2017, by correspondence with the custodian, transfer agent and brokers or by other appropriate auditing procedures when replies from brokers were not received. An audit also includes assessing the accounting principles used and significant estimates made by management, as well as evaluating the overall financial statement presentation. We believe that our audits provide a reasonable basis for our opinion.
In our opinion, the financial statements and financial highlights referred to above present fairly, in all material respects, the financial position of the Fund as of October 31, 2017, and the results of its operations for the year then ended, the changes in its net assets for each of the years in the two-year period then ended, and the financial highlights for each of the years in the five-year period then ended, in conformity with U.S. generally accepted accounting principles.

New York, New York
December 15, 2017
| 62 |
Tax Information (unaudited)
For the year ended October 31, 2017, the Series reports the maximum amount allowable but not less than 14.59% as interest-related dividends in accordance with Section 871(k)(1) and 881(e)(1) of the Internal Revenue Code.
In January 2018, you will be advised on IRS Form 1099-DIV or substitute 1099-DIV, as to the Federal tax status of the dividends received by you in calendar year 2017.
| Prudential Emerging Markets Debt Local Currency Fund | 63 |
INFORMATION ABOUT BOARD MEMBERS AND OFFICERS
(Unaudited)
Information about Board Members and Officers of the Fund is set forth below. Board Members who are not deemed to be “interested persons” of the Fund, as defined in the 1940 Act, are referred to as “Independent Board Members.” Board Members who are deemed to be “interested persons” of the Fund are referred to as “Interested Board Members.” The Board Members are responsible for the overall supervision of the operations of the Fund and perform the various duties imposed on the directors of investment companies by the 1940 Act. The Board in turn elects the Officers, who are responsible for administering the day-to-day operations of the Fund.
| Independent Board Members(1) | ||||
Name, Address, Age Position(s) Portfolios Overseen | Principal Occupation(s) During Past Five Years | Other Directorships Held During Past Five Years | ||
Ellen S. Alberding (59) Board Member Portfolios Overseen: 89 | President and Board Member, The Joyce Foundation (charitable foundation) (since 2002); Vice Chair, City Colleges of Chicago (community college system) (since 2011); Trustee, Skills for America’s Future (national initiative to connect employers to community colleges) (since 2011); Trustee, National Park Foundation (charitable foundation for national park system) (since 2009); Trustee, Economic Club of Chicago (since 2009). | None. | ||
Kevin J. Bannon (65) Board Member Portfolios Overseen: 89 | Retired; Managing Director (April 2008-May 2015) and Chief Investment Officer (October 2008-November 2013) of Highmount Capital LLC (registered investment adviser); formerly Executive Vice President and Chief Investment Officer (April 1993-August 2007) of Bank of New York Company; President (May 2003-May 2007) of BNY Hamilton Family of Mutual Funds. | Director of Urstadt Biddle Properties (equity real estate investment trust) (since September 2008). | ||
Linda W. Bynoe (65) Board Member Portfolios Overseen: 89 | President and Chief Executive Officer (since March 1995) and formerly Chief Operating Officer (December 1989-February 1995) of Telemat Ltd. (management consulting); formerly Vice President (January 1985-June 1989) at Morgan Stanley & Co. (broker-dealer). | Director of Simon Property Group, Inc. (retail real estate) (May 2003-May 2012); Director of Anixter International, Inc. (communication products distributor) (since January 2006); Director of Northern Trust Corporation (financial services) (since April 2006); Trustee of Equity Residential (residential real estate) (since December 2009). | ||
Prudential Emerging Markets Debt Local Currency Fund
| Independent Board Members(1) | ||||
Name, Address, Age Position(s) Portfolios Overseen | Principal Occupation(s) During Past Five Years | Other Directorships Held During Past Five Years | ||
Barry H. Evans (57)± Board Member Portfolios Overseen: 89 | Retired; Formerly President (2005-2016), Global Chief Operating Officer (2014-2016), Chief Investment Officer-Global Head of Fixed Income (1998-2014), and various portfolio manager roles (1986-2006), Manulife Asset Management U.S. | Director, Manulife Trust Company (2011-present); Director, Manulife Asset Management Limited (2015-present); Formerly Chairman of the Board of Directors of Manulife Asset Management U.S. (2005-2016); Formerly Chairman of the Board, Declaration Investment Management and Research (2008-2016). | ||
Keith F. Hartstein (61) Board Member & Independent Chair Portfolios Overseen: 89 | Retired; Member (since November 2014) of the Governing Council of the Independent Directors Council (organization of independent mutual fund directors); formerly President and Chief Executive Officer (2005-2012), Senior Vice President (2004-2005), Senior Vice President of Sales and Marketing (1997-2004), and various executive management positions (1990-1997), John Hancock Funds, LLC (asset management); Chairman, Investment Company Institute’s Sales Force Marketing Committee (2003-2008). | None. | ||
Laurie Simon Hodrick (55)± Board Member Portfolios Overseen: 89 | A. Barton Hepburn Professor of Economics in the Faculty of Business, Columbia Business School (since 1996); Visiting Professor of Law and Rock Center for Corporate Governance Fellow, Stanford Law School (since 2015); Visiting Fellow, Hoover Institution, Stanford University (since 2015); Sole Member, ReidCourt LLC (since 2008) (a consulting firm); Formerly Managing Director, Global Head of Alternative Investment Strategies, Deutsche Bank (2006-2008); Formerly Director/Trustee, Merrill Lynch Investment Managers Funds (1999-2006). | Independent Director, Corporate Capital Trust (since April 2017) (a business development company). | ||
Michael S. Hyland, CFA (72) Board Member Portfolios Overseen: 89 | Retired (since February 2005); formerly Senior Managing Director (July 2001-February 2005) of Bear Stearns & Co, Inc.; Global Partner, INVESCO (1999-2001); Managing Director and President of Salomon Brothers Asset Management (1989-1999). | None. | ||
Visit our website at pgiminvestments.com
| Independent Board Members(1) | ||||
Name, Address, Age Position(s) Portfolios Overseen | Principal Occupation(s) During Past Five Years | Other Directorships Held During Past Five Years | ||
Richard A. Redeker (74) Board Member & Independent Vice Chair9 Portfolios Overseen: 87 | Retired Mutual Fund Senior Executive (47 years); Management Consultant; Director, Mutual Fund Directors Forum (since 2014); Independent Directors Council (organization of independent mutual fund directors)-Executive Committee, Chair of Policy Steering Committee, Governing Council. | None. | ||
Stephen G. Stoneburn (74) Board Member Portfolios Overseen: 89 | Chairman (since July 2011), President and Chief Executive Officer (since June 1996) of Frontline Medical Communications (publishing company); formerly President (June 1995-June 1996) of Argus Integrated Media, Inc.; Senior Vice President and Managing Director (January 1993-1995) of Cowles Business Media; Senior Vice President of Fairchild Publications, Inc. (1975-1989). | None. | ||
± Mr. Evans and Ms. Hodrick joined the Board effective as of September 1, 2017.
| Interested Board Members(1) | ||||
Name, Address, Age Position(s) Portfolios Overseen | Principal Occupation(s) During Past Five Years | Other Directorships Held During Past Five Years | ||
Stuart S. Parker (55) Board Member & President Portfolios Overseen: 89 | President of PGIM Investments LLC (formerly known as Prudential Investments LLC) (since January 2012); Executive Vice President of Prudential Investment Management Services LLC (since December 2012); Executive Vice President of Jennison Associates LLC and Head of Retail Distribution of PGIM Investments LLC (June 2005-December 2011). | None. | ||
Prudential Emerging Markets Debt Local Currency Fund
| Interested Board Members(1) | ||||
Name, Address, Age Position(s) Portfolios Overseen | Principal Occupation(s) During Past Five Years | Other Directorships Held During Past Five Years | ||
Scott E. Benjamin (44) Board Member & Vice President Portfolios Overseen: 89 | Executive Vice President (since June 2009) of PGIM Investments LLC; Executive Vice President (June 2009-June 2012) and Vice President (since June 2012) of Prudential Investment Management Services LLC; Executive Vice President (since September 2009) of AST Investment Services, Inc.; Senior Vice President of Product Development and Marketing, PGIM Investments (since February 2006); Vice President of Product Development and Product Management, Prudential Investments (2003-2006). | None. | ||
Grace C. Torres* (58) Board Member Portfolios Overseen: 88 | Retired; formerly Treasurer and Principal Financial and Accounting Officer of the Prudential Funds, Target Funds, Advanced Series Trust, Prudential Variable Contract Accounts and The Prudential Series Fund (1998-June 2014); Assistant Treasurer (March 1999-June 2014) and Senior Vice President (September 1999-June 2014) of PGIM Investments LLC; Assistant Treasurer (May 2003-June 2014) and Vice President (June 2005-June 2014) of AST Investment Services, Inc.; Senior Vice President and Assistant Treasurer (May 2003-June 2014) of Prudential Annuities Advisory Services, Inc. | Director (since July 2015) of Sun Bancorp, Inc. N.A. and Sun National Bank | ||
* Note: Prior to her retirement in 2014, Ms. Torres was employed by PGIM Investments LLC. Due to her prior employment, she is considered to be an “interested person” under the 1940 Act. Ms. Torres is a Non-Management Interested Board Member.
(1) The year that each Board Member joined the Board is as follows:
Ellen S. Alberding; 2013; Kevin J. Bannon, 2008; Linda W. Bynoe, 2005; Barry H. Evans, 2017; Keith F. Hartstein, 2013; Laurie Simon Hodrick, 2017; Michael S. Hyland, 2008; Richard A. Redeker, 2003; Stephen G. Stoneburn, 1996; Grace C. Torres, 2014; Stuart S. Parker, Board Member and President since 2012; Scott E. Benjamin, Board Member since 2010 and Vice President since 2009.
Visit our website at pgiminvestments.com
| Fund Officers(a) | ||||
Name, Address and Age Position with Fund | Principal Occupation(s) During Past Five Years | Length of Service as Fund Officer | ||
Raymond A. O’Hara (62) Chief Legal Officer | Vice President and Corporate Counsel (since July 2010) of Prudential Insurance Company of America (Prudential); Vice President (March 2011-Present) of Pruco Life Insurance Company and Pruco Life Insurance Company of New Jersey; Vice President and Corporate Counsel (March 2011-Present) of Prudential Annuities Life Assurance Corporation; Chief Legal Officer of PGIM Investments LLC (since June 2012); Chief Legal Officer of Prudential Mutual Fund Services LLC (since June 2012) and Corporate Counsel of AST Investment Services, Inc. (since June 2012); formerly Assistant Vice President and Corporate Counsel (September 2008-July 2010) of The Hartford Financial Services Group, Inc.; formerly Associate (September 1980-December 1987) and Partner (January 1988-August 2008) of Blazzard & Hasenauer, P.C. (formerly, Blazzard, Grodd & Hasenauer, P.C.). | Since 2012 | ||
Chad A. Earnst (42) Chief Compliance Officer | Chief Compliance Officer (September 2014-Present) of PGIM Investments LLC; Chief Compliance Officer (September 2014-Present) of the Prudential Funds, Target Funds, Advanced Series Trust, The Prudential Series Fund, Prudential’s Gibraltar Fund, Inc., Prudential Global Short Duration High Yield Income Fund, Inc., Prudential Short Duration High Yield Fund, Inc. and Prudential Jennison MLP Income Fund, Inc.; formerly Assistant Director (March 2010-August 2014) of the Asset Management Unit, Division of Enforcement, US Securities & Exchange Commission; Assistant Regional Director (January 2010-August 2014), Branch Chief (June 2006-December 2009) and Senior Counsel (April 2003-May 2006) of the Miami Regional Office, Division of Enforcement, US Securities & Exchange Commission. | Since 2014 | ||
Deborah A. Docs (59) Secretary | Vice President and Corporate Counsel (since January 2001) of Prudential; Vice President (since December 1996) and Assistant Secretary (since March 1999) of PGIM Investments LLC; formerly Vice President and Assistant Secretary (May 2003-June 2005) of AST Investment Services, Inc. | Since 2004 | ||
Jonathan D. Shain (59) Assistant Secretary | Vice President and Corporate Counsel (since August 1998) of Prudential; Vice President and Assistant Secretary (since May 2001) of PGIM Investments LLC; Vice President and Assistant Secretary (since February 2001) of Prudential Mutual Fund Services LLC; formerly Vice President and Assistant Secretary (May 2003-June 2005) of AST Investment Services, Inc. | Since 2005 | ||
Claudia DiGiacomo (43) Assistant Secretary | Vice President and Corporate Counsel (since January 2005) of Prudential; Vice President and Assistant Secretary of PGIM Investments LLC (since December 2005); Associate at Sidley Austin Brown & Wood LLP (1999-2004). | Since 2005 | ||
Prudential Emerging Markets Debt Local Currency Fund
| Fund Officers(a) | ||||
Name, Address and Age Position with Fund | Principal Occupation(s) During Past Five Years | Length of Service as Fund Officer | ||
Andrew R. French (54) Assistant Secretary | Vice President and Corporate Counsel (since February 2010) of Prudential; formerly Director and Corporate Counsel (2006-2010) of Prudential; Vice President and Assistant Secretary (since January 2007) of PGIM Investments LLC; Vice President and Assistant Secretary (since January 2007) of Prudential Mutual Fund Services LLC. | Since 2006 | ||
Charles H. Smith (44) Anti-Money Laundering Compliance Officer | Vice President, Corporate Compliance, Anti-Money Laundering Unit (since January 2015) of Prudential; committee member of the American Council of Life Insurers Anti-Money Laundering and Critical Infrastructure Committee (since January 2016); formerly Global Head of Economic Sanctions Compliance at AIG Property Casualty (February 2007-December 2014); Assistant Attorney General at the New York State Attorney General’s Office, Division of Public Advocacy. (August 1998-January 2007). | Since 2016 | ||
M. Sadiq Peshimam (53) Treasurer and Principal Financial and Accounting Officer | Vice President (since 2005) of PGIM Investments LLC; formerly Assistant Treasurer of funds in the Prudential Mutual Fund Complex (2006-2014). | Since 2006 | ||
Peter Parrella (59) Assistant Treasurer | Vice President (since 2007) and Director (2004-2007) within Prudential Mutual Fund Administration; formerly Tax Manager at SSB Citi Fund Management LLC (1997-2004). | Since 2007 | ||
Lana Lomuti (50) Assistant Treasurer | Vice President (since 2007) and Director (2005-2007), within Prudential Mutual Fund Administration; formerly Assistant Treasurer (December 2007-February 2014) of The Greater China Fund, Inc. | Since 2014 | ||
Linda McMullin (56) Assistant Treasurer | Vice President (since 2011) and Director (2008-2011) within Prudential Mutual Fund Administration. | Since 2014 | ||
Kelly A. Coyne (49) Assistant Treasurer | Director, Investment Operations of Prudential Mutual Fund Services LLC (since 2010). | Since 2015 | ||
(a) Excludes Mr. Parker and Mr. Benjamin, interested Board Members who also serve as President and Vice President, respectively.
Explanatory Notes to Tables:
| ∎ | Board Members are deemed to be “Interested,” as defined in the 1940 Act, by reason of their affiliation with PGIM Investments LLC and/or an affiliate of PGIM Investments LLC. |
| ∎ | Unless otherwise noted, the address of all Board Members and Officers is c/o PGIM Investments LLC, 655 Broad Street, Newark, New Jersey 07102-4410. |
| ∎ | There is no set term of office for Board Members or Officers. The Board Members have adopted a retirement policy, which calls for the retirement of Board Members on December 31 of the year in which they reach the age of 75. |
| ∎ | “Other Directorships Held” includes only directorships of companies required to register or file reports with the SEC under the 1934 Act (that is, “public companies”) or other investment companies registered under the 1940 Act. |
| ∎ | “Portfolios Overseen” includes all investment companies managed by PGIM Investments LLC. The investment companies for which PGIM Investments LLC serves as manager include the Prudential Mutual Funds, The Prudential Variable Contract Accounts, Target Mutual Funds, Prudential Short Duration High Yield Fund, Inc., Prudential Global Short Duration High Yield Fund, Inc., The Prudential Series Fund, Prudential’s Gibraltar Fund, Inc. and the Advanced Series Trust. |
Visit our website at pgiminvestments.com
Approval of Advisory Agreements
The Fund’s Board of Directors
The Board of Directors (the “Board”) of Prudential Emerging Markets Debt Local Currency Fund (the “Fund”)1 consists of twelve individuals, nine of whom are not “interested persons” of the Fund, as defined in the Investment Company Act of 1940, as amended (the “1940 Act”) (the “Independent Directors”). The Board is responsible for the oversight of the Fund and its operations, and performs the various duties imposed on the directors of investment companies by the 1940 Act. The Independent Directors have retained independent legal counsel to assist them in connection with their duties. The Chair of the Board is an Independent Director. The Board has established four standing committees: the Audit Committee, the Nominating and Governance Committee, and two Investment Committees. Each committee is chaired by, and composed of, Independent Directors.
Annual Approval of the Fund’s Advisory Agreements
As required under the 1940 Act, the Board determines annually whether to renew the Fund’s management agreement with PGIM Investments LLC (“PGIM Investments”), the Fund’s subadvisory agreement with PGIM, Inc. (“PGIM”) on behalf of its PGIM Fixed Income unit, and the Fund’s sub-subadvisory agreement with PGIM Limited (“PGIML”). In considering the renewal of the agreements, the Board, including all of the Independent Directors,2 met on June 6-8, 2017 and approved the renewal of the agreements through July 31, 2018, after concluding that the renewal of the agreements was in the best interests of the Fund and its shareholders.
In advance of the meetings, the Board requested and received materials relating to the agreements, and had the opportunity to ask questions and request further information in connection with its consideration. Among other things, the Board considered comparative fee information from PGIM Investments and PGIM. Also, the Board considered comparisons with other mutual funds in relevant Peer Universes and Peer Groups, as is further discussed below.
In approving the agreements, the Board, including the Independent Directors advised by independent legal counsel, considered the factors it deemed relevant, including the nature, quality and extent of services provided by PGIM Investments, the subadviser, and the sub-subadviser, the performance of the Fund, the profitability of PGIM Investments and its affiliates, expenses and fees, and the potential for economies of scale that may be shared with the Fund and its shareholders as the Fund’s assets grow. In their deliberations, the Directors did not identify any single factor which alone was responsible for the Board’s
| 1 | Prudential Emerging Markets Debt Local Currency Fund is a series of Prudential World Fund, Inc. |
| 2 | Barry H. Evans and Laurie Simon Hodrick joined the Board effective as of September 1, 2017. Neither Mr. Evans nor Ms. Hodrick participated in the consideration of the renewal of the advisory agreements. |
| Prudential Emerging Markets Debt Local Currency Fund | ||
Approval of Advisory Agreements (continued)
decision to approve the agreements with respect to the Fund. In connection with its deliberations, the Board considered information provided by PGIM Investments throughout the year at regular Board meetings, presentations from portfolio managers and other information, as well as information furnished at or in advance of the meetings on June 6-8, 2017.
The Directors determined that the overall arrangements between the Fund and PGIM Investments, which serves as the Fund’s investment manager pursuant to a management agreement, between PGIM Investments and PGIM, which, through its PGIM Fixed Income unit, serves as the Fund’s subadviser pursuant to the terms of a subadvisory agreement with PGIM Investments, and between PGIM and PGIML, which serves as the Fund’s sub-subadviser pursuant to the terms of a sub-subadvisory agreement with PGIM, are in the best interests of the Fund and its shareholders in light of the services performed, fees charged and such other matters as the Directors considered relevant in the exercise of their business judgment.
The material factors and conclusions that formed the basis for the Directors’ reaching their determinations to approve the continuance of the agreements are separately discussed below.
Nature, Quality and Extent of Services
The Board received and considered information regarding the nature, quality and extent of services provided to the Fund by PGIM Investments, PGIM Fixed Income, and PGIML. The Board considered the services provided by PGIM Investments, including but not limited to the oversight of the subadviser and sub-subadviser for the Fund, as well as the provision of fund recordkeeping, compliance, and other services to the Fund. With respect to PGIM Investments’ oversight of the subadviser and sub-subadviser, the Board noted that PGIM Investments’ Strategic Investment Research Group (“SIRG”), which is a business unit of PGIM Investments, is responsible for monitoring and reporting to PGIM Investments’ senior management on the performance and operations of the subadviser and sub-subadviser. The Board also considered that PGIM Investments pays the salaries of all of the officers and interested Directors of the Fund who are part of Fund management. The Board also considered the investment subadvisory services provided by PGIM Fixed Income and PGIML, including investment research and security selection, as well as adherence to the Fund’s investment restrictions and compliance with applicable Fund policies and procedures. The Board considered PGIM Investments’ evaluation of the subadviser and sub-subadviser, as well as PGIM Investments’ recommendation, based on its review of the subadviser and sub-subadviser, to renew the subadvisory and sub-subadvisory agreements.
The Board considered the qualifications, backgrounds and responsibilities of PGIM Investments’ senior management responsible for the oversight of the Fund, PGIM, and PGIML, and also considered the qualifications, backgrounds and responsibilities of PGIM’s
| Visit our website at pgiminvestments.com |
portfolio managers who are responsible for the day-to-day management of the Fund’s portfolio. The Board was provided with information pertaining to PGIM Investments, PGIM’s, and PGIML’s organizational structure, senior management, investment operations, and other relevant information pertaining to PGIM Investments, PGIM Fixed Income, and PGIML. The Board also noted that it received favorable compliance reports from the Fund’s Chief Compliance Officer (“CCO”) as to PGIM Investments, PGIM Fixed Income, and PGIML. The Board noted that PGIM Fixed Income and PGIML are affiliated with PGIM Investments.
The Board concluded that it was satisfied with the nature, extent and quality of the investment management services provided by PGIM Investments, the subadvisory services provided to the Fund by PGIM Fixed Income, and the sub-subadvisory services provided by PGIML, and that there was a reasonable basis on which to conclude that the Fund benefits from the services provided by PGIM Investments, PGIM Fixed Income, and PGIML under the management and subadvisory agreements.
Costs of Services and Profits Realized by PGIM Investments
The Board was provided with information on the profitability of PGIM Investments and its affiliates in serving as the Fund’s investment manager. The Board discussed with PGIM Investments the methodology utilized in assembling the information regarding profitability and considered its reasonableness. The Board recognized that it is difficult to make comparisons of profitability from fund management contracts because comparative information is not generally publicly available and is affected by numerous factors, including the structure of the particular adviser, the types of funds it manages, its business mix, numerous assumptions regarding allocations and the adviser’s capital structure and cost of capital. However, the Board considered that the cost of services provided by PGIM Investments for the year ended December 31, 2016 exceeded the management fees received by PGIM Investments, resulting in an operating loss to PGIM Investments. The Board further noted that the subadviser and the sub-subadviser affiliated with PGIM Investments and that their profitability is reflected in PGIM Investments’ profitability report. Taking these factors into account, the Board concluded that the profitability of PGIM Investments and its affiliates in relation to the services rendered was not unreasonable.
Economies of Scale
The Board received and discussed information concerning economies of scale that PGIM Investments may realize as the Fund’s assets grow beyond current levels. The Board noted that the management fee schedule for the Fund includes breakpoints, which have the effect of decreasing the fee rate as assets increase, but that at its current level of assets the Fund does not realize the effect of those rate reductions. The Board took note that the Fund’s fee structure currently results in benefits to Fund shareholders whether or not PGIM
| Prudential Emerging Markets Debt Local Currency Fund | ||
Approval of Advisory Agreements (continued)
Investments realizes any economies of scale. The Board noted that economies of scale, if any, may be shared with the Fund in several ways, including low management fees from inception, additional technological and personnel investments to enhance shareholder services, and maintaining existing expense structures in the face of a rising cost environment. The Board considered PGIM Investments’ assertion that it continually evaluates the management fee schedule of the Fund and the potential to share economies of scale through breakpoints or fee waivers as asset levels increase.
The Board recognized the inherent limitations of any analysis of economies of scale, stemming largely from the Board’s understanding that most of PGIM Investments’ costs are not specific to individual funds, but rather are incurred across a variety of products and services.
Other Benefits to PGIM Investments, PGIM Fixed Income, and PGIML
The Board considered potential ancillary benefits that might be received by PGIM Investments, PGIM Fixed Income, and PGIML and their affiliates as a result of their relationship with the Fund. The Board concluded that potential benefits to be derived by PGIM Investments included transfer agency fees received by the Fund’s transfer agent (which is affiliated with PGIM Investments), as well as benefits to its reputation or other intangible benefits resulting from PGIM Investments association with the Fund. The Board concluded that the potential benefits to be derived by PGIM Fixed Income and PGIML included the ability to use soft dollar credits, as well as the potential benefits consistent with those generally resulting from an increase in assets under management, specifically, potential access to additional research resources and benefits to their reputations. The Board concluded that the benefits derived by PGIM Investments, PGIM Fixed Income, and PGIML were consistent with the types of benefits generally derived by investment managers and subadvisers to mutual funds.
Performance of the Fund / Fees and Expenses
The Board considered certain additional specific factors and made related conclusions relating to the historical performance of the Fund for the one-, three- and five-year periods ended December 31, 2016.
The Board also considered the Fund’s actual management fee, as well as the Fund’s net total expense ratio, for the fiscal year ended October 31, 2016. The Board considered the management fee for the Fund as compared to the management fee charged by PGIM Investments to other funds and the fee charged by other advisers to comparable mutual funds in a Peer Group. The actual management fee represents the fee rate actually paid by Fund shareholders and includes any fee waivers or reimbursements. The net total expense ratio for the Fund represents the actual expense ratio incurred by Fund shareholders.
| Visit our website at pgiminvestments.com |
The mutual funds included in the Peer Universe (the Lipper Emerging Markets Local Currency Debt Funds Performance Universe), which was used to consider performance, and the Peer Group, which was used to consider fees and expenses, were objectively determined by Broadridge, an independent provider of mutual fund data. The comparisons placed the Fund in various quartiles, with the first quartile being the best 25% of the mutual funds (for performance, the best performing mutual funds and, for expenses, the lowest cost mutual funds).
The section below summarizes key factors considered by the Board and the Board’s conclusions regarding the Fund’s performance, fees and overall expenses. The table sets forth gross performance comparisons (which do not reflect the impact on performance of fund expenses, or any subsidies, expense caps or waivers that may be applicable) with the Peer Universe, actual management fees with the Peer Group (which reflect the impact of any subsidies or fee waivers), and net total expenses with the Peer Group, each of which were key factors considered by the Board.
| Performance | 1 Year | 3 Years | 5 Years | 10 Years | ||||
3rd Quartile | 2nd Quartile | 2nd Quartile | N/A | |||||
| Actual Management Fees: 1st Quartile | ||||||||
| Net Total Expenses: 4th Quartile | ||||||||
| • | The Board noted that the Fund outperformed its benchmark index over the three-, five- and ten-year periods. |
| • | The Board also noted that the Fund’s performance against its Peer Universe had improved, with the Fund ranked in the first quartile of its Peer Universe for the first quarter of 2017. |
| • | The Board and PGIM Investments agreed to continue the existing expense cap, which caps the Fund’s annual operating expenses at 0.88% (exclusive of 12b-1 fees and certain other fees), through February 28, 2018. |
| • | The Board noted information provided by PGIM Investments which indicated that if the expense cap, which was implemented as of October 1, 2016, were in effect for the full fiscal year, the Fund’s net total expenses would rank in the second quartile of its Peer Group. |
| • | The Board concluded that, in light of the above, it would be in the best interests of the Fund and its shareholders to renew the agreements. |
| • | The Board concluded that the management fees (including subadvisory fees) and total expenses were reasonable in light of the services provided. |
* * *
After full consideration of these factors, the Board concluded that the approval of the agreements was in the best interests of the Fund and its shareholders.
| Prudential Emerging Markets Debt Local Currency Fund | ||
| ∎ TELEPHONE | ∎ WEBSITE | |||
655 Broad Street Newark, NJ 07102 | (800) 225-1852 | www.pgiminvestments.com |
| PROXY VOTING |
| The Board of Directors of the Fund has delegated to the Fund’s investment subadviser the responsibility for voting any proxies and maintaining proxy recordkeeping with respect to the Fund. A description of these proxy voting policies and procedures is available without charge, upon request, by calling (800) 225-1852. Information regarding how the Fund voted proxies relating to portfolio securities during the most recent 12-month period ended June 30 is available on the Fund’s website and on the Securities and Exchange Commission’s website. |
| DIRECTORS |
| Ellen S. Alberding • Kevin J. Bannon • Scott E. Benjamin • Linda W. Bynoe • Barry H. Evans • Keith F. Hartstein • Laurie Simon Hodrick • Michael S. Hyland • Stuart S. Parker • Richard A. Redeker • Stephen G. Stoneburn • Grace C. Torres |
| OFFICERS |
| Stuart S. Parker, President • Scott E. Benjamin, Vice President • M. Sadiq Peshimam, Treasurer and Principal Financial and Accounting Officer • Raymond A. O’Hara, Chief Legal Officer • Deborah A. Docs, Secretary • Chad A. Earnst, Chief Compliance Officer • Charles H. Smith, Anti-Money Laundering Compliance Officer • Jonathan D. Shain, Assistant Secretary • Claudia DiGiacomo, Assistant Secretary • Andrew R. French, Assistant Secretary • Peter Parrella, Assistant Treasurer • Lana Lomuti, Assistant Treasurer • Linda McMullin, Assistant Treasurer • Kelly A. Coyne, Assistant Treasurer |
| MANAGER | PGIM Investments LLC | 655 Broad Street Newark, NJ 07102 | ||
| ||||
| INVESTMENT SUBADVISER | PGIM Fixed Income | 655 Broad Street Newark, NJ 07102 | ||
| ||||
| DISTRIBUTOR | Prudential Investment Management Services LLC | 655 Broad Street Newark, NJ 07102 | ||
| ||||
| CUSTODIAN | The Bank of New York Mellon | 225 Liberty Street New York, NY 10286 | ||
| ||||
| TRANSFER AGENT | Prudential Mutual Fund Services LLC | PO Box 9658 Providence, RI 02940 | ||
| ||||
| INDEPENDENT REGISTERED PUBLIC ACCOUNTING FIRM | KPMG LLP | 345 Park Avenue New York, NY 10154 | ||
| ||||
| FUND COUNSEL | Willkie Farr & Gallagher LLP | 787 Seventh Avenue New York, NY 10019 | ||
| ||||
| An investor should consider the investment objectives, risks, charges, and expenses of the Fund carefully before investing. The prospectus and summary prospectus contain this and other information about the Fund. An investor may obtain a prospectus and summary prospectus by visiting our website at www.pgiminvestments.com or by calling (800) 225-1852. The prospectus and summary prospectus should be read carefully before investing. |
| E-DELIVERY |
| To receive your mutual fund documents online, go to www.pgiminvestments.com/edelivery and enroll. Instead of receiving printed documents by mail, you will receive notification via email when new materials are available. You can cancel your enrollment or change your email address at any time by visiting the website address above. |
| SHAREHOLDER COMMUNICATIONS WITH DIRECTORS |
| Shareholders can communicate directly with the Board of Directors by writing to the Chair of the Board, Prudential Emerging Markets Debt Local Currency Fund, PGIM Investments, Attn: Board of Directors, 655 Broad Street, Newark, NJ 07102. Shareholders can communicate directly with an individual Director by writing to the same address. Communications are not screened before being delivered to the addressee. |
| AVAILABILITY OF PORTFOLIO SCHEDULE |
| The Fund files its complete schedule of portfolio holdings with the Securities and Exchange Commission for the first and third quarters of each fiscal year on Form N-Q. The Fund’s Forms N-Q are available on the Commission’s website at www.sec.gov. The Fund’s Forms N-Q may also be reviewed and copied at the Commission’s Public Reference Room in Washington, D.C. Information on the operation and location of the Public Reference Room may be obtained by calling 1-800-SEC-0330. The Fund’s schedule of portfolio holdings is also available on the Fund’s website as of the end of each month no sooner than 15 days after the end of the month. |
| The Fund’s Statement of Additional Information contains additional information about the Fund’s Directors and is available without charge, upon request, by calling (800) 225-1852. |
Mutual Funds:
| ARE NOT INSURED BY THE FDIC OR ANY FEDERAL GOVERNMENT AGENCY | MAY LOSE VALUE | ARE NOT A DEPOSIT OF OR GUARANTEED BY ANY BANK OR ANY BANK AFFILIATE |
PRUDENTIAL EMERGING MARKETS DEBT LOCAL CURRENCY FUND
| SHARE CLASS | A | C | Q | Z | ||||
| NASDAQ | EMDAX | EMDCX | EMDQX | EMDZX | ||||
| CUSIP | 743969750 | 743969743 | 743969735 | 743969727 |
MF212E

PRUDENTIAL JENNISON EMERGING MARKETS EQUITY FUND
ANNUAL REPORT
OCTOBER 31, 2017

To enroll in e-delivery, go to pgiminvestments.com/edelivery
| Objective: Long-term growth of capital |
Highlights
| • | Emerging markets overall had their best performance since the aftermath of the financial crisis. |
| • | Information technology positions in Chinese companies Alibaba and Tencent, in addition to Argentina’s MercadoLibre, contributed to positive returns. |
| • | Consumer discretionary and health care detracted in aggregate, and several positions were among the poorest performing in the Fund. These included Matahari Department Store in Indonesia, Alsea in Mexico, and Tung Thih Electronic in Taiwan. |
This report is not authorized for distribution to prospective investors unless preceded or accompanied by a current prospectus.
The views expressed in this report and information about the Fund’s portfolio holdings are for the period covered by this report and are subject to change thereafter.
Mutual funds are distributed by Prudential Investment Management Services LLC, member SIPC. Jennison Associates LLC is a registered investment adviser. Both are Prudential Financial companies. © 2017 Prudential Financial, Inc. and its related entities. Jennison Associates, Jennison, PGIM, and the PGIM logo are service marks of Prudential Financial, Inc. and its related entities, registered in many jurisdictions worldwide.
| 2 | Visit our website at pgiminvestments.com |
PRUDENTIAL FUNDS — UPDATE
The Board of Directors/Trustees for the Fund has approved renaming the Fund’s Class Q shares as Class R6 shares, effective on or about June 15, 2018. The renaming of Class Q shares as Class R6 shares will not result in any changes to pricing, eligibility, or shareholder rights and obligations. The renamed Class R6 shares will not be exchangeable with Class R6 shares of the Prudential Day One Funds or the Prudential 60/40 Allocation Fund.
LR993
| Prudential Jennison Emerging Markets Equity Fund | 3 |
PRUDENTIAL FUNDS — UPDATE
Effective on or about June 1, 2018 (the “Effective Date”), the Fund’s Class A, Class C, Class R, and Class Z shares, as applicable, will be closed to investments by new group retirement plans, except as discussed below. Existing group retirement plans as of the Effective Date may keep their investments in their current share class and may continue to make additional purchases or exchanges of that class of shares. As of the Effective Date, all new group retirement plans wishing to add the Fund as a new addition to the plan generally will be into one of the available Class Q shares, Class R2 shares, or Class R4 shares of the Fund.
In addition, on or about the Effective Date, the Class R shares of the Fund will be closed to all new investors, except as discussed below. Due to the closing of the Class R shares to new investors, effective on or about the Effective Date new IRA investors may only purchase Class A, Class C, Class Z, or Class Q shares of the Fund, subject to share class eligibility. Following the Effective Date, no new accounts may be established in the Fund’s Class R shares and no Class R shares may be purchased or acquired by any new Class R shareholder, except as discussed below.
| Class A | Class C | Class Z | Class R | |||||
Existing Investors (Group Retirement Plans, IRAs, and all other investors) | No Change | No Change | No Change | No Change | ||||
| New Group Retirement Plans | Closed to group retirement plans wishing to add the share classes as new additions to plan menus on or about June 1, 2018, subject to certain exceptions below | |||||||
New IRAs | No Change | No Change | No Change | Closed to all new investors on or about June 1, 2018, subject to certain exceptions below | ||||
| All Other New Investors | No Change | No Change | No Change | |||||
| 4 | Visit our website at pgiminvestments.com |
However, the following new investors may continue to purchase Class A, Class C, Class R, and Class Z shares of the Fund, as applicable:
| • | Eligible group retirement plans who are exercising their one-time 90-day repurchase privilege in the Fund will be permitted to purchase such share classes. |
| • | Plan participants in a group retirement plan that offers Class A, Class C, Class R, or Class Z shares of the Fund as of the Effective Date will be permitted to purchase such share classes of the Fund, even if the plan participant did not own shares of that class of the Fund as of the Effective Date. |
| • | Certain new group retirement plans will be permitted to offer such share classes of the Fund after the Effective Date, provided that the plan has or is actively negotiating a contractual agreement with the Fund’s distributor or service provider to offer such share classes of the Fund prior to or on the Effective Date. |
| • | New group retirement plans that combine with, replace, or are otherwise affiliated with a current plan that invests in such share classes prior to or on the Effective Date will be permitted to purchase such share classes. |
The Fund also reserves the right to refuse any purchase order that might disrupt management of the Fund or to otherwise modify the closure policy at any time on a case-by-case basis.
| Prudential Jennison Emerging Markets Equity Fund | 5 |
This Page Intentionally Left Blank
| 6 | Visit our website at pgiminvestments.com |
Letter from the President

Dear Shareholder:
We hope you find the annual report for the Prudential Jennison Emerging Markets Equity Fund informative and useful. The report covers performance for the 12-month period ended October 31, 2017.
Significant events during the reporting period included a new US president, followed by uncertainty in Congress over implementing the Trump administration’s policy initiatives. Elsewhere, Britain began its formal legal process to leave the European Union. France elected a more centrist president, which was viewed as a pro-euro referendum. North Korea’s missile launches escalated geopolitical tensions. Also, late in the period, a series of hurricanes caused damage in the US and the Caribbean.
Despite some turbulence in the macro-environment, solid economic fundamentals in the US economy included moderate gross domestic product expansion, robust employment, and accelerating corporate profit growth. Inflation remained tame. The Federal Reserve raised its federal funds rate twice in 2017, and is in the process of winding down its stimulus program.
Global economic growth remained mostly positive. Equities in the US reached new highs amid low volatility, while international equities posted strong gains. European stocks continued to gain. Asian markets were solid, and emerging markets outperformed most regions. Fixed income markets were mixed. High yield and emerging markets bonds were the top performers.
Given the uncertainty in today’s investment environment, we believe that active professional portfolio management offers a potential advantage. Active managers often have the knowledge and flexibility to find the best investment opportunities in the most challenging markets.
Even so, it’s best if investment decisions are based on your long-term goals rather than on short-term market and economic developments. We also encourage you to work with an experienced financial advisor who can help you set goals, determine your tolerance for risk, and build a diversified plan that’s right for you and make adjustments when necessary.
At PGIM Investments, we consider it a great privilege and responsibility to help investors participate in opportunities across global markets while meeting their toughest investment challenges. We’re part of PGIM, a top-10 global investment manager with more than $1 trillion in assets under management. This investment expertise allows us to deliver actively managed funds and strategies to meet the needs of investors around the globe.
Thank you for choosing our family of funds.
Sincerely,

Stuart S. Parker, President
Prudential Jennison Emerging Markets Equity Fund
December 15, 2017
| Prudential Jennison Emerging Markets Equity Fund | 7 |
Your Fund’s Performance (unaudited)
Performance data quoted represents past performance. Past performance does not guarantee future results. The investment return and principal value of an investment will fluctuate, so that an investor’s shares, when redeemed, may be worth more or less than their original cost. Current performance may be lower or higher than the past performance data quoted. An investor may obtain performance data as of the most recent month-end by visiting our website at www.pgiminvestments.com or by calling (800) 225-1852.
| Average Annual Total Returns as of 10/31/17 (with sales charges) | ||||||
| One Year (%) | Since Inception (%) | |||||
| Class A | 13.12 | 1.77 (9/16/14) | ||||
| Class C | 17.80 | 2.88 (9/16/14) | ||||
| Class Q | 20.02 | 3.92 (9/16/14) | ||||
| Class Z | 20.02 | 3.90 (9/16/14) | ||||
| MSCI Emerging Markets Index | 26.45 | 5.94 | ||||
| Lipper Emerging Markets Funds Average | 23.41 | 4.56 | ||||
Average Annual Total Returns as of 10/31/17 (without sales charges) | ||||||
| One Year (%) | Since Inception (%) | |||||
| Class A | 19.70 | 3.63 (9/16/14) | ||||
| Class C | 18.80 | 2.88 (9/16/14) | ||||
| Class Q | 20.02 | 3.92 (9/16/14) | ||||
| Class Z | 20.02 | 3.90 (9/16/14) | ||||
| MSCI Emerging Markets Index | 26.45 | 5.94 | ||||
| Lipper Emerging Markets Funds Average | 23.41 | 4.56 | ||||
| 8 | Visit our website at pgiminvestments.com |
Growth of a $10,000 Investment
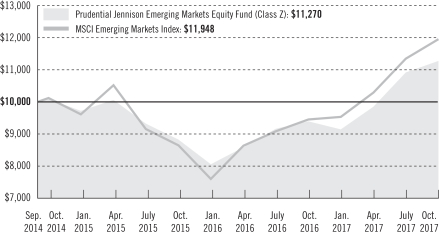
The graph compares a $10,000 investment in the Prudential Jennison Emerging Markets Equity Fund (Class Z shares) with a similar investment in the MSCI Emerging Markets Index, by portraying the initial account values at the commencement of operations for Class Z shares (September 16, 2014) and the account values at the end of the current fiscal year (October 31, 2017) as measured on a quarterly basis. For purposes of the graph, and unless otherwise indicated, it has been assumed that (a) all recurring fees (including management fees) were deducted; and (b) all dividends and distributions were reinvested. The line graph provides information for Class Z shares only. As indicated in the tables provided earlier, performance for Class A, Class C, and Class Q shares will vary due to the differing charges and expenses applicable to each share class (as indicated in the following paragraphs). Without waiver of fees and/or expense reimbursements, if any, the Fund’s returns would have been lower.
Past performance does not predict future performance. Total returns and the ending account values in the graph include changes in share price and reinvestment of dividends and capital gains distributions in a hypothetical investment for the periods shown. The Fund’s total returns do not reflect the deduction of income taxes on an individual’s investment. Taxes may reduce your actual investment returns on income or gains paid by the Fund or any gains you may realize if you sell your shares.
Source: PGIM Investments LLC and Lipper Inc.
Since Inception returns are provided since the Fund has less than 10 fiscal years of returns. Since Inception returns for the Index and the Lipper Average are measured from the closest month-end to the Fund’s inception date.
| Prudential Jennison Emerging Markets Equity Fund | 9 |
Your Fund’s Performance (continued)
The returns in the tables do not reflect the deduction of taxes that a shareholder would pay on Fund distributions or following the redemption of Fund shares. The average annual total returns take into account applicable sales charges, which are described for each share class in the table below.
| Class A* | Class C* | Class Q | Class Z* | |||||
| Maximum initial sales charge | 5.50% of the public offering price | None | None | None | ||||
| Contingent deferred sales charge (CDSC) (as a percentage of the lower of original purchase price or net asset value at redemption) | 1.00% on sales of $1 million or more made within 12 months of purchase | 1.00% on sales made within 12 months of purchase | None | None | ||||
| Annual distribution and service (12b-1) fees (shown as a percentage of average daily net assets) | 0.30% (0.25% currently) | 1.00% | None | None |
*Certain share classes will be generally closed to investments by new group retirement plans effective on or about June 1, 2018. Please see the “PRUDENTIAL FUNDS—UPDATE” on page 4 of this report for more information.
Benchmark Definitions
MSCI Emerging Markets Index—The MSCI Emerging Markets Index is an unmanaged free float-adjusted market capitalization index that is designed to measure equity market performance of emerging markets. The MSCI Emerging Markets Index consists of the following 24 emerging market country indexes: Brazil, Chile, China, Colombia, Czech Republic, Egypt, Greece, Hungary, India, Indonesia, Korea, Malaysia, Mexico, Pakistan, Peru, Philippines, Poland, Qatar, Russia, South Africa, Taiwan, Thailand, Turkey, and United Arab Emirates.
Lipper Emerging Markets Funds Average—The Lipper Emerging Markets Funds Average (Lipper Average) includes funds that seek long-term capital appreciation by investing at least 65% of total assets in emerging market equity securities, where “emerging market” is defined by a country’s GNP per capita or other economic measures.
Investors cannot invest directly in an index or average. The returns for the Index would be lower if they included the effects of sales charges, operating expenses of a mutual fund, or taxes. Returns for the Lipper Average reflect the deduction of operating expenses, but not sales charges or taxes.
| 10 | Visit our website at pgiminvestments.com |
Presentation of Fund Holdings
| Five Largest Holdings expressed as a percentage of net assets as of 10/31/17 (%) | ||||
Tencent Holdings Ltd., Internet Software & Services | 9.0 | |||
Alibaba Group Holding Ltd., Internet Software & Services | 7.4 | |||
MercadoLibre, Inc., Internet Software & Services | 5.4 | |||
Sociedad Quimica y Minera de Chile SA, Chemicals | 4.7 | |||
MakeMyTrip Ltd., Internet & Direct Marketing Retail | 3.8 | |||
Holdings reflect only long-term investments and are subject to change.
| Five Largest Industries expressed as a percentage of net assets as of 10/31/17 (%) | ||||
Internet Software & Services | 25.0 | |||
Internet & Direct Marketing Retail | 10.4 | |||
Banks | 9.2 | |||
Food & Staples Retailing | 7.4 | |||
Chemicals | 6.9 | |||
Industry weightings reflect only long-term investments and are subject to change.
| Prudential Jennison Emerging Markets Equity Fund | 11 |
Strategy and Performance Overview
How did the Fund perform?
The Prudential Jennison Emerging Markets Equity Fund’s Class Z shares rose 20.02% in the 12 months ended October 31, 2017. In the same period, the MSCI Emerging Markets Index (the Index) advanced 26.45% and the Lipper Emerging Markets Funds Average climbed 23.41%.
What was the market environment?
| • | Equity returns were strong in the 12-month period ended October 31, 2017, as global GDP advanced at a healthy pace, long-term interest rates remained close to historical lows, and central banks tightened monetary policy prudently and gradually in light of subdued inflation. |
| • | Europe’s economic recovery proceeded, and emerging markets had their best performance since the aftermath of the financial crisis. Japan likewise showed healthier trends in economic activity. |
| • | In the Index, all sectors advanced, with information technology, real estate, and materials posting the largest gains, while returns in consumer staples, telecom services, and utilities were more modest. |
What worked?
| • | Information technology positions were strong contributors to return. |
| • | Alibaba reported impressive financial results that beat consensus expectations on most key metrics. It operates China’s largest global online wholesale platform for small businesses, China’s largest online retail website, and China’s largest online third-party platform for brands and retailers. Jennison believes Alibaba, with its dominant market share, offers an attractive opportunity to invest in the long-term growth of the Chinese e-commerce market. |
| • | Tencent, China’s largest and most visited Internet service portal, continues to perform well, fundamentally driven by its dominant position in China’s online gaming and instant messaging markets and its growing advertising and payment service efforts. With its recent acquisition of two key music platforms, Tencent is also China’s leading online music provider. |
| • | MercadoLibre is a Buenos Aires-based online trading service that enables individuals and businesses to electronically sell and buy items in more than 2,000 categories. The company’s strong execution and enhanced marketplace initiatives, including integrated shipping and payment systems, are driving market share gains. Jennison likes the company’s exposure to Latin America’s expanding Internet penetration rates and low e-commerce share of the retail market. |
| 12 | Visit our website at pgiminvestments.com |
| • | Taiwan-based Largan Precision designs, manufactures, and sells optical lens modules, real image view finders, and optoelectronic parts. It provides optical lenses and lens sets, which are incorporated in scanners, cameras, multifunctional office machines, liquid crystal display (LCD) projectors, digital cameras, mobile phone cameras, and DVD players. With expertise in phone camera plastic lens manufacturing, it counts Apple and major Chinese smartphone manufacturers among its customers. Jennison expects earnings growth and margin expansion for Largan, seeing potentially rapid growth in demand for its comprehensive lens designs. |
| • | Materials also contributed to results, led by In Sociedad Quimica y Minera. Based in Santiago de Chile, the company makes and sells fertilizers and specialty chemicals. Jennison believes Quimica y Minera stands to benefit from a nascent shift in energy usage that is being fueled by low-cost, lightweight, and safe lithium-based energy storage, especially over the next few years, as electric vehicle battery applications and continued growth in consumer electronics drive growth in the lithium business. The stock’s advance reflected expectations that lithium pricing will increase as demand intensifies and near-term supply additions materialize slower than anticipated. In the past couple of months, several major car makers announced plans for new electronic car variants. |
What didn’t work?
| • | Consumer discretionary and health care detracted in aggregate, and several positions from these sectors were among the Fund’s largest detractors. |
| • | Matahari Department Store is the biggest and one of the most profitable department store operators in Indonesia. It focuses on the country’s middle-income consumers, a sizable, fast-growing group with resilient purchasing power. Jennison believes retailers targeting this demographic segment are better positioned to weather cyclicality and capitalize on long-term consumption growth. Jennison also believes its flexible merchandising, extensive distribution network, and relationships with property developers support growth opportunities outside of the country’s largest city, Jakarta, while its dominant scale strengthens pricing power and lowers cost structure. The stock’s decline reflected indications of declining same-store sales. |
| • | Alsea is the largest restaurant operator in Mexico with more than 2,000 restaurants across different formats, including Domino’s Pizza, Starbucks, Burger King, Chili’s, California Pizza Kitchen, PF Chang’s, Pei-Wei, Italianni’s, Vips, and The Cheesecake Factory. Although Jennison likes Alsea’s dominant position, well-diversified and reputable mix of restaurant brands, superior scale, and strong execution, possible headwinds on the horizon include a potential slowdown in domestic consumer spending and possible fallout from the new US administration, which has questioned the North American Free Trade Agreement and could interfere with remittances. For these reasons, the Fund eliminated the position. |
| Prudential Jennison Emerging Markets Equity Fund | 13 |
Strategy and Performance Overview (continued)
| • | Tung Thih Electronic makes and sells advanced driver-assist systems that use internal software connected to sensors and cameras to alert drivers to potential hazards or temporarily take control of vehicles to avoid accidents. It develops its own software algorithms, allowing it to transform from a product-focused company to a system provider positioned to challenge global auto-safety system leaders such as Bosch and Valeo. Tung Thih’s key customers include General Motors, Renault, Great Wall Motor, SAIC, Chang’an Auto, and Dongfeng Motor. Tung Thih’s weakness reflected disappointing sales figures. The Fund eliminated the position very early in the fiscal year. |
| • | South Korean biotechnology company Medytox declined even as revenue and earnings grew. Market sentiment on Korean pharmaceuticals has been deteriorating due to delays and cancellations on drug development plans so Jennison eliminated the position due to the company’s higher risk profile. The company makes and markets plastic surgery and facial wrinkle reduction products, as well as muscular contractive therapies. Medytox has expanded from a strong Korean market into China, Taiwan, Japan, Thailand, India, Brazil, and more than 40 other global markets. |
| • | In information technology, 58.com was hurt by new government policies designed to ease the real estate bubble in China. Authorities moved to tighten home buyers’ qualifications, raise down payments, and restrict displays of home listing ads, dampening real estate markets in top-tier cities and forcing real estate agents, who provide a hefty portion of 58.com’s revenues, to cut costs. A leading online marketplace in China, 58.com facilitates connections, information-sharing, and transactions between small and medium-sized local businesses and consumers in almost 400 cities. The new policies represented a change to the Fund’s investment decision and Jennison eliminated the position. |
The percentage points shown in the tables below identify each security’s positive or negative contribution to the Fund’s return relative to the benchmark, which is the sum of all contributions by individual holdings.
| Top Contributors (%) | Top Detractors (%) | |||||
| Tencent Holdings Ltd. China | 4.38 | PT Matahari Department Store Tbk PT | –1.29 | |||
| Alibaba Group Holding Ltd China | 3.95 | 58.com, Inc (ADR) | –1.03 | |||
| MercadoLibre, Inc. Argentina | 3.24 | Alsea SAB de CV | –0.86 | |||
| Sociedad Quimica y Minera de Chile (ADR) | 2.92 | Tung Thih Electronic Co. Taiwan | –0.44 | |||
| Largan Precision Co., Ltd. Taiwan | 1.51 | Medy-Tox, Inc. Korea | –0.44 | |||
Current outlook
| • | Jennison believes overall conditions favor the Fund’s strategy over a reasonable investment horizon. Jennison remains focused on identifying businesses that can |
| 14 | Visit our website at pgiminvestments.com |
generate organic growth and that continue to benefit from structural changes in their industries. The strategy is heavily invested in consumer and technology stocks offering these characteristics. |
| • | The Fund’s overall view of the emerging markets macroeconomic environment has been turning more positive, as currencies have stabilized, gross domestic product growth has reaccelerated, commodities prices have improved, inflationary pressures have remained subdued, and central banks have eased monetary policy. However, potential geopolitical uncertainty stemming from possible US isolationism and trade protection under the new administration could trigger changes in relative currency valuations and spur reactive currency devaluations, which could create significant challenges, especially for emerging markets economies. |
| • | China’s struggle to drive economic growth through domestic consumer demand rather than exports and massive public works programs is a work in progress. A host of measures are designed to loosen monetary and fiscal policies and stimulate consumption. China continues to have a number of policy options to work with in the current environment, and heightened volatility may persist for a while. Although structural issues remain, high-frequency data suggest that conditions are improving and that the risk of a hard landing is fading. The positions the Fund holds in Chinese equities continue to focus on the rapidly growing e-commerce and Internet platform opportunities that have seen little, if any, impact from the pressures surrounding the broader economy. |
| Prudential Jennison Emerging Markets Equity Fund | 15 |
Fees and Expenses (unaudited)
As a shareholder of the Fund, you incur two types of costs: (1) transaction costs, including sales charges (loads) on purchase payments and redemptions, as applicable, and (2) ongoing costs, including management fees, distribution, and/or service (12b-1) fees, and other Fund expenses, as applicable. This example is intended to help you understand your ongoing costs (in dollars) of investing in the Fund and to compare these costs with the ongoing costs of investing in other mutual funds.
The example is based on an investment of $1,000 held through the six-month period ended October 31, 2017. The example is for illustrative purposes only; you should consult the Prospectus for information on initial and subsequent minimum investment requirements.
Actual Expenses
The first line for each share class in the table on the following page provides information about actual account values and actual expenses. You may use the information on this line, together with the amount you invested, to estimate the expenses that you paid over the period. Simply divide your account value by $1,000 (for example, an $8,600 account value ÷ $1,000 = 8.6), then multiply the result by the number on the first line under the heading “Expenses Paid During the Six-Month Period” to estimate the expenses you paid on your account during this period.
Hypothetical Example for Comparison Purposes
The second line for each share class in the table on the following page provides information about hypothetical account values and hypothetical expenses based on the Fund’s actual expense ratio and an assumed rate of return of 5% per year before expenses, which is not the Fund’s actual return. The hypothetical account values and expenses may not be used to estimate the actual ending account balance or expenses you paid for the period. You may use this information to compare the ongoing costs of investing in the Fund and other funds. To do so, compare this 5% hypothetical example with the 5% hypothetical examples that appear in the shareholder reports of the other funds.
The Fund’s transfer agent may charge additional fees to holders of certain accounts that are not included in the expenses shown in the table on the following page. These fees apply to individual retirement accounts (IRAs) and Section 403(b) accounts. As of the close of the six-month period covered by the table, IRA fees included an annual maintenance fee of $15 per account (subject to a maximum annual maintenance fee of $25 for all accounts held by the same shareholder). Section 403(b) accounts are charged an annual $25 fiduciary maintenance fee. Some of the fees may vary in amount, or may be waived, based on your total account balance or the number of Prudential funds, including the Fund, that you own. You should consider the additional fees that were charged to your Fund account
| 16 | Visit our website at pgiminvestments.com |
over the six-month period when you estimate the total ongoing expenses paid over the period and the impact of these fees on your ending account value, as these additional expenses are not reflected in the information provided in the expense table. Additional fees have the effect of reducing investment returns.
Please note that the expenses shown in the table are meant to highlight your ongoing costs only and do not reflect any transactional costs such as sales charges (loads). Therefore, the second line for each share class in the table is useful in comparing ongoing costs only and will not help you determine the relative total costs of owning different funds. In addition, if these transactional costs were included, your costs would have been higher.
| Prudential Jennison Emerging Markets Equity Fund | Beginning Account Value May 1, 2017 | Ending Account October 31, 2017 | Annualized Expense Ratio Based on the Six-Month Period | Expenses Paid During the Six-Month Period* | ||||||||||||||
| Class A | Actual | $ | 1,000.00 | $ | 1,142.00 | 1.45 | % | $ | 7.83 | |||||||||
| Hypothetical | $ | 1,000.00 | $ | 1,017.90 | 1.45 | % | $ | 7.38 | ||||||||||
| Class C | Actual | $ | 1,000.00 | $ | 1,138.50 | 2.20 | % | $ | 11.86 | |||||||||
| Hypothetical | $ | 1,000.00 | $ | 1,014.12 | 2.20 | % | $ | 11.17 | ||||||||||
| Class Q | Actual | $ | 1,000.00 | $ | 1,144.20 | 1.20 | % | $ | 6.49 | |||||||||
| Hypothetical | $ | 1,000.00 | $ | 1,019.16 | 1.20 | % | $ | 6.11 | ||||||||||
| Class Z | Actual | $ | 1,000.00 | $ | 1,144.20 | 1.20 | % | $ | 6.49 | |||||||||
| Hypothetical | $ | 1,000.00 | $ | 1,019.16 | 1.20 | % | $ | 6.11 | ||||||||||
*Fund expenses (net of fee waivers or subsidies, if any) for each share class are equal to the annualized expense ratio for each share class (provided in the table), multiplied by the average account value over the period, multiplied by the 184 days in the six-month period ended October 31, 2017, and divided by the 365 days in the Fund’s fiscal year ended October 31, 2017 (to reflect the six-month period). Expenses presented in the table include the expenses of any underlying funds in which the Fund may invest.
| Prudential Jennison Emerging Markets Equity Fund | 17 |
Schedule of Investments
as of October 31, 2017
| Description | Shares | Value | ||||||
LONG-TERM INVESTMENTS 98.2% | ||||||||
COMMON STOCKS 96.4% | ||||||||
Argentina 5.4% | ||||||||
MercadoLibre, Inc. | 3,558 | $ | 855,023 | |||||
Brazil 4.9% | ||||||||
Lojas Renner SA | 34,153 | 359,142 | ||||||
Raia Drogasil SA | 17,495 | 420,997 | ||||||
|
| |||||||
| 780,139 | ||||||||
Chile 4.7% | ||||||||
Sociedad Quimica y Minera de Chile SA, ADR | 12,508 | 747,228 | ||||||
China 32.4% | ||||||||
Alibaba Group Holding Ltd., ADR* | 6,431 | 1,189,028 | ||||||
Baidu, Inc., ADR* | 2,065 | 503,736 | ||||||
Ctrip.com International Ltd., ADR* | 12,155 | 582,103 | ||||||
JD.com, Inc., ADR* | 12,491 | 468,662 | ||||||
Jiangsu Hengrui Medicine Co. Ltd. (Class A Stock) | 41,940 | 425,330 | ||||||
Kweichow Moutai Co. Ltd. (Class A Stock) | 6,050 | 563,999 | ||||||
Tencent Holdings Ltd. | 31,972 | 1,436,985 | ||||||
|
| |||||||
| 5,169,843 | ||||||||
Hong Kong 1.1% | ||||||||
Sands China Ltd. | 38,107 | 179,775 | ||||||
India 20.2% | ||||||||
Ashok Leyland Ltd. | 190,140 | 385,368 | ||||||
Asian Paints Ltd. | 19,067 | 348,177 | ||||||
Biocon Ltd. | 65,435 | 363,247 | ||||||
Eicher Motors Ltd. | 646 | 321,760 | ||||||
Godrej Consumer Products Ltd. | 27,545 | 397,412 | ||||||
HDFC Bank Ltd., ADR | 3,451 | 318,527 | ||||||
MakeMyTrip Ltd.*(a) | 22,329 | 609,582 | ||||||
Maruti Suzuki India Ltd. | 3,773 | 478,648 | ||||||
|
| |||||||
| 3,222,721 | ||||||||
Indonesia 10.3% | ||||||||
Ace Hardware Indonesia Tbk PT | 4,870,011 | 450,674 | ||||||
Astra International Tbk PT | 615,922 | 363,312 | ||||||
Bank Rakyat Indonesia Persero Tbk PT | 310,610 | 357,357 | ||||||
Matahari Department Store Tbk PT | 223,918 | 141,932 | ||||||
Mitra Adiperkasa Tbk PT | 680,034 | 328,415 | ||||||
|
| |||||||
| 1,641,690 | ||||||||
See Notes to Financial Statements.
| Prudential Jennison Emerging Markets Equity Fund | 19 |
Schedule of Investments (continued)
as of October 31, 2017
| Description | Shares | Value | ||||||
COMMON STOCKS (Continued) | ||||||||
Malaysia 1.5% | ||||||||
IHH Healthcare Bhd | 182,990 | $ | 243,842 | |||||
Mexico 2.3% | ||||||||
Arca Continental SAB de CV | 56,603 | 360,224 | ||||||
Peru 1.5% | ||||||||
Credicorp Ltd. | 1,165 | 243,998 | ||||||
Russia 3.6% | ||||||||
Sberbank of Russia PJSC, ADR | 19,001 | 272,474 | ||||||
X5 Retail Group NV, GDR* | 7,433 | 310,941 | ||||||
|
| |||||||
| 583,415 | ||||||||
Taiwan 4.4% | ||||||||
Cathay Financial Holding Co. Ltd. | 195,000 | 322,222 | ||||||
Largan Precision Co. Ltd. | 2,000 | 379,119 | ||||||
|
| |||||||
| 701,341 | ||||||||
Thailand 4.1% | ||||||||
Bangkok Dusit Medical Services PCL | 324,240 | 206,971 | ||||||
CP ALL PCL | 214,246 | 451,496 | ||||||
|
| |||||||
| 658,467 | ||||||||
|
| |||||||
TOTAL COMMON STOCKS | 15,387,706 | |||||||
|
| |||||||
PREFERRED STOCK 1.8% | ||||||||
Brazil | ||||||||
Itau Unibanco Holding SA (PRFC) | 21,985 | 283,675 | ||||||
|
| |||||||
Units | ||||||||
RIGHTS* 0.0% | ||||||||
China | ||||||||
China Literature Ltd., expiring 11/01/17^ | 25 | — | ||||||
|
| |||||||
TOTAL LONG-TERM INVESTMENTS | 15,671,381 | |||||||
|
| |||||||
See Notes to Financial Statements.
| 20 |
| Description | Shares | Value | ||||||
SHORT-TERM INVESTMENTS 2.5% | ||||||||
AFFILIATED MUTUAL FUNDS | ||||||||
Prudential Investment Portfolios 2 - Prudential Core Ultra Short Bond Fund(w) | 380,415 | $ | 380,415 | |||||
Prudential Investment Portfolios 2 - Prudential Institutional Money | 23,894 | 23,897 | ||||||
|
| |||||||
TOTAL SHORT-TERM INVESTMENTS | 404,312 | |||||||
|
| |||||||
TOTAL INVESTMENTS 100.7% | 16,075,693 | |||||||
Liabilities in excess of other assets (0.7)% | (104,563 | ) | ||||||
|
| |||||||
NET ASSETS 100.0% | $ | 15,971,130 | ||||||
|
| |||||||
The following abbreviations are used in the annual report:
ADR—American Depositary Receipt
GDR—Global Depositary Receipt
LIBOR—London Interbank Offered Rate
PRFC—Preference Shares
| * | Non-income producing security. |
| ^ | Indicates a Level 3 security. The aggregate value of Level 3 securities is $0 and 0.0% of net assets. |
| (a) | All or a portion of security is on loan. The aggregate market value of such securities, including those sold and pending settlement, is $24,570; cash collateral of $23,556 (included in liabilities) was received with which the Series purchased highly liquid short-term investments. Cash collateral is less than 102% of the market value of securities loaned due to significant market increases on the last business day of the reporting period. Collateral was subsequently received on the following business day and the Series remained in compliance. |
| (b) | Represents security purchased with cash collateral received for securities on loan and includes dividend reinvestment. |
| (w) | PGIM Investments LLC, the manager of the Series, also serves as manager of the Prudential Investment Portfolios 2 - Prudential Core Ultra Short Bond Fund and Prudential Institutional Money Market Fund. |
Fair Value Measurements:
Various inputs are used in determining the value of the Series’ investments. These inputs are summarized in the three broad levels listed below.
Level 1—unadjusted quoted prices generally in active markets for identical securities.
Level 2—quoted prices for similar securities, interest rates and yield curves, prepayment speeds, foreign currency exchange rates and other observable inputs.
Level 3—unobservable inputs for securities valued in accordance with Board approved fair valuation procedures.
See Notes to Financial Statements.
| Prudential Jennison Emerging Markets Equity Fund | 21 |
Schedule of Investments (continued)
as of October 31, 2017
The following is a summary of the inputs used as of October 31, 2017 in valuing such portfolio securities:
| Level 1 | Level 2 | Level 3 | ||||||||||
Investments in Securities | ||||||||||||
Common Stocks | ||||||||||||
Argentina | $ | 855,023 | $ | — | $ | — | ||||||
Brazil | 780,139 | — | — | |||||||||
Chile | 747,228 | — | — | |||||||||
China | 2,743,529 | 2,426,314 | — | |||||||||
Hong Kong | — | 179,775 | — | |||||||||
India | 928,109 | 2,294,612 | — | |||||||||
Indonesia | — | 1,641,690 | — | |||||||||
Malaysia | — | 243,842 | — | |||||||||
Mexico | 360,224 | — | — | |||||||||
Peru | 243,998 | — | — | |||||||||
Russia | 583,415 | — | — | |||||||||
Taiwan | — | 701,341 | — | |||||||||
Thailand | — | 658,467 | — | |||||||||
Preferred Stock | ||||||||||||
Brazil | 283,675 | — | — | |||||||||
Rights | ||||||||||||
China | — | — | — | |||||||||
Affiliated Mutual Funds | 404,312 | — | — | |||||||||
|
|
|
|
|
| |||||||
Total | $ | 7,929,652 | $ | 8,146,041 | $ | — | ||||||
|
|
|
|
|
| |||||||
It is the Series’ policy to recognize transfers in and transfers out at the fair value as of the beginning of period. Securities transferred levels as follows:
Investments in Securities | Amount Transferred | Level Transfer | Logic | |||||||||
Common Stocks | $ | 276,373 | L1 to L2 | Official Close to Model Price | ||||||||
See Notes to Financial Statements.
| 22 |
Industry Classification:
The industry classification of investments and liabilities in excess of other assets shown as a percentage of net assets as of October 31, 2017 were as follows (unaudited):
Internet Software & Services | 25.0 | % | ||
Internet & Direct Marketing Retail | 10.4 | |||
Banks | 9.2 | |||
Food & Staples Retailing | 7.4 | |||
Chemicals | 6.9 | |||
Beverages | 5.8 | |||
Automobiles | 5.3 | |||
Multiline Retail | 5.2 | |||
Machinery | 4.4 | |||
Health Care Providers & Services | 2.8 | |||
Specialty Retail | 2.8 | |||
Pharmaceuticals | 2.7 | |||
Affiliated Mutual Funds (including 0.1% of collateral for securities on loan) | 2.5 | % | ||
Personal Products | 2.5 | |||
Electronic Equipment, Instruments & Components | 2.4 | |||
Biotechnology | 2.3 | |||
Insurance | 2.0 | |||
Hotels, Restaurants & Leisure | 1.1 | |||
|
| |||
| 100.7 | ||||
Liabilities in excess of other assets | (0.7 | ) | ||
|
| |||
| 100.0 | % | |||
|
|
Effects of Derivative Instruments on the Financial Statements and Primary Underlying Risk Exposure:
The Series invested in derivative instruments during the reporting period. The primary type of risk associated with these derivative instruments is equity contracts risk. The effect of such derivative instruments on the Series’ financial position and financial performance as reflected in the Statement of Assets and Liabilities and Statement of Operations is presented in the summary below.
Fair values of derivative instruments as of October 31, 2017 as presented in the Statement of Assets and Liabilities:
Derivatives not accounted for as hedging instruments, carried at fair value | Asset Derivatives | Liability Derivatives | ||||||
| Balance Sheet Location | Fair Value | Balance Sheet Location | Fair Value | |||||
| Equity contracts | Unaffiliated investments | $— | — | $— | ||||
|
| |||||||
See Notes to Financial Statements.
| Prudential Jennison Emerging Markets Equity Fund | 23 |
Schedule of Investments (continued)
as of October 31, 2017
The effects of derivative instruments on the Statement of Operations for the year ended October 31, 2017 are as follows:
Amount of Realized Gain (Loss) on Derivatives Recognized in Income | ||||
Derivatives not accounted for as hedging instruments, carried at fair value | Warrants(1) | |||
Equity contracts | $ | 7,617 | ||
|
| |||
| (1) | Included in net realized gain (loss) on investments transactions in the Statement of Operations. |
Change in Unrealized Appreciation (Depreciation) on Derivatives Recognized in Income | ||||||||||||
Derivatives not accounted for as hedging | Rights(2) | Warrants(2) | Total | |||||||||
Equity contracts | $ | — | $ | (6,239 | ) | $ | (6,239 | ) | ||||
|
|
|
|
|
| |||||||
| (2) | Included in net change in unrealized appreciation (depreciation) on investments in the Statement of Operations. |
Financial Instruments/Transactions—Summary of Offsetting and Netting Arrangements:
The Series entered into financial instruments/transactions during the reporting period that are either offset in accordance with current requirements or are subject to enforceable master netting arrangements or similar agreements that permit offsetting. The information about offsetting and related netting arrangements for financial instruments/transactions, where the legal right to set-off exists, is presented in the summary below.
Offsetting of financial instruments/transactions assets and liabilities:
Description | Gross Market Value of Recognized Assets/(Liabilities) | Collateral Pledged/(Received)(1) | Net Amount | |||||||||
Securities on Loan | $ | 24,570 | $ | (23,556 | ) | $ | 1,014 | |||||
|
| |||||||||||
| (1) | Collateral amount disclosed by the Series is limited to the market value of financial instruments/transactions. |
See Notes to Financial Statements.
| 24 |
This Page Intentionally Left Blank
Statement of Assets & Liabilities
as of October 31, 2017
Assets | ||||
Investments at value, including securities on loan of $24,570: | ||||
Unaffiliated investments (cost $11,409,994) | $ | 15,671,381 | ||
Affiliated investments (cost $404,312) | 404,312 | |||
Receivable for Series shares sold | 26,478 | |||
Dividends and interest receivable | 4,529 | |||
Receivable for investments sold | 282 | |||
Prepaid expenses | 835 | |||
|
| |||
Total assets | 16,107,817 | |||
|
| |||
Liabilities | ||||
Foreign capital gains tax liability | 59,280 | |||
Payable for investments purchased | 26,927 | |||
Payable to broker for collateral for securities on loan | 23,556 | |||
Custodian and accounting fees payable | 10,530 | |||
Shareholders’ reports payable | 8,262 | |||
Accrued expenses and other liabilities | 4,444 | |||
Distribution fee payable | 1,730 | |||
Management fee payable | 1,212 | |||
Affiliated transfer agent fee payable | 746 | |||
|
| |||
Total liabilities | 136,687 | |||
|
| |||
Net Assets | $ | 15,971,130 | ||
|
| |||
Net assets were comprised of: | ||||
Common stock, at par | $ | 14,233 | ||
Paid-in capital in excess of par | 14,016,810 | |||
|
| |||
| 14,031,043 | ||||
Accumulated net investment loss | (23,966 | ) | ||
Accumulated net realized loss on investment and foreign currency transactions | (2,237,904 | ) | ||
Net unrealized appreciation on investments and foreign currencies | 4,201,957 | |||
|
| |||
Net assets, October 31, 2017 | $ | 15,971,130 | ||
|
| |||
See Notes to Financial Statements.
| 26 |
Class A | ||||
Net asset value, offering price and redemption price per share, | $ | 11.19 | ||
Maximum sales charge (5.50% of offering price) | 0.65 | |||
|
| |||
Maximum offering price to public | $ | 11.84 | ||
|
| |||
Class C | ||||
Net asset value, offering price and redemption price per share, | $ | 10.93 | ||
|
| |||
Class Q | ||||
Net asset value, offering price and redemption price per share, | $ | 11.27 | ||
|
| |||
Class Z | ||||
Net asset value, offering price and redemption price per share, | $ | 11.27 | ||
|
| |||
See Notes to Financial Statements.
| Prudential Jennison Emerging Markets Equity Fund | 27 |
Statement of Operations
Year Ended October 31, 2017
Net Investment Income (Loss) | ||||
Income | ||||
Unaffiliated dividend income (net of foreign withholding taxes of $16,854) | $ | 127,582 | ||
Affiliated dividend income | 5,991 | |||
Income from securities lending, net (including affiliated income of $800) | 2,645 | |||
|
| |||
Total income | 136,218 | |||
|
| |||
Expenses | ||||
Management fee | 133,552 | |||
Distribution fee—Class A | 4,090 | |||
Distribution fee—Class C | 9,727 | |||
Custodian and accounting fees | 64,000 | |||
Registration fees | 53,000 | |||
Audit fee | 29,000 | |||
Shareholders’ reports | 23,000 | |||
Legal fees and expenses | 20,000 | |||
Directors’ fees | 10,000 | |||
Transfer agent’s fees and expenses (including affiliated expense of $3,600) | 7,000 | |||
Miscellaneous | 19,562 | |||
|
| |||
Total expenses | 372,931 | |||
Less: Management fee waiver and/or expense reimbursement | (206,484 | ) | ||
Distribution fee waiver—Class A | (682 | ) | ||
|
| |||
Net expenses | 165,765 | |||
|
| |||
Net investment income (loss) | (29,547 | ) | ||
|
| |||
Realized And Unrealized Gain (Loss) On Investments And Foreign Currency Transactions | ||||
Net realized gain (loss) on: | ||||
Investment transactions (Including affiliated of $156) | (112,669 | ) | ||
Foreign currency transactions | (3,425 | ) | ||
|
| |||
| (116,094 | ) | |||
|
| |||
Net change in unrealized appreciation (depreciation) on: | ||||
Investments (Including affiliated of ($153)) (net of change in foreign capital gains taxes $(59,280)) | 2,602,796 | |||
Foreign currencies | (265 | ) | ||
|
| |||
| 2,602,531 | ||||
|
| |||
Net gain (loss) on investment and foreign currency transactions | 2,486,437 | |||
|
| |||
Net Increase (Decrease) In Net Assets Resulting From Operations | $ | 2,456,890 | ||
|
| |||
See Notes to Financial Statements.
| 28 |
Statement of Changes in Net Assets
| Year Ended October 31, | ||||||||
| 2017 | 2016 | |||||||
Increase (Decrease) in Net Assets | ||||||||
Operations | ||||||||
Net investment income (loss) | $ | (29,547 | ) | $ | (36,576 | ) | ||
Net realized gain (loss) on investment and foreign currency transactions | (116,094 | ) | (1,054,244 | ) | ||||
Net change in unrealized appreciation (depreciation) on investments and foreign currencies | 2,602,531 | 1,752,198 | ||||||
|
|
|
| |||||
Net increase (decrease) in net assets resulting from operations | 2,456,890 | 661,378 | ||||||
|
|
|
| |||||
Series share transactions (Net of share conversions) | ||||||||
Net proceeds from shares sold | 3,369,561 | 1,120,407 | ||||||
Cost of shares reacquired | (1,045,433 | ) | (464,853 | ) | ||||
|
|
|
| |||||
Net increase (decrease) in net assets from Series share transactions | 2,324,128 | 655,554 | ||||||
|
|
|
| |||||
Total increase (decrease) | 4,781,018 | 1,316,932 | ||||||
Net Assets: | ||||||||
Beginning of year | 11,190,112 | 9,873,180 | ||||||
|
|
|
| |||||
End of year | $ | 15,971,130 | $ | 11,190,112 | ||||
|
|
|
| |||||
See Notes to Financial Statements.
| Prudential Jennison Emerging Markets Equity Fund | 29 |
Notes to Financial Statements
Prudential World Fund, Inc. (the “Fund”) is registered under the Investment Company Act of 1940, as amended (“1940 Act”), as an open-end management investment company and currently consists of seven investment portfolios: Prudential Emerging Markets Debt Hard Currency Fund and Prudential Emerging Markets Debt Local Currency Fund which are non-diversified funds and Prudential Jennison Emerging Markets Equity Fund, Prudential Jennison Global Infrastructure Fund, Prudential Jennison Global Opportunities Fund, Prudential Jennison International Opportunities Fund and Prudential QMA International Equity Fund which are diversified funds. These financial statements relate to the Prudential Jennison Emerging Markets Equity Fund (the “Series”).
The investment objective of the Series is to seek long-term growth of capital.
1. Accounting Policies
The Series follows investment company accounting and reporting guidance of the Financial Accounting Standards Board (“FASB”) Accounting Standard Codification Topic 946 Financial Services—Investment Companies. The following accounting policies conform to U.S. generally accepted accounting principles. The Series consistently follows such policies in the preparation of its financial statements.
Securities Valuation: The Series holds securities and other assets and liabilities that are fair valued at the close of each day (generally, 4:00 PM Eastern time) the New York Stock Exchange (“NYSE”) is open for trading. Fair value is the price that would be received to sell an asset or paid to transfer a liability in an orderly transaction between market participants on the measurement date. The Board of Directors (the “Board”) has adopted valuation procedures for security valuation under which fair valuation responsibilities have been delegated to PGIM Investments LLC (“PGIM Investments” or “the Manager”) (formerly known as Prudential Investments LLC). Under the current valuation procedures, the Valuation Committee is responsible for supervising the valuation of portfolio securities and other assets and liabilities. The valuation procedures permit the Series to utilize independent pricing vendor services, quotations from market makers, and alternative valuation methods when market quotations are either not readily available or not deemed representative of fair value. A record of the Valuation Committee’s actions is subject to the Board’s review, approval, and ratification at its next regularly scheduled quarterly meeting.
Various inputs determine how the Series’ investments are valued, all of which are categorized according to the three broad levels (Level 1, 2, or 3) detailed in the Schedule of Investments.
Common and preferred stocks, exchange-traded funds, and derivative instruments, such as futures or options, that are traded on a national securities exchange are valued at the
| 30 |
last sale price as of the close of trading on the applicable exchange where the security principally trades. Securities traded via NASDAQ are valued at the NASDAQ official closing price. To the extent these securities are valued at the last sale price or NASDAQ official closing price, they are classified as Level 1 in the fair value hierarchy. In the event that no sale or official closing price on valuation date exists, these securities are generally valued at the mean between the last reported bid and ask prices, or at the last bid price in the absence of an ask price. These securities are classified as Level 2 in the fair value hierarchy.
Foreign equities traded on foreign securities exchanges are generally valued using pricing vendor services that provide model prices derived using adjustment factors based on information such as local closing price, relevant general and sector indices, currency fluctuations, depositary receipts, and futures, as applicable. Securities valued using such model prices are classified as Level 2 in the fair value hierarchy. The models generate an evaluated adjustment factor for each security, which is applied to the local closing price to adjust it for post closing market movements. Utilizing that evaluated adjustment factor, the vendor provides an evaluated price for each security. If the vendor does not provide an evaluated price, securities are valued in accordance with exchange-traded common and preferred stock valuation policies discussed above.
Investments in open-end, non-exchange-traded mutual funds are valued at their net asset values as of the close of the NYSE on the date of valuation. These securities are classified as Level 1 in the fair value hierarchy since they may be purchased or sold at their net asset values on the date of valuation.
Securities and other assets that cannot be priced according to the methods described above are valued based on pricing methodologies approved by the Board. In the event that unobservable inputs are used when determining such valuations, the securities will be classified as Level 3 in the fair value hierarchy.
When determining the fair value of securities, some of the factors influencing the valuation include: the nature of any restrictions on disposition of the securities; assessment of the general liquidity of the securities; the issuer’s financial condition and the markets in which it does business; the cost of the investment; the size of the holding and the capitalization of the issuer; the prices of any recent transactions or bids/offers for such securities or any comparable securities; any available analyst media or other reports or information deemed reliable by the investment manager regarding the issuer or the markets or industry in which it operates. Using fair value to price securities may result in a value that is different from a security’s most recent closing price and from the price used by other unaffiliated mutual funds to calculate their net asset values.
Restricted and Illiquid Securities: Subject to guidelines adopted by the Board, the Series may invest up to 15% of its net assets in illiquid securities, including those which are restricted as to disposition under securities law (“restricted securities”). Restricted securities are valued pursuant to the valuation procedures noted above. Illiquid securities are those that, because of the absence of a readily available market or due to legal or
| Prudential Jennison Emerging Markets Equity Fund | 31 |
Notes to Financial Statements (continued)
contractual restrictions on resale, cannot be sold within seven days in the ordinary course of business at approximately the amount at which the Series has valued the investment. Therefore, the Series may find it difficult to sell illiquid securities at the time considered most advantageous by its Subadviser and may incur expenses that would not be incurred in the sale of securities that were freely marketable. Certain securities that would otherwise be considered illiquid because of legal restrictions on resale to the general public may be traded among qualified institutional buyers under Rule 144A of the Securities Act of 1933. These Rule 144A securities, as well as commercial paper that is sold in private placements under Section 4(2) of the Securities Act, may be deemed liquid by the Series’ Subadviser under the guidelines adopted by the Directors of the Series. However, the liquidity of the Series’ investments in Rule 144A securities could be impaired if trading does not develop or declines.
Foreign Currency Translation: The books and records of the Series are maintained in U.S. dollars. Foreign currency amounts are translated into U.S. dollars on the following basis:
(i) market value of investment securities, other assets and liabilities—at the current rates of exchange;
(ii) purchases and sales of investment securities, income and expenses—at the rates of exchange prevailing on the respective dates of such transactions.
Although the net assets of the Series are presented at the foreign exchange rates and market values at the close of the period, the Series does not generally isolate that portion of the results of operations arising as a result of changes in the foreign exchange rates from the fluctuations arising from changes in the market prices of long-term portfolio securities held at the end of the period. Similarly, the Series does not isolate the effect of changes in foreign exchange rates from the fluctuations arising from changes in the market prices of long-term portfolio securities sold during the period. Accordingly, holding period realized foreign currency gains (losses) are included in the reported net realized gains (losses) on investment transactions.
Net realized gains (losses) on foreign currency transactions represent net foreign exchange gains (losses) from the disposition of holdings of foreign currencies, forward currency contracts, currency gains (losses) realized between the trade and settlement dates on securities transactions, and the difference between the amounts of interest, dividends and foreign withholding taxes recorded on the Series’ books and the U.S. dollar equivalent amounts actually received or paid. Net unrealized currency gains (losses) from valuing foreign currency denominated assets and liabilities (other than investments) at period end exchange rates are reflected as a component of net unrealized appreciation (depreciation) on foreign currencies.
| 32 |
Master Netting Arrangements: The Series is subject to various Master Agreements, or netting arrangements, with select counterparties. These are agreements which a subadviser may have negotiated and entered into on behalf of the Series. A master netting arrangement between the Series and the counterparty permits the Series to offset amounts payable by the Series to the same counterparty against amounts to be received; and by the receipt of collateral from the counterparty by the Series to cover the Series’ exposure to the counterparty. However, there is no assurance that such mitigating factors are easily enforceable. In addition to master netting arrangements, the right to set-off exists when all the conditions are met such that each of the parties owes the other determinable amounts, the reporting party has the right to set-off the amount owed with the amount owed by the other party, the reporting party intends to set-off and the right of set-off is enforceable by law. During the reporting period, there was no intention to settle on a net basis and all amounts are presented on a gross basis on the Statement of Assets and Liabilities.
Warrants and Rights: The Series may hold warrants and rights acquired either through a direct purchase, included as part of a private placement, or pursuant to corporate actions. Warrants and rights entitle the holder to buy a proportionate amount of common stock, or such other security that the issuer may specify, at a specific price and time through the expiration dates. Such warrants and rights are held as long positions by the Series until exercised, sold or expired. Warrants and rights are valued at fair value in accordance with the Board approved fair valuation procedures.
Securities Lending: The Series may lend its portfolio securities to banks and broker-dealers. The loans are secured by collateral at least equal to the market value of the securities loaned. Collateral pledged by each borrower is invested in an affiliated money market fund and is marked to market daily, based on the previous day’s market value, such that the value of the collateral exceeds the value of the loaned securities. Loans are subject to termination at the option of the borrower or the Series. Upon termination of the loan, the borrower will return to the Series securities identical to the loaned securities. Should the borrower of the securities fail financially, the Series has the right to repurchase the securities in the open market using the collateral. The Series recognizes income, net of any rebate and securities lending agent fees, for lending its securities in the form of fees or interest on the investment of any cash received as collateral. The borrower receives all interest and dividends from the securities loaned and such payments are passed back to the lender in amounts equivalent thereto. The Series also continues to recognize any unrealized gain (loss) in the market price of the securities loaned and on the change in the value of the collateral invested that may occur during the term of the loan. In addition, realized gain (loss) is recognized on changes in the value of the collateral invested upon liquidation of the collateral. Net earnings from securities lending are disclosed on the Statement of Operations as “Income from securities lending, net”.
Concentration of Risk: Foreign security and currency transactions may involve certain considerations and risks not typically associated with those of domestic origin as a result of, among other factors, the possibility of political or economic instability or the level of governmental supervision and regulation of foreign securities markets.
| Prudential Jennison Emerging Markets Equity Fund | 33 |
Notes to Financial Statements (continued)
Securities Transactions and Net Investment Income: Securities transactions are recorded on the trade date. Realized gains (losses) from investment and currency transactions are calculated on the specific identification method. Dividend income is recorded on the ex-date. Interest income, including amortization of premium and accretion of discount on debt securities, as required, is recorded on the accrual basis. Expenses are recorded on an accrual basis, which may require the use of certain estimates by management that may differ from actual.
Net investment income or loss (other than distribution fees which are charged directly to the respective class and transfer agency fees specific to Class Q shares which are charged to that share class) and unrealized and realized gains (losses) are allocated daily to each class of shares based upon the relative proportion of adjusted net assets of each class at the beginning of the day.
Taxes: It is the Series’ policy to continue to meet the requirements of the Internal Revenue Code applicable to regulated investment companies and to distribute all of its taxable net investment income and capital gains, if any, to its shareholders. Therefore, no federal income tax provision is required. Withholding taxes on foreign dividends, interest and capital gains, if any, are recorded, net of reclaimable amounts, at the time the related income is earned.
Dividends and Distributions: The Series expects to pay dividends from net investment income and distributions from net realized capital and currency gains, if any, annually. Dividends and distributions to shareholders, which are determined in accordance with federal income tax regulations and which may differ from generally accepted accounting principles, are recorded on the ex-date. Permanent book/tax differences relating to income and gain (loss) are reclassified amongst undistributed net investment income, accumulated net realized gain (loss) and paid-in capital in excess of par, as appropriate.
Estimates: The preparation of financial statements requires management to make estimates and assumptions that affect the reported amounts and disclosures in the financial statements. Actual results could differ from those estimates.
2. Agreements
The Fund, on behalf of the Series, has a management agreement with PGIM Investments. Pursuant to this agreement, PGIM Investments has responsibility for all investment advisory services and supervises the subadviser’s performance of such services. PGIM Investments has entered into a subadvisory agreement with Jennison Associates LLC (“Jennison”). The subadvisory agreement provides that Jennison will furnish investment
| 34 |
advisory services in connection with the management of the Series. In connection therewith, Jennison is obligated to keep certain books and records of the Series. PGIM Investments pays for the services of Jennison, the cost of compensation of officers of the Series, occupancy and certain clerical and bookkeeping costs of the Series. The Series bears all other costs and expenses.
The management fee paid to PGIM Investments is accrued daily and payable monthly, at an annual rate of 1.05% of the Series’ average daily net assets up to $5 billion and 1.025% of the Series’ average daily net assets in excess of $5 billion. The effective management fee rate before any waivers and/or expense reimbursement was 1.05% for the year ended October 31, 2017. For the year ended October 31, 2017, the expense reimbursement exceeded the effective management fee.
PGIM Investments has contractually agreed through February 28, 2019 to limit the net annual operating expenses (exclusive of distribution and service (12b-1) fees, taxes (such as income and foreign withholdings taxes, stamp duty and deferred tax expenses), interest, underlying funds, brokerage, extraordinary and certain other expenses such as dividend, broker charges and interest expense on short sales) of each class of shares of the Fund to 1.20% of the Fund’s average daily net assets. Expenses waived/reimbursed by the Manager in accordance with this agreement may be recouped by the Manager within the same fiscal year during which such waiver/reimbursement is made if such recoupment can be realized without exceeding the expense limit in effect at the time of the recoupment for that fiscal year.
The Fund, on behalf of the Series, has a distribution agreement with Prudential Investment Management Services LLC (“PIMS”) which acts as the distributor of the Class A, Class C, Class Q and Class Z shares of the Series. The Series compensates PIMS for distributing and servicing the Series’ Class A and Class C shares, pursuant to plans of distribution (the “Distribution Plans”), regardless of expenses actually incurred by PIMS. The distribution fees are accrued daily and payable monthly. No distribution or service fees are paid to PIMS as distributor of the Class Q shares and Class Z shares of the Series.
Pursuant to the Distribution Plans, the Series compensates PIMS for distribution related activities at an annual rate of up to .30% and 1% of the average daily net assets of the Class A and C shares, respectively. PIMS has contractually agreed to limit such fee to .25% of the average daily net assets of the Class A shares through February 28, 2019.
PIMS has advised the Series that it has received $15,522 in front-end sales charges resulting from sales of Class A shares during the year ended October 31, 2017. From these fees, PIMS paid such sales charges to affiliated broker-dealers, which in turn paid commissions to salespersons and incurred other distribution costs.
PIMS has advised the Series that for the year ended October 31, 2017 it received $33 in contingent deferred sales charges imposed upon redemptions by certain Class C shareholders.
| Prudential Jennison Emerging Markets Equity Fund | 35 |
Notes to Financial Statements (continued)
PGIM Investments, PIMS and Jennison are indirect, wholly-owned subsidiaries of Prudential Financial, Inc. (“Prudential”).
3. Other Transactions with Affiliates
Prudential Mutual Fund Services LLC (“PMFS”), an affiliate of PGIM Investments and an indirect, wholly-owned subsidiary of Prudential, serves as the Series’ transfer agent. Transfer agent’s fees and expenses in the Statement of Operations include certain out-of-pocket expenses paid to non-affiliates, where applicable.
The Series may enter into certain securities purchase or sale transactions under Board approved Rule 17a-7 procedures. Rule 17a-7 is an exemptive rule under the 1940 Act, that permits purchase and sale transactions among affiliated investment companies, or between an investment company and a person that is affiliated solely by reason of having a common (or affiliated) investment adviser, common directors, and/or common officers. Such transactions are subject to ratification by the Board. For the reporting period ended October 31, 2017 no such transactions were entered into by the Series.
The Series may invest its overnight sweep cash in the Prudential Core Ultra Short Bond Fund (the “Core Fund”), and its securities lending cash collateral in the Prudential Institutional Money Market Fund (the “Money Market Fund”), each a series of Prudential Investment Portfolios 2, registered under the 1940 Act and managed by PGIM Investments. For the reporting period ended October 31, 2017, PGIM, Inc. was compensated $516 by PGIM Investments for managing the Series’ securities lending cash collateral as subadviser to the Money Market Fund. Earnings from the Core Fund and Money Market Fund are disclosed on the Statement of Operations as “Affiliated dividend income” and “Income from securities lending, net”, respectively.
4. Portfolio Securities
The aggregate cost of purchases and proceeds from sales of portfolio securities (excluding short-term investments and U.S. Government securities) for the year ended October 31, 2017 were $7,838,647 and $5,473,659, respectively.
5. Distributions and Tax Information
Distributions to shareholders, which are determined in accordance with federal income tax regulations, which may differ from generally accepted accounting principles, are recorded on the ex-date. In order to present accumulated net investment loss, accumulated net realized loss on investment and foreign currency transactions and paid-in capital in excess of par on
| 36 |
the Statement of Assets and Liabilities that more closely represent their tax character, certain adjustments have been made to accumulated net investment loss, accumulated net realized loss on investment and foreign currency transactions and paid-in capital in excess of par. For the tax year ended October 31, 2017 the adjustments were to decrease accumulated net investment loss by $24,070, decrease accumulated net realized loss on investment and foreign currency transactions by $3,425 and decrease paid-in capital in excess of par by $27,495 due to the differences in the treatment for book and tax purposes of certain transactions involving foreign securities and a net operating loss. Net investment loss, net realized gain (loss) on investment and foreign currencies transactions and net assets were not affected by this change.
For the tax years ended October 31, 2017, and October 31, 2016, there were no distributions paid by the Series.
As of October 31, 2017, the Series had no undistributed earnings on a tax basis.
The United States federal income tax basis of the Series’ investments and the net unrealized appreciation as of October 31, 2017 were as follows:
Tax Basis | Gross | Gross | Net | |||
| $11,873,738 | $4,509,852 | $(307,897) | $4,201,955 |
The book basis may differ from tax basis due to tax-related adjustments.
For federal income tax purposes, the Series had a capital loss carryforward of approximately $2,238,000 which can be carried forward for an unlimited period. No capital gains distributions are expected to be paid to shareholders until net gains have been realized in excess of such losses.
The Series elected to treat late year ordinary losses of approximately $24,000 as having been incurred in the following fiscal year (October 31, 2018).
Management has analyzed the Series’ tax positions taken on federal, state and local income tax returns for all open tax years and has concluded that no provision for income tax is required in the Series’ financial statements for the current reporting period. The Series’ federal, state and local income and federal excise tax returns for tax years for which the applicable statutes of limitations have not expired are subject to examination by the Internal Revenue Service and state departments of revenue.
6. Capital
The Series offers Class A, Class C, Class Q and Class Z shares. Class A shares are sold with a maximum front-end sales charge of 5.50%. Investors who purchase $1 million or more of Class A shares and sell these shares within 12 months of purchase are subject to a contingent deferred sales charge (“CDSC”) of 1%, although they are not subject to an initial
| Prudential Jennison Emerging Markets Equity Fund | 37 |
Notes to Financial Statements (continued)
sales charge. The Class A CDSC is waived for certain retirement and/or benefit plans. Class C shares are sold with a CDSC of 1% on sales made within 12 months of purchase. A special exchange privilege is also available for shareholders who qualified to purchase Class A shares at net asset value. Class Q and Class Z shares are not subject to any sales or redemption charge and are available exclusively for sale to a limited group of investors.
Under certain circumstances, an exchange may be made from specified share classes of the Series to one or more other share classes of the Series as presented in the table of transactions in shares of common stock.
The Fund is authorized to issue 4.8 billion shares of common stock, with a par value of $.01 per share, which is divided into seven series. There are 865 million shares authorized for the Series, divided into five classes, designated Class A, Class C, Class Q, Class Z and Class T common stock, each of which consists of 25 million, 65 million, 250 million, 300 million and 225 million authorized shares, respectively. The Series currently does not have any Class T shares outstanding.
As of October 31, 2017, Prudential through its affiliate entities, including affiliated funds, owned 1,000,515 shares of Class Q. At reporting period end, two shareholders of record held 79% of the Series’ outstanding shares, of which 71% were held by an affiliate of Prudential.
Transactions in shares of common stock were as follows:
Class A | Shares | Amount | ||||||
Year ended October 31, 2017: | ||||||||
Shares sold | 156,262 | $ | 1,561,350 | |||||
Shares reacquired† | (50,106 | ) | (484,454 | ) | ||||
|
|
|
| |||||
Net increase (decrease) in shares outstanding before conversion | 106,156 | 1,076,896 | ||||||
Shares reacquired upon conversion into other share class(es) | (2,111 | ) | (22,119 | ) | ||||
|
|
|
| |||||
Net increase (decrease) in shares outstanding | 104,045 | $ | 1,054,777 | |||||
|
|
|
| |||||
Year ended October 31, 2016: | ||||||||
Shares sold | 73,952 | $ | 650,175 | |||||
Shares reacquired | (13,892 | ) | (121,759 | ) | ||||
|
|
|
| |||||
Net increase (decrease) in shares outstanding before conversion | 60,060 | 528,416 | ||||||
Shares reacquired upon conversion into other share class(es) | (2,403 | ) | (21,648 | ) | ||||
|
|
|
| |||||
Net increase (decrease) in shares outstanding | 57,657 | $ | 506,768 | |||||
|
|
|
| |||||
| 38 |
Class C | Shares | Amount | ||||||
Year ended October 31, 2017: | ||||||||
Shares sold | 77,848 | $ | 791,362 | |||||
Shares reacquired† | (10,893 | ) | (103,832 | ) | ||||
|
|
|
| |||||
Net increase (decrease) in shares outstanding before conversion | 66,955 | 687,530 | ||||||
Shares reacquired upon conversion into other share class(es) | (7,961 | ) | (85,348 | ) | ||||
|
|
|
| |||||
Net increase (decrease) in shares outstanding | 58,994 | $ | 602,182 | |||||
|
|
|
| |||||
Year ended October 31, 2016: | ||||||||
Shares sold | 18,264 | $ | 163,648 | |||||
Shares reacquired | (14,302 | ) | (127,007 | ) | ||||
|
|
|
| |||||
Net increase (decrease) in shares outstanding before conversion | 3,962 | $ | 36,641 | |||||
|
|
|
| |||||
Class Q | ||||||||
Year ended October 31, 2017: | ||||||||
Shares reacquired† | (1,000 | ) | $ | (10,735 | ) | |||
|
|
|
| |||||
Net increase (decrease) in shares outstanding | (1,000 | ) | $ | (10,735 | ) | |||
|
|
|
| |||||
Year ended October 31, 2016 | ||||||||
Shares sold | — | $ | — | |||||
Shares reacquired | — | — | ||||||
|
|
|
| |||||
Net increase (decrease) in shares outstanding | — | $ | — | |||||
|
|
|
| |||||
Class Z | ||||||||
Year ended October 31, 2017: | ||||||||
Shares sold | 101,704 | $ | 1,016,849 | |||||
Shares reacquired† | (44,028 | ) | (446,412 | ) | ||||
|
|
|
| |||||
Net increase (decrease) in shares outstanding before conversion | 57,676 | 570,437 | ||||||
Shares issued upon conversion from other share class(es) | 9,834 | 107,467 | ||||||
|
|
|
| |||||
Net increase (decrease) in shares outstanding | 67,510 | $ | 677,904 | |||||
|
|
|
| |||||
Year ended October 31, 2016: | ||||||||
Shares sold | 34,206 | $ | 306,584 | |||||
Shares reacquired | (23,906 | ) | (216,087 | ) | ||||
|
|
|
| |||||
Net increase (decrease) in shares outstanding before conversion | 10,300 | 90,497 | ||||||
Shares issued upon conversion from other share class(es) | 2,400 | 21,648 | ||||||
|
|
|
| |||||
Net increase (decrease) in shares outstanding | 12,700 | $ | 112,145 | |||||
|
|
|
| |||||
| † | Includes affiliated redemption of 1,000 shares with a value of $10,720 for Class A shares, 1,000 shares with a value of $10,490 for Class C shares, 1,000 shares with a value of $10,796 for Class Q shares and 1,000 shares with a value of $10,800 for Class Z shares. |
7. Borrowings
The Fund, on behalf of the Series, along with other affiliated registered investment companies (the “Funds”), is a party to a Syndicated Credit Agreement (“SCA”) with a group of banks. The purpose of the SCA is to provide an alternative source of temporary funding for capital share redemptions. The SCA provides for a commitment of $900 million for the period October 5, 2017 through October 4, 2018. The Funds pay an annualized commitment fee of .15% of the unused portion of the SCA. The Series’ portion of the
| Prudential Jennison Emerging Markets Equity Fund | 39 |
Notes to Financial Statements (continued)
commitment fee for the unused amount, allocated based upon a method approved by the Board, is accrued daily and paid quarterly. Prior to October 5, 2017, the Funds had another SCA that provided a commitment of $900 million and the Funds paid an annualized commitment fee of .15% of the unused portion of the SCA. The interest on borrowings under the SCAs is paid monthly and at a per annum interest rate based upon a contractual spread plus the higher of (1) the effective federal funds rate, (2) the 1-month LIBOR rate or (3) zero percent.
Other affiliated registered investment companies that are parties to the SCA include portfolios that are subject to a predetermined mathematical formula used to manage certain benefit guarantees offered under variable annuity contracts. The formula may result in large scale asset flows into and out of these portfolios. Consequently, these portfolios may be more likely to utilize the SCA for purposes of funding redemptions. It may be possible for those portfolios to fully exhaust the committed amount of the SCA, thereby requiring the Manager to allocate available funding per a Board-approved methodology designed to treat the Funds in the SCA equitably.
The Series did not utilize the SCA during the reporting period ended October 31, 2017.
8. Other
At the Fund’s Board meeting in March 2017, the Board approved a change in the methodology of allocating certain expenses, such as Transfer Agent fees (including sub-transfer agent and networking fees) and Blue Sky fees. PGIM Investments implemented the changes effective November 1, 2017.
| 40 |
Financial Highlights
| Class A Shares | ||||||||||||||||||||
Year Ended October 31, | September 16, 2014(b) through October 31, | |||||||||||||||||||
| 2017 | 2016 | 2015 | 2014 | |||||||||||||||||
| Per Share Operating Performance(c): | ||||||||||||||||||||
| Net Asset Value, Beginning of Period | $9.34 | $8.81 | $10.09 | $10.00 | ||||||||||||||||
| Income (loss) from investment operations: | ||||||||||||||||||||
| Net investment income (loss) | (.04 | ) | (.04 | ) | (.04 | ) | (.01 | ) | ||||||||||||
| Net realized and unrealized gain (loss) on investments | 1.89 | .57 | (1.24 | ) | .10 | |||||||||||||||
| Total from investment operations | 1.85 | .53 | (1.28 | ) | .09 | |||||||||||||||
| Net asset value, end of period | $11.19 | $9.34 | $8.81 | $10.09 | ||||||||||||||||
| Total Return(a) | 19.81% | 6.02% | (12.69)% | .90% | ||||||||||||||||
| Ratios/Supplemental Data: | ||||||||||||||||||||
| Net assets, end of period (000) | $2,204 | $869 | $311 | $18 | ||||||||||||||||
| Average net assets (000) | $1,363 | $528 | $208 | $15 | ||||||||||||||||
| Ratios to average net assets(d): | ||||||||||||||||||||
| Expenses after waiver and/or expense reimbursement | 1.45% | 1.45% | 1.54% | 1.55% | (e) | |||||||||||||||
| Expenses before waiver and/or expense reimbursement | 3.28% | 3.87% | 3.40% | 14.06% | (e) | |||||||||||||||
| Net investment income (loss) | (.35)% | (.49)% | (.48)% | (.93)% | (e) | |||||||||||||||
| Portfolio turnover rate | 45% | 44% | 67% | 15% | (f) | |||||||||||||||
| (a) | Total return does not consider the effect of sales load. Total return is calculated assuming a purchase of a share on the first day and a sale on the last day of each period reported and includes reinvestment of dividends and distributions, if any. Total return may reflect adjustments to conform to generally accepted accounting principles. Total returns for periods less than one full year are not annualized. |
| (b) | Commencement of operations. |
| (c) | Calculated based on average shares outstanding during the period. |
| (d) | Does not include expenses of the underlying funds in which the Series invests. |
| (e) | Annualized. |
| (f) | Not annualized. |
See Notes to Financial Statements.
| Prudential Jennison Emerging Markets Equity Fund | 41 |
Financial Highlights (continued)
| Class C Shares | ||||||||||||||||||||
Year Ended October 31, | September 16, 2014(b) through October 31, | |||||||||||||||||||
| 2017 | 2016 | 2015 | 2014 | |||||||||||||||||
| Per Share Operating Performance(c): | ||||||||||||||||||||
| Net Asset Value, Beginning of Period | $9.20 | $8.74 | $10.08 | $10.00 | ||||||||||||||||
| Income (loss) from investment operations: | ||||||||||||||||||||
| Net investment income (loss) | (.11 | ) | (.11 | ) | (.13 | ) | (.02 | ) | ||||||||||||
| Net realized and unrealized gain (loss) on investments | 1.84 | .57 | (1.21 | ) | .10 | |||||||||||||||
| Total from investment operations | 1.73 | .46 | (1.34 | ) | .08 | |||||||||||||||
| Net asset value, end of period | $10.93 | $9.20 | $8.74 | $10.08 | ||||||||||||||||
| Total Return(a) | 18.80% | 5.26% | (13.29)% | .80% | ||||||||||||||||
| Ratios/Supplemental Data: | ||||||||||||||||||||
| Net assets, end of period (000) | $1,516 | $734 | $662 | $501 | ||||||||||||||||
| Average net assets (000) | $973 | $672 | $699 | $296 | ||||||||||||||||
| Ratios to average net assets(d): | ||||||||||||||||||||
| Expenses after waiver and/or expense reimbursement | 2.20% | 2.20% | 2.29% | 2.30% | (e) | |||||||||||||||
| Expenses before waiver and/or expense reimbursement | 4.00% | 4.62% | 4.12% | 15.19% | (e) | |||||||||||||||
| Net investment income (loss) | (1.17)% | (1.29)% | (1.36)% | (1.79)% | (e) | |||||||||||||||
| Portfolio turnover rate | 45% | 44% | 67% | 15% | (f) | |||||||||||||||
| (a) | Total return does not consider the effect of sales load. Total return is calculated assuming a purchase of a share on the first day and a sale on the last day of each period reported and includes reinvestment of dividends and distributions, if any. Total return may reflect adjustments to conform to generally accepted accounting principles. Total returns for periods less than one full year are not annualized. |
| (b) | Commencement of operations. |
| (c) | Calculated based on average shares outstanding during the period. |
| (d) | Does not include expenses of the underlying funds in which the Series invests. |
| (e) | Annualized. |
| (f) | Not annualized. |
See Notes to Financial Statements.
| 42 |
| Class Q Shares | ||||||||||||||||||||
Year Ended October 31, | September 16, 2014(b) through October 31, | |||||||||||||||||||
| 2017 | 2016 | 2015 | 2014 | |||||||||||||||||
| Per Share Operating Performance(c): | ||||||||||||||||||||
| Net Asset Value, Beginning of Period | $9.39 | $8.83 | $10.09 | $10.00 | ||||||||||||||||
| Income (loss) from investment operations: | ||||||||||||||||||||
| Net investment income (loss) | (.01 | ) | (.03 | ) | (.04 | ) | (.01 | ) | ||||||||||||
| Net realized and unrealized gain (loss) on investments | 1.89 | .59 | (1.21 | ) | .10 | |||||||||||||||
| Total from investment operations | 1.88 | .56 | (1.25 | ) | .09 | |||||||||||||||
| Less Dividends: | ||||||||||||||||||||
| Dividends from net investment income | - | - | (.01 | ) | - | |||||||||||||||
| Net asset value, end of period | $11,27 | $9.39 | $8.83 | $10.09 | ||||||||||||||||
| Total Return(a) | 20.02% | 6.34% | (12.44)% | .90% | ||||||||||||||||
| Ratios/Supplemental Data: | ||||||||||||||||||||
| Net assets, end of period (000) | $11,271 | $9,404 | $8,840 | $10,101 | ||||||||||||||||
| Average net assets (000) | $9,893 | $8,722 | $9,518 | $9,785 | ||||||||||||||||
| Ratios to average net assets(d): | ||||||||||||||||||||
| Expenses after waiver and/or expense reimbursement | 1.20% | 1.20% | 1.29% | 1.30% | (e) | |||||||||||||||
| Expenses before waiver and/or expense reimbursement | 2.78% | 3.13% | 2.91% | 13.37% | (e) | |||||||||||||||
| Net investment income (loss) | (.13)% | (.29)% | (.40)% | (.68)% | (e) | |||||||||||||||
| Portfolio turnover rate | 45% | 44% | 67% | 15% | (f) | |||||||||||||||
| (a) | Total return is calculated assuming a purchase of a share on the first day and a sale on the last day of each period reported and includes reinvestment of dividends and distributions, if any. Total investment return may reflect adjustments to conform to generally accepted accounting principles. Total returns for periods less than one full year are not annualized. |
| (b) | Commencement of operations. |
| (c) | Calculated based on average shares outstanding during the period. |
| (d) | Does not include expenses of the underlying funds in which the Series invests. |
| (e) | Annualized. |
| (f) | Not annualized. |
See Notes to Financial Statements.
| Prudential Jennison Emerging Markets Equity Fund | 43 |
Financial Highlights (continued)
| Class Z Shares | ||||||||||||||||||||
Year Ended October 31, | September 16, 2014(b) through October 31, | |||||||||||||||||||
| 2017 | 2016 | 2015 | 2014 | |||||||||||||||||
| Per Share Operating Performance(c): | ||||||||||||||||||||
| Net Asset Value, Beginning of Period | $9.39 | $8.82 | $10.09 | $10.00 | ||||||||||||||||
| Income (loss) from investment operations: | ||||||||||||||||||||
| Net investment income (loss) | (.02 | ) | (.03 | ) | (.04 | ) | (.01 | ) | ||||||||||||
| Net realized and unrealized gain (loss) on investments | 1.90 | .60 | (1.23 | ) | .10 | |||||||||||||||
| Total from investment operations | 1.88 | .57 | (1.27 | ) | .09 | |||||||||||||||
| Net asset value, end of period | $11.27 | $9.39 | $8.82 | $10.09 | ||||||||||||||||
| Total Return(a) | 20.02% | 6.46% | (12.59)% | .90% | ||||||||||||||||
| Ratios/Supplemental Data: | ||||||||||||||||||||
| Net assets, end of period (000) | $980 | $183 | $60 | $10 | ||||||||||||||||
| Average net assets (000) | $490 | $102 | $17 | $10 | ||||||||||||||||
| Ratios to average net assets(d): | ||||||||||||||||||||
| Expenses after waiver and/or expense reimbursement | 1.20% | 1.20% | 1.29% | 1.30% | (e) | |||||||||||||||
| Expenses before waiver and/or expense reimbursement | 2.94% | 3.55% | 3.48% | 13.51% | (e) | |||||||||||||||
| Net investment income (loss) | (.19)% | (.31)% | (.44)% | (.67)% | (e) | |||||||||||||||
| Portfolio turnover rate | 45% | 44% | 67% | 15% | (f) | |||||||||||||||
| (a) | Total return is calculated assuming a purchase of a share on the first day and a sale on the last day of each period reported and includes reinvestment of dividends and distributions, if any. Total investment return may reflect adjustments to conform to generally accepted accounting principles. Total returns for periods less than one full year are not annualized. |
| (b) | Commencement of operations. |
| (c) | Calculated based on average shares outstanding during the period. |
| (d) | Does not include expenses of the underlying funds in which the Series invests. |
| (e) | Annualized. |
| (f) | Not annualized. |
See Notes to Financial Statements.
| 44 |
Report of Independent Registered Public
Accounting Firm
The Board of Directors and Shareholders
Prudential World Fund, Inc.:
We have audited the accompanying statement of assets and liabilities of Prudential Jennison Emerging Markets Equity Fund (the “Fund”), a series of Prudential World Fund, Inc., including the portfolio of investments, as of October 31, 2017, and the related statement of operations for the year then ended, the statements of changes in net assets for each of the years in the two-year period then ended, and the financial highlights for each of the years in the three-year period then ended and the period from September 16, 2014 (commencement of operations) to October 31, 2014. These financial statements and financial highlights are the responsibility of the Fund’s management. Our responsibility is to express an opinion on these financial statements and financial highlights based on our audits.
We conducted our audits in accordance with the standards of the Public Company Accounting Oversight Board (United States). Those standards require that we plan and perform the audit to obtain reasonable assurance about whether the financial statements and financial highlights are free of material misstatement. An audit includes examining, on a test basis, evidence supporting the amounts and disclosures in the financial statements. Our procedures included confirmation of securities owned as of October 31, 2017, by correspondence with the custodian, transfer agent and brokers or by other appropriate auditing procedures when replies from brokers were not received. An audit also includes assessing the accounting principles used and significant estimates made by management, as well as evaluating the overall financial statement presentation. We believe that our audits provide a reasonable basis for our opinion.
In our opinion, the financial statements and financial highlights referred to above present fairly, in all material respects, the financial position of the Fund as of October 31, 2017, and the results of its operations, the changes in its net assets, and the financial highlights for each of the years or periods described in the first paragraph, in conformity with U.S. generally accepted accounting principles.

New York, New York
December 15, 2017
| Prudential Jennison Emerging Markets Equity Fund | 45 |
INFORMATION ABOUT BOARD MEMBERS AND OFFICERS
(Unaudited)
Information about Board Members and Officers of the Fund is set forth below. Board Members who are not deemed to be “interested persons” of the Fund, as defined in the 1940 Act, are referred to as “Independent Board Members.” Board Members who are deemed to be “interested persons” of the Fund are referred to as “Interested Board Members.” The Board Members are responsible for the overall supervision of the operations of the Fund and perform the various duties imposed on the directors of investment companies by the 1940 Act. The Board in turn elects the Officers, who are responsible for administering the day-to-day operations of the Fund.
| Independent Board Members(1) | ||||
Name, Address, Age Position(s) Portfolios Overseen | Principal Occupation(s) During Past Five Years | Other Directorships Held During Past Five Years | ||
Ellen S. Alberding (59) Board Member Portfolios Overseen: 89 | President and Board Member, The Joyce Foundation (charitable foundation) (since 2002); Vice Chair, City Colleges of Chicago (community college system) (since 2011); Trustee, Skills for America’s Future (national initiative to connect employers to community colleges) (since 2011); Trustee, National Park Foundation (charitable foundation for national park system) (since 2009); Trustee, Economic Club of Chicago (since 2009). | None. | ||
Kevin J. Bannon (65) Board Member Portfolios Overseen: 89 | Retired; Managing Director (April 2008-May 2015) and Chief Investment Officer (October 2008-November 2013) of Highmount Capital LLC (registered investment adviser); formerly Executive Vice President and Chief Investment Officer (April 1993-August 2007) of Bank of New York Company; President (May 2003-May 2007) of BNY Hamilton Family of Mutual Funds. | Director of Urstadt Biddle Properties (equity real estate investment trust) (since September 2008). | ||
Linda W. Bynoe (65) Board Member Portfolios Overseen: 89 | President and Chief Executive Officer (since March 1995) and formerly Chief Operating Officer (December 1989-February 1995) of Telemat Ltd. (management consulting); formerly Vice President (January 1985-June 1989) at Morgan Stanley & Co. (broker-dealer). | Director of Simon Property Group, Inc. (retail real estate) (May 2003-May 2012); Director of Anixter International, Inc. (communication products distributor) (since January 2006); Director of Northern Trust Corporation (financial services) (since April 2006); Trustee of Equity Residential (residential real estate) (since December 2009). | ||
Prudential Jennison Emerging Markets Equity Fund
| Independent Board Members(1) | ||||
Name, Address, Age Position(s) Portfolios Overseen | Principal Occupation(s) During Past Five Years | Other Directorships Held During Past Five Years | ||
Barry H. Evans (57)± Board Member Portfolios Overseen: 89 | Retired; Formerly President (2005-2016), Global Chief Operating Officer (2014-2016), Chief Investment Officer-Global Head of Fixed Income (1998-2014), and various portfolio manager roles (1986-2006), Manulife Asset Management U.S. | Director, Manulife Trust Company (2011- present); Director, Manulife Asset Management Limited (2015-present); Formerly Chairman of the Board of Directors of Manulife Asset Management U.S. (2005-2016); Formerly Chairman of the Board, Declaration Investment Management and Research (2008-2016). | ||
Keith F. Hartstein (61) Board Member & Independent Chair Portfolios Overseen: 89 | Retired; Member (since November 2014) of the Governing Council of the Independent Directors Council (organization of independent mutual fund directors); formerly President and Chief Executive Officer (2005-2012), Senior Vice President (2004-2005), Senior Vice President of Sales and Marketing (1997-2004), and various executive management positions (1990-1997), John Hancock Funds, LLC (asset management); Chairman, Investment Company Institute’s Sales Force Marketing Committee (2003-2008). | None. | ||
Laurie Simon Hodrick (55)± Board Member Portfolios Overseen: 89 | A. Barton Hepburn Professor of Economics in the Faculty of Business, Columbia Business School (since 1996); Visiting Professor of Law and Rock Center for Corporate Governance Fellow, Stanford Law School (since 2015); Visiting Fellow, Hoover Institution, Stanford University (since 2015); Sole Member, ReidCourt LLC (since 2008) (a consulting firm); Formerly Managing Director, Global Head of Alternative Investment Strategies, Deutsche Bank (2006-2008); Formerly Director/Trustee, Merrill Lynch Investment Managers Funds (1999-2006). | Independent Director, Corporate Capital Trust (since April 2017) (a business development company). | ||
Michael S. Hyland, CFA (72) Board Member Portfolios Overseen: 89 | Retired (since February 2005); formerly Senior Managing Director (July 2001-February 2005) of Bear Stearns & Co, Inc.; Global Partner, INVESCO (1999-2001); Managing Director and President of Salomon Brothers Asset Management (1989-1999). | None. | ||
Visit our website at pgiminvestments.com
| Independent Board Members(1) | ||||
Name, Address, Age Position(s) Portfolios Overseen | Principal Occupation(s) During Past Five Years | Other Directorships Held During Past Five Years | ||
Richard A. Redeker (74) Board Member & Independent Vice Chair9 Portfolios Overseen: 87 | Retired Mutual Fund Senior Executive (47 years); Management Consultant; Director, Mutual Fund Directors Forum (since 2014); Independent Directors Council (organization of independent mutual fund directors)-Executive Committee, Chair of Policy Steering Committee, Governing Council. | None. | ||
Stephen G. Stoneburn (74) Board Member Portfolios Overseen: 89 | Chairman (since July 2011), President and Chief Executive Officer (since June 1996) of Frontline Medical Communications (publishing company); formerly President (June 1995-June 1996) of Argus Integrated Media, Inc.; Senior Vice President and Managing Director (January 1993-1995) of Cowles Business Media; Senior Vice President of Fairchild Publications, Inc. (1975-1989). | None. | ||
± Mr. Evans and Ms. Hodrick joined the Board effective as of September 1, 2017.
| Interested Board Members(1) | ||||
Name, Address, Age Position(s) Portfolios Overseen | Principal Occupation(s) During Past Five Years | Other Directorships Held During Past Five Years | ||
Stuart S. Parker (55) Board Member & President Portfolios Overseen: 89 | President of PGIM Investments LLC (formerly known as Prudential Investments LLC) (since January 2012); Executive Vice President of Prudential Investment Management Services LLC (since December 2012); Executive Vice President of Jennison Associates LLC and Head of Retail Distribution of PGIM Investments LLC (June 2005-December 2011). | None. | ||
Prudential Jennison Emerging Markets Equity Fund
| Interested Board Members(1) | ||||
Name, Address, Age Position(s) Portfolios Overseen | Principal Occupation(s) During Past Five Years | Other Directorships Held During Past Five Years | ||
Scott E. Benjamin (44) Board Member & Vice President Portfolios Overseen: 89 | Executive Vice President (since June 2009) of PGIM Investments LLC; Executive Vice President (June 2009-June 2012) and Vice President (since June 2012) of Prudential Investment Management Services LLC; Executive Vice President (since September 2009) of AST Investment Services, Inc.; Senior Vice President of Product Development and Marketing, PGIM Investments (since February 2006); Vice President of Product Development and Product Management, Prudential Investments (2003-2006). | None. | ||
Grace C. Torres* (58) Board Member Portfolios Overseen: 88 | Retired; formerly Treasurer and Principal Financial and Accounting Officer of the Prudential Funds, Target Funds, Advanced Series Trust, Prudential Variable Contract Accounts and The Prudential Series Fund (1998-June 2014); Assistant Treasurer (March 1999-June 2014) and Senior Vice President (September 1999-June 2014) of PGIM Investments LLC; Assistant Treasurer (May 2003-June 2014) and Vice President (June 2005-June 2014) of AST Investment Services, Inc.; Senior Vice President and Assistant Treasurer (May 2003-June 2014) of Prudential Annuities Advisory Services, Inc. | Director (since July 2015) of Sun Bancorp, Inc. N.A. and Sun National Bank | ||
* Note: Prior to her retirement in 2014, Ms. Torres was employed by PGIM Investments LLC. Due to her prior employment, she is considered to be an “interested person” under the 1940 Act. Ms. Torres is a Non-Management Interested Board Member.
(1) The year that each Board Member joined the Board is as follows:
Ellen S. Alberding; 2013; Kevin J. Bannon, 2008; Linda W. Bynoe, 2005; Barry H. Evans, 2017; Keith F. Hartstein, 2013; Laurie Simon Hodrick, 2017; Michael S. Hyland, 2008; Richard A. Redeker, 2003; Stephen G. Stoneburn, 1996; Grace C. Torres, 2014; Stuart S. Parker, Board Member and President since 2012; Scott E. Benjamin, Board Member since 2010 and Vice President since 2009.
Visit our website at pgiminvestments.com
| Fund Officers(a) | ||||
Name, Address and Age Position with Fund | Principal Occupation(s) During Past Five Years | Length of Service as Fund Officer | ||
Raymond A. O’Hara (62) Chief Legal Officer | Vice President and Corporate Counsel (since July 2010) of Prudential Insurance Company of America (Prudential); Vice President (March 2011-Present) of Pruco Life Insurance Company and Pruco Life Insurance Company of New Jersey; Vice President and Corporate Counsel (March 2011-Present) of Prudential Annuities Life Assurance Corporation; Chief Legal Officer of PGIM Investments LLC (since June 2012); Chief Legal Officer of Prudential Mutual Fund Services LLC (since June 2012) and Corporate Counsel of AST Investment Services, Inc. (since June 2012); formerly Assistant Vice President and Corporate Counsel (September 2008-July 2010) of The Hartford Financial Services Group, Inc.; formerly Associate (September 1980-December 1987) and Partner (January 1988-August 2008) of Blazzard & Hasenauer, P.C. (formerly, Blazzard, Grodd & Hasenauer, P.C.). | Since 2012 | ||
Chad A. Earnst (42) Chief Compliance Officer | Chief Compliance Officer (September 2014-Present) of PGIM Investments LLC; Chief Compliance Officer (September 2014-Present) of the Prudential Funds, Target Funds, Advanced Series Trust, The Prudential Series Fund, Prudential’s Gibraltar Fund, Inc., Prudential Global Short Duration High Yield Income Fund, Inc., Prudential Short Duration High Yield Fund, Inc. and Prudential Jennison MLP Income Fund, Inc.; formerly Assistant Director (March 2010-August 2014) of the Asset Management Unit, Division of Enforcement, US Securities & Exchange Commission; Assistant Regional Director (January 2010-August 2014), Branch Chief (June 2006-December 2009) and Senior Counsel (April 2003-May 2006) of the Miami Regional Office, Division of Enforcement, US Securities & Exchange Commission. | Since 2014 | ||
Deborah A. Docs (59) Secretary | Vice President and Corporate Counsel (since January 2001) of Prudential; Vice President (since December 1996) and Assistant Secretary (since March 1999) of PGIM Investments LLC; formerly Vice President and Assistant Secretary (May 2003-June 2005) of AST Investment Services, Inc. | Since 2004 | ||
Jonathan D. Shain (59) Assistant Secretary | Vice President and Corporate Counsel (since August 1998) of Prudential; Vice President and Assistant Secretary (since May 2001) of PGIM Investments LLC; Vice President and Assistant Secretary (since February 2001) of Prudential Mutual Fund Services LLC; formerly Vice President and Assistant Secretary (May 2003-June 2005) of AST Investment Services, Inc. | Since 2005 | ||
Claudia DiGiacomo (43) Assistant Secretary | Vice President and Corporate Counsel (since January 2005) of Prudential; Vice President and Assistant Secretary of PGIM Investments LLC (since December 2005); Associate at Sidley Austin Brown & Wood LLP (1999-2004). | Since 2005 | ||
Prudential Jennison Emerging Markets Equity Fund
| Fund Officers(a) | ||||
Name, Address and Age Position with Fund | Principal Occupation(s) During Past Five Years | Length of Service as Fund Officer | ||
Andrew R. French (54) Assistant Secretary | Vice President and Corporate Counsel (since February 2010) of Prudential; formerly Director and Corporate Counsel (2006-2010) of Prudential; Vice President and Assistant Secretary (since January 2007) of PGIM Investments LLC; Vice President and Assistant Secretary (since January 2007) of Prudential Mutual Fund Services LLC. | Since 2006 | ||
Charles H. Smith (44) Anti-Money Laundering Compliance Officer | Vice President, Corporate Compliance, Anti-Money Laundering Unit (since January 2015) of Prudential; committee member of the American Council of Life Insurers Anti-Money Laundering and Critical Infrastructure Committee (since January 2016); formerly Global Head of Economic Sanctions Compliance at AIG Property Casualty (February 2007-December 2014); Assistant Attorney General at the New York State Attorney General’s Office, Division of Public Advocacy. (August 1998-January 2007). | Since 2016 | ||
M. Sadiq Peshimam (53) Treasurer and Principal Financial and Accounting Officer | Vice President (since 2005) of PGIM Investments LLC; formerly Assistant Treasurer of funds in the Prudential Mutual Fund Complex (2006-2014). | Since 2006 | ||
Peter Parrella (59) Assistant Treasurer | Vice President (since 2007) and Director (2004-2007) within Prudential Mutual Fund Administration; formerly Tax Manager at SSB Citi Fund Management LLC (1997-2004). | Since 2007 | ||
Lana Lomuti (50) Assistant Treasurer | Vice President (since 2007) and Director (2005-2007), within Prudential Mutual Fund Administration; formerly Assistant Treasurer (December 2007-February 2014) of The Greater China Fund, Inc. | Since 2014 | ||
Linda McMullin (56) Assistant Treasurer | Vice President (since 2011) and Director (2008-2011) within Prudential Mutual Fund Administration. | Since 2014 | ||
Kelly A. Coyne (49) Assistant Treasurer | Director, Investment Operations of Prudential Mutual Fund Services LLC (since 2010). | Since 2015 | ||
(a) Excludes Mr. Parker and Mr. Benjamin, interested Board Members who also serve as President and Vice President, respectively.
Explanatory Notes to Tables:
| ∎ | Board Members are deemed to be “Interested,” as defined in the 1940 Act, by reason of their affiliation with PGIM Investments LLC and/or an affiliate of PGIM Investments LLC. |
| ∎ | Unless otherwise noted, the address of all Board Members and Officers is c/o PGIM Investments LLC, 655 Broad Street, Newark, New Jersey 07102-4410. |
| ∎ | There is no set term of office for Board Members or Officers. The Board Members have adopted a retirement policy, which calls for the retirement of Board Members on December 31 of the year in which they reach the age of 75. |
| ∎ | “Other Directorships Held” includes only directorships of companies required to register or file reports with the SEC under the 1934 Act (that is, “public companies”) or other investment companies registered under the 1940 Act. |
| ∎ | “Portfolios Overseen” includes all investment companies managed by PGIM Investments LLC. The investment companies for which PGIM Investments LLC serves as manager include the Prudential Mutual Funds, The Prudential Variable Contract Accounts, Target Mutual Funds, Prudential Short Duration High Yield Fund, Inc., Prudential Global Short Duration High Yield Fund, Inc., The Prudential Series Fund, Prudential’s Gibraltar Fund, Inc. and the Advanced Series Trust. |
Visit our website at pgiminvestments.com
Approval of Advisory Agreements
The Fund’s Board of Trustees
The Board of Directors (the “Board”) of Prudential Jennison Emerging Markets Equity Fund (the “Fund”)1 consists of twelve individuals, nine of whom are not “interested persons” of the Fund, as defined in the Investment Company Act of 1940, as amended (the “1940 Act”) (the “Independent Directors”). The Board is responsible for the oversight of the Fund and its operations, and performs the various duties imposed on the directors of investment companies by the 1940 Act. The Independent Directors have retained independent legal counsel to assist them in connection with their duties. The Chair of the Board is an Independent Director. The Board has established four standing committees: the Audit Committee, the Nominating and Governance Committee, and two Investment Committees. Each committee is chaired by, and composed of, Independent Directors.
Annual Approval of the Fund’s Advisory Agreements
As required under the 1940 Act, the Board determines annually whether to renew the Fund’s management agreement with PGIM Investments LLC (“PGIM Investments”) and the Fund’s subadvisory agreement with Jennison Associates LLC (“Jennison”). In considering the renewal of the agreements, the Board, including all of the Independent Trustees,2 met on June 6-8, 2017 and approved the renewal of the agreements through July 31, 2018, after concluding that the renewal of the agreements was in the best interests of the Fund and its shareholders.
In advance of the meetings, the Board requested and received materials relating to the agreements, and had the opportunity to ask questions and request further information in connection with its consideration. Among other things, the Board considered comparative fee information from PGIM Investments and Jennison. Also, the Board considered comparisons with other mutual funds in relevant Peer Universes and Peer Groups, as is further discussed below.
In approving the agreements, the Board, including the Independent Directors advised by independent legal counsel, considered the factors it deemed relevant, including the nature, quality and extent of services provided by PGIM Investments and the subadviser, the performance of the Fund, the profitability of PGIM Investments and its affiliates, expenses and fees, and the potential for economies of scale that may be shared with the Fund and its shareholders as the Fund’s assets grow. In their deliberations, the Directors did not identify any single factor which alone was responsible for the Board’s decision to approve the agreements with respect to the Fund. In connection with its deliberations, the Board
| 1 | Prudential Jennison Emerging Markets Equity Fund is a series of Prudential World Fund, Inc. |
| 2 | Barry H. Evans and Laurie Simon Hodrick joined the Board effective as of September 1, 2017. Neither Mr. Evans nor Ms. Hodrick participated in the consideration of the renewal of the advisory agreements. |
| Prudential Jennison Emerging Markets Equity Fund | ||
Approval of Advisory Agreements (continued)
considered information provided by PGIM Investments throughout the year at regular Board meetings, presentations from portfolio managers and other information, as well as information furnished at or in advance of the meetings on June 6-8, 2017.
The Directors determined that the overall arrangements between the Fund and PGIM Investments, which serves as the Fund’s investment manager pursuant to a management agreement, and between PGIM Investments and Jennison, which serves as the Fund’s subadviser pursuant to the terms of a subadvisory agreement with PGIM Investments, are in the best interests of the Fund and its shareholders in light of the services performed, fees charged and such other matters as the Directors considered relevant in the exercise of their business judgment.
The material factors and conclusions that formed the basis for the Directors’ determinations to approve the renewal of the agreements are discussed separately below.
Nature, Quality and Extent of Services
The Board received and considered information regarding the nature, quality and extent of services provided to the Fund by PGIM Investments and Jennison. The Board considered the services provided by PGIM Investments, including but not limited to the oversight of the subadviser for the Fund, as well as the provision of fund recordkeeping, compliance, and other services to the Fund. With respect to PGIM Investments’ oversight of the subadviser, the Board noted that PGIM Investments’ Strategic Investment Research Group (“SIRG”), a business unit of PGIM Investments, is responsible for monitoring and reporting to PGIM Investments’ senior management on the performance and operations of the subadviser. The Board also considered that PGIM Investments pays the salaries of all of the officers and interested Directors of the Fund who are part of Fund management. The Board also considered the investment subadvisory services provided by Jennison, as well as compliance with the Fund’s investment restrictions, policies and procedures. The Board considered PGIM Investments’ evaluation of Jennison as well as PGIM Investments’ recommendation, based on its review of Jennison, to renew the subadvisory agreement.
The Board considered the qualifications, backgrounds and responsibilities of PGIM Investments’ senior management responsible for the oversight of the Fund and Jennison, and also considered the qualifications, backgrounds and responsibilities of Jennison’s portfolio managers who are responsible for the day-to-day management of the Fund’s portfolio. The Board was provided with information pertaining to PGIM Investments’ and Jennison’s organizational structure, senior management, investment operations, and other relevant information pertaining to both PGIM Investments and Jennison. The Board also noted that it received favorable compliance reports from the Fund’s Chief Compliance
| Visit our website at pgiminvestments.com |
Officer (“CCO”) as to both PGIM Investments and Jennison. The Board noted that Jennison is affiliated with PGIM Investments.
The Board concluded that it was satisfied with the nature, extent and quality of the investment management services provided by PGIM Investments and the subadvisory services provided to the Fund by Jennison, and that there was a reasonable basis on which to conclude that the Fund benefits from the services provided by PGIM Investments and Jennison under the management and subadvisory agreements.
Costs of Services and Profits Realized by PGIM Investments
The Board was provided with information on the profitability of PGIM Investments and its affiliates in serving as the Fund’s investment manager. The Board discussed with PGIM Investments the methodology utilized in assembling the information regarding profitability and considered its reasonableness. The Board recognized that it is difficult to make comparisons of profitability from fund management contracts because comparative information is not generally publicly available and is affected by numerous factors, including the structure of the particular adviser, the types of funds it manages, its business mix, numerous assumptions regarding allocations and the adviser’s capital structure and cost of capital. However, the Board considered that the cost of services provided by PGIM Investments for the year ended December 31, 2016 exceeded the management fees received by PGIM Investments, resulting in an operating loss to PGIM Investments. The Board further noted that the subadviser is affiliated with PGIM Investments and that its profitability is reflected in PGIM Investments’ profitability report. Taking these factors into account, the Board concluded that the profitability of PGIM Investments and its affiliates in relation to the services rendered was not unreasonable.
Economies of Scale
The Board received and discussed information concerning economies of scale that PGIM Investments may realize as the Fund’s assets grow beyond current levels. The Board noted that the management fee schedule for the Fund includes breakpoints, which have the effect of decreasing the fee rate as assets increase, but that at its current level of assets the Fund does not realize the effect of those rate reductions. The Board took note that the Fund’s fee structure currently results in benefits to Fund shareholders whether or not PGIM Investments realizes any economies of scale. The Board noted that economies of scale can be shared with the Fund in other ways, including low management fees from inception, additional technological and personnel investments to enhance shareholder services, and maintaining existing expense structures in the face of a rising cost environment. The Board also considered PGIM Investments’ assertion that it continually evaluates the management fee schedule of the Fund and the potential to share economies of scale through breakpoints or fee waivers as asset levels increase.
| Prudential Jennison Emerging Markets Equity Fund | ||
Approval of Advisory Agreements (continued)
The Board recognized the inherent limitations of any analysis of economies of scale, stemming largely from the Board’s understanding that most of PGIM Investments’ costs are not specific to individual funds, but rather are incurred across a variety of products and services.
Other Benefits to PGIM Investments and Jennison
The Board considered potential ancillary benefits that might be received by PGIM Investments and Jennison and their affiliates as a result of their relationship with the Fund. The Board concluded that potential benefits to be derived by PGIM Investments included fees received by affiliates of PGIM Investments for serving as the Fund’s securities lending agent, transfer agency fees received by the Fund’s transfer agent (which is affiliated with PGIM Investments), as well as benefits to its reputation or other intangible benefits resulting from PGIM Investments’ association with the Fund. The Board concluded that the potential benefits to be derived by Jennison included its ability to use soft dollar credits, as well as the potential benefits consistent with those generally resulting from an increase in assets under management, specifically, potential access to additional research resources and benefits to its reputation. The Board concluded that the benefits derived by PGIM Investments and Jennison were consistent with the types of benefits generally derived by investment managers and subadvisers to mutual funds.
Performance of the Fund / Fees and Expenses
The Board considered certain additional specific factors and made related conclusions relating to the historical performance of the Fund for the one-year period ended December 31, 2016. The Board considered that the Fund commenced operations on September 16, 2014 and that longer-term performance was not yet available.
The Board also considered the Fund’s actual management fee, as well as the Fund’s net total expense ratio, for the fiscal year ended October 31, 2016. The Board considered the management fee for the Fund as compared to the management fee charged by PGIM Investments to other funds and the fee charged by other advisers to comparable mutual funds in a Peer Group. The actual management fee represents the fee rate actually paid by Fund shareholders and includes any fee waivers or reimbursements. The net total expense ratio for the Fund represents the actual expense ratio incurred by Fund shareholders.
The mutual funds included in the Peer Universe (the Lipper Emerging Markets Funds Performance Universe), which was used to consider performance, and the Peer Group, which was used to consider fees and expenses, were objectively determined by Broadridge, an independent provider of mutual fund data. The comparisons placed the Fund in various quartiles, with the first quartile being the best 25% of the mutual funds (for performance, the best performing mutual funds and, for expenses, the lowest cost mutual funds).
| Visit our website at pgiminvestments.com |
The section below summarizes key factors considered by the Board and the Board’s conclusions regarding the Fund’s performance, fees and overall expenses. The table sets forth gross performance comparisons (which do not reflect the impact on performance of fund expenses, or any subsidies, expense caps or waivers that may be applicable) with the Peer Universe, actual management fees with the Peer Group (which reflect the impact of any subsidies or fee waivers), and net total expenses with the Peer Group, each of which were key factors considered by the Board.
| Performance | 1 Year | 3 Years | 5 Years | 10 Years | ||||
4th Quartile | N/A | N/A | N/A | |||||
| Actual Management Fees: 1st Quartile | ||||||||
| Net Total Expenses: 2nd Quartile | ||||||||
| • | The Board noted that the Fund underperformed its benchmark index over the one- year period. |
| • | The Board noted that the Fund’s recent performance had improved, with the Fund ranking in the third quartile of its Peer Universe for the first quarter of 2017. |
| • | The Board noted that the Fund does not yet have a three-year performance record and that, therefore, the subadviser should have more time to develop that record. |
| • | The Board and PGIM Investments agreed to continue the Fund’s existing expense cap, which caps the Fund’s annual operating expenses at 1.20% (exclusive of 12b-1 and certain other fees), through February 28, 2018. |
| • | The Board concluded that in light of the above, it would be in the best interests of the Fund and its shareholders to continue to allow the Fund to create a performance record, and to renew the agreements. |
| • | The Board concluded that the management fees (including subadvisory fees) and total expenses were reasonable in light of the services provided. |
* * *
After full consideration of these factors, the Board concluded that approval of the agreements was in the best interests of the Fund and its shareholders.
| Prudential Jennison Emerging Markets Equity Fund | ||
| ∎ TELEPHONE | ∎ WEBSITE | |||
655 Broad Street Newark, NJ 07102 | (800) 225-1852 | www.pgiminvestments.com |
| PROXY VOTING |
| The Board of Trustees of the Fund has delegated to the Fund’s investment subadviser the responsibility for voting any proxies and maintaining proxy recordkeeping with respect to the Fund. A description of these proxy voting policies and procedures is available without charge, upon request, by calling (800) 225-1852. Information regarding how the Fund voted proxies relating to portfolio securities during the most recent 12-month period ended June 30 is available on the Fund’s website and on the Securities and Exchange Commission’s website. |
| TRUSTEES |
| Ellen S. Alberding • Kevin J. Bannon • Scott E. Benjamin • Linda W. Bynoe • Barry H. Evans • Keith F. Hartstein • Laurie Simon Hodrick • Michael S. Hyland • Stuart S. Parker • Richard A. Redeker • Stephen G. Stoneburn • Grace C. Torres |
| OFFICERS |
| Stuart S. Parker, President • Scott E. Benjamin, Vice President • M. Sadiq Peshimam, Treasurer and Principal Financial and Accounting Officer • Raymond A. O’Hara, Chief Legal Officer • Chad A. Earnst, Chief Compliance Officer • Deborah A. Docs, Secretary • Charles H. Smith, Anti-Money Laundering Compliance Officer • Jonathan D. Shain, Assistant Secretary • Claudia DiGiacomo, Assistant Secretary • Andrew R. French, Assistant Secretary • Peter Parrella, Assistant Treasurer • Lana Lomuti, Assistant Treasurer • Linda McMullin, Assistant Treasurer • Kelly A. Coyne, Assistant Treasurer |
| MANAGER | PGIM Investments LLC | 655 Broad Street Newark, NJ 07102 | ||
| ||||
| INVESTMENT SUBADVISER | Jennison Associates LLC | 466 Lexington Avenue New York, NY 10017 | ||
| ||||
| DISTRIBUTOR | Prudential Investment Management Services LLC | 655 Broad Street Newark, NJ 07102 | ||
| ||||
| CUSTODIAN | The Bank of New York Mellon | 225 Liberty Street New York, NY 10286 | ||
| ||||
| TRANSFER AGENT | Prudential Mutual Fund Services LLC | PO Box 9658 Providence, RI 02940 | ||
| ||||
| INDEPENDENT REGISTERED PUBLIC ACCOUNTING FIRM | KPMG LLP | 345 Park Avenue New York, NY 10154 | ||
| ||||
| FUND COUNSEL | Willkie Farr & Gallagher LLP | 787 Seventh Avenue New York, NY 10019 | ||
| ||||
| An investor should consider the investment objectives, risks, charges, and expenses of the Fund carefully before investing. The prospectus and summary prospectus contain this and other information about the Fund. An investor may obtain a prospectus and summary prospectus by visiting our website at www.pgiminvestments.com or by calling (800) 225-1852. The prospectus and summary prospectus should be read carefully before investing. |
| E-DELIVERY |
| To receive your mutual fund documents online, go to www.pgiminvestments.com/edelivery and enroll. Instead of receiving printed documents by mail, you will receive notification via email when new materials are available. You can cancel your enrollment or change your email address at any time by visiting the website address above. |
| SHAREHOLDER COMMUNICATIONS WITH TRUSTEES |
| Shareholders can communicate directly with the Board of Trustees by writing to the Chair of the Board, Prudential Jennison Emerging Markets Equity Fund, PGIM Investments, Attn: Board of Trustees, 655 Broad Street, Newark, NJ 07102. Shareholders can communicate directly with an individual Director by writing to the same address. Communications are not screened before being delivered to the addressee. |
| AVAILABILITY OF PORTFOLIO SCHEDULE |
| The Fund files its complete schedule of portfolio holdings with the Securities and Exchange Commission for the first and third quarters of each fiscal year on Form N-Q. The Fund’s Forms N-Q are available on the Commission’s website at www.sec.gov. The Fund’s Forms N-Q may also be reviewed and copied at the Commission’s Public Reference Room in Washington, D.C. Information on the operation and location of the Public Reference Room may be obtained by calling 1-800-SEC-0330. The Fund’s schedule of portfolio holdings is also available on the Fund’s website as of the end of each month no sooner than 15 days after the end of the month. |
| The Fund’s Statement of Additional Information contains additional information about the Fund’s Trustees and is available without charge, upon request, by calling (800) 225-1852. |
Mutual Funds:
| ARE NOT INSURED BY THE FDIC OR ANY FEDERAL GOVERNMENT AGENCY | MAY LOSE VALUE | ARE NOT A DEPOSIT OF OR GUARANTEED BY ANY BANK OR ANY BANK AFFILIATE |
PRUDENTIAL JENNISON EMERGING MARKETS EQUITY FUND
| SHARE CLASS | A | C | Q | Z | ||||
| NASDAQ | PDEAX | PDECX | PDEQX | PDEZX | ||||
| CUSIP | 743969644 | 743969636 | 743969628 | 743969610 |
MF225E

PRUDENTIAL JENNISON GLOBAL OPPORTUNITIES FUND
ANNUAL REPORT
OCTOBER 31, 2017

To enroll in e-delivery, go to pgiminvestments.com/edelivery
| Objective: To seek long-term growth of capital |
Highlights
| • | The Fund produced strong performance results in the fiscal year, as all sectors and regions advanced. |
| • | Information technology positions were strong contributors to return. Alibaba reported impressive financial results that beat consensus expectations on most key metrics. Tencent, China’s largest and most visited Internet service portal, continued to perform well. |
| • | Consumer discretionary holdings also performed well in aggregate and a number of top performers were found in the sector. These included Paris-based Kering, which is the world’s third-largest luxury group behind LVMH and Richemont. Amazon continued to drive growth in its core retail business and through the proliferation of digital commerce via the mobile market. |
| • | A large underweight to financials weighed on results and the Fund’s health care positions were also a source of relative weakness; however, notable detractors were diversified across various sectors. |
This report is not authorized for distribution to prospective investors unless preceded or accompanied by a current prospectus.
The views expressed in this report and information about the Fund’s portfolio holdings are for the period covered by this report and are subject to change thereafter.
Mutual funds are distributed by Prudential Investment Management Services LLC, member SIPC. Jennison Associates is a registered investment adviser. Both are Prudential Financial companies. © 2017 Prudential Financial, Inc. and its related entities. Jennison Associates, Jennison, PGIM, and the PGIM logo are service marks of Prudential Financial, Inc. and its related entities, registered in many jurisdictions worldwide.
| 2 | Visit our website at pgiminvestments.com |
PRUDENTIAL FUNDS — UPDATE
The Board of Directors/Trustees for the Fund has approved renaming the Fund’s Class Q shares as Class R6 shares, effective on or about June 15, 2018. The renaming of Class Q shares as Class R6 shares will not result in any changes to pricing, eligibility, or shareholder rights and obligations. The renamed Class R6 shares will not be exchangeable with Class R6 shares of the Prudential Day One Funds or the Prudential 60/40 Allocation Fund.
LR993
| Prudential Jennison Global Opportunities Fund | 3 |
| 4 | Visit our website at pgiminvestments.com |
PRUDENTIAL FUNDS — UPDATE
Effective on or about June 1, 2018 (the “Effective Date”), the Fund’s Class A, Class C, Class R, and Class Z shares, as applicable, will be closed to investments by new group retirement plans, except as discussed below. Existing group retirement plans as of the Effective Date may keep their investments in their current share class and may continue to make additional purchases or exchanges of that class of shares. As of the Effective Date, all new group retirement plans wishing to add the Fund as a new addition to the plan generally will be into one of the available Class Q shares, Class R2 shares, or Class R4 shares of the Fund.
In addition, on or about the Effective Date, the Class R shares of the Fund will be closed to all new investors, except as discussed below. Due to the closing of the Class R shares to new investors, effective on or about the Effective Date new IRA investors may only purchase Class A, Class C, Class Z, or Class Q shares of the Fund, subject to share class eligibility. Following the Effective Date, no new accounts may be established in the Fund’s Class R shares and no Class R shares may be purchased or acquired by any new Class R shareholder, except as discussed below.
| Class A | Class C | Class Z | Class R | |||||
Existing Investors (Group Retirement Plans, IRAs, and all other investors) | No Change | No Change | No Change | No Change | ||||
| New Group Retirement Plans | Closed to group retirement plans wishing to add the share classes as new additions to plan menus on or about June 1, 2018, subject to certain exceptions below | |||||||
New IRAs | No Change | No Change | No Change | Closed to all new investors on or about June 1, 2018, subject to certain exceptions below | ||||
| All Other New Investors | No Change | No Change | No Change | |||||
However, the following new investors may continue to purchase Class A, Class C, Class R, and Class Z shares of the Fund, as applicable:
| • | Eligible group retirement plans who are exercising their one-time 90-day repurchase privilege in the Fund will be permitted to purchase such share classes. |
| • | Plan participants in a group retirement plan that offers Class A, Class C, Class R, or Class Z shares of the Fund as of the Effective Date will be permitted to purchase such share classes of the Fund, even if the plan participant did not own shares of that class of the Fund as of the Effective Date. |
| • | Certain new group retirement plans will be permitted to offer such share classes of the Fund after the Effective Date, provided that the plan has or is actively negotiating a contractual agreement with the Fund’s distributor or service provider to offer such share classes of the Fund prior to or on the Effective Date. |
| • | New group retirement plans that combine with, replace, or are otherwise affiliated with a current plan that invests in such share classes prior to or on the Effective Date will be permitted to purchase such share classes. |
The Fund also reserves the right to refuse any purchase order that might disrupt management of the Fund or to otherwise modify the closure policy at any time on a case-by-case basis.
| Prudential Jennison Global Opportunities Fund | 5 |
This Page Intentionally Left Blank
| 6 | Visit our website at pgiminvestments.com |
Letter from the President

Dear Shareholder:
We hope you find the annual report for the Prudential Jennison Global Opportunities Fund informative and useful. The report covers performance for the 12-month period ended October 31, 2017.
Significant events during the reporting period included a new US president, followed by uncertainty in Congress over implementing the Trump
administration’s policy initiatives. Elsewhere, Britain began its formal legal process to leave the European Union. France elected a more centrist president, which was viewed as a pro-euro referendum. North Korea’s missile launches escalated geopolitical tensions. Also, late in the period, a series of hurricanes caused damage in the US and the Caribbean.
Despite some turbulence in the macro-environment, solid economic fundamentals in the US economy included moderate gross domestic product expansion, robust employment, and accelerating corporate profit growth. Inflation remained tame. The Federal Reserve raised its federal funds rate twice in 2017, and is in the process of winding down its stimulus program.
Global economic growth remained mostly positive. Equities in the US reached new highs amid low volatility, while international equities posted strong gains. European stocks continued to gain. Asian markets were solid, and emerging markets outperformed most regions. Fixed income markets were mixed. High yield and emerging markets bonds were the top performers.
Given the uncertainty in today’s investment environment, we believe that active professional portfolio management offers a potential advantage. Active managers often have the knowledge and flexibility to find the best investment opportunities in the most challenging markets.
Even so, it’s best if investment decisions are based on your long-term goals rather than on short-term market and economic developments. We also encourage you to work with an experienced financial advisor who can help you set goals, determine your tolerance for risk, and build a diversified plan that’s right for you and make adjustments when necessary.
At PGIM Investments, we consider it a great privilege and responsibility to help investors participate in opportunities across global markets while meeting their toughest investment challenges. We’re part of PGIM, a top-10 global investment manager with more than $1 trillion in assets under management. This investment expertise allows us to deliver actively managed funds and strategies to meet the needs of investors around the globe.
Thank you for choosing our family of funds.
Sincerely,

Stuart S. Parker, President
Prudential Jennison Global Opportunities Fund
December 15, 2017
| Prudential Jennison Global Opportunities Fund | 7 |
Your Fund’s Performance (unaudited)
Performance data quoted represents past performance. Past performance does not guarantee future results. The investment return and principal value of an investment will fluctuate, so that an investor’s shares, when redeemed, may be worth more or less than their original cost. Current performance may be lower or higher than the past performance data quoted. An investor may obtain performance data as of the most recent month-end by visiting our website at www.pgiminvestments.com or by calling (800) 225-1852.
| Average Annual Total Returns as of 10/31/17 (with sales charges) | ||||||
| One Year (%) | Five Years (%) | Since Inception (%) | ||||
| Class A | 29.33 | 14.71 | 12.67 (3/14/12) | |||
| Class C | 34.87 | 15.14 | 12.94 (3/14/12) | |||
| Class Q | 37.38 | N/A | 14.91 (12/22/14) | |||
| Class Z | 37.17 | 16.30 | 14.07 (3/14/12) | |||
| MSCI ACWI ND Index | 23.20 | 10.80 | — | |||
| Lipper Global Multi-Cap Growth Funds Average* | 25.20 | 12.07 | — | |||
| Lipper Global Large-Cap Growth Funds Average* | 24.67 | 11.46 | — | |||
| Average Annual Total Returns as of 10/31/17 (without sales charges) | ||||||
| One Year (%) | Five Years (%) | Since Inception (%) | ||||
| Class A | 36.86 | 16.01 | 13.80 (3/14/12) | |||
| Class C | 35.87 | 15.14 | 12.94 (3/14/12) | |||
| Class Q | 37.38 | N/A | 14.91 (12/22/14) | |||
| Class Z | 37.17 | 16.30 | 14.07 (3/14/12) | |||
| MSCI ACWI ND Index | 23.20 | 10.80 | — | |||
| Lipper Global Multi-Cap Growth Funds Average* | 25.20 | 12.07 | — | |||
| Lipper Global Large-Cap Growth Funds Average* | 24.67 | 11.46 | — | |||
*The Fund is compared to the Lipper Global Multi-Cap Growth Funds Average performance universe, although Lipper classifies the Fund in the Lipper Global Large-Cap Growth Funds performance universe. The Lipper Global Multi-Cap Growth Funds performance universe is utilized because the Fund’s manager believes that the funds included in this universe provide a more appropriate basis for fund performance comparison.
| 8 | Visit our website at pgiminvestments.com |
Growth of a $10,000 Investment
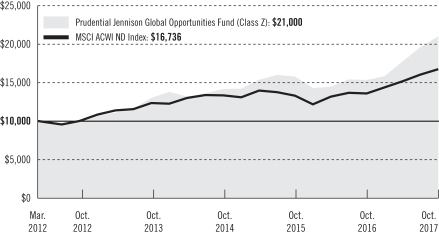
The graph compares a $10,000 investment in the Prudential Jennison Global Opportunities Fund (Class Z shares) with a similar investment in the MSCI ACWI ND Index by portraying the initial account values at the commencement of operations for Class Z shares (March 14, 2012) and the account values at the end of the current fiscal year (October 31, 2017), as measured on a quarterly basis. For purposes of the graph, and unless otherwise indicated, it has been assumed that (a) all recurring fees (including management fees) were deducted; and (b) all dividends and distributions were reinvested. The line graph provides information for Class Z shares only. As indicated in the tables provided earlier, performance for Class A, Class C, and Class Q shares will vary due to the differing charges and expenses applicable to each share class (as indicated in the following paragraphs). Without waiver of fees and/or expense reimbursements, if any, the returns would have been lower.
Past performance does not predict future performance. Total returns and the ending account values in the graph include changes in share price and reinvestment of dividends and capital gains distributions in a hypothetical investment for the periods shown. The Fund’s total returns do not reflect the deduction of income taxes on an individual’s investment. Taxes may reduce your actual investment returns on income or gains paid by the Fund or any gains you may realize if you sell your shares.
Source: PGIM Investments LLC and Lipper Inc.
Since Inception returns are provided since the Fund has less than 10 fiscal years of returns. Since Inception returns for the Index and the Lipper Averages are measured from the inception date for the indicated share class.
| Prudential Jennison Global Opportunities Fund | 9 |
Your Fund’s Performance (continued)
The returns in the tables do not reflect the deduction of taxes that a shareholder would pay on Fund distributions or following the redemption of Fund shares. The average annual total returns take into account applicable sales charges, which are described for each share class in the table below.
| Class A* | Class C* | Class Q | Class Z* | |||||
| Maximum initial sales charge | 5.50% of the public offering price | None | None | None | ||||
| Contingent deferred sales charge (CDSC) (as a percentage of the lower of original purchase price or net asset value at redemption) | 1.00% on sales of $1 million or more made within 12 months of purchase | 1.00% on sales made within 12 months of purchase | None | None | ||||
| Annual distribution and service (12b-1) fees (shown as a percentage of average daily net assets) | 0.30% (0.25% currently) | 1.00% | None | None |
*Certain share classes will be generally closed to investments by new group retirement plans effective on or about June 1, 2018. Please see the “PRUDENTIAL FUNDS—UPDATE” on page 4 of this report for more information.
Benchmark Definitions
MSCI ACWI ND Index—The Morgan Stanley Capital International All Country World Net Dividend Index (MSCI ACWI ND Index) is an unmanaged free float-adjusted market capitalization weighted index that is designed to measure the equity market performance of developed and emerging markets. The MSCI ACWI ND Index consists of 46 country indexes comprising 23 developed and 23 emerging market country indexes. The ND version of the MSCI ACWI Index reflects the impact of the maximum withholding taxes on reinvested dividends. The average annual total return for the Index measured from the month-end closest to the inception date of the Fund’s Class A, Class C, and Class Z shares through 10/31/17 is 9.64% and 8.51% for Class Q shares.
Lipper Global Multi-Cap Growth Funds Average—The Lipper Global Multi-Cap Growth Funds Average (Lipper Average) is based on the average return of all funds in the Lipper Global Multi-Cap Growth Funds universe for the periods noted. Funds in the Lipper Average are funds that, by portfolio practice, invest in a variety of market capitalization ranges without concentrating 75% of their equity assets in any one market capitalization range over an extended period of time. Global multi-cap growth funds typically have above-average characteristics compared to the MSCI World Index. The average annual total return for the Lipper Average measured from the month-end closest to the inception date of the Fund’s Class A, Class C, and Class Z shares through 10/31/17 is 10.47% and 9.06% for Class Q shares.
Lipper Global Large-Cap Growth Funds Average—The Lipper Global Large-Cap Growth Funds Average (Lipper Average) is based on the average return of all funds in the Lipper Global Large-Cap Growth Funds universe for the periods noted. Funds in the Lipper Average are funds that, by portfolio practice, invest at least 75% of their
| 10 | Visit our website at pgiminvestments.com |
equity assets in companies both inside and outside of the US with market capitalizations (on a three-year weighted basis) above Lipper’s global large-cap floor. Global large-cap growth funds typically have above average characteristics compared to their large-cap specific subset of the MSCI World Index. The average annual total return for the Lipper Average measured from the month-end closest to the inception date of the Fund’s Class A, Class C, and Class Z shares through 10/31/17 is 10.08% and 9.54% for Class Q shares.
Investors cannot invest directly in an index or average. The returns for the Index would be lower if they included the effects of sales charges, operating expenses of a mutual fund, or taxes. Returns for the Lipper Average reflect the deduction of operating expenses, but not sales charges or taxes.
Presentation of Fund Holdings
| Five Largest Holdings expressed as a percentage of net assets as of 10/31/17 (%) | ||||
Tencent Holdings Ltd., Internet Software & Services | 6.8 | |||
| Alibaba Group Holding Ltd., Internet Software & Services | 6.4 | |||
| Kering, Textiles, Apparel & Luxury Goods | 4.5 | |||
| Amazon.com, Inc., Internet & Direct Marketing Retail | 4.4 | |||
| Adidas AG, Textiles, Apparel & Luxury Goods | 4.3 | |||
Holdings reflect only long-term investments and are subject to change.
| Five Largest Industries expressed as a percentage of net assets as of 10/31/17 (%) | ||||
Internet Software & Services | 21.7 | |||
| Textiles, Apparel & Luxury Goods | 11.8 | |||
| Internet & Direct Marketing Retail | 9.5 | |||
| IT Services | 8.1 | |||
| Biotechnology | 5.4 | |||
Industry weightings reflect only long-term investments and are subject to change.
| Prudential Jennison Global Opportunities Fund | 11 |
Strategy and Performance Overview
How did the Fund perform?
The Prudential Jennison Global Opportunities Fund’s Class Z shares rose 37.17% for the 12 months ended October 31, 2017. In the same period, the MSCI All Country World Index (the Index) advanced 23.20% and the Lipper Global Multi-Cap Growth Funds Average climbed 25.20%.
What was the market environment?
| • | Equity returns were strong in the 12-month period ended October 31, 2017, as global gross domestic product advanced at a healthy pace, long-term interest rates remained close to historical lows, and central banks tightened monetary policy prudently and gradually in light of subdued inflation. |
| • | In the US, solid economic fundamentals included stable and moderate economic expansion, robust employment, accelerating corporate profit growth, and accumulating cash on company balance sheets. |
| • | North Korean missile activity, ongoing investigations into Russia’s interference in the 2016 election, and turnover in key administration positions contributed to uncertainty. |
| • | Europe’s economic recovery proceeded, and emerging markets had their best performance since the aftermath of the financial crisis. Japan likewise showed healthier trends in economic activity. |
| • | In the Index, all sectors advanced, with information technology, financials, materials, and industrials posting the largest gains, while returns in telecommunications services and consumer staples were more modest. |
| • | Likewise, all regions were positive, with developed Europe and emerging markets leading the others. |
What worked?
| • | Information technology positions were strong contributors to return. |
| • | Apple’s fundamental strength reflects the proliferation of the iOS platform across the global mobile phone, tablet, and personal computer landscape as well as the financial power related to the attractive margin profile of the company’s hardware products. In September, Apple unveiled a new product cycle, which includes a new iPhone X (borderless OLED screen, wireless charging, facial recognition cameras); iPhone 8 and iPhone 8 Plus; Apple Watch Series 3; and iOS 11. |
| • | Alibaba reported impressive financial results that beat consensus expectations on most key metrics. It operates China’s largest global online wholesale platform for small businesses, China’s largest online retail website, and China’s largest online third-party platform for brands and retailers. Jennison believes Alibaba, with its dominant market share, offers an attractive opportunity to invest in the long-term growth of the Chinese e-commerce market. |
| 12 | Visit our website at prudentialfunds.com |
| • | Tencent, China’s largest and most visited Internet service portal, continued to perform well, fundamentally driven by its dominant position in China’s online gaming and instant messaging markets and its growing advertising and payment service efforts. With its recent acquisition of two key music platforms, Tencent is also China’s leading online music provider. |
| • | Consumer discretionary holdings also performed well in aggregate and a number of top performers were found in the sector: |
| • | Paris-based Kering is the world’s third-largest luxury group behind LVMH and Richemont. It operates in three divisions: luxury, lifestyle, and retail. Its global luxury brands include Gucci, Alexander McQueen, Balenciaga, Brioni, Boucheron, Bottega Veneta, and Yves Saint Laurent. German athletic shoemaker Puma is key to lifestyle operations. After restructuring and repositioning the Gucci brand for several quarters, with efforts focused on improving store concept, training staff, and broadening the product portfolio, Kering is beginning to see results. Jennison expects Kering’s positive earnings momentum to continue as the company increases its focus on organic growth (through retail execution and product innovation), financial discipline, and free cash generation. |
| • | Amazon continued to drive growth in its core retail business and through the proliferation of digital commerce via the mobile market. The stock has benefited from strong execution, long-term revenue growth, and development of a meaningfully important business opportunity in cloud infrastructure. Amazon’s acquisition of Whole Foods, which potentially unlocks another large addressable market over the long term, closed in August. As Amazon’s business momentum continues, Jennison believe investments in distribution, digital content, Prime Now/Amazon Fresh, Alexa/Echo, and India will continue to fuel growth. |
| • | Based in Bavaria, Germany, Adidas sells sports shoes, apparel, and equipment in 160 countries. After several years of suboptimal performance, the company is poised to generate accelerated growth as new management repositions the Adidas brand in North America, leverages its Boost technology, and restructures certain product lines. Jennison anticipates double-digit revenue growth and stable profit margins as higher raw material costs and negative currency effects are offset by better channel and product mix and more favorable pricing trends. |
What didn’t work?
| • | A large underweight to financials weighed on results and the Fund’s health care positions were also a source of relative weakness; however, notable detractors were diversified across a variety of sectors. |
| • | Nintendo, one of the world’s largest video game console makers, makes Wii home video consoles and DS handheld consoles. Kyoto, Japan-based company also makes software or |
| Prudential Jennison Global Opportunities Fund | 13 |
Strategy and Performance Overview (continued)
| Internet Protocol (IP) games, including the Donkey Kong, Mario, Zelda, and Pokémon franchises. Until recently, Nintendo has been slow to adjust as the game industry has extended to mobile platforms. In December, the company launched Super Mario Run in 151 countries and reached the top spot in App Store sales rankings in almost all developed markets and emerging markets. However, user ratings deteriorated shortly after the release, suggesting that the game’s appeal may subside quickly. Jennison eliminated the position. |
| • | One of the largest oilfield services companies in the world, Halliburton serves the exploration and production oil and gas industry in 80 countries. Emerging from its failed, 17-month struggle to merge with Baker Hughes, Jennison expected the company to cut costs aggressively and leverage its strength and upgraded fleet as drilling activity recovered. However, expectations that oil prices would stabilize or rise (in the wake of OPEC’s decision to cut production late last fall) and that oil field capital spending programs would accelerate did not materialize, as oil prices declined off their highs. To mitigate the risk of potentially disappointing earnings in the months ahead due to delays in capital spending, the Fund eliminated the position. |
| • | Based in Kobe, Japan, Sysmex makes and sells clinical laboratory equipment, reagents, and software related to diagnostics, especially in hematology, hemostasis, urinalysis, and immunochemistry. It operates globally, with a strong presence in China and other emerging markets. Although hematology operations in the US and Europe are performing well, sales in China, a leading contributor to overall profit, have slowed and Jennison exited the position. |
| • | Itaú Unibanco is Brazil’s largest private-sector bank with an approximate 15% market share. Its businesses include commercial and retail banking, merchant acquiring, insurance, investment banking, and asset management. The bank also operates in Chile, Colombia, Argentina, Paraguay, and Uruguay. Although Jennison likes its growing fee-generating businesses, declining credit costs, best-in-class efficiency ratio, and strong management team, renewed political turmoil in Brazil stemming from a wide-ranging corruption investigation increased the risk that economic recovery will be delayed and the Fund closed the position. |
| • | Constellation Brands is the world’s largest premium wine producer, offering more than 100 brands, including Robert Mondavi and Clos du Bois. The company is also the third-largest beer distributor in the US and the sole US distributor for Grupo Modelo, the brewer of Corona, Modelo Especial, Negra Modelo, and other beers. Although Constellation’s strong beer sales growth has been fueled by expanding capacity, improved marketing, and greater distribution, recent results suggested slowing growth. The stock has also been hurt by the company’s exposure to a threatened border-adjusted tax; the new US administration has espoused import taxes on Mexican exports, including Constellation’s lucrative beers. The Fund eliminated the position. |
| 14 | Visit our website at pgiminvestments.com |
The percentage points shown in the tables below identify each security’s positive or negative contribution to the Fund’s return relative to the benchmark, which is the sum of all contributions by individual holdings.
| Top Contributors (%) | Top Detractors (%) | |||||
| Alibaba Group Holding Ltd. Sponsored ADR | 3.88 | Nintendo Co., Ltd. | –0.77 | |||
| Tencent Holdings Ltd. | 3.73 | Halliburton Co. | –0.49 | |||
| Kering | 2.52 | Sysmex Corp. | –0.46 | |||
| Amazon.com | 2.01 | Itau Unibanco Holding SA (ADR) | –0.36 | |||
| Adidas AG | 1.87 | Constellation Brands, Inc. | –0.31 | |||
Current outlook
| • | The Fund remains focused on identifying businesses that can generate organic growth and that continue to benefit from structural changes in their industries. The strategy remains heavily invested in technology and consumer discretionary stocks offering these characteristics. Jennison will continue to carefully evaluate the fundamental outlooks of its holdings and make adjustments as necessary as the overall global environment evolves. |
| • | US investor sentiment continues to improve as regulatory relief and the prospect of tax code changes appear to be outweighing the lack of major policy achievements from the new administration. |
| • | Many developed European holdings are global companies with unique business models that derive much, if not most, of their revenues outside of Europe. Service-oriented companies offering a competitive advantage are performing fundamentally well. |
| • | In developed Asia, Jennison is closely monitoring efforts under way in Japan to stimulate growth and reform aspects of the economy. |
| • | Jennison’s overall view of the emerging markets macroeconomic environment has been turning more positive, as currencies have stabilized, gross domestic product growth has reaccelerated, commodities prices have improved, inflationary pressures have remained subdued, and central banks have eased monetary policy. However, potential geopolitical uncertainty stemming from possible US isolationism and trade protection under the new administration could trigger changes in relative currency valuations and spur reactive currency devaluations, which could create significant challenges, especially for emerging markets economies. |
| Prudential Jennison Global Opportunities Fund | 15 |
Strategy and Performance Overview (continued)
| • | China’s struggle to drive economic growth through domestic consumer demand, rather than exports and massive public works programs, is a work in progress. The positions Jennison holds in Chinese equities continue to focus on the rapidly growing e-commerce and Internet platform opportunities that have seen little, if any, impact from the pressures surrounding the broader economy. |
| 16 | Visit our website at pgiminvestments.com |
Fees and Expenses (unaudited)
As a shareholder of the Fund, you incur two types of costs: (1) transaction costs, including sales charges (loads) on purchase payments and redemptions, as applicable, and (2) ongoing costs, including management fees, distribution, and/or service (12b-1) fees, and other Fund expenses, as applicable. This example is intended to help you understand your ongoing costs (in dollars) of investing in the Fund and to compare these costs with the ongoing costs of investing in other mutual funds.
The example is based on an investment of $1,000 held through the six-month period ended October 31, 2017. The example is for illustrative purposes only; you should consult the Prospectus for information on initial and subsequent minimum investment requirements.
Actual Expenses
The first line for each share class in the table on the following page provides information about actual account values and actual expenses. You may use the information on this line, together with the amount you invested, to estimate the expenses that you paid over the period. Simply divide your account value by $1,000 (for example, an $8,600 account value ÷ $1,000 = 8.6), then multiply the result by the number on the first line under the heading “Expenses Paid During the Six-Month Period” to estimate the expenses you paid on your account during this period.
Hypothetical Example for Comparison Purposes
The second line for each share class in the table on the following page provides information about hypothetical account values and hypothetical expenses based on the Fund’s actual expense ratio and an assumed rate of return of 5% per year before expenses, which is not the Fund’s actual return. The hypothetical account values and expenses may not be used to estimate the actual ending account balance or expenses you paid for the period. You may use this information to compare the ongoing costs of investing in the Fund and other funds. To do so, compare this 5% hypothetical example with the 5% hypothetical examples that appear in the shareholder reports of the other funds.
The Fund’s transfer agent may charge additional fees to holders of certain accounts that are not included in the expenses shown in the table on the following page. These fees apply to individual retirement accounts (IRAs) and Section 403(b) accounts. As of the close of the six-month period covered by the table, IRA fees included an annual maintenance fee of $15 per account (subject to a maximum annual maintenance fee of $25 for all accounts held by the same shareholder). Section 403(b) accounts are charged an annual $25 fiduciary maintenance fee. Some of the fees may vary in amount, or may be waived, based on your total account balance or the number of Prudential funds, including the Fund, that you own. You should consider the additional fees that were charged to your
| Prudential Jennison Global Opportunities Fund | 17 |
Fees and Expenses (continued)
Fund account over the six-month period when you estimate the total ongoing expenses paid over the period and the impact of these fees on your ending account value, as these additional expenses are not reflected in the information provided in the expense table. Additional fees have the effect of reducing investment returns.
Please note that the expenses shown in the table are meant to highlight your ongoing costs only and do not reflect any transactional costs such as sales charges (loads). Therefore, the second line for each share class in the table is useful in comparing ongoing costs only and will not help you determine the relative total costs of owning different funds. In addition, if these transactional costs were included, your costs would have been higher.
| Prudential Jennison Global Opportunities Fund | Beginning Account Value May 1, 2017 | Ending Account Value October 31, 2017 | Annualized Expense Ratio Based on the Six-Month Period | Expenses Paid During the Six-Month Period* | ||||||||||||||
| Class A | Actual | $ | 1,000.00 | $ | 1,182.00 | 1.17 | % | $ | 6.43 | |||||||||
| Hypothetical | $ | 1,000.00 | $ | 1,019.31 | 1.17 | % | $ | 5.96 | ||||||||||
| Class C | Actual | $ | 1,000.00 | $ | 1,177.30 | 1.92 | % | $ | 10.54 | |||||||||
| Hypothetical | $ | 1,000.00 | $ | 1,015.53 | 1.92 | % | $ | 9.75 | ||||||||||
| Class Q | Actual | $ | 1,000.00 | $ | 1,183.80 | 0.84 | % | $ | 4.62 | |||||||||
| Hypothetical | $ | 1,000.00 | $ | 1,020.97 | 0.84 | % | $ | 4.28 | ||||||||||
| Class Z | Actual | $ | 1,000.00 | $ | 1,183.10 | 0.92 | % | $ | 5.06 | |||||||||
| Hypothetical | $ | 1,000.00 | $ | 1,020.57 | 0.92 | % | $ | 4.69 | ||||||||||
*Fund expenses (net of fee waivers or subsidies, if any) for each share class are equal to the annualized expense ratio for each share class (provided in the table), multiplied by the average account value over the period, multiplied by the 184 days in the six-month period ended October 31, 2017, and divided by the 365 days in the Fund’s fiscal year ended October 31, 2017 (to reflect the six-month period). Expenses presented in the table include the expenses of any underlying funds in which the Fund may invest.
| 18 | Visit our website at pgiminvestments.com |
Schedule of Investments
as of October 31, 2017
| Description | Shares | Value | ||||||
LONG-TERM INVESTMENTS 98.6% | ||||||||
COMMON STOCKS | ||||||||
Argentina 3.1% | ||||||||
MercadoLibre, Inc.(a) | 68,360 | $ | 16,427,592 | |||||
Brazil 2.2% | ||||||||
Raia Drogasil SA | 497,041 | 11,960,709 | ||||||
China 13.2% | ||||||||
Alibaba Group Holding Ltd., ADR*(a) | 186,070 | 34,402,482 | ||||||
Tencent Holdings Ltd. | 801,459 | 36,021,661 | ||||||
|
| |||||||
| 70,424,143 | ||||||||
Denmark 1.7% | ||||||||
Novozymes A/S (Class B Stock) | 163,334 | 9,024,665 | ||||||
France 9.7% | ||||||||
Kering | 52,566 | 24,107,063 | ||||||
L’Oreal SA | 52,719 | 11,733,327 | ||||||
LVMH Moet Hennessy Louis Vuitton SE | 54,118 | 16,141,410 | ||||||
|
| |||||||
| 51,981,800 | ||||||||
Germany 6.6% | ||||||||
adidas AG | 101,964 | 22,695,473 | ||||||
Wirecard AG | 127,362 | 12,653,428 | ||||||
|
| |||||||
| 35,348,901 | ||||||||
India 2.4% | ||||||||
HDFC Bank Ltd., ADR | 139,471 | 12,873,173 | ||||||
Italy 1.3% | ||||||||
Ferrari NV | 58,019 | 6,947,075 | ||||||
Japan 3.9% | ||||||||
FANUC Corp. | 22,589 | 5,281,848 | ||||||
Keyence Corp. | 27,868 | 15,473,009 | ||||||
|
| |||||||
| 20,754,857 | ||||||||
Netherlands 2.9% | ||||||||
ASML Holding NV | 84,441 | 15,235,639 | ||||||
Spain 2.1% | ||||||||
Industria de Diseno Textil SA | 298,630 | 11,162,212 | ||||||
See Notes to Financial Statements.
| Prudential Jennison Global Opportunities Fund | 19 |
Schedule of Investments (continued)
as of October 31, 2017
| Description | Shares | Value | ||||||
COMMON STOCKS (Continued) | ||||||||
Thailand 2.4% | ||||||||
CP ALL PCL | 5,969,433 | $ | 12,579,803 | |||||
United Kingdom 2.5% | ||||||||
ASOS PLC* | 78,369 | 5,928,365 | ||||||
St. James’s Place PLC | 472,491 | 7,384,964 | ||||||
|
| |||||||
| 13,313,329 | ||||||||
United States 44.6% | ||||||||
AbbVie, Inc. | 107,669 | 9,717,127 | ||||||
Activision Blizzard, Inc. | 124,064 | 8,124,951 | ||||||
Albemarle Corp. | 115,645 | 16,293,224 | ||||||
Alphabet, Inc. (Class A Stock)* | 7,382 | 7,625,901 | ||||||
Amazon.com, Inc.* | 21,030 | 23,244,039 | ||||||
Apple, Inc. | 84,235 | 14,239,084 | ||||||
Boston Scientific Corp.* | 421,021 | 11,847,531 | ||||||
Charter Communications, Inc. (Class A Stock)* | 48,670 | 16,264,054 | ||||||
Estee Lauder Cos., Inc. (The) (Class A Stock) | 92,977 | 10,395,758 | ||||||
Facebook, Inc. (Class A Stock)* | 122,581 | 22,071,935 | ||||||
Incyte Corp.* | 62,725 | 7,103,606 | ||||||
Mastercard, Inc. (Class A Stock) | 112,980 | 16,808,035 | ||||||
Netflix, Inc.* | 108,604 | 21,333,084 | ||||||
PayPal Holdings, Inc.* | 186,097 | 13,503,198 | ||||||
Tesla, Inc.*(a) | 34,640 | 11,484,199 | ||||||
UnitedHealth Group, Inc. | 76,912 | 16,168,441 | ||||||
Vertex Pharmaceuticals, Inc.* | 80,669 | 11,796,228 | ||||||
|
| |||||||
| 238,020,395 | ||||||||
|
| |||||||
TOTAL LONG-TERM INVESTMENTS | 526,054,293 | |||||||
|
| |||||||
SHORT-TERM INVESTMENTS 11.6% | ||||||||
AFFILIATED MUTUAL FUNDS | ||||||||
Prudential Investment Portfolios 2 - Prudential Core Ultra Short Bond Fund(w) | 5,431,483 | 5,431,483 | ||||||
Prudential Investment Portfolios 2 - Prudential Institutional Money Market Fund | 56,729,460 | 56,735,133 | ||||||
|
| |||||||
TOTAL SHORT-TERM INVESTMENTS | 62,166,616 | |||||||
|
| |||||||
TOTAL INVESTMENTS 110.2% | 588,220,909 | |||||||
Liabilities in excess of other assets (10.2)% | (54,635,589 | ) | ||||||
|
| |||||||
NET ASSETS 100.0% | $ | 533,585,320 | ||||||
|
| |||||||
See Notes to Financial Statements.
| 20 |
The following abbreviations are used in the annual report:
ADR—American Depositary Receipt
LIBOR—London Interbank Offered Rate
| * | Non-income producing security. |
| (a) | All or a portion of security is on loan. The aggregate market value of such securities, including those sold and pending settlement, is $56,800,028; cash collateral of $56,687,399 (included in liabilities) was received with which the Series purchased highly liquid short-term investments. Cash collateral is less than 102% of the market value of securities loaned due to significant market increases on the last business day of the reporting period. Collateral was subsequently received on the following business day and the Series remained in compliance. |
| (b) | Represents security purchased with cash collateral received for securities on loan and includes dividend reinvestment. |
| (w) | PGIM Investments LLC, the manager of the Series, also serves as manager of the Prudential Investment Portfolios 2 - Prudential Core Ultra Short Bond Fund and Prudential Institutional Money Market Fund. |
Fair Value Measurements:
Various inputs are used in determining the value of the Series’ investments. These inputs are summarized in the three broad levels listed below.
Level 1—unadjusted quoted prices generally in active markets for identical securities.
Level 2—quoted prices for similar securities, interest rates and yield curves, prepayment speeds, foreign currency exchange rates and other observable inputs.
Level 3—unobservable inputs for securities valued in accordance with Board approved fair valuation procedures.
The following is a summary of the inputs used as of October 31, 2017 in valuing such portfolio securities:
| Level 1 | Level 2 | Level 3 | ||||||||||
Investments in Securities | ||||||||||||
Common Stocks | ||||||||||||
Argentina | $ | 16,427,592 | $ | — | $ | — | ||||||
Brazil | 11,960,709 | — | — | |||||||||
China | 34,402,482 | 36,021,661 | — | |||||||||
Denmark | — | 9,024,665 | — | |||||||||
France | — | 51,981,800 | — | |||||||||
Germany | — | 35,348,901 | — | |||||||||
India | 12,873,173 | — | — | |||||||||
Italy | — | 6,947,075 | — | |||||||||
Japan | — | 20,754,857 | — | |||||||||
Netherlands | — | 15,235,639 | — | |||||||||
Spain | — | 11,162,212 | — | |||||||||
Thailand | — | 12,579,803 | — | |||||||||
United Kingdom | — | 13,313,329 | — | |||||||||
United States | 238,020,395 | — | — | |||||||||
Affiliated Mutual Funds | 62,166,616 | — | — | |||||||||
|
|
|
|
|
| |||||||
Total | $ | 375,850,967 | $ | 212,369,942 | $ | — | ||||||
|
|
|
|
|
| |||||||
See Notes to Financial Statements.
| Prudential Jennison Global Opportunities Fund | 21 |
Schedule of Investments (continued)
as of October 31, 2017
During the period, there were no transfers between Level 1, Level 2 and Level 3 to report.
Industry Classification:
The industry classification of investments and liabilities in excess of other assets shown as a percentage of net assets as of October 31, 2017 were as follows (unaudited):
Internet Software & Services | 21.8 | % | ||
Textiles, Apparel & Luxury Goods | 11.8 | |||
Affiliated Mutual Funds (including 10.6% of collateral for securities on loan) | 11.6 | |||
Internet & Direct Marketing Retail | 9.5 | |||
IT Services | 8.1 | |||
Biotechnology | 5.4 | |||
Chemicals | 4.7 | |||
Food & Staples Retailing | 4.6 | |||
Personal Products | 4.1 | |||
Automobiles | 3.5 | |||
Media | 3.0 | |||
Health Care Providers & Services | 3.0 | |||
Electronic Equipment, Instruments & Components | 2.9 | % | ||
Semiconductors & Semiconductor Equipment | 2.9 | |||
Technology Hardware, Storage & Peripherals | 2.7 | |||
Banks | 2.4 | |||
Health Care Equipment & Supplies | 2.2 | |||
Specialty Retail | 2.1 | |||
Software | 1.5 | |||
Capital Markets | 1.4 | |||
Machinery | 1.0 | |||
|
| |||
| 110.2 | ||||
Liabilities in excess of other assets | (10.2 | ) | ||
|
| |||
| 100.0 | % | |||
|
|
Financial Instruments/Transactions—Summary of Offsetting and Netting Arrangements:
The Series entered into financial instruments/transactions during the reporting period that are either offset in accordance with current requirements or are subject to enforceable master netting arrangements or similar agreements that permit offsetting. The information about offsetting and related netting arrangements for financial instruments/transactions, where the legal right to set-off exists, is presented in the summary below.
Offsetting of financial instruments/transactions assets and liabilities:
Description | Gross Market Value of Recognized Assets/(Liabilities) | Collateral Pledged/(Received)(1) | Net Amount | |||||||||
Securities on Loan | $ | 56,800,028 | $ | (56,687,399 | ) | $ | 112,629 | |||||
|
| |||||||||||
| (1) | Collateral amount disclosed by the Series is limited to the market value of financial instruments/transactions. |
See Notes to Financial Statements.
| 22 |
This Page Intentionally Left Blank
Statement of Assets & Liabilities
as of October 31, 2017
Assets | ||||
Investments at value, including securities on loan of $56,800,028: | ||||
Unaffiliated investments (cost $393,842,456) | $ | 526,054,293 | ||
Affiliated investments (cost $62,165,920) | 62,166,616 | |||
Foreign currency, at value (cost $667,514) | 667,514 | |||
Receivable for Series shares sold | 2,855,056 | |||
Receivable for investments sold | 787,843 | |||
Dividends receivable | 225,553 | |||
Tax reclaim receivable | 81,845 | |||
Prepaid expenses | 3,170 | |||
|
| |||
Total Assets | 592,841,890 | |||
|
| |||
Liabilities | ||||
Payable to broker for collateral for securities on loan | 56,687,399 | |||
Payable for investments purchased | 1,281,862 | |||
Payable for Series shares reacquired | 704,918 | |||
Management fee payable | 361,535 | |||
Accrued expenses and other liabilities | 138,132 | |||
Distribution fee payable | 69,179 | |||
Affiliated transfer agent fee payable | 13,545 | |||
|
| |||
Total Liabilities | 59,256,570 | |||
|
| |||
Net Assets | $ | 533,585,320 | ||
|
| |||
Net assets were comprised of: | ||||
Common stock, at par | $ | 256,799 | ||
Paid-in capital in excess of par | 421,520,202 | |||
|
| |||
| 421,777,001 | ||||
Accumulated net investment loss | (1,356,667 | ) | ||
Accumulated net realized loss on investment and foreign currency transactions | (19,045,300 | ) | ||
Net unrealized appreciation on investments and foreign currencies | 132,210,286 | |||
|
| |||
Net assets, October 31, 2017 | $ | 533,585,320 | ||
|
| |||
See Notes to Financial Statements.
| 24 |
Class A | ||||
Net asset value and redemption price per share | $ | 20.72 | ||
Maximum sales charge (5.50% of offering price) | 1.21 | |||
|
| |||
Maximum offering price to public | $ | 21.93 | ||
|
| |||
Class C | ||||
Net asset value, offering price and redemption price per share | $ | 19.85 | ||
|
| |||
Class Q | ||||
Net asset value, offering price and redemption price per share | $ | 21.06 | ||
|
| |||
Class Z | ||||
Net asset value, offering price and redemption price per share | $ | 21.00 | ||
|
| |||
See Notes to Financial Statements.
| Prudential Jennison Global Opportunities Fund | 25 |
Statement of Operations
Year Ended October 31, 2017
Net Investment Income (Loss) | ||||
Income | ||||
Unaffiliated dividend income (net of foreign withholding taxes of $112,822) | $ | 2,026,598 | ||
Income from securities lending, net (including affiliated income of $22,621) | 95,391 | |||
Affiliated dividend income | 68,698 | |||
|
| |||
Total income | 2,190,687 | |||
|
| |||
Expenses | ||||
Management fee | 2,766,985 | |||
Distribution fee—Class A | 212,411 | |||
Distribution fee—Class C | 559,188 | |||
Transfer agent’s fees and expenses (including affiliated expense of $59,800) | 312,000 | |||
Custodian and accounting fees | 119,000 | |||
Registration fees | 81,000 | |||
Shareholders’ reports | 38,000 | |||
Audit fee | 27,000 | |||
Legal fees and expenses | 22,000 | |||
Directors’ fees | 15,000 | |||
Miscellaneous | 36,184 | |||
|
| |||
Total expenses | 4,188,768 | |||
|
| |||
Less: Expense reimbursement | (286,511 | ) | ||
Distribution fee waiver—Class A | (35,405 | ) | ||
|
| |||
Net expenses | 3,866,852 | |||
|
| |||
Net investment income (loss) | (1,676,165 | ) | ||
|
| |||
Realized And Unrealized Gain (Loss) On Investments And Foreign Currency Transactions | ||||
Net realized gain (loss) on: | ||||
Investment transactions (including affiliated of $1,395) | 10,635,164 | |||
Foreign currency transactions | (8,686 | ) | ||
|
| |||
| 10,626,478 | ||||
|
| |||
Net change in unrealized appreciation (depreciation) on: | ||||
Investments (including affiliated of $1,348) | 97,282,365 | |||
Foreign currencies | (672 | ) | ||
|
| |||
| 97,281,693 | ||||
|
| |||
Net gain (loss) on investment and foreign currency transactions | 107,908,171 | |||
|
| |||
Net Increase (Decrease) In Net Assets Resulting From Operations | $ | 106,232,006 | ||
|
| |||
See Notes to Financial Statements.
| 26 |
Statement of Changes in Net Assets
| Year Ended October 31, | ||||||||
| 2017 | 2016 | |||||||
Increase (Decrease) in Net Assets | ||||||||
Operations | ||||||||
Net investment income (loss) | $ | (1,676,165 | ) | $ | (939,509 | ) | ||
Net realized gain (loss) on investment and foreign currency transactions | 10,626,478 | (26,490,892 | ) | |||||
Net change in unrealized appreciation (depreciation) on investments and foreign currencies | 97,281,693 | 12,316,327 | ||||||
|
|
|
| |||||
Net increase (decrease) in net assets resulting from operations | 106,232,006 | (15,114,074 | ) | |||||
|
|
|
| |||||
Series share transactions (Net of share conversions) | ||||||||
Net proceeds from shares sold | 276,077,034 | 270,276,394 | ||||||
Cost of shares reacquired | (113,423,243 | ) | (196,305,393 | ) | ||||
|
|
|
| |||||
Net increase (decrease) in net assets from Series share transactions | 162,653,791 | 73,971,001 | ||||||
|
|
|
| |||||
Total increase (decrease) | 268,885,797 | 58,856,927 | ||||||
Net Assets: | ||||||||
Beginning of year | 264,699,523 | 205,842,596 | ||||||
|
|
|
| |||||
End of year | $ | 533,585,320 | $ | 264,699,523 | ||||
|
|
|
| |||||
See Notes to Financial Statements.
| Prudential Jennison Global Opportunities Fund | 27 |
Notes to Financial Statements
Prudential World Fund, Inc. (the “Fund”) is registered under the Investment Company Act of 1940, as amended (“1940 Act”), as an open-end management investment company and currently consists of seven investment portfolios: Prudential Emerging Markets Debt Hard Currency Fund and Prudential Emerging Markets Debt Local Currency Fund which are non-diversified funds and Prudential Jennison Emerging Markets Equity Fund, Prudential Jennison Global Infrastructure Fund, Prudential Jennison Global Opportunities Fund, Prudential Jennison International Opportunities Fund and Prudential QMA International Equity Fund which are diversified funds. These financial statements relate only to the Prudential Jennison Global Opportunities Fund (the “Series”).
The investment objective of the Series is to seek long-term growth of capital.
1. Accounting Policies
The Series follows investment company accounting and reporting guidance of the Financial Accounting Standards Board (“FASB”) Accounting Standard Codification Topic 946 Financial Services—Investment Companies. The following accounting policies conform to U.S. generally accepted accounting principles. The Series consistently follows such policies in the preparation of its financial statements.
Securities Valuation: The Series holds securities and other assets and liabilities that are fair valued at the close of each day (generally, 4:00 PM Eastern time) the New York Stock Exchange (“NYSE”) is open for trading. Fair value is the price that would be received to sell an asset or paid to transfer a liability in an orderly transaction between market participants on the measurement date. The Board of Directors (the “Board”) has adopted valuation procedures for security valuation under which fair valuation responsibilities have been delegated to PGIM Investments LLC (“PGIM Investments” or “the Manager”). Under the current valuation procedures, the Valuation Committee is responsible for supervising the valuation of portfolio securities and other assets and liabilities. The valuation procedures permit the Series to utilize independent pricing vendor services, quotations from market makers, and alternative valuation methods when market quotations are either not readily available or not deemed representative of fair value. A record of the Valuation Committee’s actions is subject to the Board’s review, approval, and ratification at its next regularly scheduled quarterly meeting.
Various inputs determine how the Series’ investments are valued, all of which are categorized according to the three broad levels (Level 1, 2, or 3) detailed in the Schedule of Investments.
Common and preferred stocks, exchange-traded funds, and derivative instruments, such as futures or options, that are traded on a national securities exchange are valued at the last sale price as of the close of trading on the applicable exchange where the security
| 28 |
principally trades. Securities traded via NASDAQ are valued at the NASDAQ official closing price. To the extent these securities are valued at the last sale price or NASDAQ official closing price, they are classified as Level 1 in the fair value hierarchy. In the event that no sale or official closing price on valuation date exists, these securities are generally valued at the mean between the last reported bid and ask prices, or at the last bid price in the absence of an ask price. These securities are classified as Level 2 in the fair value hierarchy.
Foreign equities traded on foreign securities exchanges are generally valued using pricing vendor services that provide model prices derived using adjustment factors based on information such as local closing price, relevant general and sector indices, currency fluctuations, depositary receipts, and futures, as applicable. Securities valued using such model prices are classified as Level 2 in the fair value hierarchy. The models generate an evaluated adjustment factor for each security, which is applied to the local closing price to adjust it for post closing market movements. Utilizing that evaluated adjustment factor, the vendor provides an evaluated price for each security. If the vendor does not provide an evaluated price, securities are valued in accordance with exchange-traded common and preferred stock valuation policies discussed above.
Investments in open-end, non-exchange-traded mutual funds are valued at their net asset values as of the close of the NYSE on the date of valuation. These securities are classified as Level 1 in the fair value hierarchy since they may be purchased or sold at their net asset values on the date of valuation.
Securities and other assets that cannot be priced according to the methods described above are valued based on pricing methodologies approved by the Board. In the event that unobservable inputs are used when determining such valuations, the securities will be classified as Level 3 in the fair value hierarchy.
When determining the fair value of securities, some of the factors influencing the valuation include: the nature of any restrictions on disposition of the securities; assessment of the general liquidity of the securities; the issuer’s financial condition and the markets in which it does business; the cost of the investment; the size of the holding and the capitalization of the issuer; the prices of any recent transactions or bids/offers for such securities or any comparable securities; any available analyst media or other reports or information deemed reliable by the investment manager regarding the issuer or the markets or industry in which it operates. Using fair value to price securities may result in a value that is different from a security’s most recent closing price and from the price used by other unaffiliated mutual funds to calculate their net asset values.
Restricted and Illiquid Securities: Subject to guidelines adopted by the Board, the Series may invest up to 15% of its net assets in illiquid securities, including those which are restricted as to disposition under securities law (“restricted securities”). Restricted securities are valued pursuant to the valuation procedures noted above. Illiquid securities are those that, because of the absence of a readily available market or due to legal or contractual restrictions on resale, cannot be sold within seven days in the ordinary course
| Prudential Jennison Global Opportunities Fund | 29 |
Notes to Financial Statements (continued)
of business at approximately the amount at which the Series has valued the investment. Therefore, the Series may find it difficult to sell illiquid securities at the time considered most advantageous by its Subadviser and may incur expenses that would not be incurred in the sale of securities that were freely marketable. Certain securities that would otherwise be considered illiquid because of legal restrictions on resale to the general public may be traded among qualified institutional buyers under Rule 144A of the Securities Act of 1933. These Rule 144A securities, as well as commercial paper that is sold in private placements under Section 4(2) of the Securities Act, may be deemed liquid by the Series’ Subadviser under the guidelines adopted by the Directors of the Series. However, the liquidity of the Series’ investments in Rule 144A securities could be impaired if trading does not develop or declines.
Foreign Currency Translation: The books and records of the Series are maintained in U.S. dollars. Foreign currency amounts are translated into U.S. dollars on the following basis:
(i) market value of investment securities, other assets and liabilities—at the current rates of exchange;
(ii) purchases and sales of investment securities, income and expenses—at the rates of exchange prevailing on the respective dates of such transactions.
Although the net assets of the Series are presented at the foreign exchange rates and market values at the close of the period, the Series does not generally isolate that portion of the results of operations arising as a result of changes in the foreign exchange rates from the fluctuations arising from changes in the market prices of long-term portfolio securities held at the end of the period. Similarly, the Series does not isolate the effect of changes in foreign exchange rates from the fluctuations arising from changes in the market prices of long-term portfolio securities sold during the period. Accordingly, holding period realized foreign currency gains (losses) are included in the reported net realized gains (losses) on investment transactions.
Net realized gains (losses) on foreign currency transactions represent net foreign exchange gains (losses) from the disposition of holdings of foreign currencies, currency gains (losses) realized between the trade and settlement dates on securities transactions, and the difference between the amounts of interest, dividends and foreign withholding taxes recorded on the Series’ books and the U.S. dollar equivalent amounts actually received or paid. Net unrealized currency gains (losses) from valuing foreign currency denominated assets and liabilities (other than investments) at period end exchange rates are reflected as a component of net unrealized appreciation (depreciation) on foreign currencies.
Master Netting Arrangements: The Fund, on behalf of the Series, is subject to various Master Agreements, or netting arrangements, with select counterparties. These are
| 30 |
agreements which a subadviser may have negotiated and entered into on behalf of the Series. A master netting arrangement between the Series and the counterparty permits the Series to offset amounts payable by the Series to the same counterparty against amounts to be received; and by the receipt of collateral from the counterparty by the Series to cover the Series’ exposure to the counterparty. However, there is no assurance that such mitigating factors are easily enforceable. In addition to master netting arrangements, the right to set-off exists when all the conditions are met such that each of the parties owes the other determinable amounts, the reporting party has the right to set-off the amount owed with the amount owed by the other party, the reporting party intends to set-off and the right of set-off is enforceable by law. During the reporting period, there was no intention to settle on a net basis and all amounts are presented on a gross basis on the Statement of Assets and Liabilities.
Securities Lending: The Series may lend its portfolio securities to banks and broker-dealers. The loans are secured by collateral at least equal to the market value of the securities loaned. Collateral pledged by each borrower is invested in an affiliated money market fund and is marked to market daily, based on the previous day’s market value, such that the value of the collateral exceeds the value of the loaned securities. Loans are subject to termination at the option of the borrower or the Series. Upon termination of the loan, the borrower will return to the Series securities identical to the loaned securities. Should the borrower of the securities fail financially, the Series has the right to repurchase the securities in the open market using the collateral. The Series recognizes income, net of any rebate and securities lending agent fees, for lending its securities in the form of fees or interest on the investment of any cash received as collateral. The borrower receives all interest and dividends from the securities loaned and such payments are passed back to the lender in amounts equivalent thereto. The Series also continues to recognize any unrealized gain (loss) in the market price of the securities loaned and on the change in the value of the collateral invested that may occur during the term of the loan. In addition, realized gain (loss) is recognized on changes in the value of the collateral invested upon liquidation of the collateral. Net earnings from securities lending are disclosed on the Statement of Operations as “Income from securities lending, net”.
Concentration of Risk: Foreign security and currency transactions may involve certain considerations and risks not typically associated with those of domestic origin as a result of, among other factors, the possibility of political or economic instability or the level of governmental supervision and regulation of foreign securities markets.
Securities Transactions and Net Investment Income: Securities transactions are recorded on the trade date. Realized gains (losses) from investment and currency transactions are calculated on the specific identification method. Dividend income is recorded on the ex-date. Interest income, including amortization of premium and accretion of discount on debt securities, as required, is recorded on the accrual basis. Expenses are recorded on an accrual basis, which may require the use of certain estimates by management that may differ from actual.
Net investment income or loss (other than distribution fees which are charged directly to the respective class and transfer agency fees specific to Class Q shares which are charged
| Prudential Jennison Global Opportunities Fund | 31 |
Notes to Financial Statements (continued)
to that share class) and unrealized and realized gains (losses) are allocated daily to each class of shares based upon the relative proportion of adjusted net assets of each class at the beginning of the day.
Taxes: It is the Series’ policy to continue to meet the requirements of the Internal Revenue Code applicable to regulated investment companies and to distribute all of its taxable net investment income and capital gains, if any, to its shareholders. Therefore, no federal income tax provision is required. Withholding taxes on foreign dividends, interest and capital gains, if any, are recorded, net of reclaimable amounts, at the time the related income is earned.
Dividends and Distributions: The Series expects to pay dividends from net investment income and distributions from net realized capital and currency gains, if any, annually. Dividends and distributions to shareholders, which are determined in accordance with federal income tax regulations and which may differ from generally accepted accounting principles, are recorded on the ex-date. Permanent book/tax differences relating to income and gain (loss) are reclassified amongst undistributed net investment income, accumulated net realized gain (loss) and paid-in capital in excess of par, as appropriate.
Estimates: The preparation of financial statements requires management to make estimates and assumptions that affect the reported amounts and disclosures in the financial statements. Actual results could differ from those estimates.
2. Agreements
The Fund, on behalf of the Series, has a management agreement with PGIM Investments. Pursuant to this agreement, PGIM Investments has responsibility for all investment advisory services and supervises the subadviser’s performance of such services. PGIM Investments has entered into a subadvisory agreement with Jennison Associates LLC (“Jennison”). The sub advisory agreement provides that Jennison will furnish investment advisory services in connection with the management of the Series. In connection therewith, Jennison is obligated to keep certain books and records of the Series. PGIM Investments pays for the services of Jennison, the cost of compensation of officers of the Series, occupancy and certain clerical and bookkeeping costs of the Series. The Series bears all other costs and expenses.
The management fee paid to PGIM Investments is accrued daily and payable monthly, at an annual rate of .825% of the Series’ average daily net assets up to $1 billion and .80% of such assets in excess of $1 billion. The effective management fee rate, before any waivers and/or expense reimbursement, was .825% for the year ended October 31, 2017. The effective management fee rate, net of waivers and/or expense reimbursement, was .740%.
| 32 |
PGIM Investments has contractually agreed through February 28, 2019 to limit the net annual operating expenses (exclusive of distribution and service (12b-1) fees, transfer agency expenses (including sub-transfer agency and networking fees), taxes (such as income and foreign withholdings taxes, stamp duty and deferred tax expenses), interest, underlying funds, brokerage, extraordinary and certain other expenses, such as dividend, broker charges and interest expense on short sales) of each class of shares of the Series to .84% of the Series’ average daily net assets. Expenses waived/reimbursed by the Manager in accordance with this agreement may be recouped by the Manager within the same fiscal year during which such waiver/reimbursement is made if such recoupment can be realized without exceeding the expense limit in effect at the time of the recoupment for that fiscal year.
The Fund, on behalf of the Series, has a distribution agreement with Prudential Investment Management Services LLC (“PIMS”), which acts as the distributor of the Class A, Class C, Class Q and Class Z shares of the Series. The Series compensates PIMS for distributing and servicing the Series’ Class A and Class C shares, pursuant to plans of distribution (the “Distribution Plans”), regardless of expenses actually incurred by PIMS. The distribution fees are accrued daily and payable monthly. No distribution or service fees are paid to PIMS as distributor of the Class Q and Class Z shares of the Series.
Pursuant to the Distribution Plans, the Series compensates PIMS for distribution related activities at an annual rate of up to .30% and 1% of the average daily net assets of the Class A and Class C shares, respectively. PIMS has contractually agreed to limit such fees to .25% of the average daily net assets of the Class A shares through February 28, 2019.
PIMS has advised the Series that it has received $579,230 in front-end sales charges resulting from sales of Class A shares during the year ended October 31, 2017. From these fees, PIMS paid such sales charges to affiliated broker-dealers, which in turn paid commissions to salespersons and incurred other distribution costs.
PIMS has advised the Series that for the year ended October 31, 2017 it received $7,808 in contingent deferred sales charges imposed upon redemptions by certain Class C shareholders.
PGIM Investments, PIMS and Jennison are indirect, wholly-owned subsidiaries of Prudential Financial, Inc. (“Prudential”).
3. Other Transactions with Affiliates
Prudential Mutual Fund Services LLC (“PMFS”), an affiliate of PGIM Investments and an indirect, wholly-owned subsidiary of Prudential, serves as the Series’ transfer agent. Transfer agent’s fees and expenses in the Statement of Operations include certain out-of-pocket expenses paid to non-affiliates, where applicable.
The Series may enter into certain securities purchase or sale transactions under Board approved Rule 17a-7 procedures. Rule 17a-7 is an exemptive rule under the 1940 Act,
| Prudential Jennison Global Opportunities Fund | 33 |
Notes to Financial Statements (continued)
that permits purchase and sale transactions among affiliated investment companies, or between an investment company and a person that is affiliated solely by reason of having a common (or affiliated) investment adviser, common directors, and/or common officers. Such transactions are subject to ratification by the Board. For the reporting period ended October 31, 2017 no such transactions were entered into by the Series.
The Series may invest its overnight sweep cash in the Prudential Core Ultra Short Bond Fund (the “Core Fund”), and its securities lending cash collateral in the Prudential Institutional Money Market Fund (the “Money Market Fund”), each a series of Prudential Investment Portfolios 2, registered under the 1940 Act and managed by PGIM Investments. For the reporting period ended October 31, 2017, PGIM, Inc. was compensated $20,926 by PGIM Investments for managing the Series’ securities lending cash collateral as subadviser to the Money Market Fund. Earnings from the Core Fund and Money Market Fund are disclosed on the Statement of Operations as “Affiliated dividend income” and “Income from securities lending, net”, respectively.
4. Portfolio Securities
The aggregate cost of purchases and proceeds from sales of portfolio securities (excluding short-term investments and U.S. Government securities) for the year ended October 31, 2017 were $420,418,854 and $263,882,638, respectively.
5. Distributions and Tax Information
Distributions to shareholders, which are determined in accordance with federal income tax regulations and which may differ from generally accepted accounting principles, are recorded on the ex-date. In order to present accumulated net investment loss, accumulated net realized loss on investment and foreign currency transactions and paid-in capital in excess of par on the Statement of Assets and Liabilities that more closely represent their tax character, certain adjustments have been made to accumulated net investment loss, accumulated net realized loss on investment and foreign currency transactions and paid-in capital in excess of par. For the year ended October 31, 2017, the adjustments were to decrease accumulated net investment loss by $1,049,593, decrease accumulated net realized loss on investment and foreign currency transactions by $8,686 and decrease paid-in capital in excess of par by $1,058,279 due to a net operating loss and certain transactions involving foreign currencies. Net investment loss, net realized gain (loss) on investment and foreign currency transactions and net assets were not affected by this change.
For the years ended October 31, 2017 and October 31, 2016, there were no distributions paid by the Series.
| 34 |
As of October 31, 2017, the Series had no undistributed earnings on a tax basis.
The United States federal income tax basis of the Series’ investments and the net unrealized appreciation as of October 31, 2017 were as follows:
Tax Basis | Gross Unrealized Appreciation | Gross Unrealized Depreciation | Net Unrealized Appreciation | |||
| $457,672,479 | $133,990,875 | $(3,442,445) | $130,548,430 |
The difference between book basis and tax basis was primarily due to deferred losses on wash sales and mark-to-market of receivables and payables.
For federal income tax purposes, the Series had a capital loss carryforward as of October 31, 2017 of approximately $17,383,000 which can be carried forward for an unlimited period. The Series utilized approximately $10,095,000 of its capital loss carryforward to offset net taxable gains realized in the fiscal year ended October 31, 2017. No capital gains distributions are expected to be paid to shareholders until net gains have been realized in excess of such losses.
The Series elected to treat certain late-year ordinary income losses of approximately $1,351,000 as having been incurred in the following fiscal year (October 31, 2018).
Management has analyzed the Series’ tax positions taken on federal, state and local income tax returns for all open tax years and has concluded that no provision for income tax is required in the Series’ financial statements for the current reporting period. The Series’ federal, state and local income and federal excise tax returns for tax years for which the applicable statutes of limitations have not expired are subject to examination by the Internal Revenue Service and state departments of revenue.
6. Capital
The Series offers Class A, Class C, Class Q and Class Z shares. Class A shares are sold with a maximum front-end sales charge of 5.50%. Investors who purchase $1 million or more of Class A shares and sell these shares within 12 months of purchase are subject to a contingent deferred sales charge (“CDSC”) of 1%, although they are not subject to an initial sales charge. The Class A CDSC is waived for certain retirement and/or benefit plans. Class C shares are sold with a CDSC of 1% on sales made within 12 months of purchase. A special exchange privilege is also available for shareholders who qualified to purchase Class A shares at net asset value. Class Q and Class Z shares are not subject to any sales or redemption charge and are offered exclusively for sale to a limited group of investors.
Under certain circumstances, an exchange may be made from specified share classes of the Series to one or more other share classes of the Series as presented in the table of transactions in shares of common stock.
| Prudential Jennison Global Opportunities Fund | 35 |
Notes to Financial Statements (continued)
The Fund is authorized to issue 4.8 billion shares of common stock, with a par value of $.01 per share, which are divided into seven series. There are 725 million shares authorized for the Series, divided into five classes, designated Class A, Class C, Class Q, Class Z and Class T common stock, each of which consists of 25 million, 65 million, 200 million, 200 million and 235 million authorized shares, respectively. The Series currently does not have any Class T shares outstanding.
At reporting period end, six shareholders of record held 64% of the Series’ outstanding shares.
Transactions in shares of common stock were as follows:
Class A | Shares | Amount | ||||||
Year ended October 31, 2017: | ||||||||
Shares sold | 2,078,996 | $ | 38,260,950 | |||||
Shares reacquired | (1,776,496 | ) | (28,917,700 | ) | ||||
|
|
|
| |||||
Net increase (decrease) in shares outstanding before conversion | 302,500 | 9,343,250 | ||||||
Shares issued upon conversion from other share class(es) | 33,357 | 589,430 | ||||||
Shares reacquired upon conversion into other share class(es) | (1,897,150 | ) | (30,135,824 | ) | ||||
|
|
|
| |||||
Net increase (decrease) in shares outstanding | (1,561,293 | ) | $ | (20,203,144 | ) | |||
|
|
|
| |||||
Year ended October 31, 2016: | ||||||||
Shares sold | 4,917,603 | $ | 74,099,622 | |||||
Shares reacquired | (3,588,967 | ) | (52,198,226 | ) | ||||
|
|
|
| |||||
Net increase (decrease) in shares outstanding before conversion | 1,328,636 | 21,901,396 | ||||||
Shares issued upon conversion from other share class(es) | 72,822 | 1,078,878 | ||||||
Shares reacquired upon conversion into other share class(es) | (221,310 | ) | (3,302,153 | ) | ||||
|
|
|
| |||||
Net increase (decrease) in shares outstanding | 1,180,148 | $ | 19,678,121 | |||||
|
|
|
| |||||
Class C | ||||||||
Year ended October 31, 2017: | ||||||||
Shares sold | 1,591,435 | $ | 28,218,908 | |||||
Shares reacquired | (1,038,579 | ) | (16,015,909 | ) | ||||
|
|
|
| |||||
Net increase (decrease) in shares outstanding before conversion | 552,856 | 12,202,999 | ||||||
Shares reacquired upon conversion into other share class(es) | (121,302 | ) | (2,004,556 | ) | ||||
|
|
|
| |||||
Net increase (decrease) in shares outstanding | 431,554 | $ | 10,198,443 | |||||
|
|
|
| |||||
Year ended October 31, 2016: | ||||||||
Shares sold | 2,729,452 | $ | 40,204,884 | |||||
Shares reacquired | (1,010,034 | ) | (14,223,430 | ) | ||||
|
|
|
| |||||
Net increase (decrease) in shares outstanding before conversion | 1,719,418 | 25,981,454 | ||||||
Shares reacquired upon conversion into other share class(es) | (50,695 | ) | (759,086 | ) | ||||
|
|
|
| |||||
Net increase (decrease) in shares outstanding | 1,668,723 | $ | 25,222,368 | |||||
|
|
|
| |||||
| 36 |
Class Q | Shares | Amount | ||||||
Year ended October 31, 2017: | ||||||||
Shares sold | 811,863 | $ | 15,630,303 | |||||
Shares reacquired | (7,440 | ) | (141,254 | ) | ||||
|
|
|
| |||||
Net increase (decrease) in shares outstanding before conversion | 804,423 | 15,489,049 | ||||||
Shares issued upon conversion from other share class(es) | 9,725 | 178,938 | ||||||
|
|
|
| |||||
Net increase (decrease) in shares outstanding | 814,148 | $ | 15,667,987 | |||||
|
|
|
| |||||
Year ended October 31, 2016: | ||||||||
Shares sold | 563,204 | $ | 9,000,000 | |||||
|
|
|
| |||||
Net increase (decrease) in shares outstanding | 563,204 | $ | 9,000,000 | |||||
|
|
|
| |||||
Class Z | ||||||||
Year ended October 31, 2017: | ||||||||
Shares sold | 10,560,611 | $ | 193,966,873 | |||||
Shares reacquired | (4,030,257 | ) | (68,348,380 | ) | ||||
|
|
|
| |||||
Net increase (decrease) in shares outstanding before conversion | 6,530,354 | 125,618,493 | ||||||
Shares issued upon conversion from other share class(es) | 1,977,600 | 31,909,367 | ||||||
Shares reacquired upon conversion into other share class(es) | (30,248 | ) | (537,355 | ) | ||||
|
|
|
| |||||
Net increase (decrease) in shares outstanding | 8,477,706 | $ | 156,990,505 | |||||
|
|
|
| |||||
Year ended October 31, 2016: | ||||||||
Shares sold | 9,732,772 | $ | 146,971,888 | |||||
Shares reacquired | (8,986,305 | ) | (129,883,737 | ) | ||||
|
|
|
| |||||
Net increase (decrease) in shares outstanding before conversion | 746,467 | 17,088,151 | ||||||
Shares issued upon conversion from other shares class(es) | 247,411 | 3,745,581 | ||||||
Shares reacquired upon conversion into other share class(es) | (51,894 | ) | (763,220 | ) | ||||
|
|
|
| |||||
Net increase (decrease) in shares outstanding | 941,984 | $ | 20,070,512 | |||||
|
|
|
| |||||
7. Borrowings
The Fund, on behalf of the Series, along with other affiliated registered investment companies (the “Funds”), is a party to a Syndicated Credit Agreement (“SCA”) with a group of banks. The purpose of the SCA is to provide an alternative source of temporary funding for capital share redemptions. The SCA provides for a commitment of $900 million for the period October 5, 2017 through October 4, 2018. The Funds pay an annualized commitment fee of .15% of the unused portion of the SCA. The Series’ portion of the commitment fee for the unused amount, allocated based upon a method approved by the Board, is accrued daily and paid quarterly. Prior to October 5, 2017, the Funds had another SCA that provided a commitment of $900 million and the Funds paid an annualized commitment fee of .15% of the unused portion of the SCA. The interest on borrowings under the SCAs is paid monthly and at a per annum interest rate based upon a contractual spread plus the higher of (1) the effective federal funds rate, (2) the 1-month LIBOR rate or (3) zero percent.
Other affiliated registered investment companies that are parties to the SCA include portfolios that are subject to a predetermined mathematical formula used to manage certain benefit guarantees offered under variable annuity contracts. The formula may result
| Prudential Jennison Global Opportunities Fund | 37 |
Notes to Financial Statements (continued)
in large scale asset flows into and out of these portfolios. Consequently, these portfolios may be more likely to utilize the SCA for purposes of funding redemptions. It may be possible for those portfolios to fully exhaust the committed amount of the SCA, thereby requiring the Manager to allocate available funding per a Board-approved methodology designed to treat the Funds in the SCA equitably.
The Series utilized the SCA during the reporting period ended October 31, 2017. The average daily balance for the 19 days that the Series had loans outstanding during the period was $1,124,053, borrowed at a weighted average interest rate of 1.99%. The maximum loan balance outstanding during the period was $3,835,000. At October 31, 2017, the Series did not have an outstanding loan balance.
8. Other
At the Fund’s Board meeting in March 2017, the Board approved a change in the methodology of allocating certain expenses, such as Transfer Agent fees (including sub-transfer agent and networking fees) and Blue Sky fees. PGIM Investments implemented the changes effective November 1, 2017.
| 38 |
Financial Highlights
| Class A Shares | ||||||||||||||||||||
Year Ended October 31, | ||||||||||||||||||||
| 2017 | 2016 | 2015 | 2014 | 2013 | ||||||||||||||||
| Per Share Operating Performance(a): | ||||||||||||||||||||
| Net Asset Value, Beginning of Year | $15.14 | $15.63 | $14.08 | $12.94 | $9.86 | |||||||||||||||
| Income (loss) from investment operations: | ||||||||||||||||||||
| Net investment income (loss) | (.09 | ) | (.05 | ) | (.09 | ) | (.11 | ) | (.06 | ) | ||||||||||
| Net realized and unrealized gain (loss) on investment and foreign currency transactions | 5.67 | (.44 | ) | 1.64 | 1.25 | 3.14 | ||||||||||||||
| Total from investment operations | 5.58 | (.49 | ) | 1.55 | 1.14 | 3.08 | ||||||||||||||
| Net asset value, end of year | $20.72 | $15.14 | $15.63 | $14.08 | $12.94 | |||||||||||||||
| Total Return(b): | 36.86% | (3.13)% | 11.01% | 8.81% | 31.24% | |||||||||||||||
| Ratios/Supplemental Data: | ||||||||||||||||||||
| Net assets, end of year (000) | $90,247 | $89,579 | $74,049 | $21,150 | $10,035 | |||||||||||||||
| Average net assets (000) | $70,810 | $100,220 | $36,635 | $19,352 | $4,982 | |||||||||||||||
| Ratios to average net assets(c): | ||||||||||||||||||||
| Expenses after waivers and/or expense reimbursement | 1.19% | 1.20% | 1.38% | 1.60% | 1.60% | |||||||||||||||
| Expenses before waivers and/or expense reimbursement | 1.33% | 1.36% | 1.56% | 1.71% | 2.19% | |||||||||||||||
| Net investment income (loss) | (.55)% | (.31)% | (.63)% | (.78)% | (.54)% | |||||||||||||||
| Portfolio turnover rate | 79% | 88% | 58% | 68% | 70% | |||||||||||||||
| (a) | Calculated based on average shares outstanding during the year. |
| (b) | Total return does not consider the effects of sales loads. Total return is calculated assuming a purchase of a share on the first day and a sale on the last day of each year reported and includes reinvestment of dividends and distributions, if any. Total returns may reflect adjustments to conform to generally accepted accounting principles. |
| (c) | Does not include expenses of the underlying funds in which the Series invests. |
See Notes to Financial Statements.
| Prudential Jennison Global Opportunities Fund | 39 |
Financial Highlights (continued)
| Class C Shares | ||||||||||||||||||||
Year Ended October 31, | ||||||||||||||||||||
| 2017 | 2016 | 2015 | 2014 | 2013 | ||||||||||||||||
| Per Share Operating Performance(a): | ||||||||||||||||||||
| Net Asset Value, Beginning of Year | $14.61 | $15.20 | $13.79 | $12.77 | $9.81 | |||||||||||||||
| Income (loss) from investment operations: | ||||||||||||||||||||
| Net investment income (loss) | (.22) | (.15) | (.20 | ) | (.21 | ) | (.14 | ) | ||||||||||||
| Net realized and unrealized gain (loss) on investment and foreign currency transactions | 5.46 | (.44) | 1.61 | 1.23 | 3.10 | |||||||||||||||
| Total from investment operations | 5.24 | (.59) | 1.41 | 1.02 | 2.96 | |||||||||||||||
| Net asset value, end of year | $19.85 | $14.61 | $15.20 | $13.79 | $12.77 | |||||||||||||||
| Total Return(b): | 35.87% | (3.88)% | 10.22% | 7.99% | 30.17% | |||||||||||||||
| Ratios/Supplemental Data: | ||||||||||||||||||||
| Net assets, end of year (000) | $79,531 | $52,246 | $28,982 | $5,723 | $1,659 | |||||||||||||||
| Average net assets (000) | $55,922 | $50,113 | $11,330 | $4,361 | $950 | |||||||||||||||
| Ratios to average net assets(c): | ||||||||||||||||||||
| Expenses after waivers and/or expense reimbursement | 1.94% | 1.95% | 2.12% | 2.35% | 2.35% | |||||||||||||||
| Expenses before waivers and/or expense reimbursement | 2.03% | 2.06% | 2.27% | 2.41% | 2.89% | |||||||||||||||
| Net investment income (loss) | (1.28)% | (1.07)% | (1.37)% | (1.54)% | (1.26)% | |||||||||||||||
| Portfolio turnover rate | 79% | 88% | 58% | 68% | 70% | |||||||||||||||
| (a) | Calculated based on average shares outstanding during the year. |
| (b) | Total return does not consider the effects of sales loads. Total return is calculated assuming a purchase of a share on the first day and a sale on the last day of each year reported and includes reinvestment of dividends and distributions, if any. Total returns may reflect adjustments to conform to generally accepted accounting principles. |
| (c) | Does not include expenses of the underlying funds in which the Series invests. |
See Notes to Financial Statements.
| 40 |
| Class Q Shares | ||||||||||||||||
| Year Ended October 31, | December 22, 2014(a) through October 31, | |||||||||||||||
| 2017 | 2016 | 2015 | ||||||||||||||
| Per Share Operating Performance(b): | ||||||||||||||||
| Net Asset Value, Beginning of Period | $15.33 | $15.78 | $14.15 | |||||||||||||
| Income (loss) from investment operations: | ||||||||||||||||
| Net investment income (loss) | (.04 | ) | .01 | (.03 | ) | |||||||||||
| Net realized and unrealized gain (loss) on investment and foreign currency transactions | 5.77 | (.46 | ) | 1.66 | ||||||||||||
| Total from investment operations | 5.73 | (.45 | ) | 1.63 | ||||||||||||
| Net asset value, end of period | $21.06 | $15.33 | $15.78 | |||||||||||||
| Total Return(c): | 37.38% | (2.85)% | 11.52% | |||||||||||||
| Ratios/Supplemental Data: | ||||||||||||||||
| Net assets, end of period (000) | $29,023 | $8,647 | $11 | |||||||||||||
| Average net assets (000) | $14,700 | $7,736 | $11 | |||||||||||||
| Ratios to average net assets(d): | ||||||||||||||||
| Expenses after waivers and/or expense reimbursement | .84% | .84% | 1.09% | (e) | ||||||||||||
| Expenses before waivers and/or expense reimbursement | .92% | .95% | 1.18% | (e) | ||||||||||||
| Net investment income (loss) | (.23)% | .05% | (.27)% | (e) | ||||||||||||
| Portfolio turnover rate | 79% | 88% | 58% | |||||||||||||
| (a) | Commencement of offering. |
| (b) | Calculated based on average shares outstanding during the period. |
| (c) | Total return is calculated assuming a purchase of a share on the first day and a sale on the last day of each period reported and includes reinvestment of dividends and distributions, if any. Total returns may reflect adjustments to conform to generally accepted accounting principles. Total returns for periods of less than one full year are not annualized. |
| (d) | Does not include expenses of the underlying funds in which the Series invests. |
| (e) | Annualized. |
See Notes to Financial Statements.
| Prudential Jennison Global Opportunities Fund | 41 |
Financial Highlights (continued)
| Class Z Shares | ||||||||||||||||||||
Year Ended October 31, | ||||||||||||||||||||
| 2017 | 2016 | 2015 | 2014 | 2013 | ||||||||||||||||
| Per Share Operating Performance(a): | ||||||||||||||||||||
| Net Asset Value, Beginning of Year | $15.31 | $15.77 | $14.17 | $12.99 | $9.87 | |||||||||||||||
| Income (loss) from investment operations: | ||||||||||||||||||||
| Net investment income (loss) | (.05 | ) | (.01 | ) | (.06 | ) | (.08 | ) | (.03 | ) | ||||||||||
| Net realized and unrealized gain (loss) on investment and foreign currency transactions | 5.74 | (.45 | ) | 1.66 | 1.26 | 3.15 | ||||||||||||||
| Total from investment operations | 5.69 | (.46 | ) | 1.60 | 1.18 | 3.12 | ||||||||||||||
| Net asset value, end of year | $21.00 | $15.31 | $15.77 | $14.17 | $12.99 | |||||||||||||||
| Total Return(b): | 37.17% | (2.92)% | 11.29% | 9.08% | 31.61% | |||||||||||||||
| Ratios/Supplemental Data: | ||||||||||||||||||||
| Net assets, end of year (000) | $334,783 | $114,228 | $102,800 | $33,504 | $25,219 | |||||||||||||||
| Average net assets (000) | $193,977 | $131,042 | $48,494 | $30,965 | $18,340 | |||||||||||||||
| Ratios to average net assets(c): | ||||||||||||||||||||
| Expenses after waivers and/or expense reimbursement | .94% | .95% | 1.15% | 1.35% | 1.35% | |||||||||||||||
| Expenses before waivers and/or expense reimbursement | 1.02% | 1.06% | 1.28% | 1.42% | 1.89% | |||||||||||||||
| Net investment income (loss) | (.28)% | (.07)% | (.41)% | (.56)% | (.25)% | |||||||||||||||
| Portfolio turnover rate | 79% | 88% | 58% | 68% | 70% | |||||||||||||||
| (a) | Calculated based on average shares outstanding during the year. |
| (b) | Total return is calculated assuming a purchase of a share on the first day and a sale on the last day of each year reported and includes reinvestment of dividends and distributions, if any. Total returns may reflect adjustments to conform to generally accepted accounting principles. |
| (c) | Does not include expenses of the underlying funds in which the Series invests. |
See Notes to Financial Statements.
| 42 |
Report of Independent Registered Public Accounting Firm
The Board of Directors and Shareholders
Prudential World Fund, Inc.:
We have audited the accompanying statement of assets and liabilities of Prudential Jennison Global Opportunities Fund (the “Fund”), a series of Prudential World Fund, Inc., including the portfolio of investments, as of October 31, 2017, and the related statement of operations for the year then ended, the statements of changes in net assets for each of the years in the two-year period then ended, and the financial highlights for each of the years or periods in the five-year period then ended. These financial statements and financial highlights are the responsibility of the Fund’s management. Our responsibility is to express an opinion on these financial statements and financial highlights based on our audits.
We conducted our audits in accordance with the standards of the Public Company Accounting Oversight Board (United States). Those standards require that we plan and perform the audit to obtain reasonable assurance about whether the financial statements and financial highlights are free of material misstatement. An audit includes examining, on a test basis, evidence supporting the amounts and disclosures in the financial statements. Our procedures included confirmation of securities owned as of October 31, 2017, by correspondence with the custodian, transfer agent and brokers or by other appropriate auditing procedures when replies from brokers were not received. An audit also includes assessing the accounting principles used and significant estimates made by management, as well as evaluating the overall financial statement presentation. We believe that our audits provide a reasonable basis for our opinion.
In our opinion, the financial statements and financial highlights referred to above present fairly, in all material respects, the financial position of the Fund as of October 31, 2017, and the results of its operations for the year then ended, the changes in its net assets for each of the year in the two-year period then ended, and the financial highlights for each of the years or periods in the five-year period then ended, in conformity with U.S. generally accepted accounting principles.

New York, New York
December 15, 2017
| Prudential Jennison Global Opportunities Fund | 43 |
INFORMATION ABOUT BOARD MEMBERS AND OFFICERS
(Unaudited)
Information about Board Members and Officers of the Fund is set forth below. Board Members who are not deemed to be “interested persons” of the Fund, as defined in the 1940 Act, are referred to as “Independent Board Members.” Board Members who are deemed to be “interested persons” of the Fund are referred to as “Interested Board Members.” The Board Members are responsible for the overall supervision of the operations of the Fund and perform the various duties imposed on the directors of investment companies by the 1940 Act. The Board in turn elects the Officers, who are responsible for administering the day-to-day operations of the Fund.
| Independent Board Members(1) | ||||
Name, Address, Age Position(s) Portfolios Overseen | Principal Occupation(s) During Past Five Years | Other Directorships Held During Past Five Years | ||
Ellen S. Alberding (59) Board Member Portfolios Overseen: 89 | President and Board Member, The Joyce Foundation (charitable foundation) (since 2002); Vice Chair, City Colleges of Chicago (community college system) (since 2011); Trustee, Skills for America’s Future (national initiative to connect employers to community colleges) (since 2011); Trustee, National Park Foundation (charitable foundation for national park system) (since 2009); Trustee, Economic Club of Chicago (since 2009). | None. | ||
Kevin J. Bannon (65) Board Member Portfolios Overseen: 89 | Retired; Managing Director (April 2008-May 2015) and Chief Investment Officer (October 2008-November 2013) of Highmount Capital LLC (registered investment adviser); formerly Executive Vice President and Chief Investment Officer (April 1993-August 2007) of Bank of New York Company; President (May 2003-May 2007) of BNY Hamilton Family of Mutual Funds. | Director of Urstadt Biddle Properties (equity real estate investment trust) (since September 2008). | ||
Linda W. Bynoe (65) Board Member Portfolios Overseen: 89 | President and Chief Executive Officer (since March 1995) and formerly Chief Operating Officer (December 1989-February 1995) of Telemat Ltd. (management consulting); formerly Vice President (January 1985-June 1989) at Morgan Stanley & Co. (broker-dealer). | Director of Simon Property Group, Inc. (retail real estate) (May 2003-May 2012); Director of Anixter International, Inc. (communication products distributor) (since January 2006); Director of Northern Trust Corporation (financial services) (since April 2006); Trustee of Equity Residential (residential real estate) (since December 2009). | ||
Prudential Jennison Global Opportunities Fund
| Independent Board Members(1) | ||||
Name, Address, Age Position(s) Portfolios Overseen | Principal Occupation(s) During Past Five Years | Other Directorships Held During Past Five Years | ||
Barry H. Evans (57)± Board Member Portfolios Overseen: 89 | Retired; Formerly President (2005-2016), Global Chief Operating Officer (2014-2016), Chief Investment Officer-Global Head of Fixed Income (1998-2014), and various portfolio manager roles (1986-2006), Manulife Asset Management U.S. | Director, Manulife Trust Company (2011-present); Director, Manulife Asset Management Limited (2015-present); Formerly Chairman of the Board of Directors of Manulife Asset Management U.S. (2005-2016); Formerly Chairman of the Board, Declaration Investment Management and Research (2008-2016). | ||
Keith F. Hartstein (61) Board Member & Independent Chair Portfolios Overseen: 89 | Retired; Member (since November 2014) of the Governing Council of the Independent Directors Council (organization of independent mutual fund directors); formerly President and Chief Executive Officer (2005-2012), Senior Vice President (2004-2005), Senior Vice President of Sales and Marketing (1997-2004), and various executive management positions (1990-1997), John Hancock Funds, LLC (asset management); Chairman, Investment Company Institute’s Sales Force Marketing Committee (2003-2008). | None. | ||
Laurie Simon Hodrick (55)± Board Member Portfolios Overseen: 89 | A. Barton Hepburn Professor of Economics in the Faculty of Business, Columbia Business School (since 1996); Visiting Professor of Law and Rock Center for Corporate Governance Fellow, Stanford Law School (since 2015); Visiting Fellow, Hoover Institution, Stanford University (since 2015); Sole Member, ReidCourt LLC (since 2008) (a consulting firm); Formerly Managing Director, Global Head of Alternative Investment Strategies, Deutsche Bank (2006-2008); Formerly Director/Trustee, Merrill Lynch Investment Managers Funds (1999-2006). | Independent Director, Corporate Capital Trust (since April 2017) (a business development company). | ||
Michael S. Hyland, CFA (72) Board Member Portfolios Overseen: 89 | Retired (since February 2005); formerly Senior Managing Director (July 2001-February 2005) of Bear Stearns & Co, Inc.; Global Partner, INVESCO (1999-2001); Managing Director and President of Salomon Brothers Asset Management (1989-1999). | None. | ||
Visit our website at pgiminvestments.com
| Independent Board Members(1) | ||||
Name, Address, Age Position(s) Portfolios Overseen | Principal Occupation(s) During Past Five Years | Other Directorships Held During Past Five Years | ||
Richard A. Redeker (74) Board Member & Independent Vice Chair9 Portfolios Overseen: 87 | Retired Mutual Fund Senior Executive (47 years); Management Consultant; Director, Mutual Fund Directors Forum (since 2014); Independent Directors Council (organization of independent mutual fund directors)-Executive Committee, Chair of Policy Steering Committee, Governing Council. | None. | ||
Stephen G. Stoneburn (74) Board Member Portfolios Overseen: 89 | Chairman (since July 2011), President and Chief Executive Officer (since June 1996) of Frontline Medical Communications (publishing company); formerly President (June 1995-June 1996) of Argus Integrated Media, Inc.; Senior Vice President and Managing Director (January 1993-1995) of Cowles Business Media; Senior Vice President of Fairchild Publications, Inc. (1975-1989). | None. | ||
± Mr. Evans and Ms. Hodrick joined the Board effective as of September 1, 2017.
| Interested Board Members(1) | ||||
Name, Address, Age Position(s) Portfolios Overseen | Principal Occupation(s) During Past Five Years | Other Directorships Held During Past Five Years | ||
Stuart S. Parker (55) Board Member & President Portfolios Overseen: 89 | President of PGIM Investments LLC (formerly known as Prudential Investments LLC) (since January 2012); Executive Vice President of Prudential Investment Management Services LLC (since December 2012); Executive Vice President of Jennison Associates LLC and Head of Retail Distribution of PGIM Investments LLC (June 2005-December 2011). | None. | ||
Prudential Jennison Global Opportunities Fund
| Interested Board Members(1) | ||||
Name, Address, Age Position(s) Portfolios Overseen | Principal Occupation(s) During Past Five Years | Other Directorships Held During Past Five Years | ||
Scott E. Benjamin (44) Board Member & Vice President Portfolios Overseen: 89 | Executive Vice President (since June 2009) of PGIM Investments LLC; Executive Vice President (June 2009-June 2012) and Vice President (since June 2012) of Prudential Investment Management Services LLC; Executive Vice President (since September 2009) of AST Investment Services, Inc.; Senior Vice President of Product Development and Marketing, PGIM Investments (since February 2006); Vice President of Product Development and Product Management, Prudential Investments (2003-2006). | None. | ||
Grace C. Torres* (58) Board Member Portfolios Overseen: 88 | Retired; formerly Treasurer and Principal Financial and Accounting Officer of the Prudential Funds, Target Funds, Advanced Series Trust, Prudential Variable Contract Accounts and The Prudential Series Fund (1998-June 2014); Assistant Treasurer (March 1999-June 2014) and Senior Vice President (September 1999-June 2014) of PGIM Investments LLC; Assistant Treasurer (May 2003-June 2014) and Vice President (June 2005-June 2014) of AST Investment Services, Inc.; Senior Vice President and Assistant Treasurer (May 2003-June 2014) of Prudential Annuities Advisory Services, Inc. | Director (since July 2015) of Sun Bancorp, Inc. N.A. and Sun National Bank | ||
* Note: Prior to her retirement in 2014, Ms. Torres was employed by PGIM Investments LLC. Due to her prior employment, she is considered to be an “interested person” under the 1940 Act. Ms. Torres is a Non-Management Interested Board Member.
(1) The year that each Board Member joined the Board is as follows:
Ellen S. Alberding; 2013; Kevin J. Bannon, 2008; Linda W. Bynoe, 2005; Barry H. Evans, 2017; Keith F. Hartstein, 2013; Laurie Simon Hodrick, 2017; Michael S. Hyland, 2008; Richard A. Redeker, 2003; Stephen G. Stoneburn, 1996; Grace C. Torres, 2014; Stuart S. Parker, Board Member and President since 2012; Scott E. Benjamin, Board Member since 2010 and Vice President since 2009.
Visit our website at pgiminvestments.com
| Fund Officers(a) | ||||
Name, Address and Age Position with Fund | Principal Occupation(s) During Past Five Years | Length of Service as Fund Officer | ||
Raymond A. O’Hara (62) Chief Legal Officer | Vice President and Corporate Counsel (since July 2010) of Prudential Insurance Company of America (Prudential); Vice President (March 2011-Present) of Pruco Life Insurance Company and Pruco Life Insurance Company of New Jersey; Vice President and Corporate Counsel (March 2011-Present) of Prudential Annuities Life Assurance Corporation; Chief Legal Officer of PGIM Investments LLC (since June 2012); Chief Legal Officer of Prudential Mutual Fund Services LLC (since June 2012) and Corporate Counsel of AST Investment Services, Inc. (since June 2012); formerly Assistant Vice President and Corporate Counsel (September 2008-July 2010) of The Hartford Financial Services Group, Inc.; formerly Associate (September 1980-December 1987) and Partner (January 1988-August 2008) of Blazzard & Hasenauer, P.C. (formerly, Blazzard, Grodd & Hasenauer, P.C.). | Since 2012 | ||
Chad A. Earnst (42) Chief Compliance Officer | Chief Compliance Officer (September 2014-Present) of PGIM Investments LLC; Chief Compliance Officer (September 2014-Present) of the Prudential Funds, Target Funds, Advanced Series Trust, The Prudential Series Fund, Prudential’s Gibraltar Fund, Inc., Prudential Global Short Duration High Yield Income Fund, Inc., Prudential Short Duration High Yield Fund, Inc. and Prudential Jennison MLP Income Fund, Inc.; formerly Assistant Director (March 2010-August 2014) of the Asset Management Unit, Division of Enforcement, US Securities & Exchange Commission; Assistant Regional Director (January 2010-August 2014), Branch Chief (June 2006-December 2009) and Senior Counsel (April 2003-May 2006) of the Miami Regional Office, Division of Enforcement, US Securities & Exchange Commission. | Since 2014 | ||
Deborah A. Docs (59) Secretary | Vice President and Corporate Counsel (since January 2001) of Prudential; Vice President (since December 1996) and Assistant Secretary (since March 1999) of PGIM Investments LLC; formerly Vice President and Assistant Secretary (May 2003-June 2005) of AST Investment Services, Inc. | Since 2004 | ||
Jonathan D. Shain (59) Assistant Secretary | Vice President and Corporate Counsel (since August 1998) of Prudential; Vice President and Assistant Secretary (since May 2001) of PGIM Investments LLC; Vice President and Assistant Secretary (since February 2001) of Prudential Mutual Fund Services LLC; formerly Vice President and Assistant Secretary (May 2003-June 2005) of AST Investment Services, Inc. | Since 2005 | ||
Claudia DiGiacomo (43) Assistant Secretary | Vice President and Corporate Counsel (since January 2005) of Prudential; Vice President and Assistant Secretary of PGIM Investments LLC (since December 2005); Associate at Sidley Austin Brown & Wood LLP (1999-2004). | Since 2005 | ||
Prudential Jennison Global Opportunities Fund
| Fund Officers(a) | ||||
Name, Address and Age Position with Fund | Principal Occupation(s) During Past Five Years | Length of Service as Fund Officer | ||
Andrew R. French (54) Assistant Secretary | Vice President and Corporate Counsel (since February 2010) of Prudential; formerly Director and Corporate Counsel (2006-2010) of Prudential; Vice President and Assistant Secretary (since January 2007) of PGIM Investments LLC; Vice President and Assistant Secretary (since January 2007) of Prudential Mutual Fund Services LLC. | Since 2006 | ||
Charles H. Smith (44) Anti-Money Laundering Compliance Officer | Vice President, Corporate Compliance, Anti-Money Laundering Unit (since January 2015) of Prudential; committee member of the American Council of Life Insurers Anti-Money Laundering and Critical Infrastructure Committee (since January 2016); formerly Global Head of Economic Sanctions Compliance at AIG Property Casualty (February 2007-December 2014); Assistant Attorney General at the New York State Attorney General’s Office, Division of Public Advocacy. (August 1998-January 2007). | Since 2016 | ||
M. Sadiq Peshimam (53) Treasurer and Principal Financial and Accounting Officer | Vice President (since 2005) of PGIM Investments LLC; formerly Assistant Treasurer of funds in the Prudential Mutual Fund Complex (2006-2014). | Since 2006 | ||
Peter Parrella (59) Assistant Treasurer | Vice President (since 2007) and Director (2004-2007) within Prudential Mutual Fund Administration; formerly Tax Manager at SSB Citi Fund Management LLC (1997-2004). | Since 2007 | ||
Lana Lomuti (50) Assistant Treasurer | Vice President (since 2007) and Director (2005-2007), within Prudential Mutual Fund Administration; formerly Assistant Treasurer (December 2007-February 2014) of The Greater China Fund, Inc. | Since 2014 | ||
Linda McMullin (56) Assistant Treasurer | Vice President (since 2011) and Director (2008-2011) within Prudential Mutual Fund Administration. | Since 2014 | ||
Kelly A. Coyne (49) Assistant Treasurer | Director, Investment Operations of Prudential Mutual Fund Services LLC (since 2010). | Since 2015 | ||
(a) Excludes Mr. Parker and Mr. Benjamin, interested Board Members who also serve as President and Vice President, respectively.
Explanatory Notes to Tables:
| ∎ | Board Members are deemed to be “Interested,” as defined in the 1940 Act, by reason of their affiliation with PGIM Investments LLC and/or an affiliate of PGIM Investments LLC. |
| ∎ | Unless otherwise noted, the address of all Board Members and Officers is c/o PGIM Investments LLC, 655 Broad Street, Newark, New Jersey 07102-4410. |
| ∎ | There is no set term of office for Board Members or Officers. The Board Members have adopted a retirement policy, which calls for the retirement of Board Members on December 31 of the year in which they reach the age of 75. |
| ∎ | “Other Directorships Held” includes only directorships of companies required to register or file reports with the SEC under the 1934 Act (that is, “public companies”) or other investment companies registered under the 1940 Act. |
| ∎ | “Portfolios Overseen” includes all investment companies managed by PGIM Investments LLC. The investment companies for which PGIM Investments LLC serves as manager include the Prudential Mutual Funds, The Prudential Variable Contract Accounts, Target Mutual Funds, Prudential Short Duration High Yield Fund, Inc., Prudential Global Short Duration High Yield Fund, Inc., The Prudential Series Fund, Prudential’s Gibraltar Fund, Inc. and the Advanced Series Trust. |
Visit our website at pgiminvestments.com
Approval of Advisory Agreements
The Fund’s Board of Directors
The Board of Directors (the “Board”) of Prudential Jennison Global Opportunities Fund (the “Fund”)1 consists of twelve individuals, nine of whom are not “interested persons” of the Fund, as defined in the Investment Company Act of 1940, as amended (the “1940 Act”) (the “Independent Directors”). The Board is responsible for the oversight of the Fund and its operations, and performs the various duties imposed on the directors of investment companies by the 1940 Act. The Independent Directors have retained independent legal counsel to assist them in connection with their duties. The Chair of the Board is an Independent Director. The Board has established four standing committees: the Audit Committee, the Nominating and Governance Committee, and two Investment Committees. Each committee is chaired by, and composed of, Independent Directors.
Annual Approval of the Fund’s Advisory Agreements
As required under the 1940 Act, the Board determines annually whether to renew the Fund’s management agreement with PGIM Investments LLC (“PGIM Investments”) and the Fund’s subadvisory agreement with Jennison Associates LLC (“Jennison”). In considering the renewal of the agreements, the Board, including all of the Independent Directors,2 met on June 6-8, 2017 and approved the renewal of the agreements through July 31, 2018, after concluding that the renewal of the agreements was in the best interests of the Fund and its shareholders.
In advance of the meetings, the Board requested and received materials relating to the agreements, and had the opportunity to ask questions and request further information in connection with its consideration. Among other things, the Board considered comparative fee information from PGIM Investments and Jennison. Also, the Board considered comparisons with other mutual funds in relevant Peer Universes and Peer Groups, as is further discussed below.
In approving the agreements, the Board, including the Independent Directors advised by independent legal counsel, considered the factors it deemed relevant, including the nature, quality and extent of services provided by PGIM Investments and the subadviser, the performance of the Fund, the profitability of PGIM Investments and its affiliates, expenses and fees, and the potential for economies of scale that may be shared with the Fund and its shareholders as the Fund’s assets grow. In their deliberations, the Directors did not identify
any single factor which alone was responsible for the Board’s decision to approve the
| 1 | Prudential Jennison Global Opportunities Fund is a series of Prudential World Fund, Inc. |
| 2 | Barry H. Evans and Laurie Simon Hodrick joined the Board effective as of September 1, 2017. Neither Mr. Evans nor Ms. Hodrick participated in the consideration of the renewal of the advisory agreements. |
| Prudential Jennison Global Opportunities Fund | ||
Approval of Advisory Agreements (continued)
agreements with respect to the Fund. In connection with its deliberations, the Board considered information provided by PGIM Investments throughout the year at regular Board meetings, presentations from portfolio managers and other information, as well as information furnished at or in advance of the meetings on June 6-8, 2017.
The Directors determined that the overall arrangements between the Fund and PGIM Investments, which serves as the Fund’s investment manager pursuant to a management agreement, and between PGIM Investments and Jennison, which serves as the Fund’s subadviser pursuant to the terms of a subadvisory agreement with PGIM Investments, are in the best interests of the Fund and its shareholders in light of the services performed, fees charged and such other matters as the Directors considered relevant in the exercise of their business judgment.
The material factors and conclusions that formed the basis for the Directors’ reaching their determinations to approve the continuance of the agreements are separately discussed below.
Nature, Quality and Extent of Services
The Board received and considered information regarding the nature, quality and extent of services provided to the Fund by PGIM Investments and Jennison. The Board considered the services provided by PGIM Investments, including but not limited to the oversight of the subadviser for the Fund, as well as the provision of fund recordkeeping, compliance, and other services to the Fund. With respect to PGIM Investments’ oversight of the subadviser, the Board noted that PGIM Investments’ Strategic Investment Research Group (“SIRG”), which is a business unit of PGIM Investments, is responsible for monitoring and reporting to PGIM Investments’ senior management on the performance and operations of the subadviser. The Board also considered that PGIM Investments pays the salaries of all of the officers and interested Directors of the Fund who are part of Fund management. The Board also considered the investment subadvisory services provided by Jennison, as well as adherence to the Fund’s investment restrictions and compliance with applicable Fund policies and procedures. The Board considered PGIM Investments’ evaluation of the subadviser, as well as PGIM Investments’ recommendation, based on its review of the subadviser, to renew the subadvisory agreement.
The Board considered the qualifications, backgrounds and responsibilities of PGIM Investments’ senior management responsible for the oversight of the Fund and Jennison, and also considered the qualifications, backgrounds and responsibilities of Jennison’s portfolio managers who are responsible for the day-to-day management of the Fund’s portfolio. The Board was provided with information pertaining to PGIM Investments’ and Jennison’s organizational structure, senior management, investment operations, and other relevant information pertaining to both PGIM Investments and Jennison. The Board also
| Visit our website at pgiminvestments.com |
noted that it received favorable compliance reports from the Fund’s Chief Compliance Officer (“CCO”) as to both PGIM Investments and Jennison. The Board noted that Jennison is affiliated with PGIM Investments.
The Board concluded that it was satisfied with the nature, extent and quality of the investment management services provided by PGIM Investments and the subadvisory services provided to the Fund by Jennison, and that there was a reasonable basis on which to conclude that the Fund benefits from the services provided by PGIM Investments and Jennison under the management and subadvisory agreements.
Costs of Services and Profits Realized by PGIM Investments
The Board was provided with information on the profitability of PGIM Investments and its affiliates in serving as the Fund’s investment manager. The Board discussed with PGIM Investments the methodology utilized in assembling the information regarding profitability and considered its reasonableness. The Board recognized that it is difficult to make comparisons of profitability from fund management contracts because comparative information is not generally publicly available and is affected by numerous factors, including the structure of the particular adviser, the types of funds it manages, its business mix, numerous assumptions regarding allocations and the adviser’s capital structure and cost of capital. However, the Board considered that the cost of services provided by PGIM Investments to the Fund during the year ended December 31, 2016 exceeded the management fees paid by the Fund, resulting in an operating loss to PGIM Investments. The Board further noted that the subadviser is affiliated with PGIM Investments and that its profitability is reflected in PGIM Investments’ profitability report. Taking these factors into account, the Board concluded that the profitability of PGIM Investments and its affiliates in relation to the services rendered was not unreasonable.
Economies of Scale
The Board received and discussed information concerning economies of scale that PGIM Investments may realize as the Fund’s assets grow beyond current levels. The Board noted that the management fee schedule for the Fund includes breakpoints, which have the effect of decreasing the fee rate as assets increase, but that at its current level of assets the Fund does not realize the effect of those rate reductions. The Board took note that the Fund’s fee structure currently results in benefits to Fund shareholders whether or not PGIM Investments realizes any economies of scale. The Board noted that economies of scale, if any, may be shared with the Fund in several ways, including low management fees from inception, additional technological and personnel investments to enhance shareholder services, and maintaining existing expense structures in the face of a rising cost environment. The Board considered PGIM Investments’ assertion that it continually
| Prudential Jennison Global Opportunities Fund | ||
Approval of Advisory Agreements (continued)
evaluates the management fee schedule of the Fund and the potential to share economies of scale through breakpoints or fee waivers as asset levels increase.
The Board recognized the inherent limitations of any analysis of economies of scale, stemming largely from the Board’s understanding that most of PGIM Investments’ costs are not specific to individual funds, but rather are incurred across a variety of products and services.
Other Benefits to PGIM Investments and Jennison
The Board considered potential ancillary benefits that might be received by PGIM Investments and Jennison and their affiliates as a result of their relationship with the Fund. The Board concluded that potential benefits to be derived by PGIM Investments included transfer agency fees received by the Fund’s transfer agent (which is affiliated with PGIM Investments), as well as benefits to its reputation or other intangible benefits resulting from PGIM Investments’ association with the Fund. The Board concluded that the potential benefits to be derived by Jennison included the ability to use soft dollar credits, as well as the potential benefits consistent with those generally resulting from an increase in assets under management, specifically, potential access to additional research resources and benefits to its reputation. The Board concluded that the benefits derived by PGIM Investments and Jennison were consistent with the types of benefits generally derived by investment managers and subadvisers to mutual funds.
Performance of the Fund / Fees and Expenses
The Board considered certain additional specific factors and made related conclusions relating to the historical performance of the Fund for the one- and three-year periods ended December 31, 2016.
The Board also considered the Fund’s actual management fee, as well as the Fund’s net total expense ratio, for the fiscal year ended October 31, 2016. The Board considered the management fee for the Fund as compared to the management fee charged by PGIM Investments to other funds and the fee charged by other advisers to comparable mutual funds in a Peer Group. The actual management fee represents the fee rate actually paid by Fund shareholders and includes any fee waivers or reimbursements. The net total expense ratio for the Fund represents the actual expense ratio incurred by Fund shareholders.
The mutual funds included in the Peer Universe (the Lipper Global Multi-Cap Growth Funds Performance Universe), which was used to consider performance, and the Peer Group, which was used to consider fees and expenses, were objectively determined by Broadridge, an independent provider of mutual fund data. The comparisons placed the
| Visit our website at pgiminvestments.com |
Fund in various quartiles, with the first quartile being the best 25% of the mutual funds (for performance, the best performing mutual funds and, for expenses, the lowest cost mutual funds).
The section below summarizes key factors considered by the Board and the Board’s conclusions regarding the Fund’s performance, fees and overall expenses. The table sets forth gross performance comparisons (which do not reflect the impact on performance of fund expenses, or any subsidies, expense caps or waivers that may be applicable) with the Peer Universe, actual management fees with the Peer Group (which reflect the impact of any subsidies or fee waivers), and net total expenses with the Peer Group, each of which were key factors considered by the Board.
| Performance | 1 Year | 3 Years | 5 Years | 10 Years | ||||
4th Quartile | 2nd Quartile | N/A | N/A | |||||
| Actual Management Fees: 2nd Quartile | ||||||||
| Net Total Expenses: 1st Quartile | ||||||||
| • | The Board noted that Fund outperformed its benchmark index over the three-year period. |
| • | The Board also noted PGIM Investments’ assertion that the Fund’s underperformance was partly attributable to the Fund’s growth investment style, since value investing was favored by the market during the period. |
| • | The Board considered that the Fund’s recent performance had improved, with the Fund ranked in the first quartile of its Peer Universe for the first quarter of 2017. |
| • | The Board and PGIM Investments agreed to continue the Fund’s existing expense cap, which caps the Fund’s annual operating expenses at 0.84% (exclusive of 12b-1, transfer agent, and certain other fees), through February 28, 2018. |
| • | The Board concluded that, in light of the above, it would be in the best interests of the Fund and its shareholders to continue to monitor performance and to renew the agreements. |
| • | The Board concluded that the management fees (including subadvisory fees) and total expenses were reasonable in light of the services provided. |
* * *
After full consideration of these factors, the Board concluded that the approval of the agreements was in the best interests of the Fund and its shareholders.
| Prudential Jennison Global Opportunities Fund | ||
| ∎ TELEPHONE | ∎ WEBSITE | |||
655 Broad Street Newark, NJ 07102 | (800) 225-1852 | www.pgiminvestments.com |
| PROXY VOTING |
| The Board of Directors of the Fund has delegated to the Fund’s investment subadviser the responsibility for voting any proxies and maintaining proxy recordkeeping with respect to the Fund. A description of these proxy voting policies and procedures is available without charge, upon request, by calling (800) 225-1852. Information regarding how the Fund voted proxies relating to portfolio securities during the most recent 12-month period ended June 30 is available on the Fund’s website and on the Securities and Exchange Commission’s website. |
| DIRECTORS |
| Ellen S. Alberding • Kevin J. Bannon • Scott E. Benjamin • Linda W. Bynoe • Barry H. Evans • Keith F. Hartstein • Laurie Simon Hodrick • Michael S. Hyland • Stuart S. Parker • Richard A. Redeker • Stephen G. Stoneburn • Grace C. Torres |
| OFFICERS |
| Stuart S. Parker, President • Scott E. Benjamin, Vice President • M. Sadiq Peshimam, Treasurer and Principal Financial and Accounting Officer • Raymond A. O’Hara, Chief Legal Officer • Deborah A. Docs, Secretary • Chad A. Earnst, Chief Compliance Officer • Charles H. Smith, Anti-Money Laundering Compliance Officer • Jonathan D. Shain, Assistant Secretary • Claudia DiGiacomo, Assistant Secretary • Andrew R. French, Assistant Secretary • Peter Parrella, Assistant Treasurer • Lana Lomuti, Assistant Treasurer • Linda McMullin, Assistant Treasurer • Kelly A. Coyne, Assistant Treasurer |
| MANAGER | PGIM Investments LLC | 655 Broad Street Newark, NJ 07102 | ||
| ||||
| INVESTMENT SUBADVISER | Jennison Associates LLC | 466 Lexington Avenue New York, NY 10017 | ||
| ||||
| DISTRIBUTOR | Prudential Investment Management Services LLC | 655 Broad Street Newark, NJ 07102 | ||
| ||||
| CUSTODIAN | The Bank of New York Mellon | 225 Liberty Street New York, NY 10286 | ||
| ||||
| TRANSFER AGENT | Prudential Mutual Fund Services LLC | PO Box 9658 Providence, RI 02940 | ||
| ||||
| INDEPENDENT REGISTERED PUBLIC ACCOUNTING FIRM | KPMG LLP | 345 Park Avenue New York, NY 10154 | ||
| ||||
| FUND COUNSEL | Willkie Farr & Gallagher LLP | 787 Seventh Avenue New York, NY 10019 | ||
| ||||
| An investor should consider the investment objectives, risks, charges, and expenses of the Fund carefully before investing. The prospectus and summary prospectus contain this and other information about the Fund. An investor may obtain a prospectus and summary prospectus by visiting our website at www.pgiminvestments.com or by calling (800) 225-1852. The prospectus and summary prospectus should be read carefully before investing. |
| E-DELIVERY |
| To receive your mutual fund documents online, go to www.pgiminvestments.com/edelivery and enroll. Instead of receiving printed documents by mail, you will receive notification via email when new materials are available. You can cancel your enrollment or change your email address at any time by visiting the website address above. |
| SHAREHOLDER COMMUNICATIONS WITH DIRECTORS |
| Shareholders can communicate directly with the Board of Directors by writing to the Chair of the Board, Prudential Jennison Global Opportunities Fund, PGIM Investments, Attn: Board of Directors, 655 Broad Street, Newark, NJ 07102. Shareholders can communicate directly with an individual Director by writing to the same address. Communications are not screened before being delivered to the addressee. |
| AVAILABILITY OF PORTFOLIO SCHEDULE |
| The Fund files its complete schedule of portfolio holdings with the Securities and Exchange Commission for the first and third quarters of each fiscal year on Form N-Q. The Fund’s Forms N-Q are available on the Commission’s website at www.sec.gov. The Fund’s Forms N-Q may also be reviewed and copied at the Commission’s Public Reference Room in Washington, D.C. Information on the operation and location of the Public Reference Room may be obtained by calling 1-800-SEC-0330. The Fund’s schedule of portfolio holdings is also available on the Fund’s website as of the end of each month no sooner than 15 days after the end of the month. |
| The Fund’s Statement of Additional Information contains additional information about the Fund’s Directors and is available without charge, upon request, by calling (800) 225-1852. |
Mutual Funds:
| ARE NOT INSURED BY THE FDIC OR ANY FEDERAL GOVERNMENT AGENCY | MAY LOSE VALUE | ARE NOT A DEPOSIT OF OR GUARANTEED BY ANY BANK OR ANY BANK AFFILIATE |
PRUDENTIAL JENNISON GLOBAL OPPORTUNITIES FUND
| SHARE CLASS | A | C | Q | Z | ||||
| NASDAQ | PRJAX | PRJCX | PRJQX | PRJZX | ||||
| CUSIP | 743969719 | 743969693 | 743969594 | 743969685 |
MF214E

PRUDENTIAL JENNISON INTERNATIONAL OPPORTUNITIES FUND
ANNUAL REPORT
OCTOBER 31, 2017

To enroll in e-delivery, go to pgiminvestments.com/edelivery
| Objective: To seek long-term growth of capital |
Highlights
| • | The Fund produced strong performance results in the fiscal year, as all sectors and regions advanced. |
| • | Information technology positions were strong contributors to return. Alibaba reported impressive financial results that beat consensus expectations on most key metrics. Tencent, China’s largest and most visited Internet service portal, continued to perform well. |
| • | Consumer discretionary holdings also performed well in aggregate and a number of top performers were found in the sector. These included luxury retailer Kering in France, and apparel and equipment retailer Adidas in Germany. |
| • | A large underweight to financials weighed on results and the Fund’s health care and energy positions were also a modest source of relative weakness; however, notable detractors were found in several different sectors. |
This report is not authorized for distribution to prospective investors unless preceded or accompanied by a current prospectus.
The views expressed in this report and information about the Fund’s portfolio holdings are for the period covered by this report and are subject to change thereafter.
Mutual funds are distributed by Prudential Investment Management Services LLC, member SIPC. Jennison Associates is a registered investment adviser. Both are Prudential Financial companies. © 2017 Prudential Financial, Inc. and its related entities. Jennison Associates, Jennison, PGIM, and the PGIM logo are service marks of Prudential Financial, Inc. and its related entities, registered in many jurisdictions worldwide.
| 2 | Visit our website at pgiminvestments.com |
PRUDENTIAL FUNDS — UPDATE
The Board of Directors/Trustees for the Fund has approved renaming the Fund’s Class Q shares as Class R6 shares, effective on or about June 15, 2018. The renaming of Class Q shares as Class R6 shares will not result in any changes to pricing, eligibility, or shareholder rights and obligations. The renamed Class R6 shares will not be exchangeable with Class R6 shares of the Prudential Day One Funds or the Prudential 60/40 Allocation Fund.
LR993
| Prudential Jennison International Opportunities Fund | 3 |
PRUDENTIAL FUNDS — UPDATE
Effective on or about June 1, 2018 (the “Effective Date”), the Fund’s Class A, Class C, Class R, and Class Z shares, as applicable, will be closed to investments by new group retirement plans, except as discussed below. Existing group retirement plans as of the Effective Date may keep their investments in their current share class and may continue to make additional purchases or exchanges of that class of shares. As of the Effective Date, all new group retirement plans wishing to add the Fund as a new addition to the plan generally will be into one of the available Class Q shares, Class R2 shares, or Class R4 shares of the Fund.
In addition, on or about the Effective Date, the Class R shares of the Fund will be closed to all new investors, except as discussed below. Due to the closing of the Class R shares to new investors, effective on or about the Effective Date new IRA investors may only purchase Class A, Class C, Class Z, or Class Q shares of the Fund, subject to share class eligibility. Following the Effective Date, no new accounts may be established in the Fund’s Class R shares and no Class R shares may be purchased or acquired by any new Class R shareholder, except as discussed below.
| Class A | Class C | Class Z | Class R | |||||
Existing Investors (Group Retirement Plans, IRAs, and all other investors) | No Change | No Change | No Change | No Change | ||||
| New Group Retirement Plans | Closed to group retirement plans wishing to add the share classes as new additions to plan menus on or about June 1, 2018, subject to certain exceptions below | |||||||
New IRAs | No Change | No Change | No Change | Closed to all new investors on or about June 1, 2018, subject to certain exceptions below | ||||
| All Other New Investors | No Change | No Change | No Change | |||||
| 4 | Visit our website at pgiminvestments.com |
However, the following new investors may continue to purchase Class A, Class C, Class R, and Class Z shares of the Fund, as applicable:
| • | Eligible group retirement plans who are exercising their one-time 90-day repurchase privilege in the Fund will be permitted to purchase such share classes. |
| • | Plan participants in a group retirement plan that offers Class A, Class C, Class R, or Class Z shares of the Fund as of the Effective Date will be permitted to purchase such share classes of the Fund, even if the plan participant did not own shares of that class of the Fund as of the Effective Date. |
| • | Certain new group retirement plans will be permitted to offer such share classes of the Fund after the Effective Date, provided that the plan has or is actively negotiating a contractual agreement with the Fund’s distributor or service provider to offer such share classes of the Fund prior to or on the Effective Date. |
| • | New group retirement plans that combine with, replace, or are otherwise affiliated with a current plan that invests in such share classes prior to or on the Effective Date will be permitted to purchase such share classes. |
The Fund also reserves the right to refuse any purchase order that might disrupt management of the Fund or to otherwise modify the closure policy at any time on a case-by-case basis.
| Prudential Jennison International Opportunities Fund | 5 |
This Page Intentionally Left Blank
| 6 | Visit our website at pgiminvestments.com |
Letter from the President

Dear Shareholder:
We hope you find the annual report for the Prudential Jennison International Opportunities Fund informative and useful. The report covers performance for the 12-month period ended October 31, 2017.
Significant events during the reporting period included a new US president, followed by uncertainty in Congress over implementing the Trump administration’s policy initiatives. Elsewhere, Britain began its formal legal process to leave the European Union. France elected a more centrist president, which was viewed as a pro-euro referendum. North Korea’s missile launches escalated geopolitical tensions. Also, late in the period, a series of hurricanes caused damage in the US and the Caribbean.
Despite some turbulence in the macro-environment, solid economic fundamentals in the US economy included moderate gross domestic product expansion, robust employment, and accelerating corporate profit growth. Inflation remained tame. The Federal Reserve raised its federal funds rate twice in 2017, and is in the process of winding down its stimulus program.
Global economic growth remained mostly positive. Equities in the US reached new highs amid low volatility, while international equities posted strong gains. European stocks continued to gain. Asian markets were solid, and emerging markets outperformed most regions. Fixed income markets were mixed. High yield and emerging markets bonds were the top performers.
Given the uncertainty in today’s investment environment, we believe that active professional portfolio management offers a potential advantage. Active managers often have the knowledge and flexibility to find the best investment opportunities in the most challenging markets.
Even so, it’s best if investment decisions are based on your long-term goals rather than on short-term market and economic developments. We also encourage you to work with an experienced financial advisor who can help you set goals, determine your tolerance for risk, and build a diversified plan that’s right for you and make adjustments when necessary.
At PGIM Investments, we consider it a great privilege and responsibility to help investors participate in opportunities across global markets while meeting their toughest investment challenges. We’re part of PGIM, a top-10 global investment manager with more than $1 trillion in assets under management. This investment expertise allows us to deliver actively managed funds and strategies to meet the needs of investors around the globe.
Thank you for choosing our family of funds.
Sincerely,

Stuart S. Parker, President
Prudential Jennison International Opportunities Fund
December 15, 2017
| Prudential Jennison International Opportunities Fund | 7 |
Your Fund’s Performance (unaudited)
Performance data quoted represents past performance. Past performance does not guarantee future results. The investment return and principal value of an investment will fluctuate, so that an investor’s shares, when redeemed, may be worth more or less than their original cost. Current performance may be lower or higher than the past performance data quoted. An investor may obtain performance data as of the most recent month-end by visiting our website at www.pgiminvestments.com or by calling (800) 225-1852.
| Average Annual Total Returns as of 10/31/17 (with sales charges) | ||||||||||
| One Year (%) | Five Years (%) | Since Inception (%) | ||||||||
| Class A | 30.74 | 8.26 | 10.09 (6/5/12) | |||||||
| Class C | 36.37 | 8.68 | 10.44 (6/5/12) | |||||||
| Class Q | 38.75 | N/A | 15.58 (12/23/15) | |||||||
| Class Z | 38.65 | 9.77 | 11.53 (6/5/12) | |||||||
| MSCI ACWI ex-US Index | 23.64 | 7.29 | — | |||||||
| Lipper International Multi-Cap Growth Funds Average | 24.19 | 8.43 | — | |||||||
| Average Annual Total Returns as of 10/31/17 (without sales charges) | ||||||||||
| One Year (%) | Five Years (%) | Since Inception (%) | ||||||||
| Class A | 38.35 | 9.49 | 11.25 (6/5/12) | |||||||
| Class C | 37.37 | 8.68 | 10.44 (6/5/12) | |||||||
| Class Q | 38.75 | N/A | 15.58 (12/23/15) | |||||||
| Class Z | 38.65 | 9.77 | 11.53 (6/5/12) | |||||||
| MSCI ACWI ex-US Index | 23.64 | 7.29 | — | |||||||
| Lipper International Multi-Cap Growth Funds Average | 24.19 | 8.43 | — | |||||||
| 8 | Visit our website at pgiminvestments.com |
Growth of a $10,000 Investment
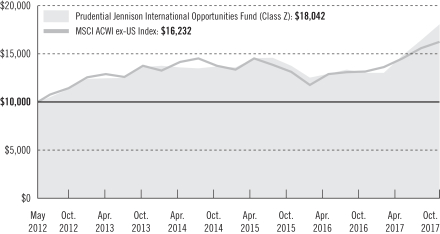
The graph compares a $10,000 investment in the Prudential Jennison International Opportunities Fund (Class Z shares) with a similar investment in the MSCI ACWI ex-US Index by portraying the initial account values at the commencement of operations for Class Z shares (June 5, 2012) and the account values at the end of the current fiscal year (October 31, 2017), as measured on a quarterly basis. For purposes of the graph, and unless otherwise indicated, it has been assumed that (a) all recurring fees (including management fees) were deducted; and (b) all dividends and distributions were reinvested. The line graph provides information for Class Z shares only. As indicated in the tables provided earlier, performance for Class A, Class C, and Class Q shares will vary due to the differing charges and expenses applicable to each share class (as indicated in the following paragraphs). Without waiver of fees and/or expense reimbursements, if any, the Fund’s returns would have been lower.
Past performance does not predict future performance. Total returns and the ending account values in the graph include changes in share price and reinvestment of dividends and capital gains distributions in a hypothetical investment for the periods shown. The Fund’s total returns do not reflect the deduction of income taxes on an individual’s investment. Taxes may reduce your actual investment returns on income or gains paid by the Fund or any gains you may realize if you sell your shares.
Source: PGIM Investments LLC and Lipper Inc.
Since Inception returns are provided since the Fund has less than 10 fiscal years of returns. Since Inception returns for the Index and the Lipper Average are measured from the inception date for the indicated share class.
| Prudential Jennison International Opportunities Fund | 9 |
Your Fund’s Performance (continued)
The returns in the tables do not reflect the deduction of taxes that a shareholder would pay on Fund distributions or following the redemption of Fund shares. The average annual total returns take into account applicable sales charges, which are described for each share class in the table below.
| Class A* | Class C* | Class Q | Class Z* | |||||
| Maximum initial sales charge | 5.50% of the public offering price | None | None | None | ||||
| Contingent deferred sales charge (CDSC) (as a percentage of the lower of original purchase price or net asset value at redemption) | 1.00% on sales of $1 million or more made within 12 months of purchase | 1.00% on sales made within 12 months of purchase | None | None | ||||
| Annual distribution and service (12b-1) fees (shown as a percentage of average daily net assets) | 0.30% (0.25% currently) | 1.00% | None | None |
*Certain share classes will be generally closed to investments by new group retirement plans effective on or about June 1, 2018. Please see the “PRUDENTIAL FUNDS—UPDATE” on page 4 of this report for more information.
Benchmark Definitions
MSCI All Country World Index ex-US Index—The Morgan Stanley Capital International All Country World Index ex-US Index (MSCI ACWI ex-US Index) is an unmanaged free float-adjusted market capitalization weighted index that is designed to provide a broad measure of stock performance throughout the world, with the exception of US-based companies. The average annual total returns for the MSCI ACWI ex-US Index measured from the month-end closest to the inception date of the Fund’s Class A, Class C, and Class Z shares through 10/31/17 is 9.35% and 14.88% for Class Q shares.
Lipper International Multi-Cap Growth Funds Average—The Lipper International Multi-Cap Growth Funds Average (Lipper Average) is based on the average return of all funds in the Lipper International Multi-Cap Growth Funds universe for the periods noted. Funds in the Lipper Average, by portfolio practice, invest in a variety of market-capitalization ranges without concentrating 75% of their equity assets in any one market-capitalization range over an extended period of time. International multi-cap growth funds typically have above-average characteristics compared to the MSCI EAFE Index. The average annual total return for the Lipper Average measured from the month-end closest to the inception date of the Fund’s Class A, Class C, and Class Z shares through 10/31/17 is 10.12% and 12.95% for Class Q shares.
| 10 | Visit our website at pgiminvestments.com |
Investors cannot invest directly in an index or average. The returns for the Index would be lower if they included the effects of sales charges, operating expenses of a mutual fund, or taxes. Returns for the Lipper Average reflect the deduction of operating expenses, but not sales charges or taxes.
Presentation of Fund Holdings
| Five Largest Holdings expressed as a percentage of net assets as of 10/31/17 (%) | ||
| Alibaba Group Holding Ltd. | 7.5 | |
| Tencent Holdings Ltd. | 7.1 | |
| Kering | 5.0 | |
| Adidas AG | 4.3 | |
| MercadoLibre, Inc. | 3.5 |
Holdings reflect only long-term investments and are subject to change.
| Five Largest Industries expressed as a percentage of net assets as of 10/31/17 (%) | ||
| Internet Software & Services | 18.0 | |||
| Textiles, Apparel & Luxury Goods | 14.4 | |||
| Chemicals | 7.3 | |||
| Semiconductors & Semiconductor Equipment | 6.4 | |||
| Health Care Equipment & Supplies | 5.5 |
Industry weightings reflect only long-term investments and are subject to change.
| Prudential Jennison International Opportunities Fund | 11 |
Strategy and Performance Overview
How did the Fund perform?
The Prudential Jennison International Opportunities Fund’s Class Z shares rose 38.65% in the 12 months ended October 31, 2017. In the same period, the MSCI All Country World Index (excluding the US) (the Index) advanced 23.64% and the Lipper International Multi-Cap Growth Funds Average climbed 24.19%.
What was the market environment?
| • | Equity returns were strong in the 12-month period ended October 31, 2017, as global GDP advanced at a healthy pace, long-term interest rates remained close to historical lows, and central banks tightened monetary policy prudently and gradually in light of subdued inflation. |
| • | Europe’s economic recovery proceeded, and emerging markets had their best performance since the aftermath of the financial crisis. Japan likewise showed healthier trends in economic activity. |
| • | In the Index, all sectors advanced, with information technology, financials, materials, and industrials posting the largest gains, while returns in telecom services were more modest. |
| • | Likewise, all regions were positive, with Developed Europe and emerging markets leading the others. |
What worked?
| • | Information technology positions were strong contributors to return. |
| • | Alibaba reported impressive financial results that beat consensus expectations on most key metrics. It operates China’s largest global online wholesale platform for small businesses, China’s largest online retail website, and China’s largest online third-party platform for brands and retailers. Jennison believes Alibaba, with its dominant market share, offers an attractive opportunity to invest in the long-term growth of the Chinese e-commerce market. |
| • | Tencent, China’s largest and most visited Internet service portal, continues to perform well, fundamentally driven by its dominant position in China’s online gaming and instant messaging markets and its growing advertising and payment service efforts. With its recent acquisition of two key music platforms, Tencent is also China’s leading online music provider. |
| • | MercadoLibre is a Buenos Aires-based online trading service that enables individuals and businesses to electronically sell and buy items in more than 2,000 categories. The company’s strong execution and enhanced marketplace initiatives, including integrated shipping and payment systems, are driving market share gains. Jennison likes MercadoLibre’s exposure to Latin America’s expanding Internet penetration rates and low e-commerce share of the retail market. |
| 12 | Visit our website at pgiminvestments.com |
| • | Consumer discretionary holdings also performed well in aggregate and a number of top performers were found in the sector: |
| • | Paris-based Kering is the world’s third-largest luxury group behind LVMH and Richemont. It operates in three divisions: luxury, lifestyle, and retail. Its global luxury brands include Gucci, Alexander McQueen, Balenciaga, Brioni, Boucheron, Bottega Veneta, and Yves Saint Laurent. German athletic shoemaker Puma is key to lifestyle operations. After restructuring and repositioning the Gucci brand for several quarters, with efforts focused on improving store concept, training staff, and broadening the product portfolio, Kering is beginning to see results. Jennison expects Kering’s positive earnings momentum to continue as the company increases its focus on organic growth (through retail execution and product innovation), financial discipline, and free cash generation. |
| • | Based in Bavaria Germany, Adidas sells sports shoes, apparel, and equipment in 160 countries. After several years of suboptimal performance, the company is poised to generate accelerated growth as new management repositions the adidas brand in North America, leverages its Boost technology, and restructures certain product lines. Jennison anticipates double-digit revenue growth and stable profit margins as higher raw material costs and negative currency effects are offset by better channel and product mix and more favorable pricing trends. |
What didn’t work?
| • | A large underweight to financials weighed on results and the Fund’s health care and energy positions were also a modest source of relative weakness; however, notable detractors were found in several different sectors. |
| • | In consumer discretionary: |
| • | Alsea is the largest restaurant operator in Mexico with more than 2,000 restaurants across different formats, including Domino’s Pizza, Starbucks, Burger King, Chili’s, California Pizza Kitchen, PF Chang’s, Pei-Wei, Italianni’s, Vips, and The Cheesecake Factory. Although Jennison likes Alsea’s dominant position, well-diversified and reputable mix of restaurant brands, superior scale, and strong execution, possible headwinds on the horizon include a potential slowdown in domestic consumer spending and possible fallout from the new US administration, which has questioned the North American Free Trade Agreement and could interfere with remittances. For these reasons, the Fund eliminated the position. |
| • | Based in Jakarta, Astra International operates in several business segments. Its principal automotive business assembles and distributes automobiles, motorcycles, and automotive components in Indonesia. The company also has banking, insurance, trading, mining, agriculture, construction, transportation, and consulting businesses. With Indonesian automobile sales growth expected to moderate, the Fund eliminated the position. |
| Prudential Jennison International Opportunities Fund | 13 |
Strategy and Performance Overview (continued)
| • | Nintendo, one of the world’s largest video game console makers, makes Wii home video consoles and DS handheld consoles. Kyoto, Japan-based company also makes software or IP games, including the Donkey Kong, Mario, Zelda, and Pokémon franchises. Until recently, Nintendo has been slow to adjust as the game industry has extended to mobile platforms. In December, the company launched Super Mario Run in 151 countries and reached the top spot in App Store sales rankings in almost all developed markets and emerging markets. However, user ratings deteriorated shortly after the release, suggesting that the game’s appeal may subside quickly. The Fund eliminated the position. |
| • | Based in Kobe, Japan, Sysmex makes and sells clinical laboratory equipment, reagents, and software related to diagnostics, especially in hematology, hemostasis, urinalysis, and immunochemistry. It operates globally, with a strong presence in China and other emerging markets. Although hematology operations in the US and Europe are performing well, sales in China, a leading contributor to overall profit, have slowed and the Fund exited the position. |
| • | Schlumberger declined on lower energy prices. While Jennison believes the oil equipment and services provider stands to benefit from longer-term increased industry activities, especially offshore drilling and hydraulic fracturing, that favor its best-in-class technologies and services, Jennison eliminated the position and funded other opportunities offering nearer-term growth prospects. |
The percentage points shown in the tables below identify each security’s positive or negative contribution to the Fund’s return relative to the benchmark, which is the sum of all contributions by individual holdings.
| Top Contributors (%) | Top Detractors (%) | |||||||||
| Alibaba Group Holding Ltd CHINA | 4.40 | Alsea MEXICO | –0.97 | |||||||
| Tencent Holdings Ltd. CHINA | 4.21 | Sysmex JAPAN | –0.95 | |||||||
| Kering FRANCE | 2.56 | Nintendo Co., Ltd. | –0.70 | |||||||
| Adidas AG | 2.13 | Astra Otoparts Tbk PT | –0.36 | |||||||
| MercadoLibre | 1.93 | Schlumberger Limited | –0.33 | |||||||
Current outlook
| • | Jennison remains focused on identifying businesses that can generate organic growth and that continue to benefit from structural changes in their industries. The strategy remains heavily invested in technology and consumer discretionary stocks offering these characteristics. The Fund will continue to carefully evaluate the fundamental outlooks of our holdings and make adjustments as necessary as the overall global environment evolves. |
| 14 | Visit our website at pgiminvestments.com |
| • | Many holdings in developed European countries are global companies with unique business models that derive much, if not most, of their revenues outside of Europe. Service-oriented companies offering a competitive advantage are performing fundamentally well. |
| • | In developed Asia, The Fund is closely monitoring efforts under way in Japan to stimulate growth and reform aspects of the economy. Jennison has exposure to a Japanese company that offers globally competitive products, attractive returns, and improving shareholder transparency. |
| • | Jennison’s overall view of the emerging markets macroeconomic environment has been turning more positive, as currencies have stabilized, GDP growth has reaccelerated, commodities prices have improved, inflationary pressures have remained subdued, and central banks have eased monetary policy. However, potential geopolitical uncertainty stemming from possible US isolationism and trade protection under the new administration could trigger changes in relative currency valuations and spur reactive currency devaluations, which could create significant challenges, especially for emerging markets economies. |
| • | China’s struggle to drive economic growth through domestic consumer demand rather than exports and massive public works programs is a work in progress. The positions the Fund holds in Chinese equities continue to focus on the rapidly growing e-commerce and Internet platform opportunities that have seen little, if any, impact from the pressures surrounding the broader economy. |
| Prudential Jennison International Opportunities Fund | 15 |
Fees and Expenses (unaudited)
As a shareholder of the Fund, you incur two types of costs: (1) transaction costs, including sales charges (loads) on purchase payments and redemptions, as applicable, and (2) ongoing costs, including management fees, distribution, and/or service (12b-1) fees, and other Fund expenses, as applicable. This example is intended to help you understand your ongoing costs (in dollars) of investing in the Fund and to compare these costs with the ongoing costs of investing in other mutual funds.
The example is based on an investment of $1,000 held through the six-month period ended October 31, 2017. The example is for illustrative purposes only; you should consult the Prospectus for information on initial and subsequent minimum investment requirements.
Actual Expenses
The first line for each share class in the table on the following page provides information about actual account values and actual expenses. You may use the information on this line, together with the amount you invested, to estimate the expenses that you paid over the period. Simply divide your account value by $1,000 (for example, an $8,600 account value ÷ $1,000 = 8.6), then multiply the result by the number on the first line under the heading “Expenses Paid During the Six-Month Period” to estimate the expenses you paid on your account during this period.
Hypothetical Example for Comparison Purposes
The second line for each share class in the table on the following page provides information about hypothetical account values and hypothetical expenses based on the Fund’s actual expense ratio and an assumed rate of return of 5% per year before expenses, which is not the Fund’s actual return. The hypothetical account values and expenses may not be used to estimate the actual ending account balance or expenses you paid for the period. You may use this information to compare the ongoing costs of investing in the Fund and other funds. To do so, compare this 5% hypothetical example with the 5% hypothetical examples that appear in the shareholder reports of the other funds.
The Fund’s transfer agent may charge additional fees to holders of certain accounts that are not included in the expenses shown in the table on the following page. These fees apply to individual retirement accounts (IRAs) and Section 403(b) accounts. As of the close of the six-month period covered by the table, IRA fees included an annual maintenance fee of $15 per account (subject to a maximum annual maintenance fee of $25 for all accounts held by the same shareholder). Section 403(b) accounts are charged an annual $25 fiduciary maintenance fee. Some of the fees may vary in amount, or may be waived, based on your total account balance or the number of Prudential funds, including the Fund, that you own. You should consider the additional fees that were charged to your Fund account
| 16 | Visit our website at pgiminvestments.com |
over the six-month period when you estimate the total ongoing expenses paid over the period and the impact of these fees on your ending account value, as these additional expenses are not reflected in the information provided in the expense table. Additional fees have the effect of reducing investment returns.
Please note that the expenses shown in the table are meant to highlight your ongoing costs only and do not reflect any transactional costs such as sales charges (loads). Therefore, the second line for each share class in the table is useful in comparing ongoing costs only and will not help you determine the relative total costs of owning different funds. In addition, if these transactional costs were included, your costs would have been higher.
| Prudential Jennison International Opportunities Fund | Beginning Account Value May 1, 2017 | Ending Account October 31, 2017 | Annualized Expense Ratio Based on the Six-Month Period | Expenses Paid During the Six-Month Period* | ||||||||||||||
| Class A | Actual | $ | 1,000.00 | $ | 1,217.90 | 1.14 | % | $ | 6.37 | |||||||||
| Hypothetical | $ | 1,000.00 | $ | 1,019.46 | 1.14 | % | $ | 5.80 | ||||||||||
| Class C | Actual | $ | 1,000.00 | $ | 1,213.40 | 1.89 | % | $ | 10.54 | |||||||||
| Hypothetical | $ | 1,000.00 | $ | 1,015.68 | 1.89 | % | $ | 9.60 | ||||||||||
| Class Q | Actual | $ | 1,000.00 | $ | 1,219.30 | 0.84 | % | $ | 4.70 | |||||||||
| Hypothetical | $ | 1,000.00 | $ | 1,020.97 | 0.84 | % | $ | 4.28 | ||||||||||
| Class Z | Actual | $ | 1,000.00 | $ | 1,220.20 | 0.89 | % | $ | 4.98 | |||||||||
| Hypothetical | $ | 1,000.00 | $ | 1,020.72 | 0.89 | % | $ | 4.53 | ||||||||||
*Fund expenses (net of fee waivers or subsidies, if any) for each share class are equal to the annualized expense ratio for each share class (provided in the table), multiplied by the average account value over the period, multiplied by the 184 days in the six-month period ended October 31, 2017, and divided by the 365 days in the Fund’s fiscal year ended October 31, 2017 (to reflect the six-month period). Expenses presented in the table include the expenses of any underlying funds in which the Fund may invest.
| Prudential Jennison International Opportunities Fund | 17 |
Schedule of Investments
as of October 31, 2017
| Description | Shares | Value | ||||||
LONG-TERM INVESTMENTS 99.3% | ||||||||
COMMON STOCKS 97.0% | ||||||||
Argentina 3.5% | ||||||||
MercadoLibre, Inc.(a) | 8,902 | $ | 2,139,240 | |||||
Brazil 2.3% | ||||||||
Raia Drogasil SA | 58,552 | 1,408,985 | ||||||
China 14.5% | ||||||||
Alibaba Group Holding Ltd., ADR*(a) | 24,982 | 4,618,922 | ||||||
Tencent Holdings Ltd. | 97,644 | 4,388,620 | ||||||
|
| |||||||
| 9,007,542 | ||||||||
Denmark 2.0% | ||||||||
Novozymes A/S (Class B Stock) | 22,862 | 1,263,190 | ||||||
France 14.3% | ||||||||
Dassault Systemes SE | 11,034 | 1,171,329 | ||||||
Kering | 6,802 | 3,119,435 | ||||||
L’Oreal SA | 4,958 | 1,103,470 | ||||||
LVMH Moet Hennessy Louis Vuitton SE | 6,154 | 1,835,512 | ||||||
Remy Cointreau SA | 5,724 | 743,439 | ||||||
Valeo SA | 13,331 | 902,565 | ||||||
|
| |||||||
| 8,875,750 | ||||||||
Germany 12.2% | ||||||||
adidas AG | 11,968 | 2,663,876 | ||||||
Fresenius SE & Co. KGaA | 14,863 | 1,244,274 | ||||||
Infineon Technologies AG | 56,868 | 1,572,858 | ||||||
Wirecard AG | 20,549 | 2,041,545 | ||||||
|
| |||||||
| 7,522,553 | ||||||||
Hong Kong 2.1% | ||||||||
Techtronic Industries Co. Ltd. | 225,908 | 1,326,129 | ||||||
India 5.1% | ||||||||
HDFC Bank Ltd., ADR | 18,156 | 1,675,799 | ||||||
Maruti Suzuki India Ltd. | 11,627 | 1,475,017 | ||||||
|
| |||||||
| 3,150,816 | ||||||||
Italy 6.0% | ||||||||
Brembo SpA | 59,862 | 988,195 | ||||||
Brunello Cucinelli SpA | 32,757 | 1,099,399 | ||||||
Brunello Cucinelli SpA, 144A | 5,417 | 181,807 | ||||||
Ferrari NV | 12,102 | 1,449,068 | ||||||
|
| |||||||
| 3,718,469 | ||||||||
See Notes to Financial Statements.
| Prudential Jennison International Opportunities Fund | 19 |
Schedule of Investments (continued)
as of October 31, 2017
| Description | Shares | Value | ||||||
COMMON STOCKS (Continued) | ||||||||
Japan 4.3% | ||||||||
FANUC Corp. | 2,424 | $ | 566,789 | |||||
Keyence Corp. | 3,795 | 2,107,079 | ||||||
|
| |||||||
| 2,673,868 | ||||||||
Netherlands 3.2% | ||||||||
ASML Holding NV | 10,827 | 1,953,509 | ||||||
Spain 2.5% | ||||||||
Industria de Diseno Textil SA | 41,364 | 1,546,106 | ||||||
Sweden 3.0% | ||||||||
Atlas Copco AB (Class A Stock) | 42,713 | 1,873,028 | ||||||
Switzerland 5.3% | ||||||||
Givaudan SA | 573 | 1,279,675 | ||||||
Straumann Holding AG | 2,889 | 2,017,102 | ||||||
|
| |||||||
| 3,296,777 | ||||||||
Thailand 1.6% | ||||||||
CP ALL PCL | 460,430 | 970,296 | ||||||
United Kingdom 10.1% | ||||||||
Ashtead Group PLC | 53,074 | 1,367,155 | ||||||
ASOS PLC* | 9,475 | 716,754 | ||||||
Compass Group PLC | 68,262 | 1,498,642 | ||||||
St. James’s Place PLC | 83,831 | 1,310,266 | ||||||
Unilever NV, CVA | 23,519 | 1,366,217 | ||||||
|
| |||||||
| 6,259,034 | ||||||||
United States 5.0% | ||||||||
Albemarle Corp. | 13,863 | 1,953,158 | ||||||
Broadcom Ltd. | 1,752 | 462,370 | ||||||
JPMorgan Chase & Co. | 6,598 | 663,825 | ||||||
|
| |||||||
| 3,079,353 | ||||||||
|
| |||||||
TOTAL COMMON STOCKS | 60,064,645 | |||||||
|
| |||||||
PREFERRED STOCK 2.3% | ||||||||
Germany | ||||||||
Sartorius AG (PRFC) | 14,976 | 1,398,402 | ||||||
|
| |||||||
TOTAL LONG-TERM INVESTMENTS | 61,463,047 | |||||||
|
| |||||||
See Notes to Financial Statements.
| 20 |
| Description | Shares | Value | ||||||
SHORT-TERM INVESTMENTS 11.6% | ||||||||
AFFILIATED MUTUAL FUNDS | ||||||||
Prudential Investment Portfolios 2 - Prudential Core Ultra Short Bond Fund(w) | 1,267,836 | $ | 1,267,836 | |||||
Prudential Investment Portfolios 2 - Prudential Institutional Money Market Fund | 5,918,406 | 5,918,998 | ||||||
|
| |||||||
TOTAL SHORT-TERM INVESTMENTS | 7,186,834 | |||||||
|
| |||||||
TOTAL INVESTMENTS 110.9% | 68,649,881 | |||||||
Liabilities in excess of other assets (10.9)% | (6,724,301 | ) | ||||||
|
| |||||||
NET ASSETS 100.0% | $ | 61,925,580 | ||||||
|
| |||||||
The following abbreviations are used in the annual report:
144A—Security was purchased pursuant to Rule 144A under the Securities Act of 1933 and may not be resold subject to that rule except to qualified institutional buyers. Unless otherwise noted, 144A securities are deemed to be liquid.
ADR—American Depositary Receipt
CVA—Certificate Van Aandelen (Bearer)
LIBOR—London Interbank Offered Rate
PRFC—Preference Shares
| * | Non-income producing security. |
| (a) | All or a portion of security is on loan. The aggregate market value of such securities, including those sold and pending settlement, is $5,912,519; cash collateral of $5,915,312 (included in liabilities) was received with which the Series purchased highly liquid short-term investments. |
| (b) | Represents security purchased with cash collateral received for securities on loan and includes dividend reinvestment. |
| (w) | PGIM Investments LLC, the manager of the Series, also serves as manager of the Prudential Investment Portfolios 2 - Prudential Core Ultra Short Bond Fund and Prudential Institutional Money Market Fund. |
Fair Value Measurements:
Various inputs are used in determining the value of the Series’ investments. These inputs are summarized in the three broad levels listed below.
Level 1—unadjusted quoted prices generally in active markets for identical securities.
Level 2—quoted prices for similar securities, interest rates and yield curves, prepayment speeds, foreign currency exchange rates and other observable inputs.
Level 3—unobservable inputs for securities valued in accordance with Board approved fair valuation procedures.
See Notes to Financial Statements.
| Prudential Jennison International Opportunities Fund | 21 |
Schedule of Investments (continued)
as of October 31, 2017
The following is a summary of the inputs used as of October 31, 2017 in valuing such portfolio securities:
| Level 1 | Level 2 | Level 3 | ||||||||||
Investments in Securities | ||||||||||||
Common Stocks | ||||||||||||
Argentina | $ | 2,139,240 | $ | — | $ | — | ||||||
Brazil | 1,408,985 | — | — | |||||||||
China | 4,618,922 | 4,388,620 | — | |||||||||
Denmark | — | 1,263,190 | — | |||||||||
France | — | 8,875,750 | — | |||||||||
Germany | — | 7,522,553 | — | |||||||||
Hong Kong | — | 1,326,129 | — | |||||||||
India | 1,675,799 | 1,475,017 | — | |||||||||
Italy | — | 3,718,469 | — | |||||||||
Japan | — | 2,673,868 | — | |||||||||
Netherlands | — | 1,953,509 | — | |||||||||
Spain | — | 1,546,106 | — | |||||||||
Sweden | — | 1,873,028 | — | |||||||||
Switzerland | — | 3,296,777 | — | |||||||||
Thailand | — | 970,296 | — | |||||||||
United Kingdom | — | 6,259,034 | — | |||||||||
United States | 3,079,353 | — | — | |||||||||
Preferred Stock | ||||||||||||
Germany | — | 1,398,402 | — | |||||||||
Affiliated Mutual Funds | 7,186,834 | — | — | |||||||||
|
|
|
|
|
| |||||||
Total | $ | 20,109,133 | $ | 48,540,748 | $ | — | ||||||
|
|
|
|
|
| |||||||
During the period, there were no transfers between Level 1, Level 2 and Level 3 to report.
Industry Classification:
The industry classification of investments and liabilities in excess of other assets shown as a percentage of net assets as of October 31, 2017 were as follows (unaudited):
Internet Software & Services | 18.0 | % | ||
Textiles, Apparel & Luxury Goods | 14.4 | |||
Affiliated Mutual Funds (including 9.6% of collateral for securities on loan) | 11.6 | |||
Chemicals | 7.3 | |||
Semiconductors & Semiconductor Equipment | 6.4 | |||
Health Care Equipment & Supplies | 5.5 | |||
Automobiles | 4.7 | |||
Personal Products | 4.0 | |||
Machinery | 3.9 | |||
Food & Staples Retailing | 3.9 | |||
Banks | 3.8 | |||
Electronic Equipment, Instruments & Components | 3.4 | |||
IT Services | 3.3 | |||
Auto Components | 3.1 | % | ||
Specialty Retail | 2.5 | |||
Hotels, Restaurants & Leisure | 2.4 | |||
Trading Companies & Distributors | 2.2 | |||
Household Durables | 2.1 | |||
Capital Markets | 2.1 | |||
Health Care Providers & Services | 2.0 | |||
Software | 1.9 | |||
Beverages | 1.2 | |||
Internet & Direct Marketing Retail | 1.2 | |||
|
| |||
| 110.9 | ||||
Liabilities in excess of other assets | (10.9 | ) | ||
|
| |||
| 100.0 | % | |||
|
|
See Notes to Financial Statements.
| 22 |
Financial Instruments/Transactions—Summary of Offsetting and Netting Arrangements:
The Series entered into financial instruments/transactions during the reporting period that are either offset in accordance with current requirements or are subject to enforceable master netting arrangements or similar agreements that permit offsetting. The information about offsetting and related netting arrangements for financial instruments/transactions, where the legal right to set-off exists, is presented in the summary below.
Offsetting of financial instruments/transactions assets and liabilities:
Description | Gross Market Value of Recognized Assets/(Liabilities) | Collateral Pledged/(Received)(1) | Net Amount | |||||||||
Securities on Loan | $ | 5,912,519 | $ | (5,912,519 | ) | $ | — | |||||
| (1) | Collateral amount disclosed by the Series is limited to the market value of financial instruments/transactions. |
See Notes to Financial Statements.
| Prudential Jennison International Opportunities Fund | 23 |
Statement of Assets & Liabilities
as of October 31, 2017
Assets | ||||
Investments at value, including securities on loan of $5,912,519: | ||||
Unaffiliated investments (cost $41,030,206) | $ | 61,463,047 | ||
Affiliated investments (cost $7,186,834) | 7,186,834 | |||
Receivable for investments sold | 94,458 | |||
Tax reclaim receivable | 75,356 | |||
Dividends receivable | 36,330 | |||
Receivable for Series shares sold | 27,440 | |||
Prepaid expenses | 909 | |||
|
| |||
Total Assets | 68,884,374 | |||
|
| |||
Liabilities | ||||
Payable to broker for collateral for securities on loan | 5,915,312 | |||
Payable for investments purchased | 591,017 | |||
Payable for Series shares reacquired | 376,666 | |||
Management fee payable | 41,639 | |||
Accrued expenses and other liabilities | 31,658 | |||
Distribution fee payable | 1,502 | |||
Affiliated transfer agent fee payable | 1,000 | |||
|
| |||
Total Liabilities | 6,958,794 | |||
|
| |||
Net Assets | $ | 61,925,580 | ||
|
| |||
Net assets were comprised of: | ||||
Common stock, at par | $ | 35,906 | ||
Paid-in capital in excess of par | 43,853,541 | |||
|
| |||
| 43,889,447 | ||||
Undistributed net investment income | 104,056 | |||
Accumulated net realized loss on investment and foreign currency transactions | (2,499,319 | ) | ||
Net unrealized appreciation on investments and foreign currencies | 20,431,396 | |||
|
| |||
Net assets, October 31, 2017 | $ | 61,925,580 | ||
|
| |||
See Notes to Financial Statements.
| 24 |
Class A | ||||
Net asset value and redemption price per share | $ | 17.10 | ||
Maximum sales charge (5.50% of offering price) | 1.00 | |||
|
| |||
Maximum offering price to public | $ | 18.10 | ||
|
| |||
Class C | ||||
Net asset value, offering price and redemption price per share | $ | 16.43 | ||
|
| |||
Class Q | ||||
Net asset value, offering price and redemption price per share | $ | 17.29 | ||
|
| |||
Class Z | ||||
Net asset value, offering price and redemption price per share | $ | 17.29 | ||
|
| |||
See Notes to Financial Statements.
| Prudential Jennison International Opportunities Fund | 25 |
Statement of Operations
Year Ended October 31, 2017
Net Investment Income (Loss) | ||||
Income | ||||
Unaffiliated dividend income (net of foreign withholding taxes of $48,270) | $ | 558,387 | ||
Affiliated dividend income | 7,900 | |||
Income from securities lending, net (including affiliated income of $2,282) | 4,587 | |||
|
| |||
Total income | 570,874 | |||
|
| |||
Expenses | ||||
Management fee | 419,812 | |||
Distribution fee—Class A | 9,365 | |||
Distribution fee—Class C | 10,804 | |||
Custodian and accounting fees | 73,000 | |||
Registration fees | 56,000 | |||
Audit fee | 27,000 | |||
Legal fees and expenses | 22,000 | |||
Shareholders’ reports | 20,000 | |||
Transfer agent’s fees and expenses (including affiliated expense of $4,700) | 14,000 | |||
Directors’ fees | 10,000 | |||
Miscellaneous | 28,576 | |||
|
| |||
Total expenses | 690,557 | |||
Less: Expense reimbursement | (228,599 | ) | ||
Distribution fee waiver—Class A | (1,561 | ) | ||
|
| |||
Net expenses | 460,397 | |||
|
| |||
Net investment income (loss) | 110,477 | |||
|
| |||
Realized And Unrealized Gain (Loss) On Investments And Foreign Currency Transactions | ||||
Net realized gain (loss) on: | ||||
Investment transactions (including affiliated of $1,926) | 2,354,112 | |||
Foreign currency transactions | (1,284 | ) | ||
|
| |||
| 2,352,828 | ||||
|
| |||
Net change in unrealized appreciation (depreciation) on: | ||||
Investments (including affiliated of $(299)) | 14,850,650 | |||
Foreign currencies | 2,476 | |||
|
| |||
| 14,853,126 | ||||
|
| |||
Net gain (loss) on investment and foreign currency transactions | 17,205,954 | |||
|
| |||
Net Increase (Decrease) In Net Assets Resulting From Operations | $ | 17,316,431 | ||
|
| |||
See Notes to Financial Statements.
| 26 |
Statement of Changes in Net Assets
| Year Ended October 31, | ||||||||
| 2017 | 2016 | |||||||
Increase (Decrease) in Net Assets | ||||||||
Operations | ||||||||
Net investment income (loss) | $ | 110,477 | $ | 179,456 | ||||
Net realized gain (loss) on investment and foreign currency transactions | 2,352,828 | (2,754,574 | ) | |||||
Net change in unrealized appreciation (depreciation) on investments and foreign currencies | 14,853,126 | 26,264 | ||||||
|
|
|
| |||||
Net increase (decrease) in net assets resulting from operations | 17,316,431 | (2,548,854 | ) | |||||
|
|
|
| |||||
Dividends from net investment income | �� | |||||||
Class Q | (71,620 | ) | — | |||||
Class Z | (41,518 | ) | — | |||||
|
|
|
| |||||
| (113,138 | ) | — | ||||||
|
|
|
| |||||
Series share transactions (Net of share conversions) | ||||||||
Net proceeds from shares sold | 11,624,932 | 6,080,927 | ||||||
Net asset value of shares issued in reinvestment of dividends | 113,138 | — | ||||||
Cost of shares reacquired | (12,451,939 | ) | (9,583,417 | ) | ||||
|
|
|
| |||||
Net increase (decrease) in net assets from Series share transactions | (713,869 | ) | (3,502,490 | ) | ||||
|
|
|
| |||||
Total increase (decrease) | 16,489,424 | (6,051,344 | ) | |||||
Net Assets: | ||||||||
Beginning of year | 45,436,156 | 51,487,500 | ||||||
|
|
|
| |||||
End of year(a) | $ | 61,925,580 | $ | 45,436,156 | ||||
|
|
|
| |||||
(a) Includes undistributed net investment income of: | $ | 104,056 | $ | 108,001 | ||||
|
|
|
| |||||
See Notes to Financial Statements.
| Prudential Jennison International Opportunities Fund | 27 |
Notes to Financial Statements
Prudential World Fund, Inc. (the “Fund”) is registered under the Investment Company Act of 1940, as amended (“1940 Act”), as an open-end management investment company and currently consists of seven investment portfolios: Prudential Emerging Markets Debt Hard Currency Fund and Prudential Emerging Markets Debt Local Currency Fund which are non-diversified funds and Prudential Jennison Emerging Markets Equity Fund, Prudential Jennison Global Infrastructure Fund, Prudential Jennison Global Opportunities Fund, Prudential Jennison International Opportunities Fund and Prudential QMA International Equity Fund which are diversified funds. These financial statements relate to the Prudential Jennison International Opportunities Fund (the “Series”).
The investment objective of the Series is to seek long-term growth of capital.
1. Accounting Policies
The Series follows investment company accounting and reporting guidance of the Financial Accounting Standards Board (“FASB”) Accounting Standard Codification Topic 946 Financial Services—Investment Companies. The following accounting policies conform to U.S. generally accepted accounting principles. The Series consistently follows such policies in the preparation of its financial statements.
Securities Valuation: The Series holds securities and other assets and liabilities that are fair valued at the close of each day (generally, 4:00 PM Eastern time) the New York Stock Exchange (“NYSE”) is open for trading. Fair value is the price that would be received to sell an asset or paid to transfer a liability in an orderly transaction between market participants on the measurement date. The Board of Directors (the “Board”) has adopted valuation procedures for security valuation under which fair valuation responsibilities have been delegated to PGIM Investments LLC (“PGIM Investments” or “the Manager”) (formerly known as Prudential Investments LLC). Under the current valuation procedures, the Valuation Committee is responsible for supervising the valuation of portfolio securities and other assets and liabilities. The valuation procedures permit the Series to utilize independent pricing vendor services, quotations from market makers, and alternative valuation methods when market quotations are either not readily available or not deemed representative of fair value. A record of the Valuation Committee’s actions is subject to the Board’s review, approval, and ratification at its next regularly scheduled quarterly meeting.
Various inputs determine how the Series’ investments are valued, all of which are categorized according to the three broad levels (Level 1, 2, or 3) detailed in the Schedule of Investments.
Common and preferred stocks, exchange-traded funds, and derivative instruments, such as futures or options, that are traded on a national securities exchange are valued at the
| 28 |
last sale price as of the close of trading on the applicable exchange where the security principally trades. Securities traded via NASDAQ are valued at the NASDAQ official closing price. To the extent these securities are valued at the last sale price or NASDAQ official closing price, they are classified as Level 1 in the fair value hierarchy. In the event that no sale or official closing price on valuation date exists, these securities are generally valued at the mean between the last reported bid and ask prices, or at the last bid price in the absence of an ask price. These securities are classified as Level 2 in the fair value hierarchy.
Foreign equities traded on foreign securities exchanges are generally valued using pricing vendor services that provide model prices derived using adjustment factors based on information such as local closing price, relevant general and sector indices, currency fluctuations, depositary receipts, and futures, as applicable. Securities valued using such model prices are classified as Level 2 in the fair value hierarchy. The models generate an evaluated adjustment factor for each security, which is applied to the local closing price to adjust it for post closing market movements. Utilizing that evaluated adjustment factor, the vendor provides an evaluated price for each security. If the vendor does not provide an evaluated price, securities are valued in accordance with exchange-traded common and preferred stock valuation policies discussed above.
Participatory notes (“P-notes”) are generally valued based upon the value of a related underlying security that trades actively in the market and are classified as Level 2 in the fair value hierarchy.
Investments in open-end, non-exchange-traded mutual funds are valued at their net asset values as of the close of the NYSE on the date of valuation. These securities are classified as Level 1 in the fair value hierarchy since they may be purchased or sold at their net asset values on the date of valuation.
Securities and other assets that cannot be priced according to the methods described above are valued based on pricing methodologies approved by the Board. In the event that unobservable inputs are used when determining such valuations, the securities will be classified as Level 3 in the fair value hierarchy.
When determining the fair value of securities, some of the factors influencing the valuation include: the nature of any restrictions on disposition of the securities; assessment of the general liquidity of the securities; the issuer’s financial condition and the markets in which it does business; the cost of the investment; the size of the holding and the capitalization of the issuer; the prices of any recent transactions or bids/offers for such securities or any comparable securities; any available analyst media or other reports or information deemed reliable by the investment manager regarding the issuer or the markets or industry in which it operates. Using fair value to price securities may result in a value that is different from a security’s most recent closing price and from the price used by other unaffiliated mutual funds to calculate their net asset values.
| Prudential Jennison International Opportunities Fund | 29 |
Notes to Financial Statements (continued)
Restricted and Illiquid Securities: Subject to guidelines adopted by the Board, the Series may invest up to 15% of its net assets in illiquid securities, including those which are restricted as to disposition under securities law (“restricted securities”). Restricted securities are valued pursuant to the valuation procedures noted above. Illiquid securities are those that, because of the absence of a readily available market or due to legal or contractual restrictions on resale, cannot be sold within seven days in the ordinary course of business at approximately the amount at which the Series has valued the investment. Therefore, the Series may find it difficult to sell illiquid securities at the time considered most advantageous by its Subadviser and may incur expenses that would not be incurred in the sale of securities that were freely marketable. Certain securities that would otherwise be considered illiquid because of legal restrictions on resale to the general public may be traded among qualified institutional buyers under Rule 144A of the Securities Act of 1933. These Rule 144A securities, as well as commercial paper that is sold in private placements under Section 4(2) of the Securities Act, may be deemed liquid by the Series’ Subadviser under the guidelines adopted by the Directors of the Series. However, the liquidity of the Series’ investments in Rule 144A securities could be impaired if trading does not develop or declines.
Foreign Currency Translation: The books and records of the Series are maintained in U.S. dollars. Foreign currency amounts are translated into U.S. dollars on the following basis:
(i) market value of investment securities, other assets and liabilities—at the current rates of exchange;
(ii) purchases and sales of investment securities, income and expenses—at the rates of exchange prevailing on the respective dates of such transactions.
Although the net assets of the Series are presented at the foreign exchange rates and market values at the close of the period, the Series does not generally isolate that portion of the results of operations arising as a result of changes in the foreign exchange rates from the fluctuations arising from changes in the market prices of long-term portfolio securities held at the end of the period. Similarly, the Series does not isolate the effect of changes in foreign exchange rates from the fluctuations arising from changes in the market prices of long-term portfolio securities sold during the period. Accordingly, holding period realized foreign currency gains (losses) are included in the reported net realized gains (losses) on investment transactions.
Net realized gains (losses) on foreign currency transactions represent net foreign exchange gains (losses) from the disposition of holdings of foreign currencies, currency gains (losses) realized between the trade and settlement dates on securities transactions, and the difference between the amounts of interest, dividends and foreign withholding taxes
| 30 |
recorded on the Series’ books and the U.S. dollar equivalent amounts actually received or paid. Net unrealized currency gains (losses) from valuing foreign currency denominated assets and liabilities (other than investments) at period end exchange rates are reflected as a component of net unrealized appreciation (depreciation) on foreign currencies.
P-notes: The Series may gain exposure to securities in certain foreign markets through investments in P-notes. The Series may purchase P-notes due to restrictions applicable to foreign investors when investing directly in a foreign market. P-notes are generally issued by banks or broker-dealers and are designed to offer a return linked to a particular underlying security. P-notes involve transaction costs, which may be higher than those applicable to the equity securities. An investment in a P-note may involve risks, including counterparty risk, beyond those normally associated with a direct investment in the underlying security. The Series must rely on the creditworthiness of the counterparty and would have no rights against the issuer of the underlying security. Furthermore, the P-note’s performance may differ from that of the underlying security. The holder of the P-note is entitled to receive from the bank or broker-dealer, an amount equal to dividends paid by the issuer of the underlying security; however, the holder is not entitled to the same rights (e.g., dividends, voting rights) as an owner of the underlying security. There is also no assurance that there will be a secondary trading market for a P-note or that the trading price of a P-note will equal the value of the underlying security.
Master Netting Arrangements: The Fund, on behalf of the Series, is subject to various Master Agreements, or netting arrangements, with select counterparties. These are agreements which a subadviser may have negotiated and entered into on behalf of the Series. A master netting arrangement between the Series and the counterparty permits the Series to offset amounts payable by the Series to the same counterparty against amounts to be received; and by the receipt of collateral from the counterparty by the Series to cover the Series’ exposure to the counterparty. However, there is no assurance that such mitigating factors are easily enforceable. In addition to master netting arrangements, the right to set-off exists when all the conditions are met such that each of the parties owes the other determinable amounts, the reporting party has the right to set-off the amount owed with the amount owed by the other party, the reporting party intends to set-off and the right of set-off is enforceable by law. During the reporting period, there was no intention to settle on a net basis and all amounts are presented on a gross basis on the Statement of Assets and Liabilities.
Securities Lending: The Series may lend its portfolio securities to banks and broker-dealers. The loans are secured by collateral at least equal to the market value of the securities loaned. Collateral pledged by each borrower is invested in an affiliated money market fund and is marked to market daily, based on the previous day’s market value, such that the value of the collateral exceeds the value of the loaned securities. Loans are subject to termination at the option of the borrower or the Series. Upon termination of the loan, the borrower will return to the Series securities identical to the loaned securities. Should the borrower of the securities fail financially, the Series has the right to repurchase the securities in the open market using the collateral. The Series recognizes income, net of any rebate and securities lending agent fees, for lending its securities in the form of fees or
| Prudential Jennison International Opportunities Fund | 31 |
Notes to Financial Statements (continued)
interest on the investment of any cash received as collateral. The borrower receives all interest and dividends from the securities loaned and such payments are passed back to the lender in amounts equivalent thereto. The Series also continues to recognize any unrealized gain (loss) in the market price of the securities loaned and on the change in the value of the collateral invested that may occur during the term of the loan. In addition, realized gain (loss) is recognized on changes in the value of the collateral invested upon liquidation of the collateral. Net earnings from securities lending are disclosed on the Statement of Operations as “Income from securities lending, net”.
Concentration of Risk: Foreign security and currency transactions may involve certain considerations and risks not typically associated with those of domestic origin as a result of, among other factors, the possibility of political or economic instability or the level of governmental supervision and regulation of foreign securities markets.
Securities Transactions and Net Investment Income: Securities transactions are recorded on the trade date. Realized gains (losses) from investment and currency transactions are calculated on the specific identification method. Dividend income is recorded on the ex-date. Interest income, including amortization of premium and accretion of discount on debt securities, as required, is recorded on the accrual basis. Expenses are recorded on an accrual basis, which may require the use of certain estimates by management that may differ from actual.
Net investment income or loss (other than distribution fees which are charged directly to the respective class and transfer agency fees specific to Class Q shares which are charged to that share class) and unrealized and realized gains (losses) are allocated daily to each class of shares based upon the relative proportion of adjusted net assets of each class at the beginning of the day.
Taxes: It is the Series’ policy to continue to meet the requirements of the Internal Revenue Code applicable to regulated investment companies and to distribute all of its taxable net investment income and capital gains, if any, to its shareholders. Therefore, no federal income tax provision is required. Withholding taxes on foreign dividends, interest and capital gains, if any, are recorded, net of reclaimable amounts, at the time the related income is earned.
Dividends and Distributions: The Series expects to pay dividends from net investment income and distributions from net realized capital and currency gains, if any, annually. Dividends and distributions to shareholders, which are determined in accordance with federal income tax regulations and which may differ from generally accepted accounting principles, are recorded on the ex-date. Permanent book/tax differences relating to income and gain (loss) are reclassified amongst undistributed net investment income, accumulated net realized gain (loss) and paid-in capital in excess of par, as appropriate.
| 32 |
Estimates: The preparation of financial statements requires management to make estimates and assumptions that affect the reported amounts and disclosures in the financial statements. Actual results could differ from those estimates.
2. Agreements
The Fund, on behalf of the Series, has a management agreement with PGIM Investments. Pursuant to this agreement, PGIM Investments has responsibility for all investment advisory services and supervises the subadviser’s performance of such services. PGIM Investments has entered into a subadvisory agreement with Jennison Associates LLC (“Jennison”). The subadvisory agreement provides that Jennison will furnish investment advisory services in connection with the management of the Series. In connection therewith, Jennison is obligated to keep certain books and records of the Series. PGIM Investments pays for the services of Jennison, the cost of compensation of officers of the Series, occupancy and certain clerical and bookkeeping costs of the Series. The Series bears all other costs and expenses.
The management fee paid to PGIM Investments is accrued daily and payable monthly, at an annual rate of .825% of the Series’ average daily net assets up to and including $1 billion and .80% of such assets in excess of $1 billion. The effective management fee rate, before any waivers and/or expense reimbursement, was .825% for the year ended October 31, 2017. The effective management fee rate, net of waivers and/or expense reimbursement, was ..376%.
PGIM Investments has contractually agreed through February 28, 2019 to limit the net annual operating expenses (exclusive of distribution and service (12b-1) fees, transfer agency expenses (including sub-transfer agency and networking fees), taxes (such as income and foreign withholding taxes, stamp duty and deferred tax expenses), interest, underlying funds, brokerage, extraordinary and certain other expenses such as dividend, broker charges and interest expense on short sales) of each class of shares of the Series to .84% of the Series’ average daily net assets. Expenses waived/reimbursed by the Manager in accordance with this agreement may be recouped by the Manager within the same fiscal year during which such waiver/reimbursement is made if such recoupment can be realized without exceeding the expense limit in effect at the time of the recoupment for that fiscal year.
The Fund, on behalf of the Series, has a distribution agreement with Prudential Investment Management Services LLC (“PIMS”), which acts as the distributor of the Class A, Class C, Class Q and Class Z shares of the Series. The Series compensates PIMS for distributing and servicing the Series’ Class A and Class C shares, pursuant to plans of distribution (the “Distribution Plans”), regardless of expenses actually incurred by PIMS. The distribution fees are accrued daily and payable monthly. No distribution or service fees are paid to PIMS as distributor of the Class Q and Class Z shares of the Series.
Pursuant to the Distribution Plans, the Series compensates PIMS for distribution related activities at an annual rate of up to .30% and 1% of the average daily net assets of the Class A and Class C shares, respectively. PIMS has contractually agreed to limit such fees to .25% of the average daily net assets of the Class A shares through February 28, 2019.
| Prudential Jennison International Opportunities Fund | 33 |
Notes to Financial Statements (continued)
PIMS has advised the Series that it has received $17,511 in front-end sales charges resulting from sales of Class A shares during the year ended October 31, 2017. From these fees, PIMS paid such sales charges to affiliated broker-dealers, which in turn paid commissions to salespersons and incurred other distribution costs.
PIMS has advised the Series that for the year ended October 31, 2017 it received $32 in contingent deferred sales charges imposed upon redemptions by certain Class C shareholders.
PGIM Investments, PIMS and Jennison are indirect, wholly-owned subsidiaries of Prudential Financial, Inc. (“Prudential”).
3. Other Transactions with Affiliates
Prudential Mutual Fund Services LLC (“PMFS”), an affiliate of PGIM Investments and an indirect, wholly-owned subsidiary of Prudential, serves as the Series’ transfer agent. Transfer agent’s fees and expenses in the Statement of Operations include certain out-of-pocket expenses paid to non-affiliates, where applicable.
The Series may enter into certain securities purchase or sale transactions under Board approved Rule 17a-7 procedures. Rule 17a-7 is an exemptive rule under the 1940 Act, that permits purchase and sale transactions among affiliated investment companies, or between an investment company and a person that is affiliated solely by reason of having a common (or affiliated) investment adviser, common directors, and/or common officers. Such transactions are subject to ratification by the Board. For the reporting period ended October 31, 2017 no such transactions were entered into by the Series.
The Series may invest its overnight sweep cash in the Prudential Core Ultra Short Bond Fund (the “Core Fund”), and its securities lending cash collateral in the Prudential Institutional Money Market Fund (the “Money Market Fund”), each a series of Prudential Investment Portfolios 2, registered under the 1940 Act and managed by PGIM Investments. For the reporting period ended October 31, 2017, PGIM, Inc. was compensated $1,908 by PGIM Investments for managing the Series’ securities lending cash collateral as subadviser to the Money Market Fund. Earnings from the Core Fund and Money Market Fund are disclosed on the Statement of Operations as “Affiliated dividend income” and “Income from securities lending, net”, respectively.
4. Portfolio Securities
The aggregate cost of purchases and proceeds from sales of portfolio securities (excluding short-term investments and U.S. Government securities) for the year ended October 31, 2017 were $35,191,825 and $34,721,953, respectively.
| 34 |
5. Distributions and Tax Information
Distributions to shareholders, which are determined in accordance with federal income tax regulations and which may differ from generally accepted accounting principles, are recorded on the ex-date. In order to present undistributed net investment income, accumulated net realized loss on investment and foreign currency transactions and paid-in capital in excess of par on the Statement of Assets and Liabilities that more closely represent their tax character, certain adjustments have been made to undistributed net investment income and accumulated net realized loss on investment and foreign currency transactions. For the year ended October 31, 2017, the adjustments were to decrease undistributed net investment income and decrease accumulated net realized loss on investment and foreign currency transactions by $1,284 primarily due to the difference between certain transactions involving foreign currencies. Net investment income (loss), net realized gain (loss) on investment and foreign currency transactions and net assets were not affected by this change.
For the year ended October 31, 2017, the tax character of dividends paid by the Series was $113,138 of ordinary income. For the year ended October 31, 2016, there were no distributions paid by the Series.
As of October 31, 2017, the accumulated undistributed earnings on a tax basis was $104,251 of ordinary income.
The United States federal income tax basis of the Series’ investments and the net unrealized appreciation as of October 31, 2017 were as follows:
Tax Basis | Gross | Gross | Net Unrealized | |||
| $48,251,045 | $20,471,841 | $(74,450) | $20,397,391 |
The difference between book basis and tax basis is primarily attributable to deferred losses on wash sales and other cost basis adjustments between financial and tax accounting.
For federal income tax purposes, the Series had a capital loss carryforward as of October 31, 2017 of approximately $2,465,000 which can be carried forward for an unlimited period. The Series utilized approximately $2,367,000 of its capital loss carryforward during the fiscal year ended October 31, 2017 to offset capital gains. No capital gains distributions are expected to be paid to shareholders until net gains have been realized in excess of such losses.
Management has analyzed the Series’ tax positions taken on federal, state and local income tax returns for all open tax years and has concluded that no provision for income tax is required in the Series’ financial statements for the current reporting period. The Series’ federal, state and local income and federal excise tax returns for tax years for which the applicable statutes of limitations have not expired are subject to examination by the Internal Revenue Service and state departments of revenue.
| Prudential Jennison International Opportunities Fund | 35 |
Notes to Financial Statements (continued)
6. Capital
The Series offers Class A, Class C, Class Q and Class Z shares. Class A shares are sold with a maximum front-end sales charge of 5.50%. Investors who purchase $1 million or more of Class A shares and sell these shares within 12 months of purchase are subject to a contingent deferred sales charge (“CDSC”) of 1%, although they are not subject to an initial sales charge. The Class A CDSC is waived for certain retirement and/or benefit plans. Class C shares are sold with a CDSC of 1% on sales made within 12 months of purchase. A special exchange privilege is also available for shareholders who qualified to purchase Class A shares at net asset value. Class Q and Class Z shares are not subject to any sales or redemption charge and are offered exclusively for sale to a limited group of investors.
Under certain circumstances, an exchange may be made from specified share classes of the Series to one or more other share classes of the Series as presented in the table of transactions in shares of common stock.
The Fund is authorized to issue 4.8 billion shares of common stock, with a par value of $.01 per share, which is divided into seven series. There are 850 million shares authorized for the Series, divided into six classes, designated Class A, Class C, Class Q, Class Z, Class T and Class R common stock, each of which consists of 40 million, 75 million, 175 million, 175 million, 210 million and 175 million authorized shares, respectively. The Series currently does not have any Class T or Class R shares outstanding.
As of October 31, 2017, Prudential through its affiliate entities, including affiliated funds, owned 1,518,342 shares of Class Q and 1,043,512 shares of Class Z, respectively. At reporting period end, five shareholders of record held 86% of the Series’ outstanding shares, of which 72% were held by affiliates of Prudential.
Transactions in shares of common stock were as follows:
Class A | Shares | Amount | ||||||
Year ended October 31, 2017: | ||||||||
Shares sold | 178,060 | $ | 2,725,886 | |||||
Shares reacquired | (71,108 | ) | (952,807 | ) | ||||
|
|
|
| |||||
Net increase (decrease) in shares outstanding before conversion | 106,952 | 1,773,079 | ||||||
Shares reacquired upon conversion into other share class(es) | (32,857 | ) | (412,542 | ) | ||||
|
|
|
| |||||
Net increase (decrease) in shares outstanding | 74,095 | $ | 1,360,537 | |||||
|
|
|
| |||||
Year ended October 31, 2016: | ||||||||
Shares sold | 70,653 | $ | 882,511 | |||||
Shares reacquired | (143,364 | ) | (1,778,347 | ) | ||||
|
|
|
| |||||
Net increase (decrease) in shares outstanding before conversion | (72,711 | ) | (895,836 | ) | ||||
Shares reacquired upon conversion into other share class(es) | (9,512 | ) | (120,888 | ) | ||||
|
|
|
| |||||
Net increase (decrease) in shares outstanding | (82,223 | ) | $ | (1,016,724 | ) | |||
|
|
|
| |||||
| 36 |
Class C | Shares | Amount | ||||||
Year ended October 31, 2017: | ||||||||
Shares sold | 65,162 | $ | 925,090 | |||||
Shares reacquired† | (23,164 | ) | (312,798 | ) | ||||
|
|
|
| |||||
Net increase (decrease) in shares outstanding | 41,998 | $ | 612,292 | |||||
|
|
|
| |||||
Year ended October 31, 2016: | ||||||||
Shares sold | 20,106 | $ | 248,644 | |||||
Shares reacquired | (50,156 | ) | (613,645 | ) | ||||
|
|
|
| |||||
Net increase (decrease) in shares outstanding | (30,050 | ) | $ | (365,001 | ) | |||
|
|
|
| |||||
Class Q | ||||||||
Year ended October 31, 2017: | ||||||||
Shares sold | 252,504 | $ | 3,192,000 | |||||
Shares issued in reinvestment of dividends and distributions | 6,044 | 71,620 | ||||||
Shares reacquired† | (585,779 | ) | (8,482,097 | ) | ||||
|
|
|
| |||||
Net increase (decrease) in shares outstanding | (327,231 | ) | $ | (5,218,477 | ) | |||
|
|
|
| |||||
Period ended October 31, 2016*: | ||||||||
Shares sold | 269,177 | $ | 3,275,000 | |||||
Shares reacquired | (340,747 | ) | (4,355,000 | ) | ||||
|
|
|
| |||||
Net increase (decrease) in shares outstanding before conversion | (71,570 | ) | (1,080,000 | ) | ||||
Shares issued upon conversion from other share class(es) | 1,917,143 | 25,402,138 | ||||||
|
|
|
| |||||
Net increase (decrease) in shares outstanding | 1,845,573 | $ | 24,322,138 | |||||
|
|
|
| |||||
Class Z | ||||||||
Year ended October 31, 2017: | ||||||||
Shares sold | 317,602 | $ | 4,781,956 | |||||
Shares issued in reinvestment of dividends and distributions | 3,504 | 41,518 | ||||||
Shares reacquired | (192,382 | ) | (2,704,237 | ) | ||||
|
|
|
| |||||
Net increase (decrease) in shares outstanding before conversion | 128,724 | 2,119,237 | ||||||
Shares issued upon conversion from other share class(es) | 32,543 | 412,542 | ||||||
|
|
|
| |||||
Net increase (decrease) in shares outstanding | 161,267 | $ | 2,531,779 | |||||
|
|
|
| |||||
Year ended October 31, 2016: | ||||||||
Shares sold | 133,459 | $ | 1,674,772 | |||||
Shares reacquired | (224,120 | ) | (2,836,425 | ) | ||||
|
|
|
| |||||
Net increase (decrease) in shares outstanding before conversion | (90,661 | ) | (1,161,653 | ) | ||||
Shares issued upon conversion from other shares class(es) | 9,411 | 120,888 | ||||||
Shares reacquired upon conversion into other share class(es) | (1,917,143 | ) | (25,402,138 | ) | ||||
|
|
|
| |||||
Net increase (decrease) in shares outstanding | (1,998,393 | ) | $ | (26,442,903 | ) | |||
|
|
|
| |||||
| * | Commencement of offering was December 23, 2015. |
| † | Includes affiliated redemption of 1,041 and 757 shares with a value of $15,835 and $12,098 for Class C and Q shares, respectively. |
7. Borrowings
The Fund, on behalf of the Series, along with other affiliated registered investment companies (the “Funds”), is a party to a Syndicated Credit Agreement (“SCA”) with a group of banks. The purpose of the SCA is to provide an alternative source of temporary funding
| Prudential Jennison International Opportunities Fund | 37 |
Notes to Financial Statements (continued)
for capital share redemptions. The SCA provides for a commitment of $900 million for the period October 5, 2017 through October 4, 2018. The Funds pay an annualized commitment fee of .15% of the unused portion of the SCA. The Series’ portion of the commitment fee for the unused amount, allocated based upon a method approved by the Board, is accrued daily and paid quarterly. Prior to October 5, 2017, the Funds had another SCA that provided a commitment of $900 million and the Funds paid an annualized commitment fee of .15% of the unused portion of the SCA. The interest on borrowings under the SCAs is paid monthly and at a per annum interest rate based upon a contractual spread plus the higher of (1) the effective federal funds rate, (2) the 1-month LIBOR rate or (3) zero percent.
Other affiliated registered investment companies that are parties to the SCA include portfolios that are subject to a predetermined mathematical formula used to manage certain benefit guarantees offered under variable annuity contracts. The formula may result in large scale asset flows into and out of these portfolios. Consequently, these portfolios may be more likely to utilize the SCA for purposes of funding redemptions. It may be possible for those portfolios to fully exhaust the committed amount of the SCA, thereby requiring the Manager to allocate available funding per a Board-approved methodology designed to treat the Funds in the SCA equitably.
The Series utilized the SCA during the reporting period ended October 31, 2017. The average daily balance for the 17 days that the Series had loans outstanding during the period was $183,059, borrowed at a weighted average interest rate of 2.36%. The maximum loan balance outstanding during the period was $234,000. At October 31, 2017, the Series did not have an outstanding loan balance.
8. Other
At the Fund’s Board meeting in March 2017, the Board approved a change in the methodology of allocating certain expenses, such as Transfer Agent fees (including sub-transfer agent and networking fees) and Blue Sky fees. PGIM Investments implemented the changes effective November 1, 2017.
At a meeting held on June 7, 2017, the Board of Directors of the Fund approved a plan of reorganization whereby Prudential Jennison International Opportunities Fund would acquire the Target International Equity Portfolio. This reorganization was approved by the shareholders of Target International Equity Portfolio on November 28, 2017 and was completed at the close of business on December 15, 2017.
| 38 |
9. Dividends to Shareholders
Subsequent to the year ended October 31, 2017, the Series declared ordinary income dividends on December 13, 2017 to shareholders of record on December 13, 2017. The ex-date was December 14, 2017. The per share amounts declared were as follows:
| Ordinary Income | ||||
Class Q | $ | 0.03631 | ||
Class Z | $ | 0.03001 | ||
| Prudential Jennison International Opportunities Fund | 39 |
Financial Highlights
| Class A Shares | ||||||||||||||||||||
Year Ended October 31, | ||||||||||||||||||||
| 2017 | 2016 | 2015 | 2014 | 2013 | ||||||||||||||||
| Per Share Operating Performance(a): | ||||||||||||||||||||
| Net Asset Value, Beginning of Year | $12.36 | $13.09 | $13.06 | $13.51 | $11.30 | |||||||||||||||
| Income (loss) from investment operations: | ||||||||||||||||||||
| Net investment income (loss) | (.01 | ) | .02 | (.05 | ) | (.06 | ) | (.01 | ) | |||||||||||
| Net realized and unrealized gain (loss) on investment transactions | 4.75 | (.75 | ) | .08 | .09 | 2.27 | ||||||||||||||
| Total from investment operations | 4.74 | (.73 | ) | .03 | .03 | 2.26 | ||||||||||||||
| Less Dividends and Distributions: | ||||||||||||||||||||
| Dividends from net investment income | - | - | - | - | (.05 | ) | ||||||||||||||
| Distributions from net realized gains | - | - | - | (.48 | ) | - | ||||||||||||||
| Total dividends and distributions | - | - | - | (.48 | ) | (.05 | ) | |||||||||||||
| Net asset value, end of year | $17.10 | $12.36 | $13.09 | $13.06 | $13.51 | |||||||||||||||
| Total Return(b): | 38.35% | (5.58)% | .23% | .20% | 20.04% | |||||||||||||||
| Ratios/Supplemental Data: | ||||||||||||||||||||
| Net assets, end of year (000) | $5,303 | $2,918 | $4,167 | $1,833 | $889 | |||||||||||||||
| Average net assets (000) | $3,121 | $3,575 | $3,179 | $1,467 | $356 | |||||||||||||||
| Ratios to average net assets(c): | ||||||||||||||||||||
| Expenses after waivers and/or expense reimbursement | 1.15% | 1.15% | 1.55% | 1.60% | 1.60% | |||||||||||||||
| Expenses before waivers and/or expense reimbursement | 1.63% | 1.74% | 1.67% | 1.90% | 3.16% | |||||||||||||||
| Net investment income (loss) | (.07)% | .15% | (.39)% | (.48)% | (.08)% | |||||||||||||||
| Portfolio turnover rate | 69% | 65% | 75% | 61% | 86% | |||||||||||||||
| (a) | Calculated based on average shares outstanding during the year. |
| (b) | Total return does not consider the effects of sales loads. Total return is calculated assuming a purchase of a share on the first day and a sale on the last day of each year reported and includes reinvestment of dividends and distributions, if any. Total returns may reflect adjustments to conform to generally accepted accounting principles. |
| (c) | Does not include expenses of the underlying funds in which the Series invests. |
See Notes to Financial Statements.
| 40 |
| Class C Shares | ||||||||||||||||||||
Year Ended October 31, | ||||||||||||||||||||
| 2017 | 2016 | 2015 | 2014 | 2013 | ||||||||||||||||
| Per Share Operating Performance(a): | ||||||||||||||||||||
| Net Asset Value, Beginning of Year | $11.96 | $12.77 | $12.82 | $13.37 | $11.27 | |||||||||||||||
| Income (loss) from investment operations: | ||||||||||||||||||||
| Net investment income (loss) | (.11 | ) | (.08 | ) | (.15 | ) | (.16 | ) | (.14 | ) | ||||||||||
| Net realized and unrealized gain (loss) on investment transactions | 4.58 | (.73 | ) | .10 | .09 | 2.29 | ||||||||||||||
| Total from investment operations | 4.47 | (.81 | ) | (.05 | ) | (.07 | ) | 2.15 | ||||||||||||
| Less Dividends and Distributions: | ||||||||||||||||||||
| Dividends from net investment income | - | - | - | - | (.05 | ) | ||||||||||||||
| Distributions from net realized gains | - | - | - | (.48 | ) | - | ||||||||||||||
| Total dividends and distributions | - | - | - | (.48 | ) | (.05 | ) | |||||||||||||
| Net asset value, end of year | $16.43 | $11.96 | $12.77 | $12.82 | $13.37 | |||||||||||||||
| Total Return(b): | 37.37% | (6.34)% | (.39)% | (.57)% | 19.11% | |||||||||||||||
| Ratios/Supplemental Data: | ||||||||||||||||||||
| Net assets, end of year (000) | $1,759 | $779 | $1,215 | $465 | $181 | |||||||||||||||
| Average net assets (000) | $1,080 | $895 | $903 | $362 | $38 | |||||||||||||||
| Ratios to average net assets(c): | ||||||||||||||||||||
| Expenses after waivers and/or expense reimbursement | 1.89% | 1.90% | 2.30% | 2.35% | 2.35% | |||||||||||||||
| Expenses before waivers and/or expense reimbursement | 2.32% | 2.44% | 2.37% | 2.60% | 4.09% | |||||||||||||||
| Net investment income (loss) | (.80)% | (.67)% | (1.15)% | (1.21)% | (1.12)% | |||||||||||||||
| Portfolio turnover rate | 69% | 65% | 75% | 61% | 86% | |||||||||||||||
| (a) | Calculated based on average shares outstanding during the year. |
| (b) | Total return does not consider the effects of sales loads. Total return is calculated assuming a purchase of a share on the first day and a sale on the last day of each year reported and includes reinvestment of dividends and distributions, if any. Total returns may reflect adjustments to conform to generally accepted accounting principles. |
| (c) | Does not include expenses of the underlying funds in which the Series invests. |
See Notes to Financial Statements.
| Prudential Jennison International Opportunities Fund | 41 |
Financial Highlights (continued)
| Class Q Shares | ||||||||||||
| Year Ended October 31, | December 23, 2015(a) through October 31, | |||||||||||
| 2017 | 2016 | |||||||||||
| Per Share Operating Performance(b): | ||||||||||||
| Net Asset Value, Beginning of Period | $12.50 | $13.25 | ||||||||||
| Income (loss) from investment operations: | ||||||||||||
| Net investment income (loss) | .04 | .06 | ||||||||||
| Net realized and unrealized gain (loss) on investment transactions | 4.79 | (.81 | ) | |||||||||
| Total from investment operations | 4.83 | (.75 | ) | |||||||||
| Less Dividends: | ||||||||||||
| Dividends from net investment income | (.04 | ) | - | |||||||||
| Net asset value, end of period | $17.29 | $12.50 | ||||||||||
| Total Return(c): | 38.75% | (5.66)% | ||||||||||
| Ratios/Supplemental Data: | ||||||||||||
| Net assets, end of period (000) | $26,252 | $23,073 | ||||||||||
| Average net assets (000) | $24,927 | $23,677 | ||||||||||
| Ratios to average net assets(d): | ||||||||||||
| Expenses after waivers and/or expense reimbursement | .84% | .84% | (e) | |||||||||
| Expenses before waivers and/or expense reimbursement | 1.30% | 1.43% | (e) | |||||||||
| Net investment income (loss) | .28% | .60% | (e) | |||||||||
| Portfolio turnover rate | 69% | 65% | ||||||||||
| (a) | Commencement of offering. |
| (b) | Calculated based on average shares outstanding during the period. |
| (c) | Total return is calculated assuming a purchase of a share on the first day and a sale on the last day of each period reported and includes reinvestment of dividends and distributions, if any. Total returns may reflect adjustments to conform to generally accepted accounting principles. Total returns for periods of less than one full year are not annualized. |
| (d) | Does not include expenses of the underlying funds in which the Series invests. |
| (e) | Annualized. |
See Notes to Financial Statements.
| 42 |
| Class Z Shares | ||||||||||||||||||||
Year Ended October 31, | ||||||||||||||||||||
| 2017 | 2016 | 2015 | 2014 | 2013 | ||||||||||||||||
| Per Share Operating Performance(a): | ||||||||||||||||||||
| Net Asset Value, Beginning of Year | $12.50 | $13.20 | $13.13 | $13.55 | $11.32 | |||||||||||||||
| Income (loss) from investment operations: | ||||||||||||||||||||
| Net investment income (loss) | .03 | .03 | (.03 | ) | (.02 | ) | .02 | |||||||||||||
| Net realized and unrealized gain (loss) on investment transactions | 4.79 | (.73 | ) | .10 | .08 | 2.26 | ||||||||||||||
| Total from investment operations | 4.82 | (.70 | ) | .07 | .06 | 2.28 | ||||||||||||||
| Less Dividends and Distributions: | ||||||||||||||||||||
| Dividends from net investment income | (.03 | ) | - | - | - | (.05 | ) | |||||||||||||
| Distributions from net realized gains | - | - | - | (.48 | ) | - | ||||||||||||||
| Total dividends and distributions | (.03 | ) | - | - | (.48 | ) | (.05 | ) | ||||||||||||
| Net asset value, end of year | $17.29 | $12.50 | $13.20 | $13.13 | $13.55 | |||||||||||||||
| Total Return(b): | 38.65% | (5.30)% | .53% | .42% | 20.24% | |||||||||||||||
| Ratios/Supplemental Data: | ||||||||||||||||||||
| Net assets, end of year (000) | $28,612 | $18,667 | $46,105 | $46,996 | $16,487 | |||||||||||||||
| Average net assets (000) | $21,756 | $23,274 | $47,187 | $38,835 | $13,938 | |||||||||||||||
| Ratios to average net assets(c): | ||||||||||||||||||||
| Expenses after waivers and/or expense reimbursement | .89% | .90% | 1.31% | 1.35% | 1.35% | |||||||||||||||
| Expenses before waivers and/or expense reimbursement | 1.34% | 1.41% | 1.40% | 1.54% | 2.73% | |||||||||||||||
| Net investment income (loss) | .23% | .25% | (.19)% | (.13)% | .13% | |||||||||||||||
| Portfolio turnover rate | 69% | 65% | 75% | 61% | 86% | |||||||||||||||
| (a) | Calculated based on average shares outstanding during the year. |
| (b) | Total return is calculated assuming a purchase of a share on the first day and a sale on the last day of each year reported and includes reinvestment of dividends and distributions, if any. Total returns may reflect adjustments to conform to generally accepted accounting principles. |
| (c) | Does not include expenses of the underlying funds in which the Series invests. |
See Notes to Financial Statements.
| Prudential Jennison International Opportunities Fund | 43 |
Report of Independent Registered Public Accounting Firm
The Board of Directors and Shareholders
Prudential World Fund, Inc.:
We have audited the accompanying statement of assets and liabilities of Prudential Jennison International Opportunities Fund (the “Fund”), a series of Prudential World Fund, Inc., including the portfolio of investments, as of October 31, 2017, and the related statement of operations for the year then ended, the statements of changes in net assets for each of the years in the two-year period then ended, and the financial highlights for each of the years or periods in the five-year period then ended. These financial statements and financial highlights are the responsibility of the Fund’s management. Our responsibility is to express an opinion on these financial statements and financial highlights based on our audits.
We conducted our audits in accordance with the standards of the Public Company Accounting Oversight Board (United States). Those standards require that we plan and perform the audit to obtain reasonable assurance about whether the financial statements and financial highlights are free of material misstatement. An audit includes examining, on a test basis, evidence supporting the amounts and disclosures in the financial statements. Our procedures included confirmation of securities owned as of October 31, 2017, by correspondence with the custodian, transfer agent and brokers or by other appropriate auditing procedures when replies from brokers were not received. An audit also includes assessing the accounting principles used and significant estimates made by management, as well as evaluating the overall financial statement presentation. We believe that our audits provide a reasonable basis for our opinion.
In our opinion, the financial statements and financial highlights referred to above present fairly, in all material respects, the financial position of the Fund as of October 31, 2017, and the results of its operations for the year then ended, the changes in its net assets for each of the years in the two-year period then ended, and the financial highlights for each of the years or periods in the five-year period then ended, in conformity with U.S. generally accepted accounting principles.

New York, New York
December 15, 2017
| 44 |
Federal Income Tax Information (unaudited)
For the fiscal year ended October 31, 2017, the Series made an election to pass through the maximum amount of the portion of the ordinary income dividends paid derived from foreign source income as well as any foreign taxes paid by the Series in accordance with Section 853 of the Internal Revenue Code of the following amounts: $34,050 foreign tax credit from recognized foreign source income of $562,480.
For the fiscal year ended October 31, 2017, the Series reports the maximum amount allowable under Section 854 of the Internal Revenue Code, but not less than, the following percentages of the ordinary income dividends paid as 1) qualified dividend income (QDI); 2) eligible for corporate dividend received deduction (DRD):
| QDI | DRD | |||||||
Prudential Jennison International Opportunities Fund | 100.00 | % | 5.14 | % | ||||
In January 2018, you will be advised on IRS Form 1099-DIV or substitute 1099-DIV as to the federal tax status of dividends received by you in calendar year 2017.
| Prudential Jennison International Opportunities Fund | 45 |
INFORMATION ABOUT BOARD MEMBERS AND OFFICERS
(Unaudited)
Information about Board Members and Officers of the Fund is set forth below. Board Members who are not deemed to be “interested persons” of the Fund, as defined in the 1940 Act, are referred to as “Independent Board Members.” Board Members who are deemed to be “interested persons” of the Fund are referred to as “Interested Board Members.” The Board Members are responsible for the overall supervision of the operations of the Fund and perform the various duties imposed on the directors of investment companies by the 1940 Act. The Board in turn elects the Officers, who are responsible for administering the day-to-day operations of the Fund.
| Independent Board Members(1) | ||||
| Name, Address, Age Position(s) Portfolios Overseen | Principal Occupation(s) During Past Five Years | Other Directorships Held During Past Five Years | ||
Ellen S. Alberding (59) Board Member Portfolios Overseen: 89 | President and Board Member, The Joyce Foundation (charitable foundation) (since 2002); Vice Chair, City Colleges of Chicago (community college system) (since 2011); Trustee, Skills for America’s Future (national initiative to connect employers to community colleges) (since 2011); Trustee, National Park Foundation (charitable foundation for national park system) (since 2009); Trustee, Economic Club of Chicago (since 2009). | None. | ||
Kevin J. Bannon (65) Board Member Portfolios Overseen: 89 | Retired; Managing Director (April 2008-May 2015) and Chief Investment Officer (October 2008-November 2013) of Highmount Capital LLC (registered investment adviser); formerly Executive Vice President and Chief Investment Officer (April 1993-August 2007) of Bank of New York Company; President (May 2003-May 2007) of BNY Hamilton Family of Mutual Funds. | Director of Urstadt Biddle Properties (equity real estate investment trust) (since September 2008). | ||
Linda W. Bynoe (65) Board Member Portfolios Overseen: 89 | President and Chief Executive Officer (since March 1995) and formerly Chief Operating Officer (December 1989-February 1995) of Telemat Ltd. (management consulting); formerly Vice President (January 1985-June 1989) at Morgan Stanley & Co. (broker-dealer). | Director of Simon Property Group, Inc. (retail real estate) (May 2003-May 2012); Director of Anixter International, Inc. (communication products distributor) (since January 2006); Director of Northern Trust Corporation (financial services) (since April 2006); Trustee of Equity Residential (residential real estate) (since December 2009). | ||
Prudential Jennison International Opportunities Fund
| Independent Board Members(1) | ||||
| Name, Address, Age Position(s) Portfolios Overseen | Principal Occupation(s) During Past Five Years | Other Directorships Held During Past Five Years | ||
Barry H. Evans (57)± Board Member Portfolios Overseen: 89 | Retired; Formerly President (2005-2016), Global Chief Operating Officer (2014-2016), Chief Investment Officer-Global Head of Fixed Income (1998-2014), and various portfolio manager roles (1986-2006), Manulife Asset Management U.S. | Director, Manulife Trust Company (2011-present); Director, Manulife Asset Management Limited (2015-present); Formerly Chairman of the Board of Directors of Manulife Asset Management U.S. (2005-2016); Formerly Chairman of the Board, Declaration Investment Management and Research (2008-2016). | ||
Keith F. Hartstein (61) Board Member & Portfolios Overseen: 89 | Retired; Member (since November 2014) of the Governing Council of the Independent Directors Council (organization of independent mutual fund directors); formerly President and Chief Executive Officer (2005-2012), Senior Vice President (2004-2005), Senior Vice President of Sales and Marketing (1997-2004), and various executive management positions (1990-1997), John Hancock Funds, LLC (asset management); Chairman, Investment Company Institute’s Sales Force Marketing Committee (2003-2008). | None. | ||
Laurie Simon Hodrick (55)± Board Member Portfolios Overseen: 89 | A. Barton Hepburn Professor of Economics in the Faculty of Business, Columbia Business School (since 1996); Visiting Professor of Law and Rock Center for Corporate Governance Fellow, Stanford Law School (since 2015); Visiting Fellow, Hoover Institution, Stanford University (since 2015); Sole Member, ReidCourt LLC (since 2008) (a consulting firm); Formerly Managing Director, Global Head of Alternative Investment Strategies, Deutsche Bank (2006-2008); Formerly Director/Trustee, Merrill Lynch Investment Managers Funds (1999-2006). | Independent Director, Corporate Capital Trust (since April 2017) (a business development company). | ||
Michael S. Hyland, CFA (72) Board Member Portfolios Overseen: 89 | Retired (since February 2005); formerly Senior Managing Director (July 2001-February 2005) of Bear Stearns & Co, Inc.; Global Partner, INVESCO (1999-2001); Managing Director and President of Salomon Brothers Asset Management (1989-1999). | None. | ||
Visit our website at pgiminvestments.com
| Independent Board Members(1) | ||||
| Name, Address, Age Position(s) Portfolios Overseen | Principal Occupation(s) During Past Five Years | Other Directorships Held During Past Five Years | ||
Richard A. Redeker (74) Board Member & Portfolios Overseen: 87 | Retired Mutual Fund Senior Executive (47 years); Management Consultant; Director, Mutual Fund Directors Forum (since 2014); Independent Directors Council (organization of independent mutual fund directors)-Executive Committee, Chair of Policy Steering Committee, Governing Council. | None. | ||
Stephen G. Stoneburn (74) Board Member Portfolios Overseen: 89 | Chairman (since July 2011), President and Chief Executive Officer (since June 1996) of Frontline Medical Communications (publishing company); formerly President (June 1995-June 1996) of Argus Integrated Media, Inc.; Senior Vice President and Managing Director (January 1993-1995) of Cowles Business Media; Senior Vice President of Fairchild Publications, Inc. (1975-1989). | None. | ||
± Mr. Evans and Ms. Hodrick joined the Board effective as of September 1, 2017.
| Interested Board Members(1) | ||||
| Name, Address, Age Position(s) Portfolios Overseen | Principal Occupation(s) During Past Five Years | Other Directorships Held During Past Five Years | ||
Stuart S. Parker (55) Board Member & President Portfolios Overseen: 89 | President of PGIM Investments LLC (formerly known as Prudential Investments LLC) (since January 2012); Executive Vice President of Prudential Investment Management Services LLC (since December 2012); Executive Vice President of Jennison Associates LLC and Head of Retail Distribution of PGIM Investments LLC (June 2005-December 2011). | None. | ||
Prudential Jennison International Opportunities Fund
| Interested Board Members(1) | ||||
| Name, Address, Age Position(s) Portfolios Overseen | Principal Occupation(s) During Past Five Years | Other Directorships Held During Past Five Years | ||
Scott E. Benjamin (44) Board Member & Vice President Portfolios Overseen: 89 | Executive Vice President (since June 2009) of PGIM Investments LLC; Executive Vice President (June 2009-June 2012) and Vice President (since June 2012) of Prudential Investment Management Services LLC; Executive Vice President (since September 2009) of AST Investment Services, Inc.; Senior Vice President of Product Development and Marketing, PGIM Investments (since February 2006); Vice President of Product Development and Product Management, Prudential Investments (2003-2006). | None. | ||
Grace C. Torres* (58) Board Member Portfolios Overseen: 88 | Retired; formerly Treasurer and Principal Financial and Accounting Officer of the Prudential Funds, Target Funds, Advanced Series Trust, Prudential Variable Contract Accounts and The Prudential Series Fund (1998-June 2014); Assistant Treasurer (March 1999-June 2014) and Senior Vice President (September 1999-June 2014) of PGIM Investments LLC; Assistant Treasurer (May 2003-June 2014) and Vice President (June 2005-June 2014) of AST Investment Services, Inc.; Senior Vice President and Assistant Treasurer (May 2003-June 2014) of Prudential Annuities Advisory Services, Inc. | Director (since July 2015) of Sun Bancorp, Inc. N.A. and Sun National Bank | ||
* Note: Prior to her retirement in 2014, Ms. Torres was employed by PGIM Investments LLC. Due to her prior employment, she is considered to be an “interested person” under the 1940 Act. Ms. Torres is a Non-Management Interested Board Member.
(1) The year that each Board Member joined the Board is as follows:
Ellen S. Alberding; 2013; Kevin J. Bannon, 2008; Linda W. Bynoe, 2005; Barry H. Evans, 2017; Keith F. Hartstein, 2013; Laurie Simon Hodrick, 2017; Michael S. Hyland, 2008; Richard A. Redeker, 2003; Stephen G. Stoneburn, 1996; Grace C. Torres, 2014; Stuart S. Parker, Board Member and President since 2012; Scott E. Benjamin, Board Member since 2010 and Vice President since 2009.
Visit our website at pgiminvestments.com
| Fund Officers(a) | ||||
| Name, Address and Age Position with Fund | Principal Occupation(s) During Past Five Years | Length of Service as Fund Officer | ||
Raymond A. O’Hara (62) Chief Legal Officer | Vice President and Corporate Counsel (since July 2010) of Prudential Insurance Company of America (Prudential); Vice President (March 2011-Present) of Pruco Life Insurance Company and Pruco Life Insurance Company of New Jersey; Vice President and Corporate Counsel (March 2011-Present) of Prudential Annuities Life Assurance Corporation; Chief Legal Officer of PGIM Investments LLC (since June 2012); Chief Legal Officer of Prudential Mutual Fund Services LLC (since June 2012) and Corporate Counsel of AST Investment Services, Inc. (since June 2012); formerly Assistant Vice President and Corporate Counsel (September 2008-July 2010) of The Hartford Financial Services Group, Inc.; formerly Associate (September 1980-December 1987) and Partner (January 1988-August 2008) of Blazzard & Hasenauer, P.C. (formerly, Blazzard, Grodd & Hasenauer, P.C.). | Since 2012 | ||
Chad A. Earnst (42) Chief Compliance Officer | Chief Compliance Officer (September 2014-Present) of PGIM Investments LLC; Chief Compliance Officer (September 2014-Present) of the Prudential Funds, Target Funds, Advanced Series Trust, The Prudential Series Fund, Prudential’s Gibraltar Fund, Inc., Prudential Global Short Duration High Yield Income Fund, Inc., Prudential Short Duration High Yield Fund, Inc. and Prudential Jennison MLP Income Fund, Inc.; formerly Assistant Director (March 2010-August 2014) of the Asset Management Unit, Division of Enforcement, US Securities & Exchange Commission; Assistant Regional Director (January 2010-August 2014), Branch Chief (June 2006-December 2009) and Senior Counsel (April 2003-May 2006) of the Miami Regional Office, Division of Enforcement, US Securities & Exchange Commission. | Since 2014 | ||
Deborah A. Docs (59) Secretary | Vice President and Corporate Counsel (since January 2001) of Prudential; Vice President (since December 1996) and Assistant Secretary (since March 1999) of PGIM Investments LLC; formerly Vice President and Assistant Secretary (May 2003-June 2005) of AST Investment Services, Inc. | Since 2004 | ||
Jonathan D. Shain (59) Assistant Secretary | Vice President and Corporate Counsel (since August 1998) of Prudential; Vice President and Assistant Secretary (since May 2001) of PGIM Investments LLC; Vice President and Assistant Secretary (since February 2001) of Prudential Mutual Fund Services LLC; formerly Vice President and Assistant Secretary (May 2003-June 2005) of AST Investment Services, Inc. | Since 2005 | ||
Claudia DiGiacomo (43) Assistant Secretary | Vice President and Corporate Counsel (since January 2005) of Prudential; Vice President and Assistant Secretary of PGIM Investments LLC (since December 2005); Associate at Sidley Austin Brown & Wood LLP (1999-2004). | Since 2005 | ||
Prudential Jennison International Opportunities Fund
| Fund Officers(a) | ||||
| Name, Address and Age Position with Fund | Principal Occupation(s) During Past Five Years | Length of Service as Fund Officer | ||
Andrew R. French (54) Assistant Secretary | Vice President and Corporate Counsel (since February 2010) of Prudential; formerly Director and Corporate Counsel (2006-2010) of Prudential; Vice President and Assistant Secretary (since January 2007) of PGIM Investments LLC; Vice President and Assistant Secretary (since January 2007) of Prudential Mutual Fund Services LLC. | Since 2006 | ||
Charles H. Smith (44) Anti-Money Laundering Compliance Officer | Vice President, Corporate Compliance, Anti-Money Laundering Unit (since January 2015) of Prudential; committee member of the American Council of Life Insurers Anti-Money Laundering and Critical Infrastructure Committee (since January 2016); formerly Global Head of Economic Sanctions Compliance at AIG Property Casualty (February 2007 – December 2014); Assistant Attorney General at the New York State Attorney General’s Office, Division of Public Advocacy. (August 1998-January 2007). | Since 2016 | ||
M. Sadiq Peshimam (53) Treasurer and Principal Financial and Accounting Officer | Vice President (since 2005) of PGIM Investments LLC; formerly Assistant Treasurer of funds in the Prudential Mutual Fund Complex (2006-2014). | Since 2006 | ||
Peter Parrella (59) Assistant Treasurer | Vice President (since 2007) and Director (2004-2007) within Prudential Mutual Fund Administration; formerly Tax Manager at SSB Citi Fund Management LLC (1997-2004). | Since 2007 | ||
Lana Lomuti (50) Assistant Treasurer | Vice President (since 2007) and Director (2005-2007), within Prudential Mutual Fund Administration; formerly Assistant Treasurer (December 2007-February 2014) of The Greater China Fund, Inc. | Since 2014 | ||
Linda McMullin (56) Assistant Treasurer | Vice President (since 2011) and Director (2008-2011) within Prudential Mutual Fund Administration. | Since 2014 | ||
Kelly A. Coyne (49) Assistant Treasurer | Director, Investment Operations of Prudential Mutual Fund Services LLC (since 2010). | Since 2015 | ||
(a) Excludes Mr. Parker and Mr. Benjamin, interested Board Members who also serve as President and Vice President, respectively.
Explanatory Notes to Tables:
| ∎ | Board Members are deemed to be “Interested,” as defined in the 1940 Act, by reason of their affiliation with PGIM Investments LLC and/or an affiliate of PGIM Investments LLC. |
| ∎ | Unless otherwise noted, the address of all Board Members and Officers is c/o PGIM Investments LLC, 655 Broad Street, Newark, New Jersey 07102-4410. |
| ∎ | There is no set term of office for Board Members or Officers. The Board Members have adopted a retirement policy, which calls for the retirement of Board Members on December 31 of the year in which they reach the age of 75. |
| ∎ | “Other Directorships Held” includes only directorships of companies required to register or file reports with the SEC under the 1934 Act (that is, “public companies”) or other investment companies registered under the 1940 Act. |
| ∎ | “Portfolios Overseen” includes all investment companies managed by PGIM Investments LLC. The investment companies for which PGIM Investments LLC serves as manager include the Prudential Mutual Funds, The Prudential Variable Contract Accounts, Target Mutual Funds, Prudential Short Duration High Yield Fund, Inc., Prudential Global Short Duration High Yield Fund, Inc., The Prudential Series Fund, Prudential’s Gibraltar Fund, Inc. and the Advanced Series Trust. |
Visit our website at pgiminvestments.com
Approval of Advisory Agreements
The Fund’s Board of Directors
The Board of Directors (the “Board”) of Prudential Jennison International Opportunities Fund (the “Fund”)1 consists of twelve individuals, nine of whom are not “interested persons” of the Fund, as defined in the Investment Company Act of 1940, as amended (the “1940 Act”) (the “Independent Directors”). The Board is responsible for the oversight of the Fund and its operations, and performs the various duties imposed on the directors of investment companies by the 1940 Act. The Independent Directors have retained independent legal counsel to assist them in connection with their duties. The Chair of the Board is an Independent Director. The Board has established four standing committees: the Audit Committee, the Nominating and Governance Committee, and two Investment Committees. Each committee is chaired by, and composed of, Independent Directors.
Annual Approval of the Fund’s Advisory Agreements
As required under the 1940 Act, the Board determines annually whether to renew the Fund’s management agreement with PGIM Investments LLC (“PGIM Investments”) and the Fund’s subadvisory agreement with Jennison Associates LLC (“Jennison”). In considering the renewal of the agreements, the Board, including all of the Independent Directors,2 met on June 6-8, 2017 and approved the renewal of the agreements through July 31, 2018, after concluding that the renewal of the agreements was in the best interests of the Fund and its shareholders.
In advance of the meetings, the Board requested and received materials relating to the agreements, and had the opportunity to ask questions and request further information in connection with its consideration. Among other things, the Board considered comparative fee information from PGIM Investments and Jennison. Also, the Board considered comparisons with other mutual funds in relevant Peer Universes and Peer Groups, as is further discussed below.
In approving the agreements, the Board, including the Independent Directors advised by independent legal counsel, considered the factors it deemed relevant, including the nature, quality and extent of services provided by PGIM Investments and the subadviser, the performance of the Fund, the profitability of PGIM Investments and its affiliates, expenses and fees, and the potential for economies of scale that may be shared with the Fund and its shareholders as the Fund’s assets grow. In their deliberations, the Directors did not identify any single factor which alone was responsible for the Board’s decision to approve the agreements with respect to the Fund. In connection with its deliberations, the Board considered information provided by PGIM Investments throughout the year at regular Board meetings, presentations from portfolio managers and other information, as well as information furnished at or in advance of the meetings on June 6-8, 2017.
| 1 | Prudential Jennison International Opportunities Fund is a series of Prudential World Fund, Inc. |
| 2 | Barry H. Evans and Laurie Simon Hodrick joined the Board effective as of September 1, 2017. Neither Mr. Evans nor Ms. Hodrick participated in the consideration of the renewal of the advisory agreements. |
| Prudential Jennison International Opportunities Fund | ||
Approval of Advisory Agreements (continued)
The Directors determined that the overall arrangements between the Fund and PGIM Investments, which serves as the Fund’s investment manager pursuant to a management agreement, and between PGIM Investments and Jennison, which serves as the Fund’s subadviser pursuant to the terms of a subadvisory agreement with PGIM Investments, are in the best interests of the Fund and its shareholders in light of the services performed, fees charged and such other matters as the Directors considered relevant in the exercise of their business judgment.
The material factors and conclusions that formed the basis for the Directors’ reaching their determinations to approve the continuance of the agreements are separately discussed below.
Nature, Quality and Extent of Services
The Board received and considered information regarding the nature, quality and extent of services provided to the Fund by PGIM Investments and Jennison. The Board considered the services provided by PGIM Investments, including but not limited to the oversight of the subadviser for the Fund, as well as the provision of fund recordkeeping, compliance, and other services to the Fund. With respect to PGIM Investments’ oversight of the subadviser, the Board noted that PGIM Investments’ Strategic Investment Research Group (“SIRG”), which is a business unit of PGIM Investments, is responsible for monitoring and reporting to PGIM Investments’ senior management on the performance and operations of the subadviser. The Board also considered that PGIM Investments pays the salaries of all of the officers and interested Directors of the Fund who are part of Fund management. The Board also considered the investment subadvisory services provided by Jennison, as well as adherence to the Fund’s investment restrictions and compliance with applicable Fund policies and procedures. The Board considered PGIM Investments’ evaluation of the subadviser, as well as PGIM Investments’ recommendation, based on its review of the subadviser, to renew the subadvisory agreement.
The Board considered the qualifications, backgrounds and responsibilities of PGIM Investments’ senior management responsible for the oversight of the Fund and Jennison, and also considered the qualifications, backgrounds and responsibilities of Jennison’s portfolio managers who are responsible for the day-to-day management of the Fund’s portfolio. The Board was provided with information pertaining to PGIM Investments’ and Jennison’s organizational structure, senior management, investment operations, and other relevant information pertaining to both PGIM Investments and Jennison. The Board also
noted that it received favorable compliance reports from the Fund’s Chief Compliance Officer (“CCO”) as to both PGIM Investments and Jennison. The Board noted that Jennison is affiliated with PGIM Investments.
| Visit our website at pgiminvestments.com |
The Board concluded that it was satisfied with the nature, extent and quality of the investment management services provided by PGIM Investments and the subadvisory services provided to the Fund by Jennison, and that there was a reasonable basis on which to conclude that the Fund benefits from the services provided by PGIM Investments and Jennison under the management and subadvisory agreements.
Costs of Services and Profits Realized by PGIM Investments
The Board was provided with information on the profitability of PGIM Investments and its affiliates in serving as the Fund’s investment manager. The Board discussed with PGIM Investments the methodology utilized in assembling the information regarding profitability and considered its reasonableness. The Board recognized that it is difficult to make comparisons of profitability from fund management contracts because comparative information is not generally publicly available and is affected by numerous factors, including the structure of the particular adviser, the types of funds it manages, its business mix, numerous assumptions regarding allocations and the adviser’s capital structure and cost of capital. However, the Board considered that the cost of services provided by PGIM Investments to the Fund during the year ended December 31, 2016 exceeded the management fees paid by the Fund, resulting in an operating loss to PGIM Investments. The Board further noted that the subadviser is affiliated with PGIM Investments and that its profitability is reflected in PGIM Investments’ profitability report. Taking these factors into account, the Board concluded that the profitability of PGIM Investments and its affiliates in relation to the services rendered was not unreasonable.
Economies of Scale
The Board received and discussed information concerning economies of scale that PGIM Investments may realize as the Fund’s assets grow beyond current levels. The Board noted that the management fee schedule for the Fund includes breakpoints, which have the effect of reducing the fee rate as assets increase, but that at its current level of assets the Fund did not realize the effect of their rate reductions. The Board took note that the Fund’s fee structure currently results in benefits to Fund shareholders whether or not PGIM Investments realizes any economies of scale. The Board noted that economies of scale, if any, may be shared with the Fund in several ways, including low management fees from inception, additional technological and personnel investments to enhance shareholder services, and maintaining existing expense structures in the face of a rising cost environment. The Board considered PGIM Investments’ assertion that it continually evaluates the management fee schedule of the Fund and the potential to share economies of scale through breakpoints or fee waivers as asset levels increase.
The Board recognized the inherent limitations of any analysis of economies of scale, stemming largely from the Board’s understanding that most of PGIM Investments’ costs are not specific to individual funds, but rather are incurred across a variety of products and services.
| Prudential Jennison International Opportunities Fund | ||
Approval of Advisory Agreements (continued)
Other Benefits to PGIM Investments and Jennison
The Board considered potential ancillary benefits that might be received by PGIM Investments and Jennison and their affiliates as a result of their relationship with the Fund. The Board concluded that potential benefits to be derived by PGIM Investments included fees received by affiliates of PGIM Investments for serving as the Fund’s securities lending agent, transfer agency fees received by the Fund’s transfer agent (which is affiliated with PGIM Investments), as well as benefits to its reputation or other intangible benefits resulting from PGIM Investments’ association with the Fund. The Board concluded that the potential benefits to be derived by Jennison included the ability to use soft dollar credits, as well as the potential benefits consistent with those generally resulting from an increase in assets under management, specifically, potential access to additional research resources and benefits to its reputation. The Board concluded that the benefits derived by PGIM Investments and Jennison were consistent with the types of benefits generally derived by investment managers and subadvisers to mutual funds.
Performance of the Fund / Fees and Expenses
The Board considered certain additional specific factors and made related conclusions relating to the historical performance of the Fund for the one- and three-year periods ended December 31, 2016.
The Board also considered the Fund’s actual management fee, as well as the Fund’s net total expense ratio, for the fiscal year ended October 31, 2016. The Board considered the management fee for the Fund as compared to the management fee charged by PGIM Investments to other funds and the fee charged by other advisers to comparable mutual funds in a Peer Group. The actual management fee represents the fee rate actually paid by Fund shareholders and includes any fee waivers or reimbursements. The net total expense ratio for the Fund represents the actual expense ratio incurred by Fund shareholders.
The mutual funds included in the Peer Universe (the Lipper International Multi-Cap Growth Funds Performance Universe), which was used to consider performance, and the Peer Group, which was used to consider fees and expenses, were objectively determined by Broadridge, an independent provider of mutual fund data. The comparisons placed the Fund in various quartiles, with the first quartile being the best 25% of the mutual funds (for performance, the best performing mutual funds and, for expenses, the lowest cost mutual funds).
The section below summarizes key factors considered by the Board and the Board’s conclusions regarding the Fund’s performance, fees and overall expenses. The table sets forth gross performance comparisons (which do not reflect the impact on performance of fund expenses, or any subsidies, expense caps or waivers that may be applicable) with the
| Visit our website at pgiminvestments.com |
Peer Universe, actual management fees with the Peer Group (which reflect the impact of any subsidies or fee waivers), and net total expenses with the Peer Group, each of which were key factors considered by the Board.
| Performance | 1 Year | 3 Years | 5 Years | 10 Years | ||||
4th Quartile | 4th Quartile | N/A | N/A | |||||
| Actual Management Fees: 1st Quartile | ||||||||
| Net Total Expenses: 1st Quartile | ||||||||
| • | The Board noted that Fund underperformed its benchmark over all periods. |
| • | The Board also noted PGIM Investments’ assertion that the Fund’s underperformance was partly attributable to the Fund’s growth investment style and larger market capitalization, since value investing and smaller capitalization stocks were favored by the market during 2016, whereas in 2015 the Fund ranked in the first quartile for the one-year period ending December 31, 2015 of its Peer Universe when large capitalization growth stocks outperformed. |
| • | The Board further considered that, when the Board evaluated the Fund’s performance in connection with contract renewals in 2016, the Fund had outperformed its benchmark index for the one- and three-year periods and ranked in the first quartile of its Peer Universe for the one-year period. |
| • | The Board considered that the Fund’s recent performance had improved, with the Fund outperforming its benchmark index by over five percent and ranked in the first quartile of its Peer Universe for the first quarter of 2017. |
| • | The Board and PGIM Investments agreed to continue the existing expense cap, which caps the Fund’s annual operating expenses at 0.84% (exclusive of 12b-1, transfer agent, and certain other fees), through February 28, 2018. |
| • | The Board concluded that, in light of the above, it would be in the best interests of the Fund and its shareholders to continue to monitor performance and to renew the agreements. |
| • | The Board concluded that the management fees (including subadvisory fees) and total expenses were reasonable in light of the services provided. |
* * *
After full consideration of these factors, the Board concluded that the approval of the agreements was in the best interests of the Fund and its shareholders.
| Prudential Jennison International Opportunities Fund | ||
| ∎ TELEPHONE | ∎ WEBSITE | |||
655 Broad Street Newark, NJ 07102 | (800) 225-1852 | www.pgiminvestments.com |
| PROXY VOTING |
| The Board of Directors of the Fund has delegated to the Fund’s investment subadviser the responsibility for voting any proxies and maintaining proxy recordkeeping with respect to the Fund. A description of these proxy voting policies and procedures is available without charge, upon request, by calling (800) 225-1852. Information regarding how the Fund voted proxies relating to portfolio securities during the most recent 12-month period ended June 30 is available on the Fund’s website and on the Securities and Exchange Commission’s website. |
| DIRECTORS |
| Ellen S. Alberding • Kevin J. Bannon • Scott E. Benjamin • Linda W. Bynoe • Barry H. Evans • Keith F. Hartstein • Laurie Simon Hodrick • Michael S. Hyland • Stuart S. Parker • Richard A. Redeker • Stephen G. Stoneburn • Grace C. Torres |
| OFFICERS |
| Stuart S. Parker, President • Scott E. Benjamin, Vice President • M. Sadiq Peshimam, Treasurer and Principal Financial and Accounting Officer • Raymond A. O’Hara, Chief Legal Officer • Deborah A. Docs, Secretary • Chad A. Earnst, Chief Compliance Officer • Charles H. Smith, Anti-Money Laundering Compliance Officer • Jonathan D. Shain, Assistant Secretary • Claudia DiGiacomo, Assistant Secretary • Andrew R. French, Assistant Secretary • Peter Parrella, Assistant Treasurer • Lana Lomuti, Assistant Treasurer • Linda McMullin, Assistant Treasurer • Kelly A. Coyne, Assistant Treasurer |
| MANAGER | PGIM Investments LLC | 655 Broad Street Newark, NJ 07102 | ||
| ||||
| INVESTMENT SUBADVISER | Jennison Associates LLC | 466 Lexington Avenue New York, NY 10017 | ||
| ||||
| DISTRIBUTOR | Prudential Investment Management Services LLC | 655 Broad Street Newark, NJ 07102 | ||
| ||||
| CUSTODIAN | The Bank of New York Mellon | 225 Liberty Street New York, NY 10286 | ||
| ||||
| TRANSFER AGENT | Prudential Mutual Fund Services LLC | PO Box 9658 Providence, RI 02940 | ||
| ||||
| INDEPENDENT REGISTERED PUBLIC ACCOUNTING FIRM | KPMG LLP | 345 Park Avenue New York, NY 10154 | ||
| ||||
| FUND COUNSEL | Willkie Farr & Gallagher LLP | 787 Seventh Avenue New York, NY 10019 | ||
| ||||
| An investor should consider the investment objectives, risks, charges, and expenses of the Fund carefully before investing. The prospectus and summary prospectus contain this and other information about the Fund. An investor may obtain a prospectus and summary prospectus by visiting our website at www.pgiminvestments.com or by calling (800) 225-1852. The prospectus and summary prospectus should be read carefully before investing. |
| E-DELIVERY |
| To receive your mutual fund documents online, go to www.pgiminvestments.com/edelivery and enroll. Instead of receiving printed documents by mail, you will receive notification via email when new materials are available. You can cancel your enrollment or change your email address at any time by visiting the website address above. |
| SHAREHOLDER COMMUNICATIONS WITH DIRECTORS |
| Shareholders can communicate directly with the Board of Directors by writing to the Chair of the Board, Prudential Jennison International Opportunities Fund, PGIM Investments, Attn: Board of Directors, 655 Broad Street, Newark, NJ 07102. Shareholders can communicate directly with an individual Director by writing to the same address. Communications are not screened before being delivered to the addressee. |
| AVAILABILITY OF PORTFOLIO SCHEDULE |
| The Fund files its complete schedule of portfolio holdings with the Securities and Exchange Commission for the first and third quarters of each fiscal year on Form N-Q. The Fund’s Forms N-Q are available on the Commission’s website at www.sec.gov. The Fund’s Forms N-Q may also be reviewed and copied at the Commission’s Public Reference Room in Washington, D.C. Information on the operation and location of the Public Reference Room may be obtained by calling 1-800-SEC-0330. The Fund’s schedule of portfolio holdings is also available on the Fund’s website as of the end of each month no sooner than 15 days after the end of the month. |
| The Fund’s Statement of Additional Information contains additional information about the Fund’s Directors and is available without charge, upon request, by calling (800) 225-1852. |
Mutual Funds:
| ARE NOT INSURED BY THE FDIC OR ANY FEDERAL GOVERNMENT AGENCY | MAY LOSE VALUE | ARE NOT A DEPOSIT OF OR GUARANTEED BY ANY BANK OR ANY BANK AFFILIATE |
PRUDENTIAL JENNISON INTERNATIONAL OPPORTUNITIES FUND
| SHARE CLASS | A | C | Q | Z | ||||
| NASDAQ | PWJAX | PWJCX | PWJQX | PWJZX | ||||
| CUSIP | 743969677 | 743969669 | 743969586 | 743969651 |
MF215E

PRUDENTIAL JENNISON GLOBAL INFRASTRUCTURE FUND
ANNUAL REPORT
OCTOBER 31, 2017

To enroll in e-delivery, go to pgiminvestments.com/edelivery
| Objective: Total return |
Highlights
| • | Industrials and construction & engineering holdings were among the main contributors to performance during the period. Positions within the airport services segment also helped. |
| • | Conversely, multi-utilities and integrated telecommunication services holdings were the primary detractors from performance during the period. |
This report is not authorized for distribution to prospective investors unless preceded or accompanied by a current prospectus.
The views expressed in this report and information about the Fund’s portfolio holdings are for the period covered by this report and are subject to change thereafter.
Mutual funds are distributed by Prudential Investment Management Services LLC, member SIPC. Jennison Associates LLC is a registered investment adviser. Both are Prudential Financial companies. © 2017 Prudential Financial, Inc. and its related entities. Jennison Associates, Jennison, PGIM, and the PGIM logo are service marks of Prudential Financial, Inc. and its related entities, registered in many jurisdictions worldwide.
| 2 | Visit our website at pgiminvestments.com |
PRUDENTIAL FUNDS — UPDATE
The Board of Directors/Trustees for the Fund has approved renaming the Fund’s Class Q shares as Class R6 shares, effective on or about June 15, 2018. The renaming of Class Q shares as Class R6 shares will not result in any changes to pricing, eligibility, or shareholder rights and obligations. The renamed Class R6 shares will not be exchangeable with Class R6 shares of the Prudential Day One Funds or the Prudential 60/40 Allocation Fund.
LR993
| Prudential Jennison Global Infrastructure Fund | 3 |
PRUDENTIAL FUNDS — UPDATE
Effective on or about June 1, 2018 (the “Effective Date”), the Fund’s Class A, Class C, Class R, and Class Z shares, as applicable, will be closed to investments by new group retirement plans, except as discussed below. Existing group retirement plans as of the Effective Date may keep their investments in their current share class and may continue to make additional purchases or exchanges of that class of shares. As of the Effective Date, all new group retirement plans wishing to add the Fund as a new addition to the plan generally will be into one of the available Class Q shares, Class R2 shares, or Class R4 shares of the Fund.
In addition, on or about the Effective Date, the Class R shares of the Fund will be closed to all new investors, except as discussed below. Due to the closing of the Class R shares to new investors, effective on or about the Effective Date new IRA investors may only purchase Class A, Class C, Class Z, or Class Q shares of the Fund, subject to share class eligibility. Following the Effective Date, no new accounts may be established in the Fund’s Class R shares and no Class R shares may be purchased or acquired by any new Class R shareholder, except as discussed below.
| Class A | Class C | Class Z | Class R | |||||
Existing Investors (Group Retirement Plans, IRAs, and all other investors) | No Change | No Change | No Change | No Change | ||||
| New Group Retirement Plans | Closed to group retirement plans wishing to add the share classes as new additions to plan menus on or about June 1, 2018, subject to certain exceptions below | |||||||
New IRAs | No Change | No Change | No Change | Closed to all new investors on or about June 1, 2018, subject to certain exceptions below | ||||
| All Other New Investors | No Change | No Change | No Change | |||||
| 4 | Visit our website at pgiminvestments.com |
However, the following new investors may continue to purchase Class A, Class C, Class R, and Class Z shares of the Fund, as applicable:
| • | Eligible group retirement plans who are exercising their one-time 90-day repurchase privilege in the Fund will be permitted to purchase such share classes. |
| • | Plan participants in a group retirement plan that offers Class A, Class C, Class R, or Class Z shares of the Fund as of the Effective Date will be permitted to purchase such share classes of the Fund, even if the plan participant did not own shares of that class of the Fund as of the Effective Date. |
| • | Certain new group retirement plans will be permitted to offer such share classes of the Fund after the Effective Date, provided that the plan has or is actively negotiating a contractual agreement with the Fund’s distributor or service provider to offer such share classes of the Fund prior to or on the Effective Date. |
| • | New group retirement plans that combine with, replace, or are otherwise affiliated with a current plan that invests in such share classes prior to or on the Effective Date will be permitted to purchase such share classes. |
The Fund also reserves the right to refuse any purchase order that might disrupt management of the Fund or to otherwise modify the closure policy at any time on a case-by-case basis.
| Prudential Jennison Global Infrastructure Fund | 5 |
This Page Intentionally Left Blank
| 6 | Visit our website at pgiminvestments.com |
Letter from the President

Dear Shareholder:
We hope you find the annual report for the Prudential Jennison Global Infrastructure Fund informative and useful. The report covers performance for the 12-month period ended October 31, 2017.
Significant events during the reporting period included a new US president, followed by uncertainty in Congress over implementing the Trump administration’s policy initiatives. Elsewhere, Britain began its formal legal process to leave the European Union. France elected a more centrist president, which was viewed as a pro-euro referendum. North Korea’s missile launches escalated geopolitical tensions. Also, late in the period, a series of hurricanes caused damage in the US and the Caribbean.
Despite some turbulence in the macro-environment, solid economic fundamentals in the US economy included moderate gross domestic product expansion, robust employment, and accelerating corporate profit growth. Inflation remained tame. The Federal Reserve raised its federal funds rate twice in 2017, and is in the process of winding down its stimulus program.
Global economic growth remained mostly positive. Equities in the US reached new highs amid low volatility, while international equities posted strong gains. European stocks continued to gain. Asian markets were solid, and emerging markets outperformed most regions. Fixed income markets were mixed. High yield and emerging markets bonds were the top performers.
Given the uncertainty in today’s investment environment, we believe that active professional portfolio management offers a potential advantage. Active managers often have the knowledge and flexibility to find the best investment opportunities in the most challenging markets.
Even so, it’s best if investment decisions are based on your long-term goals rather than on short-term market and economic developments. We also encourage you to work with an experienced financial advisor who can help you set goals, determine your tolerance for risk, and build a diversified plan that’s right for you and make adjustments when necessary.
At PGIM Investments, we consider it a great privilege and responsibility to help investors participate in opportunities across global markets while meeting their toughest investment challenges. We’re part of PGIM, a top-10 global investment manager with more than $1 trillion in assets under management. This investment expertise allows us to deliver actively managed funds and strategies to meet the needs of investors around the globe.
Thank you for choosing our family of funds.
Sincerely,

Stuart S. Parker, President
Prudential Jennison Global Infrastructure Fund
December 15, 2017
| Prudential Jennison Global Infrastructure Fund | 7 |
Your Fund’s Performance (unaudited)
Performance data quoted represents past performance. Past performance does not guarantee future results. The investment return and principal value of an investment will fluctuate, so that an investor’s shares, when redeemed, may be worth more or less than their original cost. Current performance may be lower or higher than the past performance data quoted. An investor may obtain performance data as of the most recent month-end by visiting our website at www.pgiminvestments.com or by calling (800) 225-1852.
| Average Annual Total Returns as of 10/31/17 (with sales charges) | ||||||
| One Year (%) | Since Inception (%) | |||||
| Class A | 7.88 | 6.51 (9/25/13) | ||||
| Class C | 12.39 | 7.19 (9/25/13) | ||||
| Class Q | N/A | 16.02* (12/28/16) | ||||
| Class Z | 14.51 | 8.26 (9/25/13) | ||||
| S&P Global Infrastructure Index | 16.51 | — | ||||
| S&P 500 Index | 23.61 | — | ||||
| Lipper Global Infrastructure Funds Average | 14.07 | — | ||||
| Average Annual Total Returns as of 10/31/17 (without sales charges) | ||||||
| One Year (%) | Since Inception (%) | |||||
| Class A | 14.15 | 7.99 (9/25/13) | ||||
| Class C | 13.39 | 7.19 (9/25/13) | ||||
| Class Q | N/A | 16.02* (12/28/16) | ||||
| Class Z | 14.51 | 8.26 (9/25/13) | ||||
| S&P Global Infrastructure Index | 16.51 | — | ||||
| S&P 500 Index | 23.61 | — | ||||
| Lipper Global Infrastructure Funds Average | 14.07 | — | ||||
*Not annualized
| 8 | Visit our website at pgiminvestments.com |
Growth of a $10,000 Investment
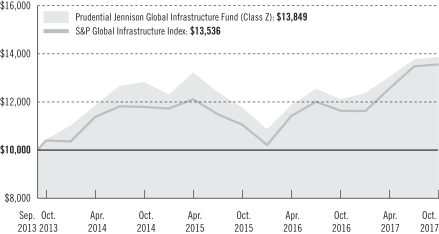
The graph compares a $10,000 investment in the Fund’s Class Z shares with a similar investment in the S&P Global Infrastructure Index by portraying the initial account values at the commencement of operations of Class Z shares (September 25, 2013) and the account values at the end of the current fiscal year (October 31, 2017), as measured on a quarterly basis. For purposes of the graph, and unless otherwise indicated, it has been assumed that (a) all recurring fees (including management fees) were deducted; and (b) all dividends and distributions were reinvested. The line graph provides information for Class Z shares only. As indicated in the tables provided earlier, performance for Class A and Class C shares will vary due to the differing charges and expenses applicable to each share class (as indicated in the following paragraphs). Without waiver of fees and/or expense reimbursements, if any, the Fund’s returns would have been lower.
Past performance does not predict future performance. Total returns and the ending account values in the graphs include changes in share price and reinvestment of dividends and capital gains distributions in a hypothetical investment for the periods shown. The Fund’s total returns do not reflect the deduction of income taxes on an individual’s investment. Taxes may reduce your actual investment returns on income or gains paid by the Fund or any gains you may realize if you sell your shares.
Source: PGIM Investments LLC and Lipper Inc.
Since Inception returns are provided since the Fund has less than 10 fiscal years of returns. Since Inception returns for the Indexes and the Lipper Average are measured from the closest month-end to the Fund’s inception date.
| Prudential Jennison Global Infrastructure Fund | 9 |
Your Fund’s Performance (continued)
The returns in the tables do not reflect the deduction of taxes that a shareholder would pay on Fund distributions or following the redemption of Fund shares. The average annual total returns take into account applicable sales charges, which are described for each share class in the table below.
| Class A* | Class C* | Class Q | Class Z* | |||||
| Maximum initial sales charge | 5.50% of the public offering price | None | None | None | ||||
| Contingent deferred sales charge (CDSC) (as a percentage of the lower of original purchase price or net asset value at redemption) | 1.00% on sales of $1 million or more made within 12 months of purchase | 1.00% on sales made within 12 months of purchase | None | None | ||||
| Annual distribution and service (12b-1) fees (shown as a percentage of average daily net assets) | 0.30% (0.25% currently) | 1.00% | None | None |
*Certain share classes will be generally closed to investments by new group retirement plans effective on or about June 1, 2018. Please see the “PRUDENTIAL FUNDS—UPDATE” on page 4 of this report for more information.
| 10 | Visit our website at pgiminvestments.com |
Benchmark Definitions
S&P Global Infrastructure Index—The S&P Global Infrastructure Index is an unmanaged index that consists of 75 companies from around the world that represent the listed infrastructure universe. To create diversified exposure across the global listed infrastructure market, the Index has balanced weights across three distinct infrastructure clusters: Utilities, Transportation, and Energy. The average annual total return for the Index measured from the month-end closest to the inception date of the Fund’s Class A, Class C, and Class Z shares through 10/31/17 is 7.70%. Class Q shares have been in existence for less than one year and have no average annual total return performance information available.
S&P 500 Index—The Standard & Poor’s 500 Composite Stock Price Index (S&P 500 Index) is an unmanaged index of over 500 stocks of large US public companies. It gives a broad look at how stock prices in the United States have performed. The average annual total return for the Index measured from the month-end closest to the inception date of the Fund’s Class A, Class C, and Class Z shares through 10/31/17 is 13.32%. Class Q shares have been in existence for less than one year and have no average annual total return performance information available.
Lipper Global Infrastructure Funds Average—The Lipper Global Infrastructure Funds Average (Lipper Average) is based on the average return of all funds in the Lipper Global Infrastructure Funds universe for the periods noted. Funds in the Lipper Average invest primarily in equity securities of domestic and foreign companies engaged in an infrastructure industry, including but not limited to transportation, communication, and waste management. The average annual total return for the Lipper Average measured from the month-end closest to the inception date of the Fund’s Class A, Class C, and Class Z shares through 10/31/17 is 7.48%. Class Q shares have been in existence for less than one year and have no average annual total return performance information available.
Investors cannot invest directly in an index or average. The returns for the Indexes would be lower if they included the effects of sales charges, operating expenses of a mutual fund, or taxes. Returns for the Lipper Average reflect the deduction of operating expenses, but not sales charges or taxes.
Presentation of Fund Holdings
| Five Largest Holdings expressed as a percentage of net assets as of 10/31/17 (%) | ||||
Eiffage SA, Construction & Engineering | 4.0 | |||
Atlantia SpA, Transportation Infrastructure | 3.9 | |||
NextEra Energy, Inc., Electric Utilities | 3.7 | |||
Vinci SA, Construction & Engineering | 3.3 | |||
Transurban Group, Transportation Infrastructure | 3.2 | |||
Holdings reflect only long-term investments and are subject to change.
| Five Largest Industries expressed as a percentage of net assets as of 10/31/17 (%) | ||||
Electric Utilities | 20.9 | |||
Transportation Infrastructure | 19.6 | |||
Oil, Gas & Consumable Fuels | 17.6 | |||
Construction & Engineering | 10.1 | |||
Equity Real Estate Investment Trusts (REITs) | 6.5 | |||
Industry weightings reflect only long-term investments and are subject to change.
| Prudential Jennison Global Infrastructure Fund | 11 |
Strategy and Performance Overview
How did the Fund perform?
The Prudential Jennison Global Infrastructure Fund’s Class Z shares rose 14.51% for the 12-months ended October 31, 2017. Over the same period, the S&P Global Infrastructure Index (the Index) climbed 16.51%. The Lipper Global Infrastructure Funds Average returned 14.07%.
What was the market environment?
| • | The unconventional US presidential election and the new administration’s shaky start contributed to market volatility in the 12-month period ended October 31, 2017. Notwithstanding the volatile news flow around US politics and international government tensions, equity market gains were consistently positive throughout the fiscal year. |
| • | The market’s initial favorable response to the election reflected anticipation of lower corporate tax rates, a less onerous regulatory environment, and increased fiscal spending on infrastructure. With legislative accomplishments elusive and factionalism impeding cooperation, market expectations moderated. |
| • | West Texas Intermediate (WTI), a benchmark for crude prices, remained volatile, hitting a high of $54.45 in February, before plunging approximately 28% to a 12-month low in June, then rising approximately 28% through the end of October 2017. |
| • | Regulated utility share prices in the US, Europe, and Australia came under pressure during the latter part of the third quarter of 2017 as bond yields rose in those respective regions. During the latter part of the third quarter, shares of both tower and data center REITs—which largely trade as specialty REITs in the US—came under pressure as bond yields rose. |
What worked?
Industrials and construction & engineering holdings were among the main contributors to performance during the period. Positions within the airport services segment also helped.
| • | In industrials: |
| • | Eiffage SA is a French-based holding company which is engaged in concessions and public-private partnerships of construction and public works projects through its subsidiaries. The company operates through five divisions and the concessions and public-private partnerships, which manage the company’s participating interests and services, such as the management and operation of car parks, motorways, and other infrastructure. Jennison favors the company for its improving contracting business, solid toll road traffic growth, and the ability to lower its interest costs which can drive EPS growth. Shares performed well over the period as the company reported solid results consistent with earnings estimates, in addition to its announcing strong order trends, which highlighted a cyclical improvement in its French construction business. |
| 12 | Visit our website at pgiminvestments.com |
| • | Aeroports de Paris SA is a French-based airport group which operates three commercial airports located in or near Paris, including Paris-Charles de Gaulle, Paris-Orly, and Paris-Le Bourget. It also manages 10 other civil airports. Apart from airport activities, the company also provides rental office space, customs services, telecom and information technology services, as well as airport design and development. Following his election win in France, Emmanuel Macron, who is a supporter of privatization, heightened speculation that the French government could sell down its controlling stake in the company. That speculation as well as accelerating global traffic, and improving retail trends and appetite for European equities, drove the stock higher during the period. |
| • | Atlantia S.p.A. is an Italian-based infrastructure holding company which, along with its subsidiaries, engages in the construction, maintenance, and operation of toll roads and tunnels mainly in Italy, but also in Brazil, Chile, India, Poland, and the United States. Jennison continues to view the company as an attractive pure-play European toll operator, with a good balance sheet that’s under-levered, has an attractive dividend yield, and has some smaller stakes in fast growing markets in Latin America and elsewhere. Shares of Atlantia have performed well during the period, with the company reporting results that were in line with analyst expectations, supported by positive traffic growth, as well as a positive foreign exchange impact. |
What didn’t work?
| • | Multi-utilities and integrated telecommunication services holdings were the primary detractors of performance during the period. |
| • | Energy Transfer Partners LP (ETP) is a master limited partnership (MLP) which owns and operates one of the largest and most diversified portfolios of energy assets in the US, including natural gas gathering and transportation pipelines and treatment, processing, and storage facilities. In August, the company issued a 54 million unit offering to eliminate equity needs through mid-2018, a decision by management that was likely due to the negative stock reaction to a positive earnings release. While the equity issuance temporarily hurt shares, it ultimately removed the equity overhang, which, in addition to poor investor sentiment in the overall energy sector and the management’s recent announcement that a corporate simplification likely won’t occur before late 2019, had all plagued its share price over the past few months. |
| • | Kinder Morgan Inc. (KMI) is a US-based energy infrastructure company, which owns an interest in or operates approximately 80,000 miles of pipelines and 180 terminals. The company’s pipelines transport natural gas, gasoline, crude oil, CO2, and other products, and its terminals store petroleum products and chemicals, and handle bulk materials like coal and petroleum coke. Jennison favors the company for its attractive risk-adjusted upside potential, as well as a potential dividend increase over the next |
| Prudential Jennison Global Infrastructure Fund | 13 |
Strategy and Performance Overview (continued)
| year or two, along with a few potential catalysts which could be viewed favorably by the market. Shares underperformed during the period as poor investor sentiment and falling and volatile commodity prices negatively, weighed on the broad energy sector. |
| • | In utilities: |
| • | Innogy SE is a German-based company, which is primarily involved in the utilities industry. The company operates primarily as a provider of electricity and natural gas in multiple countries across Europe. Despite its lower growth opportunities, Jennison liked the company as a lower-risk, distribution yield-focused European utility, as there are not many of them. After the US presidential election surprise, interest rates began rising in the US and to a lesser extent in Europe. However, Jennison believed the upward rate pressure will continue. Given that slower growth, higher-yielding companies tend to be most vulnerable in a rising rate environment, and with the continued pressure of rising rates ahead, Jennison decided to liquidate the position in favor of less interest rate sensitive companies. |
The percentage points shown in the tables below identify each security’s positive or negative contribution to the Fund’s return relative to the benchmark, which is the sum of all contributions by individual holdings.
| Top Contributors (%) | Top Detractors (%) | |||||
| Eiffage SA | 1.27 | Energy Transfer Partners LP | –0.58 | |||
| Aeroports de Paris SA | 1.23 | Innogy SE | –0.35 | |||
| Atlantia S.p.A. | 1.00 | Kinder Morgan Inc. | –0.22 | |||
| VINCI SA | 0.97 | ENAV S.p.A. | –0.20 | |||
| Enel S.p.A. | 0.72 | Orsted | –0.17 | |||
Current outlook
| • | Within the utility sector, Jennison continues to prefer regulated utilities (electric, gas, and/or water) with solid dividend yields and above-average projected earnings and/or dividend growth that are driven by a regulatory rate-base. In addition, Jennison favors utilities with constructive state legislatures and utility commissions because a supportive policy environment enhances the ability of utilities to ultimately earn or exceed their regulatory return targets. Jennison believes higher-quality, faster-growth utilities should outperform peers with lower-growth and/or lower-quality over time. |
| • | Regarding renewable energy, in spite of recent rhetoric from the White House, Jennison believes there is continued momentum behind the secular trend of rising global demand for renewable energy supply and subsequent transmission investment needed to tie |
| 14 | Visit our website at pgiminvestments.com |
those cleaner resources into the grid, as well as to modernize the aging grid infrastructure to absorb the intermittent nature of renewable generation. |
| • | As it relates to energy infrastructure, Jennison believes oil, natural gas, and natural gas liquid (NGL) fundamentals are in a much better position than they were a year ago—which bodes well for volume growth and the need for critical midstream infrastructure to move remote energy supplies to end-use demand markets in North America and around the world. Jennison believes the next part of this midstream cycle will largely be demand and export driven—as a result, the Fund’s current energy infrastructure exposure is heavily weighted towards companies with infrastructure which Jernnison believes will benefit from future natural gas and NGL demand growth. |
| • | Within transportation, during the course of 2017, Jennison has responded to accelerating economic activity in several regions outside the US by increasing its exposure to companies which should benefit from those improving economic trends. Jennison especially favors European toll-road operators as they are experiencing a recovery in commercial and passenger traffic, improving margins in their construction activities, and interest cost savings as they refinance at lower rates. |
| • | Regarding communications infrastructure, Jennison continues to favor wireless towers and data center operators, as both industries capitalize on exponential data demand growth around the world. In datacenters, Jennison sees an opportunity to invest in infrastructure operations which can profit from secular global trends of the increasing shift towards cloud computing by large corporations. |
| Prudential Jennison Global Infrastructure Fund | 15 |
Fees and Expenses (unaudited)
As a shareholder of the Fund, you incur two types of costs: (1) transaction costs, including sales charges (loads) on purchase payments and redemptions, as applicable, and (2) ongoing costs, including management fees, distribution, and/or service (12b-1) fees, and other Fund expenses, as applicable. This example is intended to help you understand your ongoing costs (in dollars) of investing in the Fund and to compare these costs with the ongoing costs of investing in other mutual funds.
The example is based on an investment of $1,000 held through the six-month period ended October 31, 2017. The example is for illustrative purposes only; you should consult the Prospectus for information on initial and subsequent minimum investment requirements.
Actual Expenses
The first line for each share class in the table on the following page provides information about actual account values and actual expenses. You may use the information on this line, together with the amount you invested, to estimate the expenses that you paid over the period. Simply divide your account value by $1,000 (for example, an $8,600 account value ÷ $1,000 = 8.6), then multiply the result by the number on the first line under the heading “Expenses Paid During the Six-Month Period” to estimate the expenses you paid on your account during this period.
Hypothetical Example for Comparison Purposes
The second line for each share class in the table on the following page provides information about hypothetical account values and hypothetical expenses based on the Fund’s actual expense ratio and an assumed rate of return of 5% per year before expenses, which is not the Fund’s actual return. The hypothetical account values and expenses may not be used to estimate the actual ending account balance or expenses you paid for the period. You may use this information to compare the ongoing costs of investing in the Fund and other funds. To do so, compare this 5% hypothetical example with the 5% hypothetical examples that appear in the shareholder reports of the other funds.
The Fund’s transfer agent may charge additional fees to holders of certain accounts that are not included in the expenses shown in the table on the following page. These fees apply to individual retirement accounts (IRAs) and Section 403(b) accounts. As of the close of the six-month period covered by the table, IRA fees included an annual maintenance fee of $15 per account (subject to a maximum annual maintenance fee of $25 for all accounts held by the same shareholder). Section 403(b) accounts are charged an annual $25 fiduciary maintenance fee. Some of the fees may vary in amount, or may be waived, based on your total account balance or the number of Prudential funds, including the Fund, that you own. You should consider the additional fees that were charged to your Fund account over the six-month period when you estimate the total ongoing expenses paid over the
| 16 | Visit our website at pgiminvestments.com |
period and the impact of these fees on your ending account value, as these additional expenses are not reflected in the information provided in the expense table. Additional fees have the effect of reducing investment returns.
Please note that the expenses shown in the table are meant to highlight your ongoing costs only and do not reflect any transactional costs such as sales charges (loads). Therefore, the second line for each share class in the table is useful in comparing ongoing costs only and will not help you determine the relative total costs of owning different funds. In addition, if these transactional costs were included, your costs would have been higher.
| Prudential Jennison Global Infrastructure Fund | Beginning Account Value May 1, 2017 | Ending Account Value October 31, 2017 | Annualized Expense Ratio Based on the Six-Month Period | Expenses Paid During the Six-Month Period* | ||||||||||||||
| Class A | Actual | $ | 1,000.00 | $ | 1,060.00 | 1.50 | % | $ | 7.79 | |||||||||
| Hypothetical | $ | 1,000.00 | $ | 1,017.64 | 1.50 | % | $ | 7.63 | ||||||||||
| Class C | Actual | $ | 1,000.00 | $ | 1,055.90 | 2.25 | % | $ | 11.66 | |||||||||
| Hypothetical | $ | 1,000.00 | $ | 1,013.86 | 2.25 | % | $ | 11.42 | ||||||||||
| Class Q | Actual | $ | 1,000.00 | $ | 1,062.20 | 1.25 | % | $ | 6.50 | |||||||||
| Hypothetical | $ | 1,000.00 | $ | 1,018.90 | 1.25 | % | $ | 6.36 | ||||||||||
| Class Z | Actual | $ | 1,000.00 | $ | 1,062.20 | 1.25 | % | $ | 6.50 | |||||||||
| Hypothetical | $ | 1,000.00 | $ | 1,018.90 | 1.25 | % | $ | 6.36 | ||||||||||
*Fund expenses (net of fee waivers or subsidies, if any) for each share class are equal to the annualized expense ratio for each share class (provided in the table), multiplied by the average account value over the period, multiplied by the 184 days in the six-month period ended October 31, 2017, and divided by the 365 days in the Fund’s fiscal year ended October 31, 2017 (to reflect the six-month period). Expenses presented in the table include the expenses of any underlying funds in which the Fund may invest.
| Prudential Jennison Global Infrastructure Fund | 17 |
Schedule of Investments
as of October 31, 2017
| Description | Shares | Value | ||||||
LONG-TERM INVESTMENTS 99.8% | ||||||||
COMMON STOCKS 99.7% | ||||||||
Argentina 1.0% | ||||||||
Pampa Energia SA, ADR* | 9,822 | $ | 666,226 | |||||
Australia 5.5% | ||||||||
Spark Infrastructure Group | 348,495 | 678,419 | ||||||
Sydney Airport | 165,344 | 900,842 | ||||||
Transurban Group | 236,034 | 2,194,133 | ||||||
|
| |||||||
| 3,773,394 | ||||||||
Brazil 1.0% | ||||||||
CCR SA | 121,783 | 676,055 | ||||||
Canada 7.9% | ||||||||
Enbridge, Inc. (TSX) | 16,428 | 631,347 | ||||||
Pembina Pipeline Corp. | 51,127 | 1,690,770 | ||||||
TransCanada Corp. (TSX) | 41,757 | 1,982,495 | ||||||
Westshore Terminals Investment Corp. | 58,910 | 1,123,769 | ||||||
|
| |||||||
| 5,428,381 | ||||||||
China 2.2% | ||||||||
Beijing Enterprises Holdings Ltd. | 124,067 | 737,611 | ||||||
Huaneng Renewables Corp. Ltd. (Class H Stock) | 2,303,295 | 792,113 | ||||||
|
| |||||||
| 1,529,724 | ||||||||
France 8.3% | ||||||||
Aeroports de Paris | 4,223 | 711,007 | ||||||
Eiffage SA | 26,279 | 2,744,990 | ||||||
Vinci SA | 22,992 | 2,252,702 | ||||||
|
| |||||||
| 5,708,699 | ||||||||
Germany 1.1% | ||||||||
Fraport AG Frankfurt Airport Services Worldwide | 8,155 | 774,918 | ||||||
India 3.2% | ||||||||
NTPC Ltd. | 484,734 | 1,357,422 | ||||||
Power Grid Corp. of India Ltd. | 265,535 | 868,730 | ||||||
|
| |||||||
| 2,226,152 | ||||||||
Italy 9.5% | ||||||||
Atlantia SpA | 82,370 | 2,685,312 | ||||||
Enel SpA | 284,322 | 1,763,271 | ||||||
Italgas SpA | 355,209 | 2,075,201 | ||||||
|
| |||||||
| 6,523,784 | ||||||||
See Notes to Financial Statements.
| Prudential Jennison Global Infrastructure Fund | 19 |
Schedule of Investments (continued)
as of October 31, 2017
| Description | Shares | Value | ||||||
COMMON STOCKS (Continued) | ||||||||
Malaysia 0.9% | ||||||||
Malaysia Airports Holdings Bhd | 327,741 | $ | 640,789 | |||||
Mexico 2.4% | ||||||||
Grupo Aeroportuario del Sureste SAB de CV (Class B Stock) | 30,755 | 549,914 | ||||||
Infraestructura Energetica Nova SAB de CV,144A | 17,329 | 88,400 | ||||||
Infraestructura Energetica Nova SAB de CV | 195,169 | 995,607 | ||||||
|
| |||||||
| 1,633,921 | ||||||||
Philippines 1.1% | ||||||||
International Container Terminal Services, Inc. | 354,671 | 726,400 | ||||||
Spain 6.4% | ||||||||
Aena SME SA | 6,051 | 1,110,199 | ||||||
Ferrovial SA | 85,689 | 1,860,875 | ||||||
Iberdrola SA | 172,096 | 1,390,710 | ||||||
|
| |||||||
| 4,361,784 | ||||||||
Switzerland 2.0% | ||||||||
Flughafen Zurich AG | 6,347 | 1,380,319 | ||||||
United States 47.2% | ||||||||
Advanced Disposal Services, Inc.* | 46,318 | 1,154,245 | ||||||
American Electric Power Co., Inc. | 23,818 | 1,772,297 | ||||||
American Tower Corp., REIT | 10,603 | 1,523,333 | ||||||
American Water Works Co., Inc. | 13,738 | 1,205,647 | ||||||
Cheniere Energy Partners LP Holdings LLC | 33,814 | 846,703 | ||||||
Cheniere Energy, Inc.* | 23,262 | 1,087,266 | ||||||
CSX Corp. | 38,740 | 1,953,658 | ||||||
Edison International | 13,168 | 1,052,781 | ||||||
Energy Transfer Equity LP, MLP | 31,240 | 554,510 | ||||||
Energy Transfer Partners LP, MLP | 30,023 | 522,700 | ||||||
Equinix, Inc., REIT | 2,825 | 1,309,387 | ||||||
Exelon Corp. | 26,673 | 1,072,521 | ||||||
FedEx Corp. | 4,997 | 1,128,373 | ||||||
Genesee & Wyoming, Inc. (Class A Stock)* | 14,556 | 1,044,830 | ||||||
Great Plains Energy, Inc. | 54,996 | 1,805,519 | ||||||
Kinder Morgan, Inc. | 36,645 | 663,641 | ||||||
NextEra Energy, Inc. | 16,427 | 2,547,335 | ||||||
NiSource, Inc. | 39,898 | 1,052,110 | ||||||
NRG Energy, Inc. | 72,726 | 1,818,150 | ||||||
ONEOK, Inc. | 12,265 | 665,622 | ||||||
Plains GP Holdings LP (Class A Stock) | 16,097 | 328,379 | ||||||
SBA Communications Corp., REIT* | 10,510 | 1,651,962 | ||||||
See Notes to Financial Statements.
| 20 |
| Description | Shares | Value | ||||||
COMMON STOCKS (Continued) | ||||||||
United States (cont’d.) | ||||||||
Sempra Energy | 8,952 | $ | 1,051,860 | |||||
Southern Co. (The) | 13,909 | 726,050 | ||||||
Targa Resources Corp. | 22,025 | 914,037 | ||||||
Union Pacific Corp. | 6,476 | 749,856 | ||||||
Williams Cos., Inc. (The) | 75,801 | 2,160,328 | ||||||
|
| |||||||
| 32,363,100 | ||||||||
|
| |||||||
TOTAL COMMON STOCKS | 68,413,646 | |||||||
|
| |||||||
Units | ||||||||
RIGHTS* 0.1% | ||||||||
Spain | ||||||||
Ferrovial SA (Spain), expiring 11/13/17 | 85,689 | 41,223 | ||||||
|
| |||||||
TOTAL LONG-TERM INVESTMENTS | 68,454,869 | |||||||
|
| |||||||
Shares | ||||||||
SHORT-TERM INVESTMENT 0.2% | ||||||||
AFFILIATED MUTUAL FUND | ||||||||
Prudential Investment Portfolios 2 - Prudential Core Ultra Short Bond Fund | 135,581 | 135,581 | ||||||
|
| |||||||
TOTAL INVESTMENTS 100.0% | 68,590,450 | |||||||
Other assets in excess of liabilities 0.0% | 9,883 | |||||||
|
| |||||||
NET ASSETS 100.0% | $ | 68,600,333 | ||||||
|
| |||||||
The following abbreviations are used in the annual report:
144A—Security was purchased pursuant to Rule 144A under the Securities Act of 1933 and may not be resold subject to that rule except to qualified institutional buyers. Unless otherwise noted, 144A securities are deemed to be liquid.
ADR—American Depositary Receipt
LIBOR—London Interbank Offered Rate
MLP—Master Limited Partnership
REIT(s)—Real Estate Investment Trust(s)
TSX—Toronto Stock Exchange
| * | Non-income producing security. |
| (w) | PGIM Investments LLC, the manager of the Series, also serves as manager of the Prudential Investment Portfolios 2 - Prudential Core Ultra Short Bond Fund. |
See Notes to Financial Statements.
| Prudential Jennison Global Infrastructure Fund | 21 |
Schedule of Investments (continued)
as of October 31, 2017
Fair Value Measurements:
Various inputs are used in determining the value of the Series’ investments. These inputs are summarized in the three broad levels listed below.
Level 1—unadjusted quoted prices generally in active markets for identical securities.
Level 2—quoted prices for similar securities, interest rates and yield curves, prepayment speeds, foreign currency exchange rates and other observable inputs.
Level 3—unobservable inputs for securities valued in accordance with Board approved fair valuation procedures.
The following is a summary of the inputs used as of October 31, 2017 in valuing such portfolio securities:
| Level 1 | Level 2 | Level 3 | ||||||||||
Investments in Securities | ||||||||||||
Common Stocks | ||||||||||||
Argentina | $ | 666,226 | $ | — | $ | — | ||||||
Australia | — | 3,773,394 | — | |||||||||
Brazil | 676,055 | — | — | |||||||||
Canada | 5,428,381 | — | — | |||||||||
China | — | 1,529,724 | — | |||||||||
France | — | 5,708,699 | — | |||||||||
Germany | — | 774,918 | — | |||||||||
India | — | 2,226,152 | — | |||||||||
Italy | — | 6,523,784 | — | |||||||||
Malaysia | — | 640,789 | — | |||||||||
Mexico | 1,545,521 | 88,400 | — | |||||||||
Philippines | — | 726,400 | — | |||||||||
Spain | — | 4,361,784 | — | |||||||||
Switzerland | — | 1,380,319 | — | |||||||||
United States | 32,363,100 | — | — | |||||||||
Rights | ||||||||||||
Spain | 41,223 | — | — | |||||||||
Affiliated Mutual Fund | 135,581 | — | — | |||||||||
|
|
|
|
|
| |||||||
Total | $ | 40,856,087 | $ | 27,734,363 | $ | — | ||||||
|
|
|
|
|
| |||||||
During the period, there were no transfers between Level 1, Level 2 and Level 3 to report.
See Notes to Financial Statements.
| 22 |
Industry Classification:
The industry classification of investments and other assets in excess of liabilities shown as a percentage of net assets as of October 31, 2017 were as follows (unaudited):
Electric Utilities | 20.9 | % | ||
Transportation Infrastructure | 19.6 | |||
Oil, Gas & Consumable Fuels | 17.6 | |||
Construction & Engineering | 10.1 | |||
Equity Real Estate Investment Trusts (REITs) | 6.5 | |||
Independent Power & Renewable Electricity Producers | 5.8 | |||
Road & Rail | 5.4 | |||
Gas Utilities | 4.6 | |||
Multi-Utilities | 3.1 | |||
Water Utilities | 1.8 | % | ||
Commercial Services & Supplies | 1.7 | |||
Air Freight & Logistics | 1.6 | |||
Industrial Conglomerates | 1.1 | |||
Affiliated Mutual Fund | 0.2 | |||
|
| |||
| 100.0 | ||||
Other assets in excess of liabilities | 0.0 | * | ||
|
| |||
| 100.0 | % | |||
|
|
| * | Less than +/- 0.05% |
Effects of Derivative Instruments on the Financial Statements and Primary Underlying Risk Exposure:
The Series invested in derivative instruments during the reporting period. The primary type of risk associated with these derivative instruments is equity contracts risk. The effect of such derivative instruments on the Series’ financial position and financial performance as reflected in the Statement of Assets and Liabilities and Statement of Operations is presented in the summary below.
Fair values of derivative instruments as of October 31, 2017 as presented in the Statement of Assets and Liabilities:
| Asset Derivatives | Liability Derivatives | |||||||||
Derivatives not accounted | Balance Sheet Location | Fair Value | Balance Sheet Location | Fair Value | ||||||
| Equity contracts | Unaffiliated investments | $ | 41,223 | $ — | ||||||
|
|
| ||||||||
See Notes to Financial Statements.
| Prudential Jennison Global Infrastructure Fund | 23 |
Schedule of Investments (continued)
as of October 31, 2017
The effects of derivative instruments on the Statement of Operations for the year ended October 31, 2017 are as follows:
For the year ended October 31, 2017, the Series did not have any net realized gain (loss) on derivatives recognized in income.
Change in Unrealized Appreciation (Depreciation) on Derivatives Recognized in Income | ||||
Derivatives not accounted for as hedging | Rights(1) | |||
Equity contracts | $ | 2,207 | ||
|
| |||
| (1) | Included in net change in unrealized appreciation (depreciation) on investments in the Statement of Operations. |
See Notes to Financial Statements.
| 24 |
This Page Intentionally Left Blank
Statement of Assets & Liabilities
as of October 31, 2017
Assets | ||||
Investments at value: | ||||
Unaffiliated investments (cost $57,595,655) | $ | 68,454,869 | ||
Affiliated investments (cost $135,581) | 135,581 | |||
Foreign currency, at value (cost $16,856) | 16,856 | |||
Receivable for Series shares sold | 64,497 | |||
Dividends and interest receivable | 62,646 | |||
Tax reclaim receivable | 43,491 | |||
Prepaid expenses | 980 | |||
|
| |||
Total assets | 68,778,920 | |||
|
| |||
Liabilities | ||||
Payable for Series shares reacquired | 65,313 | |||
Management fee payable | 51,280 | |||
Foreign capital gains tax liability | 20,592 | |||
Custodian and accounting fees payable | 11,514 | |||
Shareholders’ reports payable | 10,984 | |||
Accrued expenses and other liabilities | 8,669 | |||
Distribution fee payable | 7,662 | |||
Affiliated transfer agent fee payable | 2,573 | |||
|
| |||
Total liabilities | 178,587 | |||
|
| |||
Net Assets | $ | 68,600,333 | ||
|
| |||
Net assets were comprised of: | ||||
Common stock, at par | $ | 52,579 | ||
Paid-in capital in excess of par | 64,526,428 | |||
|
| |||
| 64,579,007 | ||||
Accumulated net realized loss on investment and foreign currency transactions | (6,816,760 | ) | ||
Net unrealized appreciation on investments and foreign currencies | 10,838,086 | |||
|
| |||
Net assets, October 31, 2017 | $ | 68,600,333 | ||
|
| |||
See Notes to Financial Statements.
| 26 |
Class A | ||||
Net asset value and redemption price per share, | ||||
($11,689,187 ÷ 895,443 shares of common stock issued and outstanding) | $ | 13.05 | ||
Maximum sales charge (5.50% of offering price) | 0.76 | |||
|
| |||
Maximum offering price to public | $ | 13.81 | ||
|
| |||
Class C | ||||
Net asset value, offering price and redemption price per share, | ||||
($6,101,142 ÷ 470,489 shares of common stock issued and outstanding) | $ | 12.97 | ||
|
| |||
Class Q | ||||
Net asset value, offering price and redemption price per share, | ||||
($21,978,992 ÷ 1,683,505 shares of common stock issued and outstanding) | $ | 13.06 | ||
|
| |||
Class Z | ||||
Net asset value, offering price and redemption price per share, | ||||
($28,831,012 ÷ 2,208,417 shares of common stock issued and outstanding) | $ | 13.06 | ||
|
| |||
See Notes to Financial Statements.
| Prudential Jennison Global Infrastructure Fund | 27 |
Statement of Operations
Year Ended October 31, 2017
Net Investment Income (Loss) |
| |||
Income |
| |||
Unaffiliated dividend income (net of foreign withholding taxes of $113,013) | $ | 1,614,448 | ||
Affiliated dividend income | 15,503 | |||
Income from securities lending, net (including affiliated income of $154) | 1,776 | |||
|
| |||
Total income | 1,631,727 | |||
|
| |||
Expenses |
| |||
Management fee | 633,534 | |||
Distribution fee—Class A | 34,300 | |||
Distribution fee—Class C | 61,112 | |||
Custodian and accounting fees | 73,000 | |||
Registration fees | 69,000 | |||
Transfer agent’s fees and expenses (including affiliated expense of $14,000) | 51,000 | |||
Shareholders’ reports | 28,000 | |||
Audit fee | 28,000 | |||
Legal fees and expenses | 24,000 | |||
Directors’ fees | 11,000 | |||
Miscellaneous | 20,992 | |||
|
| |||
Total expenses | 1,033,938 | |||
Less: Management fee waiver and/or expense reimbursement | (146,308 | ) | ||
Distribution fee waiver—Class A | (5,717 | ) | ||
|
| |||
Net expenses | 881,913 | |||
|
| |||
Net investment income (loss) | 749,814 | |||
|
| |||
Realized And Unrealized Gain (Loss) On Investments And Foreign Currency Transactions | ||||
Net realized gain (loss) on: |
| |||
Investment transactions (including affiliated of $(26)) | 1,774,194 | |||
Foreign currency transactions | (5,302 | ) | ||
|
| |||
| 1,768,892 | ||||
|
| |||
Net change in unrealized appreciation (depreciation) on: |
| |||
Investments (Net of change in foreign capital gains taxes $(20,592)) | 5,854,213 | |||
Foreign currencies | (2,515 | ) | ||
|
| |||
| 5,851,698 | ||||
|
| |||
Net gain (loss) on investment and foreign currency transactions | 7,620,590 | |||
|
| |||
Net Increase (Decrease) In Net Assets Resulting From Operations | $ | 8,370,404 | ||
|
| |||
See Notes to Financial Statements.
| 28 |
Statement of Changes in Net Assets
| Year Ended October 31, | ||||||||
| 2017 | 2016 | |||||||
Increase (Decrease) in Net Assets | ||||||||
Operations | ||||||||
Net investment income (loss) | $ | 749,814 | $ | 501,509 | ||||
Net realized gain (loss) on investment and foreign currency transactions | 1,768,892 | (3,627,807 | ) | |||||
Net change in unrealized appreciation (depreciation) on investments and foreign currencies | 5,851,698 | 3,466,087 | ||||||
|
|
|
| |||||
Net increase (decrease) in net assets resulting from operations | 8,370,404 | 339,789 | ||||||
|
|
|
| |||||
Dividends and Distributions | ||||||||
Dividends from net investment income | ||||||||
Class A | (118,512 | ) | (115,375 | ) | ||||
Class C | (39,550 | ) | (20,095 | )�� | ||||
Class Q | (159,950 | ) | — | |||||
Class Z | (379,823 | ) | (340,326 | ) | ||||
|
|
|
| |||||
| (697,835 | ) | (475,796 | ) | |||||
|
|
|
| |||||
Tax return of capital distributions | ||||||||
Class A | (58,583 | ) | (132,272 | ) | ||||
Class C | (19,550 | ) | (23,038 | ) | ||||
Class Q | (79,068 | ) | — | |||||
Class Z | (187,756 | ) | (390,170 | ) | ||||
|
|
|
| |||||
| (344,957 | ) | (545,480 | ) | |||||
|
|
|
| |||||
Series share transactions (Net of share conversions) | ||||||||
Net proceeds from shares sold | 24,826,946 | 17,321,482 | ||||||
Net asset value of shares issued in reinvestment of dividends and distributions and tax return of capital | 1,001,786 | 979,002 | ||||||
Cost of shares reacquired | (23,382,391 | ) | (35,225,219 | ) | ||||
|
|
|
| |||||
Net increase (decrease) in net assets from Series share transactions | 2,446,341 | (16,924,735 | ) | |||||
|
|
|
| |||||
Total increase (decrease) | 9,773,953 | (17,606,222 | ) | |||||
Net Assets: | ||||||||
Beginning of year | 58,826,380 | 76,432,602 | ||||||
|
|
|
| |||||
End of year | $ | 68,600,333 | $ | 58,826,380 | ||||
|
|
|
| |||||
See Notes to Financial Statements.
| Prudential Jennison Global Infrastructure Fund | 29 |
Notes to Financial Statements
Prudential World Fund, Inc. (the “Fund”) is registered under the Investment Company Act of 1940, as amended (“1940 Act”), as an open-end management investment company and currently consists of seven investment portfolios: Prudential Emerging Markets Debt Hard Currency Fund and Prudential Emerging Markets Debt Local Currency Fund which are non-diversified funds and Prudential Jennison Emerging Markets Equity Fund, Prudential Jennison Global Infrastructure Fund, Prudential Jennison Global Opportunities Fund, Prudential Jennison International Opportunities Fund and Prudential QMA International Equity Fund which are diversified funds. These financial statements relate to the Prudential Jennison Global Infrastructure Fund (the “Series”).
The investment objective of the Series is to achieve total return.
1. Accounting Policies
The Series follows investment company accounting and reporting guidance of the Financial Accounting Standards Board (“FASB”) Accounting Standard Codification Topic 946 Financial Services—Investment Companies. The following accounting policies conform to U.S. generally accepted accounting principles. The Series consistently follows such policies in the preparation of its financial statements.
Securities Valuation: The Series holds securities and other assets and liabilities that are fair valued at the close of each day (generally, 4:00 PM Eastern time) the New York Stock Exchange (“NYSE”) is open for trading. Fair value is the price that would be received to sell an asset or paid to transfer a liability in an orderly transaction between market participants on the measurement date. The Board of Directors (the “Board”) has adopted valuation procedures for security valuation under which fair valuation responsibilities have been delegated to PGIM Investments LLC (“PGIM Investments” or “the Manager”) (formerly known as Prudential Investments LLC). Under the current valuation procedures, the Valuation Committee is responsible for supervising the valuation of portfolio securities and other assets and liabilities. The valuation procedures permit the Series to utilize independent pricing vendor services, quotations from market makers, and alternative valuation methods when market quotations are either not readily available or not deemed representative of fair value. A record of the Valuation Committee’s actions is subject to the Board’s review, approval, and ratification at its next regularly scheduled quarterly meeting.
Various inputs determine how the Series’ investments are valued, all of which are categorized according to the three broad levels (Level 1, 2, or 3) detailed in the Schedule of Investments.
Common and preferred stocks, exchange-traded funds, and derivative instruments, such as futures or options, that are traded on a national securities exchange are valued at the
| 30 |
last sale price as of the close of trading on the applicable exchange where the security principally trades. Securities traded via NASDAQ are valued at the NASDAQ official closing price. To the extent these securities are valued at the last sale price or NASDAQ official closing price, they are classified as Level 1 in the fair value hierarchy. In the event that no sale or official closing price on valuation date exists, these securities are generally valued at the mean between the last reported bid and ask prices, or at the last bid price in the absence of an ask price. These securities are classified as Level 2 in the fair value hierarchy.
Foreign equities traded on foreign securities exchanges are generally valued using pricing vendor services that provide model prices derived using adjustment factors based on information such as local closing price, relevant general and sector indices, currency fluctuations, depositary receipts, and futures, as applicable. Securities valued using such model prices are classified as Level 2 in the fair value hierarchy. The models generate an evaluated adjustment factor for each security, which is applied to the local closing price to adjust it for post closing market movements. Utilizing that evaluated adjustment factor, the vendor provides an evaluated price for each security. If the vendor does not provide an evaluated price, securities are valued in accordance with exchange-traded common and preferred stock valuation policies discussed above.
Investments in open-end, non-exchange-traded mutual funds are valued at their net asset values as of the close of the NYSE on the date of valuation. These securities are classified as Level 1 in the fair value hierarchy since they may be purchased or sold at their net asset values on the date of valuation.
Securities and other assets that cannot be priced according to the methods described above are valued based on pricing methodologies approved by the Board. In the event that unobservable inputs are used when determining such valuations, the securities will be classified as Level 3 in the fair value hierarchy.
When determining the fair value of securities, some of the factors influencing the valuation include: the nature of any restrictions on disposition of the securities; assessment of the general liquidity of the securities; the issuer’s financial condition and the markets in which it does business; the cost of the investment; the size of the holding and the capitalization of the issuer; the prices of any recent transactions or bids/offers for such securities or any comparable securities; any available analyst media or other reports or information deemed reliable by the investment manager regarding the issuer or the markets or industry in which it operates. Using fair value to price securities may result in a value that is different from a security’s most recent closing price and from the price used by other unaffiliated mutual funds to calculate their net asset values.
Restricted and Illiquid Securities: Subject to guidelines adopted by the Board, the Series may invest up to 15% of its net assets in illiquid securities, including those which are restricted as to disposition under securities law (“restricted securities”). Restricted securities are valued pursuant to the valuation procedures noted above. Illiquid securities are those that, because of the absence of a readily available market or due to legal or
| Prudential Jennison Global Infrastructure Fund | 31 |
Notes to Financial Statements (continued)
contractual restrictions on resale, cannot be sold within seven days in the ordinary course of business at approximately the amount at which the Series has valued the investment. Therefore, the Series may find it difficult to sell illiquid securities at the time considered most advantageous by its Subadviser and may incur expenses that would not be incurred in the sale of securities that were freely marketable. Certain securities that would otherwise be considered illiquid because of legal restrictions on resale to the general public may be traded among qualified institutional buyers under Rule 144A of the Securities Act of 1933. These Rule 144A securities, as well as commercial paper that is sold in private placements under Section 4(2) of the Securities Act, may be deemed liquid by the Series’ Subadviser under the guidelines adopted by the Directors of the Series. However, the liquidity of the Series’ investments in Rule 144A securities could be impaired if trading does not develop or declines.
Foreign Currency Translation: The books and records of the Series are maintained in U.S. dollars. Foreign currency amounts are translated into U.S. dollars on the following basis:
(i) market value of investment securities, other assets and liabilities—at the current rates of exchange;
(ii) purchases and sales of investment securities, income and expenses—at the rates of exchange prevailing on the respective dates of such transactions.
Although the net assets of the Series are presented at the foreign exchange rates and market values at the close of the period, the Series does not generally isolate that portion of the results of operations arising as a result of changes in the foreign exchange rates from the fluctuations arising from changes in the market prices of long-term portfolio securities held at the end of the period. Similarly, the Series does not isolate the effect of changes in foreign exchange rates from the fluctuations arising from changes in the market prices of long-term portfolio securities sold during the period. Accordingly, holding period realized foreign currency gains (losses) are included in the reported net realized gains (losses) on investment transactions.
Net realized gains (losses) on foreign currency transactions represent net foreign exchange gains (losses) from the disposition of holdings of foreign currencies, forward currency contracts, currency gains (losses) realized between the trade and settlement dates on securities transactions, and the difference between the amounts of interest, dividends and foreign withholding taxes recorded on the Series’ books and the U.S. dollar equivalent amounts actually received or paid. Net unrealized currency gains (losses) from valuing foreign currency denominated assets and liabilities (other than investments) at period end exchange rates are reflected as a component of net unrealized appreciation (depreciation) on foreign currencies.
| 32 |
Master Netting Arrangements: The Series is subject to various Master Agreements, or netting arrangements, with select counterparties. These are agreements which a subadviser may have negotiated and entered into on behalf of the Series. A master netting arrangement between the Series and the counterparty permits the Series to offset amounts payable by the Series to the same counterparty against amounts to be received; and by the receipt of collateral from the counterparty by the Series to cover the Series’ exposure to the counterparty. However, there is no assurance that such mitigating factors are easily enforceable. In addition to master netting arrangements, the right to set-off exists when all the conditions are met such that each of the parties owes the other determinable amounts, the reporting party has the right to set-off the amount owed with the amount owed by the other party, the reporting party intends to set-off and the right of set-off is enforceable by law. During the reporting period, there was no intention to settle on a net basis and all amounts are presented on a gross basis on the Statement of Assets and Liabilities.
Rights: The Series may hold rights acquired either through a direct purchase, included as part of a private placement, or pursuant to corporate actions. Rights entitle the holder to buy a proportionate amount of common stock, or such other security that the issuer may specify, at a specific price and time through the expiration dates. Such rights are held as long positions by the Series until exercised, sold or expired. Rights are valued at fair value in accordance with the Board approved fair valuation procedures.
Securities Lending: The Series may lend its portfolio securities to banks and broker-dealers. The loans are secured by collateral at least equal to the market value of the securities loaned. Collateral pledged by each borrower is invested in an affiliated money market fund and is marked to market daily, based on the previous day’s market value, such that the value of the collateral exceeds the value of the loaned securities. Loans are subject to termination at the option of the borrower or the Series. Upon termination of the loan, the borrower will return to the Series securities identical to the loaned securities. Should the borrower of the securities fail financially, the Series has the right to repurchase the securities in the open market using the collateral. The Series recognizes income, net of any rebate and securities lending agent fees, for lending its securities in the form of fees or interest on the investment of any cash received as collateral. The borrower receives all interest and dividends from the securities loaned and such payments are passed back to the lender in amounts equivalent thereto. The Series also continues to recognize any unrealized gain (loss) in the market price of the securities loaned and on the change in the value of the collateral invested that may occur during the term of the loan. In addition, realized gain (loss) is recognized on changes in the value of the collateral invested upon liquidation of the collateral. Net earnings from securities lending are disclosed on the Statement of Operations as “Income from securities lending, net”.
Concentration of Risk: Foreign security and currency transactions may involve certain considerations and risks not typically associated with those of domestic origin as a result of, among other factors, the possibility of political or economic instability or the level of governmental supervision and regulation of foreign securities markets.
| Prudential Jennison Global Infrastructure Fund | 33 |
Notes to Financial Statements (continued)
Equity and Mortgage Real Estate Investment Trusts (REITs): The Series invests in equity REITs, which report information on the source of their distributions annually. Based on current and historical information, a portion of distributions received from equity REITs during the period is estimated to be dividend income, capital gain or return of capital and recorded accordingly. When material, these estimates are adjusted periodically when the actual source of distributions is disclosed by the equity REITs.
Concentration of Risk for REITs: Real estate securities are subject to the same risks as direct investments in real estate and mortgages, and their value will depend on the value of the underlying properties or the underlying loans or interests. The underlying loans may be subject to the risks of default or of prepayments that occur earlier or later than expected, and such loans may also include so-called “subprime” mortgages. The value of these securities will rise and fall in response to many factors, including economic conditions, the demand for rental property and interest rates. In particular, the value of these securities may decline when interest rates rise and will also be affected by the real estate market and by the management of the underlying properties.
In addition, investing in REITs involves certain unique risks in addition to those risks associated with investing in the real estate industry in general. Equity REITs may be affected by changes in the value of the underlying property owned by the REITs, while mortgage REITs may be affected by the quality of any credit extended. REITs are dependent upon management skills, may not be diversified geographically or by property/mortgage asset type, and are subject to heavy cash flow dependency, default by borrowers and self-liquidation. REITs may be more volatile and/or more illiquid than other types of equity securities. REITs (especially mortgage REITs) are subject to interest rate risks. REITs may incur significant amounts of leverage. The Series will indirectly bear a portion of the expenses, including management fees, paid by each REIT in which it invests, in addition to the expenses of the Series.
Master Limited Partnerships (MLPs): The Series invests in MLPs. Distributions received from the Series’ investment in MLPs generally are comprised of income and return of capital. The Series records investment income and return of capital based on estimates made at the time such distributions are received. Such estimates are based on historical information available from each MLP and other industry sources. These estimates may subsequently be revised based on information received from MLPs after their respective tax reporting periods have concluded.
Securities Transactions and Net Investment Income: Securities transactions are recorded on the trade date. Realized gains (losses) from investment and currency transactions are calculated on the specific identification method. Dividend income is recorded on the ex-date. Interest income, including amortization of premium and accretion of discount on debt
| 34 |
securities, as required, is recorded on the accrual basis. Expenses are recorded on an accrual basis, which may require the use of certain estimates by management that may differ from actual.
Net investment income or loss (other than distribution fees which are charged directly to the respective class and transfer agency fees specific to Class Q shares which are charged to that share class) and unrealized and realized gains (losses) are allocated daily to each class of shares based upon the relative proportion of adjusted net assets of each class at the beginning of the day.
Taxes: It is the Series’ policy to continue to meet the requirements of the Internal Revenue Code applicable to regulated investment companies and to distribute all of its taxable net investment income and capital gains, if any, to its shareholders. Therefore, no federal income tax provision is required. Withholding taxes on foreign dividends, interest and capital gains, if any, are recorded, net of reclaimable amounts, at the time the related income is earned.
Dividends and Distributions: The Series expects to pay dividends from net investment income quarterly and distributions from net realized capital and currency gains, if any, annually. Dividends and distributions to shareholders, which are determined in accordance with federal income tax regulations and which may differ from generally accepted accounting principles, are recorded on the ex-date. Permanent book/tax differences relating to income and gain (loss) are reclassified amongst undistributed net investment income, accumulated net realized gain (loss) and paid-in capital in excess of par, as appropriate.
Estimates: The preparation of financial statements requires management to make estimates and assumptions that affect the reported amounts and disclosures in the financial statements. Actual results could differ from those estimates.
2. Agreements
The Fund, on behalf of the Series, has a management agreement with PGIM Investments. Pursuant to this agreement, PGIM Investments has responsibility for all investment advisory services and supervises the subadviser’s performance of such services. PGIM Investments has entered into a subadvisory agreement with Jennison Associates LLC (“Jennison”). The subadvisory agreement provides that Jennison will furnish investment advisory services in connection with the management of the Series. In connection therewith, Jennison is obligated to keep certain books and records of the Series. PGIM Investments pays for the services of Jennison, the cost of compensation of officers of the Series, occupancy and certain clerical and bookkeeping costs of the Series. The Series bears all other costs and expenses.
Effective July 1, 2017, the management fee paid to PGIM Investments is accrued daily and payable monthly, at an annual rate of 1.00% of the Series’ average daily net assets up to $1 billion, .98% of the next $2 billion, .96% of the next $2 billion, .95% of the next
| Prudential Jennison Global Infrastructure Fund | 35 |
Notes to Financial Statements (continued)
$5 billion and .94% of the Series’ average daily net assets in excess of $10 billion. Prior to July 1, 2017, the management fee paid to PGIM Investments was accrued daily and payable monthly at an annual rate of 1.00% of the Series average daily net assets. The effective management fee rate before any waivers and/or expense reimbursement was 1.00% for the year ended October 31, 2017. The effective management fee rate net of waivers and/or expense reimbursement was .77%.
PGIM Investments has contractually agreed through February 28, 2019 to limit the net annual operating expenses (exclusive of distribution and service (12b-1) fees, taxes (such as income and foreign withholdings taxes, stamp duty and deferred tax expenses), interest, underlying funds, brokerage, extraordinary and certain other expenses such as dividend, broker charges and interest expense on short sales) of each class of shares of the Series to 1.25% of the Series’ average daily net assets. Expenses waived/reimbursed by the Manager in accordance with this agreement may be recouped by the Manager within the same fiscal year during which such waiver/reimbursement is made if such recoupment can be realized without exceeding the expense limit in effect at the time of the recoupment for that fiscal year.
The Fund, on behalf of the Series, has a distribution agreement with Prudential Investment Management Services LLC (“PIMS”) which acts as the distributor of the Class A, Class C, Class Q and Class Z shares of the Series. The Series compensates PIMS for distributing and servicing the Series’ Class A and Class C shares, pursuant to plans of distribution (the “Distribution Plans”), regardless of expenses actually incurred by PIMS. The distribution fees are accrued daily and payable monthly. No distribution or service fees are paid to PIMS as distributor of the Class Q and Class Z shares of the Series.
Pursuant to the Distribution Plans, the Series compensates PIMS for distribution related activities at an annual rate of up to .30% and 1% of the average daily net assets of the Class A and C shares, respectively. PIMS has contractually agreed to limit such fees to .25% of the average daily net assets of the Class A shares through February 28, 2019.
PIMS has advised the Series that it has received $36,159 in front-end sales charges resulting from sales of Class A shares during the year ended October 31, 2017. From these fees, PIMS paid such sales charges to affiliated broker-dealers, which in turn paid commissions to salespersons and incurred other distribution costs.
PIMS has advised the Series that for the year ended October 31, 2017 it received $105 and $3,956 in contingent deferred sales charges imposed upon redemptions by certain Class A and Class C shareholders, respectively.
| 36 |
PGIM Investments, PIMS and Jennison are indirect, wholly-owned subsidiaries of Prudential Financial, Inc. (“Prudential”).
3. Other Transactions with Affiliates
Prudential Mutual Fund Services LLC (“PMFS”), an affiliate of PGIM Investments and an indirect, wholly-owned subsidiary of Prudential, serves as the Series’ transfer agent. Transfer agent’s fees and expenses in the Statement of Operations include certain out-of-pocket expenses paid to non-affiliates, where applicable.
The Series may enter into certain securities purchase or sale transactions under Board approved Rule 17a-7 procedures. Rule 17a-7 is an exemptive rule under the 1940 Act, that permits purchase and sale transactions among affiliated investment companies, or between an investment company and a person that is affiliated solely by reason of having a common (or affiliated) investment adviser, common directors, and/or common officers. Such transactions are subject to ratification by the Board. For the reporting period ended October 31, 2017 no such transactions were entered into by the Series.
The Series may invest its overnight sweep cash in the Prudential Core Ultra Short Bond Fund (the “Core Fund”), and its securities lending cash collateral in the Prudential Institutional Money Market Fund (the “Money Market Fund”), each a series of Prudential Investment Portfolios 2, registered under the 1940 Act and managed by PGIM Investments. For the reporting period ended October 31, 2017, PGIM, Inc. was compensated $162 by PGIM Investments for managing the Series’ securities lending cash collateral as subadviser to the Money Market Fund. Earnings from the Core Fund and Money Market Fund are disclosed on the Statement of Operations as “Affiliated dividend income” and “Income from securities lending, net”, respectively.
4. Portfolio Securities
The aggregate cost of purchases and proceeds from sales of portfolio securities (excluding short-term investments and U.S. Government securities) for the year ended October 31, 2017 were $52,816,354 and $49,283,234, respectively.
5. Distributions and Tax Information
Distributions to shareholders, which are determined in accordance with federal income tax regulations and which may differ from generally accepted accounting principles, are recorded on the ex-date. In order to present undistributed net investment income, accumulated net realized loss on investment and foreign currency transactions and paid-in capital in excess of par on the Statement of Assets and Liabilities that more closely represent their tax character, certain adjustments have been made to undistributed net investment income, accumulated net realized loss on investment and foreign currency transactions and paid-in capital in excess of par. For the year ended October 31, 2017, the adjustments were to decrease undistributed net investment income by $51,979, increase accumulated net
| Prudential Jennison Global Infrastructure Fund | 37 |
Notes to Financial Statements (continued)
realized loss on investment and foreign currency transactions by $31,840 and increase paid-in capital in excess of par by $83,819 due to differences in the treatment for book and tax purposes of certain transactions involving foreign currencies, partnership investments, and other book to tax differences. Net investment income, net realized gain on investment and foreign currencies transactions and net assets were not affected by this change.
For the year ended October 31, 2017, the tax character of dividends paid by the Series were $697,835 of ordinary income and $344,957 of tax return of capital. For the year ended October 31, 2016, the tax character of dividends paid by the Series was $475,796 of ordinary income and $545,480 of tax return of capital.
As of October 31, 2017, the Series had no undistributed earnings on a tax basis.
The United States federal income tax basis of the Series’ investments and the net unrealized appreciation as of October 31, 2017 were as follows:
Tax Basis | Gross | Gross | Net | |||
| $58,479,970 | $10,699,924 | $(589,444) | $10,110,480 |
The difference between book basis and tax basis was primarily due to deferred losses on wash sales, investments in partnerships and other book to tax differences.
For federal income tax purposes, the Series had a capital loss carryforward at October 31, 2017 of approximately $6,089,000 which can be carried forward for an unlimited period. During the year ended October 31, 2017, the Series utilized approximately $1,785,000 to offset capital gains. No capital gains distributions are expected to be paid to shareholders until net gains have been realized in excess of such losses.
Management has analyzed the Series’ tax positions taken on federal, state and local income tax returns for all open tax years and has concluded that no provision for income tax is required in the Series’ financial statements for the current reporting period. The Series’ federal, state and local income and federal excise tax returns for tax years for which the applicable statutes of limitations have not expired are subject to examination by the Internal Revenue Service and state departments of revenue.
6. Capital
The Series offers Class A, Class C, Class Q, and Class Z shares. Class A shares are sold with a maximum front-end sales charge of 5.50%. Investors who purchase $1 million or
| 38 |
more of Class A shares and sell these shares within 12 months of purchase are subject to a contingent deferred sales charge (“CDSC”) of 1%, although they are not subject to an initial sales charge. The Class A CDSC is waived for certain retirement and/or benefit plans. Class C shares are sold with a CDSC of 1% on sales made within 12 months of purchase. A special exchange privilege is also available for shareholders who qualified to purchase Class A shares at net asset value. Class Q and Class Z shares are not subject to any sales or redemption charge and are available exclusively for sale to a limited group of investors.
Under certain circumstances, an exchange may be made from specified share classes of the Series to one or more other share classes of the Series as presented in the table of transactions in shares of common stock.
The Fund is authorized to issue 4.8 billion shares of common stock, with a par value of $.01 per share, which is divided into seven series. There are 510 million shares authorized for the Series, divided into five classes, designated Class A, Class C, Class Q, Class Z and Class T common stock, each of which consists of 20 million, 100 million, 125 million, 150 million and 115 million authorized shares, respectively. The Series currently does not have any Class T shares outstanding.
As of October 31, 2017, Prudential through its affiliate entities, including affiliated funds, owned 1,683,505 shares of Class Q and 530,203 shares of Class Z. At reporting period end, five shareholders of record held 80% of the Series’ outstanding shares, of which 42% were held by the affiliates of Prudential.
Transactions in shares of common stock were as follows:
Class A | Shares | Amount | ||||||
Year ended October 31, 2017: | ||||||||
Shares sold | 279,822 | $ | 3,391,012 | |||||
Shares issued in reinvestment of dividends and distributions | 13,824 | 168,066 | ||||||
Shares reacquired | (184,608 | ) | (2,241,919 | ) | ||||
|
|
|
| |||||
Net increase (decrease) in shares outstanding before conversion | 109,038 | 1,317,159 | ||||||
Shares issued upon conversion from other share class(es) | 9,426 | 116,828 | ||||||
Shares reacquired upon conversion into other share class(es) | (280,568 | ) | (3,367,052 | ) | ||||
|
|
|
| |||||
Net increase (decrease) in shares outstanding | (162,104 | ) | $ | (1,933,065 | ) | |||
|
|
|
| |||||
Year ended October 31, 2016: | ||||||||
Shares sold | 168,191 | $ | 1,888,675 | |||||
Shares issued in reinvestment of dividends and distributions | 18,936 | 214,780 | ||||||
Shares reacquired† | (843,748 | ) | (9,350,430 | ) | ||||
|
|
|
| |||||
Net increase (decrease) in shares outstanding before conversion | (656,621 | ) | (7,246,975 | ) | ||||
Shares issued upon conversion from other share class(es) | 2,208 | 26,057 | ||||||
Shares reacquired upon conversion into other share class(es) | (235,790 | ) | (2,823,216 | ) | ||||
|
|
|
| |||||
Net increase (decrease) in shares outstanding | (890,203 | ) | $ | (10,044,134 | ) | |||
|
|
|
| |||||
| Prudential Jennison Global Infrastructure Fund | 39 |
Notes to Financial Statements (continued)
Class C | Shares | Amount | ||||||
Year ended October 31, 2017: | ||||||||
Shares sold | 143,195 | $ | 1,702,514 | |||||
Shares issued in reinvestment of dividends and distributions | 4,347 | 52,151 | ||||||
Shares reacquired | (149,323 | ) | (1,820,597 | ) | ||||
|
|
|
| |||||
Net increase (decrease) in shares outstanding before conversion | (1,781 | ) | (65,932 | ) | ||||
Shares reacquired upon conversion into other share class(es) | (24,441 | ) | (298,815 | ) | ||||
|
|
|
| |||||
Net increase (decrease) in shares outstanding | (26,222 | ) | $ | (364,747 | ) | |||
|
|
|
| |||||
Year ended October 31, 2016: | ||||||||
Shares sold | 101,212 | $ | 1,168,296 | |||||
Shares issued in reinvestment of dividends and distributions | 3,649 | 40,323 | ||||||
Shares reacquired† | (197,310 | ) | (2,185,953 | ) | ||||
|
|
|
| |||||
Net increase (decrease) in shares outstanding before conversion | (92,449 | ) | (977,334 | ) | ||||
Shares reacquired upon conversion into other share class(es) | (3,951 | ) | (46,048 | ) | ||||
|
|
|
| |||||
Net increase (decrease) in shares outstanding | (96,400 | ) | $ | (1,023,382 | ) | |||
|
|
|
| |||||
Class Q | ||||||||
Period ended October 31, 2017*: | ||||||||
Shares sold | 851,072 | $ | 10,645,862 | |||||
Shares issued in reinvestment of dividends and distributions | 18,790 | 239,018 | ||||||
Shares reacquired† | (628,004 | ) | (7,836,176 | ) | ||||
|
|
|
| |||||
Net increase (decrease) in shares outstanding before conversion | 241,858 | 3,048,704 | ||||||
Shares issued upon conversion from other share class(es) | 1,441,647 | 16,420,354 | ||||||
|
|
|
| |||||
Net increase (decrease) in shares outstanding | 1,683,505 | $ | 19,469,058 | |||||
|
|
|
| |||||
Class Z | ||||||||
Year ended October 31, 2017: | ||||||||
Shares sold | 758,227 | $ | 9,087,558 | |||||
Shares issued in reinvestment of dividends and distributions | 45,023 | 542,551 | ||||||
Shares reacquired | (963,920 | ) | (11,483,699 | ) | ||||
|
|
|
| |||||
Net increase (decrease) in shares outstanding before conversion | (160,670 | ) | (1,853,590 | ) | ||||
Shares issued upon conversion from other share class(es) | 296,886 | 3,566,596 | ||||||
Shares reacquired upon conversion into other share class(es) | (1,443,112 | ) | (16,437,911 | ) | ||||
|
|
|
| |||||
Net increase (decrease) in shares outstanding | (1,306,896 | ) | $ | (14,724,905 | ) | |||
|
|
|
| |||||
Year ended October 31, 2016: | ||||||||
Shares sold | 1,234,281 | $ | 14,264,511 | |||||
Shares issued in reinvestment of dividends and distributions | 63,614 | 723,899 | ||||||
Shares reacquired† | (2,142,501 | ) | (23,688,836 | ) | ||||
|
|
|
| |||||
Net increase (decrease) in shares outstanding before conversion | (844,606 | ) | (8,700,426 | ) | ||||
Shares issued upon conversion from other share class(es) | 238,917 | 2,860,137 | ||||||
Shares reacquired upon conversion into other share class(es) | (1,431 | ) | (16,930 | ) | ||||
|
|
|
| |||||
Net increase (decrease) in shares outstanding | (607,120 | ) | $ | (5,857,219 | ) | |||
|
|
|
| |||||
| † | Includes affiliated redemptions of 1,019 shares with a value of $11,243 for Class A shares, 1,008 shares with a value of $11,065 for Class C shares, 887 shares with a value of $11,576 for Class Q shares and 1,024 shares with a value of $11,296 for Class Z shares. |
| * | Commencement of operations was December 28, 2016. |
| 40 |
7. Borrowings
The Fund, on behalf of the Series, along with other affiliated registered investment companies (the “Funds”), is a party to a Syndicated Credit Agreement (“SCA”) with a group of banks. The purpose of the SCA is to provide an alternative source of temporary funding for capital share redemptions. The SCA provides for a commitment of $900 million for the period October 5, 2017 through October 4, 2018. The Funds pay an annualized commitment fee of .15% of the unused portion of the SCA. The Series’ portion of the commitment fee for the unused amount, allocated based upon a method approved by the Board, is accrued daily and paid quarterly. Prior to October 5, 2017, the Funds had another SCA that provided a commitment of $900 million and the Funds paid an annualized commitment fee of .15% of the unused portion of the SCA. The interest on borrowings under the SCAs is paid monthly and at a per annum interest rate based upon a contractual spread plus the higher of (1) the effective federal funds rate, (2) the 1-month LIBOR rate or (3) zero percent.
Other affiliated registered investment companies that are parties to the SCA include portfolios that are subject to a predetermined mathematical formula used to manage certain benefit guarantees offered under variable annuity contracts. The formula may result in large scale asset flows into and out of these portfolios. Consequently, these portfolios may be more likely to utilize the SCA for purposes of funding redemptions. It may be possible for those portfolios to fully exhaust the committed amount of the SCA, thereby requiring the Manager to allocate available funding per a Board-approved methodology designed to treat the Funds in the SCA equitably.
The Series utilized the SCA during the reporting period ended October 31, 2017. The average daily balance for the 5 days that the Series had loans outstanding during the period was $1,071,000 borrowed at a weighted average interest rate of 2.03%. The maximum loan balance outstanding during the period was $1,071,000. At October 31, 2017, the Series did not have an outstanding loan balance.
8. Other
At the Fund’s Board meeting in March 2017, the Board approved a change in the methodology of allocating certain expenses, such as Transfer Agent fees (including sub-transfer agent and networking fees) and Blue Sky fees. PGIM Investments implemented the changes effective November 1, 2017.
| Prudential Jennison Global Infrastructure Fund | 41 |
Financial Highlights
| Class A Shares | ||||||||||||||||||||||||
| Year Ended October 31, | September 25, 2013(b) through October 31, | |||||||||||||||||||||||
| 2017 | 2016 | 2015 | 2014 | 2013 | ||||||||||||||||||||
| Per Share Operating Performance(c): | ||||||||||||||||||||||||
| Net Asset Value, Beginning of Period | $11.61 | $11.48 | $12.62 | $10.42 | $10.00 | |||||||||||||||||||
| Income (loss) from investment operations: | ||||||||||||||||||||||||
| Net investment income (loss) | .14 | .09 | .06 | .09 | - | (g) | ||||||||||||||||||
| Net realized and unrealized gain (loss) on investments | 1.49 | .21 | (1.12 | ) | 2.26 | .42 | ||||||||||||||||||
| Total from investment operations | 1.63 | .30 | (1.06 | ) | 2.35 | .42 | ||||||||||||||||||
| Less Dividends and Distributions: | ||||||||||||||||||||||||
| Dividends from net investment income | (.13 | ) | (.08 | ) | (.05 | ) | (.14 | ) | - | |||||||||||||||
| Tax return of capital distributions | (.06 | ) | (.09 | ) | (.03 | ) | - | - | ||||||||||||||||
| Distributions from net realized gains | - | - | - | (.01 | ) | - | ||||||||||||||||||
| Total dividends and distributions | (.19 | ) | (.17 | ) | (.08 | ) | (.15 | ) | - | |||||||||||||||
| Net Asset Value, end of period | $13.05 | $11.61 | $11.48 | $12.62 | $10.42 | |||||||||||||||||||
| Total Return(a): | 14.15% | 2.62% | (8.46)% | 22.67% | 4.20% | |||||||||||||||||||
| Ratios/Supplemental Data: | ||||||||||||||||||||||||
| Net assets, end of period (000) | $11,689 | $12,277 | $22,353 | $15,521 | $21 | |||||||||||||||||||
| Average net assets (000) | $11,433 | $16,694 | $22,695 | $4,906 | $17 | |||||||||||||||||||
| Ratios to average net assets(d): | ||||||||||||||||||||||||
| Expenses after waivers and/or expense reimbursement | 1.50% | 1.50% | 1.50% | 1.50% | 1.50% | (e) | ||||||||||||||||||
| Expenses before waivers and/or expense reimbursement | 1.81% | 1.79% | 1.78% | 1.95% | 25.87% | (e) | ||||||||||||||||||
| Net investment income (loss) | 1.10% | .76% | .52% | .73% | .28% | (e) | ||||||||||||||||||
| Portfolio turnover rate | 80% | 82% | 94% | 49% | 10% | (f) | ||||||||||||||||||
| (a) | Total return does not consider the effect of sales loads. Total return is calculated assuming a purchase of a share on the first day and a sale on the last day of each period reported and includes reinvestment of dividends and distributions, if any. Total returns may reflect adjustments to conform to generally accepted accounting principles. Total returns for periods less than one full year are not annualized. |
| (b) | Commencement of operations. |
| (c) | Calculated based on the average shares outstanding during the period. |
| (d) | Does not include expenses of the underlying portfolios in which the Series invests. |
| (e) | Annualized. |
| (f) | Not Annualized. |
| (g) | Less than $.005. |
See Notes to Financial Statements.
| 42 |
| Class C Shares | ||||||||||||||||||||||||
| Year Ended October 31, | September 25, 2013(b) through October 31, | |||||||||||||||||||||||
| 2017 | 2016 | 2015 | 2014 | 2013 | ||||||||||||||||||||
| Per Share Operating Performance(c): | ||||||||||||||||||||||||
| Net Asset Value, Beginning of Period | $11.55 | $11.42 | $12.58 | $10.41 | $10.00 | |||||||||||||||||||
| Income (loss) from investment operations: | ||||||||||||||||||||||||
| Net investment income (loss) | .04 | - | (g) | (.03 | ) | .01 | .01 | |||||||||||||||||
| Net realized and unrealized gain (loss) on investments | 1.50 | .21 | (1.13 | ) | 2.25 | .40 | ||||||||||||||||||
| Total from investment operations | 1.54 | .21 | (1.16 | ) | 2.26 | .41 | ||||||||||||||||||
| Less Dividends and Distributions: | ||||||||||||||||||||||||
| Dividends from net investment income | (.08 | ) | (.04 | ) | - | (g) | (.08 | ) | - | |||||||||||||||
| Tax return of capital distributions | (.04 | ) | (.04 | ) | - | (g) | - | - | ||||||||||||||||
| Distributions from net realized gains | - | - | - | (.01 | ) | - | ||||||||||||||||||
| Total dividends and distributions | (.12 | ) | (.08 | ) | - | (.09 | ) | - | ||||||||||||||||
| Net Asset Value, end of period | $12.97 | $11.55 | $11.42 | $12.58 | $10.41 | |||||||||||||||||||
| Total Return(a): | 13.39% | 1.88% | (9.21)% | 21.76% | 4.10% | |||||||||||||||||||
| Ratios/Supplemental Data: | ||||||||||||||||||||||||
| Net assets, end of period (000) | $6,101 | $5,738 | $6,775 | $3,835 | $40 | |||||||||||||||||||
| Average net assets (000) | $6,111 | $5,783 | $6,353 | $1,104 | $17 | |||||||||||||||||||
| Ratios to average net assets(d): | ||||||||||||||||||||||||
| Expenses after waivers and/or expense reimbursement | 2.25% | 2.25% | 2.25% | 2.25% | 2.25% | (e) | ||||||||||||||||||
| Expenses before waivers and/or expense reimbursement | 2.51% | 2.49% | 2.48% | 2.70% | 38.05% | (e) | ||||||||||||||||||
| Net investment income (loss) | .34% | (.02)% | (.22)% | .12% | .52% | (e) | ||||||||||||||||||
| Portfolio turnover rate | 80% | 82% | 94% | 49% | 10% | (f) | ||||||||||||||||||
| (a) | Total return does not consider the effect of sales loads. Total return is calculated assuming a purchase of a share on the first day and a sale on the last day of each period reported and includes reinvestment of dividends and distributions, if any. Total returns may reflect adjustments to conform to generally accepted accounting principles. Total returns for periods less than one full year are not annualized. |
| (b) | Commencement of operations. |
| (c) | Calculated based on the average shares outstanding during the period. |
| (d) | Does not include expenses of the underlying portfolios in which the Series invests. |
| (e) | Annualized. |
| (f) | Not Annualized. |
| (g) | Less than $.005. |
See Notes to Financial Statements.
| Prudential Jennison Global Infrastructure Fund | 43 |
Financial Highlights (continued)
| Class Q Shares | ||||
December 28, October 31, 2017 | ||||
| Per Share Operating Performance(b): | ||||
| Net Asset Value, Beginning of Period | $11.39 | |||
| Income (loss) from investment operations: | ||||
| Net investment income (loss) | .11 | |||
| Net realized and unrealized gain (loss) on investment transactions | 1.71 | |||
| Total from investment operations | 1.82 | |||
| Less Dividends and Distributions: | ||||
| Dividends from net investment Income | (.10 | ) | ||
| Tax return of capital distributions | (.05 | ) | ||
| Total dividends and distributions | (.15 | ) | ||
| Net asset value, end of period | $13.06 | |||
| Total Return(c): | 16.02% | |||
| Ratios/Supplemental Data: | ||||
| Net assets, end of period (000) | $21,979 | |||
| Average net assets (000) | $19,274 | |||
| Ratios to average net assets(d): | ||||
| Expenses after waivers and/or expense reimbursement | 1.25% | (e) | ||
| Expenses before waivers and/or expense reimbursement | 1.40% | (e) | ||
| Net investment income (loss) | 1.00% | (e) | ||
| Portfolio turnover rate | 80% | (f) | ||
| (a) | Commencement of operations. |
| (b) | Calculated based on average shares outstanding during the period. |
| (c) | Total return is calculated assuming a purchase of a share on the first day and a sale on the last day of each period reported and includes reinvestment of dividends and distributions, if any. Total returns may reflect adjustments to conform to generally accepted accounting principles. Total returns for periods less than one full year are not annualized. |
| (d) | Does not include expenses of the underlying portfolios in which the Series invests. |
| (e) | Annualized. |
| (f) | Not annualized. |
See Notes to Financial Statements.
| 44 |
| Class Z Shares | ||||||||||||||||||||||||
Year Ended October 31, | September 25, 2013(b) through October 31, | |||||||||||||||||||||||
| 2017 | 2016 | 2015 | 2014 | 2013 | ||||||||||||||||||||
| Per Share Operating Performance(c): | ||||||||||||||||||||||||
| Net Asset Value, Beginning of Period | $11.61 | $11.47 | $12.62 | $10.42 | $10.00 | |||||||||||||||||||
| Income (loss) from investment operations: | ||||||||||||||||||||||||
| Net investment income (loss) | .18 | .11 | .09 | .22 | .01 | |||||||||||||||||||
| Net realized and unrealized gain (loss) on investments | 1.49 | .23 | (1.13 | ) | 2.15 | .41 | ||||||||||||||||||
| Total from investment operations | 1.67 | .34 | (1.04 | ) | 2.37 | .42 | ||||||||||||||||||
| Less Dividends and Distributions: | ||||||||||||||||||||||||
| Dividends from net investment income | (.14 | ) | (.09 | ) | (.08 | ) | (.16 | ) | - | |||||||||||||||
| Tax return of capital distributions | (.08 | ) | (.11 | ) | (.03 | ) | - | - | ||||||||||||||||
| Distributions from net realized gains | - | - | - | (.01 | ) | - | ||||||||||||||||||
| Total dividends and distributions | (.22 | ) | (.20 | ) | (.11 | ) | (.17 | ) | - | |||||||||||||||
| Net Asset Value, end of period | $13.06 | $11.61 | $11.47 | $12.62 | $10.42 | |||||||||||||||||||
| Total Return(a): | 14.51% | 2.96% | (8.28)% | 22.91% | 4.20% | |||||||||||||||||||
| Ratios/Supplemental Data: | ||||||||||||||||||||||||
| Net assets, end of period (000) | $28,831 | $40,811 | $47,305 | $31,788 | $5,247 | |||||||||||||||||||
| Average net assets (000) | $29,597 | $40,236 | $42,210 | $20,117 | $5,113 | |||||||||||||||||||
| Ratios to average net assets(d): | ||||||||||||||||||||||||
| Expenses after waivers and/or expense reimbursement | 1.25% | 1.25% | 1.25% | 1.25% | 1.25% | (e) | ||||||||||||||||||
| Expenses before waivers and/or expense reimbursement | 1.51% | 1.49% | 1.48% | 2.08% | 22.65% | (e) | ||||||||||||||||||
| Net investment income (loss) | 1.49% | .94% | .75% | 1.79% | .56% | (e) | ||||||||||||||||||
| Portfolio turnover rate | 80% | 82% | 94% | 49% | 10% | (f) | ||||||||||||||||||
| (a) | Total return is calculated assuming a purchase of a share on the first day and a sale on the last day of each period reported and includes reinvestment of dividends and distributions, if any. Total returns may reflect adjustments to conform to generally accepted accounting principles. Total returns for periods less than one full year are not annualized. |
| (b) | Commencement of operations. |
| (c) | Calculated based on the average shares outstanding during the period. |
| (d) | Does not include expenses of the underlying portfolios in which the Series invests. |
| (e) | Annualized. |
| (f) | Not Annualized. |
See Notes to Financial Statements.
| Prudential Jennison Global Infrastructure Fund | 45 |
Report of Independent Registered Public
Accounting Firm
The Board of Directors and Shareholders
Prudential World Fund, Inc.:
We have audited the accompanying statement of assets and liabilities of Prudential Jennison Global Infrastructure Fund (the “Fund”), a series of Prudential World Fund, Inc., including the portfolio of investments, as of October 31, 2017, and the related statement of operations for the year then ended, the statements of changes in net assets for each of the years in the two-year period then ended, and the financial highlights for each of the years or periods in the five-year period then ended. These financial statements and financial highlights are the responsibility of the Fund’s management. Our responsibility is to express an opinion on these financial statements and financial highlights based on our audits.
We conducted our audits in accordance with the standards of the Public Company Accounting Oversight Board (United States). Those standards require that we plan and perform the audit to obtain reasonable assurance about whether the financial statements and financial highlights are free of material misstatement. An audit includes examining, on a test basis, evidence supporting the amounts and disclosures in the financial statements. Our procedures included confirmation of securities owned as of October 31, 2017, by correspondence with the custodian, transfer agent and brokers or by other appropriate auditing procedures when replies from brokers were not received. An audit also includes assessing the accounting principles used and significant estimates made by management, as well as evaluating the overall financial statement presentation. We believe that our audits provide a reasonable basis for our opinion.
In our opinion, the financial statements and financial highlights referred to above present fairly, in all material respects, the financial position of the Fund as of October 31, 2017, and the results of its operations, the changes in its net assets, and the financial highlights for each of the years or periods described in the first paragraph, in conformity with U.S. generally accepted accounting principles.

New York, New York
December 15, 2017
| 46 |
Federal Income Tax Information (unaudited)
For the year ended October 31, 2017, the Series reports under Section 854 of the Internal Revenue Code, the following percentages of the ordinary income dividends paid as 1) qualified dividend income (QDI); and 2) eligible for corporate dividends received deduction (DRD):
| QDI | DRD | |||||||
Prudential Jennison Global Infrastructure Fund | 100.00 | % | 80.65 | % | ||||
For the year ended October 31, 2017, the Series made an election to pass through the maximum amount of the portion of the ordinary income dividends paid derived from foreign source income as well as any foreign taxes paid by the Series in accordance with Section 853 of the Internal Revenue Code of the following amounts: $94,468 foreign tax credit from recognized foreign source income of $1,215,024.
In January 2018, you will be advised on IRS Form 1099-DIV or substitute 1099-DIV, as to the federal tax status of dividends and distributions received by you in calendar year 2017.
| Prudential Jennison Global Infrastructure Fund | 47 |
INFORMATION ABOUT BOARD MEMBERS AND OFFICERS
(Unaudited)
Information about Board Members and Officers of the Fund is set forth below. Board Members who are not deemed to be “interested persons” of the Fund, as defined in the 1940 Act, are referred to as “Independent Board Members.” Board Members who are deemed to be “interested persons” of the Fund are referred to as “Interested Board Members.” The Board Members are responsible for the overall supervision of the operations of the Fund and perform the various duties imposed on the directors of investment companies by the 1940 Act. The Board in turn elects the Officers, who are responsible for administering the day-to-day operations of the Fund.
| Independent Board Members(1) | ||||
Name, Address, Age Position(s) Portfolios Overseen | Principal Occupation(s) During Past Five Years | Other Directorships Held During Past Five Years | ||
Ellen S. Alberding (59) Board Member Portfolios Overseen: 89 | President and Board Member, The Joyce Foundation (charitable foundation) (since 2002); Vice Chair, City Colleges of Chicago (community college system) (since 2011); Trustee, Skills for America’s Future (national initiative to connect employers to community colleges) (since 2011); Trustee, National Park Foundation (charitable foundation for national park system) (since 2009); Trustee, Economic Club of Chicago (since 2009). | None. | ||
Kevin J. Bannon (65) Board Member Portfolios Overseen: 89 | Retired; Managing Director (April 2008-May 2015) and Chief Investment Officer (October 2008-November 2013) of Highmount Capital LLC (registered investment adviser); formerly Executive Vice President and Chief Investment Officer (April 1993-August 2007) of Bank of New York Company; President (May 2003-May 2007) of BNY Hamilton Family of Mutual Funds. | Director of Urstadt Biddle Properties (equity real estate investment trust) (since September 2008). | ||
Linda W. Bynoe (65) Board Member Portfolios Overseen: 89 | President and Chief Executive Officer (since March 1995) and formerly Chief Operating Officer (December 1989-February 1995) of Telemat Ltd. (management consulting); formerly Vice President (January 1985-June 1989) at Morgan Stanley & Co. (broker-dealer). | Director of Simon Property Group, Inc. (retail real estate) (May 2003-May 2012); Director of Anixter International, Inc. (communication products distributor) (since January 2006); Director of Northern Trust Corporation (financial services) (since April 2006); Trustee of Equity Residential (residential real estate) (since December 2009). | ||
Prudential Jennison Global Infrastructure Fund
| Independent Board Members(1) | ||||
Name, Address, Age Position(s) Portfolios Overseen | Principal Occupation(s) During Past Five Years | Other Directorships Held During Past Five Years | ||
Barry H. Evans (57)± Board Member Portfolios Overseen: 89 | Retired; Formerly President (2005-2016), Global Chief Operating Officer (2014-2016), Chief Investment Officer-Global Head of Fixed Income (1998-2014), and various portfolio manager roles (1986-2006), Manulife Asset Management U.S. | Director, Manulife Trust Company (2011-present); Director, Manulife Asset Management Limited (2015-present); Formerly Chairman of the Board of Directors of Manulife Asset Management U.S. (2005-2016); Formerly Chairman of the Board, Declaration Investment Management and Research (2008-2016). | ||
Keith F. Hartstein (61) Board Member & Independent Chair Portfolios Overseen: 89 | Retired; Member (since November 2014) of the Governing Council of the Independent Directors Council (organization of independent mutual fund directors); formerly President and Chief Executive Officer (2005-2012), Senior Vice President (2004-2005), Senior Vice President of Sales and Marketing (1997-2004), and various executive management positions (1990-1997), John Hancock Funds, LLC (asset management); Chairman, Investment Company Institute’s Sales Force Marketing Committee (2003-2008). | None. | ||
Laurie Simon Hodrick (55)± Board Member Portfolios Overseen: 89 | A. Barton Hepburn Professor of Economics in the Faculty of Business, Columbia Business School (since 1996); Visiting Professor of Law and Rock Center for Corporate Governance Fellow, Stanford Law School (since 2015); Visiting Fellow, Hoover Institution, Stanford University (since 2015); Sole Member, ReidCourt LLC (since 2008) (a consulting firm); Formerly Managing Director, Global Head of Alternative Investment Strategies, Deutsche Bank (2006-2008); Formerly Director/Trustee, Merrill Lynch Investment Managers Funds (1999-2006). | Independent Director, Corporate Capital Trust (since April 2017) (a business development company). | ||
Michael S. Hyland, CFA (72) Board Member Portfolios Overseen: 89 | Retired (since February 2005); formerly Senior Managing Director (July 2001-February 2005) of Bear Stearns & Co, Inc.; Global Partner, INVESCO (1999-2001); Managing Director and President of Salomon Brothers Asset Management (1989-1999). | None. | ||
Visit our website at pgiminvestments.com
| Independent Board Members(1) | ||||
Name, Address, Age Position(s) Portfolios Overseen | Principal Occupation(s) During Past Five Years | Other Directorships Held During Past Five Years | ||
Richard A. Redeker (74) Board Member & Independent Vice Chair9 Portfolios Overseen: 87 | Retired Mutual Fund Senior Executive (47 years); Management Consultant; Director, Mutual Fund Directors Forum (since 2014); Independent Directors Council (organization of independent mutual fund directors)-Executive Committee, Chair of Policy Steering Committee, Governing Council. | None. | ||
Stephen G. Stoneburn (74) Board Member Portfolios Overseen: 89 | Chairman (since July 2011), President and Chief Executive Officer (since June 1996) of Frontline Medical Communications (publishing company); formerly President (June 1995-June 1996) of Argus Integrated Media, Inc.; Senior Vice President and Managing Director (January 1993-1995) of Cowles Business Media; Senior Vice President of Fairchild Publications, Inc. (1975-1989). | None. | ||
± Mr. Evans and Ms. Hodrick joined the Board effective as of September 1, 2017.
| Interested Board Members(1) | ||||
Name, Address, Age Position(s) Portfolios Overseen | Principal Occupation(s) During Past Five Years | Other Directorships Held During Past Five Years | ||
Stuart S. Parker (55) Board Member & President Portfolios Overseen: 89 | President of PGIM Investments LLC (formerly known as Prudential Investments LLC) (since January 2012); Executive Vice President of Prudential Investment Management Services LLC (since December 2012); Executive Vice President of Jennison Associates LLC and Head of Retail Distribution of PGIM Investments LLC (June 2005-December 2011). | None. | ||
Prudential Jennison Global Infrastructure Fund
| Interested Board Members(1) | ||||
Name, Address, Age Position(s) Portfolios Overseen | Principal Occupation(s) During Past Five Years | Other Directorships Held During Past Five Years | ||
Scott E. Benjamin (44) Board Member & Vice President Portfolios Overseen: 89 | Executive Vice President (since June 2009) of PGIM Investments LLC; Executive Vice President (June 2009-June 2012) and Vice President (since June 2012) of Prudential Investment Management Services LLC; Executive Vice President (since September 2009) of AST Investment Services, Inc.; Senior Vice President of Product Development and Marketing, PGIM Investments (since February 2006); Vice President of Product Development and Product Management, Prudential Investments (2003-2006). | None. | ||
Grace C. Torres* (58) Board Member Portfolios Overseen: 88 | Retired; formerly Treasurer and Principal Financial and Accounting Officer of the Prudential Funds, Target Funds, Advanced Series Trust, Prudential Variable Contract Accounts and The Prudential Series Fund (1998-June 2014); Assistant Treasurer (March 1999-June 2014) and Senior Vice President (September 1999-June 2014) of PGIM Investments LLC; Assistant Treasurer (May 2003-June 2014) and Vice President (June 2005-June 2014) of AST Investment Services, Inc.; Senior Vice President and Assistant Treasurer (May 2003-June 2014) of Prudential Annuities Advisory Services, Inc. | Director (since July 2015) of Sun Bancorp, Inc. N.A. and Sun National Bank | ||
* Note: Prior to her retirement in 2014, Ms. Torres was employed by PGIM Investments LLC. Due to her prior employment, she is considered to be an “interested person” under the 1940 Act. Ms. Torres is a Non-Management Interested Board Member.
(1) The year that each Board Member joined the Board is as follows:
Ellen S. Alberding; 2013; Kevin J. Bannon, 2008; Linda W. Bynoe, 2005; Barry H. Evans, 2017; Keith F. Hartstein, 2013; Laurie Simon Hodrick, 2017; Michael S. Hyland, 2008; Richard A. Redeker, 2003; Stephen G. Stoneburn, 1996; Grace C. Torres, 2014; Stuart S. Parker, Board Member and President since 2012; Scott E. Benjamin, Board Member since 2010 and Vice President since 2009.
Visit our website at pgiminvestments.com
| Fund Officers(a) | ||||
Name, Address and Age Position with Fund | Principal Occupation(s) During Past Five Years | Length of Service as Fund Officer | ||
Raymond A. O’Hara (62) Chief Legal Officer | Vice President and Corporate Counsel (since July 2010) of Prudential Insurance Company of America (Prudential); Vice President (March 2011-Present) of Pruco Life Insurance Company and Pruco Life Insurance Company of New Jersey; Vice President and Corporate Counsel (March 2011-Present) of Prudential Annuities Life Assurance Corporation; Chief Legal Officer of PGIM Investments LLC (since June 2012); Chief Legal Officer of Prudential Mutual Fund Services LLC (since June 2012) and Corporate Counsel of AST Investment Services, Inc. (since June 2012); formerly Assistant Vice President and Corporate Counsel (September 2008-July 2010) of The Hartford Financial Services Group, Inc.; formerly Associate (September 1980-December 1987) and Partner (January 1988-August 2008) of Blazzard & Hasenauer, P.C. (formerly, Blazzard, Grodd & Hasenauer, P.C.). | Since 2012 | ||
Chad A. Earnst (42) Chief Compliance Officer | Chief Compliance Officer (September 2014-Present) of PGIM Investments LLC; Chief Compliance Officer (September 2014-Present) of the Prudential Funds, Target Funds, Advanced Series Trust, The Prudential Series Fund, Prudential’s Gibraltar Fund, Inc., Prudential Global Short Duration High Yield Income Fund, Inc., Prudential Short Duration High Yield Fund, Inc. and Prudential Jennison MLP Income Fund, Inc.; formerly Assistant Director (March 2010-August 2014) of the Asset Management Unit, Division of Enforcement, US Securities & Exchange Commission; Assistant Regional Director (January 2010-August 2014), Branch Chief (June 2006-December 2009) and Senior Counsel (April 2003-May 2006) of the Miami Regional Office, Division of Enforcement, US Securities & Exchange Commission. | Since 2014 | ||
Deborah A. Docs (59) Secretary | Vice President and Corporate Counsel (since January 2001) of Prudential; Vice President (since December 1996) and Assistant Secretary (since March 1999) of PGIM Investments LLC; formerly Vice President and Assistant Secretary (May 2003-June 2005) of AST Investment Services, Inc. | Since 2004 | ||
Jonathan D. Shain (59) Assistant Secretary | Vice President and Corporate Counsel (since August 1998) of Prudential; Vice President and Assistant Secretary (since May 2001) of PGIM Investments LLC; Vice President and Assistant Secretary (since February 2001) of Prudential Mutual Fund Services LLC; formerly Vice President and Assistant Secretary (May 2003-June 2005) of AST Investment Services, Inc. | Since 2005 | ||
Claudia DiGiacomo (43) Assistant Secretary | Vice President and Corporate Counsel (since January 2005) of Prudential; Vice President and Assistant Secretary of PGIM Investments LLC (since December 2005); Associate at Sidley Austin Brown & Wood LLP (1999-2004). | Since 2005 | ||
Prudential Jennison Global Infrastructure Fund
| Fund Officers(a) | ||||
Name, Address and Age Position with Fund | Principal Occupation(s) During Past Five Years | Length of Service as Fund Officer | ||
Andrew R. French (54) Assistant Secretary | Vice President and Corporate Counsel (since February 2010) of Prudential; formerly Director and Corporate Counsel (2006-2010) of Prudential; Vice President and Assistant Secretary (since January 2007) of PGIM Investments LLC; Vice President and Assistant Secretary (since January 2007) of Prudential Mutual Fund Services LLC. | Since 2006 | ||
Charles H. Smith (44) Anti-Money Laundering Compliance Officer | Vice President, Corporate Compliance, Anti-Money Laundering Unit (since January 2015) of Prudential; committee member of the American Council of Life Insurers Anti-Money Laundering and Critical Infrastructure Committee (since January 2016); formerly Global Head of Economic Sanctions Compliance at AIG Property Casualty (February 2007-December 2014); Assistant Attorney General at the New York State Attorney General’s Office, Division of Public Advocacy. (August 1998-January 2007). | Since 2016 | ||
M. Sadiq Peshimam (53) Treasurer and Principal Financial and Accounting Officer | �� | Vice President (since 2005) of PGIM Investments LLC; formerly Assistant Treasurer of funds in the Prudential Mutual Fund Complex (2006-2014). | Since 2006 | |
Peter Parrella (59) Assistant Treasurer | Vice President (since 2007) and Director (2004-2007) within Prudential Mutual Fund Administration; formerly Tax Manager at SSB Citi Fund Management LLC (1997-2004). | Since 2007 | ||
Lana Lomuti (50) Assistant Treasurer | Vice President (since 2007) and Director (2005-2007), within Prudential Mutual Fund Administration; formerly Assistant Treasurer (December 2007-February 2014) of The Greater China Fund, Inc. | Since 2014 | ||
Linda McMullin (56) Assistant Treasurer | Vice President (since 2011) and Director (2008-2011) within Prudential Mutual Fund Administration. | Since 2014 | ||
Kelly A. Coyne (49) Assistant Treasurer | Director, Investment Operations of Prudential Mutual Fund Services LLC (since 2010). | Since 2015 | ||
(a) Excludes Mr. Parker and Mr. Benjamin, interested Board Members who also serve as President and Vice President, respectively.
Explanatory Notes to Tables:
| ∎ | Board Members are deemed to be “Interested,” as defined in the 1940 Act, by reason of their affiliation with PGIM Investments LLC and/or an affiliate of PGIM Investments LLC. |
| ∎ | Unless otherwise noted, the address of all Board Members and Officers is c/o PGIM Investments LLC, 655 Broad Street, Newark, New Jersey 07102-4410. |
| ∎ | There is no set term of office for Board Members or Officers. The Board Members have adopted a retirement policy, which calls for the retirement of Board Members on December 31 of the year in which they reach the age of 75. |
| ∎ | “Other Directorships Held” includes only directorships of companies required to register or file reports with the SEC under the 1934 Act (that is, “public companies”) or other investment companies registered under the 1940 Act. |
| ∎ | “Portfolios Overseen” includes all investment companies managed by PGIM Investments LLC. The investment companies for which PGIM Investments LLC serves as manager include the Prudential Mutual Funds, The Prudential Variable Contract Accounts, Target Mutual Funds, Prudential Short Duration High Yield Fund, Inc., Prudential Global Short Duration High Yield Fund, Inc., The Prudential Series Fund, Prudential’s Gibraltar Fund, Inc. and the Advanced Series Trust. |
Visit our website at pgiminvestments.com
Approval of Advisory Agreements (unaudited)
The Fund’s Board of Directors
The Board of Directors (the “Board”) of Prudential Jennison Global Infrastructure Fund (the “Fund”)1 consists of twelve individuals, nine of whom are not “interested persons” of the Fund, as defined in the Investment Company Act of 1940, as amended (the “1940 Act”) (the “Independent Directors”). The Board is responsible for the oversight of the Fund and its operations, and performs the various duties imposed on the directors of investment companies by the 1940 Act. The Independent Directors have retained independent legal counsel to assist them in connection with their duties. The Chair of the Board is an Independent Director. The Board has established four standing committees: the Audit Committee, the Nominating and Governance Committee, and two Investment Committees. Each committee is chaired by, and composed of, Independent Directors.
Annual Approval of the Fund’s Advisory Agreements
As required under the 1940 Act, the Board determines annually whether to renew the Fund’s management agreement with PGIM Investments LLC (“PGIM Investments”) and the Fund’s subadvisory agreement with Jennison Associates LLC (“Jennison”). In considering the renewal of the agreements, the Board, including all of the Independent Directors,2 met on June 6-8, 2017 and approved the renewal of the agreements through July 31, 2018, after concluding that the renewal of the agreements was in the best interests of the Fund and its shareholders.
In advance of the meetings, the Board requested and received materials relating to the agreements, and had the opportunity to ask questions and request further information in connection with their consideration. Among other things, the Board considered comparative fee information from PGIM Investments and Jennison. Also, the Board considered comparisons with other mutual funds in relevant Peer Universes and Peer Groups, as is further discussed below.
In approving the agreements, the Board, including the Independent Directors advised by independent legal counsel, considered the factors it deemed relevant, including the nature, quality and extent of services provided by PGIM Investments and the subadviser, the performance of the Fund, the profitability of PGIM Investments and its affiliates, expenses and fees, and the potential for economies of scale that may be shared with the Fund and its shareholders as the Fund’s assets grow. In their deliberations, the Directors did not identify
any single factor which alone was responsible for the Board’s decision to approve the
| 1 | Prudential Jennison Global Infrastructure Fund is a series of Prudential World Fund, Inc. |
| 2 | Barry H. Evans and Laurie Simon Hodrick joined the Board effective as of September 1, 2017. Neither Mr. Evans nor Ms. Hodrick participated in the consideration of the renewal of the advisory agreements. |
| Prudential Jennison Global Infrastructure Fund | ||
Approval of Advisory Agreements (continued)
agreements with respect to the Fund. In connection with its deliberations, the Board considered information provided by PGIM Investments throughout the year at regular Board meetings, presentations from portfolio managers and other information, as well as information furnished at or in advance of the meetings on June 6-8, 2017.
The Directors determined that the overall arrangements between the Fund and PGIM Investments, which serves as the Fund’s investment manager pursuant to a management agreement, and between PGIM Investments and Jennison, which serves as the Fund’s subadviser pursuant to the terms of a subadvisory agreement with PGIM Investments, are in the best interests of the Fund and its shareholders in light of the services performed, fees charged and such other matters as the Directors considered relevant in the exercise of their business judgment.
The material factors and conclusions that formed the basis for the Directors’ reaching their determinations to approve the continuance of the agreements are separately discussed below.
Nature, Quality and Extent of Services
The Board received and considered information regarding the nature, quality and extent of services provided to the Fund by PGIM Investments and Jennison. The Board considered the services provided by PGIM Investments, including but not limited to the oversight of the subadviser for the Fund, as well as the provision of fund recordkeeping, compliance, and other services to the Fund. With respect to PGIM Investments’ oversight of the subadviser, the Board noted that PGIM Investments’ Strategic Investment Research Group (“SIRG”), which is a business unit of PGIM Investments, is responsible for monitoring and reporting to PGIM Investments’ senior management on the performance and operations of the subadviser. The Board also considered that PGIM Investments pays the salaries of all of the officers and interested Directors of the Fund who are part of Fund management. The Board also considered the investment subadvisory services provided by Jennison, as well as adherence to the Fund’s investment restrictions and compliance with applicable Fund policies and procedures. The Board considered PGIM Investments’ evaluation of the subadviser, as well as PGIM Investments’ recommendation, based on its review of the subadviser, to renew the subadvisory agreement.
The Board considered the qualifications, backgrounds and responsibilities of PGIM Investments’ senior management responsible for the oversight of the Fund and Jennison, and also considered the qualifications, backgrounds and responsibilities of Jennison’s portfolio managers who are responsible for the day-to-day management of the Fund’s portfolio. The Board was provided with information pertaining to PGIM Investments’ and Jennison’s organizational structure, senior management, investment operations, and other relevant information pertaining to both PGIM Investments and Jennison. The Board also
| Visit our website at pgiminvestments.com |
noted that it received favorable compliance reports from the Fund’s Chief Compliance Officer (“CCO”) as to both PGIM Investments and Jennison. The Board noted that Jennison is affiliated with PGIM Investments.
The Board concluded that it was satisfied with the nature, extent and quality of the investment management services provided by PGIM Investments and the subadvisory services provided to the Fund by Jennison, and that there was a reasonable basis on which to conclude that the Fund benefits from the services provided by PGIM Investments and Jennison under the management and subadvisory agreements.
Costs of Services and Profits Realized by PGIM Investments
The Board was provided with information on the profitability of PGIM Investments and its affiliates in serving as the Fund’s investment manager. The Board discussed with PGIM Investments the methodology utilized in assembling the information regarding profitability and considered its reasonableness. The Board recognized that it is difficult to make comparisons of profitability from fund management contracts because comparative information is not generally publicly available and is affected by numerous factors, including the structure of the particular adviser, the types of funds it manages, its business mix, numerous assumptions regarding allocations and the adviser’s capital structure and cost of capital. However, the Board considered that the cost of services provided by PGIM Investments to the Fund during the year ended December 31, 2016 exceeded the management fees paid by the Fund, resulting in an operating loss to PGIM Investments. The Board further noted that the subadviser is affiliated with PGIM Investments and that its profitability is reflected in PGIM Investments’ profitability report. Taking these factors into account, the Board concluded that the profitability of PGIM Investments and its affiliates in relation to the services rendered was not unreasonable.
Economies of Scale
The Board received and discussed information concerning economies of scale that PGIM Investments may realize as the Fund’s assets grow beyond current levels. The Board considered information provided by PGIM Investments regarding the launch date of the Fund, the management fees of the Fund compared to those of similarly managed funds and PGIM Investments’ investment in the Fund over time. The Board noted that economies of scale, if any, may be shared with the Fund in several ways, including low management fees from inception, additional technological and personnel investments to enhance shareholder services, and maintaining existing expense structures in the face of a rising cost environment. The Board considered PGIM Investments’ assertion that it continually evaluates the management fee schedule of the Fund and the potential to share economies of scale through breakpoints or fee waivers as asset levels increase.
| Prudential Jennison Global Infrastructure Fund | ||
Approval of Advisory Agreements (continued)
The Board recognized the inherent limitations of any analysis of economies of scale, stemming largely from the Board’s understanding that most of PGIM Investments’ costs are not specific to individual funds, but rather are incurred across a variety of products and services.
Other Benefits to PGIM Investments and Jennison
The Board considered potential ancillary benefits that might be received by PGIM Investments and Jennison and their affiliates as a result of their relationship with the Fund. The Board concluded that potential benefits to be derived by PGIM Investments included transfer agency fees received by the Fund’s transfer agent (which is affiliated with PGIM Investments), benefits to its reputation as well as other intangible benefits resulting from PGIM Investments’ association with the Fund. The Board concluded that the potential benefits to be derived by Jennison included its ability to use soft dollar credits, as well as the potential benefits consistent with those generally resulting from an increase in assets under management, specifically, potential access to additional research resources and benefits to its reputation. The Board concluded that the benefits derived by PGIM Investments and Jennison were consistent with the types of benefits generally derived by investment managers and subadvisers to mutual funds.
Performance of the Fund / Fees and Expenses
The Board considered certain additional specific factors and made related conclusions relating to the historical performance of the Fund for the one-year period ended December 31, 2016. The Board considered that the Fund commenced operations on September 25, 2013 and that longer-term performance was not yet available.
The Board also considered the Fund’s actual management fee, as well as the Fund’s net total expense ratio, for the fiscal year ended October 31, 2016. The Board considered the management fee for the Fund as compared to the management fee charged by PGIM Investments to other funds and the fee charged by other advisers to comparable mutual funds in a Peer Group. The actual management fee represents the fee rate actually paid by Fund shareholders and includes any fee waivers or reimbursements. The net total expense ratio for the Fund represents the actual expense ratio incurred by Fund shareholders.
The mutual funds included in the Peer Universe (the Lipper Global Infrastructure Performance Universe), which was used to consider performance, and the Peer Group, which was used to consider fees and expenses, were objectively determined by Broadridge, an independent provider of mutual fund data. The comparisons placed the Fund in various quartiles, with the first quartile being the best 25% of the mutual funds (for performance, the best performing mutual funds and, for expenses, the lowest cost mutual funds).
| Visit our website at pgiminvestments.com |
The section below summarizes key factors considered by the Board and the Board’s conclusions regarding the Fund’s performance, fees and overall expenses. The table sets forth gross performance comparisons (which do not reflect the impact on performance of fund expenses, or any subsidies, expense caps or waivers that may be applicable) with the Peer Universe, actual management fees with the Peer Group (which reflect the impact of any subsidies or fee waivers), and net total expenses with the Peer Group, each of which were key factors considered by the Board.
| Performance | 1 Year | 3 Years | 5 Years | 10 Years | ||||
3rd Quartile | 3rd Quartile | N/A | N/A | |||||
| Actual Management Fees: 2nd Quartile | ||||||||
| Net Total Expenses: 4th Quartile | ||||||||
| • | The Board noted that the Fund outperformed its benchmark index over the three-year period. |
| • | The Board considered PGIM Investments’ assertion that, due to the small size of the Peer Universe, the Fund’s performance against its benchmark index was a more relevant measure of the Fund’s performance. In that regard, the Board considered information that the Fund outperformed its benchmark index over the one- and three-year periods ended March 31, 2017. |
| • | The Board noted information provided by PGIM Investments indicating that the Fund’s fourth quartile net total expense rank was attributable to the smaller asset size of the Fund in comparison to the other funds in the Peer Group. |
| • | The Board and PGIM Investments agreed to continue the Fund’s existing expense cap, which caps the Fund’s annual operating expenses at 1.25% (exclusive of 12b-1 and certain other fees), through February 28, 2018. |
| • | The Board and PGIM Investments agreed to permanently reduce the Fund’s management fee schedule. The current management fee is 1.00% of average daily net assets. The new management fee schedule will be 1.00% of average daily net assets to $1 billion, 0.98% of average daily net assets from $1 billion to $3 billion, 0.96% of average daily net assets from $3 billion to $5 billion, 0.95% of average daily net assets from $5 billion to $10 billion, and 0.94% of average daily net assets over $10 billion. |
| • | The Board concluded that, in light of the above, it would be in the best interests of the Fund and its shareholders to renew the agreements with the permanent reduction of the management fee schedule. |
| • | The Board concluded that the management fees (including subadvisory fees) and total expenses were reasonable in light of the services provided. |
* * *
After full consideration of these factors, the Board concluded that approval of the agreements was in the best interests of the Fund and its shareholders.
| Prudential Jennison Global Infrastructure Fund | ||
| ∎ TELEPHONE | ∎ WEBSITE | |||
655 Broad Street Newark, NJ 07102 | (800) 225-1852 | www.pgiminvestments.com |
| PROXY VOTING |
| The Board of Directors of the Fund has delegated to the Fund’s investment subadviser the responsibility for voting any proxies and maintaining proxy recordkeeping with respect to the Fund. A description of these proxy voting policies and procedures is available without charge, upon request, by calling (800) 225-1852. Information regarding how the Fund voted proxies relating to portfolio securities during the most recent 12-month period ended June 30 is available on the Fund’s website and on the Securities and Exchange Commission’s website. |
| DIRECTORS |
| Ellen S. Alberding • Kevin J. Bannon • Scott E. Benjamin • Linda W. Bynoe • Barry H. Evans • Keith F. Hartstein • Laurie Simon Hodrick • Michael S. Hyland • Stuart S. Parker • Richard A. Redeker • Stephen G. Stoneburn • Grace C. Torres |
| OFFICERS |
| Stuart S. Parker, President • Scott E. Benjamin, Vice President • M. Sadiq Peshimam, Treasurer and Principal Financial and Accounting Officer • Raymond A. O’Hara, Chief Legal Officer • Deborah A. Docs, Secretary • Chad A. Earnst, Chief Compliance Officer • Charles H. Smith, Anti-Money Laundering Compliance Officer • Jonathan D. Shain, Assistant Secretary • Claudia DiGiacomo, Assistant Secretary • Andrew R. French, Assistant Secretary • Peter Parrella, Assistant Treasurer • Lana Lomuti, Assistant Treasurer • Linda McMullin, Assistant Treasurer • Kelly A. Coyne, Assistant Treasurer |
| MANAGER | PGIM Investments LLC | 655 Broad Street Newark, NJ 07102 | ||
| ||||
| INVESTMENT SUBADVISER | Jennison Associates LLC | 466 Lexington Avenue New York, NY 10017 | ||
| ||||
| DISTRIBUTOR | Prudential Investment Management Services LLC | 655 Broad Street Newark, NJ 07102 | ||
| ||||
| CUSTODIAN | The Bank of New York Mellon | 225 Liberty Street New York, NY 10286 | ||
| ||||
| TRANSFER AGENT | Prudential Mutual Fund Services LLC | PO Box 9658 Providence, RI 02940 | ||
| ||||
| INDEPENDENT REGISTERED PUBLIC ACCOUNTING FIRM | KPMG LLP | 345 Park Avenue New York, NY 10154 | ||
| ||||
| FUND COUNSEL | Willkie Farr & Gallagher LLP | 787 Seventh Avenue New York, NY 10019 | ||
| ||||
| An investor should consider the investment objectives, risks, charges, and expenses of the Fund carefully before investing. The prospectus and summary prospectus contain this and other information about the Fund. An investor may obtain a prospectus and summary prospectus by visiting our website at www.pgiminvestments.com or by calling (800) 225-1852. The prospectus and summary prospectus should be read carefully before investing. |
| E-DELIVERY |
| To receive your mutual fund documents online, go to www.pgiminvestments.com/edelivery and enroll. Instead of receiving printed documents by mail, you will receive notification via email when new materials are available. You can cancel your enrollment or change your email address at any time by visiting the website address above. |
| SHAREHOLDER COMMUNICATIONS WITH DIRECTORS |
| Shareholders can communicate directly with the Board of Directors by writing to the Chair of the Board, Prudential Jennison Global Infrastructure Fund, PGIM Investments, Attn: Board of Directors, 655 Broad Street, Newark, NJ 07102. Shareholders can communicate directly with an individual Director by writing to the same address. Communications are not screened before being delivered to the addressee. |
| AVAILABILITY OF PORTFOLIO SCHEDULE |
| The Fund files its complete schedule of portfolio holdings with the Securities and Exchange Commission for the first and third quarters of each fiscal year on Form N-Q. The Fund’s Forms N-Q are available on the Commission’s website at www.sec.gov. The Fund’s Forms N-Q may also be reviewed and copied at the Commission’s Public Reference Room in Washington, D.C. Information on the operation and location of the Public Reference Room may be obtained by calling 1-800-SEC-0330. The Fund’s schedule of portfolio holdings is also available on the Fund’s website as of the end of each month no sooner than 15 days after the end of the month. |
| The Fund’s Statement of Additional Information contains additional information about the Fund’s Directors and is available without charge, upon request, by calling (800) 225-1852. |
Mutual Funds:
| ARE NOT INSURED BY THE FDIC OR ANY FEDERAL GOVERNMENT AGENCY | MAY LOSE VALUE | ARE NOT A DEPOSIT OF OR GUARANTEED BY ANY BANK OR ANY BANK AFFILIATE |
PRUDENTIAL JENNISON GLOBAL INFRASTRUCTURE FUND
| SHARE CLASS | A | C | Q | Z | ||||
| NASDAQ | PGJAX | PGJCX | PGJQX | PGJZX | ||||
| CUSIP | 743969792 | 743969784 | 743969560 | 743969776 |
MF217E
Item 2 – Code of Ethics — See Exhibit (a)
As of the end of the period covered by this report, the registrant has adopted a code of ethics (the “Section 406 Standards for Investment Companies – Ethical Standards for Principal Executive and Financial Officers”) that applies to the registrant’s Principal Executive Officer and Principal Financial Officer; the registrant’s Principal Financial Officer also serves as the Principal Accounting Officer.
The registrant hereby undertakes to provide any person, without charge, upon request, a copy of the code of ethics. To request a copy of the code of ethics, contact the registrant 800-225-1852, and ask for a copy of the Section 406 Standards for Investment Companies - Ethical Standards for Principal Executive and Financial Officers.
Item 3 – Audit Committee Financial Expert –
The registrant’s Board has determined that Mr. Kevin J. Bannon, member of the Board’s Audit Committee is an “audit committee financial expert,” and that he is “independent,” for purposes of this Item.
Item 4 – Principal Accountant Fees and Services –
(a) Audit Fees
For the fiscal years ended October 31, 2017 and October 31, 2016, KPMG LLP (“KPMG”), the Registrant’s principal accountant, billed the Registrant $211,075 and $218,104 respectively, for professional services rendered for the audit of the Registrant’s annual financial statements or services that are normally provided in connection with statutory and regulatory filings. In addition to the above, $18,000 of audit fees billed by KPMG were paid by PGIM Investments and/or its affiliates for the fiscal year ended October 31, 2017.
(b) Audit-Related Fees
For the fiscal years ended October 31, 2017 and October 31, 2016: none.
(c) Tax Fees
For the fiscal years ended October 31, 2017 and October 31, 2016: none.
(d) All Other Fees
For the fiscal years ended October 31, 2017 and October 31, 2016: none.
(e) (1) Audit Committee Pre-Approval Policies and Procedures
THE PRUDENTIAL MUTUAL FUNDS
AUDIT COMMITTEE POLICY
on
Pre-Approval of Services Provided by the Independent Accountants
The Audit Committee of each Prudential Mutual Fund is charged with the responsibility to monitor the independence of the Fund’s independent accountants. As part of this responsibility, the Audit Committee must pre-approve the independent accounting firm’s engagement to render audit and/or permissible non-audit services, as required by law. In evaluating a proposed engagement of the independent accountants, the Audit Committee will assess the effect that the engagement might reasonably be expected to have on the accountant’s independence. The Committee’s evaluation will be based on:
| • | a review of the nature of the professional services expected to be provided, |
| • | a review of the safeguards put into place by the accounting firm to safeguard independence, and |
| • | periodic meetings with the accounting firm. |
Policy for Audit and Non-Audit Services Provided to the Funds
On an annual basis, the scope of audits for each Fund, audit fees and expenses, and audit-related and non-audit services (and fees proposed in respect thereof) proposed to be performed by the Fund’s independent accountants will be presented by the Treasurer and the independent accountants to the Audit Committee for review and, as appropriate, approval prior to the initiation of such services. Such presentation shall be accompanied by confirmation by both the Treasurer and the independent accountants that the proposed non-audit services will not adversely affect the independence of the independent accountants. Such proposed non-audit services shall be described in sufficient detail to enable the Audit Committee to assess the appropriateness of such services and fees, and the compatibility of the provision of such services with the auditor’s independence. The Committee shall receive periodic reports on the progress of the audit and other services which are approved by the Committee or by the Committee Chair pursuant to authority delegated in this Policy.
The categories of services enumerated under “Audit Services”, “Audit-related Services”, and “Tax Services” are intended to provide guidance to the Treasurer and the independent accountants as to those categories of services which the Committee believes are generally consistent with the independence of the independent accountants and which the Committee (or the Committee Chair) would expect upon the presentation of specific proposals to pre-approve. The enumerated categories are not intended as an exclusive list of audit, audit-related or tax services, which the Committee (or the Committee Chair) would consider for pre-approval.
Audit Services
The following categories of audit services are considered to be consistent with the role of the Fund’s independent accountants:
| Ø | Annual Fund financial statement audits |
| Ø | Seed audits (related to new product filings, as required) |
| Ø | SEC and regulatory filings and consents |
Audit-related Services
The following categories of audit-related services are considered to be consistent with the role of the Fund’s independent accountants:
| Ø | Accounting consultations |
| Ø | Fund merger support services |
| Ø | Agreed Upon Procedure Reports |
| Ø | Attestation Reports |
| Ø | Other Internal Control Reports |
Individual audit-related services that fall within one of these categories (except for fund merger support services) and are not presented to the Audit Committee as part of the annual pre-approval process are subject to an authorized pre-approval by the Audit Committee so long as the estimated fee for those services does not exceed $30,000. Any services provided under such pre-approval will be reported to the Audit Committee at its next regular meeting. Should the amount of such services exceed $30,000 any additional fees will be subject to pre-approval by the Committee Chair (or any other Committee member on whom this responsibility has been delegated). Fees related to fund merger support services are subject to a separate authorized pre-approval by the Audit Committee with fees determined on a per occurrence and merger complexity basis.
Tax Services
The following categories of tax services are considered to be consistent with the role of the Fund’s independent accountants:
| Ø | Tax compliance services related to the filing or amendment of the following: |
| ◾ Federal, state and local income tax compliance; and, |
| ◾ Sales and use tax compliance |
| Ø | Timely RIC qualification reviews |
| Ø | Tax distribution analysis and planning |
| Ø | Tax authority examination services |
| Ø | Tax appeals support services |
| Ø | Accounting methods studies |
| Ø | Fund merger support services |
| Ø | Tax consulting services and related projects |
Individual tax services that fall within one of these categories and are not presented to the Audit Committee as part of the annual pre-approval process are subject to an authorized pre-approval by the Audit Committee so long as the estimated fee for those services does not exceed $30,000. Any services provided under such pre-approval will be reported to the Audit Committee at its next regular meeting. Should the amount of such services exceed $30,000 any additional fees will be subject to pre-approval by the Committee Chair (or any other Committee member on whom this responsibility has been delegated).
Other Non-Audit Services
Certain non-audit services that the independent accountants are legally permitted to render will be subject to pre-approval by the Committee or by one or more Committee members to whom the Committee has
delegated this authority and who will report to the full Committee any pre-approval decisions made pursuant to this Policy. Non-audit services presented for pre-approval pursuant to this paragraph will be accompanied by a confirmation from both the Treasurer and the independent accountants that the proposed services will not adversely affect the independence of the independent accountants.
Proscribed Services
The Fund’s independent accountants will not render services in the following categories of non-audit services:
| Ø | Bookkeeping or other services related to the accounting records or financial statements of the Fund |
| Ø | Financial information systems design and implementation |
| Ø | Appraisal or valuation services, fairness opinions, or contribution-in-kind reports |
| Ø | Actuarial services |
| Ø | Internal audit outsourcing services |
| Ø | Management functions or human resources |
| Ø | Broker or dealer, investment adviser, or investment banking services |
| Ø | Legal services and expert services unrelated to the audit |
| Ø | Any other service that the Public Company Accounting Oversight Board determines, by regulation, is impermissible. |
Pre-approval of Non-Audit Services Provided to Other Entities Within the Prudential Fund Complex
Certain non-audit services provided to PGIM Investments LLC or any of its affiliates that also provide ongoing services to the Prudential Mutual Funds will be subject to pre-approval by the Audit Committee. The only non-audit services provided to these entities that will require pre-approval are those related directly to the operations and financial reporting of the Funds. Individual projects that are not presented to the Audit Committee as part of the annual pre-approval process will be subject to pre-approval by the Committee Chair (or any other Committee member on whom this responsibility has been delegated) so long as the estimated fee for those services does not exceed $30,000. Services presented for pre-approval pursuant to this paragraph will be accompanied by a confirmation from both the Treasurer and the independent accountants that the proposed services will not adversely affect the independence of the independent accountants.
Although the Audit Committee will not pre-approve all services provided to PGIM Investments LLC and its affiliates, the Committee will receive an annual report from the Fund’s independent accounting firm showing the aggregate fees for all services provided to PGIM Investments LLC and its affiliates.
(e) (2) Percentage of services referred to in 4(b) – 4(d) that were approved by the audit committee –
For the fiscal years ended October 31, 2017 and October 31, 2016: none.
(f) Percentage of hours expended attributable to work performed by other than full time employees of principal accountant if greater than 50%.
The percentage of hours expended on the principal accountant’s engagement to audit the registrant’s financial statements for the most recent fiscal year that were attributed to work performed by persons other than the principal accountant’s full-time, permanent employees was 0%.
(g) Non-Audit Fees
The aggregate non-audit fees billed by KPMG for services rendered to the registrant’s investment adviser and any entity controlling, controlled by, or under common control with the investment adviser that provides ongoing services to the registrant for the fiscal years ended October 31, 2017 and October 31, 2016 was $0 and $0, respectively.
(h) Principal Accountant’s Independence
Not applicable as KPMG has not provided non-audit services to the registrant’s investment adviser and any entity controlling, controlled by, or under common control with the investment adviser that provides ongoing services to the registrant that were not pre-approved pursuant to Rule 2-01(c)(7)(ii) of Regulation S-X.
| Item 5 – | Audit Committee of Listed Registrants – Not applicable. | |
| Item 6 – | Schedule of Investments – The schedule is included as part of the report to shareholders filed under Item 1 of this Form. | |
| Item 7 – | Disclosure of Proxy Voting Policies and Procedures for Closed-End Management Investment Companies – Not applicable. | |
| Item 8 – | Portfolio Managers of Closed-End Management Investment Companies – Not applicable. | |
| Item 9 – | Purchases of Equity Securities by Closed-End Management Investment Company and Affiliated Purchasers – Not applicable. | |
| Item 10 – | Submission of Matters to a Vote of Security Holders – Not applicable. | |
| Item 11 – | Controls and Procedures | |
| (a) | It is the conclusion of the registrant’s principal executive officer and principal financial officer that the effectiveness of the registrant’s current disclosure controls and procedures (such disclosure controls and procedures having been evaluated within 90 days of the date of this filing) provide reasonable assurance that the information required to be disclosed by the registrant has been recorded, processed, summarized and reported within the time period specified in the Commission’s rules and forms and that the information required to be disclosed by the registrant has been accumulated and communicated to the registrant’s principal executive officer and principal financial officer in order to allow timely decisions regarding required disclosure. |
| (b) | There has been no significant change in the registrant’s internal control over financial reporting that occurred during the registrant’s most recent fiscal quarter of the period covered by this report that has materially affected, or is likely to materially affect, the registrant’s internal control over financial reporting. |
Item 12 – Exhibits
| (a) | (1) Code of Ethics – Attached hereto as Exhibit EX-99.CODE-ETH |
| (2) | Certifications pursuant to Section 302 of the Sarbanes-Oxley Act – Attached hereto as Exhibit EX-99.CERT. |
| (3) | Any written solicitation to purchase securities under Rule 23c-1. – Not applicable. |
| (b) | Certifications pursuant to Section 906 of the Sarbanes-Oxley Act – Attached hereto as Exhibit EX-99.906CERT. |
SIGNATURES
Pursuant to the requirements of the Securities Exchange Act of 1934 and the Investment Company Act of 1940, the registrant has duly caused this report to be signed on its behalf by the undersigned, thereunto duly authorized.
| Registrant: | Prudential World Fund, Inc. | |
| By: | /s/ Deborah A. Docs | |
| Deborah A. Docs | ||
| Secretary | ||
| Date: | December 20, 2017 | |
Pursuant to the requirements of the Securities Exchange Act of 1934 and the Investment Company Act of 1940, this report has been signed below by the following persons on behalf of the registrant and in the capacities and on the dates indicated.
| By: | /s/ Stuart S. Parker | |
| Stuart S. Parker | ||
| President and Principal Executive Officer | ||
| Date: | December 20, 2017 | |
| By: | /s/ M. Sadiq Peshimam | |
| M. Sadiq Peshimam | ||
| Treasurer and Principal Financial and Accounting Officer | ||
| Date: | December 20, 2017 | |