UNITED STATES
SECURITIES AND EXCHANGE COMMISSION
Washington, D.C. 20549
FORM N-CSR
CERTIFIED SHAREHOLDER REPORT OF REGISTERED MANAGEMENT INVESTMENT COMPANIES
| | |
| Investment Company Act file number: | | 811-03981 |
| |
| Exact name of registrant as specified in charter: | | Prudential World Fund, Inc. |
| |
| Address of principal executive offices: | | 655 Broad Street, 17th Floor |
| | Newark, New Jersey 07102 |
| |
| Name and address of agent for service: | | Andrew R. French |
| | 655 Broad Street, 17th Floor |
| | Newark, New Jersey 07102 |
| |
| Registrant’s telephone number, including area code: | | 800-225-1852 |
| |
| Date of fiscal year end: | | 10/31/2018 |
| |
| Date of reporting period: | | 10/31/2018 |
Item 1 – Reports to Stockholders

PGIM QMA INTERNATIONAL EQUITY FUND
(Formerly known as Prudential QMA International Equity Fund)
ANNUAL REPORT
OCTOBER 31, 2018
COMING SOON: PAPERLESS SHAREHOLDER REPORTS
Beginning on January 1, 2021, as permitted by regulations adopted by the Securities and Exchange Commission, paper copies of the Fund’s annual and semi-annual shareholder reports will no longer be sent by mail, unless you specifically request paper copies of the reports. Instead, the reports will be made available on the Fund’s website (www.pgiminvestments.com), and you will be notified by mail each time a report is posted and provided with a website link to access the report.
If you already elected to receive shareholder reports electronically, you will not be affected by this change and you need not take any action. You may elect to receive shareholder reports and other communications from the Fund electronically anytime by contacting your financial intermediary (such as a broker-dealer or bank) or, if you are a direct investor, by calling 1-800-225-1852 or by sending an e-mail request to PGIM Investments at shareholderreports@pgim.com.
Beginning on January 1, 2019, you may elect to receive all future reports in paper free of charge. If you invest through a financial intermediary, you can contact your financial intermediary or follow instructions included with this notice to elect to continue to receive paper copies of your shareholder reports. If you invest directly with the Fund, you can call 1-800-225-1852 or send an email request to shareholderreports@pgim.com to let the Fund know you wish to continue receiving paper copies of your shareholder reports. Your election to receive reports in paper will apply to all funds held in your account if you invest through your financial intermediary or all funds held with the fund complex if you invest directly with the Fund.

To enroll in e-delivery, go to pgiminvestments.com/edelivery
|
| Objective: Long-term growth of capital |
Highlights (unaudited)
| • | | The Fund benefited from its stock selection in the large-cap universe, particularly in the financials sector and in emerging markets such as Brazil. |
| • | | China also contributed significantly to performance, driven by stock selection in financials and underweights in the consumer discretionary and information technology sectors, each of which declined. |
| • | | The Fund’s allocation to small caps, where stock selection was particularly challenging in developed markets such as Germany and the United Kingdom, detracted from results. |
| • | | Although valuation improved, particularly later on in the period, the component still lagged for the past 12 months. The performance was further hurt by the weakening of growth factors, which had been instrumental in tempering the valuation shortfall. |
This report is not authorized for distribution to prospective investors unless preceded or accompanied by a current prospectus.
The views expressed in this report and information about the Fund’s portfolio holdings are for the period covered by this report and are subject to change thereafter.
Mutual funds are distributed by Prudential Investment Management Services LLC, a Prudential Financial company and member SIPC. QMA is the primary business name of Quantitative Management Associates LLC, a registered investment adviser and a wholly owned subsidiary of PGIM, Inc., a Prudential Financial company. © 2018 Prudential Financial, Inc. and its related entities. PGIM and the PGIM logo are service marks of Prudential Financial, Inc. and its related entities, registered in many jurisdictions worldwide.
| | |
| 2 | | Visit our website at pgiminvestments.com |
PGIM FUNDS — UPDATE
The Board of Directors/Trustees for the Fund has approved the implementation of an automatic conversion feature for Class C shares, effective as of April 1, 2019. To reflect these changes, effective April 1, 2019, the section of the Fund’s Prospectus entitled “How to Buy, Sell and Exchange Fund Shares—How to Exchange Your Shares—Frequent Purchases and Redemptions of Fund Shares” is restated to read as follows:
This supplement should be read in conjunction with your Summary Prospectus, Statutory Prospectus and Statement of Additional Information, be retained for future reference and is in addition to any existing Fund supplements.
| | 1. | In each Fund’s Statutory Prospectus, the following is added at the end of the section entitled “Fund Distributions And Tax Issues—If You Sell or Exchange Your Shares”: |
Automatic Conversion of Class C Shares
The conversion of Class C shares into Class A shares—which happens automatically approximately 10 years after purchase—is not a taxable event for federal income tax purposes. For more information about the automatic conversion of Class C shares, see Class C Shares Automatically Convert to Class A Shares in How to Buy, Sell and Exchange Fund Shares.
| | 2. | In each Fund’s Statutory Prospectus, the following sentence is added at the end of the section entitled “How to Buy, Sell and Exchange Shares—Closure of Certain Share Classes to New Group Retirement Plans”: |
Shareholders owning Class C shares may continue to hold their Class C shares until the shares automatically convert to Class A shares under the conversion schedule, or until the shareholder redeems their Class C shares.
| | 3. | In each Fund’s Statutory Prospectus, the following disclosure is added immediately following the section entitled “How to Buy, Sell and Exchange Shares—How to Buy Shares—Class B Shares Automatically Convert to Class A Shares”: |
Class C Shares Automatically Convert to Class A Shares
Starting on or about April 1, 2019 (the “Effective Date”), Class C shares will be eligible for automatic conversion into Class A shares on a monthly basis approximately ten years after the original date of purchase (the “Conversion Date”). Conversion will take place based on the relative NAV of the two classes, without the imposition of any sales load, fee or other charge. All such automatic conversions of Class C shares will constitute tax-free exchanges for federal income tax purposes.
For shareholders investing in Class C shares through retirement plans or omnibus accounts, and in certain other instances, the Fund and its agents may not have
| | | | |
| PGIM QMA International Equity Fund | | | 3 | |
transparency into how long a shareholder has held Class C shares for purposes of determining whether such Class C shares are eligible for automatic conversion into Class A shares, and the relevant financial intermediary may not have the ability to track purchases in order to credit individual shareholders’ holding periods. In these circumstances, the Fund will not be able to automatically convert Class C shares into Class A shares as described above. In order to determine eligibility for conversion in these circumstances, it is the responsibility of the financial intermediary to notify the Fund that the shareholder is eligible for the conversion of Class C shares to Class A shares, and the financial intermediary may be required to maintain and provide the Fund with records that substantiate the holding period of Class C shares. It is the financial intermediary’s (and not the Fund’s) responsibility to keep records of transactions made in accounts it holds and to ensure that the shareholder is credited with the proper holding period based on such records or those provided to the financial intermediary by the shareholder. Please consult with your financial intermediary for the applicability of this conversion feature to your shares.
A financial intermediary may sponsor and/or control accounts, programs or platforms that impose a different conversion schedule or different eligibility requirements for the exchange of Class C shares for Class A shares (see Appendix A: Waivers and Discounts Available From Certain Financial Intermediaries of the Prospectus). Please consult with your financial intermediary if you have any questions regarding your shares’ conversion from Class C shares to Class A shares.
| | 4. | In Part II of each Fund’s Statement of Additional Information, the following disclosure is added immediately following the section entitled “Purchase, Redemption and Pricing of Fund Shares—Share Classes—Automatic Conversion of Class B Shares”: |
AUTOMATIC CONVERSION OF CLASS C SHARES. Starting on or about April 1, 2019 (the “Effective Date”), Class C shares will be eligible for automatic conversion into Class A shares on a monthly basis approximately ten years after the original date of purchase (the “Conversion Date”). Conversion will take place based on the relative NAV of the two classes, without the imposition of any sales load, fee or other charge. Class C shares of a Fund acquired through automatic reinvestment of dividends or distributions will convert to Class A shares of the Fund on the Conversion Date pro rata with the converting Class C shares of the Fund that were not acquired through reinvestment of dividends or distributions. All such automatic conversions of Class C shares will constitute tax-free exchanges for federal income tax purposes.
For shareholders investing in Class C shares through retirement plans or omnibus accounts, and in certain other instances, the Fund and its agents may not have transparency into how long a shareholder has held Class C shares for purposes of determining whether such Class C shares are eligible for automatic conversion into Class A shares, and the relevant financial intermediary may not have the ability to track purchases in order to credit individual shareholders’ holding periods. In these circumstances, the
| | |
| 4 | | Visit our website at pgiminvestments.com |
Fund will not be able to automatically convert Class C shares into Class A shares as described above. In order to determine eligibility for conversion in these circumstances, it is the responsibility of the financial intermediary to notify the Fund that the shareholder is eligible for the conversion of Class C shares to Class A shares, and the financial intermediary may be required to maintain and provide the Fund with records that substantiate the holding period of Class C shares. It is the financial intermediary’s (and not the Fund’s) responsibility to keep records of transactions made in accounts it holds and to ensure that the shareholder is credited with the proper holding period based on such records or those provided to the financial intermediary by the shareholder. Please consult with your financial intermediary for the applicability of this conversion feature to your shares.
Class C shares were generally closed to investments by new group retirement plans effective June 1, 2018. Group retirement plans (and their successor, related and affiliated plans) that have Class C shares of the Fund available to participants on or before the Effective Date may continue to open accounts for new participants in such share class and purchase additional shares in existing participant accounts.
The Fund has no responsibility for monitoring or implementing a financial intermediary’s process for determining whether a shareholder meets the required holding period for conversion. A financial intermediary may sponsor and/or control accounts, programs or platforms that impose a different conversion schedule or different eligibility requirements for the exchange of Class C shares for Class A shares, as set forth on Appendix A: Waivers and Discounts Available From Certain Financial Intermediaries of the Prospectus. In these cases, Class C shareholders may have their shares exchanged for Class A shares under the policies of the financial intermediary. Financial intermediaries will be responsible for making such exchanges in those circumstances. Please consult with your financial intermediary if you have any questions regarding your shares’ conversion from Class C shares to Class A shares.
LR1094
- Not part of the Annual Report -
| | | | |
| PGIM QMA International Equity Fund | | | 5 | |
Table of Contents
| | |
| 6 | | Visit our website at pgiminvestments.com |
Letter from the President

Dear Shareholder:
We hope you find the annual report for PGIM QMA International Equity Fund informative and useful. The report covers performance for the 12-month period that ended October 31, 2018.
We have important information to share with you. Effective June 11, 2018, Prudential Mutual Funds were renamed PGIM Funds. This renaming is part of our ongoing effort to further build our reputation and establish our global brand, which began when our firm adopted PGIM Investments as its name in April 2017. Please note that only the Fund’s name has changed. Your Fund’s management and operation, along with its symbols, remained the same.*
During the reporting period, the global economy continued to grow, and central banks gradually tightened monetary policy. In the US, the economy expanded and employment increased. In September, the Federal Reserve hiked interest rates for the eighth time since 2015, based on confidence in the economy.
Equity returns on the whole were strong, due to optimistic earnings expectations and investor sentiment. Global equities, including emerging markets, generally posted positive returns. However, they trailed the performance of US equities, which rose on higher corporate profits, new regulatory policies, and tax reform benefits. Volatility spiked briefly early in the period on inflation concerns, rising interest rates, and a potential global trade war, and again late in the period on worries that profit growth might slow in 2019.
The overall bond market declined modestly during the period, as measured by the Bloomberg Barclays US Aggregate Bond Index. The best performance came from higher-yielding, economically sensitive sectors, such as high yield bonds and bank loans, which posted small gains. US investment-grade corporate bonds and US Treasury bonds both finished the period with negative returns. A major trend during the period was the flattening of the US Treasury yield curve, which increased the yield on fixed income investments with shorter maturities and made them more attractive to investors.
Regarding your investments with PGIM, we believe it is important to maintain a diversified portfolio of funds consistent with your tolerance for risk, time horizon, and financial goals. Your financial advisor can help you create a diversified investment plan that may include funds covering all the basic asset classes and that reflects your personal investor profile and risk tolerance. However, diversification and asset allocation strategies do not assure a profit or protect against loss in declining markets.
At PGIM Investments, we consider it a great privilege and responsibility to help investors participate in opportunities across global markets while meeting their toughest investment challenges. PGIM is a top-10 global investment manager with more than $1 trillion in assets under management. This investment expertise allows us to deliver actively managed funds and strategies to meet the needs of investors around the globe.
Thank you for choosing our family of funds.
Sincerely,

Stuart S. Parker, President
PGIM QMA International Equity Fund
December 14, 2018
*The Prudential Day One Funds did not change their names.
| | | | |
| PGIM QMA International Equity Fund | | | 7 | |
Your Fund’s Performance (unaudited)
Performance data quoted represents past performance. Past performance does not guarantee future results. The investment return and principal value of an investment will fluctuate, so that an investor’s shares, when redeemed, may be worth more or less than their original cost. Current performance may be lower or higher than the past performance data quoted. An investor may obtain performance data as of the most recent month-end by visiting our website at www.pgiminvestments.com or by calling (800) 225-1852.
| | | | | | | | | | | | | | |
| | | Average Annual Total Returns as of 10/31/18 (with sales charges) | |
| | | One Year (%) | | Five Years (%) | | | Ten Years (%) | | | Since Inception (%) | |
| Class A | | –15.71 | | | –0.28 | | | | 5.42 | | | | — | |
| Class B | | –16.25 | | | –0.15 | | | | 5.22 | | | | — | |
| Class C | | –12.39 | | | 0.12 | | | | 5.27 | | | | — | |
| Class Z | | –10.59 | | | 1.15 | | | | 6.31 | | | | — | |
| Class R6* | | –10.43 | | | N/A | | | | N/A | | | | 7.34 (12/28/16) | |
| MSCI All Country World Ex-US Index | |
| | –8.24 | | | 1.63 | | | | 6.92 | | | | — | |
| Lipper International Multi-Cap Core Funds Average | |
| | | –8.49 | | | 1.67 | | | | 6.64 | | | | — | |
| | | | | | | | | | | | | | |
| | | Average Annual Total Returns as of 10/31/18 (without sales charges) | |
| | | One Year (%) | | Five Years (%) | | | Ten Years (%) | | | Since Inception (%) | |
| Class A | | –10.81 | | | 0.85 | | | | 6.02 | | | | — | |
| Class B | | –11.90 | | | 0.04 | | | | 5.22 | | | | — | |
| Class C | | –11.52 | | | 0.12 | | | | 5.27 | | | | — | |
| Class Z | | –10.59 | | | 1.15 | | | | 6.31 | | | | — | |
| Class R6* | | –10.43 | | | N/A | | | | N/A | | | | 7.34 (12/28/16) | |
| MSCI All Country World Ex-US Index | |
| | –8.24 | | | 1.63 | | | | 6.92 | | | | — | |
| Lipper International Multi-Cap Core Funds Average | |
| | | –8.49 | | | 1.67 | | | | 6.64 | | | | — | |
| | |
| 8 | | Visit our website at pgiminvestments.com |
Growth of a $10,000 Investment (unaudited)
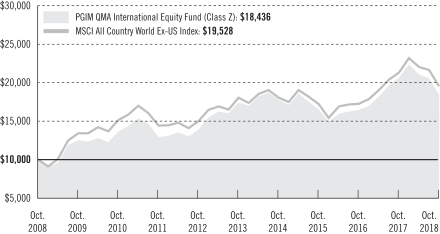
The graph compares a $10,000 investment in the Fund’s Class Z shares with a similar investment in the MSCI All Country World Ex-US Index by portraying the initial account values at the beginning of the 10-year period for Class Z shares (October 31, 2008) and the account values at the end of the current fiscal year (October 31, 2018) as measured on a quarterly basis. For purposes of the graph, and unless otherwise indicated, it has been assumed that (a) all recurring fees (including management fees) were deducted; and (b) all dividends and distributions were reinvested. The line graph provides information for Class Z shares only. As indicated in the tables provided earlier, performance for other share classes will vary due to the differing charges and expenses applicable to each share class (as indicated in the following paragraphs). Without waiver of fees and/or expense reimbursements, if any, the Fund’s returns would have been lower.
Past performance does not predict future performance. Total returns and the ending account values in the graph include changes in share price and reinvestment of dividends and capital gains distributions in a hypothetical investment for the periods shown. The Fund’s total returns do not reflect the deduction of income taxes on an individual’s investment. Taxes may reduce your actual investment returns on income or gains paid by the Fund or any gains you may realize if you sell your shares.
Source: PGIM Investments LLC and Lipper Inc.
*Formerly known as Class Q shares.
Since Inception returns are provided for any share class with less than 10 fiscal years of returns. Since Inception returns for the Index and the Lipper Average are measured from the closest month-end to the class’ inception date.
| | | | |
| PGIM QMA International Equity Fund | | | 9 | |
Your Fund’s Performance (continued)
The returns in the tables do not reflect the deduction of taxes that a shareholder would pay on Fund distributions or following the redemption of Fund shares. The average annual total returns take into account applicable sales charges, which are described for each share class in the table below.
| | | | | | | | | | |
| | | Class A | | Class B* | | Class C | | Class Z | | Class R6** |
| Maximum initial sales charge | | 5.50% of the public offering price | | None | | None | | None | | None |
Contingent deferred sales charge (CDSC) (as a percentage of the lower of original purchase
price or net asset value at redemption) | | 1.00% on sales of $1 million or more made within 12 months of purchase | | 5.00% (Yr.1) 4.00% (Yr.2) 3.00% (Yr.3) 2.00% (Yr.4) 1.00% (Yr.5) 1.00% (Yr.6) 0.00% (Yr.7) | | 1.00% on sales made within 12 months of purchase | | None | | None |
Annual distribution and service (12b-1) fees
(shown as a percentage of average daily net assets) | | 0.30% | | 1.00% | | 1.00% | | None | | None |
*Class B shares are closed to all purchase activity and no additional Class B shares may be purchased or acquired except by exchange from Class B shares of another Fund or through dividend or capital gains reinvestment.
**Formerly known as Class Q shares.
Benchmark Definitions
MSCI All Country World Ex-US Index—The Morgan Stanley Capital International All Country World ex-US Index (MSCI ACWI ex-US Index) is an unmanaged free float-adjusted market-capitalization-weighted index that is designed to measure the equity market performance of developed and emerging markets, excluding the US. The average annual total return for the Index measured from the month-end closest to the inception date of the Fund’s Class R6 shares is 7.02%.
Lipper International Multi-Cap Core Funds Average—The Lipper International Multi-Cap Core Funds Average (Lipper Average) is based on the average return of all funds in the Lipper International Multi-Cap Core Funds universe for the periods noted. Funds in the Lipper Average are funds that, by portfolio practice, invest in a variety of market-capitalization ranges without concentrating 75% of their equity assets in any one market-capitalization range over an extended period of time. International multi-cap core funds typically have above-average characteristics compared to the MSCI EAFE Index. The average annual total return for the Lipper Average measured from the month-end closest to the inception date of the Fund’s Class R6 shares is 6.30%.
Investors cannot invest directly in an index or average. The returns for the Index would be lower if they included the effects of sales charges, operating expenses of a mutual fund, or taxes. Returns for the Lipper Average reflect the deduction of operating expenses of a mutual fund, but not sales charges or taxes.
| | |
| 10 | | Visit our website at pgiminvestments.com |
Presentation of Fund Holdings
| | | | |
Five Largest Holdings expressed as a
percentage of net assets as of 10/31/18 (%) | |
Novartis AG, Pharmaceuticals | | | 1.7 | |
Roche Holding AG, Pharmaceuticals | | | 1.6 | |
Toyota Motor Corp., Automobiles | | | 1.3 | |
Toronto-Dominion Bank (The), Banks | | | 1.2 | |
Sanofi, Pharmaceuticals | | | 1.2 | |
Holdings reflect only long-term investments and are subject to change.
| | | | |
Five Largest Industries expressed as a
percentage of net assets as of 10/31/18 (%) | |
Banks | | | 13.7 | |
Oil, Gas & Consumable Fuels | | | 7.8 | |
Pharmaceuticals | | | 7.0 | |
Metals & Mining | | | 5.2 | |
Insurance | | | 4.2 | |
Industry weightings reflect only long-term investments and are subject to change.
| | | | |
| PGIM QMA International Equity Fund | | | 11 | |
Strategy and Performance Overview (unaudited)
How did the Fund perform?
The PGIM QMA International Equity Fund’s Class Z shares returned –10.59% for the 12-month period that ended October 31, 2018, underperforming the –8.24% return of the MSCI All Country World Ex-US (MSCI ACWI Ex-US) Index (the Index) and the –8.49% return of the Lipper International Multi-Cap Core Funds Average.
What were the market conditions?
| • | | While 2017 was characterized as a year of synchronized global recovery, 2018 may be best described as a year of divergence. With the US Congress’ fiscal stimulus in late 2017 boosting economic activity, the US stands out among the world’s major economies with accelerating growth, even as other major economies appear to be slowing—at least in the near term. |
| • | | Anxiety regarding a global trade war emerged in March 2018, eased in May, but intensified again in June on the heels of unprecedented acrimony at the G7 summit and the Trump administration’s threat to impose round after round of tariffs on Chinese goods. The G7, or Group of Seven, is a forum of the world’s largest industrialized economies and consists of Canada, France, Germany, Italy, Japan, the United Kingdom (the UK), and the US. Retaliatory measures by China ignited fears of a tit-for-tat escalation cycle, which would have been destructive for global growth. |
| • | | Fears of trade wars abated toward the end of the summer with good news heralded by an agreement with Mexico, lower-than-expected tariffs on $200 billion of Chinese goods, and, lastly, a trade agreement with Canada that concluded renegotiation of NAFTA (North American Free Trade Agreement). US equity markets surged again, rising more than 7% from July through September and reaching new highs on reduced geopolitical anxiety and more good news on the earnings front. |
| • | | US equities were volatile in October 2018, declining amid investor concerns about the pace of US economic growth and the outlook for corporate earnings. Toward the end of the month, US equities retraced some of their losses on positive economic news and solid earnings reports. |
| • | | This singular strength of the US economy, accompanied by rising US interest rates and the stronger dollar, have put a strain on emerging markets. The rising rates have caused capital outflows from these markets, leading to sharp currency depreciation and unleashing a vicious cycle of inflation and rate hikes. This was especially the case in countries with significant political problems, economic imbalances, and limited reserves, such as Turkey and Argentina. Trade tensions and high oil prices exacerbated the problem, even in stronger emerging market countries, by putting additional pressure on foreign currency reserves. Nevertheless, the emerging markets crisis has been contained so far thanks to China’s commitment to doing “whatever it takes” to keep its economy stable and a proactive stance by other emerging market central banks. |
| | |
| 12 | | Visit our website at pgiminvestments.com |
| • | | On an absolute basis, based on the performance of their respective MSCI indexes, developed equity markets outpaced their emerging market counterparts, and larger- capitalization companies outpaced smaller MSCI index constituents—a reversal of 2017 (emerging markets was the exception on a size basis). |
What worked?
| • | | The Fund’s stock selection was effective in the larger-capitalization space. This was most notable in emerging markets, where Brazil far outpaced its peers on the back of a rebound in the energy sector, which rose significantly, and selection in financials, which staged a comeback in the last few months of the period. The country suffered significant setbacks this year as it struggled with widespread political scandal and economic uncertainty. |
| • | | China also contributed significantly to performance, driven by stock selection in financials and underweights in the consumer discretionary and information technology sectors, each of which declined. |
What didn’t work?
| • | | The challenging environment for valuation measures throughout the better part of the period was worsened by decreasing effectiveness from growth metrics. The measures fared the worst in the small capitalization space, which drove the Fund’s underperformance. This is an about-face from the market segment’s significant contributions in 2017. |
| • | | The Fund’s allocation to small-cap stocks (an out-of-benchmark position), where factors weakened considerably during the period, drove the Fund’s underperformance. This segment contributed the most to the Fund’s notable gains in 2017. |
| • | | Stock selection was the most challenged among small-cap stocks in developed markets, particularly in Germany (in the information technology and financials sectors) and in the UK, where selection was broadly difficult. |
Current outlook
| • | | The global economy entered the last quarter of 2018 with good momentum. However, QMA believes growth has become less synchronized, more uneven, and less robust than in 2017, with economic activity accelerating in the US; moderating in the eurozone, UK, and Japan; and slowing in China and other emerging markets. |
| • | | Trade tensions and the ongoing crisis in emerging markets top the downside risks. Trade uncertainty has now seeped into the gross domestic product (GDP) and business confidence data for Europe and Japan, while the combination of trade tensions, fears of Turkish lira contagion, and Federal Reserve rate hikes have contributed to slowdowns in a number of emerging markets, including China. However, QMA believes that, on balance, the near-term risk of a global downturn remains very low but that storm clouds are gathering. |
| | | | |
| PGIM QMA International Equity Fund | | | 13 | |
Fees and Expenses (unaudited)
As a shareholder of the Fund, you incur two types of costs: (1) transaction costs, including sales charges (loads) on purchase payments and redemptions, as applicable, and (2) ongoing costs, including management fees, distribution, and/or service (12b-1) fees, and other Fund expenses, as applicable. This example is intended to help you understand your ongoing costs (in dollars) of investing in the Fund and to compare these costs with the ongoing costs of investing in other mutual funds.
The example is based on an investment of $1,000 held through the six-month period ended October 31, 2018. The example is for illustrative purposes only; you should consult the Prospectus for information on initial and subsequent minimum investment requirements.
Actual Expenses
The first line for each share class in the table on the following page provides information about actual account values and actual expenses. You may use the information on this line, together with the amount you invested, to estimate the expenses that you paid over the period. Simply divide your account value by $1,000 (for example, an $8,600 account value ÷ $1,000 = 8.6), then multiply the result by the number on the first line under the heading “Expenses Paid During the Six-Month Period” to estimate the expenses you paid on your account during this period.
Hypothetical Example for Comparison Purposes
The second line for each share class in the table on the following page provides information about hypothetical account values and hypothetical expenses based on the Fund’s actual expense ratio and an assumed rate of return of 5% per year before expenses, which is not the Fund’s actual return. The hypothetical account values and expenses may not be used to estimate the actual ending account balance or expenses you paid for the period. You may use this information to compare the ongoing costs of investing in the Fund and other funds. To do so, compare this 5% hypothetical example with the 5% hypothetical examples that appear in the shareholder reports of the other funds.
The Fund’s transfer agent may charge additional fees to holders of certain accounts that are not included in the expenses shown in the table on the following page. These fees apply to individual retirement accounts (IRAs) and Section 403(b) accounts. As of the close of the six-month period covered by the table, IRA fees included an annual maintenance fee of $15 per account (subject to a maximum annual maintenance fee of $25 for all accounts held by the same shareholder). Section 403(b) accounts are charged an annual $25 fiduciary maintenance fee. Some of the fees may vary in amount, or may be waived, based on your total account balance or the number of PGIM funds, including the Fund, that you own. You should consider the additional fees that were charged to your Fund account over the six-month period when you estimate the total ongoing expenses paid over the
| | |
| 14 | | Visit our website at pgiminvestments.com |
period and the impact of these fees on your ending account value, as these additional expenses are not reflected in the information provided in the expense table. Additional fees have the effect of reducing investment returns.
Please note that the expenses shown in the table are meant to highlight your ongoing costs only and do not reflect any transactional costs such as sales charges (loads). Therefore, the second line for each share class in the table is useful in comparing ongoing costs only and will not help you determine the relative total costs of owning different funds. In addition, if these transactional costs were included, your costs would have been higher.
| | | | | | | | | | | | | | | | | | |
PGIM QMA
International
Equity Fund | | Beginning Account
Value
May 1, 2018 | | | Ending Account
Value
October 31, 2018 | | | Annualized
Expense Ratio
Based on the
Six-Month Period | | | Expenses Paid
During the
Six-Month Period* | |
| Class A | | Actual | | $ | 1,000.00 | | | $ | 874.40 | | | | 1.32 | % | | $ | 6.24 | |
| | Hypothetical | | $ | 1,000.00 | | | $ | 1,018.55 | | | | 1.32 | % | | $ | 6.72 | |
| Class B | | Actual | | $ | 1,000.00 | | | $ | 868.80 | | | | 2.53 | % | | $ | 11.92 | |
| | Hypothetical | | $ | 1,000.00 | | | $ | 1,012.45 | | | | 2.53 | % | | $ | 12.83 | |
| Class C | | Actual | | $ | 1,000.00 | | | $ | 870.20 | | | | 2.10 | % | | $ | 9.90 | |
| | Hypothetical | | $ | 1,000.00 | | | $ | 1,014.62 | | | | 2.10 | % | | $ | 10.66 | |
| Class Z | | Actual | | $ | 1,000.00 | | | $ | 875.30 | | | | 1.00 | % | | $ | 4.73 | |
| | Hypothetical | | $ | 1,000.00 | | | $ | 1,020.16 | | | | 1.00 | % | | $ | 5.09 | |
| Class R6** | | Actual | | $ | 1,000.00 | | | $ | 875.50 | | | | 0.78 | % | | $ | 3.69 | |
| | | Hypothetical | | $ | 1,000.00 | | | $ | 1,021.27 | | | | 0.78 | % | | $ | 3.97 | |
*Fund expenses (net of fee waivers or subsidies, if any) for each share class are equal to the annualized expense ratio for each share class (provided in the table), multiplied by the average account value over the period, multiplied by the 184 days in the six-month period ended October 31, 2018, and divided by the 365 days in the Fund's fiscal year ended October 31, 2018 (to reflect the six-month period). Expenses presented in the table include the expenses of any underlying portfolios in which the Fund may invest.
**Formerly known as Class Q shares.
| | | | |
| PGIM QMA International Equity Fund | | | 15 | |
Schedule of Investments
as of October 31, 2018
| | | | | | | | |
| Description | | Shares | | | Value | |
LONG-TERM INVESTMENTS 99.3% | | | | | | | | |
| | |
COMMON STOCKS 96.9% | | | | | | | | |
| | |
Australia 4.8% | | | | | | | | |
AGL Energy Ltd. | | | 96,027 | | | $ | 1,227,069 | |
Aristocrat Leisure Ltd. | | | 84,472 | | | | 1,591,023 | |
BHP Billiton PLC | | | 22,181 | | | | 441,925 | |
BlueScope Steel Ltd. | | | 104,507 | | | | 1,071,654 | |
CIMIC Group Ltd. | | | 2,764 | | | | 92,567 | |
CSL Ltd. | | | 13,576 | | | | 1,821,490 | |
Goodman Group, REIT | | | 134,976 | | | | 990,585 | |
Macquarie Group Ltd. | | | 23,516 | | | | 1,961,664 | |
Rio Tinto Ltd. | | | 5,546 | | | | 301,901 | |
Rio Tinto PLC | | | 34,589 | | | | 1,680,928 | |
Stockland, REIT | | | 32,981 | | | | 84,191 | |
WPP AUNZ Ltd. | | | 336,587 | | | | 133,592 | |
| | | | | | | | |
| | | | | | | 11,398,589 | |
| | |
Austria 0.1% | | | | | | | | |
EVN AG | | | 12,056 | | | | 210,267 | |
| | |
Belgium 0.1% | | | | | | | | |
UCB SA | | | 2,506 | | | | 210,260 | |
| | |
Brazil 2.1% | | | | | | | | |
Banco Bradesco SA | | | 12,300 | | | | 99,286 | |
Banco do Brasil SA | | | 51,900 | | | | 594,796 | |
Banco Santander Brasil SA, UTS | | | 152,100 | | | | 1,725,966 | |
Engie Brasil Energia SA | | | 120,900 | | | | 1,292,979 | |
Petroleo Brasileiro SA | | | 40,600 | | | | 329,688 | |
SLC Agricola SA | | | 33,800 | | | | 513,607 | |
Transmissora Alianca de Energia Eletrica SA, UTS | | | 65,500 | | | | 394,954 | |
| | | | | | | | |
| | | | | | | 4,951,276 | |
| | |
Canada 6.2% | | | | | | | | |
Bank of Montreal | | | 8,400 | | | | 628,062 | |
Canadian Imperial Bank of Commerce | | | 20,500 | | | | 1,770,246 | |
Canadian National Railway Co. | | | 23,100 | | | | 1,974,761 | |
Canadian Pacific Railway Ltd. | | | 4,000 | | | | 820,297 | |
Corus Entertainment, Inc. (Class B Stock) | | | 162,500 | | | | 612,253 | |
Genworth MI Canada, Inc. | | | 10,100 | | | | 331,513 | |
Husky Energy, Inc. | | | 62,700 | | | | 886,359 | |
Loblaw Cos. Ltd. | | | 2,400 | | | | 120,032 | |
Rogers Communications, Inc. (Class B Stock) | | | 2,600 | | | | 133,886 | |
Royal Bank of Canada | | | 34,900 | | | | 2,542,905 | |
See Notes to Financial Statements.
| | | | |
| PGIM QMA International Equity Fund | | | 17 | |
Schedule of Investments (continued)
as of October 31, 2018
| | | | | | | | |
| Description | | Shares | | | Value | |
COMMON STOCKS (Continued) | | | | | | | | |
| | |
Canada (cont’d.) | | | | | | | | |
Shopify, Inc. (Class A Stock)* | | | 1,100 | | | $ | 151,967 | |
Sun Life Financial, Inc. | | | 7,300 | | | | 267,335 | |
Suncor Energy, Inc. | | | 6,300 | | | | 211,332 | |
Teck Resources Ltd. (Class B Stock) | | | 66,400 | | | | 1,372,436 | |
Toronto-Dominion Bank (The) | | | 51,500 | | | | 2,856,960 | |
| | | | | | | | |
| | | | | | | 14,680,344 | |
| | |
Chile 0.2% | | | | | | | | |
Colbun SA | | | 2,233,388 | | | | 419,014 | |
| | |
China 7.2% | | | | | | | | |
Alibaba Group Holding Ltd., ADR* | | | 6,100 | | | | 867,908 | |
Anhui Conch Cement Co. Ltd. (Class H Stock) | | | 17,500 | | | | 91,072 | |
Asia Cement China Holdings Corp. | | | 723,000 | | | | 622,932 | |
Bank of Shanghai Co. Ltd. (Class A Stock) | | | 78,200 | | | | 137,322 | |
BOC Hong Kong Holdings Ltd. | | | 44,500 | | | | 166,621 | |
China BlueChemical Ltd. (Class H Stock) | | | 1,676,000 | | | | 575,311 | |
China Communications Services Corp. Ltd. (Class H Stock) | | | 1,400,000 | | | | 1,133,339 | |
China International Travel Service Corp. Ltd. (Class A Stock) | | | 12,100 | | | | 93,647 | |
China Petroleum & Chemical Corp. (Class H Stock) | | | 1,704,000 | | | | 1,391,107 | |
China Railway Group Ltd. (Class H Stock) | | | 106,000 | | | | 94,904 | |
China Resources Land Ltd. | | | 36,000 | | | | 122,737 | |
China Shenhua Energy Co. Ltd. (Class H Stock) | | | 39,500 | | | | 89,832 | |
China Unicom Hong Kong Ltd. | | | 1,126,000 | | | | 1,173,541 | |
China United Network Communications Ltd. (Class A Stock) | | | 153,600 | | | | 119,717 | |
China Yuhua Education Corp. Ltd., 144A | | | 512,000 | | | | 205,663 | |
Chlitina Holding Ltd. | | | 96,000 | | | | 644,052 | |
CITIC Telecom International Holdings Ltd. | | | 890,000 | | | | 279,786 | |
CNOOC Ltd. | | | 228,000 | | | | 393,358 | |
Country Garden Holdings Co. Ltd. | | | 832,000 | | | | 896,172 | |
Daqin Railway Co. Ltd. (Class A Stock) | | | 101,800 | | | | 117,931 | |
Jiangsu Yanghe Brewery Joint-Stock Co. Ltd. (Class A Stock) | | | 6,558 | | | | 83,567 | |
Lonking Holdings Ltd. | | | 390,000 | | | | 88,017 | |
Momo, Inc., ADR* | | | 7,300 | | | | 245,061 | |
Ping An Insurance Group Co. of China Ltd. (Class H Stock) | | | 65,000 | | | | 616,836 | |
Poly Property Group Co. Ltd. | | | 2,643,000 | | | | 792,219 | |
Postal Savings Bank of China Co. Ltd. (Class H Stock), 144A | | | 2,138,000 | | | | 1,280,772 | |
Powerlong Real Estate Holdings Ltd. | | | 551,000 | | | | 188,727 | |
Sany Heavy Industry Co. Ltd. (Class A Stock) | | | 94,200 | | | | 106,667 | |
Shougang Fushan Resources Group Ltd. | | | 2,122,000 | | | | 429,995 | |
Sinotruk Hong Kong Ltd.(a) | | | 722,000 | | | | 1,044,933 | |
Tencent Holdings Ltd. | | | 35,900 | | | | 1,233,138 | |
Weichai Power Co. Ltd. (Class H Stock) | | | 902,000 | | | | 897,397 | |
See Notes to Financial Statements.
| | | | | | | | |
| Description | | Shares | | | Value | |
COMMON STOCKS (Continued) | | | | | | | | |
| | |
China (cont’d.) | | | | | | | | |
West China Cement Ltd. | | | 1,296,000 | | | $ | 192,574 | |
Wuliangye Yibin Co. Ltd. (Class A Stock) | | | 11,100 | | | | 76,937 | |
Yanzhou Coal Mining Co. Ltd. (Class H Stock) | | | 86,000 | | | | 81,948 | |
Yuexiu Transport Infrastructure Ltd. | | | 464,000 | | | | 373,216 | |
| | | | | | | | |
| | | | | | | 16,948,956 | |
| | |
Colombia 0.6% | | | | | | | | |
Ecopetrol SA | | | 1,310,210 | | | | 1,532,205 | |
| | |
Denmark 0.7% | | | | | | | | |
H. Lundbeck A/S | | | 3,114 | | | | 145,265 | |
Novo Nordisk A/S (Class B Stock) | | | 21,501 | | | | 928,775 | |
Orsted A/S, 144A | | | 2,270 | | | | 144,371 | |
Scandinavian Tobacco Group A/S, 144A | | | 32,739 | | | | 497,899 | |
| | | | | | | | |
| | | | | | | 1,716,310 | |
| | |
Finland 0.4% | | | | | | | | |
Neste OYJ | | | 3,531 | | | | 290,081 | |
Nordea Bank Abp | | | 37,350 | | | | 324,915 | |
UPM-Kymmene OYJ | | | 13,199 | | | | 425,059 | |
| | | | | | | | |
| | | | | | | 1,040,055 | |
| | |
France 5.8% | | | | | | | | |
AXA SA | | | 41,981 | | | | 1,050,979 | |
Dassault Systemes SE | | | 1,544 | | | | 193,767 | |
Eiffage SA | | | 1,013 | | | | 99,146 | |
Eutelsat Communications SA | | | 47,134 | | | | 957,699 | |
Hermes International | | | 381 | | | | 217,861 | |
IPSOS | | | 8,904 | | | | 237,292 | |
Kering SA | | | 1,080 | | | | 481,277 | |
Klepierre SA, REIT | | | 20,120 | | | | 684,296 | |
LVMH Moet Hennessy Louis Vuitton SE | | | 7,755 | | | | 2,361,427 | |
Peugeot SA | | | 58,551 | | | | 1,393,577 | |
Sanofi | | | 31,733 | | | | 2,827,730 | |
Teleperformance | | | 3,309 | | | | 546,503 | |
TOTAL SA | | | 14,224 | | | | 834,349 | |
Vinci SA | | | 20,238 | | | | 1,808,095 | |
| | | | | | | | |
| | | | | | | 13,693,998 | |
| | |
Germany 5.3% | | | | | | | | |
Allianz SE | | | 13,032 | | | | 2,723,230 | |
See Notes to Financial Statements.
| | | | |
| PGIM QMA International Equity Fund | | | 19 | |
Schedule of Investments (continued)
as of October 31, 2018
| | | | | | | | |
| Description | | Shares | | | Value | |
COMMON STOCKS (Continued) | | | | | | | | |
| | |
Germany (cont’d.) | | | | | | | | |
Amadeus Fire AG | | | 1,263 | | | $ | 144,452 | |
AURELIUS Equity Opportunities SE & Co. KGaA | | | 14,623 | | | | 681,690 | |
Bayer AG | | | 12,183 | | | | 932,413 | |
Covestro AG, 144A | | | 10,549 | | | | 682,319 | |
Deutsche Lufthansa AG | | | 48,733 | | | | 979,974 | |
Deutsche Pfandbriefbank AG, 144A | | | 58,265 | | | | 775,106 | |
Deutsche Telekom AG | | | 109,187 | | | | 1,792,658 | |
Fresenius Medical Care AG & Co. KGaA | | | 1,163 | | | | 91,184 | |
Henkel AG & Co. KGaA | | | 1,391 | | | | 136,445 | |
Infineon Technologies AG | | | 67,864 | | | | 1,361,691 | |
Nemetschek SE | | | 3,686 | | | | 485,265 | |
SAP SE | | | 958 | | | | 102,541 | |
Siltronic AG | | | 7,630 | | | | 702,022 | |
Sixt SE | | | 6,638 | | | | 676,799 | |
Wirecard AG | | | 1,427 | | | | 268,254 | |
| | | | | | | | |
| | | | | | | 12,536,043 | |
| | |
Hong Kong 1.7% | | | | | | | | |
CK Asset Holdings Ltd. | | | 57,500 | | | | 373,863 | |
CK Hutchison Holdings Ltd. | | | 32,000 | | | | 323,365 | |
Galaxy Entertainment Group Ltd. | | | 402 | | | | 2,183 | |
Hang Seng Bank Ltd. | | | 61,400 | | | | 1,441,123 | |
Kerry Properties Ltd. | | | 29,000 | | | | 91,382 | |
Swire Pacific Ltd. (Class A Stock) | | | 114,500 | | | | 1,192,025 | |
WH Group Ltd., 144A | | | 862,500 | | | | 604,439 | |
Wharf Real Estate Investment Co. Ltd. | | | 15,000 | | | | 93,049 | |
| | | | | | | | |
| | | | | | | 4,121,429 | |
| | |
Hungary 0.2% | | | | | | | | |
Magyar Telekom Telecommunications PLC | | | 272,773 | | | | 372,409 | |
OTP Bank Nyrt | | | 2,746 | | | | 98,716 | |
| | | | | | | | |
| | | | | | | 471,125 | |
| | |
India 2.0% | | | | | | | | |
Endurance Technologies Ltd., 144A | | | 11,950 | | | | 196,153 | |
Graphite India Ltd. | | | 17,648 | | | | 228,299 | |
HCL Technologies Ltd. | | | 92,006 | | | | 1,317,270 | |
Jubilant Foodworks Ltd. | | | 49,386 | | | | 727,292 | |
Larsen & Toubro Infotech Ltd., 144A | | | 33,321 | | | | 798,076 | |
Minda Industries Ltd. | | | 74,836 | | | | 315,288 | |
See Notes to Financial Statements.
| | | | | | | | |
| Description | | Shares | | | Value | |
COMMON STOCKS (Continued) | | | | | | | | |
| | |
India (cont’d.) | | | | | | | | |
Tata Consultancy Services Ltd. | | | 36,279 | | | $ | 953,596 | |
Tech Mahindra Ltd. | | | 10,180 | | | | 102,734 | |
| | | | | | | | |
| | | | | | | 4,638,708 | |
| | |
Indonesia 0.1% | | | | | | | | |
Ace Hardware Indonesia Tbk PT | | | 2,307,600 | | | | 208,134 | |
| | |
Ireland 0.6% | | | | | | | | |
Bank of Ireland Group PLC | | | 154,762 | | | | 1,095,272 | |
CRH PLC | | | 10,186 | | | | 304,212 | |
| | | | | | | | |
| | | | | | | 1,399,484 | |
| | |
Israel 0.7% | | | | | | | | |
Check Point Software Technologies Ltd.* | | | 12,500 | | | | 1,387,500 | |
Israel Chemicals Ltd. | | | 15,629 | | | | 90,101 | |
Plus500 Ltd. | | | 12,856 | | | | 222,283 | |
| | | | | | | | |
| | | | | | | 1,699,884 | |
| | |
Italy 2.3% | | | | | | | | |
Enel SpA | | | 347,428 | | | | 1,719,112 | |
Eni SpA | | | 99,727 | | | | 1,771,835 | |
Intesa Sanpaolo SpA | | | 174,365 | | | | 385,235 | |
Mediobanca Banca di Credito Finanziario SpA | | | 135,978 | | | | 1,193,806 | |
Poste Italiane SpA, 144A | | | 49,691 | | | | 357,166 | |
| | | | | | | | |
| | | | | | | 5,427,154 | |
| | |
Japan 17.5% | | | | | | | | |
Advantest Corp. | | | 4,900 | | | | 90,450 | |
Asahi Group Holdings Ltd. | | | 4,400 | | | | 193,492 | |
Asahi Kasei Corp. | | | 14,800 | | | | 178,620 | |
Astellas Pharma, Inc. | | | 115,000 | | | | 1,786,140 | |
Capcom Co. Ltd. | | | 6,700 | | | | 139,201 | |
Central Japan Railway Co. | | | 5,300 | | | | 1,029,586 | |
Dai-ichi Life Holdings, Inc. | | | 13,000 | | | | 247,048 | |
Fast Retailing Co. Ltd. | | | 3,800 | | | | 1,924,733 | |
Hitachi Ltd. | | | 57,200 | | | | 1,755,894 | |
Isuzu Motors Ltd. | | | 25,200 | | | | 330,153 | |
ITOCHU Corp. | | | 96,400 | | | | 1,791,992 | |
Japan Tobacco, Inc. | | | 44,200 | | | | 1,132,888 | |
JFE Holdings, Inc. | | | 5,700 | | | | 107,797 | |
JXTG Holdings, Inc. | | | 267,900 | | | | 1,828,662 | |
See Notes to Financial Statements.
| | | | |
| PGIM QMA International Equity Fund | | | 21 | |
Schedule of Investments (continued)
as of October 31, 2018
| | | | | | | | |
| Description | | Shares | | | Value | |
COMMON STOCKS (Continued) | | | | | | | | |
| | |
Japan (cont’d.) | | | | | | | | |
Kansai Electric Power Co., Inc. (The) | | | 8,300 | | | $ | 127,154 | |
KDDI Corp. | | | 68,200 | | | | 1,675,551 | |
Kirin Holdings Co. Ltd. | | | 10,600 | | | | 253,153 | |
Kobe Steel Ltd. | | | 35,700 | | | | 288,208 | |
Marubeni Corp. | | | 31,300 | | | | 254,504 | |
Medipal Holdings Corp. | | | 63,800 | | | | 1,369,637 | |
Mitsubishi Chemical Holdings Corp. | | | 187,500 | | | | 1,465,634 | |
Mitsubishi Corp. | | | 71,600 | | | | 2,020,667 | |
Mitsubishi UFJ Financial Group, Inc. | | | 345,300 | | | | 2,097,222 | |
Mitsui & Co. Ltd. | | | 57,700 | | | | 966,156 | |
Mizuho Financial Group, Inc. | | | 293,900 | | | | 506,429 | |
Nippon Telegraph & Telephone Corp. | | | 46,284 | | | | 1,923,847 | |
NTT DOCOMO, Inc. | | | 60,100 | | | | 1,511,071 | |
ORIX Corp. | | | 118,200 | | | | 1,931,078 | |
Resona Holdings, Inc. | | | 27,600 | | | | 145,960 | |
Shin-Etsu Chemical Co. Ltd. | | | 5,600 | | | | 470,904 | |
Shionogi & Co. Ltd. | | | 14,600 | | | | 936,229 | |
Sompo Holdings, Inc. | | | 4,200 | | | | 173,885 | |
Sony Corp. | | | 45,100 | | | | 2,433,509 | |
Sumitomo Corp. | | | 114,800 | | | | 1,745,752 | |
Sumitomo Mitsui Financial Group, Inc. | | | 19,700 | | | | 774,004 | |
Suzuki Motor Corp. | | | 17,200 | | | | 859,583 | |
Taisei Corp. | | | 32,300 | | | | 1,383,918 | |
Tokio Marine Holdings, Inc. | | | 8,400 | | | | 398,071 | |
Toyota Motor Corp. | | | 51,333 | | | | 3,011,636 | |
Toyota Tsusho Corp. | | | 3,000 | | | | 108,372 | |
| | | | | | | | |
| | | | | | | 41,368,790 | |
| | |
Luxembourg 0.6% | | | | | | | | |
ArcelorMittal | | | 55,208 | | | | 1,374,145 | |
| | |
Malaysia 0.1% | | | | | | | | |
Genting Bhd | | | 94,400 | | | | 165,728 | |
| | |
Mexico 0.1% | | | | | | | | |
Concentradora Fibra Danhos SA de CV, REIT | | | 151,700 | | | | 200,890 | |
| | |
Netherlands 3.1% | | | | | | | | |
ABN AMRO Group NV, CVA, 144A | | | 53,234 | | | | 1,308,061 | |
Aegon NV | | | 229,735 | | | | 1,409,752 | |
ASR Nederland NV | | | 18,624 | | | | 847,220 | |
Koninklijke Ahold Delhaize NV | | | 64,771 | | | | 1,483,182 | |
NN Group NV | | | 3,679 | | | | 158,179 | |
See Notes to Financial Statements.
| | | | | | | | |
| Description | | Shares | | | Value | |
COMMON STOCKS (Continued) | | | | | | | | |
| | |
Netherlands (cont’d.) | | | | | | | | |
Royal Dutch Shell PLC (Class A Stock) | | | 56,521 | | | $ | 1,802,010 | |
Royal Dutch Shell PLC (Class B Stock) | | | 6,509 | | | | 212,871 | |
Wolters Kluwer NV | | | 3,399 | | | | 193,145 | |
| | | | | | | | |
| | | | | | | 7,414,420 | |
| | |
New Zealand 0.3% | | | | | | | | |
Metlifecare Ltd. | | | 102,941 | | | | 390,914 | |
Summerset Group Holdings Ltd. | | | 60,451 | | | | 262,612 | |
| | | | | | | | |
| | | | | | | 653,526 | |
| | |
Norway 0.9% | | | | | | | | |
Aker BP ASA | | | 2,685 | | | | 88,350 | |
DNB ASA | | | 65,971 | | | | 1,192,384 | |
Salmar ASA | | | 15,800 | | | | 832,465 | |
| | | | | | | | |
| | | | | | | 2,113,199 | |
| | |
Pakistan 0.3% | | | | | | | | |
Engro Fertilizers Ltd. | | | 323,500 | | | | 198,069 | |
Oil & Gas Development Co. Ltd. | | | 316,000 | | | | 379,818 | |
Pakistan Oilfields Ltd. | | | 43,490 | | | | 179,131 | |
| | | | | | | | |
| | | | | | | 757,018 | |
| | |
Peru 0.1% | | | | | | | | |
Credicorp Ltd. | | | 800 | | | | 180,568 | |
| | |
Philippines 0.3% | | | | | | | | |
SM Prime Holdings, Inc. | | | 969,600 | | | | 612,913 | |
| | |
Poland 0.0% | | | | | | | | |
Stalprodukt SA | | | 1,135 | | | | 109,025 | |
| | |
Portugal 0.3% | | | | | | | | |
Sonae SGPS SA | | | 790,744 | | | | 792,773 | |
| | |
Qatar 0.5% | | | | | | | | |
Industries Qatar QSC | | | 17,424 | | | | 670,841 | |
Qatar Navigation QSC | | | 14,750 | | | | 287,479 | |
United Development Co. QSC | | | 42,641 | | | | 164,001 | |
| | | | | | | | |
| | | | | | | 1,122,321 | |
See Notes to Financial Statements.
| | | | |
| PGIM QMA International Equity Fund | | | 23 | |
Schedule of Investments (continued)
as of October 31, 2018
| | | | | | | | |
| Description | | Shares | | | Value | |
COMMON STOCKS (Continued) | | | | | | | | |
| | |
Russia 1.3% | | | | | | | | |
Evraz PLC | | | 120,063 | | | $ | 833,461 | |
Gazprom PJSC, ADR | | | 102,260 | | | | 484,508 | |
Lukoil PJSC, ADR | | | 7,998 | | | | 597,451 | |
Novatek PJSC, GDR | | | 1,121 | | | | 190,009 | |
Sberbank of Russia PJSC, ADR | | | 48,247 | | | | 569,315 | |
Tatneft PJSC, ADR | | | 5,629 | | | | 396,619 | |
| | | | | | | | |
| | | | | | | 3,071,363 | |
| | |
Singapore 1.0% | | | | | | | | |
United Overseas Bank Ltd. | | | 60,200 | | | | 1,061,247 | |
Wilmar International Ltd. | | | 540,500 | | | | 1,235,300 | |
| | | | | | | | |
| | | | | | | 2,296,547 | |
| | |
South Africa 1.3% | | | | | | | | |
Adcock Ingram Holdings Ltd. | | | 55,721 | | | | 216,383 | |
Anglo American PLC | | | 91,214 | | | | 1,952,496 | |
Astral Foods Ltd. | | | 45,569 | | | | 611,890 | |
Kumba Iron Ore Ltd. | | | 8,137 | | | | 159,167 | |
Old Mutual Ltd. | | | 61,014 | | | | 93,763 | |
| | | | | | | | |
| | | | | | | 3,033,699 | |
| | |
South Korea 4.1% | | | | | | | | |
Daishin Securities Co. Ltd. | | | 41,453 | | | | 403,225 | |
Hana Financial Group, Inc. | | | 36,527 | | | | 1,225,372 | |
Industrial Bank of Korea | | | 92,160 | | | | 1,199,358 | |
KB Financial Group, Inc. | | | 28,528 | | | | 1,184,928 | |
Lotte Chemical Corp. | | | 383 | | | | 88,383 | |
Mirae Asset Life Insurance Co. Ltd. | | | 21,961 | | | | 87,771 | |
POSCO | | | 5,979 | | | | 1,353,394 | |
Samsung C&T Corp. | | | 917 | | | | 87,526 | |
Samsung Electronics Co. Ltd. | | | 57,068 | | | | 2,132,191 | |
SK Hynix, Inc. | | | 30,285 | | | | 1,823,989 | |
SK Telecom Co. Ltd. | | | 407 | | | | 95,577 | |
Woori Bank | | | 6,933 | | | | 96,125 | |
| | | | | | | | |
| | | | | | | 9,777,839 | |
| | |
Spain 1.3% | | | | | | | | |
Amadeus IT Group SA | | | 25,095 | | | | 2,023,506 | |
See Notes to Financial Statements.
| | | | | | | | |
| Description | | Shares | | | Value | |
COMMON STOCKS (Continued) | | | | | | | | |
| | |
Spain (cont’d.) | | | | | | | | |
Endesa SA | | | 4,388 | | | $ | 91,928 | |
Repsol SA | | | 52,797 | | | | 945,555 | |
| | | | | | | | |
| | | | | | | 3,060,989 | |
| | |
Sweden 2.7% | | | | | | | | |
Atlas Copco AB (Class B Stock) | | | 5,159 | | | | 118,410 | |
ICA Gruppen AB | | | 12,082 | | | | 427,374 | |
Investor AB (Class B Stock) | | | 32,317 | | | | 1,401,853 | |
Lundin Petroleum AB | | | 3,245 | | | | 98,812 | |
Sandvik AB | | | 87,418 | | | | 1,381,080 | |
Svenska Handelsbanken AB (Class A Stock) | | | 121,959 | | | | 1,326,391 | |
Volvo AB (Class B Stock) | | | 100,392 | | | | 1,501,926 | |
| | | | | | | | |
| | | | | | | 6,255,846 | |
| | |
Switzerland 4.8% | | | | | | | | |
Chocoladefabriken Lindt & Spruengli AG | | | 1 | | | | 79,722 | |
Georg Fischer AG | | | 689 | | | | 641,148 | |
Logitech International SA | | | 11,712 | | | | 432,798 | |
Nestle SA | | | 21,616 | | | | 1,825,826 | |
Novartis AG | | | 44,658 | | | | 3,907,229 | |
Oriflame Holding AG | | | 5,824 | | | | 137,546 | |
Partners Group Holding AG | | | 219 | | | | 155,916 | |
Roche Holding AG | | | 15,130 | | | | 3,679,098 | |
Sonova Holding AG | | | 682 | | | | 111,514 | |
Sunrise Communications Group AG, 144A* | | | 2,716 | | | | 239,177 | |
Swatch Group AG (The) | | | 547 | | | | 184,565 | |
| | | | | | | | |
| | | | | | | 11,394,539 | |
| | |
Taiwan 3.3% | | | | | | | | |
Cathay Financial Holding Co. Ltd. | | | 103,000 | | | | 163,849 | |
Formosa Petrochemical Corp. | | | 29,000 | | | | 114,721 | |
Gigabyte Technology Co. Ltd. | | | 440,000 | | | | 580,727 | |
Lien Hwa Industrial Corp. | | | 645,700 | | | | 637,337 | |
President Chain Store Corp. | | | 143,000 | | | | 1,618,544 | |
Taiwan Semiconductor Manufacturing Co. Ltd. | | | 128,000 | | | | 970,657 | |
Uni-President Enterprises Corp. | | | 615,000 | | | | 1,484,019 | |
Walsin Lihwa Corp. | | | 1,196,000 | | | | 597,924 | |
Yageo Corp. | | | 82,000 | | | | 850,667 | |
Yuanta Financial Holding Co. Ltd. | | | 1,526,000 | | | | 741,748 | |
| | | | | | | | |
| | | | | | | 7,760,193 | |
See Notes to Financial Statements.
| | | | |
| PGIM QMA International Equity Fund | | | 25 | |
Schedule of Investments (continued)
as of October 31, 2018
| | | | | | | | |
| Description | | Shares | | | Value | |
COMMON STOCKS (Continued) | | | | | | | | |
| | |
Thailand 1.3% | | | | | | | | |
Electricity Generating PCL | | | 96,700 | | | $ | 674,829 | |
Plan B Media PCL | | | 2,243,000 | | | | 441,711 | |
PTT Global Chemical PCL | | | 150,200 | | | | 351,242 | |
PTT PCL | | | 968,800 | | | | 1,494,933 | |
| | | | | | | | |
| | | | | | | 2,962,715 | |
| | |
Turkey 1.1% | | | | | | | | |
Aygaz A/S | | | 103,398 | | | | 225,198 | |
Eregli Demir ve Celik Fabrikalari TAS | | | 610,246 | | | | 989,429 | |
Ford Otomotiv Sanayi A/S | | | 46,224 | | | | 497,199 | |
Tekfen Holding A/S | | | 198,157 | | | | 754,659 | |
Turkiye Garanti Bankasi A/S | | | 73,538 | | | | 91,997 | |
| | | | | | | | |
| | | | | | | 2,558,482 | |
| | |
United Kingdom 9.2% | | | | | | | | |
3i Group PLC | | | 106,899 | | | | 1,199,113 | |
Berkeley Group Holdings PLC | | | 27,257 | | | | 1,219,810 | |
BP PLC | | | 84,281 | | | | 609,227 | |
British American Tobacco PLC | | | 28,457 | | | | 1,235,202 | |
Britvic PLC | | | 84,628 | | | | 855,448 | |
CNH Industrial NV | | | 12,487 | | | | 129,602 | |
Coca-Cola European Partners PLC | | | 33,700 | | | | 1,533,013 | |
EMIS Group PLC | | | 12,126 | | | | 140,385 | |
Fiat Chrysler Automobiles NV* | | | 14,364 | | | | 219,184 | |
GlaxoSmithKline PLC | | | 40,764 | | | | 788,645 | |
HSBC Holdings PLC | | | 99,115 | | | | 814,769 | |
Hunting PLC | | | 10,767 | | | | 92,898 | |
Imperial Brands PLC | | | 49,831 | | | | 1,689,095 | |
Inchcape PLC | | | 86,474 | | | | 598,198 | |
JD Sports Fashion PLC | | | 139,456 | | | | 728,300 | |
Land Securities Group PLC, REIT | | | 114,922 | | | | 1,253,591 | |
Legal & General Group PLC | | | 438,760 | | | | 1,412,066 | |
Linde PLC* | | | 3,619 | | | | 593,746 | |
Lloyds Banking Group PLC | | | 1,999,812 | | | | 1,460,105 | |
Melrose Industries PLC | | | 59,213 | | | | 127,785 | |
Pearson PLC | | | 110,042 | | | | 1,261,037 | |
Persimmon PLC | | | 45,497 | | | | 1,334,921 | |
Reckitt Benckiser Group PLC | | | 10,555 | | | | 853,970 | |
SSP Group PLC | | | 38,414 | | | | 327,932 | |
Unilever NV, CVA | | | 9,380 | | | | 503,976 | |
Unilever PLC | | | 15,216 | | | | 805,322 | |
| | | | | | | | |
| | | | | | | 21,787,340 | |
See Notes to Financial Statements.
| | | | | | | | |
| Description | | Shares | | | Value | |
COMMON STOCKS (Continued) | | | | | | | | |
| | |
United States 0.3% | | | | | | | | |
BRP, Inc. | | | 13,400 | | | $ | 539,074 | |
QIAGEN NV* | | | 2,708 | | | | 98,216 | |
| | | | | | | | |
| | | | | | | 637,290 | |
TOTAL COMMON STOCKS
(cost $222,055,123) | | | | | | | 228,765,393 | |
| | | | | | | | |
| | |
EXCHANGE TRADED FUNDS 1.3% | | | | | | | | |
| | |
United States | | | | | | | | |
iShares MSCI EAFE ETF | | | 39,100 | | | | 2,442,186 | |
iShares MSCI Emerging Markets ETF | | | 17,600 | | | | 689,216 | |
| | | | | | | | |
TOTAL EXCHANGE TRADED FUNDS
(cost $3,210,271) | | | | | | | 3,131,402 | |
| | | | | | | | |
| | |
PREFERRED STOCKS 1.1% | | | | | | | | |
| | |
Brazil 0.9% | | | | | | | | |
Banco do Estado do Rio Grande do Sul SA (PRFC) (Class B Stock) | | | 130,900 | | | | 689,059 | |
Cia Paranaense de Energia (PRFC) (Class B Stock) | | | 14,200 | | | | 99,932 | |
Petroleo Brasileiro SA (PRFC) | | | 178,900 | | | | 1,327,268 | |
| | | | | | | | |
| | | | | | | 2,116,259 | |
| | |
South Korea 0.2% | | | | | | | | |
Samsung Electronics Co. Ltd. (PRFC) | | | 11,500 | | | | 362,090 | |
| | | | | | | | |
TOTAL PREFERRED STOCKS
(cost $1,841,308) | | | | | | | 2,478,349 | |
| | | | | | | | |
TOTAL LONG-TERM INVESTMENTS
(cost $227,106,702) | | | | | | | 234,375,144 | |
| | | | | | | | |
| | |
SHORT-TERM INVESTMENTS 0.5% | | | | | | | | |
| | |
AFFILIATED MUTUAL FUNDS | | | | | | | | |
PGIM Core Ultra Short Bond Fund(w) | | | 101,342 | | | | 101,342 | |
See Notes to Financial Statements.
| | | | |
| PGIM QMA International Equity Fund | | | 27 | |
Schedule of Investments (continued)
as of October 31, 2018
| | | | | | | | |
| Description | | Shares | | | Value | |
AFFILIATED MUTUAL FUNDS (Continued) | | | | | | | | |
PGIM Institutional Money Market Fund
(cost $1,092,106; includes $1,088,646 of cash collateral for securities on loan)(b)(w) | | | 1,092,213 | | | $ | 1,092,213 | |
| | | | | | | | |
TOTAL SHORT-TERM INVESTMENTS
(cost $1,193,448) | | | | | | | 1,193,555 | |
| | | | | | | | |
| | |
TOTAL INVESTMENTS 99.8%
(cost $228,300,150) | | | | | | | 235,568,699 | |
Other assets in excess of liabilities 0.2% | | | | | | | 463,390 | |
| | | | | | | | |
| | |
NET ASSETS 100.0% | | | | | | $ | 236,032,089 | |
| | | | | | | | |
The following abbreviations are used in the annual report:
144A—Security was purchased pursuant to Rule 144A under the Securities Act of 1933 and may not be resold subject to that rule except to qualified institutional buyers. Unless otherwise noted, 144A securities are deemed to be liquid.
ADR—American Depositary Receipt
CVA—Certificate Van Aandelen (Bearer)
EAFE—Europe, Australasia, Far East
ETF—Exchange Traded Fund
GDR—Global Depositary Receipt
LIBOR—London Interbank Offered Rate
MSCI—Morgan Stanley Capital International
PJSC—Public Joint-Stock Company
PRFC—Preference Shares
REIT—Real Estate Investment Trust
UTS—Unit Trust Security
| * | Non-income producing security. |
| (a) | All or a portion of security is on loan. The aggregate market value of such securities, including those sold and pending settlement, is $1,059,510; cash collateral of $1,088,646 (included in liabilities) was received with which the Series purchased highly liquid short-term investments. |
| (b) | Represents security purchased with cash collateral received for securities on loan and includes dividend reinvestment. |
| (w) | PGIM Investments LLC, the manager of the Series, also serves as manager of the PGIM Core Ultra Short Bond Fund and PGIM Institutional Money Market Fund. |
Fair Value Measurements:
Various inputs are used in determining the value of the Series’ investments. These inputs are summarized in the three broad levels listed below.
Level 1—unadjusted quoted prices generally in active markets for identical securities.
Level 2—quoted prices for similar securities, interest rates and yield curves, prepayment speeds, foreign currency exchange rates and other observable inputs.
Level 3—unobservable inputs for securities valued in accordance with Board approved fair valuation procedures.
See Notes to Financial Statements.
The following is a summary of the inputs used as of October 31, 2018 in valuing such portfolio securities:
| | | | | | | | | | | | |
| | | Level 1 | | | Level 2 | | | Level 3 | |
Investments in Securities | | | | | | | | | | | | |
Common Stocks | | | | | | | | | | | | |
Australia | | $ | — | | | $ | 11,398,589 | | | $ | — | |
Austria | | | — | | | | 210,267 | | | | — | |
Belgium | | | — | | | | 210,260 | | | | — | |
Brazil | | | 4,951,276 | | | | — | | | | — | |
Canada | | | 14,680,344 | | | | — | | | | — | |
Chile | | | 419,014 | | | | — | | | | — | |
China | | | 1,112,969 | | | | 15,835,987 | | | | — | |
Colombia | | | 1,532,205 | | | | — | | | | — | |
Denmark | | | — | | | | 1,716,310 | | | | — | |
Finland | | | — | | | | 1,040,055 | | | | — | |
France | | | — | | | | 13,693,998 | | | | — | |
Germany | | | — | | | | 12,536,043 | | | | — | |
Hong Kong | | | — | | | | 4,121,429 | | | | — | |
Hungary | | | — | | | | 471,125 | | | | — | |
India | | | — | | | | 4,638,708 | | | | — | |
Indonesia | | | — | | | | 208,134 | | | | — | |
Ireland | | | — | | | | 1,399,484 | | | | — | |
Israel | | | 1,387,500 | | | | 312,384 | | | | — | |
Italy | | | — | | | | 5,427,154 | | | | — | |
Japan | | | — | | | | 41,368,790 | | | | — | |
Luxembourg | | | — | | | | 1,374,145 | | | | — | |
Malaysia | | | — | | | | 165,728 | | | | — | |
Mexico | | | 200,890 | | | | — | | | | — | |
Netherlands | | | — | | | | 7,414,420 | | | | — | |
New Zealand | | | — | | | | 653,526 | | | | — | |
Norway | | | — | | | | 2,113,199 | | | | — | |
Pakistan | | | — | | | | 757,018 | | | | — | |
Peru | | | 180,568 | | | | — | | | | — | |
Philippines | | | — | | | | 612,913 | | | | — | |
Poland | | | — | | | | 109,025 | | | | — | |
Portugal | | | — | | | | 792,773 | | | | — | |
Qatar | | | — | | | | 1,122,321 | | | | — | |
Russia | | | 2,237,902 | | | | 833,461 | | | | — | |
Singapore | | | — | | | | 2,296,547 | | | | — | |
South Africa | | | — | | | | 3,033,699 | | | | — | |
South Korea | | | — | | | | 9,777,839 | | | | — | |
Spain | | | — | | | | 3,060,989 | | | | — | |
Sweden | | | — | | | | 6,255,846 | | | | — | |
Switzerland | | | — | | | | 11,394,539 | | | | — | |
Taiwan | | | — | | | | 7,760,193 | | | | — | |
Thailand | | | — | | | | 2,962,715 | | | | — | |
Turkey | | | — | | | | 2,558,482 | | | | — | |
United Kingdom | | | 2,126,759 | | | | 19,660,581 | | | | — | |
United States | | | 539,074 | | | | 98,216 | | | | — | |
Exchange Traded Funds | | | | | | | | | | | | |
United States | | | 3,131,402 | | | | — | | | | — | |
See Notes to Financial Statements.
| | | | |
| PGIM QMA International Equity Fund | | | 29 | |
Schedule of Investments (continued)
as of October 31, 2018
| | | | | | | | | | | | |
| | | Level 1 | | | Level 2 | | | Level 3 | |
Investments in Securities (continued) | | | | | | | | | | | | |
Preferred Stocks | | | | | | | | | | | | |
Brazil | | $ | 2,116,259 | | | $ | — | | | $ | — | |
South Korea | | | — | | | | 362,090 | | | | — | |
Affiliated Mutual Funds | | | 1,193,555 | | | | — | | | | — | |
| | | | | | | | | | | | |
Total | | $ | 35,809,717 | | | $ | 199,758,982 | | | $ | — | |
| | | | | | | | | | | | |
Industry Classification:
The industry classification of investments and other assets in excess of liabilities shown as a percentage of net assets as of October 31, 2018 were as follows (unaudited):
| | | | |
Banks | | | 13.7 | % |
Oil, Gas & Consumable Fuels | | | 7.8 | |
Pharmaceuticals | | | 7.0 | |
Metals & Mining | | | 5.2 | |
Insurance | | | 4.2 | |
Food Products | | | 3.4 | |
Diversified Telecommunication Services | | | 3.0 | |
Trading Companies & Distributors | | | 2.9 | |
Automobiles | | | 2.7 | |
Machinery | | | 2.5 | |
IT Services | | | 2.5 | |
Capital Markets | | | 2.2 | |
Household Durables | | | 2.1 | |
Semiconductors & Semiconductor Equipment | | | 2.1 | |
Chemicals | | | 2.0 | |
Real Estate Management & Development | | | 2.0 | |
Road & Rail | | | 1.9 | |
Tobacco | | | 1.9 | |
Food & Staples Retailing | | | 1.8 | |
Construction & Engineering | | | 1.7 | |
Media | | | 1.6 | |
Diversified Financial Services | | | 1.5 | |
Wireless Telecommunication Services | | | 1.5 | |
Technology Hardware, Storage & Peripherals | | | 1.5 | |
Textiles, Apparel & Luxury Goods | | | 1.4 | |
Equity Real Estate Investment Trusts (REITs) | | | 1.3 | |
Exchange Traded Funds | | | 1.3 | |
Beverages | | | 1.2 | |
Hotels, Restaurants & Leisure | | | 1.2 | |
Specialty Retail | | | 1.2 | |
Electric Utilities | | | 1.1 | |
Electronic Equipment, Instruments & Components | | | 1.1 | |
Independent Power & Renewable Electricity Producers | | | 1.1 | |
| | | | |
Software | | | 0.9 | % |
Health Care Providers & Services | | | 0.9 | |
Personal Products | | | 0.8 | |
Biotechnology | | | 0.8 | |
Interactive Media & Services | | | 0.6 | |
Multi-Utilities | | | 0.5 | |
Construction Materials | | | 0.5 | |
Affiliated Mutual Funds (0.5% represents investments purchased with collateral from securities on loan) | | | 0.5 | |
Household Products | | | 0.5 | |
Electrical Equipment | | | 0.5 | |
Thrifts & Mortgage Finance | | | 0.4 | |
Industrial Conglomerates | | | 0.4 | |
Airlines | | | 0.4 | |
Professional Services | | | 0.4 | |
Internet & Direct Marketing Retail | | | 0.4 | |
Distributors | | | 0.3 | |
Leisure Products | | | 0.2 | |
Auto Components | | | 0.2 | |
Paper & Forest Products | | | 0.2 | |
Transportation Infrastructure | | | 0.2 | |
Marine | | | 0.1 | |
Gas Utilities | | | 0.1 | |
Diversified Consumer Services | | | 0.1 | |
Health Care Technology | | | 0.1 | |
Entertainment | | | 0.1 | |
Life Sciences Tools & Services | | | 0.1 | |
Health Care Equipment & Supplies | | | 0.0 | * |
See Notes to Financial Statements.
Industry Classification (cont’d.):
| | | | |
Energy Equipment & Services | | | 0.0 | *% |
| | | | |
| | | 99.8 | |
Other assets in excess of liabilities | | | 0.2 | |
| | | | |
| | | 100.0 | % |
| | | | |
Effects of Derivative Instruments on the Financial Statements and Primary Underlying Risk Exposure:
The Series invested in derivative instruments during the reporting period. The primary type of risk associated with these derivative instruments is equity contracts risk. The effect of such derivative instruments on the Series’ financial position and financial performance as reflected in the Statement of Assets and Liabilities and Statement of Operations is presented in the summary below.
The Series did not hold any derivative instruments as of October 31, 2018, accordingly, no derivative positions were presented in the Statement of Assets and Liabilities.
The effects of derivative instruments on the Statement of Operations for the year ended October 31, 2018 are as follows:
| | | | |
Amount of Realized Gain (Loss) on Derivatives Recognized in Income | |
Derivatives not accounted for as hedging
instruments, carried at fair value | | Rights(1) | |
Equity contracts | | $ | 37,561 | |
| | | | |
| (1) | Included in net realized gain (loss) on investment transactions in the Statement of Operations. |
For the year ended October, 31, 2018, the Series did not have any net change in unrealized appreciation (depreciation) on derivatives in the Statement of Operations.
Financial Instruments/Transactions—Summary of Offsetting and Netting Arrangements:
The Series entered into financial instruments/transactions during the reporting period that are either offset in accordance with current requirements or are subject to enforceable master netting arrangements or similar agreements that permit offsetting. The information about offsetting and related netting arrangements for financial instruments/transactions, where the legal right to set-off exists, is presented in the summary below.
Offsetting of financial instrument/transaction assets and liabilities:
| | | | | | | | | | | | |
Description | | Gross
Market
Value of
Recognized
Assets/
(Liabilities) | | | Collateral
Pledged/
(Received)(1) | | | Net Amount | |
Securities on Loan | | $ | 1,059,510 | | | $ | (1,059,510 | ) | | $ | — | |
| | | | | | | | | | | | |
See Notes to Financial Statements.
| | | | |
| PGIM QMA International Equity Fund | | | 31 | |
Schedule of Investments (continued)
as of October 31, 2018
| (1) | Collateral amount disclosed by the Series is limited to the market value of financial instruments/transactions. |
See Notes to Financial Statements.
Statement of Assets & Liabilities
as of October 31, 2018
| | | | |
Assets | | | | |
Investments at value, including securities on loan of $1,059,510: | | | | |
Unaffiliated investments (cost $227,106,702) | | $ | 234,375,144 | |
Affiliated investments (cost $1,193,448) | | | 1,193,555 | |
Foreign currency, at value (cost $248,780) | | | 248,262 | |
Tax reclaim receivable | | | 1,110,143 | |
Dividends and interest receivable | | | 744,811 | |
Receivable for Series shares sold | | | 229,791 | |
Receivable for investments sold | | | 30,973 | |
Prepaid expenses | | | 2,157 | |
| | | | |
Total Assets | | | 237,934,836 | |
| | | | |
| |
Liabilities | | | | |
Payable to broker for collateral for securities on loan | | | 1,088,646 | |
Payable for Series shares reacquired | | | 262,495 | |
Accrued expenses and other liabilities | | | 147,637 | |
Payable for investments purchased | | | 126,467 | |
Management fee payable | | | 112,866 | |
Affiliated transfer agent fee payable | | | 78,152 | |
Distribution fee payable | | | 57,842 | |
Foreign capital gains tax liability accrued | | | 28,642 | |
| | | | |
Total Liabilities | | | 1,902,747 | |
| | | | |
| |
Net Assets | | $ | 236,032,089 | |
| | | | |
| | | | | |
Net assets were comprised of: | | | | |
Common stock, at par | | $ | 339,558 | |
Paid-in capital in excess of par | | | 223,356,851 | |
Total distributable earnings (loss) | | | 12,335,680 | |
| | | | |
Net assets, October 31, 2018 | | $ | 236,032,089 | |
| | | | |
See Notes to Financial Statements.
| | | | |
| PGIM QMA International Equity Fund | | | 33 | |
Statement of Assets & Liabilities
as of October 31, 2018
| | | | |
Class A | | | | |
Net asset value and redemption price per share,
($171,325,819 ÷ 24,631,106 shares of common stock issued and outstanding) | | $ | 6.96 | |
Maximum sales charge (5.50% of offering price) | | | 0.41 | |
| | | | |
Maximum offering price to public | | $ | 7.37 | |
| | | | |
| |
Class B | | | | |
Net asset value, offering price and redemption price per share,
($1,723,081 ÷ 260,170 shares of common stock issued and outstanding) | | $ | 6.62 | |
| | | | |
| |
Class C | | | | |
Net asset value, offering price and redemption price per share,
($12,530,157 ÷ 1,888,024 shares of common stock issued and outstanding) | | $ | 6.64 | |
| | | | |
| |
Class Z | | | | |
Net asset value, offering price and redemption price per share,
($13,901,035 ÷ 1,979,967 shares of common stock issued and outstanding) | | $ | 7.02 | |
| | | | |
| |
Class R6 | | | | |
Net asset value, offering price and redemption price per share,
($36,551,997 ÷ 5,196,530 shares of common stock issued and outstanding) | | $ | 7.03 | |
| | | | |
See Notes to Financial Statements.
Statement of Operations
Year Ended October 31, 2018
| | | | |
Net Investment Income (Loss) | | | | |
Income | | | | |
Unaffiliated dividend income (net of $1,031,467 foreign withholding tax) | | $ | 9,296,990 | |
Income from securities lending, net (including affiliated income of $6,204) | | | 62,228 | |
Affiliated dividend income | | | 5,482 | |
| | | | |
Total income | | | 9,364,700 | |
| | | | |
| |
Expenses | | | | |
Management fee | | | 2,058,290 | |
Distribution fee(a) | | | 782,590 | |
Transfer agent’s fees and expenses (including affiliated expense of $310,439)(a) | | | 582,132 | |
Custodian and accounting fees | | | 221,867 | |
Registration fees(a) | | | 70,611 | |
Shareholders’ reports | | | 68,974 | |
Audit fee | | | 30,618 | |
Legal fees and expenses | | | 21,421 | |
Directors’ fees | | | 17,050 | |
Miscellaneous | | | 88,126 | |
| | | | |
Total expenses | | | 3,941,679 | |
Less: Fee waiver and/or expense reimbursement(a) | | | (395,320 | ) |
| | | | |
Net expenses | | | 3,546,359 | |
| | | | |
Net investment income (loss) | | | 5,818,341 | |
| | | | |
| |
Realized And Unrealized Gain (Loss) On Investment And Foreign Currency Transactions | | | | |
Net realized gain (loss) on: | | | | |
Investment transactions (including affiliated of $(55)) (net of foreign capital gains taxes $(90,255)) | | | 12,912,691 | |
Foreign currency transactions | | | (159,807 | ) |
| | | | |
| | | 12,752,884 | |
| | | | |
Net change in unrealized appreciation (depreciation) on: | | | | |
Investments (including affiliated of $98) (net of change in foreign capital gains taxes $(28,642)) | | | (47,084,832 | ) |
Foreign currencies | | | 8,824 | |
| | | | |
| | | (47,076,008 | ) |
| | | | |
Net gain (loss) on investment and foreign currency transactions | | | (34,323,124 | ) |
| | | | |
Net Increase (Decrease) In Net Assets Resulting From Operations | | $ | (28,504,783 | ) |
| | | | |
| (a) | Class specific expenses and waivers were as follows: |
| | | | | | | | | | | | | | | | | | | | |
| | | Class A | | | Class B | | | Class C | | | Class Z | | | Class R6 | |
Distribution fee | | | 600,766 | | | | 25,560 | | | | 156,264 | | | | — | | | | — | |
Transfer agent’s fees and expenses | | | 501,514 | | | | 19,041 | | | | 36,473 | | | | 24,981 | | | | 123 | |
Registration fees | | | 14,676 | | | | 14,335 | | | | 14,258 | | | | 12,640 | | | | 14,702 | |
Fee waiver and/or expense reimbursement | | | (267,384 | ) | | | (17,471 | ) | | | (20,865 | ) | | | (22,772 | ) | | | (66,828 | ) |
See Notes to Financial Statements.
| | | | |
| PGIM QMA International Equity Fund | | | 35 | |
Statements of Changes in Net Assets
| | | | | | | | |
| | | Year Ended October 31, | |
| | | 2018 | | | 2017 | |
Increase (Decrease) in Net Assets | | | | | | | | |
Operations | | | | | | | | |
Net investment income (loss) | | $ | 5,818,341 | | | $ | 4,384,696 | |
Net realized gain (loss) on investment and foreign currency transactions | | | 12,752,884 | | | | 27,025,193 | |
Net change in unrealized appreciation (depreciation) on investments and foreign currencies | | | (47,076,008 | ) | | | 28,366,824 | |
| | | | | | | | |
Net increase (decrease) in net assets resulting from operations | | | (28,504,783 | ) | | | 59,776,713 | |
| | | | | | | | |
| | |
Dividends and Distributions | | | | | | | | |
Distributions from distributable earnings* | | | | | | | | |
Class A | | | (3,767,555 | ) | | | — | |
Class B | | | (34,288 | ) | | | — | |
Class C | | | (206,355 | ) | | | — | |
Class Z | | | (363,326 | ) | | | — | |
Class R6 | | | (939,275 | ) | | | — | |
| | | | | | | | |
| | | (5,310,799 | ) | | | — | |
| | | | | | | | |
Dividends from net investment income | | | | | | | | |
Class A | | | | | | | (3,575,263 | ) |
Class B | | | | | | | (42,092 | ) |
Class C | | | | | | | (214,555 | ) |
Class Z | | | | | | | (1,161,844 | ) |
| | | | | | | | |
| | | * | | | | (4,993,754 | ) |
| | | | | | | | |
| | |
Series share transactions (Net of share conversions) | | | | | | | | |
Net proceeds from shares sold | | | 15,948,974 | | | | 12,665,842 | |
Net asset value of shares issued in reinvestment of dividends and distributions | | | 5,229,466 | | | | 4,913,253 | |
Cost of shares reacquired | | | (35,360,628 | ) | | | (42,098,907 | ) |
| | | | | | | | |
Net increase (decrease) in net assets from Series share transactions | | | (14,182,188 | ) | | | (24,519,812 | ) |
| | | | | | | | |
Total increase (decrease) | | | (47,997,770 | ) | | | 30,263,147 | |
| | |
Net Assets: | | | | | | | | |
Beginning of year | | | 284,029,859 | | | | 253,766,712 | |
| | | | | | | | |
End of year(a) | | $ | 236,032,089 | | | $ | 284,029,859 | |
| | | | | | | | |
(a) Includes undistributed/(distributions in excess of) net investment income of: | | $ | * | | | $ | 3,897,086 | |
| | | | | | | | |
| * | For the year ended October 31, 2018, the Series has adopted amendments to Regulation S-X (refer to Note 9). |
See Notes to Financial Statements.
Notes to Financial Statements
Prudential World Fund, Inc. (the “Fund”) is registered under the Investment Company Act of 1940, as amended (“1940 Act”), as an open-end management investment company and currently consists of seven series: PGIM Jennison Emerging Markets Equity Opportunities Fund (formerly known as Prudential Jennison Emerging Markets Equity Fund), PGIM Jennison Global Opportunities Fund, PGIM Jennison International Opportunities Fund and PGIM QMA International Equity Fund, each of which are diversified funds and PGIM Jennison Global Infrastructure Fund, PGIM Emerging Markets Debt Hard Currency Fund and PGIM Emerging Markets Debt Local Currency Fund, each of which are non-diversified funds for purposes of the 1940 Act and may invest a greater percentage of their assets in the securities of a single company or other issuer than a diversified fund. Investing in a non-diversified fund involves greater risk than investing in a diversified fund because a loss resulting from the decline in value of any one security may represent a greater portion of the total assets of a non-diversified fund. These financial statements relate only to the PGIM QMA International Equity Fund (the “Series”). Effective June 11, 2018, the names of the Series and the other series which comprise the Fund were changed by replacing “Prudential” with “PGIM” and each series’ Class Q shares were renamed Class R6 shares.
The investment objective of the Series is to seek long-term growth of capital.
1. Accounting Policies
The Series follows the investment company accounting and reporting guidance of the Financial Accounting Standards Board (“FASB”) Accounting Standard Codification (“ASC”) Topic 946 Financial Services—Investment Companies. The following accounting policies conform to U.S. generally accepted accounting principles. The Series consistently follows such policies in the preparation of its financial statements.
Securities Valuation: The Series holds securities and other assets and liabilities that are fair valued at the close of each day (generally, 4:00 PM Eastern time) the New York Stock Exchange (“NYSE”) is open for trading. Fair value is the price that would be received to sell an asset or paid to transfer a liability in an orderly transaction between market participants on the measurement date. The Fund’s Board of Directors (the “Board”) has adopted valuation procedures for security valuation under which fair valuation responsibilities have been delegated to PGIM Investments LLC (“PGIM Investments” or the “Manager”). Pursuant to the Board’s delegation, a Valuation Committee has been established as two persons, being one or more officers of the Fund, including: the Fund’s Treasurer (or the Treasurer’s direct reports); and the Fund’s Chief or Deputy Chief Compliance Officer (or Vice-President-level direct reports of the Chief or Deputy Chief Compliance Officer). Under the current valuation procedures, the Valuation Committee of the Board is responsible for supervising the valuation of portfolio securities and other assets and liabilities. The valuation procedures permit the Series to utilize independent pricing vendor services, quotations from
| | | | |
| PGIM QMA International Equity Fund | | | 37 | |
Notes to Financial Statements (continued)
market makers, and alternative valuation methods when market quotations are either not readily available or not deemed representative of fair value. A record of the Valuation Committee’s actions is subject to the Board’s review, approval, and ratification at its next regularly scheduled quarterly meeting.
For the fiscal reporting period-end, securities and other assets and liabilities were fair valued at the close of the last U.S. business day. Trading in certain foreign securities may occur when the NYSE is closed (including weekends and holidays). Because such foreign securities trade in markets that are open on weekends and U.S. holidays, the values of some of the Series’ foreign investments may change on days when investors cannot purchase or redeem Series shares.
Various inputs determine how the Series’ investments are valued, all of which are categorized according to the three broad levels (Level 1, 2, or 3) detailed in the Schedule of Investments and referred to herein as the “fair value hierarchy” in accordance with FASB ASC Topic 820—Fair Value Measurements and Disclosures.
Common and preferred stocks, exchange-traded funds, and derivative instruments, such as futures or options, that are traded on a national securities exchange are valued at the last sale price as of the close of trading on the applicable exchange where the security principally trades. Securities traded via NASDAQ are valued at the NASDAQ official closing price. To the extent these securities are valued at the last sale price or NASDAQ official closing price, they are classified as Level 1 in the fair value hierarchy. In the event that no sale or official closing price on valuation date exists, these securities are generally valued at the mean between the last reported bid and ask prices, or at the last bid price in the absence of an ask price. These securities are classified as Level 2 in the fair value hierarchy.
Foreign equities traded on foreign securities exchanges are generally valued using pricing vendor services that provide model prices derived using adjustment factors based on information such as local closing price, relevant general and sector indices, currency fluctuations, depositary receipts, and futures, as applicable. Securities valued using such model prices are classified as Level 2 in the fair value hierarchy. The models generate an evaluated adjustment factor for each security, which is applied to the local closing price to adjust it for post closing market movements up to the time the Series is valued. Utilizing that evaluated adjustment factor, the vendor provides an evaluated price for each security. If the vendor does not provide an evaluated price, securities are valued in accordance with exchange-traded common and preferred stock valuation policies discussed above.
Investments in open-end, non-exchange-traded mutual funds are valued at their net asset values as of the close of the NYSE on the date of valuation. These securities are classified as
Level 1 in the fair value hierarchy since they may be purchased or sold at their net asset values on the date of valuation.
Securities and other assets that cannot be priced according to the methods described above are valued based on pricing methodologies approved by the Board. In the event that unobservable inputs are used when determining such valuations, the securities will be classified as Level 3 in the fair value hierarchy.
When determining the fair value of securities, some of the factors influencing the valuation include: the nature of any restrictions on disposition of the securities; assessment of the general liquidity of the securities; the issuer’s financial condition and the markets in which it does business; the cost of the investment; the size of the holding and the capitalization of the issuer; the prices of any recent transactions or bids/offers for such securities or any comparable securities; any available analyst media or other reports or information deemed reliable by the Manager regarding the issuer or the markets or industry in which it operates. Using fair value to price securities may result in a value that is different from a security’s most recent closing price and from the price used by other unaffiliated mutual funds to calculate their net asset values.
Restricted and Illiquid Securities: Subject to guidelines adopted by the Board, the Series may invest up to 15% of its net assets in illiquid securities, including those which are restricted as to disposition under securities law (“restricted securities”). Restricted securities are valued pursuant to the valuation procedures noted above. Illiquid securities are those that, because of the absence of a readily available market or due to legal or contractual restrictions on resale, cannot be sold within seven days in the ordinary course of business at approximately the amount at which the Series has valued the investment. Therefore, the Series may find it difficult to sell illiquid securities at the time considered most advantageous by its subadviser and may incur transaction costs that would not be incurred in the sale of securities that were freely marketable. Certain securities that would otherwise be considered illiquid because of legal restrictions on resale to the general public may be traded among qualified institutional buyers under Rule 144A of the Securities Act of 1933. These Rule 144A securities, as well as commercial paper that is sold in private placements under Section 4(2) of the Securities Act, may be deemed liquid by the Series’ subadviser under the guidelines adopted by the Board of the Fund. However, the liquidity of the Series’ investments in Rule 144A securities could be impaired if trading does not develop or declines.
Foreign Currency Translation: The books and records of the Series are maintained in U.S. dollars. Foreign currency amounts are translated into U.S. dollars on the following basis:
(i) market value of investment securities, other assets and liabilities—at the current rates of exchange;
(ii) purchases and sales of investment securities, income and expenses—at the rates of exchange prevailing on the respective dates of such transactions.
| | | | |
| PGIM QMA International Equity Fund | | | 39 | |
Notes to Financial Statements (continued)
Although the net assets of the Series are presented at the foreign exchange rates and market values at the close of the period, the Series does not generally isolate that portion of the results of operations arising as a result of changes in the foreign exchange rates from the fluctuations arising from changes in the market prices of long-term portfolio securities held at the end of the period. Similarly, the Series does not isolate the effect of changes in foreign exchange rates from the fluctuations arising from changes in the market prices of long-term portfolio securities sold during the period. Accordingly, holding period realized foreign currency gains (losses) are included in the reported net realized gains (losses) on investment transactions.
Net realized gains (losses) on foreign currency transactions represent net foreign exchange gains (losses) from the disposition of holdings of foreign currencies, currency gains (losses) realized between the trade and settlement dates on securities transactions, and the difference between the amounts of interest, dividends and foreign withholding taxes recorded on the Series’ books and the U.S. dollar equivalent amounts actually received or paid. Net unrealized currency gains (losses) arise from valuing foreign currency denominated assets and liabilities (other than investments) at period end exchange rates.
Master Netting Arrangements: The Series is subject to various Master Agreements, or netting arrangements, with select counterparties. These are agreements which a subadviser may have negotiated and entered into on behalf of the Series. A master netting arrangement between the Series and the counterparty permits the Series to offset amounts payable by the Series to the same counterparty against amounts to be received; and by the receipt of collateral from the counterparty by the Series to cover the Series’ exposure to the counterparty. However, there is no assurance that such mitigating factors are easily enforceable. In addition to master netting arrangements, the right to set-off exists when all the conditions are met such that each of the parties owes the other determinable amounts, the reporting party has the right to set-off the amount owed with the amount owed by the other party, the reporting party intends to set-off and the right of set-off is enforceable by law. During the reporting period, there was no intention to settle on a net basis and all amounts are presented on a gross basis on the Statement of Assets and Liabilities.
Warrants and Rights: The Series held warrants and rights acquired either through a direct purchase or pursuant to corporate actions. Warrants and rights entitle the holder to buy a proportionate amount of common stock, or such other security that the issuer may specify, at a specific price and time through the expiration dates. Such warrants and rights are held as long positions by the Series until exercised, sold or expired. Warrants and rights are valued at fair value in accordance with the Board approved fair valuation procedures.
Securities Lending: The Series lends its portfolio securities to banks and broker-dealers. The loans are secured by collateral at least equal to the market value of the securities loaned.
Collateral pledged by each borrower is invested in an affiliated money market fund and is marked to market daily, based on the previous day’s market value, such that the value of the collateral exceeds the value of the loaned securities. In the event of significant appreciation in value of securities on loan on the last business day of the reporting period, the financial statements may reflect a collateral value that is less than the market value of the loaned securities. Such shortfall is remedied as described above. Loans are subject to termination at the option of the borrower or the Series. Upon termination of the loan, the borrower will return to the Series securities identical to the loaned securities. Should the borrower of the securities fail financially, the Series has the right to repurchase the securities in the open market using the collateral.
The Series recognizes income, net of any rebate and securities lending agent fees, for lending its securities in the form of fees or interest on the investment of any cash received as collateral. The borrower receives all interest and dividends from the securities loaned and such payments are passed back to the lender in amounts equivalent thereto. The Series also continues to recognize any unrealized gain (loss) in the market price of the securities loaned and on the change in the value of the collateral invested that may occur during the term of the loan. In addition, realized gain (loss) is recognized on changes in the value of the collateral invested upon liquidation of the collateral. Net earnings from securities lending are disclosed on the Statement of Operations as “Income from securities lending, net”.
Securities Transactions and Net Investment Income: Securities transactions are recorded on the trade date. Realized gains (losses) from investment and currency transactions are calculated on the specific identification method. Dividend income is recorded on the ex-date. Expenses are recorded on an accrual basis, which may require the use of certain estimates by management that may differ from actual. Net investment income or loss (other than class specific expenses and waivers, which are allocated as noted below) and unrealized and realized gains (losses) are allocated daily to each class of shares based upon the relative proportion of adjusted net assets of each class at the beginning of the day. Class specific expenses and waivers, where applicable, are charged to the respective share classes. Class specific expenses include distribution fees and distribution fee waivers, shareholder servicing fees, transfer agent’s fees and expenses, registration fees and fee waivers and/or expense reimbursements, as applicable.
Taxes: It is the Series’ policy to continue to meet the requirements of the Internal Revenue Code applicable to regulated investment companies and to distribute all of its taxable net investment income and capital gains, if any, to its shareholders. Therefore, no federal income tax provision is required. Withholding taxes on foreign dividends, interest and capital gains, if any, are recorded, net of reclaimable amounts, at the time the related income is earned.
Dividends and Distributions: The Series expects to pay dividends from net investment income and distributions from net realized capital and currency gains, if any, annually. Dividends and distributions to shareholders, which are determined in accordance with federal income tax regulations and which may differ from generally accepted accounting
| | | | |
| PGIM QMA International Equity Fund | | | 41 | |
Notes to Financial Statements (continued)
principles, are recorded on the ex-date. Permanent book/tax differences relating to income and gain (loss) are reclassified amongst total distributable earnings (loss) and paid-in capital in excess of par, as appropriate.
Estimates: The preparation of financial statements requires management to make estimates and assumptions that affect the reported amounts and disclosures in the financial statements. Actual results could differ from those estimates.
2. Agreements
The Fund, on behalf of the Series, has a management agreement with PGIM Investments. Pursuant to this agreement, PGIM Investments has responsibility for all investment advisory services and supervises the subadviser’s performance of such services. In addition, under the management agreement, PGIM Investments provides all of the administrative functions necessary for the organization, operation and management of the Series. PGIM Investments administers the corporate affairs of the Series and, in connection therewith, furnishes the Series with office facilities, together with those ordinary clerical and bookkeeping services which are not being furnished by the Series’ custodian and the Series’ transfer agent. PGIM Investments is also responsible for the staffing and management of dedicated groups of legal, marketing, compliance and related personnel necessary for the operation of the Series. The legal, marketing, compliance and related personnel are also responsible for the management and oversight of the various service providers to the Series, including, but not limited to, the custodian, transfer agent, and accounting agent.
PGIM Investments has entered into a subadvisory agreement with Quantitative Management Associates LLC (“QMA”). The subadvisory agreement provides that QMA will furnish investment advisory services in connection with the management of the Series. In connection therewith, QMA is obligated to keep certain books and records of the Series. PGIM Investments pays for the services of QMA, the cost of compensation of officers of the Series, occupancy and certain clerical and bookkeeping costs of the Series. The Series bears all other costs and expenses.
The management fee paid to PGIM Investments is accrued daily and payable monthly at an annual rate of 0.750% of the Series’ average daily net assets up to $2 billion, 0.70% of the next $3 billion and 0.690% of the average daily net assets over $5 billion. The effective management fee rate before any waivers and/or expense reimbursements was 0.750% for the year ended October 31, 2018.
PGIM Investments has contractually agreed, through February 29, 2020, to limit total annual operating expenses after fee waivers and/or expense reimbursements to 2.53% of average daily net assets for Class B shares, and 0.78% of average daily net assets for
Class R6 shares. This contractual waiver excludes interest, brokerage, taxes (such as income and foreign withholding taxes, stamp duty and deferred tax expenses), acquired fund fees and expenses, extraordinary expenses, and certain other Series expenses such as dividend and interest expense and broker charges on short sales. Expenses waived/reimbursed by the Manager in accordance with this agreement may be recouped by the Manager within the same fiscal year during which such waiver/reimbursement is made if such recoupment can be realized without exceeding the expense limit in effect at the time of the recoupment for that fiscal year.
Where applicable, PGIM Investments voluntarily agreed through October 31, 2018, to waive management fees or shared operating expenses on any share class to the same extent that it waives similar expenses on any other share class and, in addition, total annual operating expenses for Class R6 shares will not exceed total annual operating expenses for Class Z shares. Effective November 1, 2018 this voluntary agreement became part of the Fund’s contractual waiver agreement through February 29, 2020 and is subject to recoupment by the Manager within the same fiscal year during which such wavier/reimbursement is made if such recoupment can be realized without exceeding the expense limit in effect at the time of the recoupment for that fiscal year.
The Fund, on behalf of the Series, has a distribution agreement with Prudential Investment Management Services LLC (“PIMS”), which acts as the distributor of the Class A, Class B, Class C, Class Z and Class R6 shares of the Series. The Series compensates PIMS for distributing and servicing the Series’ Class A, Class B and Class C shares, pursuant to the plans of distribution (the “Distribution Plans”), regardless of expenses actually incurred by PIMS. The distribution fees are accrued daily and payable monthly. No distribution or service fees are paid to PIMS as distributor of the Class Z and Class R6 shares of the Series.
Pursuant to the Distribution Plans, the Series compensates PIMS for distribution related activities at an annual rate of up to 0.30%, 1% and 1% of the average daily net assets of the Class A, Class B and Class C shares, respectively.
PIMS has advised the Series that it received $83,579 in front-end sales charges resulting from sales of Class A shares during the year ended October 31, 2018. From these fees, PIMS paid such sales charges to broker-dealers, who in turn paid commissions to salespersons and incurred other distribution costs.
PIMS has advised the Series that for the year ended October 31, 2018, it received $0, $1,716 and $475 in contingent deferred sales charges imposed upon redemptions by certain Class A, Class B and Class C shareholders, respectively.
PGIM Investments, PIMS and QMA are indirect, wholly-owned subsidiaries of Prudential Financial, Inc. (“Prudential”).
| | | | |
| PGIM QMA International Equity Fund | | | 43 | |
Notes to Financial Statements (continued)
3. Other Transactions with Affiliates
Prudential Mutual Fund Services LLC (“PMFS”), an affiliate of PGIM Investments and an indirect, wholly-owned subsidiary of Prudential, serves as the Series’ transfer agent. Transfer agent’s fees and expenses in the Statement of Operations include certain out-of-pocket expenses paid to non-affiliates, where applicable.
The Series may enter into certain securities purchase or sale transactions under Board approved Rule 17a-7 procedures. Rule 17a-7 is an exemptive rule under the 1940 Act, that, subject to certain conditions, permits purchase and sale transactions among affiliated investment companies, or between an investment company and a person that is affiliated solely by reason of having a common (or affiliated) investment adviser, common directors, and/or common officers. Such transactions are subject to ratification by the Board. For the reporting period ended October 31, 2018, no such transactions were entered into by the Series.
The Series may invest its overnight sweep cash in the PGIM Core Ultra Short Bond Fund (the “Core Fund”), and its securities lending cash collateral in the PGIM Institutional Money Market Fund (the “Money Market Fund”), each a series of Prudential Investment Portfolios 2, registered under the 1940 Act and managed by PGIM Investments. For the reporting period ended October 31, 2018, PGIM, Inc. was compensated $1,921 by PGIM Investments for managing the Series’ securities lending cash collateral as subadviser to the Money Market Fund. Earnings from the Core Fund and Money Market Fund are disclosed on the Statement of Operations as “Affiliated dividend income” and “Income from securities lending, net”, respectively.
4. Portfolio Securities
The aggregate cost of purchases and proceeds from sales of portfolio securities (excluding short-term investments and U.S. Government securities) for the year ended October 31, 2018, were $309,138,124 and $323,000,404, respectively.
A summary of the cost of purchases and proceeds from sales of shares of affiliated mutual funds for the year ended October 31, 2018, is presented as follows:
| | | | | | | | | | | | | | | | | | | | | | | | | | | | | | |
Value,
Beginning
of Year | | | Cost of
Purchases | | | Proceeds
from Sales | | | Change in
Unrealized
Gain
(Loss) | | | Realized
Gain
(Loss) | | | Value,
End of
Year | | | Shares,
End of
Year | | | Income | |
| | PGIM Core Ultra Short Bond Fund* | | | | | | | | | | | | | |
| $ | 234,025 | | | $ | 34,127,424 | | | $ | 34,260,107 | | | $ | — | | | $ | — | | | $ | 101,342 | | | | 101,342 | | | $ | 5,482 | |
| | | |
| | PGIM Institutional Money Market Fund* | | | | | | | | | | | | | |
| | 7,029,505 | | | | 28,778,023 | | | | 34,715,358 | | | | 98 | | | | (55 | ) | | | 1,092,213 | | | | 1,092,213 | | | | 6,204 | ** |
| | | | | | | | | | | | | | | | | | | | | | | | | | | | | | |
| $ | 7,263,530 | | | $ | 62,905,447 | | | $ | 68,975,465 | | | $ | 98 | | | $ | (55 | ) | | $ | 1,193,555 | | | | | | | $ | 11,686 | |
| | | | | | | | | | | | | | | | | | | | | | | | | | | | | | |
| * | The Fund did not have any capital gain distributions during the reporting period. |
| ** | This amount is included in “Income from securities lending, net” on the Statement of Operations. |
5. Distributions and Tax Information
Distributions to shareholders, which are determined in accordance with federal income tax regulations and which may differ from generally accepted accounting principles, are recorded on the ex-date.
For the year ended October 31, 2018, the tax character of dividends paid by the Series was $5,310,799 of ordinary income. For the year ended October 31, 2017, the tax character of dividends paid by the Series was $4,993,754 of ordinary income.
As of October 31, 2018, the accumulated undistributed earnings on a tax basis were $5,343,097 of ordinary income and $874,172 of long-term capital gains.
The United States federal income tax basis of the Series’ investments and the net unrealized appreciation as of October 31, 2018 were as follows:
| | | | | | |
Tax Basis | | Gross Unrealized Appreciation | | Gross Unrealized Depreciation | | Net Unrealized Appreciation |
| $229,450,288 | | $23,704,848 | | $(17,586,437) | | $6,118,411 |
The difference between book and tax basis was primarily due to deferred losses on wash sales, investments in passive foreign investment companies and corporate spin-off adjustments.
For federal income tax purposes, the Series utilized approximately $10,778,000 of its capital loss carryforward to offset capital gains during the year ended October 31, 2018.
Management has analyzed the Series’ tax positions taken on federal, state and local income tax returns for all open tax years and has concluded that no provision for income tax is required in the Series’ financial statements for the current reporting period. The Series’ federal, state and local income and federal excise tax returns for tax years for which the applicable statutes of limitations have not expired are subject to examination by the Internal
| | | | |
| PGIM QMA International Equity Fund | | | 45 | |
Notes to Financial Statements (continued)
Revenue Service and state departments of revenue.
6. Capital and Ownership
The Series offers Class A, Class B, Class C, Class Z and Class R6 shares. Class A shares are sold with a maximum front-end sales charge of 5.50%. Investors who purchase $1 million or more of Class A shares and sell these shares within 12 months of purchase are subject to a contingent deferred sales charge (“CDSC”) of 1%, although they are not subject to an initial sales charge. The Class A CDSC is waived for certain retirement and/or benefit plans. A special exchange privilege is also available for shareholders who qualified to purchase Class A shares at net asset value. Class B shares are sold with a CDSC which declines from 5% to zero depending on the period of time the shares are held. Class B shares will automatically convert to Class A shares on a quarterly basis approximately seven years after purchase. Class B shares are closed to new purchases. Class C shares are sold with a CDSC of 1% on sales made within 12 months of purchase. Class Z and Class R6 shares are not subject to any sales or redemption charge and are available exclusively for sale to a limited group of investors.
Under certain circumstances, an exchange may be made from specified share classes of the Series to one or more other share classes of the Series as presented in the table of transactions in shares of common stock.
The Fund is authorized to issue 5.075 billion shares of common stock, with a par value of $0.01 per share, which is divided into seven series. There are 700 million shares authorized for the Series, divided into six classes, designated Class A, Class B, Class C, Class Z, Class R6 and Class T common stock, each of which consists of 100 million, 5 million, 100 million, 180 million, 180 million and 135 million authorized shares, respectively. The Series currently does not have any Class T shares outstanding.
As of October 31, 2018, Prudential, through its affiliated entities, including affiliated funds (if applicable), owned 4,989,881 Class R6 shares of the Series. At reporting period end, four
shareholders of record held 41% of the Series’ outstanding shares on behalf of multiple beneficial owners, of which 12% were held by an affiliate of Prudential.
Transactions in shares of common stock were as follows:
| | | | | | | | |
Class A | | Shares | | | Amount | |
Year ended October 31, 2018: | | | | | | | | |
Shares sold | | | 804,151 | | | $ | 6,370,219 | |
Shares issued in reinvestment of dividends and distributions | | | 477,661 | | | | 3,697,101 | |
Shares reacquired | | | (2,740,309 | ) | | | (21,405,716 | ) |
| | | | | | | | |
Net increase (decrease) in shares outstanding before conversion | | | (1,458,497 | ) | | | (11,338,396 | ) |
Shares issued upon conversion from other share class(es) | | | 98,091 | | | | 763,413 | |
Shares reacquired upon conversion into other share class(es) | | | (125,149 | ) | | | (987,877 | ) |
| | | | | | | | |
Net increase (decrease) in shares outstanding | | | (1,485,555 | ) | | $ | (11,562,860 | ) |
| | | | | | | | |
Year ended October 31, 2017: | | | | | | | | |
Shares sold | | | 752,431 | | | $ | 5,382,926 | |
Shares issued in reinvestment of dividends and distributions | | | 558,922 | | | | 3,504,441 | |
Shares reacquired | | | (3,695,192 | ) | | | (25,772,057 | ) |
| | | | | | | | |
Net increase (decrease) in shares outstanding before conversion | | | (2,383,839 | ) | | | (16,884,690 | ) |
Shares issued upon conversion from other share class(es) | | | 184,434 | | | | 1,286,550 | |
Shares reacquired upon conversion into other share class(es) | | | (243,609 | ) | | | (1,688,042 | ) |
| | | | | | | | |
Net increase (decrease) in shares outstanding | | | (2,443,014 | ) | | $ | (17,286,182 | ) |
| | | | | | | | |
Class B | | | | | | |
Year ended October 31, 2018: | | | | | | | | |
Shares sold | | | 28,928 | | | $ | 223,860 | |
Shares issued in reinvestment of dividends and distributions | | | 4,495 | | | | 33,444 | |
Shares reacquired | | | (86,909 | ) | | | (647,663 | ) |
| | | | | | | | |
Net increase (decrease) in shares outstanding before conversion | | | (53,486 | ) | | | (390,359 | ) |
Shares reacquired upon conversion into other share class(es) | | | (83,891 | ) | | | (627,742 | ) |
| | | | | | | | |
Net increase (decrease) in shares outstanding | | | (137,377 | ) | | $ | (1,018,101 | ) |
| | | | | | | | |
Year ended October 31, 2017: | | | | | | | | |
Shares sold | | | 70,167 | | | $ | 511,080 | |
Shares issued in reinvestment of dividends and distributions | | | 6,760 | | | | 40,832 | |
Shares reacquired | | | (55,031 | ) | | | (363,862 | ) |
| | | | | | | | |
Net increase (decrease) in shares outstanding before conversion | | | 21,896 | | | | 188,050 | |
Shares reacquired upon conversion into other share class(es) | | | (120,582 | ) | | | (808,620 | ) |
| | | | | | | | |
Net increase (decrease) in shares outstanding | | | (98,686 | ) | | $ | (620,570 | ) |
| | | | | | | | |
| | | | |
| PGIM QMA International Equity Fund | | | 47 | |
Notes to Financial Statements (continued)
| | | | | | | | |
Class C | | Shares | | | Amount | |
Year ended October 31, 2018: | | | | | | | | |
Shares sold | | | 97,298 | | | $ | 737,280 | |
Shares issued in reinvestment of dividends and distributions | | | 27,319 | | | | 202,979 | |
Shares reacquired | | | (422,142 | ) | | | (3,144,588 | ) |
| | | | | | | | |
Net increase (decrease) in shares outstanding before conversion | | | (297,525 | ) | | | (2,204,329 | ) |
Shares reacquired upon conversion into other share class(es) | | | (7,107 | ) | | | (54,450 | ) |
| | | | | | | | |
Net increase (decrease) in shares outstanding | | | (304,632 | ) | | $ | (2,258,779 | ) |
| | | | | | | | |
Year ended October 31, 2017: | | | | | | | | |
Shares sold | | | 151,352 | | | $ | 1,041,106 | |
Shares issued in reinvestment of dividends and distributions | | | 34,905 | | | | 210,474 | |
Shares reacquired | | | (470,230 | ) | | | (3,105,114 | ) |
| | | | | | | | |
Net increase (decrease) in shares outstanding before conversion | | | (283,973 | ) | | | (1,853,534 | ) |
Shares reacquired upon conversion into other share class(es) | | | (84,714 | ) | | | (563,607 | ) |
| | | | | | | | |
Net increase (decrease) in shares outstanding | | | (368,687 | ) | | $ | (2,417,141 | ) |
| | | | | | | | |
Class Z | | | | | | |
Year ended October 31, 2018: | | | | | | | | |
Shares sold | | | 201,211 | | | $ | 1,579,542 | |
Shares issued in reinvestment of dividends and distributions | | | 45,785 | | | | 356,667 | |
Shares reacquired | | | (539,404 | ) | | | (4,190,995 | ) |
| | | | | | | | |
Net increase (decrease) in shares outstanding before conversion | | | (292,408 | ) | | | (2,254,786 | ) |
Shares issued upon conversion from other share class(es) | | | 125,908 | | | | 1,001,643 | |
Shares reacquired upon conversion into other share class(es) | | | (16,340 | ) | | | (125,981 | ) |
| | | | | | | | |
Net increase (decrease) in shares outstanding | | | (182,840 | ) | | $ | (1,379,124 | ) |
| | | | | | | | |
Year ended October 31, 2017: | | | | | | | | |
Shares sold | | | 650,610 | | | $ | 4,273,750 | |
Shares issued in reinvestment of dividends and distributions | | | 183,440 | | | | 1,157,506 | |
Shares reacquired | | | (825,492 | ) | | | (5,651,314 | ) |
| | | | | | | | |
Net increase (decrease) in shares outstanding before conversion | | | 8,558 | | | | (220,058 | ) |
Shares issued upon conversion from other share class(es) | | | 241,534 | | | | 1,676,815 | |
Shares reacquired upon conversion into other share class(es) | | | (5,687,349 | ) | | | (35,945,590 | ) |
| | | | | | | | |
Net increase (decrease) in shares outstanding | | | (5,437,257 | ) | | $ | (34,488,833 | ) |
| | | | | | | | |
| | | | | | | | |
Class R6 | | Shares | | | Amount | |
Year ended October 31, 2018: | | | | | | | | |
Shares sold | | | 917,539 | | | $ | 7,038,073 | |
Shares issued in reinvestment of dividends and distributions | | | 120,574 | | | | 939,275 | |
Shares reacquired | | | (744,222 | ) | | | (5,971,666 | ) |
| | | | | | | | |
Net increase (decrease) in shares outstanding before conversion | | | 293,891 | | | | 2,005,682 | |
Shares issued upon conversion from other share class(es) | | | 3,823 | | | | 30,994 | |
| | | | | | | | |
Net increase (decrease) in shares outstanding | | | 297,714 | | | $ | 2,036,676 | |
| | | | | | | | |
Period ended October 31, 2017*: | | | | | | | | |
Shares sold | | | 201,769 | | | $ | 1,456,980 | |
Shares reacquired† | | | (1,003,132 | ) | | | (7,206,560 | ) |
| | | | | | | | |
Net increase (decrease) in shares outstanding before conversion | | | (801,363 | ) | | | (5,749,580 | ) |
Shares issued upon conversion from other share class(es) | | | 5,700,179 | | | | 36,042,494 | |
| | | | | | | | |
Net increase (decrease) in shares outstanding | | | 4,898,816 | | | $ | 30,292,914 | |
| | | | | | | | |
| * | Commencement of offering was December 28, 2016. |
| † | Includes affiliated redemptions of 1,582 shares with a value of $12,199 for Class R6 shares. |
7. Borrowings
The Fund, on behalf of the Series, along with other affiliated registered investment companies (the “Funds”), is a party to a Syndicated Credit Agreement (“SCA”) with a group of banks. The purpose of the SCA is to provide an alternative source of temporary funding for capital share redemptions. The SCA provides for a commitment of $900 million for the period October 4, 2018 through October 3, 2019. The Funds pay an annualized commitment fee of 0.15% of the unused portion of the SCA. The Series’ portion of the commitment fee for the unused amount, allocated based upon a method approved by the Board, is accrued daily and paid quarterly. Prior to October 4, 2018, the Funds had another SCA that provided a commitment of $900 million and the Funds paid an annualized commitment fee of 0.15% of the unused portion of the SCA. The interest on borrowings under both SCAs is paid monthly and at a per annum interest rate based upon a contractual spread plus the higher of (1) the effective federal funds rate, (2) the 1-month LIBOR rate or (3) zero percent.
Other affiliated registered investment companies that are parties to the SCA include portfolios that are subject to a predetermined mathematical formula used to manage certain benefit guarantees offered under variable annuity contracts. The formula may result in large scale asset flows into and out of these portfolios. Consequently, these portfolios may be more likely to utilize the SCA for purposes of funding redemptions. It may be possible for those portfolios to fully exhaust the committed amount of the SCA, thereby requiring the Manager to allocate available funding per a Board-approved methodology designed to treat the Funds in the SCA equitably.
The Series utilized the SCA during the reporting period ended October 31, 2018. The average daily balance for the 91 days that the Series had loans outstanding during the period was $324,253, borrowed at a weighted average interest rate of 3.10%. The maximum loan balance outstanding during the period was $1,855,000. At October 31,
| | | | |
| PGIM QMA International Equity Fund | | | 49 | |
Notes to Financial Statements (continued)
2018, the Series did not have an outstanding loan balance.
8. Risks of Investing in the Series
The Series’ risks include, but are not limited to, some or all of the risks discussed below:
Emerging Markets Risk: The risks of foreign investments are greater for investments in or exposed to emerging markets. Emerging market countries typically have economic and political systems that are less fully developed, and can be expected to be less stable, than those of more developed countries. For example, the economies of such countries can be subject to rapid and unpredictable rates of inflation or deflation. Low trading volumes may result in a lack of liquidity and price volatility. Emerging market countries may have policies that restrict investment by non-US investors, or that prevent non-US investors from withdrawing their money at will.
Equity and Equity-Related Securities Risks: The value of a particular security could go down and you could lose money. In addition to an individual security losing value, the value of the equity markets or a sector in which the Series invests could go down. The Series’ holdings can vary significantly from broad market indexes and the performance of the Series can deviate from the performance of these indexes. Different parts of a market can react differently to adverse issuer, market, regulatory, political and economic developments.
Foreign Securities Risk: The Series’ investments in securities of foreign issuers or issuers with significant exposure to foreign markets involve additional risk. Foreign countries in which the Series may invest may have markets that are less liquid, less regulated and more volatile than US markets. The value of the Series’ investments may decline because of factors affecting the particular issuer as well as foreign markets and issuers generally, such as unfavorable government actions, and political or financial instability.
9. Recent Accounting Pronouncements and Reporting Updates
In August 2018, the Securities and Exchange Commission (the “SEC”) adopted amendments to Regulation S-X to update and simplify the disclosure requirements for registered investment companies by eliminating requirements that are redundant or duplicative of US GAAP requirements or other SEC disclosure requirements. The new amendments require the presentation of the total, rather than the components, of distributable earnings on the Statement of Assets and Liabilities and the total, rather than the components, of dividends from net investment income and distributions from net realized gains on the Statements of Changes in Net Assets. The amendments also removed the requirement for the parenthetical disclosure of undistributed net investment income on
the Statements of Changes in Net Assets and certain tax adjustments that were reflected in the Notes to Financial Statements. All of these have been reflected in the Series’ financial statements.
In August 2018, the FASB issued Accounting Standards Update (“ASU”) No. 2018-13, which changes certain fair value measurement disclosure requirements. The new ASU, in addition to other modifications and additions, removes the requirement to disclose the amount and reasons for transfers between Level 1 and Level 2 of the fair value hierarchy, and the Series’ policy for the timing of transfers between levels. The amendments are effective for financial statements issued for fiscal years beginning after December 15, 2019, and interim periods within those fiscal years. Management has evaluated the implications of certain provisions of the ASU and has determined to early adopt aspects related to the removal and modification of certain fair value measurement disclosures under the ASU effective immediately. At this time, management is evaluating the implications of certain other provisions of the ASU related to new disclosure requirements and any impact on the financial statement disclosures has not yet been determined.
| | | | |
| PGIM QMA International Equity Fund | | | 51 | |
Financial Highlights
| | | | | | | | | | | | | | | | | | | | |
| Class A Shares | |
| | | Year Ended October 31, | |
| | | 2018 | | | 2017 | | | 2016 | | | 2015 | | | 2014 | |
| Per Share Operating Performance(a): | | | | | | | | | | | | | | | | | | | | |
| Net Asset Value, Beginning of Year | | | $7.95 | | | | $6.48 | | | | $6.65 | | | | $7.36 | | | | $7.37 | |
| Income (loss) from investment operations: | | | | | | | | | | | | | | | | | | | | |
| Net investment income (loss) | | | 0.16 | | | | 0.11 | | | | 0.11 | | | | 0.11 | | | | 0.15 | |
| Net realized and unrealized gain (loss) on investment and foreign currency transactions | | | (1.00 | ) | | | 1.49 | | | | (0.17 | ) | | | (0.65 | ) | | | (0.02 | ) |
| Total from investment operations | | | (0.84 | ) | | | 1.60 | | | | (0.06 | ) | | | (0.54 | ) | | | 0.13 | |
| Less Dividends and Distributions: | | | | | | | | | | | | | | | | | | | | |
| Dividends from net investment income | | | (0.15 | ) | | | (0.13 | ) | | | (0.11 | ) | | | (0.17 | ) | | | (0.14 | ) |
| Net asset value, end of year | | | $6.96 | | | | $7.95 | | | | $6.48 | | | | $6.65 | | | | $7.36 | |
| Total Return(b): | | | (10.81)% | | | | 25.17% | | | | (0.93)% | | | | (7.37)% | | | | 1.84% | |
| |
| Ratios/Supplemental Data: | |
| Net assets, end of year (000) | | | $171,326 | | | | $207,626 | | | | $185,120 | | | | $211,314 | | | | $218,909 | |
| Average net assets (000) | | | $200,255 | | | | $192,517 | | | | $189,980 | | | | $229,598 | | | | $232,049 | |
| Ratios to average net assets(c): | | | | | | | | | | | | | | | | | | | | |
| Expenses after waivers and/or expense reimbursement | | | 1.34% | | | | 1.58% | | | | 1.66% | | | | 1.62% | | | | 1.59% | |
| Expenses before waivers and/or expense reimbursement | | | 1.47% | | | | 1.59% | (d) | | | 1.66% | | | | 1.62% | | | | 1.59% | |
| Net investment income (loss) | | | 2.08% | | | | 1.62% | | | | 1.69% | | | | 1.39% | | | | 2.02% | |
| Portfolio turnover rate(e) | | | 114% | | | | 105% | | | | 114% | | | | 111% | | | | 134% | |
| (a) | Calculated based on average shares outstanding during the year. |
| (b) | Total return does not consider the effects of sales loads. Total return is calculated assuming a purchase of a share on the first day and a sale on the last day of each year reported and includes reinvestment of dividends and distributions, if any. Total returns may reflect adjustments to conform to generally accepted accounting principles. |
| (c) | Does not include expenses of the underlying funds in which the Series invests. |
| (d) | Effective August 1, 2017, class specific expenses include transfer agent fees and expenses and registration fees, which are charged to their respective share class. |
| (e) | The Series’ portfolio turnover rate is calculated in accordance with regulatory requirements, without regard to transactions involving short term investments and certain derivatives. If such transactions were included, the Series’ portfolio turnover rate may be higher. |
See Notes to Financial Statements.
| | | | | | | | | | | | | | | | | | | | |
| Class B Shares | |
| | | Year Ended October 31, | |
| | | 2018 | | | 2017 | | | 2016 | | | 2015 | | | 2014 | |
| Per Share Operating Performance(a): | | | | | | | | | | | | | | | | | | | | |
| Net Asset Value, Beginning of Year | | | $7.60 | | | | $6.21 | | | | $6.37 | | | | $7.05 | | | | $7.07 | |
| Income (loss) from investment operations: | | | | | | | | | | | | | | | | | | | | |
| Net investment income (loss) | | | 0.07 | | | | 0.05 | | | | 0.06 | | | | 0.05 | | | | 0.10 | |
| Net realized and unrealized gain (loss) on investment and foreign currency transactions | | | (0.96 | ) | | | 1.43 | | | | (0.16 | ) | | | (0.61 | ) | | | (0.03 | ) |
| Total from investment operations | | | (0.89 | ) | | | 1.48 | | | | (0.10 | ) | | | (0.56 | ) | | | 0.07 | |
| Less Dividends and Distributions: | | | | | | | | | | | | | | | | | | | | |
| Dividends from net investment income | | | (0.09 | ) | | | (0.09 | ) | | | (0.06 | ) | | | (0.12 | ) | | | (0.09 | ) |
| Net asset value, end of year | | | $6.62 | | | | $7.60 | | | | $6.21 | | | | $6.37 | | | | $7.05 | |
| Total Return(b): | | | (11.90)% | | | | 24.12% | | | | (1.55)% | | | | (7.96)% | | | | 1.10% | |
| |
| Ratios/Supplemental Data: | |
| Net assets, end of year (000) | | | $1,723 | | | | $3,020 | | | | $3,080 | | | | $4,774 | | | | $5,006 | |
| Average net assets (000) | | | $2,556 | | | | $2,833 | | | | $3,710 | | | | $5,313 | | | | $5,868 | |
| Ratios to average net assets(c): | | | | | | | | | | | | | | | | | | | | |
| Expenses after waivers and/or expense reimbursement | | | 2.53% | | | | 2.39% | | | | 2.36% | | | | 2.32% | | | | 2.29% | |
| Expenses before waivers and/or expense reimbursement | | | 3.21% | | | | 2.72% | (d) | | | 2.36% | | | | 2.32% | | | | 2.29% | |
| Net investment income (loss) | | | 0.88% | | | | 0.75% | | | | 0.96% | | | | 0.68% | | | | 1.35% | |
| Portfolio turnover rate(e) | | | 114% | | | | 105% | | | | 114% | | | | 111% | | | | 134% | |
| (a) | Calculated based on average shares outstanding during the year. |
| (b) | Total return does not consider the effects of sales loads. Total return is calculated assuming a purchase of a share on the first day and a sale on the last day of each year reported and includes reinvestment of dividends and distributions, if any. Total returns may reflect adjustments to conform to generally accepted accounting principles. |
| (c) | Does not include expenses of the underlying funds in which the Series invests. |
| (d) | Effective August 1, 2017, class specific expenses include transfer agent fees and expenses and registration fees, which are charged to their respective share class. |
| (e) | The Series’ portfolio turnover rate is calculated in accordance with regulatory requirements, without regard to transactions involving short term investments and certain derivatives. If such transactions were included, the Series’ portfolio turnover rate may be higher. |
See Notes to Financial Statements.
| | | | |
| PGIM QMA International Equity Fund | | | 53 | |
Financial Highlights (continued)
| | | | | | | | | | | | | | | | | | | | |
| Class C Shares | |
| | | Year Ended October 31, | |
| | | 2018 | | | 2017 | | | 2016 | | | 2015 | | | 2014 | |
| Per Share Operating Performance(a): | | | | | | | | | | | | | | | | | | | | |
| Net Asset Value, Beginning of Year | | | $7.60 | | | | $6.20 | | | | $6.37 | | | | $7.05 | | | | $7.07 | |
| Income (loss) from investment operations: | | | | | | | | | | | | | | | | | | | | |
| Net investment income (loss) | | | 0.10 | | | | 0.06 | | | | 0.06 | | | | 0.06 | | | | 0.10 | |
| Net realized and unrealized gain (loss) on investment and foreign currency transactions | | | (0.97 | ) | | | 1.43 | | | | (0.17 | ) | | | (0.62 | ) | | | (0.03 | ) |
| Total from investment operations | | | (0.87 | ) | | | 1.49 | | | | (0.11 | ) | | | (0.56 | ) | | | 0.07 | |
| Less Dividends and Distributions: | | | | | | | | | | | | | | | | | | | | |
| Dividends from net investment income | | | (0.09 | ) | | | (0.09 | ) | | | (0.06 | ) | | | (0.12 | ) | | | (0.09 | ) |
| Net asset value, end of year | | | $6.64 | | | | $7.60 | | | | $6.20 | | | | $6.37 | | | | $7.05 | |
| Total Return(b): | | | (11.52)% | | | | 24.33% | | | | (1.71)% | | | | (7.96)% | | | | 1.10% | |
| |
| Ratios/Supplemental Data: | |
| Net assets, end of year (000) | | | $12,530 | | | | $16,661 | | | | $15,892 | | | | $18,209 | | | | $18,146 | |
| Average net assets (000) | | | $15,626 | | | | $15,736 | | | | $16,416 | | | | $20,086 | | | | $19,402 | |
| Ratios to average net assets(c): | | | | | | | | | | | | | | | | | | | | |
| Expenses after waivers and/or expense reimbursement | | | 2.10% | | | | 2.32% | | | | 2.36% | | | | 2.32% | | | | 2.29% | |
| Expenses before waivers and/or expense reimbursement | | | 2.23% | | | | 2.33% | (d) | | | 2.36% | | | | 2.32% | | | | 2.29% | |
| Net investment income (loss) | | | 1.32% | | | | 0.86% | | | | 0.98% | | | | 0.71% | | | | 1.32% | |
| Portfolio turnover rate(e) | | | 114% | | | | 105% | | | | 114% | | | | 111% | | | | 134% | |
| (a) | Calculated based on average shares outstanding during the year. |
| (b) | Total return does not consider the effects of sales loads. Total return is calculated assuming a purchase of a share on the first day and a sale on the last day of each year reported and includes reinvestment of dividends and distributions, if any. Total returns may reflect adjustments to conform to generally accepted accounting principles. |
| (c) | Does not include expenses of the underlying funds in which the Series invests. |
| (d) | Effective August 1, 2017, class specific expenses include transfer agent fees and expenses and registration fees, which are charged to their respective share class. |
| (e) | The Series’ portfolio turnover rate is calculated in accordance with regulatory requirements, without regard to transactions involving short term investments and certain derivatives. If such transactions were included, the Series’ portfolio turnover rate may be higher. |
See Notes to Financial Statements.
| | | | | | | | | | | | | | | | | | | | |
| Class Z Shares | |
| | | Year Ended October 31, | |
| | | 2018 | | | 2017 | | | 2016 | | | 2015 | | | 2014 | |
| Per Share Operating Performance(a): | | | | | | | | | | | | | | | | | | | | |
| Net Asset Value, Beginning of Year | | | $8.02 | | | | $6.54 | | | | $6.70 | | | | $7.42 | | | | $7.43 | |
| Income (loss) from investment operations: | | | | | | | | | | | | | | | | | | | | |
| Net investment income (loss) | | | 0.19 | | | | 0.11 | | | | 0.13 | | | | 0.13 | | | | 0.16 | |
| Net realized and unrealized gain (loss) on investment and foreign currency transactions | | | (1.02 | ) | | | 1.52 | | | | (0.16 | ) | | | (0.66 | ) | | | (0.01 | ) |
| Total from investment operations | | | (0.83 | ) | | | 1.63 | | | | (0.03 | ) | | | (0.53 | ) | | | 0.15 | |
| Less Dividends and Distributions: | | | | | | | | | | | | | | | | | | | | |
| Dividends from net investment income | | | (0.17 | ) | | | (0.15 | ) | | | (0.13 | ) | | | (0.19 | ) | | | (0.16 | ) |
| Net asset value, end of year | | | $7.02 | | | | $8.02 | | | | $6.54 | | | | $6.70 | | | | $7.42 | |
| Total Return(b): | | | (10.59)% | | | | 25.46% | | | | (0.44)% | | | | (7.15)% | | | | 2.12% | |
| |
| Ratios/Supplemental Data: | |
| Net assets, end of year (000) | | | $13,901 | | | | $17,344 | | | | $49,675 | | | | $54,726 | | | | $48,064 | |
| Average net assets (000) | | | $17,055 | | | | $21,567 | | | | $50,923 | | | | $55,405 | | | | $53,881 | |
| Ratios to average net assets(c): | | | | | | | | | | | | | | | | | | | | |
| Expenses after waivers and/or expense reimbursement | | | 1.00% | | | | 1.31% | | | | 1.36% | | | | 1.32% | | | | 1.29% | |
| Expenses before waivers and/or expense reimbursement | | | 1.13% | | | | 1.32% | (d) | | | 1.36% | | | | 1.32% | | | | 1.29% | |
| Net investment income (loss) | | | 2.44% | | | | 1.57% | | | | 1.99% | | | | 1.69% | | | | 2.07% | |
| Portfolio turnover rate(e) | | | 114% | | | | 105% | | | | 114% | | | | 111% | | | | 134% | |
| (a) | Calculated based on average shares outstanding during the year. |
| (b) | Total return is calculated assuming a purchase of a share on the first day and a sale on the last day of each year reported and includes reinvestment of dividends and distributions, if any. Total returns may reflect adjustments to conform to generally accepted accounting principles. |
| (c) | Does not include expenses of the underlying funds in which the Series invests. |
| (d) | Effective August 1, 2017, class specific expenses include transfer agent fees and expenses and registration fees, which are charged to their respective share class. |
| (e) | The Series’ portfolio turnover rate is calculated in accordance with regulatory requirements, without regard to transactions involving short term investments and certain derivatives. If such transactions were included, the Series’ portfolio turnover rate may be higher. |
See Notes to Financial Statements.
| | | | |
| PGIM QMA International Equity Fund | | | 55 | |
Financial Highlights (continued)
| | | | | | | | | | | | |
| Class R6 Shares | | | | | | | | | |
| | | Year Ended
October 31,
2018 | | | | | | December 28,
2016(a)
through
October 31,
2017 | |
| Per Share Operating Performance(b): | | | | | | | | | | | | |
| Net Asset Value, Beginning of Period | | | $8.04 | | | | | | | | $6.32 | |
| Income (loss) from investment operations: | | | | | | | | | | | | |
| Net investment income (loss) | | | 0.21 | | | | | | | | 0.15 | |
| Net realized and unrealized gain (loss) on investment and foreign currency transactions | | | (1.03 | ) | | | | | | | 1.57 | |
| Total from investment operations | | | (0.82 | ) | | | | | | | 1.72 | |
| Less Dividends and Distributions: | | | | | | | | | | | | |
| Dividends from net investment income | | | (0.19 | ) | | | | | | | — | |
| Net asset value, end of period | | | $7.03 | | | | | | | | $8.04 | |
| Total Return(c): | | | (10.43)% | | | | | | | | 27.22% | |
| |
| Ratios/Supplemental Data: | | | | | | | | | | | | |
| Net assets, end of period (000) | | | $36,552 | | | | | | | | $39,379 | |
| Average net assets (000) | | | $38,947 | | | | | | | | $37,891 | |
| Ratios to average net assets(d): | | | | | | | | | | | | |
| Expenses after waivers and/or expense reimbursement | | | 0.78% | | | | | | | | 0.95% | (e) |
| Expenses before waivers and/or expense reimbursement | | | 0.95% | | | | | | | | 0.99% | (f)(e) |
| Net investment income (loss) | | | 2.61% | | | | | | | | 2.45% | (e) |
| Portfolio turnover rate(g) | | | 114% | | | | | | | | 105% | |
| (a) | Commencement of offering. |
| (b) | Calculated based on average shares outstanding during the period. |
| (c) | Total return is calculated assuming a purchase of a share on the first day and a sale on the last day of each period reported and includes reinvestment of dividends and distributions, if any. Total returns may reflect adjustments to conform to generally accepted accounting principles. Total returns for periods less than one full year are not annualized. |
| (d) | Does not include expenses of the underlying funds in which the Series invests. |
| (f) | Effective August 1, 2017, class specific expenses include transfer agent fees and expenses and registration fees, which are charged to their respective share class. |
| (g) | The Series’ portfolio turnover rate is calculated in accordance with regulatory requirements, without regard to transactions involving short term investments and certain derivatives. If such transactions were included, the Series’ portfolio turnover rate may be higher. |
See Notes to Financial Statements.
Report of Independent Registered Public Accounting Firm
The Board of Directors and Shareholders
Prudential World Fund, Inc.:
Opinion on the Financial Statements
We have audited the accompanying statement of assets and liabilities of PGIM QMA International Equity Fund (formerly Prudential QMA International Equity Fund) (the “Fund”), a series of Prudential World Fund, Inc., including the schedule of investments, as of October 31, 2018, the related statement of operations for the year then ended, the statements of changes in net assets for each of the years in the two-year period then ended, and the related notes (collectively, the financial statements) and the financial highlights for the years or periods indicated therein. In our opinion, the financial statements and financial highlights present fairly, in all material respects, the financial position of the Fund as of October 31, 2018, the results of its operations for the year then ended, the changes in its net assets for each of the years in the two-year period then ended, and the financial highlights for the years or periods indicated therein, in conformity with U.S. generally accepted accounting principles.
Basis for Opinion
These financial statements and financial highlights are the responsibility of the Fund’s management. Our responsibility is to express an opinion on these financial statements and financial highlights based on our audits. We are a public accounting firm registered with the Public Company Accounting Oversight Board (United States) (“PCAOB”) and are required to be independent with respect to the Fund in accordance with the U.S. federal securities laws and the applicable rules and regulations of the Securities and Exchange Commission and the PCAOB.
We conducted our audits in accordance with the standards of the PCAOB. Those standards require that we plan and perform the audit to obtain reasonable assurance about whether the financial statements and financial highlights are free of material misstatement, whether due to error or fraud. Our audits included performing procedures to assess the risks of material misstatement of the financial statements and financial highlights, whether due to error or fraud, and performing procedures that respond to those risks. Such procedures included examining, on a test basis, evidence regarding the amounts and disclosures in the financial statements and financial highlights. Such procedures also included confirmation of securities owned as of October 31, 2018, by correspondence with the custodians, transfer agents and brokers or by other appropriate auditing procedures when replies from brokers were not received. Our audits also included evaluating the accounting principles used and significant estimates made by management, as well as evaluating the overall presentation of the financial statements and financial highlights. We believe that our audits provide a reasonable basis for our opinion.

We have served as the auditor of one or more PGIM and/or Prudential Retail investment companies since 2003.
New York, New York
December 17, 2018
| | | | |
| PGIM QMA International Equity Fund | | | 57 | |
Federal Income Tax Information (unaudited)
For the year ended October 31, 2018, the Series reports, the maximum amount allowable under Section 854 of the Internal Revenue Code, but not less than, the following percentage of the ordinary income dividends paid as qualified dividend income (QDI):
| | | | |
| | | QDI | |
PGIM QMA International Equity Fund | | | 85.69 | % |
For the year ended October 31, 2018, the Series made an election to pass through the maximum amount of the portion of the ordinary income dividends paid derived from foreign source income as well as any foreign taxes paid by the Series in accordance with Section 853 of the Internal Revenue Code of the following amounts: $929,768 foreign tax credit from recognized foreign source income of $10,747,314.
In January 2019, you will be advised on IRS Form 1099-DIV or substitute 1099-DIV as to the federal tax status of dividends received by you in calendar year 2018.
INFORMATION ABOUT BOARD MEMBERS AND OFFICERS (unaudited)
Information about Board Members and Officers of the Fund is set forth below. Board Members who are not deemed to be “interested persons” of the Fund, as defined in the 1940 Act, are referred to as “Independent Board Members.” Board Members who are deemed to be “interested persons” of the Fund are referred to as “Interested Board Members.” The Board Members are responsible for the overall supervision of the operations of the Fund and perform the various duties imposed on the directors of investment companies by the 1940 Act. The Board in turn elects the Officers, who are responsible for administering the day-to-day operations of the Fund.
| | | | | | |
| Independent Board Members | | | | |
| | | | |
Name, Address, Age Position(s) Portfolios Overseen | | Principal Occupation(s) During Past Five Years | | Other Directorships Held During Past Five Years | | Length of Board Service |
| | | | |
Ellen S. Alberding (60) Board Member Portfolios Overseen: 93 | | President and Board Member, The Joyce Foundation (charitable foundation) (since 2002); Vice Chair, City Colleges of Chicago (community college system) (2011-2015); Trustee, National Park Foundation (charitable foundation for national park system) (2009-2018); Trustee, Economic Club of Chicago (since 2009); Trustee, Loyola University (since 2018). | | None. | | Since September 2013 |
| | | | |
Kevin J. Bannon (66) Board Member Portfolios Overseen: 93 | | Retired; Managing Director (April 2008-May 2015) and Chief Investment Officer (October 2008-November 2013) of Highmount Capital LLC (registered investment adviser); formerly Executive Vice President and Chief Investment Officer (April 1993-August 2007) of Bank of New York Company; President (May 2003-May 2007) of BNY Hamilton Family of Mutual Funds. | | Director of Urstadt Biddle Properties (equity real estate investment trust) (since September 2008). | | Since July 2008 |
| | | | |
Linda W. Bynoe (66) Board Member Portfolios Overseen: 93 | | President and Chief Executive Officer (since March 1995) and formerly Chief Operating Officer (December 1989-February 1995) of Telemat Ltd. (management consulting); formerly Vice President (January 1985-June 1989) at Morgan Stanley & Co. (broker-dealer). | | Director of Anixter International, Inc. (communication products distributor) (since January 2006); Director of Northern Trust Corporation (financial services) (since April 2006); Trustee of Equity Residential (residential real estate) (since December 2009). | | Since March 2005 |
PGIM QMA International Equity Fund
| | | | | | |
Independent Board Members | | | | |
| | | | |
Name, Address, Age Position(s) Portfolios Overseen | | Principal Occupation(s) During Past Five Years | | Other Directorships Held During Past Five Years | | Length of Board Service |
| | | | |
Barry H. Evans (58) Board Member Portfolios Overseen: 92 | | Retired; formerly President (2005 – 2016), Global Chief Operating Officer (2014– 2016), Chief Investment Officer – Global Head of Fixed Income (1998-2014), and various portfolio manager roles (1986-2006), Manulife Asset Management U.S. | | Director, Manulife Trust Company (since 2011); formerly Director, Manulife Asset Management Limited (2015-2017); formerly Chairman of the Board of Directors of Manulife Asset Management U.S. (2005-2016); formerly Chairman of the Board, Declaration Investment Management and Research (2008-2016). | | Since September 2017 |
| | | | |
Keith F. Hartstein (62) Board Member & Independent Chair Portfolios Overseen: 93 | | Retired; Member (since November 2014) of the Governing Council of the Independent Directors Council (organization of independent mutual fund directors); formerly President and Chief Executive Officer (2005-2012), Senior Vice President (2004-2005), Senior Vice President of Sales and Marketing (1997-2004), and various executive management positions (1990-1997), John Hancock Funds, LLC (asset management); Chairman, Investment Company Institute’s Sales Force Marketing Committee (2003-2008). | | None. | | Since September 2013 |
Visit our website at pgiminvestments.com
| | | | | | |
| Independent Board Members | | | | |
| | | | |
Name, Address, Age Position(s) Portfolios Overseen | | Principal Occupation(s) During Past Five Years | | Other Directorships Held During Past Five Years | | Length of Board Service |
| | | | |
Laurie Simon Hodrick (56) Board Member Portfolios Overseen: 92 | | A. Barton Hepburn Professor Emerita of Economics in the Faculty of Business, Columbia Business School (since 2018); Visiting Professor of Law, Stanford Law School (since 2015); Visiting Fellow at the Hoover Institution, Stanford University (since 2015); Sole Member, ReidCourt LLC (since 2008) (a consulting firm); formerly A. Barton Hepburn Professor of Economics in the Faculty of Business, Columbia Business School (1996-2017); formerly Managing Director, Global Head of Alternative Investment Strategies, Deutsche Bank (2006-2008). | | Independent Director, Corporate Capital Trust (since April 2017) (a business development company); Independent Director, Kabbage, Inc. (since July 2018) (financial services). | | Since September 2017 |
| | | | |
Michael S. Hyland, CFA (73) Board Member Portfolios Overseen: 93 | | Retired (since February 2005); formerly Senior Managing Director (July 2001-February 2005) of Bear Stearns & Co, Inc.; Global Partner, INVESCO (1999-2001); Managing Director and President of Salomon Brothers Asset Management (1989-1999). | | None. | | Since July 2008 |
| | | | |
Richard A. Redeker (75) Board Member Portfolios Overseen: 93 | | Retired Mutual Fund Senior Executive (50 years); Management Consultant; Director, Mutual Fund Directors Forum (since 2014); Independent Directors Council (organization of independent mutual fund directors)-Executive Committee, Chair of Policy Steering Committee, Governing Council. | | None. | | Since October 1993 |
PGIM QMA International Equity Fund
| | | | | | |
| Independent Board Members | | | | |
| | | | |
Name, Address, Age Position(s) Portfolios Overseen | | Principal Occupation(s) During Past Five Years | | Other Directorships Held During Past Five Years | | Length of Board Service |
| | | | |
Brian K. Reid (56)# Board Member Portfolios Overseen: 92 | | Retired; formerly Chief Economist for the Investment Company Institute (ICI) (2005-2017); formerly Senior Economist and Director of Industry and Financial Analysis at the ICI (1998-2004); formerly Senior Economist, Industry and Financial Analysis at the ICI (1996-1998); formerly Staff Economist at the Federal Reserve Board (1989-1996); Director, ICI Mutual Insurance Company (2012-2017). | | None. | | Since March 2018 |
| # | Mr. Reid joined the Board effective as of March 1, 2018. |
| | | | | | |
| Interested Board Members | | | | |
| | | | |
Name, Address, Age Position(s) Portfolios Overseen | | Principal Occupation(s) During Past Five Years | | Other Directorships Held During Past Five Years | | Length of
Board Service |
| | | | |
Stuart S. Parker (56) Board Member & President Portfolios Overseen: 93 | | President of PGIM Investments LLC (formerly known as Prudential Investments LLC) (since January 2012); Executive Vice President of Prudential Investment Management Services LLC (since December 2012); formerly Executive Vice President of Jennison Associates LLC and Head of Retail Distribution of PGIM Investments LLC (June 2005-December 2011). | | None. | | Since January 2012 |
Visit our website at pgiminvestments.com
| | | | | | |
| Interested Board Members | | | | |
| | | | |
Name, Address, Age Position(s) Portfolios Overseen | | Principal Occupation(s) During Past Five Years | | Other Directorships Held During Past Five Years | | Length of Board Service |
| | | | |
Scott E. Benjamin (45) Board Member & Vice President Portfolios Overseen:93 | | Executive Vice President (since June 2009) of PGIM Investments LLC; Executive Vice President (June 2009-June 2012) and Vice President (since June 2012) of Prudential Investment Management Services LLC; Executive Vice President (since September 2009) of AST Investment Services, Inc.; Senior Vice President of Product Development and Marketing, PGIM Investments (since February 2006); formerly Vice President of Product Development and Product Management, PGIM Investments LLC (2003-2006). | | None. | | Since March 2010 |
| | | | |
Grace C. Torres* (59) Board Member Portfolios Overseen: 92 | | Retired; formerly Treasurer and Principal Financial and Accounting Officer of the PGIM Funds, Target Funds, Advanced Series Trust, Prudential Variable Contract Accounts and The Prudential Series Fund (1998-June 2014); Assistant Treasurer (March 1999-June 2014) and Senior Vice President (September 1999-June 2014) of PGIM Investments LLC; Assistant Treasurer (May 2003-June 2014) and Vice President (June 2005-June 2014) of AST Investment Services, Inc.; Senior Vice President and Assistant Treasurer (May 2003-June 2014) of Prudential Annuities Advisory Services, Inc. | | Formerly Director (July 2015-January 2018) of Sun Bancorp, Inc. N.A. and Sun National Bank; Director (since January 2018) of OceanFirst Financial Corp. and OceanFirst Bank. | | Since November 2014 |
* Note: Prior to her retirement in 2014, Ms. Torres was employed by PGIM Investments LLC. Due to her prior employment, she is considered to be an “interested person” under the 1940 Act. Ms. Torres is a Non-Management Interested Board Member.
PGIM QMA International Equity Fund
| | | | |
| Fund Officers(a) | | | | |
| | | |
Name, Address and Age Position with Fund | | Principal Occupation(s) During Past Five Years | | Length of Service as Fund Officer |
| | | |
Raymond A. O’Hara (63) Chief Legal Officer | | Vice President and Corporate Counsel (since July 2010) of Prudential Insurance Company of America (Prudential); Vice President (March 2011-Present) of Pruco Life Insurance Company and Pruco Life Insurance Company of New Jersey; Vice President and Corporate Counsel (March 2011-Present) of Prudential Annuities Life Assurance Corporation; Chief Legal Officer of PGIM Investments LLC (since June 2012); Chief Legal Officer of Prudential Mutual Fund Services LLC (since June 2012) and Corporate Counsel of AST Investment Services, Inc. (since June 2012); formerly Assistant Vice President and Corporate Counsel (September 2008-July 2010) of The Hartford Financial Services Group, Inc.; formerly Associate (September 1980-December 1987) and Partner (January 1988–August 2008) of Blazzard & Hasenauer, P.C. (formerly, Blazzard, Grodd & Hasenauer, P.C.). | | Since June 2012 |
| | | |
Chad A. Earnst (43) Chief Compliance Officer | | Chief Compliance Officer (September 2014-Present) of PGIM Investments LLC; Chief Compliance Officer (September 2014-Present) of the PGIM Funds, Target Funds, Advanced Series Trust, The Prudential Series Fund, Prudential’s Gibraltar Fund, Inc., PGIM Global Short Duration High Yield Income Fund, Inc., PGIM Short Duration High Yield Fund, Inc. and PGIM Jennison MLP Income Fund, Inc.; formerly Assistant Director (March 2010-August 2014) of the Asset Management Unit, Division of Enforcement, US Securities & Exchange Commission; Assistant Regional Director (January 2010-August 2014), Branch Chief (June 2006–December 2009) and Senior Counsel (April 2003-May 2006) of the Miami Regional Office, Division of Enforcement, US Securities & Exchange Commission. | | Since September 2014 |
| | | |
Dino Capasso (44) Deputy Chief Compliance Officer | | Vice President and Deputy Chief Compliance Officer (June 2017-Present) of PGIM Investments LLC; formerly, Senior Vice President and Senior Counsel (January 2016-June 2017), and Vice President and Counsel (February 2012-December 2015) of Pacific Investment Management Company LLC. | | Since March 2018 |
| | | |
Andrew R. French (56) Secretary | | Vice President and Corporate Counsel (since February 2010) of Prudential; formerly Director and Corporate Counsel (2006-2010) of Prudential; Vice President and Assistant Secretary (since January 2007) of PGIM Investments LLC; Vice President and Assistant Secretary (since January 2007) of Prudential Mutual Fund Services LLC. | | Since October 2006 |
Visit our website at pgiminvestments.com
| | | | |
| Fund Officers(a) | | | | |
| | | |
Name, Address and Age Position with Fund | | Principal Occupation(s) During Past Five Years | | Length of Service as Fund Officer |
| | | |
Jonathan D. Shain (60) Assistant Secretary | | Vice President and Corporate Counsel (since August 1998) of Prudential; Vice President and Assistant Secretary (since May 2001) of PGIM Investments LLC; Vice President and Assistant Secretary (since February 2001) of Prudential Mutual Fund Services LLC; formerly Vice President and Assistant Secretary (May 2003-June 2005) of AST Investment Services, Inc. | | Since May 2005 |
| | | |
Claudia DiGiacomo (44) Assistant Secretary | | Vice President and Corporate Counsel (since January 2005) of Prudential; Vice President and Assistant Secretary of PGIM Investments LLC (since December 2005); formerly Associate at Sidley Austin Brown & Wood LLP (1999-2004). | | Since December 2005 |
| | | |
Charles H. Smith (45) Anti-Money Laundering Compliance Officer | | Vice President, Corporate Compliance, Anti-Money Laundering Unit (since January 2015) of Prudential; committee member of the American Council of Life Insurers Anti-Money Laundering and Critical Infrastructure Committee (since January 2016); formerly Global Head of Economic Sanctions Compliance at AIG Property Casualty (February 2007 – December 2014); Assistant Attorney General at the New York State Attorney General’s Office, Division of Public Advocacy. (August 1998 —January 2007). | | Since January 2017 |
| | | |
Brian D. Nee (52) Treasurer and Principal Financial and Accounting Officer | | Vice President and Head of Finance of PGIM Investments LLC (since August 2015) and PGIM Global Partners (since February 2017); formerly, Vice President, Treasurer’s Department of Prudential (September 2007-August 2015). | | Since July 2018 |
| | | |
Peter Parrella (60) Assistant Treasurer | | Vice President (since 2007) and Director (2004-2007) within Prudential Mutual Fund Administration; formerly Tax Manager at SSB Citi Fund Management LLC (1997-2004). | | Since June 2007 |
| | | |
Lana Lomuti (51) Assistant Treasurer | | Vice President (since 2007) and Director (2005-2007), within Prudential Mutual Fund Administration; formerly Assistant Treasurer (December 2007-February 2014) of The Greater China Fund, Inc. | | Since April 2014 |
| | | |
Linda McMullin (57) Assistant Treasurer | | Vice President (since 2011) and Director (2008-2011) within Prudential Mutual Fund Administration. | | Since April 2014 |
| | | |
Kelly A. Coyne (50) Assistant Treasurer | | Director, Investment Operations of Prudential Mutual Fund Services LLC (since 2010). | | Since March 2015 |
(a) Excludes Mr. Parker and Mr. Benjamin, interested Board Members who also serve as President and Vice President, respectively.
Explanatory Notes to Tables:
| ∎ | | Board Members are deemed to be “Interested,” as defined in the 1940 Act, by reason of their affiliation with PGIM Investments LLC and/or an affiliate of PGIM Investments LLC. |
| ∎ | | Unless otherwise noted, the address of all Board Members and Officers is c/o PGIM Investments LLC, 655 Broad Street, Newark, New Jersey 07102-4410. |
| ∎ | | There is no set term of office for Board Members or Officers. The Board Members have adopted a retirement policy, which calls for the retirement of Board Members on December 31 of the year in which they reach the age of 75. |
PGIM QMA International Equity Fund
| ∎ | | “Other Directorships Held” includes only directorships of companies required to register or file reports with the SEC under the 1934 Act (that is, “public companies”) or other investment companies registered under the 1940 Act. |
| ∎ | | “Portfolios Overseen” includes all investment companies managed by PGIM Investments LLC. The investment companies for which PGIM Investments LLC serves as manager include the PGIM Funds, The Prudential Variable Contract Accounts, PGIM ETF Trust, PGIM Short Duration High Yield Fund, Inc., PGIM Global Short Duration High Yield Fund, Inc., The Prudential Series Fund, Prudential’s Gibraltar Fund, Inc. and the Advanced Series Trust. |
Visit our website at pgiminvestments.com
Approval of Advisory Agreements (unaudited)
The Fund’s Board of Directors
The Board of Directors (the “Board”) of PGIM QMA International Equity Fund (the “Fund”)1 consists of twelve individuals, nine of whom are not “interested persons” of the Fund, as defined in the Investment Company Act of 1940, as amended (the “1940 Act”) (the “Independent Directors”). The Board is responsible for the oversight of the Fund and its operations, and performs the various duties imposed on the directors of investment companies by the 1940 Act. The Independent Directors have retained independent legal counsel to assist them in connection with their duties. The Chair of the Board is an Independent Director. The Board has established four standing committees: the Audit Committee, the Nominating and Governance Committee, and two Investment Committees. Each committee is chaired by, and composed of, Independent Directors.
Annual Approval of the Fund’s Advisory Agreements
As required under the 1940 Act, the Board determines annually whether to renew the Fund’s management agreement with PGIM Investments LLC (“PGIM Investments”) and the Fund’s subadvisory agreement with Quantitative Management Associates LLC (“QMA”). In considering the renewal of the agreements, the Board, including all of the Independent Directors, met on June 7, 2018 and on June 19-21, 2018 and approved the renewal of the agreements through July 31, 2019, after concluding that the renewal of the agreements was in the best interests of the Fund and its shareholders.
In advance of the meetings, the Board requested and received materials relating to the agreements, and had the opportunity to ask questions and request further information in connection with its consideration. Among other things, the Board considered comparative fee information from PGIM Investments and QMA. Also, the Board considered comparisons with other mutual funds in relevant Peer Universes and Peer Groups, as is further discussed below.
In approving the agreements, the Board, including the Independent Directors advised by independent legal counsel, considered the factors it deemed relevant, including the nature, quality and extent of services provided by PGIM Investments and the subadviser, the performance of the Fund, the profitability of PGIM Investments and its affiliates, expenses and fees, and the potential for economies of scale that may be shared with the Fund and its shareholders as the Fund’s assets grow. In their deliberations, the Directors did not identify any single factor which alone was responsible for the Board’s decision to approve the agreements with respect to the Fund. In connection with its deliberations, the Board considered information provided by PGIM Investments throughout the year at regular Board meetings, presentations from portfolio managers and other information, as well as
| 1 | PGIM QMA International Equity Fund is a series of Prudential World Fund, Inc. |
| | |
| PGIM QMA International Equity Fund |
Approval of Advisory Agreements (continued)
information furnished at or in advance of the meetings on June 7, 2018 and on June 19-21, 2018.
The Directors determined that the overall arrangements between the Fund and PGIM Investments, which serves as the Fund’s investment manager pursuant to a management agreement, and between PGIM Investments and QMA, which serves as the Fund’s subadviser pursuant to the terms of a subadvisory agreement with PGIM Investments, are in the best interests of the Fund and its shareholders in light of the services performed, fees charged and such other matters as the Directors considered relevant in the exercise of their business judgment.
The material factors and conclusions that formed the basis for the Directors’ reaching their determinations to approve the continuance of the agreements are separately discussed below.
Nature, Quality and Extent of Services
The Board received and considered information regarding the nature, quality and extent of services provided to the Fund by PGIM Investments and QMA. The Board considered the services provided by PGIM Investments, including but not limited to the oversight of the subadviser for the Fund, as well as the provision of fund recordkeeping, compliance, and other services to the Fund. With respect to PGIM Investments’ oversight of the subadviser, the Board noted that PGIM Investments’ Strategic Investment Research Group (“SIRG”), which is a business unit of PGIM Investments, is responsible for monitoring and reporting to PGIM Investments’ senior management on the performance and operations of the subadviser. The Board also considered that PGIM Investments pays the salaries of all of the officers and interested Directors of the Fund who are part of Fund management. The Board also considered the investment subadvisory services provided by QMA, including investment research and security selection, as well as adherence to the Fund’s investment restrictions and compliance with applicable Fund policies and procedures. The Board considered PGIM Investments’ evaluation of the subadviser, as well as PGIM Investments’ recommendation, based on its review of the subadviser, to renew the subadvisory agreement.
The Board considered the qualifications, backgrounds and responsibilities of PGIM Investments’ senior management responsible for the oversight of the Fund and QMA, and also considered the qualifications, backgrounds and responsibilities of QMA’s portfolio managers who are responsible for the day-to-day management of the Fund’s portfolio. The Board was provided with information pertaining to PGIM Investments’ and QMA’s organizational structure, senior management, investment operations, and other relevant information pertaining to both PGIM Investments and QMA. The Board also noted that it received favorable compliance reports from the Fund’s Chief Compliance Officer (“CCO”)
| | |
| Visit our website at pgiminvestments.com | | |
as to both PGIM Investments and QMA. The Board noted that QMA is affiliated with PGIM Investments.
The Board concluded that it was satisfied with the nature, extent and quality of the investment management services provided by PGIM Investments and the subadvisory services provided to the Fund by QMA, and that there was a reasonable basis on which to conclude that the Fund benefits from the services provided by PGIM Investments and QMA under the management and subadvisory agreements.
Costs of Services and Profits Realized by PGIM Investments
The Board was provided with information on the profitability of PGIM Investments and its affiliates in serving as the Fund’s investment manager. The Board discussed with PGIM Investments the methodology utilized in assembling the information regarding profitability and considered its reasonableness. The Board recognized that it is difficult to make comparisons of profitability from fund management contracts because comparative information is not generally publicly available and is affected by numerous factors, including the structure of the particular adviser, the types of funds it manages, its business mix, numerous assumptions regarding allocations and the adviser’s capital structure and cost of capital. Taking these factors into account, the Board concluded that the profitability of PGIM Investments and its affiliates in relation to the services rendered was not unreasonable.
Economies of Scale
The Board received and discussed information concerning economies of scale that PGIM Investments may realize as the Fund’s assets grow beyond current levels. The Board noted that the management fee schedule for the Fund includes breakpoints. During the course of time, the Board has considered information regarding the launch date of the Fund, the management fees of the Fund compared to those of similarly managed funds and PGIM Investments’ investment in the Fund over time. The Board noted that economies of scale can be shared with the Fund in other ways, including low management fees from inception, additional technological and personnel investments to enhance shareholder services, and maintaining existing expense structures in the face of a rising cost environment. The Board also considered PGIM Investments’ assertion that it continually evaluates the management fee schedule of the Fund and the potential to share economies of scale through breakpoints or fee waivers as asset levels increase.
The Board recognized the inherent limitations of any analysis of economies of scale, stemming largely from the Board’s understanding that most of PGIM Investments’ costs are not specific to individual funds, but rather are incurred across a variety of products and services.
| | |
| PGIM QMA International Equity Fund |
Approval of Advisory Agreements (continued)
Other Benefits to PGIM Investments and QMA
The Board considered potential ancillary benefits that might be received by PGIM Investments, QMA and their affiliates as a result of their relationship with the Fund. The Board concluded that potential benefits to be derived by PGIM Investments included transfer agency fees received by the Fund’s transfer agent (which is affiliated with PGIM Investments), and benefits to its reputation as well as other intangible benefits resulting from PGIM Investments’ association with the Fund. The Board concluded that the potential benefits to be derived by QMA included its ability to use soft dollar credits, as well as the potential benefits consistent with those generally resulting from an increase in assets under management, specifically, potential access to additional research resources and benefits to its reputation. The Board concluded that the benefits derived by PGIM Investments and QMA were consistent with the types of benefits generally derived by investment managers and subadvisers to mutual funds.
Performance of the Fund / Fees and Expenses
The Board considered certain additional specific factors and made related conclusions relating to the historical performance of the Fund for the one-, three-, five- and ten-year periods ended December 31, 2017.
The Board also considered the Fund’s actual management fee, as well as the Fund’s net total expense ratio, for the fiscal year ended October 31, 2017. The Board considered the management fee for the Fund as compared to the management fee charged by PGIM Investments to other funds and the fee charged by other advisers to comparable mutual funds in a Peer Group. The actual management fee represents the fee rate actually paid by Fund shareholders and includes any fee waivers or reimbursements. The net total expense ratio for the Fund represents the actual expense ratio incurred by Fund shareholders.
The mutual funds included in the Peer Universe, which was used to consider performance, and the Peer Group, which was used to consider expenses and fees, were objectively determined by Broadridge, an independent provider of mutual fund data. In certain circumstances, PGIM Investments also may have provided supplemental Peer Universe or Peer Group information for reasons addressed with the Board. The comparisons placed the Fund in various quartiles, with the first quartile being the best 25% of the mutual funds (for performance, the best performing mutual funds and, for expenses, the lowest cost mutual funds).
The section below summarizes key factors considered by the Board and the Board’s conclusions regarding the Fund’s performance, fees and overall expenses. The table sets forth gross performance comparisons (which do not reflect the impact on performance of
| | |
| Visit our website at pgiminvestments.com | | |
fund expenses, or any subsidies, expense caps or waivers that may be applicable) with the Peer Universe, actual management fees with the Peer Group (which reflect the impact of any subsidies or fee waivers), and net total expenses with the Peer Group, each of which were key factors considered by the Board.
| | | | | | | | |
Gross
Performance | | 1 Year | | 3 Years | | 5 Years | | 10 Years |
| | 1st Quartile | | 2nd Quartile | | 2nd Quartile | | 3rd Quartile |
| Actual Management Fees: 3rd Quartile |
| Net Total Expenses: 4th Quartile |
| | • | | The Board noted that the Fund outperformed its benchmark index over all periods. |
| | • | | The Board and PGIM Investments agreed to retain the Fund’s existing contractual expense cap, which (exclusive of certain fees and expenses), caps annual fund operating expenses at 2.53% for Class B shares, and 0.78% for Class R6 shares through February 29, 2020. |
| | • | | The Board concluded that, in light of the above, it would be in the best interests of the Fund and its shareholders to renew the agreements. |
| | • | | The Board concluded that the management fees (including subadvisory fees) and total expenses were reasonable in light of the services provided. |
* * *
After full consideration of these factors, the Board concluded that approval of the agreements was in the best interests of the Fund and its shareholders.
| | |
| PGIM QMA International Equity Fund |
| | | | |
| ∎ MAIL | | ∎ TELEPHONE | | ∎ WEBSITE |
655 Broad Street Newark, NJ 07102 | | (800) 225-1852 | | www.pgiminvestments.com |
|
| PROXY VOTING |
| The Board of Directors of the Fund has delegated to the Fund’s subadviser the responsibility for voting any proxies and maintaining proxy recordkeeping with respect to the Fund. A description of these proxy voting policies and procedures is available without charge, upon request, by calling (800) 225-1852. Information regarding how the Fund voted proxies relating to portfolio securities during the most recent 12-month period ended June 30 is available on the Fund’s website and on the Securities and Exchange Commission’s website. |
|
| DIRECTORS |
| Ellen S. Alberding • Kevin J. Bannon • Scott E. Benjamin • Linda W. Bynoe • Barry H. Evans • Keith F. Hartstein • Laurie Simon Hodrick • Michael S. Hyland • Stuart S. Parker • Richard A. Redeker • Brian K. Reid • Grace C. Torres |
|
| OFFICERS |
| Stuart S. Parker, President • Scott E. Benjamin, Vice President • Brian D. Nee, Treasurer and Principal Financial and Accounting Officer • Raymond A. O’Hara, Chief Legal Officer • Andrew R. French, Secretary • Chad A. Earnst, Chief Compliance Officer • Dino Capasso, Vice President and Deputy Chief Compliance Officer • Charles H. Smith, Anti-Money Laundering Compliance Officer • Jonathan D. Shain, Assistant Secretary • Claudia DiGiacomo, Assistant Secretary • Peter Parrella, Assistant Treasurer • Lana Lomuti, Assistant Treasurer • Linda McMullin, Assistant Treasurer • Kelly A. Coyne, Assistant Treasurer |
| | | | |
| MANAGER | | PGIM Investments LLC | | 655 Broad Street
Newark, NJ 07102 |
|
| SUBADVISER | | Quantitative Management Associates LLC | | Gateway Center Two
100 Mulberry Street
Newark, NJ 07102 |
|
| DISTRIBUTOR | | Prudential Investment
Management Services LLC | | 655 Broad Street
Newark, NJ 07102 |
|
| CUSTODIAN | | The Bank of New York Mellon | | 225 Liberty Street
New York, NY 10286 |
|
| TRANSFER AGENT | | Prudential Mutual Fund
Services LLC | | PO Box 9658
Providence, RI 02940 |
|
| INDEPENDENT REGISTERED PUBLIC ACCOUNTING FIRM | | KPMG LLP | | 345 Park Avenue New York, NY 10154 |
|
| FUND COUNSEL | | Willkie Farr & Gallagher LLP | | 787 Seventh Avenue
New York, NY 10019 |
|
|
| An investor should consider the investment objectives, risks, charges, and expenses of the Fund carefully before investing. The prospectus and summary prospectus contain this and other information about the Fund. An investor may obtain a prospectus and summary prospectus by visiting our website at www.pgiminvestments.com or by calling (800) 225-1852. The prospectus and summary prospectus should be read carefully before investing. |
|
| E-DELIVERY |
| To receive your mutual fund documents online, go to www.pgiminvestments.com/edelivery and enroll. Instead of receiving printed documents by mail, you will receive notification via email when new materials are available. You can cancel your enrollment or change your email address at any time by visiting the website address above. |
|
| SHAREHOLDER COMMUNICATIONS WITH DIRECTORS |
| Shareholders can communicate directly with the Board of Directors by writing to the Chair of the Board, PGIM QMA International Equity Fund, PGIM Investments, Attn: Board of Directors, 655 Broad Street, Newark, NJ 07102. Shareholders can communicate directly with an individual Director by writing to the same address. Communications are not screened before being delivered to the addressee. |
|
| AVAILABILITY OF PORTFOLIO SCHEDULE |
| The Fund files its complete schedule of portfolio holdings with the Securities and Exchange Commission for the first and third quarters of each fiscal year on Form N-Q. The Fund’s Forms N-Q are available on the Commission’s website at www.sec.gov. The Fund’s schedule of portfolio holdings is also available on the Fund’s website as of the end of each month no sooner than 15 days after the end of the month. |
|
| The Fund’s Statement of Additional Information contains additional information about the Fund’s Directors and is available without charge, upon request, by calling (800) 225-1852. |
Mutual Funds:
| | | | |
ARE NOT INSURED BY THE FDIC OR ANY
FEDERAL GOVERNMENT AGENCY | | MAY LOSE VALUE | | ARE NOT A DEPOSIT OF OR GUARANTEED
BY ANY BANK OR ANY BANK AFFILIATE |
PGIM QMA INTERNATIONAL EQUITY FUND
| | | | | | | | | | |
| SHARE CLASS | | A | | B | | C | | Z | | R6* |
| NASDAQ | | PJRAX | | PJRBX | | PJRCX | | PJIZX | | PJRQX |
| CUSIP | | 743969859 | | 743969867 | | 743969875 | | 743969883 | | 743969578 |
*Formerly known as Class Q shares.
MF190E

PGIM EMERGING MARKETS DEBT
LOCAL CURRENCY FUND
(Formerly known as Prudential Emerging Markets Debt Local Currency Fund)
ANNUAL REPORT
OCTOBER 31, 2018
COMING SOON: PAPERLESS SHAREHOLDER REPORTS
Beginning on January 1, 2021, as permitted by regulations adopted by the Securities and Exchange Commission, paper copies of the Fund’s annual and semi-annual shareholder reports will no longer be sent by mail, unless you specifically request paper copies of the reports. Instead, the reports will be made available on the Fund’s website (www.pgiminvestments.com), and you will be notified by mail each time a report is posted and provided with a website link to access the report.
If you already elected to receive shareholder reports electronically, you will not be affected by this change and you need not take any action. You may elect to receive shareholder reports and other communications from the Fund electronically anytime by contacting your financial intermediary (such as a broker-dealer or bank) or, if you are a direct investor, by calling 1-800-225-1852 or by sending an e-mail request to PGIM Investments at shareholderreports@pgim.com.
Beginning on January 1, 2019, you may elect to receive all future reports in paper free of charge. If you invest through a financial intermediary, you can contact your financial intermediary or follow instructions included with this notice to elect to continue to receive paper copies of your shareholder reports. If you invest directly with the Fund, you can call 1-800-225-1852 or send an email request to shareholderreports@pgim.com to let the Fund know you wish to continue receiving paper copies of your shareholder reports. Your election to receive reports in paper will apply to all funds held in your account if you invest through your financial intermediary or all funds held with the fund complex if you invest directly with the Fund.

To enroll in e-delivery, go to pgiminvestments.com/edelivery
|
Objective: Total return, through a combination of current income and
capital appreciation |
Highlights (unaudited)
| • | | Long-duration positioning in Brazil added value, as did short-duration positioning in Turkey. Yield-curve positioning and security selection within Mexico added to performance over the reporting period. |
| • | | Within foreign currencies, underweights to the Chilean peso, Philippine peso, Israeli new shekel, and Swiss franc were all strong contributors. |
| • | | Overall yield-curve positioning and security selection were the largest detractors from performance over the period, highlighted by positioning in Russia and Brazil. Long-duration positions in Mexico also detracted from returns. |
| • | | Overweights to the Indian rupee and Brazilan real, coupled with an underweight to the South African rand, were negative over the period. |
| • | | An allocation to off-benchmark hard currency emerging markets hurt performance. |
This report is not authorized for distribution to prospective investors unless preceded or accompanied by a current prospectus.
The views expressed in this report and information about the Fund’s portfolio holdings are for the period covered by this report and are subject to change thereafter.
Mutual funds are distributed by Prudential Investment Management Services LLC (PIMS), member SIPC. PGIM Fixed Income is a unit of PGIM, Inc. (PGIM), a registered investment adviser. PIMS and PGIM are Prudential Financial companies. © 2018 Prudential Financial, Inc. and its related entities. PGIM and the PGIM logo are service marks of Prudential Financial, Inc. and its related entities, registered in many jurisdictions worldwide.
| | |
| 2 | | Visit our website at pgiminvestments.com |
PGIM FUNDS — UPDATE
The Board of Directors/Trustees for the Fund has approved the implementation of an automatic conversion feature for Class C shares, effective as of April 1, 2019. To reflect these changes, effective April 1, 2019, the section of the Fund’s Prospectus entitled “How to Buy, Sell and Exchange Fund Shares—How to Exchange Your Shares—Frequent Purchases and Redemptions of Fund Shares” is restated to read as follows:
This supplement should be read in conjunction with your Summary Prospectus, Statutory Prospectus and Statement of Additional Information, be retained for future reference and is in addition to any existing Fund supplements.
| | 1. | In each Fund’s Statutory Prospectus, the following is added at the end of the section entitled “Fund Distributions And Tax Issues—If You Sell or Exchange Your Shares”: |
Automatic Conversion of Class C Shares
The conversion of Class C shares into Class A shares—which happens automatically approximately 10 years after purchase—is not a taxable event for federal income tax purposes. For more information about the automatic conversion of Class C shares, see Class C Shares Automatically Convert to Class A Shares in How to Buy, Sell and Exchange Fund Shares.
| | 2. | In each Fund’s Statutory Prospectus, the following sentence is added at the end of the section entitled “How to Buy, Sell and Exchange Shares—Closure of Certain Share Classes to New Group Retirement Plans”: |
Shareholders owning Class C shares may continue to hold their Class C shares until the shares automatically convert to Class A shares under the conversion schedule, or until the shareholder redeems their Class C shares.
| | 3. | In each Fund’s Statutory Prospectus, the following disclosure is added immediately following the section entitled “How to Buy, Sell and Exchange Shares—How to Buy Shares—Class B Shares Automatically Convert to Class A Shares”: |
Class C Shares Automatically Convert to Class A Shares
Starting on or about April 1, 2019 (the “Effective Date”), Class C shares will be eligible for automatic conversion into Class A shares on a monthly basis approximately ten years after the original date of purchase (the “Conversion Date”). Conversion will take place based on the relative NAV of the two classes, without the imposition of any sales load, fee or other charge. All such automatic conversions of Class C shares will constitute tax-free exchanges for federal income tax purposes.
For shareholders investing in Class C shares through retirement plans or omnibus accounts, and in certain other instances, the Fund and its agents may not have
| | | | |
| PGIM Emerging Markets Debt Local Currency Fund | | | 3 | |
transparency into how long a shareholder has held Class C shares for purposes of determining whether such Class C shares are eligible for automatic conversion into Class A shares, and the relevant financial intermediary may not have the ability to track purchases in order to credit individual shareholders’ holding periods. In these circumstances, the Fund will not be able to automatically convert Class C shares into Class A shares as described above. In order to determine eligibility for conversion in these circumstances, it is the responsibility of the financial intermediary to notify the Fund that the shareholder is eligible for the conversion of Class C shares to Class A shares, and the financial intermediary may be required to maintain and provide the Fund with records that substantiate the holding period of Class C shares. It is the financial intermediary’s (and not the Fund’s) responsibility to keep records of transactions made in accounts it holds and to ensure that the shareholder is credited with the proper holding period based on such records or those provided to the financial intermediary by the shareholder. Please consult with your financial intermediary for the applicability of this conversion feature to your shares.
A financial intermediary may sponsor and/or control accounts, programs or platforms that impose a different conversion schedule or different eligibility requirements for the exchange of Class C shares for Class A shares (see Appendix A: Waivers and Discounts Available From Certain Financial Intermediaries of the Prospectus). Please consult with your financial intermediary if you have any questions regarding your shares’ conversion from Class C shares to Class A shares.
| | 4. | In Part II of each Fund’s Statement of Additional Information, the following disclosure is added immediately following the section entitled “Purchase, Redemption and Pricing of Fund Shares—Share Classes—Automatic Conversion of Class B Shares”: |
AUTOMATIC CONVERSION OF CLASS C SHARES. Starting on or about April 1, 2019 (the “Effective Date”), Class C shares will be eligible for automatic conversion into Class A shares on a monthly basis approximately ten years after the original date of purchase (the “Conversion Date”). Conversion will take place based on the relative NAV of the two classes, without the imposition of any sales load, fee or other charge. Class C shares of a Fund acquired through automatic reinvestment of dividends or distributions will convert to Class A shares of the Fund on the Conversion Date pro rata with the converting Class C shares of the Fund that were not acquired through reinvestment of dividends or distributions. All such automatic conversions of Class C shares will constitute tax-free exchanges for federal income tax purposes.
For shareholders investing in Class C shares through retirement plans or omnibus accounts, and in certain other instances, the Fund and its agents may not have transparency into how long a shareholder has held Class C shares for purposes of determining whether such Class C shares are eligible for automatic conversion into Class A shares, and the relevant financial intermediary may not have the ability to track purchases in order to credit individual shareholders’ holding periods. In these circumstances, the
| | |
| 4 | | Visit our website at pgiminvestments.com |
Fund will not be able to automatically convert Class C shares into Class A shares as described above. In order to determine eligibility for conversion in these circumstances, it is the responsibility of the financial intermediary to notify the Fund that the shareholder is eligible for the conversion of Class C shares to Class A shares, and the financial intermediary may be required to maintain and provide the Fund with records that substantiate the holding period of Class C shares. It is the financial intermediary’s (and not the Fund’s) responsibility to keep records of transactions made in accounts it holds and to ensure that the shareholder is credited with the proper holding period based on such records or those provided to the financial intermediary by the shareholder. Please consult with your financial intermediary for the applicability of this conversion feature to your shares.
Class C shares were generally closed to investments by new group retirement plans effective June 1, 2018. Group retirement plans (and their successor, related and affiliated plans) that have Class C shares of the Fund available to participants on or before the Effective Date may continue to open accounts for new participants in such share class and purchase additional shares in existing participant accounts.
The Fund has no responsibility for monitoring or implementing a financial intermediary’s process for determining whether a shareholder meets the required holding period for conversion. A financial intermediary may sponsor and/or control accounts, programs or platforms that impose a different conversion schedule or different eligibility requirements for the exchange of Class C shares for Class A shares, as set forth on Appendix A: Waivers and Discounts Available From Certain Financial Intermediaries of the Prospectus. In these cases, Class C shareholders may have their shares exchanged for Class A shares under the policies of the financial intermediary. Financial intermediaries will be responsible for making such exchanges in those circumstances. Please consult with your financial intermediary if you have any questions regarding your shares’ conversion from Class C shares to Class A shares.
LR1094
- Not part of the Annual Report -
| | | | |
| PGIM Emerging Markets Debt Local Currency Fund | | | 5 | |
Table of Contents
| | |
| 6 | | Visit our website at pgiminvestments.com |
Letter from the President

Dear Shareholder:
We hope you find the annual report for PGIM Emerging Markets Debt Local Currency Fund informative and useful. The report covers performance for the 12-month period that ended October 31, 2018.
We have important information to share with you. Effective June 11, 2018, Prudential Mutual Funds were renamed PGIM Funds. This renaming is part of our ongoing effort to further build our reputation and establish our global brand, which
began when our firm adopted PGIM Investments as its name in April 2017. Please note that only the Fund’s name has changed. Your Fund’s management and operation, along with its symbols, remained the same.*
During the reporting period, the global economy continued to grow, and central banks gradually tightened monetary policy. In the US, the economy expanded and employment increased. In September, the Federal Reserve hiked interest rates for the eighth time since 2015, based on confidence in the economy.
Equity returns on the whole were strong, due to optimistic earnings expectations and investor sentiment. Global equities, including emerging markets, generally posted positive returns. However, they trailed the performance of US equities, which rose on higher corporate profits, new regulatory policies, and tax reform benefits. Volatility spiked briefly early in the period on inflation concerns, rising interest rates, and a potential global trade war, and again late in the period on worries that profit growth might slow in 2019.
The overall bond market declined modestly during the period, as measured by the Bloomberg Barclays US Aggregate Bond Index. The best performance came from higher-yielding, economically sensitive sectors, such as high yield bonds and bank loans, which posted small gains. US investment-grade corporate bonds and US Treasury bonds both finished the period with negative returns. A major trend during the period was the flattening of the US Treasury yield curve, which increased the yield on fixed income investments with shorter maturities and made them more attractive to investors.
Regarding your investments with PGIM, we believe it is important to maintain a diversified portfolio of funds consistent with your tolerance for risk, time horizon, and financial goals. Your financial advisor can help you create a diversified investment plan that may include funds covering all the basic asset classes and that reflects your personal investor profile and risk tolerance. However, diversification and asset allocation strategies do not assure a profit or protect against loss in declining markets.
At PGIM Investments, we consider it a great privilege and responsibility to help investors participate in opportunities across global markets while meeting their toughest investment challenges. PGIM is a top-10 global investment manager with more than $1 trillion in assets under management. This investment expertise allows us to deliver actively managed funds and strategies to meet the needs of investors around the globe.
Thank you for choosing our family of funds.
Sincerely,

Stuart S. Parker, President
PGIM Emerging Markets Debt Local Currency Fund
December 14, 2018
*The Prudential Day One Funds did not change their names.
| | | | |
| PGIM Emerging Markets Debt Local Currency Fund | | | 7 | |
Your Fund’s Performance (unaudited)
Performance data quoted represents past performance. Past performance does not guarantee future results. The investment return and principal value of an investment will fluctuate, so that an investor’s shares, when redeemed, may be worth more or less than their original cost. Current performance may be lower or higher than the past performance data quoted. An investor may obtain performance data as of the most recent month-end by visiting our website at www.pgiminvestments.com or by calling (800) 225-1852.
| | | | | | |
| | | Average Annual Total Returns as of 10/31/18
(with sales charges) |
| | | One Year (%) | | Five Years (%) | | Since Inception (%) |
| Class A | | –12.79 | | –3.92 | | –2.38 (3/30/11) |
| Class C | | –10.47 | | –3.76 | | –2.42 (3/30/11) |
| Class Z | | –8.83 | | –2.78 | | –1.50 (3/30/11) |
| Class R6* | | –8.63 | | –2.68 | | –1.44 (3/30/11) |
| JP Morgan Government Bond Index-Emerging Markets Global Diversified Index |
| | –6.58 | | –2.59 | | –0.97 |
| Lipper Emerging Markets Local Currency Debt Funds Average | | | | |
| | | –7.21 | | –2.26 | | –1.34 |
| | | | | | |
| | | Average Annual Total Returns as of 10/31/18
(without sales charges) |
| | | One Year (%) | | Five Years (%) | | Since Inception (%) |
| Class A | | –8.68 | | –3.03 | | –1.79 (3/30/11) |
| Class C | | –9.61 | | –3.76 | | –2.42 (3/30/11) |
| Class Z | | –8.83 | | –2.78 | | –1.50 (3/30/11) |
| Class R6* | | –8.63 | | –2.68 | | –1.44 (3/30/11) |
| JP Morgan Government Bond Index-Emerging Markets Global Diversified Index |
| | –6.58 | | –2.59 | | –0.97 |
| Lipper Emerging Markets Local Currency Debt Funds Average | | | | |
| | | –7.21 | | –2.26 | | –1.34 |
| | |
| 8 | | Visit our website at pgiminvestments.com |
Growth of a $10,000 Investment (unaudited)
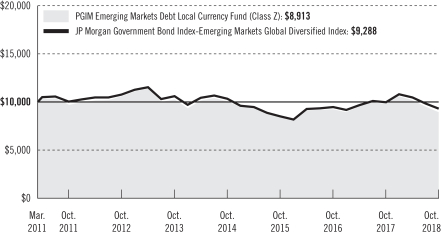
The graph compares a $10,000 investment in the Fund’s Class Z shares with a similar investment in the JP Morgan Government Bond Index-Emerging Markets Global Diversified Index by portraying the initial account values at the commencement of operations for Class Z shares (March 30, 2011) and the account values at the end of the current fiscal year (October 31, 2018), as measured on a quarterly basis. For purposes of the graph, and unless otherwise indicated, it has been assumed that (a) all recurring fees (including management fees) were deducted; and (b) all dividends and distributions were reinvested. The line graph provides information for Class Z shares only. As indicated in the tables provided earlier, performance for other share classes will vary due to the differing charges and expenses applicable to each share class (as indicated in the following paragraphs). Without waiver of fees and/or expense reimbursements, if any, the Fund’s returns would have been lower.
Past performance does not predict future performance. Total returns and the ending account values in the graph include changes in share price and reinvestment of dividends and capital gains distributions in a hypothetical investment for the periods shown. The Fund’s total returns do not reflect the deduction of income taxes on an individual’s investment. Taxes may reduce your actual investment returns on income or gains paid by the Fund or any gains you may realize if you sell your shares.
Source: PGIM Investments LLC, Lipper, Inc. and JP Morgan
*Formerly known as Class Q shares.
Since Inception returns are provided since the Fund has less than 10 fiscal years of returns. Since Inception returns for the Index and the Lipper Average are measured from the closest month-end to the Fund’s inception date.
| | | | |
| PGIM Emerging Markets Debt Local Currency Fund | | | 9 | |
Your Fund’s Performance (continued)
The returns in the tables do not reflect the deduction of taxes that a shareholder would pay on Fund distributions or following the redemption of Fund shares. The average annual total returns take into account applicable sales charges, which are described for each share class in the table below.
| | | | | | | | |
| | | Class A | | Class C | | Class Z | | Class R6* |
| Maximum initial sales charge | | 4.50% of the public offering price | | None | | None | | None |
| Contingent deferred sales charge (CDSC) (as a percentage of the lower of original purchase price or net asset value at redemption) | | 1.00% on sales of $1 million or more made within 12 months of purchase | | 1.00% on sales made within 12 months of purchase | | None | | None |
| Annual distribution and service (12b-1) fees (shown as a percentage of average daily net assets) | | 0.25% | | 1.00% | | None | | None |
*Formerly known as Class Q shares.
Benchmark Definitions
JP Morgan Government Bond Index-Emerging Markets Global Diversified Index—The JP Morgan Government Bond Index-Emerging Markets Global Diversified Index, an unmanaged index, is a comprehensive emerging markets debt benchmark that tracks local currency bonds issued by emerging market governments.
Lipper Emerging Markets Local Currency Debt Funds Average—The Lipper Emerging Markets Local Currency Debt Funds Average (Lipper Average) is based on the average return of all funds in the Lipper Emerging Markets Local Currency Debt Funds universe for the periods noted. Funds in the Lipper Average seek either current income or total return by investing at least 65% of total assets in debt issues denominated in the currency of their market of issuance. “Emerging markets” are defined by a country’s GNP per capita or other economic measures.
Investors cannot invest directly in an index or average. The returns for the Index would be lower if they included the effects of sales charges, operating expenses of a mutual fund, or taxes. Returns for the Lipper Average reflect the deduction of operating expenses of a mutual fund, but not sales charges or taxes.
| | |
| 10 | | Visit our website at pgiminvestments.com |
| | | | | | |
| Distributions and Yields as of 10/31/18 |
| | Total Distributions
Paid for
12 Months ($) | | SEC 30-Day
Subsidized
Yield* (%) | | SEC 30-Day
Unsubsidized
Yield** (%) |
| Class A | | 0.35 | | 5.59 | | 4.17 |
| Class C | | 0.31 | | 5.04 | | –0.17 |
| Class Z | | 0.37 | | 6.05 | | 5.38 |
| Class R6*** | | 0.38 | | 5.87 | | 571.30 |
*SEC 30-Day Subsidized Yield (%)—A standardized yield calculation created by the Securities and Exchange Commission, it reflects the income earned during a 30-day period, after the deduction of the Fund’s net expenses (net of any expense waivers or reimbursements).
**SEC 30-Day Unsubsidized Yield (%)—A standardized yield calculation created by the Securities and Exchange Commission, it reflects the income earned during a 30-day period, after the deduction of the Fund’s gross expenses. The investor experience is represented by the SEC 30-Day Subsidized Yield.
***Formerly known as Class Q shares.
| | | | |
| Credit Quality expressed as a percentage of total investments as of 10/31/18 (%) | |
| AAA | | | 2.1 | |
| AA | | | 6.4 | |
| A | | | 32.2 | |
| BBB | | | 32.5 | |
| BB | | | 17.6 | |
| B | | | 6.1 | |
| Not Rated | | | –0.2 | |
| Cash/Cash Equivalents | | | 3.3 | |
| Total Investments | | | 100.0 | |
Source: PGIM Fixed Income
Credit ratings reflect the highest rating assigned by a nationally recognized statistical rating organization (NRSRO) such as Moody’s Investors Service, Inc. (Moody’s), S&P Global Ratings (S&P), or Fitch, Inc. (Fitch). Credit ratings reflect the common nomenclature used by both S&P and Fitch. Where applicable, ratings are converted to the comparable S&P/Fitch rating tier nomenclature. These rating agencies are independent and are widely used. The Not Rated category consists of securities that have not been rated by a NRSRO. Credit ratings are subject to change. Values may not sum to 100.0% due to rounding.
| | | | |
| PGIM Emerging Markets Debt Local Currency Fund | | | 11 | |
Strategy and Performance Overview (unaudited)
How did the Fund perform?
The PGIM Emerging Markets Debt Local Currency Fund’s Class Z shares returned -8.83% in the 12-month reporting period that ended October 31, 2018, underperforming the -6.58% return of the JP Morgan GBI-EM Global Diversified Index (the Index) and the -7.21% return of the Lipper Emerging Markets Local Currency Debt Funds Average.
What were market conditions?
| • | | In 2017, emerging market (EM) economies benefited from the global economy’s improving momentum, generating numerous opportunities across local-rate emerging markets. On the back of improving fundamentals, such as narrower current account deficits, falling inflation, and growing central bank reserves, PGIM Fixed Income expected EM growth (excluding China) to accelerate in 2018 and outpace growth in the developed world. Although macro risks remained on the horizon (e.g., the ongoing removal of developed-market monetary stimulus, led by the Federal Reserve’s contracting balance sheet and prospects for three or four rate hikes in 2018), some of these concerns were remnants of the volatility surrounding 2013’s taper tantrum. Many idiosyncratic credit stories in emerging markets also dominated headlines, including Venezuela, Argentina, Brazil, Mexico, Ukraine, and Russia, among others. |
| • | | Local-rate emerging markets started 2018 with a very strong January on the back of stable yields and appreciating currencies. This was followed by a soggier February and March as inflation fears, trade war rhetoric, spikes in volatility, and rising US interest rates drove investors to the sidelines. Despite giving up much of the gains achieved in January, local-rate emerging markets continued to outperform their hard currency counterparts, producing positive total returns for the quarter, led by South Africa, Mexico, and Columbia. The South African markets were bolstered by the selection of reform-minded Cyril Ramaphosa to head the African National Congress and then his ascension to South African president in February 2018, while Mexican assets rallied from oversold levels as investors became more comfortable with the outlook for North American Free Trade Agreement (NAFTA) negotiations and the country’s presidential elections in July 2018. |
| • | | Pressure increased on the emerging market asset class in the second quarter of 2018 on the back of rising US Treasury rates, a stronger US dollar, mounting trade concerns, and coalescing idiosyncratic events. Emerging market foreign exchange (EMFX) also began a sharp sell-off in mid-April 2018 in response to capital outflows and weakening growth in Europe and Asia, thus weakening EMFX crosses at the margin. The stronger US dollar stoked fears that countries and/or companies with excessive external borrowing in dollars could be forced to refinance at less-favorable exchange rates and/or higher interest rates. Bonds from countries with large fiscal and external deficits, most notably Argentina and Turkey, were particularly sensitive to these developments. The recent EM instability seems to have been aggravated by idiosyncratic stories in Argentina, Turkey, Brazil, and Mexico, as opposed to broad-based weakness across the asset class. And while these idiosyncratic stories continued to loom over EM for the very short term, global growth |
| | |
| 12 | | Visit our website at pgiminvestments.com |
| | remained on solid ground, shining a more positive light on potential second-half opportunities created by the recent stretch of underperformance. PGIM Fixed Income also notes that, in the context of country-specific concerns (in large part tied to political dynamics, particularly in Turkey, Mexico, and Brazil), policymakers have responded to the feedback from financial markets and have acted accordingly. For example, Argentina’s central bank recently implemented a series of rate hikes—1,275 basis points (bps)—and policy moves in conjunction with finalizing a $50 billion loan program with the International Monetary Fund and other multilateral lenders (an additional $5.65 billion) (one bps equals 0.01%). During the market turmoil of May and June, Turkey also raised its benchmark interest rate several times. India, Indonesia, and Mexico also raised rates. In Brazil, the central bank decided to increase the use of foreign exchange (FX) swaps, and the Treasury opted to buy back nominal local bonds in order to provide support and stability to the market. |
| • | | After a tough second quarter in 2018, the emerging markets debt sector rebounded with hard-currency sovereign debt leading the way. There was significant monthly variability throughout the quarter—particularly in Argentina, Turkey, and Ecuador—amid concerns about vulnerability to tighter global financial conditions and idiosyncratic, issuer-specific factors. Macro developments in the third quarter of 2018 included periods of dollar resilience and escalating trade war rhetoric. The expectations of strong US growth relative to other developed and emerging markets posed a headwind for EMFX and similarly limited performance in hedged local bonds. In hedged local bonds, Turkey and Argentina posted double-digit losses year-to-date and had to hike rates significantly given severe currency weakness and elevated inflation. Argentina raised rates more than 3,275 bps and Turkey by 625 bps. Policy credibility remained an issue in both countries. Given some of the headwinds from EMFX, other central banks have also raised interest rates, including Indonesia, the Philippines, and Russia. More central banks could follow suit, but given that inflation—with a few exceptions—is contained, the hikes should be modest. In EMFX, the third quarter of 2018 started against a backdrop of US growth outperformance on the back of fiscal stimulus and lower growth forecasts for the eurozone and several EM countries, notably in Latin America. Trade policy uncertainty was also high throughout the quarter. These factors, along with the market pricing in a more aggressive Fed-hiking path relative to the rest of G-10 central banks, facilitated U.S. dollar strengthening over the past two quarters. |
| • | | In October, emerging market local bonds were modestly negative in total return, with idiosyncratic stories dominating. The top performers were Argentina, Brazil, and Turkey. Argentina rallied from the International Monetary Fund’s approval of expedited funding; Brazil rallied from the presidential victory of market-favorite Jair Bolsonaro; and Turkey rallied from easing tensions with the US following the release of a captive US pastor. The bottom performer, Mexico, struggled with US border control issues and incoming President Andrés Manuel López Obrador’s cancellation of a partially finished international airport. |
| | | | |
| PGIM Emerging Markets Debt Local Currency Fund | | | 13 | |
Strategy and Performance Overview (continued)
What worked?
| • | | Long-duration positioning in Brazil added value, as did short-duration positioning in Turkey. |
| • | | Yield-curve positioning and security selection within Mexico added to performance over the reporting period. |
| • | | Within foreign currencies, underweights to the Chilean peso, Philippine peso, Israeli new shekel, and Swiss franc were all strong contributors. |
What didn’t work?
| • | | Overall yield-curve positioning and security selection were the largest detractors from performance over the period, highlighted by positioning in Russia and Brazil. |
| • | | Long-duration positions in Mexico also detracted from returns. |
| • | | Overweights to the Indian rupee and Brazilan real, coupled with an underweight to the South African rand, were negative over the period. |
| • | | An allocation to off-benchmark hard currency emerging markets hurt performance. |
Did the Fund use derivatives, and how did they affect performance?
| • | | Currency positioning in the Fund was partially facilitated by the use of currency forward and option contracts. During the reporting period, the Fund’s currency positioning detracted from relative performance. |
| • | | The Fund also used interest rate swaps to help manage duration and yield-curve exposure, which had a negligible impact on performance. |
Current outlook
| • | | As the final quarter of 2018 progresses, PGIM Fixed Income is mindful of headwinds within emerging markets, yet remains comfortable adding risk, particularly where valuations are compelling after having reduced risk earlier in the year. Notable premiums have been built into spreads in countries where significant sell-offs occurred. PGIM Fixed Income’s outlook on emerging market debt is cautiously optimistic based on valuations, a decent global growth outlook, and adjustments that have already occurred. While there are distinct vulnerabilities, the risk of a credit event in sovereign and quasi-sovereign issuers in Argentina, Turkey, and other lower-rated countries is contained over the near term. Given the uncertainty of the future extent of Fed tightening, PGIM Fixed Income is more cautious of its longer-dated positioning, choosing to be positioned only in higher-rated sovereigns and quasi-sovereigns in the long end. The divergence in performance of local bond markets in recent months may present opportunities as the end of the year approaches. In local bond positioning, the Fund features overweights in Brazil, Mexico, and Singapore, while holding underweight positions in Chile and Thailand. Looking at FX positioning, the Fund features long positions in the Peruvian nuevo sol, Thai baht, and Indian rupee, and is short in the Hungarian forint, South African rand, and Polish zloty. |
| | |
| 14 | | Visit our website at pgiminvestments.com |
Fees and Expenses (unaudited)
As a shareholder of the Fund, you incur two types of costs: (1) transaction costs, including sales charges (loads) on purchase payments and redemptions, as applicable, and (2) ongoing costs, including management fees, distribution, and/or service (12b-1) fees, and other Fund expenses, as applicable. This example is intended to help you understand your ongoing costs (in dollars) of investing in the Fund and to compare these costs with the ongoing costs of investing in other mutual funds.
The example is based on an investment of $1,000 held through the six-month period ended October 31, 2018. The example is for illustrative purposes only; you should consult the Prospectus for information on initial and subsequent minimum investment requirements.
Actual Expenses
The first line for each share class in the table on the following page provides information about actual account values and actual expenses. You may use the information on this line, together with the amount you invested, to estimate the expenses that you paid over the period. Simply divide your account value by $1,000 (for example, an $8,600 account value ÷ $1,000 = 8.6), then multiply the result by the number on the first line under the heading “Expenses Paid During the Six-Month Period” to estimate the expenses you paid on your account during this period.
Hypothetical Example for Comparison Purposes
The second line for each share class in the table on the following page provides information about hypothetical account values and hypothetical expenses based on the Fund’s actual expense ratio and an assumed rate of return of 5% per year before expenses, which is not the Fund’s actual return. The hypothetical account values and expenses may not be used to estimate the actual ending account balance or expenses you paid for the period. You may use this information to compare the ongoing costs of investing in the Fund and other funds. To do so, compare this 5% hypothetical example with the 5% hypothetical examples that appear in the shareholder reports of the other funds.
The Fund’s transfer agent may charge additional fees to holders of certain accounts that are not included in the expenses shown in the table on the following page. These fees apply to individual retirement accounts (IRAs) and Section 403(b) accounts. As of the close of the six-month period covered by the table, IRA fees included an annual maintenance fee of $15 per account (subject to a maximum annual maintenance fee of $25 for all accounts held by the same shareholder). Section 403(b) accounts are charged an annual $25 fiduciary maintenance fee. Some of the fees may vary in amount, or may be waived, based on your total account balance or the number of PGIM funds, including the Fund, that you own. You should consider the additional fees that were charged to your Fund account over the six-month period when you estimate the total ongoing expenses paid over the period
| | | | |
| PGIM Emerging Markets Debt Local Currency Fund | | | 15 | |
Fees and Expenses (continued)
and the impact of these fees on your ending account value, as these additional expenses are not reflected in the information provided in the expense table. Additional fees have the effect of reducing investment returns.
Please note that the expenses shown in the table are meant to highlight your ongoing costs only and do not reflect any transactional costs such as sales charges (loads). Therefore, the second line for each share class in the table is useful in comparing ongoing costs only and will not help you determine the relative total costs of owning different funds. In addition, if these transactional costs were included, your costs would have been higher.
| | | | | | | | | | | | | | | | | | |
PGIM
Emerging Markets Debt
Local Currency Fund | | Beginning Account
Value
May 1, 2018 | | | Ending Account
Value
October 31, 2018 | | | Annualized
Expense Ratio
Based on the
Six-Month Period | | | Expenses Paid
During the
Six-Month Period* | |
| Class A | | Actual | | $ | 1,000.00 | | | $ | 874.10 | | | | 1.13 | % | | $ | 5.34 | |
| | Hypothetical | | $ | 1,000.00 | | | $ | 1,019.51 | | | | 1.13 | % | | $ | 5.75 | |
| Class C | | Actual | | $ | 1,000.00 | | | $ | 870.10 | | | | 1.88 | % | | $ | 8.86 | |
| | Hypothetical | | $ | 1,000.00 | | | $ | 1,015.73 | | | | 1.88 | % | | $ | 9.55 | |
| Class Z | | Actual | | $ | 1,000.00 | | | $ | 874.70 | | | | 0.88 | % | | $ | 4.16 | |
| | Hypothetical | | $ | 1,000.00 | | | $ | 1,020.77 | | | | 0.88 | % | | $ | 4.48 | |
| Class R6** | | Actual | | $ | 1,000.00 | | | $ | 874.10 | | | | 0.88 | % | | $ | 4.16 | |
| | | Hypothetical | | $ | 1,000.00 | | | $ | 1,020.77 | | | | 0.88 | % | | $ | 4.48 | |
*Fund expenses (net of fee waivers or subsidies, if any) for each share class are equal to the annualized expense ratio for each share class (provided in the table), multiplied by the average account value over the period, multiplied by the 184 days in the six-month period ended October 31, 2018, and divided by the 365 days in the Fund’s fiscal year ended October 31, 2018 (to reflect the six-month period). Expenses presented in the table include the expenses of any underlying portfolios in which the Fund may invest.
**Formerly known as Class Q shares.
| | |
| 16 | | Visit our website at pgiminvestments.com |
Schedule of Investments
as of October 31, 2018
| | | | | | | | | | | | | | | | |
| Description | | Interest
Rate | | | Maturity
Date | | | Principal
Amount (000)# | | | Value | |
LONG-TERM INVESTMENTS 94.7% | |
|
SOVEREIGN BONDS 90.8% | |
|
Angola 0.4% | |
Angolan Government International Bond,
Sr. Unsec’d. Notes | | | 9.500 | % | | | 11/12/25 | | | | 200 | | | $ | 220,220 | |
|
Argentina 0.8% | |
Argentine Republic Government International Bond,
Sr. Unsec’d. Notes | | | 5.625 | | | | 01/26/22 | | | | 180 | | | | 161,550 | |
Provincia de Buenos Aires, | | | | | | | | | | | | | | | | |
Sr. Unsec’d. Notes | | | 9.125 | | | | 03/16/24 | | | | 200 | | | | 178,502 | |
Sr. Unsec’d. Notes | | | 9.950 | | | | 06/09/21 | | | | 140 | | | | 136,808 | |
| | | | | | | | | | | | | | | | |
| | | | | | | | | | | | | | | 476,860 | |
| | | | |
Bahrain 0.3% | | | | | | | | | | | | | | | | |
Bahrain Government International Bond,
Sr. Unsec’d. Notes | | | 6.125 | | | | 07/05/22 | | | | 200 | | | | 201,252 | |
| | | | |
Brazil 11.4% | | | | | | | | | | | | | | | | |
Brazil Minas SPE via State of Minas Gerais,
Gov’t. Gtd. Notes | | | 5.333 | | | | 02/15/28 | | | | 435 | | | | 421,406 | |
Brazil Notas do Tesouro Nacionalie, | | | | | | | | | | | | | | | | |
Notes, Ser. NTNF | | | 10.000 | | | | 01/01/23 | | | BRL | 9,511 | | | | 2,623,225 | |
Notes, Ser. NTNF | | | 10.000 | | | | 01/01/25 | | | BRL | 8,811 | | | | 2,405,952 | |
Notes, Ser. NTNF | | | 10.000 | | | | 01/01/27 | | | BRL | 4,465 | | | | 1,201,141 | |
Brazilian Government International Bond,
Sr. Unsec’d. Notes | | | 8.500 | | | | 01/05/24 | | | BRL | 54 | | | | 14,365 | |
| | | | | | | | | | | | | | | | |
| | | | 6,666,089 | |
| | | | |
Chile 1.5% | | | | | | | | | | | | | | | | |
Bonos De La Tesoreria De La Republica En Pesos,
Bonds | | | 4.500 | | | | 03/01/26 | | | CLP | 620,000 | | | | 889,663 | |
| | | | |
Colombia 4.5% | | | | | | | | | | | | | | | | |
Colombian TES, | | | | | | | | | | | | | | | | |
Bonds, Ser. B | | | 6.000 | | | | 04/28/28 | | | COP | 6,211,000 | | | | 1,774,960 | |
Bonds, Ser. B | | | 10.000 | | | | 07/24/24 | | | COP | 2,350,000 | | | | 849,767 | |
| | | | | | | | | | | | | | | | |
| | | | 2,624,727 | |
See Notes to Financial Statements.
| | | | |
| PGIM Emerging Markets Debt Local Currency Fund | | | 17 | |
Schedule of Investments (continued)
as of October 31, 2018
| | | | | | | | | | | | | | | | |
| Description | | Interest
Rate | | | Maturity
Date | | | Principal
Amount (000)# | | | Value | |
SOVEREIGN BONDS (Continued) | | | | | | | | | | | | | | | | |
|
Czech Republic 4.8% | |
Czech Republic Government Bond, | | | | | | | | | | | | | | | | |
Bonds, Ser. 089 | | | 2.400 | % | | | 09/17/25 | | | CZK | 21,840 | | | $ | 974,244 | |
Bonds, Ser. 095 | | | 1.000 | | | | 06/26/26 | | | CZK | 8,540 | | | | 343,806 | |
Bonds, Ser. 097 | | | 0.450 | | | | 10/25/23 | | | CZK | 32,680 | | | | 1,332,095 | |
Bonds, Ser. 104 | | | 0.750 | | | | 02/23/21 | | | CZK | 3,840 | | | | 163,967 | |
| | | | | | | | | | | | | | | | |
| | | | 2,814,112 | |
| | | | |
Ecuador 0.5% | | | | | | | | | | | | | | | | |
Ecuador Government International Bond,
Sr. Unsec’d. Notes | | | 10.750 | | | | 03/28/22 | | | | 260 | | | | 267,800 | |
| | | | |
Egypt 0.4% | | | | | | | | | | | | | | | | |
Egypt Government International Bond,
Sr. Unsec’d. Notes, MTN | | | 6.125 | | | | 01/31/22 | | | | 215 | | | | 212,231 | |
| | | | |
El Salvador 0.2% | | | | | | | | | | | | | | | | |
El Salvador Government International Bond,
Sr. Unsec’d. Notes | | | 7.750 | | | | 01/24/23 | | | | 125 | | | | 125,861 | |
| | | | |
Gabon 0.3% | | | | | | | | | | | | | | | | |
Gabon Government International Bond,
Bonds | | | 6.375 | | | | 12/12/24 | | | | 200 | | | | 181,708 | |
| | | | |
Greece 0.3% | | | | | | | | | | | | | | | | |
Hellenic Republic Government Bond,
Bonds | | | 3.500 | | | | 01/30/23 | | | EUR | 165 | | | | 188,288 | |
| | | | |
Hungary 4.8% | | | | | | | | | | | | | | | | |
Hungary Government Bond, | | | | | | | | | | | | | | | | |
Bonds, Ser. 21/B | | | 2.500 | | | | 10/27/21 | | | HUF | 52,800 | | | | 188,453 | |
Bonds, Ser. 22/A | | | 7.000 | | | | 06/24/22 | | | HUF | 126,770 | | | | 517,103 | |
Bonds, Ser. 25/B | | | 5.500 | | | | 06/24/25 | | | HUF | 431,680 | | | | 1,717,303 | |
Bonds, Ser. 27/A | | | 3.000 | | | | 10/27/27 | | | HUF | 81,000 | | | | 270,353 | |
Bonds, Ser. 31/A | | | 3.250 | | | | 10/22/31 | | | HUF | 48,200 | | | | 153,921 | |
| | | | | | | | | | | | | | | | |
| | | | 2,847,133 | |
| | | | |
Indonesia 9.7% | | | | | | | | | | | | | | | | |
Indonesia Treasury Bond,
Sr. Unsec’d. Notes, Ser. 53 | | | 8.250 | | | | 07/15/21 | | | IDR | 7,820,000 | | | | 516,376 | |
See Notes to Financial Statements.
| | | | | | | | | | | | | | | | |
| Description | | Interest
Rate | | | Maturity
Date | | | Principal
Amount (000)# | | | Value | |
SOVEREIGN BONDS (Continued) | | | | | | | | | | | | | | | | |
|
Indonesia (cont’d.) | |
Indonesia Treasury Bond, (cont’d.) | |
Sr. Unsec’d. Notes, Ser. 56 | | | 8.375 | % | | | 09/15/26 | | | IDR | 14,591,000 | | | $ | 945,617 | |
Sr. Unsec’d. Notes, Ser. 59 | | | 7.000 | | | | 05/15/27 | | | IDR | 7,765,000 | | | | 460,205 | |
Sr. Unsec’d. Notes, Ser. 61 | | | 7.000 | | | | 05/15/22 | | | IDR | 3,000,000 | | | | 189,980 | |
Sr. Unsec’d. Notes, Ser. 63 | | | 5.625 | | | | 05/15/23 | | | IDR | 2,250,000 | | | | 132,758 | |
Sr. Unsec’d. Notes, Ser. 64 | | | 6.125 | | | | 05/15/28 | | | IDR | 6,455,000 | | | | 356,665 | |
Sr. Unsec’d. Notes, Ser. 65 | | | 6.625 | | | | 05/15/33 | | | IDR | 8,100,000 | | | | 439,033 | |
Sr. Unsec’d. Notes, Ser. 68 | | | 8.375 | | | | 03/15/34 | | | IDR | 13,300,000 | | | | 834,613 | |
Sr. Unsec’d. Notes, Ser. 70 | | | 8.375 | | | | 03/15/24 | | | IDR | 7,910,000 | | | | 515,106 | |
Sr. Unsec’d. Notes, Ser. 71 | | | 9.000 | | | | 03/15/29 | | | IDR | 7,310,000 | | | | 490,577 | |
Sr. Unsec’d. Notes, Ser. 72 | | | 8.250 | | | | 05/15/36 | | | IDR | 10,260,000 | | | | 631,696 | |
Sr. Unsec’d. Notes, Ser. 73 | | | 8.750 | | | | 05/15/31 | | | IDR | 2,705,000 | | | | 176,933 | |
| | | | | | | | | | | | | | | | |
| | | | 5,689,559 | |
| | | | |
Iraq 0.5% | | | | | | | | | | | | | | | | |
Iraq International Bond,
Sr. Unsec’d. Notes | | | 6.752 | | | | 03/09/23 | | | | 280 | | | | 272,569 | |
| | | | |
Ivory Coast 0.4% | | | | | | | | | | | | | | | | |
Ivory Coast Government International Bond,
Sr. Unsec’d. Notes | | | 5.375 | | | | 07/23/24 | | | | 250 | | | | 233,650 | |
| | | | |
Kenya 0.3% | | | | | | | | | | | | | | | | |
Kenya Government International Bond,
Sr. Unsec’d. Notes | | | 6.875 | | | | 06/24/24 | | | | 200 | | | | 194,582 | |
| | | | |
Malaysia 6.8% | | | | | | | | | | | | | | | | |
Malaysia Government Bond, | | | | | | | | | | | | | | | | |
Sr. Unsec’d. Notes, Ser. 0111 | | | 4.160 | | | | 07/15/21 | | | MYR | 130 | | | | 31,462 | |
Sr. Unsec’d. Notes, Ser. 0116 | | | 3.800 | | | | 08/17/23 | | | MYR | 2,000 | | | | 476,162 | |
Sr. Unsec’d. Notes, Ser. 0118 | | | 3.882 | | | | 03/14/25 | | | MYR | 1,060 | | | | 251,218 | |
Sr. Unsec’d. Notes, Ser. 0217 | | | 4.059 | | | | 09/30/24 | | | MYR | 335 | | | | 80,198 | |
Sr. Unsec’d. Notes, Ser. 0311 | | | 4.392 | | | | 04/15/26 | | | MYR | 285 | | | | 68,936 | |
Sr. Unsec’d. Notes, Ser. 0313 | | | 3.480 | | | | 03/15/23 | | | MYR | 1,100 | | | | 259,037 | |
Sr. Unsec’d. Notes, Ser. 0314 | | | 4.048 | | | | 09/30/21 | | | MYR | 1,375 | | | | 332,051 | |
Sr. Unsec’d. Notes, Ser. 0315 | | | 3.659 | | | | 10/15/20 | | | MYR | 520 | | | | 124,595 | |
Sr. Unsec’d. Notes, Ser. 0316 | | | 3.900 | | | | 11/30/26 | | | MYR | 3,070 | | | | 722,383 | |
Sr. Unsec’d. Notes, Ser. 0411 | | | 4.232 | | | | 06/30/31 | | | MYR | 1,770 | | | | 411,756 | |
Sr. Unsec’d. Notes, Ser. 0413 | | | 3.844 | | | | 04/15/33 | | | MYR | 140 | | | | 30,768 | |
Sr. Unsec’d. Notes, Ser. 0417 | | | 3.899 | | | | 11/16/27 | | | MYR | 130 | | | | 30,347 | |
See Notes to Financial Statements.
| | | | |
| PGIM Emerging Markets Debt Local Currency Fund | | | 19 | |
Schedule of Investments (continued)
as of October 31, 2018
| | | | | | | | | | | | | | | | |
| Description | | Interest
Rate | | | Maturity
Date | | | Principal
Amount (000)# | | | Value | |
SOVEREIGN BONDS (Continued) | | | | | | | | | | | | | | | | |
| | | | |
Malaysia (cont’d.) | | | | | | | | | | | | | | | | |
Malaysia Government Bond, (cont’d.) | | | | | | | | | | | | | | | | |
Sr. Unsec’d. Notes, Ser. 0515 | | | 3.759 | % | | | 03/15/19 | | | MYR | 440 | | | $ | 105,306 | |
Sr. Unsec’d. Notes, Ser. 0517 | | | 3.441 | | | | 02/15/21 | | | MYR | 2,250 | | | | 535,947 | |
Malaysia Government Investment Issue,
Sr. Unsec’d. Notes, Ser. 0416 | | | 3.226 | | | | 04/15/20 | | | MYR | 2,180 | | | | 518,962 | |
| | | | | | | | | | | | | | | | |
| | | | | | | | | | | | | | | 3,979,128 | |
| | | | |
Mexico 9.8% | | | | | | | | | | | | | | | | |
Mexican Bonos, | | | | | | | | | | | | | | | | |
Bonds, Ser. M | | | 6.500 | | | | 06/09/22 | | | MXN | 23,425 | | | | 1,076,616 | |
Bonds, Ser. M | | | 8.000 | | | | 11/07/47 | | | MXN | 5,750 | | | | 253,916 | |
Bonds, Ser. M20 | | | 7.500 | | | | 06/03/27 | | | MXN | 63,195 | | | | 2,862,453 | |
Sr. Unsec’d. Notes, Ser. M | | | 8.000 | | | | 12/07/23 | | | MXN | 16,697 | | | | 798,936 | |
Sr. Unsec’d. Notes, Ser. M20 | | | 8.500 | | | | 05/31/29 | | | MXN | 15,500 | | | | 742,256 | |
| | | | | | | | | | | | | | | | |
| | | | | | | | | | | | | | | 5,734,177 | |
| | | | |
Nigeria 0.4% | | | | | | | | | | | | | | | | |
Nigeria Government International Bond,
Sr. Unsec’d. Notes | | | 5.625 | | | | 06/27/22 | | | | 230 | | | | 226,656 | |
| | | | |
Pakistan 0.6% | | | | | | | | | | | | | | | | |
Third Pakistan International Sukuk Co. Ltd. (The),
Sr. Unsec’d. Notes, 144A | | | 5.625 | | | | 12/05/22 | | | | 400 | | | | 381,570 | |
| | | | |
Peru 3.9% | | | | | | | | | | | | | | | | |
Peru Government Bond,
Bonds | | | 6.950 | | | | 08/12/31 | | | PEN | 190 | | | | 60,159 | |
Sr. Unsec’d. Notes, 144A | | | 6.150 | | | | 08/12/32 | | | PEN | 285 | | | | 84,042 | |
Peruvian Government International Bond, | | | | | | | | | | | | | | | | |
Sr. Unsec’d. Notes | | | 5.200 | | | | 09/12/23 | | | PEN | 1,444 | | | | 436,862 | |
Sr. Unsec’d. Notes | | | 6.950 | | | | 08/12/31 | | | PEN | 5,100 | | | | 1,614,786 | |
Sr. Unsec’d. Notes | | | 8.200 | | | | 08/12/26 | | | PEN | 260 | | | | 89,764 | |
| | | | | | | | | | | | | | | | |
| | | | | | | | | | | | | | | 2,285,613 | |
| | | | |
Philippines 0.1% | | | | | | | | | | | | | | | | |
Philippine Government Bond,
Sr. Unsec’d. Notes, Ser. 1060 | | | 3.625 | | | | 09/09/25 | | | PHP | 5,600 | | | | 83,164 | |
See Notes to Financial Statements.
| | | | | | | | | | | | | | | | |
| Description | | Interest
Rate | | | Maturity
Date | | | Principal
Amount (000)# | | | Value | |
SOVEREIGN BONDS (Continued) | | | | | | | | | | | | | | | | |
| | | | |
Poland 4.7% | | | | | | | | | | | | | | | | |
Republic of Poland Government Bond, | | | | | | | | | | | | | | | | |
Bonds, Ser. 0725 | | | 3.250 | % | | | 07/25/25 | | | PLN | 3,890 | | | $ | 1,035,772 | |
Bonds, Ser. 0726 | | | 2.500 | | | | 07/25/26 | | | PLN | 6,840 | | | | 1,716,618 | |
| | | | | | | | | | | | | | | | |
| | | | | | | | | | | | | | | 2,752,390 | |
| | | | |
Romania 0.4% | | | | | | | | | | | | | | | | |
Romania Government Bond,
Bonds, Ser. 10YR | | | 5.850 | | | | 04/26/23 | | | RON | 960 | | | | 243,434 | |
| | | | |
Russia 4.3% | | | | | | | | | | | | | | | | |
Russian Federal Bond - OFZ, | | | | | | | | | | | | | | | | |
Bonds, Ser. 6218 | | | 8.500 | | | | 09/17/31 | | | RUB | 48,250 | | | | 732,491 | |
Bonds, Ser. 6219 | | | 7.750 | | | | 09/16/26 | | | RUB | 33,100 | | | | 483,116 | |
Bonds, Ser. 6221 | | | 7.700 | | | | 03/23/33 | | | RUB | 48,700 | | | | 692,355 | |
Bonds, Ser. 6222 | | | 7.100 | | | | 10/16/24 | | | RUB | 42,250 | | | | 604,063 | |
| | | | | | | | | | | | | | | | |
| | | | | | | | | | | | | | | 2,512,025 | |
| | | | |
Singapore 2.1% | | | | | | | | | | | | | | | | |
Singapore Government Bond, | | | | | | | | | | | | | | | | |
Sr. Unsec’d. Notes | | | 1.750 | | | | 02/01/23 | | | SGD | 225 | | | | 159,140 | |
Sr. Unsec’d. Notes | | | 2.375 | | | | 06/01/25 | | | SGD | 340 | | | | 244,724 | |
Sr. Unsec’d. Notes | | | 2.750 | | | | 07/01/23 | | | SGD | 1,108 | | | | 815,560 | |
| | | | | | | | | | | | | | | | |
| | | | | | | | | | | | | | | 1,219,424 | |
| | | | |
South Africa 6.8% | | | | | | | | | | | | | | | | |
Republic of South Africa Government Bond, | | | | | | | | | | | | | | | | |
Bonds, Ser. 2032 | | | 8.250 | | | | 03/31/32 | | | ZAR | 19,140 | | | | 1,128,366 | |
Bonds, Ser. 2040 | | | 9.000 | | | | 01/31/40 | | | ZAR | 20,850 | | | | 1,256,081 | |
Bonds, Ser. 2044 | | | 8.750 | | | | 01/31/44 | | | ZAR | 6,715 | | | | 392,670 | |
Bonds, Ser. 2048 | | | 8.750 | | | | 02/28/48 | | | ZAR | 1,476 | | | | 86,125 | |
Bonds, Ser. R186 | | | 10.500 | | | | 12/21/26 | | | ZAR | 15,508 | | | | 1,114,691 | |
| | | | | | | | | | | | | | | | |
| | | | | | | | | | | | | | | 3,977,933 | |
| | | | |
Sri Lanka 0.3% | | | | | | | | | | | | | | | | |
Sri Lanka Government International Bond,
Sr. Unsec’d. Notes | | | 6.250 | | | | 07/27/21 | | | | 200 | | | | 189,793 | |
See Notes to Financial Statements.
| | | | |
| PGIM Emerging Markets Debt Local Currency Fund | | | 21 | |
Schedule of Investments (continued)
as of October 31, 2018
| | | | | | | | | | | | | | | | |
| Description | | Interest
Rate | | | Maturity
Date | | | Principal
Amount (000)# | | | Value | |
SOVEREIGN BONDS (Continued) | | | | | | | | | | | | | | | | |
| | | | |
Thailand 4.9% | | | | | | | | | | | | | | | | |
Thailand Government Bond, | | | | | | | | | | | | | | | | |
Sr. Unsec’d. Notes | | | 2.125 | % | | | 12/17/26 | | | THB | 19,520 | | | $ | 561,697 | |
Sr. Unsec’d. Notes | | | 2.875 | | | | 06/17/46 | | | THB | 3,150 | | | | 85,557 | |
Sr. Unsec’d. Notes | | | 3.400 | | | | 06/17/36 | | | THB | 44,850 | | | | 1,376,799 | |
Sr. Unsec’d. Notes | | | 3.625 | | | | 06/16/23 | | | THB | 8,530 | | | | 271,081 | |
Sr. Unsec’d. Notes | | | 3.775 | | | | 06/25/32 | | | THB | 600 | | | | 19,129 | |
Sr. Unsec’d. Notes | | | 4.875 | | | | 06/22/29 | | | THB | 15,170 | | | | 535,998 | |
| | | | | | | | | | | | | | | | |
| | | | | | | | | | | | | | | 2,850,261 | |
| | | | |
Turkey 3.9% | | | | | | | | | | | | | | | | |
Turkey Government Bond, | | | | | | | | | | | | | | | | |
Bonds | | | 7.100 | | | | 03/08/23 | | | TRY | 3,515 | | | | 409,030 | |
Bonds | | | 8.800 | | | | 09/27/23 | | | TRY | 4,430 | | | | 546,062 | |
Bonds | | | 10.600 | | | | 02/11/26 | | | TRY | 4,479 | | | | 570,532 | |
Bonds | | | 11.000 | | | | 02/24/27 | | | TRY | 4,000 | | | | 504,079 | |
Turkey Government International Bond,
Sr. Unsec’d. Notes | | | 5.625 | | | | 03/30/21 | | | | 250 | | | | 243,736 | |
| | | | | | | | | | | | | | | | |
| | | | | | | | | | | | | | | 2,273,439 | |
| | | | |
Ukraine 0.5% | | | | | | | | | | | | | | | | |
Ukraine Government International Bond,
Sr. Unsec’d. Notes | | | 7.750 | | | | 09/01/22 | | | | 325 | | | | 315,042 | |
| | | | |
Uruguay 0.2% | | | | | | | | | | | | | | | | |
Uruguay Government International Bond, | | | | | | | | | | | | | | | | |
Sr. Unsec’d. Notes | | | 9.875 | | | | 06/20/22 | | | UYU | 3,260 | | | | 97,755 | |
Sr. Unsec’d. Notes, 144A | | | 8.500 | | | | 03/15/28 | | | UYU | 1,870 | | | | 48,723 | |
| | | | | | | | | | | | | | | | |
| | | | | | | | | | | | | | | 146,478 | |
| | | | | | | | | | | | | | | | |
TOTAL SOVEREIGN BONDS
(cost $59,731,895) | | | | | | | | | | | | | | | 53,276,831 | |
| | | | | | | | | | | | | | | | |
| | | | |
CORPORATE BONDS 3.9% | | | | | | | | | | | | | | | | |
| | | | |
Brazil 0.5% | | | | | | | | | | | | | | | | |
Petrobras Global Finance BV,
Gtd. Notes | | | 6.250 | | | | 03/17/24 | | | | 285 | | | | 288,277 | |
See Notes to Financial Statements.
| | | | | | | | | | | | | | | | |
| Description | | Interest
Rate | | | Maturity
Date | | | Principal
Amount (000)# | | | Value | |
CORPORATE BONDS (Continued) | | | | | | | | | | | | | | | | |
| | | | |
China 0.6% | | | | | | | | | | | | | | | | |
CNAC HK Finbridge Co. Ltd.,
Gtd. Notes | | | 4.125 | % | | | 03/14/21 | | | | 355 | | | $ | 353,644 | |
| | | | |
Indonesia 0.4% | | | | | | | | | | | | | | | | |
Saka Energi Indonesia PT,
Sr. Unsec’d. Notes | | | 4.450 | | | | 05/05/24 | | | | 225 | | | | 206,070 | |
| | | | |
Jamaica 0.3% | | | | | | | | | | | | | | | | |
Digicel Ltd.,
Gtd. Notes | | | 6.750 | | | | 03/01/23 | | | | 235 | | | | 188,588 | |
| | | | |
Mexico 1.4% | | | | | | | | | | | | | | | | |
America Movil SAB de CV,
Sr. Unsec’d. Notes | | | 6.450 | | | | 12/05/22 | | | MXN | 7,500 | | | | 328,234 | |
Petroleos Mexicanos, | | | | | | | | | | | | | | | | |
Gtd. Notes, 144A | | | 7.650 | | | | 11/24/21 | | | MXN | 4,120 | | | | 189,194 | |
Gtd. Notes, MTN | | | 6.875 | | | | 08/04/26 | | | | 315 | | | | 313,740 | |
| | | | | | | | | | | | | | | | |
| | | | | | | | | | | | | | | 831,168 | |
| | | | |
Russia 0.3% | | | | | | | | | | | | | | | | |
Vnesheconombank Via VEB Finance PLC,
Sr. Unsec’d. Notes | | | 5.942 | | | | 11/21/23 | | | | 200 | | | | 190,933 | |
| | | | |
South Africa 0.4% | | | | | | | | | | | | | | | | |
Eskom Holdings SOC Ltd.,
Sr. Unsec’d. Notes | | | 5.750 | | | | 01/26/21 | | | | 235 | | | | 225,013 | |
| | | | | | | | | | | | | | | | |
TOTAL CORPORATE BONDS
(cost $2,761,381) | | | | | | | | | | | | | | | 2,283,693 | |
| | | | | | | | | | | | | | | | |
TOTAL LONG-TERM INVESTMENTS
(cost $62,493,276) | | | | | | | | | | | | | | | 55,560,524 | |
| | | | | | | | | | | | | | | | |
See Notes to Financial Statements.
| | | | |
| PGIM Emerging Markets Debt Local Currency Fund | | | 23 | |
Schedule of Investments (continued)
as of October 31, 2018
| | | | | | | | | | | | | | | | |
| Description | | | | | | | | Shares | | | Value | |
SHORT-TERM INVESTMENT 2.5% | | | | | | | | | | | | | | | | |
| | | | |
AFFILIATED MUTUAL FUND | | | | | | | | | | | | | | | | |
PGIM Core Ultra Short Bond Fund
(cost $1,473,311)(w) | | | | | | | | | | | 1,473,311 | | | $ | 1,473,311 | |
| | | | | | | | | | | | | | | | |
| | | | |
TOTAL INVESTMENTS 97.2%
(cost $63,966,587) | | | | | | | | | | | | | | | 57,033,835 | |
Other assets in excess of liabilities(z) 2.8% | | | | | | | | | | | | | | | 1,650,873 | |
| | | | | | | | | | | | | | | | |
NET ASSETS 100.0% | | | | | | | | | | | | | | $ | 58,684,708 | |
| | | | | | | | | | | | | | | | |
The following abbreviations are used in the annual report:
144A—Security was purchased pursuant to Rule 144A under the Securities Act of 1933 and may not be resold subject to that rule except to qualified institutional buyers. Unless otherwise noted, 144A securities are deemed to be liquid.
A—Annual payment frequency for swaps
LIBOR—London Interbank Offered Rate
M—Monthly payment frequency for swaps
MTN—Medium Term Note
OFZ—Obligatsyi Federal’novo Zaima (Federal Loan Obligations)
OTC—Over-the-counter
S—Semiannual payment frequency for swaps
WIBOR—Warsaw Interbank Offered Rate
ARS—Argentine Peso
AUD—Australian Dollar
BRL—Brazilian Real
CAD—Canadian Dollar
CHF—Swiss Franc
CLP—Chilean Peso
CNH—Chinese Renminbi
COP—Colombian Peso
CZK—Czech Koruna
EUR—Euro
HUF—Hungarian Forint
IDR—Indonesian Rupiah
ILS—Israeli Shekel
INR—Indian Rupee
KRW—South Korean Won
MXN—Mexican Peso
MYR—Malaysian Ringgit
NZD—New Zealand Dollar
PEN—Peruvian Nuevo Sol
PHP—Philippine Peso
PLN—Polish Zloty
RON—Romanian Leu
RUB—Russian Ruble
SGD—Singapore Dollar
THB—Thai Baht
TRY—Turkish Lira
TWD—New Taiwanese Dollar
See Notes to Financial Statements.
USD—US Dollar
UYU—Uruguayan Peso
ZAR—South African Rand
| # | Principal or notional amount is shown in U.S. dollars unless otherwise stated. |
| (w) | PGIM Investments LLC, the manager of the Series, also serves as manager of the PGIM Core Ultra Short Bond Fund. |
| (z) | Includes net unrealized appreciation/(depreciation) and/or market value of the below holdings which are excluded from the Schedule of Investments: |
Forward foreign currency exchange contracts outstanding at October 31, 2018:
| | | | | | | | | | | | | | | | | | | | | | |
Purchase Contracts | | Counterparty | | Notional
Amount
(000) | | | Value at
Settlement
Date | | | Current
Value | | | Unrealized
Appreciation | | | Unrealized
Depreciation | |
OTC Forward Foreign Currency Exchange Contracts: | | | | | |
Argentine Peso, | | | | | | | | | | | | | | | | | | | | | | |
Expiring 11/09/18 | | BNP Paribas | | ARS | 9,271 | | | $ | 243,642 | | | $ | 255,326 | | | $ | 11,684 | | | $ | — | |
Expiring 11/09/18 | | BNP Paribas | | ARS | 9,170 | | | | 236,338 | | | | 252,553 | | | | 16,215 | | | | — | |
Expiring 11/09/18 | | Citibank NA | | ARS | 3,866 | | | | 89,213 | | | | 106,489 | | | | 17,276 | | | | — | |
Expiring 11/30/18 | | BNP Paribas | | ARS | 1,125 | | | | 29,425 | | | | 30,174 | | | | 749 | | | | — | |
Expiring 11/30/18 | | BNP Paribas | | ARS | 1,123 | | | | 29,447 | | | | 30,118 | | | | 671 | | | | — | |
Brazilian Real, | | | | | | | | | | | | | | | | | | | | | | |
Expiring 12/04/18 | | Goldman Sachs
International | | BRL | 3,771 | | | | 1,017,696 | | | | 1,009,935 | | | | — | | | | (7,761 | ) |
Expiring 02/25/19 | | Citibank NA | | BRL | 857 | | | | 253,701 | | | | 228,003 | | | | — | | | | (25,698 | ) |
Canadian Dollar, | | | | | | | | | | | | | | | | | | | | | | |
Expiring 01/18/19 | | Citibank NA | | CAD | 377 | | | | 289,200 | | | | 286,601 | | | | — | | | | (2,599 | ) |
Expiring 01/18/19 | | Goldman Sachs
International | | CAD | 405 | | | | 309,300 | | | | 307,841 | | | | — | | | | (1,459 | ) |
Chilean Peso, | | | | | | | | | | | | | | | | | | | | | | |
Expiring 12/19/18 | | JPMorgan Chase | | CLP | 104,447 | | | | 156,400 | | | | 150,182 | | | | — | | | | (6,218 | ) |
Expiring 12/19/18 | | JPMorgan Chase | | CLP | 54,234 | | | | 77,833 | | | | 77,982 | | | | 149 | | | | — | |
Expiring 12/19/18 | | Morgan Stanley | | CLP | 108,128 | | | | 155,000 | | | | 155,475 | | | | 475 | | | | — | |
Expiring 12/19/18 | | Morgan Stanley | | CLP | 36,791 | | | | 55,234 | | | | 52,901 | | | | — | | | | (2,333 | ) |
Expiring 12/19/18 | | UBS AG | | CLP | 69,533 | | | | 104,000 | | | | 99,980 | | | | — | | | | (4,020 | ) |
Colombian Peso, | | | | | | | | | | | | | | | | | | | | | | |
Expiring 12/14/18 | | Citibank NA | | COP | 3,139,979 | | | | 1,005,357 | | | | 973,416 | | | | — | | | | (31,941 | ) |
Expiring 12/14/18 | | Citibank NA | | COP | 455,607 | | | | 144,225 | | | | 141,241 | | | | — | | | | (2,984 | ) |
Expiring 12/14/18 | | JPMorgan Chase | | COP | 576,106 | | | | 178,582 | | | | 178,597 | | | | 15 | | | | — | |
Expiring 12/14/18 | | JPMorgan Chase | | COP | 471,933 | | | | 158,949 | | | | 146,302 | | | | — | | | | (12,647 | ) |
Expiring 12/14/18 | | JPMorgan Chase | | COP | 428,652 | | | | 133,980 | | | | 132,885 | | | | — | | | | (1,095 | ) |
Czech Koruna, | | | | | | | | | | | | | | | | | | | | | | |
Expiring 01/25/19 | | UBS AG | | CZK | 3,104 | | | | 139,000 | | | | 136,645 | | | | — | | | | (2,355 | ) |
Euro, | | | | | | | | | | | | | | | | | | | | | | |
Expiring 01/25/19 | | Citibank NA | | EUR | 688 | | | | 790,419 | | | | 785,526 | | | | — | | | | (4,893 | ) |
Expiring 02/25/19 | | Citibank NA | | EUR | 50 | | | | 59,230 | | | | 57,258 | | | | — | | | | (1,972 | ) |
Hungarian Forint, | | | | | | | | | | | | | | | | | | | | | | |
Expiring 01/25/19 | | JPMorgan Chase | | HUF | 30,237 | | | | 106,194 | | | | 106,290 | | | | 96 | | | | — | |
Indian Rupee, | | | | | | | | | | | | | | | | | | | | | | |
Expiring 01/11/19 | | Citibank NA | | INR | 11,217 | | | | 150,000 | | | | 150,381 | | | | 381 | | | | — | |
See Notes to Financial Statements.
| | | | |
| PGIM Emerging Markets Debt Local Currency Fund | | | 25 | |
Schedule of Investments (continued)
as of October 31, 2018
Forward foreign currency exchange contracts outstanding at October 31, 2018 (continued):
| | | | | | | | | | | | | | | | | | | | | | |
Purchase Contracts | | Counterparty | | Notional
Amount
(000) | | | Value at
Settlement
Date | | | Current
Value | | | Unrealized
Appreciation | | | Unrealized
Depreciation | |
OTC Forward Foreign Currency Exchange Contracts (cont’d.): | | | | | | | | | | | | | |
Indian Rupee (cont’d.), | | | | | | | | | | | | | | | | | | | | |
Expiring 01/11/19 | | Goldman Sachs
International | | INR | 16,087 | | | $ | 214,751 | | | $ | 215,670 | | | $ | 919 | | | $ | — | |
Expiring 01/11/19 | | Goldman Sachs
International | | INR | 15,379 | | | | 206,445 | | | | 206,180 | | | | — | | | | (265 | ) |
Expiring 01/11/19 | | JPMorgan Chase | | INR | 59,876 | | | | 803,807 | | | | 802,721 | | | | — | | | | (1,086 | ) |
Expiring 01/11/19 | | JPMorgan Chase | | INR | 48,261 | | | | 641,555 | | | | 647,010 | | | | 5,455 | | | | — | |
Indonesian Rupiah, | | | | | | | | | | | | | | | | | | | | | | |
Expiring 12/14/18 | | Deutsche Bank AG | | IDR | 887,775 | | | | 58,696 | | | | 58,052 | | | | — | | | | (644 | ) |
Expiring 12/19/18 | | Barclays Bank PLC | | IDR | 9,098,458 | | | | 596,804 | | | | 594,502 | | | | — | | | | (2,302 | ) |
Expiring 12/19/18 | | Barclays Bank PLC | | IDR | 6,666,628 | | | | 440,448 | | | | 435,604 | | | | — | | | | (4,844 | ) |
Expiring 12/19/18 | | Barclays Bank PLC | | IDR | 2,175,724 | | | | 142,000 | | | | 142,164 | | | | 164 | | | | — | |
Expiring 12/19/18 | | Barclays Bank PLC | | IDR | 1,546,522 | | | | 101,000 | | | | 101,051 | | | | 51 | | | | — | |
Expiring 12/19/18 | | Citibank NA | | IDR | 1,361,789 | | | | 89,000 | | | | 88,981 | | | | — | | | | (19 | ) |
Expiring 12/19/18 | | JPMorgan Chase | | IDR | 5,294,069 | | | | 348,659 | | | | 345,920 | | | | — | | | | (2,739 | ) |
Expiring 12/19/18 | | JPMorgan Chase | | IDR | 1,209,111 | | | | 79,260 | | | | 79,005 | | | | — | | | | (255 | ) |
Expiring 12/19/18 | | JPMorgan Chase | | IDR | 678,807 | | | | 45,020 | | | | 44,354 | | | | — | | | | (666 | ) |
Expiring 12/19/18 | | Morgan Stanley | | IDR | 1,982,720 | | | | 128,000 | | | | 129,553 | | | | 1,553 | | | | — | |
Israeli Shekel, | | | | | | | | | | | | | | | | | | | | | | |
Expiring 01/28/19 | | Barclays Bank PLC | | ILS | 521 | | | | 141,100 | | | | 141,081 | | | | — | | | | (19 | ) |
Mexican Peso, | | | | | | | | | | | | | | | | | | | | | | |
Expiring 12/19/18 | | JPMorgan Chase | | MXN | 9,741 | | | | 477,560 | | | | 475,565 | | | | — | | | | (1,995 | ) |
Expiring 12/19/18 | | UBS AG | | MXN | 1,885 | | | | 98,000 | | | | 92,022 | | | | — | | | | (5,978 | ) |
Expiring 01/29/19 | | JPMorgan Chase | | MXN | 586 | | | | 30,823 | | | | 28,402 | | | | — | | | | (2,421 | ) |
Expiring 01/29/19 | | UBS AG | | MXN | 4,131 | | | | 209,000 | | | | 200,307 | | | | — | | | | (8,693 | ) |
Expiring 01/29/19 | | UBS AG | | MXN | 3,778 | | | | 191,000 | | | | 183,181 | | | | — | | | | (7,819 | ) |
New Taiwanese Dollar, | | | | | | | | | | | | | | | | | | | | | | |
Expiring 01/11/19 | | Citibank NA | | TWD | 5,589 | | | | 182,000 | | | | 181,730 | | | | — | | | | (270 | ) |
Expiring 01/11/19 | | JPMorgan Chase | | TWD | 5,836 | | | | 190,000 | | | | 189,749 | | | | — | | | | (251 | ) |
Expiring 01/11/19 | | JPMorgan Chase | | TWD | 5,566 | | | | 180,000 | | | | 180,985 | | | | 985 | | | | — | |
Expiring 01/11/19 | | Morgan Stanley | | TWD | 6,892 | | | | 223,000 | | | | 224,098 | | | | 1,098 | | | | — | |
Peruvian Nuevo Sol, | | | | | | | | | | | | | | | | | | | | | | |
Expiring 12/19/18 | | BNP Paribas | | PEN | 1,702 | | | | 514,472 | | | | 503,730 | | | | — | | | | (10,742 | ) |
Expiring 12/19/18 | | BNP Paribas | | PEN | 486 | | | | 145,000 | | | | 143,732 | | | | — | | | | (1,268 | ) |
Expiring 12/19/18 | | Citibank NA | | PEN | 976 | | | | 293,119 | | | | 288,908 | | | | — | | | | (4,211 | ) |
Expiring 12/19/18 | | JPMorgan Chase | | PEN | 499 | | | | 150,492 | | | | 147,867 | | | | — | | | | (2,625 | ) |
Expiring 12/19/18 | | JPMorgan Chase | | PEN | 498 | | | | 150,154 | | | | 147,317 | | | | — | | | | (2,837 | ) |
Expiring 12/19/18 | | JPMorgan Chase | | PEN | 320 | | | | 96,000 | | | | 94,862 | | | | — | | | | (1,138 | ) |
Expiring 12/19/18 | | JPMorgan Chase | | PEN | 109 | | | | 32,958 | | | | 32,270 | | | | — | | | | (688 | ) |
Philippine Peso, | | | | | | | | | | | | | | | | | | | | | | |
Expiring 12/14/18 | | Barclays Bank PLC | | PHP | 12,449 | | | | 228,001 | | | | 231,981 | | | | 3,980 | | | | — | |
Expiring 12/14/18 | | Barclays Bank PLC | | PHP | 9,708 | | | | 178,000 | | | | 180,900 | | | | 2,900 | | | | — | |
Expiring 12/14/18 | | Barclays Bank PLC | | PHP | 8,789 | | | | 161,000 | | | | 163,773 | | | | 2,773 | | | | — | |
See Notes to Financial Statements.
Forward foreign currency exchange contracts outstanding at October 31, 2018 (continued):
| | | | | | | | | | | | | | | | | | | | | | |
Purchase Contracts | | Counterparty | | Notional
Amount
(000) | | | Value at
Settlement
Date | | | Current
Value | | | Unrealized
Appreciation | | | Unrealized
Depreciation | |
OTC Forward Foreign Currency Exchange Contracts (cont’d.): | | | | | | | | | |
Philippine Peso (cont’d.), | | | | | | | | | | | | | | | | | | | | |
Expiring 12/14/18 | | Barclays Bank PLC | | PHP | 8,658 | | | $ | 159,000 | | | $ | 161,339 | | | $ | 2,339 | | | $ | — | |
Expiring 12/14/18 | | Barclays Bank PLC | | PHP | 8,316 | | | | 152,000 | | | | 154,964 | | | | 2,964 | | | | — | |
Expiring 12/14/18 | | Citibank NA | | PHP | 9,106 | | | | 168,000 | | | | 169,673 | | | | 1,673 | | | | — | |
Expiring 12/14/18 | | Citibank NA | | PHP | 6,712 | | | | 123,000 | | | | 125,073 | | | | 2,073 | | | | — | |
Expiring 12/14/18 | | JPMorgan Chase | | PHP | 11,242 | | | | 207,000 | | | | 209,488 | | | | 2,488 | | | | — | |
Expiring 12/14/18 | | JPMorgan Chase | | PHP | 9,288 | | | | 172,000 | | | | 173,072 | | | | 1,072 | | | | — | |
Expiring 12/14/18 | | JPMorgan Chase | | PHP | 7,853 | | | | 147,001 | | | | 146,336 | | | | — | | | | (665 | ) |
Expiring 12/14/18 | | JPMorgan Chase | | PHP | 6,960 | | | | 127,000 | | | | 129,699 | | | | 2,699 | | | | — | |
Expiring 12/14/18 | | Morgan Stanley | | PHP | 11,622 | | | | 212,000 | | | | 216,560 | | | | 4,560 | | | | — | |
Expiring 12/14/18 | | Morgan Stanley | | PHP | 9,505 | | | | 175,000 | | | | 177,108 | | | | 2,108 | | | | — | |
Expiring 12/14/18 | | Morgan Stanley | | PHP | 9,260 | | | | 170,000 | | | | 172,548 | | | | 2,548 | | | | — | |
Polish Zloty, | | | | | | | | | | | | | | | | | | | | | | |
Expiring 01/25/19 | | Barclays Bank PLC | | PLN | 5,532 | | | | 1,481,313 | | | | 1,445,350 | | | | — | | | | (35,963 | ) |
Expiring 01/25/19 | | Toronto Dominion | | PLN | 410 | | | | 110,000 | | | | 107,164 | | | | — | | | | (2,836 | ) |
Romanian Leu, | | | | | | | | | | | | | | | | | | | | | | |
Expiring 01/25/19 | | BNP Paribas | | RON | 3,777 | | | | 928,124 | | | | 916,122 | | | | — | | | | (12,002 | ) |
Russian Ruble, | | | | | | | | | | | | | | | | | | | | | | |
Expiring 12/19/18 | | Barclays Bank PLC | | RUB | 9,962 | | | | 152,000 | | | | 150,291 | | | | — | | | | (1,709 | ) |
Expiring 12/19/18 | | Barclays Bank PLC | | RUB | 9,467 | | | | 141,000 | | | | 142,821 | | | | 1,821 | | | | — | |
Expiring 12/19/18 | | Barclays Bank PLC | | RUB | 7,148 | | | | 108,000 | | | | 107,837 | | | | — | | | | (163 | ) |
Expiring 12/19/18 | | Citibank NA | | RUB | 3,325 | | | | 49,391 | | | | 50,157 | | | | 766 | | | | — | |
Expiring 12/19/18 | | JPMorgan Chase | | RUB | 108,115 | | | | 1,609,456 | | | | 1,631,063 | | | | 21,607 | | | | — | |
Singapore Dollar, | | | | | | | | | | | | | | | | | | | | | | |
Expiring 11/09/18 | | Bank of America | | SGD | 133 | | | | 98,000 | | | | 96,305 | | | | — | | | | (1,695 | ) |
Expiring 11/09/18 | | Barclays Bank PLC | | SGD | 873 | | | | 636,726 | | | | 630,418 | | | | — | | | | (6,308 | ) |
Expiring 11/09/18 | | Citibank NA | | SGD | 336 | | | | 243,387 | | | | 242,279 | | | | — | | | | (1,108 | ) |
Expiring 11/09/18 | | Citibank NA | | SGD | 185 | | | | 135,000 | | | | 133,471 | | | | — | | | | (1,529 | ) |
Expiring 11/09/18 | | Citibank NA | | SGD | 165 | | | | 121,000 | | | | 119,302 | | | | — | | | | (1,698 | ) |
Expiring 11/09/18 | | Citibank NA | | SGD | 134 | | | | 98,000 | | | | 96,834 | | | | — | | | | (1,166 | ) |
Expiring 11/09/18 | | Deutsche Bank AG | | SGD | 311 | | | | 227,000 | | | | 224,545 | | | | — | | | | (2,455 | ) |
Expiring 11/09/18 | | Deutsche Bank AG | | SGD | 173 | | | | 127,000 | | | | 125,177 | | | | — | | | | (1,823 | ) |
Expiring 11/09/18 | | Deutsche Bank AG | | SGD | 156 | | | | 113,000 | | | | 112,472 | | | | — | | | | (528 | ) |
Expiring 11/09/18 | | Hong Kong &
Shanghai Bank | | SGD | 121 | | | | 87,812 | | | | 87,257 | | | | — | | | | (555 | ) |
Expiring 11/09/18 | | JPMorgan Chase | | SGD | 140 | | | | 103,000 | | | | 101,208 | | | | — | | | | (1,792 | ) |
Expiring 11/09/18 | | JPMorgan Chase | | SGD | 137 | | | | 101,000 | | | | 99,244 | | | | — | | | | (1,756 | ) |
Expiring 11/09/18 | | UBS AG | | SGD | 184 | | | | 135,000 | | | | 132,851 | | | | — | | | | (2,149 | ) |
Expiring 11/09/18 | | UBS AG | | SGD | 136 | | | | 100,000 | | | | 98,491 | | | | — | | | | (1,509 | ) |
Expiring 11/09/18 | | UBS AG | | SGD | 120 | | | | 88,000 | | | | 86,748 | | | | — | | | | (1,252 | ) |
South African Rand, | | | | | | | | | | | | | | | | | | | | | | |
Expiring 12/07/18 | | Bank of America | | ZAR | 2,184 | | | | 151,196 | | | | 147,335 | | | | — | | | | (3,861 | ) |
Expiring 12/07/18 | | Barclays Bank PLC | | ZAR | 891 | | | | 59,314 | | | | 60,088 | | | | 774 | | | | — | |
See Notes to Financial Statements.
| | | | |
| PGIM Emerging Markets Debt Local Currency Fund | | | 27 | |
Schedule of Investments (continued)
as of October 31, 2018
Forward foreign currency exchange contracts outstanding at October 31, 2018 (continued):
| | | | | | | | | | | | | | | | | | | | | | |
Purchase Contracts | | Counterparty | | Notional
Amount
(000) | | | Value at
Settlement
Date | | | Current
Value | | | Unrealized
Appreciation | | | Unrealized
Depreciation | |
OTC Forward Foreign Currency Exchange Contracts (cont’d.): | | | | | | | | | |
South African Rand (cont’d.), | | | | | | | | | | | | | | | | | | | | |
Expiring 12/07/18 | | Deutsche Bank AG | | ZAR | 1,513 | | | $ | 103,000 | | | $ | 102,093 | | | $ | — | | | $ | (907 | ) |
Expiring 12/07/18 | | JPMorgan Chase | | ZAR | 1,836 | | | | 126,000 | | | | 123,845 | | | | — | | | | (2,155 | ) |
Expiring 12/07/18 | | JPMorgan Chase | | ZAR | 1,447 | | | | 100,000 | | | | 97,658 | | | | — | | | | (2,342 | ) |
Expiring 12/07/18 | | UBS AG | | ZAR | 2,125 | | | | 148,000 | | | | 143,387 | | | | — | | | | (4,613 | ) |
Expiring 12/07/18 | | UBS AG | | ZAR | 1,399 | | | | 98,000 | | | | 94,401 | | | | — | | | | (3,599 | ) |
South Korean Won, | | | | | | | | | | | | | | | | | | | | | | |
Expiring 01/16/19 | | JPMorgan Chase | | KRW | 265,994 | | | | 235,748 | | | | 234,071 | | | | — | | | | (1,677 | ) |
Thai Baht, | | | | | | | | | | | | | | | | | | | | | | |
Expiring 11/09/18 | | Citibank NA | | THB | 9,486 | | | | 293,845 | | | | 286,216 | | | | — | | | | (7,629 | ) |
Expiring 11/09/18 | | Citibank NA | | THB | 6,084 | | | | 186,000 | | | | 183,559 | | | | — | | | | (2,441 | ) |
Expiring 11/09/18 | | Citibank NA | | THB | 5,825 | | | | 179,000 | | | | 175,749 | | | | — | | | | (3,251 | ) |
Expiring 11/09/18 | | Citibank NA | | THB | 5,661 | | | | 173,000 | | | | 170,816 | | | | — | | | | (2,184 | ) |
Expiring 11/09/18 | | Citibank NA | | THB | 5,086 | | | | 156,000 | | | | 153,468 | | | | — | | | | (2,532 | ) |
Expiring 11/09/18 | | Citibank NA | | THB | 4,830 | | | | 150,000 | | | | 145,737 | | | | — | | | | (4,263 | ) |
Expiring 11/09/18 | | Citibank NA | | THB | 4,782 | | | | 148,000 | | | | 144,274 | | | | — | | | | (3,726 | ) |
Expiring 11/09/18 | | Citibank NA | | THB | 4,576 | | | | 139,000 | | | | 138,075 | | | | — | | | | (925 | ) |
Expiring 11/09/18 | | Citibank NA | | THB | 3,957 | | | | 122,000 | | | | 119,398 | | | | — | | | | (2,602 | ) |
Expiring 11/09/18 | | Citibank NA | | THB | 3,396 | | | | 105,000 | | | | 102,456 | | | | — | | | | (2,544 | ) |
Expiring 11/09/18 | | Citibank NA | | THB | 3,122 | | | | 96,765 | | | | 94,192 | | | | — | | | | (2,573 | ) |
Expiring 11/09/18 | | Citibank NA | | THB | 3,082 | | | | 93,087 | | | | 93,001 | | | | — | | | | (86 | ) |
Expiring 11/09/18 | | Citibank NA | | THB | 2,815 | | | | 85,999 | | | | 84,928 | | | | — | | | | (1,071 | ) |
Expiring 11/09/18 | | Citibank NA | | THB | 1,605 | | | | 48,336 | | | | 48,416 | | | | 80 | | | | — | |
Expiring 11/09/18 | | Deutsche Bank AG | | THB | 4,839 | | | | 149,000 | | | | 145,997 | | | | — | | | | (3,003 | ) |
Expiring 11/09/18 | | UBS AG | | THB | 73,431 | | | | 2,206,303 | | | | 2,215,586 | | | | 9,283 | | | | — | |
Turkish Lira, | | | | | | | | | | | | | | | | | | | | | | |
Expiring 12/07/18 | | Barclays Bank PLC | | TRY | 715 | | | | 112,000 | | | | 124,989 | | | | 12,989 | | | | — | |
Expiring 12/07/18 | | Barclays Bank PLC | | TRY | 263 | | | | 41,200 | | | | 45,978 | | | | 4,778 | | | | — | |
Expiring 12/07/18 | | Citibank NA | | TRY | 1,537 | | | | 220,717 | | | | 268,679 | | | | 47,962 | | | | — | |
Expiring 12/07/18 | | Goldman Sachs
International | | TRY | 327 | | | | 48,375 | | | | 57,198 | | | | 8,823 | | | | — | |
Expiring 12/07/18 | | Hong Kong &
Shanghai Bank | | TRY | 125 | | | | 18,396 | | | | 21,808 | | | | 3,412 | | | | — | |
Expiring 12/07/18 | | JPMorgan Chase | | TRY | 934 | | | | 149,341 | | | | 163,185 | | | | 13,844 | | | | — | |
Expiring 12/07/18 | | JPMorgan Chase | | TRY | 729 | | | | 123,000 | | | | 127,471 | | | | 4,471 | | | | — | |
Expiring 12/07/18 | | JPMorgan Chase | | TRY | 586 | | | | 102,366 | | | | 102,390 | | | | 24 | | | | — | |
Expiring 12/07/18 | | Morgan Stanley | | TRY | 696 | | | | 106,000 | | | | 121,666 | | | | 15,666 | | | | — | |
Expiring 12/07/18 | | Toronto Dominion | | TRY | 4,288 | | | | 628,131 | | | | 749,448 | | | | 121,317 | | | | — | |
Expiring 12/07/18 | | Toronto Dominion | | TRY | 757 | | | | 119,000 | | | | 132,383 | | | | 13,383 | | | | — | |
Expiring 12/07/18 | | UBS AG | | TRY | 879 | | | | 151,000 | | | | 153,706 | | | | 2,706 | | | | — | |
Expiring 12/07/18 | | UBS AG | | TRY | 118 | | | | 18,265 | | | | 20,610 | | | | 2,345 | | | | — | |
| | | | | | | | | | | | | | | | | | | | | | |
| | | | | | | | $ | 29,675,083 | | | $ | 29,742,852 | | | | 378,164 | | | | (310,395 | ) |
| | | | | | | | | | | | | | | | | | | | | | |
See Notes to Financial Statements.
Forward foreign currency exchange contracts outstanding at October 31, 2018 (continued):
| | | | | | | | | | | | | | | | | | | | | | |
Sale Contracts | | Counterparty | | Notional
Amount
(000) | | | Value at
Settlement
Date | | | Current
Value | | | Unrealized
Appreciation | | | Unrealized
Depreciation | |
OTC Forward Foreign Currency Exchange Contracts: | | | | | | | | | |
Australian Dollar, | | | | | | | | | | | | | | | | | | | | |
Expiring 01/18/19 | | Bank of America | | AUD | 208 | | | $ | 147,574 | | | $ | 147,708 | | | $ | — | | | $ | (134 | ) |
Brazilian Real, | | | | | | | | | | | | | | | | | | | | | | |
Expiring 12/04/18 | | Barclays Bank PLC | | BRL | 506 | | | | 136,000 | | | | 135,451 | | | | 549 | | | | — | |
Expiring 12/04/18 | | BNP Paribas | | BRL | 166 | | | | 44,200 | | | | 44,369 | | | | — | | | | (169 | ) |
Expiring 12/04/18 | | Goldman Sachs
International | | BRL | 2,081 | | | | 512,223 | | | | 557,210 | | | | — | | | | (44,987 | ) |
Expiring 12/04/18 | | Goldman Sachs
International | | BRL | 382 | | | | 102,592 | | | | 102,214 | | | | 378 | | | | — | |
Expiring 12/04/18 | | JPMorgan Chase | | BRL | 2,655 | | | | 712,975 | | | | 711,109 | | | | 1,866 | | | | — | |
Expiring 12/04/18 | | JPMorgan Chase | | BRL | 658 | | | | 163,987 | | | | 176,264 | | | | — | | | | (12,277 | ) |
Expiring 12/04/18 | | JPMorgan Chase | | BRL | 585 | | | | 156,509 | | | | 156,560 | | | | — | | | | (51 | ) |
Expiring 02/25/19 | | Citibank NA | | BRL | 233 | | | | 59,294 | | | | 61,990 | | | | — | | | | (2,696 | ) |
Canadian Dollar, | | | | | | | | | | | | | | | | | | | | | | |
Expiring 01/18/19 | | Deutsche Bank AG | | CAD | 405 | | | | 310,528 | | | | 307,781 | | | | 2,747 | | | | — | |
Expiring 01/18/19 | | Goldman Sachs
International | | CAD | 383 | | | | 295,231 | | | | 291,592 | | | | 3,639 | | | | — | |
Chilean Peso, | | | | | | | | | | | | | | | | | | | | | | |
Expiring 12/19/18 | | BNP Paribas | | CLP | 396,112 | | | | 588,734 | | | | 569,560 | | | | 19,174 | | | | — | |
Expiring 12/19/18 | | Citibank NA | | CLP | 34,551 | | | | 52,565 | | | | 49,680 | | | | 2,885 | | | | — | |
Chinese Renminbi, | | | | | | | | | | | | | | | | | | | | | | |
Expiring 01/28/19 | | Deutsche Bank AG | | CNH | 2,003 | | | | 287,000 | | | | 285,783 | | | | 1,217 | | | | — | |
Expiring 01/28/19 | | Deutsche Bank AG | | CNH | 1,423 | | | | 204,000 | | | | 202,993 | | | | 1,007 | | | | — | |
Expiring 01/28/19 | | Morgan Stanley | | CNH | 11,920 | | | | 1,709,002 | | | | 1,700,966 | | | | 8,036 | | | | — | |
Colombian Peso, | | | | | | | | | | | | | | | | | | | | | | |
Expiring 12/14/18 | | Barclays Bank PLC | | COP | 385,059 | | | | 128,000 | | | | 119,371 | | | | 8,629 | | | | — | |
Expiring 12/14/18 | | Citibank NA | | COP | 116,665 | | | | 38,448 | | | | 36,167 | | | | 2,281 | | | | — | |
Expiring 12/14/18 | | Morgan Stanley | | COP | 415,017 | | | | 135,000 | | | | 128,658 | | | | 6,342 | | | | — | |
Expiring 12/14/18 | | Morgan Stanley | | COP | 317,100 | | | | 105,000 | | | | 98,303 | | | | 6,697 | | | | — | |
Czech Koruna, | | | | | | | | | | | | | | | | | | | | | | |
Expiring 01/25/19 | | Citibank NA | | CZK | 11,268 | | | | 500,827 | | | | 496,061 | | | | 4,766 | | | | — | |
Expiring 01/25/19 | | Deutsche Bank AG | | CZK | 11,268 | | | | 503,827 | | | | 496,060 | | | | 7,767 | | | | — | |
Euro, | | | | | | | | | | | | | | | | | | | | | | |
Expiring 01/25/19 | | UBS AG | | EUR | 124 | | | | 141,350 | | | | 141,052 | | | | 298 | | | | — | |
Expiring 02/25/19 | | Citibank NA | | EUR | 200 | | | | 253,730 | | | | 229,032 | | | | 24,698 | | | | — | |
Hungarian Forint, | | | | | | | | | | | | | | | | | | | | | | |
Expiring 01/25/19 | | JPMorgan Chase | | HUF | 154,610 | | | | 557,453 | | | | 543,489 | | | | 13,964 | | | | — | |
Expiring 01/25/19 | | Toronto Dominion | | HUF | 210,316 | | | | 754,120 | | | | 739,307 | | | | 14,813 | | | | — | |
Expiring 01/25/19 | | Toronto Dominion | | HUF | 103,588 | | | | 372,059 | | | | 364,137 | | | | 7,922 | | | | — | |
Expiring 01/25/19 | | UBS AG | | HUF | 31,414 | | | | 111,000 | | | | 110,429 | | | | 571 | | | | — | |
Indian Rupee, | | | | | | | | | | | | | | | | | | | | | | |
Expiring 01/11/19 | | JPMorgan Chase | | INR | 12,910 | | | | 174,000 | | | | 173,079 | | | | 921 | | | | — | |
Expiring 01/11/19 | | JPMorgan Chase | | INR | 10,984 | | | | 147,000 | | | | 147,253 | | | | — | | | | (253 | ) |
See Notes to Financial Statements.
| | | | |
| PGIM Emerging Markets Debt Local Currency Fund | | | 29 | |
Schedule of Investments (continued)
as of October 31, 2018
Forward foreign currency exchange contracts outstanding at October 31, 2018 (continued):
| | | | | | | | | | | | | | | | | | | | | | |
Sale Contracts | | Counterparty | | Notional
Amount
(000) | | | Value at
Settlement
Date | | | Current
Value | | | Unrealized
Appreciation | | | Unrealized
Depreciation | |
OTC Forward Foreign Currency Exchange Contracts (cont’d.): | | | | | | | | | |
Indian Rupee (cont’d.), | | | | | | | | | | | | | | | | | | | | |
Expiring 01/11/19 | | JPMorgan Chase | | INR | 10,087 | | | $ | 135,000 | | | $ | 135,232 | | | $ | — | | | $ | (232 | ) |
Expiring 01/11/19 | | JPMorgan Chase | | INR | 9,251 | | | | 125,000 | | | | 124,020 | | | | 980 | | | | — | |
Expiring 01/11/19 | | JPMorgan Chase | | INR | 6,816 | | | | 92,000 | | | | 91,382 | | | | 618 | | | | — | |
Expiring 01/11/19 | | Morgan Stanley | | INR | 6,663 | | | | 90,000 | | | | 89,332 | | | | 668 | | | | — | |
Indonesian Rupiah, | | | | | | | | | | | | | | | | | | | | | | |
Expiring 12/14/18 | | Barclays Bank PLC | | IDR | 887,775 | | | | 57,638 | | | | 58,052 | | | | — | | | | (414 | ) |
Expiring 12/19/18 | | Barclays Bank PLC | | IDR | 4,022,041 | | | | 265,050 | | | | 262,804 | | | | 2,246 | | | | — | |
Expiring 12/19/18 | | Barclays Bank PLC | | IDR | 3,606,428 | | | | 235,000 | | | | 235,648 | | | | — | | | | (648 | ) |
Expiring 12/19/18 | | Barclays Bank PLC | | IDR | 3,458,931 | | | | 229,000 | | | | 226,010 | | | | 2,990 | | | | — | |
Expiring 12/19/18 | | Barclays Bank PLC | | IDR | 2,191,912 | | | | 142,000 | | | | 143,222 | | | | — | | | | (1,222 | ) |
Expiring 12/19/18 | | Barclays Bank PLC | | IDR | 1,888,210 | | | | 123,000 | | | | 123,376 | | | | — | | | | (376 | ) |
Expiring 12/19/18 | | Citibank NA | | IDR | 1,150,554 | | | | 76,627 | | | | 75,178 | | | | 1,449 | | | | — | |
Expiring 12/19/18 | | JPMorgan Chase | | IDR | 4,179,399 | | | | 276,000 | | | | 273,086 | | | | 2,914 | | | | — | |
Expiring 12/19/18 | | JPMorgan Chase | | IDR | 3,946,815 | | | | 262,000 | | | | 257,889 | | | | 4,111 | | | | — | |
Expiring 12/19/18 | | JPMorgan Chase | | IDR | 3,782,061 | | | | 249,000 | | | | 247,124 | | | | 1,876 | | | | — | |
Expiring 12/19/18 | | JPMorgan Chase | | IDR | 3,760,846 | | | | 249,000 | | | | 245,737 | | | | 3,263 | | | | — | |
Expiring 12/19/18 | | JPMorgan Chase | | IDR | 2,662,434 | | | | 177,000 | | | | 173,966 | | | | 3,034 | | | | — | |
Expiring 12/19/18 | | JPMorgan Chase | | IDR | 2,658,145 | | | | 173,000 | | | | 173,686 | | | | — | | | | (686 | ) |
Expiring 12/19/18 | | JPMorgan Chase | | IDR | 1,986,615 | | | | 131,173 | | | | 129,807 | | | | 1,366 | | | | — | |
Expiring 12/19/18 | | JPMorgan Chase | | IDR | 1,801,637 | | | | 119,274 | | | | 117,721 | | | | 1,553 | | | | — | |
Expiring 12/19/18 | | JPMorgan Chase | | IDR | 1,548,669 | | | | 100,827 | | | | 101,192 | | | | — | | | | (365 | ) |
Expiring 12/19/18 | | JPMorgan Chase | | IDR | 1,387,566 | | | | 90,000 | | | | 90,665 | | | | — | | | | (665 | ) |
Expiring 12/19/18 | | Morgan Stanley | | IDR | 2,237,156 | | | | 147,521 | | | | 146,178 | | | | 1,343 | | | | — | |
Israeli Shekel, | | | | | | | | | | | | | | | | | | | | | | |
Expiring 01/28/19 | | Citibank NA | | ILS | 2,178 | | | | 594,608 | | | | 589,779 | | | | 4,829 | | | | — | |
Malaysian Ringgit, | | | | | | | | | | | | | | | | | | | | | | |
Expiring 12/05/18 | | Barclays Bank PLC | | MYR | 1,493 | | | | 360,755 | | | | 356,440 | | | | 4,315 | | | | — | |
Expiring 12/05/18 | | Barclays Bank PLC | | MYR | 516 | | | | 124,590 | | | | 123,174 | | | | 1,416 | | | | — | |
Mexican Peso, | | | | | | | | | | | | | | | | | | | | | | |
Expiring 12/19/18 | | Barclays Bank PLC | | MXN | 36,965 | | | | 1,945,020 | | | | 1,804,653 | | | | 140,367 | | | | — | |
Expiring 12/19/18 | | Citibank NA | | MXN | 176 | | | | 9,105 | | | | 8,567 | | | | 538 | | | | — | |
Expiring 12/19/18 | | JPMorgan Chase | | MXN | 1,325 | | | | 69,007 | | | | 64,687 | | | | 4,320 | | | | — | |
Expiring 12/19/18 | | JPMorgan Chase | | MXN | 888 | | | | 46,418 | | | | 43,361 | | | | 3,057 | | | | — | |
Expiring 01/29/19 | | UBS AG | | MXN | 3,718 | | | | 190,000 | | | | 180,274 | | | | 9,726 | | | | — | |
New Taiwanese Dollar, | | | | | | | | | | | | | | | | | | | | | | |
Expiring 01/11/19 | | JPMorgan Chase | | TWD | 3,757 | | | | 122,000 | | | | 122,168 | | | | — | | | | (168 | ) |
Expiring 01/11/19 | | Morgan Stanley | | TWD | 4,957 | | | | 161,000 | | | | 161,180 | | | | — | | | | (180 | ) |
Expiring 01/11/19 | | UBS AG | | TWD | 10,740 | | | | 352,925 | | | | 349,188 | | | | 3,737 | | | | — | |
New Zealand Dollar, | | | | | | | | | | | | | | | | | | | | | | |
Expiring 01/18/19 | | Toronto Dominion | | NZD | 227 | | | | 147,606 | | | | 148,068 | | | | — | | | | (462 | ) |
Peruvian Nuevo Sol, | | | | | | | | | | | | | | | | | | | | | | |
Expiring 12/19/18 | | Citibank NA | | PEN | 211 | | | | 63,719 | | | | 62,572 | | | | 1,147 | | | | — | |
See Notes to Financial Statements.
Forward foreign currency exchange contracts outstanding at October 31, 2018 (continued):
| | | | | | | | | | | | | | | | | | | | | | |
Sale Contracts | | Counterparty | | Notional
Amount
(000) | | | Value at
Settlement
Date | | | Current
Value | | | Unrealized
Appreciation | | | Unrealized
Depreciation | |
OTC Forward Foreign Currency Exchange Contracts (cont’d.): | | | | | | | | | |
Peruvian Nuevo Sol (cont’d.), | | | | | | | | | | | | | | | | | | | | |
Expiring 12/19/18 | | JPMorgan Chase | | PEN | 642 | | | $ | 193,000 | | | $ | 190,127 | | | $ | 2,873 | | | $ | — | |
Expiring 12/19/18 | | JPMorgan Chase | | PEN | 307 | | | | 92,000 | | | | 90,812 | | | | 1,188 | | | | — | |
Expiring 12/19/18 | | Morgan Stanley | | PEN | 471 | | | | 142,000 | | | | 139,455 | | | | 2,545 | | | | — | |
Philippine Peso, | | | | | | | | | | | | | | | | | | | | | | |
Expiring 12/14/18 | | Barclays Bank PLC | | PHP | 5,816 | | | | 108,000 | | | | 108,381 | | | | — | | | | (381 | ) |
Expiring 12/14/18 | | Citibank NA | | PHP | 8,618 | | | | 158,000 | | | | 160,589 | | | | — | | | | (2,589 | ) |
Expiring 12/14/18 | | Citibank NA | | PHP | 4,764 | | | | 88,000 | | | | 88,778 | | | | — | | | | (778 | ) |
Expiring 12/14/18 | | JPMorgan Chase | | PHP | 8,974 | | | | 166,000 | | | | 167,219 | | | | — | | | | (1,219 | ) |
Expiring 12/14/18 | | JPMorgan Chase | | PHP | 8,701 | | | | 161,000 | | | | 162,138 | | | | — | | | | (1,138 | ) |
Expiring 12/14/18 | | JPMorgan Chase | | PHP | 8,260 | | | | 151,000 | | | | 153,919 | | | | — | | | | (2,919 | ) |
Expiring 12/14/18 | | Morgan Stanley | | PHP | 27,951 | | | | 512,057 | | | | 520,830 | | | | — | | | | (8,773 | ) |
Russian Ruble, | | | | | | | | | | | | | | | | | | | | | | |
Expiring 12/19/18 | | JPMorgan Chase | | RUB | 8,573 | | | | 127,018 | | | | 129,333 | | | | — | | | | (2,315 | ) |
Singapore Dollar, | | | | | | | | | | | | | | | | | | | | | | |
Expiring 11/09/18 | | Citibank NA | | SGD | 2,145 | | | | 1,569,653 | | | | 1,548,952 | | | | 20,701 | | | | — | |
Expiring 11/09/18 | | Citibank NA | | SGD | 266 | | | | 194,545 | | | | 191,719 | | | | 2,826 | | | | — | |
Expiring 11/09/18 | | Deutsche Bank AG | | SGD | 251 | | | | 181,000 | | | | 181,080 | | | | — | | | | (80 | ) |
Expiring 11/09/18 | | Deutsche Bank AG | | SGD | 205 | | | | 149,000 | | | | 148,214 | | | | 786 | | | | — | |
Expiring 11/09/18 | | Deutsche Bank AG | | SGD | 122 | | | | 88,000 | | | | 87,954 | | | | 46 | | | | — | |
Expiring 11/09/18 | | Goldman Sachs
International | | SGD | 170 | | | | 124,000 | | | | 123,046 | | | | 954 | | | | — | |
Expiring 11/09/18 | | Goldman Sachs
International | | SGD | 145 | | | | 105,000 | | | | 104,468 | | | | 532 | | | | — | |
Expiring 11/09/18 | | Hong Kong &
Shanghai Bank | | SGD | 419 | | | | 306,688 | | | | 302,308 | | | | 4,380 | | | | — | |
Expiring 11/09/18 | | JPMorgan Chase | | SGD | 159 | | | | 116,000 | | | | 114,775 | | | | 1,225 | | | | — | |
Expiring 11/09/18 | | Morgan Stanley | | SGD | 167 | | | | 122,800 | | | | 120,817 | | | | 1,983 | | | | — | |
Expiring 11/09/18 | | Toronto Dominion | | SGD | 847 | | | | 616,347 | | | | 611,311 | | | | 5,036 | | | | — | |
Expiring 11/09/18 | | UBS AG | | SGD | 281 | | | | 203,000 | | | | 202,610 | | | | 390 | | | | — | |
South African Rand, | | | | | | | | | | | | | | | | | | | | | | |
Expiring 11/09/18 | | Citibank NA | | ZAR | 2,615 | | | | 181,807 | | | | 177,064 | | | | 4,743 | | | | — | |
Expiring 12/07/18 | | Barclays Bank PLC | | ZAR | 301 | | | | 19,688 | | | | 20,313 | | | | — | | | | (625 | ) |
Expiring 12/07/18 | | Barclays Bank PLC | | ZAR | 301 | | | | 19,688 | | | | 20,313 | | | | — | | | | (625 | ) |
Expiring 12/07/18 | | Citibank NA | | ZAR | 2,128 | | | | 149,052 | | | | 143,551 | | | | 5,501 | | | | — | |
Expiring 12/07/18 | | Citibank NA | | ZAR | 1,616 | | | | 112,293 | | | | 109,045 | | | | 3,248 | | | | — | |
Expiring 12/07/18 | | Citibank NA | | ZAR | 1,259 | | | | 86,708 | | | | 84,933 | | | | 1,775 | | | | — | |
Expiring 12/07/18 | | Citibank NA | | ZAR | 1,030 | | | | 70,930 | | | | 69,463 | | | | 1,467 | | | | — | |
Expiring 12/07/18 | | Citibank NA | | ZAR | 706 | | | | 48,573 | | | | 47,660 | | | | 913 | | | | — | |
Expiring 12/07/18 | | Goldman Sachs
International | | ZAR | 1,846 | | | | 119,339 | | | | 124,568 | | | | — | | | | (5,229 | ) |
Expiring 12/07/18 | | Goldman Sachs
International | | ZAR | 351 | | | | 22,875 | | | | 23,672 | | | | — | | | | (797 | ) |
See Notes to Financial Statements.
| | | | |
| PGIM Emerging Markets Debt Local Currency Fund | | | 31 | |
Schedule of Investments (continued)
as of October 31, 2018
Forward foreign currency exchange contracts outstanding at October 31, 2018 (continued):
| | | | | | | | | | | | | | | | | | | | | | |
Sale Contracts | | Counterparty | | Notional
Amount
(000) | | | Value at
Settlement
Date | | | Current
Value | | | Unrealized
Appreciation | | | Unrealized
Depreciation | |
OTC Forward Foreign Currency Exchange Contracts (cont’d.): | | | | | | | | | |
South African Rand (cont’d.), | | | | | | | | | | | | | | | | | | | | |
Expiring 12/07/18 | | JPMorgan Chase | | ZAR | 1,884 | | | $ | 121,000 | | | $ | 127,115 | | | $ | — | | | $ | (6,115 | ) |
Expiring 12/07/18 | | JPMorgan Chase | | ZAR | 1,768 | | | | 117,632 | | | | 119,271 | | | | — | | | | (1,639 | ) |
Expiring 12/07/18 | | JPMorgan Chase | | ZAR | 581 | | | | 39,896 | | | | 39,219 | | | | 677 | | | | — | |
South Korean Won, | | | | | | | | | | | | | | | | | | | | | | |
Expiring 01/16/19 | | Barclays Bank PLC | | KRW | 366,178 | | | | 322,337 | | | | 322,231 | | | | 106 | | | | — | |
Expiring 01/16/19 | | Barclays Bank PLC | | KRW | 167,620 | | | | 149,341 | | | | 147,503 | | | | 1,838 | | | | — | |
Expiring 01/16/19 | | Barclays Bank PLC | | KRW | 136,332 | | | | 120,000 | | | | 119,970 | | | | 30 | | | | — | |
Expiring 01/16/19 | | Goldman Sachs
International | | KRW | 162,590 | | | | 144,000 | | | | 143,077 | | | | 923 | | | | — | |
Expiring 01/16/19 | | JPMorgan Chase | | KRW | 170,603 | | | | 150,000 | | | | 150,127 | | | | — | | | | (127 | ) |
Expiring 01/16/19 | | JPMorgan Chase | | KRW | 118,899 | | | | 105,000 | | | | 104,629 | | | | 371 | | | | — | |
Expiring 01/16/19 | | Morgan Stanley | | KRW | 190,562 | | | | 168,000 | | | | 167,692 | | | | 308 | | | | — | |
Swiss Franc, | | | | | | | | | | | | | | | | | | | | | | |
Expiring 01/25/19 | | BNP Paribas | | CHF | 213 | | | | 215,207 | | | | 213,166 | | | | 2,041 | | | | — | |
Expiring 01/25/19 | | Toronto Dominion | | CHF | 213 | | | | 215,414 | | | | 213,166 | | | | 2,248 | | | | — | |
Thai Baht, | | | | | | | | | | | | | | | | | | | | | | |
Expiring 11/09/18 | | Citibank NA | | THB | 5,473 | | | | 165,000 | | | | 165,120 | | | | — | | | | (120 | ) |
Expiring 11/09/18 | | Citibank NA | | THB | 4,889 | | | | 147,000 | | | | 147,524 | | | | — | | | | (524 | ) |
Expiring 11/09/18 | | Citibank NA | | THB | 4,095 | | | | 125,185 | | | | 123,557 | | | | 1,628 | | | | — | |
Expiring 11/09/18 | | Citibank NA | | THB | 3,902 | | | | 120,000 | | | | 117,723 | | | | 2,277 | | | | — | |
Expiring 11/09/18 | | Citibank NA | | THB | 2,270 | | | | 70,244 | | | | 68,500 | | | | 1,744 | | | | — | |
Expiring 11/09/18 | | Citibank NA | | THB | 1,807 | | | | 55,000 | | | | 54,514 | | | | 486 | | | | — | |
Expiring 11/09/18 | | Citibank NA | | THB | 1,692 | | | | 52,454 | | | | 51,052 | | | | 1,402 | | | | — | |
Expiring 11/09/18 | | Citibank NA | | THB | 1,586 | | | | 48,600 | | | | 47,866 | | | | 734 | | | | — | |
Expiring 11/09/18 | | Citibank NA | | THB | 934 | | | | 28,538 | | | | 28,174 | | | | 364 | | | | — | |
Expiring 11/09/18 | | UBS AG | | THB | 851 | | | | 26,223 | | | | 25,683 | | | | 540 | | | | — | |
Turkish Lira, | | | | | | | | | | | | | | | | | | | | | | |
Expiring 12/07/18 | | Goldman Sachs
International | | TRY | 334 | | | | 51,096 | | | | 58,455 | | | | — | | | | (7,359 | ) |
Expiring 12/07/18 | | JPMorgan Chase | | TRY | 756 | | | | 129,900 | | | | 132,103 | | | | — | | | | (2,203 | ) |
Expiring 12/07/18 | | JPMorgan Chase | | TRY | 311 | | | | 49,426 | | | | 54,270 | | | | — | | | | (4,844 | ) |
Expiring 12/07/18 | | JPMorgan Chase | | TRY | 199 | | | | 34,240 | | | | 34,839 | | | | — | | | | (599 | ) |
Expiring 12/07/18 | | Morgan Stanley | | TRY | 2,104 | | | | 332,046 | | | | 367,699 | | | | — | | | | (35,653 | ) |
| | | | | | | | | | | | | | | | | | | | | | |
| | | | | | | | $ | 26,943,931 | | | $ | 26,672,708 | | | | 423,859 | | | | (152,636 | ) |
| | | | | | | | | | | | | | | | | | | | | | |
| | | | | | | | | | | | | | | | $ | 802,023 | | | $ | (463,031 | ) |
| | | | | | | | | | | | | | | | | | | | | | |
See Notes to Financial Statements.
Cross currency exchange contracts outstanding at October 31, 2018:
| | | | | | | | | | | | | | | | | | | | | | |
Settlement | | Type | | Notional
Amount
(000) | | | In Exchange
For (000) | | | Unrealized
Appreciation | | | Unrealized
Depreciation | | | Counterparty | |
OTC Cross Currency Exchange Contract: | |
01/25/19 | | | | | CHF 213 | | | | EUR 187 | | | $ | — | | | $ | (90 | ) | | | Toronto Dominion | |
| | | | | | | | | | | | | | | | | | | | | | |
Interest rate swap agreements outstanding at October 31, 2018:
| | | | | | | | | | | | | | | | | | | | | | | | |
Notional
Amount
(000)# | | | Termination
Date | | | Fixed
Rate | | | Floating Rate | | Value at
Trade Date | | | Value at
October 31,
2018 | | | Unrealized
Appreciaton
(Depreciation) | |
| | Centrally Cleared Interest Rate Swap Agreements: | | | | | | | | | | | | |
| MXN | 14,650 | | | | 06/04/25 | | | | 6.470%(M) | | | 28 Day Mexican
Interbank Rate(2)(M) | | $ | 12 | | | $ | (90,588 | ) | | $ | (90,600 | ) |
| PLN | 3,430 | | | | 09/21/22 | | | | 2.312%(A) | | | 6 Month
WIBOR(2)(S) | | | — | | | | (1,269 | ) | | | (1,269 | ) |
| | | | | | | | | | | | | | | | | | | | | | | | |
| | | | | | | | | | | | | | $ | 12 | | | $ | (91,857 | ) | | $ | (91,869 | ) |
| | | | | | | | | | | | | | | | | | | | | | | | |
| (1) | The Series pays the fixed rate and receives the floating rate. |
| (2) | The Series pays the floating rate and receives the fixed rate. |
Summary of Collateral for Centrally Cleared/Exchange-traded Derivatives:
Cash and securities segregated as collateral to cover requirements for open centrally cleared/exchange-traded derivatives are listed by broker as follows:
| | | | | | | | |
Broker | | Cash and/or
Foreign Currency | | | Securities
Market Value | |
Citigroup Global Markets | | $ | 170,000 | | | $ | — | |
| | | | | | | | |
Fair Value Measurements:
Various inputs are used in determining the value of the Series’ investments. These inputs are summarized in the three broad levels listed below.
Level 1—unadjusted quoted prices generally in active markets for identical securities.
Level 2—quoted prices for similar securities, interest rates and yield curves, prepayment speeds, foreign currency exchange rates and other observable inputs.
Level 3—unobservable inputs for securities valued in accordance with Board approved fair valuation procedures.
The following is a summary of the inputs used as of October 31, 2018 in valuing such portfolio securities:
| | | | | | | | | | | | |
| | | Level 1 | | | Level 2 | | | Level 3 | |
Investments in Securities | | | | | | | | | | | | |
Sovereign Bonds | | | | | | | | | | | | |
Angola | | $ | — | | | $ | 220,220 | | | $ | — | |
Argentina | | | — | | | | 476,860 | | | | — | |
Bahrain | | | — | | | | 201,252 | | | | — | |
See Notes to Financial Statements.
| | | | |
| PGIM Emerging Markets Debt Local Currency Fund | | | 33 | |
Schedule of Investments (continued)
as of October 31, 2018
| | | | | | | | | | | | |
| | | Level 1 | | | Level 2 | | | Level 3 | |
Investments in Securities (continued) | | | | | | | | | | | | |
Sovereign Bonds (continued) | | | | | | | | | | | | |
Brazil | | $ | — | | | $ | 6,666,089 | | | $ | — | |
Chile | | | — | | | | 889,663 | | | | — | |
Colombia | | | — | | | | 2,624,727 | | | | — | |
Czech Republic | | | — | | | | 2,814,112 | | | | — | |
Ecuador | | | — | | | | 267,800 | | | | — | |
Egypt | | | — | | | | 212,231 | | | | — | |
El Salvador | | | — | | | | 125,861 | | | | — | |
Gabon | | | — | | | | 181,708 | | | | — | |
Greece | | | — | | | | 188,288 | | | | — | |
Hungary | | | — | | | | 2,847,133 | | | | — | |
Indonesia | | | — | | | | 5,689,559 | | | | — | |
Iraq | | | — | | | | 272,569 | | | | — | |
Ivory Coast | | | — | | | | 233,650 | | | | — | |
Kenya | | | — | | | �� | 194,582 | | | | — | |
Malaysia | | | — | | | | 3,979,128 | | | | — | |
Mexico | | | — | | | | 5,734,177 | | | | — | |
Nigeria | | | — | | | | 226,656 | | | | — | |
Pakistan | | | — | | | | 381,570 | | | | — | |
Peru | | | — | | | | 2,285,613 | | | | — | |
Philippines | | | — | | | | 83,164 | | | | — | |
Poland | | | — | | | | 2,752,390 | | | | — | |
Romania | | | — | | | | 243,434 | | | | — | |
Russia | | | — | | | | 2,512,025 | | | | — | |
Singapore | | | — | | | | 1,219,424 | | | | — | |
South Africa | | | — | | | | 3,977,933 | | | | — | |
Sri Lanka | | | — | | | | 189,793 | | | | — | |
Thailand | | | — | | | | 2,850,261 | | | | — | |
Turkey | | | — | | | | 2,273,439 | | | | — | |
Ukraine | | | — | | | | 315,042 | | | | — | |
Uruguay | | | — | | | | 146,478 | | | | — | |
Corporate Bonds | | | | | | | | | | | | |
Brazil | | | — | | | | 288,277 | | | | — | |
China | | | — | | | | 353,644 | | | | — | |
Indonesia | | | — | | | | 206,070 | | | | — | |
Jamaica | | | — | | | | 188,588 | | | | — | |
Mexico | | | — | | | | 831,168 | | | | — | |
Russia | | | — | | | | 190,933 | | | | — | |
South Africa | | | — | | | | 225,013 | | | | — | |
Affiliated Mutual Fund | | | 1,473,311 | | | | — | | | | — | |
Other Financial Instruments* | | | | | | | | | | | | |
OTC Forward Foreign Currency Exchange Contracts | | | — | | | | 338,992 | | | | — | |
OTC Cross Currency Exchange Contract | | | — | | | | (90 | ) | | | — | |
Centrally Cleared Interest Rate Swap Agreements | | | — | | | | (91,869 | ) | | | — | |
| | | | | | | | | | | | |
Total | | $ | 1,473,311 | | | $ | 55,807,557 | | | $ | — | |
| | | | | | | | | | | | |
See Notes to Financial Statements.
| * | Other financial instruments are derivative instruments not reflected in the Schedule of Investments, such as futures, forwards and centrally cleared swap contracts, which are recorded at the unrealized appreciation (depreciation) on the instrument, and OTC swap contracts which are recorded at fair value. |
Industry Classification:
The industry classification of investments and other assets in excess of liabilities shown as a percentage of net assets as of October 31, 2018 were as follows (unaudited):
| | | | |
Sovereign Bonds | | | 90.8 | % |
Affiliated Mutual Fund | | | 2.5 | |
Oil & Gas | | | 1.7 | |
Telecommunications | | | 0.9 | |
Chemicals | | | 0.6 | |
Electric | | | 0.4 | |
Banks | | | 0.3 | % |
| | | | |
| | | 97.2 | |
Other assets in excess of liabilities | | | 2.8 | |
| | | | |
| | | 100.0 | % |
| | | | |
Effects of Derivative Instruments on the Financial Statements and Primary Underlying Risk Exposure:
The Series invested in derivative instruments during the reporting period. The primary types of risk associated with these derivative instruments are foreign exchange contracts risk and interest rate contracts risk. The effect of such derivative instruments on the Series’ financial position and financial performance as reflected in the Statement of Assets and Liabilities and Statement of Operations is presented in the summary below.
Fair values of derivative instruments as of October 31, 2018 as presented in the Statement of Assets and Liabilities:
| | | | | | | | | | | | |
| | | Asset Derivatives | | | Liability Derivatives | |
Derivatives not accounted for as hedging instruments, carried at fair value | | Statement of
Assets and
Liabilities Location | | Fair
Value | | | Statement of
Assets and
Liabilities Location | | Fair
Value | |
| Foreign exchange contracts | | — | | $ | — | | | Unrealized depreciation on OTC cross currency exchange contracts | | $ | 90 | |
| Foreign exchange contracts | | Unrealized appreciation on OTC forward foreign currency exchange contracts | | | 802,023 | | | Unrealized depreciation on OTC forward foreign currency exchange contracts | | | 463,031 | |
| Interest rate contracts | | — | | | — | | | Due from/to broker—variation margin swaps | | | 91,869 | * |
| | | | | | | | | | | | |
| | | | $ | 802,023 | | | | | $ | 554,990 | |
| | | | | | | | | | | | |
| * | Includes cumulative appreciation (depreciation) as reported in the schedule of open futures and centrally cleared swap contracts. Only unsettled variation margin receivable (payable) is reported within the Statement of Assets and Liabilities. |
See Notes to Financial Statements.
| | | | |
| PGIM Emerging Markets Debt Local Currency Fund | | | 35 | |
Schedule of Investments (continued)
as of October 31, 2018
The effects of derivative instruments on the Statement of Operations for the year ended October 31, 2018 are as follows:
| | | | | | | | | | | | | | | | |
Amount of Realized Gain (Loss) on Derivatives Recognized in Income | |
Derivatives not accounted for as hedging instruments, carried at fair value | | Options
Purchased(1) | | | Options
Written | | | Forward &
Cross
Currency
Exchange
Contracts | | | Swaps | |
Foreign exchange contracts | | $ | (33,050 | ) | | $ | 52,650 | | | $ | (2,062,827 | ) | | $ | — | |
Interest rate contracts | | | — | | | | — | | | | — | | | | 13,613 | |
| | | | | | | | | | | | | | | | |
Total | | $ | (33,050 | ) | | $ | 52,650 | | | $ | (2,062,827 | ) | | $ | 13,613 | |
| | | | | | | | | | | | | | | | |
| (1) | Included in net realized gain (loss) on investment transactions in the Statement of Operations. |
| | | | | | | | | | | | | | | | |
Change in Unrealized Appreciation (Depreciation) on Derivatives Recognized in Income | |
Derivatives not accounted for as hedging instruments, carried at fair value | | Options
Purchased(2) | | | Options
Written | | | Forward &
Cross
Currency
Exchange
Contracts | | | Swaps | |
Foreign exchange contracts | | $ | (8,301 | ) | | $ | (20,917 | ) | | $ | 510,997 | | | $ | — | |
Interest rate contracts | | | — | | | | — | | | | — | | | | (65,747 | ) |
| | | | | | | | | | | | | | | | |
Total | | $ | (8,301 | ) | | $ | (20,917 | ) | | $ | 510,997 | | | $ | (65,747 | ) |
| | | | | | | | | | | | | | | | |
| (2) | Included in net change in unrealized appreciation (depreciation) on investments in the Statement of Operations. |
For the year ended October 31, 2018, the Series’ average volume of derivative activities is as follows:
| | | | | | | | | | |
Options
Purchased(1) | | | Options
Written(2) | | | Forward
Foreign
Currency
Exchange
Contracts—
Purchased(3) | |
| $ | 54,118 | | | $ | 1,547,552 | | | $ | 33,448,662 | |
| | | | | | | | | | |
Forward
Foreign
Currency
Exchange
Contracts—
Sold(3) | | | Cross
Currency
Exchange
Contracts(4) | | | Interest
Rate
Swap
Agreements(2) | |
| $ | 22,711,340 | | | $ | 398,317 | | | $ | 1,511,078 | |
| (2) | Notional Amount in USD. |
| (3) | Value at Settlement Date. |
See Notes to Financial Statements.
Financial Instruments/Transactions—Summary of Offsetting and Netting Arrangements:
The Series invested in OTC derivatives during the reporting period that are either offset in accordance with current requirements or are subject to enforceable master netting arrangements or similar agreements that permit offsetting. The information about offsetting and related netting arrangements for OTC derivatives where the legal right to set-off exists, is presented in the summary below.
Offsetting of OTC derivative assets and liabilities:
| | | | | | | | | | | | | | | | | | | | |
Counterparty | | Gross
Amounts of
Recognized
Assets(1) | | | Gross
Amounts of
Recognized
Liabilities(1) | | | Net Amounts of
Recognized
Assets/(Liabilities) | | | Collateral
Pledged/
(Received)(2) | | | Net
Amount | |
Bank of America | | $ | — | | | $ | (5,690 | ) | | $ | (5,690 | ) | | $ | — | | | $ | (5,690 | ) |
Barclays Bank PLC | | | 198,019 | | | | (55,599 | ) | | | 142,420 | | | | — | | | | 142,420 | |
BNP Paribas | | | 50,534 | | | | (24,181 | ) | | | 26,353 | | | | — | | | | 26,353 | |
Citibank NA | | | 162,613 | | | | (122,622 | ) | | | 39,991 | | | | — | | | | 39,991 | |
Deutsche Bank AG | | | 13,570 | | | | (9,440 | ) | | | 4,130 | | | | — | | | | 4,130 | |
Goldman Sachs International | | | 16,168 | | | | (67,857 | ) | | | (51,689 | ) | | | — | | | | (51,689 | ) |
Hong Kong & Shanghai Bank | | | 7,792 | | | | (555 | ) | | | 7,237 | | | | — | | | | 7,237 | |
JPMorgan Chase | | | 103,082 | | | | (84,863 | ) | | | 18,219 | | | | — | | | | 18,219 | |
Morgan Stanley | | | 55,930 | | | | (46,939 | ) | | | 8,991 | | | | — | | | | 8,991 | |
Toronto Dominion | | | 164,719 | | | | (3,388 | ) | | | 161,331 | | | | — | | | | 161,331 | |
UBS AG | | | 29,596 | | | | (41,987 | ) | | | (12,391 | ) | | | — | | | | (12,391 | ) |
| | | | | | | | | | | | | | | | | | | | |
| | $ | 802,023 | | | $ | (463,121 | ) | | $ | 338,902 | | | $ | — | | | $ | 338,902 | |
| | | | | | | | | | | | | | | | | | | | |
| (1) | Includes unrealized appreciation/(depreciation) on swaps and forwards, premiums paid/(received) on swap agreements and market value of purchased and written options, as represented on the Statement of Assets and Liabilities. |
| (2) | Collateral amount disclosed by the Series is limited to the market value of financial instruments/transactions and the Series’ OTC derivative exposure by counterparty. |
See Notes to Financial Statements.
| | | | |
| PGIM Emerging Markets Debt Local Currency Fund | | | 37 | |
Statement of Assets & Liabilities
as of October 31, 2018
| | | | |
Assets | | | | |
Investments at value: | | | | |
Unaffiliated investments (cost $62,493,276) | | $ | 55,560,524 | |
Affiliated investments (cost $1,473,311) | | | 1,473,311 | |
Foreign currency, at value (cost $229,980) | | | 227,739 | |
Interest receivable | | | 1,032,949 | |
Unrealized appreciation on OTC forward foreign currency exchange contracts | | | 802,023 | |
Deposit with broker for centrally cleared/exchange-traded derivatives | | | 170,000 | |
Receivable for Series shares sold | | | 144,243 | |
Tax reclaim receivable | | | 43,409 | |
Receivable for investments sold | | | 35 | |
Prepaid expenses | | | 939 | |
| | | | |
Total Assets | | | 59,455,172 | |
| | | | |
| |
Liabilities | | | | |
Unrealized depreciation on OTC forward foreign currency exchange contracts | | | 463,031 | |
Payable for Series shares reacquired | | | 163,678 | |
Payable for investments purchased | | | 75,259 | |
Custodian and accounting fees payable | | | 40,279 | |
Accrued expenses and other liabilities | | | 18,105 | |
Due to broker—variation margin swaps | | | 5,507 | |
Management fee payable | | | 1,193 | |
Distribution fee payable | | | 1,153 | |
Payable to custodian | | | 935 | |
Affiliated transfer agent fee payable | | | 672 | |
Dividends payable | | | 562 | |
Unrealized depreciation on OTC cross currency exchange contracts | | | 90 | |
| | | | |
Total Liabilities | | | 770,464 | |
| | | | |
| |
Net Assets | | $ | 58,684,708 | |
| | | | |
| | | | | |
Net assets were comprised of: | | | | |
Common stock, at par | | $ | 105,414 | |
Paid-in capital in excess of par | | | 69,876,857 | |
Total distributable earnings (loss) | | | (11,297,563 | ) |
| | | | |
Net assets, October 31, 2018 | | $ | 58,684,708 | |
| | | | |
See Notes to Financial Statements.
| | | | |
Class A | | | | |
Net asset value and redemption price per share,
($ 3,145,662 ÷ 570,211 shares of common stock issued and outstanding) | | $ | 5.52 | |
Maximum sales charge (4.50% of offering price) | | | 0.26 | |
| | | | |
Maximum offering price to public | | $ | 5.78 | |
| | | | |
| |
Class C | | | | |
Net asset value, offering price and redemption price per share,
($ 537,983 ÷ 96,790 shares of common stock issued and outstanding) | | $ | 5.56 | |
| | | | |
| |
Class Z | | | | |
Net asset value, offering price and redemption price per share,
($ 55,000,167 ÷ 9,874,282 shares of common stock issued and outstanding) | | $ | 5.57 | |
| | | | |
| |
Class R6 | | | | |
Net asset value, offering price and redemption price per share,
($ 896 ÷ 161 shares of common stock issued and outstanding) | | $ | 5.56 | |
| | | | |
See Notes to Financial Statements.
| | | | |
| PGIM Emerging Markets Debt Local Currency Fund | | | 39 | |
Statement of Operations
Year Ended October 31, 2018
| | | | |
Net Investment Income (Loss) | | | | |
Income | | | | |
Interest income (net of $94,350 foreign withholding tax) | | $ | 3,449,900 | |
Affiliated dividend income | | | 24,046 | |
Income from securities lending, net (including affiliated income of $409) | | | 509 | |
| | | | |
Total income | | | 3,474,455 | |
| | | | |
| |
Expenses | | | | |
Management fee | | | 435,377 | |
Distribution fee(a) | | | 16,986 | |
Custodian and accounting fees | | | 154,510 | |
Registration fees(a) | | | 64,325 | |
Audit fee | | | 64,197 | |
Shareholders’ reports | | | 29,646 | |
Transfer agent’s fees and expenses (including affiliated expense of $3,216)(a) | | | 23,572 | |
Legal fees and expenses | | | 18,609 | |
Directors’ fees | | | 13,273 | |
Miscellaneous | | | 15,829 | |
| | | | |
Total expenses | | | 836,324 | |
Less: Fee waiver and/or expense reimbursement(a) | | | (340,226 | ) |
| | | | |
Net expenses | | | 496,098 | |
| | | | |
Net investment income (loss) | | | 2,978,357 | |
| | | | |
| |
Realized And Unrealized Gain (Loss) On Investment And Foreign Currency Transactions | | | | |
Net realized gain (loss) on: | | | | |
Investment transactions (including affiliated of $267) | | | (3,334,038 | ) |
Forward and cross currency contract transactions | | | (2,062,827 | ) |
Options written transactions | | | 52,650 | |
Swap agreement transactions | | | 13,613 | |
Foreign currency transactions | | | (340,644 | ) |
| | | | |
| | | (5,671,246 | ) |
| | | | |
Net change in unrealized appreciation (depreciation) on: | | | | |
Investments (net of change in foreign capital gains taxes $21,602) | | | (5,921,095 | ) |
Forward and cross currency contracts | | | 510,997 | |
Options written | | | (20,917 | ) |
Swap agreements | | | (65,747 | ) |
Foreign currencies | | | (31,389 | ) |
| | | | |
| | | (5,528,151 | ) |
| | | | |
Net gain (loss) on investment and foreign currency transactions | | | (11,199,397 | ) |
| | | | |
Net Increase (Decrease) In Net Assets Resulting From Operations | | $ | (8,221,040 | ) |
| | | | |
See Notes to Financial Statements.
| (a) | Class specific expenses and waivers were as follows: |
| | | | | | | | | | | | | | | | |
| | | Class A | | | Class C | | | Class Z | | | Class R6 | |
Distribution fee | | | 10,262 | | | | 6,724 | | | | — | | | | — | |
Registration fees | | | 15,564 | | | | 15,564 | | | | 17,633 | | | | 15,564 | |
Transfer agent’s fees and expenses | | | 6,123 | | | | 1,220 | | | | 16,194 | | | | 35 | |
Fee waiver and/or expense reimbursement | | | (42,164 | ) | | | (20,232 | ) | | | (262,227 | ) | | | (15,603 | ) |
See Notes to Financial Statements.
| | | | |
| PGIM Emerging Markets Debt Local Currency Fund | | | 41 | |
Statements of Changes in Net Assets
| | | | | | | | |
| | | Year Ended October 31, | |
| | | 2018 | | | 2017 | |
Increase (Decrease) in Net Assets | | | | | | | | |
Operations | | | | | | | | |
Net investment income (loss) | | $ | 2,978,357 | | | $ | 1,701,413 | |
Net realized gain (loss) on investment and foreign currency transactions | | | (5,671,246 | ) | | | (532,379 | ) |
Net change in unrealized appreciation (depreciation) on investments and foreign currencies | | | (5,528,151 | ) | | | 488,486 | |
| | | | | | | | |
Net increase (decrease) in net assets resulting from operations | | | (8,221,040 | ) | | | 1,657,520 | |
| | | | | | | | |
| | |
Dividends and Distributions | | | | | | | | |
Tax return of capital distributions | | | | | | | | |
Class A | | | (233,404 | ) | | | (127,487 | ) |
Class C | | | (32,950 | ) | | | (19,611 | ) |
Class Z | | | (2,899,199 | ) | | | (950,614 | ) |
Class R6 | | | (60 | ) | | | (35 | ) |
| | | | | | | | |
| | | (3,165,613 | ) | | | (1,097,747 | ) |
| | | | | | | | |
Dividends from net investment income | | | | | | | | |
Class A | | | | | | | (85,906 | ) |
Class C | | | | | | | (13,215 | ) |
Class Z | | | | | | | (640,570 | ) |
Class R6 | | | | | | | (23 | ) |
| | | | | | | | |
| | | * | | | | (739,714 | ) |
| | | | | | | | |
| | |
Series share transactions (Net of share conversions) | | | | | | | | |
Net proceeds from shares sold | | | 50,204,752 | | | | 7,471,777 | |
Net asset value of shares issued in reinvestment of dividends and distributions | | | 3,154,838 | | | | 1,804,721 | |
Cost of shares reacquired | | | (14,112,150 | ) | | | (10,512,516 | ) |
| | | | | | | | |
Net increase (decrease) in net assets from Series share transactions | | | 39,247,440 | | | | (1,236,018 | ) |
| | | | | | | | |
Total increase (decrease) | | | 27,860,787 | | | | (1,415,959 | ) |
| | |
Net Assets: | | | | | | | | |
Beginning of year | | | 30,823,921 | | | | 32,239,880 | |
| | | | | | | | |
End of year(a) | | $ | 58,684,708 | | | $ | 30,823,921 | |
| | | | | | | | |
(a) Includes undistributed/(distributions in excess of) net investment income of: | | $ | * | | | $ | (380,602 | ) |
| | | | | | | | |
| * | For the year ended October 31, 2018, the Series has adopted amendments to Regulation S-X (refer to Note 9). |
See Notes to Financial Statements.
Notes to Financial Statements
Prudential World Fund, Inc. (the “Fund”) is registered under the Investment Company Act of 1940, as amended (“1940 Act”), as an open-end management investment company and currently consists of seven series: PGIM Jennison Emerging Markets Equity Opportunities Fund (formerly known as Prudential Jennison Emerging Markets Equity Fund), PGIM Jennison Global Opportunities Fund, PGIM Jennison International Opportunities Fund and PGIM QMA International Equity Fund, each of which are diversified funds and PGIM Jennison Global Infrastructure Fund, PGIM Emerging Markets Debt Hard Currency Fund and PGIM Emerging Markets Debt Local Currency Fund, each of which are non-diversified funds for purposes of the 1940 Act. These financial statements relate only to the PGIM Emerging Markets Debt Local Currency Fund (the “Series”). Effective June 11, 2018, the names of the Series and the other series which comprise the Fund were changed by replacing “Prudential” with “PGIM” and each series’ Class Q shares were renamed Class R6 shares.
The investment objective of the Series is total return, through a combination of current income and capital appreciation.
1. Accounting Policies
The Series follows the investment company accounting and reporting guidance of the Financial Accounting Standards Board (“FASB”) Accounting Standard Codification (“ASC”) Topic 946 Financial Services — Investment Companies. The following accounting policies conform to U.S. generally accepted accounting principles. The Series consistently follows such policies in the preparation of its financial statements.
Securities Valuation: The Series holds securities and other assets and liabilities that are fair valued at the close of each day (generally, 4:00 PM Eastern time) the New York Stock Exchange (“NYSE”) is open for trading. Fair value is the price that would be received to sell an asset or paid to transfer a liability in an orderly transaction between market participants on the measurement date. The Fund’s Board of Directors (the “Board”) has adopted valuation procedures for security valuation under which fair valuation responsibilities have been delegated to PGIM Investments LLC (“PGIM Investments” or the “Manager”). Pursuant to the Board’s delegation, a Valuation Committee has been established as two persons, being one or more officers of the Fund, including: the Fund’s Treasurer (or the Treasurer’s direct reports); and the Fund’s Chief or Deputy Chief Compliance Officer (or Vice-President-level direct reports of the Chief or Deputy Chief Compliance Officer). Under the current valuation procedures, the Valuation Committee of the Board is responsible for supervising the valuation of portfolio securities and other assets and liabilities. The valuation procedures permit the Series to utilize independent pricing vendor services, quotations from market makers, and alternative valuation methods when market quotations are either not readily available or not deemed representative of fair value. A record of the Valuation
| | | | |
| PGIM Emerging Markets Debt Local Currency Fund | | | 43 | |
Notes to Financial Statements (continued)
Committee’s actions is subject to the Board’s review, approval, and ratification at its next regularly scheduled quarterly meeting.
For the fiscal reporting period-end, securities and other assets and liabilities were fair valued at the close of the last U.S. business day. Trading in certain foreign securities may occur when the NYSE is closed (including weekends and holidays). Because such foreign securities trade in markets that are open on weekends and U.S. holidays, the values of some of the Series’ foreign investments may change on days when investors cannot purchase or redeem Series shares.
Various inputs determine how the Series’ investments are valued, all of which are categorized according to the three broad levels (Level 1, 2, or 3) detailed in the Schedule of Investments and referred to herein as the “fair value hierarchy” in accordance with FASB ASC Topic 820—Fair Value Measurements and Disclosures.
Investments in open-end, non-exchange-traded mutual funds are valued at their net asset values as of the close of the NYSE on the date of valuation. These securities are classified as Level 1 in the fair value hierarchy since they may be purchased or sold at their net asset values on the date of valuation.
Fixed income securities traded in the OTC market are generally classified as Level 2 in the fair value hierarchy. Such fixed income securities are typically valued using the market approach which generally involves obtaining data from an approved independent third-party vendor source. The Series utilizes the market approach as the primary method to value securities when market prices of identical or comparable instruments are available. The third-party vendors’ valuation techniques used to derive the evaluated bid price are based on evaluating observable inputs, including but not limited to, yield curves, yield spreads, credit ratings, deal terms, tranche level attributes, default rates, cash flows, prepayment speeds, broker/dealer quotations and reported trades. Certain Level 3 securities are also valued using the market approach when obtaining a single broker quote or when utilizing transaction prices for identical securities that have been used in excess of five business days. During the reporting period, there were no changes to report with respect to the valuation approach and/or valuation techniques discussed above.
OTC derivative instruments are generally classified as Level 2 in the fair value hierarchy. Such derivative instruments are typically valued using the market approach and/or income approach which generally involves obtaining data from an approved independent third-party vendor source. The Series utilizes the market approach when quoted prices in broker-dealer markets are available but also includes consideration of alternative valuation approaches, including the income approach. In the absence of reliable market quotations, the income approach is typically utilized for purposes of valuing OTC derivatives such as interest rate
swaps based on a discounted cash flow analysis whereby the value of the instrument is equal to the present value of its future cash inflows or outflows. Such analysis includes projecting future cash flows and determining the discount rate (including the present value factors that affect the discount rate) used to discount the future cash flows. In addition, the third-party vendors’ valuation techniques used to derive the evaluated OTC derivative price is based on evaluating observable inputs, including but not limited to, underlying asset prices, indices, spreads, interest rates and exchange rates. Certain OTC derivatives may be classified as Level 3 when valued using the market approach by obtaining a single broker quote or when utilizing unobservable inputs in the income approach. During the reporting period, there were no changes to report with respect to the valuation approach and/or valuation techniques discussed above.
Centrally cleared swaps listed or traded on a multilateral or trade facility platform, such as a registered exchange, are generally valued at the daily settlement price determined by the respective exchange. These securities are classified as Level 2 in the fair value hierarchy, as the daily settlement price is not public.
Securities and other assets that cannot be priced according to the methods described above are valued based on pricing methodologies approved by the Board. In the event that unobservable inputs are used when determining such valuations, the securities will be classified as Level 3 in the fair value hierarchy.
When determining the fair value of securities, some of the factors influencing the valuation include: the nature of any restrictions on disposition of the securities; assessment of the general liquidity of the securities; the issuer’s financial condition and the markets in which it does business; the cost of the investment; the size of the holding and the capitalization of the issuer; the prices of any recent transactions or bids/offers for such securities or any comparable securities; any available analyst media or other reports or information deemed reliable by the Manager regarding the issuer or the markets or industry in which it operates. Using fair value to price securities may result in a value that is different from a security’s most recent closing price and from the price used by other unaffiliated mutual funds to calculate their net asset values.
Restricted and Illiquid Securities: Subject to guidelines adopted by the Board, the Series may invest up to 15% of its net assets in illiquid securities, including those which are restricted as to disposition under securities law (“restricted securities”). Restricted securities are valued pursuant to the valuation procedures noted above. Illiquid securities are those that, because of the absence of a readily available market or due to legal or contractual restrictions on resale, cannot be sold within seven days in the ordinary course of business at approximately the amount at which the Series has valued the investment. Therefore, the Series may find it difficult to sell illiquid securities at the time considered most advantageous by its subadviser and may incur transaction costs that would not be incurred in the sale of securities that were freely marketable. Certain securities that would otherwise be considered illiquid because of legal restrictions on resale to the general public may be traded among qualified institutional buyers under Rule 144A of the Securities Act of 1933. These
| | | | |
| PGIM Emerging Markets Debt Local Currency Fund | | | 45 | |
Notes to Financial Statements (continued)
Rule 144A securities, as well as commercial paper that is sold in private placements under Section 4(2) of the Securities Act, may be deemed liquid by the Series’ subadviser under the guidelines adopted by the Board of the Fund. However, the liquidity of the Series’ investments in Rule 144A securities could be impaired if trading does not develop or declines.
Foreign Currency Translation: The books and records of the Series are maintained in U.S. dollars. Foreign currency amounts are translated into U.S. dollars on the following basis:
(i) market value of investment securities, other assets and liabilities—at the current rates of exchange;
(ii) purchases and sales of investment securities, income and expenses—at the rates of exchange prevailing on the respective dates of such transactions.
Although the net assets of the Series are presented at the foreign exchange rates and market values at the close of the period, the Series does not generally isolate that portion of the results of operations arising as a result of changes in the foreign exchange rates from the fluctuations arising from changes in the market prices of long-term portfolio securities held at the end of the period. Similarly, the Series does not isolate the effect of changes in foreign exchange rates from the fluctuations arising from changes in the market prices of long-term portfolio securities sold during the period. Accordingly, holding period realized foreign currency gains (losses) are included in the reported net realized gains (losses) on investment transactions. Notwithstanding the above, the Series does isolate the effect of fluctuations in foreign currency exchange rates when determining the gain (loss) upon the sale or maturity of foreign currency denominated debt obligations; such amounts are included in net realized gains (losses) on foreign currency transactions.
Additionally, net realized gains (losses) on foreign currency transactions represent net foreign exchange gains (losses) from the disposition of holdings of foreign currencies, currency gains (losses) realized between the trade and settlement dates on securities transactions, and the difference between the amounts of interest, dividends and foreign withholding taxes recorded on the Series’ books and the U.S. dollar equivalent amounts actually received or paid. Net unrealized currency gains (losses) arise from valuing foreign currency denominated assets and liabilities (other than investments) at period end exchange rates.
Forward and Cross Currency Contracts: A forward currency contract is a commitment to purchase or sell a foreign currency at a future date at a negotiated forward rate. The Series enters into forward currency contracts in order to hedge its exposure to changes in foreign currency exchange rates on its foreign portfolio holdings or specific receivables and
payables denominated in a foreign currency and to gain exposure to certain currencies. The contracts are valued daily at current forward exchange rates and any unrealized gain (loss) is included in net unrealized appreciation (depreciation) on investments and foreign currencies. Gain (loss) is realized on the settlement date of the contract equal to the difference between the settlement value of the original and negotiated forward contracts. This gain (loss), if any, is included in net realized gain (loss) on forward and cross currency contract transactions. Risks may arise upon entering into these contracts from the potential inability of the counterparties to meet the terms of their contracts. Forward currency contracts involve risks from currency exchange rate and credit risk in excess of the amounts reflected on the Statement of Assets and Liabilities. The Series’ maximum risk of loss from counterparty credit risk is the net value of the cash flows to be received from the counterparty at the end of the contract’s life. A cross currency contract is a forward contract where a specified amount of one foreign currency will be exchanged for a specified amount of another foreign currency.
Options: The Series purchased or wrote options in order to hedge against adverse market movements or fluctuations in value caused by changes in prevailing interest rates, value of equities or foreign currency exchange rates with respect to securities or financial instruments which the Series currently owns or intends to purchase. The Series may also use options to gain additional market exposure. The Series’ principal reason for writing options is to realize, through receipt of premiums, a greater current return than would be realized on the underlying security alone. When the Series purchases an option, it pays a premium and an amount equal to that premium is recorded as an asset. When the Series writes an option, it receives a premium and an amount equal to that premium is recorded as a liability. The asset or liability is adjusted daily to reflect the current market value of the option. If an option expires unexercised, the Series realizes a gain (loss) to the extent of the premium received or paid. If an option is exercised, the premium received or paid is recorded as an adjustment to the proceeds from the sale or the cost of the purchase in determining whether the Series has realized a gain (loss). The difference between the premium and the amount received or paid at the closing of a purchase or sale transaction is also treated as a realized gain (loss). Gain (loss) on purchased options is included in net realized gain (loss) on investment transactions. Gain (loss) on written options is presented separately as net realized gain (loss) on options written transactions.
The Series, as writer of an option, may have no control over whether the underlying securities or financial instruments may be sold (called) or purchased (put). As a result, the Series bears the market risk of an unfavorable change in the price of the security or financial instrument underlying the written option. The Series, as purchaser of an OTC option, bears the risk of the potential inability of the counterparties to meet the terms of their contracts. With exchange-traded options contracts, there is minimal counterparty credit risk to the Series since the exchanges’ clearinghouse acts as counterparty to all exchange-traded options and guarantees the options contracts against default.
When the Series writes an option on a swap, an amount equal to any premium received by the Series is recorded as a liability and is subsequently adjusted to the current market value
| | | | |
| PGIM Emerging Markets Debt Local Currency Fund | | | 47 | |
Notes to Financial Statements (continued)
of the written option on the swap. If a call option on a swap is exercised, the Series becomes obligated to pay a fixed interest rate (noted as the strike price) and receive a variable interest rate on a notional amount. If a put option on a swap is exercised, the Series becomes obligated to pay a variable interest rate and receive a fixed interest rate (noted as the strike price) on a notional amount. Premiums received from writing options on swaps that expire or are exercised are treated as realized gains upon the expiration or exercise of such options on swaps. The risk associated with writing put and call options on swaps is that the Series will be obligated to be party to a swap agreement if an option on a swap is exercised.
Swap Agreements: The Series may enter into credit default, interest rate and other types of swap agreements. A swap agreement is an agreement to exchange the return generated by one instrument for the return generated by another instrument. Swap agreements are negotiated in the OTC market and may be executed either directly with counterparty (“OTC-traded”) or through a central clearing facility, such as a registered exchange. Swap agreements are valued daily at current market value and any change in value is included in the net unrealized appreciation (depreciation) on swap agreements. Centrally cleared swaps pay or receive an amount known as “variation margin”, based on daily changes in the valuation of the swap contract. Any upfront premiums paid and received are shown as swap premiums paid and swap premiums received in the Statement of Assets and Liabilities. Risk of loss may exceed amounts recognized on the Statement of Assets and Liabilities. Swap agreements outstanding at period end, if any, are listed on the Schedule of Investments.
Interest Rate Swaps: Interest rate swaps represent an agreement between counterparties to exchange cash flows based on the difference between two interest rates, applied to a notional principal amount for a specified period. The Series is subject to interest rate risk exposure in the normal course of pursuing its investment objective. The Series used interest rate swaps to maintain its ability to generate steady cash flow by receiving a stream of fixed-rate payments and to increase exposure to prevailing market rates by receiving floating rate payments. The Series’ maximum risk of loss from counterparty credit risk is the discounted net present value of the cash flows to be received from the counterparty over the contract’s remaining life.
Master Netting Arrangements: The Fund, on behalf of the Series, is subject to various Master Agreements, or netting arrangements, with select counterparties. These are agreements which a subadviser may have negotiated and entered into on behalf of the Series. A master netting arrangement between the Series and the counterparty permits the Series to offset amounts payable by the Series to the same counterparty against amounts to be received; and by the receipt of collateral from the counterparty by the Series to cover the Series’ exposure to the counterparty. However, there is no assurance that such mitigating factors are easily enforceable. In addition to master netting arrangements, the right to set-off exists when all the conditions are met such that each of the parties owes the other
determinable amounts, the reporting party has the right to set-off the amount owed with the amount owed by the other party, the reporting party intends to set-off and the right of set-off is enforceable by law. During the reporting period, there was no intention to settle on a net basis and all amounts are presented on a gross basis on the Statement of Assets and Liabilities.
The Fund, on behalf of the Series, is a party to International Swaps and Derivatives Association, Inc. (“ISDA”) Master Agreements with certain counterparties that govern OTC derivative and foreign exchange contracts entered into from time to time. The Master Agreements may contain provisions regarding, among other things, the parties’ general obligations, representations, agreements, collateral requirements, events of default and early termination. With respect to certain counterparties, in accordance with the terms of the Master Agreements, collateral posted to the Series is held in a segregated account by the Series’ custodian and with respect to those amounts which can be sold or re-pledged, is presented in the Schedule of Investments. Collateral pledged by the Series is segregated by the Series’ custodian and identified in the Schedule of Investments. Collateral can be in the form of cash or debt securities issued by the U.S. Government or related agencies or other securities as agreed to by the Series and the applicable counterparty. Collateral requirements are determined based on the Series’ net position with each counterparty. Termination events applicable to the Series may occur upon a decline in the Series’ net assets below a specified threshold over a certain period of time. Termination events applicable to counterparties may occur upon a decline in the counterparty’s long-term and short-term credit ratings below a specified level. In each case, upon occurrence, the other party may elect to terminate early and cause settlement of all derivative and foreign exchange contracts outstanding, including the payment of any losses and costs resulting from such early termination, as reasonably determined by the terminating party. Any decision by one or more of the Series’ counterparties to elect early termination could impact the Series’ future derivative activity.
In addition to each instrument’s primary underlying risk exposure (e.g. interest rate, credit, equity or foreign exchange, etc.), swap agreements involve, to varying degrees, elements of credit, market and documentation risk. Such risks involve the possibility that no liquid market for these agreements will exist, the counterparty to the agreement may default on its obligation to perform or disagree on the contractual terms of the agreement, and changes in net interest rates will be unfavorable. In connection with these agreements, securities in the portfolio may be identified or received as collateral from the counterparty in accordance with the terms of the respective swap agreements to provide or receive assets of value and to serve as recourse in the event of default or bankruptcy/insolvency of either party. Such OTC derivative agreements include conditions which, when materialized, give the counterparty the right to cause an early termination of the transactions under those agreements. Any election by the counterparty for early termination of the contract(s) may impact the amounts reported on financial statements.
As of October 31, 2018, the Series has not met conditions under such agreements which give the counterparty the right to call for an early termination.
| | | | |
| PGIM Emerging Markets Debt Local Currency Fund | | | 49 | |
Notes to Financial Statements (continued)
Forward currency contracts, forward rate agreements, written options, short sales, swaps and financial futures contracts involve elements of both market and credit risk in excess of the amounts reflected on the Statement of Assets and Liabilities. Such risks may be mitigated by engaging in master netting arrangements.
Securities Lending: The Series lends its portfolio securities to banks and broker-dealers. The loans are secured by collateral at least equal to the market value of the securities loaned. Collateral pledged by each borrower is invested in an affiliated money market fund and is marked to market daily, based on the previous day’s market value, such that the value of the collateral exceeds the value of the loaned securities. In the event of significant appreciation in value of securities on loan on the last business day of the reporting period, the financial statements may reflect a collateral value that is less than the market value of the loaned securities. Such shortfall is remedied as described above. Loans are subject to termination at the option of the borrower or the Series. Upon termination of the loan, the borrower will return to the Series securities identical to the loaned securities. Should the borrower of the securities fail financially, the Series has the right to repurchase the securities in the open market using the collateral.
The Series recognizes income, net of any rebate and securities lending agent fees, for lending its securities in the form of fees or interest on the investment of any cash received as collateral. The borrower receives all interest and dividends from the securities loaned and such payments are passed back to the lender in amounts equivalent thereto. The Series also continues to recognize any unrealized gain (loss) in the market price of the securities loaned and on the change in the value of the collateral invested that may occur during the term of the loan. In addition, realized gain (loss) is recognized on changes in the value of the collateral invested upon liquidation of the collateral. Net earnings from securities lending are disclosed on the Statement of Operations as “Income from securities lending, net”.
Securities Transactions and Net Investment Income: Securities transactions are recorded on the trade date. Realized gains (losses) from investment and currency transactions are calculated on the specific identification method. Dividend income is recorded on the ex-date. Interest income, including amortization of premium and accretion of discount on debt securities, as required, is recorded on the accrual basis. Expenses are recorded on an accrual basis, which may require the use of certain estimates by management that may differ from actual. Net investment income or loss (other than class specific expenses and waivers, which are allocated as noted below) and unrealized and realized gains (losses) are allocated daily to each class of shares based upon the relative proportion of adjusted net assets of each class at the beginning of the day. Class specific expenses and waivers, where applicable, are charged to the respective share classes. Class specific expenses include
distribution fees and distribution fee waivers, shareholder servicing fees, transfer agent’s fees and expenses, registration fees and fee waivers and/or expense reimbursements, as applicable.
Taxes: It is the Series’ policy to continue to meet the requirements of the Internal Revenue Code applicable to regulated investment companies and to distribute all of its taxable net investment income and capital gains, if any, to its shareholders. Therefore, no federal income tax provision is required. Withholding taxes on foreign dividends, interest and capital gains, if any, are recorded, net of reclaimable amounts, at the time the related income is earned.
Dividends and Distributions: The Series expects to declare dividends of its net investment income daily and pay such dividends monthly. Distributions of net realized capital and currency gains, if any, are declared and paid at least annually. Dividends and distributions to shareholders, which are determined in accordance with federal income tax regulations and which may differ from generally accepted accounting principles, are recorded on the ex-date. Permanent book/tax differences relating to income and gain (loss) are reclassified amongst total distributable earnings (loss) and paid-in capital in excess of par, as appropriate.
Estimates: The preparation of financial statements requires management to make estimates and assumptions that affect the reported amounts and disclosures in the financial statements. Actual results could differ from those estimates.
2. Agreements
The Fund, on behalf of the Series, has a management agreement with PGIM Investments. Pursuant to this agreement, PGIM Investments has responsibility for all investment advisory services and supervises the subadviser’s performance of such services. In addition, under the management agreement, PGIM Investments provides all of the administrative functions necessary for the organization, operation and management of the Series. PGIM Investments administers the corporate affairs of the Series and, in connection therewith, furnishes the Series with office facilities, together with those ordinary clerical and bookkeeping services which are not being furnished by the Series’ custodian and the Series’ transfer agent. PGIM Investments is also responsible for the staffing and management of dedicated groups of legal, marketing, compliance and related personnel necessary for the operation of the Series. The legal, marketing, compliance and related personnel are also responsible for the management and oversight of the various service providers to the Series, including, but not limited to, the custodian, transfer agent, and accounting agent.
PGIM Investments has entered into a subadvisory agreement with PGIM, Inc., which provides subadvisory services to the Series through its PGIM Fixed Income unit. The subadvisory agreement provides that PGIM, Inc. will furnish investment advisory services in connection with the management of the Series. In connection therewith, PGIM, Inc. is obligated to keep certain books and records of the Series. PGIM Investments pays for the
| | | | |
| PGIM Emerging Markets Debt Local Currency Fund | | | 51 | |
Notes to Financial Statements (continued)
services of PGIM, Inc., the cost of compensation of officers of the Series, occupancy and certain clerical and bookkeeping costs of the Series. The Series bears all other costs and expenses.
The management fee paid to PGIM Investments is accrued daily and payable monthly at an annual rate of 0.800% of the Series’ average daily net assets up to and including $1 billion; 0.78% on the next $2 billion of average daily net assets; 0.76% on the next $2 billion of average daily net assets; 0.75% on the next $5 billion of average daily net assets; and 0.740% on average daily net assets exceeding $10 billion. The effective management fee rate before any waivers and/or expense reimbursements was 0.800% for the year ended October 31, 2018.
PGIM Investments has contractually agreed, through February 28, 2019, to limit total annual operating expenses after fee waivers and/or expense reimbursements to 1.13% of average daily net assets for Class A shares, 1.88% of average daily net assets for Class C shares, 0.88% of average daily net assets for Class Z shares, and 0.88% of average daily net assets for Class R6 shares. This contractual waiver excludes interest, brokerage, taxes (such as income and foreign withholding taxes, stamp duty and deferred tax expenses), acquired fund fees and expenses, extraordinary expenses, and certain other Series expenses such as dividend and interest expense and broker charges on short sales. Expenses waived/reimbursed by the Manager in accordance with this agreement may be recouped by the Manager within the same fiscal year during which such waiver/reimbursement is made if such recoupment can be realized without exceeding the expense limit in effect at the time of the recoupment for that fiscal year. Effective November 1, 2018 this waiver agreement was extended through February 29, 2020.
Where applicable, PGIM Investments voluntarily agreed through October 31, 2018, to waive management fees or shared operating expenses on any share class to the same extent that it waives similar expenses on any other share class and, in addition, total annual operating expenses for Class R6 shares will not exceed total annual operating expenses for Class Z shares. Effective November 1, 2018 this voluntary agreement became part of the Series’ contractual waiver agreement through February 29, 2020 and is subject to recoupment by the Manager within the same fiscal year during which such wavier/reimbursement is made if such recoupment can be realized without exceeding the expense limit in effect at the time of the recoupment for that fiscal year.
The Fund, on behalf of the Series, has a distribution agreement with Prudential Investment Management Services LLC (“PIMS”), which acts as the distributor of the Class A, Class C, Class Z and Class R6 shares of the Series. The Series compensates PIMS for distributing and servicing the Series’ Class A and Class C shares, pursuant to the plans of distribution (the “Distribution Plans”), regardless of expenses actually incurred by PIMS. The
distribution fees are accrued daily and payable monthly. No distribution or service fees are paid to PIMS as distributor of the Class Z or Class R6 shares of the Series.
Pursuant to the Distribution Plans, the Series compensates PIMS for distribution related activities at an annual rate of up to 0.25% and 1% of the average daily net assets of the Class A and Class C shares, respectively.
PIMS has advised the Series that it received $10,061 in front-end sales charges resulting from sales of Class A shares during the year ended October 31, 2018. From these fees, PIMS paid such sales charges to broker-dealers, who in turn paid commissions to salespersons and incurred other distribution costs.
PIMS has advised the Series that for the year ended October 31, 2018, it received $35 in contingent deferred sales charges imposed upon redemptions by certain Class C shareholders.
PGIM Investments, PGIM, Inc. and PIMS are indirect, wholly-owned subsidiaries of Prudential Financial, Inc. (“Prudential”).
3. Other Transactions with Affiliates
Prudential Mutual Fund Services LLC (“PMFS”), an affiliate of PGIM Investments and an indirect, wholly-owned subsidiary of Prudential, serves as the Series’ transfer agent. Transfer agent’s fees and expenses in the Statement of Operations include certain out-of-pocket expenses paid to non-affiliates, where applicable.
The Series may enter into certain securities purchase or sale transactions under Board approved Rule 17a-7 procedures. Rule 17a-7 is an exemptive rule under the 1940 Act, that subject to certain conditions, permits purchase and sale transactions among affiliated investment companies, or between an investment company and a person that is affiliated solely by reason of having a common (or affiliated) investment adviser, common directors, and/or common officers. Such transactions are subject to ratification by the Board. For the reporting period ended October 31, 2018, no such transactions were entered into by the Series.
The Series may invest its overnight sweep cash in the PGIM Core Ultra Short Bond Fund (the “Core Fund”), and its securities lending cash collateral in the PGIM Institutional Money Market Fund (the “Money Market Fund”), each a series of Prudential Investment Portfolios 2, registered under the 1940 Act and managed by PGIM Investments. For the reporting period ended October 31, 2018, PGIM, Inc. was compensated $70 by PGIM Investments for managing the Series’ securities lending cash collateral as subadviser to the Money Market Fund. Earnings from the Core Fund and Money Market Fund are disclosed on the Statement of Operations as “Affiliated dividend income” and “Income from securities lending, net”, respectively.
| | | | |
| PGIM Emerging Markets Debt Local Currency Fund | | | 53 | |
Notes to Financial Statements (continued)
4. Portfolio Securities
The aggregate cost of purchases and proceeds from sales of portfolio securities (excluding short-term investments and U.S. Government securities) for the year ended October 31, 2018, were $92,558,711 and $56,805,749, respectively.
A summary of the cost of purchases and proceeds from sales of shares of affiliated mutual funds for the year ended October 31, 2018, is presented as follows:
| | | | | | | | | | | | | | | | | | | | | | | | | | | | | | |
Value,
Beginning
of Year | | | Cost of
Purchases | | | Proceeds
from Sales | | | Change in
Unrealized
Gain
(Loss) | | | Realized
Gain
(Loss) | | | Value,
End of
Year | | | Shares,
End
of Year | | | Income | |
| | PGIM Core Ultra Short Bond Fund* | | | | | | | | | |
| $ | 481,154 | | | $ | 63,849,910 | | | $ | 62,857,753 | | | $ | — | | | $ | — | | | $ | 1,473,311 | | | | 1,473,311 | | | $ | 24,046 | |
| | PGIM Institutional Money Market Fund* | | | | | | | | | |
| | — | | | | 1,120,794 | | | | 1,121,061 | | | | — | | | | 267 | | | | — | | | | — | | | | 409 | ** |
| | | | | | | | | | | | | | | | | | | | | | | | | | | | | | |
| $ | 481,154 | | | $ | 64,970,704 | | | $ | 63,978,814 | | | $ | — | | | $ | 267 | | | $ | 1,473,311 | | | | | | | $ | 24,455 | |
| | | | | | | | | | | | | | | | | | | | | | | | | | | | | | |
| * | The Funds did not have any capital gain distributions during the reporting period. |
| ** | This amount is included in “Income from securities lending, net” on the Statement of Operations. |
5. Distributions and Tax Information
Distributions to shareholders, which are determined in accordance with federal income tax regulations and which may differ from generally accepted accounting principles, are recorded on the ex-date. In order to present total distributable earnings (loss) and paid-in capital in excess of par on the Statement of Assets and Liabilities that more closely represent their tax character, certain adjustments have been made to total distributable earnings (loss) and paid-in capital in excess of par. For the year ended October 31, 2018, the adjustments were to decrease total distributable loss and decrease paid-in capital in excess of par by $1,520,603 due to a net operating loss and other book to tax differences. Net investment income, net realized gain (loss) on investments and foreign currency transactions and net assets were not affected by this change.
For the year ended October 31, 2018, the tax character of dividends paid by the Series was $3,165,613 of tax return of capital. For the year ended October 31, 2017, the tax character of dividends paid by the Series were $739,714 of ordinary income and $1,097,747 of tax return of capital.
As of October 31, 2018, the Series had no undistributed earnings on a tax basis.
The United States federal income tax basis of the Series’ investments and the net unrealized depreciation as of October 31, 2018 were as follows:
| | | | | | |
Tax Basis | | Gross
Unrealized
Appreciation | | Gross
Unrealized
Depreciation | | Net Unrealized
Depreciation |
| $64,866,285 | | $347,422 | | $(7,932,839) | | $(7,585,417) |
The difference between book basis and tax basis is primarily attributable to the difference in the treatment of amortization of premiums, wash sales, straddle loss deferrals and other cost basis differences between financial and tax accounting.
For federal income tax purposes, the Series had a capital loss carryforward as of October 31, 2018 of approximately $3,708,000 which can be carried forward for an unlimited period. No capital gains distributions are expected to be paid to shareholders until net gains have been realized in excess of such losses.
Management has analyzed the Series’ tax positions taken on federal, state and local income tax returns for all open tax years and has concluded that no provision for income tax is required in the Series’ financial statements for the current reporting period. The Series’ federal, state and local income and federal excise tax returns for tax years for which the applicable statutes of limitations have not expired are subject to examination by the Internal Revenue Service and state departments of revenue.
6. Capital and Ownership
The Series offers Class A, Class C, Class Z and Class R6 shares. Class A shares are sold with a maximum front-end sales charge of 4.50%. Investors who purchase $1 million or more of Class A shares and sell these shares within 12 months of purchase are subject to a contingent deferred sales charge (“CDSC”) of 1%, although they are not subject to an initial sales charge. The Class A CDSC is waived for certain retirement and/or benefit plans. A special exchange privilege is also available for shareholders who qualified to purchase Class A shares at net asset value. Class C shares are sold with a CDSC of 1% on sales made within 12 months of purchase. Class Z and Class R6 shares are not subject to any sales or redemption charge and are available exclusively for sale to a limited group of investors.
Under certain circumstances, an exchange may be made from specified share classes of the Series to one or more other share classes of the Series as presented in the table of transactions in shares of common stock.
The Fund is authorized to issue 5.075 billion shares of common stock, with a par value of $0.01 per share, which is divided into five series. There are 550 million shares authorized for the Series, divided into five classes, designated Class A, Class C, Class Z, Class R6 and Class T common stock, each of which consists of 10 million, 50 million, 250 million, 50 million and 190 million authorized shares, respectively. The Series currently does not have any Class T shares outstanding.
| | | | |
| PGIM Emerging Markets Debt Local Currency Fund | | | 55 | |
Notes to Financial Statements (continued)
As of October 31, 2018, Prudential, through its affiliated entities, including affiliated funds (if applicable), owned 3,290,836 Class Z shares and 161 Class R6 shares of the Series. At reporting period end, four shareholders of record held 87% of the Series’ outstanding shares on behalf of multiple beneficial owners, of which 31% were held by an affiliate of Prudential.
Transactions in shares of common stock were as follows:
| | | | | | | | |
Class A | | Shares | | | Amount | |
Year ended October 31, 2018: | | | | | | | | |
Shares sold | | | 378,543 | | | $ | 2,469,000 | |
Shares issued in reinvestment of dividends and distributions | | | 36,334 | | | | 224,308 | |
Shares reacquired | | | (313,047 | ) | | | (1,809,468 | ) |
| | | | | | | | |
Net increase (decrease) in shares outstanding before conversion | | | 101,830 | | | | 883,840 | |
Shares issued upon conversion from other share class(es) | | | 711 | | | | 4,557 | |
Shares reacquired upon conversion into other share class(es) | | | (14,303 | ) | | | (89,959 | ) |
| | | | | | | | |
Net increase (decrease) in shares outstanding | | | 88,238 | | | $ | 798,438 | |
| | | | | | | | |
Year ended October 31, 2017: | | | | | | | | |
Shares sold | | | 411,807 | | | $ | 2,625,583 | |
Shares issued in reinvestment of dividends and distributions | | | 30,171 | | | | 192,867 | |
Shares reacquired | | | (514,542 | ) | | | (3,279,092 | ) |
| | | | | | | | |
Net increase (decrease) in shares outstanding before conversion | | | (72,564 | ) | | | (460,642 | ) |
Shares issued upon conversion from other share class(es) | | | 32,906 | | | | 196,522 | |
Shares reacquired upon conversion into other share class(es) | | | (98,133 | ) | | | (619,781 | ) |
| | | | | | | | |
Net increase (decrease) in shares outstanding | | | (137,791 | ) | | $ | (883,901 | ) |
| | | | | | | | |
Class C | | | | | | |
Year ended October 31, 2018: | | | | | | | | |
Shares sold | | | 13,391 | | | $ | 87,611 | |
Shares issued in reinvestment of dividends and distributions | | | 5,177 | | | | 32,470 | |
Shares reacquired | | | (32,864 | ) | | | (202,443 | ) |
| | | | | | | | |
Net increase (decrease) in shares outstanding | | | (14,296 | ) | | $ | (82,362 | ) |
| | | | | | | | |
Year ended October 31, 2017: | | | | | | | | |
Shares sold | | | 35,784 | | | $ | 236,548 | |
Shares issued in reinvestment of dividends and distributions | | | 4,923 | | | | 31,728 | |
Shares reacquired | | | (50,941 | ) | | | (317,283 | ) |
| | | | | | | | |
Net increase (decrease) in shares outstanding | | | (10,234 | ) | | $ | (49,007 | ) |
| | | | | | | | |
| | | | | | | | |
Class Z | | Shares | | | Amount | |
Year ended October 31, 2018: | | | | | | | | |
Shares sold | | | 7,175,606 | | | $ | 47,648,141 | |
Shares issued in reinvestment of dividends and distributions | | | 470,660 | | | | 2,898,000 | |
Shares reacquired | | | (1,956,209 | ) | | | (12,100,239 | ) |
| | | | | | | | |
Net increase (decrease) in shares outstanding before conversion | | | 5,690,057 | | | | 38,445,902 | |
Shares issued upon conversion from other share class(es) | | | 14,151 | | | | 89,959 | |
Shares reacquired upon conversion into other share class(es) | | | (704 | ) | | | (4,557 | ) |
| | | | | | | | |
Net increase (decrease) in shares outstanding | | | 5,703,504 | | | $ | 38,531,304 | |
| | | | | | | | |
Year ended October 31, 2017: | | | | | | | | |
Shares sold | | | 698,617 | | | $ | 4,609,646 | |
Shares issued in reinvestment of dividends and distributions | | | 244,834 | | | | 1,580,068 | |
Shares reacquired† | | | (1,059,507 | ) | | | (6,916,141 | ) |
| | | | | | | | |
Net increase (decrease) in shares outstanding before conversion | | | (116,056 | ) | | | (726,427 | ) |
Shares issued upon conversion from other share class(es) | | | 97,078 | | | | 619,781 | |
Shares reacquired upon conversion into other share class(es) | | | (32,483 | ) | | | (196,522 | ) |
| | | | | | | | |
Net increase (decrease) in shares outstanding | | | (51,461 | ) | | $ | (303,168 | ) |
| | | | | | | | |
Class R6 | | | | | | |
Year ended October 31, 2018: | | | | | | | | |
Shares issued in reinvestment of dividends and distributions | | | 10 | | | $ | 60 | |
| | | | | | | | |
Net increase (decrease) in shares outstanding | | | 10 | | | $ | 60 | |
| | | | | | | | |
Year ended October 31, 2017: | | | | | | | | |
Shares issued in reinvestment of dividends and distributions | | | 9 | | | $ | 58 | |
| | | | | | | | |
Net increase (decrease) in shares outstanding | | | 9 | | | $ | 58 | |
| | | | | | | | |
| † | Includes affiliated redemptions of 455,235 shares with a value of $3,000,000 for Class Z. |
7. Borrowings
The Fund, on behalf of the Series, along with other affiliated registered investment companies (the “Funds”), is a party to a Syndicated Credit Agreement (“SCA”) with a group of banks. The purpose of the SCA is to provide an alternative source of temporary funding for capital share redemptions. The SCA provides for a commitment of $900 million for the period October 4, 2018 through October 3, 2019. The Funds pay an annualized commitment fee of 0.15% of the unused portion of the SCA. The Series’ portion of the commitment fee for the unused amount, allocated based upon a method approved by the Board, is accrued daily and paid quarterly. Prior to October 4, 2018, the Funds had another SCA that provided a commitment of $900 million and the Funds paid an annualized commitment fee of 0.15% of the unused portion of the SCA. The interest on borrowings under both SCAs is paid monthly and at a per annum interest rate based upon a contractual spread plus the higher of (1) the effective federal funds rate, (2) the 1-month LIBOR rate or (3) zero percent.
Other affiliated registered investment companies that are parties to the SCA include portfolios that are subject to a predetermined mathematical formula used to manage certain benefit guarantees offered under variable annuity contracts. The formula may result in large scale asset flows into and out of these portfolios. Consequently, these portfolios may be more
| | | | |
| PGIM Emerging Markets Debt Local Currency Fund | | | 57 | |
Notes to Financial Statements (continued)
likely to utilize the SCA for purposes of funding redemptions. It may be possible for those portfolios to fully exhaust the committed amount of the SCA, thereby requiring the Manager to allocate available funding per a Board-approved methodology designed to treat the Funds in the SCA equitably.
The Series utilized the SCA during the reporting period ended October 31, 2018. The average daily balance for the 3 days that the Series had loans outstanding during the period was $889,667, borrowed at a weighted average interest rate of 3.19%. The maximum loan balance outstanding during the period was $2,223,000. At October 31, 2018, the Series did not have an outstanding loan balance.
8. Risks of Investing in the Series
The Series’ risks include, but are not limited to, some or all of the risks discussed below:
Bond Obligations Risk: The Series’ holdings, share price, yield and total return may fluctuate in response to bond market movements. The value of bonds may decline for issuer-related reasons, including management performance, financial leverage and reduced demand for the issuer’s goods and services. Certain types of fixed-income obligations also may be subject to “call and redemption risk,” which is the risk that the issuer may call a bond held by the Series for redemption before it matures and the Series may not be able to reinvest at the same level and therefore would earn less income.
Derivatives Risk: Derivatives involve special risks and costs and may result in losses to the Series. The successful use of derivatives requires sophisticated management, and, to the extent that derivatives are used, the Series will depend on the subadviser’s ability to analyze and manage derivative transactions. The prices of derivatives may move in unexpected ways, especially in abnormal market conditions. Some derivatives are “leveraged” and therefore may magnify or otherwise increase investment losses to the Series. The Series’ use of derivatives may also increase the amount of taxes payable by shareholders. Other risks arise from the potential inability to terminate or sell derivatives positions. A liquid secondary market may not always exist for the Series’ derivatives positions. In fact, many OTC derivative instruments will not have liquidity beyond the counterparty to the instrument. OTC derivative instruments also involve the risk that the other party will not meet its obligations to the Series.
Emerging Markets Risk: The risks of foreign investments are greater for investments in or exposed to emerging markets. Emerging market countries typically have economic and political systems that are less fully developed, and can be expected to be less stable, than those of more developed countries. For example, the economies of such countries can be subject to rapid and unpredictable rates of inflation or deflation. Low trading volumes may
result in a lack of liquidity and price volatility. Emerging market countries may have policies that restrict investment by non-US investors, or that prevent non-US investors from withdrawing their money at will.
Interest Rate Risk: The value of an investment may go down when interest rates rise. A rise in rates tends to have a greater impact on the prices of longer term or duration securities. When interest rates fall, the issuers of debt obligations may prepay principal more quickly than expected, and the Series may be required to reinvest the proceeds at a lower interest rate. This is referred to as “prepayment risk.” When interest rates rise, debt obligations may be repaid more slowly than expected, and the value of the Series’ holdings may fall sharply. This is referred to as “extension risk. The Series may face a heightened level of interest rate risk as a result of the US Federal Reserve Board’s policies. The Series’ investments may lose value if short-term or long-term interest rates rise sharply or in a manner not anticipated by the subadviser.
Liquidity Risk: The Series may invest in instruments that trade in lower volumes and are less liquid than other investments. Liquidity risk exists when particular investments made by the Series are difficult to purchase or sell. Liquidity risk includes the risk that the Series may make investments that may become less liquid in response to market developments or adverse investor perceptions. Investments that are illiquid or that trade in lower volumes may be more difficult to value. If the Series is forced to sell these investments to pay redemption proceeds or for other reasons, the Fund may lose money. In addition, when there is no willing buyer and investments cannot be readily sold at the desired time or price, the Series may have to accept a lower price or may not be able to sell the instrument at all. The reduction in dealer market-making capacity in the fixed-income markets that has occurred in recent years also has the potential to reduce liquidity. An inability to sell a portfolio position can adversely affect the Series’ value or prevent the Series from being able to take advantage of other investment opportunities.
Non-diversification Risk: The Series is non-diversified, meaning that the Series may invest a greater percentage of its assets in the securities of a single company or industry than a diversified fund. Investing in a non-diversified fund involves greater risk than investing in a diversified fund because a loss resulting from the decline in value of any one security may represent a greater portion of the total assets of a non-diversified fund.
9. Recent Accounting Pronouncements and Reporting Updates
In August 2018, the Securities and Exchange Commission (the “SEC”) adopted amendments to Regulation S-X to update and simplify the disclosure requirements for registered investment companies by eliminating requirements that are redundant or duplicative of US GAAP requirements or other SEC disclosure requirements. The new amendments require the presentation of the total, rather than the components, of distributable earnings on the Statement of Assets and Liabilities and the total, rather than the components, of dividends from net investment income and distributions from net realized gains on the Statements of Changes in Net Assets. The amendments also removed
| | | | |
| PGIM Emerging Markets Debt Local Currency Fund | | | 59 | |
Notes to Financial Statements (continued)
the requirement for the parenthetical disclosure of undistributed net investment income on the Statements of Changes in Net Assets and certain tax adjustments that were reflected in the Notes to Financial Statements. All of these have been reflected in the Series’ financial statements.
In August 2018, the FASB issued Accounting Standards Update (“ASU”) No. 2018-13, which changes certain fair value measurement disclosure requirements. The new ASU, in addition to other modifications and additions, removes the requirement to disclose the amount and reasons for transfers between Level 1 and Level 2 of the fair value hierarchy, and the Series’ policy for the timing of transfers between levels. The amendments are effective for financial statements issued for fiscal years beginning after December 15, 2019, and interim periods within those fiscal years. Management has evaluated the implications of certain provisions of the ASU and has determined to early adopt aspects related to the removal and modification of certain fair value measurement disclosures under the ASU effective immediately. At this time, management is evaluating the implications of certain other provisions of the ASU related to new disclosure requirements and any impact on the financial statement disclosures has not yet been determined.
Financial Highlights
| | | | | | | | | | | | | | | | | | | | |
| Class A Shares | |
| | | Year Ended October 31, | |
| | | 2018 | | | 2017 | | | 2016 | | | 2015 | | | 2014 | |
| Per Share Operating Performance(a): | | | | | | | | | | | | | | | | | | | | |
| Net Asset Value, Beginning of Year | | | $6.40 | | | | $6.44 | | | | $6.24 | | | | $7.92 | | | | $8.67 | |
| Income (loss) from investment operations: | | | | | | | | | | | | | | | | | | | | |
| Net investment income (loss) | | | 0.33 | | | | 0.35 | | | | 0.33 | | | | 0.37 | | | | 0.49 | |
| Net realized and unrealized gain (loss) on investment and foreign currency transactions | | | (0.86 | ) | | | (0.02 | ) | | | 0.23 | | | | (1.64 | ) | | | (0.71 | ) |
| Total from investment operations | | | (0.53 | ) | | | 0.33 | | | | 0.56 | | | | (1.27 | ) | | | (0.22 | ) |
| Less Dividends and Distributions: | | | | | | | | | | | | | | | | | | | | |
| Dividends from net investment income* | | | - | | | | (0.15 | ) | | | - | (b) | | | (0.06 | ) | | | (0.07 | ) |
| Tax return of capital distributions | | | (0.35 | ) | | | (0.22 | ) | | | (0.36 | ) | | | (0.35 | ) | | | (0.46 | ) |
| Total dividends and distributions | | | (0.35 | ) | | | (0.37 | ) | | | (0.36 | ) | | | (0.41 | ) | | | (0.53 | ) |
| Net asset value, end of year | | | $5.52 | | | | $6.40 | | | | $6.44 | | | | $6.24 | | | | $7.92 | |
| Total Return(c): | | | (8.68)% | | | | 5.36% | | | | 9.29% | | | | (16.41)% | | | | (2.47)% | |
| |
| Ratios/Supplemental Data: | |
| Net assets, end of year (000) | | | $3,146 | | | | $3,085 | | | | $3,990 | | | | $3,208 | | | | $5,991 | |
| Average net assets (000) | | | $4,105 | | | | $3,639 | | | | $3,343 | | | | $4,341 | | | | $6,701 | |
| Ratios to average net assets(d): | | | | | | | | | | | | | | | | | | | | |
| Expenses after waivers and/or expense reimbursement | | | 1.13% | | | | 1.13% | | | | 1.28% | | | | 1.30% | (e) | | | 1.30% | |
| Expenses before waivers and/or expense reimbursement | | | 2.16% | (f) | | | 2.15% | | | | 2.33% | | | | 2.39% | (e) | | | 2.13% | |
| Net investment income (loss) | | | 5.34% | | | | 5.42% | | | | 5.20% | | | | 5.32% | (e) | | | 5.99% | |
| Portfolio turnover rate(g) | | | 113% | | | | 186% | | | | 196% | | | | 101% | | | | 110% | |
| * | Dividends from net investment income may include other items that are ordinary income for tax purposes. |
| (a) | Calculated based on average shares outstanding during the year. |
| (b) | Less than $0.005 per share. |
| (c) | Total return does not consider the effects of sales loads. Total return is calculated assuming a purchase of a share on the first day and a sale on the last day of each year reported and includes reinvestment of dividends and distributions, if any. Total returns may reflect adjustments to conform to generally accepted accounting principles. |
| (d) | Does not include expenses of the underlying funds in which the Series invests. |
| (e) | Effective March 9, 2015, the contractual distribution and service (12b-1) fees were reduced from 0.30% to 0.25% of the average daily net assets and the 0.05% contractual 12b-1 fee waiver was terminated. |
| (f) | Effective November 1, 2017, class specific expenses include transfer agent fees and expenses and registration fees, which are charged to their respective share class. |
| (g) | The Series’ portfolio turnover rate is calculated in accordance with regulatory requirements, without regard to transactions involving short term investments and certain derivatives. If such transactions were included, the Series’ portfolio turnover rate may be higher. |
See Notes to Financial Statements.
| | | | |
| PGIM Emerging Markets Debt Local Currency Fund | | | 61 | |
Financial Highlights (continued)
| | | | | | | | | | | | | | | | | | | | |
| Class C Shares | |
| | | Year Ended October 31, | |
| | | 2018 | | | 2017 | | | 2016 | | | 2015 | | | 2014 | |
| Per Share Operating Performance(a): | | | | | | | | | | | | | | | | | | | | |
| Net Asset Value, Beginning of Year | | | $6.46 | | | | $6.49 | | | | $6.28 | | | | $7.97 | | | | $8.72 | |
| Income (loss) from investment operations: | | | | | | | | | | | | | | | | | | | | |
| Net investment income (loss) | | | 0.29 | | | | 0.30 | | | | 0.28 | | | | 0.32 | | | | 0.43 | |
| Net realized and unrealized gain (loss) on investment and foreign currency transactions | | | (0.88 | ) | | | (0.01 | ) | | | 0.25 | | | | (1.65 | ) | | | (0.71 | ) |
| Total from investment operations | | | (0.59 | ) | | | 0.29 | | | | 0.53 | | | | (1.33 | ) | | | (0.28 | ) |
| Less Dividends and Distributions: | | | | | | | | | | | | | | | | | | | | |
| Dividends from net investment income* | | | - | | | | (0.13 | ) | | | - | (b) | | | (0.01 | ) | | | (0.01 | ) |
| Tax return of capital distributions | | | (0.31 | ) | | | (0.19 | ) | | | (0.32 | ) | | | (0.35 | ) | | | (0.46 | ) |
| Total dividends and distributions | | | (0.31 | ) | | | (0.32 | ) | | | (0.32 | ) | | | (0.36 | ) | | | (0.47 | ) |
| Net asset value, end of year | | | $5.56 | | | | $6.46 | | | | $6.49 | | | | $6.28 | | | | $7.97 | |
| Total Return(c): | | | (9.61)% | | | | 4.66% | | | | 8.61% | | | | (17.00)% | | | | (3.21)% | |
| |
| Ratios/Supplemental Data: | |
| Net assets, end of year (000) | | | $538 | | | | $718 | | | | $787 | | | | $701 | | | | $927 | |
| Average net assets (000) | | | $672 | | | | $649 | | | | $721 | | | | $789 | | | | $1,207 | |
| Ratios to average net assets(d): | | | | | | | | | | | | | | | | | | | | |
| Expenses after waivers and/or expense reimbursement | | | 1.88% | | | | 1.88% | | | | 2.03% | | | | 2.05% | | | | 2.05% | |
| Expenses before waivers and/or expense reimbursement | | | 4.89% | (e) | | | 2.88% | | | | 3.07% | | | | 3.11% | | | | 2.82% | |
| Net investment income (loss) | | | 4.56% | | | | 4.63% | | | | 4.40% | | | | 4.52% | | | | 5.17% | |
| Portfolio turnover rate(f) | | | 113% | | | | 186% | | | | 196% | | | | 101% | | | | 110% | |
| * | Dividends from net investment income may include other items that are ordinary income for tax purposes. |
| (a) | Calculated based on average shares outstanding during the year. |
| (b) | Less than $0.005 per share. |
| (c) | Total return does not consider the effects of sales loads. Total return is calculated assuming a purchase of a share on the first day and a sale on the last day of each year reported and includes reinvestment of dividends and distributions, if any. Total returns may reflect adjustments to conform to generally accepted accounting principles. |
| (d) | Does not include expenses of the underlying funds in which the Series invests. |
| (e) | Effective November 1, 2017, class specific expenses include transfer agent fees and expenses and registration fees, which are charged to their respective share class. |
| (f) | The Series’ portfolio turnover rate is calculated in accordance with regulatory requirements, without regard to transactions involving short term investments and certain derivatives. If such transactions were included, the Series’ portfolio turnover rate may be higher. |
See Notes to Financial Statements.
| | | | | | | | | | | | | | | | | | | | |
| Class Z Shares | |
| | | Year Ended October 31, | |
| | | 2018 | | | 2017 | | | 2016 | | | 2015 | | | 2014 | |
| Per Share Operating Performance(a): | | | | | | | | | | | | | | | | | | | | |
| Net Asset Value, Beginning of Year | | | $6.48 | | | | $6.50 | | | | $6.31 | | | | $7.98 | | | | $8.72 | |
| Income (loss) from investment operations: | | | | | | | | | | | | | | | | | | | | |
| Net investment income (loss) | | | 0.34 | | | | 0.36 | | | | 0.34 | | | | 0.38 | | | | 0.51 | |
| Net realized and unrealized gain (loss) on investment and foreign currency transactions | | | (0.88 | ) | | | 0.01 | | | | 0.23 | | | | (1.62 | ) | | | (0.70 | ) |
| Total from investment operations | | | (0.54 | ) | | | 0.37 | | | | 0.57 | | | | (1.24 | ) | | | (0.19 | ) |
| Less Dividends and Distributions: | | | | | | | | | | | | | | | | | | | | |
| Dividends from net investment income* | | | - | | | | (0.16 | ) | | | - | (b) | | | (0.08 | ) | | | (0.09 | ) |
| Tax return of capital distributions | | | (0.37 | ) | | | (0.23 | ) | | | (0.38 | ) | | | (0.35 | ) | | | (0.46 | ) |
| Total dividends and distributions | | | (0.37 | ) | | | (0.39 | ) | | | (0.38 | ) | | | (0.43 | ) | | | (0.55 | ) |
| Net asset value, end of year | | | $5.57 | | | | $6.48 | | | | $6.50 | | | | $6.31 | | | | $7.98 | |
| Total Return(c): | | | (8.83)% | | | | 5.85% | | | | 9.31% | | | | (15.90)% | | | | (2.12)% | |
| |
| Ratios/Supplemental Data: | |
| Net assets, end of year (000) | | | $55,000 | | | | $27,020 | | | | $27,462 | | | | $24,821 | | | | $28,578 | |
| Average net assets (000) | | | $49,644 | | | | $26,437 | | | | $25,994 | | | | $25,969 | | | | $30,288 | |
| Ratios to average net assets(d): | | | | | | | | | | | | | | | | | | | | |
| Expenses after waivers and/or expense reimbursement | | | 0.88% | | | | 0.88% | | | | 1.03% | | | | 1.05% | | | | 1.05% | |
| Expenses before waivers and/or expense reimbursement | | | 1.41% | (e) | | | 1.88% | | | | 2.06% | | | | 2.11% | | | | 1.82% | |
| Net investment income (loss) | | | 5.50% | | | | 5.58% | | | | 5.36% | | | | 5.50% | | | | 6.14% | |
| Portfolio turnover rate(f) | | | 113% | | | | 186% | | | | 196% | | | | 101% | | | | 110% | |
| * | Dividends from net investment income may include other items that are ordinary income for tax purposes. |
| (a) | Calculated based on average shares outstanding during the year. |
| (b) | Less than $0.005 per share. |
| (c) | Total return is calculated assuming a purchase of a share on the first day and a sale on the last day of each year reported and includes reinvestment of dividends and distributions, if any. Total returns may reflect adjustments to conform to generally accepted accounting principles. |
| (d) | Does not include expenses of the underlying funds in which the Series invests. |
| (e) | Effective November 1, 2017, class specific expenses include transfer agent fees and expenses and registration fees, which are charged to their respective share class. |
| (f) | The Series’ portfolio turnover rate is calculated in accordance with regulatory requirements, without regard to transactions involving short term investments and certain derivatives. If such transactions were included, the Series’ portfolio turnover rate may be higher. |
See Notes to Financial Statements.
| | | | |
| PGIM Emerging Markets Debt Local Currency Fund | | | 63 | |
Financial Highlights (continued)
| | | | | | | | | | | | | | | | | | | | |
| Class R6 Shares | |
| | | Year Ended October 31, | |
| | | 2018 | | | 2017 | | | 2016 | | | 2015 | | | 2014 | |
| Per Share Operating Performance(a): | | | | | | | | | | | | | | | | | | | | |
| Net Asset Value, Beginning of Year | | | $6.47 | | | | $6.50 | | | | $6.30 | | | | $7.98 | | | | $8.71 | |
| Income (loss) from investment operations: | | | | | | | | | | | | | | | | | | | | |
| Net investment income (loss) | | | 0.36 | | | | 0.37 | | | | 0.35 | | | | 0.39 | | | | 0.51 | |
| Net realized and unrealized gain (loss) on investment and foreign currency transactions | | | (0.89 | ) | | | - | (b) | | | 0.23 | | | | (1.63 | ) | | | (0.69 | ) |
| Total from investment operations | | | (0.53 | ) | | | 0.37 | | | | 0.58 | | | | (1.24 | ) | | | (0.18 | ) |
| Less Dividends and Distributions: | | | | | | | | | | | | | | | | | | | | |
| Dividends from net investment income* | | | - | | | | (0.16 | ) | | | - | (b) | | | (0.09 | ) | | | (0.09 | ) |
| Tax return of capital distributions | | | (0.38 | ) | | | (0.24 | ) | | | (0.38 | ) | | | (0.35 | ) | | | (0.46 | ) |
| Total dividends and distributions | | | (0.38 | ) | | | (0.40 | ) | | | (0.38 | ) | | | (0.44 | ) | | | (0.55 | ) |
| Net asset value, end of year | | | $5.56 | | | | $6.47 | | | | $6.50 | | | | $6.30 | | | | $7.98 | |
| Total Return(c): | | | (8.63)% | | | | 5.82% | | | | 9.55% | | | | (15.94)% | | | | (1.97)% | |
| |
| Ratios/Supplemental Data: | |
| Net assets, end of year (000) | | | $1 | | | | $1 | | | | $1 | | | | $1 | | | | $1 | |
| Average net assets (000) | | | $1 | | | | $1 | | | | $1 | | | | $1 | | | | $1 | |
| Ratios to average net assets(d): | | | | | | | | | | | | | | | | | | | | |
| Expenses after waivers and/or expense reimbursement | | | 0.88% | | | | 0.88% | | | | 1.03% | | | | 1.05% | | | | 1.05% | |
| Expenses before waivers and/or expense reimbursement | | | 1,595.87% | (e) | | | 1.83% | | | | 2.06% | | | | 2.01% | | | | 1.69% | |
| Net investment income (loss) | | | 5.73% | | | | 5.73% | | | | 5.47% | | | | 5.60% | | | | 6.17% | |
| Portfolio turnover rate(f) | | | 113% | | | | 186% | | | | 196% | | | | 101% | | | | 110% | |
| * | Dividends from net investment income may include other items that are ordinary income for tax purposes. |
| (a) | Calculated based on average shares outstanding during the year. |
| (b) | Less than $0.005 per share. |
| (c) | Total return is calculated assuming a purchase of a share on the first day and a sale on the last day of each year reported and includes reinvestment of dividends and distributions, if any. Total returns may reflect adjustments to conform to generally accepted accounting principles. |
| (d) | Does not include expenses of the underlying funds in which the Series invests. |
| (e) | Effective November 1, 2017, class specific expenses include transfer agent fees and expenses and registration fees, which are charged to their respective share class. |
| (f) | The Series’ portfolio turnover rate is calculated in accordance with regulatory requirements, without regard to transactions involving short term investments and certain derivatives. If such transactions were included, the Series’ portfolio turnover rate may be higher. |
See Notes to Financial Statements.
Report of Independent Registered Public Accounting Firm
The Board of Directors and Shareholders
Prudential World Fund, Inc.:
Opinion on the Financial Statements
We have audited the accompanying statement of assets and liabilities of PGIM Emerging Markets Debt Local Currency Fund (formerly Prudential Emerging Markets Debt Local Currency Fund) (the “Fund”), a series of Prudential World Fund, Inc., including the schedule of investments, as of October 31, 2018, the related statement of operations for the year then ended, the statements of changes in net assets for each of the years in the two-year period then ended, and the related notes (collectively, the financial statements) and the financial highlights for the years indicated therein. In our opinion, the financial statements and financial highlights present fairly, in all material respects, the financial position of the Fund as of October 31, 2018, the results of its operations for the year then ended, the changes in its net assets for each of the years in the two-year period then ended, and the financial highlights for the years indicated therein, in conformity with U.S. generally accepted accounting principles.
Basis for Opinion
These financial statements and financial highlights are the responsibility of the Fund’s management. Our responsibility is to express an opinion on these financial statements and financial highlights based on our audits. We are a public accounting firm registered with the Public Company Accounting Oversight Board (United States) (“PCAOB”) and are required to be independent with respect to the Fund in accordance with the U.S. federal securities laws and the applicable rules and regulations of the Securities and Exchange Commission and the PCAOB.
We conducted our audits in accordance with the standards of the PCAOB. Those standards require that we plan and perform the audit to obtain reasonable assurance about whether the financial statements and financial highlights are free of material misstatement, whether due to error or fraud. Our audits included performing procedures to assess the risks of material misstatement of the financial statements and financial highlights, whether due to error or fraud, and performing procedures that respond to those risks. Such procedures included examining, on a test basis, evidence regarding the amounts and disclosures in the financial statements and financial highlights. Such procedures also included confirmation of securities owned as of October 31, 2018, by correspondence with the custodians, transfer agents and brokers or by other appropriate auditing procedures when replies from brokers were not received. Our audits also included evaluating the accounting principles used and significant estimates made by management, as well as evaluating the overall presentation of the financial statements and financial highlights. We believe that our audits provide a reasonable basis for our opinion.

We have served as the auditor of one or more PGIM and/or Prudential Retail investment companies since 2003.
New York, New York
December 18, 2018
| | | | |
| PGIM Emerging Markets Debt Local Currency Fund | | | 65 | |
INFORMATION ABOUT BOARD MEMBERS AND OFFICERS (unaudited)
Information about Board Members and Officers of the Fund is set forth below. Board Members who are not deemed to be “interested persons” of the Fund, as defined in the 1940 Act, are referred to as “Independent Board Members.” Board Members who are deemed to be “interested persons” of the Fund are referred to as “Interested Board Members.” The Board Members are responsible for the overall supervision of the operations of the Fund and perform the various duties imposed on the directors of investment companies by the 1940 Act. The Board in turn elects the Officers, who are responsible for administering the day-to-day operations of the Fund.
| | | | | | |
| Independent Board Members | | | | |
| | | | |
Name, Address, Age Position(s) Portfolios Overseen | | Principal Occupation(s) During Past Five Years | | Other Directorships Held During Past Five Years | | Length of Board Service |
| | | | |
Ellen S. Alberding (60) Board Member Portfolios Overseen: 93 | | President and Board Member, The Joyce Foundation (charitable foundation) (since 2002); Vice Chair, City Colleges of Chicago (community college system) (2011-2015); Trustee, National Park Foundation (charitable foundation for national park system) (2009-2018); Trustee, Economic Club of Chicago (since 2009); Trustee, Loyola University (since 2018). | | None. | | Since September 2013 |
| | | | |
Kevin J. Bannon (66) Board Member Portfolios Overseen: 93 | | Retired; Managing Director (April 2008-May 2015) and Chief Investment Officer (October 2008-November 2013) of Highmount Capital LLC (registered investment adviser); formerly Executive Vice President and Chief Investment Officer (April 1993-August 2007) of Bank of New York Company; President (May 2003-May 2007) of BNY Hamilton Family of Mutual Funds. | | Director of Urstadt Biddle Properties (equity real estate investment trust) (since September 2008). | | Since July 2008 |
| | | | |
Linda W. Bynoe (66) Board Member Portfolios Overseen: 93 | | President and Chief Executive Officer (since March 1995) and formerly Chief Operating Officer (December 1989-February 1995) of Telemat Ltd. (management consulting); formerly Vice President (January 1985-June 1989) at Morgan Stanley & Co. (broker-dealer). | | Director of Anixter International, Inc. (communication products distributor) (since January 2006); Director of Northern Trust Corporation (financial services) (since April 2006); Trustee of Equity Residential (residential real estate) (since December 2009). | | Since March 2005 |
PGIM Emerging Markets Debt Local Currency Fund
| | | | | | |
Independent Board Members | | | | |
| | | | |
Name, Address, Age Position(s) Portfolios Overseen | | Principal Occupation(s) During Past Five Years | | Other Directorships Held During Past Five Years | | Length of Board Service |
| | | | |
Barry H. Evans (58) Board Member Portfolios Overseen: 92 | | Retired; formerly President (2005 – 2016), Global Chief Operating Officer (2014– 2016), Chief Investment Officer – Global Head of Fixed Income (1998-2014), and various portfolio manager roles (1986-2006), Manulife Asset Management U.S. | | Director, Manulife Trust Company (since 2011); formerly Director, Manulife Asset Management Limited (2015-2017); formerly Chairman of the Board of Directors of Manulife Asset Management U.S. (2005-2016); formerly Chairman of the Board, Declaration Investment Management and Research (2008-2016). | | Since September 2017 |
| | | | |
Keith F. Hartstein (62) Board Member & Independent Chair Portfolios Overseen: 93 | | Retired; Member (since November 2014) of the Governing Council of the Independent Directors Council (organization of independent mutual fund directors); formerly President and Chief Executive Officer (2005-2012), Senior Vice President (2004-2005), Senior Vice President of Sales and Marketing (1997-2004), and various executive management positions (1990-1997), John Hancock Funds, LLC (asset management); Chairman, Investment Company Institute’s Sales Force Marketing Committee (2003-2008). | | None. | | Since September 2013 |
Visit our website at pgiminvestments.com
| | | | | | |
| Independent Board Members | | | | |
| | | | |
Name, Address, Age Position(s) Portfolios Overseen | | Principal Occupation(s) During Past Five Years | | Other Directorships Held During Past Five Years | | Length of Board Service |
| | | | |
Laurie Simon Hodrick (56) Board Member Portfolios Overseen: 92 | | A. Barton Hepburn Professor Emerita of Economics in the Faculty of Business, Columbia Business School (since 2018); Visiting Professor of Law, Stanford Law School (since 2015); Visiting Fellow at the Hoover Institution, Stanford University (since 2015); Sole Member, ReidCourt LLC (since 2008) (a consulting firm); formerly A. Barton Hepburn Professor of Economics in the Faculty of Business, Columbia Business School (1996-2017); formerly Managing Director, Global Head of Alternative Investment Strategies, Deutsche Bank (2006-2008). | | Independent Director, Corporate Capital Trust (since April 2017) (a business development company); Independent Director, Kabbage, Inc. (since July 2018) (financial services). | | Since September 2017 |
| | | | |
Michael S. Hyland, CFA (73) Board Member Portfolios Overseen: 93 | | Retired (since February 2005); formerly Senior Managing Director (July 2001-February 2005) of Bear Stearns & Co, Inc.; Global Partner, INVESCO (1999-2001); Managing Director and President of Salomon Brothers Asset Management (1989-1999). | | None. | | Since July 2008 |
| | | | |
Richard A. Redeker (75) Board Member Portfolios Overseen: 93 | | Retired Mutual Fund Senior Executive (50 years); Management Consultant; Director, Mutual Fund Directors Forum (since 2014); Independent Directors Council (organization of independent mutual fund directors)-Executive Committee, Chair of Policy Steering Committee, Governing Council. | | None. | | Since October 1993 |
PGIM Emerging Markets Debt Local Currency Fund
| | | | | | |
| Independent Board Members | | | | |
| | | | |
Name, Address, Age Position(s) Portfolios Overseen | | Principal Occupation(s) During Past Five Years | | Other Directorships Held During Past Five Years | | Length of Board Service |
| | | | |
Brian K. Reid (56)# Board Member Portfolios Overseen: 92 | | Retired; formerly Chief Economist for the Investment Company Institute (ICI) (2005-2017); formerly Senior Economist and Director of Industry and Financial Analysis at the ICI (1998-2004); formerly Senior Economist, Industry and Financial Analysis at the ICI (1996-1998); formerly Staff Economist at the Federal Reserve Board (1989-1996); Director, ICI Mutual Insurance Company (2012-2017). | | None. | | Since March 2018 |
| # | Mr. Reid joined the Board effective as of March 1, 2018. |
| | | | | | |
| Interested Board Members | | | | |
| | | | |
Name, Address, Age Position(s) Portfolios Overseen | | Principal Occupation(s) During Past Five Years | | Other Directorships Held During Past Five Years | | Length of
Board Service |
| | | | |
Stuart S. Parker (56) Board Member & President Portfolios Overseen: 93 | | President of PGIM Investments LLC (formerly known as Prudential Investments LLC) (since January 2012); Executive Vice President of Prudential Investment Management Services LLC (since December 2012); formerly Executive Vice President of Jennison Associates LLC and Head of Retail Distribution of PGIM Investments LLC (June 2005-December 2011). | | None. | | Since January 2012 |
Visit our website at pgiminvestments.com
| | | | | | |
| Interested Board Members | | | | |
| | | | |
Name, Address, Age Position(s) Portfolios Overseen | | Principal Occupation(s) During Past Five Years | | Other Directorships Held During Past Five Years | | Length of Board Service |
| | | | |
Scott E. Benjamin (45) Board Member & Vice President Portfolios Overseen:93 | | Executive Vice President (since June 2009) of PGIM Investments LLC; Executive Vice President (June 2009-June 2012) and Vice President (since June 2012) of Prudential Investment Management Services LLC; Executive Vice President (since September 2009) of AST Investment Services, Inc.; Senior Vice President of Product Development and Marketing, PGIM Investments (since February 2006); formerly Vice President of Product Development and Product Management, PGIM Investments LLC (2003-2006). | | None. | | Since March 2010 |
| | | | |
Grace C. Torres* (59) Board Member Portfolios Overseen: 92 | | Retired; formerly Treasurer and Principal Financial and Accounting Officer of the PGIM Funds, Target Funds, Advanced Series Trust, Prudential Variable Contract Accounts and The Prudential Series Fund (1998-June 2014); Assistant Treasurer (March 1999-June 2014) and Senior Vice President (September 1999-June 2014) of PGIM Investments LLC; Assistant Treasurer (May 2003-June 2014) and Vice President (June 2005-June 2014) of AST Investment Services, Inc.; Senior Vice President and Assistant Treasurer (May 2003-June 2014) of Prudential Annuities Advisory Services, Inc. | | Formerly Director (July 2015-January 2018) of Sun Bancorp, Inc. N.A. and Sun National Bank; Director (since January 2018) of OceanFirst Financial Corp. and OceanFirst Bank. | | Since November 2014 |
* Note: Prior to her retirement in 2014, Ms. Torres was employed by PGIM Investments LLC. Due to her prior employment, she is considered to be an “interested person” under the 1940 Act. Ms. Torres is a Non-Management Interested Board Member.
PGIM Emerging Markets Debt Local Currency Fund
| | | | |
| Fund Officers(a) | | | | |
| | | |
Name, Address and Age Position with Fund | | Principal Occupation(s) During Past Five Years | | Length of Service as Fund Officer |
| | | |
Raymond A. O’Hara (63) Chief Legal Officer | | Vice President and Corporate Counsel (since July 2010) of Prudential Insurance Company of America (Prudential); Vice President (March 2011-Present) of Pruco Life Insurance Company and Pruco Life Insurance Company of New Jersey; Vice President and Corporate Counsel (March 2011-Present) of Prudential Annuities Life Assurance Corporation; Chief Legal Officer of PGIM Investments LLC (since June 2012); Chief Legal Officer of Prudential Mutual Fund Services LLC (since June 2012) and Corporate Counsel of AST Investment Services, Inc. (since June 2012); formerly Assistant Vice President and Corporate Counsel (September 2008-July 2010) of The Hartford Financial Services Group, Inc.; formerly Associate (September 1980-December 1987) and Partner (January 1988–August 2008) of Blazzard & Hasenauer, P.C. (formerly, Blazzard, Grodd & Hasenauer, P.C.). | | Since June 2012 |
| | | |
Chad A. Earnst (43) Chief Compliance Officer | | Chief Compliance Officer (September 2014-Present) of PGIM Investments LLC; Chief Compliance Officer (September 2014-Present) of the PGIM Funds, Target Funds, Advanced Series Trust, The Prudential Series Fund, Prudential’s Gibraltar Fund, Inc., PGIM Global Short Duration High Yield Income Fund, Inc., PGIM Short Duration High Yield Fund, Inc. and PGIM Jennison MLP Income Fund, Inc.; formerly Assistant Director (March 2010-August 2014) of the Asset Management Unit, Division of Enforcement, US Securities & Exchange Commission; Assistant Regional Director (January 2010-August 2014), Branch Chief (June 2006–December 2009) and Senior Counsel (April 2003-May 2006) of the Miami Regional Office, Division of Enforcement, US Securities & Exchange Commission. | | Since September 2014 |
| | | |
Dino Capasso (44) Deputy Chief Compliance Officer | | Vice President and Deputy Chief Compliance Officer (June 2017-Present) of PGIM Investments LLC; formerly, Senior Vice President and Senior Counsel (January 2016-June 2017), and Vice President and Counsel (February 2012-December 2015) of Pacific Investment Management Company LLC. | | Since March 2018 |
| | | |
Andrew R. French (56) Secretary | | Vice President and Corporate Counsel (since February 2010) of Prudential; formerly Director and Corporate Counsel (2006-2010) of Prudential; Vice President and Assistant Secretary (since January 2007) of PGIM Investments LLC; Vice President and Assistant Secretary (since January 2007) of Prudential Mutual Fund Services LLC. | | Since October 2006 |
Visit our website at pgiminvestments.com
| | | | |
| Fund Officers(a) | | | | |
| | | |
Name, Address and Age Position with Fund | | Principal Occupation(s) During Past Five Years | | Length of Service as Fund Officer |
| | | |
Jonathan D. Shain (60) Assistant Secretary | | Vice President and Corporate Counsel (since August 1998) of Prudential; Vice President and Assistant Secretary (since May 2001) of PGIM Investments LLC; Vice President and Assistant Secretary (since February 2001) of Prudential Mutual Fund Services LLC; formerly Vice President and Assistant Secretary (May 2003-June 2005) of AST Investment Services, Inc. | | Since May 2005 |
| | | |
Claudia DiGiacomo (44) Assistant Secretary | | Vice President and Corporate Counsel (since January 2005) of Prudential; Vice President and Assistant Secretary of PGIM Investments LLC (since December 2005); formerly Associate at Sidley Austin Brown & Wood LLP (1999-2004). | | Since December 2005 |
| | | |
Charles H. Smith (45) Anti-Money Laundering Compliance Officer | | Vice President, Corporate Compliance, Anti-Money Laundering Unit (since January 2015) of Prudential; committee member of the American Council of Life Insurers Anti-Money Laundering and Critical Infrastructure Committee (since January 2016); formerly Global Head of Economic Sanctions Compliance at AIG Property Casualty (February 2007 – December 2014); Assistant Attorney General at the New York State Attorney General’s Office, Division of Public Advocacy. (August 1998 —January 2007). | | Since January 2017 |
| | | |
Brian D. Nee (52) Treasurer and Principal Financial and Accounting Officer | | Vice President and Head of Finance of PGIM Investments LLC (since August 2015) and PGIM Global Partners (since February 2017); formerly, Vice President, Treasurer’s Department of Prudential (September 2007-August 2015). | | Since July 2018 |
| | | |
Peter Parrella (60) Assistant Treasurer | | Vice President (since 2007) and Director (2004-2007) within Prudential Mutual Fund Administration; formerly Tax Manager at SSB Citi Fund Management LLC (1997-2004). | | Since June 2007 |
| | | |
Lana Lomuti (51) Assistant Treasurer | | Vice President (since 2007) and Director (2005-2007), within Prudential Mutual Fund Administration; formerly Assistant Treasurer (December 2007-February 2014) of The Greater China Fund, Inc. | | Since April 2014 |
| | | |
Linda McMullin (57) Assistant Treasurer | | Vice President (since 2011) and Director (2008-2011) within Prudential Mutual Fund Administration. | | Since April 2014 |
| | | |
Kelly A. Coyne (50) Assistant Treasurer | | Director, Investment Operations of Prudential Mutual Fund Services LLC (since 2010). | | Since March 2015 |
(a) Excludes Mr. Parker and Mr. Benjamin, interested Board Members who also serve as President and Vice President, respectively.
Explanatory Notes to Tables:
| ∎ | | Board Members are deemed to be “Interested,” as defined in the 1940 Act, by reason of their affiliation with PGIM Investments LLC and/or an affiliate of PGIM Investments LLC. |
| ∎ | | Unless otherwise noted, the address of all Board Members and Officers is c/o PGIM Investments LLC, 655 Broad Street, Newark, New Jersey 07102-4410. |
| ∎ | | There is no set term of office for Board Members or Officers. The Board Members have adopted a retirement policy, which calls for the retirement of Board Members on December 31 of the year in which they reach the age of 75. |
PGIM Emerging Markets Debt Local Currency Fund
| ∎ | | “Other Directorships Held” includes only directorships of companies required to register or file reports with the SEC under the 1934 Act (that is, “public companies”) or other investment companies registered under the 1940 Act. |
| ∎ | | “Portfolios Overseen” includes all investment companies managed by PGIM Investments LLC. The investment companies for which PGIM Investments LLC serves as manager include the PGIM Funds, The Prudential Variable Contract Accounts, PGIM ETF Trust, PGIM Short Duration High Yield Fund, Inc., PGIM Global Short Duration High Yield Fund, Inc., The Prudential Series Fund, Prudential’s Gibraltar Fund, Inc. and the Advanced Series Trust. |
Visit our website at pgiminvestments.com
Approval of Advisory Agreements (unaudited)
The Fund’s Board of Directors
The Board of Directors (the “Board”) of PGIM Emerging Markets Debt Local Currency Fund (the “Fund”)1 consists of twelve individuals, nine of whom are not “interested persons” of the Fund, as defined in the Investment Company Act of 1940, as amended (the “1940 Act”) (the “Independent Directors”). The Board is responsible for the oversight of the Fund and its operations, and performs the various duties imposed on the directors of investment companies by the 1940 Act. The Independent Directors have retained independent legal counsel to assist them in connection with their duties. The Chair of the Board is an Independent Director. The Board has established four standing committees: the Audit Committee, the Nominating and Governance Committee, and two Investment Committees. Each committee is chaired by, and composed of, Independent Directors.
Annual Approval of the Fund’s Advisory Agreements
As required under the 1940 Act, the Board determines annually whether to renew the Fund’s management agreement with PGIM Investments LLC (“PGIM Investments”), the Fund’s subadvisory agreement with PGIM, Inc. (“PGIM”) on behalf of its PGIM Fixed Income unit, and the Fund’s sub-subadvisory agreement with PGIM Limited (“PGIML”). In considering the renewal of the agreements, the Board, including all of the Independent Directors, met on June 7, 2018 and on June 19-21, 2018 and approved the renewal of the agreements through July 31, 2019, after concluding that the renewal of the agreements was in the best interests of the Fund and its shareholders.
In advance of the meetings, the Board requested and received materials relating to the agreements, and had the opportunity to ask questions and request further information in connection with its consideration. Among other things, the Board considered comparative fee information from PGIM Investments, PGIM, and, where appropriate, affiliates of PGIM. Also, the Board considered comparisons with other mutual funds in relevant Peer Universes and Peer Groups, as is further discussed below.
In approving the agreements, the Board, including the Independent Directors advised by independent legal counsel, considered the factors it deemed relevant, including the nature, quality and extent of services provided by PGIM Investments, the subadviser, and, as relevant, its affiliates, the performance of the Fund, the profitability of PGIM Investments and its affiliates, expenses and fees, and the potential for economies of scale that may be shared with the Fund and its shareholders as the Fund’s assets grow. In their deliberations, the Directors did not identify any single factor which alone was responsible for the Board’s decision to approve the agreements with respect to the Fund. In connection with its deliberations, the Board considered information provided by PGIM Investments throughout
| 1 | PGIM Emerging Markets Debt Local Currency Fund is a series of Prudential World Fund, Inc. |
| | |
| PGIM Emerging Markets Debt Local Currency Fund |
Approval of Advisory Agreements (continued)
the year at regular Board meetings, presentations from portfolio managers and other information, as well as information furnished at or in advance of the meetings on June 7, 2018 and on June 19-21, 2018.
The Directors determined that the overall arrangements between the Fund and PGIM Investments, which serves as the Fund’s investment manager pursuant to a management agreement, between PGIM Investments and PGIM, which, through its PGIM Fixed Income unit, serves as the Fund’s subadviser pursuant to the terms of a subadvisory agreement with PGIM Investments, and between PGIM and PGIML, which serves as the Fund’s sub-subadviser pursuant to the terms of a sub-subadvisory agreement with PGIM, are in the best interests of the Fund and its shareholders in light of the services performed, fees charged and such other matters as the Directors considered relevant in the exercise of their business judgment.
The material factors and conclusions that formed the basis for the Directors’ reaching their determinations to approve the continuance of the agreements are separately discussed below.
Nature, Quality and Extent of Services
The Board received and considered information regarding the nature, quality and extent of services provided to the Fund by PGIM Investments, PGIM Fixed Income, and PGIML. The Board considered the services provided by PGIM Investments, including but not limited to the oversight of the subadviser and sub-subadviser for the Fund, as well as the provision of fund recordkeeping, compliance, and other services to the Fund. With respect to PGIM Investments’ oversight of the subadviser and sub-subadviser, the Board noted that PGIM Investments’ Strategic Investment Research Group (“SIRG”), which is a business unit of PGIM Investments, is responsible for monitoring and reporting to PGIM Investments’ senior management on the performance and operations of the subadviser and sub-subadviser. The Board also considered that PGIM Investments pays the salaries of all of the officers and interested Directors of the Fund who are part of Fund management. The Board also considered the investment subadvisory services provided by PGIM Fixed Income and PGIML, including investment research and security selection, as well as adherence to the Fund’s investment restrictions and compliance with applicable Fund policies and procedures. The Board considered PGIM Investments’ evaluation of the subadviser and sub-subadviser, as well as PGIM Investments’ recommendation, based on its review of the subadviser and sub-subadviser, to renew the subadvisory and sub-subadvisory agreements.
The Board considered the qualifications, backgrounds and responsibilities of PGIM Investments’ senior management responsible for the oversight of the Fund, PGIM, and PGIML, and also considered the qualifications, backgrounds and responsibilities of PGIM Fixed Income’s portfolio managers who are responsible for the day-to-day management of
| | |
| Visit our website at pgiminvestments.com | | |
the Fund’s portfolio. The Board was provided with information pertaining to PGIM Investments, PGIM Fixed Income’s, and PGIML’s organizational structure, senior management, investment operations, and other relevant information pertaining to PGIM Investments, PGIM Fixed Income, and PGIML. The Board also noted that it received favorable compliance reports from the Fund’s Chief Compliance Officer (“CCO”) as to PGIM Investments, PGIM Fixed Income, and PGIML. The Board noted that PGIM Fixed Income and PGIML are affiliated with PGIM Investments.
The Board concluded that it was satisfied with the nature, extent and quality of the investment management services provided by PGIM Investments, the subadvisory services provided to the Fund by PGIM Fixed Income, and the sub-subadvisory services provided by PGIML, and that there was a reasonable basis on which to conclude that the Fund benefits from the services provided by PGIM Investments, PGIM Fixed Income, and PGIML under the management, subadvisory and sub-subadvisory agreements.
Costs of Services and Profits Realized by PGIM Investments
The Board was provided with information on the profitability of PGIM Investments and its affiliates in serving as the Fund’s investment manager. The Board discussed with PGIM Investments the methodology utilized in assembling the information regarding profitability and considered its reasonableness. The Board recognized that it is difficult to make comparisons of profitability from fund management contracts because comparative information is not generally publicly available and is affected by numerous factors, including the structure of the particular adviser, the types of funds it manages, its business mix, numerous assumptions regarding allocations and the adviser’s capital structure and cost of capital. However, the Board considered that the cost of services provided by PGIM Investments for the year ended December 31, 2017 exceeded the management fees received by PGIM Investments, resulting in an operating loss to PGIM Investments. Taking these factors into account, the Board concluded that the profitability of PGIM Investments and its affiliates in relation to the services rendered was not unreasonable.
Economies of Scale
The Board received and discussed information concerning economies of scale that PGIM Investments may realize as the Fund’s assets grow beyond current levels. The Board noted that the management fee schedule for the Fund includes breakpoints, which have the effect of decreasing the fee rate as assets increase. During the course of time, the Board has considered information regarding the launch date of the Fund, the management fees of the Fund compared to those of similarly managed funds and PGIM Investments investment in the Fund over time. The Board noted that economies of scale may be shared with the Fund in several ways, including low management fees from inception, additional
| | |
| PGIM Emerging Markets Debt Local Currency Fund |
Approval of Advisory Agreements (continued)
technological and personnel investments to enhance shareholder services, and maintaining existing expense structures in the face of a rising cost environment. The Board considered PGIM Investments’ assertion that it continually evaluates the management fee schedule of the Fund and the potential to share economies of scale through breakpoints or fee waivers as asset levels increase.
The Board recognized the inherent limitations of any analysis of economies of scale, stemming largely from the Board’s understanding that most of PGIM Investments’ costs are not specific to individual funds, but rather are incurred across a variety of products and services.
Other Benefits to PGIM Investments, PGIM Fixed Income, and PGIML
The Board considered potential ancillary benefits that might be received by PGIM Investments, PGIM Fixed Income, PGIML and their affiliates as a result of their relationship with the Fund. The Board concluded that potential benefits to be derived by PGIM Investments included transfer agency fees received by the Fund’s transfer agent (which is affiliated with PGIM Investments), as well as benefits to its reputation or other intangible benefits resulting from PGIM Investments’ association with the Fund. The Board concluded that the potential benefits to be derived by PGIM Fixed Income and PGIML included the ability to use soft dollar credits, as well as the potential benefits consistent with those generally resulting from an increase in assets under management, specifically, potential access to additional research resources and benefits to their reputations. The Board concluded that the benefits derived by PGIM Investments, PGIM Fixed Income, and PGIML were consistent with the types of benefits generally derived by investment managers and subadvisers to mutual funds.
Performance of the Fund / Fees and Expenses
The Board considered certain additional specific factors and made related conclusions relating to the historical performance of the Fund for the one-, three- and five-year periods ended December 31, 2017.
The Board also considered the Fund’s actual management fee, as well as the Fund’s net total expense ratio, for the fiscal year ended October 31, 2017. The Board considered the management fee for the Fund as compared to the management fee charged by PGIM Investments to other funds and the fee charged by other advisers to comparable mutual funds in a Peer Group. The actual management fee represents the fee rate actually paid by Fund shareholders and includes any fee waivers or reimbursements. The net total expense ratio for the Fund represents the actual expense ratio incurred by Fund shareholders.
The mutual funds included in the Peer Universe, which was used to consider performance, and the Peer Group, which was used to consider fees and expenses, were objectively
| | |
| Visit our website at pgiminvestments.com | | |
determined by Broadridge, an independent provider of mutual fund data. In certain circumstances, PGIM Investments also may have provided supplemental Peer Universe or Peer Group information, for reasons addressed with the Board. The comparisons placed the Fund in various quartiles, with the first quartile being the best 25% of the mutual funds (for performance, the best performing mutual funds and, for expenses, the lowest cost mutual funds).
The section below summarizes key factors considered by the Board and the Board’s conclusions regarding the Fund’s performance, fees and overall expenses. The table sets forth gross performance comparisons (which do not reflect the impact on performance of fund expenses, or any subsidies, expense caps or waivers that may be applicable) with the Peer Universe, actual management fees with the Peer Group (which reflect the impact of any subsidies or fee waivers), and net total expenses with the Peer Group, each of which were key factors considered by the Board.
| | | | | | | | |
| Gross Performance | | 1 Year | | 3 Years | | 5 Years | | 10 Years |
| | 2nd Quartile | | 2nd Quartile | | 2nd Quartile | | N/A |
| Actual Management Fees: 1st Quartile |
| Net Total Expenses: 2nd Quartile |
| | • | | The Board noted that the Fund outperformed its benchmark index over all periods. |
| | • | | The Board and PGIM Investments agreed to retain the existing contractual expense cap, which caps the Fund’s annual operating expenses at 1.13% for Class A shares, 1.88% for Class C shares, 0.88% for Class R6 shares, and 0.88% for Class Z shares through February 28, 2019. |
| | • | | The Board concluded that, in light of the above, it would be in the best interests of the Fund and its shareholders to renew the agreements. |
| | • | | The Board concluded that the management fees (including subadvisory fees) and total expenses were reasonable in light of the services provided. |
* * *
After full consideration of these factors, the Board concluded that the approval of the agreements was in the best interests of the Fund and its shareholders.
| | |
| PGIM Emerging Markets Debt Local Currency Fund |
| | | | |
| ∎ MAIL | | ∎ TELEPHONE | | ∎ WEBSITE |
655 Broad Street Newark, NJ 07102 | | (800) 225-1852 | | www.pgiminvestments.com |
|
| PROXY VOTING |
The Board of Directors of the Fund has delegated to the Fund’s subadviser the responsibility for voting any proxies and maintaining proxy recordkeeping with respect to the Fund. A description of these proxy voting policies and procedures is available without charge, upon request, by calling
(800) 225-1852. Information regarding how the Fund voted proxies relating to portfolio securities during the most recent 12-month period ended June 30 is available on the Fund’s website and on the Securities and Exchange Commission’s website. |
|
| DIRECTORS |
| Ellen S. Alberding • Kevin J. Bannon • Scott E. Benjamin • Linda W. Bynoe • Barry H. Evans • Keith F. Hartstein • Laurie Simon Hodrick • Michael S. Hyland • Stuart S. Parker • Richard A. Redeker • Brian K. Reid • Grace C. Torres |
|
| OFFICERS |
| Stuart S. Parker, President • Scott E. Benjamin, Vice President • Brian D. Nee, Treasurer and Principal Financial and Accounting Officer • Raymond A. O’Hara, Chief Legal Officer • Andrew R. French, Secretary • Chad A. Earnst, Chief Compliance Officer • Dino Capasso, Vice President and Deputy Chief Compliance Officer • Charles H. Smith, Anti-Money Laundering Compliance Officer • Jonathan D. Shain, Assistant Secretary • Claudia DiGiacomo, Assistant Secretary • Peter Parrella, Assistant Treasurer • Lana Lomuti, Assistant Treasurer • Linda McMullin, Assistant Treasurer • Kelly A. Coyne, Assistant Treasurer |
| | | | |
| MANAGER | | PGIM Investments LLC | | 655 Broad Street
Newark, NJ 07102 |
|
| SUBADVISER | | PGIM Fixed Income | | 655 Broad Street
Newark, NJ 07102 |
|
| DISTRIBUTOR | | Prudential Investment
Management Services LLC | | 655 Broad Street
Newark, NJ 07102 |
|
| CUSTODIAN | | The Bank of New York Mellon | | 225 Liberty Street
New York, NY 10286 |
|
| TRANSFER AGENT | | Prudential Mutual Fund
Services LLC | | PO Box 9658
Providence, RI 02940 |
|
INDEPENDENT REGISTERED
PUBLIC ACCOUNTING FIRM | | KPMG LLP | | 345 Park Avenue
New York, NY 10154 |
|
| FUND COUNSEL | | Willkie Farr & Gallagher LLP | | 787 Seventh Avenue
New York, NY 10019 |
|
|
| An investor should consider the investment objectives, risks, charges, and expenses of the Fund carefully before investing. The prospectus and summary prospectus contain this and other information about the Fund. An investor may obtain a prospectus and summary prospectus by visiting our website at www.pgiminvestments.com or by calling (800) 225-1852. The prospectus and summary prospectus should be read carefully before investing. |
|
| E-DELIVERY |
| To receive your mutual fund documents online, go to www.pgiminvestments.com/edelivery and enroll. Instead of receiving printed documents by mail, you will receive notification via email when new materials are available. You can cancel your enrollment or change your email address at any time by visiting the website address above. |
|
| SHAREHOLDER COMMUNICATIONS WITH DIRECTORS |
| Shareholders can communicate directly with the Board of Directors by writing to the Chair of the Board, PGIM Emerging Markets Debt Local Currency Fund, PGIM Investments, Attn: Board of Directors, 655 Broad Street, Newark, NJ 07102. Shareholders can communicate directly with an individual Director by writing to the same address. Communications are not screened before being delivered to the addressee. |
|
| AVAILABILITY OF PORTFOLIO SCHEDULE |
| The Fund files its complete schedule of portfolio holdings with the Securities and Exchange Commission for the first and third quarters of each fiscal year on Form N-Q. The Fund’s Forms N-Q are available on the Commission’s website at www.sec.gov. The Fund’s schedule of portfolio holdings is also available on the Fund’s website as of the end of each month no sooner than 15 days after the end of the month. |
|
| The Fund’s Statement of Additional Information contains additional information about the Fund’s Directors and is available without charge, upon request, by calling (800) 225-1852. |
Mutual Funds:
| | | | |
| ARE NOT INSURED BY THE FDIC OR ANY FEDERAL GOVERNMENT AGENCY | | MAY LOSE VALUE | | ARE NOT A DEPOSIT OF OR GUARANTEED BY ANY BANK OR ANY BANK AFFILIATE |
PGIM EMERGING MARKETS DEBT LOCAL CURRENCY FUND
| | | | | | | | |
| SHARE CLASS | | A | | C | | Z | | R6* |
| NASDAQ | | EMDAX | | EMDCX | | EMDZX | | EMDQX |
| CUSIP | | 743969750 | | 743969743 | | 743969727 | | 743969735 |
*Formerly known as Class Q shares.
MF212E

PGIM JENNISON EMERGING MARKETS EQUITY OPPORTUNITIES FUND
(Formerly known as Prudential Jennison Emerging Markets Equity Fund)
ANNUAL REPORT
OCTOBER 31, 2018
COMING SOON: PAPERLESS SHAREHOLDER REPORTS
Beginning on January 1, 2021, as permitted by regulations adopted by the Securities and Exchange Commission, paper copies of the Fund’s annual and semi-annual shareholder reports will no longer be sent by mail, unless you specifically request paper copies of the reports. Instead, the reports will be made available on the Fund’s website (www.pgiminvestments.com), and you will be notified by mail each time a report is posted and provided with a website link to access the report.
If you already elected to receive shareholder reports electronically, you will not be affected by this change and you need not take any action. You may elect to receive shareholder reports and other communications from the Fund electronically anytime by contacting your financial intermediary (such as a broker-dealer or bank) or, if you are a direct investor, by calling 1-800-225-1852 or by sending an e-mail request to PGIM Investments at shareholderreports@pgim.com.
Beginning on January 1, 2019, you may elect to receive all future reports in paper free of charge. If you invest through a financial intermediary, you can contact your financial intermediary or follow instructions included with this notice to elect to continue to receive paper copies of your shareholder reports. If you invest directly with the Fund, you can call 1-800-225-1852 or send an email request to shareholderreports@pgim.com to let the Fund know you wish to continue receiving paper copies of your shareholder reports. Your election to receive reports in paper will apply to all funds held in your account if you invest through your financial intermediary or all funds held with the fund complex if you invest directly with the Fund.

To enroll in e-delivery, go to pgiminvestments.com/edelivery
|
| Objective: Long-term growth of capital |
Highlights (unaudited)
| • | | Concerns about liquidity and the trajectory of global growth weighed heavily on emerging markets (EM) during the reporting period. Weaker investor sentiment and the effect of higher US interest rates on local US-dollar-denominated debt added to the toll. |
| • | | In China, the Fund’s largest country exposure, a slowdown in the rate of economic expansion constricted the prices of many commodities and fueled concerns about the potential ramifications on global growth. |
| • | | Several health care holdings were strong contributors to total return. |
| • | | Despite overall contributions from the communication services and consumer discretionary sectors, the Fund’s largest individual detractors were found in these sectors, including Tencent Holdings, JD.com, and Alibaba Group. |
This report is not authorized for distribution to prospective investors unless preceded or accompanied by a current prospectus.
The views expressed in this report and information about the Fund’s portfolio holdings are for the period covered by this report and are subject to change thereafter.
Mutual funds are distributed by Prudential Investment Management Services LLC, member SIPC. Jennison Associates LLC is a registered investment adviser. Both are Prudential Financial companies. © 2018 Prudential Financial, Inc. and its related entities. Jennison Associates, Jennison, PGIM, and the PGIM logo are service marks of Prudential Financial, Inc. and its related entities, registered in many jurisdictions worldwide.
| | |
| 2 | | Visit our website at pgiminvestments.com |
PGIM FUNDS — UPDATE
The Board of Directors/Trustees for the Fund has approved the implementation of an automatic conversion feature for Class C shares, effective as of April 1, 2019. To reflect these changes, effective April 1, 2019, the section of the Fund’s Prospectus entitled “How to Buy, Sell and Exchange Fund Shares—How to Exchange Your Shares—Frequent Purchases and Redemptions of Fund Shares” is restated to read as follows:
This supplement should be read in conjunction with your Summary Prospectus, Statutory Prospectus and Statement of Additional Information, be retained for future reference and is in addition to any existing Fund supplements.
| | 1. | In each Fund’s Statutory Prospectus, the following is added at the end of the section entitled “Fund Distributions And Tax Issues—If You Sell or Exchange Your Shares”: |
Automatic Conversion of Class C Shares
The conversion of Class C shares into Class A shares—which happens automatically approximately 10 years after purchase—is not a taxable event for federal income tax purposes. For more information about the automatic conversion of Class C shares, see Class C Shares Automatically Convert to Class A Shares in How to Buy, Sell and Exchange Fund Shares.
| | 2. | In each Fund’s Statutory Prospectus, the following sentence is added at the end of the section entitled “How to Buy, Sell and Exchange Shares—Closure of Certain Share Classes to New Group Retirement Plans”: |
Shareholders owning Class C shares may continue to hold their Class C shares until the shares automatically convert to Class A shares under the conversion schedule, or until the shareholder redeems their Class C shares.
| | 3. | In each Fund’s Statutory Prospectus, the following disclosure is added immediately following the section entitled “How to Buy, Sell and Exchange Shares—How to Buy Shares—Class B Shares Automatically Convert to Class A Shares”: |
Class C Shares Automatically Convert to Class A Shares
Starting on or about April 1, 2019 (the “Effective Date”), Class C shares will be eligible for automatic conversion into Class A shares on a monthly basis approximately ten years after the original date of purchase (the “Conversion Date”). Conversion will take place based on the relative NAV of the two classes, without the imposition of any sales load, fee or other charge. All such automatic conversions of Class C shares will constitute tax-free exchanges for federal income tax purposes.
For shareholders investing in Class C shares through retirement plans or omnibus accounts, and in certain other instances, the Fund and its agents may not have
| | | | |
| PGIM Jennison Emerging Markets Equity Opportunities Fund | | | 3 | |
transparency into how long a shareholder has held Class C shares for purposes of determining whether such Class C shares are eligible for automatic conversion into Class A shares, and the relevant financial intermediary may not have the ability to track purchases in order to credit individual shareholders’ holding periods. In these circumstances, the Fund will not be able to automatically convert Class C shares into Class A shares as described above. In order to determine eligibility for conversion in these circumstances, it is the responsibility of the financial intermediary to notify the Fund that the shareholder is eligible for the conversion of Class C shares to Class A shares, and the financial intermediary may be required to maintain and provide the Fund with records that substantiate the holding period of Class C shares. It is the financial intermediary’s (and not the Fund’s) responsibility to keep records of transactions made in accounts it holds and to ensure that the shareholder is credited with the proper holding period based on such records or those provided to the financial intermediary by the shareholder. Please consult with your financial intermediary for the applicability of this conversion feature to your shares.
A financial intermediary may sponsor and/or control accounts, programs or platforms that impose a different conversion schedule or different eligibility requirements for the exchange of Class C shares for Class A shares (see Appendix A: Waivers and Discounts Available From Certain Financial Intermediaries of the Prospectus). Please consult with your financial intermediary if you have any questions regarding your shares’ conversion from Class C shares to Class A shares.
| | 4. | In Part II of each Fund’s Statement of Additional Information, the following disclosure is added immediately following the section entitled “Purchase, Redemption and Pricing of Fund Shares—Share Classes—Automatic Conversion of Class B Shares”: |
AUTOMATIC CONVERSION OF CLASS C SHARES. Starting on or about April 1, 2019 (the “Effective Date”), Class C shares will be eligible for automatic conversion into Class A shares on a monthly basis approximately ten years after the original date of purchase (the “Conversion Date”). Conversion will take place based on the relative NAV of the two classes, without the imposition of any sales load, fee or other charge. Class C shares of a Fund acquired through automatic reinvestment of dividends or distributions will convert to Class A shares of the Fund on the Conversion Date pro rata with the converting Class C shares of the Fund that were not acquired through reinvestment of dividends or distributions. All such automatic conversions of Class C shares will constitute tax-free exchanges for federal income tax purposes.
For shareholders investing in Class C shares through retirement plans or omnibus accounts, and in certain other instances, the Fund and its agents may not have transparency into how long a shareholder has held Class C shares for purposes of determining whether such Class C shares are eligible for automatic conversion into Class A shares, and the relevant financial intermediary may not have the ability to track purchases in order to credit individual shareholders’ holding periods. In these circumstances, the
| | |
| 4 | | Visit our website at pgiminvestments.com |
Fund will not be able to automatically convert Class C shares into Class A shares as described above. In order to determine eligibility for conversion in these circumstances, it is the responsibility of the financial intermediary to notify the Fund that the shareholder is eligible for the conversion of Class C shares to Class A shares, and the financial intermediary may be required to maintain and provide the Fund with records that substantiate the holding period of Class C shares. It is the financial intermediary’s (and not the Fund’s) responsibility to keep records of transactions made in accounts it holds and to ensure that the shareholder is credited with the proper holding period based on such records or those provided to the financial intermediary by the shareholder. Please consult with your financial intermediary for the applicability of this conversion feature to your shares.
Class C shares were generally closed to investments by new group retirement plans effective June 1, 2018. Group retirement plans (and their successor, related and affiliated plans) that have Class C shares of the Fund available to participants on or before the Effective Date may continue to open accounts for new participants in such share class and purchase additional shares in existing participant accounts.
The Fund has no responsibility for monitoring or implementing a financial intermediary’s process for determining whether a shareholder meets the required holding period for conversion. A financial intermediary may sponsor and/or control accounts, programs or platforms that impose a different conversion schedule or different eligibility requirements for the exchange of Class C shares for Class A shares, as set forth on Appendix A: Waivers and Discounts Available From Certain Financial Intermediaries of the Prospectus. In these cases, Class C shareholders may have their shares exchanged for Class A shares under the policies of the financial intermediary. Financial intermediaries will be responsible for making such exchanges in those circumstances. Please consult with your financial intermediary if you have any questions regarding your shares’ conversion from Class C shares to Class A shares.
LR1094
- Not part of the Annual Report -
| | | | |
| PGIM Jennison Emerging Markets Equity Opportunities Fund | | | 5 | |
Table of Contents
| | |
| 6 | | Visit our website at pgiminvestments.com |
Letter from the President

Dear Shareholder:
We hope you find the annual report for PGIM Jennison Emerging Markets Equity Opportunities Fund informative and useful. The report covers performance for the 12-month period that ended October 31, 2018.
We have important information to share with you. Effective June 11, 2018, Prudential Mutual Funds were renamed PGIM Funds. This renaming is part of our ongoing effort to further build our reputation and establish our global brand, which began when our firm adopted PGIM Investments as its name in April 2017. Please note that only the Fund’s name has changed. Your Fund’s management and operation, along with its symbols, remained the same.*
During the reporting period, the global economy continued to grow, and central banks gradually tightened monetary policy. In the US, the economy expanded and employment increased. In September, the Federal Reserve hiked interest rates for the eighth time since 2015, based on confidence in the economy.
Equity returns on the whole were strong, due to optimistic earnings expectations and investor sentiment. Global equities, including emerging markets, generally posted positive returns. However, they trailed the performance of US equities, which rose on higher corporate profits, new regulatory policies, and tax reform benefits. Volatility spiked briefly early in the period on inflation concerns, rising interest rates, and a potential global trade war, and again late in the period on worries that profit growth might slow in 2019.
The overall bond market declined modestly during the period, as measured by the Bloomberg Barclays US Aggregate Bond Index. The best performance came from higher-yielding, economically sensitive sectors, such as high yield bonds and bank loans, which posted small gains. US investment-grade corporate bonds and US Treasury bonds both finished the period with negative returns. A major trend during the period was the flattening of the US Treasury yield curve, which increased the yield on fixed income investments with shorter maturities and made them more attractive to investors.
Regarding your investments with PGIM, we believe it is important to maintain a diversified portfolio of funds consistent with your tolerance for risk, time horizon, and financial goals. Your financial advisor can help you create a diversified investment plan that may include funds covering all the basic asset classes and that reflects your personal investor profile and risk tolerance. However, diversification and asset allocation strategies do not assure a profit or protect against loss in declining markets.
At PGIM Investments, we consider it a great privilege and responsibility to help investors participate in opportunities across global markets while meeting their toughest investment challenges. PGIM is a top-10 global investment manager with more than $1 trillion in assets under management. This investment expertise allows us to deliver actively managed funds and strategies to meet the needs of investors around the globe.
Thank you for choosing our family of funds.
Sincerely,

Stuart S. Parker, President
PGIM Jennison Emerging Markets Equity Opportunities Fund
December 14, 2018
*The Prudential Day One Funds did not change their names.
| | | | |
| PGIM Jennison Emerging Markets Equity Opportunities Fund | | | 7 | |
Your Fund’s Performance (unaudited)
Performance data quoted represents past performance. Past performance does not guarantee future results. The investment return and principal value of an investment will fluctuate, so that an investor’s shares, when redeemed, may be worth more or less than their original cost. Current performance may be lower or higher than the past performance data quoted. An investor may obtain performance data as of the most recent month-end by visiting our website at www.pgiminvestments.com or by calling (800) 225-1852.
| | | | | | |
| | | Average Annual Total Returns as of 10/31/18
(with sales charges) | |
| | | One Year (%) | | Since Inception (%) | |
| Class A | | –19.02 | | | –2.38 (9/16/14) | |
| Class C | | –15.85 | | | –1.77 (9/16/14) | |
| Class Z | | –14.20 | | | –0.81 (9/16/14) | |
| Class R6* | | –14.20 | | | –0.80 (9/16/14) | |
| MSCI Emerging Markets Index | | | | | | |
| | –12.52 | | | 1.09 | |
| Lipper Emerging Markets Funds Average | |
| | | –13.58 | | | –0.30 | |
| | | | | | |
| | | Average Annual Total Returns as of 10/31/18 (without sales charges) | |
| | | One Year (%) | | Since Inception (%) | |
| Class A | | –14.31 | | | –1.03 (9/16/14) | |
| Class C | | –15.00 | | | –1.77 (9/16/14) | |
| Class Z | | –14.20 | | | –0.81 (9/16/14) | |
| Class R6* | | –14.20 | | | –0.80 (9/16/14) | |
| MSCI Emerging Markets Index | | | | | | |
| | –12.52 | | | 1.09 | |
| Lipper Emerging Markets Funds Average | | | | | | |
| | | –13.58 | | | –0.30 | |
| | |
| 8 | | Visit our website at pgiminvestments.com |
Growth of a $10,000 Investment (unaudited)
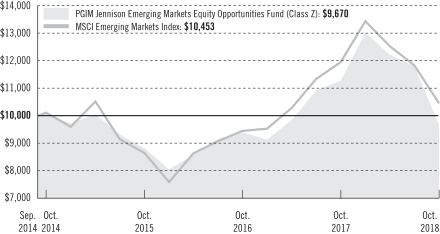
The graph compares a $10,000 investment in the Fund’s Class Z shares with a similar investment in the MSCI Emerging Markets Index, by portraying the initial account values at the commencement of operations for Class Z shares (September 16, 2014) and the account values at the end of the current fiscal year (October 31, 2018) as measured on a quarterly basis. For purposes of the graph, and unless otherwise indicated, it has been assumed that (a) all recurring fees (including management fees) were deducted; and (b) all dividends and distributions were reinvested. The line graph provides information for Class Z shares only. As indicated in the tables provided earlier, performance for other share classes will vary due to the differing charges and expenses applicable to each share class (as indicated in the following paragraphs). Without waiver of fees and/or expense reimbursements, if any, the Fund’s returns would have been lower.
Past performance does not predict future performance. Total returns and the ending account values in the graph include changes in share price and reinvestment of dividends and capital gains distributions in a hypothetical investment for the periods shown. The Fund’s total returns do not reflect the deduction of income taxes on an individual’s investment. Taxes may reduce your actual investment returns on income or gains paid by the Fund or any gains you may realize if you sell your shares.
Source: PGIM Investments LLC and Lipper Inc.
*Formerly known as Class Q shares.
Since Inception returns are provided since the Fund has less than 10 fiscal years of returns. Since Inception returns for the Index and the Lipper Average are measured from the closest month-end to the Fund’s inception date.
| | | | |
| PGIM Jennison Emerging Markets Equity Opportunities Fund | | | 9 | |
Your Fund’s Performance (continued)
The returns in the tables do not reflect the deduction of taxes that a shareholder would pay on Fund distributions or following the redemption of Fund shares. The average annual total returns take into account applicable sales charges, which are described for each share class in the table below.
| | | | | | | | |
| | | Class A | | Class C | | Class Z | | Class R6* |
| Maximum initial sales charge | | 5.50% of the public offering price | | None | | None | | None |
| Contingent deferred sales charge (CDSC) (as a percentage of the lower of original purchase price or net asset value at redemption) | | 1.00% on sales of $1 million or more made within 12 months of purchase | | 1.00% on sales made within 12 months of purchase | | None | | None |
| Annual distribution and service (12b-1) fees (shown as a percentage of average daily net assets) | | 0.30% (0.25% currently) | | 1.00% | | None | | None |
*Formerly known as Class Q shares.
Benchmark Definitions
MSCI Emerging Markets Index—The MSCI Emerging Markets Index is an unmanaged free float-adjusted market capitalization index that is designed to measure equity market performance of emerging markets. The MSCI Emerging Markets Index consists of the following 24 emerging market country indexes: Brazil, Chile, China, Colombia, the Czech Republic, Egypt, Greece, Hungary, India, Indonesia, Korea, Malaysia, Mexico, Pakistan, Peru, the Philippines, Poland, Qatar, Russia, South Africa, Taiwan, Thailand, Turkey, and the United Arab Emirates.
Lipper Emerging Markets Funds Average—The Lipper Emerging Markets Funds Average (Lipper Average) includes funds that seek long-term capital appreciation by investing at least 65% of total assets in emerging market equity securities, where “emerging market” is defined by a country’s GNP per capita or other economic measures.
Investors cannot invest directly in an index or average. The returns for the Index would be lower if they included the effects of sales charges, operating expenses of a mutual fund, or taxes. Returns for the Lipper Average reflect the deduction of operating expenses of a mutual fund, but not sales charges or taxes.
| | |
| 10 | | Visit our website at pgiminvestments.com |
Presentation of Fund Holdings
| | | | |
Five Largest Holdings expressed as a
percentage of net assets as of 10/31/18 (%) | |
| MercadoLibre, Inc., Internet & Direct Marketing Retail | | | 8.1 | |
| Alibaba Group Holding Ltd., Internet & Direct Marketing Retail | | | 7.4 | |
| Tencent Holdings Ltd., Interactive Media & Services | | | 7.3 | |
| Biocon Ltd., Biotechnology | | | 4.5 | |
| MakeMyTrip Ltd., Internet & Direct Marketing Retail | | | 4.3 | |
Holdings reflect only long-term investments and are subject to change.
| | | | |
Five Largest Industries expressed as a
percentage of net assets as of 10/31/18 (%) | |
| Internet & Direct Marketing Retail | | | 25.0 | |
| Interactive Media & Services | | | 8.9 | |
| Banks | | | 6.0 | |
| Biotechnology | | | 6.0 | |
| Food & Staples Retailing | | | 6.0 | |
Industry weightings reflect only long-term investments and are subject to change.
| | | | |
| PGIM Jennison Emerging Markets Equity Opportunities Fund | | | 11 | |
Strategy and Performance Overview (unaudited)
How did the Fund perform?
The PGIM Jennison Emerging Markets Equity Opportunities Fund’s Class Z shares returned –14.20% in the 12-month reporting period that ended October 31, 2018, underperforming the –12.52% return of the MSCI Emerging Markets Index (the Index) and the –13.58% return of the Lipper Emerging Markets Funds Average.
What were the market conditions?
| • | | Concerns about liquidity and the trajectory of global growth weighed heavily on emerging markets (EM) during the reporting period. Weaker investor sentiment and the effect of higher US interest rates on local US-dollar-denominated debt added to the toll. |
| • | | In China, the Fund’s largest country exposure, a slowdown in the rate of economic expansion constricted the prices of many commodities and fueled concerns about the potential ramifications on global growth. |
| • | | Trade tensions between China and the United States intensified toward the end of the period, creating another headwind for EM stocks. |
| • | | Within the Index, energy was the only sector that rose. Growth-oriented sectors like consumer discretionary, communication services, and information technology were the worst-performing groups. |
What worked?
Health care holdings were strong contributors to performance in the reporting period.
| • | | Bangkok Dusit Medical Services is the largest private hospital in Thailand, in terms of revenue and hospitals network. The firm owns and manages 45 hospitals, catering to middle-to-high-income Thai and international patients through its six hospital brands. The stock benefited from the firm’s margin improvement and broad-based revenue growth as volumes picked up across segments. Jennison believes the company’s strong network and reach in Thailand is unparalleled, and that it should benefit from rising demand for health care in the country. Further, Jennison anticipates steady growth and continued margin improvement as bed utilization improves and its wellness initiatives gain traction. |
| • | | Biocon Ltd., India’s largest biopharmaceutical company, has successfully developed and marketed a range of novel therapies at affordable prices to treat diabetes, cancer, autoimmune disease, and other conditions. The firm’s reported strong financial results, with revenue growing 20% year over year, led by the firm’s Biologics and Research Services businesses. Looking ahead, Jennison believes the company will benefit from substantial and unfolding global biosimilar opportunity and favorably views its monetization prospects and product pipeline. Biosimilars are medical products that are almost identical to original products manufactured by other companies. |
| | |
| 12 | | Visit our website at pgiminvestments.com |
Stock selection and an underweighting in communication services also contributed to Fund performance.
| • | | IQIYI (IQ) is an online entertainment service company often referred to as the “Netflix of China.” It offers a video subscription service with a rapidly growing subscriber base. In its first quarter as a public company, IQ reported better-than-anticipated revenue and earnings, driven by membership services and online advertising. Jennison views positively the company’s opportunity as a first mover to grow a subscription model by developing popular original content. |
The consumer discretionary sector also added value. Stock selection was strong, but the Fund’s higher weighting than the Index in one of the worst-performing sectors offset some of the gain.
| • | | MercadoLibre, Inc. (MELI) is a Buenos Aires-based online trading service that enables individuals and businesses to electronically sell and buy items in thousands of categories. Jennison views positively MELI’s strong execution and enhanced marketplace initiatives, including integrated shipping and payment systems, as well as its exposure to Latin America’s expanding Internet penetration and low e-commerce share of the overall retail market. MELI’s second-quarter revenues were above expectations, despite disruption in Brazil due to a trucker strike. Jennison also believes that MELI made good progress on various long-term initiatives in areas such as fulfillment and payments. |
In financial services:
| • | | Cathay Financial was a standout this period. The Taiwan-based company provides various financial services, such as life insurance, banking, wealth management, and consumer and corporate financing. Shares of Cathay benefited from earnings growth based on a strong product selection and strong profitability in its banking and insurance businesses. Jennison believes this level of profitability can continue, and views the stock’s value as very attractive given the firm’s growth potential. |
What didn’t work?
Having no exposure to energy, a large underweight in financials, and stock selection in materials detracted from the Fund’s results.
Despite overall contributions from communication services and consumer discretionary, the Fund’s largest individual detractors were found in these sectors.
| • | | Tencent Holdings Ltd. is the largest videogame publisher in the world by revenue, but is best known in China for its popular WeChat and QQ messaging and mobile payment apps. The company also offers services similar to Facebook, Twitter, and Netflix; a cloud service for businesses; a news service; and a payment and financial services business. |
| | | | |
| PGIM Jennison Emerging Markets Equity Opportunities Fund | | | 13 | |
Strategy and Performance Overview (continued)
| | Tencent shares declined during the period on regulatory and macroeconomic uncertainties. Still, Jennison anticipates that the company’s accelerating earnings and revenue growth will resume, driven by its dominant market position in China’s online gaming and messaging segments, and its growing efforts in advertising and payment services. Jennison also expects Tencent to overcome the regulatory roadblocks restricting its ability to monetize new games. |
| • | | JD.com is China’s largest direct sales company (measured by transaction volume) and second-largest e-commerce business (after Alibaba Group). It sells products on its website, including books, electronics and computers, office and school supplies, and home appliances. Jennison expects that competition and investment in new initiatives will weigh on margins for the next several quarters so it eliminated the position in October as the investment thesis was not playing out as expected. |
| • | | Shares of Alibaba Group, one of the world’s largest e-commerce firms, underperformed on macroeconomic uncertainties, some softness in China’s online retail market, and tariff concerns. In addition, the company increased its pace of investment spending to take advantage of new market opportunities in China, resulting in falling earnings estimates. Jennison believes Alibaba’s various business segments have the potential for durable, high revenue growth. The company’s new Taobao interface, which features a personalized recommendation feed, could meaningfully increase sales over the long term. While Jennison is closely monitoring economic conditions in China, it believes Alibaba’s structural growth remains very compelling. |
| • | | Ctrip.com International is China’s leading online travel agency. Its app allows hotel bookings; air, bus, cruise, and train ticketing; car rentals; local tour visits; and group-buy deals. Ctrip continues to invest in mobile Internet technology, new products, platform infrastructure, and branding in order to expand its service offerings and penetrate lower-tier cities. Jennison believes that international ticketing and a focus on lower-tier cities will continue to drive strong growth for the company. Shares were weak given softer Chinese travel trends. |
| • | | New Delhi-based Maruti Suzuki India is a subsidiary of Japan-based Suzuki and India’s largest original equipment manufacturer of passenger cars. It has 18 brands and exports to Latin America, Africa, Southeast Asia, and Europe. The stock declined in the period despite a solid earnings report that included volume growth, rural demand recovery, and market share gains. Jennison believes that concerns over capacity and rising raw material costs could be reasons for the decline in share price. Still, Jennison views favorably the company’s strong earnings growth and dominant position in India’s passenger car market. |
| | |
| 14 | | Visit our website at pgiminvestments.com |
Current outlook
| • | | From the peak in January to recent lows, the Index is down significantly and risk-off sentiment remains high. While concerns about liquidity, the US dollar, and the trajectory of global growth warrant increased attention, Jennison believes much of the news is already discounted in stock prices, but is closely monitoring the macro environment and currencies. |
| • | | Jennison’s overall view of the EM macroeconomic environment remains cautiously optimistic, believing there are favorable fundamentals and greater resilience today than in prior episodes of market stress. Nevertheless in the second quarter, Jennison trimmed the Fund’s exposure to particularly vulnerable economies like Indonesia and Brazil. Jennison thinks it is paramount to focus on company-specific fundamentals to better weather macro slowdowns. |
| • | | China continues its path to drive economic growth through domestic consumer demand rather than exports and massive public works programs. This is a fundamental research in progress that should allow China to make inroads on high value-added economic activity, in Jennison’s view. Despite risks, Jennison observes more-balanced and better-quality growth in the Chinese economy. Jennison’s work and the positions the Fund holds in Chinese equities are focused on the rapidly growing e-commerce and Internet platform opportunities that are less exposed to the more volatile sectors of the Chinese economy. |
| • | | Overall, conditions favor Jennison’s bottom-up investment approach over a reasonable investment horizon, and Jennison continues to believe a bottom-up approach is the best way to navigate market volatility. |
The percentage points shown in the tables below identify each security’s positive or negative contribution to the Fund’s return relative to the benchmark, which is the sum of all contributions by individual holdings.
| | | | | | | | |
| Top contributors (%) | | | Top detractors (%) |
| MercadoLibre, Inc. | | | 1.50 | | | Tencent Holdings Ltd. | | –1.62 |
| Biocon, Ltd. | | | 1.20 | | | Alibaba Group | | –1.56 |
| iQIYI | | | 0.34 | | | JD.com, Inc. | | –1.16 |
| Cathay Financial | | | 0.21 | | | Ctrip.com International | | –1.01 |
| Bangkok Dusit Medical Services | | | 0.17 | | | Maruti Suzuki | | –0.83 |
| | | | |
| PGIM Jennison Emerging Markets Equity Opportunities Fund | | | 15 | |
Fees and Expenses (unaudited)
As a shareholder of the Fund, you incur two types of costs: (1) transaction costs, including sales charges (loads) on purchase payments and redemptions, as applicable, and (2) ongoing costs, including management fees, distribution, and/or service (12b-1) fees, and other Fund expenses, as applicable. This example is intended to help you understand your ongoing costs (in dollars) of investing in the Fund and to compare these costs with the ongoing costs of investing in other mutual funds.
The example is based on an investment of $1,000 held through the six-month period ended October 31, 2018. The example is for illustrative purposes only; you should consult the Prospectus for information on initial and subsequent minimum investment requirements.
Actual Expenses
The first line for each share class in the table on the following page provides information about actual account values and actual expenses. You may use the information on this line, together with the amount you invested, to estimate the expenses that you paid over the period. Simply divide your account value by $1,000 (for example, an $8,600 account value ÷ $1,000 = 8.6), then multiply the result by the number on the first line under the heading “Expenses Paid During the Six-Month Period” to estimate the expenses you paid on your account during this period.
Hypothetical Example for Comparison Purposes
The second line for each share class in the table on the following page provides information about hypothetical account values and hypothetical expenses based on the Fund’s actual expense ratio and an assumed rate of return of 5% per year before expenses, which is not the Fund’s actual return. The hypothetical account values and expenses may not be used to estimate the actual ending account balance or expenses you paid for the period. You may use this information to compare the ongoing costs of investing in the Fund and other funds. To do so, compare this 5% hypothetical example with the 5% hypothetical examples that appear in the shareholder reports of the other funds.
The Fund’s transfer agent may charge additional fees to holders of certain accounts that are not included in the expenses shown in the table on the following page. These fees apply to individual retirement accounts (IRAs) and Section 403(b) accounts. As of the close of the six-month period covered by the table, IRA fees included an annual maintenance fee of $15 per account (subject to a maximum annual maintenance fee of $25 for all accounts held by the same shareholder). Section 403(b) accounts are charged an annual $25 fiduciary maintenance fee. Some of the fees may vary in amount, or may be waived, based on your total account balance or the number of PGIM funds, including the Fund, that you own. You should consider the additional fees that were charged to your Fund account over the six-month period when you estimate the total ongoing expenses paid over the period
| | |
| 16 | | Visit our website at pgiminvestments.com |
and the impact of these fees on your ending account value, as these additional expenses are not reflected in the information provided in the expense table. Additional fees have the effect of reducing investment returns.
Please note that the expenses shown in the table are meant to highlight your ongoing costs only and do not reflect any transactional costs such as sales charges (loads). Therefore, the second line for each share class in the table is useful in comparing ongoing costs only and will not help you determine the relative total costs of owning different funds. In addition, if these transactional costs were included, your costs would have been higher.
| | | | | | | | | | | | | | | | | | |
PGIM
Jennison Emerging
Markets Equity
Opportunities Fund | | Beginning Account
Value
May 1, 2018 | | | Ending Account
Value
October 31, 2018 | | | Annualized
Expense Ratio
Based on the
Six-Month Period | | | Expenses Paid
During the
Six-Month Period* | |
| Class A | | Actual | | $ | 1,000.00 | | | $ | 791.10 | | | | 1.45 | % | | $ | 6.55 | |
| | Hypothetical | | $ | 1,000.00 | | | $ | 1,017.90 | | | | 1.45 | % | | $ | 7.38 | |
| Class C | | Actual | | $ | 1,000.00 | | | $ | 788.00 | | | | 2.20 | % | | $ | 9.91 | |
| | Hypothetical | | $ | 1,000.00 | | | $ | 1,014.12 | | | | 2.20 | % | | $ | 11.17 | |
| Class Z | | Actual | | $ | 1,000.00 | | | $ | 791.30 | | | | 1.20 | % | | $ | 5.42 | |
| | Hypothetical | | $ | 1,000.00 | | | $ | 1,019.16 | | | | 1.20 | % | | $ | 6.11 | |
| Class R6** | | Actual | | $ | 1,000.00 | | | $ | 791.30 | | | | 1.20 | % | | $ | 5.42 | |
| | | Hypothetical | | $ | 1,000.00 | | | $ | 1,019.16 | | | | 1.20 | % | | $ | 6.11 | |
*Fund expenses (net of fee waivers or subsidies, if any) for each share class are equal to the annualized expense ratio for each share class (provided in the table), multiplied by the average account value over the period, multiplied by the 184 days in the six-month period ended October 31, 2018, and divided by the 365 days in the Fund's fiscal year ended October 31, 2018 (to reflect the six-month period). Expenses presented in the table include the expenses of any underlying portfolios in which the Fund may invest.
**Formerly known as Class Q shares.
| | | | |
| PGIM Jennison Emerging Markets Equity Opportunities Fund | | | 17 | |
Schedule of Investments
as of October 31, 2018
| | | | | | | | |
| Description | | Shares | | | Value | |
LONG-TERM INVESTMENTS 98.0% | | | | | | | | |
| | |
COMMON STOCKS | | | | | | | | |
| | |
Argentina 8.1% | | | | | | | | |
MercadoLibre, Inc. | | | 3,618 | | | $ | 1,174,041 | |
| | |
Brazil 6.0% | | | | | | | | |
Lojas Renner SA | | | 34,337 | | | | 347,661 | |
Pagseguro Digital Ltd. (Class A Stock)* | | | 12,367 | | | | 333,785 | |
Raia Drogasil SA | | | 11,756 | | | | 198,792 | |
| | | | | | | | |
| | | | | | | 880,238 | |
| | |
Chile 2.5% | | | | | | | | |
Sociedad Quimica y Minera de Chile SA, ADR(a) | | | 8,367 | | | | 366,558 | |
| | |
China 36.0% | | | | | | | | |
Alibaba Group Holding Ltd., ADR* | | | 7,625 | | | | 1,084,885 | |
Ascletis Pharma, Inc., 144A* | | | 18,759 | | | | 13,664 | |
Baidu, Inc., ADR* | | | 1,210 | | | | 229,973 | |
BeiGene Ltd., ADR*(a) | | | 1,557 | | | | 196,089 | |
Ctrip.com International Ltd., ADR* | | | 15,556 | | | | 517,704 | |
Hangzhou Hikvision Digital Technology Co. Ltd. (Class A Stock) | | | 30,685 | | | | 107,260 | |
Hua Medicine, 144A* | | | 22,350 | | | | 19,854 | |
Innovent Biologics, Inc., 144A* | | | 3,689 | | | | 7,799 | |
iQIYI, Inc., ADR*(a) | | | 12,335 | | | | 242,259 | |
Jiangsu Hengrui Medicine Co. Ltd. (Class A Stock) | | | 59,592 | | | | 525,894 | |
Kweichow Moutai Co. Ltd. (Class A Stock) | | | 6,550 | | | | 517,531 | |
Meituan Dianping (Class B Stock)* | | | 26,301 | | | | 170,042 | |
Meituan Dianping (Class B Stock), 144A* | | | 10,000 | | | | 64,652 | |
Tencent Holdings Ltd. | | | 31,031 | | | | 1,065,891 | |
Wuxi Biologics Cayman, Inc., 144A* | | | 67,235 | | | | 483,409 | |
| | | | | | | | |
| | | | | | | 5,246,906 | |
| | |
India 24.4% | | | | | | | | |
Ashok Leyland Ltd. | | | 213,565 | | | | 332,949 | |
Asian Paints Ltd. | | | 21,320 | | | | 355,794 | |
Biocon Ltd. | | | 73,147 | | | | 654,129 | |
Eicher Motors Ltd. | | | 729 | | | | 216,412 | |
Godrej Consumer Products Ltd. | | | 46,369 | | | | 455,771 | |
HDFC Bank Ltd., ADR | | | 4,201 | | | | 373,511 | |
MakeMyTrip Ltd.* | | | 25,070 | | | | 621,485 | |
Maruti Suzuki India Ltd. | | | 4,243 | | | | 380,731 | |
Titan Co. Ltd. | | | 13,692 | | | | 157,004 | |
| | | | | | | | |
| | | | | | | 3,547,786 | |
See Notes to Financial Statements.
| | | | |
| PGIM Jennison Emerging Markets Equity Opportunities Fund | | | 19 | |
Schedule of Investments (continued)
as of October 31, 2018
| | | | | | | | |
| Description | | Shares | | | Value | |
COMMON STOCKS (Continued) | | | | | | | | |
| | |
Indonesia 6.1% | | | | | | | | |
Ace Hardware Indonesia Tbk PT | | | 5,467,747 | | | $ | 493,165 | |
Mitra Adiperkasa Tbk PT | | | 7,634,990 | | | | 402,051 | |
| | | | | | | | |
| | | | | | | 895,216 | |
| | |
Macau 1.8% | | | | | | | | |
Sands China Ltd. | | | 64,283 | | | | 254,746 | |
| | |
Malaysia 1.7% | | | | | | | | |
IHH Healthcare Bhd | | | 205,448 | | | | 245,402 | |
| | |
Mexico 1.5% | | | | | | | | |
Arca Continental SAB de CV | | | 43,861 | | | | 220,242 | |
| | |
Peru 2.0% | | | | | | | | |
Credicorp Ltd. | | | 1,310 | | | | 295,680 | |
| | |
Russia 1.3% | | | | | | | | |
X5 Retail Group NV, GDR | | | 7,546 | | | | 177,331 | |
X5 Retail Group NV, GDR | | | 661 | | | | 15,561 | |
| | | | | | | | |
| | | | | | | 192,892 | |
| | |
Thailand 6.6% | | | | | | | | |
Bangkok Dusit Medical Services PCL (Class F Stock) | | | 364,036 | | | | 269,589 | |
CP ALL PCL | | | 240,542 | | | | 488,814 | |
Kasikornbank PCL, NVDR | | | 32,846 | | | | 197,670 | |
| | | | | | | | |
| | | | | | | 956,073 | |
| | | | | | | | |
TOTAL LONG-TERM INVESTMENTS
(cost $12,533,227) | | | | | | | 14,275,780 | |
| | | | | | | | |
|
SHORT-TERM INVESTMENTS 8.2% | |
|
AFFILIATED MUTUAL FUNDS | |
PGIM Core Ultra Short Bond Fund(w) | | | 394,167 | | | | 394,167 | |
See Notes to Financial Statements.
| | | | | | | | |
| Description | | Shares | | | Value | |
AFFILIATED MUTUAL FUNDS (Continued) | | | | | | | | |
PGIM Institutional Money Market Fund
(cost $807,439; includes $806,371 of cash collateral for securities on loan)(b)(w) | | | 807,439 | | | $ | 807,439 | |
| | | | | | | | |
TOTAL SHORT-TERM INVESTMENTS
(cost $1,201,606) | | | | | | | 1,201,606 | |
| | | | | | | | |
TOTAL INVESTMENTS 106.2%
(cost $13,734,833) | | | | | | | 15,477,386 | |
Liabilities in excess of other assets (6.2)% | | | | | | | (909,645 | ) |
| | | | | | | | |
NET ASSETS 100.0% | | | | | | $ | 14,567,741 | |
| | | | | | | | |
The following abbreviations are used in the annual report:
144A—Security was purchased pursuant to Rule 144A under the Securities Act of 1933 and may not be resold subject to that rule except to qualified institutional buyers. Unless otherwise noted, 144A securities are deemed to be liquid.
ADR—American Depositary Receipt
GDR—Global Depositary Receipt
LIBOR—London Interbank Offered Rate
NVDR—Non-voting Depositary Receipt
| * | Non-income producing security. |
| (a) | All or a portion of security is on loan. The aggregate market value of such securities, including those sold and pending settlement, is $794,105; cash collateral of $806,371 (included in liabilities) was received with which the Series purchased highly liquid short-term investments. |
| (b) | Represents security purchased with cash collateral received for securities on loan and includes dividend reinvestment. |
| (w) | PGIM Investments LLC, the manager of the Series, also serves as manager of the PGIM Core Ultra Short Bond Fund and PGIM Institutional Money Market Fund. |
Fair Value Measurements:
Various inputs are used in determining the value of the Series’ investments. These inputs are summarized in the three broad levels listed below.
Level 1—unadjusted quoted prices generally in active markets for identical securities.
Level 2—quoted prices for similar securities, interest rates and yield curves, prepayment speeds, foreign currency exchange rates and other observable inputs.
Level 3—unobservable inputs for securities valued in accordance with Board approved fair valuation procedures.
The following is a summary of the inputs used as of October 31, 2018 in valuing such portfolio securities:
| | | | | | | | | | | | |
| | | Level 1 | | | Level 2 | | | Level 3 | |
Investments in Securities | | | | | | | | | | | | |
Common Stocks | | | | | | | | | | | | |
Argentina | | $ | 1,174,041 | | | $ | — | | | $ | — | |
Brazil | | | 880,238 | | | | — | | | | — | |
Chile | | | 366,558 | | | | — | | | | — | |
See Notes to Financial Statements.
| | | | |
| PGIM Jennison Emerging Markets Equity Opportunities Fund | | | 21 | |
Schedule of Investments (continued)
as of October 31, 2018
| | | | | | | | | | | | |
| | | Level 1 | | | Level 2 | | | Level 3 | |
Investments in Securities (continued) | | | | | | | | | | | | |
Common Stocks (continued) | | | | | | | | | | | | |
China | | $ | 2,278,709 | | | $ | 2,968,197 | | | $ | — | |
India | | | 994,996 | | | | 2,552,790 | | | | — | |
Indonesia | | | — | | | | 895,216 | | | | — | |
Macau | | | — | | | | 254,746 | | | | — | |
Malaysia | | | — | | | | 245,402 | | | | — | |
Mexico | | | 220,242 | | | | — | | | | — | |
Peru | | | 295,680 | | | | — | | | | — | |
Russia | | | 192,892 | | | | — | | | | — | |
Thailand | | | 197,670 | | | | 758,403 | | | | — | |
Affiliated Mutual Funds | | | 1,201,606 | | | | — | | | | — | |
| | | | | | | | | | | | |
Total | | $ | 7,802,632 | | | $ | 7,674,754 | | | $ | — | |
| | | | | | | | | | | | |
Industry Classification:
The industry classification of investments and liabilities in excess of other assets shown as a percentage of net assets as of October 31, 2018 were as follows (unaudited):
| | | | |
Internet & Direct Marketing Retail | | | 25.0 | % |
Interactive Media & Services | | | 8.9 | |
Affiliated Mutual Funds (5.5% represents investments purchased with collateral from securities on loan) | | | 8.2 | |
Food & Staples Retailing | | | 6.0 | |
Biotechnology | | | 6.0 | |
Banks | | | 6.0 | |
Multiline Retail | | | 5.1 | |
Beverages | | | 5.1 | |
Chemicals | | | 4.9 | |
Automobiles | | | 4.1 | |
Pharmaceuticals | | | 3.7 | |
Health Care Providers & Services | | | 3.5 | |
Specialty Retail | | | 3.4 | |
Life Sciences Tools & Services | | | 3.3 | % |
Personal Products | | | 3.1 | |
IT Services | | | 2.3 | |
Machinery | | | 2.3 | |
Hotels, Restaurants & Leisure | | | 1.8 | |
Entertainment | | | 1.7 | |
Textiles, Apparel & Luxury Goods | | | 1.1 | |
Electronic Equipment, Instruments & Components | | | 0.7 | |
| | | | |
| | | 106.2 | |
Liabilities in excess of other assets | | | (6.2 | ) |
| | | | |
| | | 100.0 | % |
| | | | |
Financial Instruments/Transactions—Summary of Offsetting and Netting Arrangements:
The Series entered into financial instruments/transactions during the reporting period that are either offset in accordance with current requirements or are subject to enforceable master netting arrangements or similar agreements that permit offsetting. The information about offsetting and related netting arrangements for financial instruments/transactions, where the legal right to set-off exists, is presented in the summary below.
See Notes to Financial Statements.
Offsetting of financial instrument/transaction assets and liabilities:
| | | | | | | | | | | | |
Description | | Gross Market
Value of
Recognized
Assets/(Liabilities) | | | Collateral
Pledged/
(Received)(1) | | | Net Amount | |
Securities on Loan | | $ | 794,105 | | | $ | (794,105 | ) | | $ | — | |
| | | | | | | | | | | | |
| (1) | Collateral amount disclosed by the Series is limited to the market value of financial instruments/transactions. |
See Notes to Financial Statements.
| | | | |
| PGIM Jennison Emerging Markets Equity Opportunities Fund | | | 23 | |
Statement of Assets & Liabilities
as of October 31, 2018
| | | | |
Assets | | | | |
Investments at value, including securities on loan of $794,105: | | | | |
Unaffiliated investments (cost $12,533,227) | | $ | 14,275,780 | |
Affiliated investments (cost $1,201,606) | | | 1,201,606 | |
Foreign currency, at value (cost $4) | | | 4 | |
Due from Manager | | | 20,964 | |
Dividends and interest receivable | | | 4,317 | |
Receivable for Series shares sold | | | 348 | |
Receivable for investments sold | | | 213 | |
Prepaid expenses | | | 844 | |
| | | | |
Total Assets | | | 15,504,076 | |
| | | | |
| |
Liabilities | | | | |
Payable to broker for collateral for securities on loan | | | 806,371 | |
Payable for investments purchased | | | 81,193 | |
Accrued expenses and other liabilities | | | 45,289 | |
Distribution fee payable | | | 1,715 | |
Foreign capital gains tax liability accrued | | | 1,148 | |
Payable for Series shares reacquired | | | 573 | |
Affiliated transfer agent fee payable | | | 46 | |
| | | | |
Total Liabilities | | | 936,335 | |
| | | | |
| |
Net Assets | | $ | 14,567,741 | |
| | | | |
| | | | | |
Net assets were comprised of: | | | | |
Common stock, at par | | $ | 15,147 | |
Paid-in capital in excess of par | | | 15,193,814 | |
Total distributable earnings (loss) | | | (641,220 | ) |
| | | | |
Net assets, October 31, 2018 | | $ | 14,567,741 | |
| | | | |
See Notes to Financial Statements.
| | | | |
Class A | | | | |
Net asset value and redemption price per share,
($2,315,588 ÷ 241,809 shares of common stock issued and outstanding) | | $ | 9.58 | |
Maximum sales charge (5.50% of offering price) | | | 0.56 | |
| | | | |
Maximum offering price to public | | $ | 10.14 | |
| | | | |
| |
Class C | | | | |
Net asset value, offering price and redemption price per share,
($1,362,675 ÷ 146,742 shares of common stock issued and outstanding) | | $ | 9.29 | |
| | | | |
| |
Class Z | | | | |
Net asset value, offering price and redemption price per share,
($1,214,698 ÷ 125,598 shares of common stock issued and outstanding) | | $ | 9.67 | |
| | | | |
| |
Class R6 | | | | |
Net asset value, offering price and redemption price per share,
($9,674,780 ÷ 1,000,515 shares of common stock issued and outstanding) | | $ | 9.67 | |
| | | | |
See Notes to Financial Statements.
| | | | |
| PGIM Jennison Emerging Markets Equity Opportunities Fund | | | 25 | |
Statement of Operations
Year Ended October 31, 2018
| | | | |
Net Investment Income (Loss) | | | | |
Income | | | | |
Unaffiliated dividend income (net of $19,271 foreign withholding tax) | | $ | 171,697 | |
Affiliated dividend income | | | 12,231 | |
Income from securities lending, net (including affiliated income of $1,679) | | | 5,076 | |
| | | | |
Total income | | | 189,004 | |
| | | | |
| |
Expenses | | | | |
Management fee | | | 189,270 | |
Distribution fee(a) | | | 26,617 | |
Custodian and accounting fees | | | 73,232 | |
Registration fees(a) | | | 66,461 | |
Audit fee | | | 29,583 | |
Shareholders’ reports | | | 22,703 | |
Legal fees and expenses | | | 19,397 | |
Directors’ fees | | | 12,463 | |
Transfer agent’s fees and expenses (including affiliated expense of $217)(a) | | | 12,403 | |
Miscellaneous | | | 45,419 | |
| | | | |
Total expenses | | | 497,548 | |
Less: Fee waiver and/or expense reimbursement(a) | | | (254,621 | ) |
Distribution fee waiver(a) | | | (1,478 | ) |
| | | | |
Net expenses | | | 241,449 | |
| | | | |
Net investment income (loss) | | | (52,445 | ) |
| | | | |
| |
Realized And Unrealized Gain (Loss) On Investment And Foreign Currency Transactions | | | | |
Net realized gain (loss) on: | | | | |
Investment transactions (including affiliated of $(69)) | | | (114,486 | ) |
Foreign currency transactions | | | 2,123 | |
| | | | |
| | | (112,363 | ) |
| | | | |
Net change in unrealized appreciation (depreciation) on: | | | | |
Investments (net of change in foreign capital gains taxes $58,132) | | | (2,460,702 | ) |
Foreign currencies | | | 248 | |
| | | | |
| | | (2,460,454 | ) |
| | | | |
Net gain (loss) on investment and foreign currency transactions | | | (2,572,817 | ) |
| | | | |
Net Increase (Decrease) In Net Assets Resulting From Operations | | $ | (2,625,262 | ) |
| | | | |
| (a) | Class specific expenses and waivers were as follows: |
| | | | | | | | | | | | | | | | |
| | | Class A | | | Class C | | | Class Z | | | Class R6 | |
Distribution fee | | | 8,868 | | | | 17,749 | | | | — | | | | — | |
Registration fees | | | 16,142 | | | | 16,142 | | | | 17,135 | | | | 17,042 | |
Transfer agent’s fees and expenses | | | 7,612 | | | | 2,303 | | | | 2,459 | | | | 29 | |
Fee waiver and/or expense reimbursement | | | (52,457 | ) | | | (35,577 | ) | | | (34,034 | ) | | | (132,553 | ) |
Distribution fee waiver | | | (1,478 | ) | | | — | | | | — | | | | — | |
See Notes to Financial Statements.
Statements of Changes in Net Assets
| | | | | | | | |
| | | Year Ended October 31, | |
| | | 2018 | | | 2017 | |
Increase (Decrease) in Net Assets | | | | | | | | |
Operations | | | | | | | | |
Net investment income (loss) | | $ | (52,445 | ) | | $ | (29,547 | ) |
Net realized gain (loss) on investment and foreign currency transactions | | | (112,363 | ) | | | (116,094 | ) |
Net change in unrealized appreciation (depreciation) on investments and foreign currencies | | | (2,460,454 | ) | | | 2,602,531 | |
| | | | | | | | |
Net increase (decrease) in net assets resulting from operations | | | (2,625,262 | ) | | | 2,456,890 | |
| | | | | | | | |
| | |
Series share transactions (Net of share conversions) | | | | | | | | |
Net proceeds from shares sold | | | 3,466,110 | | | | 3,369,561 | |
Cost of shares reacquired | | | (2,244,237 | ) | | | (1,045,433 | ) |
| | | | | | | | |
Net increase (decrease) in net assets from Series share transactions | | | 1,221,873 | | | | 2,324,128 | |
| | | | | | | | |
Total increase (decrease) | | | (1,403,389 | ) | | | 4,781,018 | |
| | |
Net Assets: | | | | | | | | |
Beginning of year | | | 15,971,130 | | | | 11,190,112 | |
| | | | | | | | |
End of year(a)* | | $ | 14,567,741 | | | $ | 15,971,130 | |
| | | | | | | | |
(a) Includes accumulated net investment loss of: | | $ | * | | | $ | (23,966 | ) |
| | | | | | | | |
| * | Effective October 31, 2018, the Series has adopted amendments to Regulation S-X. |
See Notes to Financial Statements.
| | | | |
| PGIM Jennison Emerging Markets Equity Opportunities Fund | | | 27 | |
Notes to Financial Statements
Prudential World Fund, Inc. (the “Fund”) is registered under the Investment Company Act of 1940, as amended (“1940 Act”), as an open-end management investment company. The Fund was established as a Maryland business trust on September 28, 1994. The Fund currently consists of seven series: PGIM Jennison Emerging Markets Equity Opportunities Fund (formerly known as Prudential Jennison Emerging Markets Equity Fund), PGIM Jennison Global Opportunities Fund, PGIM Jennison International Opportunities Fund and PGIM QMA International Equity Fund, each of which are diversified funds and PGIM Jennison Global Infrastructure Fund, PGIM Emerging Markets Debt Hard Currency Fund and PGIM Emerging Markets Debt Local Currency Fund, each of which are non-diversified funds for purposes of the 1940 Act and may invest a greater percentage of their assets in the securities of a single company or other issuer than a diversified fund. Investing in a non-diversified fund involves greater risk than investing in a diversified fund because a loss resulting from the decline in value of any one security may represent a greater portion of the total assets of a non-diversified fund. These financial statements relate only to the PGIM Jennison Emerging Markets Equity Opportunities Fund (the “Series”). Effective June 11, 2018, the names of the Series and the other series which comprise the Fund were changed by replacing “Prudential” with “PGIM” and each series’ Class Q shares were renamed Class R6 shares.
The investment objective of the Series is to seek long-term growth of capital.
1. Accounting Policies
The Series follows the investment company accounting and reporting guidance of the Financial Accounting Standards Board (“FASB”) Accounting Standard Codification (“ASC”) Topic 946 Financial Services—Investment Companies. The following accounting policies conform to U.S. generally accepted accounting principles. The Series consistently follows such policies in the preparation of its financial statements.
Securities Valuation: The Series holds securities and other assets and liabilities that are fair valued at the close of each day (generally, 4:00 PM Eastern time) the New York Stock Exchange (“NYSE”) is open for trading. Fair value is the price that would be received to sell an asset or paid to transfer a liability in an orderly transaction between market participants on the measurement date. The Fund’s Board of Directors (the “Board”) has adopted valuation procedures for security valuation under which fair valuation responsibilities have been delegated to PGIM Investments LLC (“PGIM Investments” or the “Manager”). Pursuant to the Board’s delegation, a Valuation Committee has been established as two persons, being one or more officers of the Fund, including: the Fund’s Treasurer (or the Treasurer’s direct reports); and the Fund’s Chief or Deputy Chief Compliance Officer (or Vice-President-level direct reports of the Chief or Deputy Chief Compliance Officer). Under the current valuation procedures, the Valuation Committee of the Board is responsible for
supervising the valuation of portfolio securities and other assets and liabilities. The valuation procedures permit the Series to utilize independent pricing vendor services, quotations from market makers, and alternative valuation methods when market quotations are either not readily available or not deemed representative of fair value. A record of the Valuation Committee’s actions is subject to the Board’s review, approval, and ratification at its next regularly scheduled quarterly meeting.
For the fiscal reporting period-end, securities and other assets and liabilities were fair valued at the close of the last U.S. business day. Trading in certain foreign securities may occur when the NYSE is closed (including weekends and holidays). Because such foreign securities trade in markets that are open on weekends and U.S. holidays, the values of some of the Series’ foreign investments may change on days when investors cannot purchase or redeem Series shares.
Various inputs determine how the Series’ investments are valued, all of which are categorized according to the three broad levels (Level 1, 2, or 3) detailed in the Schedule of Investments and referred to herein as the “fair value hierarchy” in accordance with FASB ASC Topic 820—Fair Value Measurements and Disclosures.
Common and preferred stocks, exchange-traded funds, and derivative instruments, such as futures or options, that are traded on a national securities exchange are valued at the last sale price as of the close of trading on the applicable exchange where the security principally trades. Securities traded via NASDAQ are valued at the NASDAQ official closing price. To the extent these securities are valued at the last sale price or NASDAQ official closing price, they are classified as Level 1 in the fair value hierarchy. In the event that no sale or official closing price on valuation date exists, these securities are generally valued at the mean between the last reported bid and ask prices, or at the last bid price in the absence of an ask price. These securities are classified as Level 2 in the fair value hierarchy.
Foreign equities traded on foreign securities exchanges are generally valued using pricing vendor services that provide model prices derived using adjustment factors based on information such as local closing price, relevant general and sector indices, currency fluctuations, depositary receipts, and futures, as applicable. Securities valued using such model prices are classified as Level 2 in the fair value hierarchy. The models generate an evaluated adjustment factor for each security, which is applied to the local closing price to adjust it for post closing market movements up to the time the Series is valued. Utilizing that evaluated adjustment factor, the vendor provides an evaluated price for each security. If the vendor does not provide an evaluated price, securities are valued in accordance with exchange-traded common and preferred stock valuation policies discussed above.
Investments in open-end, non-exchange-traded mutual funds are valued at their net asset values as of the close of the NYSE on the date of valuation. These securities are classified as Level 1 in the fair value hierarchy since they may be purchased or sold at their net asset values on the date of valuation.
| | | | |
| PGIM Jennison Emerging Markets Equity Opportunities Fund | | | 29 | |
Notes to Financial Statements (continued)
Securities and other assets that cannot be priced according to the methods described above are valued based on pricing methodologies approved by the Board. In the event that unobservable inputs are used when determining such valuations, the securities will be classified as Level 3 in the fair value hierarchy.
When determining the fair value of securities, some of the factors influencing the valuation include: the nature of any restrictions on disposition of the securities; assessment of the general liquidity of the securities; the issuer’s financial condition and the markets in which it does business; the cost of the investment; the size of the holding and the capitalization of the issuer; the prices of any recent transactions or bids/offers for such securities or any comparable securities; any available analyst media or other reports or information deemed reliable by the Manager regarding the issuer or the markets or industry in which it operates. Using fair value to price securities may result in a value that is different from a security’s most recent closing price and from the price used by other unaffiliated mutual funds to calculate their net asset values.
Restricted and Illiquid Securities: Subject to guidelines adopted by the Board, the Series may invest up to 15% of its net assets in illiquid securities, including those which are restricted as to disposition under securities law (“restricted securities”). Restricted securities are valued pursuant to the valuation procedures noted above. Illiquid securities are those that, because of the absence of a readily available market or due to legal or contractual restrictions on resale, cannot be sold within seven days in the ordinary course of business at approximately the amount at which the Series has valued the investment. Therefore, the Series may find it difficult to sell illiquid securities at the time considered most advantageous by its subadviser and may incur transaction costs that would not be incurred in the sale of securities that were freely marketable. Certain securities that would otherwise be considered illiquid because of legal restrictions on resale to the general public may be traded among qualified institutional buyers under Rule 144A of the Securities Act of 1933. These Rule 144A securities, as well as commercial paper that is sold in private placements under Section 4(2) of the Securities Act, may be deemed liquid by the Series’ subadviser under the guidelines adopted by the Board of the Fund. However, the liquidity of the Series’ investments in Rule 144A securities could be impaired if trading does not develop or declines.
Foreign Currency Translation: The books and records of the Series are maintained in U.S. dollars. Foreign currency amounts are translated into U.S. dollars on the following basis:
(i) market value of investment securities, other assets and liabilities—at the current rates of exchange;
(ii) purchases and sales of investment securities, income and expenses—at the rates of exchange prevailing on the respective dates of such transactions.
Although the net assets of the Series are presented at the foreign exchange rates and market values at the close of the period, the Series does not generally isolate that portion of the results of operations arising as a result of changes in the foreign exchange rates from the fluctuations arising from changes in the market prices of long-term portfolio securities held at the end of the period. Similarly, the Series does not isolate the effect of changes in foreign exchange rates from the fluctuations arising from changes in the market prices of long-term portfolio securities sold during the period. Accordingly, holding period realized foreign currency gains (losses) are included in the reported net realized gains (losses) on investment transactions.
Net realized gains (losses) on foreign currency transactions represent net foreign exchange gains (losses) from the disposition of holdings of foreign currencies, currency gains (losses) realized between the trade and settlement dates on securities transactions, and the difference between the amounts of interest, dividends and foreign withholding taxes recorded on the Series’ books and the U.S. dollar equivalent amounts actually received or paid. Net unrealized currency gains (losses) arise from valuing foreign currency denominated assets and liabilities (other than investments) at period end exchange rates.
Master Netting Arrangements: The Series is subject to various Master Agreements, or netting arrangements, with select counterparties. These are agreements which a subadviser may have negotiated and entered into on behalf of the Series. A master netting arrangement between the Series and the counterparty permits the Series to offset amounts payable by the Series to the same counterparty against amounts to be received; and by the receipt of collateral from the counterparty by the Series to cover the Series’ exposure to the counterparty. However, there is no assurance that such mitigating factors are easily enforceable. In addition to master netting arrangements, the right to set-off exists when all the conditions are met such that each of the parties owes the other determinable amounts, the reporting party has the right to set-off the amount owed with the amount owed by the other party, the reporting party intends to set-off and the right of set-off is enforceable by law. During the reporting period, there was no intention to settle on a net basis and all amounts are presented on a gross basis on the Statement of Assets and Liabilities.
Securities Lending: The Series lends its portfolio securities to banks and broker-dealers. The loans are secured by collateral at least equal to the market value of the securities loaned. Collateral pledged by each borrower is invested in an affiliated money market fund and is marked to market daily, based on the previous day’s market value, such that the value of the collateral exceeds the value of the loaned securities. In the event of significant appreciation in value of securities on loan on the last business day of the reporting period, the financial statements may reflect a collateral value that is less than the market value of the loaned securities. Such shortfall is remedied as described above. Loans are subject to termination at the option of the borrower or the Series. Upon termination of the loan, the borrower will return to the Series securities identical to the loaned securities. Should the borrower of the
| | | | |
| PGIM Jennison Emerging Markets Equity Opportunities Fund | | | 31 | |
Notes to Financial Statements (continued)
securities fail financially, the Series has the right to repurchase the securities in the open market using the collateral.
The Series recognizes income, net of any rebate and securities lending agent fees, for lending its securities in the form of fees or interest on the investment of any cash received as collateral. The borrower receives all interest and dividends from the securities loaned and such payments are passed back to the lender in amounts equivalent thereto. The Series also continues to recognize any unrealized gain (loss) in the market price of the securities loaned and on the change in the value of the collateral invested that may occur during the term of the loan. In addition, realized gain (loss) is recognized on changes in the value of the collateral invested upon liquidation of the collateral. Net earnings from securities lending are disclosed on the Statement of Operations as “Income from securities lending, net”.
Securities Transactions and Net Investment Income: Securities transactions are recorded on the trade date. Realized gains (losses) from investment and currency transactions are calculated on the specific identification method. Dividend income is recorded on the ex-date. Expenses are recorded on an accrual basis, which may require the use of certain estimates by management that may differ from actual. Net investment income or loss (other than class specific expenses and waivers, which are allocated as noted below) and unrealized and realized gains (losses) are allocated daily to each class of shares based upon the relative proportion of adjusted net assets of each class at the beginning of the day. Class specific expenses and waivers, where applicable, are charged to the respective share classes. Class specific expenses include distribution fees and distribution fee waivers, shareholder servicing fees, transfer agent’s fees and expenses, registration fees and fee waivers and/or expense reimbursements, as applicable.
Taxes: It is the Series’ policy to continue to meet the requirements of the Internal Revenue Code applicable to regulated investment companies and to distribute all of its taxable net investment income and capital gains, if any, to its shareholders. Therefore, no federal income tax provision is required. Withholding taxes on foreign dividends, interest and capital gains, if any, are recorded, net of reclaimable amounts, at the time the related income is earned.
Dividends and Distributions: The Series expects to pay dividends from net investment income and distributions from net realized capital and currency gains, if any, annually. Dividends and distributions to shareholders, which are determined in accordance with federal income tax regulations and which may differ from generally accepted accounting principles, are recorded on the ex-date. Permanent book/tax differences relating to income and gain (loss) are reclassified amongst total distributable earnings (loss) and paid-in capital in excess of par, as appropriate.
Estimates: The preparation of financial statements requires management to make estimates and assumptions that affect the reported amounts and disclosures in the financial statements. Actual results could differ from those estimates.
2. Agreements
The Fund, on behalf of the Series, has a management agreement with PGIM Investments. Pursuant to this agreement, PGIM Investments has responsibility for all investment advisory services and supervises the subadviser’s performance of such services. In addition, under the management agreement, PGIM Investments provides all of the administrative functions necessary for the organization, operation and management of the Series. PGIM Investments administers the corporate affairs of the Series and, in connection therewith, furnishes the Series with office facilities, together with those ordinary clerical and bookkeeping services which are not being furnished by the Series’ custodian and the Series’ transfer agent. PGIM Investments is also responsible for the staffing and management of dedicated groups of legal, marketing, compliance and related personnel necessary for the operation of the Series. The legal, marketing, compliance and related personnel are also responsible for the management and oversight of the various service providers to the Series, including, but not limited to, the custodian, transfer agent, and accounting agent.
PGIM Investments has entered into a subadvisory agreement with Jennison Associates LLC (“Jennison”). The subadvisory agreement provides that Jennison will furnish investment advisory services in connection with the management of the Series. In connection therewith, Jennison is obligated to keep certain books and records of the Series. PGIM Investments pays for the services of Jennison, the cost of compensation of officers of the Series, occupancy and certain clerical and bookkeeping costs of the Series. The Series bears all other costs and expenses.
The management fee paid to PGIM Investments is accrued daily and payable monthly at an annual rate of 1.050% of the Series’ average daily net assets up to $5 billion and 1.025% of the Series’ average daily net assets in excess of $5 billion. The effective management fee rate before any waivers and/or expense reimbursements was 1.050% for the year ended October 31, 2018.
PGIM Investments has contractually agreed, through February 28, 2019, to limit total annual operating expenses after fee waivers and/or expense reimbursements to 1.45% of average daily net assets for Class A shares, 2.20% of average daily net assets for Class C shares, 1.20% of average daily net assets for Class Z shares, and 1.20% of average daily net assets for Class R6 shares. This contractual waiver excludes interest, brokerage, taxes (such as income and foreign withholding taxes, stamp duty and deferred tax expenses), acquired fund fees and expenses, extraordinary expenses, and certain other Series expenses such as dividend and interest expense and broker charges on short sales. Expenses waived/reimbursed by the Manager in accordance with this agreement may be recouped by the Manager within the same fiscal year during which such waiver/reimbursement is made if such recoupment can be realized without exceeding the expense limit in effect at the time of
| | | | |
| PGIM Jennison Emerging Markets Equity Opportunities Fund | | | 33 | |
Notes to Financial Statements (continued)
the recoupment for that fiscal year. Effective November 1, 2018 this waiver agreement was extended through February 29, 2020.
Where applicable, PGIM Investments voluntarily agreed through October 31, 2018, to waive management fees or shared operating expenses on any share class to the same extent that it waives similar expenses on any other share class and, in addition, total annual operating expenses for Class R6 shares will not exceed total annual operating expenses for Class Z shares. Effective November 1, 2018 this voluntary agreement became part of the Fund’s contractual waiver agreement through February 29, 2020 and is subject to recoupment by the Manager within the same fiscal year during which such wavier/reimbursement is made if such recoupment can be realized without exceeding the expense limit in effect at the time of the recoupment for that fiscal year.
The Fund, on behalf of the Series, has a distribution agreement with Prudential Investment Management Services LLC (“PIMS”), which acts as the distributor of the Class A, Class C, Class Z and Class R6 shares of the Series. The Series compensates PIMS for distributing and servicing the Series’ Class A and Class C shares, pursuant to the plans of distribution (the “Distribution Plans”), regardless of expenses actually incurred by PIMS. The distribution fees are accrued daily and payable monthly. No distribution or service fees are paid to PIMS as distributor of the Class Z and Class R6 shares of the Series.
Pursuant to the Distribution Plans, the Series compensates PIMS for distribution related activities at an annual rate of up to 0.30% and 1% of the average daily net assets of the Class A and Class C shares, respectively. PIMS has contractually agreed to limit such fee to 0.25% of the average daily net assets of the Class A shares through February 29, 2020.
PIMS has advised the Series that it received $32,036 in front-end sales charges resulting from sales of Class A shares during the year ended October 31, 2018. From these fees, PIMS paid such sales charges to broker-dealers, who in turn paid commissions to salespersons and incurred other distribution costs.
PIMS has advised the Series that for the year ended October 31, 2018, it received $100 in contingent deferred sales charges imposed upon redemptions by certain Class C shareholders.
PGIM Investments, PIMS and Jennison are indirect, wholly-owned subsidiaries of Prudential Financial, Inc. (“Prudential”).
3. Other Transactions with Affiliates
Prudential Mutual Fund Services LLC (“PMFS”), an affiliate of PGIM Investments and an indirect, wholly-owned subsidiary of Prudential, serves as the Series’ transfer agent. Transfer agent’s fees and expenses in the Statement of Operations include certain out-of-pocket expenses paid to non-affiliates, where applicable.
The Series may enter into certain securities purchase or sale transactions under Board approved Rule 17a-7 procedures. Rule 17a-7 is an exemptive rule under the 1940 Act, that, subject to certain conditions, permits purchase and sale transactions among affiliated investment companies, or between an investment company and a person that is affiliated solely by reason of having a common (or affiliated) investment adviser, common directors, and/or common officers. Such transactions are subject to ratification by the Board. For the reporting period ended October 31, 2018, no such transactions were entered into by the Series.
The Series may invest its overnight sweep cash in the PGIM Core Ultra Short Bond Fund (the “Core Fund”), and its securities lending cash collateral in the PGIM Institutional Money Market Fund (the “Money Market Fund”), each a series of Prudential Investment Portfolios 2, registered under the 1940 Act and managed by PGIM Investments. For the reporting period ended October 31, 2018, PGIM, Inc. was compensated $644 by PGIM Investments for managing the Series’ securities lending cash collateral as subadviser to the Money Market Fund. Earnings from the Core Fund and Money Market Fund are disclosed on the Statement of Operations as “Affiliated dividend income” and “Income from securities lending, net”, respectively.
4. Portfolio Securities
The aggregate cost of purchases and proceeds from sales of portfolio securities (excluding short-term investments and U.S. Government securities) for the year ended October 31, 2018, were $5,270,892 and $4,032,864, respectively.
A summary of the cost of purchases and proceeds from sales of shares of affiliated mutual funds for the year ended October 31, 2018, is presented as follows:
| | | | | | | | | | | | | | | | | | | | | | | | | | | | |
Value,
Beginning
of Year | | Cost of
Purchases | | | Proceeds
from Sales | | | Change in
Unrealized
Gain
(Loss) | | | Realized
Gain
(Loss) | | | Value,
End of Year | | | Shares,
End
of Year | | | Income | |
PGIM Core Ultra Short Bond Fund* | | | | | | | | | | | | | | | | | |
| $380,415 | | $ | 5,197,052 | | | $ | 5,183,300 | | | $ | — | | | $ | — | | | $ | 394,167 | | | | 394,167 | | | $ | 12,231 | |
PGIM Institutional Money Market Fund* | | | | | | | | | | | | | | | | | |
| 23,897 | | | 15,122,099 | | | | 14,338,488 | | | | — | | | | (69 | ) | | | 807,439 | | | | 807,439 | | | | 1,679 | ** |
| | | | | | | | | | | | | | | | | | | | | | | | | | | | |
| $404,312 | | $ | 20,319,151 | | | $ | 19,521,788 | | | $ | — | | | $ | (69 | ) | | $ | 1,201,606 | | | | | | | $ | 13,910 | |
| | | | | | | | | | | | | | | | | | | | | | | | | | | | |
| | | | | | | | | | | | | |
| * | The Fund did not have any capital gain distributions during the reporting period. |
| | | | |
| PGIM Jennison Emerging Markets Equity Opportunities Fund | | | 35 | |
Notes to Financial Statements (continued)
| ** | This amount is included in “Income from securities lending, net” on the Statement of Operations. |
5. Distributions and Tax Information
Distributions to shareholders, which are determined in accordance with federal income tax regulations and which may differ from generally accepted accounting principles, are recorded on the ex-date. In order to present total distributable earnings (loss) and paid-in capital in excess of par on the Statement of Assets and Liabilities that more closely represent their tax character, certain adjustments have been made to total distributable earnings (loss) and paid-in capital in excess of par. For the tax year ended October 31, 2018, the adjustments were to decrease total distributable loss and decrease paid-in capital in excess of par by $43,955 due to a net operating loss. Net investment income, net realized gain (loss) on investments and foreign currency transactions and net assets were not affected by this change.
For the fiscal years ended October 31, 2018 and October 31, 2017, there were no distributions paid by the Series.
As of October 31, 2018, the Series had no undistributed earnings on a tax basis.
The United States federal income tax basis of the Series’ investments and the net unrealized appreciation as of October 31, 2018 were as follows:
| | | | | | |
Tax Basis | | Gross
Unrealized
Appreciation | | Gross
Unrealized
Depreciation | | Net
Unrealized
Appreciation |
| $13,736,104 | | $2,766,460 | | $(1,025,178) | | $1,741,282 |
The book basis may differ from tax basis due to deferred losses on wash sales.
For federal income tax purposes, the Series had a capital loss carryforward as of October 31, 2018 of approximately $2,352,000 which can be carried forward for an unlimited period. No capital gains distributions are expected to be paid to shareholders until net gains have been realized in excess of such losses.
The Series elected to treat late year ordinary losses of approximately $30,000 as having been incurred in the following fiscal year (October 31, 2019).
Management has analyzed the Series’ tax positions taken on federal, state and local income tax returns for all open tax years and has concluded that no provision for income tax is required in the Series’ financial statements for the current reporting period. The Series’
federal, state and local income and federal excise tax returns for tax years for which the applicable statutes of limitations have not expired are subject to examination by the Internal Revenue Service and state departments of revenue.
6. Capital and Ownership
The Series offers Class A, Class C, Class Z and Class R6 shares. Class A shares are sold with a maximum front-end sales charge of 5.50%. Investors who purchase $1 million or more of Class A shares and sell these shares within 12 months of purchase are subject to a contingent deferred sales charge (“CDSC”) of 1%, although they are not subject to an initial sales charge. The Class A CDSC is waived for certain retirement and/or benefit plans. A special exchange privilege is also available for shareholders who qualified to purchase Class A shares at net asset value. Class Z and Class R6 shares are not subject to any sales or redemption charge and are available exclusively for sale to a limited group of investors.
Under certain circumstances, an exchange may be made from specified share classes of the Series to one or more other share classes of the Series as presented in the table of transactions in shares of common stock.
The Fund is authorized to issue 5.075 billion shares of common stock, with a par value of $0.01 per share, which is divided into seven series. There are 865 million shares authorized for the Series, divided into five classes, designated Class A, Class C, Class Z, Class R6 and Class T common stock, each of which consists of 25 million, 65 million, 300 million, 250 million and 225 million authorized shares, respectively. The Series currently does not have any Class T shares outstanding.
As of October 31, 2018, Prudential, through its affiliated entities, including affiliated funds (if applicable), owned 1,000,515 Class R6 shares of the Series. At reporting period end, two shareholders of record held 78% of the Series’ outstanding shares on behalf of multiple beneficial owners, of which 66% were held by an affiliate of Prudential.
Transactions in shares of common stock were as follows:
| | | | | | | | |
Class A | | Shares | | | Amount | |
Year ended October 31, 2018: | | | | | | | | |
Shares sold | | | 155,646 | | | $ | 1,901,408 | |
Shares reacquired | | | (108,937 | ) | | | (1,274,373 | ) |
| | | | | | | | |
Net increase (decrease) in shares outstanding before conversion | | | 46,709 | | | | 627,035 | |
Shares reacquired upon conversion into other share class(es) | | | (1,943 | ) | | | (22,936 | ) |
| | | | | | | | |
Net increase (decrease) in shares outstanding | | | 44,766 | | | $ | 604,099 | |
| | | | | | | | |
Year ended October 31, 2017: | | | | | | | | |
Shares sold | | | 156,262 | | | $ | 1,561,350 | |
Shares reacquired† | | | (50,106 | ) | | | (484,454 | ) |
| | | | | | | | |
Net increase (decrease) in shares outstanding before conversion | | | 106,156 | | | | 1,076,896 | |
Shares reacquired upon conversion into other share class(es) | | | (2,111 | ) | | | (22,119 | ) |
| | | | | | | | |
Net increase (decrease) in shares outstanding | | | 104,045 | | | $ | 1,054,777 | |
| | | | | | | | |
| | | | |
| PGIM Jennison Emerging Markets Equity Opportunities Fund | | | 37 | |
Notes to Financial Statements (continued)
| | | | | | | | |
Class C | | Shares | | | Amount | |
Year ended October 31, 2018: | | | | | | | | |
Shares sold | | | 30,840 | | | $ | 362,143 | |
Shares reacquired | | | (20,870 | ) | | | (229,131 | ) |
| | | | | | | | |
Net increase (decrease) in shares outstanding before conversion | | | 9,970 | | | | 133,012 | |
Shares reacquired upon conversion into other share class(es) | | | (1,961 | ) | | | (22,185 | ) |
| | | | | | | | |
Net increase (decrease) in shares outstanding | | | 8,009 | | | $ | 110,827 | |
| | | | | | | | |
Year ended October 31, 2017: | | | | | | | | |
Shares sold | | | 77,848 | | | $ | 791,362 | |
Shares reacquired† | | | (10,893 | ) | | | (103,832 | ) |
| | | | | | | | |
Net increase (decrease) in shares outstanding before conversion | | | 66,955 | | | | 687,530 | |
Shares reacquired upon conversion into other share class(es) | | | (7,961 | ) | | | (85,348 | ) |
| | | | | | | | |
Net increase (decrease) in shares outstanding | | | 58,994 | | | $ | 602,182 | |
| | | | | | | | |
Class Z | | | | | | |
Year ended October 31, 2018: | | | | | | | | |
Shares sold | | | 99,645 | | | $ | 1,202,559 | |
Shares reacquired | | | (64,853 | ) | | | (740,733 | ) |
| | | | | | | | |
Net increase (decrease) in shares outstanding before conversion | | | 34,792 | | | | 461,826 | |
Shares issued upon conversion from other share class(es) | | | 3,814 | | | | 45,121 | |
| | | | | | | | |
Net increase (decrease) in shares outstanding | | | 38,606 | | | $ | 506,947 | |
| | | | | | | | |
Year ended October 31, 2017: | | | | | | | | |
Shares sold | | | 101,704 | | | $ | 1,016,849 | |
Shares reacquired† | | | (44,028 | ) | | | (446,412 | ) |
| | | | | | | | |
Net increase (decrease) in shares outstanding before conversion | | | 57,676 | | | | 570,437 | |
Shares issued upon conversion from other share class(es) | | | 9,834 | | | | 107,467 | |
| | | | | | | | |
Net increase (decrease) in shares outstanding | | | 67,510 | | | $ | 677,904 | |
| | | | | | | | |
Class R6 | | | | | | |
Year ended October 31, 2018: | | | | | | | | |
Net increase (decrease) in shares outstanding | | | — | | | $ | — | |
| | | | | | | | |
Year ended October 31, 2017: | | | | | | | | |
Shares reacquired† | | | (1,000 | ) | | $ | (10,735 | ) |
| | | | | | | | |
Net increase (decrease) in shares outstanding | | | (1,000 | ) | | $ | (10,735 | ) |
| | | | | | | | |
| † | Includes affiliated redemption of 1,000 shares with a value of $10,720 for Class A shares, 1,000 shares with a value of $10,490 for Class C shares, 1,000 shares with a value of $10,800 for Class Z shares and 1,000 shares with a value of $10,796 for Class R6 shares. |
7. Borrowings
The Fund, on behalf of the Series, along with other affiliated registered investment companies (the “Funds”), is a party to a Syndicated Credit Agreement (“SCA”) with a group of banks. The purpose of the SCA is to provide an alternative source of temporary funding for capital share redemptions. The SCA provides for a commitment of $900 million for the period October 4, 2018 through October 3, 2019. The Funds pay an annualized
commitment fee of 0.15% of the unused portion of the SCA. The Series’ portion of the commitment fee for the unused amount, allocated based upon a method approved by the Board, is accrued daily and paid quarterly. Prior to October 4, 2018, the Funds had another SCA that provided a commitment of $900 million and the Funds paid an annualized commitment fee of 0.15% of the unused portion of the SCA. The interest on borrowings under both SCAs is paid monthly and at a per annum interest rate based upon a contractual spread plus the higher of (1) the effective federal funds rate, (2) the 1-month LIBOR rate or (3) zero percent.
Other affiliated registered investment companies that are parties to the SCA include portfolios that are subject to a predetermined mathematical formula used to manage certain benefit guarantees offered under variable annuity contracts. The formula may result in large scale asset flows into and out of these portfolios. Consequently, these portfolios may be more likely to utilize the SCA for purposes of funding redemptions. It may be possible for those portfolios to fully exhaust the committed amount of the SCA, thereby requiring the Manager to allocate available funding per a Board-approved methodology designed to treat the Funds in the SCA equitably.
The Series did not utilize the SCA during the reporting period ended October 31, 2018.
8. Risks of Investing in the Series
The Series’ risks include, but are not limited to, some or all of the risks discussed below:
Emerging Markets Risk: The risks of foreign investments are greater for investments in or exposed to emerging markets. Emerging market countries typically have economic and political systems that are less fully developed, and can be expected to be less stable, than those of more developed countries. For example, the economies of such countries can be subject to rapid and unpredictable rates of inflation or deflation. Low trading volumes may result in a lack of liquidity and price volatility. Emerging market countries may have policies that restrict investment by non-US investors, or that prevent non-US investors from withdrawing their money at will.
Equity and Equity-Related Securities Risks: The value of a particular security could go down and you could lose money. In addition to an individual security losing value, the value of the equity markets or a sector in which the Series invests could go down. The Series’ holdings can vary significantly from broad market indexes and the performance of the Series can deviate from the performance of these indexes. Different parts of a market can react differently to adverse issuer, market, regulatory, political and economic developments.
Foreign Securities Risk: The Series’ investments in securities of foreign issuers or issuers with significant exposure to foreign markets involve additional risk. Foreign countries in which the Series may invest may have markets that are less liquid, less regulated and more volatile than US markets. The value of the Series’ investments may decline because of
| | | | |
| PGIM Jennison Emerging Markets Equity Opportunities Fund | | | 39 | |
Notes to Financial Statements (continued)
factors affecting the particular issuer as well as foreign markets and issuers generally, such as unfavorable government actions, and political or financial instability.
Geographic Concentration Risk: The Fund’s performance may be closely tied to the market, economic, political, regulatory or other conditions in the countries or regions in which the Fund invests. This can result in more pronounced risks based upon conditions that impact one or more countries or regions more or less than other countries or regions.
9. Recent Accounting Pronouncements and Reporting Updates
In August 2018, the Securities and Exchange Commission (the “SEC”) adopted amendments to Regulation S-X to update and simplify the disclosure requirements for registered investment companies by eliminating requirements that are redundant or duplicative of US GAAP requirements or other SEC disclosure requirements. The new amendments require the presentation of the total, rather than the components, of distributable earnings on the Statement of Assets and Liabilities and the total, rather than the components, of dividends from net investment income and distributions from net realized gains on the Statements of Changes in Net Assets. The amendments also removed the requirement for the parenthetical disclosure of undistributed net investment income on the Statements of Changes in Net Assets and certain tax adjustments that were reflected in the Notes to Financial Statements. All of these have been reflected in the Series’ financial statements.
In August 2018, the FASB issued Accounting Standards Update (“ASU”) No. 2018-13, which changes certain fair value measurement disclosure requirements. The new ASU, in addition to other modifications and additions, removes the requirement to disclose the amount and reasons for transfers between Level 1 and Level 2 of the fair value hierarchy, and the Series’ policy for the timing of transfers between levels. The amendments are effective for financial statements issued for fiscal years beginning after December 15, 2019, and interim periods within those fiscal years. Management has evaluated the implications of certain provisions of the ASU and has determined to early adopt aspects related to the removal and modification of certain fair value measurement disclosures under the ASU effective immediately. At this time, management is evaluating the implications of certain other provisions of the ASU related to new disclosure requirements and any impact on the financial statement disclosures has not yet been determined.
Financial Highlights
| | | | | | | | | | | | | | | | | | | | | | | | |
| Class A Shares | |
| | | Year Ended October 31, | | | | | | September 16,
2014(a) through
October 31, | |
| | | 2018 | | | 2017 | | | 2016 | | | 2015 | | | | | | 2014 | |
| Per Share Operating Performance(b): | | | | | | | | | | | | | | | | | | | | | | | | |
| Net Asset Value, Beginning of Period | | | $11.19 | | | | $9.34 | | | | $8.81 | | | | $10.09 | | | | | | | | $10.00 | |
| Income (loss) from investment operations: | | | | | | | | | | | | | | | | | | | | | | | | |
| Net investment income (loss) | | | (0.04 | ) | | | (0.04 | ) | | | (0.04 | ) | | | (0.04 | ) | | | | | | | (0.01 | ) |
| Net realized and unrealized gain (loss) on investment and foreign currency transactions | | | (1.57 | ) | | | 1.89 | | | | 0.57 | | | | (1.24 | ) | | | | | | | 0.10 | |
| Total from investment operations | | | (1.61 | ) | | | 1.85 | | | | 0.53 | | | | (1.28 | ) | | | | | | | 0.09 | |
| Net asset value, end of period | | | $9.58 | | | | $11.19 | | | | $9.34 | | | | $8.81 | | | | | | | | $10.09 | |
| Total Return(c): | | | (14.39)% | | | | 19.81% | | | | 6.02% | | | | (12.69)% | | | | | | | | 0.90% | |
| |
| Ratios/Supplemental Data: | |
| Net assets, end of period (000) | | | $2,316 | | | | $2,204 | | | | $869 | | | | $311 | | | | | | | | $18 | |
| Average net assets (000) | | | $2,956 | | | | $1,363 | | | | $528 | | | | $208 | | | | | | | | $15 | |
| Ratios to average net assets(d): | | | | | | | | | | | | | | | | | | | | | | | | |
| Expenses after waivers and/or expense reimbursement | | | 1.45% | | | | 1.45% | | | | 1.45% | | | | 1.54% | | | | | | | | 1.55% | (e) |
| Expenses before waivers and/or expense reimbursement | | | 3.27% | (f) | | | 3.28% | | | | 3.87% | | | | 3.40% | | | | | | | | 14.06% | (e) |
| Net investment income (loss) | | | (0.35)% | | | | (0.35)% | | | | (0.49)% | | | | (0.48)% | | | | | | | | (0.93)% | (e) |
| Portfolio turnover rate(g) | | | 23% | | | | 45% | | | | 44.0% | | | | 67% | | | | | | | | 15% | |
| (a) | Commencement of operations. |
| (b) | Calculated based on average shares outstanding during the year. |
| (c) | Total return does not consider the effects of sales loads. Total return is calculated assuming a purchase of a share on the first day and a sale on the last day of each period reported and includes reinvestment of dividends and distributions, if any. Total returns may reflect adjustments to conform to generally accepted accounting principles. Total returns for periods less than one full year are not annualized. |
| (d) | Does not include expenses of the underlying funds in which the Series invests. |
| (f) | Effective November 1, 2017, class specific expenses include transfer agent fees and expenses and registration fees, which are charged to their respective share class. |
| (g) | The Series’ portfolio turnover rate is calculated in accordance with regulatory requirements, without regard to transactions involving short term investments and certain derivatives. If such transactions were included, the Series’ portfolio turnover rate may be higher. |
See Notes to Financial Statements.
| | | | |
| PGIM Jennison Emerging Markets Equity Opportunities Fund | | | 41 | |
Financial Highlights (continued)
| | | | | | | | | | | | | | | | | | | | | | | | |
| Class C Shares | |
| | | Year Ended October 31, | | | | | | September 16,
2014(a) through
October 31, | |
| | | 2018 | | | 2017 | | | 2016 | | | 2015 | | | | | | 2014 | |
| Per Share Operating Performance(b): | | | | | | | | | | | | | | | | | | | | | | | | |
| Net Asset Value, Beginning of Period | | | $10.93 | | | | $9.20 | | | | $8.74 | | | | $10.08 | | | | | | | | $10.00 | |
| Income (loss) from investment operations: | | | | | | | | | | | | | | | | | | | | | | | | |
| Net investment income (loss) | | | (0.13 | ) | | | (0.11 | ) | | | (0.11 | ) | | | (0.13 | ) | | | | | | | (0.02 | ) |
| Net realized and unrealized gain (loss) on investment and foreign currency transactions | | | (1.51 | ) | | | 1.84 | | | | 0.57 | | | | (1.21 | ) | | | | | | | 0.10 | |
| Total from investment operations | | | (1.64 | ) | | | 1.73 | | | | 0.46 | | | | (1.34 | ) | | | | | | | 0.08 | |
| Net asset value, end of period | | | $9.29 | | | | $10.93 | | | | $9.20 | | | | $8.74 | | | | | | | | $10.08 | |
| Total Return(c): | | | (15.00)% | | | | 18.80% | | | | 5.26% | | | | (13.29)% | | | | | | | | 0.80% | |
| |
| Ratios/Supplemental Data: | |
| Net assets, end of period (000) | | | $1,363 | | | | $1,516 | | | | $734 | | | | $662 | | | | | | | | $501 | |
| Average net assets (000) | | | $1,775 | | | | $973 | | | | $672 | | | | $699 | | | | | | | | $296 | |
| Ratios to average net assets(d): | | | | | | | | | | | | | | | | | | | | | | | | |
| Expenses after waivers and/or expense reimbursement | | | 2.20% | | | | 2.20% | | | | 2.20% | | | | 2.29% | | | | | | | | 2.30% | (e) |
| Expenses before waivers and/or expense reimbursement | | | 4.20% | (f) | | | 4.00% | | | | 4.62% | | | | 4.12% | | | | | | | | 15.19% | (e) |
| Net investment income (loss) | | | (1.14)% | | | | (1.17)% | | | | (1.29)% | | | | (1.36)% | | | | | | | | (1.79)% | (e) |
| Portfolio turnover rate(g) | | | 23% | | | | 45% | | | | 44% | | | | 67% | | | | | | | | 15% | |
| (a) | Commencement of operations. |
| (b) | Calculated based on average shares outstanding during the year. |
| (c) | Total return does not consider the effects of sales loads. Total return is calculated assuming a purchase of a share on the first day and a sale on the last day of each period reported and includes reinvestment of dividends and distributions, if any. Total returns may reflect adjustments to conform to generally accepted accounting principles. Total returns for periods less than one full year are not annualized. |
| (d) | Does not include expenses of the underlying funds in which the Series invests. |
| (f) | Effective November 1, 2017, class specific expenses include transfer agent fees and expenses and registration fees, which are charged to their respective share class. |
| (g) | The Series’ portfolio turnover rate is calculated in accordance with regulatory requirements, without regard to transactions involving short term investments and certain derivatives. If such transactions were included, the Series’ portfolio turnover rate may be higher. |
See Notes to Financial Statements.
| | | | | | | | | | | | | | | | | | | | | | | | |
| Class Z Shares | |
| | | Year Ended October 31, | | | | | | September 16,
2014(a) through
October 31, | |
| | | 2018 | | | 2017 | | | 2016 | | | 2015 | | | | | | 2014 | |
| Per Share Operating Performance(b): | | | | | | | | | | | | | | | | | | | | | | | | |
| Net Asset Value, Beginning of Period | | | $11.27 | | | | $9.39 | | | | $8.82 | | | | $10.09 | | | | | | | | $10.00 | |
| Income (loss) from investment operations: | | | | | | | | | | | | | | | | | | | | | | | | |
| Net investment income (loss) | | | (0.01 | ) | | | (0.02 | ) | | | (0.03 | ) | | | (0.04 | ) | | | | | | | (0.01 | ) |
| Net realized and unrealized gain (loss) on investment and foreign currency transactions | | | (1.59 | ) | | | 1.90 | | | | 0.60 | | | | (1.23 | ) | | | | | | | 0.10 | |
| Total from investment operations | | | (1.60 | ) | | | 1.88 | | | | 0.57 | | | | (1.27 | ) | | | | | | | 0.09 | |
| Net asset value, end of period | | | $9.67 | | | | $11.27 | | | | $9.39 | | | | $8.82 | | | | | | | | $10.09 | |
| Total Return(c): | | | (14.20)% | | | | 20.02% | | | | 6.46% | | | | (12.59)% | | | | | | | | 0.90% | |
| |
| Ratios/Supplemental Data: | |
| Net assets, end of period (000) | | | $1,215 | | | | $980 | | | | $183 | | | | $60 | | | | | | | | $10 | |
| Average net assets (000) | | | $1,443 | | | | $490 | | | | $102 | | | | $17 | | | | | | | | $10 | |
| Ratios to average net assets(d): | | | | | | | | | | | | | | | | | | | | | | | | |
| Expenses after waivers and/or expense reimbursement | | | 1.20% | | | | 1.20% | | | | 1.20% | | | | 1.29% | | | | | | | | 1.30% | (e) |
| Expenses before waivers and/or expense reimbursement | | | 3.56% | (f) | | | 2.94% | | | | 3.55% | | | | 3.48% | | | | | | | | 13.51% | (e) |
| Net investment income (loss) | | | (0.13)% | | | | (0.19)% | | | | (0.31)% | | | | (0.44)% | | | | | | | | (0.67)% | (e) |
| Portfolio turnover rate(g) | | | 23% | | | | 45% | | | | 44% | | | | 67% | | | | | | | | 15% | |
| (a) | Commencement of operations. |
| (b) | Calculated based on average shares outstanding during the year. |
| (c) | Total return is calculated assuming a purchase of a share on the first day and a sale on the last day of each period reported and includes reinvestment of dividends and distributions, if any. Total returns may reflect adjustments to conform to generally accepted accounting principles. Total returns for periods less than one full year are not annualized. |
| (d) | Does not include expenses of the underlying funds in which the Series invests. |
| (f) | Effective November 1, 2017, class specific expenses include transfer agent fees and expenses and registration fees, which are charged to their respective share class. |
| (g) | The Series’ portfolio turnover rate is calculated in accordance with regulatory requirements, without regard to transactions involving short term investments and certain derivatives. If such transactions were included, the Series’ portfolio turnover rate may be higher. |
See Notes to Financial Statements.
| | | | |
| PGIM Jennison Emerging Markets Equity Opportunities Fund | | | 43 | |
Financial Highlights (continued)
| | | | | | | | | | | | | | | | | | | | | | | | |
| Class R6 Shares | |
| | | Year Ended October 31, | | | | | | September 16,
2014(a) through
October 31, | |
| | | 2018 | | | 2017 | | | 2016 | | | 2015 | | | | | | 2014 | |
| Per Share Operating Performance(b): | | | | | | | | | | | | | | | | | | | | | | | | |
| Net Asset Value, Beginning of Period | | | $11.27 | | | | $9.39 | | | | $8.83 | | | | $10.09 | | | | | | | | $10.00 | |
| Income (loss) from investment operations: | | | | | | | | | | | | | | | | | | | | | | | | |
| Net investment income (loss) | | | (0.02 | ) | | | (0.01 | ) | | | (0.03 | ) | | | (0.04 | ) | | | | | | | (0.01 | ) |
| Net realized and unrealized gain (loss) on investment and foreign currency transactions | | | (1.58 | ) | | | 1.89 | | | | 0.59 | | | | (1.21 | ) | | | | | | | 0.10 | |
| Total from investment operations | | | (1.60 | ) | | | 1.88 | | | | 0.56 | | | | (1.25 | ) | | | | | | | 0.09 | |
| Dividends from net investment income | | | - | | | | - | | | | - | | | | (0.01 | ) | | | | | | | - | |
| Net asset value, end of period | | | $9.67 | | | | $11.27 | | | | $9.39 | | | | $8.83 | | | | | | | | $10.09 | |
| Total Return(c): | | | (14.20)% | | | | 20.02% | | | | 6.34% | | | | (12.44)% | | | | | | | | 0.90% | |
| |
| Ratios/Supplemental Data: | |
| Net assets, end of period (000) | | | $9,675 | | | | $11,271 | | | | $9,404 | | | | $8,840 | | | | | | | | $10,101 | |
| Average net assets (000) | | | $11,852 | | | | $9,893 | | | | $8,722 | | | | $9,518 | | | | | | | | $9,785 | |
| Ratios to average net assets(d): | | | | | | | | | | | | | | | | | | | | | | | | |
| Expenses after waivers and/or expense reimbursement | | | 1.20% | | | | 1.20% | | | | 1.20% | | | | 1.29% | | | | | | | | 1.30% | (e) |
| Expenses before waivers and/or expense reimbursement | | | 2.32% | (f) | | | 2.78% | | | | 3.13% | | | | 2.91% | | | | | | | | 13.37% | (e) |
| Net investment income (loss) | | | (0.17)% | | | | (0.13)% | | | | (0.29)% | | | | (0.40)% | | | | | | | | (0.68)% | (e) |
| Portfolio turnover rate(g) | | | 23% | | | | 45% | | | | 44% | | | | 67% | | | | | | | | 15% | |
| (a) | Commencement of operations. |
| (b) | Calculated based on average shares outstanding during the period. |
| (c) | Total return is calculated assuming a purchase of a share on the first day and a sale on the last day of each period reported and includes reinvestment of dividends and distributions, if any. Total returns may reflect adjustments to conform to generally accepted accounting principles. Total returns for periods less than one full year are not annualized. |
| (d) | Does not include expenses of the underlying funds in which the Series invests. |
| (f) | Effective November 1, 2017, class specific expenses include transfer agent fees and expenses and registration fees, which are charged to their respective share class. |
| (g) | The Series’ portfolio turnover rate is calculated in accordance with regulatory requirements, without regard to transactions involving short term investments and certain derivatives. If such transactions were included, the Series’ portfolio turnover rate may be higher. |
See Notes to Financial Statements.
Report of Independent Registered Public
Accounting Firm
The Board of Directors and Shareholders
Prudential World Fund, Inc.:
Opinion on the Financial Statements
We have audited the accompanying statement of assets and liabilities of PGIM Jennison Emerging Markets Equity Opportunities Fund (formerly Prudential Jennison Emerging Markets Equity Fund) (the “Fund”), a series of Prudential World Fund, Inc., including the schedule of investments, as of October 31, 2018, the related statement of operations for the year then ended, the statements of changes in net assets for each of the years in the two-year period then ended, and the related notes (collectively, the financial statements) and the financial highlights for the years or periods indicated therein. In our opinion, the financial statements and financial highlights present fairly, in all material respects, the financial position of the Fund as of October 31, 2018, the results of its operations for the year then ended, the changes in its net assets for each of the years in the two-year period then ended, and the financial highlights for the years or periods indicated therein, in conformity with U.S. generally accepted accounting principles.
Basis for Opinion
These financial statements and financial highlights are the responsibility of the Fund’s management. Our responsibility is to express an opinion on these financial statements and financial highlights based on our audits. We are a public accounting firm registered with the Public Company Accounting Oversight Board (United States) (“PCAOB”) and are required to be independent with respect to the Fund in accordance with the U.S. federal securities laws and the applicable rules and regulations of the Securities and Exchange Commission and the PCAOB.
We conducted our audits in accordance with the standards of the PCAOB. Those standards require that we plan and perform the audit to obtain reasonable assurance about whether the financial statements and financial highlights are free of material misstatement, whether due to error or fraud. Our audits included performing procedures to assess the risks of material misstatement of the financial statements and financial highlights, whether due to error or fraud, and performing procedures that respond to those risks. Such procedures included examining, on a test basis, evidence regarding the amounts and disclosures in the financial statements and financial highlights. Such procedures also included confirmation of securities owned as of October 31, 2018, by correspondence with the custodians, transfer agents and brokers or by other appropriate auditing procedures when replies from brokers were not received. Our audits also included evaluating the accounting principles used and significant estimates made by management, as well as evaluating the overall presentation of the financial statements and financial highlights. We believe that our audits provide a reasonable basis for our opinion.

We have served as the auditor of one or more PGIM and/or Prudential Retail investment companies since 2003.
New York, New York
December 17, 2018
| | | | |
| PGIM Jennison Emerging Markets Equity Opportunities Fund | | | 45 | |
INFORMATION ABOUT BOARD MEMBERS AND OFFICERS (unaudited)
Information about Board Members and Officers of the Fund is set forth below. Board Members who are not deemed to be “interested persons” of the Fund, as defined in the 1940 Act, are referred to as “Independent Board Members.” Board Members who are deemed to be “interested persons” of the Fund are referred to as “Interested Board Members.” The Board Members are responsible for the overall supervision of the operations of the Fund and perform the various duties imposed on the directors of investment companies by the 1940 Act. The Board in turn elects the Officers, who are responsible for administering the day-to-day operations of the Fund.
| | | | | | |
| Independent Board Members | | | | |
| | | | |
Name, Address, Age Position(s) Portfolios Overseen | | Principal Occupation(s) During Past Five Years | | Other Directorships Held During Past Five Years | | Length of Board Service |
| | | | |
Ellen S. Alberding (60) Board Member Portfolios Overseen: 93 | | President and Board Member, The Joyce Foundation (charitable foundation) (since 2002); Vice Chair, City Colleges of Chicago (community college system) (2011-2015); Trustee, National Park Foundation (charitable foundation for national park system) (2009-2018); Trustee, Economic Club of Chicago (since 2009); Trustee, Loyola University (since 2018). | | None. | | Since September 2013 |
| | | | |
Kevin J. Bannon (66) Board Member Portfolios Overseen: 93 | | Retired; Managing Director (April 2008-May 2015) and Chief Investment Officer (October 2008-November 2013) of Highmount Capital LLC (registered investment adviser); formerly Executive Vice President and Chief Investment Officer (April 1993-August 2007) of Bank of New York Company; President (May 2003-May 2007) of BNY Hamilton Family of Mutual Funds. | | Director of Urstadt Biddle Properties (equity real estate investment trust) (since September 2008). | | Since July 2008 |
| | | | |
Linda W. Bynoe (66) Board Member Portfolios Overseen: 93 | | President and Chief Executive Officer (since March 1995) and formerly Chief Operating Officer (December 1989-February 1995) of Telemat Ltd. (management consulting); formerly Vice President (January 1985-June 1989) at Morgan Stanley & Co. (broker-dealer). | | Director of Anixter International, Inc. (communication products distributor) (since January 2006); Director of Northern Trust Corporation (financial services) (since April 2006); Trustee of Equity Residential (residential real estate) (since December 2009). | | Since March 2005 |
PGIM Jennison Emerging Markets Equity Opportunities Fund
| | | | | | |
Independent Board Members | | | | |
| | | | |
Name, Address, Age Position(s) Portfolios Overseen | | Principal Occupation(s) During Past Five Years | | Other Directorships Held During Past Five Years | | Length of Board Service |
| | | | |
Barry H. Evans (58) Board Member Portfolios Overseen: 92 | | Retired; formerly President (2005 – 2016), Global Chief Operating Officer (2014– 2016), Chief Investment Officer – Global Head of Fixed Income (1998-2014), and various portfolio manager roles (1986-2006), Manulife Asset Management U.S. | | Director, Manulife Trust Company (since 2011); formerly Director, Manulife Asset Management Limited (2015-2017); formerly Chairman of the Board of Directors of Manulife Asset Management U.S. (2005-2016); formerly Chairman of the Board, Declaration Investment Management and Research (2008-2016). | | Since September 2017 |
| | | | |
Keith F. Hartstein (62) Board Member & Independent Chair Portfolios Overseen: 93 | | Retired; Member (since November 2014) of the Governing Council of the Independent Directors Council (organization of independent mutual fund directors); formerly President and Chief Executive Officer (2005-2012), Senior Vice President (2004-2005), Senior Vice President of Sales and Marketing (1997-2004), and various executive management positions (1990-1997), John Hancock Funds, LLC (asset management); Chairman, Investment Company Institute’s Sales Force Marketing Committee (2003-2008). | | None. | | Since September 2013 |
Visit our website at pgiminvestments.com
| | | | | | |
| Independent Board Members | | | | |
| | | | |
Name, Address, Age Position(s) Portfolios Overseen | | Principal Occupation(s) During Past Five Years | | Other Directorships Held During Past Five Years | | Length of Board Service |
| | | | |
Laurie Simon Hodrick (56) Board Member Portfolios Overseen: 92 | | A. Barton Hepburn Professor Emerita of Economics in the Faculty of Business, Columbia Business School (since 2018); Visiting Professor of Law, Stanford Law School (since 2015); Visiting Fellow at the Hoover Institution, Stanford University (since 2015); Sole Member, ReidCourt LLC (since 2008) (a consulting firm); formerly A. Barton Hepburn Professor of Economics in the Faculty of Business, Columbia Business School (1996-2017); formerly Managing Director, Global Head of Alternative Investment Strategies, Deutsche Bank (2006-2008). | | Independent Director, Corporate Capital Trust (since April 2017) (a business development company); Independent Director, Kabbage, Inc. (since July 2018) (financial services). | | Since September 2017 |
| | | | |
Michael S. Hyland, CFA (73) Board Member Portfolios Overseen: 93 | | Retired (since February 2005); formerly Senior Managing Director (July 2001-February 2005) of Bear Stearns & Co, Inc.; Global Partner, INVESCO (1999-2001); Managing Director and President of Salomon Brothers Asset Management (1989-1999). | | None. | | Since July 2008 |
| | | | |
Richard A. Redeker (75) Board Member Portfolios Overseen: 93 | | Retired Mutual Fund Senior Executive (50 years); Management Consultant; Director, Mutual Fund Directors Forum (since 2014); Independent Directors Council (organization of independent mutual fund directors)-Executive Committee, Chair of Policy Steering Committee, Governing Council. | | None. | | Since October 1993 |
PGIM Jennison Emerging Markets Equity Opportunities Fund
| | | | | | |
| Independent Board Members | | | | |
| | | | |
Name, Address, Age Position(s) Portfolios Overseen | | Principal Occupation(s) During Past Five Years | | Other Directorships Held During Past Five Years | | Length of Board Service |
| | | | |
Brian K. Reid (56)# Board Member Portfolios Overseen: 92 | | Retired; formerly Chief Economist for the Investment Company Institute (ICI) (2005-2017); formerly Senior Economist and Director of Industry and Financial Analysis at the ICI (1998-2004); formerly Senior Economist, Industry and Financial Analysis at the ICI (1996-1998); formerly Staff Economist at the Federal Reserve Board (1989-1996); Director, ICI Mutual Insurance Company (2012-2017). | | None. | | Since March 2018 |
| # | Mr. Reid joined the Board effective as of March 1, 2018. |
| | | | | | |
| Interested Board Members | | | | |
| | | | |
Name, Address, Age Position(s) Portfolios Overseen | | Principal Occupation(s) During Past Five Years | | Other Directorships Held During Past Five Years | | Length of
Board Service |
| | | | |
Stuart S. Parker (56) Board Member & President Portfolios Overseen: 93 | | President of PGIM Investments LLC (formerly known as Prudential Investments LLC) (since January 2012); Executive Vice President of Prudential Investment Management Services LLC (since December 2012); formerly Executive Vice President of Jennison Associates LLC and Head of Retail Distribution of PGIM Investments LLC (June 2005-December 2011). | | None. | | Since January 2012 |
Visit our website at pgiminvestments.com
| | | | | | |
| Interested Board Members | | | | |
| | | | |
Name, Address, Age Position(s) Portfolios Overseen | | Principal Occupation(s) During Past Five Years | | Other Directorships Held During Past Five Years | | Length of Board Service |
| | | | |
Scott E. Benjamin (45) Board Member & Vice President Portfolios Overseen:93 | | Executive Vice President (since June 2009) of PGIM Investments LLC; Executive Vice President (June 2009-June 2012) and Vice President (since June 2012) of Prudential Investment Management Services LLC; Executive Vice President (since September 2009) of AST Investment Services, Inc.; Senior Vice President of Product Development and Marketing, PGIM Investments (since February 2006); formerly Vice President of Product Development and Product Management, PGIM Investments LLC (2003-2006). | | None. | | Since March 2010 |
| | | | |
Grace C. Torres* (59) Board Member Portfolios Overseen: 92 | | Retired; formerly Treasurer and Principal Financial and Accounting Officer of the PGIM Funds, Target Funds, Advanced Series Trust, Prudential Variable Contract Accounts and The Prudential Series Fund (1998-June 2014); Assistant Treasurer (March 1999-June 2014) and Senior Vice President (September 1999-June 2014) of PGIM Investments LLC; Assistant Treasurer (May 2003-June 2014) and Vice President (June 2005-June 2014) of AST Investment Services, Inc.; Senior Vice President and Assistant Treasurer (May 2003-June 2014) of Prudential Annuities Advisory Services, Inc. | | Formerly Director (July 2015-January 2018) of Sun Bancorp, Inc. N.A. and Sun National Bank; Director (since January 2018) of OceanFirst Financial Corp. and OceanFirst Bank. | | Since November 2014 |
* Note: Prior to her retirement in 2014, Ms. Torres was employed by PGIM Investments LLC. Due to her prior employment, she is considered to be an “interested person” under the 1940 Act. Ms. Torres is a Non-Management Interested Board Member.
PGIM Jennison Emerging Markets Equity Opportunities Fund
| | | | |
| Fund Officers(a) | | | | |
| | | |
Name, Address and Age Position with Fund | | Principal Occupation(s) During Past Five Years | | Length of Service as Fund Officer |
| | | |
Raymond A. O’Hara (63) Chief Legal Officer | | Vice President and Corporate Counsel (since July 2010) of Prudential Insurance Company of America (Prudential); Vice President (March 2011-Present) of Pruco Life Insurance Company and Pruco Life Insurance Company of New Jersey; Vice President and Corporate Counsel (March 2011-Present) of Prudential Annuities Life Assurance Corporation; Chief Legal Officer of PGIM Investments LLC (since June 2012); Chief Legal Officer of Prudential Mutual Fund Services LLC (since June 2012) and Corporate Counsel of AST Investment Services, Inc. (since June 2012); formerly Assistant Vice President and Corporate Counsel (September 2008-July 2010) of The Hartford Financial Services Group, Inc.; formerly Associate (September 1980-December 1987) and Partner (January 1988–August 2008) of Blazzard & Hasenauer, P.C. (formerly, Blazzard, Grodd & Hasenauer, P.C.). | | Since June 2012 |
| | | |
Chad A. Earnst (43) Chief Compliance Officer | | Chief Compliance Officer (September 2014-Present) of PGIM Investments LLC; Chief Compliance Officer (September 2014-Present) of the PGIM Funds, Target Funds, Advanced Series Trust, The Prudential Series Fund, Prudential’s Gibraltar Fund, Inc., PGIM Global Short Duration High Yield Income Fund, Inc., PGIM Short Duration High Yield Fund, Inc. and PGIM Jennison MLP Income Fund, Inc.; formerly Assistant Director (March 2010-August 2014) of the Asset Management Unit, Division of Enforcement, US Securities & Exchange Commission; Assistant Regional Director (January 2010-August 2014), Branch Chief (June 2006–December 2009) and Senior Counsel (April 2003-May 2006) of the Miami Regional Office, Division of Enforcement, US Securities & Exchange Commission. | | Since September 2014 |
| | | |
Dino Capasso (44) Deputy Chief Compliance Officer | | Vice President and Deputy Chief Compliance Officer (June 2017-Present) of PGIM Investments LLC; formerly, Senior Vice President and Senior Counsel (January 2016-June 2017), and Vice President and Counsel (February 2012-December 2015) of Pacific Investment Management Company LLC. | | Since March 2018 |
| | | |
Andrew R. French (56) Secretary | | Vice President and Corporate Counsel (since February 2010) of Prudential; formerly Director and Corporate Counsel (2006-2010) of Prudential; Vice President and Assistant Secretary (since January 2007) of PGIM Investments LLC; Vice President and Assistant Secretary (since January 2007) of Prudential Mutual Fund Services LLC. | | Since October 2006 |
Visit our website at pgiminvestments.com
| | | | |
| Fund Officers(a) | | | | |
| | | |
Name, Address and Age Position with Fund | | Principal Occupation(s) During Past Five Years | | Length of Service as Fund Officer |
| | | |
Jonathan D. Shain (60) Assistant Secretary | | Vice President and Corporate Counsel (since August 1998) of Prudential; Vice President and Assistant Secretary (since May 2001) of PGIM Investments LLC; Vice President and Assistant Secretary (since February 2001) of Prudential Mutual Fund Services LLC; formerly Vice President and Assistant Secretary (May 2003-June 2005) of AST Investment Services, Inc. | | Since May 2005 |
| | | |
Claudia DiGiacomo (44) Assistant Secretary | | Vice President and Corporate Counsel (since January 2005) of Prudential; Vice President and Assistant Secretary of PGIM Investments LLC (since December 2005); formerly Associate at Sidley Austin Brown & Wood LLP (1999-2004). | | Since December 2005 |
| | | |
Charles H. Smith (45) Anti-Money Laundering Compliance Officer | | Vice President, Corporate Compliance, Anti-Money Laundering Unit (since January 2015) of Prudential; committee member of the American Council of Life Insurers Anti-Money Laundering and Critical Infrastructure Committee (since January 2016); formerly Global Head of Economic Sanctions Compliance at AIG Property Casualty (February 2007 – December 2014); Assistant Attorney General at the New York State Attorney General’s Office, Division of Public Advocacy. (August 1998 —January 2007). | | Since January 2017 |
| | | |
Brian D. Nee (52) Treasurer and Principal Financial and Accounting Officer | | Vice President and Head of Finance of PGIM Investments LLC (since August 2015) and PGIM Global Partners (since February 2017); formerly, Vice President, Treasurer’s Department of Prudential (September 2007-August 2015). | | Since July 2018 |
| | | |
Peter Parrella (60) Assistant Treasurer | | Vice President (since 2007) and Director (2004-2007) within Prudential Mutual Fund Administration; formerly Tax Manager at SSB Citi Fund Management LLC (1997-2004). | | Since June 2007 |
| | | |
Lana Lomuti (51) Assistant Treasurer | | Vice President (since 2007) and Director (2005-2007), within Prudential Mutual Fund Administration; formerly Assistant Treasurer (December 2007-February 2014) of The Greater China Fund, Inc. | | Since April 2014 |
| | | |
Linda McMullin (57) Assistant Treasurer | | Vice President (since 2011) and Director (2008-2011) within Prudential Mutual Fund Administration. | | Since April 2014 |
| | | |
Kelly A. Coyne (50) Assistant Treasurer | | Director, Investment Operations of Prudential Mutual Fund Services LLC (since 2010). | | Since March 2015 |
(a) Excludes Mr. Parker and Mr. Benjamin, interested Board Members who also serve as President and Vice President, respectively.
Explanatory Notes to Tables:
| ∎ | | Board Members are deemed to be “Interested,” as defined in the 1940 Act, by reason of their affiliation with PGIM Investments LLC and/or an affiliate of PGIM Investments LLC. |
| ∎ | | Unless otherwise noted, the address of all Board Members and Officers is c/o PGIM Investments LLC, 655 Broad Street, Newark, New Jersey 07102-4410. |
| ∎ | | There is no set term of office for Board Members or Officers. The Board Members have adopted a retirement policy, which calls for the retirement of Board Members on December 31 of the year in which they reach the age of 75. |
PGIM Jennison Emerging Markets Equity Opportunities Fund
| ∎ | | “Other Directorships Held” includes only directorships of companies required to register or file reports with the SEC under the 1934 Act (that is, “public companies”) or other investment companies registered under the 1940 Act. |
| ∎ | | “Portfolios Overseen” includes all investment companies managed by PGIM Investments LLC. The investment companies for which PGIM Investments LLC serves as manager include the PGIM Funds, The Prudential Variable Contract Accounts, PGIM ETF Trust, PGIM Short Duration High Yield Fund, Inc., PGIM Global Short Duration High Yield Fund, Inc., The Prudential Series Fund, Prudential’s Gibraltar Fund, Inc. and the Advanced Series Trust. |
Visit our website at pgiminvestments.com
Approval of Advisory Agreements (unaudited)
The Fund’s Board of Trustees
The Board of Directors (the “Board”) of PGIM Jennison Emerging Markets Equity Opportunities Fund (the “Fund”)1 consists of twelve individuals, nine of whom are not “interested persons” of the Fund, as defined in the Investment Company Act of 1940, as amended (the “1940 Act”) (the “Independent Directors”). The Board is responsible for the oversight of the Fund and its operations, and performs the various duties imposed on the directors of investment companies by the 1940 Act. The Independent Directors have retained independent legal counsel to assist them in connection with their duties. The Chair of the Board is an Independent Director. The Board has established four standing committees: the Audit Committee, the Nominating and Governance Committee, and two Investment Committees. Each committee is chaired by, and composed of, Independent Directors.
Annual Approval of the Fund’s Advisory Agreements
As required under the 1940 Act, the Board determines annually whether to renew the Fund’s management agreement with PGIM Investments LLC (“PGIM Investments”) and the Fund’s subadvisory agreement with Jennison Associates LLC (“Jennison”). In considering the renewal of the agreements, the Board, including all of the Independent Directors, met on June 7, 2018 and on June 19-21, 2018 and approved the renewal of the agreements through July 31, 2019, after concluding that the renewal of the agreements was in the best interests of the Fund and its shareholders.
In advance of the meetings, the Board requested and received materials relating to the agreements, and had the opportunity to ask questions and request further information in connection with its consideration. Among other things, the Board considered comparative fee information from PGIM Investments and Jennison. Also, the Board considered comparisons with other mutual funds in relevant Peer Universes and Peer Groups, as is further discussed below.
In approving the agreements, the Board, including the Independent Directors advised by independent legal counsel, considered the factors it deemed relevant, including the nature, quality and extent of services provided by PGIM Investments and the subadviser, the performance of the Fund, the profitability of PGIM Investments and its affiliates, expenses and fees, and the potential for economies of scale that may be shared with the Fund and its shareholders as the Fund’s assets grow. In their deliberations, the Directors did not identify any single factor which alone was responsible for the Board’s decision to approve the agreements with respect to the Fund. In connection with its deliberations, the Board considered information provided by PGIM Investments throughout the year at regular Board
| 1 | PGIM Jennison Emerging Markets Equity Opportunities Fund is a series of Prudential World Fund, Inc. |
| | |
| PGIM Jennison Emerging Markets Equity Opportunities Fund |
Approval of Advisory Agreements (continued)
meetings, presentations from portfolio managers and other information, as well as information furnished at or in advance of the meetings on June 7, 2018 and on June 19-21, 2018.
The Directors determined that the overall arrangements between the Fund and PGIM Investments, which serves as the Fund’s investment manager pursuant to a management agreement, and between PGIM Investments and Jennison, which serves as the Fund’s subadviser pursuant to the terms of a subadvisory agreement with PGIM Investments, are in the best interests of the Fund and its shareholders in light of the services performed, fees charged and such other matters as the Directors considered relevant in the exercise of their business judgment.
The material factors and conclusions that formed the basis for the Directors’ determinations to approve the renewal of the agreements are discussed separately below.
Nature, Quality and Extent of Services
The Board received and considered information regarding the nature, quality and extent of services provided to the Fund by PGIM Investments and Jennison. The Board considered the services provided by PGIM Investments, including but not limited to the oversight of the subadviser for the Fund, as well as the provision of fund recordkeeping, compliance, and other services to the Fund. With respect to PGIM Investments’ oversight of the subadviser, the Board noted that PGIM Investments’ Strategic Investment Research Group (“SIRG”), a business unit of PGIM Investments, is responsible for monitoring and reporting to PGIM Investments’ senior management on the performance and operations of the subadviser. The Board also considered that PGIM Investments pays the salaries of all of the officers and interested Directors of the Fund who are part of Fund management. The Board also considered the investment subadvisory services provided by Jennison, including investment research and security selection, as well as compliance with the Fund’s investment restrictions, policies and procedures. The Board considered PGIM Investments’ evaluation of Jennison as well as PGIM Investments’ recommendation, based on its review of Jennison, to renew the subadvisory agreement.
The Board considered the qualifications, backgrounds and responsibilities of PGIM Investments’ senior management responsible for the oversight of the Fund and Jennison, and also considered the qualifications, backgrounds and responsibilities of Jennison’s portfolio managers who are responsible for the day-to-day management of the Fund’s portfolio. The Board was provided with information pertaining to PGIM Investments’ and Jennison’s organizational structure, senior management, investment operations, and other relevant information pertaining to both PGIM Investments and Jennison. The Board also noted that it received favorable compliance reports from the Fund’s Chief Compliance Officer (“CCO”) as to both PGIM Investments and Jennison. The Board noted that Jennison is affiliated with PGIM Investments.
| | |
| Visit our website at pgiminvestments.com | | |
The Board concluded that it was satisfied with the nature, extent and quality of the investment management services provided by PGIM Investments and the subadvisory services provided to the Fund by Jennison, and that there was a reasonable basis on which to conclude that the Fund benefits from the services provided by PGIM Investments and Jennison under the management and subadvisory agreements.
Costs of Services and Profits Realized by PGIM Investments
The Board was provided with information on the profitability of PGIM Investments and its affiliates in serving as the Fund’s investment manager. The Board discussed with PGIM Investments the methodology utilized in assembling the information regarding profitability and considered its reasonableness. The Board recognized that it is difficult to make comparisons of profitability from fund management contracts because comparative information is not generally publicly available and is affected by numerous factors, including the structure of the particular adviser, the types of funds it manages, its business mix, numerous assumptions regarding allocations and the adviser’s capital structure and cost of capital. However, the Board considered that the cost of services provided by PGIM Investments for the year ended December 31, 2017 exceeded the management fees received by PGIM Investments, resulting in an operating loss to PGIM Investments. Taking these factors into account, the Board concluded that the profitability of PGIM Investments and its affiliates in relation to the services rendered was not unreasonable.
Economies of Scale
The Board received and discussed information concerning economies of scale that PGIM Investments may realize as the Fund’s assets grow beyond current levels. The Board noted that the management fee schedule for the Fund includes breakpoints, which have the effect of decreasing the fee rate as assets increase. During the course of time, the Board has considered information regarding the launch date of the Fund, the management fees of the Fund compared to those of similarly managed funds and PGIM Investments’ investment in the Fund over time. The Board took note that the Fund’s fee structure currently results in benefits to Fund shareholders whether or not PGIM Investments realizes any economies of scale. The Board noted that economies of scale can be shared with the Fund in other ways, including low management fees from inception, additional technological and personnel investments to enhance shareholder services, and maintaining existing expense structures in the face of a rising cost environment. The Board also considered PGIM Investments’ assertion that it continually evaluates the management fee schedule of the Fund and the potential to share economies of scale through breakpoints or fee waivers as asset levels increase.
The Board recognized the inherent limitations of any analysis of economies of scale, stemming largely from the Board’s understanding that most of PGIM Investments’ costs
| | |
| PGIM Jennison Emerging Markets Equity Opportunities Fund |
Approval of Advisory Agreements (continued)
are not specific to individual funds, but rather are incurred across a variety of products and services.
Other Benefits to PGIM Investments and Jennison
The Board considered potential ancillary benefits that might be received by PGIM Investments and Jennison and their affiliates as a result of their relationship with the Fund. The Board concluded that potential benefits to be derived by PGIM Investments included transfer agency fees received by the Fund’s transfer agent (which is affiliated with PGIM Investments), as well as benefits to its reputation or other intangible benefits resulting from PGIM Investments’ association with the Fund. The Board concluded that the potential benefits to be derived by Jennison included its ability to use soft dollar credits, as well as the potential benefits consistent with those generally resulting from an increase in assets under management, specifically, potential access to additional research resources and benefits to its reputation. The Board concluded that the benefits derived by PGIM Investments and Jennison were consistent with the types of benefits generally derived by investment managers and subadvisers to mutual funds.
Performance of the Fund / Fees and Expenses
The Board considered certain additional specific factors and made related conclusions relating to the historical performance of the Fund for the one-and three-year periods ended December 31, 2017. The Board considered that the Fund commenced operations on September 16, 2014 and that longer-term performance was not yet available.
The Board also considered the Fund’s actual management fee, as well as the Fund’s net total expense ratio, for the fiscal year ended October 31, 2017. The Board considered the management fee for the Fund as compared to the management fee charged by PGIM Investments to other funds and the fee charged by other advisers to comparable mutual funds in a Peer Group. The actual management fee represents the fee rate actually paid by Fund shareholders and includes any fee waivers or reimbursements. The net total expense ratio for the Fund represents the actual expense ratio incurred by Fund shareholders.
The mutual funds included in the Peer Universe, which was used to consider performance, and the Peer Group, which was used to consider fees and expenses, were objectively determined by Broadridge, an independent provider of mutual fund data. In certain circumstances, PGIM Investments also may have provided supplemental Peer Universe or Peer Group information, for reasons addressed with the Board. The comparisons placed the Fund in various quartiles, with the first quartile being the best 25% of the mutual funds (for performance, the best performing mutual funds and, for expenses, the lowest cost mutual funds).
| | |
| Visit our website at pgiminvestments.com | | |
The section below summarizes key factors considered by the Board and the Board’s conclusions regarding the Fund’s performance, fees and overall expenses. The table sets forth gross performance comparisons (which do not reflect the impact on performance of fund expenses, or any subsidies, expense caps or waivers that may be applicable) with the Peer Universe, actual management fees with the Peer Group (which reflect the impact of any subsidies or fee waivers), and net total expenses with the Peer Group, each of which were key factors considered by the Board.
| | | | | | | | |
Gross
Performance | | 1 Year | | 3 Years | | 5 Years | | 10 Years |
| | 1st Quartile | | 3rd Quartile | | N/A | | N/A |
| Actual Management Fees: 1st Quartile |
| Net Total Expenses: 2nd Quartile |
| • | | The Board noted that the Fund outperformed its benchmark index over all periods. |
| • | | The Board and PGIM Investments agreed to retain the Fund’s existing contractual expense cap, which (exclusive of certain fees and expenses) caps the Fund’s annual operating expenses at 1.45% for Class A shares, 2.20% for Class C shares, 1.20% for Class R6 shares, and 1.20% for Class Z shares through February 28, 2019. |
| • | | The Board concluded that in light of the above, it would be in the best interests of the Fund and its shareholders to renew the agreements. |
| • | | The Board concluded that the management fees (including subadvisory fees) and total expenses were reasonable in light of the services provided. |
* * *
After full consideration of these factors, the Board concluded that approval of the agreements was in the best interests of the Fund and its shareholders.
| | |
| PGIM Jennison Emerging Markets Equity Opportunities Fund |
| | | | |
| ∎ MAIL | | ∎ TELEPHONE | | ∎ WEBSITE |
655 Broad Street Newark, NJ 07102 | | (800) 225-1852 | | www.pgiminvestments.com |
|
| PROXY VOTING |
| The Board of Trustees of the Fund has delegated to the Fund’s subadviser the responsibility for voting any proxies and maintaining proxy recordkeeping with respect to the Fund. A description of these proxy voting policies and procedures is available without charge, upon request, by calling (800) 225-1852. Information regarding how the Fund voted proxies relating to portfolio securities during the most recent 12-month period ended June 30 is available on the Fund’s website and on the Securities and Exchange Commission’s website. |
|
| TRUSTEES |
| Ellen S. Alberding • Kevin J. Bannon • Scott E. Benjamin • Linda W. Bynoe • Barry H. Evans • Keith F. Hartstein • Laurie Simon Hodrick • Michael S. Hyland • Stuart S. Parker • Richard A. Redeker • Brian K. Reid • Grace C. Torres |
|
| OFFICERS |
| Stuart S. Parker, President • Scott E. Benjamin, Vice President • Brian D. Nee, Treasurer and Principal Financial and Accounting Officer • Raymond A. O’Hara, Chief Legal Officer • Chad A. Earnst, Chief Compliance Officer • Andrew R. French, Secretary • Dino Capasso, Vice President and Deputy Chief Compliance Officer • Charles H. Smith, Anti-Money Laundering Compliance Officer • Jonathan D. Shain, Assistant Secretary • Claudia DiGiacomo, Assistant Secretary • Peter Parrella, Assistant Treasurer • Lana Lomuti, Assistant Treasurer • Linda McMullin, Assistant Treasurer • Kelly A. Coyne, Assistant Treasurer |
| | | | |
| MANAGER | | PGIM Investments LLC | | 655 Broad Street
Newark, NJ 07102 |
|
| SUBADVISER | | Jennison Associates LLC | | 466 Lexington Avenue
New York, NY 10017 |
|
| DISTRIBUTOR | | Prudential Investment
Management Services LLC | | 655 Broad Street
Newark, NJ 07102 |
|
| CUSTODIAN | | The Bank of New York Mellon | | 225 Liberty Street
New York, NY 10286 |
|
| TRANSFER AGENT | | Prudential Mutual Fund
Services LLC | | PO Box 9658
Providence, RI 02940 |
|
INDEPENDENT REGISTERED
PUBLIC ACCOUNTING FIRM | | KPMG LLP | | 345 Park Avenue
New York, NY 10154 |
|
| FUND COUNSEL | | Willkie Farr & Gallagher LLP | | 787 Seventh Avenue
New York, NY 10019 |
|
|
| An investor should consider the investment objectives, risks, charges, and expenses of the Fund carefully before investing. The prospectus and summary prospectus contain this and other information about the Fund. An investor may obtain a prospectus and summary prospectus by visiting our website at www.pgiminvestments.com or by calling (800) 225-1852. The prospectus and summary prospectus should be read carefully before investing. |
|
| E-DELIVERY |
| To receive your mutual fund documents online, go to www.pgiminvestments.com/edelivery and enroll. Instead of receiving printed documents by mail, you will receive notification via email when new materials are available. You can cancel your enrollment or change your email address at any time by visiting the website address above. |
|
| SHAREHOLDER COMMUNICATIONS WITH TRUSTEES |
| Shareholders can communicate directly with the Board of Trustees by writing to the Chair of the Board, PGIM Jennison Emerging Markets Equity Opportunities Fund, PGIM Investments, Attn: Board of Trustees, 655 Broad Street, Newark, NJ 07102. Shareholders can communicate directly with an individual Director by writing to the same address. Communications are not screened before being delivered to the addressee. |
|
| AVAILABILITY OF PORTFOLIO SCHEDULE |
| The Fund files its complete schedule of portfolio holdings with the Securities and Exchange Commission for the first and third quarters of each fiscal year on Form N-Q. The Fund’s Forms N-Q are available on the Commission’s website at www.sec.gov. The Fund’s schedule of portfolio holdings is also available on the Fund’s website as of the end of each month no sooner than 15 days after the end of the month. |
|
| The Fund’s Statement of Additional Information contains additional information about the Fund’s Trustees and is available without charge, upon request, by calling (800) 225-1852. |
Mutual Funds:
| | | | |
| ARE NOT INSURED BY THE FDIC OR ANY FEDERAL GOVERNMENT AGENCY | | MAY LOSE VALUE | | ARE NOT A DEPOSIT OF OR GUARANTEED BY ANY BANK OR ANY BANK AFFILIATE |
PGIM JENNISON EMERGING MARKETS EQUITY OPPORTUNITIES FUND
| | | | | | | | |
| SHARE CLASS | | A | | C | | Z | | R6* |
| NASDAQ | | PDEAX | | PDECX | | PDEZX | | PDEQX |
| CUSIP | | 743969644 | | 743969636 | | 743969610 | | 743969628 |
*Formerly known as Class Q shares.
MF225E

PGIM JENNISON GLOBAL OPPORTUNITIES FUND
(Formerly known as Prudential Jennison Global Opportunities Fund)
ANNUAL REPORT
OCTOBER 31, 2018
COMING SOON: PAPERLESS SHAREHOLDER REPORTS
Beginning on January 1, 2021, as permitted by regulations adopted by the Securities and Exchange Commission, paper copies of the Fund’s annual and semi-annual shareholder reports will no longer be sent by mail, unless you specifically request paper copies of the reports. Instead, the reports will be made available on the Fund’s website (www.pgiminvestments.com), and you will be notified by mail each time a report is posted and provided with a website link to access the report.
If you already elected to receive shareholder reports electronically, you will not be affected by this change and you need not take any action. You may elect to receive shareholder reports and other communications from the Fund electronically anytime by contacting your financial intermediary (such as a broker-dealer or bank) or, if you are a direct investor, by calling 1-800-225-1852 or by sending an e-mail request to PGIM Investments at shareholderreports@pgim.com.
Beginning on January 1, 2019, you may elect to receive all future reports in paper free of charge. If you invest through a financial intermediary, you can contact your financial intermediary or follow instructions included with this notice to elect to continue to receive paper copies of your shareholder reports. If you invest directly with the Fund, you can call 1-800-225-1852 or send an email request to shareholderreports@pgim.com to let the Fund know you wish to continue receiving paper copies of your shareholder reports. Your election to receive reports in paper will apply to all funds held in your account if you invest through your financial intermediary or all funds held with the fund complex if you invest directly with the Fund.

To enroll in e-delivery, go to pgiminvestments.com/edelivery
|
| Objective: To seek long-term growth of capital |
Highlights (unaudited)
| • | | While US equity markets advanced during the 12-month reporting period, global growth was mixed. |
| • | | In Europe, Brexit negotiations between the United Kingdom and European Union remained contentious, compounding uncertainty about the final outcome. |
| • | | In China, a slowdown in the rate of economic expansion was amplified toward the end of the period by escalating trade tensions with the United States. |
| • | | The Fund’s information technology holdings, especially payment processors, were strong contributors to performance. Several Internet retailers in the consumer discretionary sector were also standouts. |
| • | | The Fund’s materials holdings weighed on relative performance, as did having no exposure to energy. |
This report is not authorized for distribution to prospective investors unless preceded or accompanied by a current prospectus.
The views expressed in this report and information about the Fund’s portfolio holdings are for the period covered by this report and are subject to change thereafter.
Mutual funds are distributed by Prudential Investment Management Services LLC, member SIPC. Jennison Associates LLC is a registered investment adviser. Both are Prudential Financial companies. © 2018 Prudential Financial, Inc. and its related entities. Jennison Associates, Jennison, PGIM, and the PGIM logo are service marks of Prudential Financial, Inc. and its related entities, registered in many jurisdictions worldwide.
| | |
| 2 | | Visit our website at pgiminvestments.com |
PGIM FUNDS — UPDATE
The Board of Directors/Trustees for the Fund has approved the implementation of an automatic conversion feature for Class C shares, effective as of April 1, 2019. To reflect these changes, effective April 1, 2019, the section of the Fund’s Prospectus entitled “How to Buy, Sell and Exchange Fund Shares—How to Exchange Your Shares—Frequent Purchases and Redemptions of Fund Shares” is restated to read as follows:
This supplement should be read in conjunction with your Summary Prospectus, Statutory Prospectus and Statement of Additional Information, be retained for future reference and is in addition to any existing Fund supplements.
| | 1. | In each Fund’s Statutory Prospectus, the following is added at the end of the section entitled “Fund Distributions And Tax Issues—If You Sell or Exchange Your Shares”: |
Automatic Conversion of Class C Shares
The conversion of Class C shares into Class A shares—which happens automatically approximately 10 years after purchase—is not a taxable event for federal income tax purposes. For more information about the automatic conversion of Class C shares, see Class C Shares Automatically Convert to Class A Shares in How to Buy, Sell and Exchange Fund Shares.
| | 2. | In each Fund’s Statutory Prospectus, the following sentence is added at the end of the section entitled “How to Buy, Sell and Exchange Shares—Closure of Certain Share Classes to New Group Retirement Plans”: |
Shareholders owning Class C shares may continue to hold their Class C shares until the shares automatically convert to Class A shares under the conversion schedule, or until the shareholder redeems their Class C shares.
| | 3. | In each Fund’s Statutory Prospectus, the following disclosure is added immediately following the section entitled “How to Buy, Sell and Exchange Shares—How to Buy Shares—Class B Shares Automatically Convert to Class A Shares”: |
Class C Shares Automatically Convert to Class A Shares
Starting on or about April 1, 2019 (the “Effective Date”), Class C shares will be eligible for automatic conversion into Class A shares on a monthly basis approximately ten years after the original date of purchase (the “Conversion Date”). Conversion will take place based on the relative NAV of the two classes, without the imposition of any sales load, fee or other charge. All such automatic conversions of Class C shares will constitute tax-free exchanges for federal income tax purposes.
For shareholders investing in Class C shares through retirement plans or omnibus accounts, and in certain other instances, the Fund and its agents may not have
| | | | |
| PGIM Jennison Global Opportunities Fund | | | 3 | |
transparency into how long a shareholder has held Class C shares for purposes of determining whether such Class C shares are eligible for automatic conversion into Class A shares, and the relevant financial intermediary may not have the ability to track purchases in order to credit individual shareholders’ holding periods. In these circumstances, the Fund will not be able to automatically convert Class C shares into Class A shares as described above. In order to determine eligibility for conversion in these circumstances, it is the responsibility of the financial intermediary to notify the Fund that the shareholder is eligible for the conversion of Class C shares to Class A shares, and the financial intermediary may be required to maintain and provide the Fund with records that substantiate the holding period of Class C shares. It is the financial intermediary’s (and not the Fund’s) responsibility to keep records of transactions made in accounts it holds and to ensure that the shareholder is credited with the proper holding period based on such records or those provided to the financial intermediary by the shareholder. Please consult with your financial intermediary for the applicability of this conversion feature to your shares.
A financial intermediary may sponsor and/or control accounts, programs or platforms that impose a different conversion schedule or different eligibility requirements for the exchange of Class C shares for Class A shares (see Appendix A: Waivers and Discounts Available From Certain Financial Intermediaries of the Prospectus). Please consult with your financial intermediary if you have any questions regarding your shares’ conversion from Class C shares to Class A shares.
| | 4. | In Part II of each Fund’s Statement of Additional Information, the following disclosure is added immediately following the section entitled “Purchase, Redemption and Pricing of Fund Shares—Share Classes—Automatic Conversion of Class B Shares”: |
AUTOMATIC CONVERSION OF CLASS C SHARES. Starting on or about April 1, 2019 (the “Effective Date”), Class C shares will be eligible for automatic conversion into Class A shares on a monthly basis approximately ten years after the original date of purchase (the “Conversion Date”). Conversion will take place based on the relative NAV of the two classes, without the imposition of any sales load, fee or other charge. Class C shares of a Fund acquired through automatic reinvestment of dividends or distributions will convert to Class A shares of the Fund on the Conversion Date pro rata with the converting Class C shares of the Fund that were not acquired through reinvestment of dividends or distributions. All such automatic conversions of Class C shares will constitute tax-free exchanges for federal income tax purposes.
For shareholders investing in Class C shares through retirement plans or omnibus accounts, and in certain other instances, the Fund and its agents may not have transparency into how long a shareholder has held Class C shares for purposes of determining whether such Class C shares are eligible for automatic conversion into Class A shares, and the relevant financial intermediary may not have the ability to track purchases in order to credit individual shareholders’ holding periods. In these circumstances, the
| | |
| 4 | | Visit our website at pgiminvestments.com |
Fund will not be able to automatically convert Class C shares into Class A shares as described above. In order to determine eligibility for conversion in these circumstances, it is the responsibility of the financial intermediary to notify the Fund that the shareholder is eligible for the conversion of Class C shares to Class A shares, and the financial intermediary may be required to maintain and provide the Fund with records that substantiate the holding period of Class C shares. It is the financial intermediary’s (and not the Fund’s) responsibility to keep records of transactions made in accounts it holds and to ensure that the shareholder is credited with the proper holding period based on such records or those provided to the financial intermediary by the shareholder. Please consult with your financial intermediary for the applicability of this conversion feature to your shares.
Class C shares were generally closed to investments by new group retirement plans effective June 1, 2018. Group retirement plans (and their successor, related and affiliated plans) that have Class C shares of the Fund available to participants on or before the Effective Date may continue to open accounts for new participants in such share class and purchase additional shares in existing participant accounts.
The Fund has no responsibility for monitoring or implementing a financial intermediary’s process for determining whether a shareholder meets the required holding period for conversion. A financial intermediary may sponsor and/or control accounts, programs or platforms that impose a different conversion schedule or different eligibility requirements for the exchange of Class C shares for Class A shares, as set forth on Appendix A: Waivers and Discounts Available From Certain Financial Intermediaries of the Prospectus. In these cases, Class C shareholders may have their shares exchanged for Class A shares under the policies of the financial intermediary. Financial intermediaries will be responsible for making such exchanges in those circumstances. Please consult with your financial intermediary if you have any questions regarding your shares’ conversion from Class C shares to Class A shares.
LR1094
- Not part of the Annual Report -
| | | | |
| PGIM Jennison Global Opportunities Fund | | | 5 | |
Table of Contents
| | |
| 6 | | Visit our website at pgiminvestments.com |
Letter from the President

Dear Shareholder:
We hope you find the annual report for PGIM Jennison Global Opportunities Fund informative and useful. The report covers performance for the 12-month period that ended October 31, 2018.
We have important information to share with you. Effective June 11, 2018, Prudential Mutual Funds were renamed PGIM Funds. This renaming is part of our ongoing effort to further build our reputation and establish our global brand, which began when our firm adopted PGIM Investments as its name in April 2017. Please note that only the Fund’s name has changed. Your Fund’s management and operation, along with its symbols, remained the same.*
During the reporting period, the global economy continued to grow, and central banks gradually tightened monetary policy. In the US, the economy expanded and employment increased. In September, the Federal Reserve hiked interest rates for the eighth time since 2015, based on confidence in the economy.
Equity returns on the whole were strong, due to optimistic earnings expectations and investor sentiment. Global equities, including emerging markets, generally posted positive returns. However, they trailed the performance of US equities, which rose on higher corporate profits, new regulatory policies, and tax reform benefits. Volatility spiked briefly early in the period on inflation concerns, rising interest rates, and a potential global trade war, and again late in the period on worries that profit growth might slow in 2019.
The overall bond market declined modestly during the period, as measured by the Bloomberg Barclays US Aggregate Bond Index. The best performance came from higher-yielding, economically sensitive sectors, such as high yield bonds and bank loans, which posted small gains. US investment-grade corporate bonds and US Treasury bonds both finished the period with negative returns. A major trend during the period was the flattening of the US Treasury yield curve, which increased the yield on fixed income investments with shorter maturities and made them more attractive to investors.
Regarding your investments with PGIM, we believe it is important to maintain a diversified portfolio of funds consistent with your tolerance for risk, time horizon, and financial goals. Your financial advisor can help you create a diversified investment plan that may include funds covering all the basic asset classes and that reflects your personal investor profile and risk tolerance. However, diversification and asset allocation strategies do not assure a profit or protect against loss in declining markets.
At PGIM Investments, we consider it a great privilege and responsibility to help investors participate in opportunities across global markets while meeting their toughest investment challenges. PGIM is a top-10 global investment manager with more than $1 trillion in assets under management. This investment expertise allows us to deliver actively managed funds and strategies to meet the needs of investors around the globe.
Thank you for choosing our family of funds.
Sincerely,

Stuart S. Parker, President
PGIM Jennison Global Opportunities Fund
December 14, 2018
*The Prudential Day One Funds did not change their names.
| | | | |
| PGIM Jennison Global Opportunities Fund | | | 7 | |
Your Fund’s Performance (unaudited)
Performance data quoted represents past performance. Past performance does not guarantee future results. The investment return and principal value of an investment will fluctuate, so that an investor’s shares, when redeemed, may be worth more or less than their original cost. Current performance may be lower or higher than the past performance data quoted. An investor may obtain performance data as of the most recent month-end by visiting our website at www.pgiminvestments.com or by calling (800) 225-1852.
| | | | | | |
| | | Average Annual Total Returns as of 10/31/18
(with sales charges) |
| | | One Year (%) | | Five Years (%) | | Since Inception (%) |
| Class A | | –2.08 | | 9.41 | | 11.25 (3/14/12) |
| Class C | | 1.82 | | 9.83 | | 11.35 (3/14/12) |
| Class Z | | 3.90 | | 10.93 | | 12.48 (3/14/12) |
| Class R6* | | 3.99 | | N/A | | 11.98 (12/22/14) |
| MSCI ACWI ND Index |
| | –0.52 | | 6.15 | | — |
| Lipper Global Multi-Cap Growth Funds Average** |
| | –0.38 | | 6.66 | | — |
| Lipper Global Large-Cap Growth Funds Average** |
| | | 1.57 | | 7.13 | | — |
| | | | | | |
| | | Average Annual Total Returns as of 10/31/18
(without sales charges) |
| | | One Year (%) | | Five Years (%) | | Since Inception (%) |
| Class A | | 3.62 | | 10.66 | | 12.21 (3/14/12) |
| Class C | | 2.82 | | 9.83 | | 11.35 (3/14/12) |
| Class Z | | 3.90 | | 10.93 | | 12.48 (3/14/12) |
| Class R6* | | 3.99 | | N/A | | 11.98 (12/22/14) |
| MSCI ACWI ND Index | | –0.52 | | 6.15 | | — |
| Lipper Global Multi-Cap Growth Funds Average** |
| | –0.38 | | 6.66 | | — |
| Lipper Global Large-Cap Growth Funds Average** |
| | | 1.57 | | 7.13 | | — |
| | |
| 8 | | Visit our website at pgiminvestments.com |
Growth of a $10,000 Investment (unaudited)
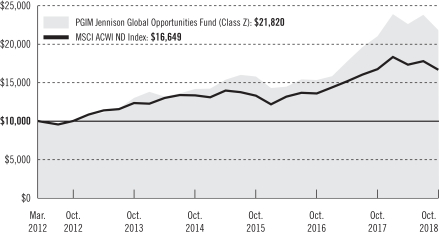
The graph compares a $10,000 investment in the Fund’s Class Z share with a similar investment in the MSCI ACWI ND Index by portraying the initial account values at the commencement of operations for Class Z shares (March 14, 2012) and the account values at the end of the current fiscal year (October 31, 2018), as measured on a quarterly basis. For purposes of the graph, and unless otherwise indicated, it has been assumed that (a) all recurring fees (including management fees) were deducted; and (b) all dividends and distributions were reinvested. The line graph provides information for Class Z shares only. As indicated in the tables provided earlier, performance for other share classes will vary due to the differing charges and expenses applicable to each share class (as indicated in the following paragraphs). Without waiver of fees and/or expense reimbursements, if any, the returns would have been lower.
Past performance does not predict future performance. Total returns and the ending account values in the graph include changes in share price and reinvestment of dividends and capital gains distributions in a hypothetical investment for the periods shown. The Fund’s total returns do not reflect the deduction of income taxes on an individual’s investment. Taxes may reduce your actual investment returns on income or gains paid by the Fund or any gains you may realize if you sell your shares.
Source: PGIM Investments LLC and Lipper Inc.
*Formerly known as Class Q shares.
**The Fund is compared to the Lipper Global Multi-Cap Growth Funds Average performance universe, although Lipper classifies the Fund in the Lipper Global Large-Cap Growth Funds performance universe. The Lipper Global Multi-Cap Growth Funds performance universe is utilized because the Fund’s manager believes that the funds included in this universe provide a more appropriate basis for fund performance comparison.
Since Inception returns are provided since the Fund has less than 10 fiscal years of returns. Since Inception returns for the Index and the Lipper Averages are measured from the closest month-end to the class’ inception date.
| | | | |
| Prudential Jennison Global Opportunities Fund | | | 9 | |
Your Fund’s Performance (continued)
The returns in the tables do not reflect the deduction of taxes that a shareholder would pay on Fund distributions or following the redemption of Fund shares. The average annual total returns take into account applicable sales charges, which are described for each share class in the table below.
| | | | | | | | |
| | | Class A | | Class C | | Class Z | | Class R6* |
| Maximum initial sales charge | | 5.50% of the public offering price | | None | | None | | None |
| Contingent deferred sales charge (CDSC) (as a percentage of the lower of original purchase price or net asset value at redemption) | | 1.00% on sales of $1 million or more made within 12 months of purchase | | 1.00% on sales made within 12 months of purchase | | None | | None |
| Annual distribution and service (12b-1) fees (shown as a percentage of average daily net assets) | | 0.30% (0.25% currently) | | 1.00% | | None | | None |
*Formerly known as Class Q shares.
Benchmark Definitions
MSCI ACWI ND Index—The Morgan Stanley Capital International All Country World Net Dividend Index (MSCI ACWI ND Index) is an unmanaged free float-adjusted market capitalization-weighted index that is designed to measure the equity market performance of developed and emerging markets. The MSCI ACWI ND Index consists of 46 country indexes comprising 23 developed and 23 emerging market country indexes. The ND version of the MSCI ACWI Index reflects the impact of the maximum withholding taxes on reinvested dividends. The average annual total returns for the Index measured from the month-end closest to the inception date of the Fund’s Class A, Class C, and Class Z shares are 8.05% and 6.08% for Class R6 shares.
Lipper Global Multi-Cap Growth Funds Average—The Lipper Global Multi-Cap Growth Funds Average (Lipper Average) is based on the average return of all funds in the Lipper Global Multi-Cap Growth Funds universe for the periods noted. Funds in the Lipper Average are funds that, by portfolio practice, invest in a variety of market capitalization ranges without concentrating 75% of their equity assets in any one market capitalization range over an extended period of time. Global multi-cap growth funds typically have above-average characteristics compared to the MSCI World Index. The average annual total returns for the Lipper Average measured from the month-end closest to the inception date of the Fund’s Class A, Class C, and Class Z shares are 8.56% and 6.54% for Class R6 shares.
Lipper Global Large-Cap Growth Funds Average—The Lipper Global Large-Cap Growth Funds Average (Lipper Average) is based on the average return of all funds in the Lipper Global Large-Cap Growth Funds universe for the periods noted. Funds in the Lipper Average are funds that, by portfolio practice, invest at least 75% of their
| | |
| 10 | | Visit our website at pgiminvestments.com |
equity assets in companies both inside and outside of the US with market capitalizations (on a three-year weighted basis) above Lipper’s global large-cap floor. Global large-cap growth funds typically have above average characteristics compared to their large-cap specific subset of the MSCI World Index. The average annual total returns for the Lipper Average measured from the month-end closest to the inception date of the Fund’s Class A, Class C, and Class Z shares are 9.11% and 7.46% for Class R6 shares.
Investors cannot invest directly in an index or average. The returns for the Index would be lower if they included the effects of sales charges, operating expenses of a mutual fund, or taxes. Returns for the Lipper Average reflect the deduction of operating expenses of a mutual fund, but not sales charges or taxes.
Presentation of Fund Holdings
| | | | |
Five Largest Holdings expressed as a
percentage of net assets as of 10/31/18 (%) | |
Amazon.com, Inc., Internet & Direct Marketing Retail | | | 6.0 | |
| Netflix, Inc., Entertainment | | | 4.7 | |
| UnitedHealth Group, Inc., Health Care Providers & Services | | | 4.6 | |
| Tencent Holdings Ltd., Interactive Media & Services | | | 4.5 | |
| Wirecard AG, IT Services | | | 4.0 | |
Holdings reflect only long-term investments and are subject to change.
| | | | |
Five Largest Industries expressed as a
percentage of net assets as of 10/31/18 (%) | |
| IT Services | | | 16.2 | |
| Internet & Direct Marketing Retail | | | 10.4 | |
| Interactive Media & Services | | | 8.8 | |
| Textiles, Apparel & Luxury Goods | | | 8.6 | |
| Health Care Equipment & Supplies | | | 7.0 | |
Industry weightings reflect only long-term investments and are subject to change.
| | | | |
| PGIM Jennison Global Opportunities Fund | | | 11 | |
Strategy and Performance Overview (unaudited)
How did the Fund perform?
The PGIM Jennison Global Opportunities Fund’s Class Z shares returned 3.90% for the 12-month reporting period that ended October 31, 2018. During the same period, the MSCI All Country World Index (the Index) fell 0.52% and the Lipper Global Multi-Cap Growth Funds Average returned –0.38%.
What were the market conditions?
| • | | US equity markets advanced during the reporting period, extending gains that stretched back to the aftermath of the credit crisis of 2008. The macroeconomic backdrop was solid. Gross domestic product (GDP) grew at a healthy pace, employment gains were robust, corporate profit growth showed continued strength, and business and consumer confidence rose. In addition, corporations used lower tax rates to increase capital spending and repurchase shares. |
| • | | However, international equity markets produced mixed results. In Europe, Brexit negotiations between the United Kingdom (the UK) and European Union (EU) remained contentious, compounding uncertainty about the final outcome. |
| • | | An economic slowdown in China constricted prices of many commodities and fueled concerns over the ramifications for global growth. Tremors rippled widely across other emerging markets, where weaker sentiment and the effect of higher US interest rates on local US-dollar-denominated debt added to the toll. |
| • | | Continued moves by the Trump administration to reset global trade practices with new tariffs and penalties for intellectual property infringement also weighed on global equities. Initially, Chinese stocks suffered the brunt of the pain, while the US economy—which is dominated by the services sector—felt relatively little impact. However, the administration’s increasingly aggressive tone, growing uncertainty about the outcome of these disputes, and worries that corporate profit growth might slow in 2019 fueled volatility for US stocks in October. |
| • | | Among the Index’s sector components, information technology, health care, and energy were the strongest performers, while materials, financials, and industrials suffered the greatest losses. |
What worked?
Information technology holdings, especially payment processors, were strong contributors to the Fund’s performance.
| • | | Munich-based Wirecard AG is a leading electronic payment processor trading in more than 120 currencies with more than 15,000 corporate customers. The company’s largest customer segment is e-commerce retailers in Germany and the rest of Western Europe. Growth was strong throughout the reporting period, leading to strong earnings |
| | |
| 12 | | Visit our website at pgiminvestments.com |
| | and better-than-expected profit margins. Jennison believes the company is well-positioned through its online focus and rapidly expanding Asia/Pacific footprint. |
| • | | MasterCard, Inc. is the second-largest payment system in the US. Jennison expects the company to continue benefiting from the long-term shift from cash to electronic credit and debit transactions globally. In addition, MasterCard has a strong market position with high barriers to entry, as well as pricing power and solid operating leverage potential. |
Several key contributors in consumer discretionary also boosted results.
| • | | E-commerce giant Amazon.com, Inc. continues to invest to drive unit growth in its core retail business and through the proliferation of digital commerce via mobile engagement. The stock benefited from the company’s strong business execution, long-term revenue growth, and development of a meaningfully important business opportunity in cloud infrastructure. |
| • | | MercadoLibre, Inc. (MELI) is a Buenos Aires-based online trading service that enables individuals and businesses to electronically sell and buy items in thousands of categories. Jennison views positively MELI’s strong execution and enhanced marketplace initiatives, including integrated shipping and payment systems, as well as its exposure to Latin America’s expanding Internet penetration and low e-commerce share of the overall retail market. MELI’s second-quarter revenues were above expectations, despite disruption in Brazil due to a trucker strike. Jennison also saw good progress on various long-term initiatives in areas such as fulfillment and payments. |
Despite lackluster results for the communication services sector, there was one standout.
| • | | Media services provider Netflix, Inc. continued to develop its long-term competitive barriers with investments in content, resulting in strong subscriber growth and solid evidence of increased pricing and operating leverage. Jennison believes the company’s long-term competitive positioning has been strengthened by exclusive deals and original content, international expansion, and scale advantage, enabling the company to fund content costs with a global subscriber base. |
Health care holdings, in aggregate, and limited exposure to financials, materials, and industrials also helped the Fund’s relative performance.
What didn’t work?
Materials was the largest detractor at the sector level.
| • | | Chemical maker Albemarle Corp. has the top global share and lowest cost structure in the lithium market. While Jennison thinks the company should benefit over the long term as electric vehicle battery applications and continued growth in consumer electronics drive lithium growth, the position was sold in July 2018 as concerns about aggressive lithium supply expansion continued to weigh on market sentiment. |
| | | | |
| PGIM Jennison Global Opportunities Fund | | | 13 | |
Strategy and Performance Overview (continued)
In communication services, Tencent was a notable laggard.
| • | | Tencent Holdings Ltd. is the largest videogame publisher in the world by revenue, but is best known in China for its popular WeChat and QQ messaging and mobile payment apps. The company also offers services similar to Facebook, Twitter, and Netflix; a cloud service for businesses; a news service; and a payment and financial services business. Tencent shares declined during the period on regulatory and macroeconomic uncertainties. Still, Jennison anticipates that the company’s accelerating earnings and revenue growth will resume, driven by its dominant market position in China’s online gaming and messaging segments, and its growing efforts in advertising and payment services. Jennison also anticipates that Tencent will overcome the regulatory roadblocks restricting its ability to monetize new games. |
Other holdings that somewhat offset otherwise strong performance in consumer discretionary and information technology included the following companies.
| • | | JD.com, Inc. is China’s largest direct sales company, as measured by transaction volume, and also the country’s second-largest e-commerce business. The firm sells a number of products on its website, including books, electronics, office and school supplies, and home appliances. Jennison expects that competition and new investment initiatives will weigh on margins for the next several quarters, so the position was sold in September 2018. |
| • | | Shares of Alibaba Group, one of the world’s largest e-commerce firms, underperformed on macroeconomic uncertainties, some softness in China’s online retail market, and tariff concerns. In addition, the company increased its pace of investment spending to take advantage of new market opportunities in China, resulting in falling earnings estimates. Jennison believes Alibaba’s various business segments have the potential for durable, high revenue growth. The company’s new Taobao interface, which features a personalized recommendation feed, could meaningfully increase sales over the long term. While Jennison is closely monitoring economic conditions in China, it believes Alibaba’s structural growth remains very compelling. |
| • | | Nvidia Corp. is focused on key high-growth markets where it can leverage its graphics semiconductor expertise to offer value-added solutions. These growth-driving markets include gaming—where Nvidia has dominant market share and where user and user-engagement metrics continue to exceed forecasts—automotive, high-performance computing, and cloud and enterprise. The company’s core graphics intellectual property business is playing a key role in the development of autonomous driving, artificial intelligence, deep learning, augmented reality, and blockchain. Jennison believes Nvidia is uniquely positioned in these markets, as the firm’s architecture and platform have set the standard for software developers, potentially driving several years of strong revenue |
| | |
| 14 | | Visit our website at pgiminvestments.com |
| | growth. Jennison also views favorably the company’s expanding margins, strong cash flow, and solid management team. In Jennison’s view, the stock’s decline at the end of the period may have reflected investor concerns about recent softness in order patterns from industrial and consumer end markets. |
Having no exposure to energy companies also detracted from the Fund’s performance, as this sector was one of the Index’s best performers.
Current outlook
| • | | Although global trade tensions and the first round of tariffs between China and the US did not directly affect portfolio holdings by the end of the period, these factors have led to increased market volatility and are the headline issues that Jennison is most concerned about. |
| • | | US equity market volatility in October suggests that some investors believe domestic companies are susceptible to the effects of the ongoing trade war, similar to Chinese stocks. At this stage, the economic impact and breadth of possible disruptions are unknown. Tariffs are a wild card, and trade has not played a pivotal role in stock performance for more than 40 years. In Jennison’s view, much still depends on how China reacts to the Trump administration’s aggressive stance. If supply chains continue to tighten and tariffs mount, headwinds to US economic expansion could threaten a deceleration in GDP growth heading into 2019. |
| • | | In the wake of the US mid-term elections, there is a new power dynamic in Congress. Meanwhile, Brexit negotiations between the UK and EU remain contentious, compounding uncertainty about the final outcome, which has a March 2019 deadline. |
| • | | Against this backdrop, Jennison believes the portfolio is well-positioned with companies whose growth prospects remain robust and well above average, even with the outlook for heightened risk. Although not immune to increasing trade tensions, the portfolio, on balance, includes diversified growth opportunities across many different product and market segments with strong outlooks. |
The percentage points shown in the tables below identify each security’s positive or negative contribution to the Fund’s return relative to the benchmark, which is the sum of all contributions by individual holdings.
| | | | | | |
| Top contributors (%) | | Top detractors (%) |
| Wirecard AG | | 2.11 | | Alibaba Group | | –1.16 |
| Netflix, Inc. | | 1.71 | | JD.com, Inc. | | –0.92 |
| Amazon.com, Inc. | | 1.51 | | Albemarle, Corp. | | –0.88 |
| MercardoLibre, Inc. | | 1.10 | | Tencent Holdings Ltd. | | –0.87 |
| Mastercard, Inc. | | 0.86 | | NVIDIA Corp. | | –0.56 |
| | | | |
| PGIM Jennison Global Opportunities Fund | | | 15 | |
Fees and Expenses (unaudited)
As a shareholder of the Fund, you incur two types of costs: (1) transaction costs, including sales charges (loads) on purchase payments and redemptions, as applicable, and (2) ongoing costs, including management fees, distribution, and/or service (12b-1) fees, and other Fund expenses, as applicable. This example is intended to help you understand your ongoing costs (in dollars) of investing in the Fund and to compare these costs with the ongoing costs of investing in other mutual funds.
The example is based on an investment of $1,000 held through the six-month period ended October 31, 2018. The example is for illustrative purposes only; you should consult the Prospectus for information on initial and subsequent minimum investment requirements.
Actual Expenses
The first line for each share class in the table on the following page provides information about actual account values and actual expenses. You may use the information on this line, together with the amount you invested, to estimate the expenses that you paid over the period. Simply divide your account value by $1,000 (for example, an $8,600 account value ÷ $1,000 = 8.6), then multiply the result by the number on the first line under the heading “Expenses Paid During the Six-Month Period” to estimate the expenses you paid on your account during this period.
Hypothetical Example for Comparison Purposes
The second line for each share class in the table on the following page provides information about hypothetical account values and hypothetical expenses based on the Fund’s actual expense ratio and an assumed rate of return of 5% per year before expenses, which is not the Fund’s actual return. The hypothetical account values and expenses may not be used to estimate the actual ending account balance or expenses you paid for the period. You may use this information to compare the ongoing costs of investing in the Fund and other funds. To do so, compare this 5% hypothetical example with the 5% hypothetical examples that appear in the shareholder reports of the other funds.
The Fund’s transfer agent may charge additional fees to holders of certain accounts that are not included in the expenses shown in the table on the following page. These fees apply to individual retirement accounts (IRAs) and Section 403(b) accounts. As of the close of the six-month period covered by the table, IRA fees included an annual maintenance fee of $15 per account (subject to a maximum annual maintenance fee of $25 for all accounts held by the same shareholder). Section 403(b) accounts are charged an annual $25 fiduciary maintenance fee. Some of the fees may vary in amount, or may be waived, based on your total account balance or the number of PGIM funds, including the Fund, that you own. You should consider the additional fees that were charged to your Fund account over the six-month period when you estimate the total ongoing expenses paid over the period
| | |
| 16 | | Visit our website at pgiminvestments.com |
and the impact of these fees on your ending account value, as these additional expenses are not reflected in the information provided in the expense table. Additional fees have the effect of reducing investment returns.
Please note that the expenses shown in the table are meant to highlight your ongoing costs only and do not reflect any transactional costs such as sales charges (loads). Therefore, the second line for each share class in the table is useful in comparing ongoing costs only and will not help you determine the relative total costs of owning different funds. In addition, if these transactional costs were included, your costs would have been higher.
| | | | | | | | | | | | | | | | | | |
PGIM Jennison Global
Opportunities Fund | | Beginning Account
Value
May 1, 2018 | | | Ending Account
Value
October 31, 2018 | | | Annualized
Expense Ratio
Based on the
Six-Month Period | | | Expenses Paid
During the
Six-Month Period* | |
| Class A | | Actual | | $ | 1,000.00 | | | $ | 964.10 | | | | 1.11 | % | | $ | 5.50 | |
| | Hypothetical | | $ | 1,000.00 | | | $ | 1,019.61 | | | | 1.11 | % | | $ | 5.65 | |
| Class C | | Actual | | $ | 1,000.00 | | | $ | 960.00 | | | | 1.96 | % | | $ | 9.68 | |
| | Hypothetical | | $ | 1,000.00 | | | $ | 1,015.32 | | | | 1.96 | % | | $ | 9.96 | |
| Class Z | | Actual | | $ | 1,000.00 | | | $ | 965.10 | | | | 0.95 | % | | $ | 4.71 | |
| | Hypothetical | | $ | 1,000.00 | | | $ | 1,020.42 | | | | 0.95 | % | | $ | 4.84 | |
| Class R6** | | Actual | | $ | 1,000.00 | | | $ | 965.60 | | | | 0.84 | % | | $ | 4.16 | |
| | | Hypothetical | | $ | 1,000.00 | | | $ | 1,020.97 | | | | 0.84 | % | | $ | 4.28 | |
*Fund expenses (net of fee waivers or subsidies, if any) for each share class are equal to the annualized expense ratio for each share class (provided in the table), multiplied by the average account value over the period, multiplied by the 184 days in the six-month period ended October 31, 2018, and divided by the 365 days in the Fund’s fiscal year ended October 31, 2018 (to reflect the six-month period). Expenses presented in the table include the expenses of any underlying portfolios in which the Fund may invest.
**Formerly known as Class Q shares.
| | | | |
| PGIM Jennison Global Opportunities Fund | | | 17 | |
Schedule of Investments
as of October 31, 2018
| | | | | | | | |
| Description | | Shares | | | Value | |
LONG-TERM INVESTMENTS 98.8% | | | | | | | | |
| | |
COMMON STOCKS | | | | | | | | |
| | |
Argentina 1.3% | | | | | | | | |
MercadoLibre, Inc.(a) | | | 60,219 | | | $ | 19,541,065 | |
| | |
Canada 2.0% | | | | | | | | |
Shopify, Inc. (Class A Stock)*(a) | | | 219,673 | | | | 30,347,825 | |
| | |
China 7.6% | | | | | | | | |
Alibaba Group Holding Ltd., ADR*(a) | | | 328,240 | | | | 46,701,987 | |
Tencent Holdings Ltd. | | | 1,977,868 | | | | 67,938,274 | |
| | | | | | | | |
| | | | | | | 114,640,261 | |
| | |
France 8.8% | | | | | | | | |
Kering SA | | | 36,116 | | | | 16,094,245 | |
LVMH Moet Hennessy Louis Vuitton SE | | | 189,310 | | | | 57,645,620 | |
Remy Cointreau SA | | | 177,807 | | | | 21,128,222 | |
Safran SA | | | 301,502 | | | | 39,003,352 | |
| | | | | | | | |
| | | | | | | 133,871,439 | |
| | |
Germany 4.0% | | | | | | | | |
Wirecard AG | | | 319,425 | | | | 60,047,062 | |
| | |
India 1.7% | | | | | | | | |
HDFC Bank Ltd., ADR(a) | | | 296,202 | | | | 26,335,320 | |
| | |
Italy 2.8% | | | | | | | | |
Ferrari NV | | | 360,798 | | | | 42,320,190 | |
| | |
Japan 2.4% | | | | | | | | |
Keyence Corp. | | | 72,701 | | | | 35,913,233 | |
| | |
Netherlands 3.6% | | | | | | | | |
Adyen NV, 144A* | | | 65,730 | | | | 42,597,862 | |
ASML Holding NV | | | 68,201 | | | | 11,674,200 | |
| | | | | | | | |
| | | | | | | 54,272,062 | |
| | |
Switzerland 3.8% | | | | | | | | |
Givaudan SA | | | 12,220 | | | | 29,677,330 | |
Straumann Holding AG | | | 40,196 | | | | 27,424,023 | |
| | | | | | | | |
| | | | | | | 57,101,353 | |
See Notes to Financial Statements.
| | | | |
| PGIM Jennison Global Opportunities Fund | | | 19 | |
Schedule of Investments (continued)
as of October 31, 2018
| | | | | | | | |
| Description | | Shares | | | Value | |
COMMON STOCKS (Continued) | | | | | | | | |
| | |
United States 60.8% | | | | | | | | |
Adobe, Inc.* | | | 136,659 | | | $ | 33,585,316 | |
Alphabet, Inc. (Class A Stock)* | | | 32,056 | | | | 34,959,632 | |
Amazon.com, Inc.* | | | 56,444 | | | | 90,198,076 | |
Boeing Co. (The) | | | 164,358 | | | | 58,324,080 | |
Edwards Lifesciences Corp.* | | | 217,324 | | | | 32,077,022 | |
Eli Lilly & Co.(a) | | | 283,421 | | | | 30,734,173 | |
Facebook, Inc. (Class A Stock)* | | | 202,514 | | | | 30,739,600 | |
Illumina, Inc.* | | | 76,031 | | | | 23,657,046 | |
Intuitive Surgical, Inc.*(a) | | | 89,850 | | | | 46,828,023 | |
Mastercard, Inc. (Class A Stock) | | | 285,231 | | | | 56,381,612 | |
Merck & Co., Inc. | | | 477,484 | | | | 35,147,597 | |
Netflix, Inc.* | | | 237,688 | | | | 71,729,485 | |
NIKE, Inc. (Class B Stock) | | | 765,062 | | | | 57,410,253 | |
NVIDIA Corp. | | | 182,759 | | | | 38,531,080 | |
PayPal Holdings, Inc.*(a) | | | 399,376 | | | | 33,623,465 | |
salesforce.com, Inc.* | | | 214,495 | | | | 29,437,294 | |
Square, Inc. (Class A Stock)* | | | 314,802 | | | | 23,122,207 | |
Tesla, Inc.*(a) | | | 135,158 | | | | 45,591,497 | |
UnitedHealth Group, Inc. | | | 264,301 | | | | 69,075,066 | |
Vertex Pharmaceuticals, Inc.* | | | 252,560 | | | | 42,798,818 | |
Workday, Inc. (Class A Stock)*(a) | | | 280,746 | | | | 37,344,833 | |
| | | | | | | | |
| | | | | | | 921,296,175 | |
| | | | | | | | |
TOTAL LONG-TERM INVESTMENTS
(cost $1,373,370,086) | | | | | | | 1,495,685,985 | |
| | | | | | | | |
| | |
SHORT-TERM INVESTMENTS 14.9% | | | | | | | | |
| | |
AFFILIATED MUTUAL FUNDS | | | | | | | | |
PGIM Core Ultra Short Bond Fund(w) | | | 15,403,571 | | | | 15,403,571 | |
PGIM Institutional Money Market Fund
(cost $210,773,155; includes $210,375,207 of cash collateral for securities on loan)(b)(w) | | | 210,761,557 | | | | 210,761,557 | |
| | | | | | | | |
TOTAL SHORT-TERM INVESTMENTS
(cost $226,176,726) | | | | | | | 226,165,128 | |
| | | | | | | | |
TOTAL INVESTMENTS 113.7%
(cost $1,599,546,812) | | | | | | | 1,721,851,113 | |
Liabilities in excess of other assets (13.7)% | | | | | | | (207,997,520 | ) |
| | | | | | | | |
NET ASSETS 100.0% | | | | | | $ | 1,513,853,593 | |
| | | | | | | | |
See Notes to Financial Statements.
The following abbreviations are used in the annual report:
144A—Security was purchased pursuant to Rule 144A under the Securities Act of 1933 and may not be resold subject to that rule except to qualified institutional buyers. Unless otherwise noted, 144A securities are deemed to be liquid.
ADR—American Depositary Receipt
LIBOR—London Interbank Offered Rate
| * | Non-income producing security. |
| (a) | All or a portion of security is on loan. The aggregate market value of such securities, including those sold and pending settlement, is $214,552,753; cash collateral of $210,375,207 (included in liabilities) was received with which the Series purchased highly liquid short-term investments. |
| (b) | Represents security purchased with cash collateral received for securities on loan and includes dividend reinvestment. |
| (w) | PGIM Investments LLC, the manager of the Series, also serves as manager of the PGIM Core Ultra Short Bond Fund and PGIM Institutional Money Market Fund. |
Fair Value Measurements:
Various inputs are used in determining the value of the Series’ investments. These inputs are summarized in the three broad levels listed below.
Level 1—unadjusted quoted prices generally in active markets for identical securities.
Level 2—quoted prices for similar securities, interest rates and yield curves, prepayment speeds, foreign currency exchange rates and other observable inputs.
Level 3—unobservable inputs for securities valued in accordance with Board approved fair valuation procedures.
The following is a summary of the inputs used as of October 31, 2018 in valuing such portfolio securities:
| | | | | | | | | | | | |
| | | Level 1 | | | Level 2 | | | Level 3 | |
Investments in Securities | | | | | | | | | | | | |
Common Stocks | | | | | | | | | | | | |
Argentina | | $ | 19,541,065 | | | $ | — | | | $ | — | |
Canada | | | 30,347,825 | | | | — | | | | — | |
China | | | 46,701,987 | | | | 67,938,274 | | | | — | |
France | | | — | | | | 133,871,439 | | | | — | |
Germany | | | — | | | | 60,047,062 | | | | — | |
India | | | 26,335,320 | | | | — | | | | — | |
Italy | | | — | | | | 42,320,190 | | | | — | |
Japan | �� | | — | | | | 35,913,233 | | | | — | |
Netherlands | | | — | | | | 54,272,062 | | | | — | |
Switzerland | | | — | | | | 57,101,353 | | | | — | |
United States | | | 921,296,175 | | | | — | | | | — | |
Affiliated Mutual Funds | | | 226,165,128 | | | | — | | | | — | |
| | | | | | | | | | | | |
Total | | $ | 1,270,387,500 | | | $ | 451,463,613 | | | $ | — | |
| | | | | | | | | | | | |
See Notes to Financial Statements.
| | | | |
| PGIM Jennison Global Opportunities Fund | | | 21 | |
Schedule of Investments (continued)
as of October 31, 2018
Industry Classification:
The industry classification of investments and liabilities in excess of other assets shown as a percentage of net assets as of October 31, 2018 were as follows (unaudited):
| | | | |
IT Services | | | 16.2 | % |
Affiliated Mutual Funds (13.9% represents investments purchased with collateral from securities on loan) | | | 14.9 | |
Internet & Direct Marketing Retail | | | 10.4 | |
Interactive Media & Services | | | 8.8 | |
Textiles, Apparel & Luxury Goods | | | 8.6 | |
Health Care Equipment & Supplies | | | 7.0 | |
Software | | | 6.6 | |
Aerospace & Defense | | | 6.5 | |
Automobiles | | | 5.8 | |
Entertainment | | | 4.7 | |
Health Care Providers & Services | | | 4.6 | |
Pharmaceuticals | | | 4.3 | |
| | | | |
Semiconductors & Semiconductor Equipment | | | 3.4 | % |
Biotechnology | | | 2.8 | |
Electronic Equipment, Instruments & Components | | | 2.4 | |
Chemicals | | | 2.0 | |
Banks | | | 1.7 | |
Life Sciences Tools & Services | | | 1.6 | |
Beverages | | | 1.4 | |
| | | | |
| | | 113.7 | |
Liabilities in excess of other assets | | | (13.7 | ) |
| | | | |
| | | 100.0 | % |
| | | | |
Financial Instruments/Transactions—Summary of Offsetting and Netting Arrangements:
The Series entered into financial instruments/transactions during the reporting period that are either offset in accordance with current requirements or are subject to enforceable master netting arrangements or similar agreements that permit offsetting. The information about offsetting and related netting arrangements for financial instruments/transactions, where the legal right to set-off exists, is presented in the summary below.
Offsetting of financial instrument/transaction assets and liabilities:
| | | | | | | | | | | | |
Description | | Gross
Market
Value of
Recognized
Assets/
(Liabilities) | | | Collateral
Pledged/
(Received)(1) | | | Net Amount | |
Securities on Loan | | $ | 214,552,753 | | | $ | (210,375,207 | ) | | $ | 4,177,546 | |
| | | | | | | | | | | | |
| (1) | Collateral amount disclosed by the Series is limited to the market value of financial instruments/transactions. |
See Notes to Financial Statements.
Statement of Assets & Liabilities
as of October 31, 2018
| | | | |
Assets | | | | |
Investments at value, including securities on loan of $214,552,753: | | | | |
Unaffiliated investments (cost $1,373,370,086) | | $ | 1,495,685,985 | |
Affiliated investments (cost $226,176,726) | | | 226,165,128 | |
Receivable for Series shares sold | | | 8,694,991 | |
Dividends receivable | | | 227,375 | |
Tax reclaim receivable | | | 117,650 | |
Prepaid expenses and other assets | | | 13,762 | |
| | | | |
Total Assets | | | 1,730,904,891 | |
| | | | |
| |
Liabilities | | | | |
Payable to broker for collateral for securities on loan | | | 210,375,207 | |
Payable for Series shares reacquired | | | 4,882,492 | |
Management fee payable | | | 935,763 | |
Accrued expenses and other liabilities | | | 654,243 | |
Distribution fee payable | | | 183,235 | |
Affiliated transfer agent fee payable | | | 20,358 | |
| | | | |
Total Liabilities | | | 217,051,298 | |
| | | | |
| |
Net Assets | | $ | 1,513,853,593 | |
| | | | |
| | | | | |
Net assets were comprised of: | | | | |
Common stock, at par | | $ | 699,926 | |
Paid-in capital in excess of par | | | 1,446,322,984 | |
Total distributable earnings (loss) | | | 66,830,683 | |
| | | | |
Net assets, October 31, 2018 | | $ | 1,513,853,593 | |
| | | | |
See Notes to Financial Statements.
| | | | |
| PGIM Jennison Global Opportunities Fund | | | 23 | |
Statement of Assets & Liabilities
as of October 31, 2018
| | | | |
Class A | | | | |
Net asset value and redemption price per share,
($164,764,090 ÷ 7,673,110 shares of common stock issued and outstanding) | | $ | 21.47 | |
Maximum sales charge (5.50% of offering price) | | | 1.25 | |
| | | | |
Maximum offering price to public | | $ | 22.72 | |
| | | | |
| |
Class C | | | | |
Net asset value, offering price and redemption price per share,
($168,587,498 ÷ 8,259,675 shares of common stock issued and outstanding) | | $ | 20.41 | |
| | | | |
| |
Class Z | | | | |
Net asset value, offering price and redemption price per share,
($927,492,056 ÷ 42,507,167 shares of common stock issued and outstanding) | | $ | 21.82 | |
| | | | |
| |
Class R6 | | | | |
Net asset value, offering price and redemption price per share,
($253,009,949 ÷ 11,552,666 shares of common stock issued and outstanding) | | $ | 21.90 | |
| | | | |
See Notes to Financial Statements.
Statement of Operations
Year Ended October 31, 2018
| | | | |
Net Investment Income (Loss) | | | | |
Income | | | | |
Unaffiliated dividend income (net of $1,004,428 foreign withholding tax) | | $ | 5,225,481 | |
Income from securities lending, net (including affiliated income of $231,120) | | | 767,292 | |
Affiliated dividend income | | | 466,902 | |
| | | | |
Total income | | | 6,459,675 | |
| | | | |
| |
Expenses | | | | |
Management fee | | | 9,104,677 | |
Distribution fee(a) | | | 1,794,820 | |
Transfer agent’s fees and expenses (including affiliated expense of $142,276)(a) | | | 924,876 | |
Custodian and accounting fees | | | 273,913 | |
Registration fees(a) | | | 190,303 | |
Shareholders’ reports | | | 75,441 | |
Directors’ fees | | | 31,267 | |
Audit fee | | | 27,599 | |
Legal fees and expenses | | | 25,007 | |
Miscellaneous | | | 32,499 | |
| | | | |
Total expenses | | | 12,480,402 | |
Less: Fee waiver and/or expense reimbursement(a) | | | (551,837 | ) |
Distribution fee waiver(a) | | | (71,159 | ) |
| | | | |
Net expenses | | | 11,857,406 | |
| | | | |
Net investment income (loss) | | | (5,397,731 | ) |
| | | | |
| |
Realized And Unrealized Gain (Loss) On Investment And Foreign Currency Transactions | | | | |
Net realized gain (loss) on: | | | | |
Investment transactions (including affiliated of $3,379) | | | (31,686,692 | ) |
Foreign currency transactions | | | (68,259 | ) |
| | | | |
| | | (31,754,951 | ) |
| | | | |
Net change in unrealized appreciation (depreciation) on: | | | | |
Investments (including affiliated of $(12,294)) | | | (9,908,232 | ) |
Foreign currencies | | | (3,004 | ) |
| | | | |
| | | (9,911,236 | ) |
| | | | |
Net gain (loss) on investment and foreign currency transactions | | | (41,666,187 | ) |
| | | | |
Net Increase (Decrease) In Net Assets Resulting From Operations | | $ | (47,063,918 | ) |
| | | | |
| (a) | Class specific expenses and waivers were as follows: |
| | | | | | | | | | | | | | | | |
| | | Class A | | | Class C | | | Class Z | | | Class R6 | |
Distribution fee | | | 426,939 | | | | 1,367,881 | | | | — | | | | — | |
Transfer agent’s fees and expenses | | | 157,398 | | | | 140,350 | | | | 626,079 | | | | 1,049 | |
Registration fees | | | 35,012 | | | | 28,174 | | | | 82,583 | | | | 44,534 | |
Fee waiver and/or expense reimbursement | | | (156,794 | ) | | | (60,728 | ) | | | (253,144 | ) | | | (81,171 | ) |
Distribution fee waiver | | | (71,159 | ) | | | — | | | | — | | | | — | |
See Notes to Financial Statements.
| | | | |
| PGIM Jennison Global Opportunities Fund | | | 25 | |
Statements of Changes in Net Assets
| | | | | | | | |
| | | Year Ended October 31, | |
| | | 2018 | | | 2017 | |
Increase (Decrease) in Net Assets | | | | | | | | |
Operations | | | | | | | | |
Net investment income (loss) | | $ | (5,397,731 | ) | | $ | (1,676,165 | ) |
Net realized gain (loss) on investment and foreign currency transactions | | | (31,754,951 | ) | | | 10,626,478 | |
Net change in unrealized appreciation (depreciation) on investments and foreign currencies | | | (9,911,236 | ) | | | 97,281,693 | |
| | | | | | | | |
Net increase (decrease) in net assets resulting from operations | | | (47,063,918 | ) | | | 106,232,006 | |
| | | | | | | | |
| | |
Series share transactions (Net of share conversions) | | | | | | | | |
Net proceeds from shares sold | | | 1,284,233,392 | | | | 276,077,034 | |
Cost of shares reacquired | | | (256,901,201 | ) | | | (113,423,243 | ) |
| | | | | | | | |
Net increase (decrease) in net assets from Series share transactions | | | 1,027,332,191 | | | | 162,653,791 | |
| | | | | | | | |
Total increase (decrease) | | | 980,268,273 | | | | 268,885,797 | |
| | |
Net Assets: | | | | | | | | |
Beginning of year | | | 533,585,320 | | | | 264,699,523 | |
| | | | | | | | |
End of year(a)* | | $ | 1,513,853,593 | | | $ | 533,585,320 | |
| | | | | | | | |
(a) Includes accumulated net investment loss of: | | $ | * | | | $ | (1,356,667 | ) |
| | | | | | | | |
| * | Effective October 31, 2018, the Series has adopted amendments to Regulation S-X. |
See Notes to Financial Statements.
Notes to Financial Statements
Prudential World Fund, Inc. (the “Fund”) is registered under the Investment Company Act of 1940, as amended (“1940 Act”), as an open-end management investment company and currently consists of seven series: PGIM Jennison Emerging Markets Equity Opportunities Fund (formerly known as Prudential Jennison Emerging Markets Equity Fund), PGIM Jennison Global Infrastructure Fund, PGIM Jennison Global Opportunities Fund, PGIM Jennison International Opportunities Fund and PGIM QMA International Equity Fund, each of which are diversified funds and PGIM Emerging Markets Debt Hard Currency Fund and PGIM Emerging Markets Debt Local Currency Fund, each of which are non-diversified funds for purposes of the 1940 Act and may invest a greater percentage of their assets in the securities of a single company or other issuer than a diversified fund. Investing in a non-diversified fund involves greater risk than investing in a diversified fund because a loss resulting from the decline in value of any one security may represent a greater portion of the total assets of a non-diversified fund. These financial statements relate only to the PGIM Jennison Global Opportunities Fund (the “Series”). Effective June 11, 2018, the names of the Series and the other series which comprise the Fund were changed by replacing “Prudential” with “PGIM” and each series’ Class Q shares were renamed Class R6 shares.
The investment objective of the Series is to seek long-term growth of capital.
1. Accounting Policies
The Series follows the investment company accounting and reporting guidance of the Financial Accounting Standards Board (“FASB”) Accounting Standard Codification (“ASC”) Topic 946 Financial Services — Investment Companies. The following accounting policies conform to U.S. generally accepted accounting principles. The Series consistently follows such policies in the preparation of its financial statements.
Securities Valuation: The Series holds securities and other assets and liabilities that are fair valued at the close of each day (generally, 4:00 PM Eastern time) the New York Stock Exchange (“NYSE”) is open for trading. Fair value is the price that would be received to sell an asset or paid to transfer a liability in an orderly transaction between market participants on the measurement date. The Fund’s Board of Directors (the “Board”) has adopted valuation procedures for security valuation under which fair valuation responsibilities have been delegated to PGIM Investments LLC (“PGIM Investments” or the “Manager”). Pursuant to the Board’s delegation, a Valuation Committee has been established as two persons, being one or more officers of the Fund, including: the Fund’s Treasurer (or the Treasurer’s direct reports); and the Fund’s Chief or Deputy Chief Compliance Officer (or Vice-President-level direct reports of the Chief or Deputy Chief Compliance Officer). Under the current valuation procedures, the Valuation Committee of the Board is responsible for supervising the valuation of portfolio securities and other assets and liabilities. The valuation procedures permit the Series to utilize independent pricing vendor services, quotations from
| | | | |
| PGIM Jennison Global Opportunities Fund | | | 27 | |
Notes to Financial Statements (continued)
market makers, and alternative valuation methods when market quotations are either not readily available or not deemed representative of fair value. A record of the Valuation Committee’s actions is subject to the Board’s review, approval, and ratification at its next regularly scheduled quarterly meeting.
For the fiscal reporting period-end, securities and other assets and liabilities were fair valued at the close of the last U.S. business day. Trading in certain foreign securities may occur when the NYSE is closed (including weekends and holidays). Because such foreign securities trade in markets that are open on weekends and U.S. holidays, the values of some of the Series’ foreign investments may change on days when investors cannot purchase or redeem Series shares.
Various inputs determine how the Series’ investments are valued, all of which are categorized according to the three broad levels (Level 1, 2, or 3) detailed in the Schedule of Investments and referred to herein as the “fair value hierarchy” in accordance with FASB ASC Topic 820 - Fair Value Measurements and Disclosures.
Common and preferred stocks, exchange-traded funds, and derivative instruments, such as futures or options, that are traded on a national securities exchange are valued at the last sale price as of the close of trading on the applicable exchange where the security principally trades. Securities traded via NASDAQ are valued at the NASDAQ official closing price. To the extent these securities are valued at the last sale price or NASDAQ official closing price, they are classified as Level 1 in the fair value hierarchy. In the event that no sale or official closing price on valuation date exists, these securities are generally valued at the mean between the last reported bid and ask prices, or at the last bid price in the absence of an ask price. These securities are classified as Level 2 in the fair value hierarchy.
Foreign equities traded on foreign securities exchanges are generally valued using pricing vendor services that provide model prices derived using adjustment factors based on information such as local closing price, relevant general and sector indices, currency fluctuations, depositary receipts, and futures, as applicable. Securities valued using such model prices are classified as Level 2 in the fair value hierarchy. The models generate an evaluated adjustment factor for each security, which is applied to the local closing price to adjust it for post closing market movements up to the time the Series is valued. Utilizing that evaluated adjustment factor, the vendor provides an evaluated price for each security. If the vendor does not provide an evaluated price, securities are valued in accordance with exchange-traded common and preferred stock valuation policies discussed above.
Investments in open-end, non-exchange-traded mutual funds are valued at their net asset values as of the close of the NYSE on the date of valuation. These securities are classified as
Level 1 in the fair value hierarchy since they may be purchased or sold at their net asset values on the date of valuation.
Securities and other assets that cannot be priced according to the methods described above are valued based on pricing methodologies approved by the Board. In the event that unobservable inputs are used when determining such valuations, the securities will be classified as Level 3 in the fair value hierarchy.
When determining the fair value of securities, some of the factors influencing the valuation include: the nature of any restrictions on disposition of the securities; assessment of the general liquidity of the securities; the issuer’s financial condition and the markets in which it does business; the cost of the investment; the size of the holding and the capitalization of the issuer; the prices of any recent transactions or bids/offers for such securities or any comparable securities; any available analyst media or other reports or information deemed reliable by the Manager regarding the issuer or the markets or industry in which it operates. Using fair value to price securities may result in a value that is different from a security’s most recent closing price and from the price used by other unaffiliated mutual funds to calculate their net asset values.
Restricted and Illiquid Securities: Subject to guidelines adopted by the Board, the Series may invest up to 15% of its net assets in illiquid securities, including those which are restricted as to disposition under securities law (“restricted securities”). Restricted securities are valued pursuant to the valuation procedures noted above. Illiquid securities are those that, because of the absence of a readily available market or due to legal or contractual restrictions on resale, cannot be sold within seven days in the ordinary course of business at approximately the amount at which the Series has valued the investment. Therefore, the Series may find it difficult to sell illiquid securities at the time considered most advantageous by its subadviser and may incur transaction costs that would not be incurred in the sale of securities that were freely marketable. Certain securities that would otherwise be considered illiquid because of legal restrictions on resale to the general public may be traded among qualified institutional buyers under Rule 144A of the Securities Act of 1933. These Rule 144A securities, as well as commercial paper that is sold in private placements under Section 4(2) of the Securities Act, may be deemed liquid by the Series’ subadviser under the guidelines adopted by the Board of the Fund. However, the liquidity of the Series’ investments in Rule 144A securities could be impaired if trading does not develop or declines.
Foreign Currency Translation: The books and records of the Series are maintained in U.S. dollars. Foreign currency amounts are translated into U.S. dollars on the following basis:
(i) market value of investment securities, other assets and liabilities — at the current rates of exchange;
(ii) purchases and sales of investment securities, income and expenses — at the rates of exchange prevailing on the respective dates of such transactions.
| | | | |
| PGIM Jennison Global Opportunities Fund | | | 29 | |
Notes to Financial Statements (continued)
Although the net assets of the Series are presented at the foreign exchange rates and market values at the close of the period, the Series does not generally isolate that portion of the results of operations arising as a result of changes in the foreign exchange rates from the fluctuations arising from changes in the market prices of long-term portfolio securities held at the end of the period. Similarly, the Series does not isolate the effect of changes in foreign exchange rates from the fluctuations arising from changes in the market prices of long-term portfolio securities sold during the period. Accordingly, holding period realized foreign currency gains (losses) are included in the reported net realized gains (losses) on investment transactions.
Net realized gains (losses) on foreign currency transactions represent net foreign exchange gains (losses) from the disposition of holdings of foreign currencies, currency gains (losses) realized between the trade and settlement dates on securities transactions, and the difference between the amounts of interest, dividends and foreign withholding taxes recorded on the Series’ books and the U.S. dollar equivalent amounts actually received or paid. Net unrealized currency gains (losses) arise from valuing foreign currency denominated assets and liabilities (other than investments) at period end exchange rates.
Master Netting Arrangements: The Fund, on behalf of the Series, is subject to various Master Agreements, or netting arrangements, with select counterparties. These are agreements which a subadviser may have negotiated and entered into on behalf of the Series. A master netting arrangement between the Series and the counterparty permits the Series to offset amounts payable by the Series to the same counterparty against amounts to be received; and by the receipt of collateral from the counterparty by the Series to cover the Series’ exposure to the counterparty. However, there is no assurance that such mitigating factors are easily enforceable. In addition to master netting arrangements, the right to set-off exists when all the conditions are met such that each of the parties owes the other determinable amounts, the reporting party has the right to set-off the amount owed with the amount owed by the other party, the reporting party intends to set-off and the right of set-off is enforceable by law. During the reporting period, there was no intention to settle on a net basis and all amounts are presented on a gross basis on the Statement of Assets and Liabilities.
Securities Lending: The Series lends its portfolio securities to banks and broker-dealers. The loans are secured by collateral at least equal to the market value of the securities loaned. Collateral pledged by each borrower is invested in an affiliated money market fund and is marked to market daily, based on the previous day’s market value, such that the value of the collateral exceeds the value of the loaned securities. In the event of significant appreciation in value of securities on loan on the last business day of the reporting period, the financial statements may reflect a collateral value that is less than the market value of the loaned securities. Such shortfall is remedied as described above. Loans are subject to termination
at the option of the borrower or the Series. Upon termination of the loan, the borrower will return to the Series securities identical to the loaned securities. Should the borrower of the securities fail financially, the Series has the right to repurchase the securities in the open market using the collateral.
The Series recognizes income, net of any rebate and securities lending agent fees, for lending its securities in the form of fees or interest on the investment of any cash received as collateral. The borrower receives all interest and dividends from the securities loaned and such payments are passed back to the lender in amounts equivalent thereto. The Series also continues to recognize any unrealized gain (loss) in the market price of the securities loaned and on the change in the value of the collateral invested that may occur during the term of the loan. In addition, realized gain (loss) is recognized on changes in the value of the collateral invested upon liquidation of the collateral. Net earnings from securities lending are disclosed on the Statement of Operations as “Income from securities lending, net”.
Securities Transactions and Net Investment Income: Securities transactions are recorded on the trade date. Realized gains (losses) from investment and currency transactions are calculated on the specific identification method. Dividend income is recorded on the ex-date. Expenses are recorded on an accrual basis, which may require the use of certain estimates by management that may differ from actual. Net investment income or loss (other than class specific expenses and waivers, which are allocated as noted below) and unrealized and realized gains (losses) are allocated daily to each class of shares based upon the relative proportion of adjusted net assets of each class at the beginning of the day. Class specific expenses and waivers, where applicable, are charged to the respective share classes. Class specific expenses include distribution fees and distribution fee waivers, shareholder servicing fees, transfer agent’s fees and expenses, registration fees and fee waivers and/or expense reimbursements, as applicable.
Taxes: It is the Series’ policy to continue to meet the requirements of the Internal Revenue Code applicable to regulated investment companies and to distribute all of its taxable net investment income and capital gains, if any, to its shareholders. Therefore, no federal income tax provision is required. Withholding taxes on foreign dividends, interest and capital gains, if any, are recorded, net of reclaimable amounts, at the time the related income is earned.
Dividends and Distributions: The Series expects to pay dividends from net investment income and distributions from net realized capital and currency gains, if any, annually. Dividends and distributions to shareholders, which are determined in accordance with federal income tax regulations and which may differ from generally accepted accounting principles, are recorded on the ex-date. Permanent book/tax differences relating to income and gain (loss) are reclassified amongst total distributable earnings (loss) and paid-in capital in excess of par, as appropriate.
Estimates: The preparation of financial statements requires management to make estimates and assumptions that affect the reported amounts and disclosures in the financial
| | | | |
| PGIM Jennison Global Opportunities Fund | | | 31 | |
Notes to Financial Statements (continued)
statements. Actual results could differ from those estimates.
2. Agreements
The Fund, on behalf of the Series, has a management agreement with PGIM Investments. Pursuant to this agreement, PGIM Investments has responsibility for all investment advisory services and supervises the subadviser’s performance of such services. In addition, under the management agreement, PGIM Investments provides all of the administrative functions necessary for the organization, operation and management of the Series. PGIM Investments administers the corporate affairs of the Series and, in connection therewith, furnishes the Series with office facilities, together with those ordinary clerical and bookkeeping services which are not being furnished by the Series’ custodian and the Series’ transfer agent. PGIM Investments is also responsible for the staffing and management of dedicated groups of legal, marketing, compliance and related personnel necessary for the operation of the Series. The legal, marketing, compliance and related personnel are also responsible for the management and oversight of the various service providers to the Series, including, but not limited to, the custodian, transfer agent, and accounting agent.
PGIM Investments has entered into a subadvisory agreement with Jennison Associates LLC (“Jennison”). The subadvisory agreement provides that Jennison will furnish investment advisory services in connection with the management of the Series. In connection therewith, Jennison is obligated to keep certain books and records of the Series. PGIM Investments pays for the services of Jennison, the cost of compensation of officers of the Series, occupancy and certain clerical and bookkeeping costs of the Series. The Series bears all other costs and expenses.
The management fee paid to PGIM Investments is accrued daily and payable monthly at an annual rate of 0.825% of the Series’ average daily net assets up to $1 billion and 0.800% of such assets in excess of $1 billion. The effective management fee rate before any waivers and/or expense reimbursements was 0.823% for the year ended October 31, 2018.
PGIM Investments has contractually agreed, through February 29, 2020, to limit net annual Series operating expenses (exclusive of distribution and service (12b-1) fees, and transfer agency expenses (including sub-transfer agency and networking fees)), of each class of shares to 0.84% of the Series’ average daily net assets. Additionally, effective July 1, 2018, PGIM Investments has contractually agreed, through February 29, 2020, to limit total annual operating expenses after fee waivers and/or expense reimbursements to 1.08% of average daily net assets for Class A shares. This contractual waiver excludes interest, brokerage, taxes (such as income and foreign withholding taxes, stamp duty and deferred tax expenses), acquired fund fees and expenses, extraordinary expenses, and certain other Fund expenses such as dividend and interest expense and broker charges on short sales.
Expenses waived/reimbursed by the Manager in accordance with this agreement may be recouped by the Manager within the same fiscal year during which such waiver/reimbursement is made if such recoupment can be realized without exceeding the expense limit in effect at the time of the recoupment for that fiscal year.
Where applicable, PGIM Investments voluntarily agreed through June 30, 2018, to waive management fees or shared operating expenses on any share class to the same extent that it waives similar expenses on any other share class and, in addition, total annual operating expenses for Class R6 shares will not exceed total annual operating expenses for Class Z shares. Effective July 1, 2018 this voluntary agreement became part of the Series’ contractual waiver agreement through February 29, 2020 and is subject to recoupment by the Manager within the same fiscal year during which such wavier/reimbursement is made if such recoupment can be realized without exceeding the expense limit in effect at the time of the recoupment for that fiscal year.
The Fund, on behalf of the Series, has a distribution agreement with Prudential Investment Management Services LLC (“PIMS”), which acts as the distributor of the Class A, Class C, Class Z and Class R6 shares of the Series. The Series compensates PIMS for distributing and servicing the Series’ Class A and Class C shares, pursuant to the plans of distribution (the “Distribution Plans”), regardless of expenses actually incurred by PIMS. The distribution fees are accrued daily and payable monthly. No distribution or service fees are paid to PIMS as distributor of the Class Z and Class R6 shares of the Series.
Pursuant to the Distribution Plans, the Series compensates PIMS for distribution related activities at an annual rate of up to 0.30% and 1% of the average daily net assets of the Class A and Class C shares, respectively. PIMS has contractually agreed to limit such fees to 0.25% of the average daily net assets of the Class A shares through February 29, 2020.
PIMS has advised the Series that it received $2,092,900 in front-end sales charges resulting from sales of Class A shares during the year ended October 31, 2018. From these fees, PIMS paid such sales charges to broker-dealers, who in turn paid commissions to salespersons and incurred other distribution costs.
PIMS has advised the Series that for the year ended October 31, 2018, it received $678 and $23,347 in contingent deferred sales charges imposed upon redemptions by certain Class A and Class C shareholders, respectively.
PGIM Investments, PIMS and Jennison are indirect, wholly-owned subsidiaries of Prudential Financial, Inc. (“Prudential”).
3. Other Transactions with Affiliates
Prudential Mutual Fund Services LLC (“PMFS”), an affiliate of PGIM Investments and an indirect, wholly-owned subsidiary of Prudential, serves as the Series’ transfer agent. Transfer
| | | | |
| PGIM Jennison Global Opportunities Fund | | | 33 | |
Notes to Financial Statements (continued)
agent’s fees and expenses in the Statement of Operations include certain out-of-pocket expenses paid to non-affiliates, where applicable.
The Series may enter into certain securities purchase or sale transactions under Board approved Rule 17a-7 procedures. Rule 17a-7 is an exemptive rule under the 1940 Act, that, subject to certain conditions, permits purchase and sale transactions among affiliated investment companies, or between an investment company and a person that is affiliated solely by reason of having a common (or affiliated) investment adviser, common directors, and/or common officers. Such transactions are subject to ratification by the Board. For the reporting period ended October 31, 2018, no such transactions were entered into by the Series.
The Series may invest its overnight sweep cash in the PGIM Core Ultra Short Bond Fund (the “Core Fund”), and its securities lending cash collateral in the PGIM Institutional Money Market Fund (the “Money Market Fund”), each a series of Prudential Investment Portfolios 2, registered under the 1940 Act and managed by PGIM Investments. For the reporting period ended October 31, 2018, PGIM, Inc. was compensated $95,344 by PGIM Investments for managing the Series’ securities lending cash collateral as subadviser to the Money Market Fund. Earnings from the Core Fund and Money Market Fund are disclosed on the Statement of Operations as “Affiliated dividend income” and “Income from securities lending, net”, respectively.
4. Portfolio Securities
The aggregate cost of purchases and proceeds from sales of portfolio securities (excluding short-term investments and U.S. Government securities) for the year ended October 31, 2018, were $1,685,507,949 and $670,187,295, respectively.
A summary of the cost of purchases and proceeds from sales of shares of affiliated mutual funds for the year ended October 31, 2018, is presented as follows:
| | | | | | | | | | | | | | | | | | | | | | | | | | | | |
Value,
Beginning
of Year | | Cost of
Purchases | | | Proceeds
from Sales | | | Change in
Unrealized
Gain
(Loss) | | | Realized
Gain
(Loss) | | | Value,
End of
Year | | | Shares,
End of
Year | | | Income | |
PGIM Core Ultra Short Bond Fund* | | | | | | | | | | | | | |
| $ 5,431,483 | | $ | 577,301,619 | | | $ | 567,329,531 | | | $ | — | | | $ | — | | | $ | 15,403,571 | | | | 15,403,571 | | | $ | 466,902 | |
| | | |
PGIM Institutional Money Market Fund* | | | | | | | | | | | | | |
| 56,735,133 | | | 1,331,962,582 | | | | 1,177,927,243 | | | | (12,294 | ) | | | 3,379 | | | | 210,761,557 | | | | 210,761,557 | | | | 231,120 | ** |
| | | | | | | | | | | | | | | | | | | | | | | | | | | | |
| $ 62,166,616 | | $ | 1,909,264,201 | | | $ | 1,745,256,774 | | | $ | (12,294 | ) | | $ | 3,379 | | | $ | 226,165,128 | | | | | | | $ | 698,022 | |
| | | | | | | | | | | | | | | | | | | | | | | | | | | | |
| * | The Funds did not have any capital gain distributions during the reporting period. |
| ** | This amount is included in “Income from securities lending, net” on the Statement of Operations. |
5. Distributions and Tax Information
Distributions to shareholders, which are determined in accordance with federal income tax regulations and which may differ from generally accepted accounting principles, are recorded on the ex-date. In order to present total distributable earnings (loss) and paid-in capital in excess of par on the Statement of Assets and Liabilities that more closely represent their tax character, certain adjustments have been made to total distributable earnings (loss) and paid-in capital in excess of par. For the year ended October 31, 2018, the adjustments were to increase total distributable earnings and decrease paid-in capital in excess of par by $2,086,282 due to a net operating loss. Net investment loss, net realized gain (loss) on investment and foreign currency transactions and net assets were not affected by this change.
For the years ended October 31, 2018, and October 31, 2017, there were no distributions paid by the Series.
As of October 31, 2018, the Series had no undistributed earnings on a tax basis.
The United States federal income tax basis of the Series’ investments and the net unrealized appreciation as of October 31, 2018 were as follows:
| | | | | | |
Tax Basis | | Gross Unrealized
Appreciation | | Gross Unrealized
Depreciation | | Net Unrealized
Appreciation |
| $1,607,179,765 | | $195,021,635 | | $(80,350,287) | | $114,671,348 |
The difference between book basis and tax basis was primarily due to deferred losses on wash sales, corporate spin-off adjustment and mark-to-market of receivables and payables.
For federal income tax purposes, the Series had a capital loss carryforward as of October 31, 2018 of approximately $47,206,000 which can be carried forward for an unlimited period. No capital gains distributions are expected to be paid to shareholders until net gains have been realized in excess of such losses.
The Series elected to treat certain late-year ordinary income losses of approximately $629,000 as having been incurred in the following fiscal year (October 31, 2019).
Management has analyzed the Series’ tax positions taken on federal, state and local income tax returns for all open tax years and has concluded that no provision for income tax is required in the Series’ financial statements for the current reporting period. The Series’ federal, state and local income and federal excise tax returns for tax years for which the applicable statutes of limitations have not expired are subject to examination by the Internal Revenue Service and state departments of revenue.
| | | | |
| PGIM Jennison Global Opportunities Fund | | | 35 | |
Notes to Financial Statements (continued)
6. Capital and Ownership
The Series offers Class A, Class C, Class Z and Class R6 shares. Class A shares are sold with a maximum front-end sales charge of 5.50%. Investors who purchase $1 million or more of Class A shares and sell these shares within 12 months of purchase are subject to a contingent deferred sales charge (“CDSC”) of 1%, although they are not subject to an initial sales charge. The Class A CDSC is waived for certain retirement and/or benefit plans. A special exchange privilege is also available for shareholders who qualified to purchase Class A shares at net asset value. Class C shares are sold with a CDSC of 1% on sales made within 12 months of purchase. Class Z and Class R6 shares are not subject to any sales or redemption charge and are available exclusively for sale to a limited group of investors.
Under certain circumstances, an exchange may be made from specified share classes of the Series to one or more other share classes of the Series as presented in the table of transactions in shares of common stock.
The Fund is authorized to issue 5.075 billion shares of common stock, with a par value of $0.01 per share, which is divided into seven series. There are 950 million shares authorized for the Series, divided into seven classes, designated Class A, Class C, Class Z, Class R2, Class R4, and Class R6 and Class T common stock, each of which consists of 50 million, 70 million, 300 million, 75 million, 75 million, 255 million and 125 million authorized shares, respectively. The Series currently does not have any Class R2, Class R4 and Class T shares outstanding.
At reporting period end, seven shareholders of record held 72% of the Series’ outstanding shares.
Transactions in shares of common stock were as follows:
| | | | | | | | |
Class A | | Shares | | | Amount | |
Year ended October 31, 2018: | | | | | | | | |
Shares sold | | | 5,248,520 | | | $ | 120,535,515 | |
Shares reacquired | | | (1,281,008 | ) | | | (28,827,088 | ) |
| | | | | | | | |
Net increase (decrease) in shares outstanding before conversion | | | 3,967,512 | | | | 91,708,427 | |
Shares issued upon conversion from other share class(es) | | | 145,935 | | | | 3,322,018 | |
Shares reacquired upon conversion into other share class(es) | | | (796,366 | ) | | | (18,356,167 | ) |
| | | | | | | | |
Net increase (decrease) in shares outstanding | | | 3,317,081 | | | $ | 76,674,278 | |
| | | | | | | | |
Year ended October 31, 2017: | | | | | | | | |
Shares sold | | | 2,078,996 | | | $ | 38,260,950 | |
Shares reacquired | | | (1,776,496 | ) | | | (28,917,700 | ) |
| | | | | | | | |
Net increase (decrease) in shares outstanding before conversion | | | 302,500 | | | | 9,343,250 | |
Shares issued upon conversion from other share class(es) | | | 33,357 | | | | 589,430 | |
Shares reacquired upon conversion into other share class(es) | | | (1,897,150 | ) | | | (30,135,824 | ) |
| | | | | | | | |
Net increase (decrease) in shares outstanding | | | (1,561,293 | ) | | $ | (20,203,144 | ) |
| | | | | | | | |
| | | | | | | | |
Class C | | Shares | | | Amount | |
Year ended October 31, 2018: | | | | | | | | |
Shares sold | | | 5,122,386 | | | $ | 111,862,993 | |
Shares reacquired | | | (586,124 | ) | | | (12,752,680 | ) |
| | | | | | | | |
Net increase (decrease) in shares outstanding before conversion | | | 4,536,262 | | | | 99,110,313 | |
Shares reacquired upon conversion into other share class(es) | | | (283,448 | ) | | | (6,256,038 | ) |
| | | | | | | | |
Net increase (decrease) in shares outstanding | | | 4,252,814 | | | $ | 92,854,275 | |
| | | | | | | | |
Year ended October 31, 2017: | | | | | | | | |
Shares sold | | | 1,591,435 | | | $ | 28,218,908 | |
Shares reacquired | | | (1,038,579 | ) | | | (16,015,909 | ) |
| | | | | | | | |
Net increase (decrease) in shares outstanding before conversion | | | 552,856 | | | | 12,202,999 | |
Shares reacquired upon conversion into other share class(es) | | | (121,302 | ) | | | (2,004,556 | ) |
| | | | | | | | |
Net increase (decrease) in shares outstanding | | | 431,554 | | | $ | 10,198,443 | |
| | | | | | | | |
Class Z | | | | | | |
Year ended October 31, 2018: | | | | | | | | |
Shares sold | | | 34,289,075 | | | $ | 799,365,247 | |
Shares reacquired | | | (8,598,020 | ) | | | (197,942,065 | ) |
| | | | | | | | |
Net increase (decrease) in shares outstanding before conversion | | | 25,691,055 | | | | 601,423,182 | |
Shares issued upon conversion from other share class(es) | | | 1,037,287 | | | | 24,312,057 | |
Shares reacquired upon conversion into other share class(es) | | | (160,174 | ) | | | (3,726,870 | ) |
| | | | | | | | |
Net increase (decrease) in shares outstanding | | | 26,568,168 | | | $ | 622,008,369 | |
| | | | | | | | |
Year ended October 31, 2017: | | | | | | | | |
Shares sold | | | 10,560,611 | | | $ | 193,966,873 | |
Shares reacquired | | | (4,030,257 | ) | | | (68,348,380 | ) |
| | | | | | | | |
Net increase (decrease) in shares outstanding before conversion | | | 6,530,354 | | | | 125,618,493 | |
Shares issued upon conversion from other share class(es) | | | 1,977,600 | | | | 31,909,367 | |
Shares reacquired upon conversion into other share class(es) | | | (30,248 | ) | | | (537,355 | ) |
| | | | | | | | |
Net increase (decrease) in shares outstanding | | | 8,477,706 | | | $ | 156,990,505 | |
| | | | | | | | |
Class R6 | | | | | | |
Year ended October 31, 2018: | | | | | | | | |
Shares sold | | | 10,875,042 | | | $ | 252,469,637 | |
Shares reacquired | | | (729,939 | ) | | | (17,379,368 | ) |
| | | | | | | | |
Net increase (decrease) in shares outstanding before conversion | | | 10,145,103 | | | | 235,090,269 | |
Shares issued upon conversion from other share class(es) | | | 29,504 | | | | 705,000 | |
| | | | | | | | |
Net increase (decrease) in shares outstanding | | | 10,174,607 | | | $ | 235,795,269 | |
| | | | | | | | |
Year ended October 31, 2017: | | | | | | | | |
Shares sold | | | 811,863 | | | $ | 15,630,303 | |
Shares reacquired | | | (7,440 | ) | | | (141,254 | ) |
| | | | | | | | |
Net increase (decrease) in shares outstanding before conversion | | | 804,423 | | | | 15,489,049 | |
Shares issued upon conversion from other share class(es) | | | 9,725 | | | | 178,938 | |
| | | | | | | | |
Net increase (decrease) in shares outstanding | | | 814,148 | | | $ | 15,667,987 | |
| | | | | | | | |
7. Borrowings
The Fund, on behalf of the Series, along with other affiliated registered investment companies (the “Funds”), is a party to a Syndicated Credit Agreement (“SCA”) with a group of banks. The purpose of the SCA is to provide an alternative source of temporary funding for capital share redemptions. The SCA provides for a commitment of $900 million for the period October 4, 2018 through October 3, 2019. The Funds pay an annualized
| | | | |
| PGIM Jennison Global Opportunities Fund | | | 37 | |
Notes to Financial Statements (continued)
commitment fee of 0.15% of the unused portion of the SCA. The Series’ portion of the commitment fee for the unused amount, allocated based upon a method approved by the Board, is accrued daily and paid quarterly. Prior to October 4, 2018, the Funds had another SCA that provided a commitment of $900 million and the Funds paid an annualized commitment fee of 0.15% of the unused portion of the SCA. The interest on borrowings under both SCAs is paid monthly and at a per annum interest rate based upon a contractual spread plus the higher of (1) the effective federal funds rate, (2) the 1-month LIBOR rate or (3) zero percent.
Other affiliated registered investment companies that are parties to the SCA include portfolios that are subject to a predetermined mathematical formula used to manage certain benefit guarantees offered under variable annuity contracts. The formula may result in large scale asset flows into and out of these portfolios. Consequently, these portfolios may be more likely to utilize the SCA for purposes of funding redemptions. It may be possible for those portfolios to fully exhaust the committed amount of the SCA, thereby requiring the Manager to allocate available funding per a Board-approved methodology designed to treat the Funds in the SCA equitably.
The Series did not utilize the SCA during the reporting period ended October 31, 2018.
8. Risks of Investing in the Series
The Series’ risks include, but are not limited to, some or all of the risks discussed below:
Emerging Markets Risk: The risks of foreign investments are greater for investments in or exposed to emerging markets. Emerging market countries typically have economic and political systems that are less fully developed, and can be expected to be less stable, than those of more developed countries. For example, the economies of such countries can be subject to rapid and unpredictable rates of inflation or deflation. Low trading volumes may result in a lack of liquidity and price volatility. Emerging market countries may have policies that restrict investment by non-US investors, or that prevent non-US investors from withdrawing their money at will.
Equity and Equity-Related Securities Risks: The value of a particular security could go down and you could lose money. In addition to an individual security losing value, the value of the equity markets or a sector in which the Series invests could go down. The Series’ holdings can vary significantly from broad market indexes and the performance of the Series can deviate from the performance of these indexes. Different parts of a market can react differently to adverse issuer, market, regulatory, political and economic developments.
Foreign Securities Risk: The Series’ investments in securities of foreign issuers or issuers with significant exposure to foreign markets involve additional risk. Foreign countries in which the Series may invest may have markets that are less liquid, less regulated and more volatile than US markets. The value of the Series’ investments may decline because of factors affecting the particular issuer as well as foreign markets and issuers generally, such as unfavorable government actions, and political or financial instability.
9. Recent Accounting Pronouncements and Reporting Updates
In August 2018, the Securities and Exchange Commission (the “SEC”) adopted amendments to Regulation S-X to update and simplify the disclosure requirements for registered investment companies by eliminating requirements that are redundant or duplicative of US GAAP requirements or other SEC disclosure requirements. The new amendments require the presentation of the total, rather than the components, of distributable earnings on the Statement of Assets and Liabilities and the total, rather than the components, of dividends from net investment income and distributions from net realized gains on the Statements of Changes in Net Assets. The amendments also removed the requirement for the parenthetical disclosure of undistributed net investment income on the Statements of Changes in Net Assets and certain tax adjustments that were reflected in the Notes to Financial Statements. All of these have been reflected in the Series’ financial statements.
In August 2018, the FASB issued Accounting Standards Update (“ASU”) No. 2018-13, which changes certain fair value measurement disclosure requirements. The new ASU, in addition to other modifications and additions, removes the requirement to disclose the amount and reasons for transfers between Level 1 and Level 2 of the fair value hierarchy, and the Series’ policy for the timing of transfers between levels. The amendments are effective for financial statements issued for fiscal years beginning after December 15, 2019, and interim periods within those fiscal years. Management has evaluated the implications of certain provisions of the ASU and has determined to early adopt aspects related to the removal and modification of certain fair value measurement disclosures under the ASU effective immediately. At this time, management is evaluating the implications of certain other provisions of the ASU related to new disclosure requirements and any impact on the financial statement disclosures has not yet been determined.
| | | | |
| PGIM Jennison Global Opportunities Fund | | | 39 | |
Financial Highlights
| | | | | | | | | | | | | | | | | | | | |
| Class A Shares | |
| | | Year Ended October 31, | |
| | | 2018 | | | 2017 | | | 2016 | | | 2015 | | | 2014 | |
| Per Share Operating Performance(a): | | | | | | | | | | | | | | | | | | | | |
| Net Asset Value, Beginning of Year | | | $20.72 | | | | $15.14 | | | | $15.63 | | | | $14.08 | | | | $12.94 | |
| Income (loss) from investment operations: | | | | | | | | | | | | | | | | | | | | |
| Net investment income (loss) | | | (0.13 | ) | | | (0.09 | ) | | | (0.05 | ) | | | (0.09 | ) | | | (0.11 | ) |
| Net realized and unrealized gain (loss) on investment and foreign currency transactions | | | 0.88 | | | | 5.67 | | | | (0.44 | ) | | | 1.64 | | | | 1.25 | |
| Total from investment operations | | | 0.75 | | | | 5.58 | | | | (0.49 | ) | | | 1.55 | | | | 1.14 | |
| Net asset value, end of year | | | $21.47 | | | | $20.72 | | | | $15.14 | | | | $15.63 | | | | $14.08 | |
| Total Return(b): | | | 3.62% | | | | 36.86% | | | | (3.13)% | | | | 11.01% | | | | 8.81% | |
| |
| Ratios/Supplemental Data: | |
| Net assets, end of year (000) | | | $164,764 | | | | $90,247 | | | | $89,579 | | | | $74,049 | | | | $21,150 | |
| Average net assets (000) | | | $142,313 | | | | $70,810 | | | | $100,220 | | | | $36,635 | | | | $19,352 | |
| Ratios to average net assets(c): | | | | | | | | | | | | | | | | | | | | |
| Expenses after waivers and/or expense reimbursement | | | 1.14% | | | | 1.19% | | | | 1.20% | | | | 1.38% | | | | 1.60% | |
| Expenses before waivers and/or expense reimbursement | | | 1.30% | (d) | | | 1.33% | | | | 1.36% | | | | 1.56% | | | | 1.71% | |
| Net investment income (loss) | | | (0.55)% | | | | (0.55)% | | | | (0.31)% | | | | (0.63)% | | | | (0.78)% | |
| Portfolio turnover rate(e) | | | 62% | | | | 79% | | | | 88% | | | | 58% | | | | 68% | |
| (a) | Calculated based on average shares outstanding during the year. |
| (b) | Total return does not consider the effects of sales loads. Total return is calculated assuming a purchase of a share on the first day and a sale on the last day of each year reported and includes reinvestment of dividends and distributions, if any. Total returns may reflect adjustments to conform to generally accepted accounting principles. |
| (c) | Does not include expenses of the underlying funds in which the Series invests. |
| (d) | Effective November 1, 2017, class specific expenses include transfer agent fees and expenses and registration fees, which are charged to their respective share class. |
| (e) | The Series’ portfolio turnover rate is calculated in accordance with regulatory requirements, without regard to transactions involving short term investments and certain derivatives. If such transactions were included, the Series’ portfolio turnover rate may be higher. |
See Notes to Financial Statements.
| | | | | | | | | | | | | | | | | | | | |
| Class C Shares | |
| | | Year Ended October 31, | |
| | | 2018 | | | 2017 | | | 2016 | | | 2015 | | | 2014 | |
| Per Share Operating Performance(a): | | | | | | | | | | | | | | | | | | | | |
| Net Asset Value, Beginning of Year | | | $19.85 | | | | $14.61 | | | | $15.20 | | | | $13.79 | | | | $12.77 | |
| Income (loss) from investment operations: | | | | | | | | | | | | | | | | | | | | |
| Net investment income (loss) | | | (0.30 | ) | | | (0.22 | ) | | | (0.15 | ) | | | (0.20 | ) | | | (0.21 | ) |
| Net realized and unrealized gain (loss) on investment and foreign currency transactions | | | 0.86 | | | | 5.46 | | | | (0.44 | ) | | | 1.61 | | | | 1.23 | |
| Total from investment operations | | | 0.56 | | | | 5.24 | | | | (0.59 | ) | | | 1.41 | | | | 1.02 | |
| Net asset value, end of year | | | $20.41 | | | | $19.85 | | | | $14.61 | | | | $15.20 | | | | $13.79 | |
| Total Return(b): | | | 2.82% | | | | 35.87% | | | | (3.88)% | | | | 10.22% | | | | 7.99% | |
| |
| Ratios/Supplemental Data: | |
| Net assets, end of year (000) | | | $168,587 | | | | $79,531 | | | | $52,246 | | | | $28,982 | | | | $5,723 | |
| Average net assets (000) | | | $136,788 | | | | $55,922 | | | | $50,113 | | | | $11,330 | | | | $4,361 | |
| Ratios to average net assets(c): | | | | | | | | | | | | | | | | | | | | |
| Expenses after waivers and/or expense reimbursement | | | 1.94% | | | | 1.94% | | | | 1.95% | | | | 2.12% | | | | 2.35% | |
| Expenses before waivers and/or expense reimbursement | | | 1.99% | (d) | | | 2.03% | | | | 2.06% | | | | 2.27% | | | | 2.41% | |
| Net investment income (loss) | | | (1.35)% | | | | (1.28)% | | | | (1.07)% | | | | (1.37)% | | | | (1.54)% | |
| Portfolio turnover rate(e) | | | 62% | | | | 79% | | | | 88% | | | | 58% | | | | 68% | |
| (a) | Calculated based on average shares outstanding during the year. |
| (b) | Total return does not consider the effects of sales loads. Total return is calculated assuming a purchase of a share on the first day and a sale on the last day of each year reported and includes reinvestment of dividends and distributions, if any. Total returns may reflect adjustments to conform to generally accepted accounting principles. |
| (c) | Does not include expenses of the underlying funds in which the Series invests. |
| (d) | Effective November 1, 2017, class specific expenses include transfer agent fees and expenses and registration fees, which are charged to their respective share class. |
| (e) | The Series’ portfolio turnover rate is calculated in accordance with regulatory requirements, without regard to transactions involving short term investments and certain derivatives. If such transactions were included, the Series’ portfolio turnover rate may be higher. |
See Notes to Financial Statements.
| | | | |
| PGIM Jennison Global Opportunities Fund | | | 41 | |
Financial Highlights (continued)
| | | | | | | | | | | | | | | | | | | | |
| Class Z Shares | |
| | | Year Ended October 31, | |
| | | 2018 | | | 2017 | | | 2016 | | | 2015 | | | 2014 | |
| Per Share Operating Performance(a): | | | | | | | | | | | | | | | | | | | | |
| Net Asset Value, Beginning of Year | | | $21.00 | | | | $15.31 | | | | $15.77 | | | | $14.17 | | | | $12.99 | |
| Income (loss) from investment operations: | | | | | | | | | | | | | | | | | | | | |
| Net investment income (loss) | | | (0.08 | ) | | | (0.05 | ) | | | (0.01 | ) | | | (0.06 | ) | | | (0.08 | ) |
| Net realized and unrealized gain (loss) on investment and foreign currency transactions | | | 0.90 | | | | 5.74 | | | | (0.45 | ) | | | 1.66 | | | | 1.26 | |
| Total from investment operations | | | 0.82 | | | | 5.69 | | | | (0.46 | ) | | | 1.60 | | | | 1.18 | |
| Net asset value, end of year | | | $21.82 | | | | $21.00 | | | | $15.31 | | | | $15.77 | | | | $14.17 | |
| Total Return(b): | | | 3.90% | | | | 37.17% | | | | (2.92)% | | | | 11.29% | | | | 9.08% | |
| |
| Ratios/Supplemental Data: | |
| Net assets, end of year (000) | | | $927,492 | | | | $334,783 | | | | $114,228 | | | | $102,800 | | | | $33,504 | |
| Average net assets (000) | | | $693,749 | | | | $193,977 | | | | $131,042 | | | | $48,494 | | | | $30,965 | |
| Ratios to average net assets(c): | | | | | | | | | | | | | | | | | | | | |
| Expenses after waivers and/or expense reimbursement | | | 0.93% | | | | 0.94% | | | | 0.95% | | | | 1.15% | | | | 1.35% | |
| Expenses before waivers and/or expense reimbursement | | | 0.97% | (d) | | | 1.02% | | | | 1.06% | | | | 1.28% | | | | 1.42% | |
| Net investment income (loss) | | | (0.35)% | | | | (0.28)% | | | | (0.07)% | | | | (0.41)% | | | | (0.56)% | |
| Portfolio turnover rate(e) | | | 62% | | | | 79% | | | | 88% | | | | 58% | | | | 68% | |
| (a) | Calculated based on average shares outstanding during the year. |
| (b) | Total return is calculated assuming a purchase of a share on the first day and a sale on the last day of each year reported and includes reinvestment of dividends and distributions, if any. Total returns may reflect adjustments to conform to generally accepted accounting principles. |
| (c) | Does not include expenses of the underlying funds in which the Series invests. |
| (d) | Effective November 1, 2017, class specific expenses include transfer agent fees and expenses and registration fees, which are charged to their respective share class. |
| (e) | The Series’ portfolio turnover rate is calculated in accordance with regulatory requirements, without regard to transactions involving short term investments and certain derivatives. If such transactions were included, the Series’ portfolio turnover rate may be higher. |
See Notes to Financial Statements.
| | | | | | | | | | | | | | | | | | | | |
| Class R6 Shares | |
| | | Year Ended October 31, | | | | | | December 22,
2014(a)
through
October 31,
2015 | |
| | | 2018 | | | 2017 | | | 2016 | |
| Per Share Operating Performance(b): | | | | | | | | | | | | | | | | | | | | |
| Net Asset Value, Beginning of Period | | | $21.06 | | | | $15.33 | | | | $15.78 | | | | | | | | $14.15 | |
| Income (loss) from investment operations: | | | | | | | | | | | | | | | | | | | | |
| Net investment income (loss) | | | (0.06 | ) | | | (0.04 | ) | | | 0.01 | | | | | | | | (0.03 | ) |
| Net realized and unrealized gain (loss) on investment and foreign currency transactions | | | 0.90 | | | | 5.77 | | | | (0.46 | ) | | | | | | | 1.66 | |
| Total from investment operations | | | 0.84 | | | | 5.73 | | | | (0.45 | ) | | | | | | | 1.63 | |
| Net asset value, end of period | | | $21.90 | | | | $21.06 | | | | $15.33 | | | | | | | | $15.78 | |
| Total Return(c): | | | 3.99% | | | | 37.38% | | | | (2.85)% | | | | | | | | 11.52% | |
| |
| Ratios/Supplemental Data: | |
| Net assets, end of period (000) | | | $253,010 | | | | $29,023 | | | | $8,647 | | | | | | | | $11 | |
| Average net assets (000) | | | $133,984 | | | | $14,700 | | | | $7,736 | | | | | | | | $11 | |
| Ratios to average net assets(d): | | | | | | | | | | | | | | | | | | | | |
| Expenses after waivers and/or expense reimbursement | | | 0.84% | | | | 0.84% | | | | 0.84% | | | | | | | | 1.09% | (e) |
| Expenses before waivers and/or expense reimbursement | | | 0.90% | (f) | | | 0.92% | | | | 0.95% | | | | | | | | 1.18% | (e) |
| Net investment income (loss) | | | (0.26)% | | | | (0.23)% | | | | 0.05% | | | | | | | | (0.27)% | (e) |
| Portfolio turnover rate(g) | | | 62% | | | | 79% | | | | 88% | | | | | | | | 58% | |
| (a) | Commencement of offering. |
| (b) | Calculated based on average shares outstanding during the period. |
| (c) | Total return is calculated assuming a purchase of a share on the first day and a sale on the last day of each period reported and includes reinvestment of dividends and distributions, if any. Total returns may reflect adjustments to conform to generally accepted accounting principles. Total returns for periods less than one full year are not annualized. |
| (d) | Does not include expenses of the underlying funds in which the Series invests. |
| (f) | Effective November 1, 2017, class specific expenses include transfer agent fees and expenses and registration fees, which are charged to their respective share class. |
| (g) | The Series’ portfolio turnover rate is calculated in accordance with regulatory requirements, without regard to transactions involving short term investments and certain derivatives. If such transactions were included, the Series’ portfolio turnover rate may be higher. |
See Notes to Financial Statements.
| | | | |
| PGIM Jennison Global Opportunities Fund | | | 43 | |
Report of Independent Registered Public Accounting Firm
The Board of Directors and Shareholders
Prudential World Fund, Inc.:
Opinion on the Financial Statements
We have audited the accompanying statement of assets and liabilities of PGIM Jennison Global Opportunities Fund (formerly Prudential Jennison Global Opportunities Fund) (the “Fund”), a series of Prudential World Fund, Inc., including the schedule of investments, as of October 31, 2018, the related statement of operations for the year then ended, the statements of changes in net assets for each of the years in the two-year period then ended, and the related notes (collectively, the financial statements) and the financial highlights for the years or periods indicated therein. In our opinion, the financial statements and financial highlights present fairly, in all material respects, the financial position of the Fund as of October 31, 2018, the results of its operations for the year then ended, the changes in its net assets for each of the years in the two-year period then ended, and the financial highlights for the years or periods indicated therein, in conformity with U.S. generally accepted accounting principles.
Basis for Opinion
These financial statements and financial highlights are the responsibility of the Fund’s management. Our responsibility is to express an opinion on these financial statements and financial highlights based on our audits. We are a public accounting firm registered with the Public Company Accounting Oversight Board (United States) (“PCAOB”) and are required to be independent with respect to the Fund in accordance with the U.S. federal securities laws and the applicable rules and regulations of the Securities and Exchange Commission and the PCAOB.
We conducted our audits in accordance with the standards of the PCAOB. Those standards require that we plan and perform the audit to obtain reasonable assurance about whether the financial statements and financial highlights are free of material misstatement, whether due to error or fraud. Our audits included performing procedures to assess the risks of material misstatement of the financial statements and financial highlights, whether due to error or fraud, and performing procedures that respond to those risks. Such procedures included examining, on a test basis, evidence regarding the amounts and disclosures in the financial statements and financial highlights. Such procedures also included confirmation of securities owned as of October 31, 2018, by correspondence with the custodians, transfer agents and brokers or by other appropriate auditing procedures when replies from brokers were not received. Our audits also included evaluating the accounting principles used and significant estimates made by management, as well as evaluating the overall presentation of the financial statements and financial highlights. We believe that our audits provide a reasonable basis for our opinion.

We have served as the auditor of one or more PGIM and/or Prudential Retail investment companies since 2003.
New York, New York
December 17, 2018
INFORMATION ABOUT BOARD MEMBERS AND OFFICERS (unaudited)
Information about Board Members and Officers of the Fund is set forth below. Board Members who are not deemed to be “interested persons” of the Fund, as defined in the 1940 Act, are referred to as “Independent Board Members.” Board Members who are deemed to be “interested persons” of the Fund are referred to as “Interested Board Members.” The Board Members are responsible for the overall supervision of the operations of the Fund and perform the various duties imposed on the directors of investment companies by the 1940 Act. The Board in turn elects the Officers, who are responsible for administering the day-to-day operations of the Fund.
| | | | | | |
| Independent Board Members | | | | |
| | | | |
Name, Address, Age Position(s) Portfolios Overseen | | Principal Occupation(s) During Past Five Years | | Other Directorships Held During Past Five Years | | Length of Board Service |
| | | | |
Ellen S. Alberding (60) Board Member Portfolios Overseen: 93 | | President and Board Member, The Joyce Foundation (charitable foundation) (since 2002); Vice Chair, City Colleges of Chicago (community college system) (2011-2015); Trustee, National Park Foundation (charitable foundation for national park system) (2009-2018); Trustee, Economic Club of Chicago (since 2009); Trustee, Loyola University (since 2018). | | None. | | Since September 2013 |
| | | | |
Kevin J. Bannon (66) Board Member Portfolios Overseen: 93 | | Retired; Managing Director (April 2008-May 2015) and Chief Investment Officer (October 2008-November 2013) of Highmount Capital LLC (registered investment adviser); formerly Executive Vice President and Chief Investment Officer (April 1993-August 2007) of Bank of New York Company; President (May 2003-May 2007) of BNY Hamilton Family of Mutual Funds. | | Director of Urstadt Biddle Properties (equity real estate investment trust) (since September 2008). | | Since July 2008 |
| | | | |
Linda W. Bynoe (66) Board Member Portfolios Overseen: 93 | | President and Chief Executive Officer (since March 1995) and formerly Chief Operating Officer (December 1989-February 1995) of Telemat Ltd. (management consulting); formerly Vice President (January 1985-June 1989) at Morgan Stanley & Co. (broker-dealer). | | Director of Anixter International, Inc. (communication products distributor) (since January 2006); Director of Northern Trust Corporation (financial services) (since April 2006); Trustee of Equity Residential (residential real estate) (since December 2009). | | Since March 2005 |
PGIM Jennison Global Opportunities Fund
| | | | | | |
Independent Board Members | | | | |
| | | | |
Name, Address, Age Position(s) Portfolios Overseen | | Principal Occupation(s) During Past Five Years | | Other Directorships Held During Past Five Years | | Length of Board Service |
| | | | |
Barry H. Evans (58) Board Member Portfolios Overseen: 92 | | Retired; formerly President (2005 – 2016), Global Chief Operating Officer (2014– 2016), Chief Investment Officer – Global Head of Fixed Income (1998-2014), and various portfolio manager roles (1986-2006), Manulife Asset Management U.S. | | Director, Manulife Trust Company (since 2011); formerly Director, Manulife Asset Management Limited (2015-2017); formerly Chairman of the Board of Directors of Manulife Asset Management U.S. (2005-2016); formerly Chairman of the Board, Declaration Investment Management and Research (2008-2016). | | Since September 2017 |
| | | | |
Keith F. Hartstein (62) Board Member & Independent Chair Portfolios Overseen: 93 | | Retired; Member (since November 2014) of the Governing Council of the Independent Directors Council (organization of independent mutual fund directors); formerly President and Chief Executive Officer (2005-2012), Senior Vice President (2004-2005), Senior Vice President of Sales and Marketing (1997-2004), and various executive management positions (1990-1997), John Hancock Funds, LLC (asset management); Chairman, Investment Company Institute’s Sales Force Marketing Committee (2003-2008). | | None. | | Since September 2013 |
Visit our website at pgiminvestments.com
| | | | | | |
| Independent Board Members | | | | |
| | | | |
Name, Address, Age Position(s) Portfolios Overseen | | Principal Occupation(s) During Past Five Years | | Other Directorships Held During Past Five Years | | Length of Board Service |
| | | | |
Laurie Simon Hodrick (56) Board Member Portfolios Overseen: 92 | | A. Barton Hepburn Professor Emerita of Economics in the Faculty of Business, Columbia Business School (since 2018); Visiting Professor of Law, Stanford Law School (since 2015); Visiting Fellow at the Hoover Institution, Stanford University (since 2015); Sole Member, ReidCourt LLC (since 2008) (a consulting firm); formerly A. Barton Hepburn Professor of Economics in the Faculty of Business, Columbia Business School (1996-2017); formerly Managing Director, Global Head of Alternative Investment Strategies, Deutsche Bank (2006-2008). | | Independent Director, Corporate Capital Trust (since April 2017) (a business development company); Independent Director, Kabbage, Inc. (since July 2018) (financial services). | | Since September 2017 |
| | | | |
Michael S. Hyland, CFA (73) Board Member Portfolios Overseen: 93 | | Retired (since February 2005); formerly Senior Managing Director (July 2001-February 2005) of Bear Stearns & Co, Inc.; Global Partner, INVESCO (1999-2001); Managing Director and President of Salomon Brothers Asset Management (1989-1999). | | None. | | Since July 2008 |
| | | | |
Richard A. Redeker (75) Board Member Portfolios Overseen: 93 | | Retired Mutual Fund Senior Executive (50 years); Management Consultant; Director, Mutual Fund Directors Forum (since 2014); Independent Directors Council (organization of independent mutual fund directors)-Executive Committee, Chair of Policy Steering Committee, Governing Council. | | None. | | Since October 1993 |
PGIM Jennison Global Opportunities Fund
| | | | | | |
| Independent Board Members | | | | |
| | | | |
Name, Address, Age Position(s) Portfolios Overseen | | Principal Occupation(s) During Past Five Years | | Other Directorships Held During Past Five Years | | Length of Board Service |
| | | | |
Brian K. Reid (56)# Board Member Portfolios Overseen: 92 | | Retired; formerly Chief Economist for the Investment Company Institute (ICI) (2005-2017); formerly Senior Economist and Director of Industry and Financial Analysis at the ICI (1998-2004); formerly Senior Economist, Industry and Financial Analysis at the ICI (1996-1998); formerly Staff Economist at the Federal Reserve Board (1989-1996); Director, ICI Mutual Insurance Company (2012-2017). | | None. | | Since March 2018 |
| # | Mr. Reid joined the Board effective as of March 1, 2018. |
| | | | | | |
| Interested Board Members | | | | |
| | | | |
Name, Address, Age Position(s) Portfolios Overseen | | Principal Occupation(s) During Past Five Years | | Other Directorships Held During Past Five Years | | Length of
Board Service |
| | | | |
Stuart S. Parker (56) Board Member & President Portfolios Overseen: 93 | | President of PGIM Investments LLC (formerly known as Prudential Investments LLC) (since January 2012); Executive Vice President of Prudential Investment Management Services LLC (since December 2012); formerly Executive Vice President of Jennison Associates LLC and Head of Retail Distribution of PGIM Investments LLC (June 2005-December 2011). | | None. | | Since January 2012 |
Visit our website at pgiminvestments.com
| | | | | | |
| Interested Board Members | | | | |
| | | | |
Name, Address, Age Position(s) Portfolios Overseen | | Principal Occupation(s) During Past Five Years | | Other Directorships Held During Past Five Years | | Length of Board Service |
| | | | |
Scott E. Benjamin (45) Board Member & Vice President Portfolios Overseen:93 | | Executive Vice President (since June 2009) of PGIM Investments LLC; Executive Vice President (June 2009-June 2012) and Vice President (since June 2012) of Prudential Investment Management Services LLC; Executive Vice President (since September 2009) of AST Investment Services, Inc.; Senior Vice President of Product Development and Marketing, PGIM Investments (since February 2006); formerly Vice President of Product Development and Product Management, PGIM Investments LLC (2003-2006). | | None. | | Since March 2010 |
| | | | |
Grace C. Torres* (59) Board Member Portfolios Overseen: 92 | | Retired; formerly Treasurer and Principal Financial and Accounting Officer of the PGIM Funds, Target Funds, Advanced Series Trust, Prudential Variable Contract Accounts and The Prudential Series Fund (1998-June 2014); Assistant Treasurer (March 1999-June 2014) and Senior Vice President (September 1999-June 2014) of PGIM Investments LLC; Assistant Treasurer (May 2003-June 2014) and Vice President (June 2005-June 2014) of AST Investment Services, Inc.; Senior Vice President and Assistant Treasurer (May 2003-June 2014) of Prudential Annuities Advisory Services, Inc. | | Formerly Director (July 2015-January 2018) of Sun Bancorp, Inc. N.A. and Sun National Bank; Director (since January 2018) of OceanFirst Financial Corp. and OceanFirst Bank. | | Since November 2014 |
* Note: Prior to her retirement in 2014, Ms. Torres was employed by PGIM Investments LLC. Due to her prior employment, she is considered to be an “interested person” under the 1940 Act. Ms. Torres is a Non-Management Interested Board Member.
PGIM Jennison Global Opportunities Fund
| | | | |
| Fund Officers(a) | | | | |
| | | |
Name, Address and Age Position with Fund | | Principal Occupation(s) During Past Five Years | | Length of Service as Fund Officer |
| | | |
Raymond A. O’Hara (63) Chief Legal Officer | | Vice President and Corporate Counsel (since July 2010) of Prudential Insurance Company of America (Prudential); Vice President (March 2011-Present) of Pruco Life Insurance Company and Pruco Life Insurance Company of New Jersey; Vice President and Corporate Counsel (March 2011-Present) of Prudential Annuities Life Assurance Corporation; Chief Legal Officer of PGIM Investments LLC (since June 2012); Chief Legal Officer of Prudential Mutual Fund Services LLC (since June 2012) and Corporate Counsel of AST Investment Services, Inc. (since June 2012); formerly Assistant Vice President and Corporate Counsel (September 2008-July 2010) of The Hartford Financial Services Group, Inc.; formerly Associate (September 1980-December 1987) and Partner (January 1988–August 2008) of Blazzard & Hasenauer, P.C. (formerly, Blazzard, Grodd & Hasenauer, P.C.). | | Since June 2012 |
| | | |
Chad A. Earnst (43) Chief Compliance Officer | | Chief Compliance Officer (September 2014-Present) of PGIM Investments LLC; Chief Compliance Officer (September 2014-Present) of the PGIM Funds, Target Funds, Advanced Series Trust, The Prudential Series Fund, Prudential’s Gibraltar Fund, Inc., PGIM Global Short Duration High Yield Income Fund, Inc., PGIM Short Duration High Yield Fund, Inc. and PGIM Jennison MLP Income Fund, Inc.; formerly Assistant Director (March 2010-August 2014) of the Asset Management Unit, Division of Enforcement, US Securities & Exchange Commission; Assistant Regional Director (January 2010-August 2014), Branch Chief (June 2006–December 2009) and Senior Counsel (April 2003-May 2006) of the Miami Regional Office, Division of Enforcement, US Securities & Exchange Commission. | | Since September 2014 |
| | | |
Dino Capasso (44) Deputy Chief Compliance Officer | | Vice President and Deputy Chief Compliance Officer (June 2017-Present) of PGIM Investments LLC; formerly, Senior Vice President and Senior Counsel (January 2016-June 2017), and Vice President and Counsel (February 2012-December 2015) of Pacific Investment Management Company LLC. | | Since March 2018 |
| | | |
Andrew R. French (56) Secretary | | Vice President and Corporate Counsel (since February 2010) of Prudential; formerly Director and Corporate Counsel (2006-2010) of Prudential; Vice President and Assistant Secretary (since January 2007) of PGIM Investments LLC; Vice President and Assistant Secretary (since January 2007) of Prudential Mutual Fund Services LLC. | | Since October 2006 |
Visit our website at pgiminvestments.com
| | | | |
| Fund Officers(a) | | | | |
| | | |
Name, Address and Age Position with Fund | | Principal Occupation(s) During Past Five Years | | Length of Service as Fund Officer |
| | | |
Jonathan D. Shain (60) Assistant Secretary | | Vice President and Corporate Counsel (since August 1998) of Prudential; Vice President and Assistant Secretary (since May 2001) of PGIM Investments LLC; Vice President and Assistant Secretary (since February 2001) of Prudential Mutual Fund Services LLC; formerly Vice President and Assistant Secretary (May 2003-June 2005) of AST Investment Services, Inc. | | Since May 2005 |
| | | |
Claudia DiGiacomo (44) Assistant Secretary | | Vice President and Corporate Counsel (since January 2005) of Prudential; Vice President and Assistant Secretary of PGIM Investments LLC (since December 2005); formerly Associate at Sidley Austin Brown & Wood LLP (1999-2004). | | Since December 2005 |
| | | |
Charles H. Smith (45) Anti-Money Laundering Compliance Officer | | Vice President, Corporate Compliance, Anti-Money Laundering Unit (since January 2015) of Prudential; committee member of the American Council of Life Insurers Anti-Money Laundering and Critical Infrastructure Committee (since January 2016); formerly Global Head of Economic Sanctions Compliance at AIG Property Casualty (February 2007 – December 2014); Assistant Attorney General at the New York State Attorney General’s Office, Division of Public Advocacy. (August 1998 —January 2007). | | Since January 2017 |
| | | |
Brian D. Nee (52) Treasurer and Principal Financial and Accounting Officer | | Vice President and Head of Finance of PGIM Investments LLC (since August 2015) and PGIM Global Partners (since February 2017); formerly, Vice President, Treasurer’s Department of Prudential (September 2007-August 2015). | | Since July 2018 |
| | | |
Peter Parrella (60) Assistant Treasurer | | Vice President (since 2007) and Director (2004-2007) within Prudential Mutual Fund Administration; formerly Tax Manager at SSB Citi Fund Management LLC (1997-2004). | | Since June 2007 |
| | | |
Lana Lomuti (51) Assistant Treasurer | | Vice President (since 2007) and Director (2005-2007), within Prudential Mutual Fund Administration; formerly Assistant Treasurer (December 2007-February 2014) of The Greater China Fund, Inc. | | Since April 2014 |
| | | |
Linda McMullin (57) Assistant Treasurer | | Vice President (since 2011) and Director (2008-2011) within Prudential Mutual Fund Administration. | | Since April 2014 |
| | | |
Kelly A. Coyne (50) Assistant Treasurer | | Director, Investment Operations of Prudential Mutual Fund Services LLC (since 2010). | | Since March 2015 |
(a) Excludes Mr. Parker and Mr. Benjamin, interested Board Members who also serve as President and Vice President, respectively.
Explanatory Notes to Tables:
| ∎ | | Board Members are deemed to be “Interested,” as defined in the 1940 Act, by reason of their affiliation with PGIM Investments LLC and/or an affiliate of PGIM Investments LLC. |
| ∎ | | Unless otherwise noted, the address of all Board Members and Officers is c/o PGIM Investments LLC, 655 Broad Street, Newark, New Jersey 07102-4410. |
| ∎ | | There is no set term of office for Board Members or Officers. The Board Members have adopted a retirement policy, which calls for the retirement of Board Members on December 31 of the year in which they reach the age of 75. |
PGIM Jennison Global Opportunities Fund
| ∎ | | “Other Directorships Held” includes only directorships of companies required to register or file reports with the SEC under the 1934 Act (that is, “public companies”) or other investment companies registered under the 1940 Act. |
| ∎ | | “Portfolios Overseen” includes all investment companies managed by PGIM Investments LLC. The investment companies for which PGIM Investments LLC serves as manager include the PGIM Funds, The Prudential Variable Contract Accounts, PGIM ETF Trust, PGIM Short Duration High Yield Fund, Inc., PGIM Global Short Duration High Yield Fund, Inc., The Prudential Series Fund, Prudential’s Gibraltar Fund, Inc. and the Advanced Series Trust. |
Visit our website at pgiminvestments.com
Approval of Advisory Agreements (unaudited)
The Fund’s Board of Directors
The Board of Directors (the “Board”) of PGIM Jennison Global Opportunities Fund (the “Fund”)1 consists of twelve individuals, nine of whom are not “interested persons” of the Fund, as defined in the Investment Company Act of 1940, as amended (the “1940 Act”) (the “Independent Directors”). The Board is responsible for the oversight of the Fund and its operations, and performs the various duties imposed on the directors of investment companies by the 1940 Act. The Independent Directors have retained independent legal counsel to assist them in connection with their duties. The Chair of the Board is an Independent Director. The Board has established four standing committees: the Audit Committee, the Nominating and Governance Committee, and two Investment Committees. Each committee is chaired by, and composed of, Independent Directors.
Annual Approval of the Fund’s Advisory Agreements
As required under the 1940 Act, the Board determines annually whether to renew the Fund’s management agreement with PGIM Investments LLC (“PGIM Investments”) and the Fund’s subadvisory agreement with Jennison Associates LLC (“Jennison”). In considering the renewal of the agreements, the Board, including all of the Independent Directors, met on June 7, 2018 and on June 19-21, 2018 and approved the renewal of the agreements through July 31, 2019, after concluding that the renewal of the agreements was in the best interests of the Fund and its shareholders.
In advance of the meetings, the Board requested and received materials relating to the agreements, and had the opportunity to ask questions and request further information in connection with its consideration. Among other things, the Board considered comparative fee information from PGIM Investments and Jennison. Also, the Board considered comparisons with other mutual funds in relevant Peer Universes and Peer Groups, as is further discussed below.
In approving the agreements, the Board, including the Independent Directors advised by independent legal counsel, considered the factors it deemed relevant, including the nature, quality and extent of services provided by PGIM Investments and the subadviser, the performance of the Fund, the profitability of PGIM Investments and its affiliates, expenses and fees, and the potential for economies of scale that may be shared with the Fund and its shareholders as the Fund’s assets grow. In their deliberations, the Directors did not identify any single factor which alone was responsible for the Board’s decision to approve the agreements with respect to the Fund. In connection with its deliberations, the Board considered information provided by PGIM Investments throughout the year at regular Board meetings, presentations from portfolio managers and other information, as well as
| | |
| PGIM Jennison Global Opportunities Fund |
| 1 | PGIM Jennison Global Opportunities Fund is a series of Prudential World Fund, Inc. |
Approval of Advisory Agreements (continued)
information furnished at or in advance of the meetings on June 7, 2018 and on June 19-21, 2018.
The Directors determined that the overall arrangements between the Fund and PGIM Investments, which serves as the Fund’s investment manager pursuant to a management agreement, and between PGIM Investments and Jennison, which serves as the Fund’s subadviser pursuant to the terms of a subadvisory agreement with PGIM Investments, are in the best interests of the Fund and its shareholders in light of the services performed, fees charged and such other matters as the Directors considered relevant in the exercise of their business judgment.
The material factors and conclusions that formed the basis for the Directors’ reaching their determinations to approve the continuance of the agreements are separately discussed below.
Nature, Quality and Extent of Services
The Board received and considered information regarding the nature, quality and extent of services provided to the Fund by PGIM Investments and Jennison. The Board considered the services provided by PGIM Investments, including but not limited to the oversight of the subadviser for the Fund, as well as the provision of fund recordkeeping, compliance, and other services to the Fund. With respect to PGIM Investments’ oversight of the subadviser, the Board noted that PGIM Investments’ Strategic Investment Research Group (“SIRG”), which is a business unit of PGIM Investments, is responsible for monitoring and reporting to PGIM Investments’ senior management on the performance and operations of the subadviser. The Board also considered that PGIM Investments pays the salaries of all of the officers and interested Directors of the Fund who are part of Fund management. The Board also considered the investment subadvisory services provided by Jennison, including investment research and security selection, as well as adherence to the Fund’s investment restrictions and compliance with applicable Fund policies and procedures. The Board considered PGIM Investments’ evaluation of the subadviser, as well as PGIM Investments’ recommendation, based on its review of the subadviser, to renew the subadvisory agreement.
The Board considered the qualifications, backgrounds and responsibilities of PGIM Investments’ senior management responsible for the oversight of the Fund and Jennison, and also considered the qualifications, backgrounds and responsibilities of Jennison’s portfolio managers who are responsible for the day-to-day management of the Fund’s portfolio. The Board was provided with information pertaining to PGIM Investments’ and Jennison’s organizational structure, senior management, investment operations, and other relevant information pertaining to both PGIM Investments and Jennison. The Board also noted that it received favorable compliance reports from the Fund’s Chief Compliance Officer (“CCO”) as to both PGIM Investments and Jennison. The Board noted that Jennison is affiliated with PGIM Investments.
| | |
| Visit our website at pgiminvestments.com | | |
The Board concluded that it was satisfied with the nature, extent and quality of the investment management services provided by PGIM Investments and the subadvisory services provided to the Fund by Jennison, and that there was a reasonable basis on which to conclude that the Fund benefits from the services provided by PGIM Investments and Jennison under the management and subadvisory agreements.
Costs of Services and Profits Realized by PGIM Investments
The Board was provided with information on the profitability of PGIM Investments and its affiliates in serving as the Fund’s investment manager. The Board discussed with PGIM Investments the methodology utilized in assembling the information regarding profitability and considered its reasonableness. The Board recognized that it is difficult to make comparisons of profitability from fund management contracts because comparative information is not generally publicly available and is affected by numerous factors, including the structure of the particular adviser, the types of funds it manages, its business mix, numerous assumptions regarding allocations and the adviser’s capital structure and cost of capital. However, the Board considered that the cost of services provided by PGIM Investments to the Fund during the year ended December 31, 2017 exceeded the management fees paid by the Fund, resulting in an operating loss to PGIM Investments. Taking these factors into account, the Board concluded that the profitability of PGIM Investments and its affiliates in relation to the services rendered was not unreasonable.
Economies of Scale
The Board received and discussed information concerning economies of scale that PGIM Investments may realize as the Fund’s assets grow beyond current levels. The Board noted that the management fee schedule for the Fund includes breakpoints, which have the effect of decreasing the fee rate as assets increase. During the course of time, the Board has considered information regarding the launch date of the Fund, the management fees of the Fund compared to those of similarly managed funds and PGIM Investments’ investment in the Fund over time. The Board noted that economies of scale may be shared with the Fund in several ways, including low management fees from inception, additional technological and personnel investments to enhance shareholder services, and maintaining existing expense structures in the face of a rising cost environment. The Board considered PGIM Investments’ assertion that it continually evaluates the management fee schedule of the Fund and the potential to share economies of scale through breakpoints or fee waivers as asset levels increase.
The Board recognized the inherent limitations of any analysis of economies of scale, stemming largely from the Board’s understanding that most of PGIM Investments’ costs are not specific to individual funds, but rather are incurred across a variety of products and services.
| | |
| PGIM Jennison Global Opportunities Fund |
Approval of Advisory Agreements (continued)
Other Benefits to PGIM Investments and Jennison
The Board considered potential ancillary benefits that might be received by PGIM Investments, Jennison and their affiliates as a result of their relationship with the Fund. The Board concluded that potential benefits to be derived by PGIM Investments included transfer agency fees received by the Fund’s transfer agent (which is affiliated with PGIM Investments), as well as benefits to its reputation or other intangible benefits resulting from PGIM Investments’ association with the Fund. The Board concluded that the potential benefits to be derived by Jennison included the ability to use soft dollar credits, as well as the potential benefits consistent with those generally resulting from an increase in assets under management, specifically, potential access to additional research resources and benefits to its reputation. The Board concluded that the benefits derived by PGIM Investments and Jennison were consistent with the types of benefits generally derived by investment managers and subadvisers to mutual funds.
Performance of the Fund / Fees and Expenses
The Board considered certain additional specific factors and made related conclusions relating to the historical performance of the Fund for the one-, three- and five-year periods ended December 31, 2017.
The Board also considered the Fund’s actual management fee, as well as the Fund’s net total expense ratio, for the fiscal year ended October 31, 2017. The Board considered the management fee for the Fund as compared to the management fee charged by PGIM Investments to other funds and the fee charged by other advisers to comparable mutual funds in a Peer Group. The actual management fee represents the fee rate actually paid by Fund shareholders and includes any fee waivers or reimbursements. The net total expense ratio for the Fund represents the actual expense ratio incurred by Fund shareholders.
The mutual funds included in the Peer Universe, which was used to consider performance, and the Peer Group, which was used to consider fees and expenses, were objectively determined by Broadridge, an independent provider of mutual fund data. In certain circumstances, PGIM Investments also may have provided supplemental Peer Universe or Peer Group information for reasons addressed with the Board. The comparisons placed the Fund in various quartiles, with the first quartile being the best 25% of the mutual funds (for performance, the best performing mutual funds and, for expenses, the lowest cost mutual funds).
The section below summarizes key factors considered by the Board and the Board’s conclusions regarding the Fund’s performance, fees and overall expenses. The table sets forth gross performance comparisons (which do not reflect the impact on performance of fund expenses, or any subsidies, expense caps or waivers that may be applicable) with the
| | |
| Visit our website at pgiminvestments.com | | |
Peer Universe, actual management fees with the Peer Group (which reflect the impact of any subsidies or fee waivers), and net total expenses with the Peer Group, each of which were key factors considered by the Board.
| | | | | | | | |
Gross
Performance | | 1 Year | | 3 Years | | 5 Years | | 10 Years |
| | 1st Quartile | | 1st Quartile | | 1st Quartile | | N/A |
| Actual Management Fees: 1st Quartile |
| Net Total Expenses: 1st Quartile |
| | • | | The Board noted that Fund outperformed its benchmark index over all periods. |
| | • | | The Board and PGIM Investments agreed to enhance the Fund’s existing expense cap, such that, effective July 1, 2018 the expense cap (exclusive of certain fees and expenses) is 0.84% for each share class through February 29, 2020. PGIM Investments has also agreed to cap annual fund operating expenses for Class A shares at 1.08% through February 29, 2020. PGIM Investments is also obligated to waive fees or shared operating expenses on any share class to the same extent that it waives similar expenses on any other share class. |
| | • | | The Board concluded that, in light of the above, it would be in the best interests of the Fund and its shareholders to continue to monitor performance and to renew the agreements. |
| | • | | The Board concluded that the management fees (including subadvisory fees) and total expenses were reasonable in light of the services provided. |
* * *
After full consideration of these factors, the Board concluded that the approval of the agreements was in the best interests of the Fund and its shareholders.
| | |
| PGIM Jennison Global Opportunities Fund |
| | | | |
| ∎ MAIL | | ∎ TELEPHONE | | ∎ WEBSITE |
655 Broad Street Newark, NJ 07102 | | (800) 225-1852 | | www.pgiminvestments.com |
|
| PROXY VOTING |
| The Board of Directors of the Fund has delegated to the Fund’s subadviser the responsibility for voting any proxies and maintaining proxy recordkeeping with respect to the Fund. A description of these proxy voting policies and procedures is available without charge, upon request, by calling (800) 225-1852. Information regarding how the Fund voted proxies relating to portfolio securities during the most recent 12-month period ended June 30 is available on the Fund’s website and on the Securities and Exchange Commission’s website. |
|
| DIRECTORS |
| Ellen S. Alberding • Kevin J. Bannon • Scott E. Benjamin • Linda W. Bynoe • Barry H. Evans • Keith F. Hartstein • Laurie Simon Hodrick • Michael S. Hyland • Stuart S. Parker • Richard A. Redeker • Brian K. Reid • Grace C. Torres |
|
| OFFICERS |
| Stuart S. Parker, President • Scott E. Benjamin, Vice President • Brian D. Nee, Treasurer and Principal Financial and Accounting Officer • Raymond A. O’Hara, Chief Legal Officer • Andrew R. French, Secretary • Chad A. Earnst, Chief Compliance Officer • Dino Capasso, Vice President and Deputy Chief Compliance Officer • Charles H. Smith, Anti-Money Laundering Compliance Officer • Jonathan D. Shain, Assistant Secretary • Claudia DiGiacomo, Assistant Secretary • Peter Parrella, Assistant Treasurer • Lana Lomuti, Assistant Treasurer • Linda McMullin, Assistant Treasurer • Kelly A. Coyne, Assistant Treasurer |
| | | | |
| MANAGER | | PGIM Investments LLC | | 655 Broad Street Newark, NJ 07102 |
|
| SUBADVISER | | Jennison Associates LLC | | 466 Lexington Avenue
New York, NY 10017 |
|
| DISTRIBUTOR | | Prudential Investment
Management Services LLC | | 655 Broad Street Newark, NJ 07102 |
|
| CUSTODIAN | | The Bank of New York Mellon | | 225 Liberty Street
New York, NY 10286 |
|
| TRANSFER AGENT | | Prudential Mutual Fund
Services LLC | | PO Box 9658
Providence, RI 02940 |
|
| INDEPENDENT REGISTERED PUBLIC ACCOUNTING FIRM | | KPMG LLP | | 345 Park Avenue New York, NY 10154 |
|
| FUND COUNSEL | | Willkie Farr & Gallagher LLP | | 787 Seventh Avenue
New York, NY 10019 |
|
|
| An investor should consider the investment objectives, risks, charges, and expenses of the Fund carefully before investing. The prospectus and summary prospectus contain this and other information about the Fund. An investor may obtain a prospectus and summary prospectus by visiting our website at www.pgiminvestments.com or by calling (800) 225-1852. The prospectus and summary prospectus should be read carefully before investing. |
|
| E-DELIVERY |
| To receive your mutual fund documents online, go to www.pgiminvestments.com/edelivery and enroll. Instead of receiving printed documents by mail, you will receive notification via email when new materials are available. You can cancel your enrollment or change your email address at any time by visiting the website address above. |
|
| SHAREHOLDER COMMUNICATIONS WITH DIRECTORS |
| Shareholders can communicate directly with the Board of Directors by writing to the Chair of the Board, PGIM Jennison Global Opportunities Fund, PGIM Investments, Attn: Board of Directors, 655 Broad Street, Newark, NJ 07102. Shareholders can communicate directly with an individual Director by writing to the same address. Communications are not screened before being delivered to the addressee. |
|
| AVAILABILITY OF PORTFOLIO SCHEDULE |
| The Fund files its complete schedule of portfolio holdings with the Securities and Exchange Commission for the first and third quarters of each fiscal year on Form N-Q. The Fund’s Forms N-Q are available on the Commission’s website at www.sec.gov. The Fund’s schedule of portfolio holdings is also available on the Fund’s website as of the end of each month no sooner than 15 days after the end of the month. |
|
| The Fund’s Statement of Additional Information contains additional information about the Fund’s Directors and is available without charge, upon request, by calling (800) 225-1852. |
Mutual Funds:
| | | | |
| ARE NOT INSURED BY THE FDIC OR ANY FEDERAL GOVERNMENT AGENCY | | MAY LOSE VALUE | | ARE NOT A DEPOSIT OF OR GUARANTEED BY ANY BANK OR ANY BANK AFFILIATE |
PGIM JENNISON GLOBAL OPPORTUNITIES FUND
| | | | | | | | |
| SHARE CLASS | | A | | C | | Z | | R6* |
| NASDAQ | | PRJAX | | PRJCX | | PRJZX | | PRJQX |
| CUSIP | | 743969719 | | 743969693 | | 743969685 | | 743969594 |
*Formerly known as Class Q shares.
MF214E

PGIM JENNISON INTERNATIONAL OPPORTUNITIES FUND
(Formerly known as Prudential Jennison International Opportunities Fund)
ANNUAL REPORT
OCTOBER 31, 2018
COMING SOON: PAPERLESS SHAREHOLDER REPORTS
Beginning on January 1, 2021, as permitted by regulations adopted by the Securities and Exchange Commission, paper copies of the Fund’s annual and semi-annual shareholder reports will no longer be sent by mail, unless you specifically request paper copies of the reports. Instead, the reports will be made available on the Fund’s website (www.pgiminvestments.com), and you will be notified by mail each time a report is posted and provided with a website link to access the report.
If you already elected to receive shareholder reports electronically, you will not be affected by this change and you need not take any action. You may elect to receive shareholder reports and other communications from the Fund electronically anytime by contacting your financial intermediary (such as a broker-dealer or bank) or, if you are a direct investor, by calling 1-800-225-1852 or by sending an e-mail request to PGIM Investments at shareholderreports@pgim.com.
Beginning on January 1, 2019, you may elect to receive all future reports in paper free of charge. If you invest through a financial intermediary, you can contact your financial intermediary or follow instructions included with this notice to elect to continue to receive paper copies of your shareholder reports. If you invest directly with the Fund, you can call 1-800-225-1852 or send an email request to shareholderreports@pgim.com to let the Fund know you wish to continue receiving paper copies of your shareholder reports. Your election to receive reports in paper will apply to all funds held in your account if you invest through your financial intermediary or all funds held with the fund complex if you invest directly with the Fund.

To enroll in e-delivery, go to pgiminvestments.com/edelivery
|
| Objective: To seek long-term growth of capital |
Highlights (unaudited)
| • | | US equity markets advanced over the period, while global growth was more mixed. |
| • | | In Europe, Brexit negotiations between the UK and EU remained contentious, compounding uncertainty about the final outcome. |
| • | | In China, a slowdown in the rate of economic expansion was amplified toward the end of the 12 months by trade discord. |
| • | | Turning to Fund specifics, information technology holdings, especially payment processors, were strong contributors to Fund outperformance. Other notable contributors were diversified across sectors. |
| • | | Having no exposure to the energy sector hurt the Fund’s results in the period, as did specific holdings in several different sectors. |
This report is not authorized for distribution to prospective investors unless preceded or accompanied by a current prospectus.
The views expressed in this report and information about the Fund’s portfolio holdings are for the period covered by this report and are subject to change thereafter.
Mutual funds are distributed by Prudential Investment Management Services LLC, member SIPC. Jennison Associates LLC is a registered investment adviser. Both are Prudential Financial companies. © 2018 Prudential Financial, Inc. and its related entities. Jennison Associates, Jennison, PGIM, and the PGIM logo are service marks of Prudential Financial, Inc. and its related entities, registered in many jurisdictions worldwide.
| | |
| 2 | | Visit our website at pgiminvestments.com |
PGIM FUNDS — UPDATE
The Board of Directors/Trustees for the Fund has approved the implementation of an automatic conversion feature for Class C shares, effective as of April 1, 2019. To reflect these changes, effective April 1, 2019, the section of the Fund’s Prospectus entitled “How to Buy, Sell and Exchange Fund Shares—How to Exchange Your Shares—Frequent Purchases and Redemptions of Fund Shares” is restated to read as follows:
This supplement should be read in conjunction with your Summary Prospectus, Statutory Prospectus and Statement of Additional Information, be retained for future reference and is in addition to any existing Fund supplements.
| | 1. | In each Fund’s Statutory Prospectus, the following is added at the end of the section entitled “Fund Distributions And Tax Issues—If You Sell or Exchange Your Shares”: |
Automatic Conversion of Class C Shares
The conversion of Class C shares into Class A shares—which happens automatically approximately 10 years after purchase—is not a taxable event for federal income tax purposes. For more information about the automatic conversion of Class C shares, see Class C Shares Automatically Convert to Class A Shares in How to Buy, Sell and Exchange Fund Shares.
| | 2. | In each Fund’s Statutory Prospectus, the following sentence is added at the end of the section entitled “How to Buy, Sell and Exchange Shares—Closure of Certain Share Classes to New Group Retirement Plans”: |
Shareholders owning Class C shares may continue to hold their Class C shares until the shares automatically convert to Class A shares under the conversion schedule, or until the shareholder redeems their Class C shares.
| | 3. | In each Fund’s Statutory Prospectus, the following disclosure is added immediately following the section entitled “How to Buy, Sell and Exchange Shares—How to Buy Shares—Class B Shares Automatically Convert to Class A Shares”: |
Class C Shares Automatically Convert to Class A Shares
Starting on or about April 1, 2019 (the “Effective Date”), Class C shares will be eligible for automatic conversion into Class A shares on a monthly basis approximately ten years after the original date of purchase (the “Conversion Date”). Conversion will take place based on the relative NAV of the two classes, without the imposition of any sales load, fee or other charge. All such automatic conversions of Class C shares will constitute tax-free exchanges for federal income tax purposes.
For shareholders investing in Class C shares through retirement plans or omnibus accounts, and in certain other instances, the Fund and its agents may not have
| | | | |
| PGIM Jennison International Opportunities Fund | | | 3 | |
transparency into how long a shareholder has held Class C shares for purposes of determining whether such Class C shares are eligible for automatic conversion into Class A shares, and the relevant financial intermediary may not have the ability to track purchases in order to credit individual shareholders’ holding periods. In these circumstances, the Fund will not be able to automatically convert Class C shares into Class A shares as described above. In order to determine eligibility for conversion in these circumstances, it is the responsibility of the financial intermediary to notify the Fund that the shareholder is eligible for the conversion of Class C shares to Class A shares, and the financial intermediary may be required to maintain and provide the Fund with records that substantiate the holding period of Class C shares. It is the financial intermediary’s (and not the Fund’s) responsibility to keep records of transactions made in accounts it holds and to ensure that the shareholder is credited with the proper holding period based on such records or those provided to the financial intermediary by the shareholder. Please consult with your financial intermediary for the applicability of this conversion feature to your shares.
A financial intermediary may sponsor and/or control accounts, programs or platforms that impose a different conversion schedule or different eligibility requirements for the exchange of Class C shares for Class A shares (see Appendix A: Waivers and Discounts Available From Certain Financial Intermediaries of the Prospectus). Please consult with your financial intermediary if you have any questions regarding your shares’ conversion from Class C shares to Class A shares.
| | 4. | In Part II of each Fund’s Statement of Additional Information, the following disclosure is added immediately following the section entitled “Purchase, Redemption and Pricing of Fund Shares—Share Classes—Automatic Conversion of Class B Shares”: |
AUTOMATIC CONVERSION OF CLASS C SHARES. Starting on or about April 1, 2019 (the “Effective Date”), Class C shares will be eligible for automatic conversion into Class A shares on a monthly basis approximately ten years after the original date of purchase (the “Conversion Date”). Conversion will take place based on the relative NAV of the two classes, without the imposition of any sales load, fee or other charge. Class C shares of a Fund acquired through automatic reinvestment of dividends or distributions will convert to Class A shares of the Fund on the Conversion Date pro rata with the converting Class C shares of the Fund that were not acquired through reinvestment of dividends or distributions. All such automatic conversions of Class C shares will constitute tax-free exchanges for federal income tax purposes.
For shareholders investing in Class C shares through retirement plans or omnibus accounts, and in certain other instances, the Fund and its agents may not have transparency into how long a shareholder has held Class C shares for purposes of determining whether such Class C shares are eligible for automatic conversion into Class A shares, and the relevant financial intermediary may not have the ability to track purchases in order to credit individual shareholders’ holding periods. In these circumstances, the
| | |
| 4 | | Visit our website at pgiminvestments.com |
Fund will not be able to automatically convert Class C shares into Class A shares as described above. In order to determine eligibility for conversion in these circumstances, it is the responsibility of the financial intermediary to notify the Fund that the shareholder is eligible for the conversion of Class C shares to Class A shares, and the financial intermediary may be required to maintain and provide the Fund with records that substantiate the holding period of Class C shares. It is the financial intermediary’s (and not the Fund’s) responsibility to keep records of transactions made in accounts it holds and to ensure that the shareholder is credited with the proper holding period based on such records or those provided to the financial intermediary by the shareholder. Please consult with your financial intermediary for the applicability of this conversion feature to your shares.
Class C shares were generally closed to investments by new group retirement plans effective June 1, 2018. Group retirement plans (and their successor, related and affiliated plans) that have Class C shares of the Fund available to participants on or before the Effective Date may continue to open accounts for new participants in such share class and purchase additional shares in existing participant accounts.
The Fund has no responsibility for monitoring or implementing a financial intermediary’s process for determining whether a shareholder meets the required holding period for conversion. A financial intermediary may sponsor and/or control accounts, programs or platforms that impose a different conversion schedule or different eligibility requirements for the exchange of Class C shares for Class A shares, as set forth on Appendix A: Waivers and Discounts Available From Certain Financial Intermediaries of the Prospectus. In these cases, Class C shareholders may have their shares exchanged for Class A shares under the policies of the financial intermediary. Financial intermediaries will be responsible for making such exchanges in those circumstances. Please consult with your financial intermediary if you have any questions regarding your shares’ conversion from Class C shares to Class A shares.
LR1094
- Not part of the Annual Report -
| | | | |
| PGIM Jennison International Opportunities Fund | | | 5 | |
Table of Contents
| | |
| 6 | | Visit our website at pgiminvestments.com |
Letter from the President

Dear Shareholder:
We hope you find the annual report for PGIM Jennison International Opportunities Fund informative and useful. The report covers performance for the 12-month period that ended October 31, 2018.
We have important information to share with you. Effective June 11, 2018, Prudential Mutual Funds were renamed PGIM Funds. This renaming is part of our ongoing effort to further build our reputation and establish our global brand, which began when our firm adopted PGIM Investments as its name in April 2017. Please note that only the Fund’s name has changed. Your Fund’s management and operation, along with its symbols, remained the same.*
During the reporting period, the global economy continued to grow, and central banks gradually tightened monetary policy. In the US, the economy expanded and employment increased. In September, the Federal Reserve hiked interest rates for the eighth time since 2015, based on confidence in the economy.
Equity returns on the whole were strong, due to optimistic earnings expectations and investor sentiment. Global equities, including emerging markets, generally posted positive returns. However, they trailed the performance of US equities, which rose on higher corporate profits, new regulatory policies, and tax reform benefits. Volatility spiked briefly early in the period on inflation concerns, rising interest rates, and a potential global trade war, and again late in the period on worries that profit growth might slow in 2019.
The overall bond market declined modestly during the period, as measured by the Bloomberg Barclays US Aggregate Bond Index. The best performance came from higher-yielding, economically sensitive sectors, such as high yield bonds and bank loans, which posted small gains. US investment-grade corporate bonds and US Treasury bonds both finished the period with negative returns. A major trend during the period was the flattening of the US Treasury yield curve, which increased the yield on fixed income investments with shorter maturities and made them more attractive to investors.
Regarding your investments with PGIM, we believe it is important to maintain a diversified portfolio of funds consistent with your tolerance for risk, time horizon, and financial goals. Your financial advisor can help you create a diversified investment plan that may include funds covering all the basic asset classes and that reflects your personal investor profile and risk tolerance. However, diversification and asset allocation strategies do not assure a profit or protect against loss in declining markets.
At PGIM Investments, we consider it a great privilege and responsibility to help investors participate in opportunities across global markets while meeting their toughest investment challenges. PGIM is a top-10 global investment manager with more than $1 trillion in assets under management. This investment expertise allows us to deliver actively managed funds and strategies to meet the needs of investors around the globe.
Thank you for choosing our family of funds.
Sincerely,

Stuart S. Parker, President
PGIM Jennison International Opportunities Fund
December 14, 2018
*The Prudential Day One Funds did not change their names.
| | | | |
| PGIM Jennison International Opportunities Fund | | | 7 | |
Your Fund’s Performance (unaudited)
Performance data quoted represents past performance. Past performance does not guarantee future results. The investment return and principal value of an investment will fluctuate, so that an investor’s shares, when redeemed, may be worth more or less than their original cost. Current performance may be lower or higher than the past performance data quoted. An investor may obtain performance data as of the most recent month-end by visiting our website at www.pgiminvestments.com or by calling (800) 225-1852.
| | | | | | | | | | | | |
| | | Average Annual Total Returns as of 10/31/18
(with sales charges) | |
| | | One Year (%) | | | Five Years (%) | | | Since Inception (%) | |
| Class A | | | –12.57 | | | | 2.78 | | | | 7.14 (6/5/12) | |
| Class C | | | –9.13 | | | | 3.18 | | | | 7.29 (6/5/12) | |
| Class R | | | N/A | | | | N/A | | | | –9.99* (11/20/17) | |
| Class Z | | | –7.24 | | | | 4.22 | | | | 8.37 (6/5/12) | |
| Class R6** | | | –7.21 | | | | N/A | | | | 7.04 (12/23/15) | |
| MSCI ACWI ex-US Index | |
| | | –8.24 | | | | 1.63 | | | | — | |
| Lipper International Multi-Cap Growth Funds Average | |
| | | | –8.33 | | | | 2.32 | | | | — | |
| | | | | | | | | | | | |
| | | Average Annual Total Returns as of 10/31/18
(without sales charges) | |
| | | One Year (%) | | | Five Years (%) | | | Since Inception (%) | |
| Class A | | | –7.49 | | | | 3.95 | | | | 8.09 (6/5/12) | |
| Class C | | | –8.22 | | | | 3.18 | | | | 7.29 (6/5/12) | |
| Class R | | | N/A | | | | N/A | | | | –9.99* (11/20/17) | |
| Class Z | | | –7.24 | | | | 4.22 | | | | 8.37 (6/5/12) | |
| Class R6** | | | –7.21 | | | | N/A | | | | 7.04 (12/23/15) | |
| MSCI ACWI ex-US Index | |
| | | –8.24 | | | | 1.63 | | | | — | |
| Lipper International Multi-Cap Growth Funds Average | |
| | | | –8.33 | | | | 2.32 | | | | — | |
| | |
| 8 | | Visit our website at pgiminvestments.com |
Growth of a $10,000 Investment (unaudited)
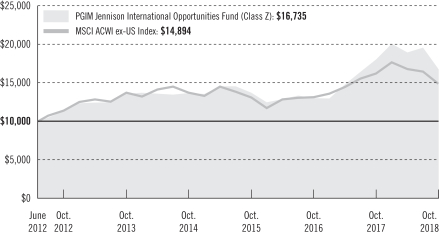
The graph compares a $10,000 investment in the Fund’s Class Z shares with a similar investment in the MSCI ACWI ex-US Index by portraying the initial account values at the commencement of operations for Class Z shares (June 5, 2012) and the account values at the end of the current fiscal year (October 31, 2018), as measured on a quarterly basis. For purposes of the graph, and unless otherwise indicated, it has been assumed that (a) all recurring fees (including management fees) were deducted; and (b) all dividends and distributions were reinvested. The line graph provides information for Class Z shares only. As indicated in the tables provided earlier, performance for other share classes will vary due to the differing charges and expenses applicable to each share class (as indicated in the following paragraphs). Without waiver of fees and/or expense reimbursements, if any, the Fund’s returns would have been lower.
Past performance does not predict future performance. Total returns and the ending account values in the graph include changes in share price and reinvestment of dividends and capital gains distributions in a hypothetical investment for the periods shown. The Fund’s total returns do not reflect the deduction of income taxes on an individual’s investment. Taxes may reduce your actual investment returns on income or gains paid by the Fund or any gains you may realize if you sell your shares.
Source: PGIM Investments LLC and Lipper Inc.
*Not Annualized
**Formerly known as Class Q shares.
Since Inception returns are provided since the Fund has less than 10 fiscal years of returns. Since Inception returns for the Index and the Lipper Average are measured from the closest month-end to each class’ inception date.
| | | | |
| PGIM Jennison International Opportunities Fund | | | 9 | |
Your Fund’s Performance (continued)
The returns in the tables do not reflect the deduction of taxes that a shareholder would pay on Fund distributions or following the redemption of Fund shares. The average annual total returns take into account applicable sales charges, which are described for each share class in the table below.
| | | | | | | | | | |
| | | Class A | | Class C | | Class R | | Class Z | | Class R6* |
| Maximum initial sales charge | | 5.50% of the public offering price | | None | | None | | None | | None |
Contingent deferred sales charge (CDSC)
(as a percentage of the lower of original purchase price or net asset value at redemption) | | 1.00% on sales of $1 million or more made within 12 months of purchase | | 1.00% on sales made within 12 months of purchase | | None | | None | | None |
Annual distribution and service (12b-1) fees
(shown as a percentage of average daily net assets) | | 0.30%
(0.25% currently) | | 1.00% | | 0.75%
(0.50% currently) | | None | | None |
* Formerly known as Class Q shares.
Benchmark Definitions
MSCI All Country World Index ex-US Index—The Morgan Stanley Capital International All Country World ex-US Index (MSCI ACWI ex-US Index) is an unmanaged free float-adjusted market capitalization-weighted index that is designed to provide a broad measure of stock performance throughout the world, with the exception of US-based companies. The average annual total returns for the MSCI ACWI ex-US Index measured from the month-end closest to the inception date of the Fund’s Class A, Class C, and Class Z shares are 6.41% and 6.12% for Class R6 shares. The cumulative total return for the MSCI ACWI ex-US Index measured from the month-end closest to the inception date of the Fund’s Class R shares is –8.98%.
Lipper International Multi-Cap Growth Funds Average—The Lipper International Multi-Cap Growth Funds Average (Lipper Average) is based on the average return of all funds in the Lipper International Multi-Cap Growth Funds universe for the periods noted. Funds in the Lipper Average, by portfolio practice, invest in a variety of market-capitalization ranges without concentrating 75% of their equity assets in any one market-capitalization range over an extended period of time. International multi-cap growth funds typically have above-average characteristics compared to the MSCI EAFE Index. The average annual total returns for the Lipper Average measured from the month-end closest to the inception date of the Fund’s Class A, Class C, and Class Z shares are 7.07% and 4.96% for Class R6 shares. The cumulative total return for the Lipper Average measured from the month-end closest to the inception date of the Fund’s Class R shares is –9.15%.
| | |
| 10 | | Visit our website at pgiminvestments.com |
Investors cannot invest directly in an index or average. The returns for the Index would be lower if they included the effects of sales charges, operating expenses of a mutual fund, or taxes. Returns for the Lipper Average reflect the deduction of operating expenses of a mutual fund, but not sales charges or taxes.
Presentation of Fund Holdings
| | | | |
Five Largest Holdings expressed as a
percentage of net assets as of 10/31/18 (%) | |
Alibaba Group Holding Ltd., Internet & Direct Marketing Retail | | | 6.5 | |
Wirecard AG, IT Services | | | 5.4 | |
Tencent Holdings Ltd., Interactive Media & Services | | | 5.3 | |
LVMH Moet Hennessy Louis Vuitton SE, Textiles, Apparel & Luxury Goods | | | 3.9 | |
L’Oreal SA, Personal Products | | | 3.9 | |
Holdings reflect only long-term investments and are subject to change.
| | | | |
Five Largest Industries expressed as a
percentage of net assets as of 10/31/18 (%) | |
Textiles, Apparel & Luxury Goods | | | 12.9 | |
IT Services | | | 11.3 | |
Internet & Direct Marketing Retail | | | 9.1 | |
Health Care Equipment & Supplies | | | 9.0 | |
Chemicals | | | 6.6 | |
Industry weightings reflect only long-term investments and are subject to change.
| | | | |
| PGIM Jennison International Opportunities Fund | | | 11 | |
Strategy and Performance Overview (unaudited)
How did the Fund perform?
The PGIM Jennison International Opportunities Fund’s Class Z shares returned -7.24% in the 12-month reporting period that ended October 31, 2018 outperforming the -8.24% return of the MSCI All Country World ex-US Index (the Index) and the -8.33% return of the Lipper International Multi-Cap Growth Funds Average.
What were the market conditions?
| • | | US equity markets advanced during the reporting period, extending gains that stretched back to the aftermath of the credit crisis of 2008. The macroeconomic backdrop was solid. Gross domestic product (GDP) grew at a healthy pace, employment gains were robust, corporate profit growth showed continued strength, and business and consumer confidence rose. In addition, corporations used lower tax rates to increase capital spending and repurchase shares. |
| • | | However, international equity markets produced mixed results. In Europe, Brexit negotiations between the United Kingdom (the UK) and European Union (EU) remained contentious, compounding uncertainty about the final outcome. |
| • | | An economic slowdown in China constricted prices of many commodities and fueled concerns over the ramifications for global growth. Tremors rippled widely across other emerging markets, where weaker sentiment and the effect of higher US interest rates on local US-dollar-denominated debt added to the toll. |
| • | | Continued moves by the Trump administration to reset global trade practices with new tariffs and penalties for intellectual property infringement also weighed on global equities. Initially, Chinese stocks suffered the brunt of the pain, while the US economy—which is dominated by the services sector—felt relatively little impact. However, the administration’s increasingly aggressive tone, growing uncertainty about the outcome of these disputes, and worries that corporate profit growth might slow in 2019 fueled volatility for US stocks in October. |
| • | | Among the Index’s sector components, health care and energy posted gains, while growth-oriented sectors like communication services, consumer discretionary, and information technology suffered the greatest losses. |
What worked?
Information technology holdings, especially payment processors, were strong contributors to the Fund’s performance.
| • | | Munich-based Wirecard AG is a leading electronic payment processor trading in more than 120 currencies with more than 15,000 corporate customers. The company’s largest customer segment is e-commerce retailers in Germany and the rest of Western Europe. Growth was strong throughout the reporting period, leading to strong earnings and better- |
| | |
| 12 | | Visit our website at pgiminvestments.com |
| | than-expected profit margins. Jennison believes the company is well-positioned through its online focus and rapidly expanding Asia/Pacific footprint. |
The Fund’s health care positions also performed well.
| • | | Sartorius AG, based in Germany, is a leading maker of bioprocess solutions (BPS)—innovative, single-use products and equipment for the biopharmaceuticals industry. It also has a high-quality lab products and services business, with a strong market position in precision weighing scales and a comprehensive product line in lab consumables. Jennison thinks Sartorius is well-positioned to benefit from an expected reacceleration of growth in the BPS industry. The stock advanced on strong earnings this reporting period, supporting Jennison’s secular growth thesis. |
In other sectors:
| • | | MercadoLibre, Inc. (MELI) is a Buenos Aires-based online trading service that enables individuals and businesses to electronically sell and buy items in thousands of categories. Jennison views positively MELI’s strong execution and enhanced marketplace initiatives, including integrated shipping and payment systems, as well as its exposure to Latin America’s expanding Internet penetration and low e-commerce share of the overall retail market. MELI’s second-quarter revenues were above expectations, despite disruption in Brazil due to a trucker strike. Jennison also saw good progress on various long-term initiatives in areas such as fulfillment and payments. |
| • | | Paris-based Kering SA, the world’s third-largest luxury goods operator, is best known for brands such as Gucci, Balenciaga, and Yves Saint Laurent. The stock was rewarded this period after the firm restructured its Gucci line, with efforts focused on improving store concept, training staff, and broadening the product portfolio. Jennison expects Kering’s positive earnings momentum to continue as the company increases its focus on organic growth, financial discipline, and free-cash-flow generation. |
| • | | Based in Switzerland, Givaudan SA is a global leader in flavors and fragrances, including beverage flavors, perfumes, and more. Jennison views positively the company’s reliable and stable business given the indispensable nature of the firm’s products and low production costs. At the same time, the company is expanding its footprint in faster-growing areas such as cosmetic active ingredients. |
What didn’t work?
Having no exposure to the energy sector hurt the Fund’s results in the period.
In consumer discretionary, a large overweight position more than offset the positive contribution from stock selection.
| | | | |
| PGIM Jennison International Opportunities Fund | | | 13 | |
Strategy and Performance Overview (continued)
| • | | JD.com, Inc. is China’s largest direct sales company, as measured by transaction volume, and also the country’s second-largest e-commerce business. The firm sells a number of products on its website, including books, electronics, office and school supplies, and home appliances. Jennison expects that competition and new investment initiatives will weigh on margins for the next several quarters, so the position was sold in September 2018. |
| • | | Shares of Alibaba Group, one of the world’s largest e-commerce firms, underperformed on macroeconomic uncertainties, some softness in China’s online retail market, and tariff concerns. In addition, the company increased its pace of investment spending to take advantage of new market opportunities in China, resulting in falling earnings estimates. Jennison believes Alibaba’s various business segments have the potential for durable, high revenue growth. The company’s new Taobao interface, which features a personalized recommendation feed, could meaningfully increase sales over the long term. While Jennison is closely monitoring economic conditions in China, it believes Alibaba’s structural growth remains very compelling. |
In materials:
| • | | Chemical maker Albemarle Corp. has the top global share and lowest cost structure in the lithium market. While concerns about aggressive lithium supply expansion weighed on market sentiment, Jennison thinks the company should benefit over the long term as electric vehicle battery applications and continued growth in consumer electronics drive lithium growth. |
In communication services:
| • | | Tencent Holdings Ltd. is the largest videogame publisher in the world by revenue, but is best known in China for its popular WeChat and QQ messaging and mobile payment apps. The company also offers services similar to Facebook, Twitter, and Netflix; a cloud service for businesses; a news service; and a payment and financial services business. Tencent shares declined during the period on regulatory and macroeconomic uncertainties. Still, Jennison anticipates the company’s accelerating earnings and revenue growth to resume, driven by its dominant market position in China’s online gaming and messaging segments, and its growing efforts in advertising and payment services. Jennison also anticipates that Tencent will overcome the regulatory roadblocks restricting its ability to monetize new games. |
One holding that somewhat offset strong sector performance in information technology:
| • | | Infineon Technologies AG, based in Germany, makes semiconductors. It operates in four segments: automotive, industrial power control, power management and multimarket, |
| | |
| 14 | | Visit our website at pgiminvestments.com |
| | and chip card and security. Jennison views positively the company’s automotive products and exposure to the electric vehicle and autonomous driving markets. The company enjoyed broad-based demand and strong order momentum but shares were hurt by automobile tariff concerns. |
Current outlook
| • | | Jennison remains focused on identifying businesses that can generate organic growth and that continue to offer secular growth opportunities. The strategy remains heavily invested in technology and consumer discretionary stocks that demonstrate these characteristics. Jennison will continue to carefully evaluate the fundamental outlooks of the Fund’s holdings and make adjustments as necessary as the overall global environment evolves. |
| • | | Overall, the Fund’s developed Europe holdings include global companies with unique business models that derive much, if not most, of their revenue outside of Europe. They are diversified across industries, with service-oriented companies, luxury goods, and specialty retail especially well-represented. |
| • | | In developed Asia, the Fund has exposure to Japanese companies that offer globally competitive products and improving shareholder transparency. |
| • | | The Fund’s emerging market (EM) exposure decreased, as Jennison exited positions in especially vulnerable economies and trimmed others. At period end, the Fund’s largest EM country exposure was China, as many other EM currencies faced pressure and the opportunity overall became less constructive. In this area, Jennison’s fundamental research is focused on the rapidly growing e-commerce and Internet platform opportunities, particularly in China. |
The percentage points shown in the tables below identify each security’s positive or negative contribution to the Fund’s return relative to the benchmark, which is the sum of all contributions by individual holdings.
| | | | | | |
| Top contributors (%) | | Top detractors (%) |
| Wirecard AG | | 2.16 | | Alibaba Group | | –1.54 |
| MercadoLibre, Inc. | | 1.08 | | Tencent, Inc. | | –1.18 |
| Sartorius AG | | 1.05 | | JD.com, Inc. | | –0.99 |
| Kering SA | | 0.77 | | Infineon Technologies AG | | –0.78 |
| Givaudan SA | | 0.28 | | Albemarle, Corp. | | –0.77 |
| | | | |
| PGIM Jennison International Opportunities Fund | | | 15 | |
Fees and Expenses (unaudited)
As a shareholder of the Fund, you incur two types of costs: (1) transaction costs, including sales charges (loads) on purchase payments and redemptions, as applicable, and (2) ongoing costs, including management fees, distribution, and/or service (12b-1) fees, and other Fund expenses, as applicable. This example is intended to help you understand your ongoing costs (in dollars) of investing in the Fund and to compare these costs with the ongoing costs of investing in other mutual funds.
The example is based on an investment of $1,000 held through the six-month period ended October 31, 2018. The example is for illustrative purposes only; you should consult the Prospectus for information on initial and subsequent minimum investment requirements.
Actual Expenses
The first line for each share class in the table on the following page provides information about actual account values and actual expenses. You may use the information on this line, together with the amount you invested, to estimate the expenses that you paid over the period. Simply divide your account value by $1,000 (for example, an $8,600 account value ÷ $1,000 = 8.6), then multiply the result by the number on the first line under the heading “Expenses Paid During the Six-Month Period” to estimate the expenses you paid on your account during this period.
Hypothetical Example for Comparison Purposes
The second line for each share class in the table on the following page provides information about hypothetical account values and hypothetical expenses based on the Fund’s actual expense ratio and an assumed rate of return of 5% per year before expenses, which is not the Fund’s actual return. The hypothetical account values and expenses may not be used to estimate the actual ending account balance or expenses you paid for the period. You may use this information to compare the ongoing costs of investing in the Fund and other funds. To do so, compare this 5% hypothetical example with the 5% hypothetical examples that appear in the shareholder reports of the other funds.
The Fund’s transfer agent may charge additional fees to holders of certain accounts that are not included in the expenses shown in the table on the following page. These fees apply to individual retirement accounts (IRAs) and Section 403(b) accounts. As of the close of the six-month period covered by the table, IRA fees included an annual maintenance fee of $15 per account (subject to a maximum annual maintenance fee of $25 for all accounts held by the same shareholder). Section 403(b) accounts are charged an annual $25 fiduciary maintenance fee. Some of the fees may vary in amount, or may be waived, based on your total account balance or the number of PGIM funds, including the Fund, that you own. You should consider the additional fees that were charged to your Fund account over the six-month period when you estimate the total ongoing expenses paid over the period
| | |
| 16 | | Visit our website at pgiminvestments.com |
and the impact of these fees on your ending account value, as these additional expenses are not reflected in the information provided in the expense table. Additional fees have the effect of reducing investment returns.
Please note that the expenses shown in the table are meant to highlight your ongoing costs only and do not reflect any transactional costs such as sales charges (loads). Therefore, the second line for each share class in the table is useful in comparing ongoing costs only and will not help you determine the relative total costs of owning different funds. In addition, if these transactional costs were included, your costs would have been higher.
| | | | | | | | | | | | | | | | | | |
PGIM
Jennison International
Opportunities Fund | | Beginning Account
Value
May 1, 2018 | | | Ending Account
Value
October 31, 2018 | | | Annualized
Expense Ratio
Based on the
Six-Month Period | | | Expenses Paid
During the
Six-Month Period* | |
| Class A | | Actual | | $ | 1,000.00 | | | $ | 882.30 | | | | 1.11 | % | | $ | 5.27 | |
| | Hypothetical | | $ | 1,000.00 | | | $ | 1,019.61 | | | | 1.11 | % | | $ | 5.65 | |
| Class C | | Actual | | $ | 1,000.00 | | | $ | 879.30 | | | | 1.93 | % | | $ | 9.14 | |
| | Hypothetical | | $ | 1,000.00 | | | $ | 1,015.48 | | | | 1.93 | % | | $ | 9.80 | |
| Class R | | Actual | | $ | 1,000.00 | | | $ | 881.10 | | | | 1.48 | % | | $ | 7.02 | |
| | Hypothetical | | $ | 1,000.00 | | | $ | 1,017.74 | | | | 1.48 | % | | $ | 7.53 | |
| Class Z | | Actual | | $ | 1,000.00 | | | $ | 883.60 | | | | 0.91 | % | | $ | 4.32 | |
| | Hypothetical | | $ | 1,000.00 | | | $ | 1,020.62 | | | | 0.91 | % | | $ | 4.63 | |
| Class R6** | | Actual | | $ | 1,000.00 | | | $ | 883.60 | | | | 0.84 | % | | $ | 3.99 | |
| | | Hypothetical | | $ | 1,000.00 | | | $ | 1,020.97 | | | | 0.84 | % | | $ | 4.28 | |
*Fund expenses (net of fee waivers or subsidies, if any) for each share class are equal to the annualized expense ratio for each share class (provided in the table), multiplied by the average account value over the period, multiplied by the 184 days in the six-month period ended October 31, 2018, and divided by the 365 days in the Fund’s fiscal year ended October 31, 2018 (to reflect the six-month period). Expenses presented in the table include the expenses of any underlying portfolios in which the Fund may invest.
**Formerly known as Class Q shares.
| | | | |
| PGIM Jennison International Opportunities Fund | | | 17 | |
Schedule of Investments
as of October 31, 2018
| | | | | | | | |
| Description | | Shares | | | Value | |
LONG-TERM INVESTMENTS 98.2% | | | | | | | | |
| | |
COMMON STOCKS 95.1% | | | | | | | | |
| | |
Argentina 1.4% | | | | | | | | |
MercadoLibre, Inc. | | | 18,002 | | | $ | 5,841,649 | |
| | |
Australia 2.3% | | | | | | | | |
Cochlear Ltd. | | | 78,312 | | | | 9,861,515 | |
| | |
Canada 2.7% | | | | | | | | |
Shopify, Inc. (Class A Stock)* | | | 82,806 | | | | 11,439,649 | |
| | |
China 13.2% | | | | | | | | |
Alibaba Group Holding Ltd., ADR*(a) | | | 194,770 | | | | 27,711,876 | |
Kweichow Moutai Co. Ltd. (Class A Stock) | | | 75,434 | | | | 5,960,220 | |
Tencent Holdings Ltd. | | | 648,645 | | | | 22,280,467 | |
| | | | | | | | |
| | | | | | | 55,952,563 | |
| | |
Denmark 2.4% | | | | | | | | |
Novozymes A/S (Class B Stock) | | | 204,888 | | | | 10,130,028 | |
| | |
France 20.6% | | | | | | | | |
Dassault Systemes SE | | | 120,241 | | | | 15,089,887 | |
Kering SA | | | 10,341 | | | | 4,608,223 | |
L’Oreal SA | | | 73,674 | | | | 16,593,763 | |
LVMH Moet Hennessy Louis Vuitton SE | | | 54,608 | | | | 16,628,345 | |
Pernod Ricard SA | | | 71,462 | | | | 10,934,458 | |
Remy Cointreau SA | | | 73,542 | | | | 8,738,755 | |
Safran SA | | | 112,599 | | | | 14,566,200 | |
| | | | | | | | |
| | | | | | | 87,159,631 | |
| | |
Germany 8.8% | | | | | | | | |
Fresenius SE & Co. KGaA | | | 153,814 | | | | 9,809,629 | |
Infineon Technologies AG | | | 221,260 | | | | 4,439,582 | |
Wirecard AG | | | 122,285 | | | | 22,987,728 | |
| | | | | | | | |
| | | | | | | 37,236,939 | |
| | |
Hong Kong 1.0% | | | | | | | | |
Techtronic Industries Co. Ltd. | | | 866,033 | | | | 4,084,852 | |
See Notes to Financial Statements.
| | | | |
| PGIM Jennison International Opportunities Fund | | | 19 | |
Schedule of Investments (continued)
as of October 31, 2018
| | | | | | | | |
| Description | | Shares | | | Value | |
COMMON STOCKS (Continued) | | | | | | | | |
| | |
India 5.0% | | | | | | | | |
HDFC Bank Ltd., ADR | | | 140,806 | | | $ | 12,519,062 | |
Maruti Suzuki India Ltd. | | | 96,564 | | | | 8,664,835 | |
| | | | | | | | |
| | | | | | | 21,183,897 | |
| | |
Italy 7.7% | | | | | | | | |
Brunello Cucinelli SpA | | | 356,044 | | | | 12,229,204 | |
Ferrari NV | | | 110,626 | | | | 12,975,996 | |
PRADA SpA | | | 2,131,565 | | | | 7,564,414 | |
| | | | | | | | |
| | | | | | | 32,769,614 | |
| | |
Japan 4.3% | | | | | | | | |
Keyence Corp. | | | 29,093 | | | | 14,371,517 | |
Kose Corp. | | | 26,580 | | | | 3,962,996 | |
| | | | | | | | |
| | | | | | | 18,334,513 | |
| | |
Netherlands 5.0% | | | | | | | | |
Adyen NV, 144A* | | | 20,720 | | | | 13,428,080 | |
ASML Holding NV | | | 44,769 | | | | 7,663,264 | |
| | | | | | | | |
| | | | | | | 21,091,344 | |
| | |
Sweden 1.6% | | | | | | | | |
Hexagon AB (Class B Stock) | | | 141,910 | | | | 6,918,208 | |
| | |
Switzerland 6.8% | | | | | | | | |
Givaudan SA | | | 5,648 | | | | 13,716,658 | |
Straumann Holding AG | | | 22,186 | | | | 15,136,565 | |
| | | | | | | | |
| | | | | | | 28,853,223 | |
| | |
United Kingdom 8.1% | | | | | | | | |
Ashtead Group PLC | | | 351,029 | | | | 8,702,379 | |
ASOS PLC* | | | 71,298 | | | | 4,976,915 | |
AstraZeneca PLC | | | 163,943 | | | | 12,536,264 | |
St. James’s Place PLC | | | 637,059 | | | | 8,257,346 | |
| | | | | | | | |
| | | | | | | 34,472,904 | |
See Notes to Financial Statements.
| | | | | | | | |
| Description | | Shares | | | Value | |
COMMON STOCKS (Continued) | | | | | | | | |
| | |
United States 4.2% | | | | | | | | |
Albemarle Corp. | | | 44,199 | | | $ | 4,385,425 | |
Lululemon Athletica, Inc.* | | | 95,596 | | | | 13,453,225 | |
| | | | | | | | |
| | | | | | | 17,838,650 | |
| | | | | | | | |
TOTAL COMMON STOCKS
(cost $411,613,732) | | | | | | | 403,169,179 | |
| | | | | | | | |
| | |
PREFERRED STOCK 3.1% | | | | | | | | |
| | |
Germany | | | | | | | | |
Sartorius AG (PRFC)
(cost $9,092,169) | | | 89,343 | | | | 12,956,802 | |
| | | | | | | | |
TOTAL LONG-TERM INVESTMENTS
(cost $420,705,901) | | | | | | | 416,125,981 | |
| | | | | | | | |
| | |
SHORT-TERM INVESTMENTS 9.9% | | | | | | | | |
| | |
AFFILIATED MUTUAL FUNDS | | | | | | | | |
PGIM Core Ultra Short Bond Fund(w) | | | 16,359,986 | | | | 16,359,986 | |
PGIM Institutional Money Market Fund
(cost $25,776,149; includes $25,725,640 of cash collateral for securities on loan)(b)(w) | | | 25,773,727 | | | | 25,773,727 | |
| | | | | | | | |
TOTAL SHORT-TERM INVESTMENTS
(cost $42,136,135) | | | | | | | 42,133,713 | |
| | | | | | | | |
TOTAL INVESTMENTS 108.1%
(cost $462,842,036) | | | | | | | 458,259,694 | |
Liabilities in excess of other assets (8.1)% | | | | | | | (34,416,628 | ) |
| | | | | | | | |
NET ASSETS 100.0% | | | | | | $ | 423,843,066 | |
| | | | | | | | |
The following abbreviations are used in the annual report:
144A—Security was purchased pursuant to Rule 144A under the Securities Act of 1933 and may not be resold subject to that rule except to qualified institutional buyers. Unless otherwise noted, 144A securities are deemed to be liquid.
ADR—American Depositary Receipt
LIBOR—London Interbank Offered Rate
PRFC—Preference Shares
| * | Non-income producing security. |
| (a) | All or a portion of security is on loan. The aggregate market value of such securities, including those sold and pending settlement, is $26,321,800; cash collateral of $25,725,640 (included in liabilities) was received with which the Series purchased highly liquid short-term investments. |
| (b) | Represents security purchased with cash collateral received for securities on loan and includes dividend reinvestment. |
See Notes to Financial Statements.
| | | | |
| PGIM Jennison International Opportunities Fund | | | 21 | |
Schedule of Investments (continued)
as of October 31, 2018
| (w) | PGIM Investments LLC, the manager of the Series, also serves as manager of the PGIM Core Ultra Short Bond Fund and PGIM Institutional Money Market Fund. |
Fair Value Measurements:
Various inputs are used in determining the value of the Series’ investments. These inputs are summarized in the three broad levels listed below.
Level 1—unadjusted quoted prices generally in active markets for identical securities.
Level 2—quoted prices for similar securities, interest rates and yield curves, prepayment speeds, foreign currency exchange rates and other observable inputs.
Level 3—unobservable inputs for securities valued in accordance with Board approved fair valuation procedures.
The following is a summary of the inputs used as of October 31, 2018 in valuing such portfolio securities:
| | | | | | | | | | | | |
| | | Level 1 | | | Level 2 | | | Level 3 | |
Investments in Securities | | | | | | | | | | | | |
Common Stocks | | | | | | | | | | | | |
Argentina | | $ | 5,841,649 | | | $ | — | | | $ | — | |
Australia | | | — | | | | 9,861,515 | | | | — | |
Canada | | | 11,439,649 | | | | — | | | | — | |
China | | | 27,711,876 | | | | 28,240,687 | | | | — | |
Denmark | | | — | | | | 10,130,028 | | | | — | |
France | | | — | | | | 87,159,631 | | | | — | |
Germany | | | — | | | | 37,236,939 | | | | — | |
Hong Kong | | | — | | | | 4,084,852 | | | | — | |
India | | | 12,519,062 | | | | 8,664,835 | | | | — | |
Italy | | | — | | | | 32,769,614 | | | | — | |
Japan | | | — | | | | 18,334,513 | | | | — | |
Netherlands | | | — | | | | 21,091,344 | | | | — | |
Sweden | | | — | | | | 6,918,208 | | | | — | |
Switzerland | | | — | | | | 28,853,223 | | | | — | |
United Kingdom | | | — | | | | 34,472,904 | | | | — | |
United States | | | 17,838,650 | | | | — | | | | — | |
Preferred Stock | | | | | | | | | | | | |
Germany | | | — | | | | 12,956,802 | | | | — | |
Affiliated Mutual Funds | | | 42,133,713 | | | | — | | | | — | |
| | | | | | | | | | | | |
Total | | $ | 117,484,599 | | | $ | 340,775,095 | | | $ | — | |
| | | | | | | | | | | | |
Industry Classification:
The industry classification of investments and liabilities in excess of other assets shown as a percentage of net assets as of October 31, 2018 were as follows (unaudited):
| | | | |
Textiles, Apparel & Luxury Goods | | | 12.9 | % |
IT Services | | | 11.3 | |
Affiliated Mutual Funds (6.1% represents investments purchased with collateral from securities on loan) | | | 9.9 | |
| | | | |
Internet & Direct Marketing Retail | | | 9.1 | % |
Health Care Equipment & Supplies | | | 9.0 | |
Chemicals | | | 6.6 | |
Beverages | | | 6.1 | |
Interactive Media & Services | | | 5.3 | |
See Notes to Financial Statements.
| | | | |
Industry Classification (cont’d.) | | | |
Automobiles | | | 5.0 | % |
Electronic Equipment, Instruments & Components | | | 5.0 | |
Personal Products | | | 4.8 | |
Software | | | 3.6 | |
Aerospace & Defense | | | 3.4 | |
Pharmaceuticals | | | 3.0 | |
Banks | | | 3.0 | |
Semiconductors & Semiconductor Equipment | | | 2.9 | |
Health Care Providers & Services | | | 2.3 | |
| | | | |
Trading Companies & Distributors | | | 2.0 | % |
Capital Markets | | | 1.9 | |
Household Durables | | | 1.0 | |
| | | | |
| | | 108.1 | |
Liabilities in excess of other assets | | | (8.1 | ) |
| | | | |
| | | 100.0 | % |
| | | | |
Financial Instruments/Transactions—Summary of Offsetting and Netting Arrangements:
The Series entered into financial instruments/transactions during the reporting period that are either offset in accordance with current requirements or are subject to enforceable master netting arrangements or similar agreements that permit offsetting. The information about offsetting and related netting arrangements for financial instruments/transactions, where the legal right to set-off exists, is presented in the summary below.
Offsetting of financial instrument/transaction assets and liabilities:
| | | | | | | | | | | | |
Description | | Gross
Market
Value of
Recognized
Assets/
(Liabilities) | | | Collateral
Pledged/
(Received)(1) | | | Net Amount | |
Securities on Loan | | $ | 26,321,800 | | | $ | (25,725,640 | ) | | $ | 596,160 | |
| | | | | | | | | | | | |
| (1) | Collateral amount disclosed by the Series is limited to the market value of financial instruments/transactions. |
See Notes to Financial Statements.
| | | | |
| PGIM Jennison International Opportunities Fund | | | 23 | |
Statement of Assets & Liabilities
as of October 31, 2018
| | | | |
Assets | | | | |
Investments at value, including securities on loan of $26,321,800: | | | | |
Unaffiliated investments (cost $420,705,901) | | $ | 416,125,981 | |
Affiliated investments (cost $42,136,135) | | | 42,133,713 | |
Foreign currency, at value (cost $276,001) | | | 275,955 | |
Tax reclaim receivable | | | 1,896,446 | |
Receivable for Series shares sold | | | 1,451,904 | |
Dividends and interest receivable | | | 229,896 | |
Receivable for investments sold | | | 4,877 | |
Prepaid expenses | | | 3,615 | |
| | | | |
Total Assets | | | 462,122,387 | |
| | | | |
| |
Liabilities | | | | |
Payable to broker for collateral for securities on loan | | | 25,725,640 | |
Payable for investments purchased | | | 11,432,805 | |
Payable for Series shares reacquired | | | 608,581 | |
Management fee payable | | | 190,667 | |
Accrued expenses and other liabilities | | | 126,782 | |
Distribution fee payable | | | 125,409 | |
Affiliated transfer agent fee payable | | | 69,437 | |
| | | | |
Total Liabilities | | | 38,279,321 | |
| | | | |
| |
Net Assets | | $ | 423,843,066 | |
| | | | |
| | | | | |
Net assets were comprised of: | | | | |
Common stock, at par | | $ | 266,545 | |
Paid-in capital in excess of par | | | 444,610,890 | |
Total distributable earnings (loss) | | | (21,034,369 | ) |
| | | | |
Net assets, October 31, 2018 | | $ | 423,843,066 | |
| | | | |
See Notes to Financial Statements.
| | | | |
Class A | | | | |
Net asset value and redemption price per share,
($14,495,553 ÷ 916,013 shares of common stock issued and outstanding) | | $ | 15.82 | |
Maximum sales charge (5.50% of offering price) | | | 0.92 | |
| | | | |
Maximum offering price to public | | $ | 16.74 | |
| | | | |
| |
Class C | | | | |
Net asset value, offering price and redemption price per share,
($3,799,507 ÷ 251,984 shares of common stock issued and outstanding) | | $ | 15.08 | |
| | | | |
| |
Class R | | | | |
Net asset value, offering price and redemption price per share,
($266,294,101 ÷ 16,791,253 shares of common stock issued and outstanding) | | $ | 15.86 | |
| | | | |
| |
Class Z | | | | |
Net asset value, offering price and redemption price per share,
($104,113,182 ÷ 6,501,955 shares of common stock issued and outstanding) | | $ | 16.01 | |
| | | | |
| |
Class R6 | | | | |
Net asset value, offering price and redemption price per share,
($35,140,723 ÷ 2,193,246 shares of common stock issued and outstanding) | | $ | 16.02 | |
| | | | |
See Notes to Financial Statements.
| | | | |
| PGIM Jennison International Opportunities Fund | | | 25 | |
Statement of Operations
Year Ended October 31, 2018
| | | | |
Net Investment Income (Loss) | | | | |
Income | | | | |
Unaffiliated dividend income (net of $1,030,456 foreign withholding tax) | | $ | 3,292,331 | |
Affiliated dividend income | | | 186,166 | |
Income from securities lending, net (including affiliated income of $52,374) | | | 99,116 | |
| | | | |
Total income | | | 3,577,613 | |
| | | | |
| |
Expenses | | | | |
Management fee | | | 3,298,407 | |
Distribution fee(a) | | | 2,192,053 | |
Transfer agent’s fees and expenses (including affiliated expense of $342,771)(a) | | | 437,178 | |
Custodian and accounting fees | | | 204,904 | |
Registration fees(a) | | | 91,829 | |
Shareholders’ reports | | | 58,440 | |
Audit fee | | | 33,099 | |
Legal fees and expenses | | | 22,564 | |
Directors’ fees | | | 14,861 | |
Miscellaneous | | | 60,928 | |
| | | | |
Total expenses | | | 6,414,263 | |
Less: Fee waiver and/or expense reimbursement(a) | | | (466,140 | ) |
Distribution fee waiver(a) | | | (713,993 | ) |
| | | | |
Net expenses | | | 5,234,130 | |
| | | | |
Net investment income (loss) | | | (1,656,517 | ) |
| | | | |
| |
Realized And Unrealized Gain (Loss) On Investment And Foreign Currency Transactions | | | | |
Net realized gain (loss) on: | | | | |
Investment transactions (including affiliated of $(2,101)) | | | (6,270,070 | ) |
Foreign currency transactions | | | (126,992 | ) |
| | | | |
| | | (6,397,062 | ) |
| | | | |
Net change in unrealized appreciation (depreciation) on: | | | | |
Investments (including affiliated of $(2,422)) | | | (30,840,968 | ) |
Foreign currencies | | | (66,672 | ) |
| | | | |
| | | (30,907,640 | ) |
| | | | |
Net gain (loss) on investment and foreign currency transactions | | | (37,304,702 | ) |
| | | | |
Net Increase (Decrease) In Net Assets Resulting From Operations | | $ | (38,961,219 | ) |
| | | | |
| (a) | Class specific expenses and waivers were as follows: |
| | | | | | | | | | | | | | | | | | | | |
| | | Class A | | | Class C | | | Class R | | | Class Z | | | Class R6 | |
Distribution fee | | | 31,180 | | | | 34,486 | | | | 2,126,387 | | | | — | | | | — | |
Transfer agent’s fees and expenses | | | 15,809 | | | | 4,356 | | | | 355,990 | | | | 60,871 | | | | 152 | |
Registration fees | | | 15,986 | | | | 16,182 | | | | 25,980 | | | | 19,191 | | | | 14,490 | |
Fee waiver and/or expense reimbursement | | | (38,173 | ) | | | (21,230 | ) | | | (249,962 | ) | | | (113,209 | ) | | | (43,566 | ) |
Distribution fee waiver | | | (5,197 | ) | | | — | | | | (708,796 | ) | | | — | | | | — | |
See Notes to Financial Statements.
Statements of Changes in Net Assets
| | | | | | | | |
| | | Year Ended October 31, | |
| | | 2018 | | | 2017 | |
Increase (Decrease) in Net Assets | | | | | | | | |
Operations | | | | | | | | |
Net investment income (loss) | | $ | (1,656,517 | ) | | $ | 110,477 | |
Net realized gain (loss) on investment and foreign currency transactions | | | (6,397,062 | ) | | | 2,352,828 | |
Net change in unrealized appreciation (depreciation) on investments and foreign currencies | | | (30,907,640 | ) | | | 14,853,126 | |
| | | | | | | | |
Net increase (decrease) in net assets resulting from operations | | | (38,961,219 | ) | | | 17,316,431 | |
| | | | | | | | |
| | |
Dividends and Distributions | | | | | | | | |
Distributions from distributable earnings* | | | | | | | | |
Class Z | | | (54,385 | ) | | | — | |
Class R6 | | | (54,898 | ) | | | — | |
| | | | | | | | |
| | | (109,283 | ) | | | — | |
| | | | | | | | |
Dividends from net investment income | | | | | | | | |
Class Z | | | | | | | (41,518 | ) |
Class R6 | | | | | | | (71,620 | ) |
| | | | | | | | |
| | | * | | | | (113,138 | ) |
| | | | | | | | |
| | |
Series share transactions (Net of share conversions) | | | | | | | | |
Net proceeds from shares sold | | | 140,754,250 | | | | 11,624,932 | |
Net asset value of shares issued in reinvestment of dividends and distributions | | | 109,173 | | | | 113,138 | |
Net asset value of shares issued in merger | | | 372,771,258 | | | | — | |
Cost of shares reacquired | | | (112,646,693 | ) | | | (12,451,939 | ) |
| | | | | | | | |
Net increase (decrease) in net assets from Series share transactions | | | 400,987,988 | | | | (713,869 | ) |
| | | | | | | | |
Total increase (decrease) | | | 361,917,486 | | | | 16,489,424 | |
| | |
Net Assets: | | | | | | | | |
Beginning of year | | | 61,925,580 | | | | 45,436,156 | |
| | | | | | | | |
End of year(a) | | $ | 423,843,066 | | | $ | 61,925,580 | |
| | | | | | | | |
(a) Includes undistributed/(distributions in excess of) net investment income of: | | $ | * | | | $ | 104,056 | |
| | | | | | | | |
| * | For the year ended October 31, 2018, the Series has adopted amendments to Regulation S-X (refer to Note 9). |
See Notes to Financial Statements.
| | | | |
| PGIM Jennison International Opportunities Fund | | | 27 | |
Notes to Financial Statements
Prudential World Fund, Inc. (the “Fund”) is registered under the Investment Company Act of 1940, as amended (“1940 Act”), as an open-end management investment company and currently consists of seven series: PGIM Jennison Emerging Markets Equity Opportunities Fund (formerly known as Prudential Jennison Emerging Markets Equity Fund), PGIM Jennison Global Opportunities Fund, PGIM Jennison International Opportunities Fund and PGIM QMA International Equity Fund, each of which are diversified funds and PGIM Jennison Global Infrastructure Fund, PGIM Emerging Markets Debt Hard Currency Fund and PGIM Emerging Markets Debt Local Currency Fund, each of which are non-diversified funds for purposes of the 1940 Act and may invest a greater percentage of their assets in the securities of a single company or other issuer than a diversified fund. Investing in a non-diversified fund involves greater risk than investing in a diversified fund because a loss resulting from the decline in value of any one security may represent a greater portion of the total assets of a non-diversified fund. These financial statements relate only to the PGIM Jennison International Opportunities Fund (the “Series”). Effective June 11, 2018, the names of the Series and the other series which comprise the Fund were changed by replacing “Prudential” with “PGIM” and each series’ Class Q shares were renamed Class R6 shares.
The investment objective of the Series is to seek long-term growth of capital.
1. Accounting Policies
The Series follows the investment company accounting and reporting guidance of the Financial Accounting Standards Board (“FASB”) Accounting Standard Codification (“ASC”) Topic 946 Financial Services—Investment Companies. The following accounting policies conform to U.S. generally accepted accounting principles. The Series consistently follows such policies in the preparation of its financial statements.
Securities Valuation: The Series holds securities and other assets and liabilities that are fair valued at the close of each day (generally, 4:00 PM Eastern time) the New York Stock Exchange (“NYSE”) is open for trading. Fair value is the price that would be received to sell an asset or paid to transfer a liability in an orderly transaction between market participants on the measurement date. The Fund’s Board of Directors (the “Board”) has adopted valuation procedures for security valuation under which fair valuation responsibilities have been delegated to PGIM Investments LLC (“PGIM Investments” or the “Manager”). Pursuant to the Board’s delegation, a Valuation Committee has been established as two persons, being one or more officers of the Fund, including: the Fund’s Treasurer (or the Treasurer’s direct reports); and the Fund’s Chief or Deputy Chief Compliance Officer (or Vice-President-level direct reports of the Chief or Deputy Chief Compliance Officer). Under the current valuation procedures, the Valuation Committee of the Board is responsible for supervising the valuation of portfolio securities and other assets and liabilities. The valuation
procedures permit the Series to utilize independent pricing vendor services, quotations from market makers, and alternative valuation methods when market quotations are either not readily available or not deemed representative of fair value. A record of the Valuation Committee’s actions is subject to the Board’s review, approval, and ratification at its next regularly scheduled quarterly meeting.
For the fiscal reporting period-end, securities and other assets and liabilities were fair valued at the close of the last U.S. business day. Trading in certain foreign securities may occur when the NYSE is closed (including weekends and holidays). Because such foreign securities trade in markets that are open on weekends and U.S. holidays, the values of some of the Series’ foreign investments may change on days when investors cannot purchase or redeem Series shares.
Various inputs determine how the Series’ investments are valued, all of which are categorized according to the three broad levels (Level 1, 2, or 3) detailed in the Schedule of Investments and referred to herein as the “fair value hierarchy” in accordance with FASB ASC Topic 820—Fair Value Measurements and Disclosures.
Common and preferred stocks, exchange-traded funds, and derivative instruments, such as futures or options, that are traded on a national securities exchange are valued at the last sale price as of the close of trading on the applicable exchange where the security principally trades. Securities traded via NASDAQ are valued at the NASDAQ official closing price. To the extent these securities are valued at the last sale price or NASDAQ official closing price, they are classified as Level 1 in the fair value hierarchy. In the event that no sale or official closing price on valuation date exists, these securities are generally valued at the mean between the last reported bid and ask prices, or at the last bid price in the absence of an ask price. These securities are classified as Level 2 in the fair value hierarchy.
Foreign equities traded on foreign securities exchanges are generally valued using pricing vendor services that provide model prices derived using adjustment factors based on information such as local closing price, relevant general and sector indices, currency fluctuations, depositary receipts, and futures, as applicable. Securities valued using such model prices are classified as Level 2 in the fair value hierarchy. The models generate an evaluated adjustment factor for each security, which is applied to the local closing price to adjust it for post closing market movements up to the time the Series is valued. Utilizing that evaluated adjustment factor, the vendor provides an evaluated price for each security. If the vendor does not provide an evaluated price, securities are valued in accordance with exchange-traded common and preferred stock valuation policies discussed above.
Investments in open-end, non-exchange-traded mutual funds are valued at their net asset values as of the close of the NYSE on the date of valuation. These securities are classified as Level 1 in the fair value hierarchy since they may be purchased or sold at their net asset values on the date of valuation.
| | | | |
| PGIM Jennison International Opportunities Fund | | | 29 | |
Notes to Financial Statements (continued)
Securities and other assets that cannot be priced according to the methods described above are valued based on pricing methodologies approved by the Board. In the event that unobservable inputs are used when determining such valuations, the securities will be classified as Level 3 in the fair value hierarchy.
When determining the fair value of securities, some of the factors influencing the valuation include: the nature of any restrictions on disposition of the securities; assessment of the general liquidity of the securities; the issuer’s financial condition and the markets in which it does business; the cost of the investment; the size of the holding and the capitalization of the issuer; the prices of any recent transactions or bids/offers for such securities or any comparable securities; any available analyst media or other reports or information deemed reliable by the Manager regarding the issuer or the markets or industry in which it operates. Using fair value to price securities may result in a value that is different from a security’s most recent closing price and from the price used by other unaffiliated mutual funds to calculate their net asset values.
Restricted and Illiquid Securities: Subject to guidelines adopted by the Board, the Series may invest up to 15% of its net assets in illiquid securities, including those which are restricted as to disposition under securities law (“restricted securities”). Restricted securities are valued pursuant to the valuation procedures noted above. Illiquid securities are those that, because of the absence of a readily available market or due to legal or contractual restrictions on resale, cannot be sold within seven days in the ordinary course of business at approximately the amount at which the Series has valued the investment. Therefore, the Series may find it difficult to sell illiquid securities at the time considered most advantageous by its subadviser and may incur transaction costs that would not be incurred in the sale of securities that were freely marketable. Certain securities that would otherwise be considered illiquid because of legal restrictions on resale to the general public may be traded among qualified institutional buyers under Rule 144A of the Securities Act of 1933. These Rule 144A securities, as well as commercial paper that is sold in private placements under Section 4(2) of the Securities Act, may be deemed liquid by the Series’ subadviser under the guidelines adopted by the Board of the Fund. However, the liquidity of the Series’ investments in Rule 144A securities could be impaired if trading does not develop or declines.
Foreign Currency Translation: The books and records of the Series are maintained in U.S. dollars. Foreign currency amounts are translated into U.S. dollars on the following basis:
(i) market value of investment securities, other assets and liabilities—at the current rates of exchange;
(ii) purchases and sales of investment securities, income and expenses—at the rates of exchange prevailing on the respective dates of such transactions.
Although the net assets of the Series are presented at the foreign exchange rates and market values at the close of the period, the Series does not generally isolate that portion of the results of operations arising as a result of changes in the foreign exchange rates from the fluctuations arising from changes in the market prices of long-term portfolio securities held at the end of the period. Similarly, the Series does not isolate the effect of changes in foreign exchange rates from the fluctuations arising from changes in the market prices of long-term portfolio securities sold during the period. Accordingly, holding period realized foreign currency gains (losses) are included in the reported net realized gains (losses) on investment transactions.
Net realized gains (losses) on foreign currency transactions represent net foreign exchange gains (losses) from the disposition of holdings of foreign currencies, currency gains (losses) realized between the trade and settlement dates on securities transactions, and the difference between the amounts of interest, dividends and foreign withholding taxes recorded on the Series’ books and the U.S. dollar equivalent amounts actually received or paid. Net unrealized currency gains (losses) arise from valuing foreign currency denominated assets and liabilities (other than investments) at period end exchange rates.
Master Netting Arrangements: The Fund, on behalf of the Series, is subject to various Master Agreements, or netting arrangements, with select counterparties. These are agreements which a subadviser may have negotiated and entered into on behalf of the Series. A master netting arrangement between the Series and the counterparty permits the Series to offset amounts payable by the Series to the same counterparty against amounts to be received; and by the receipt of collateral from the counterparty by the Series to cover the Series’ exposure to the counterparty. However, there is no assurance that such mitigating factors are easily enforceable. In addition to master netting arrangements, the right to set-off exists when all the conditions are met such that each of the parties owes the other determinable amounts, the reporting party has the right to set-off the amount owed with the amount owed by the other party, the reporting party intends to set-off and the right of set-off is enforceable by law. During the reporting period, there was no intention to settle on a net basis and all amounts are presented on a gross basis on the Statement of Assets and Liabilities.
Securities Lending: The Series lends its portfolio securities to banks and broker-dealers. The loans are secured by collateral at least equal to the market value of the securities loaned. Collateral pledged by each borrower is invested in an affiliated money market fund and is marked to market daily, based on the previous day’s market value, such that the value of the collateral exceeds the value of the loaned securities. In the event of significant appreciation in value of securities on loan on the last business day of the reporting period, the financial statements may reflect a collateral value that is less than the market value of the loaned securities. Such shortfall is remedied as described above. Loans are subject to termination at the option of the borrower or the Series. Upon termination of the loan, the borrower will
| | | | |
| PGIM Jennison International Opportunities Fund | | | 31 | |
Notes to Financial Statements (continued)
return to the Series securities identical to the loaned securities. Should the borrower of the securities fail financially, the Series has the right to repurchase the securities in the open market using the collateral.
The Series recognizes income, net of any rebate and securities lending agent fees, for lending its securities in the form of fees or interest on the investment of any cash received as collateral. The borrower receives all interest and dividends from the securities loaned and such payments are passed back to the lender in amounts equivalent thereto. The Series also continues to recognize any unrealized gain (loss) in the market price of the securities loaned and on the change in the value of the collateral invested that may occur during the term of the loan. In addition, realized gain (loss) is recognized on changes in the value of the collateral invested upon liquidation of the collateral. Net earnings from securities lending are disclosed on the Statement of Operations as “Income from securities lending, net”.
Securities Transactions and Net Investment Income: Securities transactions are recorded on the trade date. Realized gains (losses) from investment and currency transactions are calculated on the specific identification method. Dividend income is recorded on the ex-date. Expenses are recorded on an accrual basis, which may require the use of certain estimates by management that may differ from actual. Net investment income or loss (other than class specific expenses and waivers, which are allocated as noted below) and unrealized and realized gains (losses) are allocated daily to each class of shares based upon the relative proportion of adjusted net assets of each class at the beginning of the day. Class specific expenses and waivers, where applicable, are charged to the respective share classes. Class specific expenses include distribution fees and distribution fee waivers, shareholder servicing fees, transfer agent’s fees and expenses, registration fees and fee waivers and/or expense reimbursements, as applicable.
Taxes: It is the Series’ policy to continue to meet the requirements of the Internal Revenue Code applicable to regulated investment companies and to distribute all of its taxable net investment income and capital gains, if any, to its shareholders. Therefore, no federal income tax provision is required. Withholding taxes on foreign dividends, interest and capital gains, if any, are recorded, net of reclaimable amounts, at the time the related income is earned.
Dividends and Distributions: The Series expects to pay dividends from net investment income and distributions from net realized capital and currency gains, if any, annually. Dividends and distributions to shareholders, which are determined in accordance with federal income tax regulations and which may differ from generally accepted accounting principles, are recorded on the ex-date. Permanent book/tax differences relating to income and gain (loss) are reclassified amongst total distributable earnings (loss) and paid-in capital in excess of par, as appropriate.
Estimates: The preparation of financial statements requires management to make estimates and assumptions that affect the reported amounts and disclosures in the financial statements. Actual results could differ from those estimates.
2. Agreements
The Fund, on behalf of the Series, has a management agreement with PGIM Investments. Pursuant to this agreement, PGIM Investments has responsibility for all investment advisory services and supervises the subadviser’s performance of such services. In addition, under the management agreement, PGIM Investments provides all of the administrative functions necessary for the organization, operation and management of the Series. PGIM Investments administers the corporate affairs of the Series and, in connection therewith, furnishes the Series with office facilities, together with those ordinary clerical and bookkeeping services which are not being furnished by the Series’ custodian and the Series’ transfer agent. PGIM Investments is also responsible for the staffing and management of dedicated groups of legal, marketing, compliance and related personnel necessary for the operation of the Series. The legal, marketing, compliance and related personnel are also responsible for the management and oversight of the various service providers to the Series, including, but not limited to, the custodian, transfer agent, and accounting agent.
PGIM Investments has entered into a subadvisory agreement with Jennison Associates LLC (“Jennison”). The subadvisory agreement provides that Jennison will furnish investment advisory services in connection with the management of the Series. In connection therewith, Jennison is obligated to keep certain books and records of the Series. PGIM Investments pays for the services of Jennison, the cost of compensation of officers of the Series, occupancy and certain clerical and bookkeeping costs of the Series. The Series bears all other costs and expenses.
The management fee paid to PGIM Investments is accrued daily and payable monthly at an annual rate of 0.825% of the Series’ average daily net assets up to and including $1 billion and 0.800% of such assets in excess of $1 billion. The effective management fee rate before any waivers and/or expense reimbursements was 0.825% for the year ended October 31, 2018.
PGIM Investments has contractually agreed, through February 29, 2020, to reimburse and/or waive fees so that the Series’ net annual operating expenses of each share class does not exceed 0.84% of the Series’ average daily net assets (exclusive of distribution and service (12b-1) fees, and transfer agency expenses (including sub-transfer agency and networking fees)). Additionally, effective July 1, 2018, PGIM Investments has contractually agreed, through February 29, 2020, to limit total annual operating expenses after fee waivers and/or expense reimbursements to 1.09% of average daily net assets for Class A shares. Separately, effective December 16, 2017, PGIM Investments has contractually agreed to waive and/or reimburse up to 0.06% of certain other expenses on an annualized basis, through February 29, 2020, to the extent that the total net annual operating expenses exceed 1.90% of average daily net assets for Class C shares, 1.48% of average daily net
| | | | |
| PGIM Jennison International Opportunities Fund | | | 33 | |
Notes to Financial Statements (continued)
assets for Class R shares, 0.90% of average daily net assets for Class Z shares, and 0.84% of average daily net assets for Class R6 shares. Prior to July 1, 2018 and for the period from December 15, 2017 through June 30, 2018 total annual operating expenses after fee waivers and/or reimbursements for Class A were limited to 1.15% of average daily net assets subject to a contractual agreement to waive and/or reimburse up to 0.06% of certain other expenses on an annualized basis, to the extent that the total net annual operating expenses exceeded 1.15% of average daily net assets. The contractual waivers and expense limitation above exclude interest, brokerage, taxes (such as income and foreign withholding taxes, stamp duty and deferred tax expenses), acquired fund fees and expenses, extraordinary expenses, and certain other Series expenses such as dividend and interest expense and broker charges on short sales. Expenses waived/reimbursed by the Manager in accordance with these agreements may be recouped by the Manager within the same fiscal year during which such waiver/reimbursement is made if such recoupment can be realized without exceeding the expense limit in effect at the time of the recoupment for that fiscal year.
Where applicable, PGIM Investments voluntarily agreed through June 30, 2018, to waive management fees or shared operating expenses on any share class to the same extent that it waives similar expenses on any other share class and, in addition, total annual operating expenses for Class R6 shares will not exceed total annual operating expenses for Class Z shares. Effective July 1, 2018 this voluntary agreement became part of the Series’ contractual waiver agreement through February 29, 2020 and is subject to recoupment by the Manager within the same fiscal year during which such wavier/reimbursement is made if such recoupment can be realized without exceeding the expense limit in effect at the time of the recoupment for that fiscal year.
The Fund, on behalf of the Series, has a distribution agreement with Prudential Investment Management Services LLC (“PIMS”), which acts as the distributor of the Class A, Class C, Class R, Class Z and Class R6 shares of the Series. The Series compensates PIMS for distributing and servicing the Series’ Class A, Class C and Class R shares, pursuant to the plans of distribution (the “Distribution Plans”), regardless of expenses actually incurred by PIMS. The distribution fees are accrued daily and payable monthly. No distribution or service fees are paid to PIMS as distributor of the Class Z and Class R6 shares of the Series.
Pursuant to the Distribution Plans, the Series compensates PIMS for distribution related activities at an annual rate of up to 0.30%, 1% and 0.75% of the average daily net assets of the Class A, Class C and Class R shares, respectively. PIMS has contractually agreed through February 29, 2020 to limit such expenses to 0.25% and 0.50% of the average daily net assets of the Class A and Class R shares, respectively.
PIMS has advised the Series that it received $110,333 in front-end sales charges resulting from sales of Class A shares during the year ended October 31, 2018. From these fees,
PIMS paid such sales charges to broker-dealers, who in turn paid commissions to salespersons and incurred other distribution costs.
PIMS has advised the Series that for the year ended October 31, 2018, it received $1,264 in contingent deferred sales charges imposed upon redemptions by certain Class C shareholders.
PGIM Investments, PIMS and Jennison are indirect, wholly-owned subsidiaries of Prudential Financial, Inc. (“Prudential”).
3. Other Transactions with Affiliates
Prudential Mutual Fund Services LLC (“PMFS”), an affiliate of PGIM Investments and an indirect, wholly-owned subsidiary of Prudential, serves as the Series’ transfer agent. Transfer agent’s fees and expenses in the Statement of Operations include certain out-of-pocket expenses paid to non-affiliates, where applicable.
The Series may enter into certain securities purchase or sale transactions under Board approved Rule 17a-7 procedures. Rule 17a-7 is an exemptive rule under the 1940 Act, that subject to certain conditions, permits purchase and sale transactions among affiliated investment companies, or between an investment company and a person that is affiliated solely by reason of having a common (or affiliated) investment adviser, common directors, and/or common officers. Such transactions are subject to ratification by the Board. For the reporting period ended October 31, 2018, no such transactions were entered into by the Series.
The Series may invest its overnight sweep cash in the PGIM Core Ultra Short Bond Fund (the “Core Fund”), and its securities lending cash collateral in the PGIM Institutional Money Market Fund (the “Money Market Fund”), each a series of Prudential Investment Portfolios 2, registered under the 1940 Act and managed by PGIM Investments. For the reporting period ended October 31, 2018, PGIM, Inc. was compensated $20,122 by PGIM Investments for managing the Series’ securities lending cash collateral as subadviser to the Money Market Fund. Earnings from the Core Fund and Money Market Fund are disclosed on the Statement of Operations as “Affiliated dividend income” and “Income from securities lending, net”, respectively.
4. Portfolio Securities
The aggregate cost of purchases and proceeds from sales of portfolio securities (excluding short-term investments and U.S. Government securities) for the year ended October 31, 2018, were $293,654,349 and $225,091,593, respectively.
A summary of the cost of purchases and proceeds from sales of shares of affiliated mutual funds for the year ended October 31, 2018, is presented as follows:
| | | | |
| PGIM Jennison International Opportunities Fund | | | 35 | |
Notes to Financial Statements (continued)
| | | | | | | | | | | | | | | | | | | | | | | | | | | | | | |
Value, Beginning
of Year | | | Cost of
Purchases | | | Proceeds
from Sales | | | Change in
Unrealized
Gain
(Loss) | | | Realized
Gain
(Loss) | | | Value,
End of
Year | | | Shares,
End of
Year | | | Income | |
| | PGIM Core Ultra Short Bond Fund* | | | | | | | | | | | | | |
| $ | 1,267,836 | | | $ | 588,263,088 | | | $ | 573,170,938 | | | $ | — | | | $ | — | | | $ | 16,359,986 | | | | 16,359,986 | | | $ | 186,166 | |
| | | | | |
| | PGIM Institutional Money Market Fund* | | | | | | | | | | | | | | | | | | | | | |
| | 5,918,998 | | | | 412,539,368 | | | | 392,680,116 | | | | (2,422 | ) | | | (2,101 | ) | | | 25,773,727 | | | | 25,773,727 | | | | 52,374 | ** |
| | | | | | | | | | | | | | | | | | | | | | | | | | | | | | |
| $ | 7,186,834 | | | $ | 1,000,802,456 | | | $ | 965,851,054 | | | $ | (2,422 | ) | | $ | (2,101 | ) | | $ | 42,133,713 | | | | | | | $ | 238,540 | |
| | | | | | | | | | | | | | | | | | | | | | | | | | | | | | |
| * | The Fund did not have any capital gain distributions during the reporting period. |
| ** | This amount is included in “Income from securities lending, net” on the Statement of Operations. |
5. Distributions and Tax Information
Distributions to shareholders, which are determined in accordance with federal income tax regulations and which may differ from generally accepted accounting principles, are recorded on the ex-date.
For the year ended October 31, 2018, the tax character of dividends paid by the Series was $109,283 of ordinary income. For the year ended October 31, 2017, the tax character of dividends paid by the Series was $113,138 of ordinary income.
As of October 31, 2018, the accumulated undistributed earnings on a tax basis was $107,361 of ordinary income.
The United States federal income tax basis of the Series’ investments and the net unrealized depreciation as of October 31, 2018 were as follows:
| | | | | | |
Tax Basis | | Gross Unrealized Appreciation | | Gross Unrealized Depreciation | | Net Unrealized Depreciation |
| $463,896,380 | | $35,212,156 | | $(40,848,842) | | $(5,636,686) |
The difference between book basis and tax basis is primarily attributable to deferred losses on wash sales and other cost basis adjustments between financial and tax accounting.
For federal income tax purposes, the Series had a capital loss carryforward as of October 31, 2018 of approximately $9,676,000 which can be carried forward for an unlimited period. No capital gains distributions are expected to be paid to shareholders until net gains have been realized in excess of such losses.
Management has analyzed the Series’ tax positions taken on federal, state and local income tax returns for all open tax years and has concluded that no provision for income tax is required in the Series’ financial statements for the current reporting period. The Series’ federal, state and local income and federal excise tax returns for tax years for which the applicable statutes of limitations have not expired are subject to examination by the Internal Revenue Service and state departments of revenue.
6. Capital and Ownership
The Series offers Class A, Class C, Class R, Class Z and Class R6 shares. Class A shares are sold with a maximum front-end sales charge of 5.50%. Investors who purchase $1 million or more of Class A shares and sell these shares within 12 months of purchase are subject to a contingent deferred sales charge (“CDSC”) of 1%, although they are not subject to an initial sales charge. The Class A CDSC is waived for certain retirement and/or benefit plans. A special exchange privilege is also available for shareholders who qualified to purchase Class A shares at net asset value. Class C shares are sold with a CDSC of 1% on sales made within 12 months of purchase. Class R, Class Z and Class R6 shares are not subject to any sales or redemption charge and are available exclusively for sale to a limited group of investors.
Under certain circumstances, an exchange may be made from specified share classes of the Series to one or more other share classes of the Series as presented in the table of transactions in shares of common stock.
The Fund is authorized to issue 5.075 billion shares of common stock, with a par value of $0.01 per share, which is divided into seven series. There are 900 million shares authorized for the Series, divided into eight classes, designated Class A, Class C, Class R, Class Z, Class R2, Class R4, and Class R6 and Class T common stock, each of which consists of 50 million, 50 million, 150 million, 175 million, 75 million, 75 million, 200 million and 125 million authorized shares, respectively. The Series currently does not have any Class R2, Class R4 and Class T shares outstanding.
As of October 31, 2018, Prudential, through its affiliated entities, including affiliated funds (if applicable), owned 567 Class R shares and 1,487,633 Class R6 shares of the Series. At
| | | | |
| PGIM Jennison International Opportunities Fund | | | 37 | |
Notes to Financial Statements (continued)
reporting period end, four shareholders of record held 77% of the Series’ outstanding shares, of which 62% were held by an affiliate of Prudential.
Transactions in shares of common stock were as follows:
| | | | | | | | |
Class A | | Shares | | | Amount | |
Year ended October 31, 2018: | | | | | | | | |
Shares sold | | | 660,533 | | | $ | 11,796,123 | |
Shares reacquired | | | (104,212 | ) | | | (1,857,275 | ) |
| | | | | | | | |
Net increase (decrease) in shares outstanding before conversion | | | 556,321 | | | | 9,938,848 | |
Shares issued upon conversion from other share class(es) | | | 55,205 | | | | 1,034,432 | |
Shares reacquired upon conversion into other share class(es) | | | (5,627 | ) | | | (102,838 | ) |
| | | | | | | | |
Net increase (decrease) in shares outstanding | | | 605,899 | | | $ | 10,870,442 | |
| | | | | | | | |
Year ended October 31, 2017: | | | | | | | | |
Shares sold | | | 178,060 | | | $ | 2,725,886 | |
Shares reacquired | | | (71,108 | ) | | | (952,807 | ) |
| | | | | | | | |
Net increase (decrease) in shares outstanding before conversion | | | 106,952 | | | | 1,773,079 | |
Shares reacquired upon conversion into other share class(es) | | | (32,857 | ) | | | (412,542 | ) |
| | | | | | | | |
Net increase (decrease) in shares outstanding | | | 74,095 | | | $ | 1,360,537 | |
| | | | | | | | |
Class C | | | | | | |
Year ended October 31, 2018: | | | | | | | | |
Shares sold | | | 205,864 | | | $ | 3,575,262 | |
Shares reacquired | | | (56,955 | ) | | | (961,489 | ) |
| | | | | | | | |
Net increase (decrease) in shares outstanding before conversion | | | 148,909 | | | | 2,613,773 | |
Shares reacquired upon conversion into other share class(es) | | | (4,015 | ) | | | (65,643 | ) |
| | | | | | | | |
Net increase (decrease) in shares outstanding | | | 144,894 | | | $ | 2,548,130 | |
| | | | | | | | |
Year ended October 31, 2017: | | | | | | | | |
Shares sold | | | 65,162 | | | $ | 925,090 | |
Shares reacquired | | | (23,164 | ) | | | (312,798 | ) |
| | | | | | | | |
Net increase (decrease) in shares outstanding | | | 41,998 | | | $ | 612,292 | |
| | | | | | | | |
Class R | | | | | | |
Period ended October 31, 2018*: | | | | | | | | |
Shares sold | | | 824,982 | | | $ | 14,999,820 | |
Shares issued in merger | | | 19,031,205 | | | | 329,810,775 | |
Shares reacquired | | | (3,064,934 | ) | | | (55,429,940 | ) |
| | | | | | | | |
Net increase (decrease) in shares outstanding | | | 16,791,253 | | | $ | 289,380,655 | |
| | | | | | | | |
| | | | | | | | |
Class Z | | Shares | | | Amount | |
Year ended October 31, 2018: | | | | | | | | |
Shares sold | | | 5,157,111 | | | $ | 93,161,083 | |
Shares issued in reinvestment of dividends and distributions | | | 3,125 | | | | 54,275 | |
Shares issued in merger | | | 2,461,464 | | | | 42,854,094 | |
Shares reacquired | | | (2,729,560 | ) | | | (48,279,119 | ) |
| | | | | | | | |
Net increase (decrease) in shares outstanding before conversion | | | 4,892,140 | | | | 87,790,333 | |
Shares issued upon conversion from other share class(es) | | | 6,420 | | | | 118,183 | |
Shares reacquired upon conversion into other share class(es) | | | (51,659 | ) | | | (984,134 | ) |
| | | | | | | | |
Net increase (decrease) in shares outstanding | | | 4,846,901 | | | $ | 86,924,382 | |
| | | | | | | | |
Year ended October 31, 2017: | | | | | | | | |
Shares sold | | | 317,602 | | | $ | 4,781,956 | |
Shares issued in reinvestment of dividends and distributions | | | 3,504 | | | | 41,518 | |
Shares reacquired | | | (192,382 | ) | | | (2,704,237 | ) |
| | | | | | | | |
Net increase (decrease) in shares outstanding before conversion | | | 128,724 | | | | 2,119,237 | |
Shares issued upon conversion from other share class(es) | | | 32,543 | | | | 412,542 | |
| | | | | | | | |
Net increase (decrease) in shares outstanding | | | 161,267 | | | $ | 2,531,779 | |
| | | | | | | | |
Class R6 | | | | | | |
Year ended October 31, 2018: | | | | | | | | |
Shares sold | | | 994,673 | | | $ | 17,221,962 | |
Shares issued in reinvestment of dividends and distributions | | | 3,160 | | | | 54,898 | |
Shares issued in merger | | | 6,114 | | | | 106,389 | |
Shares reacquired | | | (329,043 | ) | | | (6,118,870 | ) |
| | | | | | | | |
Net increase (decrease) in shares outstanding | | | 674,904 | | | $ | 11,264,379 | |
| | | | | | | | |
Year ended October 31, 2017: | | | | | | | | |
Shares sold | | | 252,504 | | | $ | 3,192,000 | |
Shares issued in reinvestment of dividends and distributions | | | 6,044 | | | | 71,620 | |
Shares reacquired | | | (585,779 | ) | | | (8,482,097 | ) |
| | | | | | | | |
Net increase (decrease) in shares outstanding | | | (327,231 | ) | | $ | (5,218,477 | ) |
| | | | | | | | |
| * | Commencement of offering was November 20, 2017 |
7. Borrowings
The Fund, on behalf of the Series, along with other affiliated registered investment companies (the “Funds”), is a party to a Syndicated Credit Agreement (“SCA”) with a group of banks. The purpose of the SCA is to provide an alternative source of temporary funding for capital share redemptions. The SCA provides for a commitment of $900 million for the period October 4, 2018 through October 3, 2019. The Funds pay an annualized commitment fee of 0.15% of the unused portion of the SCA. The Series’ portion of the commitment fee for the unused amount, allocated based upon a method approved by the Board, is accrued daily and paid quarterly. Prior to October 4, 2018, the Funds had another SCA that provided a commitment of $900 million and the Funds paid an annualized commitment fee of 0.15% of the unused portion of the SCA. The interest on borrowings under both SCAs is paid monthly and at a per annum interest rate based upon a contractual spread plus the higher of (1) the effective federal funds rate, (2) the 1-month LIBOR rate or (3) zero percent.
| | | | |
| PGIM Jennison International Opportunities Fund | | | 39 | |
Notes to Financial Statements (continued)
Other affiliated registered investment companies that are parties to the SCA include portfolios that are subject to a predetermined mathematical formula used to manage certain benefit guarantees offered under variable annuity contracts. The formula may result in large scale asset flows into and out of these portfolios. Consequently, these portfolios may be more likely to utilize the SCA for purposes of funding redemptions. It may be possible for those portfolios to fully exhaust the committed amount of the SCA, thereby requiring the Manager to allocate available funding per a Board-approved methodology designed to treat the Funds in the SCA equitably.
The Series utilized the SCA during the reporting period ended October 31, 2018. The average daily balance for the 7 days that the Series had loans outstanding during the period was $4,599,714, borrowed at a weighted average interest rate of 3.14%. The maximum loan balance outstanding during the period was $5,658,000. At October 31, 2018, the Series did not have an outstanding loan balance.
8. Risks of Investing in the Series
The Series’ risks include, but are not limited to, some or all of the risks discussed below:
Emerging Markets Risk: The risks of foreign investments are greater for investments in or exposed to emerging markets. Emerging market countries typically have economic and political systems that are less fully developed, and can be expected to be less stable, than those of more developed countries. For example, the economies of such countries can be subject to rapid and unpredictable rates of inflation or deflation. Low trading volumes may result in a lack of liquidity and price volatility. Emerging market countries may have policies that restrict investment by non-US investors, or that prevent non-US investors from withdrawing their money at will.
Equity and Equity-Related Securities Risks: The value of a particular security could go down and you could lose money. In addition to an individual security losing value, the value of the equity markets or a sector in which the Series invests could go down. The Series’ holdings can vary significantly from broad market indexes and the performance of the Series can deviate from the performance of these indexes. Different parts of a market can react differently to adverse issuer, market, regulatory, political and economic developments.
Foreign Securities Risk: The Series’ investments in securities of foreign issuers or issuers with significant exposure to foreign markets involve additional risk. Foreign countries in which the Series may invest may have markets that are less liquid, less regulated and more volatile than US markets. The value of the Series’ investments may decline because of factors affecting the particular issuer as well as foreign markets and issuers generally, such as unfavorable government actions, and political or financial instability.
9. Recent Accounting Pronouncements and Reporting Updates
In August 2018, the Securities and Exchange Commission (the “SEC”) adopted amendments to Regulation S-X to update and simplify the disclosure requirements for registered investment companies by eliminating requirements that are redundant or duplicative of US GAAP requirements or other SEC disclosure requirements. The new amendments require the presentation of the total, rather than the components, of distributable earnings on the Statement of Assets and Liabilities and the total, rather than the components, of dividends from net investment income and distributions from net realized gains on the Statements of Changes in Net Assets. The amendments also removed the requirement for the parenthetical disclosure of undistributed net investment income on the Statements of Changes in Net Assets and certain tax adjustments that were reflected in the Notes to Financial Statements. All of these have been reflected in the Series’ financial statements.
In August 2018, the FASB issued Accounting Standards Update (“ASU”) No. 2018-13, which changes certain fair value measurement disclosure requirements. The new ASU, in addition to other modifications and additions, removes the requirement to disclose the amount and reasons for transfers between Level 1 and Level 2 of the fair value hierarchy, and the Series’ policy for the timing of transfers between levels. The amendments are effective for financial statements issued for fiscal years beginning after December 15, 2019, and interim periods within those fiscal years. Management has evaluated the implications of certain provisions of the ASU and has determined to early adopt aspects related to the removal and modification of certain fair value measurement disclosures under the ASU effective immediately. At this time, management is evaluating the implications of certain other provisions of the ASU related to new disclosure requirements and any impact on the financial statement disclosures has not yet been determined.
10. Reorganization
On June 7, 2017, the Board approved an Agreement and Plan of Reorganization (the “Plans”) which provided for the transfer of all the assets of Target International Equity Portfolio (the “Merged Portfolio”) for shares of Jennison International Opportunities Fund (the “Acquiring Fund”) and the assumption of the liabilities of the Merged Portfolio respectively. Shareholders approved the Plan at a meeting on November 28, 2017 and the reorganization took place on December 15, 2017.
On the reorganization date, the Merged Portfolio had the following total investment cost and value, representing the principal assets acquired by the Acquiring Fund:
| | | | | | | | |
Merged Portfolio | | Total Investment
Value | | | Total Investment
Cost | |
Target International Equity Portfolio | | $ | 325,193,997 | | | $ | 319,368,212 | |
The purpose of the transaction was to combine two portfolios with substantially similar investment objectives and policies.
| | | | |
| PGIM Jennison International Opportunities Fund | | | 41 | |
Notes to Financial Statements (continued)
The acquisition was accomplished by a tax-free exchange of the following shares on December 15, 2017:
| | | | | | | | | | | | | | | | |
| Merged Portfolio | | | Acquiring Fund | | | | |
Target International
Equity Portfolio | | | Jennison International
Opportunities Fund | | | | |
Class | | Shares | | | Class | | | Shares | | | Value | |
| R | | | 28,199,749 | | | | R | | | | 19,031,205 | | | $ | 329,810,775 | |
| Z | | | 3,655,174 | | | | Z | | | | 2,461,464 | | | | 42,854,094 | |
| R6 | | | 9,077 | | | | R6 | | | | 6,114 | | | | 106,389 | |
For financial reporting purposes, assets received and shares issued by the Acquiring Fund were recorded at fair value; however, the cost basis of the investments received from the Merged Portfolio were carried forward to reflect the tax-free status of the acquisition.
The net assets and net unrealized appreciation on investments immediately before the acquisition were as follows:
| | | | | | | | | | | | | | | | |
| Merged Portfolio | | | | | | Acquiring Fund | |
Target International
Equity Portfolio | | | Unrealized Appreciation
on Investments | | | Jennison International
Opportunities Fund | |
Class | | Net assets | | | Class | | | Net assets | |
| R | | $ | 329,810,775 | | | $ | 5,154,385 | | | | R | | | $ | 9,834 | |
| Z | | | 42,854,094 | | | | 669,737 | | | | Z | | | | 31,606,586 | |
| R6 | | | 106,389 | | | | 1,663 | | | | R6 | | | | 26,367,768 | |
Assuming the acquisition had been completed on August 1, 2017, the Acquiring Fund’s unaudited pro forma results of operations for the year ended October 31, 2018 would have been as follows:
| | | | | | | | | | | | |
Acquiring Fund | | Net
Investment
loss (a) | | | Net realized
and unrealized
loss on
investments (b) | | | Net decrease
in net assets
resulting from
operations | |
Jennison International Opportunities Fund | | | (375,158 | ) | | | (23,698,604 | ) | | | (24,073,762 | ) |
| (a) | Net investment income (loss) as reported in the Statement of Operations (Year ended October 31, 2018) of the Acquiring Fund, plus net investment income from the Merged Portfolio pre-merger as follows: Target International Equity Portfolio $1,281,359. |
| (b) | Net realized and unrealized gain (loss) on investments as reported in the Statement of Operations (Year ended October 31, 2018) of the Acquiring Fund, plus net realized and unrealized gain (loss) on investments from the Merged Portfolio pre-merger as follows: Target International Equity Portfolio $13,606,098. |
Since both the Merged Portfolio and the Acquiring Fund sold and redeemed shares throughout the period, it is not practicable to provide pro-forma information on a per-share basis.
| | | | |
| PGIM Jennison International Opportunities Fund | | | 43 | |
Financial Highlights
| | | | | | | | | | | | | | | | | | | | |
| Class A Shares | |
| | | Year Ended October 31, | |
| | | 2018 | | | 2017 | | | 2016 | | | 2015 | | | 2014 | |
| Per Share Operating Performance(a): | | | | | | | | | | | | | | | | | | | | |
| Net Asset Value, Beginning of Year | | | $17.10 | | | | $12.36 | | | | $13.09 | | | | $13.06 | | | | $13.51 | |
| Income (loss) from investment operations: | | | | | | | | | | | | | | | | | | | | |
| Net investment income (loss) | | | (0.06 | ) | | | (0.01 | ) | | | 0.02 | | | | (0.05 | ) | | | (0.06 | ) |
| Net realized and unrealized gain (loss) on investment and foreign currency transactions | | | (1.22 | ) | | | 4.75 | | | | (0.75 | ) | | | 0.08 | | | | 0.09 | |
| Total from investment operations | | | (1.28 | ) | | | 4.74 | | | | (0.73 | ) | | | 0.03 | | | | 0.03 | |
| Less Dividends and Distributions: | | | | | | | | | | | | | | | | | | | | |
| Distributions from net realized gains | | | - | | | | - | | | | - | | | | - | | | | (0.48 | ) |
| Net asset value, end of year | | | $15.82 | | | | $17.10 | | | | $12.36 | | | | $13.09 | | | | $13.06 | |
| Total Return(b): | | | (7.49)% | | | | 38.35% | | | | (5.58)% | | | | 0.23% | | | | 0.20% | |
| |
| Ratios/Supplemental Data: | |
| Net assets, end of year (000) | | | $14,496 | | | | $5,303 | | | | $2,918 | | | | $4,167 | | | | $1,833 | |
| Average net assets (000) | | | $10,393 | | | | $3,121 | | | | $3,575 | | | | $3,179 | | | | $1,467 | |
| Ratios to average net assets(c): | | | | | | | | | | | | | | | | | | | | |
| Expenses after waivers and/or expense reimbursement | | | 1.13% | | | | 1.15% | | | | 1.15% | | | | 1.55% | | | | 1.60% | |
| Expenses before waivers and/or expense reimbursement | | | 1.55% | (d) | | | 1.63% | | | | 1.74% | | | | 1.67% | | | | 1.90% | |
| Net investment income (loss) | | | (0.32)% | | | | (0.07)% | | | | 0.15% | | | | (0.39)% | | | | (0.48)% | |
| Portfolio turnover rate(e) | | | 59% | | | | 69% | | | | 65% | | | | 75% | | | | 61% | |
| (a) | Calculated based on average shares outstanding during the year. |
| (b) | Total return does not consider the effects of sales loads. Total return is calculated assuming a purchase of a share on the first day and a sale on the last day of each year reported and includes reinvestment of dividends and distributions, if any. Total returns may reflect adjustments to conform to generally accepted accounting principles. |
| (c) | Does not include expenses of the underlying funds in which the Series invests. |
| (d) | Effective November 1, 2017, class specific expenses include transfer agent fees and expenses and registration fees, which are charged to their respective share class. |
| (e) | The Series’ portfolio turnover rate is calculated in accordance with regulatory requirements, without regard to transactions involving short term investments and certain derivatives. If such transactions were included, the Series’ portfolio turnover rate may be higher. |
See Notes to Financial Statements.
| | | | | | | | | | | | | | | | | | | | |
| Class C Shares | |
| | | Year Ended October 31, | |
| | | 2018 | | | 2017 | | | 2016 | | | 2015 | | | 2014 | |
| Per Share Operating Performance(a): | | | | | | | | | | | | | | | | | | | | |
| Net Asset Value, Beginning of Year | | | $16.43 | | | | $11.96 | | | | $12.77 | | | | $12.82 | | | | $13.37 | |
| Income (loss) from investment operations: | | | | | | | | | | | | | | | | | | | | |
| Net investment income (loss) | | | (0.18 | ) | | | (0.11 | ) | | | (0.08 | ) | | | (0.15 | ) | | | (0.16 | ) |
| Net realized and unrealized gain (loss) on investment and foreign currency transactions | | | (1.17 | ) | | | 4.58 | | | | (0.73 | ) | | | 0.10 | | | | 0.09 | |
| Total from investment operations | | | (1.35 | ) | | | 4.47 | | | | (0.81 | ) | | | (0.05 | ) | | | (0.07 | ) |
| Less Dividends and Distributions: | | | | | | | | | | | | | | | | | | | | |
| Distributions from net realized gains | | | - | | | | - | | | | - | | | | - | | | | (0.48 | ) |
| Net asset value, end of year | | | $15.08 | | | | $16.43 | | | | $11.96 | | | | $12.77 | | | | $12.82 | |
| Total Return(b): | | | (8.22)% | | | | 37.37% | | | | (6.34)% | | | | (0.39)% | | | | (0.57)% | |
| |
| Ratios/Supplemental Data: | |
| Net assets, end of year (000) | | | $3,800 | | | | $1,759 | | | | $779 | | | | $1,215 | | | | $465 | |
| Average net assets (000) | | | $3,449 | | | | $1,080 | | | | $895 | | | | $903 | | | | $362 | |
| Ratios to average net assets(c): | | | | | | | | | | | | | | | | | | | | |
| Expenses after waivers and/or expense reimbursement | | | 1.92% | | | | 1.89% | | | | 1.90% | | | | 2.30% | | | | 2.35% | |
| Expenses before waivers and/or expense reimbursement | | | 2.54% | (d) | | | 2.32% | | | | 2.44% | | | | 2.37% | | | | 2.60% | |
| Net investment income (loss) | | | (1.05)% | | | | (0.80)% | | | | (0.67)% | | | | (1.15)% | | | | (1.21)% | |
| Portfolio turnover rate(e) | | | 59% | | | | 69% | | | | 65% | | | | 75% | | | | 61% | |
| (a) | Calculated based on average shares outstanding during the year. |
| (b) | Total return does not consider the effects of sales loads. Total return is calculated assuming a purchase of a share on the first day and a sale on the last day of each year reported and includes reinvestment of dividends and distributions, if any. Total returns may reflect adjustments to conform to generally accepted accounting principles. |
| (c) | Does not include expenses of the underlying funds in which the Series invests. |
| (d) | Effective November 1, 2017, class specific expenses include transfer agent fees and expenses and registration fees, which are charged to their respective share class. |
| (e) | The Series’ portfolio turnover rate is calculated in accordance with regulatory requirements, without regard to transactions involving short term investments and certain derivatives. If such transactions were included, the Series’ portfolio turnover rate may be higher. |
See Notes to Financial Statements.
| | | | |
| PGIM Jennison International Opportunities Fund | | | 45 | |
Financial Highlights (continued)
| | | | |
| Class R Shares | | | |
| | | November 20, 2017(a)
through
October 31, 2018 | |
| Per Share Operating Performance(b): | | | | |
| Net Asset Value, Beginning of Period | | | $17.62 | |
| Income (loss) from investment operations: | | | | |
| Net investment income (loss) | | | (0.09 | ) |
| Net realized and unrealized gain (loss) on investment and foreign currency transactions | | | (1.67 | ) |
| Total from investment operations | | | (1.76 | ) |
| Net asset value, end of period | | | $15.86 | |
| Total Return(c): | | | (9.99)% | |
| |
| Ratios/Supplemental Data: | |
| Net assets, end of period (000) | | | $266,294 | |
| Average net assets (000) | | | $299,955 | |
| Ratios to average net assets(d): | | | | |
| Expenses after waivers and/or expense reimbursement | | | 1.46% | (e) |
| Expenses before waivers and/or expense reimbursement | | | 1.80% | (e) |
| Net investment income (loss) | | | (0.53)% | (e) |
| Portfolio turnover rate(f) | | | 59% | |
| (a) | Commencement of offering. |
| (b) | Calculated based on average shares outstanding during the period. |
| (c) | Total return is calculated assuming a purchase of a share on the first day and a sale on the last day of each period reported and includes reinvestment of dividends and distributions, if any. Total returns may reflect adjustments to conform to generally accepted accounting principles. Total returns for periods less than one full year are not annualized. |
| (d) | Does not include expenses of the underlying funds in which the Series invests. |
| (f) | The Series’ portfolio turnover rate is calculated in accordance with regulatory requirements, without regard to transactions involving short term investments and certain derivatives. If such transactions were included, the Series’ portfolio turnover rate may be higher. |
See Notes to Financial Statements.
| | | | | | | | | | | | | | | | | | | | |
| Class Z Shares | |
| | | Year Ended October 31, | |
| | | 2018 | | | 2017 | | | 2016 | | | 2015 | | | 2014 | |
| Per Share Operating Performance(a): | | | | | | | | | | | | | | | | | | | | |
| Net Asset Value, Beginning of Year | | | $17.29 | | | | $12.50 | | | | $13.20 | | | | $13.13 | | | | $13.55 | |
| Income (loss) from investment operations: | | | | | | | | | | | | | | | | | | | | |
| Net investment income (loss) | | | (0.01 | ) | | | 0.03 | | | | 0.03 | | | | (0.03 | ) | | | (0.02 | ) |
| Net realized and unrealized gain (loss) on investment and foreign currency transactions | | | (1.24 | ) | | | 4.79 | | | | (0.73 | ) | | | 0.10 | | | | 0.08 | |
| Total from investment operations | | | (1.25 | ) | | | 4.82 | | | | (0.70 | ) | | | 0.07 | | | | 0.06 | |
| Less Dividends and Distributions: | | | | | | | | | | | | | | | | | | | | |
| Dividends from net investment income | | | (0.03 | ) | | | (0.03 | ) | | | - | | | | - | | | | - | |
| Distributions from net realized gains | | | - | | | | - | | | | - | | | | - | | | | (0.48 | ) |
| Total dividends and distributions | | | (0.03 | ) | | | (0.03 | ) | | | - | | | | - | | | | (0.48 | ) |
| Net asset value, end of year | | | $16.01 | | | | $17.29 | | | | $12.50 | | | | $13.20 | | | | $13.13 | |
| Total Return(b): | | | (7.24)% | | | | 38.65% | | | | (5.30)% | | | | 0.53% | | | | 0.42% | |
| |
| Ratios/Supplemental Data: | |
| Net assets, end of year (000) | | | $104,113 | | | | $28,612 | | | | $18,667 | | | | $46,105 | | | | $46,996 | |
| Average net assets (000) | | | $75,711 | | | | $21,756 | | | | $23,274 | | | | $47,187 | | | | $38,835 | |
| Ratios to average net assets(c): | | | | | | | | | | | | | | | | | | | | |
| Expenses after waivers and/or expense reimbursement | | | 0.89% | | | | 0.89% | | | | 0.90% | | | | 1.31% | | | | 1.35% | |
| Expenses before waivers and/or expense reimbursement | | | 1.04% | (d) | | | 1.34% | | | | 1.41% | | | | 1.40% | | | | 1.54% | |
| Net investment income (loss) | | | (0.08)% | | | | 0.23% | | | | 0.25% | | | | (0.19)% | | | | (0.13)% | |
| Portfolio turnover rate(e) | | | 59% | | | | 69% | | | | 65% | | | | 75% | | | | 61% | |
| (a) | Calculated based on average shares outstanding during the year. |
| (b) | Total return is calculated assuming a purchase of a share on the first day and a sale on the last day of each year reported and includes reinvestment of dividends and distributions, if any. Total returns may reflect adjustments to conform to generally accepted accounting principles. |
| (c) | Does not include expenses of the underlying funds in which the Series invests. |
| (d) | Effective November 1, 2017, class specific expenses include transfer agent fees and expenses and registration fees, which are charged to their respective share class. |
| (e) | The Series’ portfolio turnover rate is calculated in accordance with regulatory requirements, without regard to transactions involving short term investments and certain derivatives. If such transactions were included, the Series’ portfolio turnover rate may be higher. |
See Notes to Financial Statements.
| | | | |
| PGIM Jennison International Opportunities Fund | | | 47 | |
Financial Highlights (continued)
| | | | | | | | | | | | | | | | |
| Class R6 Shares | |
| | | Year Ended October 31, | | | | | | December 23,
2015(a)
through
October 31, | |
| | | 2018 | | | 2017 | | | | | | 2016 | |
| Per Share Operating Performance(b): | | | | | | | | | | | | | | | | |
| Net Asset Value, Beginning of Period | | | $17.29 | | | | $12.50 | | | | | | | | $13.25 | |
| Income (loss) from investment operations: | | | | | | | | | | | | | | | | |
| Net investment income (loss) | | | (0.01 | ) | | | 0.04 | | | | | | | | 0.06 | |
| Net realized and unrealized gain (loss) on investment and foreign currency transactions | | | (1.22 | ) | | | 4.79 | | | | | | | | (0.81 | ) |
| Total from investment operations | | | (1.23 | ) | | | 4.83 | | | | | | | | (0.75 | ) |
| Less Dividends and Distributions: | | | | | | | | | | | | | | | | |
| Dividends from net investment income | | | (0.04 | ) | | | (0.04 | ) | | | | | | | - | |
| Net asset value, end of period | | | $16.02 | | | | $17.29 | | | | | | | | $12.50 | |
| Total Return(c): | | | (7.15)% | | | | 38.75% | | | | | | | | (5.66)% | |
| |
| Ratios/Supplemental Data: | |
| Net assets, end of period (000) | | | $35,141 | | | | $26,252 | | | | | | | | $23,073 | |
| Average net assets (000) | | | $26,736 | | | | $24,927 | | | | | | | | $23,677 | |
| Ratios to average net assets(d): | | | | | | | | | | | | | | | | |
| Expenses after waivers and/or expense reimbursement | | | 0.84% | | | | 0.84% | | | | | | | | 0.84% | (e) |
| Expenses before waivers and/or expense reimbursement | | | 1.00% | (f) | | | 1.30% | | | | | | | | 1.43% | (e) |
| Net investment income (loss) | | | (0.05)% | | | | 0.28% | | | | | | | | 0.60% | (e) |
| Portfolio turnover rate(g) | | | 59% | | | | 69% | | | | | | | | 65% | |
| (a) | Commencement of offering. |
| (b) | Calculated based on average shares outstanding during the period. |
| (c) | Total return is calculated assuming a purchase of a share on the first day and a sale on the last day of each period reported and includes reinvestment of dividends and distributions, if any. Total returns may reflect adjustments to conform to generally accepted accounting principles. Total returns for periods less than one full year are not annualized. |
| (d) | Does not include expenses of the underlying funds in which the Series invests. |
| (f) | Effective November 1, 2017, class specific expenses include transfer agent fees and expenses and registration fees, which are charged to their respective share class. |
| (g) | The Series’ portfolio turnover rate is calculated in accordance with regulatory requirements, without regard to transactions involving short term investments and certain derivatives. If such transactions were included, the Series’ portfolio turnover rate may be higher. |
See Notes to Financial Statements.
Report of Independent Registered Public Accounting Firm
The Board of Directors and Shareholders
Prudential World Fund, Inc.:
Opinion on the Financial Statements
We have audited the accompanying statement of assets and liabilities of PGIM Jennison International Opportunities Fund (formerly Prudential Jennison International Opportunities Fund) (the “Fund”), a series of Prudential World Fund, Inc., including the schedule of investments, as of October 31, 2018, the related statement of operations for the year then ended, the statements of changes in net assets for each of the years in the two-year period then ended, and the related notes (collectively, the financial statements) and the financial highlights for the years or periods indicated therein. In our opinion, the financial statements and financial highlights present fairly, in all material respects, the financial position of the Fund as of October 31, 2018, the results of its operations for the year then ended, the changes in its net assets for each of the years in the two-year period then ended, and the financial highlights for the years or periods indicated therein, in conformity with U.S. generally accepted accounting principles.
Basis for Opinion
These financial statements and financial highlights are the responsibility of the Fund’s management. Our responsibility is to express an opinion on these financial statements and financial highlights based on our audits. We are a public accounting firm registered with the Public Company Accounting Oversight Board (United States) (“PCAOB”) and are required to be independent with respect to the Fund in accordance with the U.S. federal securities laws and the applicable rules and regulations of the Securities and Exchange Commission and the PCAOB.
We conducted our audits in accordance with the standards of the PCAOB. Those standards require that we plan and perform the audit to obtain reasonable assurance about whether the financial statements and financial highlights are free of material misstatement, whether due to error or fraud. Our audits included performing procedures to assess the risks of material misstatement of the financial statements and financial highlights, whether due to error or fraud, and performing procedures that respond to those risks. Such procedures included examining, on a test basis, evidence regarding the amounts and disclosures in the financial statements and financial highlights. Such procedures also included confirmation of securities owned as of October 31, 2018, by correspondence with the custodians, transfer agents and brokers or by other appropriate auditing procedures when replies from brokers were not received. Our audits also included evaluating the accounting principles used and significant estimates made by management, as well as evaluating the overall presentation of the financial statements and financial highlights. We believe that our audits provide a reasonable basis for our opinion.

We have served as the auditor of one or more PGIM and/or Prudential Retail investment companies since 2003.
New York, New York
December 18, 2018
| | | | |
| PGIM Jennison International Opportunities Fund | | | 49 | |
Federal Income Tax Information (unaudited)
For the fiscal year ended October 31, 2018, the Series made an election to pass through the maximum amount of the portion of the ordinary income dividends paid derived from foreign source income as well as any foreign taxes paid by the Series in accordance with Section 853 of the Internal Revenue Code of the following amounts: $241,326 foreign tax credit from recognized foreign source income of $6,090,466.
For the fiscal year ended October 31, 2018, the Series reports the maximum amount allowable under Section 854 of the Internal Revenue Code, but not less than, the following percentages of the ordinary income dividends paid as 1) qualified dividend income (QDI); 2) eligible for corporate dividend received deduction (DRD):
| | | | | | | | |
| | | QDI | | | DRD | |
PGIM Jennison International Opportunities Fund | | | 100.00 | % | | | 24.82 | % |
In January 2019, you will be advised on IRS Form 1099-DIV or substitute 1099-DIV as to the federal tax status of dividends received by you in calendar year 2018.
INFORMATION ABOUT BOARD MEMBERS AND OFFICERS (unaudited)
Information about Board Members and Officers of the Fund is set forth below. Board Members who are not deemed to be “interested persons” of the Fund, as defined in the 1940 Act, are referred to as “Independent Board Members.” Board Members who are deemed to be “interested persons” of the Fund are referred to as “Interested Board Members.” The Board Members are responsible for the overall supervision of the operations of the Fund and perform the various duties imposed on the directors of investment companies by the 1940 Act. The Board in turn elects the Officers, who are responsible for administering the day-to-day operations of the Fund.
| | | | | | |
| Independent Board Members | | | | |
| | | | |
Name, Address, Age Position(s) Portfolios Overseen | | Principal Occupation(s) During Past Five Years | | Other Directorships Held During Past Five Years | | Length of Board Service |
| | | | |
Ellen S. Alberding (60) Board Member Portfolios Overseen: 93 | | President and Board Member, The Joyce Foundation (charitable foundation) (since 2002); Vice Chair, City Colleges of Chicago (community college system) (2011-2015); Trustee, National Park Foundation (charitable foundation for national park system) (2009-2018); Trustee, Economic Club of Chicago (since 2009); Trustee, Loyola University (since 2018). | | None. | | Since September 2013 |
| | | | |
Kevin J. Bannon (66) Board Member Portfolios Overseen: 93 | | Retired; Managing Director (April 2008-May 2015) and Chief Investment Officer (October 2008-November 2013) of Highmount Capital LLC (registered investment adviser); formerly Executive Vice President and Chief Investment Officer (April 1993-August 2007) of Bank of New York Company; President (May 2003-May 2007) of BNY Hamilton Family of Mutual Funds. | | Director of Urstadt Biddle Properties (equity real estate investment trust) (since September 2008). | | Since July 2008 |
| | | | |
Linda W. Bynoe (66) Board Member Portfolios Overseen: 93 | | President and Chief Executive Officer (since March 1995) and formerly Chief Operating Officer (December 1989-February 1995) of Telemat Ltd. (management consulting); formerly Vice President (January 1985-June 1989) at Morgan Stanley & Co. (broker-dealer). | | Director of Anixter International, Inc. (communication products distributor) (since January 2006); Director of Northern Trust Corporation (financial services) (since April 2006); Trustee of Equity Residential (residential real estate) (since December 2009). | | Since March 2005 |
PGIM Jennison International Opportunities Fund
| | | | | | |
Independent Board Members | | | | |
| | | | |
Name, Address, Age Position(s) Portfolios Overseen | | Principal Occupation(s) During Past Five Years | | Other Directorships Held During Past Five Years | | Length of Board Service |
| | | | |
Barry H. Evans (58) Board Member Portfolios Overseen: 92 | | Retired; formerly President (2005 – 2016), Global Chief Operating Officer (2014– 2016), Chief Investment Officer – Global Head of Fixed Income (1998-2014), and various portfolio manager roles (1986-2006), Manulife Asset Management U.S. | | Director, Manulife Trust Company (since 2011); formerly Director, Manulife Asset Management Limited (2015-2017); formerly Chairman of the Board of Directors of Manulife Asset Management U.S. (2005-2016); formerly Chairman of the Board, Declaration Investment Management and Research (2008-2016). | | Since September 2017 |
| | | | |
Keith F. Hartstein (62) Board Member & Independent Chair Portfolios Overseen: 93 | | Retired; Member (since November 2014) of the Governing Council of the Independent Directors Council (organization of independent mutual fund directors); formerly President and Chief Executive Officer (2005-2012), Senior Vice President (2004-2005), Senior Vice President of Sales and Marketing (1997-2004), and various executive management positions (1990-1997), John Hancock Funds, LLC (asset management); Chairman, Investment Company Institute’s Sales Force Marketing Committee (2003-2008). | | None. | | Since September 2013 |
Visit our website at pgiminvestments.com
| | | | | | |
| Independent Board Members | | | | |
| | | | |
Name, Address, Age Position(s) Portfolios Overseen | | Principal Occupation(s) During Past Five Years | | Other Directorships Held During Past Five Years | | Length of Board Service |
| | | | |
Laurie Simon Hodrick (56) Board Member Portfolios Overseen: 92 | | A. Barton Hepburn Professor Emerita of Economics in the Faculty of Business, Columbia Business School (since 2018); Visiting Professor of Law, Stanford Law School (since 2015); Visiting Fellow at the Hoover Institution, Stanford University (since 2015); Sole Member, ReidCourt LLC (since 2008) (a consulting firm); formerly A. Barton Hepburn Professor of Economics in the Faculty of Business, Columbia Business School (1996-2017); formerly Managing Director, Global Head of Alternative Investment Strategies, Deutsche Bank (2006-2008). | | Independent Director, Corporate Capital Trust (since April 2017) (a business development company); Independent Director, Kabbage, Inc. (since July 2018) (financial services). | | Since September 2017 |
| | | | |
Michael S. Hyland, CFA (73) Board Member Portfolios Overseen: 93 | | Retired (since February 2005); formerly Senior Managing Director (July 2001-February 2005) of Bear Stearns & Co, Inc.; Global Partner, INVESCO (1999-2001); Managing Director and President of Salomon Brothers Asset Management (1989-1999). | | None. | | Since July 2008 |
| | | | |
Richard A. Redeker (75) Board Member Portfolios Overseen: 93 | | Retired Mutual Fund Senior Executive (50 years); Management Consultant; Director, Mutual Fund Directors Forum (since 2014); Independent Directors Council (organization of independent mutual fund directors)-Executive Committee, Chair of Policy Steering Committee, Governing Council. | | None. | | Since October 1993 |
PGIM Jennison International Opportunities Fund
| | | | | | |
| Independent Board Members | | | | |
| | | | |
Name, Address, Age Position(s) Portfolios Overseen | | Principal Occupation(s) During Past Five Years | | Other Directorships Held During Past Five Years | | Length of Board Service |
| | | | |
Brian K. Reid (56)# Board Member Portfolios Overseen: 92 | | Retired; formerly Chief Economist for the Investment Company Institute (ICI) (2005-2017); formerly Senior Economist and Director of Industry and Financial Analysis at the ICI (1998-2004); formerly Senior Economist, Industry and Financial Analysis at the ICI (1996-1998); formerly Staff Economist at the Federal Reserve Board (1989-1996); Director, ICI Mutual Insurance Company (2012-2017). | | None. | | Since March 2018 |
| # | Mr. Reid joined the Board effective as of March 1, 2018. |
| | | | | | |
| Interested Board Members | | | | |
| | | | |
Name, Address, Age Position(s) Portfolios Overseen | | Principal Occupation(s) During Past Five Years | | Other Directorships Held During Past Five Years | | Length of
Board Service |
| | | | |
Stuart S. Parker (56) Board Member & President Portfolios Overseen: 93 | | President of PGIM Investments LLC (formerly known as Prudential Investments LLC) (since January 2012); Executive Vice President of Prudential Investment Management Services LLC (since December 2012); formerly Executive Vice President of Jennison Associates LLC and Head of Retail Distribution of PGIM Investments LLC (June 2005-December 2011). | | None. | | Since January 2012 |
Visit our website at pgiminvestments.com
| | | | | | |
| Interested Board Members | | | | |
| | | | |
Name, Address, Age Position(s) Portfolios Overseen | | Principal Occupation(s) During Past Five Years | | Other Directorships Held During Past Five Years | | Length of Board Service |
| | | | |
Scott E. Benjamin (45) Board Member & Vice President Portfolios Overseen:93 | | Executive Vice President (since June 2009) of PGIM Investments LLC; Executive Vice President (June 2009-June 2012) and Vice President (since June 2012) of Prudential Investment Management Services LLC; Executive Vice President (since September 2009) of AST Investment Services, Inc.; Senior Vice President of Product Development and Marketing, PGIM Investments (since February 2006); formerly Vice President of Product Development and Product Management, PGIM Investments LLC (2003-2006). | | None. | | Since March 2010 |
| | | | |
Grace C. Torres* (59) Board Member Portfolios Overseen: 92 | | Retired; formerly Treasurer and Principal Financial and Accounting Officer of the PGIM Funds, Target Funds, Advanced Series Trust, Prudential Variable Contract Accounts and The Prudential Series Fund (1998-June 2014); Assistant Treasurer (March 1999-June 2014) and Senior Vice President (September 1999-June 2014) of PGIM Investments LLC; Assistant Treasurer (May 2003-June 2014) and Vice President (June 2005-June 2014) of AST Investment Services, Inc.; Senior Vice President and Assistant Treasurer (May 2003-June 2014) of Prudential Annuities Advisory Services, Inc. | | Formerly Director (July 2015-January 2018) of Sun Bancorp, Inc. N.A. and Sun National Bank; Director (since January 2018) of OceanFirst Financial Corp. and OceanFirst Bank. | | Since November 2014 |
* Note: Prior to her retirement in 2014, Ms. Torres was employed by PGIM Investments LLC. Due to her prior employment, she is considered to be an “interested person” under the 1940 Act. Ms. Torres is a Non-Management Interested Board Member.
PGIM Jennison International Opportunities Fund
| | | | |
| Fund Officers(a) | | | | |
| | | |
Name, Address and Age Position with Fund | | Principal Occupation(s) During Past Five Years | | Length of Service as Fund Officer |
| | | |
Raymond A. O’Hara (63) Chief Legal Officer | | Vice President and Corporate Counsel (since July 2010) of Prudential Insurance Company of America (Prudential); Vice President (March 2011-Present) of Pruco Life Insurance Company and Pruco Life Insurance Company of New Jersey; Vice President and Corporate Counsel (March 2011-Present) of Prudential Annuities Life Assurance Corporation; Chief Legal Officer of PGIM Investments LLC (since June 2012); Chief Legal Officer of Prudential Mutual Fund Services LLC (since June 2012) and Corporate Counsel of AST Investment Services, Inc. (since June 2012); formerly Assistant Vice President and Corporate Counsel (September 2008-July 2010) of The Hartford Financial Services Group, Inc.; formerly Associate (September 1980-December 1987) and Partner (January 1988–August 2008) of Blazzard & Hasenauer, P.C. (formerly, Blazzard, Grodd & Hasenauer, P.C.). | | Since June 2012 |
| | | |
Chad A. Earnst (43) Chief Compliance Officer | | Chief Compliance Officer (September 2014-Present) of PGIM Investments LLC; Chief Compliance Officer (September 2014-Present) of the PGIM Funds, Target Funds, Advanced Series Trust, The Prudential Series Fund, Prudential’s Gibraltar Fund, Inc., PGIM Global Short Duration High Yield Income Fund, Inc., PGIM Short Duration High Yield Fund, Inc. and PGIM Jennison MLP Income Fund, Inc.; formerly Assistant Director (March 2010-August 2014) of the Asset Management Unit, Division of Enforcement, US Securities & Exchange Commission; Assistant Regional Director (January 2010-August 2014), Branch Chief (June 2006–December 2009) and Senior Counsel (April 2003-May 2006) of the Miami Regional Office, Division of Enforcement, US Securities & Exchange Commission. | | Since September 2014 |
| | | |
Dino Capasso (44) Deputy Chief Compliance Officer | | Vice President and Deputy Chief Compliance Officer (June 2017-Present) of PGIM Investments LLC; formerly, Senior Vice President and Senior Counsel (January 2016-June 2017), and Vice President and Counsel (February 2012-December 2015) of Pacific Investment Management Company LLC. | | Since March 2018 |
| | | |
Andrew R. French (56) Secretary | | Vice President and Corporate Counsel (since February 2010) of Prudential; formerly Director and Corporate Counsel (2006-2010) of Prudential; Vice President and Assistant Secretary (since January 2007) of PGIM Investments LLC; Vice President and Assistant Secretary (since January 2007) of Prudential Mutual Fund Services LLC. | | Since October 2006 |
Visit our website at pgiminvestments.com
| | | | |
| Fund Officers(a) | | | | |
| | | |
Name, Address and Age Position with Fund | | Principal Occupation(s) During Past Five Years | | Length of Service as Fund Officer |
| | | |
Jonathan D. Shain (60) Assistant Secretary | | Vice President and Corporate Counsel (since August 1998) of Prudential; Vice President and Assistant Secretary (since May 2001) of PGIM Investments LLC; Vice President and Assistant Secretary (since February 2001) of Prudential Mutual Fund Services LLC; formerly Vice President and Assistant Secretary (May 2003-June 2005) of AST Investment Services, Inc. | | Since May 2005 |
| | | |
Claudia DiGiacomo (44) Assistant Secretary | | Vice President and Corporate Counsel (since January 2005) of Prudential; Vice President and Assistant Secretary of PGIM Investments LLC (since December 2005); formerly Associate at Sidley Austin Brown & Wood LLP (1999-2004). | | Since December 2005 |
| | | |
Charles H. Smith (45) Anti-Money Laundering Compliance Officer | | Vice President, Corporate Compliance, Anti-Money Laundering Unit (since January 2015) of Prudential; committee member of the American Council of Life Insurers Anti-Money Laundering and Critical Infrastructure Committee (since January 2016); formerly Global Head of Economic Sanctions Compliance at AIG Property Casualty (February 2007 – December 2014); Assistant Attorney General at the New York State Attorney General’s Office, Division of Public Advocacy. (August 1998 —January 2007). | | Since January 2017 |
| | | |
Brian D. Nee (52) Treasurer and Principal Financial and Accounting Officer | | Vice President and Head of Finance of PGIM Investments LLC (since August 2015) and PGIM Global Partners (since February 2017); formerly, Vice President, Treasurer’s Department of Prudential (September 2007-August 2015). | | Since July 2018 |
| | | |
Peter Parrella (60) Assistant Treasurer | | Vice President (since 2007) and Director (2004-2007) within Prudential Mutual Fund Administration; formerly Tax Manager at SSB Citi Fund Management LLC (1997-2004). | | Since June 2007 |
| | | |
Lana Lomuti (51) Assistant Treasurer | | Vice President (since 2007) and Director (2005-2007), within Prudential Mutual Fund Administration; formerly Assistant Treasurer (December 2007-February 2014) of The Greater China Fund, Inc. | | Since April 2014 |
| | | |
Linda McMullin (57) Assistant Treasurer | | Vice President (since 2011) and Director (2008-2011) within Prudential Mutual Fund Administration. | | Since April 2014 |
| | | |
Kelly A. Coyne (50) Assistant Treasurer | | Director, Investment Operations of Prudential Mutual Fund Services LLC (since 2010). | | Since March 2015 |
(a) Excludes Mr. Parker and Mr. Benjamin, interested Board Members who also serve as President and Vice President, respectively.
Explanatory Notes to Tables:
| ∎ | | Board Members are deemed to be “Interested,” as defined in the 1940 Act, by reason of their affiliation with PGIM Investments LLC and/or an affiliate of PGIM Investments LLC. |
| ∎ | | Unless otherwise noted, the address of all Board Members and Officers is c/o PGIM Investments LLC, 655 Broad Street, Newark, New Jersey 07102-4410. |
| ∎ | | There is no set term of office for Board Members or Officers. The Board Members have adopted a retirement policy, which calls for the retirement of Board Members on December 31 of the year in which they reach the age of 75. |
PGIM Jennison International Opportunities Fund
| ∎ | | “Other Directorships Held” includes only directorships of companies required to register or file reports with the SEC under the 1934 Act (that is, “public companies”) or other investment companies registered under the 1940 Act. |
| ∎ | | “Portfolios Overseen” includes all investment companies managed by PGIM Investments LLC. The investment companies for which PGIM Investments LLC serves as manager include the PGIM Funds, The Prudential Variable Contract Accounts, PGIM ETF Trust, PGIM Short Duration High Yield Fund, Inc., PGIM Global Short Duration High Yield Fund, Inc., The Prudential Series Fund, Prudential’s Gibraltar Fund, Inc. and the Advanced Series Trust. |
Visit our website at pgiminvestments.com
Approval of Advisory Agreements (unaudited)
The Fund’s Board of Directors
The Board of Directors (the “Board”) of PGIM Jennison International Opportunities Fund (the “Fund”)1 consists of twelve individuals, nine of whom are not “interested persons” of the Fund, as defined in the Investment Company Act of 1940, as amended (the “1940 Act”) (the “Independent Directors”). The Board is responsible for the oversight of the Fund and its operations, and performs the various duties imposed on the directors of investment companies by the 1940 Act. The Independent Directors have retained independent legal counsel to assist them in connection with their duties. The Chair of the Board is an Independent Director. The Board has established four standing committees: the Audit Committee, the Nominating and Governance Committee, and two Investment Committees. Each committee is chaired by, and composed of, Independent Directors.
Annual Approval of the Fund’s Advisory Agreements
As required under the 1940 Act, the Board determines annually whether to renew the Fund’s management agreement with PGIM Investments LLC (“PGIM Investments”) and the Fund’s subadvisory agreement with Jennison Associates LLC (“Jennison”). In considering the renewal of the agreements, the Board, including all of the Independent Directors, met on June 7, 2018 and on June 19-21, 2018 and approved the renewal of the agreements through July 31, 2019, after concluding that the renewal of the agreements was in the best interests of the Fund and its shareholders.
In advance of the meetings, the Board requested and received materials relating to the agreements, and had the opportunity to ask questions and request further information in connection with its consideration. Among other things, the Board considered comparative fee information from PGIM Investments and Jennison. Also, the Board considered comparisons with other mutual funds in relevant Peer Universes and Peer Groups, as is further discussed below.
In approving the agreements, the Board, including the Independent Directors advised by independent legal counsel, considered the factors it deemed relevant, including the nature, quality and extent of services provided by PGIM Investments and the subadviser, the performance of the Fund, the profitability of PGIM Investments and its affiliates, expenses and fees, and the potential for economies of scale that may be shared with the Fund and its shareholders as the Fund’s assets grow. In their deliberations, the Directors did not identify any single factor which alone was responsible for the Board’s decision to approve the agreements with respect to the Fund. In connection with its deliberations, the Board considered information provided by PGIM Investments throughout the year at regular Board
| 1 | PGIM Jennison International Opportunities Fund is a series of Prudential World Fund, Inc. |
| | |
| PGIM Jennison International Opportunities Fund |
Approval of Advisory Agreements (continued)
meetings, presentations from portfolio managers and other information, as well as information furnished at or in advance of the meetings on June 7, 2018 and on June 19-21, 2018.
The Directors determined that the overall arrangements between the Fund and PGIM Investments, which serves as the Fund’s investment manager pursuant to a management agreement, and between PGIM Investments and Jennison, which serves as the Fund’s subadviser pursuant to the terms of a subadvisory agreement with PGIM Investments, are in the best interests of the Fund and its shareholders in light of the services performed, fees charged and such other matters as the Directors considered relevant in the exercise of their business judgment.
The material factors and conclusions that formed the basis for the Directors’ reaching their determinations to approve the continuance of the agreements are separately discussed below.
Nature, Quality and Extent of Services
The Board received and considered information regarding the nature, quality and extent of services provided to the Fund by PGIM Investments and Jennison. The Board considered the services provided by PGIM Investments, including but not limited to the oversight of the subadviser for the Fund, as well as the provision of fund recordkeeping, compliance, and other services to the Fund. With respect to PGIM Investments’ oversight of the subadviser, the Board noted that PGIM Investments’ Strategic Investment Research Group (“SIRG”), which is a business unit of PGIM Investments, is responsible for monitoring and reporting to PGIM Investments’ senior management on the performance and operations of the subadviser. The Board also considered that PGIM Investments pays the salaries of all of the officers and interested Directors of the Fund who are part of Fund management. The Board also considered the investment subadvisory services provided by Jennison, including investment research and security selection, as well as adherence to the Fund’s investment restrictions and compliance with applicable Fund policies and procedures. The Board considered PGIM Investments’ evaluation of the subadviser, as well as PGIM Investments’ recommendation, based on its review of the subadviser, to renew the subadvisory agreement.
The Board considered the qualifications, backgrounds and responsibilities of PGIM Investments’ senior management responsible for the oversight of the Fund and Jennison, and also considered the qualifications, backgrounds and responsibilities of Jennison’s portfolio managers who are responsible for the day-to-day management of the Fund’s portfolio. The Board was provided with information pertaining to PGIM Investments’ and Jennison’s organizational structure, senior management, investment operations, and other relevant information pertaining to both PGIM Investments and Jennison. The Board also noted that it received favorable compliance reports from the Fund’s Chief Compliance
| | |
| Visit our website at pgiminvestments.com | | |
Officer (“CCO”) as to both PGIM Investments and Jennison. The Board noted that Jennison is affiliated with PGIM Investments.
The Board concluded that it was satisfied with the nature, extent and quality of the investment management services provided by PGIM Investments and the subadvisory services provided to the Fund by Jennison, and that there was a reasonable basis on which to conclude that the Fund benefits from the services provided by PGIM Investments and Jennison under the management and subadvisory agreements.
Costs of Services and Profits Realized by PGIM Investments
The Board was provided with information on the profitability of PGIM Investments and its affiliates in serving as the Fund’s investment manager. The Board discussed with PGIM Investments the methodology utilized in assembling the information regarding profitability and considered its reasonableness. The Board recognized that it is difficult to make comparisons of profitability from fund management contracts because comparative information is not generally publicly available and is affected by numerous factors, including the structure of the particular adviser, the types of funds it manages, its business mix, numerous assumptions regarding allocations and the adviser’s capital structure and cost of capital. However, the Board considered that the cost of services provided by PGIM Investments to the Fund during the year ended December 31, 2017 exceeded the management fees paid by the Fund, resulting in an operating loss to PGIM Investments. Taking these factors into account, the Board concluded that the profitability of PGIM Investments and its affiliates in relation to the services rendered was not unreasonable.
Economies of Scale
The Board received and discussed information concerning economies of scale that PGIM Investments may realize as the Fund’s assets grow beyond current levels. The Board noted that the management fee schedule for the Fund includes breakpoints, which have the effect of reducing the fee rate as assets increase. During the course of time, the Board has considered information regarding the launch date of the Fund, the management fees of the Fund compared to those of similarly managed funds, and PGIM Investments’ investment in the Fund over time. The Board noted that economies of scale may be shared with the Fund in several ways, including low management fees from inception, additional technological and personnel investments to enhance shareholder services, and maintaining existing expense structures in the face of a rising cost environment. The Board considered PGIM Investments’ assertion that it continually evaluates the management fee schedule of the Fund and the potential to share economies of scale through breakpoints or fee waivers as asset levels increase.
| | |
| PGIM Jennison International Opportunities Fund |
Approval of Advisory Agreements (continued)
The Board recognized the inherent limitations of any analysis of economies of scale, stemming largely from the Board’s understanding that most of PGIM Investments’ costs are not specific to individual funds, but rather are incurred across a variety of products and services.
Other Benefits to PGIM Investments and Jennison
The Board considered potential ancillary benefits that might be received by PGIM Investments, Jennison and their affiliates as a result of their relationship with the Fund. The Board concluded that potential benefits to be derived by PGIM Investments included transfer agency fees received by the Fund’s transfer agent (which is affiliated with PGIM Investments), as well as benefits to its reputation or other intangible benefits resulting from PGIM Investments’ association with the Fund. The Board concluded that the potential benefits to be derived by Jennison included the ability to use soft dollar credits, as well as the potential benefits consistent with those generally resulting from an increase in assets under management, specifically, potential access to additional research resources and benefits to its reputation. The Board concluded that the benefits derived by PGIM Investments and Jennison were consistent with the types of benefits generally derived by investment managers and subadvisers to mutual funds.
Performance of the Fund / Fees and Expenses
The Board considered certain additional specific factors and made related conclusions relating to the historical performance of the Fund for the one-, three- and five-year periods ended December 31, 2017.
The Board also considered the Fund’s actual management fee, as well as the Fund’s net total expense ratio, for the fiscal year ended October 31, 2017. The Board considered the management fee for the Fund as compared to the management fee charged by PGIM Investments to other funds and the fee charged by other advisers to comparable mutual funds in a Peer Group. The actual management fee represents the fee rate actually paid by Fund shareholders and includes any fee waivers or reimbursements. The net total expense ratio for the Fund represents the actual expense ratio incurred by Fund shareholders.
The mutual funds included in the Peer Universe, which was used to consider performance, and the Peer Group, which was used to consider fees and expenses, were objectively determined by Broadridge, an independent provider of mutual fund data. In certain circumstances, PGIM Investments also may have provided supplemental Peer Universe or Peer Group information for reasons addressed with the Board. The comparisons placed the Fund in various quartiles, with the first quartile being the best 25% of the mutual funds (for performance, the best performing mutual funds and, for expenses, the lowest cost mutual funds).
| | |
| Visit our website at pgiminvestments.com | | |
The section below summarizes key factors considered by the Board and the Board’s conclusions regarding the Fund’s performance, fees and overall expenses. The table sets forth gross performance comparisons (which do not reflect the impact on performance of fund expenses, or any subsidies, expense caps or waivers that may be applicable) with the Peer Universe, actual management fees with the Peer Group (which reflect the impact of any subsidies or fee waivers), and net total expenses with the Peer Group, each of which were key factors considered by the Board.
| | | | | | | | |
| Gross Performance | | 1 Year | | 3 Years | | 5 Years | | 10 Years |
| | 1st Quartile | | 1st Quartile | | 1st Quartile | | N/A |
| Actual Management Fees: 2nd Quartile |
| Net Total Expenses: 1st Quartile |
| | • | | The Board noted that Fund outperformed its benchmark over all periods. |
| | • | | The Board and PGIM Investments agreed to retain the Fund’s existing contractual expense cap, which (exclusive of certain fees and expenses) caps annual fund operating expenses at 0.84% through February 29, 2020. |
| | • | | The Board and PGIM Investments also agreed to enhance the Fund’s existing expense waiver, such that effective July 1, 2018 (exclusive of certain fees and expenses) PGIM Investments agrees to waive and/or reimburse up to 0.06% of certain other expenses through February 29, 2020 to the extent that the annual fund operating expenses exceed 1.09% for Class A shares, 1.90% for Class C shares, 1.48% for Class R shares, 0.90% for Class Z shares, and 0.84% for Class R6 shares. |
| | • | | In addition, PGIM Investments is obligated to waive management fees or shared operating expenses on any share class to the same extent that it waives similar expenses on any other share class. |
| | • | | The Board concluded that, in light of the above, it would be in the best interests of the Fund and its shareholders to renew the agreements. |
| | • | | The Board concluded that the management fees (including subadvisory fees) and total expenses were reasonable in light of the services provided. |
* * *
After full consideration of these factors, the Board concluded that the approval of the agreements was in the best interests of the Fund and its shareholders.
| | |
| PGIM Jennison International Opportunities Fund |
| | | | |
| ∎ MAIL | | ∎ TELEPHONE | | ∎ WEBSITE |
655 Broad Street Newark, NJ 07102 | | (800) 225-1852 | | www.pgiminvestments.com |
|
| PROXY VOTING |
| The Board of Directors of the Fund has delegated to the Fund’s subadviser the responsibility for voting any proxies and maintaining proxy recordkeeping with respect to the Fund. A description of these proxy voting policies and procedures is available without charge, upon request, by calling (800) 225-1852. Information regarding how the Fund voted proxies relating to portfolio securities during the most recent 12-month period ended June 30 is available on the Fund’s website and on the Securities and Exchange Commission’s website. |
|
| DIRECTORS |
| Ellen S. Alberding • Kevin J. Bannon • Scott E. Benjamin • Linda W. Bynoe • Barry H. Evans • Keith F. Hartstein • Laurie Simon Hodrick • Michael S. Hyland • Stuart S. Parker • Richard A. Redeker • Brian K. Reid • Grace C. Torres |
|
| OFFICERS |
| Stuart S. Parker, President • Scott E. Benjamin, Vice President • Brian D. Nee, Treasurer and Principal Financial and Accounting Officer • Raymond A. O’Hara, Chief Legal Officer • Andrew R. French, Secretary • Chad A. Earnst, Chief Compliance Officer • Dino Capasso, Vice President and Deputy Chief Compliance Officer • Charles H. Smith, Anti-Money Laundering Compliance Officer • Jonathan D. Shain, Assistant Secretary • Claudia DiGiacomo, Assistant Secretary • Peter Parrella, Assistant Treasurer • Lana Lomuti, Assistant Treasurer • Linda McMullin, Assistant Treasurer • Kelly A. Coyne, Assistant Treasurer |
| | | | |
| MANAGER | | PGIM Investments LLC | | 655 Broad Street Newark, NJ 07102 |
|
| SUBADVISER | | Jennison Associates LLC | | 466 Lexington Avenue
New York, NY 10017 |
|
| DISTRIBUTOR | | Prudential Investment
Management Services LLC | | 655 Broad Street Newark, NJ 07102 |
|
| CUSTODIAN | | The Bank of New York Mellon | | 225 Liberty Street
New York, NY 10286 |
|
| TRANSFER AGENT | | Prudential Mutual Fund
Services LLC | | PO Box 9658
Providence, RI 02940 |
|
| INDEPENDENT REGISTERED PUBLIC ACCOUNTING FIRM | | KPMG LLP | | 345 Park Avenue New York, NY 10154 |
|
| FUND COUNSEL | | Willkie Farr & Gallagher LLP | | 787 Seventh Avenue
New York, NY 10019 |
|
|
| An investor should consider the investment objectives, risks, charges, and expenses of the Fund carefully before investing. The prospectus and summary prospectus contain this and other information about the Fund. An investor may obtain a prospectus and summary prospectus by visiting our website at www.pgiminvestments.com or by calling (800) 225-1852. The prospectus and summary prospectus should be read carefully before investing. |
|
| E-DELIVERY |
| To receive your mutual fund documents online, go to www.pgiminvestments.com/edelivery and enroll. Instead of receiving printed documents by mail, you will receive notification via email when new materials are available. You can cancel your enrollment or change your email address at any time by visiting the website address above. |
|
| SHAREHOLDER COMMUNICATIONS WITH DIRECTORS |
| Shareholders can communicate directly with the Board of Directors by writing to the Chair of the Board, PGIM Jennison International Opportunities Fund, PGIM Investments, Attn: Board of Directors, 655 Broad Street, Newark, NJ 07102. Shareholders can communicate directly with an individual Director by writing to the same address. Communications are not screened before being delivered to the addressee. |
|
| AVAILABILITY OF PORTFOLIO SCHEDULE |
| The Fund files its complete schedule of portfolio holdings with the Securities and Exchange Commission for the first and third quarters of each fiscal year on Form N-Q. The Fund’s Forms N-Q are available on the Commission’s website at www.sec.gov. The Fund’s schedule of portfolio holdings is also available on the Fund’s website as of the end of each month no sooner than 15 days after the end of the month. |
|
| The Fund’s Statement of Additional Information contains additional information about the Fund’s Directors and is available without charge, upon request, by calling (800) 225-1852. |
Mutual Funds:
| | | | |
| ARE NOT INSURED BY THE FDIC OR ANY FEDERAL GOVERNMENT AGENCY | | MAY LOSE VALUE | | ARE NOT A DEPOSIT OF OR GUARANTEED BY ANY BANK OR ANY BANK AFFILIATE |
PGIM JENNISON INTERNATIONAL OPPORTUNITIES FUND
| | | | | | | | | | |
| SHARE CLASS | | A | | C | | R | | Z | | R6* |
| NASDAQ | | PWJAX | | PWJCX | | PWJRX | | PWJZX | | PWJQX |
| CUSIP | | 743969677 | | 743969669 | | 743969487 | | 743969651 | | 743969586 |
*Formerly known as Class Q shares.
MF215E

PGIM JENNISON GLOBAL INFRASTRUCTURE FUND
(Formerly known as Prudential Jennison Global Infrastructure Fund)
ANNUAL REPORT
OCTOBER 31, 2018
COMING SOON: PAPERLESS SHAREHOLDER REPORTS
Beginning on January 1, 2021, as permitted by regulations adopted by the Securities and Exchange Commission, paper copies of the Fund’s annual and semi-annual shareholder reports will no longer be sent by mail, unless you specifically request paper copies of the reports. Instead, the reports will be made available on the Fund’s website (www.pgiminvestments.com), and you will be notified by mail each time a report is posted and provided with a website link to access the report.
If you already elected to receive shareholder reports electronically, you will not be affected by this change and you need not take any action. You may elect to receive shareholder reports and other communications from the Fund electronically anytime by contacting your financial intermediary (such as a broker-dealer or bank) or, if you are a direct investor, by calling 1-800-225-1852 or by sending an e-mail request to PGIM Investments at shareholderreports@pgim.com.
Beginning on January 1, 2019, you may elect to receive all future reports in paper free of charge. If you invest through a financial intermediary, you can contact your financial intermediary or follow instructions included with this notice to elect to continue to receive paper copies of your shareholder reports. If you invest directly with the Fund, you can call 1-800-225-1852 or send an email request to shareholderreports@pgim.com to let the Fund know you wish to continue receiving paper copies of your shareholder reports. Your election to receive reports in paper will apply to all funds held in your account if you invest through your financial intermediary or all funds held with the fund complex if you invest directly with the Fund.

To enroll in e-delivery, go to pgiminvestments.com/edelivery
Highlights (unaudited)
| • | | NRG Energy shares performed well in the reporting period as it beat second-quarter 2018 earnings expectations, maintained its full-year guidance, and raised its dividend 3.6%. |
| • | | Shares of CSX also rose, as its precision railroading transformation gained momentum faster than expected. The company also benefited from accelerating volumes and improved pricing trends. |
| • | | Atlantia shares declined after its Genoa Bridge motorway collapsed in August 2018 during maintenance work. Atlantia is Italy’s largest toll road motorway builder and operator. |
This report is not authorized for distribution to prospective investors unless preceded or accompanied by a current prospectus.
The views expressed in this report and information about the Fund’s portfolio holdings are for the period covered by this report and are subject to change thereafter.
Mutual funds are distributed by Prudential Investment Management Services LLC, member SIPC. Jennison Associates LLC is a registered investment adviser. Both are Prudential Financial companies. © 2018 Prudential Financial, Inc. and its related entities. Jennison Associates, Jennison, PGIM, and the PGIM logo are service marks of Prudential Financial, Inc. and its related entities, registered in many jurisdictions worldwide.
| | |
| 2 | | Visit our website at pgiminvestments.com |
PGIM FUNDS — UPDATE
The Board of Directors/Trustees for the Fund has approved the implementation of an automatic conversion feature for Class C shares, effective as of April 1, 2019. To reflect these changes, effective April 1, 2019, the section of the Fund’s Prospectus entitled “How to Buy, Sell and Exchange Fund Shares—How to Exchange Your Shares—Frequent Purchases and Redemptions of Fund Shares” is restated to read as follows:
This supplement should be read in conjunction with your Summary Prospectus, Statutory Prospectus and Statement of Additional Information, be retained for future reference and is in addition to any existing Fund supplements.
| | 1. | In each Fund’s Statutory Prospectus, the following is added at the end of the section entitled “Fund Distributions And Tax Issues—If You Sell or Exchange Your Shares”: |
Automatic Conversion of Class C Shares
The conversion of Class C shares into Class A shares—which happens automatically approximately 10 years after purchase—is not a taxable event for federal income tax purposes. For more information about the automatic conversion of Class C shares, see Class C Shares Automatically Convert to Class A Shares in How to Buy, Sell and Exchange Fund Shares.
| | 2. | In each Fund’s Statutory Prospectus, the following sentence is added at the end of the section entitled “How to Buy, Sell and Exchange Shares—Closure of Certain Share Classes to New Group Retirement Plans”: |
Shareholders owning Class C shares may continue to hold their Class C shares until the shares automatically convert to Class A shares under the conversion schedule, or until the shareholder redeems their Class C shares.
| | 3. | In each Fund’s Statutory Prospectus, the following disclosure is added immediately following the section entitled “How to Buy, Sell and Exchange Shares—How to Buy Shares—Class B Shares Automatically Convert to Class A Shares”: |
Class C Shares Automatically Convert to Class A Shares
Starting on or about April 1, 2019 (the “Effective Date”), Class C shares will be eligible for automatic conversion into Class A shares on a monthly basis approximately ten years after the original date of purchase (the “Conversion Date”). Conversion will take place based on the relative NAV of the two classes, without the imposition of any sales load, fee or other charge. All such automatic conversions of Class C shares will constitute tax-free exchanges for federal income tax purposes.
For shareholders investing in Class C shares through retirement plans or omnibus accounts, and in certain other instances, the Fund and its agents may not have
| | | | |
| PGIM Jennison Global Infrastructure Fund | | | 3 | |
transparency into how long a shareholder has held Class C shares for purposes of determining whether such Class C shares are eligible for automatic conversion into Class A shares, and the relevant financial intermediary may not have the ability to track purchases in order to credit individual shareholders’ holding periods. In these circumstances, the Fund will not be able to automatically convert Class C shares into Class A shares as described above. In order to determine eligibility for conversion in these circumstances, it is the responsibility of the financial intermediary to notify the Fund that the shareholder is eligible for the conversion of Class C shares to Class A shares, and the financial intermediary may be required to maintain and provide the Fund with records that substantiate the holding period of Class C shares. It is the financial intermediary’s (and not the Fund’s) responsibility to keep records of transactions made in accounts it holds and to ensure that the shareholder is credited with the proper holding period based on such records or those provided to the financial intermediary by the shareholder. Please consult with your financial intermediary for the applicability of this conversion feature to your shares.
A financial intermediary may sponsor and/or control accounts, programs or platforms that impose a different conversion schedule or different eligibility requirements for the exchange of Class C shares for Class A shares (see Appendix A: Waivers and Discounts Available From Certain Financial Intermediaries of the Prospectus). Please consult with your financial intermediary if you have any questions regarding your shares’ conversion from Class C shares to Class A shares.
| | 4. | In Part II of each Fund’s Statement of Additional Information, the following disclosure is added immediately following the section entitled “Purchase, Redemption and Pricing of Fund Shares—Share Classes—Automatic Conversion of Class B Shares”: |
AUTOMATIC CONVERSION OF CLASS C SHARES. Starting on or about April 1, 2019 (the “Effective Date”), Class C shares will be eligible for automatic conversion into Class A shares on a monthly basis approximately ten years after the original date of purchase (the “Conversion Date”). Conversion will take place based on the relative NAV of the two classes, without the imposition of any sales load, fee or other charge. Class C shares of a Fund acquired through automatic reinvestment of dividends or distributions will convert to Class A shares of the Fund on the Conversion Date pro rata with the converting Class C shares of the Fund that were not acquired through reinvestment of dividends or distributions. All such automatic conversions of Class C shares will constitute tax-free exchanges for federal income tax purposes.
For shareholders investing in Class C shares through retirement plans or omnibus accounts, and in certain other instances, the Fund and its agents may not have transparency into how long a shareholder has held Class C shares for purposes of determining whether such Class C shares are eligible for automatic conversion into Class A shares, and the relevant financial intermediary may not have the ability to track purchases in order to credit individual shareholders’ holding periods. In these circumstances, the
| | |
| 4 | | Visit our website at pgiminvestments.com |
Fund will not be able to automatically convert Class C shares into Class A shares as described above. In order to determine eligibility for conversion in these circumstances, it is the responsibility of the financial intermediary to notify the Fund that the shareholder is eligible for the conversion of Class C shares to Class A shares, and the financial intermediary may be required to maintain and provide the Fund with records that substantiate the holding period of Class C shares. It is the financial intermediary’s (and not the Fund’s) responsibility to keep records of transactions made in accounts it holds and to ensure that the shareholder is credited with the proper holding period based on such records or those provided to the financial intermediary by the shareholder. Please consult with your financial intermediary for the applicability of this conversion feature to your shares.
Class C shares were generally closed to investments by new group retirement plans effective June 1, 2018. Group retirement plans (and their successor, related and affiliated plans) that have Class C shares of the Fund available to participants on or before the Effective Date may continue to open accounts for new participants in such share class and purchase additional shares in existing participant accounts.
The Fund has no responsibility for monitoring or implementing a financial intermediary’s process for determining whether a shareholder meets the required holding period for conversion. A financial intermediary may sponsor and/or control accounts, programs or platforms that impose a different conversion schedule or different eligibility requirements for the exchange of Class C shares for Class A shares, as set forth on Appendix A: Waivers and Discounts Available From Certain Financial Intermediaries of the Prospectus. In these cases, Class C shareholders may have their shares exchanged for Class A shares under the policies of the financial intermediary. Financial intermediaries will be responsible for making such exchanges in those circumstances. Please consult with your financial intermediary if you have any questions regarding your shares’ conversion from Class C shares to Class A shares.
LR1094
- Not part of the Annual Report -
| | | | |
| PGIM Jennison Global Infrastructure Fund | | | 5 | |
Table of Contents
| | |
| 6 | | Visit our website at pgiminvestments.com |
Letter from the President

Dear Shareholder:
We hope you find the annual report for PGIM Jennison Global Infrastructure Fund informative and useful. The report covers performance for the 12-month period that ended October 31, 2018.
We have important information to share with you. Effective June 11, 2018, Prudential Mutual Funds were renamed PGIM Funds. This renaming is part of our ongoing effort to further build our reputation and establish our global brand, which began when our firm adopted PGIM Investments as its name in April 2017. Please note that only the Fund’s name has changed. Your Fund’s management and operation, along with its symbols, remained the same.*
During the reporting period, the global economy continued to grow, and central banks gradually tightened monetary policy. In the US, the economy expanded and employment increased. In September, the Federal Reserve hiked interest rates for the eighth time since 2015, based on confidence in the economy.
Equity returns on the whole were strong, due to optimistic earnings expectations and investor sentiment. Global equities, including emerging markets, generally posted positive returns. However, they trailed the performance of US equities, which rose on higher corporate profits, new regulatory policies, and tax reform benefits. Volatility spiked briefly early in the period on inflation concerns, rising interest rates, and a potential global trade war, and again late in the period on worries that profit growth might slow in 2019.
The overall bond market declined modestly during the period, as measured by the Bloomberg Barclays US Aggregate Bond Index. The best performance came from higher-yielding, economically sensitive sectors, such as high yield bonds and bank loans, which posted small gains. US investment-grade corporate bonds and US Treasury bonds both finished the period with negative returns. A major trend during the period was the flattening of the US Treasury yield curve, which increased the yield on fixed income investments with shorter maturities and made them more attractive to investors.
Regarding your investments with PGIM, we believe it is important to maintain a diversified portfolio of funds consistent with your tolerance for risk, time horizon, and financial goals. Your financial advisor can help you create a diversified investment plan that may include funds covering all the basic asset classes and that reflects your personal investor profile and risk tolerance. However, diversification and asset allocation strategies do not assure a profit or protect against loss in declining markets.
At PGIM Investments, we consider it a great privilege and responsibility to help investors participate in opportunities across global markets while meeting their toughest investment challenges. PGIM is a top-10 global investment manager with more than $1 trillion in assets under management. This investment expertise allows us to deliver actively managed funds and strategies to meet the needs of investors around the globe.
Thank you for choosing our family of funds.
Sincerely,

Stuart S. Parker, President
PGIM Jennison Global Infrastructure Fund
December 14, 2018
*The Prudential Day One Funds did not change their names.
| | | | |
| PGIM Jennison Global Infrastructure Fund | | | 7 | |
Your Fund’s Performance (unaudited)
Performance data quoted represents past performance. Past performance does not guarantee future results. The investment return and principal value of an investment will fluctuate, so that an investor’s shares, when redeemed, may be worth more or less than their original cost. Current performance may be lower or higher than the past performance data quoted. An investor may obtain performance data as of the most recent month-end by visiting our website at www.pgiminvestments.com or by calling (800) 225-1852.
| | | | | | | | | | |
| | | Average Annual Total Returns as of 10/31/18
(with sales charges) | |
| | | One Year (%) | | Five Years (%) | | | Since Inception (%) | |
| Class A | | –10.32 | | | 3.36 | | | | 4.13 (9/25/13) | |
| Class C | | –6.75 | | | 3.76 | | | | 4.51 (9/25/13) | |
| Class Z | | –4.86 | | | 4.80 | | | | 5.56 (9/25/13) | |
| Class R6* | | –4.94 | | | N/A | | | | 5.46 (12/28/16) | |
| S&P Global Infrastructure Index | | | | | | | | |
| | –8.46 | | | 3.60 | | | | — | |
| S&P 500 Index | | | | | | | | | | |
| | 7.35 | | | 11.33 | | | | — | |
| Lipper Global Infrastructure Funds Average | | | | | | | | |
| | | –5.17 | | | 4.20 | | | | — | |
| | | | | | | | | | |
| | | Average Annual Total Returns as of 10/31/18
(without sales charges) | |
| | | One Year (%) | | Five Years (%) | | | Since Inception (%) | |
| Class A | | –5.10 | | | 4.54 | | | | 5.29 (9/25/13) | |
| Class C | | –5.82 | | | 3.76 | | | | 4.51 (9/25/13) | |
| Class Z | | –4.86 | | | 4.80 | | | | 5.56 (9/25/13) | |
| Class R6* | | –4.94 | | | N/A | | | | 5.46 (12/28/16) | |
| S&P Global Infrastructure Index | | | | | | | | | | |
| | –8.46 | | | 3.60 | | | | — | |
| S&P 500 Index | | | | | | | | | | |
| | 7.35 | | | 11.33 | | | | — | |
| Lipper Global Infrastructure Funds Average | | | | | | | | | | |
| | | –5.17 | | | 4.20 | | | | — | |
| | |
| 8 | | Visit our website at pgiminvestments.com |
Growth of a $10,000 Investment (unaudited)

The graph compares a $10,000 investment in the Fund’s Class Z shares with a similar investment in the S&P Global Infrastructure Index by portraying the initial account values at the commencement of operations of Class Z shares (September 25, 2013) and the account values at the end of the current fiscal year (October 31, 2018), as measured on a quarterly basis. For purposes of the graph, and unless otherwise indicated, it has been assumed that (a) all recurring fees (including management fees) were deducted; and (b) all dividends and distributions were reinvested. The line graph provides information for Class Z shares only. As indicated in the tables provided earlier, performance for other share classes will vary due to the differing charges and expenses applicable to each share class (as indicated in the following paragraphs). Without waiver of fees and/or expense reimbursements, if any, the Fund’s returns would have been lower.
Past performance does not predict future performance. Total returns and the ending account values in the graphs include changes in share price and reinvestment of dividends and capital gains distributions in a hypothetical investment for the periods shown. The Fund’s total returns do not reflect the deduction of income taxes on an individual’s investment. Taxes may reduce your actual investment returns on income or gains paid by the Fund or any gains you may realize if you sell your shares.
Source: PGIM Investments LLC and Lipper Inc.
*Formerly known as Class Q shares.
Since Inception returns are provided since the Fund has less than 10 fiscal years of returns. Since Inception returns for the Indexes and the Lipper Average are measured from the closest month-end to the class’ inception date.
| | | | |
| PGIM Jennison Global Infrastructure Fund | | | 9 | |
Your Fund’s Performance (continued)
The returns in the tables do not reflect the deduction of taxes that a shareholder would pay on Fund distributions or following the redemption of Fund shares. The average annual total returns take into account applicable sales charges, which are described for each share class in the table below.
| | | | | | | | |
| | | Class A | | Class C | | Class Z | | Class R6* |
| Maximum initial sales charge | | 5.50% of the public offering price | | None | | None | | None |
| Contingent deferred sales charge (CDSC) (as a percentage of the lower of original purchase price or net asset value at redemption) | | 1.00% on sales of $1 million or more made within 12 months of purchase | | 1.00% on sales made within 12 months of purchase | | None | | None |
| Annual distribution and service (12b-1) fees (shown as a percentage of average daily net assets) | | 0.30% (0.25% currently) | | 1.00% | | None | | None |
*Formerly known as Class Q shares.
Benchmark Definitions
S&P Global Infrastructure Index—The S&P Global Infrastructure Index is an unmanaged index that consists of 75 companies from around the world that represent the listed infrastructure universe. To create diversified exposure across the global listed infrastructure market, the Index has balanced weights across three distinct infrastructure clusters: Utilities, Transportation, and Energy. The average annual total returns for the Index measured from the month-end closest to the inception date of the Fund’s Class A, Class C, and Class Z shares are 4.31% and 4.43% for Class R6 shares.
S&P 500 Index—The S&P 500 Index is an unmanaged index of over 500 stocks of large US public companies. It gives a broad look at how stock prices in the United States have performed. The average annual total returns for the Index measured from the month-end closest to the inception date of the Fund’s Class A, Class C, and Class Z shares are 12.12% and 13.18% for Class R6 shares.
Lipper Global Infrastructure Funds Average—The Lipper Global Infrastructure Funds Average (Lipper Average) is based on the average return of all funds in the Lipper Global Infrastructure Funds universe for the periods noted. Funds in the Lipper Average invest primarily in equity securities of domestic and foreign companies engaged in an infrastructure industry, including but not limited to transportation, communication, and waste management. The average annual total returns for the Lipper Average measured from the month-end closest to the inception date of the Fund’s Class A, Class C, and Class Z shares are 4.90% and 5.27% for Class R6 shares.
| | |
| 10 | | Visit our website at pgiminvestments.com |
Investors cannot invest directly in an index or average. The returns for the Indexes would be lower if they included the effects of sales charges, operating expenses of a mutual fund, or taxes. Returns for the Lipper Average reflect the deduction of operating expenses of a mutual fund, but not sales charges or taxes.
Presentation of Fund Holdings
| | | | |
Five Largest Holdings expressed as a
percentage of net assets as of 10/31/18 (%) | |
| NextEra Energy, Inc., Electric Utilities | | | 5.5 | |
| ONEOK, Inc., Oil, Gas & Consumable Fuels | | | 4.1 | |
| American Electric Power Co., Inc., Electric Utilities | | | 3.6 | |
| FirstEnergy Corp., Electric Utilities | | | 3.5 | |
| Evergy, Inc., Electric Utilities | | | 3.4 | |
Holdings reflect only long-term investments and are subject to change.
| | | | |
Five Largest Industries expressed as a
percentage of net assets as of 10/31/18 (%) | |
| Electric Utilities | | | 24.2 | |
| Oil, Gas & Consumable Fuels | | | 18.3 | |
| Transportation Infrastructure | | | 12.6 | |
| Multi-Utilities | | | 9.7 | |
| Construction & Engineering | | | 8.2 | |
Industry weightings reflect only long-term investments and are subject to change.
| | | | |
| PGIM Jennison Global Infrastructure Fund | | | 11 | |
Strategy and Performance Overview (unaudited)
How did the Fund perform?
The PGIM Jennison Global Infrastructure Fund’s Class Z shares returned –4.86% for the 12-month reporting period that ended October 31, 2018. Over the same period, the S&P Global Infrastructure Index (the Index) declined –8.46%, and the Lipper Global Infrastructure Funds Average declined –5.17%.
What were the market conditions?
| • | | Equity market returns were strong in the beginning of the reporting period, as global gross domestic product (GDP) advanced at a healthy pace, long-term interest rates remained low, and central banks tightened monetary policy gradually in light of subdued inflation and solid US economic expansion. However, toward the end of the period, trade-related concerns, rising interest rates, and a big run-up in equity prices since the last decline in the first quarter of 2018, along with deteriorating growth prospects for emerging markets, all contributed to increased volatility and a major pullback in US equity markets. |
| • | | West Texas Intermediate crude oil and natural gas prices increased 24.3% and 7.8%, respectively, while ethane prices soared 58.1% during the period. |
| • | | While regulated utility share prices in the US, Europe, and Australia have been under pressure since late 2017 as bond yields rose in those countries, the utilities sector held up better than other sectors during the October 2018 equity market sell-off. |
What worked?
Railroad holdings were among the main positive drivers of Fund performance during the reporting period, given accelerated rail volumes and improved service levels and pricing. Positions among independent power producers, energy traders, and electric utilities also helped.
In utilities:
| • | | Shares of independent power and renewable electricity producer NRG Energy, Inc. performed well. The company beat second-quarter 2018 earnings expectations, maintained its full-year guidance, and raised its dividend 3.6%. |
| • | | NextEra Energy, Inc. is an electric power company that operates through its wholly owned subsidiaries, Florida Power & Light and NextEra Energy Resources, LLC. The company reported solid quarterly earnings in April 2018, adding more than 1,000 megawatts to its backlog of renewable projects. The company also raised its baseline for earnings growth in 2018 and extended its earnings-per-share growth outlook to 2021, which together boosted its shares in the period. |
| | |
| 12 | | Visit our website at pgiminvestments.com |
In railroads:
| • | | Shares of CSX Corp. performed well in the period, as its precision railroading transformation gained momentum faster than expected. The company also benefited from accelerating volumes and improved pricing trends. At the end of the period, Jennison favorably viewed the company given improving commodity and industrial volumes, as well as the operating metrics put into place late in 2017 that improved efficiency. |
What didn’t work?
Highways & railtracks and multi-utilities holdings were among the primary detractors from the Fund’s performance during the reporting period.
In highways & railtracks:
| • | | Shares of Atlantia S.p.A. declined nearly 25% after its Genoa Bridge motorway collapsed in August 2018 during maintenance work. Atlantia is Italy’s largest toll road motorway builder and operator. The company’s toll road concession arm, ASPI, which operates and maintains the bridge, is fully insured for damages and for rebuilding it. Atlantia has committed to rebuilding the bridge in eight months. Still, uncertainty remained on the impact the collapse would have on the company financially and on whether or not the Italian government would seek to revoke its operating license for its entire Autostrade per L’Italia concession or just the Genoa tranche. Given the Fund’s underweighting in the company and the lack of clarity thus far, Jennison intends to hold the position until it can obtain further clarity. |
In energy, specifically within midstream energy infrastructure:
| • | | Williams Companies, Inc. is an integrated natural gas behemoth operating in the Northeast and Gulf Coasts that transports, sells, and processes natural gas and petroleum products. Its shares underperformed during the period given the overall negative sentiment in the energy sector and despite reporting several positive announcements. In August, Williams Companies’ shareholders voted to acquire the remaining outstanding units of Williams Partners, effectively “rolling it up” into Williams Companies’ corporate structure. The new simplified structure was not only appealing to investors but also would allow favorable distribution coverage metrics, a deleveraging balance sheet, and enough internally generated cash flow to avoid external equity issuance for the next several years, in Jennison’s view. The company also announced its entry into the DJ Basin with an agreement to acquire Discovery DJ Services for $1.17 billion in a joint venture with private equity firm KKR. Williams will be the operator of Discovery, with an initial 40% economic contribution and a commitment to fund additional growth capital to bring its ownership to 50/50. Concurrent with the acquisition announcement, Williams announced the sale of its Four Corners Area assets (non-core) in Colorado and New Mexico at an attractive price, |
| | | | |
| PGIM Jennison Global Infrastructure Fund | | | 13 | |
Strategy and Performance Overview (continued)
| | which is expected to generate approximately $82 million of annualized EBITDA (earnings before interest, tax, depreciation, and amortization) in 2018, according to sell-side estimates. This position was not sold. |
In utilities:
| • | | NTPC Ltd. is an India-based electric utility and is the country’s largest power generator. The company’s output is contracted through long-term power purchase agreements with customers. Its shares declined after reporting unexpected fixed cost under-recoveries from coal shortages at a few of its plants during its March 2018 quarterly results. |
Current outlook
| • | | While Jennison believed at the end of the reporting period that the broad economic backdrop was positive, economic conditions had become more mixed given weakness in some emerging markets (EM) and rising political uncertainties in parts of Latin America and Europe. Jennison has oriented the portfolio away from weaker EM geographies and continues to have confidence in the end markets of the portfolio’s holdings. |
| • | | Within transportation, Jennison favored French toll-road companies benefiting from strength in traffic trends and improving construction margins. Airport passenger demand was strong globally, but Jennison opportunistically tilted the Fund’s airport exposure toward names with greater visibility to pricing growth. Despite increasing concerns regarding the impact of rising trade tariffs, Jennison remained constructive on US rails in light of improved free cash-flow generation, accelerating pricing, and margin leverage from better operations. Overall, Jennison continued to find many opportunities to invest in companies in the transportation infrastructure sector that it believes will be long-term winners through the cycle and can redeploy growth capital at attractive returns while growing dividends for shareholders. |
| • | | Regarding the Fund’s energy infrastructure exposure, Jennison believed oil, natural gas, and natural gas liquid (NGL) fundamentals improved, which bodes well for volume growth and the persistent need for critical midstream infrastructure to move energy to end-use demand markets in North America and around the world. While the first half of 2018 was a volatile period for midstream equities, share price volatility began to moderate during the third quarter of 2018 as investors began to reward the rising cash-flow per share and declining balance sheet leverage seen across the sector over the past several quarters—strong evidence, in Jennison’s view, of the improved operating fundamentals and financial health of midstream companies. Jennison was supportive of the accelerating corporate reform efforts underway in the North American midstream sector and believes this transformation not only positions these companies to better sustain themselves financially but also should allow these companies to thrive over the next decade or more. As a result, the Fund’s midstream exposure not only reflects Jennison’s preference for companies with |
| | |
| 14 | | Visit our website at pgiminvestments.com |
| | assets that are well-positioned to capitalize on growing hydrocarbon demand centers and/or supply basins but also its preference for companies that have already undertaken the corporate reforms necessary to improve their financial positioning and better align management’s interests with those of their shareholders. |
| • | | Despite acceleration in the rise of US interest rates, the US utilities sector posted positive performance during the third quarter of 2018—a reflection, in Jennison’s view, of the attractive operating backdrop for both regulated utilities and companies with exposure to competitive power markets. Jennison continued to believe higher-quality, faster-growth utilities should outperform lower-growth and/or lower-quality peers over time and particularly in a rising interest rate environment. Within regulated utilities, Jennison favored those with solid dividend yields and above-average projected earnings and/or dividend growth that is driven by regulatory rate base. In addition, Jennison favored utilities with constructive state legislatures and utility commissions because it believes a supportive policy environment enhances the ability of utilities to ultimately earn or exceed their regulatory return targets. |
| • | | Regarding renewable energy, Jennison believes there is continued global momentum behind the secular trend of rising demand for renewable energy supply and subsequent transmission investment needed to tie those cleaner resources into the grid as well as to modernize the aging grid infrastructure. In Jennison’s opinion, the trend for increased global investment in renewable energy remains supported by two broad and enduring themes: (1) meaningful reductions in the cost of renewable energy, driven by continued technological advancement, and (2) increasing public policy support—on a global scale and at local levels—for renewable investment driven by concerns over greenhouse gas emissions, energy security, and job creation. |
| • | | Lastly, regarding communications infrastructure, Jennison favored wireless towers and data center operators, as both industries capitalize on exponential data demand growth around the world. In data centers, Jennison saw an opportunity to invest in infrastructure operations that can profit from secular global trends of the increasing shift toward cloud computing by large corporations. In tower operators, Jennison continued to see an attractive investment opportunity given their critical infrastructure, multi-year contracts with their wireless operator customers, and strong free cash-flow generation. |
| | | | |
| PGIM Jennison Global Infrastructure Fund | | | 15 | |
Strategy and Performance Overview (continued)
The percentage points shown in the tables identify each security’s positive or negative contribution to the Fund’s return, which is the sum of all contributions by individual holdings.
| | | | | | |
| Top contributors (%) | | Top detractors (%) |
| NRG Energy, Inc. | | 1.14 | | Atlantia S.p.A. | | –0.80 |
| CSX Corp. | | 0.85 | | Huaneng Renewables Corp. | | –0.63 |
| NextEra Energy, Inc. | | 0.61 | | Williams Companies, Inc. | | –0.63 |
| Cheniere Energy Partners LP Holdings | | 0.46 | | NTPC Ltd. | | –0.45 |
| ONEOK, Inc. | | 0.37 | | RWE AG | | –0.44 |
| | |
| 16 | | Visit our website at pgiminvestments.com |
Fees and Expenses (unaudited)
As a shareholder of the Fund, you incur two types of costs: (1) transaction costs, including sales charges (loads) on purchase payments and redemptions, as applicable, and (2) ongoing costs, including management fees, distribution, and/or service (12b-1) fees, and other Fund expenses, as applicable. This example is intended to help you understand your ongoing costs (in dollars) of investing in the Fund and to compare these costs with the ongoing costs of investing in other mutual funds.
The example is based on an investment of $1,000 held through the six-month period ended October 31, 2018. The example is for illustrative purposes only; you should consult the Prospectus for information on initial and subsequent minimum investment requirements.
Actual Expenses
The first line for each share class in the table on the following page provides information about actual account values and actual expenses. You may use the information on this line, together with the amount you invested, to estimate the expenses that you paid over the period. Simply divide your account value by $1,000 (for example, an $8,600 account value ÷ $1,000 = 8.6), then multiply the result by the number on the first line under the heading “Expenses Paid During the Six-Month Period” to estimate the expenses you paid on your account during this period.
Hypothetical Example for Comparison Purposes
The second line for each share class in the table on the following page provides information about hypothetical account values and hypothetical expenses based on the Fund’s actual expense ratio and an assumed rate of return of 5% per year before expenses, which is not the Fund’s actual return. The hypothetical account values and expenses may not be used to estimate the actual ending account balance or expenses you paid for the period. You may use this information to compare the ongoing costs of investing in the Fund and other funds. To do so, compare this 5% hypothetical example with the 5% hypothetical examples that appear in the shareholder reports of the other funds.
The Fund’s transfer agent may charge additional fees to holders of certain accounts that are not included in the expenses shown in the table on the following page. These fees apply to individual retirement accounts (IRAs) and Section 403(b) accounts. As of the close of the six-month period covered by the table, IRA fees included an annual maintenance fee of $15 per account (subject to a maximum annual maintenance fee of $25 for all accounts held by the same shareholder). Section 403(b) accounts are charged an annual $25 fiduciary maintenance fee. Some of the fees may vary in amount, or may be waived, based on your total account balance or the number of PGIM funds, including the Fund, that you own. You should consider the additional fees that were charged to your Fund account over the six-month period when you estimate the total ongoing expenses paid over the
| | | | |
| PGIM Jennison Global Infrastructure Fund | | | 17 | |
Fees and Expenses (continued)
period and the impact of these fees on your ending account value, as these additional expenses are not reflected in the information provided in the expense table. Additional fees have the effect of reducing investment returns.
Please note that the expenses shown in the table are meant to highlight your ongoing costs only and do not reflect any transactional costs such as sales charges (loads). Therefore, the second line for each share class in the table is useful in comparing ongoing costs only and will not help you determine the relative total costs of owning different funds. In addition, if these transactional costs were included, your costs would have been higher.
| | | | | | | | | | | | | | | | | | |
PGIM
Jennison Global
Infrastructure Fund | | Beginning Account
Value
May 1, 2018 | | | Ending Account
Value
October 31, 2018 | | | Annualized
Expense Ratio
Based on the
Six-Month Period | | | Expenses Paid
During the
Six-Month Period* | |
| Class A | | Actual | | $ | 1,000.00 | | | $ | 935.70 | | | | 1.50 | % | | $ | 7.32 | |
| | Hypothetical | | $ | 1,000.00 | | | $ | 1,017.64 | | | | 1.50 | % | | $ | 7.63 | |
| Class C | | Actual | | $ | 1,000.00 | | | $ | 933.00 | | | | 2.25 | % | | $ | 10.96 | |
| | Hypothetical | | $ | 1,000.00 | | | $ | 1,013.86 | | | | 2.25 | % | | $ | 11.42 | |
| Class Z | | Actual | | $ | 1,000.00 | | | $ | 937.70 | | | | 1.25 | % | | $ | 6.11 | |
| | Hypothetical | | $ | 1,000.00 | | | $ | 1,018.90 | | | | 1.25 | % | | $ | 6.36 | |
| Class R6** | | Actual | | $ | 1,000.00 | | | $ | 936.90 | | | | 1.25 | % | | $ | 6.10 | |
| | | Hypothetical | | $ | 1,000.00 | | | $ | 1,018.90 | | | | 1.25 | % | | $ | 6.36 | |
*Fund expenses (net of fee waivers or subsidies, if any) for each share class are equal to the annualized expense ratio for each share class (provided in the table), multiplied by the average account value over the period, multiplied by the 184 days in the six-month period ended October 31, 2018, and divided by the 365 days in the Fund's fiscal year ended October 31, 2018 (to reflect the six-month period). Expenses presented in the table include the expenses of any underlying portfolios in which the Fund may invest.
**Formerly known as Class Q shares.
| | |
| 18 | | Visit our website at pgiminvestments.com |
Schedule of Investments
as of October 31, 2018
| | | | | | | | |
| Description | | Shares | | | Value | |
LONG-TERM INVESTMENTS 95.6% | | | | | | | | |
| | |
COMMON STOCKS | | | | | | | | |
| | |
Australia 3.7% | | | | | | | | |
Atlas Arteria Ltd. | | | 189,114 | | | $ | 916,579 | |
Transurban Group | | | 113,415 | | | | 910,988 | |
| | | | | | | | |
| | | | | | | 1,827,567 | |
| | |
Canada 5.4% | | | | | | | | |
Enbridge, Inc. | | | 22,406 | | | | 698,161 | |
Pembina Pipeline Corp. | | | 29,816 | | | | 963,653 | |
Westshore Terminals Investment Corp. | | | 54,306 | | | | 990,045 | |
| | | | | | | | |
| | | | | | | 2,651,859 | |
| | |
China 2.5% | | | | | | | | |
China Longyuan Power Group Corp. Ltd. (Class H Stock) | | | 341,424 | | | | 260,976 | |
China Tower Corp. Ltd. (Class H Stock), 144A* | | | 3,784,198 | | | | 577,316 | |
Huaneng Renewables Corp. Ltd. (Class H Stock) | | | 1,561,758 | | | | 403,144 | |
| | | | | | | | |
| | | | | | | 1,241,436 | |
| | |
France 8.1% | | | | | | | | |
Aeroports de Paris | | | 4,448 | | | | 932,412 | |
Eiffage SA | | | 15,266 | | | | 1,494,135 | |
Vinci SA | | | 17,463 | | | | 1,560,172 | |
| | | | | | | | |
| | | | | | | 3,986,719 | |
| | |
Germany 4.8% | | | | | | | | |
E.ON SE | | | 125,426 | | | | 1,215,150 | |
RWE AG | | | 57,451 | | | | 1,120,911 | |
| | | | | | | | |
| | | | | | | 2,336,061 | |
| | |
Italy 5.5% | | | | | | | | |
Atlantia SpA | | | 24,672 | | | | 496,777 | |
Enav SpA, 144A | | | 151,569 | | | | 683,067 | |
Enel SpA | | | 105,619 | | | | 522,614 | |
Italgas SpA | | | 197,530 | | | | 1,019,915 | |
| | | | | | | | |
| | | | | | | 2,722,373 | |
| | |
Malaysia 1.1% | | | | | | | | |
Malaysia Airports Holdings Bhd | | | 281,230 | | | | 558,050 | |
See Notes to Financial Statements.
| | | | |
| PGIM Jennison Global Infrastructure Fund | | | 19 | |
Schedule of Investments (continued)
as of October 31, 2018
| | | | | | | | |
| Description | | Shares | | | Value | |
COMMON STOCKS (Continued) | | | | | | | | |
| | |
Mexico 0.9% | | | | | | | | |
CFE Capital S de RL de CV, REIT | | | 564,587 | | | $ | 464,160 | |
| | |
New Zealand 1.5% | | | | | | | | |
Auckland International Airport Ltd. | | | 158,432 | | | | 722,610 | |
| | |
Spain 5.5% | | | | | | | | |
Cellnex Telecom SA, 144A | | | 29,519 | | | | 736,225 | |
Ferrovial SA | | | 49,459 | | | | 991,821 | |
Iberdrola SA | | | 137,218 | | | | 971,623 | |
| | | | | | | | |
| | | | | | | 2,699,669 | |
| | |
United States 56.6% | | | | | | | | |
American Electric Power Co., Inc. | | | 24,171 | | | | 1,773,185 | |
American Tower Corp. | | | 4,920 | | | | 766,585 | |
Cheniere Energy, Inc.* | | | 24,951 | | | | 1,507,270 | |
CMS Energy Corp. | | | 10,145 | | | | 502,380 | |
CSX Corp. | | | 18,693 | | | | 1,287,200 | |
CyrusOne, Inc., REIT | | | 12,685 | | | | 675,222 | |
Energy Transfer LP, MLP | | | 31,309 | | | | 486,547 | |
Equinix, Inc., REIT | | | 1,840 | | | | 696,882 | |
Evergy, Inc. | | | 29,539 | | | | 1,653,889 | |
Exelon Corp. | | | 31,190 | | | | 1,366,434 | |
FirstEnergy Corp. | | | 46,052 | | | | 1,716,819 | |
Kinder Morgan, Inc. | | | 43,888 | | | | 746,974 | |
NextEra Energy, Inc. | | | 15,569 | | | | 2,685,652 | |
NRG Energy, Inc. | | | 37,569 | | | | 1,359,622 | |
ONEOK, Inc. | | | 30,583 | | | | 2,006,245 | |
PPL Corp. | | | 40,328 | | | | 1,225,971 | |
Republic Services, Inc. | | | 10,525 | | | | 764,957 | |
SCANA Corp. | | | 17,955 | | | | 719,098 | |
Sempra Energy | | | 10,895 | | | | 1,199,757 | |
Targa Resources Corp. | | | 23,796 | | | | 1,229,539 | |
Union Pacific Corp. | | | 9,246 | | | | 1,351,950 | |
Waste Connections, Inc. | | | 10,540 | | | | 805,678 | |
Williams Cos., Inc. (The) | | | 53,876 | | | | 1,310,803 | |
| | | | | | | | |
| | | | | | | 27,838,659 | |
| | | | | | | | |
TOTAL LONG-TERM INVESTMENTS
(cost $42,172,697) | | | | | | | 47,049,163 | |
| | | | | | | | |
See Notes to Financial Statements.
| | | | | | | | |
| Description | | Shares | | | Value | |
SHORT-TERM INVESTMENT 3.5% | | | | | | | | |
| | |
AFFILIATED MUTUAL FUND | | | | | | | | |
PGIM Core Ultra Short Bond Fund
(cost $1,729,474)(w) | | | 1,729,474 | | | $ | 1,729,474 | |
| | | | | | | | |
TOTAL INVESTMENTS 99.1%
(cost $43,902,171) | | | | | | | 48,778,637 | |
Other assets in excess of liabilities 0.9% | | | | | | | 442,161 | |
| | | | | | | | |
NET ASSETS 100.0% | | | | | | $ | 49,220,798 | |
| | | | | | | | |
The following abbreviations are used in the annual report:
144A—Security was purchased pursuant to Rule 144A under the Securities Act of 1933 and may not be resold subject to that rule except to qualified institutional buyers. Unless otherwise noted, 144A securities are deemed to be liquid.
LIBOR—London Interbank Offered Rate
MLP—Master Limited Partnership
REIT—Real Estate Investment Trust
| * | Non-income producing security. |
| (w) | PGIM Investments LLC, the manager of the Series, also serves as manager of the PGIM Core Ultra Short Bond Fund. |
Fair Value Measurements:
Various inputs are used in determining the value of the Series’ investments. These inputs are summarized in the three broad levels listed below.
Level 1—unadjusted quoted prices generally in active markets for identical securities.
Level 2—quoted prices for similar securities, interest rates and yield curves, prepayment speeds, foreign currency exchange rates and other observable inputs.
Level 3—unobservable inputs for securities valued in accordance with Board approved fair valuation procedures.
The following is a summary of the inputs used as of October 31, 2018 in valuing such portfolio securities:
| | | | | | | | | | | | |
| | | Level 1 | | | Level 2 | | | Level 3 | |
Investments in Securities | | | | | | | | | | | | |
Common Stocks | | | | | | | | | | | | |
Australia | | $ | — | | | $ | 1,827,567 | | | $ | — | |
Canada | | | 2,651,859 | | | | — | | | | — | |
China | | | — | | | | 1,241,436 | | | | — | |
France | | | — | | | | 3,986,719 | | | | — | |
Germany | | | — | | | | 2,336,061 | | | | — | |
Italy | | | — | | | | 2,722,373 | | | | — | |
Malaysia | | | — | | | | 558,050 | | | | — | |
Mexico | | | 464,160 | | | | — | | | | — | |
New Zealand | | | — | | | | 722,610 | | | | — | |
Spain | | | — | | | | 2,699,669 | | | | — | |
See Notes to Financial Statements.
| | | | |
| PGIM Jennison Global Infrastructure Fund | | | 21 | |
Schedule of Investments (continued)
as of October 31, 2018
| | | | | | | | | | | | |
| | | Level 1 | | | Level 2 | | | Level 3 | |
Investments in Securities (continued) | | | | | | | | | | | | |
Common Stocks (continued) | | | | | | | | | | | | |
United States | | $ | 27,838,659 | | | $ | — | | | $ | — | |
Affiliated Mutual Fund | | | 1,729,474 | | | | — | | | | — | |
| | | | | | | | | | | | |
Total | | $ | 32,684,152 | | | $ | 16,094,485 | | | $ | — | |
| | | | | | | | | | | | |
Industry Classification:
The industry classification of investments and other assets in excess of liabilities shown as a percentage of net assets as of October 31, 2018 were as follows (unaudited):
| | | | |
Electric Utilities | | | 24.2 | % |
Oil, Gas & Consumable Fuels | | | 18.3 | |
Transportation Infrastructure | | | 12.6 | |
Multi-Utilities | | | 9.7 | |
Construction & Engineering | | | 8.2 | |
Road & Rail | | | 5.3 | |
Equity Real Estate Investment Trusts (REITs) | | | 4.4 | |
Independent Power & Renewable Electricity Producers | | | 4.1 | |
Affiliated Mutual Fund | | | 3.5 | |
Commercial Services & Supplies | | | 3.1 | % |
Diversified Telecommunication Services | | | 2.7 | |
Gas Utilities | | | 2.1 | |
Banks | | | 0.9 | |
| | | | |
| | | 99.1 | |
Other assets in excess of liabilities | | | 0.9 | |
| | | | |
| | | 100.0 | % |
| | | | |
Effects of Derivative Instruments on the Financial Statements and Primary Underlying Risk Exposure:
The Series invested in derivative instruments during the reporting period. The primary type of risk associated with these derivative instruments is equity contracts risk. The effect of such derivative instruments on the Series’ financial position and financial performance as reflected in the Statement of Assets and Liabilities and Statement of Operations is presented in the summary below.
The Series did not hold any derivative instruments as of October 31, 2018, accordingly, no derivative positions were presented in the Statement of Assets and Liabilities.
The effects of derivative instruments on the Statement of Operations for the year ended October 31, 2018 are as follows:
| | | | |
Amount of Realized Gain (Loss) on Derivatives Recognized in Income | |
Derivatives not accounted for as hedging
instruments, carried at fair value | | Rights(1) | |
Equity contracts | | $ | 7,654 | |
| | | | |
| (1) | Included in net realized gain (loss) on investment transactions in the Statement of Operations. |
See Notes to Financial Statements.
| | | | |
Change in Unrealized Appreciation (Depreciation) on Derivatives Recognized in Income | |
Derivatives not accounted for as hedging
instruments, carried at fair value | | Rights(2) | |
Equity contracts | | $ | (1,126 | ) |
| | | | |
| (2) | Included in net change in unrealized appreciation (depreciation) on investments in the Statement of Operations. |
See Notes to Financial Statements.
| | | | |
| PGIM Jennison Global Infrastructure Fund | | | 23 | |
Statement of Assets & Liabilities
as of October 31, 2018
| | | | |
Assets | | | | |
Investments at value: | | | | |
Unaffiliated investments (cost $42,172,697) | | $ | 47,049,163 | |
Affiliated investments (cost $1,729,474) | | | 1,729,474 | |
Foreign currency, at value (cost $216,576) | | | 215,466 | |
Receivable for investments sold | | | 855,506 | |
Receivable for Series shares sold | | | 65,200 | |
Tax reclaim receivable | | | 63,868 | |
Dividends receivable | | | 47,581 | |
Prepaid expenses | | | 901 | |
| | | | |
Total Assets | | | 50,027,159 | |
| | | | |
| |
Liabilities | | | | |
Payable for investments purchased | | | 624,325 | |
Payable for Series shares reacquired | | | 106,983 | |
Accrued expenses and other liabilities | | | 52,550 | |
Management fee payable | | | 14,625 | |
Distribution fee payable | | | 5,533 | |
Affiliated transfer agent fee payable | | | 2,345 | |
| | | | |
Total Liabilities | | | 806,361 | |
| | | | |
| |
Net Assets | | $ | 49,220,798 | |
| | | | |
| | | | | |
Net assets were comprised of: | | | | |
Common stock, at par | | $ | 40,329 | |
Paid-in capital in excess of par | | | 48,927,139 | |
Total distributable earnings (loss) | | | 253,330 | |
| | | | |
Net assets, October 31, 2018 | | $ | 49,220,798 | |
| | | | |
See Notes to Financial Statements.
| | | | |
Class A | | | | |
Net asset value and redemption price per share,
($8,072,737 ÷ 661,059 shares of common stock issued and outstanding) | | $ | 12.21 | |
Maximum sales charge (5.50% of offering price) | | | 0.71 | |
| | | | |
Maximum offering price to public | | $ | 12.92 | |
| | | | |
| |
Class C | | | | |
Net asset value, offering price and redemption price per share, | | | | |
($4,162,233 ÷ 343,524 shares of common stock issued and outstanding) | | $ | 12.12 | |
| | | | |
| |
Class Z | | | | |
Net asset value, offering price and redemption price per share,
| | | | |
($23,073,873 ÷ 1,889,135 shares of common stock issued and outstanding) | | $ | 12.21 | |
| | | | |
| |
Class R6 | | | | |
Net asset value, offering price and redemption price per share,
| | | | |
($13,911,955 ÷ 1,139,164 shares of common stock issued and outstanding) | | $ | 12.21 | |
| | | | |
See Notes to Financial Statements.
| | | | |
| PGIM Jennison Global Infrastructure Fund | | | 25 | |
Statement of Operations
Year Ended October 31, 2018
| | | | |
Net Investment Income (Loss) | | | | |
Income | | | | |
Unaffiliated dividend income (net of $132,116 foreign withholding tax) | | $ | 1,614,239 | |
Affiliated dividend income | | | 20,273 | |
Interest income | | | 2,392 | |
Income from securities lending, net (including affiliated income of $529) | | | 848 | |
| | | | |
Total income | | | 1,637,752 | |
| | | | |
| |
Expenses | | | | |
Management fee | | | 608,873 | |
Distribution fee(a) | | | 85,294 | |
Custodian and accounting fees | | | 76,339 | |
Registration fees(a) | | | 66,297 | |
Transfer agent’s fees and expenses (including affiliated expense of $14,089)(a) | | | 53,914 | |
Shareholders’ reports | | | 35,983 | |
Audit fee | | | 28,035 | |
Legal fees and expenses | | | 19,295 | |
Directors’ fees | | | 13,846 | |
Miscellaneous | | | 42,919 | |
| | | | |
Total expenses | | | 1,030,795 | |
Less: Fee waiver and/or expense reimbursement(a) | | | (183,033 | ) |
Distribution fee waiver(a) | | | (5,109 | ) |
| | | | |
Net expenses | | | 842,653 | |
| | | | |
Net investment income (loss) | | | 795,099 | |
| | | | |
| |
Realized And Unrealized Gain (Loss) On Investment And Foreign Currency Transactions | | | | |
Net realized gain (loss) on: | | | | |
Investment transactions (including affiliated of $(21)) | | | 2,500,135 | |
Foreign currency transactions | | | 1,020 | |
| | | | |
| | | 2,501,155 | |
| | | | |
Net change in unrealized appreciation (depreciation) on: | | | | |
Investments (net of change in foreign capital gains taxes $20,592) | | | (5,962,156 | ) |
Foreign currencies | | | (853 | ) |
| | | | |
| | | (5,963,009 | ) |
| | | | |
Net gain (loss) on investment and foreign currency transactions | | | (3,461,854 | ) |
| | | | |
Net Increase (Decrease) In Net Assets Resulting From Operations | | $ | (2,666,755 | ) |
| | | | |
| (a) | Class specific expenses and waivers were as follows: |
| | | | | | | | | | | | | | | | |
| | | Class A | | | Class C | | | Class Z | | | Class R6 | |
Distribution fee | | | 30,654 | | | | 54,640 | | | | — | | | | — | |
Registration fees | | | 16,610 | | | | 16,584 | | | | 17,444 | | | | 15,659 | |
Transfer agent’s fees and expenses | | | 18,369 | | | | 8,358 | | | | 27,159 | | | | 28 | |
Fee waiver and/or expense reimbursement | | | (45,569 | ) | | | (30,477 | ) | | | (74,307 | ) | | | (32,680 | ) |
Distribution fee waiver | | | (5,109 | ) | | | — | | | | — | | | | — | |
See Notes to Financial Statements.
Statements of Changes in Net Assets
| | | | | | | | |
| | | Year Ended October 31, | |
| | | 2018 | | | 2017 | |
Increase (Decrease) in Net Assets | | | | | | | | |
Operations | | | | | | | | |
Net investment income (loss) | | $ | 795,099 | | | $ | 749,814 | |
Net realized gain (loss) on investment and foreign currency transactions | | | 2,501,155 | | | | 1,768,892 | |
Net change in unrealized appreciation (depreciation) on investments and foreign currencies | | | (5,963,009 | ) | | | 5,851,698 | |
| | | | | | | | |
Net increase (decrease) in net assets resulting from operations | | | (2,666,755 | ) | | | 8,370,404 | |
| | | | | | | | |
| | |
Dividends and Distributions | | | | | | | | |
Distributions from distributable earnings* | | | | | | | | |
Class A | | | (141,368 | ) | | | — | |
Class C | | | (41,199 | ) | | | — | |
Class Z | | | (447,302 | ) | | | — | |
Class R6 | | | (232,070 | ) | | | — | |
| | | | | | | | |
| | | (861,939 | ) | | | — | |
| | | | | | | | |
Tax return of capital distributions | | | | | | | | |
Class A | | | — | | | | (58,583 | ) |
Class C | | | — | | | | (19,550 | ) |
Class Z | | | — | | | | (187,756 | ) |
Class R6 | | | — | | | | (79,068 | ) |
| | | | | | | | |
| | | — | | | | (344,957 | ) |
| | | | | | | | |
Dividends from net investment income | | | | | | | | |
Class A | | | | | | | (118,512 | ) |
Class C | | | | | | | (39,550 | ) |
Class Z | | | | | | | (379,823 | ) |
Class R6 | | | | | | | (159,950 | ) |
| | | | | | | | |
| | | * | | | | (697,835 | ) |
| | | | | | | | |
| | |
Series share transactions (Net of share conversions) | | | | | | | | |
Net proceeds from shares sold | | | 15,455,026 | | | | 24,826,946 | |
Net asset value of shares issued in reinvestment of dividends and distributions | | | 839,400 | | | | 1,001,786 | |
Cost of shares reacquired | | | (32,145,267 | ) | | | (23,382,391 | ) |
| | | | | | | | |
Net increase (decrease) in net assets from Series share transactions | | | (15,850,841 | ) | | | 2,446,341 | |
| | | | | | | | |
Total increase (decrease) | | | (19,379,535 | ) | | | 9,773,953 | |
| | |
Net Assets: | | | | | | | | |
Beginning of year | | | 68,600,333 | | | | 58,826,380 | |
| | | | | | | | |
End of year | | $ | 49,220,798 | | | $ | 68,600,333 | |
| | | | | | | | |
| * | For the year ended October 31, 2018, the Series has adopted amendments to Regulation S-X (refer to Note 9). |
See Notes to Financial Statements.
| | | | |
PGIM Jennison Global Infrastructure Fund | | | 27 | |
Notes to Financial Statements
Prudential World Fund, Inc. (the “Fund”) is registered under the Investment Company Act of 1940, as amended (“1940 Act”), as an open-end management investment company and currently consists of seven series: PGIM Jennison Emerging Markets Equity Opportunities Fund (formerly known as Prudential Jennison Emerging Markets Equity Fund), PGIM Jennison Global Opportunities Fund, PGIM Jennison International Opportunities Fund and PGIM QMA International Equity Fund, each of which are diversified funds and PGIM Jennison Global Infrastructure Fund, PGIM Emerging Markets Debt Hard Currency Fund and PGIM Emerging Markets Debt Local Currency Fund, each of which are non-diversified funds for purposes of the 1940 Act. These financial statements relate only to the PGIM Jennison Global Infrastructure Fund (the “Series”). Effective June 11, 2018, the names of the Series and the other series which comprise the Fund were changed by replacing “Prudential” with “PGIM” and each series’ Class Q shares were renamed Class R6 shares.
The investment objective of the Series is to achieve total return.
1. Accounting Policies
The Series follows the investment company accounting and reporting guidance of the Financial Accounting Standards Board (“FASB”) Accounting Standard Codification (“ASC”) Topic 946 Financial Services—Investment Companies. The following accounting policies conform to U.S. generally accepted accounting principles. The Series consistently follows such policies in the preparation of its financial statements.
Securities Valuation: The Series holds securities and other assets and liabilities that are fair valued at the close of each day (generally, 4:00 PM Eastern time) the New York Stock Exchange (“NYSE”) is open for trading. Fair value is the price that would be received to sell an asset or paid to transfer a liability in an orderly transaction between market participants on the measurement date. The Fund’s Board of Directors (the “Board”) has adopted valuation procedures for security valuation under which fair valuation responsibilities have been delegated to PGIM Investments LLC (“PGIM Investments” or the “Manager”). Pursuant to the Board’s delegation, a Valuation Committee has been established as two persons, being one or more officers of the Fund, including: the Fund’s Treasurer (or the Treasurer’s direct reports); and the Fund’s Chief or Deputy Chief Compliance Officer (or Vice-President-level direct reports of the Chief or Deputy Chief Compliance Officer). Under the current valuation procedures, the Valuation Committee of the Board is responsible for supervising the valuation of portfolio securities and other assets and liabilities. The valuation procedures permit the Series to utilize independent pricing vendor services, quotations from market makers, and alternative valuation methods when market quotations are either not readily available or not deemed representative of fair value. A record of the Valuation Committee’s actions is subject to the Board’s review, approval, and ratification at its next regularly scheduled quarterly meeting.
For the fiscal reporting period-end, securities and other assets and liabilities were fair valued at the close of the last U.S. business day. Trading in certain foreign securities may occur when the NYSE is closed (including weekends and holidays). Because such foreign securities trade in markets that are open on weekends and U.S. holidays, the values of some of the Series’ foreign investments may change on days when investors cannot purchase or redeem Series shares.
Various inputs determine how the Series’ investments are valued, all of which are categorized according to the three broad levels (Level 1, 2, or 3) detailed in the Schedule of Investments and referred to herein as the “fair value hierarchy” in accordance with FASB ASC Topic 820—Fair Value Measurements and Disclosures.
Common and preferred stocks, exchange-traded funds, and derivative instruments, such as futures or options, that are traded on a national securities exchange are valued at the last sale price as of the close of trading on the applicable exchange where the security principally trades. Securities traded via NASDAQ are valued at the NASDAQ official closing price. To the extent these securities are valued at the last sale price or NASDAQ official closing price, they are classified as Level 1 in the fair value hierarchy. In the event that no sale or official closing price on valuation date exists, these securities are generally valued at the mean between the last reported bid and ask prices, or at the last bid price in the absence of an ask price. These securities are classified as Level 2 in the fair value hierarchy.
Foreign equities traded on foreign securities exchanges are generally valued using pricing vendor services that provide model prices derived using adjustment factors based on information such as local closing price, relevant general and sector indices, currency fluctuations, depositary receipts, and futures, as applicable. Securities valued using such model prices are classified as Level 2 in the fair value hierarchy. The models generate an evaluated adjustment factor for each security, which is applied to the local closing price to adjust it for post closing market movements up to the time the Series is valued. Utilizing that evaluated adjustment factor, the vendor provides an evaluated price for each security. If the vendor does not provide an evaluated price, securities are valued in accordance with exchange-traded common and preferred stock valuation policies discussed above.
Investments in open-end, non-exchange-traded mutual funds are valued at their net asset values as of the close of the NYSE on the date of valuation. These securities are classified as Level 1 in the fair value hierarchy since they may be purchased or sold at their net asset values on the date of valuation.
Securities and other assets that cannot be priced according to the methods described above are valued based on pricing methodologies approved by the Board. In the event that unobservable inputs are used when determining such valuations, the securities will be classified as Level 3 in the fair value hierarchy.
When determining the fair value of securities, some of the factors influencing the valuation include: the nature of any restrictions on disposition of the securities; assessment of the
| | | | |
PGIM Jennison Global Infrastructure Fund | | | 29 | |
Notes to Financial Statements (continued)
general liquidity of the securities; the issuer’s financial condition and the markets in which it does business; the cost of the investment; the size of the holding and the capitalization of the issuer; the prices of any recent transactions or bids/offers for such securities or any comparable securities; any available analyst media or other reports or information deemed reliable by the Manager regarding the issuer or the markets or industry in which it operates. Using fair value to price securities may result in a value that is different from a security’s most recent closing price and from the price used by other unaffiliated mutual funds to calculate their net asset values.
Restricted and Illiquid Securities: Subject to guidelines adopted by the Board, the Series may invest up to 15% of its net assets in illiquid securities, including those which are restricted as to disposition under securities law (“restricted securities”). Restricted securities are valued pursuant to the valuation procedures noted above. Illiquid securities are those that, because of the absence of a readily available market or due to legal or contractual restrictions on resale, cannot be sold within seven days in the ordinary course of business at approximately the amount at which the Series has valued the investment. Therefore, the Series may find it difficult to sell illiquid securities at the time considered most advantageous by its subadviser and may incur transaction costs that would not be incurred in the sale of securities that were freely marketable. Certain securities that would otherwise be considered illiquid because of legal restrictions on resale to the general public may be traded among qualified institutional buyers under Rule 144A of the Securities Act of 1933. These Rule 144A securities, as well as commercial paper that is sold in private placements under Section 4(2) of the Securities Act, may be deemed liquid by the Series’ subadviser under the guidelines adopted by the Board of the Fund. However, the liquidity of the Series’ investments in Rule 144A securities could be impaired if trading does not develop or declines.
Foreign Currency Translation: The books and records of the Series are maintained in U.S. dollars. Foreign currency amounts are translated into U.S. dollars on the following basis:
(i) market value of investment securities, other assets and liabilities—at the current rates of exchange;
(ii) purchases and sales of investment securities, income and expenses—at the rates of exchange prevailing on the respective dates of such transactions.
Although the net assets of the Series are presented at the foreign exchange rates and market values at the close of the period, the Series does not generally isolate that portion of the results of operations arising as a result of changes in the foreign exchange rates from the fluctuations arising from changes in the market prices of long-term portfolio securities held at the end of the period. Similarly, the Series does not isolate the effect of changes in foreign
exchange rates from the fluctuations arising from changes in the market prices of long-term portfolio securities sold during the period. Accordingly, holding period realized foreign currency gains (losses) are included in the reported net realized gains (losses) on investment transactions.
Net realized gains (losses) on foreign currency transactions represent net foreign exchange gains (losses) from the disposition of holdings of foreign currencies, currency gains (losses) realized between the trade and settlement dates on securities transactions, and the difference between the amounts of interest, dividends and foreign withholding taxes recorded on the Series’ books and the U.S. dollar equivalent amounts actually received or paid. Net unrealized currency gains (losses) arise from valuing foreign currency denominated assets and liabilities (other than investments) at period end exchange rates.
Master Netting Arrangements: The Series is subject to various Master Agreements, or netting arrangements, with select counterparties. These are agreements which a subadviser may have negotiated and entered into on behalf of the Series. A master netting arrangement between the Series and the counterparty permits the Series to offset amounts payable by the Series to the same counterparty against amounts to be received; and by the receipt of collateral from the counterparty by the Series to cover the Series’ exposure to the counterparty. However, there is no assurance that such mitigating factors are easily enforceable. In addition to master netting arrangements, the right to set-off exists when all the conditions are met such that each of the parties owes the other determinable amounts, the reporting party has the right to set-off the amount owed with the amount owed by the other party, the reporting party intends to set-off and the right of set-off is enforceable by law. During the reporting period, there was no intention to settle on a net basis and all amounts are presented on a gross basis on the Statement of Assets and Liabilities.
Rights: The Series held rights acquired either through a direct purchase, included as part of a private placement, or pursuant to corporate actions. Rights entitle the holder to buy a proportionate amount of common stock, or such other security that the issuer may specify, at a specific price and time through the expiration dates. Such rights are held as long positions by the Series until exercised, sold or expired. Rights are valued at fair value in accordance with the Board approved fair valuation procedures.
Securities Lending: The Series lends its portfolio securities to banks and broker-dealers. The loans are secured by collateral at least equal to the market value of the securities loaned. Collateral pledged by each borrower is invested in an affiliated money market fund and is marked to market daily, based on the previous day’s market value, such that the value of the collateral exceeds the value of the loaned securities. In the event of significant appreciation in value of securities on loan on the last business day of the reporting period, the financial statements may reflect a collateral value that is less than the market value of the loaned securities. Such shortfall is remedied as described above. Loans are subject to termination at the option of the borrower or the Series. Upon termination of the loan, the borrower will return to the Series securities identical to the loaned securities. Should the borrower of the
| | | | |
| PGIM Jennison Global Infrastructure Fund | | | 31 | |
Notes to Financial Statements (continued)
securities fail financially, the Series has the right to repurchase the securities in the open market using the collateral.
The Series recognizes income, net of any rebate and securities lending agent fees, for lending its securities in the form of fees or interest on the investment of any cash received as collateral. The borrower receives all interest and dividends from the securities loaned and such payments are passed back to the lender in amounts equivalent thereto. The Series also continues to recognize any unrealized gain (loss) in the market price of the securities loaned and on the change in the value of the collateral invested that may occur during the term of the loan. In addition, realized gain (loss) is recognized on changes in the value of the collateral invested upon liquidation of the collateral. Net earnings from securities lending are disclosed on the Statement of Operations as “Income from securities lending, net”.
Equity and Mortgage Real Estate Investment Trusts (collectively equity REITs): The Series invests in equity REITs, which report information on the source of their distributions annually. Based on current and historical information, a portion of distributions received from equity REITs during the period is estimated to be dividend income, capital gain or return of capital and recorded accordingly. When material, these estimates are adjusted periodically when the actual source of distributions is disclosed by the equity REITs.
Securities Transactions and Net Investment Income: Securities transactions are recorded on the trade date. Realized gains (losses) from investment and currency transactions are calculated on the specific identification method. Dividend income is recorded on the ex-date. Expenses are recorded on an accrual basis, which may require the use of certain estimates by management that may differ from actual. Net investment income or loss (other than class specific expenses and waivers, which are allocated as noted below) and unrealized and realized gains (losses) are allocated daily to each class of shares based upon the relative proportion of adjusted net assets of each class at the beginning of the day. Class specific expenses and waivers, where applicable, are charged to the respective share classes. Class specific expenses include distribution fees and distribution fee waivers, shareholder servicing fees, transfer agent’s fees and expenses, registration fees and fee waivers and/or expense reimbursements, as applicable.
Taxes: It is the Series’ policy to continue to meet the requirements of the Internal Revenue Code applicable to regulated investment companies and to distribute all of its taxable net investment income and capital gains, if any, to its shareholders. Therefore, no federal income tax provision is required. Withholding taxes on foreign dividends, interest and capital gains, if any, are recorded, net of reclaimable amounts, at the time the related income is earned.
Dividends and Distributions: The Series expects to pay dividends from net investment income quarterly. Distributions from net realized capital and currency gains, if any, are declared and paid annually. Dividends and distributions to shareholders, which are determined in accordance with federal income tax regulations and which may differ from generally accepted accounting principles, are recorded on the ex-date. Permanent book/tax differences relating to income and gain (loss) are reclassified amongst total distributable earnings (loss) and paid-in capital in excess of par, as appropriate.
Estimates: The preparation of financial statements requires management to make estimates and assumptions that affect the reported amounts and disclosures in the financial statements. Actual results could differ from those estimates.
2. Agreements
The Fund, on behalf of the Series, has a management agreement with PGIM Investments. Pursuant to this agreement, PGIM Investments has responsibility for all investment advisory services and supervises the subadviser’s performance of such services. In addition, under the management agreement, PGIM Investments provides all of the administrative functions necessary for the organization, operation and management of the Series. PGIM Investments administers the corporate affairs of the Series and, in connection therewith, furnishes the Series with office facilities, together with those ordinary clerical and bookkeeping services which are not being furnished by the Series’ custodian and the Series’ transfer agent. PGIM Investments is also responsible for the staffing and management of dedicated groups of legal, marketing, compliance and related personnel necessary for the operation of the Series. The legal, marketing, compliance and related personnel are also responsible for the management and oversight of the various service providers to the Series, including, but not limited to, the custodian, transfer agent, and accounting agent.
PGIM Investments has entered into a subadvisory agreement with Jennison Associates LLC (“Jennison”). The subadvisory agreement provides that Jennison will furnish investment advisory services in connection with the management of the Series. In connection therewith, Jennison is obligated to keep certain books and records of the Series. PGIM Investments pays for the services of Jennison, the cost of compensation of officers of the Series, occupancy and certain clerical and bookkeeping costs of the Series. The Series bears all other costs and expenses.
The management fee paid to PGIM Investments is accrued daily and payable monthly at an annual rate of 1.000% of the Series’ average daily net assets up to $1 billion, 0.98% of the next $2 billion, 0.96% of the next $2 billion, 0.95% of the next $5 billion and 0.940% of the Series’ average daily net assets in excess of $10 billion. The effective management fee rate before any waivers and/or expense reimbursements was 1.000% for the year ended October 31, 2018.
PGIM Investments has contractually agreed, through February 28, 2019, to limit total annual operating expenses after fee waivers and/or expense reimbursements to 1.50% of
| | | | |
| PGIM Jennison Global Infrastructure Fund | | | 33 | |
Notes to Financial Statements (continued)
average daily net assets for Class A shares, 2.25% of average daily net assets for Class C shares, 1.25% of average daily net assets for Class Z shares, and 1.25% of average daily net assets for Class R6 shares. This contractual waiver excludes interest, brokerage, taxes (such as income and foreign withholding taxes, stamp duty and deferred tax expenses), acquired fund fees and expenses, extraordinary expenses, and certain other Series expenses such as dividend and interest expense and broker charges on short sales. Expenses waived/reimbursed by the Manager in accordance with this agreement may be recouped by the Manager within the same fiscal year during which such waiver/reimbursement is made if such recoupment can be realized without exceeding the expense limit in effect at the time of the recoupment for that fiscal year. Effective November 1, 2018, PGIM Investments has contractually agreed, through February 29, 2020, to limit total annual operating expenses after fee waivers and/or expense reimbursements to 1.50% of average daily net assets for Class A shares, 2.25% of average daily net assets for Class C shares, 1.17% of average daily net assets for Class Z shares, and 1.17% of average daily net assets for Class R6 shares.
Where applicable, PGIM Investments voluntarily agreed through October 31, 2018, to waive management fees or shared operating expenses on any share class to the same extent that it waives similar expenses on any other share class and, in addition, total annual operating expenses for Class R6 shares will not exceed total annual operating expenses for Class Z shares. Effective November 1, 2018 this voluntary agreement became part of the Series’ contractual waiver agreement through February 29, 2020 and is subject to recoupment by the Manager within the same fiscal year during which such wavier/reimbursement is made if such recoupment can be realized without exceeding the expense limit in effect at the time of the recoupment for that fiscal year.
The Fund, on behalf of the Series, has a distribution agreement with Prudential Investment Management Services LLC (“PIMS”), which acts as the distributor of the Class A, Class C, Class Z and Class R6 shares of the Series. The Series compensates PIMS for distributing and servicing the Series’ Class A and Class C shares, pursuant to the plans of distribution (the “Distribution Plans”), regardless of expenses actually incurred by PIMS. The distribution fees are accrued daily and payable monthly. No distribution or service fees are paid to PIMS as distributor of the Class Z and Class R6 shares of the Series.
Pursuant to the Distribution Plans, the Series compensates PIMS for distribution related activities at an annual rate of up to 0.30% and 1% of the average daily net assets of the Class A and Class C shares, respectively. PIMS has contractually agreed to limit such fees to 0.25% of the average daily net assets of the Class A shares through February 29, 2020.
PIMS has advised the Series that it received $16,921 in front-end sales charges resulting from sales of Class A shares during the year ended October 31, 2018. From these fees,
PIMS paid such sales charges to broker-dealers, who in turn paid commissions to salespersons and incurred other distribution costs.
PIMS has advised the Series that for the year ended October 31, 2018, it received $22 and $99 in contingent deferred sales charges imposed upon redemptions by certain Class A and Class C shareholders, respectively.
PGIM Investments, PIMS and Jennison are indirect, wholly-owned subsidiaries of Prudential Financial, Inc. (“Prudential”).
3. Other Transactions with Affiliates
Prudential Mutual Fund Services LLC (“PMFS”), an affiliate of PGIM Investments and an indirect, wholly-owned subsidiary of Prudential, serves as the Series’ transfer agent. Transfer agent’s fees and expenses in the Statement of Operations include certain out-of-pocket expenses paid to non-affiliates, where applicable.
The Series may enter into certain securities purchase or sale transactions under Board approved Rule 17a-7 procedures. Rule 17a-7 is an exemptive rule under the 1940 Act, that subject to certain conditions, permits purchase and sale transactions among affiliated investment companies, or between an investment company and a person that is affiliated solely by reason of having a common (or affiliated) investment adviser, common directors, and/or common officers. Such transactions are subject to ratification by the Board. For the reporting period ended October 31, 2018, no such transactions were entered into by the Series.
The Series may invest its overnight sweep cash in the PGIM Core Ultra Short Bond Fund (the “Core Fund”), and its securities lending cash collateral in the PGIM Institutional Money Market Fund (the “Money Market Fund”), each a series of Prudential Investment Portfolios 2, registered under the 1940 Act and managed by PGIM Investments. For the reporting period ended October 31, 2018, PGIM, Inc. was compensated $249 by PGIM Investments for managing the Series’ securities lending cash collateral as subadviser to the Money Market Fund. Earnings from the Core Fund and Money Market Fund are disclosed on the Statement of Operations as “Affiliated dividend income” and “Income from securities lending, net”, respectively.
4. Portfolio Securities
The aggregate cost of purchases and proceeds from sales of portfolio securities (excluding short-term investments and U.S. Government securities) for the year ended October 31, 2018, were $44,447,856 and $62,263,392, respectively.
A summary of the cost of purchases and proceeds from sales of shares of affiliated mutual funds for the year ended October 31, 2018, is presented as follows:
| | | | |
PGIM Jennison Global Infrastructure Fund | | | 35 | |
Notes to Financial Statements (continued)
| | | | | | | | | | | | | | | | | | | | | | | | | | | | | | |
Value, Beginning
of Year | | | Cost of
Purchases | | | Proceeds
from Sales | | | Change in
Unrealized
Gain
(Loss) | | | Realized
Gain
(Loss) | | | Value,
End of
Year | | | Shares,
End of
Year | | | Income | |
| | PGIM Core Ultra Short Bond Fund* | | | | | | | | | | | | | |
| $ | 135,581 | | | $ | 43,622,435 | | | $ | 42,028,542 | | | $ | — | | | $ | — | | | $ | 1,729,474 | | | | 1,729,474 | | | $ | 20,273 | |
| | | |
| | PGIM Institutional Money Market Fund* | | | | | | | | | | | | | |
| | — | | | | 2,435,717 | | | | 2,435,696 | | | | — | | | | (21 | ) | | | — | | | | — | | | | 529 | ** |
| | | | | | | | | | | | | | | | | | | | | | | | | | | | | | |
| $ | 135,581 | | | $ | 46,058,152 | | | $ | 44,464,238 | | | $ | — | | | $ | (21 | ) | | $ | 1,729,474 | | | | | | | $ | 20,802 | |
| | | | | | | | | | | | | | | | | | | | | | | | | | | | | | |
| * | The Fund did not have any capital gain distributions during the reporting period. |
| ** | This amount is included in “Income from securities lending, net” on the Statement of Operations. |
5. Distributions and Tax Information
Distributions to shareholders, which are determined in accordance with federal income tax regulations and which may differ from generally accepted accounting principles, are recorded on the ex-date. In order to present total distributable earnings (loss) and paid-in capital in excess of par on the Statement of Assets and Liabilities that more closely represent their tax character, certain adjustments have been made to total distributable earnings (loss) and paid-in capital in excess of par. For the year ended October 31, 2018, the adjustments were to decrease total distributable earnings and increase paid-in capital in excess of par by $239,302 due to differences in the treatment for book and tax purposes of certain transactions involving partnership investments. Net investment income, net realized gain (loss) on investments and foreign currency transactions and net assets were not affected by this change.
For the year ended October 31, 2018, the tax character of dividends paid by the Series was $861,939 of ordinary income. For the year ended October 31, 2017, the tax character of dividends paid by the Series was $697,835 of ordinary income and $344,957 of tax return of capital.
As of October 31, 2018, the accumulated undistributed earnings on a tax basis was $107,833 of ordinary income.
The United States federal income tax basis of the Series’ investments and the net unrealized appreciation as of October 31, 2018 were as follows:
| | | | | | |
Tax Basis | | Gross Unrealized Appreciation | | Gross Unrealized Depreciation | | Net Unrealized
Appreciation |
| $44,099,600 | | $6,607,495 | | $(1,928,458) | | $4,679,037 |
The difference between book basis and tax basis was primarily due to deferred losses on wash sales.
For federal income tax purposes, the Series had a capital loss carryforward as of October 31, 2018 of approximately $4,534,000 which can be carried forward for an unlimited period. The Series utilized approximately $1,795,000 of its capital loss carryforward during the fiscal year ended October 31, 2018 to offset capital gains. No capital gains distributions are expected to be paid to shareholders until net gains have been realized in excess of such losses.
Management has analyzed the Series’ tax positions taken on federal, state and local income tax returns for all open tax years and has concluded that no provision for income tax is required in the Series’ financial statements for the current reporting period. The Series’ federal, state and local income and federal excise tax returns for tax years for which the applicable statutes of limitations have not expired are subject to examination by the Internal Revenue Service and state departments of revenue.
6. Capital and Ownership
The Series offers Class A, Class C, Class Z and Class R6 shares. Class A shares are sold with a maximum front-end sales charge of 5.50%. Investors who purchase $1 million or more of Class A shares and sell these shares within 12 months of purchase are subject to a contingent deferred sales charge (“CDSC”) of 1%, although they are not subject to an initial sales charge. The Class A CDSC is waived for certain retirement and/or benefit plans. A special exchange privilege is also available for shareholders who qualified to purchase Class A shares at net asset value. Class C shares are sold with a CDSC of 1% on sales made within 12 months of purchase. Class Z and Class R6 shares are not subject to any sales or redemption charge and are available exclusively for sale to a limited group of investors.
Under certain circumstances, an exchange may be made from specified share classes of the Series to one or more other share classes of the Series as presented in the table of transactions in shares of common stock.
The Fund is authorized to issue 5.075 billion shares of common stock, with a par value of $0.01 per share, which is divided into seven series. There are 510 million shares authorized for the Series, divided into five classes, designated Class A, Class C, Class Z, Class R6 and Class T common stock, each of which consists of 20 million, 100 million, 150 million,
| | | | |
| PGIM Jennison Global Infrastructure Fund | | | 37 | |
Notes to Financial Statements (continued)
125 million and 115 million authorized shares, respectively. The Series currently does not have any Class T shares outstanding.
As of October 31, 2018, Prudential, through its affiliated entities, including affiliated funds (if applicable), owned 539,085 Class Z shares and 1,139,164 Class R6 shares of the Series. At reporting period end, six shareholders of record held 81% of the Series’ outstanding shares on behalf of multiple beneficial owners, of which 42% were held by an affiliate of Prudential.
Transactions in shares of common stock were as follows:
| | | | | | | | |
Class A | | Shares | | | Amount | |
Year ended October 31, 2018: | | | | | | | | |
Shares sold | | | 150,283 | | | $ | 2,002,747 | |
Shares issued in reinvestment of dividends and distributions | | | 10,691 | | | | 139,976 | |
Shares reacquired | | | (270,926 | ) | | | (3,544,143 | ) |
| | | | | | | | |
Net increase (decrease) in shares outstanding before conversion | | | (109,952 | ) | | | (1,401,420 | ) |
Shares issued upon conversion from other share class(es) | | | 758 | | | | 10,337 | |
Shares reacquired upon conversion into other share class(es) | | | (125,190 | ) | | | (1,689,355 | ) |
| | | | | | | | |
Net increase (decrease) in shares outstanding | | | (234,384 | ) | | $ | (3,080,438 | ) |
| | | | | | | | |
Year ended October 31, 2017: | | | | | | | | |
Shares sold | | | 279,822 | | | $ | 3,391,012 | |
Shares issued in reinvestment of dividends and distributions | | | 13,824 | | | | 168,066 | |
Shares reacquired | | | (184,608 | ) | | | (2,241,919 | ) |
| | | | | | | | |
Net increase (decrease) in shares outstanding before conversion | | | 109,038 | | | | 1,317,159 | |
Shares issued upon conversion from other share class(es) | | | 9,426 | | | | 116,828 | |
Shares reacquired upon conversion into other share class(es) | | | (280,568 | ) | | | (3,367,052 | ) |
| | | | | | | | |
Net increase (decrease) in shares outstanding | | | (162,104 | ) | | $ | (1,933,065 | ) |
| | | | | | | | |
| | |
Class C | | | | | | |
Year ended October 31, 2018: | | | | | | | | |
Shares sold | | | 29,037 | | | $ | 377,809 | |
Shares issued in reinvestment of dividends and distributions | | | 2,793 | | | | 36,467 | |
Shares reacquired | | | (154,412 | ) | | | (2,008,194 | ) |
| | | | | | | | |
Net increase (decrease) in shares outstanding before conversion | | | (122,582 | ) | | | (1,593,918 | ) |
Shares reacquired upon conversion into other share class(es) | | | (4,383 | ) | | | (57,241 | ) |
| | | | | | | | |
Net increase (decrease) in shares outstanding | | | (126,965 | ) | | $ | (1,651,159 | ) |
| | | | | | | | |
Year ended October 31, 2017: | | | | | | | | |
Shares sold | | | 143,195 | | | $ | 1,702,514 | |
Shares issued in reinvestment of dividends and distributions | | | 4,347 | | | | 52,151 | |
Shares reacquired | | | (149,323 | ) | | | (1,820,597 | ) |
| | | | | | | | |
Net increase (decrease) in shares outstanding before conversion | | | (1,781 | ) | | | (65,932 | ) |
Shares reacquired upon conversion into other share class(es) | | | (24,441 | ) | | | (298,815 | ) |
| | | | | | | | |
Net increase (decrease) in shares outstanding | | | (26,222 | ) | | $ | (364,747 | ) |
| | | | | | | | |
| | | | | | | | |
Class Z | | Shares | | | Amount | |
Year ended October 31, 2018: | | | | | | | | |
Shares sold | | | 301,204 | | | $ | 3,928,359 | |
Shares issued in reinvestment of dividends and distributions | | | 32,956 | | | | 430,887 | |
Shares reacquired | | | (782,129 | ) | | | (10,173,430 | ) |
| | | | | | | | |
Net increase (decrease) in shares outstanding before conversion | | | (447,969 | ) | | | (5,814,184 | ) |
Shares issued upon conversion from other share class(es) | | | 129,445 | | | | 1,746,596 | |
Shares reacquired upon conversion into other share class(es) | | | (758 | ) | | | (10,337 | ) |
| | | | | | | | |
Net increase (decrease) in shares outstanding | | | (319,282 | ) | | $ | (4,077,925 | ) |
| | | | | | | | |
Year ended October 31, 2017: | | | | | | | | |
Shares sold | | | 758,227 | | | $ | 9,087,558 | |
Shares issued in reinvestment of dividends and distributions | | | 45,023 | | | | 542,551 | |
Shares reacquired | | | (963,920 | ) | | | (11,483,699 | ) |
| | | | | | | | |
Net increase (decrease) in shares outstanding before conversion | | | (160,670 | ) | | | (1,853,590 | ) |
Shares issued upon conversion from other share class(es) | | | 296,886 | | | | 3,566,596 | |
Shares reacquired upon conversion into other share class(es) | | | (1,443,112 | ) | | | (16,437,911 | ) |
| | | | | | | | |
Net increase (decrease) in shares outstanding | | | (1,306,896 | ) | | $ | (14,724,905 | ) |
| | | | | | | | |
| | |
Class R6 | | | | | | |
Year ended October 31, 2018: | | | | | | | | |
Shares sold | | | 693,401 | | | $ | 9,146,111 | |
Shares issued in reinvestment of dividends and distributions | | | 17,751 | | | | 232,070 | |
Shares reacquired | | | (1,255,493 | ) | | | (16,419,500 | ) |
| | | | | | | | |
Net increase (decrease) in shares outstanding | | | (544,341 | ) | | $ | (7,041,319 | ) |
| | | | | | | | |
Period ended October 31, 2017*: | | | | | | | | |
Shares sold | | | 851,072 | | | $ | 10,645,862 | |
Shares issued in reinvestment of dividends and distributions | | | 18,790 | | | | 239,018 | |
Shares reacquired | | | (628,004 | ) | | | (7,836,176 | ) |
| | | | | | | | |
Net increase (decrease) in shares outstanding before conversion | | | 241,858 | | | | 3,048,704 | |
Shares issued upon conversion from other share class(es) | | | 1,441,647 | | | | 16,420,354 | |
| | | | | | | | |
Net increase (decrease) in shares outstanding | | | 1,683,505 | | | $ | 19,469,058 | |
| | | | | | | | |
| * | Commencement of operations was December 28, 2016. |
7. Borrowings
The Fund, on behalf of the Series, along with other affiliated registered investment companies (the “Funds”), is a party to a Syndicated Credit Agreement (“SCA”) with a group of banks. The purpose of the SCA is to provide an alternative source of temporary funding for capital share redemptions. The SCA provides for a commitment of $900 million for the period October 4, 2018 through October 3, 2019. The Funds pay an annualized commitment fee of 0.15% of the unused portion of the SCA. The Series’ portion of the commitment fee for the unused amount, allocated based upon a method approved by the Board, is accrued daily and paid quarterly. Prior to October 4, 2018, the Funds had another SCA that provided a commitment of $900 million and the Funds paid an annualized commitment fee of 0.15% of the unused portion of the SCA. The interest on borrowings under both SCAs is paid monthly and at a per annum interest rate based upon a contractual spread plus the higher of (1) the effective federal funds rate, (2) the 1-month LIBOR rate or (3) zero percent.
| | | | |
| PGIM Jennison Global Infrastructure Fund | | | 39 | |
Notes to Financial Statements (continued)
Other affiliated registered investment companies that are parties to the SCA include portfolios that are subject to a predetermined mathematical formula used to manage certain benefit guarantees offered under variable annuity contracts. The formula may result in large scale asset flows into and out of these portfolios. Consequently, these portfolios may be more likely to utilize the SCA for purposes of funding redemptions. It may be possible for those portfolios to fully exhaust the committed amount of the SCA, thereby requiring the Manager to allocate available funding per a Board-approved methodology designed to treat the Funds in the SCA equitably.
The Series utilized the SCA during the reporting period ended October 31, 2018. The average daily balance for the 15 days that the Series had loans outstanding during the period was $1,063,667 borrowed at a weighted average interest rate of 3.11%. The maximum loan balance outstanding during the period was $3,353,000. At October 31, 2018, the Series did not have an outstanding loan balance.
8. Risks of Investing in the Series
The Series’ risks include, but are not limited to, some or all of the risks discussed below:
Equity and Equity-Related Securities Risks: The value of a particular security could go down and you could lose money. In addition to an individual security losing value, the value of the equity markets or a sector in which the Series invests could go down. The Series’ holdings can vary significantly from broad market indexes and the performance of the Series can deviate from the performance of these indexes. Different parts of a market can react differently to adverse issuer, market, regulatory, political and economic developments.
Foreign Securities Risk: The Series’ investments in securities of foreign issuers or issuers with significant exposure to foreign markets involve additional risk. Foreign countries in which the Series may invest may have markets that are less liquid, less regulated and more volatile than US markets. The value of the Series’ investments may decline because of factors affecting the particular issuer as well as foreign markets and issuers generally, such as unfavorable government actions, and political or financial instability.
Non-diversification Risk: The Series is non-diversified, meaning that the Series may invest a greater percentage of its assets in the securities of a single company or industry than a diversified fund. Investing in a non-diversified fund involves greater risk than investing in a diversified fund because a loss resulting from the decline in value of any one security may represent a greater portion of the total assets of a non-diversified fund.
Risks of Investing in Infrastructure Companies: Securities of infrastructure companies are more susceptible to adverse economic, social, political and regulatory occurrences affecting
their industries. Infrastructure companies may be subject to a variety of factors that may adversely affect their business or operations, including high interest costs in connection with capital construction programs, high leverage, costs associated with environmental and other regulations, the effects of economic slowdown, surplus capacity, insufficient supply of necessary resources, increased competition from other providers of similar services, uncertainties concerning the availability of fuel at reasonable prices, the effects of energy conservation policies and other factors. Certain infrastructure companies may operate in limited areas or have few sources of revenue.
9. Recent Accounting Pronouncements and Reporting Updates
In August 2018, the Securities and Exchange Commission (the “SEC”) adopted amendments to Regulation S-X to update and simplify the disclosure requirements for registered investment companies by eliminating requirements that are redundant or duplicative of US GAAP requirements or other SEC disclosure requirements. The new amendments require the presentation of the total, rather than the components, of distributable earnings on the Statement of Assets and Liabilities and the total, rather than the components, of dividends from net investment income and distributions from net realized gains on the Statements of Changes in Net Assets. The amendments also removed the requirement for the parenthetical disclosure of undistributed net investment income on the Statements of Changes in Net Assets and certain tax adjustments that were reflected in the Notes to Financial Statements. All of these have been reflected in the Series’ financial statements.
In August 2018, the FASB issued Accounting Standards Update (“ASU”) No. 2018-13, which changes certain fair value measurement disclosure requirements. The new ASU, in addition to other modifications and additions, removes the requirement to disclose the amount and reasons for transfers between Level 1 and Level 2 of the fair value hierarchy, and the Series’ policy for the timing of transfers between levels. The amendments are effective for financial statements issued for fiscal years beginning after December 15, 2019, and interim periods within those fiscal years. Management has evaluated the implications of certain provisions of the ASU and has determined to early adopt aspects related to the removal and modification of certain fair value measurement disclosures under the ASU effective immediately. At this time, management is evaluating the implications of certain other provisions of the ASU related to new disclosure requirements and any impact on the financial statement disclosures has not yet been determined.
| | | | |
PGIM Jennison Global Infrastructure Fund | | | 41 | |
Financial Highlights
| | | | | | | | | | | | | | | | | | | | |
| Class A Shares | | | | | | | | | | | | | | | |
| | | Year Ended October 31, | |
| | | 2018 | | | 2017 | | | 2016 | | | 2015 | | | 2014 | |
| Per Share Operating Performance(a): | | | | | | | | | | | | | | | | | | | | |
| Net Asset Value, Beginning of Year | | | $13.05 | | | | $11.61 | | | | $11.48 | | | | $12.62 | | | | $10.42 | |
| Income (loss) from investment operations: | | | | | | | | | | | | | | | | | | | | |
| Net investment income (loss) | | | 0.16 | | | | 0.14 | | | | 0.09 | | | | 0.06 | | | | 0.09 | |
| Net realized and unrealized gain (loss) on investment and foreign currency transactions | | | (0.81 | ) | | | 1.49 | | | | 0.21 | | | | (1.12 | ) | | | 2.26 | |
| Total from investment operations | | | (0.65 | ) | | | 1.63 | | | | 0.30 | | | | (1.06 | ) | | | 2.35 | |
| Less Dividends and Distributions: | | | | | | | | | | | | | | | | | | | | |
| Dividends from net investment income | | | (0.19 | ) | | | (0.13 | ) | | | (0.08 | ) | | | (0.05 | ) | | | (0.14 | ) |
| Tax return of capital distributions | | | - | | | | (0.06 | ) | | | (0.09 | ) | | | (0.03 | ) | | | - | |
| Distributions from net realized gains | | | - | | | | - | | | | - | | | | - | | | | (0.01 | ) |
| Total dividends and distributions | | | (0.19 | ) | | | (0.19 | ) | | | (0.17 | ) | | | (0.08 | ) | | | (0.15 | ) |
| Net asset value, end of year | | | $12.21 | | | | $13.05 | | | | $11.61 | | | | $11.48 | | | | $12.62 | |
| Total Return(b): | | | (5.10)% | | | | 14.15% | | | | 2.62% | | | | (8.46)% | | | | 22.67% | |
| |
| Ratios/Supplemental Data: | | | | | | | | | | | | | | | |
| Net assets, end of year (000) | | | $8,073 | | | | $11,689 | | | | $12,277 | | | | $22,353 | | | | $15,521 | |
| Average net assets (000) | | | $10,218 | | | | $11,433 | | | | $16,694 | | | | $22,695 | | | | $4,906 | |
| Ratios to average net assets(c): | | | | | | | | | | | | | | | | | | | | |
| Expenses after waivers and/or expense reimbursement | | | 1.50% | | | | 1.50% | | | | 1.50% | | | | 1.50% | | | | 1.50% | |
| Expenses before waivers and/or expense reimbursement | | | 2.00% | (d) | | | 1.81% | | | | 1.79% | | | | 1.78% | | | | 1.95% | |
| Net investment income (loss) | | | 1.21% | | | | 1.10% | | | | 0.76% | | | | 0.52% | | | | 0.73% | |
| Portfolio turnover rate(e) | | | 75% | | | | 80% | | | | 82% | | | | 94% | | | | 49% | |
| (a) | Calculated based on average shares outstanding during the year. |
| (b) | Total return does not consider the effects of sales loads. Total return is calculated assuming a purchase of a share on the first day and a sale on the last day of each year reported and includes reinvestment of dividends and distributions, if any. Total returns may reflect adjustments to conform to generally accepted accounting principles. |
| (c) | Does not include expenses of the underlying funds in which the Series invests. |
| (d) | Effective November 1, 2017, class specific expenses include transfer agent fees and expenses and registration fees, which are charged to their respective share class. |
| (e) | The Series’ portfolio turnover rate is calculated in accordance with regulatory requirements, without regard to transactions involving short term investments and certain derivatives. If such transactions were included, the Series’ portfolio turnover rate may be higher. |
See Notes to Financial Statements.
| | | | | | | | | | | | | | | | | | | | |
| Class C Shares | | | | | | | | | | | | | | | |
| | | Year Ended October 31, | |
| | | 2018 | | | 2017 | | | 2016 | | | 2015 | | | 2014 | |
| Per Share Operating Performance(a): | | | | | | | | | | | | | | | | | | | | |
| Net Asset Value, Beginning of Year | | | $12.97 | | | | $11.55 | | | | $11.42 | | | | $12.58 | | | | $10.41 | |
| Income (loss) from investment operations: | | | | | | | | | | | | | | | | | | | | |
| Net investment income (loss) | | | 0.06 | | | | 0.04 | | | | - | (b) | | | (0.03 | ) | | | 0.01 | |
| Net realized and unrealized gain (loss) on investment and foreign currency transactions | | | (0.81 | ) | | | 1.50 | | | | 0.21 | | | | (1.13 | ) | | | 2.25 | |
| Total from investment operations | | | (0.75 | ) | | | 1.54 | | | | 0.21 | | | | (1.16 | ) | | | 2.26 | |
| Less Dividends and Distributions: | | | | | | | | | | | | | | | | | | | | |
| Dividends from net investment income | | | (0.10 | ) | | | (0.08 | ) | | | (0.04 | ) | | | - | (b) | | | (0.08 | ) |
| Tax return of capital distributions | | | - | | | | (0.04 | ) | | | (0.04 | ) | | | - | (b) | | | - | |
| Distributions from net realized gains | | | - | | | | - | | | | - | | | | - | | | | (0.01 | ) |
| Total dividends and distributions | | | (0.10 | ) | | | (0.12 | ) | | | (0.08 | ) | | | - | | | | (0.09 | ) |
| Net asset value, end of year | | | $12.12 | | | | $12.97 | | | | $11.55 | | | | $11.42 | | | | $12.58 | |
| Total Return(c): | | | (5.82)% | | | | 13.39% | | | | 1.88% | | | | (9.21)% | | | | 21.76% | |
| |
| Ratios/Supplemental Data: | | | | | | | | | | | | | | | |
| Net assets, end of year (000) | | | $4,162 | | | | $6,101 | | | | $5,738 | | | | $6,775 | | | | $3,835 | |
| Average net assets (000) | | | $5,464 | | | | $6,111 | | | | $5,783 | | | | $6,353 | | | | $1,104 | |
| Ratios to average net assets(d): | | | | | | | | | | | | | | | | | | | | |
| Expenses after waivers and/or expense reimbursement | | | 2.25% | | | | 2.25% | | | | 2.25% | | | | 2.25% | | | | 2.25% | |
| Expenses before waivers and/or expense reimbursement | | | 2.81% | (e) | | | 2.51% | | | | 2.49% | | | | 2.48% | | | | 2.70% | |
| Net investment income (loss) | | | 0.48% | | | | 0.34% | | | | (0.02)% | | | | (0.22)% | | | | 0.12% | |
| Portfolio turnover rate(f) | | | 75% | | | | 80% | | | | 82% | | | | 94% | | | | 49% | |
| (a) | Calculated based on average shares outstanding during the year. |
| (b) | Less than $0.005 per share. |
| (c) | Total return does not consider the effects of sales loads. Total return is calculated assuming a purchase of a share on the first day and a sale on the last day of each year reported and includes reinvestment of dividends and distributions, if any. Total returns may reflect adjustments to conform to generally accepted accounting principles. |
| (d) | Does not include expenses of the underlying funds in which the Series invests. |
| (e) | Effective November 1, 2017, class specific expenses include transfer agent fees and expenses and registration fees, which are charged to their respective share class. |
| (f) | The Series’ portfolio turnover rate is calculated in accordance with regulatory requirements, without regard to transactions involving short term investments and certain derivatives. If such transactions were included, the Series’ portfolio turnover rate may be higher. |
See Notes to Financial Statements.
| | | | |
| PGIM Jennison Global Infrastructure Fund | | | 43 | |
Financial Highlights (continued)
| | | | | | | | | | | | | | | | | | | | |
| Class Z Shares | | | | | | | | | | | | | | | |
| | | Year Ended October 31, | |
| | | 2018 | | | 2017 | | | 2016 | | | 2015 | | | 2014 | |
| Per Share Operating Performance(a): | | | | | | | | | | | | | | | | | | | | |
| Net Asset Value, Beginning of Year | | | $13.06 | | | | $11.61 | | | | $11.47 | | | | $12.62 | | | | $10.42 | |
| Income (loss) from investment operations: | | | | | | | | | | | | | | | | | | | | |
| Net investment income (loss) | | | 0.19 | | | | 0.18 | | | | 0.11 | | | | 0.09 | | | | 0.22 | |
| Net realized and unrealized gain (loss) on investment and foreign currency transactions | | | (0.82 | ) | | | 1.49 | | | | 0.23 | | | | (1.13 | ) | | | 2.15 | |
| Total from investment operations | | | (0.63 | ) | | | 1.67 | | | | 0.34 | | | | (1.04 | ) | | | 2.37 | |
| Less Dividends and Distributions: | | | | | | | | | | | | | | | | | | | | |
| Dividends from net investment income | | | (0.22 | ) | | | (0.14 | ) | | | (0.09 | ) | | | (0.08 | ) | | | (0.16 | ) |
| Tax return of capital distributions | | | - | | | | (0.08 | ) | | | (0.11 | ) | | | (0.03 | ) | | | - | |
| Distributions from net realized gains | | | - | | | | - | | | | - | | | | - | | | | (0.01 | ) |
| Total dividends and distributions | | | (0.22 | ) | | | (0.22 | ) | | | (0.20 | ) | | | (0.11 | ) | | | (0.17 | ) |
| Net asset value, end of year | | | $12.21 | | | | $13.06 | | | | $11.61 | | | | $11.47 | | | | $12.62 | |
| Total Return(b): | | | (4.94)% | | | | 14.51% | | | | 2.96% | | | | (8.28)% | | | | 22.91% | |
| | | | | |
| Ratios/Supplemental Data: | | | | | | | | | | | | | | | |
| Net assets, end of year (000) | | | $23,074 | | | | $28,831 | | | | $40,811 | | | | $47,305 | | | | $31,788 | |
| Average net assets (000) | | | $27,549 | | | | $29,597 | | | | $40,236 | | | | $42,210 | | | | $20,117 | |
| Ratios to average net assets(c): | | | | | | | | | | | | | | | | | | | | |
| Expenses after waivers and/or expense reimbursement | | | 1.25% | | | | 1.25% | | | | 1.25% | | | | 1.25% | | | | 1.25% | |
| Expenses before waivers and/or expense reimbursement | | | 1.52% | (d) | | | 1.51% | | | | 1.49% | | | | 1.48% | | | | 2.08% | |
| Net investment income (loss) | | | 1.45% | | | | 1.49% | | | | 0.94% | | | | 0.75% | | | | 1.79% | |
| Portfolio turnover rate(e) | | | 75% | | | | 80% | | | | 82% | | | | 94% | | | | 49% | |
| (a) | Calculated based on average shares outstanding during the year. |
| (b) | Total return is calculated assuming a purchase of a share on the first day and a sale on the last day of each year reported and includes reinvestment of dividends and distributions, if any. Total returns may reflect adjustments to conform to generally accepted accounting principles. |
| (c) | Does not include expenses of the underlying funds in which the Series invests. |
| (d) | Effective November 1, 2017, class specific expenses include transfer agent fees and expenses and registration fees, which are charged to their respective share class. |
| (e) | The Series’ portfolio turnover rate is calculated in accordance with regulatory requirements, without regard to transactions involving short term investments and certain derivatives. If such transactions were included, the Series’ portfolio turnover rate may be higher. |
See Notes to Financial Statements.
| | | | | | | | | | | | |
| Class R6 Shares | | | | | | | | | |
| | | Year Ended
October 31,
2018 | | | | | | December 28,
2016(a)
through
October 31,
2017 | |
| Per Share Operating Performance(b): | | | | | | | | | | | | |
| Net Asset Value, Beginning of Period | | | $13.06 | | | | | | | | $11.39 | |
| Income (loss) from investment operations: | | | | | | | | | | | | |
| Net investment income (loss) | | | 0.18 | | | | | | | | 0.11 | |
| Net realized and unrealized gain (loss) on investment and foreign currency transactions | | | (0.81 | ) | | | | | | | 1.71 | |
| Total from investment operations | | | (0.63 | ) | | | | | | | 1.82 | |
| Less Dividends and Distributions: | | | | | | | | | | | | |
| Dividends from net investment income | | | (0.22 | ) | | | | | | | (0.10 | ) |
| Tax return of capital distributions | | | - | | | | | | | | (0.05 | ) |
| Total dividends and distributions | | | (0.22 | ) | | | | | | | (0.15 | ) |
| Net asset value, end of period | | | $12.21 | | | | | | | | $13.06 | |
| Total Return(c): | | | (4.94)% | | | | | | | | 16.02% | |
| |
| Ratios/Supplemental Data: | | | | | | | | | |
| Net assets, end of period (000) | | | $13,912 | | | | | | | | $21,979 | |
| Average net assets (000) | | | $17,657 | | | | | | | | $19,274 | |
| Ratios to average net assets(d): | | | | | | | | | | | | |
| Expenses after waivers and/or expense reimbursement | | | 1.25% | | | | | | | | 1.25% | (e) |
| Expenses before waivers and/or expense reimbursement | | | 1.44% | (f) | | | | | | | 1.40% | (e) |
| Net investment income (loss) | | | 1.39% | | | | | | | | 1.00% | (e) |
| Portfolio turnover rate(g) | | | 75% | | | | | | | | 80% | |
| (a) | Commencement of offering. |
| (b) | Calculated based on average shares outstanding during the period. |
| (c) | Total return is calculated assuming a purchase of a share on the first day and a sale on the last day of each period reported and includes reinvestment of dividends and distributions, if any. Total returns may reflect adjustments to conform to generally accepted accounting principles. Total returns for periods less than one full year are not annualized. |
| (d) | Does not include expenses of the underlying funds in which the Series invests. |
| (f) | Effective November 1, 2017, class specific expenses include transfer agent fees and expenses and registration fees, which are charged to their respective share class. |
| (g) | The Series’ portfolio turnover rate is calculated in accordance with regulatory requirements, without regard to transactions involving short term investments and certain derivatives. If such transactions were included, the Series’ portfolio turnover rate may be higher. |
See Notes to Financial Statements.
| | | | |
| PGIM Jennison Global Infrastructure Fund | | | 45 | |
Report of Independent Registered Public
Accounting Firm
The Board of Directors and Shareholders
Prudential World Fund, Inc.:
Opinion on the Financial Statements
We have audited the accompanying statement of assets and liabilities of PGIM Jennison Global Infrastructure Fund (formerly Prudential Jennison Global Infrastructure Fund) (the “Fund”), a series of Prudential World Fund, Inc., including the schedule of investments, as of October 31, 2018, the related statement of operations for the year then ended, the statements of changes in net assets for each of the years in the two-year period then ended, and the related notes (collectively, the financial statements) and the financial highlights for the years or periods indicated therein. In our opinion, the financial statements and financial highlights present fairly, in all material respects, the financial position of the Fund as of October 31, 2018, the results of its operations for the year then ended, the changes in its net assets for each of the years in the two-year period then ended, and the financial highlights for the years or periods indicated therein, in conformity with U.S. generally accepted accounting principles.
Basis for Opinion
These financial statements and financial highlights are the responsibility of the Fund’s management. Our responsibility is to express an opinion on these financial statements and financial highlights based on our audits. We are a public accounting firm registered with the Public Company Accounting Oversight Board (United States) (“PCAOB”) and are required to be independent with respect to the Fund in accordance with the U.S. federal securities laws and the applicable rules and regulations of the Securities and Exchange Commission and the PCAOB.
We conducted our audits in accordance with the standards of the PCAOB. Those standards require that we plan and perform the audit to obtain reasonable assurance about whether the financial statements and financial highlights are free of material misstatement, whether due to error or fraud. Our audits included performing procedures to assess the risks of material misstatement of the financial statements and financial highlights, whether due to error or fraud, and performing procedures that respond to those risks. Such procedures included examining, on a test basis, evidence regarding the amounts and disclosures in the financial statements and financial highlights. Such procedures also included confirmation of securities owned as of October 31, 2018, by correspondence with the custodians, transfer agents and brokers or by other appropriate auditing procedures when replies from brokers were not received. Our audits also included evaluating the accounting principles used and significant estimates made by management, as well as evaluating the overall presentation of the financial statements and financial highlights. We believe that our audits provide a reasonable basis for our opinion.

We have served as the auditor of one or more PGIM and/or Prudential Retail investment companies since 2003.
New York, New York
December 17, 2018
Federal Income Tax Information (unaudited)
For the year ended October 31, 2018, the Series reports under Section 854 of the Internal Revenue Code, the following percentages of the ordinary income dividends paid as 1) qualified dividend income (QDI); and 2) eligible for corporate dividends received deduction (DRD):
| | | | | | | | |
| | | QDI | | | DRD | |
PGIM Jennison Global Infrastructure Fund | | | 100.00 | % | | | 59.69 | % |
In January 2019, you will be advised on IRS Form 1099-DIV or substitute 1099-DIV, as to the federal tax status of dividends and distributions received by you in calendar year 2018.
| | | | |
| PGIM Jennison Global Infrastructure Fund | | | 47 | |
INFORMATION ABOUT BOARD MEMBERS AND OFFICERS (unaudited)
Information about Board Members and Officers of the Fund is set forth below. Board Members who are not deemed to be “interested persons” of the Fund, as defined in the 1940 Act, are referred to as “Independent Board Members.” Board Members who are deemed to be “interested persons” of the Fund are referred to as “Interested Board Members.” The Board Members are responsible for the overall supervision of the operations of the Fund and perform the various duties imposed on the directors of investment companies by the 1940 Act. The Board in turn elects the Officers, who are responsible for administering the day-to-day operations of the Fund.
| | | | | | |
| Independent Board Members | | | | |
| | | | |
Name, Address, Age Position(s) Portfolios Overseen | | Principal Occupation(s) During Past Five Years | | Other Directorships Held During Past Five Years | | Length of Board Service |
| | | | |
Ellen S. Alberding (60) Board Member Portfolios Overseen: 93 | | President and Board Member, The Joyce Foundation (charitable foundation) (since 2002); Vice Chair, City Colleges of Chicago (community college system) (2011-2015); Trustee, National Park Foundation (charitable foundation for national park system) (2009-2018); Trustee, Economic Club of Chicago (since 2009); Trustee, Loyola University (since 2018). | | None. | | Since September 2013 |
| | | | |
Kevin J. Bannon (66) Board Member Portfolios Overseen: 93 | | Retired; Managing Director (April 2008-May 2015) and Chief Investment Officer (October 2008-November 2013) of Highmount Capital LLC (registered investment adviser); formerly Executive Vice President and Chief Investment Officer (April 1993-August 2007) of Bank of New York Company; President (May 2003-May 2007) of BNY Hamilton Family of Mutual Funds. | | Director of Urstadt Biddle Properties (equity real estate investment trust) (since September 2008). | | Since July 2008 |
| | | | |
Linda W. Bynoe (66) Board Member Portfolios Overseen: 93 | | President and Chief Executive Officer (since March 1995) and formerly Chief Operating Officer (December 1989-February 1995) of Telemat Ltd. (management consulting); formerly Vice President (January 1985-June 1989) at Morgan Stanley & Co. (broker-dealer). | | Director of Anixter International, Inc. (communication products distributor) (since January 2006); Director of Northern Trust Corporation (financial services) (since April 2006); Trustee of Equity Residential (residential real estate) (since December 2009). | | Since March 2005 |
PGIM Jennison Global Infrastructure Fund
| | | | | | |
Independent Board Members | | | | |
| | | | |
Name, Address, Age Position(s) Portfolios Overseen | | Principal Occupation(s) During Past Five Years | | Other Directorships Held During Past Five Years | | Length of Board Service |
| | | | |
Barry H. Evans (58) Board Member Portfolios Overseen: 92 | | Retired; formerly President (2005 – 2016), Global Chief Operating Officer (2014– 2016), Chief Investment Officer – Global Head of Fixed Income (1998-2014), and various portfolio manager roles (1986-2006), Manulife Asset Management U.S. | | Director, Manulife Trust Company (since 2011); formerly Director, Manulife Asset Management Limited (2015-2017); formerly Chairman of the Board of Directors of Manulife Asset Management U.S. (2005-2016); formerly Chairman of the Board, Declaration Investment Management and Research (2008-2016). | | Since September 2017 |
| | | | |
Keith F. Hartstein (62) Board Member & Independent Chair Portfolios Overseen: 93 | | Retired; Member (since November 2014) of the Governing Council of the Independent Directors Council (organization of independent mutual fund directors); formerly President and Chief Executive Officer (2005-2012), Senior Vice President (2004-2005), Senior Vice President of Sales and Marketing (1997-2004), and various executive management positions (1990-1997), John Hancock Funds, LLC (asset management); Chairman, Investment Company Institute’s Sales Force Marketing Committee (2003-2008). | | None. | | Since September 2013 |
Visit our website at pgiminvestments.com
| | | | | | |
| Independent Board Members | | | | |
| | | | |
Name, Address, Age Position(s) Portfolios Overseen | | Principal Occupation(s) During Past Five Years | | Other Directorships Held During Past Five Years | | Length of Board Service |
| | | | |
Laurie Simon Hodrick (56) Board Member Portfolios Overseen: 92 | | A. Barton Hepburn Professor Emerita of Economics in the Faculty of Business, Columbia Business School (since 2018); Visiting Professor of Law, Stanford Law School (since 2015); Visiting Fellow at the Hoover Institution, Stanford University (since 2015); Sole Member, ReidCourt LLC (since 2008) (a consulting firm); formerly A. Barton Hepburn Professor of Economics in the Faculty of Business, Columbia Business School (1996-2017); formerly Managing Director, Global Head of Alternative Investment Strategies, Deutsche Bank (2006-2008). | | Independent Director, Corporate Capital Trust (since April 2017) (a business development company); Independent Director, Kabbage, Inc. (since July 2018) (financial services). | | Since September 2017 |
| | | | |
Michael S. Hyland, CFA (73) Board Member Portfolios Overseen: 93 | | Retired (since February 2005); formerly Senior Managing Director (July 2001-February 2005) of Bear Stearns & Co, Inc.; Global Partner, INVESCO (1999-2001); Managing Director and President of Salomon Brothers Asset Management (1989-1999). | | None. | | Since July 2008 |
| | | | |
Richard A. Redeker (75) Board Member Portfolios Overseen: 93 | | Retired Mutual Fund Senior Executive (50 years); Management Consultant; Director, Mutual Fund Directors Forum (since 2014); Independent Directors Council (organization of independent mutual fund directors)-Executive Committee, Chair of Policy Steering Committee, Governing Council. | | None. | | Since October 1993 |
PGIM Jennison Global Infrastructure Fund
| | | | | | |
| Independent Board Members | | | | |
| | | | |
Name, Address, Age Position(s) Portfolios Overseen | | Principal Occupation(s) During Past Five Years | | Other Directorships Held During Past Five Years | | Length of Board Service |
| | | | |
Brian K. Reid (56)# Board Member Portfolios Overseen: 92 | | Retired; formerly Chief Economist for the Investment Company Institute (ICI) (2005-2017); formerly Senior Economist and Director of Industry and Financial Analysis at the ICI (1998-2004); formerly Senior Economist, Industry and Financial Analysis at the ICI (1996-1998); formerly Staff Economist at the Federal Reserve Board (1989-1996); Director, ICI Mutual Insurance Company (2012-2017). | | None. | | Since March 2018 |
| # | Mr. Reid joined the Board effective as of March 1, 2018. |
| | | | | | |
| Interested Board Members | | | | |
| | | | |
Name, Address, Age Position(s) Portfolios Overseen | | Principal Occupation(s) During Past Five Years | | Other Directorships Held During Past Five Years | | Length of
Board Service |
| | | | |
Stuart S. Parker (56) Board Member & President Portfolios Overseen: 93 | | President of PGIM Investments LLC (formerly known as Prudential Investments LLC) (since January 2012); Executive Vice President of Prudential Investment Management Services LLC (since December 2012); formerly Executive Vice President of Jennison Associates LLC and Head of Retail Distribution of PGIM Investments LLC (June 2005-December 2011). | | None. | | Since January 2012 |
Visit our website at pgiminvestments.com
| | | | | | |
| Interested Board Members | | | | |
| | | | |
Name, Address, Age Position(s) Portfolios Overseen | | Principal Occupation(s) During Past Five Years | | Other Directorships Held During Past Five Years | | Length of Board Service |
| | | | |
Scott E. Benjamin (45) Board Member & Vice President Portfolios Overseen:93 | | Executive Vice President (since June 2009) of PGIM Investments LLC; Executive Vice President (June 2009-June 2012) and Vice President (since June 2012) of Prudential Investment Management Services LLC; Executive Vice President (since September 2009) of AST Investment Services, Inc.; Senior Vice President of Product Development and Marketing, PGIM Investments (since February 2006); formerly Vice President of Product Development and Product Management, PGIM Investments LLC (2003-2006). | | None. | | Since March 2010 |
| | | | |
Grace C. Torres* (59) Board Member Portfolios Overseen: 92 | | Retired; formerly Treasurer and Principal Financial and Accounting Officer of the PGIM Funds, Target Funds, Advanced Series Trust, Prudential Variable Contract Accounts and The Prudential Series Fund (1998-June 2014); Assistant Treasurer (March 1999-June 2014) and Senior Vice President (September 1999-June 2014) of PGIM Investments LLC; Assistant Treasurer (May 2003-June 2014) and Vice President (June 2005-June 2014) of AST Investment Services, Inc.; Senior Vice President and Assistant Treasurer (May 2003-June 2014) of Prudential Annuities Advisory Services, Inc. | | Formerly Director (July 2015-January 2018) of Sun Bancorp, Inc. N.A. and Sun National Bank; Director (since January 2018) of OceanFirst Financial Corp. and OceanFirst Bank. | | Since November 2014 |
* Note: Prior to her retirement in 2014, Ms. Torres was employed by PGIM Investments LLC. Due to her prior employment, she is considered to be an “interested person” under the 1940 Act. Ms. Torres is a Non-Management Interested Board Member.
PGIM Jennison Global Infrastructure Fund
| | | | |
| Fund Officers(a) | | | | |
| | | |
Name, Address and Age Position with Fund | | Principal Occupation(s) During Past Five Years | | Length of Service as Fund Officer |
| | | |
Raymond A. O’Hara (63) Chief Legal Officer | | Vice President and Corporate Counsel (since July 2010) of Prudential Insurance Company of America (Prudential); Vice President (March 2011-Present) of Pruco Life Insurance Company and Pruco Life Insurance Company of New Jersey; Vice President and Corporate Counsel (March 2011-Present) of Prudential Annuities Life Assurance Corporation; Chief Legal Officer of PGIM Investments LLC (since June 2012); Chief Legal Officer of Prudential Mutual Fund Services LLC (since June 2012) and Corporate Counsel of AST Investment Services, Inc. (since June 2012); formerly Assistant Vice President and Corporate Counsel (September 2008-July 2010) of The Hartford Financial Services Group, Inc.; formerly Associate (September 1980-December 1987) and Partner (January 1988–August 2008) of Blazzard & Hasenauer, P.C. (formerly, Blazzard, Grodd & Hasenauer, P.C.). | | Since June 2012 |
| | | |
Chad A. Earnst (43) Chief Compliance Officer | | Chief Compliance Officer (September 2014-Present) of PGIM Investments LLC; Chief Compliance Officer (September 2014-Present) of the PGIM Funds, Target Funds, Advanced Series Trust, The Prudential Series Fund, Prudential’s Gibraltar Fund, Inc., PGIM Global Short Duration High Yield Income Fund, Inc., PGIM Short Duration High Yield Fund, Inc. and PGIM Jennison MLP Income Fund, Inc.; formerly Assistant Director (March 2010-August 2014) of the Asset Management Unit, Division of Enforcement, US Securities & Exchange Commission; Assistant Regional Director (January 2010-August 2014), Branch Chief (June 2006–December 2009) and Senior Counsel (April 2003-May 2006) of the Miami Regional Office, Division of Enforcement, US Securities & Exchange Commission. | | Since September 2014 |
| | | |
Dino Capasso (44) Deputy Chief Compliance Officer | | Vice President and Deputy Chief Compliance Officer (June 2017-Present) of PGIM Investments LLC; formerly, Senior Vice President and Senior Counsel (January 2016-June 2017), and Vice President and Counsel (February 2012-December 2015) of Pacific Investment Management Company LLC. | | Since March 2018 |
| | | |
Andrew R. French (56) Secretary | | Vice President and Corporate Counsel (since February 2010) of Prudential; formerly Director and Corporate Counsel (2006-2010) of Prudential; Vice President and Assistant Secretary (since January 2007) of PGIM Investments LLC; Vice President and Assistant Secretary (since January 2007) of Prudential Mutual Fund Services LLC. | | Since October 2006 |
Visit our website at pgiminvestments.com
| | | | |
| Fund Officers(a) | | | | |
| | | |
Name, Address and Age Position with Fund | | Principal Occupation(s) During Past Five Years | | Length of Service as Fund Officer |
| | | |
Jonathan D. Shain (60) Assistant Secretary | | Vice President and Corporate Counsel (since August 1998) of Prudential; Vice President and Assistant Secretary (since May 2001) of PGIM Investments LLC; Vice President and Assistant Secretary (since February 2001) of Prudential Mutual Fund Services LLC; formerly Vice President and Assistant Secretary (May 2003-June 2005) of AST Investment Services, Inc. | | Since May 2005 |
| | | |
Claudia DiGiacomo (44) Assistant Secretary | | Vice President and Corporate Counsel (since January 2005) of Prudential; Vice President and Assistant Secretary of PGIM Investments LLC (since December 2005); formerly Associate at Sidley Austin Brown & Wood LLP (1999-2004). | | Since December 2005 |
| | | |
Charles H. Smith (45) Anti-Money Laundering Compliance Officer | | Vice President, Corporate Compliance, Anti-Money Laundering Unit (since January 2015) of Prudential; committee member of the American Council of Life Insurers Anti-Money Laundering and Critical Infrastructure Committee (since January 2016); formerly Global Head of Economic Sanctions Compliance at AIG Property Casualty (February 2007 – December 2014); Assistant Attorney General at the New York State Attorney General’s Office, Division of Public Advocacy. (August 1998 —January 2007). | | Since January 2017 |
| | | |
Brian D. Nee (52) Treasurer and Principal Financial and Accounting Officer | | Vice President and Head of Finance of PGIM Investments LLC (since August 2015) and PGIM Global Partners (since February 2017); formerly, Vice President, Treasurer’s Department of Prudential (September 2007-August 2015). | | Since July 2018 |
| | | |
Peter Parrella (60) Assistant Treasurer | | Vice President (since 2007) and Director (2004-2007) within Prudential Mutual Fund Administration; formerly Tax Manager at SSB Citi Fund Management LLC (1997-2004). | | Since June 2007 |
| | | |
Lana Lomuti (51) Assistant Treasurer | | Vice President (since 2007) and Director (2005-2007), within Prudential Mutual Fund Administration; formerly Assistant Treasurer (December 2007-February 2014) of The Greater China Fund, Inc. | | Since April 2014 |
| | | |
Linda McMullin (57) Assistant Treasurer | | Vice President (since 2011) and Director (2008-2011) within Prudential Mutual Fund Administration. | | Since April 2014 |
| | | |
Kelly A. Coyne (50) Assistant Treasurer | | Director, Investment Operations of Prudential Mutual Fund Services LLC (since 2010). | | Since March 2015 |
(a) Excludes Mr. Parker and Mr. Benjamin, interested Board Members who also serve as President and Vice President, respectively.
Explanatory Notes to Tables:
| ∎ | | Board Members are deemed to be “Interested,” as defined in the 1940 Act, by reason of their affiliation with PGIM Investments LLC and/or an affiliate of PGIM Investments LLC. |
| ∎ | | Unless otherwise noted, the address of all Board Members and Officers is c/o PGIM Investments LLC, 655 Broad Street, Newark, New Jersey 07102-4410. |
| ∎ | | There is no set term of office for Board Members or Officers. The Board Members have adopted a retirement policy, which calls for the retirement of Board Members on December 31 of the year in which they reach the age of 75. |
PGIM Jennison Global Infrastructure Fund
| ∎ | | “Other Directorships Held” includes only directorships of companies required to register or file reports with the SEC under the 1934 Act (that is, “public companies”) or other investment companies registered under the 1940 Act. |
| ∎ | | “Portfolios Overseen” includes all investment companies managed by PGIM Investments LLC. The investment companies for which PGIM Investments LLC serves as manager include the PGIM Funds, The Prudential Variable Contract Accounts, PGIM ETF Trust, PGIM Short Duration High Yield Fund, Inc., PGIM Global Short Duration High Yield Fund, Inc., The Prudential Series Fund, Prudential’s Gibraltar Fund, Inc. and the Advanced Series Trust. |
Visit our website at pgiminvestments.com
Approval of Advisory Agreements (unaudited)
The Fund’s Board of Directors
The Board of Directors (the “Board”) of PGIM Jennison Global Infrastructure Fund (the “Fund”)1 consists of twelve individuals, nine of whom are not “interested persons” of the Fund, as defined in the Investment Company Act of 1940, as amended (the “1940 Act”) (the “Independent Directors”). The Board is responsible for the oversight of the Fund and its operations, and performs the various duties imposed on the directors of investment companies by the 1940 Act. The Independent Directors have retained independent legal counsel to assist them in connection with their duties. The Chair of the Board is an Independent Director. The Board has established four standing committees: the Audit Committee, the Nominating and Governance Committee, and two Investment Committees. Each committee is chaired by, and composed of, Independent Directors.
Annual Approval of the Fund’s Advisory Agreements
As required under the 1940 Act, the Board determines annually whether to renew the Fund’s management agreement with PGIM Investments LLC (“PGIM Investments”) and the Fund’s subadvisory agreement with Jennison Associates LLC (“Jennison”). In considering the renewal of the agreements, the Board, including all of the Independent Directors, met on June 7, 2018 and on June 19-21, 2018 and approved the renewal of the agreements through July 31, 2019, after concluding that the renewal of the agreements was in the best interests of the Fund and its shareholders.
In advance of the meetings, the Board requested and received materials relating to the agreements, and had the opportunity to ask questions and request further information in connection with its consideration. Among other things, the Board considered comparative fee information from PGIM Investments and Jennison. Also, the Board considered comparisons with other mutual funds in relevant Peer Universes and Peer Groups, as is further discussed below.
In approving the agreements, the Board, including the Independent Directors advised by independent legal counsel, considered the factors it deemed relevant, including the nature, quality and extent of services provided by PGIM Investments and the subadviser, the performance of the Fund, the profitability of PGIM Investments and its affiliates, expenses and fees, and the potential for economies of scale that may be shared with the Fund and its shareholders as the Fund’s assets grow. In their deliberations, the Directors did not identify any single factor which alone was responsible for the Board’s decision to approve the agreements with respect to the Fund. In connection with its deliberations, the Board considered information provided by PGIM Investments throughout the year at regular Board meetings, presentations from portfolio managers and other information, as well as
| 1 | PGIM Jennison Global Infrastructure Fund is a series of Prudential World Fund, Inc. |
| | |
| PGIM Jennison Global Infrastructure Fund |
Approval of Advisory Agreements (continued)
information furnished at or in advance of the meetings on June 7, 2018 and on June 19-21, 2018.
The Directors determined that the overall arrangements between the Fund and PGIM Investments, which serves as the Fund’s investment manager pursuant to a management agreement, and between PGIM Investments and Jennison, which serves as the Fund’s subadviser pursuant to the terms of a subadvisory agreement with PGIM Investments, are in the best interests of the Fund and its shareholders in light of the services performed, fees charged and such other matters as the Directors considered relevant in the exercise of their business judgment.
The material factors and conclusions that formed the basis for the Directors’ reaching their determinations to approve the continuance of the agreements are separately discussed below.
Nature, Quality and Extent of Services
The Board received and considered information regarding the nature, quality and extent of services provided to the Fund by PGIM Investments and Jennison. The Board considered the services provided by PGIM Investments, including but not limited to the oversight of the subadviser for the Fund, as well as the provision of fund recordkeeping, compliance, and other services to the Fund. With respect to PGIM Investments’ oversight of the subadviser, the Board noted that PGIM Investments’ Strategic Investment Research Group (“SIRG”), which is a business unit of PGIM Investments, is responsible for monitoring and reporting to PGIM Investments’ senior management on the performance and operations of the subadviser. The Board also considered that PGIM Investments pays the salaries of all of the officers and interested Directors of the Fund who are part of Fund management. The Board also considered the investment subadvisory services provided by Jennison, including investment research and security selection, as well as adherence to the Fund’s investment restrictions and compliance with applicable Fund policies and procedures. The Board considered PGIM Investments’ evaluation of the subadviser, as well as PGIM Investments’ recommendation, based on its review of the subadviser, to renew the subadvisory agreement.
The Board considered the qualifications, backgrounds and responsibilities of PGIM Investments’ senior management responsible for the oversight of the Fund and Jennison, and also considered the qualifications, backgrounds and responsibilities of Jennison’s portfolio managers who are responsible for the day-to-day management of the Fund’s portfolio. The Board was provided with information pertaining to PGIM Investments’ and Jennison’s organizational structure, senior management, investment operations, and other relevant information pertaining to both PGIM Investments and Jennison. The Board also noted that it received favorable compliance reports from the Fund’s Chief Compliance
| | |
| Visit our website at pgiminvestments.com | | |
Officer (“CCO”) as to both PGIM Investments and Jennison. The Board noted that Jennison is affiliated with PGIM Investments.
The Board concluded that it was satisfied with the nature, extent and quality of the investment management services provided by PGIM Investments and the subadvisory services provided to the Fund by Jennison, and that there was a reasonable basis on which to conclude that the Fund benefits from the services provided by PGIM Investments and Jennison under the management and subadvisory agreements.
Costs of Services and Profits Realized by PGIM Investments
The Board was provided with information on the profitability of PGIM Investments and its affiliates in serving as the Fund’s investment manager. The Board discussed with PGIM Investments the methodology utilized in assembling the information regarding profitability and considered its reasonableness. The Board recognized that it is difficult to make comparisons of profitability from fund management contracts because comparative information is not generally publicly available and is affected by numerous factors, including the structure of the particular adviser, the types of funds it manages, its business mix, numerous assumptions regarding allocations and the adviser’s capital structure and cost of capital. However, the Board considered that the cost of services provided by PGIM Investments to the Fund during the year ended December 31, 2017 exceeded the management fees paid by the Fund, resulting in an operating loss to PGIM Investments. Taking these factors into account, the Board concluded that the profitability of PGIM Investments and its affiliates in relation to the services rendered was not unreasonable.
Economies of Scale
The Board received and discussed information concerning economies of scale that PGIM Investments may realize as the Fund’s assets grow beyond current levels. The Board noted that the management fee schedule for the Fund includes breakpoints, which have the effect of decreasing the fee rate as assets increase. During the course of time, the Board has considered information regarding the launch date of the Fund, the management fees of the Fund compared to those of similarly managed funds and PGIM Investments’ investment in the Fund over time. The Board noted that economies of scale may be shared with the Fund in several ways, including low management fees from inception, additional technological and personnel investments to enhance shareholder services, and maintaining existing expense structures in the face of a rising cost environment. The Board considered PGIM Investments’ assertion that it continually evaluates the management fee schedule of the Fund and the potential to share economies of scale through breakpoints or fee waivers as asset levels increase.
| | |
| PGIM Jennison Global Infrastructure Fund |
Approval of Advisory Agreements (continued)
The Board recognized the inherent limitations of any analysis of economies of scale, stemming largely from the Board’s understanding that most of PGIM Investments’ costs are not specific to individual funds, but rather are incurred across a variety of products and services.
Other Benefits to PGIM Investments and Jennison
The Board considered potential ancillary benefits that might be received by PGIM Investments and Jennison and their affiliates as a result of their relationship with the Fund. The Board concluded that potential benefits to be derived by PGIM Investments included transfer agency fees received by the Fund’s transfer agent (which is affiliated with PGIM Investments), benefits to its reputation as well as other intangible benefits resulting from PGIM Investments’ association with the Fund. The Board concluded that the potential benefits to be derived by Jennison included its ability to use soft dollar credits, as well as the potential benefits consistent with those generally resulting from an increase in assets under management, specifically, potential access to additional research resources and benefits to its reputation. The Board concluded that the benefits derived by PGIM Investments and Jennison were consistent with the types of benefits generally derived by investment managers and subadvisers to mutual funds.
Performance of the Fund / Fees and Expenses
The Board considered certain additional specific factors and made related conclusions relating to the historical performance of the Fund for the one- and three-year periods ended December 31, 2017. The Board considered that the Fund commenced operations on September 25, 2013 and that longer-term performance was not yet available.
The Board also considered the Fund’s actual management fee, as well as the Fund’s net total expense ratio, for the fiscal year ended October 31, 2017. The Board considered the management fee for the Fund as compared to the management fee charged by PGIM Investments to other funds and the fee charged by other advisers to comparable mutual funds in a Peer Group. The actual management fee represents the fee rate actually paid by Fund shareholders and includes any fee waivers or reimbursements. The net total expense ratio for the Fund represents the actual expense ratio incurred by Fund shareholders.
The mutual funds included in the Peer Universe, which was used to consider performance, and the Peer Group, which was used to consider fees and expenses, were objectively determined by Broadridge, an independent provider of mutual fund data. In certain circumstances, PGIM Investments also may have provided supplemental Peer Universe or Peer Group information for reasons addressed with the Board. The comparisons placed the Fund in various quartiles, with the first quartile being the best 25% of the mutual funds (for
| | |
| Visit our website at pgiminvestments.com | | |
performance, the best performing mutual funds and, for expenses, the lowest cost mutual funds).
The section below summarizes key factors considered by the Board and the Board’s conclusions regarding the Fund’s performance, fees and overall expenses. The table sets forth gross performance comparisons (which do not reflect the impact on performance of fund expenses, or any subsidies, expense caps or waivers that may be applicable) with the Peer Universe, actual management fees with the Peer Group (which reflect the impact of any subsidies or fee waivers), and net total expenses with the Peer Group, each of which were key factors considered by the Board.
| | | | | | | | |
| Gross Performance | | 1 Year | | 3 Years | | 5 Years | | 10 Years |
| | | 2nd Quartile | | 3rd Quartile | | N/A | | N/A |
| Actual Management Fees: 3rd Quartile |
| Net Total Expenses: 4th Quartile |
| | • | | The Board noted that the Fund outperformed its benchmark index over all periods. |
| | • | | The Board noted information provided by PGIM Investments indicating that the Fund’s actual management fees were only three basis points from the median, despite the Fund’s third quartile ranking. |
| | • | | The Board and PGIM Investments agreed to retain the Fund’s existing contractual expense cap, which (exclusive of certain fees and expenses) caps the Fund’s annual operating expenses at 1.50% for Class A shares, 2.25% for Class C shares, 1.25% for Class R6 shares, and 1.25% for Class Z shares through February 28, 2019. |
| | • | | The Board concluded that, in light of the above, it would be in the best interests of the Fund and its shareholders to renew the agreements. |
| | • | | The Board concluded that the management fees (including subadvisory fees) and total expenses were reasonable in light of the services provided. |
* * *
After full consideration of these factors, the Board concluded that approval of the agreements was in the best interests of the Fund and its shareholders.
| | |
| PGIM Jennison Global Infrastructure Fund |
| | | | |
| ∎ MAIL | | ∎ TELEPHONE | | ∎ WEBSITE |
655 Broad Street Newark, NJ 07102 | | (800) 225-1852 | | www.pgiminvestments.com |
|
| PROXY VOTING |
| The Board of Directors of the Fund has delegated to the Fund’s subadviser the responsibility for voting any proxies and maintaining proxy recordkeeping with respect to the Fund. A description of these proxy voting policies and procedures is available without charge, upon request, by calling (800) 225-1852. Information regarding how the Fund voted proxies relating to portfolio securities during the most recent 12-month period ended June 30 is available on the Fund’s website and on the Securities and Exchange Commission’s website. |
|
| DIRECTORS |
| Ellen S. Alberding • Kevin J. Bannon • Scott E. Benjamin • Linda W. Bynoe • Barry H. Evans • Keith F. Hartstein • Laurie Simon Hodrick • Michael S. Hyland • Stuart S. Parker • Richard A. Redeker • Brian K. Reid • Grace C. Torres |
|
| OFFICERS |
| Stuart S. Parker, President • Scott E. Benjamin, Vice President • Brian D. Nee, Treasurer and Principal Financial and Accounting Officer • Raymond A. O’Hara, Chief Legal Officer • Andrew R. French, Secretary • Chad A. Earnst, Chief Compliance Officer • Dino Capasso, Vice President and Deputy Chief Compliance Officer • Charles H. Smith, Anti-Money Laundering Compliance Officer • Jonathan D. Shain, Assistant Secretary • Claudia DiGiacomo, Assistant Secretary • Peter Parrella, Assistant Treasurer • Lana Lomuti, Assistant Treasurer • Linda McMullin, Assistant Treasurer • Kelly A. Coyne, Assistant Treasurer |
| | | | |
| MANAGER | | PGIM Investments LLC | | 655 Broad Street
Newark, NJ 07102 |
|
| SUBADVISER | | Jennison Associates LLC | | 466 Lexington Avenue
New York, NY 10017 |
|
| DISTRIBUTOR | | Prudential Investment
Management Services LLC | | 655 Broad Street
Newark, NJ 07102 |
|
| CUSTODIAN | | The Bank of New York Mellon | | 225 Liberty Street
New York, NY 10286 |
|
| TRANSFER AGENT | | Prudential Mutual Fund
Services LLC | | PO Box 9658
Providence, RI 02940 |
|
| INDEPENDENT REGISTERED PUBLIC ACCOUNTING FIRM | | KPMG LLP | | 345 Park Avenue New York, NY 10154 |
|
| FUND COUNSEL | | Willkie Farr & Gallagher LLP | | 787 Seventh Avenue
New York, NY 10019 |
|
|
| An investor should consider the investment objectives, risks, charges, and expenses of the Fund carefully before investing. The prospectus and summary prospectus contain this and other information about the Fund. An investor may obtain a prospectus and summary prospectus by visiting our website at www.pgiminvestments.com or by calling (800) 225-1852. The prospectus and summary prospectus should be read carefully before investing. |
|
| E-DELIVERY |
| To receive your mutual fund documents online, go to www.pgiminvestments.com/edelivery and enroll. Instead of receiving printed documents by mail, you will receive notification via email when new materials are available. You can cancel your enrollment or change your email address at any time by visiting the website address above. |
|
| SHAREHOLDER COMMUNICATIONS WITH DIRECTORS |
| Shareholders can communicate directly with the Board of Directors by writing to the Chair of the Board, PGIM Jennison Global Infrastructure Fund, PGIM Investments, Attn: Board of Directors, 655 Broad Street, Newark, NJ 07102. Shareholders can communicate directly with an individual Director by writing to the same address. Communications are not screened before being delivered to the addressee. |
|
| AVAILABILITY OF PORTFOLIO SCHEDULE |
| The Fund files its complete schedule of portfolio holdings with the Securities and Exchange Commission for the first and third quarters of each fiscal year on Form N-Q. The Fund’s Forms N-Q are available on the Commission’s website at www.sec.gov. The Fund’s schedule of portfolio holdings is also available on the Fund’s website as of the end of each month no sooner than 15 days after the end of the month. |
|
| The Fund’s Statement of Additional Information contains additional information about the Fund’s Directors and is available without charge, upon request, by calling (800) 225-1852. |
Mutual Funds:
| | | | |
| ARE NOT INSURED BY THE FDIC OR ANY FEDERAL GOVERNMENT AGENCY | | MAY LOSE VALUE | | ARE NOT A DEPOSIT OF OR GUARANTEED BY ANY BANK OR ANY BANK AFFILIATE |
PGIM JENNISON GLOBAL INFRASTRUCTURE FUND
| | | | | | | | |
| SHARE CLASS | | A | | C | | Z | | R6* |
| NASDAQ | | PGJAX | | PGJCX | | PGJZX | | PGJQX |
| CUSIP | | 743969792 | | 743969784 | | 743969776 | | 743969560 |
*Formerly known as Class Q shares.
MF217E

PGIM EMERGING MARKETS DEBT HARD
CURRENCY FUND
(Formerly known as Prudential Emerging Markets Debt Hard Currency Fund)
ANNUAL REPORT
OCTOBER 31, 2018
COMING SOON: PAPERLESS SHAREHOLDER REPORTS
Beginning on January 1, 2021, as permitted by regulations adopted by the Securities and Exchange Commission, paper copies of the Fund’s annual and semi-annual shareholder reports will no longer be sent by mail, unless you specifically request paper copies of the reports. Instead, the reports will be made available on the Fund’s website (www.pgiminvestments.com), and you will be notified by mail each time a report is posted and provided with a website link to access the report.
If you already elected to receive shareholder reports electronically, you will not be affected by this change and you need not take any action. You may elect to receive shareholder reports and other communications from the Fund electronically anytime by contacting your financial intermediary (such as a broker-dealer or bank) or, if you are a direct investor, by calling 1-800-225-1852 or by sending an e-mail request to PGIM Investments at shareholderreports@pgim.com.
Beginning on January 1, 2019, you may elect to receive all future reports in paper free of charge. If you invest through a financial intermediary, you can contact your financial intermediary or follow instructions included with this notice to elect to continue to receive paper copies of your shareholder reports. If you invest directly with the Fund, you can call 1-800-225-1852 or send an email request to shareholderreports@pgim.com to let the Fund know you wish to continue receiving paper copies of your shareholder reports. Your election to receive reports in paper will apply to all funds held in your account if you invest through your financial intermediary or all funds held with the fund complex if you invest directly with the Fund.

To enroll in e-delivery, go to pgiminvestments.com/edelivery
|
| Objective: Total return, through a combination of current income and capital appreciation |
Highlights (unaudited)
| • | | Overweight positions in Brazil, Bahrain, Greece, Iraq, and Angola contributed to performance in the reporting period. Security selection within Venezuela also added to performance. |
| • | | Within foreign currencies, underweights to the Chilean peso, Chinese yuan, Swiss franc, and the Hungarian forint were all strong contributors. |
| • | | Overall country selection was the largest detractor from performance over the reporting period, highlighted by an overweight to Argentina. Security selection within India, Hungary, China, and Romania all detracted from returns. |
| • | | Within foreign currencies, overweights to the Indian rupee, Brazilian real, and Russian ruble all hurt performance. |
This report is not authorized for distribution to prospective investors unless preceded or accompanied by a current prospectus.
The views expressed in this report and information about the Fund’s portfolio holdings are for the period covered by this report and are subject to change thereafter.
Mutual funds are distributed by Prudential Investment Management Services LLC (PIMS), member SIPC. PGIM Fixed Income is a unit of PGIM, Inc. (PGIM), a registered investment adviser. PIMS and PGIM are Prudential Financial companies. © 2018 Prudential Financial, Inc. and its related entities. PGIM and the PGIM logo are service marks of Prudential Financial, Inc. and its related entities, registered in many jurisdictions worldwide.
| | |
| 2 | | Visit our website at pgiminvestments.com |
PGIM FUNDS — UPDATE
The Board of Directors/Trustees for the Fund has approved the implementation of an automatic conversion feature for Class C shares, effective as of April 1, 2019. To reflect these changes, effective April 1, 2019, the section of the Fund’s Prospectus entitled “How to Buy, Sell and Exchange Fund Shares—How to Exchange Your Shares—Frequent Purchases and Redemptions of Fund Shares” is restated to read as follows:
This supplement should be read in conjunction with your Summary Prospectus, Statutory Prospectus and Statement of Additional Information, be retained for future reference and is in addition to any existing Fund supplements.
| | 1. | In each Fund’s Statutory Prospectus, the following is added at the end of the section entitled “Fund Distributions And Tax Issues—If You Sell or Exchange Your Shares”: |
Automatic Conversion of Class C Shares
The conversion of Class C shares into Class A shares—which happens automatically approximately 10 years after purchase—is not a taxable event for federal income tax purposes. For more information about the automatic conversion of Class C shares, see Class C Shares Automatically Convert to Class A Shares in How to Buy, Sell and Exchange Fund Shares.
| | 2. | In each Fund’s Statutory Prospectus, the following sentence is added at the end of the section entitled “How to Buy, Sell and Exchange Shares—Closure of Certain Share Classes to New Group Retirement Plans”: |
Shareholders owning Class C shares may continue to hold their Class C shares until the shares automatically convert to Class A shares under the conversion schedule, or until the shareholder redeems their Class C shares.
| | 3. | In each Fund’s Statutory Prospectus, the following disclosure is added immediately following the section entitled “How to Buy, Sell and Exchange Shares—How to Buy Shares—Class B Shares Automatically Convert to Class A Shares”: |
Class C Shares Automatically Convert to Class A Shares
Starting on or about April 1, 2019 (the “Effective Date”), Class C shares will be eligible for automatic conversion into Class A shares on a monthly basis approximately ten years after the original date of purchase (the “Conversion Date”). Conversion will take place based on the relative NAV of the two classes, without the imposition of any sales load, fee or other charge. All such automatic conversions of Class C shares will constitute tax-free exchanges for federal income tax purposes.
For shareholders investing in Class C shares through retirement plans or omnibus accounts, and in certain other instances, the Fund and its agents may not have
| | | | |
| PGIM Emerging Markets Debt Hard Currency Fund | | | 3 | |
transparency into how long a shareholder has held Class C shares for purposes of determining whether such Class C shares are eligible for automatic conversion into Class A shares, and the relevant financial intermediary may not have the ability to track purchases in order to credit individual shareholders’ holding periods. In these circumstances, the Fund will not be able to automatically convert Class C shares into Class A shares as described above. In order to determine eligibility for conversion in these circumstances, it is the responsibility of the financial intermediary to notify the Fund that the shareholder is eligible for the conversion of Class C shares to Class A shares, and the financial intermediary may be required to maintain and provide the Fund with records that substantiate the holding period of Class C shares. It is the financial intermediary’s (and not the Fund’s) responsibility to keep records of transactions made in accounts it holds and to ensure that the shareholder is credited with the proper holding period based on such records or those provided to the financial intermediary by the shareholder. Please consult with your financial intermediary for the applicability of this conversion feature to your shares.
A financial intermediary may sponsor and/or control accounts, programs or platforms that impose a different conversion schedule or different eligibility requirements for the exchange of Class C shares for Class A shares (see Appendix A: Waivers and Discounts Available From Certain Financial Intermediaries of the Prospectus). Please consult with your financial intermediary if you have any questions regarding your shares’ conversion from Class C shares to Class A shares.
| | 4. | In Part II of each Fund’s Statement of Additional Information, the following disclosure is added immediately following the section entitled “Purchase, Redemption and Pricing of Fund Shares—Share Classes—Automatic Conversion of Class B Shares”: |
AUTOMATIC CONVERSION OF CLASS C SHARES. Starting on or about April 1, 2019 (the “Effective Date”), Class C shares will be eligible for automatic conversion into Class A shares on a monthly basis approximately ten years after the original date of purchase (the “Conversion Date”). Conversion will take place based on the relative NAV of the two classes, without the imposition of any sales load, fee or other charge. Class C shares of a Fund acquired through automatic reinvestment of dividends or distributions will convert to Class A shares of the Fund on the Conversion Date pro rata with the converting Class C shares of the Fund that were not acquired through reinvestment of dividends or distributions. All such automatic conversions of Class C shares will constitute tax-free exchanges for federal income tax purposes.
For shareholders investing in Class C shares through retirement plans or omnibus accounts, and in certain other instances, the Fund and its agents may not have transparency into how long a shareholder has held Class C shares for purposes of determining whether such Class C shares are eligible for automatic conversion into Class A shares, and the relevant financial intermediary may not have the ability to track purchases in order to credit individual shareholders’ holding periods. In these circumstances, the
| | |
| 4 | | Visit our website at pgiminvestments.com |
Fund will not be able to automatically convert Class C shares into Class A shares as described above. In order to determine eligibility for conversion in these circumstances, it is the responsibility of the financial intermediary to notify the Fund that the shareholder is eligible for the conversion of Class C shares to Class A shares, and the financial intermediary may be required to maintain and provide the Fund with records that substantiate the holding period of Class C shares. It is the financial intermediary’s (and not the Fund’s) responsibility to keep records of transactions made in accounts it holds and to ensure that the shareholder is credited with the proper holding period based on such records or those provided to the financial intermediary by the shareholder. Please consult with your financial intermediary for the applicability of this conversion feature to your shares.
Class C shares were generally closed to investments by new group retirement plans effective June 1, 2018. Group retirement plans (and their successor, related and affiliated plans) that have Class C shares of the Fund available to participants on or before the Effective Date may continue to open accounts for new participants in such share class and purchase additional shares in existing participant accounts.
The Fund has no responsibility for monitoring or implementing a financial intermediary’s process for determining whether a shareholder meets the required holding period for conversion. A financial intermediary may sponsor and/or control accounts, programs or platforms that impose a different conversion schedule or different eligibility requirements for the exchange of Class C shares for Class A shares, as set forth on Appendix A: Waivers and Discounts Available From Certain Financial Intermediaries of the Prospectus. In these cases, Class C shareholders may have their shares exchanged for Class A shares under the policies of the financial intermediary. Financial intermediaries will be responsible for making such exchanges in those circumstances. Please consult with your financial intermediary if you have any questions regarding your shares’ conversion from Class C shares to Class A shares.
LR1094
- Not part of the Annual Report -
| | | | |
| PGIM Emerging Markets Debt Hard Currency Fund | | | 5 | |
Table of Contents
| | |
| 6 | | Visit our website at pgiminvestments.com |
Letter from the President

Dear Shareholder:
We hope you find the annual report for PGIM Emerging Markets Debt Hard Currency Fund informative and useful. The report covers performance for the 12-month period that ended October 31, 2018.
We have important information to share with you. Effective June 11, 2018, Prudential Mutual Funds were renamed PGIM Funds. This renaming is part of our ongoing effort to further build our reputation and establish our global brand, which began when our firm adopted PGIM Investments as its name in April 2017. Please note that only the Fund’s name has changed. Your Fund’s management and operation, along with its symbols, remained the same.*
During the reporting period, the global economy continued to grow, and central banks gradually tightened monetary policy. In the US, the economy expanded and employment increased. In September, the Federal Reserve hiked interest rates for the eighth time since 2015, based on confidence in the economy.
Equity returns on the whole were strong, due to optimistic earnings expectations and investor sentiment. Global equities, including emerging markets, generally posted positive returns. However, they trailed the performance of US equities, which rose on higher corporate profits, new regulatory policies, and tax reform benefits. Volatility spiked briefly early in the period on inflation concerns, rising interest rates, and a potential global trade war, and again late in the period on worries that profit growth might slow in 2019.
The overall bond market declined modestly during the period, as measured by the Bloomberg Barclays US Aggregate Bond Index. The best performance came from higher-yielding, economically sensitive sectors, such as high yield bonds and bank loans, which posted small gains. US investment-grade corporate bonds and US Treasury bonds both finished the period with negative returns. A major trend during the period was the flattening of the US Treasury yield curve, which increased the yield on fixed income investments with shorter maturities and made them more attractive to investors.
Regarding your investments with PGIM, we believe it is important to maintain a diversified portfolio of funds consistent with your tolerance for risk, time horizon, and financial goals. Your financial advisor can help you create a diversified investment plan that may include funds covering all the basic asset classes and that reflects your personal investor profile and risk tolerance. However, diversification and asset allocation strategies do not assure a profit or protect against loss in declining markets.
At PGIM Investments, we consider it a great privilege and responsibility to help investors participate in opportunities across global markets while meeting their toughest investment challenges. PGIM is a top-10 global investment manager with more than $1 trillion in assets under management. This investment expertise allows us to deliver actively managed funds and strategies to meet the needs of investors around the globe.
Thank you for choosing our family of funds.
Sincerely,

Stuart S. Parker, President
PGIM Emerging Markets Debt Hard Currency Fund
December 14, 2018
*The Prudential Day One Funds did not change their names.
| | | | |
| PGIM Emerging Markets Debt Hard Currency Fund | | | 7 | |
Your Fund’s Performance (unaudited)
Performance data quoted represents past performance. Past performance does not guarantee future results. The investment return and principal value of an investment will fluctuate, so that an investor’s shares, when redeemed, may be worth more or less than their original cost. Current performance may be lower or higher than the past performance data quoted. An investor may obtain performance data as of the most recent month-end by visiting our website at www.pgiminvestments.com or by calling (800) 225-1852.
| | |
| | | Total Returns as of 10/31/18
(without sales charges) |
| | | Since Inception* (%) |
| Class A | | –6.97 (12/12/17) |
| Class C | | –7.58 (12/12/17) |
| Class Z | | –6.79 (12/12/17) |
| Class R6** | | –6.72 (12/12/17) |
| JP Morgan EMBI Global Diversified Index | | |
| | –4.44 |
| Lipper Emerging Market Hard Currency Debt Funds Average | | |
| | | –5.65 |
Growth of a $10,000 Investment
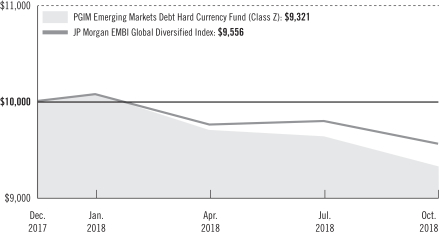
The graph compares a $10,000 investment in the Fund’s Class Z shares with a similar investment in the JP Morgan EMBI Global Diversified Index by portraying the initial account values at the commencement of operations for Class Z shares (December 12, 2017) and the account values at the end of the current fiscal period (October 31, 2018) as measured
| | |
| 8 | | Visit our website at pgiminvestments.com |
on a quarterly basis. For purposes of the graph, and unless otherwise indicated, it has been assumed that (a) all recurring fees (including management fees) were deducted; and (b) all dividends and distributions were reinvested. The line graph provides information for Class Z shares only. As indicated in the tables provided earlier, performance for other share classes will vary due to the differing charges and expenses applicable to each share class (as indicated in the following paragraphs). Without waiver of fees and/or expense reimbursements, if any, the Fund’s returns would have been lower.
Past performance does not predict future performance. Total returns and the ending account values in the graph include changes in share price and reinvestment of dividends and capital gains distributions in a hypothetical investment for the periods shown. The Fund’s total returns do not reflect the deduction of income taxes on an individual’s investment. Taxes may reduce your actual investment returns on income or gains paid by the Fund or any gains you may realize if you sell your shares.
Source: PGIM Investments LLC, Lipper Inc., and JP Morgan
*Not annualized
**Formerly known as Class Q shares.
Since Inception returns are provided since the Fund has less than 10 fiscal years of returns. Since Inception returns for the Index and the Lipper Average are measured from closest month-end to the Fund’s inception date.
The returns in the tables do not reflect the deduction of taxes that a shareholder would pay on Fund distributions or following the redemption of Fund shares. The average annual total returns take into account applicable sales charges, which are described for each share class in the table below.
| | | | | | | | |
| | | Class A | | Class C | | Class Z | | Class R6* |
| Maximum initial sales charge | | 4.50% of the public offering price | | None | | None | | None |
| Contingent deferred sales charge (CDSC) (as a percentage of the lower of original purchase price or net asset value at redemption) | | 1.00% on sales of $1 million or more made within 12 months of purchase | | 1.00% on sales made within 12 months of purchase | | None | | None |
| Annual distribution and service (12b-1) fees (shown as a percentage of average daily net assets) | | 0.25% | | 1.00% | | None | | None |
*Formerly known as Class Q shares.
| | | | |
| PGIM Emerging Markets Debt Hard Currency Fund | | | 9 | |
Your Fund’s Performance (continued)
Benchmark Definitions
JP Morgan EMBI Global Diversified Index—The JP Morgan Emerging Markets Bond Index (EMBI) Global Diversified Index is an unmanaged, comprehensive emerging markets index that tracks hard currency bonds issued by emerging markets issuers.
Lipper Emerging Market Hard Currency Debt Funds Average—The Lipper Emerging Market Hard Debt Currency Funds Average (Lipper Average) is based upon the return of all mutual funds in the Lipper Emerging Market Hard Debt Currency Funds universe.
Investors cannot invest directly in an index or average. The returns for the Index would be lower if they included the effects of sales charges, operating expenses of a mutual fund, or taxes. Returns for the Lipper Average reflect the deduction of operating expenses of a mutual fund, but not sales charges or taxes.
| | | | |
| Credit Quality expressed as a percentage of total investments as of 10/31/18 (%) | |
| AA | | | 0.8 | |
| A | | | 7.9 | |
| BBB | | | 25.9 | |
| BB | | | 24.2 | |
| B | | | 39.3 | |
| C | | | 1.2 | |
| Cash/Cash Equivalents | | | 0.7 | |
| Total | | | 100.0 | |
Source: PGIM Fixed Income
Credit ratings reflect the highest rating assigned by a nationally recognized statistical rating organization (NRSRO) such as Moody’s Investors Service, Inc. (Moody’s), S&P Global Ratings (S&P), or Fitch, Inc. (Fitch). Credit ratings reflect the common nomenclature used by both S&P and Fitch. Where applicable, ratings are converted to the comparable S&P/Fitch rating tier nomenclature. These rating agencies are independent and are widely used. The Not Rated category consists of securities that have not been rated by a NRSRO. Credit ratings are subject to change. Values may not sum to 100.0% due to rounding.
| | |
| 10 | | Visit our website at pgiminvestments.com |
| | | | | | |
| Distributions and Yields as of 10/31/18 |
| | Total Distributions
Paid for
the period ($) | | SEC 30-Day
Subsidized
Yield* (%) | | SEC 30-Day
Unsubsidized
Yield** (%) |
| Class A | | 0.44 | | 5.60 | | –199.93 |
| Class C | | 0.38 | | 5.10 | | –199.71 |
| Class Z | | 0.46 | | 6.15 | | –3.86 |
| Class R6 | | 0.46 | | 6.20 | | 4.24 |
*SEC 30-Day Subsidized Yield (%)—A standardized yield calculation created by the Securities and Exchange Commission, it reflects the income earned during a 30-day period, after the deduction of the Fund’s net expenses (net of any expense waivers or reimbursements).
**SEC 30-Day Unsubsidized Yield (%)—A standardized yield calculation created by the Securities and Exchange Commission, it reflects the income earned during a 30-day period, after the deduction of the Fund’s gross expenses. The investor experience is represented by the SEC 30-Day Subsidized Yield.
| | | | |
| PGIM Emerging Markets Debt Hard Currency Fund | | | 11 | |
Strategy and Performance Overview (unaudited)
How did the Fund perform?
The PGIM Emerging Markets Debt Hard Currency Fund’s Class Z shares returned -6.79% since the Fund’s inception on December 12, 2017, through October 31, 2018 (the reporting period), underperforming the -4.44% return of the JP Morgan EMBI Global Diversified Index (the Index) and the -5.65% return of the Lipper Emerging Markets Hard Currency Debt Funds Average.
What were market conditions?
| • | | In 2017, emerging market (EM) economies benefited from the global economy’s improving momentum, generating numerous opportunities across local-rate emerging markets. On the back of improving fundamentals, such as narrower current account deficits, falling inflation, and growing central bank reserves, PGIM Fixed Income expected EM growth (excluding China) to accelerate in 2018 and outpace growth in the developed world. Although macro risks remained on the horizon (e.g., the ongoing removal of developed-market monetary stimulus, led by the Federal Reserve’s contracting balance sheet and prospects for three or four rate hikes in 2018), some of these concerns were remnants of the volatility surrounding 2013’s taper tantrum. Many idiosyncratic credit stories in emerging markets also dominated headlines, including Venezuela, Argentina, Brazil, Mexico, Ukraine, and Russia, among others. |
| • | | In 2018, emerging market fixed income started with a very strong January, with hard currency spreads tightening on the back of stable yields and appreciating currencies. This was followed by a soggier February and March as inflation fears, trade war rhetoric, spikes in volatility, and rising US interest rates drove investors to the sidelines. Most hard currency country returns were negative, with Venezuela a surprising exception as the top performer with a return of +11.60%. Despite worsening economic conditions and falling oil production, investors bought into the belief that President Nicolás Maduro would eventually be forced from office and that the restructured value of bonds would be greater than the current prices in the $20s. |
| • | | Pressure increased on the emerging market asset class in the second quarter of 2018 on the back of rising US Treasury rates, a stronger US dollar, mounting trade concerns, and coalescing idiosyncratic events. Emerging market foreign exchange (EMFX) also began a sharp sell-off in mid-April 2018 in response to capital outflows and weakening growth in Europe and Asia, thus weakening EMFX crosses at the margin. The stronger US dollar stoked fears that countries and/or companies with excessive external borrowing in dollars could be forced to refinance at less-favorable exchange rates and/or higher interest rates. Bonds from countries with large fiscal and external deficits, most notably Argentina and Turkey, were particularly sensitive to these developments. The recent EM instability seems to have been aggravated by idiosyncratic stories in Argentina, Turkey, Brazil, and Mexico, as opposed to broad-based weakness across the asset class. And while these idiosyncratic stories continued to loom over EM for the very short term, global growth remained on solid ground, shining a more positive light on potential second-half |
| | |
| 12 | | Visit our website at pgiminvestments.com |
| | opportunities created by the recent stretch of underperformance. PGIM Fixed Income also notes that, in the context of country-specific concerns (in large part tied to political dynamics, particularly in Turkey, Mexico, and Brazil), policymakers have responded to the feedback from financial markets and have acted accordingly. For example, Argentina’s central bank recently implemented a series of rate hikes—1,275 basis points (bps)—and policy moves in conjunction with finalizing a $50 billion loan program with the International Monetary Fund and other multilateral lenders (an additional $5.65 billion). (One basis point equals 0.01%.) During the market turmoil of May and June, Turkey also raised its benchmark interest rate several times. India, Indonesia, and Mexico also raised rates. In Brazil, the central bank decided to increase the use of foreign exchange (FX) swaps, and the Treasury opted to buy back nominal local bonds in order to provide support and stability to the market. |
| • | | After a tough second quarter in 2018, the emerging markets debt sector rebounded with hard-currency sovereign debt leading the way. There was significant monthly variability throughout the quarter—particularly in Argentina, Turkey, and Ecuador—amid concerns about vulnerability to tighter global financial conditions and idiosyncratic, issuer-specific factors. Macro developments in the third quarter of 2018 included periods of dollar resilience and escalating trade war rhetoric. The expectations of strong US growth relative to other developed and emerging markets posed a headwind for EMFX and similarly limited performance in hedged local bonds. In hedged local bonds, Turkey and Argentina posted double-digit losses year-to-date and had to hike rates significantly given severe currency weakness and elevated inflation. Argentina raised rates more than 3,275 bps and Turkey by 625 bps. Policy credibility remained an issue in both countries. Given some of the headwinds from EMFX, other central banks have also raised interest rates, including Indonesia, the Philippines, and Russia. More central banks could follow suit, but given that inflation—with a few exceptions—is contained, the hikes should be modest. In EMFX, the third quarter of 2018 started against a backdrop of US growth outperformance on the back of fiscal stimulus and lower growth forecasts for the eurozone and several EM countries, notably in Latin America. Trade policy uncertainty was also high throughout the quarter. These factors, along with the market pricing in a more aggressive Fed-hiking path relative to the rest of G-10 central banks, facilitated U.S. dollar strengthening over the past two quarters. |
| • | | In October 2018, emerging market assets gave back their recent gains as risk assets suffered on the back of higher US yields and concern over the overall growth of the world economy. Flows into EM assets were negative for the month. The top hard currency performers included Lebanon, Brazil, and Suriname. Lebanon outperformed on expectations its prime minister would successfully form a cabinet. Lower beta and less-owned names, such as Suriname, also outperformed. Laggards included Sri Lanka, Venezuela, and Senegal. Sri Lanka underperformed as political stability became a concern when its president replaced the prime minister with the country’s previous |
| | | | |
| PGIM Emerging Markets Debt Hard Currency Fund | | | 13 | |
Strategy and Performance Overview (continued)
| | president and suspended parliament. Venezuela lagged as its oil output is now half what it was in early 2016, and its economic and humanitarian crisis intensified. Senegal lagged as the Africa space underperformed in the “risk-off” sentiment. |
What worked?
| • | | Overweight positions in Brazil, Bahrain, Greece, Iraq, and Angola contributed to performance in the reporting period. |
| • | | Security selection within Venezuela also added to performance. |
| • | | Within foreign currencies, underweights to the Chilean peso, Chinese yuan, Swiss franc, and the Hungarian forint were all strong contributors. |
What didn’t work?
| • | | Overall country selection was the largest detractor from performance over the reporting period, highlighted by an overweight to Argentina. |
| • | | Security selection within India, Hungary, China, and Romania all detracted from returns over the period. |
| • | | Within foreign currencies, overweights to the Indian rupee, Brazilian real, and Russian ruble all hurt performance. |
Did the Fund use derivatives, and how did they affect performance?
| • | | Currency positioning in the Fund was partially facilitated by the use of currency forward and option contracts. During the reporting period, the Fund’s currency positioning detracted from relative performance. |
Current outlook
| • | | As the final quarter of 2018 progresses, PGIM Fixed Income is mindful of headwinds within emerging markets, yet remains comfortable adding risk, particularly where valuations are compelling after having reduced risk earlier in the year. Notable premiums have been built into spreads in countries where significant sell-offs occurred. PGIM Fixed Income’s outlook on emerging market debt is cautiously optimistic based on valuations, a decent global growth outlook, and adjustments that have already occurred. While there are distinct vulnerabilities, the risk of a credit event in sovereign and quasi-sovereign issuers in Argentina, Turkey, and other lower-rated countries is contained over the near term. Given the uncertainty of the future extent of Fed tightening, PGIM Fixed Income is more cautious of its longer-dated positioning, choosing to be positioned only in higher-rated sovereigns and quasi-sovereigns in the long end. As of the end of the reporting period, the Fund featured overweights to Brazil, Argentina, Bahrain, and the Ukraine while holding underweight positions in China and the Philippines. Looking at FX positioning, the Fund features long positions in the Peruvian nuevo sol, Indian rupee, and Thai baht, and is short in the Chinese yuan, Hungarian forint, South African rand, and Polish zloty. |
| | |
| 14 | | Visit our website at pgiminvestments.com |
Fees and Expenses (unaudited)
As a shareholder of the Fund, you incur two types of costs: (1) transaction costs, including sales charges (loads) on purchase payments and redemptions, as applicable, and (2) ongoing costs, including management fees, distribution, and/or service (12b-1) fees, and other Fund expenses, as applicable. This example is intended to help you understand your ongoing costs (in dollars) of investing in the Fund and to compare these costs with the ongoing costs of investing in other mutual funds.
The example is based on an investment of $1,000 held through the six-month period ended October 31, 2018. The example is for illustrative purposes only; you should consult the Prospectus for information on initial and subsequent minimum investment requirements.
Actual Expenses
The first line for each share class in the table on the following page provides information about actual account values and actual expenses. You may use the information on this line, together with the amount you invested, to estimate the expenses that you paid over the period. Simply divide your account value by $1,000 (for example, an $8,600 account value ÷ $1,000 = 8.6), then multiply the result by the number on the first line under the heading “Expenses Paid During the Six-Month Period” to estimate the expenses you paid on your account during this period.
Hypothetical Example for Comparison Purposes
The second line for each share class in the table on the following page provides information about hypothetical account values and hypothetical expenses based on the Fund’s actual expense ratio and an assumed rate of return of 5% per year before expenses, which is not the Fund’s actual return. The hypothetical account values and expenses may not be used to estimate the actual ending account balance or expenses you paid for the period. You may use this information to compare the ongoing costs of investing in the Fund and other funds. To do so, compare this 5% hypothetical example with the 5% hypothetical examples that appear in the shareholder reports of the other funds.
The Fund’s transfer agent may charge additional fees to holders of certain accounts that are not included in the expenses shown in the table on the following page. These fees apply to individual retirement accounts (IRAs) and Section 403(b) accounts. As of the close of the six-month period covered by the table, IRA fees included an annual maintenance fee of $15 per account (subject to a maximum annual maintenance fee of $25 for all accounts held by the same shareholder). Section 403(b) accounts are charged an annual $25 fiduciary maintenance fee. Some of the fees may vary in amount, or may be waived, based on your total account balance or the number of PGIM funds, including the Fund, that you own. You should consider the additional fees that were charged to your Fund account over the six-month period when you estimate the total ongoing expenses paid over the period
| | | | |
| PGIM Emerging Markets Debt Hard Currency Fund | | | 15 | |
Fees and Expenses (continued)
and the impact of these fees on your ending account value, as these additional expenses are not reflected in the information provided in the expense table. Additional fees have the effect of reducing investment returns.
Please note that the expenses shown in the table are meant to highlight your ongoing costs only and do not reflect any transactional costs such as sales charges (loads). Therefore, the second line for each share class in the table is useful in comparing ongoing costs only and will not help you determine the relative total costs of owning different funds. In addition, if these transactional costs were included, your costs would have been higher.
| | | | | | | | | | | | | | | | | | |
PGIM Emerging
Markets Debt Hard
Currency Fund | | Beginning Account
Value
May 1, 2018 | | | Ending Account
Value
October 31, 2018 | | | Annualized
Expense Ratio
Based on the
Six-Month Period | | | Expenses Paid
During the
Six-Month Period* | |
| Class A | | Actual | | $ | 1,000.00 | | | $ | 960.00 | | | | 1.05 | % | | $ | 5.19 | |
| | Hypothetical | | $ | 1,000.00 | | | $ | 1,019.91 | | | | 1.05 | % | | $ | 5.35 | |
| Class C | | Actual | | $ | 1,000.00 | | | $ | 957.40 | | | | 1.80 | % | | $ | 8.88 | |
| | Hypothetical | | $ | 1,000.00 | | | $ | 1,016.13 | | | | 1.80 | % | | $ | 9.15 | |
| Class Z | | Actual | | $ | 1,000.00 | | | $ | 960.90 | | | | 0.80 | % | | $ | 3.95 | |
| | Hypothetical | | $ | 1,000.00 | | | $ | 1,021.17 | | | | 0.80 | % | | $ | 4.08 | |
| Class R6** | | Actual | | $ | 1,000.00 | | | $ | 961.50 | | | | 0.74 | % | | $ | 3.66 | |
| | | Hypothetical | | $ | 1,000.00 | | | $ | 1,021.48 | | | | 0.74 | % | | $ | 3.77 | |
*Fund expenses (net of fee waivers or subsidies, if any) for each share class are equal to the annualized expense ratio for each share class (provided in the table), multiplied by the average account value over the period, multiplied by the 184 days in the six-month period ended October 31, 2018, and divided by the 365 days in the Fund’s fiscal year ended October 31, 2018 (to reflect the six-month period). Expenses presented in the table include the expenses of any underlying portfolios in which the Fund may invest.
**Formerly known as Class Q shares.
| | |
| 16 | | Visit our website at pgiminvestments.com |
Schedule of Investments
as of October 31, 2018
| | | | | | | | | | | | | | | | |
| Description | | Interest
Rate | | | Maturity
Date | | | Principal
Amount (000)# | | | Value | |
LONG-TERM INVESTMENTS 97.2% | | | | | | | | | | | | | | | | |
| | | | |
CORPORATE BONDS 20.0% | | | | | | | | | | | | | | | | |
| | | | |
Argentina 0.6% | | | | | | | | | | | | | | | | |
YPF SA,
Sr. Unsec’d. Notes | | | 8.500 | % | | | 07/28/25 | | | | 155 | | | $ | 146,824 | |
| | | | |
Brazil 2.1% | | | | | | | | | | | | | | | | |
Banco do Brasil SA,
Gtd. Notes | | | 3.875 | | | | 10/10/22 | | | | 200 | | | | 189,702 | |
Petrobras Global Finance BV, | | | | | | | | | | | | | | | | |
Gtd. Notes | | | 5.299 | | | | 01/27/25 | | | | 125 | | | | 119,375 | |
Gtd. Notes | | | 5.999 | | | | 01/27/28 | | | | 95 | | | | 89,775 | |
Gtd. Notes | | | 6.250 | | | | 03/17/24 | | | | 15 | | | | 15,173 | |
Gtd. Notes | | | 7.375 | | | | 01/17/27 | | | | 18 | | | | 18,654 | |
Gtd. Notes | | | 8.750 | | | | 05/23/26 | | | | 87 | | | | 97,166 | |
| | | | | | | | | | | | | | | | |
| | | | | | | | | | | | | | | 529,845 | |
| | | | |
Chile 0.7% | | | | | | | | | | | | | | | | |
Corp Nacional del Cobre de Chile,
Sr. Unsec’d. Notes, 144A | | | 4.875 | | | | 11/04/44 | | | | 200 | | | | 194,748 | |
| | | | |
China 1.5% | | | | | | | | | | | | | | | | |
CNAC HK Finbridge Co. Ltd.,
Gtd. Notes | | | 4.875 | | | | 03/14/25 | | | | 240 | | | | 238,104 | |
Sinochem Overseas Capital Co. Ltd.,
Gtd. Notes | | | 6.300 | | | | 11/12/40 | | | | 130 | | | | 151,563 | |
| | | | | | | | | | | | | | | | |
| | | | | | | | | | | | | | | 389,667 | |
| | | | |
India 0.7% | | | | | | | | | | | | | | | | |
HPCL-Mittal Energy Ltd.,
Sr. Unsec’d. Notes | | | 5.250 | | | | 04/28/27 | | | | 200 | | | | 175,435 | |
| | | | |
Indonesia 1.6% | | | | | | | | | | | | | | | | |
Pelabuhan Indonesia III Persero PT,
Sr. Unsec’d. Notes | | | 4.875 | | | | 10/01/24 | | | | 200 | | | | 195,240 | |
Saka Energi Indonesia PT,
Sr. Unsec’d. Notes | | | 4.450 | | | | 05/05/24 | | | | 250 | | | | 228,967 | |
| | | | | | | | | | | | | | | | |
| | | | | | | | | | | | | | | 424,207 | |
See Notes to Financial Statements.
| | | | |
| PGIM Emerging Markets Debt Hard Currency Fund | | | 17 | |
Schedule of Investments (continued)
as of October 31, 2018
| | | | | | | | | | | | | | | | |
| Description | | Interest
Rate | | | Maturity
Date | | | Principal
Amount (000)# | | | Value | |
CORPORATE BONDS (Continued) | | | | | | | | | | | | | | | | |
| | | | |
Kazakhstan 0.8% | | | | | | | | | | | | | | | | |
KazMunayGas National Co. JSC,
Sr. Unsec’d. Notes | | | 4.750 | % | | | 04/24/25 | | | | 200 | | | $ | 199,557 | |
| | | | |
Malaysia 1.9% | | | | | | | | | | | | | | | | |
Petroliam Nasional Bhd,
Sr. Unsec’d. Notes | | | 7.625 | | | | 10/15/26 | | | | 250 | | | | 307,315 | |
Petronas Capital Ltd.,
Gtd. Notes, MTN | | | 3.500 | | | | 03/18/25 | | | | 200 | | | | 193,432 | |
| | | | | | | | | | | | | | | | |
| | | | | | | | | | | | | | | 500,747 | |
| | | | |
Mexico 5.1% | | | | | | | | | | | | | | | | |
Mexichem SAB de CV,
Gtd. Notes | | | 5.500 | | | | 01/15/48 | | | | 200 | | | | 175,902 | |
Nemak Sab de CV,
Sr. Unsec’d. Notes | | | 4.750 | | | | 01/23/25 | | | | 200 | | | | 192,580 | |
Petroleos Mexicanos, | | | | | | | | | | | | | | | | |
Gtd. Notes | | | 4.875 | | | | 01/18/24 | | | | 140 | | | | 133,183 | |
Gtd. Notes | | | 6.500 | | | | 03/13/27 | | | | 275 | | | | 266,200 | |
Gtd. Notes | | | 6.500 | | | | 06/02/41 | | | | 410 | | | | 351,083 | |
Gtd. Notes, 144A | | | 6.500 | | | | 01/23/29 | | | | 40 | | | | 38,280 | |
Gtd. Notes, MTN | | | 6.875 | | | | 08/04/26 | | | | 140 | | | | 139,440 | |
| | | | | | | | | | | | | | | | |
| | | | | | | | | | | | | | | 1,296,668 | |
| | | | |
Russia 1.3% | | | | | | | | | | | | | | | | |
Gazprom OAO Via Gaz Capital SA,
Sr. Unsec’d. Notes, MTN | | | 8.625 | | | | 04/28/34 | | | | 120 | | | | 146,664 | |
Vnesheconombank Via VEB Finance PLC,
Sr. Unsec’d. Notes | | | 5.942 | | | | 11/21/23 | | | | 205 | | | | 195,707 | |
| | | | | | | | | | | | | | | | |
| | | | | | | | | | | | | | | 342,371 | |
| | | | |
South Africa 1.7% | | | | | | | | | | | | | | | | |
Eskom Holdings SOC Ltd., | | | | | | | | | | | | | | | | |
Sr. Unsec’d. Notes | | | 5.750 | | | | 01/26/21 | | | | 200 | | | | 191,500 | |
Sr. Unsec’d. Notes, MTN | | | 6.750 | | | | 08/06/23 | | | | 250 | | | | 233,750 | |
| | | | | | | | | | | | | | | | |
| | | | | | | | | | | | | | | 425,250 | |
| | | | |
Trinidad & Tobago 0.4% | | | | | | | | | | | | | | | | |
Petroleum Co. of Trinidad & Tobago Ltd.,
Sr. Unsec’d. Notes | | | 6.000 | | | | 05/08/22 | | | | 122 | | | | 106,189 | |
See Notes to Financial Statements.
| | | | | | | | | | | | | | | | |
| Description | | Interest
Rate | | | Maturity
Date | | | Principal
Amount (000)# | | | Value | |
CORPORATE BONDS (Continued) | | | | | | | | | | | | | | | | |
| | | | |
Tunisia 0.6% | | | | | | | | | | | | | | | | |
Banque Centrale de Tunisie International Bond,
Sr. Unsec’d. Notes | | | 5.625 | % | | | 02/17/24 | | | EUR | 140 | | | $ | 147,470 | |
| | | | |
Venezuela 1.0% | | | | | | | | | | | | | | | | |
Petroleos de Venezuela SA, | | | | | | | | | | | | | | | | |
Gtd. Notes(d) | | | 5.375 | | | | 04/12/27 | | | | 205 | | | | 36,387 | |
Gtd. Notes(d) | | | 6.000 | | | | 05/16/24 | | | | 45 | | | | 7,718 | |
Gtd. Notes(d) | | | 6.000 | | | | 11/15/26 | | | | 65 | | | | 11,213 | |
Sr. Sec’d. Notes | | | 8.500 | | | | 10/27/20 | | | | 205 | | | | 191,162 | |
| | | | | | | | | | | | | | | | |
| | | | | | | | | | | | | | | 246,480 | |
| | | | | | | | | | | | | | | | |
TOTAL CORPORATE BONDS
(cost $5,566,550) | | | | | | | | | | | | | | | 5,125,458 | |
| | | | | | | | | | | | | | | | |
| | | | |
SOVEREIGN BONDS 77.2% | | | | | | | | | | | | | | | | |
| | | | |
Angola 1.7% | | | | | | | | | | | | | | | | |
Angolan Government International Bond, | | | | | | | | | | | | | | | | |
Sr. Unsec’d. Notes | | | 9.500 | | | | 11/12/25 | | | | 200 | | | | 220,220 | |
Sr. Unsec’d. Notes, 144A | | | 9.375 | | | | 05/08/48 | | | | 200 | | | | 201,016 | |
| | | | | | | | | | | | | | | | |
| | | | | | | | | | | | | | | 421,236 | |
| | | | |
Argentina 4.8% | | | | | | | | | | | | | | | | |
Argentine Republic Government International Bond, | | | | | | | | | | | | | | | | |
Sr. Unsec’d. Notes | | | 2.260 | (cc) | | | 12/31/38 | | | EUR | 70 | | | | 44,328 | |
Sr. Unsec’d. Notes | | | 2.500 | (cc) | | | 12/31/38 | | | | 110 | | | | 61,270 | |
Sr. Unsec’d. Notes | | | 4.625 | | | | 01/11/23 | | | | 40 | | | | 33,800 | |
Sr. Unsec’d. Notes | | | 6.875 | | | | 04/22/21 | | | | 150 | | | | 143,475 | |
Sr. Unsec’d. Notes | | | 6.875 | | | | 01/11/48 | | | | 30 | | | | 21,975 | |
Sr. Unsec’d. Notes | | | 7.500 | | | | 04/22/26 | | | | 240 | | | | 209,400 | |
Sr. Unsec’d. Notes | | | 7.820 | | | | 12/31/33 | | | EUR | 179 | | | | 182,360 | |
Sr. Unsec’d. Notes | | | 8.280 | | | | 12/31/33 | | | | 210 | | | | 180,337 | |
Sr. Unsec’d. Notes | | | 8.280 | | | | 12/31/33 | | | | 42 | | | | 35,542 | |
Provincia de Buenos Aires, | | | | | | | | | | | | | | | | |
Sr. Unsec’d. Notes | | | 5.375 | | | | 01/20/23 | | | EUR | 100 | | | | 92,822 | |
Sr. Unsec’d. Notes, 144A | | | 9.125 | | | | 03/16/24 | | | | 245 | | | | 218,665 | |
| | | | | | | | | | | | | | | | |
| | | | | | | | | | | | | | | 1,223,974 | |
See Notes to Financial Statements.
| | | | |
| PGIM Emerging Markets Debt Hard Currency Fund | | | 19 | |
Schedule of Investments (continued)
as of October 31, 2018
| | | | | | | | | | | | | | | | |
| Description | | Interest
Rate | | | Maturity
Date | | | Principal
Amount (000)# | | | Value | |
SOVEREIGN BONDS (Continued) | | | | | | | | | | | | | | | | |
| | | | |
Azerbaijan 1.1% | | | | | | | | | | | | | | | | |
Republic of Azerbaijan International Bond,
Sr. Unsec’d. Notes | | | 4.750 | % | | | 03/18/24 | | | | 275 | | | $ | 270,875 | |
| | | | |
Bahrain 1.5% | | | | | | | | | | | | | | | | |
Bahrain Government International Bond, | | | | | | | | | | | | | | | | |
Sr. Unsec’d. Notes | | | 6.750 | | | | 09/20/29 | | | | 200 | | | | 190,670 | |
Sr. Unsec’d. Notes | | | 7.000 | | | | 01/26/26 | | | | 200 | | | | 200,101 | |
| | | | | | | | | | | | | | | | |
| | | | | | | | | | | | | | | 390,771 | |
| | | | |
Belarus 0.8% | | | | | | | | | | | | | | | | |
Republic of Belarus International Bond,
Sr. Unsec’d. Notes | | | 6.875 | | | | 02/28/23 | | | | 200 | | | | 206,052 | |
| | | | |
Brazil 3.7% | | | | | | | | | | | | | | | | |
Brazil Minas SPE via State of Minas Gerais,
Gov’t. Gtd. Notes | | | 5.333 | | | | 02/15/28 | | | | 485 | | | | 469,844 | |
Brazilian Government International Bond, | | | | | | | | | | | | | | | | |
Sr. Unsec’d. Notes | | | 5.625 | | | | 01/07/41 | | | | 120 | | | | 110,460 | |
Sr. Unsec’d. Notes | | | 7.125 | | | | 01/20/37 | | | | 120 | | | | 132,000 | |
Sr. Unsec’d. Notes | | | 8.250 | | | | 01/20/34 | | | | 205 | | | | 245,487 | |
| | | | | | | | | | | | | | | | |
| | | | | | | | | | | | | | | 957,791 | |
| | | | |
Colombia 1.9% | | | | | | | | | | | | | | | | |
Colombia Government International Bond, | | | | | | | | | | | | | | | | |
Sr. Unsec’d. Notes | | | 6.125 | | | | 01/18/41 | | | | 135 | | | | 145,936 | |
Sr. Unsec’d. Notes | | | 7.375 | | | | 09/18/37 | | | | 275 | | | | 332,063 | |
| | | | | | | | | | | | | | | | |
| | | | | | | | | | | | | | | 477,999 | |
| | | | |
Congo (Republic) 0.2% | | | | | | | | | | | | | | | | |
Congolese International Bond,
Sr. Unsec’d. Notes | | | 6.000 | (cc) | | | 06/30/29 | | | | 63 | | | | 49,671 | |
| | | | |
Costa Rica 1.3% | | | | | | | | | | | | | | | | |
Costa Rica Government International Bond, | | | | | | | | | | | | | | | | |
Sr. Unsec’d. Notes | | | 4.375 | | | | 04/30/25 | | | | 200 | | | | 165,436 | |
Sr. Unsec’d. Notes | | | 7.158 | | | | 03/12/45 | | | | 200 | | | | 166,800 | |
| | | | | | | | | | | | | | | | |
| | | | | | | | | | | | | | | 332,236 | |
See Notes to Financial Statements.
| | | | | | | | | | | | | | | | |
| Description | | Interest
Rate | | | Maturity
Date | | | Principal
Amount (000)# | | | Value | |
SOVEREIGN BONDS (Continued) | | | | | | | | | | | | | | | | |
| | | | |
Dominican Republic 3.0% | | | | | | | | | | | | | | | | |
Dominican Republic International Bond, | | | | | | | | | | | | | | | | |
Sr. Unsec’d. Notes | | | 5.875 | % | | | 04/18/24 | | | | 305 | | | $ | 309,178 | |
Sr. Unsec’d. Notes | | | 7.450 | | | | 04/30/44 | | | | 340 | | | | 355,300 | |
Sr. Unsec’d. Notes | | | 7.500 | | | | 05/06/21 | | | | 110 | | | | 113,850 | |
| | | | | | | | | | | | | | | | |
| | | | | | | | | | | | | | | 778,328 | |
| | | | |
Ecuador 3.4% | | | | | | | | | | | | | | | | |
Ecuador Government International Bond, | | | | | | | | | | | | | | | | |
Sr. Unsec’d. Notes | | | 8.750 | | | | 06/02/23 | | | | 200 | | | | 191,000 | |
Sr. Unsec’d. Notes | | | 8.875 | | | | 10/23/27 | | | | 300 | | | | 263,700 | |
Sr. Unsec’d. Notes | | | 10.500 | | | | 03/24/20 | | | | 200 | | | | 205,000 | |
Sr. Unsec’d. Notes | | | 10.750 | | | | 03/28/22 | | | | 200 | | | | 206,000 | |
| | | | | | | | | | | | | | | | |
| | | | | | | | | | | | | | | 865,700 | |
| | | | |
Egypt 2.8% | | | | | | | | | | | | | | | | |
Egypt Government International Bond, | | | | | | | | | | | | | | | | |
Sr. Unsec’d. Notes, MTN | | | 6.125 | | | | 01/31/22 | | | | 300 | | | | 296,136 | |
Sr. Unsec’d. Notes, MTN | | | 7.500 | | | | 01/31/27 | | | | 200 | | | | 195,564 | |
Sr. Unsec’d. Notes, MTN | | | 8.500 | | | | 01/31/47 | | | | 250 | | | | 235,912 | |
| | | | | | | | | | | | | | | | |
| | | | | | | | | | | | | | | 727,612 | |
| | | | |
El Salvador 2.0% | | | | | | | | | | | | | | | | |
El Salvador Government International Bond, | | | | | | | | | | | | | | | | |
Sr. Unsec’d. Notes | | | 6.375 | | | | 01/18/27 | | | | 75 | | | | 67,031 | |
Sr. Unsec’d. Notes | | | 7.375 | | | | 12/01/19 | | | | 135 | | | | 134,798 | |
Sr. Unsec’d. Notes | | | 7.750 | | | | 01/24/23 | | | | 250 | | | | 251,722 | |
Sr. Unsec’d. Notes | | | 8.250 | | | | 04/10/32 | | | | 45 | | | | 44,103 | |
| | | | | | | | | | | | | | | | |
| | | | | | | | | | | | | | | 497,654 | |
| | | | |
Gabon 0.7% | | | | | | | | | | | | | | | | |
Gabon Government International Bond,
Bonds | | | 6.375 | | | | 12/12/24 | | | | 200 | | | | 181,708 | |
| | | | |
Ghana 0.9% | | | | | | | | | | | | | | | | |
Ghana Government International Bond,
Bank Gtd. Notes | | | 10.750 | | | | 10/14/30 | | | | 200 | | | | 239,756 | |
See Notes to Financial Statements.
| | | | |
| PGIM Emerging Markets Debt Hard Currency Fund | | | 21 | |
Schedule of Investments (continued)
as of October 31, 2018
| | | | | | | | | | | | | | | | |
| Description | | Interest
Rate | | | Maturity
Date | | | Principal
Amount (000)# | | | Value | |
SOVEREIGN BONDS (Continued) | | | | | | | | | | | | | | | | |
| | | | |
Greece 0.7% | | | | | | | | | | | | | | | | |
Hellenic Republic Government Bond,
Bonds | | | 3.000 | %(cc) | | | 02/24/37 | | | EUR | 200 | | | $ | 187,086 | |
| | | | |
Honduras 0.8% | | | | | | | | | | | | | | | | |
Honduras Government International Bond,
Sr. Unsec’d. Notes | | | 7.500 | | | | 03/15/24 | | | | 200 | | | | 210,924 | |
| | | | |
Hungary 0.9% | | | | | | | | | | | | | | | | |
Hungary Government International Bond,
Sr. Unsec’d. Notes | | | 7.625 | | | | 03/29/41 | | | | 178 | | | | 241,635 | |
| | | | |
Indonesia 3.2% | | | | | | | | | | | | | | | | |
Indonesia Government International Bond, | | | | | | | | | | | | | | | | |
Sr. Unsec’d. Notes | | | 7.750 | | | | 01/17/38 | | | | 160 | | | | 199,388 | |
Sr. Unsec’d. Notes | | | 8.500 | | | | 10/12/35 | | | | 150 | | | | 196,599 | |
Sr. Unsec’d. Notes, MTN | | | 4.750 | | | | 01/08/26 | | | | 300 | | | | 296,489 | |
Sr. Unsec’d. Notes, MTN | | | 6.750 | | | | 01/15/44 | | | | 100 | | | | 115,028 | |
| | | | | | | | | | | | | | | | |
| | | | | | | | | | | | | | | 807,504 | |
| | | | |
Iraq 1.7% | | | | | | | | | | | | | | | | |
Iraq International Bond, | | | | | | | | | | | | | | | | |
Sr. Unsec’d. Notes | | | 6.752 | | | | 03/09/23 | | | | 200 | | | | 194,692 | |
Unsec’d. Notes | | | 5.800 | | | | 01/15/28 | | | | 250 | | | | 228,997 | |
| | | | | | | | | | | | | | | | |
| | | | | | | | | | | | | | | 423,689 | |
| | | | |
Ivory Coast 1.1% | | | | | | | | | | | | | | | | |
Ivory Coast Government International Bond, | | | | | | | | | | | | | | | | |
Sr. Unsec’d. Notes | | | 6.375 | | | | 03/03/28 | | | | 200 | | | | 185,372 | |
Sr. Unsec’d. Notes | | | 6.625 | | | | 03/22/48 | | | EUR | 100 | | | | 100,880 | |
| | | | | | | | | | | | | | | | |
| | | | | | | | | | | | | | | 286,252 | |
| | | | |
Jamaica 1.0% | | | | | | | | | | | | | | | | |
Jamaica Government International Bond,
Sr. Unsec’d. Notes | | | 7.625 | | | | 07/09/25 | | | | 225 | | | | 257,063 | |
| | | | |
Jordan 0.7% | | | | | | | | | | | | | | | | |
Jordan Government International Bond,
Sr. Unsec’d. Notes | | | 7.375 | | | | 10/10/47 | | | | 200 | | | | 181,032 | |
See Notes to Financial Statements.
| | | | | | | | | | | | | | | | |
| Description | | Interest
Rate | | | Maturity
Date | | | Principal
Amount (000)# | | | Value | |
SOVEREIGN BONDS (Continued) | | | | | | | | | | | | | | | | |
| | | | |
Kazakhstan 0.9% | | | | | | | | | | | | | | | | |
Kazakhstan Government International Bond,
Sr. Unsec’d. Notes, MTN | | | 6.500 | % | | | 07/21/45 | | | | 200 | | | $ | 238,130 | |
| | | | |
Kenya 1.5% | | | | | | | | | | | | | | | | |
Kenya Government International Bond, | | | | | | | | | | | | | | | | |
Sr. Unsec’d. Notes | | | 6.875 | | | | 06/24/24 | | | | 200 | | | | 194,582 | |
Sr. Unsec’d. Notes, 144A | | | 7.250 | | | | 02/28/28 | | | | 200 | | | | 188,620 | |
| | | | | | | | | | | | | | | | |
| | | | | | | | | | | | | | | 383,202 | |
| | | | |
Lebanon 2.3% | | | | | | | | | | | | | | | | |
Lebanon Government International Bond, | | | | | | | | | | | | | | | | |
Sr. Unsec’d. Notes | | | 6.000 | | | | 01/27/23 | | | | 102 | | | | 87,787 | |
Sr. Unsec’d. Notes | | | 6.650 | | | | 04/22/24 | | | | 40 | | | | 34,114 | |
Sr. Unsec’d. Notes, EMTN | | | 6.100 | | | | 10/04/22 | | | | 100 | | | | 87,162 | |
Sr. Unsec’d. Notes, EMTN | | | 6.250 | | | | 05/27/22 | | | | 70 | | | | 61,594 | |
Sr. Unsec’d. Notes, MTN | | | 6.400 | | | | 05/26/23 | | | | 150 | | | | 129,762 | |
Sr. Unsec’d. Notes, MTN | | | 8.250 | | | | 04/12/21 | | | | 205 | | | | 196,193 | |
| | | | | | | | | | | | | | | | |
| | | | | | | | | | | | | | | 596,612 | |
| | | | |
Malaysia 0.2% | | | | | | | | | | | | | | | | |
Malaysia Government Bond,
Sr. Unsec’d. Notes | | | 4.378 | | | | 11/29/19 | | | MYR | 255 | | | | 61,522 | |
| | | | |
Mexico 0.7% | | | | | | | | | | | | | | | | |
Mexico Government International Bond, | | | | | | | | | | | | | | | | |
Sr. Unsec’d. Notes, GMTN | | | 5.750 | | | | 10/12/2110 | | | | 94 | | | | 86,245 | |
Sr. Unsec’d. Notes, MTN | | | 6.050 | | | | 01/11/40 | | | | 92 | | | | 95,450 | |
| | | | | | | | | | | | | | | | |
| | | | | | | | | | | | | | | 181,695 | |
| | | | |
Nigeria 1.9% | | | | | | | | | | | | | | | | |
Nigeria Government International Bond, | | | | | | | | | | | | | | | | |
Sr. Unsec’d. Notes | | | 5.625 | | | | 06/27/22 | | | | 130 | | | | 128,110 | |
Sr. Unsec’d. Notes, 144A | | | 7.143 | | | | 02/23/30 | | | | 200 | | | | 183,710 | |
Sr. Unsec’d. Notes, 144A | | | 7.696 | | | | 02/23/38 | | | | 200 | | | | 180,002 | |
| | | | | | | | | | | | | | | | |
| | | | | | | | | | | | | | | 491,822 | |
See Notes to Financial Statements.
| | | | |
| PGIM Emerging Markets Debt Hard Currency Fund | | | 23 | |
Schedule of Investments (continued)
as of October 31, 2018
| | | | | | | | | | | | | | | | |
| Description | | Interest
Rate | | | Maturity
Date | | | Principal
Amount (000)# | | | Value | |
SOVEREIGN BONDS (Continued) | | | | | | | | | | | | | | | | |
| | | | |
Oman 1.5% | | | | | | | | | | | | | | | | |
Oman Government International Bond, | | | | | | | | | | | | | | | | |
Sr. Unsec’d. Notes | | | 6.500 | % | | | 03/08/47 | | | | 225 | | | $ | 200,813 | |
Sr. Unsec’d. Notes, 144A | | | 6.750 | | | | 01/17/48 | | | | 200 | | | | 182,500 | |
| | | | | | | | | | | | | | | | |
| | | | | | | | | | | | | | | 383,313 | |
| | | | |
Pakistan 2.0% | | | | | | | | | | | | | | | | |
Pakistan Government International Bond,
Sr. Unsec’d. Notes | | | 8.250 | | | | 04/15/24 | | | | 300 | | | | 306,378 | |
Second Pakistan International Sukuk Co. Ltd. (The),
Sr. Unsec’d. Notes | | | 6.750 | | | | 12/03/19 | | | | 200 | | | | 200,318 | |
| | | | | | | | | | | | | | | | |
| | | | | | | | | | | | | | | 506,696 | |
| | | | |
Panama 1.6% | | | | | | | | | | | | | | | | |
Panama Government International Bond, | | | | | | | | | | | | | | | | |
Sr. Unsec’d. Notes | | | 6.700 | | | | 01/26/36 | | | | 220 | | | | 263,450 | |
Sr. Unsec’d. Notes | | | 9.375 | | | | 04/01/29 | | | | 105 | | | | 145,425 | |
| | | | | | | | | | | | | | | | |
| | | | | | | | | | | | | | | 408,875 | |
| | | | |
Papua New Guinea 0.8% | | | | | | | | | | | | | | | | |
Papua New Guinea Government International Bond,
Sr. Unsec’d. Notes, 144A | | | 8.375 | | | | 10/04/28 | | | | 200 | | | | 198,250 | |
| | | | |
Peru 1.8% | | | | | | | | | | | | | | | | |
Peruvian Government International Bond, | | | | | | | | | | | | | | | | |
Sr. Unsec’d. Notes | | | 6.550 | | | | 03/14/37 | | | | 75 | | | | 91,312 | |
Sr. Unsec’d. Notes | | | 8.750 | | | | 11/21/33 | | | | 265 | | | | 378,950 | |
| | | | | | | | | | | | | | | | |
| | | | | | | | | | | | | | | 470,262 | |
| | | | |
Philippines 1.0% | | | | | | | | | | | | | | | | |
Philippine Government International Bond,
Sr. Unsec’d. Notes | | | 7.750 | | | | 01/14/31 | | | | 200 | | | | 262,141 | |
| | | | |
Qatar 0.8% | | | | | | | | | | | | | | | | |
Qatar Government International Bond,
Sr. Unsec’d. Notes | | | 5.103 | | | | 04/23/48 | | | | 200 | | | | 203,000 | |
| | | | |
Romania 0.8% | | | | | | | | | | | | | | | | |
Romanian Government International Bond,
Sr. Unsec’d. Notes | | | 5.125 | | | | 06/15/48 | | | | 40 | | | | 36,998 | |
See Notes to Financial Statements.
| | | | | | | | | | | | | | | | |
| Description | | Interest
Rate | | | Maturity
Date | | | Principal
Amount (000)# | | | Value | |
SOVEREIGN BONDS (Continued) | | | | | | | | | | | | | | | | |
| | | | |
Romania (cont’d.) | | | | | | | | | | | | | | | | |
Romanian Government International Bond, (cont’d.) | | | | | | | | | | | | | | | | |
Sr. Unsec’d. Notes, 144A | | | 5.125 | % | | | 06/15/48 | | | | 44 | | | $ | 40,698 | |
Sr. Unsec’d. Notes, EMTN | | | 3.875 | | | | 10/29/35 | | | EUR | 7 | | | | 7,861 | |
Sr. Unsec’d. Notes, MTN | | | 6.125 | | | | 01/22/44 | | | | 98 | | | | 105,522 | |
| | | | | | | | | | | | | | | | |
| | | | | | | | | | | | | | | 191,079 | |
| | | | |
Russia 2.3% | | | | | | | | | | | | | | | | |
Russian Foreign Bond, | | | | | | | | | | | | | | | | |
Sr. Unsec’d. Notes | | | 4.750 | | | | 05/27/26 | | | | 200 | | | | 197,300 | |
Sr. Unsec’d. Notes | | | 5.625 | | | | 04/04/42 | | | | 200 | | | | 203,210 | |
Sr. Unsec’d. Notes | | | 12.750 | | | | 06/24/28 | | | | 110 | | | | 174,089 | |
| | | | | | | | | | | | | | | | |
| | | | | | | | | | | | | | | 574,599 | |
| | | | |
Saudi Arabia 0.8% | | | | | | | | | | | | | | | | |
Saudi Government International Bond,
Sr. Unsec’d. Notes, MTN | | | 5.000 | | | | 04/17/49 | | | | 200 | | | | 191,806 | |
| | | | |
Senegal 0.7% | | | | | | | | | | | | | | | | |
Senegal Government International Bond,
Sr. Unsec’d. Notes, 144A | | | 6.750 | | | | 03/13/48 | | | | 205 | | | | 168,449 | |
| | | | |
South Africa 2.3% | | | | | | | | | | | | | | | | |
Republic of South Africa Government International Bond, | | | | | | | | | | | | | | | | |
Sr. Unsec’d. Notes | | | 4.665 | | | | 01/17/24 | | | | 100 | | | | 95,548 | |
Sr. Unsec’d. Notes | | | 4.875 | | | | 04/14/26 | | | | 200 | | | | 185,000 | |
Sr. Unsec’d. Notes | | | 5.875 | | | | 09/16/25 | | | | 200 | | | | 197,232 | |
Sr. Unsec’d. Notes | | | 6.250 | | | | 03/08/41 | | | | 130 | | | | 120,843 | |
| | | | | | | | | | | | | | | | |
| | | | | | | | | | | | | | | 598,623 | |
| | | | |
Sri Lanka 2.8% | | | | | | | | | | | | | | | | |
Sri Lanka Government International Bond, | | | | | | | | | | | | | | | | |
Sr. Unsec’d. Notes | | | 5.750 | | | | 01/18/22 | | | | 200 | | | | 185,794 | |
Sr. Unsec’d. Notes | | | 5.875 | | | | 07/25/22 | | | | 200 | | | | 184,480 | |
Sr. Unsec’d. Notes | | | 6.200 | | | | 05/11/27 | | | | 200 | | | | 170,952 | |
Sr. Unsec’d. Notes, 144A | | | 5.750 | | | | 04/18/23 | | | | 200 | | | | 179,766 | |
| | | | | | | | | | | | | | | | |
| | | | | | | | | | | | | | | 720,992 | |
See Notes to Financial Statements.
| | | | |
| PGIM Emerging Markets Debt Hard Currency Fund | | | 25 | |
Schedule of Investments (continued)
as of October 31, 2018
| | | | | | | | | | | | | | | | |
| Description | | Interest
Rate | | | Maturity
Date | | | Principal
Amount (000)# | | | Value | |
SOVEREIGN BONDS (Continued) | | | | | | | | | | | | | | | | |
| | | | |
Turkey 4.7% | | | | | | | | | | | | | | | | |
Export Credit Bank of Turkey,
Sr. Unsec’d. Notes | | | 5.375 | % | | | 10/24/23 | | | | 200 | | | $ | 176,866 | |
Turkey Government International Bond, | | | | | | | | | | | | | | | | |
Sr. Unsec’d. Notes | | | 4.250 | | | | 04/14/26 | | | | 200 | | | | 164,673 | |
Sr. Unsec’d. Notes | | | 5.125 | | | | 03/25/22 | | | | 350 | | | | 329,109 | |
Sr. Unsec’d. Notes | | | 5.750 | | | | 03/22/24 | | | | 200 | | | | 186,298 | |
Sr. Unsec’d. Notes | | | 6.875 | | | | 03/17/36 | | | | 215 | | | | 191,146 | |
Sr. Unsec’d. Notes | | | 7.375 | | | | 02/05/25 | | | | 135 | | | | 133,806 | |
Sr. Unsec’d. Notes | | | 8.000 | | | | 02/14/34 | | | | 30 | | | | 29,799 | |
| | | | | | | | | | | | | | | | |
| | | | | | | | | | | | | | | 1,211,697 | |
| | | | |
Ukraine 4.0% | | | | | | | | | | | | | | | | |
Ukraine Government International Bond, | | | | | | | | | | | | | | | | |
Sr. Unsec’d. Notes | | | 7.750 | | | | 09/01/21 | | | | 110 | | | | 108,208 | |
Sr. Unsec’d. Notes | | | 7.750 | | | | 09/01/22 | | | | 100 | | | | 96,936 | |
Sr. Unsec’d. Notes | | | 7.750 | | | | 09/01/23 | | | | 305 | | | | 290,115 | |
Sr. Unsec’d. Notes | | | 7.750 | | | | 09/01/24 | | | | 135 | | | | 126,563 | |
Sr. Unsec’d. Notes | | | 7.750 | | | | 09/01/25 | | | | 115 | | | | 105,663 | |
Sr. Unsec’d. Notes | | | 7.750 | | | | 09/01/26 | | | | 100 | | | | 90,382 | |
Ukreximbank Via Biz Finance PLC,
Sr. Unsec’d. Notes | | | 9.750 | | | | 01/22/25 | | | | 200 | | | | 199,003 | |
| | | | | | | | | | | | | | | | |
| | | | | | | | | | | | | | | 1,016,870 | |
| | | | |
Uruguay 1.2% | | | | | | | | | | | | | | | | |
Uruguay Government International Bond, | | | | | | | | | | | | | | | | |
Sr. Unsec’d. Notes | | | 5.100 | | | | 06/18/50 | | | | 60 | | | | 56,850 | |
Sr. Unsec’d. Notes | | | 7.625 | | | | 03/21/36 | | | | 185 | | | | 238,095 | |
| | | | | | | | | | | | | | | | |
| | | | | | | | | | | | | | | 294,945 | |
| | | | |
Venezuela 0.2% | | | | | | | | | | | | | | | | |
Venezuela Government International Bond,
Sr. Unsec’d. Notes(d) | | | 12.750 | | | | 08/23/22 | | | | 180 | | | | 45,900 | |
See Notes to Financial Statements.
| | | | | | | | | | | | | | | | |
| Description | | Interest
Rate | | | Maturity
Date | | | Principal
Amount (000)# | | | Value | |
SOVEREIGN BONDS (Continued) | | | | | | | | | | | | | | | | |
| | | | |
Zambia 0.5% | | | | | | | | | | | | | | | | |
Zambia Government International Bond,
Sr. Unsec’d. Notes | | | 8.500 | % | | | 04/14/24 | | | | 200 | | | $ | 136,138 | |
| | | | | | | | | | | | | | | | |
TOTAL SOVEREIGN BONDS
(cost $21,843,001) | | | | | | | | | | | | | | | 19,753,166 | |
| | | | | | | | | | | | | | | | |
TOTAL LONG-TERM INVESTMENTS
(cost $27,409,551) | | | | | | | | | | | | | | | 24,878,624 | |
| | | | | | | | | | | | | | | | |
| | | | |
| | | | | | | | | Shares | | | | |
| | | | |
SHORT-TERM INVESTMENT 1.1% | | | | | | | | | | | | | | | | |
| | | | |
AFFILIATED MUTUAL FUND | | | | | | | | | | | | | | | | |
PGIM Core Ultra Short Bond Fund
(cost $267,048)(w) | | | | | | | | | | | 267,048 | | | | 267,048 | |
| | | | | | | | | | | | | | | | |
TOTAL INVESTMENTS 98.3%
(cost $27,676,599) | | | | | | | | | | | | | | | 25,145,672 | |
Other assets in excess of liabilities(z) 1.7% | | | | | | | | | | | | | | | 440,711 | |
| | | | | | | | | | | | | | | | |
NET ASSETS 100.0% | | | | | | | | | | | | | | $ | 25,586,383 | |
| | | | | | | | | | | | | | | | |
The following abbreviations are used in the annual report:
144A—Security was purchased pursuant to Rule 144A under the Securities Act of 1933 and may not be resold subject to that rule except to qualified institutional buyers. Unless otherwise noted, 144A securities are deemed to be liquid.
EMTN—Euro Medium Term Note
GMTN—Global Medium Term Note
LIBOR—London Interbank Offered Rate
MTN—Medium Term Note
OTC—Over-the-counter
ARS—Argentine Peso
AUD—Australian Dollar
BRL—Brazilian Real
CAD—Canadian Dollar
CHF—Swiss Franc
CLP—Chilean Peso
CNH—Chinese Renminbi
COP—Colombian Peso
CZK—Czech Koruna
EUR—Euro
HUF—Hungarian Forint
IDR—Indonesian Rupiah
ILS—Israeli Shekel
See Notes to Financial Statements.
| | | | |
| PGIM Emerging Markets Debt Hard Currency Fund | | | 27 | |
Schedule of Investments (continued)
as of October 31, 2018
INR—Indian Rupee
KRW—South Korean Won
MXN—Mexican Peso
MYR—Malaysian Ringgit
NZD—New Zealand Dollar
PEN—Peruvian Nuevo Sol
PHP—Philippine Peso
PLN—Polish Zloty
RUB—Russian Ruble
SGD—Singapore Dollar
THB—Thai Baht
TRY—Turkish Lira
TWD—New Taiwanese Dollar
ZAR—South African Rand
| # | Principal amount is shown in U.S. dollars unless otherwise stated. |
| (cc) | Variable rate instrument. The rate shown is based on the latest available information as of October 31, 2018. Certain variable rate securities are not based on a published reference rate and spread but are determined by the issuer or agent and are based on current market conditions. These securities do not indicate a reference rate and spread in their description. |
| (d) | Represents issuer in default on interest payments and/or principal repayment. Non-income producing security. Such securities may be post-maturity. |
| (w) | PGIM Investments LLC, the manager of the Fund, also serves as manager of the PGIM Core Ultra Short Bond Fund. |
| (z) | Includes net unrealized appreciation/(depreciation) and/or market value of the below holdings which are excluded from the Schedule of Investments: |
Forward foreign currency exchange contracts outstanding at October 31, 2018:
| | | | | | | | | | | | | | | | | | | | | | |
Purchase Contracts | | Counterparty | | Notional
Amount
(000) | | | Value at
Settlement
Date | | | Current
Value | | | Unrealized
Appreciation | | | Unrealized
Depreciation | |
OTC Forward Foreign Currency Exchange Contracts: | | | | | |
Argentine Peso, | | | | | | | | | | | | | | | | | | | | | | |
Expiring 11/30/18 | | BNP Paribas | | ARS | 326 | | | $ | 8,520 | | | $ | 8,737 | | | $ | 217 | | | $ | — | |
Expiring 11/30/18 | | BNP Paribas | | ARS | 325 | | | | 8,522 | | | | 8,716 | | | | 194 | | | | — | |
Canadian Dollar, | | | | | | | | | | | | | | | | | | | | | | |
Expiring 01/18/19 | | Citibank NA | | CAD | 110 | | | | 84,400 | | | | 83,641 | | | | — | | | | (759 | ) |
Expiring 01/18/19 | | Goldman Sachs
International | | CAD | 111 | | | | 84,600 | | | | 84,201 | | | | — | | | | (399 | ) |
Chilean Peso, | | | | | | | | | | | | | | | | | | | | | | |
Expiring 12/19/18 | | JPMorgan Chase | | CLP | 42,941 | | | | 64,300 | | | | 61,744 | | | | — | | | | (2,556 | ) |
Colombian Peso, | | | | | | | | | | | | | | | | | | | | | | |
Expiring 12/14/18 | | Citibank NA | | COP | 127,387 | | | | 40,325 | | | | 39,491 | | | | — | | | | (834 | ) |
Expiring 12/14/18 | | JPMorgan Chase | | COP | 124,056 | | | | 38,775 | | | | 38,458 | | | | — | | | | (317 | ) |
Indian Rupee, | | | | | | | | | | | | | | | | | | | | | | |
Expiring 01/11/19 | | Goldman Sachs
International | | INR | 4,548 | | | | 60,716 | | | | 60,976 | | | | 260 | | | | — | |
Expiring 01/11/19 | | Goldman Sachs
International | | INR | 4,348 | | | | 58,368 | | | | 58,293 | | | | — | | | | (75 | ) |
Expiring 01/11/19 | | JPMorgan Chase | | INR | 16,929 | | | | 227,260 | | | | 226,952 | | | | — | | | | (308 | ) |
Expiring 01/11/19 | | JPMorgan Chase | | INR | 13,645 | | | | 181,386 | | | | 182,928 | | | | 1,542 | | | | — | |
See Notes to Financial Statements.
Forward foreign currency exchange contracts outstanding at October 31, 2018 (continued):
| | | | | | | | | | | | | | | | | | | | | | |
Purchase Contracts | | Counterparty | | Notional
Amount
(000) | | | Value at
Settlement
Date | | | Current
Value | | | Unrealized
Appreciation | | | Unrealized
Depreciation | |
OTC Forward Foreign Currency Exchange Contracts (cont’d.): | | | | | |
Indonesian Rupiah, | | | | | | | | | | | | | | | | | | | | | | |
Expiring 12/19/18 | | Barclays Bank PLC | | IDR | 3,104,204 | | | $ | 203,617 | | | $ | 202,831 | | | $ | — | | | $ | (786 | ) |
Expiring 12/19/18 | | Barclays Bank PLC | | IDR | 2,192,368 | | | | 144,845 | | | | 143,251 | | | | — | | | | (1,594 | ) |
Expiring 12/19/18 | | Barclays Bank PLC | | IDR | 1,011,252 | | | | 66,000 | | | | 66,076 | | | | 76 | | | | — | |
Expiring 12/19/18 | | JPMorgan Chase | | IDR | 1,806,225 | | | | 118,955 | | | | 118,020 | | | | — | | | | (935 | ) |
Expiring 12/19/18 | | JPMorgan Chase | | IDR | 412,523 | | | | 27,042 | | | | 26,955 | | | | — | | | | (87 | ) |
Israeli Shekel, | | | | | | | | | | | | | | | | | | | | | | |
Expiring 01/28/19 | | Barclays Bank PLC | | ILS | 9 | | | | 2,500 | | | | 2,500 | | | | — | | | | — | |
New Taiwanese Dollar, | | | | | | | | | | | | | | | | | | | | | | |
Expiring 01/11/19 | | JPMorgan Chase | | TWD | 3,287 | | | | 107,000 | | | | 106,858 | | | | — | | | | (142 | ) |
Expiring 01/11/19 | | Morgan Stanley | | TWD | 1,978 | | | | 64,000 | | | | 64,315 | | | | 315 | | | | — | |
Peruvian Nuevo Sol, | | | | | | | | | | | | | | | | | | | | | | |
Expiring 12/19/18 | | BNP Paribas | | PEN | 643 | | | | 194,294 | | | | 190,237 | | | | — | | | | (4,057 | ) |
Expiring 12/19/18 | | BNP Paribas | | PEN | 278 | | | | 83,100 | | | | 82,350 | | | | — | | | | (750 | ) |
Expiring 12/19/18 | | Citibank NA | | PEN | 369 | | | | 110,698 | | | | 109,108 | | | | — | | | | (1,590 | ) |
Expiring 12/19/18 | | JPMorgan Chase | | PEN | 189 | | | | 56,835 | | | | 55,843 | | | | — | | | | (992 | ) |
Expiring 12/19/18 | | JPMorgan Chase | | PEN | 188 | | | | 56,706 | | | | 55,635 | | | | — | | | | (1,071 | ) |
Philippine Peso, | | | | | | | | | | | | | | | | | | | | | | |
Expiring 12/14/18 | | Barclays Bank PLC | | PHP | 5,173 | | | | 95,000 | | | | 96,397 | | | | 1,397 | | | | — | |
Expiring 12/14/18 | | Barclays Bank PLC | | PHP | 5,088 | | | | 93,000 | | | | 94,813 | | | | 1,813 | | | | — | |
Expiring 12/14/18 | | Barclays Bank PLC | | PHP | 3,658 | | | | 67,000 | | | | 68,170 | | | | 1,170 | | | | — | |
Expiring 12/14/18 | | JPMorgan Chase | | PHP | 5,703 | | | | 105,000 | | | | 106,262 | | | | 1,262 | | | | — | |
Expiring 12/14/18 | | JPMorgan Chase | | PHP | 4,533 | | | | 84,350 | | | | 84,459 | | | | 109 | | | | — | |
Expiring 12/14/18 | | JPMorgan Chase | | PHP | 4,493 | | | | 84,100 | | | | 83,720 | | | | — | | | | (380 | ) |
Expiring 12/14/18 | | Morgan Stanley | | PHP | 6,250 | | | | 114,000 | | | | 116,452 | | | | 2,452 | | | | — | |
Expiring 12/14/18 | | Morgan Stanley | | PHP | 4,725 | | | | 87,000 | | | | 88,048 | | | | 1,048 | | | | — | |
Expiring 12/14/18 | | Morgan Stanley | | PHP | 4,576 | | | | 84,000 | | | | 85,259 | | | | 1,259 | | | | — | |
Russian Ruble, | | | | | | | | | | | | | | | | | | | | | | |
Expiring 12/19/18 | | Barclays Bank PLC | | RUB | 4,898 | | | | 74,000 | | | | 73,888 | | | | — | | | | (112 | ) |
Expiring 12/19/18 | | Barclays Bank PLC | | RUB | 4,431 | | | | 66,000 | | | | 66,852 | | | | 852 | | | | — | |
Singapore Dollar, | | | | | | | | | | | | | | | | | | | | | | |
Expiring 11/09/18 | | Bank of America | | SGD | 99 | | | | 73,000 | | | | 71,737 | | | | — | | | | (1,263 | ) |
Expiring 11/09/18 | | Citibank NA | | SGD | 85 | | | | 62,000 | | | | 61,262 | | | | — | | | | (738 | ) |
Expiring 11/09/18 | | Deutsche Bank AG | | SGD | 97 | | | | 71,000 | | | | 69,981 | | | | — | | | | (1,019 | ) |
Expiring 11/09/18 | | Deutsche Bank AG | | SGD | 90 | | | | 66,000 | | | | 65,286 | | | | — | | | | (714 | ) |
Expiring 11/09/18 | | JPMorgan Chase | | SGD | 96 | | | | 70,000 | | | | 69,163 | | | | — | | | | (837 | ) |
South African Rand, | | | | | | | | | | | | | | | | | | | | | | |
Expiring 12/07/18 | | UBS AG | | ZAR | 1,134 | | | | 79,001 | | | | 76,538 | | | | — | | | | (2,463 | ) |
Expiring 12/07/18 | | UBS AG | | ZAR | 1,049 | | | | 73,000 | | | | 70,785 | | | | — | | | | (2,215 | ) |
South Korean Won, | | | | | | | | | | | | | | | | | | | | | | |
Expiring 01/16/19 | | JPMorgan Chase | | KRW | 77,291 | | | | 68,502 | | | | 68,014 | | | | — | | | | (488 | ) |
Thai Baht, | | | | | | | | | | | | | | | | | | | | | | |
Expiring 11/09/18 | | Citibank NA | | THB | 2,738 | | | | 84,813 | | | | 82,612 | | | | — | | | | (2,201 | ) |
See Notes to Financial Statements.
| | | | |
| PGIM Emerging Markets Debt Hard Currency Fund | | | 29 | |
Schedule of Investments (continued)
as of October 31, 2018
Forward foreign currency exchange contracts outstanding at October 31, 2018 (continued):
| | | | | | | | | | | | | | | | | | | | | | |
Purchase Contracts | | Counterparty | | Notional
Amount
(000) | | | Value at
Settlement
Date | | | Current
Value | | | Unrealized
Appreciation | | | Unrealized
Depreciation | |
OTC Forward Foreign Currency Exchange Contracts (cont’d.): | | | | | | | | | | | | | |
Thai Baht (cont’d.), | | | | | | | | | | | | | | | | | | | | |
Expiring 11/09/18 | | Citibank NA | | THB | 2,716 | | | $ | 83,000 | | | $ | 81,952 | | | $ | — | | | $ | (1,048 | ) |
Expiring 11/09/18 | | Citibank NA | | THB | 2,453 | | | | 75,000 | | | | 74,016 | | | | — | | | | (984 | ) |
Expiring 11/09/18 | | Citibank NA | | THB | 2,047 | | | | 62,000 | | | | 61,761 | | | | — | | | | (239 | ) |
Expiring 11/09/18 | | Citibank NA | | THB | 2,035 | | | | 63,000 | | | | 61,414 | | | | — | | | | (1,586 | ) |
Expiring 11/09/18 | | Deutsche Bank AG | | THB | 2,825 | | | | 87,000 | | | | 85,247 | | | | — | | | | (1,753 | ) |
Turkish Lira, | | | | | | | | | | | | | | | | | | | | |
Expiring 12/07/18 | | Barclays Bank PLC | | TRY | 409 | | | | 64,000 | | | | 71,418 | | | | 7,418 | | | | — | |
Expiring 12/07/18 | | JPMorgan Chase | | TRY | 427 | | | | 72,000 | | | | 74,613 | | | | 2,613 | | | | — | |
Expiring 12/07/18 | | JPMorgan Chase | | TRY | 271 | | | | 43,269 | | | | 47,277 | | | | 4,008 | | | | — | |
| | | | | | | | | | | | | | | | | | | | | | |
| | | | | | | | $ | 4,242,799 | | | $ | 4,235,512 | | | | 28,005 | | | | (35,292 | ) |
| | | | | | | | | | | | | | | | | | | | | | |
| | | | | | | | | | | | | | | | | | | | | | |
Sale Contracts | | Counterparty | | Notional
Amount
(000) | | | Value at
Settlement
Date | | | Current
Value | | | Unrealized
Appreciation | | | Unrealized
Depreciation | |
OTC Forward Foreign Currency Exchange Contracts: | | | | | | | | | | | | | | | | | |
Australian Dollar, | | | | | | | | | | | | | | | | | | | | | | |
Expiring 01/18/19 | | Bank of America | | AUD | 60 | | | $ | 42,640 | | | $ | 42,678 | | | $ | — | | | $ | (38 | ) |
Expiring 01/18/19 | | Toronto Dominion | | AUD | 2 | | | | 1,468 | | | | 1,462 | | | | 6 | | | | — | |
Brazilian Real, | | | | | | | | | | | | | | | | | | | | | | |
Expiring 12/04/18 | | Goldman Sachs
International | | BRL | 217 | | | | 53,388 | | | | 58,077 | | | | — | | | | (4,689 | ) |
Canadian Dollar, | | | | | | | | | | | | | | | | | | | | | | |
Expiring 01/18/19 | | Deutsche Bank AG | | CAD | 111 | | | | 84,965 | | | | 84,214 | | | | 751 | | | | — | |
Expiring 01/18/19 | | Goldman Sachs
International | | CAD | 111 | | | | 85,170 | | | | 84,120 | | | | 1,050 | | | | — | |
Chilean Peso, | | | | | | | | | | | | | | | | | | | | | | |
Expiring 12/19/18 | | BNP Paribas | | CLP | 204,879 | | | | 304,508 | | | | 294,591 | | | | 9,917 | | | | — | |
Chinese Renminbi, | | | | | | | | | | | | | | | | | | | | | | |
Expiring 01/28/19 | | Deutsche Bank AG | | CNH | 655 | | | | 94,000 | | | | 93,536 | | | | 464 | | | | — | |
Expiring 01/28/19 | | Deutsche Bank AG | | CNH | 572 | | | | 82,000 | | | | 81,652 | | | | 348 | | | | — | |
Expiring 01/28/19 | | Morgan Stanley | | CNH | 3,184 | | | | 456,491 | | | | 454,345 | | | | 2,146 | | | | — | |
Colombian Peso, | | | | | | | | | | | | | | | | | | | | | | |
Expiring 12/14/18 | | Citibank NA | | COP | 471,162 | | | | 150,953 | | | | 146,064 | | | | 4,889 | | | | — | |
Expiring 12/14/18 | | Morgan Stanley | | COP | 185,788 | | | | 62,000 | | | | 57,596 | | | | 4,404 | | | | — | |
Czech Koruna, | | | | | | | | | | | | | | | | | | | | | | |
Expiring 01/25/19 | | Citibank NA | | CZK | 3,499 | | | | 155,535 | | | | 154,055 | | | | 1,480 | | | | — | |
Expiring 01/25/19 | | Deutsche Bank AG | | CZK | 3,499 | | | | 156,467 | | | | 154,055 | | | | 2,412 | | | | — | |
Euro, | | | | | | | | | | | | | | | | | | | | | | |
Expiring 12/19/18 | | UBS AG | | EUR | 561 | | | | 642,150 | | | | 638,859 | | | | 3,291 | | | | — | |
Expiring 01/25/19 | | UBS AG | | EUR | 74 | | | | 84,350 | | | | 84,172 | | | | 178 | | | | — | |
See Notes to Financial Statements.
Forward foreign currency exchange contracts outstanding at October 31, 2018 (continued):
| | | | | | | | | | | | | | | | | | | | | | |
Sale Contracts | | Counterparty | | Notional
Amount
(000) | | | Value at
Settlement
Date | | | Current
Value | | | Unrealized
Appreciation | | | Unrealized
Depreciation | |
OTC Forward Foreign Currency Exchange Contracts (cont’d.): | | | | | | | | | | | | | |
Hungarian Forint, | | | | | | | | | | | | | | | | | | | | | | |
Expiring 01/25/19 | | JPMorgan Chase | | HUF | 42,501 | | | $ | 153,241 | | | $ | 149,402 | | | $ | 3,839 | | | $ | — | |
Expiring 01/25/19 | | Toronto Dominion | | HUF | 57,815 | | | | 207,303 | | | | 203,231 | | | | 4,072 | | | | — | |
Expiring 01/25/19 | | Toronto Dominion | | HUF | 28,476 | | | | 102,277 | | | | 100,099 | | | | 2,178 | | | | — | |
Indian Rupee, | | | | | | | | | | | | | | | | | | | | | | |
Expiring 01/11/19 | | JPMorgan Chase | | INR | 7,049 | | | | 95,000 | | | | 94,497 | | | | 503 | | | | — | |
Expiring 01/11/19 | | JPMorgan Chase | | INR | 6,284 | | | | 84,100 | | | | 84,244 | | | | — | | | | (144 | ) |
Indonesian Rupiah, | | | | | | | | | | | | | | | | | | | | | | |
Expiring 12/19/18 | | Barclays Bank PLC | | IDR | 1,626,729 | | | | 106,000 | | | | 106,292 | | | | — | | | | (292 | ) |
Expiring 12/19/18 | | Barclays Bank PLC | | IDR | 996,897 | | | | 66,000 | | | | 65,138 | | | | 862 | | | | — | |
Expiring 12/19/18 | | Barclays Bank PLC | | IDR | 506,226 | | | | 33,360 | | | | 33,077 | | | | 283 | | | | — | |
Expiring 12/19/18 | | JPMorgan Chase | | IDR | 1,898,087 | | | | 126,000 | | | | 124,022 | | | | 1,978 | | | | — | |
Expiring 12/19/18 | | JPMorgan Chase | | IDR | 1,211,420 | | | | 80,000 | | | | 79,155 | | | | 845 | | | | — | |
Expiring 12/19/18 | | JPMorgan Chase | | IDR | 1,152,375 | | | | 75,000 | | | | 75,297 | | | | — | | | | (297 | ) |
Expiring 12/19/18 | | JPMorgan Chase | | IDR | 1,102,577 | | | | 73,000 | | | | 72,043 | | | | 957 | | | | — | |
Expiring 12/19/18 | | JPMorgan Chase | | IDR | 1,093,608 | | | | 72,000 | | | | 71,457 | | | | 543 | | | | — | |
Expiring 12/19/18 | | JPMorgan Chase | | IDR | 573,723 | | | | 37,882 | | | | 37,488 | | | | 394 | | | | — | |
Expiring 12/19/18 | | JPMorgan Chase | | IDR | 447,243 | | | | 29,118 | | | | 29,223 | | | | — | | | | (105 | ) |
Expiring 12/19/18 | | JPMorgan Chase | | IDR | 403,892 | | | | 26,739 | | | | 26,391 | | | | 348 | | | | — | |
Expiring 12/19/18 | | Morgan Stanley | | IDR | 648,410 | | | | 42,757 | | | | 42,368 | | | | 389 | | | | — | |
Israeli Shekel, | | | | | | | | | | | | | | | | | | | | | | |
Expiring 01/28/19 | | Citibank NA | | ILS | 552 | | | | 150,661 | | | | 149,437 | | | | 1,224 | | | | — | |
Mexican Peso, | | | | | | | | | | | | | | | | | | | | | | |
Expiring 12/19/18 | | JPMorgan Chase | | MXN | 385 | | | | 20,051 | | | | 18,796 | | | | 1,255 | | | | — | |
Expiring 12/19/18 | | UBS AG | | MXN | 1,811 | | | | 95,610 | | | | 88,418 | | | | 7,192 | | | | — | |
New Taiwanese Dollar, | | | | | | | | | | | | | | | | | | | | | | |
Expiring 01/11/19 | | Morgan Stanley | | TWD | 2,525 | | | | 82,000 | | | | 82,092 | | | | — | | | | (92 | ) |
Expiring 01/11/19 | | UBS AG | | TWD | 1,635 | | | | 53,724 | | | | 53,155 | | | | 569 | | | | — | |
New Zealand Dollar, | | | | | | | | | | | | | | | | | | | | | | |
Expiring 01/18/19 | | JPMorgan Chase | | NZD | 63 | | | | 41,389 | | | | 41,438 | | | | — | | | | (49 | ) |
Peruvian Nuevo Sol, | | | | | | | | | | | | | | | | | | | | | | |
Expiring 12/19/18 | | JPMorgan Chase | | PEN | 246 | | | | 74,000 | | | | 72,899 | | | | 1,101 | | | | — | |
Philippine Peso, | | | | | | | | | | | | | | | | | | | | | | |
Expiring 12/14/18 | | JPMorgan Chase | | PHP | 5,080 | | | | 94,000 | | | | 94,664 | | | | — | | | | (664 | ) |
Expiring 12/14/18 | | JPMorgan Chase | | PHP | 4,869 | | | | 89,000 | | | | 90,720 | | | | — | | | | (1,720 | ) |
Expiring 12/14/18 | | JPMorgan Chase | | PHP | 3,561 | | | | 66,000 | | | | 66,350 | | | | — | | | | (350 | ) |
Expiring 12/14/18 | | Morgan Stanley | | PHP | 13,004 | | | | 238,235 | | | | 242,316 | | | | — | | | | (4,081 | ) |
Expiring 12/14/18 | | UBS AG | | PHP | 3,330 | | | | 62,000 | | | | 62,051 | | | | — | | | | (51 | ) |
Polish Zloty, | | | | | | | | | | | | | | | | | | | | | | |
Expiring 01/25/19 | | Goldman Sachs
International | | PLN | 1,245 | | | | 333,487 | | | | 325,239 | | | | 8,248 | | | | — | |
Russian Ruble, | | | | | | | | | | | | | | | | | | | | | | |
Expiring 12/19/18 | | JPMorgan Chase | | RUB | 7,422 | | | | 110,484 | | | | 111,967 | | | | — | | | | (1,483 | ) |
See Notes to Financial Statements.
| | | | |
| PGIM Emerging Markets Debt Hard Currency Fund | | | 31 | |
Schedule of Investments (continued)
as of October 31, 2018
Forward foreign currency exchange contracts outstanding at October 31, 2018 (continued):
| | | | | | | | | | | | | | | | | | | | | | |
Sale Contracts | | Counterparty | | Notional
Amount
(000) | | | Value at
Settlement
Date | | | Current
Value | | | Unrealized
Appreciation | | | Unrealized
Depreciation | |
OTC Forward Foreign Currency Exchange Contracts (cont’d.): | | | | | | | | | |
Russian Ruble (cont’d.), | | | | | | | | | | | | | | | | | | | | | | |
Expiring 12/19/18 | | JPMorgan Chase | | RUB | 2,481 | | | $ | 36,760 | | | $ | 37,430 | | | $ | — | | | $ | (670 | ) |
Singapore Dollar, | | | | | | | | | | | | | | | | | | | | | | |
Expiring 11/09/18 | | Citibank NA | | SGD | 149 | | | | 108,737 | | | | 107,303 | | | | 1,434 | | | | — | |
Expiring 11/09/18 | | Citibank NA | | SGD | 71 | | | | 51,733 | | | | 50,982 | | | | 751 | | | | — | |
Expiring 11/09/18 | | Goldman Sachs
International | | SGD | 91 | | | | 66,000 | | | | 65,492 | | | | 508 | | | | — | |
Expiring 11/09/18 | | UBS AG | | SGD | 155 | | | | 112,000 | | | | 111,785 | | | | 215 | | | | — | |
South African Rand, | | | | | | | | | | | | | | | | | | | | | | |
Expiring 11/09/18 | | Citibank NA | | ZAR | 758 | | | | 52,694 | | | | 51,319 | | | | 1,375 | | | | — | |
Expiring 12/07/18 | | Barclays Bank PLC | | ZAR | 1,451 | | | | 94,900 | | | | 97,913 | | | | — | | | | (3,013 | ) |
Expiring 12/07/18 | | Barclays Bank PLC | | ZAR | 1,451 | | | | 94,900 | | | | 97,913 | | | | — | | | | (3,013 | ) |
Expiring 12/07/18 | | Citibank NA | | ZAR | 616 | | | | 43,173 | | | | 41,579 | | | | 1,594 | | | | — | |
Expiring 12/07/18 | | Citibank NA | | ZAR | 468 | | | | 32,546 | | | | 31,605 | | | | 941 | | | | — | |
Expiring 12/07/18 | | Citibank NA | | ZAR | 298 | | | | 20,512 | | | | 20,088 | | | | 424 | | | | — | |
Expiring 12/07/18 | | Citibank NA | | ZAR | 243 | | | | 16,769 | | | | 16,426 | | | | 343 | | | | — | |
Expiring 12/07/18 | | Citibank NA | | ZAR | 205 | | | | 14,078 | | | | 13,813 | | | | 265 | | | | — | |
Expiring 12/07/18 | | Goldman Sachs
International | | ZAR | 521 | | | | 33,647 | | | | 35,121 | | | | — | | | | (1,474 | ) |
Expiring 12/07/18 | | JPMorgan Chase | | ZAR | 508 | | | | 33,797 | | | | 34,267 | | | | — | | | | (470 | ) |
Expiring 12/07/18 | | Toronto Dominion | | ZAR | 1,150 | | | | 75,000 | | | | 77,617 | | | | — | | | | (2,617 | ) |
South Korean Won, | | | | | | | | | | | | | | | | | | | | | | |
Expiring 01/16/19 | | Barclays Bank PLC | | KRW | 128,976 | | | | 113,534 | | | | 113,496 | | | | 38 | | | | — | |
Expiring 01/16/19 | | Barclays Bank PLC | | KRW | 48,565 | | | | 43,269 | | | | 42,735 | | | | 534 | | | | — | |
| | Goldman Sachs | | | | | | | | | | | | | | | | | | | | |
Expiring 01/16/19 | | International | | KRW | 98,232 | | | | 87,000 | | | | 86,442 | | | | 558 | | | | — | |
Expiring 01/16/19 | | JPMorgan Chase | | KRW | 88,713 | | | | 78,000 | | | | 78,067 | | | | — | | | | (67 | ) |
Swiss Franc, | | | | | | | | | | | | | | | | | | | | | | |
Expiring 01/25/19 | | BNP Paribas | | CHF | 59 | | | | 59,685 | | | | 59,119 | | | | 566 | | | | — | |
Expiring 01/25/19 | | Toronto Dominion | | CHF | 59 | | | | 59,741 | | | | 59,117 | | | | 624 | | | | — | |
Thai Baht, | | | | | | | | | | | | | | | | | | | | | | |
Expiring 11/09/18 | | Citibank NA | | THB | 2,187 | | | | 66,000 | | | | 65,984 | | | | 16 | | | | — | |
Expiring 11/09/18 | | UBS AG | | THB | 1,287 | | | | 38,664 | | | | 38,830 | | | | — | | | | (166 | ) |
Turkish Lira, | | | | | | | | | | | | | | | | | | | | | | |
Expiring 12/07/18 | | JPMorgan Chase | | TRY | 223 | | | | 38,400 | | | | 39,049 | | | | — | | | | (649 | ) |
Expiring 12/07/18 | | JPMorgan Chase | | TRY | 54 | | | | 9,200 | | | | 9,360 | | | | — | | | | (160 | ) |
| | | | | | | | | | | | | | | | | | | | | | |
| | | | | | | | $ | 6,857,242 | | | $ | 6,805,294 | | | | 78,302 | | | | (26,354 | ) |
| | | | | | | | | | | | | | | | | | | | | | |
| | | | | | | | | | | | | | | | $ | 106,307 | | | $ | (61,646 | ) |
| | | | | | | | | | | | | | | | | | | | | | |
See Notes to Financial Statements.
Cross currency exchange contracts outstanding at October 31, 2018:
| | | | | | | | | | | | | | | | | | | | | | |
Settlement | | Type | | Notional
Amount
(000) | | | In Exchange
For (000) | | | Unrealized
Appreciation | | | Unrealized
Depreciation | | | Counterparty | |
OTC Cross Currency Exchange Contract: | | | | | | | | | |
01/25/19 | | Buy | | CHF | 58 | | | EUR | 51 | | | $ | — | | | $ | (25 | ) | | | Toronto Dominion | |
| | | | | | | | | | | | | | | | | | | | | | |
Fair Value Measurements:
Various inputs are used in determining the value of the Series’ investments. These inputs are summarized in the three broad levels listed below.
Level 1—unadjusted quoted prices generally in active markets for identical securities.
Level 2—quoted prices for similar securities, interest rates and yield curves, prepayment speeds, foreign currency exchange rates and other observable inputs.
Level 3—unobservable inputs for securities valued in accordance with Board approved fair valuation procedures.
The following is a summary of the inputs used as of October 31, 2018 in valuing such portfolio securities:
| | | | | | | | | | | | |
| | | Level 1 | | | Level 2 | | | Level 3 | |
Investments in Securities | | | | | | | | | | | | |
Corporate Bonds | | | | | | | | | | | | |
Argentina | | $ | — | | | $ | 146,824 | | | $ | — | |
Brazil | | | — | | | | 529,845 | | | | — | |
Chile | | | — | | | | 194,748 | | | | — | |
China | | | — | | | | 389,667 | | | | — | |
India | | | — | | | | 175,435 | | | | — | |
Indonesia | | | — | | | | 424,207 | | | | — | |
Kazakhstan | | | — | | | | 199,557 | | | | — | |
Malaysia | | | — | | | | 500,747 | | | | — | |
Mexico | | | — | | | | 1,296,668 | | | | — | |
Russia | | | — | | | | 342,371 | | | | — | |
South Africa | | | — | | | | 425,250 | | | | — | |
Trinidad & Tobago | | | — | | | | 106,189 | | | | — | |
Tunisia | | | — | | | | 147,470 | | | | — | |
Venezuela | | | — | | | | 246,480 | | | | — | |
Sovereign Bonds | | | | | | | | | | | | |
Angola | | | — | | | | 421,236 | | | | — | |
Argentina | | | — | | | | 1,223,974 | | | | — | |
Azerbaijan | | | — | | | | 270,875 | | | | — | |
Bahrain | | | — | | | | 390,771 | | | | — | |
Belarus | | | — | | | | 206,052 | | | | — | |
Brazil | | | — | | | | 957,791 | | | | — | |
Colombia | | | — | | | | 477,999 | | | | — | |
Congo (Republic) | | | — | | | | 49,671 | | | | — | |
Costa Rica | | | — | | | | 332,236 | | | | — | |
Dominican Republic | | | — | | | | 778,328 | | | | — | |
See Notes to Financial Statements.
| | | | |
| PGIM Emerging Markets Debt Hard Currency Fund | | | 33 | |
Schedule of Investments (continued)
as of October 31, 2018
| | | | | | | | | | | | |
| | | Level 1 | | | Level 2 | | | Level 3 | |
Investments in Securities (continued) | | | | | | | | | | | | |
Sovereign Bonds (continued) | | | | | | | | | | | | |
Ecuador | | $ | — | | | $ | 865,700 | | | $ | — | |
Egypt | | | — | | | | 727,612 | | | | — | |
El Salvador | | | — | | | | 497,654 | | | | — | |
Gabon | | | — | | | | 181,708 | | | | — | |
Ghana | | | — | | | | 239,756 | | | | — | |
Greece | | | — | | | | 187,086 | | | | — | |
Honduras | | | — | | | | 210,924 | | | | — | |
Hungary | | | — | | | | 241,635 | | | | — | |
Indonesia | | | — | | | | 807,504 | | | | — | |
Iraq | | | — | | | | 423,689 | | | | — | |
Ivory Coast | | | — | | | | 286,252 | | | | — | |
Jamaica | | | — | | | | 257,063 | | | | — | |
Jordan | | | — | | | | 181,032 | | | | — | |
Kazakhstan | | | — | | | | 238,130 | | | | — | |
Kenya | | | — | | | | 383,202 | | | | — | |
Lebanon | | | — | | | | 596,612 | | | | — | |
Malaysia | | | — | | | | 61,522 | | | | — | |
Mexico | | | — | | | | 181,695 | | | | — | |
Nigeria | | | — | | | | 491,822 | | | | — | |
Oman | | | — | | | | 383,313 | | | | — | |
Pakistan | | | — | | | | 506,696 | | | | — | |
Panama | | | — | | | | 408,875 | | | | — | |
Papua New Guinea | | | — | | | | 198,250 | | | | — | |
Peru | | | — | | | | 470,262 | | | | — | |
Philippines | | | — | | | | 262,141 | | | | — | |
Qatar | | | — | | | | 203,000 | | | | — | |
Romania | | | — | | | | 191,079 | | | | — | |
Russia | | | — | | | | 574,599 | | | | — | |
Saudi Arabia | | | — | | | | 191,806 | | | | — | |
Senegal | | | — | | | | 168,449 | | | | — | |
South Africa | | | — | | | | 598,623 | | | | — | |
Sri Lanka | | | — | | | | 720,992 | | | | — | |
Turkey | | | — | | | | 1,211,697 | | | | — | |
Ukraine | | | — | | | | 1,016,870 | | | | — | |
Uruguay | | | — | | | | 294,945 | | | | — | |
Venezuela | | | — | | | | 45,900 | | | | — | |
Zambia | | | — | | | | 136,138 | | | | — | |
Affiliated Mutual Fund | | | 267,048 | | | | — | | | | — | |
Other Financial Instruments* | | | | | | | | | | | | |
OTC Forward Foreign Currency Exchange Contracts | | | — | | | | 44,661 | | | | — | |
OTC Cross Currency Exchange Contract | | | — | | | | (25 | ) | | | — | |
| | | | | | | | | | | | |
Total | | $ | 267,048 | | | $ | 24,923,260 | | | $ | — | |
| | | | | | | | | | | | |
See Notes to Financial Statements.
| * | Other financial instruments are derivative instruments not reflected in the Schedule of Investments, such as futures, forwards and centrally cleared swap contracts, which are recorded at the unrealized appreciation (depreciation) on the instrument, and OTC swap contracts which are recorded at fair value. |
Industry Classification:
The industry classification of investments and other assets in excess of liabilities shown as a percentage of net assets as of October 31, 2018 were as follows (unaudited):
| | | | |
Sovereign Bonds | | | 77.2 | % |
Oil & Gas | | | 11.9 | |
Banks | | | 2.0 | |
Electric | | | 1.7 | |
Chemicals | | | 1.6 | |
Affiliated Mutual Fund | | | 1.1 | |
Auto Parts & Equipment | | | 0.8 | |
Transportation | | | 0.7 | |
| | | | |
Mining | | | 0.7 | % |
Holding Companies-Diversified | | | 0.6 | |
| | | | |
| | | 98.3 | |
Other assets in excess of liabilities | | | 1.7 | |
| | | | |
| | | 100.0 | % |
| | | | |
Effects of Derivative Instruments on the Financial Statements and Primary Underlying Risk Exposure:
The Series invested in derivative instruments during the reporting period. The primary of risk associated with these derivative instruments is foreign exchange contracts risk. The effect of such derivative instruments on the Series’ financial position and financial performance as reflected in the Statement of Assets and Liabilities and Statement of Operations is presented in the summary below.
Fair values of derivative instruments as of October 31, 2018 as presented in the Statement of Assets and Liabilities:
| | | | | | | | | | | | |
Derivatives not accounted for as hedging instruments, carried at fair value | | Asset Derivatives | | | Liability Derivatives | |
| | Statement of
Assets and
Liabilities Location | | Fair
Value | | | Statement of
Assets and
Liabilities Location | | Fair
Value | |
| Foreign exchange contracts | | — | | $ | — | | | Unrealized depreciation on OTC cross currency exchange contracts | | $ | 25 | |
| Foreign exchange contracts | | Unrealized appreciation on OTC forward foreign currency exchange contracts | | | 106,307 | | | Unrealized depreciation on OTC forward foreign currency exchange contracts | | | 61,646 | |
| | | | | | | | | | | | |
| | | | $ | 106,307 | | | | | $ | 61,671 | |
| | | | | | | | | | | | |
See Notes to Financial Statements.
| | | | |
| PGIM Emerging Markets Debt Hard Currency Fund | | | 35 | |
Schedule of Investments (continued)
as of October 31, 2018
The effects of derivative instruments on the Statement of Operations for the period ended October 31, 2018 are as follows:
| | | | |
Amount of Realized Gain (Loss) on Derivatives Recognized in Income | |
Derivatives not accounted for as hedging instruments, carried at fair value | | Forward
& Cross
Currency
Exchange
Contracts | |
Foreign exchange contracts | | $ | (133,508 | ) |
| | | | |
| | | | |
Change in Unrealized Appreciation (Depreciation) on Derivatives Recognized in Income | |
Derivatives not accounted for as hedging instruments, carried at fair value | | Forward
& Cross
Currency
Exchange
Contracts | |
Foreign exchange contracts | | $ | 44,636 | |
| | | | |
For the period ended October 31, 2018, the Series’ average volume of derivative activities is as follows:
| | | | | | | | | | |
| | | | Forward
Foreign
Currency
Exchange
Contracts—
Purchased(1) | | | | |
| | | | $ | 5,221,230 | | | | | |
Forward Foreign
Currency Exchange
Contracts—Sold(1) | | | | | | Cross Currency
Exchange
Contracts(2) | |
| $ | 5,410,112 | | | | | | | $ | 82,814 | |
| (1) | Value at Settlement Date. |
Financial Instruments/Transactions—Summary of Offsetting and Netting Arrangements:
The Series invested in OTC derivatives during the reporting period that are either offset in accordance with current requirements or are subject to enforceable master netting arrangements or similar agreements that permit offsetting. The information about offsetting and related netting arrangements for OTC derivatives where the legal right to set-off exists, is presented in the summary below.
Offsetting of OTC derivative assets and liabilities:
See Notes to Financial Statements.
| | | | | | | | | | | | | | | | | | | | |
Counterparty | | Gross
Amounts of
Recognized
Assets(1) | | | Gross
Amounts of
Recognized
Liabilities(1) | | | Net Amounts of
Recognized
Assets/(Liabilities) | | | Collateral
Pledged/
(Received)(2) | | | Net
Amount | |
Bank of America | | $ | — | | | $ | (1,301 | ) | | $ | (1,301 | ) | | $ | — | | | $ | (1,301 | ) |
Barclays Bank PLC | | | 14,443 | | | | (8,810 | ) | | | 5,633 | | | | — | | | | 5,633 | |
BNP Paribas | | | 10,894 | | | | (4,807 | ) | | | 6,087 | | | | — | | | | 6,087 | |
Citibank NA | | | 14,736 | | | | (9,979 | ) | | | 4,757 | | | | — | | | | 4,757 | |
Deutsche Bank AG | | | 3,975 | | | | (3,486 | ) | | | 489 | | | | — | | | | 489 | |
Goldman Sachs International | | | 10,624 | | | | (6,637 | ) | | | 3,987 | | | | — | | | | 3,987 | |
JPMorgan Chase | | | 21,297 | | | | (14,941 | ) | | | 6,356 | | | | — | | | | 6,356 | |
Morgan Stanley | | | 12,013 | | | | (4,173 | ) | | | 7,840 | | | | — | | | | 7,840 | |
Toronto Dominion | | | 6,880 | | | | (2,642 | ) | | | 4,238 | | | | — | | | | 4,238 | |
UBS AG | | | 11,445 | | | | (4,895 | ) | | | 6,550 | | | | — | | | | 6,550 | |
| | | | | | | | | | | | | | | | | | | | |
| | $ | 106,307 | | | $ | (61,671 | ) | | $ | 44,636 | | | $ | — | | | $ | 44,636 | |
| | | | | | | | | | | | | | | | | | | | |
| (1) | Includes unrealized appreciation/(depreciation) on swaps and forwards, premiums paid/(received) on swap agreements and market value of purchased and written options, as represented on the Statement of Assets and Liabilities. |
| (2) | Collateral amount disclosed by the Fund is limited to the Fund’s OTC derivative exposure by counterparty. |
See Notes to Financial Statements.
| | | | |
| PGIM Emerging Markets Debt Hard Currency Fund | | | 37 | |
Statement of Assets & Liabilities
as of October 31, 2018
| | | | |
Assets | | | | |
Investments at value: | | | | |
Unaffiliated investments (cost $27,409,551) | | $ | 24,878,624 | |
Affiliated investments (cost $267,048) | | | 267,048 | |
Foreign currency, at value (cost $106,009) | | | 104,133 | |
Dividends and interest receivable | | | 364,160 | |
Unrealized appreciation on OTC forward foreign currency exchange contracts | | | 106,307 | |
Due from Manager | | | 64,816 | |
Receivable for Series shares sold | | | 30,648 | |
Prepaid expenses | | | 843 | |
| | | | |
Total Assets | | | 25,816,579 | |
| | | | |
| |
Liabilities | | | | |
Payable for investments purchased | | | 119,465 | |
Unrealized depreciation on OTC forward foreign currency exchange contracts | | | 61,646 | |
Custodian and accounting fees payable | | | 25,139 | |
Accrued expenses and other liabilities | | | 11,476 | |
Payable for Series shares reacquired | | | 10,562 | |
Affiliated transfer agent fee payable | | | 1,738 | |
Dividends payable | | | 135 | |
Unrealized depreciation on OTC cross currency exchange contracts | | | 25 | |
Distribution fee payable | | | 10 | |
| | | | |
Total Liabilities | | | 230,196 | |
| | | | |
| |
Net Assets | | $ | 25,586,383 | |
| | | | |
| | | | | |
Net assets were comprised of: | | | | |
Common stock, at par | | $ | 28,809 | |
Paid-in capital in excess of par | | | 28,492,002 | |
Total distributable earnings (loss) | | | (2,934,428 | ) |
| | | | |
Net assets, October 31, 2018 | | $ | 25,586,383 | |
| | | | |
See Notes to Financial Statements.
| | | | |
Class A | | | | |
Net asset value, offering price and redemption price per share,
($9,304 ÷ 1,048 shares of beneficial interest issued and outstanding) | | $ | 8.88 | |
Maximum sales charge (4.50% of offering price) | | | 0.42 | |
| | | | |
Maximum offering price to public | | $ | 9.30 | |
| | | | |
| |
Class C | | | | |
Net asset value, offering price and redemption price per share,
($9,242 ÷ 1,041 shares of beneficial interest issued and outstanding) | | $ | 8.88 | |
| | | | |
| |
Class Z | | | | |
Net asset value, offering price and redemption price per share,
($2,234,397 ÷ 251,489 shares of beneficial interest issued and outstanding) | | $ | 8.88 | |
| | | | |
| |
Class R6 | | | | |
Net asset value, offering price and redemption price per share,
($23,333,440 ÷ 2,627,304 shares of beneficial interest issued and outstanding) | | $ | 8.88 | |
| | | | |
See Notes to Financial Statements.
| | | | |
| PGIM Emerging Markets Debt Hard Currency Fund | | | 39 | |
Statement of Operations
Period Ended October 31, 2018*
| | | | |
Net Investment Income (Loss) | | | | |
Income | | | | |
Interest income | | $ | 1,214,598 | |
Affiliated dividend income | | | 9,105 | |
| | | | |
Total income | | | 1,223,703 | |
| | | | |
| |
Expenses | | | | |
Management fee | | | 158,494 | |
Distribution fee(a) | | | 106 | |
Registration fees(a) | | | 122,332 | |
Custodian and accounting fees | | | 77,757 | |
Shareholders’ reports | | | 35,297 | |
Audit fee | | | 35,000 | |
Legal fees and expenses | | | 30,389 | |
Directors’ fees | | | 10,343 | |
Transfer agent’s fees and expenses (including affiliated expense of $3,011)(a) | | | 3,314 | |
Miscellaneous | | | 8,450 | |
| | | | |
Total expenses | | | 481,482 | |
Less: Fee waiver and/or expense reimbursement(a) | | | (318,062 | ) |
| | | | |
Net expenses | | | 163,420 | |
| | | | |
Net investment income (loss) | | | 1,060,283 | |
| | | | |
| |
Realized And Unrealized Gain (Loss) On Investment And Foreign Currency Transactions | | | | |
Net realized gain (loss) on: | | | | |
Investment transactions | | | (170,996 | ) |
Forward and cross currency contract transactions | | | (133,508 | ) |
Foreign currency transactions | | | 11,870 | |
| | | | |
| | | (292,634 | ) |
| | | | |
Net change in unrealized appreciation (depreciation) on: | | | | |
Investments | | | (2,530,927 | ) |
Forward and cross currency contracts | | | 44,636 | |
Foreign currencies | | | (11,950 | ) |
| | | | |
| | | (2,498,241 | ) |
| | | | |
Net gain (loss) on investment and foreign currency transactions | | | (2,790,875 | ) |
| | | | |
Net Increase (Decrease) In Net Assets Resulting From Operations | | $ | (1,730,592 | ) |
| | | | |
| * | Commencement of operations was December 12, 2017. |
| (a) | Class specific expenses and waivers were as follows: |
| | | | | | | | | | | | | | | | |
| | | Class A | | | Class C | | | Class Z | | | Class R6 | |
Distribution fee | | | 21 | | | | 85 | | | | — | | | | — | |
Registration fees | | | 30,383 | | | | 30,383 | | | | 30,783 | | | | 30,783 | |
Transfer agent’s fees and expenses | | | 44 | | | | 44 | | | | 3,158 | | | | 68 | |
Fee waiver and/or expense reimbursement | | | (30,495 | ) | | | (30,495 | ) | | | (39,785 | ) | | | (217,287 | ) |
See Notes to Financial Statements.
Statement of Changes in Net Assets
| | | | |
| | | December 12, 2017**
through
October 31, 2018 | |
Increase (Decrease) in Net Assets | | | | |
Operations | | | | |
Net investment income (loss) | | $ | 1,060,283 | |
Net realized gain (loss) on investment and foreign currency transactions | | | (292,634 | ) |
Net change in unrealized appreciation (depreciation) on investments and foreign currencies | | | (2,498,241 | ) |
| | | | |
Net increase (decrease) in net assets resulting from operations | | | (1,730,592 | ) |
| | | | |
| |
Dividends and Distributions | | | | |
Distributions from distributable earnings* | | | | |
Class A | | | (440 | ) |
Class C | | | (377 | ) |
Class Z | | | (37,450 | ) |
Class R6 | | | (1,168,133 | ) |
| | | | |
| | | (1,206,400 | ) |
| | | | |
Tax return of capital distributions | | | | |
Class A | | | (6 | ) |
Class C | | | (5 | ) |
Class Z | | | (497 | ) |
Class R6 | | | (15,516 | ) |
| | | | |
| | | (16,024 | ) |
| | | | |
| |
Series share transactions | | | | |
Net proceeds from shares sold | | | 27,488,719 | |
Net asset value of shares issued in reinvestment of dividends and distributions | | | 1,220,322 | |
Cost of shares reacquired | | | (169,642 | ) |
| | | | |
Net increase (decrease) in net assets from Series share transactions | | | 28,539,399 | |
| | | | |
Total increase (decrease) | | | 25,586,383 | |
| |
Net Assets: | | | | |
Beginning of period | | | — | |
| | | | |
End of period | | $ | 25,586,383 | |
| | | | |
| * | For the period ended October 31, 2018, the Series has adopted amendments to Regulation S-X (refer to Note 9). |
| ** | Commencement of operations. |
See Notes to Financial Statements.
| | | | |
| PGIM Emerging Markets Debt Hard Currency Fund | | | 41 | |
Notes to Financial Statements
Prudential World Fund, Inc. (the “Fund”) is registered under the Investment Company Act of 1940, as amended (“1940 Act”), as an open-end management investment company. The Fund was established as a Maryland business trust on September 28, 1994. The Fund currently consists of seven series: PGIM Jennison Emerging Markets Equity Opportunities Fund (formerly known as Prudential Jennison Emerging Markets Equity Fund), PGIM Jennison Global Opportunities Fund, PGIM Jennison International Opportunities Fund and PGIM QMA International Equity Fund, each of which are diversified funds and PGIM Jennison Global Infrastructure Fund, PGIM Emerging Markets Debt Hard Currency Fund and PGIM Emerging Markets Debt Local Currency Fund, each of which are non-diversified funds for purposes of the 1940 Act. These financial statements relate only to the PGIM Emerging Markets Debt Hard Currency Fund (the “Series”). The Series commenced operations on December 12, 2017. Effective June 11, 2018, the names of the Series and the other series which comprise the Fund were changed by replacing “Prudential” with “PGIM” and each series’ Class Q shares were renamed Class R6 shares.
The investment objective of the Series is total return, through a combination of current income and capital appreciation.
1. Accounting Policies
The Series follows the investment company accounting and reporting guidance of the Financial Accounting Standards Board (“FASB”) Accounting Standard Codification (“ASC”) Topic 946 Financial Services — Investment Companies. The following accounting policies conform to U.S. generally accepted accounting principles. The Series consistently follows such policies in the preparation of its financial statements.
Securities Valuation: The Series holds securities and other assets and liabilities that are fair valued at the close of each day (generally, 4:00 PM Eastern time) the New York Stock Exchange (“NYSE”) is open for trading. Fair value is the price that would be received to sell an asset or paid to transfer a liability in an orderly transaction between market participants on the measurement date. The Board of Directors (the “Board”) has adopted valuation procedures for security valuation under which fair valuation responsibilities have been delegated to PGIM Investments LLC (“PGIM Investments” or the “Manager”). Pursuant to the Board’s delegation, a Valuation Committee has been established as two persons, being one or more officers of the Fund, including: the Fund’s Treasurer (or the Treasurer’s direct reports); and the Fund’s Chief or Deputy Chief Compliance Officer (or Vice-President-level direct reports of the Chief or Deputy Chief Compliance Officer). Under the current valuation procedures, the Valuation Committee of the Board is responsible for supervising the valuation of portfolio securities and other assets and liabilities. The valuation procedures permit the Series to utilize independent pricing vendor services, quotations from market makers, and alternative valuation methods when market quotations are either not readily
available or not deemed representative of fair value. A record of the Valuation Committee’s actions is subject to the Board’s review, approval, and ratification at its next regularly scheduled quarterly meeting.
For the fiscal reporting period-end, securities and other assets and liabilities were fair valued at the close of the last U.S. business day. Trading in certain foreign securities may occur when the NYSE is closed (including weekends and holidays). Because such foreign securities trade in markets that are open on weekends and U.S. holidays, the values of some of the Series’ foreign investments may change on days when investors cannot purchase or redeem Series shares.
Various inputs determine how the Series’ investments are valued, all of which are categorized according to the three broad levels (Level 1, 2, or 3) detailed in the Schedule of Investments and referred to herein as the “fair value hierarchy” in accordance with FASB ASC Topic 820—Fair Value Measurements and Disclosures.
Investments in open-end, non-exchange-traded mutual funds are valued at their net asset values as of the close of the NYSE on the date of valuation. These securities are classified as Level 1 in the fair value hierarchy since they may be purchased or sold at their net asset values on the date of valuation.
Fixed income securities traded in the OTC market are generally classified as Level 2 in the fair value hierarchy. Such fixed income securities are typically valued using the market approach which generally involves obtaining data from an approved independent third-party vendor source. The Series utilizes the market approach as the primary method to value securities when market prices of identical or comparable instruments are available. The third-party vendors’ valuation techniques used to derive the evaluated bid price are based on evaluating observable inputs, including but not limited to, yield curves, yield spreads, credit ratings, deal terms, tranche level attributes, default rates, cash flows, prepayment speeds, broker/dealer quotations and reported trades. Certain Level 3 securities are also valued using the market approach when obtaining a single broker quote or when utilizing transaction prices for identical securities that have been used in excess of five business days. During the reporting period, there were no changes to report with respect to the valuation approach and/or valuation techniques discussed above.
OTC derivative instruments are generally classified as Level 2 in the fair value hierarchy. Such derivative instruments are typically valued using the market approach and/or income approach which generally involves obtaining data from an approved independent third-party vendor source. The Series utilizes the market approach when quoted prices in broker-dealer markets are available but also includes consideration of alternative valuation approaches, including the income approach. In the absence of reliable market quotations, the income approach is typically utilized for purposes of valuing OTC derivatives such as interest rate swaps based on a discounted cash flow analysis whereby the value of the instrument is equal to the present value of its future cash inflows or outflows. Such analysis includes projecting future cash flows and determining the discount rate (including the present value
| | | | |
| PGIM Emerging Markets Debt Hard Currency Fund | | | 43 | |
Notes to Financial Statements (continued)
factors that affect the discount rate) used to discount the future cash flows. In addition, the third-party vendors’ valuation techniques used to derive the evaluated OTC derivative price is based on evaluating observable inputs, including but not limited to, underlying asset prices, indices, spreads, interest rates and exchange rates. Certain OTC derivatives may be classified as Level 3 when valued using the market approach by obtaining a single broker quote or when utilizing unobservable inputs in the income approach. During the reporting period, there were no changes to report with respect to the valuation approach and/or valuation techniques discussed above.
Securities and other assets that cannot be priced according to the methods described above are valued based on pricing methodologies approved by the Board. In the event that unobservable inputs are used when determining such valuations, the securities will be classified as Level 3 in the fair value hierarchy.
When determining the fair value of securities, some of the factors influencing the valuation include: the nature of any restrictions on disposition of the securities; assessment of the general liquidity of the securities; the issuer’s financial condition and the markets in which it does business; the cost of the investment; the size of the holding and the capitalization of the issuer; the prices of any recent transactions or bids/offers for such securities or any comparable securities; any available analyst media or other reports or information deemed reliable by the Manager regarding the issuer or the markets or industry in which it operates. Using fair value to price securities may result in a value that is different from a security’s most recent closing price and from the price used by other unaffiliated mutual funds to calculate their net asset values.
Restricted and Illiquid Securities: Subject to guidelines adopted by the Board, the Series may invest up to 15% of its net assets in illiquid securities, including those which are restricted as to disposition under securities law (“restricted securities”). Restricted securities are valued pursuant to the valuation procedures noted above. Illiquid securities are those that, because of the absence of a readily available market or due to legal or contractual restrictions on resale, cannot be sold within seven days in the ordinary course of business at approximately the amount at which the Series has valued the investment. Therefore, the Series may find it difficult to sell illiquid securities at the time considered most advantageous by its subadviser and may incur transaction costs that would not be incurred in the sale of securities that were freely marketable. Certain securities that would otherwise be considered illiquid because of legal restrictions on resale to the general public may be traded among qualified institutional buyers under Rule 144A of the Securities Act of 1933. These Rule 144A securities, as well as commercial paper that is sold in private placements under Section 4(2) of the Securities Act, may be deemed liquid by the Series’ subadviser under the
guidelines adopted by the Board of the Fund. However, the liquidity of the Series’ investments in Rule 144A securities could be impaired if trading does not develop or declines.
Foreign Currency Translation: The books and records of the Series are maintained in U.S. dollars. Foreign currency amounts are translated into U.S. dollars on the following basis:
(i) market value of investment securities, other assets and liabilities—at the current rates of exchange;
(ii) purchases and sales of investment securities, income and expenses—at the rates of exchange prevailing on the respective dates of such transactions.
Although the net assets of the Series are presented at the foreign exchange rates and market values at the close of the period, the Series does not generally isolate that portion of the results of operations arising as a result of changes in the foreign exchange rates from the fluctuations arising from changes in the market prices of long-term portfolio securities held at the end of the period. Similarly, the Series does not isolate the effect of changes in foreign exchange rates from the fluctuations arising from changes in the market prices of long-term portfolio securities sold during the period. Accordingly, holding period realized foreign currency gains (losses) are included in the reported net realized gains (losses) on investment transactions. Notwithstanding the above, the Series does isolate the effect of fluctuations in foreign currency exchange rates when determining the gain (loss) upon the sale or maturity of foreign currency denominated debt obligations; such amounts are included in net realized gains (losses) on foreign currency transactions.
Additionally, net realized gains (losses) on foreign currency transactions represent net foreign exchange gains (losses) from the disposition of holdings of foreign currencies, currency gains (losses) realized between the trade and settlement dates on securities transactions, and the difference between the amounts of interest, dividends and foreign withholding taxes recorded on the Series’ books and the U.S. dollar equivalent amounts actually received or paid. Net unrealized currency gains (losses) arise from valuing foreign currency denominated assets and liabilities (other than investments) at period end exchange rates.
Forward and Cross Currency Contracts: A forward currency contract is a commitment to purchase or sell a foreign currency at a future date at a negotiated forward rate. The Series enters into forward currency contracts in order to hedge its exposure to changes in foreign currency exchange rates on its foreign portfolio holdings or specific receivables and payables denominated in a foreign currency and to gain exposure to certain currencies. The contracts are valued daily at current forward exchange rates and any unrealized gain (loss) is included in net unrealized appreciation (depreciation) on investments and foreign currencies. Gain (loss) is realized on the settlement date of the contract equal to the difference between the settlement value of the original and negotiated forward contracts. This gain (loss), if any, is included in net realized gain (loss) on forward and cross currency
| | | | |
| PGIM Emerging Markets Debt Hard Currency Fund | | | 45 | |
Notes to Financial Statements (continued)
contract transactions. Risks may arise upon entering into these contracts from the potential inability of the counterparties to meet the terms of their contracts. Forward currency contracts involve risks from currency exchange rate and credit risk in excess of the amounts reflected on the Statement of Assets and Liabilities. The Series’ maximum risk of loss from counterparty credit risk is the net value of the cash flows to be received from the counterparty at the end of the contract’s life. A cross currency contract is a forward contract where a specified amount of one foreign currency will be exchanged for a specified amount of another foreign currency.
Master Netting Arrangements: The Fund, on behalf of the Series, is subject to various Master Agreements, or netting arrangements, with select counterparties. These are agreements which a subadviser may have negotiated and entered into on behalf of the Series. A master netting arrangement between the Series and the counterparty permits the Series to offset amounts payable by the Series to the same counterparty against amounts to be received; and by the receipt of collateral from the counterparty by the Series to cover the Series’ exposure to the counterparty. However, there is no assurance that such mitigating factors are easily enforceable. In addition to master netting arrangements, the right to set-off exists when all the conditions are met such that each of the parties owes the other determinable amounts, the reporting party has the right to set-off the amount owed with the amount owed by the other party, the reporting party intends to set-off and the right of set-off is enforceable by law. During the reporting period, there was no intention to settle on a net basis and all amounts are presented on a gross basis on the Statement of Assets and Liabilities.
Securities Transactions and Net Investment Income: Securities transactions are recorded on the trade date. Realized gains (losses) from investment and currency transactions are calculated on the specific identification method. Dividend income is recorded on the ex-date. Interest income, including amortization of premium and accretion of discount on debt securities, as required, is recorded on the accrual basis. Expenses are recorded on an accrual basis, which may require the use of certain estimates by management that may differ from actual. Net investment income or loss (other than class specific expenses and waivers, which are allocated as noted below) and unrealized and realized gains (losses) are allocated daily to each class of shares based upon the relative proportion of adjusted net assets of each class at the beginning of the day. Class specific expenses and waivers, where applicable, are charged to the respective share classes. Class specific expenses include distribution fees and distribution fee waivers, shareholder servicing fees, transfer agent’s fees and expenses, registration fees and fee waivers and/or expense reimbursements, as applicable.
Taxes: It is the Series’ policy to meet the requirements of the Internal Revenue Code applicable to regulated investment companies and to distribute all of its taxable net
investment income and capital gains, if any, to its shareholders. Therefore, no federal income tax provision is required. Withholding taxes on foreign dividends, interest and capital gains, if any, are recorded, net of reclaimable amounts, at the time the related income is earned.
Dividends and Distributions: The Series expects to declare dividends of its net investment income daily and pay such dividends monthly. Distributions of net realized capital and currency gains, if any, are declared and paid at least annually. Dividends and distributions to shareholders, which are determined in accordance with federal income tax regulations and which may differ from generally accepted accounting principles, are recorded on the ex-date. Permanent book/tax differences relating to income and gain (loss) are reclassified amongst total distributable earnings (loss) and paid-in capital in excess of par, as appropriate.
Estimates: The preparation of financial statements requires management to make estimates and assumptions that affect the reported amounts and disclosures in the financial statements. Actual results could differ from those estimates.
2. Agreements
The Fund, on behalf of the Series, has a management agreement with PGIM Investments. Pursuant to this agreement, PGIM Investments has responsibility for all investment advisory services and supervises the subadviser’s performance of such services. In addition, under the management agreement, PGIM Investments provides all of the administrative functions necessary for the organization, operation and management of the Series. PGIM Investments administers the corporate affairs of the Series and, in connection therewith, furnishes the Series with office facilities, together with those ordinary clerical and bookkeeping services which are not being furnished by the Series’ custodian and the Series’ transfer agent. PGIM Investments is also responsible for the staffing and management of dedicated groups of legal, marketing, compliance and related personnel necessary for the operation of the Series. The legal, marketing, compliance and related personnel are also responsible for the management and oversight of the various service providers to the Series, including, but not limited to, the custodian, transfer agent, and accounting agent.
PGIM Investments has entered into a subadvisory agreement with PGIM, Inc., which provides subadvisory services to the Series through its PGIM Fixed Income unit. The subadvisory agreement provides that PGIM, Inc. will furnish investment advisory services in connection with the management of the Series. In connection therewith, PGIM, Inc. is obligated to keep certain books and records of the Series. PGIM Investments pays for the services of PGIM, Inc., the cost of compensation of officers of the Series, occupancy and certain clerical and bookkeeping costs of the Series. The Series bears all other costs and expenses.
The management fee paid to PGIM Investments is accrued daily and payable monthly at an annual rate of 0.720% of the Series’ average daily net assets up to and including $1 billion;
| | | | |
| PGIM Emerging Markets Debt Hard Currency Fund | | | 47 | |
Notes to Financial Statements (continued)
0.70% from $1 billion to $3 billion of average daily net assets; 0.68% from $3 billion to $5 billion of average daily net assets; 0.67% on the from $5 billion to $10 billion of average daily net assets; and 0.660% of the average daily net assets exceeding $10 billion. The effective management fee rate before any waivers and/or expense reimbursements was 0.720% for the period ended October 31, 2018.
PGIM Investments has contractually agreed, through February 28, 2019, to limit total annual operating expenses after fee waivers and/or expense reimbursements to 1.05% of average daily net assets for Class A shares, 1.80% of average daily net assets for Class C shares, 0.80% of average daily net assets for Class Z shares, and 0.74% of average daily net assets for Class R6 shares. This contractual waiver excludes interest, brokerage, taxes (such as income and foreign withholding taxes, stamp duty and deferred tax expenses), acquired fund fees and expenses, extraordinary expenses, and certain other Series expenses such as dividend and interest expense and broker charges on short sales. Expenses waived/reimbursed by the Manager in accordance with this agreement may be recouped by the Manager within the same fiscal year during which such waiver/reimbursement is made if such recoupment can be realized without exceeding the expense limit in effect at the time of the recoupment for that fiscal year. Effective November 1, 2018 this waiver agreement was extended through February 29, 2020.
Where applicable, PGIM Investments voluntarily agreed through October 31, 2018, to waive management fees or shared operating expenses on any share class to the same extent that it waives similar expenses on any other share class and, in addition, total annual operating expenses for Class R6 shares will not exceed total annual operating expenses for Class Z shares. Effective November 1, 2018 this voluntary agreement became part of the Series’ contractual waiver agreement through February 29, 2020 and is subject to recoupment by the Manager within the same fiscal year during which such wavier/reimbursement is made if such recoupment can be realized without exceeding the expense limit in effect at the time of the recoupment for that fiscal year.
The Fund, on behalf of the Series, has a distribution agreement with Prudential Investment Management Services LLC (“PIMS”), which acts as the distributor of the Class A, Class C, Class Z and Class R6 shares of the Series. The Series compensates PIMS for distributing and servicing the Series’ Class A and Class C shares, pursuant to the plans of distribution (the “Distribution Plans”), regardless of expenses actually incurred by PIMS. The distribution fees are accrued daily and payable monthly. No distribution or service fees are paid to PIMS as distributor of the Class Z or Class R6 shares of the Series.
Pursuant to the Distribution Plans, the Series compensates PIMS for distribution related activities at an annual rate of up to 0.25% and 1% of the average daily net assets of the Class A and Class C shares, respectively.
PIMS has advised the Series that it has not received any front-end sales charges resulting from sales of Class A shares during the period ended October 31, 2018.
PIMS has advised the Series that for the period ended October 31, 2018, it has not received any contingent deferred sales charges imposed upon redemptions by certain Class A and Class C shareholders.
PGIM Investments, PGIM, Inc and PIMS are indirect, wholly-owned subsidiaries of Prudential Financial, Inc. (“Prudential”).
3. Other Transactions with Affiliates
Prudential Mutual Fund Services LLC (“PMFS”), an affiliate of PGIM Investments and an indirect, wholly-owned subsidiary of Prudential, serves as the Series’ transfer agent. Transfer agent’s fees and expenses in the Statement of Operations include certain out-of-pocket expenses paid to non-affiliates, where applicable.
The Series may enter into certain securities purchase or sale transactions under Board approved Rule 17a-7 procedures. Rule 17a-7 is an exemptive rule under the 1940 Act, that subject to certain conditions, permits purchase and sale transactions among affiliated investment companies, or between an investment company and a person that is affiliated solely by reason of having a common (or affiliated) investment adviser, common directors, and/or common officers. Such transactions are subject to ratification by the Board. For the reporting period ended October 31, 2018, no such transactions were entered into by the Series.
The Series may invest its overnight sweep cash in the PGIM Core Ultra Short Bond Fund (the “Core Fund”), a series of Prudential Investment Portfolios 2, registered under the 1940 Act and managed by PGIM Investments. Earnings from the Core Fund are disclosed on the Statement of Operations as “Affiliated dividend income”.
4. Portfolio Securities
The aggregate cost of purchases and proceeds from sales of portfolio securities (excluding short-term investments and U.S. Government securities) for the period ended October 31, 2018, were $31,805,753 and $4,079,444, respectively.
A summary of the cost of purchases and proceeds from sales of shares of an affiliated mutual fund for the period ended October 31, 2018, is presented as follows:
| | | | |
| PGIM Emerging Markets Debt Hard Currency Fund | | | 49 | |
Notes to Financial Statements (continued)
| | | | | | | | | | | | | | | | | | | | | | | | | | | | | | |
Value,
Beginning
of Period | | | Cost of
Purchases | | | Proceeds
from Sales | | | Change in
Unrealized
Gain
(Loss) | | | Realized
Gain
(Loss) | | | Value,
End of
Period | | | Shares,
End of
Period | | | Income | |
| | PGIM Core Ultra Short Bond Fund* | | | | | | | | | |
| $ | — | | | $ | 30,120,648 | | | $ | 29,853,600 | | | $ | — | | | $ | — | | | $ | 267,048 | | | | 267,048 | | | $ | 9,105 | |
| | | | | | | | | | | | | | | | | | | | | | | | | | | | | | |
| * | The Fund did not have any capital gain distributions during the reporting period. |
5. Distributions and Tax Information
Distributions to shareholders, which are determined in accordance with federal income tax regulations and which may differ from generally accepted accounting principles, are recorded on the ex-date. In order to present total distributable earnings (loss) and paid-in capital in excess of par on the Statement of Assets and Liabilities that more closely represent their tax character, certain adjustments have been made to total distributable earnings (loss) and paid-in capital in excess of par. For the year ended October 31, 2018, the adjustments were to decrease total distributable loss and decrease paid-in capital in excess of par by $2,564 due to non-deductible offering costs. Net investment income, net realized gain (loss) on investments and foreign currency transactions and net assets were not affected by this change.
For the period ended October 31, 2018, the tax character of dividends paid by the Series were $1,206,400 of ordinary income and $16,024 of tax return of capital.
As of October 31, 2018, the Series had no undistributed earnings on a tax basis.
The United States federal income tax basis of the Series’ investments and the net unrealized depreciation as of October 31, 2018 were as follows:
| | | | | | |
Tax Basis | | Gross
Unrealized
Appreciation | | Gross
Unrealized
Depreciation | | Net
Unrealized
Depreciation |
| $27,940,910 | | $79,479 | | $(2,830,081) | | $(2,750,602) |
The difference between book basis and tax basis was primarily due to deferred losses on wash sales, amortization of bond premium, foreign currency forwards and other book to tax differences.
For federal income tax purposes, the Series had a capital loss carryforward as of October 31, 2018 of approximately $184,000 which can be carried forward for an unlimited period. No capital gains distributions are expected to be paid to shareholders until net gains have been realized in excess of such losses.
Management has analyzed the Series’ tax positions and has concluded that no provision for income tax is required in the Series’ financial statements for the current reporting period. The Series’ federal excise tax returns for tax years for which the applicable statutes of limitations have not expired are subject to examination by the Internal Revenue Service and state departments of revenue.
6. Capital and Ownership
The Series offers Class A, Class C, Class Z and Class R6 shares. Class A shares are sold with a maximum front-end sales charge of 4.50%. Investors who purchase $1 million or more of Class A shares and sell these shares within 12 months of purchase are subject to a contingent deferred sales charge (“CDSC”) of 1%, although they are not subject to an initial sales charge. The Class A CDSC is waived for certain retirement and/or benefit plans. A special exchange privilege is also available for shareholders who qualified to purchase Class A shares at net asset value. Class C shares are sold with a CDSC of 1% on sales made within 12 months of purchase. Class Z and Class R6 shares are not subject to any sales or redemption charge and are available exclusively for sale to a limited group of investors.
Under certain circumstances, an exchange may be made from specified share classes of the Series to one or more other share classes of the Series as presented in the table of transactions in shares of common stock.
The Fund is authorized to issue 5.075 billion shares of common stock, with a par value of $0.01 per share, which is divided into seven series. There are 600 million shares authorized for the Series, divided into four classes, designated Class A, Class C, Class Z and Class R6 common stock, each of which consists of 100 million, 100 million, 200 million and 200 million authorized shares, respectively.
As of October 31, 2018, Prudential, through its affiliated entities, including affiliated funds (if applicable), owned 1,047 Class A shares, 1,041 Class C shares, 1,050 Class Z shares and 2,627,304 Class R6 shares of the Series. At reporting period end, Prudential owned 91% of the Series’ outstanding shares.
Transactions in shares of common stock were as follows:
| | | | | | | | |
Class A | | Shares | | | Amount | |
Period ended October 31, 2018*: | | | | | | | | |
Shares sold | | | 1,000 | | | $ | 10,000 | |
Shares issued in reinvestment of dividends and distributions | | | 48 | | | | 446 | |
| | | | | | | | |
Net increase (decrease) in shares outstanding | | | 1,048 | | | $ | 10,446 | |
| | | | | | | | |
Class C | | | | | | |
Period ended October 31, 2018*: | | | | | | | | |
Shares sold | | | 1,000 | | | $ | 10,000 | |
Shares issued in reinvestment of dividends and distributions | | | 41 | | | | 382 | |
| | | | | | | | |
Net increase (decrease) in shares outstanding | | | 1,041 | | | $ | 10,382 | |
| | | | | | | | |
| | | | |
| PGIM Emerging Markets Debt Hard Currency Fund | | | 51 | |
Notes to Financial Statements (continued)
| | | | | | | | |
Class Z | | Shares | | | Amount | |
Period ended October 31, 2018*: | | | | | | | | |
Shares sold | | | 266,290 | | | $ | 2,458,719 | |
Shares issued in reinvestment of dividends and distributions | | | 3,945 | | | | 35,845 | |
Shares reacquired | | | (18,746 | ) | | | (169,642 | ) |
| | | | | | | | |
Net increase (decrease) in shares outstanding | | | 251,489 | | | $ | 2,324,922 | |
| | | | | | | | |
Class R6 | | | | | | |
Period ended October 31, 2018*: | | | | | | | | |
Shares sold | | | 2,501,000 | | | $ | 25,010,000 | |
Shares issued in reinvestment of dividends and distributions | | | 126,304 | | | | 1,183,649 | |
| | | | | | | | |
Net increase (decrease) in shares outstanding | | | 2,627,304 | | | $ | 26,193,649 | |
| | | | | | | | |
| * | Commencement of operations was December 12, 2017. |
7. Borrowings
The Fund, on behalf of the Series, along with other affiliated registered investment companies (the “Funds”), is a party to a Syndicated Credit Agreement (“SCA”) with a group of banks. The purpose of the SCA is to provide an alternative source of temporary funding for capital share redemptions. The SCA provides for a commitment of $900 million for the period October 4, 2018 through October 3, 2019. The Funds pay an annualized commitment fee of 0.15% of the unused portion of the SCA. The Series’ portion of the commitment fee for the unused amount, allocated based upon a method approved by the Board, is accrued daily and paid quarterly. Prior to October 4, 2018, the Funds had another SCA that provided a commitment of $900 million and the Funds paid an annualized commitment fee of 0.15% of the unused portion of the SCA. The interest on borrowings under both SCAs is paid monthly and at a per annum interest rate based upon a contractual spread plus the higher of (1) the effective federal funds rate, (2) the 1-month LIBOR rate or (3) zero percent.
Other affiliated registered investment companies that are parties to the SCA include portfolios that are subject to a predetermined mathematical formula used to manage certain benefit guarantees offered under variable annuity contracts. The formula may result in large scale asset flows into and out of these portfolios. Consequently, these portfolios may be more likely to utilize the SCA for purposes of funding redemptions. It may be possible for those portfolios to fully exhaust the committed amount of the SCA, thereby requiring the Manager to allocate available funding per a Board-approved methodology designed to treat the Funds in the SCA equitably.
The Series did not utilize the SCA during the reporting period ended October 31, 2018.
8. Risks of Investing in the Series
The Series’ risks include, but are not limited to, some or all of the risks discussed below:
Bond Obligations Risk: The Series’ holdings, share price, yield and total return may fluctuate in response to bond market movements. The value of bonds may decline for issuer-related reasons, including management performance, financial leverage and reduced demand for the issuer’s goods and services. Certain types of fixed-income obligations also may be subject to “call and redemption risk,” which is the risk that the issuer may call a bond held by the Series for redemption before it matures and the Series may not be able to reinvest at the same level and therefore would earn less income.
Derivatives Risk: Derivatives involve special risks and costs and may result in losses to the Series. The successful use of derivatives requires sophisticated management, and, to the extent that derivatives are used, the Series will depend on the subadviser’s ability to analyze and manage derivative transactions. The prices of derivatives may move in unexpected ways, especially in abnormal market conditions. Some derivatives are “leveraged” and therefore may magnify or otherwise increase investment losses to the Series. The Series’ use of derivatives may also increase the amount of taxes payable by shareholders. Other risks arise from the potential inability to terminate or sell derivatives positions. A liquid secondary market may not always exist for the Series’ derivatives positions. In fact, many OTC derivative instruments will not have liquidity beyond the counterparty to the instrument. OTC derivative instruments also involve the risk that the other party will not meet its obligations to the Series.
Emerging Markets Risk: The risks of foreign investments are greater for investments in or exposed to emerging markets. Emerging market countries typically have economic and political systems that are less fully developed, and can be expected to be less stable, than those of more developed countries. For example, the economies of such countries can be subject to rapid and unpredictable rates of inflation or deflation. Low trading volumes may result in a lack of liquidity and price volatility. Emerging market countries may have policies that restrict investment by non-US investors, or that prevent non-US investors from withdrawing their money at will.
Foreign Securities Risk: The Series’ investments in securities of foreign issuers or issuers with significant exposure to foreign markets involve additional risk. Foreign countries in which the Series may invest may have markets that are less liquid, less regulated and more volatile than US markets. The value of the Series’ investments may decline because of factors affecting the particular issuer as well as foreign markets and issuers generally, such as unfavorable government actions, and political or financial instability.
Interest Rate Risk: The value of an investment may go down when interest rates rise. A rise in rates tends to have a greater impact on the prices of longer term or duration securities. When interest rates fall, the issuers of debt obligations may prepay principal more quickly than expected, and the Series may be required to reinvest the proceeds at a lower interest rate. This is referred to as “prepayment risk.” When interest rates rise, debt obligations may
| | | | |
| PGIM Emerging Markets Debt Hard Currency Fund | | | 53 | |
Notes to Financial Statements (continued)
be repaid more slowly than expected, and the value of the Series’ holdings may fall sharply. This is referred to as “extension risk. The Series may face a heightened level of interest rate risk as a result of the US Federal Reserve Board’s policies. The Series’ investments may lose value if short-term or long-term interest rates rise sharply or in a manner not anticipated by the subadviser.
Liquidity Risk: The Series may invest in instruments that trade in lower volumes and are less liquid than other investments. Liquidity risk exists when particular investments made by the Series are difficult to purchase or sell. Liquidity risk includes the risk that the Series may make investments that may become less liquid in response to market developments or adverse investor perceptions. Investments that are illiquid or that trade in lower volumes may be more difficult to value. If the Series is forced to sell these investments to pay redemption proceeds or for other reasons, the Fund may lose money. In addition, when there is no willing buyer and investments cannot be readily sold at the desired time or price, the Series may have to accept a lower price or may not be able to sell the instrument at all. The reduction in dealer market-making capacity in the fixed-income markets that has occurred in recent years also has the potential to reduce liquidity. An inability to sell a portfolio position can adversely affect the Series’ value or prevent the Series from being able to take advantage of other investment opportunities.
Non-diversification Risk: The Series is non-diversified, meaning that the Series may invest a greater percentage of its assets in the securities of a single company or industry than a diversified fund. Investing in a non-diversified fund involves greater risk than investing in a diversified fund because a loss resulting from the decline in value of any one security may represent a greater portion of the total assets of a non-diversified fund.
9. Recent Accounting Pronouncements and Reporting Updates
In August 2018, the Securities and Exchange Commission (the “SEC”) adopted amendments to Regulation S-X to update and simplify the disclosure requirements for registered investment companies by eliminating requirements that are redundant or duplicative of US GAAP requirements or other SEC disclosure requirements. The new amendments require the presentation of the total, rather than the components, of distributable earnings on the Statement of Assets and Liabilities and the total, rather than the components, of dividends from net investment income and distributions from net realized gains on the Statements of Changes in Net Assets. The amendments also removed the requirement for the parenthetical disclosure of undistributed net investment income on the Statements of Changes in Net Assets and certain tax adjustments that were reflected in the Notes to Financial Statements. All of these have been reflected in the Series’ financial statements.
In August 2018, the FASB issued Accounting Standards Update (“ASU”) No. 2018-13, which changes certain fair value measurement disclosure requirements. The new ASU, in addition to other modifications and additions, removes the requirement to disclose the amount and reasons for transfers between Level 1 and Level 2 of the fair value hierarchy, and the Series’ policy for the timing of transfers between levels. The amendments are effective for financial statements issued for fiscal years beginning after December 15, 2019, and interim periods within those fiscal years. Management has evaluated the implications of certain provisions of the ASU and has determined to early adopt aspects related to the removal and modification of certain fair value measurement disclosures under the ASU effective immediately. At this time, management is evaluating the implications of certain other provisions of the ASU related to new disclosure requirements and any impact on the financial statement disclosures has not yet been determined.
| | | | |
| PGIM Emerging Markets Debt Hard Currency Fund | | | 55 | |
Financial Highlights
| | | | |
| Class A Shares | | | |
| | | December 12,
2017(a)
through
October 31,
2018 | |
| Per Share Operating Performance(b): | | | | |
| Net Asset Value, Beginning of Period | | | $10.00 | |
| Income (loss) from investment operations: | | | | |
| Net investment income (loss) | | | 0.38 | |
| Net realized and unrealized gain (loss) on investment and foreign currency transactions | | | (1.06 | ) |
| Total from investment operations | | | (0.68 | ) |
| Less Dividends and Distributions: | | | | |
| Dividends from net investment income | | | (0.43 | ) |
| Tax return of capital distributions | | | (0.01 | ) |
| Total dividends and distributions | | | (0.44 | ) |
| Net asset value, end of period | | | $8.88 | |
| Total Return(c): | | | (6.97)% | |
| |
| Ratios/Supplemental Data: | | | |
| Net assets, end of period (000) | | | $9 | |
| Average net assets (000) | | | $10 | |
| Ratios to average net assets(d): | | | | |
| Expenses after waivers and/or expense reimbursement | | | 1.05% | (e) |
| Expenses before waivers and/or expense reimbursement | | | 358.14% | (e) |
| Net investment income (loss) | | | 4.49% | (e) |
| Portfolio turnover rate(f) | | | 17% | |
| (a) | Commencement of operations. |
| (b) | Calculated based on average shares outstanding during the period. |
| (c) | Total return does not consider the effects of sales loads. Total return is calculated assuming a purchase of a share on the first day and a sale on the last day of each period reported and includes reinvestment of dividends and distributions, if any. Total returns may reflect adjustments to conform to generally accepted accounting principles. Total returns for periods less than one full year are not annualized. |
| (d) | Does not include expenses of the underlying funds in which the Series invests. |
| (f) | The Series’ portfolio turnover rate is calculated in accordance with regulatory requirements, without regard to transactions involving short term investments and certain derivatives. If such transactions were included, the Series’ portfolio turnover rate may be higher. |
See Notes to Financial Statements.
| | | | |
| Class C Shares | | | |
| | | December 12,
2017(a)
through
October 31,
2018 | |
| Per Share Operating Performance(b): | | | | |
| Net Asset Value, Beginning of Period | | | $10.00 | |
| Income (loss) from investment operations: | | | | |
| Net investment income (loss) | | | 0.31 | |
| Net realized and unrealized gain (loss) on investment and foreign currency transactions | | | (1.05 | ) |
| Total from investment operations | | | (0.74 | ) |
| Less Dividends and Distributions: | | | | |
| Dividends from net investment income | | | (0.37 | ) |
| Tax return of capital distributions | | | (0.01 | ) |
| Total dividends and distributions | | | (0.38 | ) |
| Net asset value, end of period | | | $8.88 | |
| Total Return(c): | | | (7.58)% | |
| |
| Ratios/Supplemental Data: | | | |
| Net assets, end of period (000) | | | $9 | |
| Average net assets (000) | | | $10 | |
| Ratios to average net assets(d): | | | | |
| Expenses after waivers and/or expense reimbursement | | | 1.80% | (e) |
| Expenses before waivers and/or expense reimbursement | | | 359.95% | (e) |
| Net investment income (loss) | | | 3.73% | (e) |
| Portfolio turnover rate(f) | | | 17% | |
| (a) | Commencement of operations. |
| (b) | Calculated based on average shares outstanding during the period. |
| (c) | Total return does not consider the effects of sales loads. Total return is calculated assuming a purchase of a share on the first day and a sale on the last day of each period reported and includes reinvestment of dividends and distributions, if any. Total returns may reflect adjustments to conform to generally accepted accounting principles. Total returns for periods less than one full year are not annualized. |
| (d) | Does not include expenses of the underlying funds in which the Series invests. |
| (f) | The Series’ portfolio turnover rate is calculated in accordance with regulatory requirements, without regard to transactions involving short term investments and certain derivatives. If such transactions were included, the Series’ portfolio turnover rate may be higher. |
See Notes to Financial Statements.
| | | | |
| PGIM Emerging Markets Debt Hard Currency Fund | | | 57 | |
Financial Highlights (continued)
| | | | |
| Class Z Shares | | | |
| | | December 12,
2017(a)
through
October 31,
2018 | |
| Per Share Operating Performance(b): | | | | |
| Net Asset Value, Beginning of Period | | | $10.00 | |
| Income (loss) from investment operations: | | | | |
| Net investment income (loss) | | | 0.39 | |
| Net realized and unrealized gain (loss) on investment and foreign currency transactions | | | (1.05 | ) |
| Total from investment operations | | | (0.66 | ) |
| Less Dividends and Distributions: | | | | |
| Dividends from net investment income | | | (0.45 | ) |
| Tax return of capital distributions | | | (0.01 | ) |
| Total dividends and distributions | | | (0.46 | ) |
| Net asset value, end of period | | | $8.88 | |
| Total Return(c): | | | (6.79)% | |
| |
| Ratios/Supplemental Data: | | | |
| Net assets, end of period (000) | | | $2,234 | |
| Average net assets (000) | | | $766 | |
| Ratios to average net assets(d): | | | | |
| Expenses after waivers and/or expense reimbursement | | | 0.80% | (e) |
| Expenses before waivers and/or expense reimbursement | | | 6.65% | (e) |
| Net investment income (loss) | | | 4.83% | (e) |
| Portfolio turnover rate(f) | | | 17% | |
| (a) | Commencement of operations. |
| (b) | Calculated based on average shares outstanding during the period. |
| (c) | Total return is calculated assuming a purchase of a share on the first day and a sale on the last day of each period reported and includes reinvestment of dividends and distributions, if any. Total returns may reflect adjustments to conform to generally accepted accounting principles. Total returns for periods less than one full year are not annualized. |
| (d) | Does not include expenses of the underlying funds in which the Series invests. |
| (f) | The Series’ portfolio turnover rate is calculated in accordance with regulatory requirements, without regard to transactions involving short term investments and certain derivatives. If such transactions were included, the Series’ portfolio turnover rate may be higher. |
See Notes to Financial Statements.
| | | | |
| Class R6 Shares | | | |
| | | December 12,
2017(a)
through
October 31,
2018 | |
| Per Share Operating Performance(b): | | | | |
| Net Asset Value, Beginning of Period | | | $10.00 | |
| Income (loss) from investment operations: | | | | |
| Net investment income (loss) | | | 0.40 | |
| Net realized and unrealized gain (loss) on investment and foreign currency transactions | | | (1.06 | ) |
| Total from investment operations | | | (0.66 | ) |
| Less Dividends and Distributions: | | | | |
| Dividends from net investment income | | | (0.45 | ) |
| Tax return of capital distributions | | | (0.01 | ) |
| Total dividends and distributions | | | (0.46 | ) |
| Net asset value, end of period | | | $8.88 | |
| Total Return(c): | | | (6.72)% | |
| |
| Ratios/Supplemental Data: | | | |
| Net assets, end of period (000) | | | $23,333 | |
| Average net assets (000) | | | $24,014 | |
| Ratios to average net assets(d): | | | | |
| Expenses after waivers and/or expense reimbursement | | | 0.74% | (e) |
| Expenses before waivers and/or expense reimbursement | | | 1.76% | (e) |
| Net investment income (loss) | | | 4.82% | (e) |
| Portfolio turnover rate(f) | | | 17% | |
| (a) | Commencement of operations. |
| (b) | Calculated based on average shares outstanding during the period. |
| (c) | Total return is calculated assuming a purchase of a share on the first day and a sale on the last day of each period reported and includes reinvestment of dividends and distributions, if any. Total returns may reflect adjustments to conform to generally accepted accounting principles. Total returns for periods less than one full year are not annualized. |
| (d) | Does not include expenses of the underlying funds in which the Series invests. |
| (f) | The Series’ portfolio turnover rate is calculated in accordance with regulatory requirements, without regard to transactions involving short term investments and certain derivatives. If such transactions were included, the Series’ portfolio turnover rate may be higher. |
See Notes to Financial Statements.
| | | | |
| PGIM Emerging Markets Debt Hard Currency Fund | | | 59 | |
Report of Independent Registered Public Accounting Firm
The Board of Directors and Shareholders
Prudential World Fund, Inc.:
Opinion on the Financial Statements
We have audited the accompanying statement of assets and liabilities of PGIM Emerging Markets Debt Hard Currency Fund (the “Fund”), a series of Prudential World Fund, Inc., including the schedule of investments, as of October 31, 2018, the related statements of operations, and changes in net assets for the period from December 12, 2017 (commencement of operations) to October 31, 2018, and the related notes (collectively, the financial statements) and the financial highlights for the period from December 12, 2017 to October 31, 2018. In our opinion, the financial statements and financial highlights present fairly, in all material respects, the financial position of the Fund as of October 31, 2018, the results of its operations, the changes in its net assets, and the financial highlights for the period from December 12, 2017 to October 31, 2018, in conformity with U.S. generally accepted accounting principles.
Basis for Opinion
These financial statements and financial highlights are the responsibility of the Fund’s management. Our responsibility is to express an opinion on these financial statements and financial highlights based on our audit. We are a public accounting firm registered with the Public Company Accounting Oversight Board (United States) (“PCAOB”) and are required to be independent with respect to the Fund in accordance with the U.S. federal securities laws and the applicable rules and regulations of the Securities and Exchange Commission and the PCAOB.
We conducted our audit in accordance with the standards of the PCAOB. Those standards require that we plan and perform the audit to obtain reasonable assurance about whether the financial statements and financial highlights are free of material misstatement, whether due to error or fraud. Our audit included performing procedures to assess the risks of material misstatement of the financial statements and financial highlights, whether due to error or fraud, and performing procedures that respond to those risks. Such procedures included examining, on a test basis, evidence regarding the amounts and disclosures in the financial statements and financial highlights. Such procedures also included confirmation of securities owned as of October 31, 2018, by correspondence with the custodians, transfer agents and brokers or by other appropriate auditing procedures when replies from brokers were not received. Our audit also included evaluating the accounting principles used and significant estimates made by management, as well as evaluating the overall presentation of the financial statements and financial highlights. We believe that our audit provides a reasonable basis for our opinion.

We have served as the auditor of one or more PGIM and/or Prudential Retail investment companies since 2003.
New York, New York
December 17, 2018
INFORMATION ABOUT BOARD MEMBERS AND OFFICERS (unaudited)
Information about Board Members and Officers of the Fund is set forth below. Board Members who are not deemed to be “interested persons” of the Fund, as defined in the 1940 Act, are referred to as “Independent Board Members.” Board Members who are deemed to be “interested persons” of the Fund are referred to as “Interested Board Members.” The Board Members are responsible for the overall supervision of the operations of the Fund and perform the various duties imposed on the directors of investment companies by the 1940 Act. The Board in turn elects the Officers, who are responsible for administering the day-to-day operations of the Fund.
| | | | | | |
| Independent Board Members | | | | |
| | | | |
Name, Address, Age Position(s) Portfolios Overseen | | Principal Occupation(s) During Past Five Years | | Other Directorships Held During Past Five Years | | Length of Board Service |
| | | | |
Ellen S. Alberding (60) Board Member Portfolios Overseen: 93 | | President and Board Member, The Joyce Foundation (charitable foundation) (since 2002); Vice Chair, City Colleges of Chicago (community college system) (2011-2015); Trustee, National Park Foundation (charitable foundation for national park system) (2009-2018); Trustee, Economic Club of Chicago (since 2009); Trustee, Loyola University (since 2018). | | None. | | Since September 2013 |
| | | | |
Kevin J. Bannon (66) Board Member Portfolios Overseen: 93 | | Retired; Managing Director (April 2008-May 2015) and Chief Investment Officer (October 2008-November 2013) of Highmount Capital LLC (registered investment adviser); formerly Executive Vice President and Chief Investment Officer (April 1993-August 2007) of Bank of New York Company; President (May 2003-May 2007) of BNY Hamilton Family of Mutual Funds. | | Director of Urstadt Biddle Properties (equity real estate investment trust) (since September 2008). | | Since July 2008 |
| | | | |
Linda W. Bynoe (66) Board Member Portfolios Overseen: 93 | | President and Chief Executive Officer (since March 1995) and formerly Chief Operating Officer (December 1989-February 1995) of Telemat Ltd. (management consulting); formerly Vice President (January 1985-June 1989) at Morgan Stanley & Co. (broker-dealer). | | Director of Anixter International, Inc. (communication products distributor) (since January 2006); Director of Northern Trust Corporation (financial services) (since April 2006); Trustee of Equity Residential (residential real estate) (since December 2009). | | Since March 2005 |
PGIM Emerging Markets Debt Hard Currency Fund
| | | | | | |
Independent Board Members | | | | |
| | | | |
Name, Address, Age Position(s) Portfolios Overseen | | Principal Occupation(s) During Past Five Years | | Other Directorships Held During Past Five Years | | Length of Board Service |
| | | | |
Barry H. Evans (58) Board Member Portfolios Overseen: 92 | | Retired; formerly President (2005 – 2016), Global Chief Operating Officer (2014– 2016), Chief Investment Officer – Global Head of Fixed Income (1998-2014), and various portfolio manager roles (1986-2006), Manulife Asset Management U.S. | | Director, Manulife Trust Company (since 2011); formerly Director, Manulife Asset Management Limited (2015-2017); formerly Chairman of the Board of Directors of Manulife Asset Management U.S. (2005-2016); formerly Chairman of the Board, Declaration Investment Management and Research (2008-2016). | | Since September 2017 |
| | | | |
Keith F. Hartstein (62) Board Member & Independent Chair Portfolios Overseen: 93 | | Retired; Member (since November 2014) of the Governing Council of the Independent Directors Council (organization of independent mutual fund directors); formerly President and Chief Executive Officer (2005-2012), Senior Vice President (2004-2005), Senior Vice President of Sales and Marketing (1997-2004), and various executive management positions (1990-1997), John Hancock Funds, LLC (asset management); Chairman, Investment Company Institute’s Sales Force Marketing Committee (2003-2008). | | None. | | Since September 2013 |
Visit our website at pgiminvestments.com
| | | | | | |
| Independent Board Members | | | | |
| | | | |
Name, Address, Age Position(s) Portfolios Overseen | | Principal Occupation(s) During Past Five Years | | Other Directorships Held During Past Five Years | | Length of Board Service |
| | | | |
Laurie Simon Hodrick (56) Board Member Portfolios Overseen: 92 | | A. Barton Hepburn Professor Emerita of Economics in the Faculty of Business, Columbia Business School (since 2018); Visiting Professor of Law, Stanford Law School (since 2015); Visiting Fellow at the Hoover Institution, Stanford University (since 2015); Sole Member, ReidCourt LLC (since 2008) (a consulting firm); formerly A. Barton Hepburn Professor of Economics in the Faculty of Business, Columbia Business School (1996-2017); formerly Managing Director, Global Head of Alternative Investment Strategies, Deutsche Bank (2006-2008). | | Independent Director, Corporate Capital Trust (since April 2017) (a business development company); Independent Director, Kabbage, Inc. (since July 2018) (financial services). | | Since September 2017 |
| | | | |
Michael S. Hyland, CFA (73) Board Member Portfolios Overseen: 93 | | Retired (since February 2005); formerly Senior Managing Director (July 2001-February 2005) of Bear Stearns & Co, Inc.; Global Partner, INVESCO (1999-2001); Managing Director and President of Salomon Brothers Asset Management (1989-1999). | | None. | | Since July 2008 |
| | | | |
Richard A. Redeker (75) Board Member Portfolios Overseen: 93 | | Retired Mutual Fund Senior Executive (50 years); Management Consultant; Director, Mutual Fund Directors Forum (since 2014); Independent Directors Council (organization of independent mutual fund directors)-Executive Committee, Chair of Policy Steering Committee, Governing Council. | | None. | | Since October 1993 |
PGIM Emerging Markets Debt Hard Currency Fund
| | | | | | |
| Independent Board Members | | | | |
| | | | |
Name, Address, Age Position(s) Portfolios Overseen | | Principal Occupation(s) During Past Five Years | | Other Directorships Held During Past Five Years | | Length of Board Service |
| | | | |
Brian K. Reid (56)# Board Member Portfolios Overseen: 92 | | Retired; formerly Chief Economist for the Investment Company Institute (ICI) (2005-2017); formerly Senior Economist and Director of Industry and Financial Analysis at the ICI (1998-2004); formerly Senior Economist, Industry and Financial Analysis at the ICI (1996-1998); formerly Staff Economist at the Federal Reserve Board (1989-1996); Director, ICI Mutual Insurance Company (2012-2017). | | None. | | Since March 2018 |
| # | Mr. Reid joined the Board effective as of March 1, 2018. |
| | | | | | |
| Interested Board Members | | | | |
| | | | |
Name, Address, Age Position(s) Portfolios Overseen | | Principal Occupation(s) During Past Five Years | | Other Directorships Held During Past Five Years | | Length of
Board Service |
| | | | |
Stuart S. Parker (56) Board Member & President Portfolios Overseen: 93 | | President of PGIM Investments LLC (formerly known as Prudential Investments LLC) (since January 2012); Executive Vice President of Prudential Investment Management Services LLC (since December 2012); formerly Executive Vice President of Jennison Associates LLC and Head of Retail Distribution of PGIM Investments LLC (June 2005-December 2011). | | None. | | Since January 2012 |
Visit our website at pgiminvestments.com
| | | | | | |
| Interested Board Members | | | | |
| | | | |
Name, Address, Age Position(s) Portfolios Overseen | | Principal Occupation(s) During Past Five Years | | Other Directorships Held During Past Five Years | | Length of Board Service |
| | | | |
Scott E. Benjamin (45) Board Member & Vice President Portfolios Overseen:93 | | Executive Vice President (since June 2009) of PGIM Investments LLC; Executive Vice President (June 2009-June 2012) and Vice President (since June 2012) of Prudential Investment Management Services LLC; Executive Vice President (since September 2009) of AST Investment Services, Inc.; Senior Vice President of Product Development and Marketing, PGIM Investments (since February 2006); formerly Vice President of Product Development and Product Management, PGIM Investments LLC (2003-2006). | | None. | | Since March 2010 |
| | | | |
Grace C. Torres* (59) Board Member Portfolios Overseen: 92 | | Retired; formerly Treasurer and Principal Financial and Accounting Officer of the PGIM Funds, Target Funds, Advanced Series Trust, Prudential Variable Contract Accounts and The Prudential Series Fund (1998-June 2014); Assistant Treasurer (March 1999-June 2014) and Senior Vice President (September 1999-June 2014) of PGIM Investments LLC; Assistant Treasurer (May 2003-June 2014) and Vice President (June 2005-June 2014) of AST Investment Services, Inc.; Senior Vice President and Assistant Treasurer (May 2003-June 2014) of Prudential Annuities Advisory Services, Inc. | | Formerly Director (July 2015-January 2018) of Sun Bancorp, Inc. N.A. and Sun National Bank; Director (since January 2018) of OceanFirst Financial Corp. and OceanFirst Bank. | | Since November 2014 |
* Note: Prior to her retirement in 2014, Ms. Torres was employed by PGIM Investments LLC. Due to her prior employment, she is considered to be an “interested person” under the 1940 Act. Ms. Torres is a Non-Management Interested Board Member.
PGIM Emerging Markets Debt Hard Currency Fund
| | | | |
| Fund Officers(a) | | | | |
| | | |
Name, Address and Age Position with Fund | | Principal Occupation(s) During Past Five Years | | Length of Service as Fund Officer |
| | | |
Raymond A. O’Hara (63) Chief Legal Officer | | Vice President and Corporate Counsel (since July 2010) of Prudential Insurance Company of America (Prudential); Vice President (March 2011-Present) of Pruco Life Insurance Company and Pruco Life Insurance Company of New Jersey; Vice President and Corporate Counsel (March 2011-Present) of Prudential Annuities Life Assurance Corporation; Chief Legal Officer of PGIM Investments LLC (since June 2012); Chief Legal Officer of Prudential Mutual Fund Services LLC (since June 2012) and Corporate Counsel of AST Investment Services, Inc. (since June 2012); formerly Assistant Vice President and Corporate Counsel (September 2008-July 2010) of The Hartford Financial Services Group, Inc.; formerly Associate (September 1980-December 1987) and Partner (January 1988–August 2008) of Blazzard & Hasenauer, P.C. (formerly, Blazzard, Grodd & Hasenauer, P.C.). | | Since June 2012 |
| | | |
Chad A. Earnst (43) Chief Compliance Officer | | Chief Compliance Officer (September 2014-Present) of PGIM Investments LLC; Chief Compliance Officer (September 2014-Present) of the PGIM Funds, Target Funds, Advanced Series Trust, The Prudential Series Fund, Prudential’s Gibraltar Fund, Inc., PGIM Global Short Duration High Yield Income Fund, Inc., PGIM Short Duration High Yield Fund, Inc. and PGIM Jennison MLP Income Fund, Inc.; formerly Assistant Director (March 2010-August 2014) of the Asset Management Unit, Division of Enforcement, US Securities & Exchange Commission; Assistant Regional Director (January 2010-August 2014), Branch Chief (June 2006–December 2009) and Senior Counsel (April 2003-May 2006) of the Miami Regional Office, Division of Enforcement, US Securities & Exchange Commission. | | Since September 2014 |
| | | |
Dino Capasso (44) Deputy Chief Compliance Officer | | Vice President and Deputy Chief Compliance Officer (June 2017-Present) of PGIM Investments LLC; formerly, Senior Vice President and Senior Counsel (January 2016-June 2017), and Vice President and Counsel (February 2012-December 2015) of Pacific Investment Management Company LLC. | | Since March 2018 |
| | | |
Andrew R. French (56) Secretary | | Vice President and Corporate Counsel (since February 2010) of Prudential; formerly Director and Corporate Counsel (2006-2010) of Prudential; Vice President and Assistant Secretary (since January 2007) of PGIM Investments LLC; Vice President and Assistant Secretary (since January 2007) of Prudential Mutual Fund Services LLC. | | Since October 2006 |
Visit our website at pgiminvestments.com
| | | | |
| Fund Officers(a) | | | | |
| | | |
Name, Address and Age Position with Fund | | Principal Occupation(s) During Past Five Years | | Length of Service as Fund Officer |
| | | |
Jonathan D. Shain (60) Assistant Secretary | | Vice President and Corporate Counsel (since August 1998) of Prudential; Vice President and Assistant Secretary (since May 2001) of PGIM Investments LLC; Vice President and Assistant Secretary (since February 2001) of Prudential Mutual Fund Services LLC; formerly Vice President and Assistant Secretary (May 2003-June 2005) of AST Investment Services, Inc. | | Since May 2005 |
| | | |
Claudia DiGiacomo (44) Assistant Secretary | | Vice President and Corporate Counsel (since January 2005) of Prudential; Vice President and Assistant Secretary of PGIM Investments LLC (since December 2005); formerly Associate at Sidley Austin Brown & Wood LLP (1999-2004). | | Since December 2005 |
| | | |
Charles H. Smith (45) Anti-Money Laundering Compliance Officer | | Vice President, Corporate Compliance, Anti-Money Laundering Unit (since January 2015) of Prudential; committee member of the American Council of Life Insurers Anti-Money Laundering and Critical Infrastructure Committee (since January 2016); formerly Global Head of Economic Sanctions Compliance at AIG Property Casualty (February 2007 – December 2014); Assistant Attorney General at the New York State Attorney General’s Office, Division of Public Advocacy. (August 1998 —January 2007). | | Since January 2017 |
| | | |
Brian D. Nee (52) Treasurer and Principal Financial and Accounting Officer | | Vice President and Head of Finance of PGIM Investments LLC (since August 2015) and PGIM Global Partners (since February 2017); formerly, Vice President, Treasurer’s Department of Prudential (September 2007-August 2015). | | Since July 2018 |
| | | |
Peter Parrella (60) Assistant Treasurer | | Vice President (since 2007) and Director (2004-2007) within Prudential Mutual Fund Administration; formerly Tax Manager at SSB Citi Fund Management LLC (1997-2004). | | Since June 2007 |
| | | |
Lana Lomuti (51) Assistant Treasurer | | Vice President (since 2007) and Director (2005-2007), within Prudential Mutual Fund Administration; formerly Assistant Treasurer (December 2007-February 2014) of The Greater China Fund, Inc. | | Since April 2014 |
| | | |
Linda McMullin (57) Assistant Treasurer | | Vice President (since 2011) and Director (2008-2011) within Prudential Mutual Fund Administration. | | Since April 2014 |
| | | |
Kelly A. Coyne (50) Assistant Treasurer | | Director, Investment Operations of Prudential Mutual Fund Services LLC (since 2010). | | Since March 2015 |
(a) Excludes Mr. Parker and Mr. Benjamin, interested Board Members who also serve as President and Vice President, respectively.
Explanatory Notes to Tables:
| ∎ | | Board Members are deemed to be “Interested,” as defined in the 1940 Act, by reason of their affiliation with PGIM Investments LLC and/or an affiliate of PGIM Investments LLC. |
| ∎ | | Unless otherwise noted, the address of all Board Members and Officers is c/o PGIM Investments LLC, 655 Broad Street, Newark, New Jersey 07102-4410. |
| ∎ | | There is no set term of office for Board Members or Officers. The Board Members have adopted a retirement policy, which calls for the retirement of Board Members on December 31 of the year in which they reach the age of 75. |
PGIM Emerging Markets Debt Hard Currency Fund
| ∎ | | “Other Directorships Held” includes only directorships of companies required to register or file reports with the SEC under the 1934 Act (that is, “public companies”) or other investment companies registered under the 1940 Act. |
| ∎ | | “Portfolios Overseen” includes all investment companies managed by PGIM Investments LLC. The investment companies for which PGIM Investments LLC serves as manager include the PGIM Funds, The Prudential Variable Contract Accounts, PGIM ETF Trust, PGIM Short Duration High Yield Fund, Inc., PGIM Global Short Duration High Yield Fund, Inc., The Prudential Series Fund, Prudential’s Gibraltar Fund, Inc. and the Advanced Series Trust. |
Visit our website at pgiminvestments.com
Approval of Advisory Agreements (unaudited)
Board Consideration of Management Agreement and PGIM, Inc. and PGIM Limited Subadvisory Agreement:
Initial Approval of the Fund’s Advisory Agreements
As required by the Investment Company Act of 1940 (the 1940 Act), the Board of Prudential World Fund, Inc. considered the proposed management agreement with PGIM Investments LLC (the Manager) and the proposed subadvisory agreement between the Manager, PGIM, Inc. (PGIM) on behalf of its PGIM Fixed Income unit, and PGIM Limited (PGIML, and together with PGIM, the Subadviser), with respect to the Prudential Emerging Markets Debt Hard Currency Fund (the Fund) prior to the Fund’s commencement of operations. The Board, including a majority of the Independent Directors, met on September 12-14, 2017 and approved the agreements for an initial two-year period, after concluding that approval of the agreements was in the best interests of the Fund.
In advance of the meetings, the Board requested and received materials relating to the agreements, and had the opportunity to ask questions and request further information in connection with its consideration.
In approving the agreements, the Board, including the Independent Directors advised by independent legal counsel, considered the factors it deemed relevant, including the nature, quality and extent of services to be provided to the Fund by the Manager, PGIM and PGIML; any relevant comparable performance and the qualifications and track record of PGIM and PGIML in serving other affiliated mutual funds; the fees proposed to be paid by the Fund to the Manager and by the Manager to the Subadviser, under the agreements; and the potential for economies of scale that may be shared with the Fund and its shareholders. In connection with its deliberations, the Board considered information provided by the Manager, PGIM and PGIML at or in advance of the meetings on September 12-14, 2017. The Board also considered information provided by the Manager with respect to other funds managed by the Manager, PGIM and PGIML, which information had been provided throughout the year at regular Board meetings. In their deliberations, the Directors did not identify any single factor which alone was responsible for the Board’s decision to approve the agreements with respect to the Fund.
The Directors determined that the overall arrangements between the Fund and the Manager, which will serve as the Fund’s investment manager pursuant to a management agreement, and between the Manager, PGIM and PGIML, which will serve as the Fund’s subadvisers pursuant to the terms of a subadvisory agreement, were in the best interests of the Fund in light of the services to be performed and the fees to be charged under the agreements and such other matters as the Directors considered relevant in the exercise of their business judgment.
| | |
| PGIM Emerging Markets Debt Hard Currency Fund |
Approval of Advisory Agreements (continued)
Certain factors and conclusions that formed the basis for the Directors’ reaching their determinations to approve the agreements are separately discussed below.
Nature, quality and extent of services
With respect to the Manager, the Board noted that it had received and considered information about the Manager at the June 6-8, 2017 meetings in connection with the renewal of the management agreements between the Manager and the other Prudential Retail Funds. The Board also noted that it received and considered information at other regular meetings throughout the year, regarding the nature, quality and extent of services provided by the Manager. The Board considered the services to be provided by the Manager, including but not limited to the oversight of PGIM and PGIML, as well as the provision of fund recordkeeping, compliance and other services to the Fund. With respect to the Manager’s oversight of PGIM and PGIML, the Board noted that the Manager’s Strategic Investment Research Group, which is a business unit of the Manager, is responsible for monitoring and reporting to the Manager’s senior management on the performance and operations of PGIM and PGIML. The Board also noted that the Manager pays the salaries of all the officers and interested Directors of the Fund who are members of management. The Board reviewed the qualifications, backgrounds and responsibilities of the Manager’s senior management responsible for the oversight of the Fund, PGIM and PGIML, and was also provided with information pertaining to the Manager’s organizational structure, senior management, investment operations and other relevant information. The Board further noted that it received favorable compliance reports from the Fund’s Chief Compliance Officer as to the Manager. The Board noted that it had concluded that it was satisfied with the nature, quality and extent of the services provided by the Manager to other Prudential Retail Funds and determined that it was reasonable to conclude that the nature, quality and extent of services to be provided by the Manager under the management agreement for the Fund would be similar in nature to those provided under other similar management agreements.
With respect to the Subadviser, the Board noted that it had received and considered information about PGIM and PGIML at the June 6-8, 2017 meetings in connection with the renewal of the subadvisory agreements between the Manager and PGIM and sub-subadvisory agreements between PGIM and PGIML with respect to other Prudential Retail Funds. The Board also noted that it received and considered information at other regular meetings throughout the year, regarding the nature, quality and extent of services provided by PGIM and PGIML to other Prudential Retail Funds. The Board considered, among other things, the qualifications, background and experience of PGIM’s and PGIML’s portfolio managers who will be responsible for the day-to-day management of the Fund’s portfolio, as well as information on the organizational structure, senior management, investment operations and other relevant information of PGIM and PGIML. The Board
| | |
| Visit our website at pgiminvestments.com | | |
further noted that it received favorable compliance reports from the Fund’s Chief Compliance Officer as to PGIM and PGIML. The Board noted that PGIM and PGIML are affiliated with the Manager. The Board noted that it was satisfied with the nature, quality and extent of services provided by PGIM and PGIML with respect to other Prudential Retail Funds served by PGIM and PGIML and determined that it was reasonable to conclude that the nature, quality and extent of services to be provided by PGIM and PGIML under the subadvisory agreement for the Fund would be similar in nature to those provided under other similar subadvisory agreements.
Performance
Because the Fund had not yet commenced operations, no investment performance for the Fund existed for Board review. The Board did consider PGIM’s track record in managing the sleeve of another registered investment company that follows substantially similar investment strategies. The Board considered the background and professional experience of the proposed portfolio management team for the Fund. The Board noted that the Manager will provide information relating to performance to the Board in connection with future annual reviews of the management agreement and subadvisory agreement.
Fee Rates
The Board considered the proposed management fees to be paid by the Fund to the Manager and the proposed subadvisory fees to be paid by the Manager to the Subadviser.
The Board considered information provided by the Manager comparing the Fund’s proposed management fee rate and net total expenses for Class A shares to a Peer Group of comparable funds chosen by Broadridge. The Board noted that the Fund’s proposed contractual management fee was in the first quartile of the Broadridge Peer Group (first quartile being among the lowest fees). The Board further noted that the Fund’s net total expense ratio, after waivers and reimbursements, ranked in the first quartile of the Broadridge Peer Group (first quartile being among the lowest expenses).
The Board noted that the Manager had contractually agreed, through February 28, 2019, to limit Total annual Fund operating expenses.
Profitability
Because the Fund had not yet commenced operations and the actual asset base of the Fund has not yet been determined, the Board noted that there was no historical profitability information with respect to the Fund to be reviewed. The Board noted that PGIM and PGIML were affiliated with the Manager and, as a result, their profitability will be reflected in the Manager’s profitability report. The Board noted that it would review profitability
| | |
| PGIM Emerging Markets Debt Hard Currency Fund |
Approval of Advisory Agreements (continued)
information in connection with the annual renewal of the advisory and subadvisory agreements after their initial two-year terms.
Economies of Scale
The Board noted that the proposed management fees payable by the Fund to the Manager contained breakpoints that would reduce the fee rates on assets above specified levels, as did the subadvisory fees payable by the Manager to the Subadviser. The Board considered the potential for the Manager and the Subadviser to experience economies of scale as the amount of assets managed by the Manager and the Subadviser, respectively, increased in size. Because the Fund had not yet commenced operations and the actual asset base of the Fund has not yet been determined, the Board noted that there was no historical information regarding economies of scale with respect to the Fund to be reviewed. The Board noted that it would review such information in connection with the annual renewal of the advisory and subadvisory agreements after their initial two-year terms.
Other Benefits to the Manager and the Subadviser
The Board considered potential “fall-out” or ancillary benefits anticipated to be received by the Manager, PGIM, PGIML and their affiliates as a result of their relationships with the Fund. The Board concluded that any potential benefits to be derived by the Manager were likely to be similar to benefits derived by the Manager in connection with its management of other Prudential Retail Funds, which are reviewed on an annual basis. The Board also concluded that any potential benefits to be derived by PGIM and PGIML were likely to be consistent with those generally derived by subadvisers to the Prudential Retail Funds, and that those benefits are reviewed on an annual basis. The Board concluded that any potential benefits derived by the Manager, PGIM and PGIML were consistent with the types of benefits generally derived by investment managers and subadvisers to mutual funds.
* * *
After full consideration of these factors, among others, the Board concluded that the approval of the agreements was in the best interests of the Fund.
| | |
| Visit our website at pgiminvestments.com | | |
| | | | |
| ∎ MAIL | | ∎ TELEPHONE | | ∎ WEBSITE |
655 Broad Street Newark, NJ 07102 | | (800) 225-1852 | | www.pgiminvestments.com |
|
| PROXY VOTING |
| The Board of Trustees of the Fund has delegated to the Fund’s subadviser the responsibility for voting any proxies and maintaining proxy recordkeeping with respect to the Fund. A description of these proxy voting policies and procedures is available without charge, upon request, by calling (800) 225-1852. Information regarding how the Fund voted proxies relating to portfolio securities during the most recent 12-month period ended June 30 is available on the Fund’s website and on the Securities and Exchange Commission’s website. |
|
| TRUSTEES |
| Ellen S. Alberding • Kevin J. Bannon • Scott E. Benjamin • Linda W. Bynoe • Barry H. Evans • Keith F. Hartstein • Laurie Simon Hodrick • Michael S. Hyland • Stuart S. Parker • Richard A. Redeker • Brian K. Reid • Grace C. Torres |
|
| OFFICERS |
| Stuart S. Parker, President • Scott E. Benjamin, Vice President • Brian D. Nee, Treasurer and Principal Financial and Accounting Officer • Raymond A. O’Hara, Chief Legal Officer • Chad A. Earnst, Chief Compliance Officer • Andrew R. French, Secretary • Dino Capasso, Vice President and Deputy Chief Compliance Officer • Charles H. Smith, Anti-Money Laundering Compliance Officer • Jonathan D. Shain, Assistant Secretary • Claudia DiGiacomo, Assistant Secretary • Peter Parrella, Assistant Treasurer • Lana Lomuti, Assistant Treasurer • Linda McMullin, Assistant Treasurer • Kelly A. Coyne, Assistant Treasurer |
| | | | |
| MANAGER | | PGIM Investments LLC | | 655 Broad Street
Newark, NJ 07102 |
|
| SUBADVISER | | PGIM Fixed Income | | 655 Broad Street
Newark, NJ 07102 |
|
| DISTRIBUTOR | | Prudential Investment
Management Services LLC | | 655 Broad Street
Newark, NJ 07102 |
|
| CUSTODIAN | | The Bank of New York Mellon | | 225 Liberty Street
New York, NY 10286 |
|
| TRANSFER AGENT | | Prudential Mutual Fund
Services LLC | | PO Box 9658
Providence, RI 02940 |
|
INDEPENDENT REGISTERED
PUBLIC ACCOUNTING FIRM | | KPMG LLP | | 345 Park Avenue
New York, NY 10154 |
|
| FUND COUNSEL | | Willkie Farr & Gallagher LLP | | 787 Seventh Avenue
New York, NY 10019 |
|
|
| An investor should consider the investment objectives, risks, charges, and expenses of the Fund carefully before investing. The prospectus and summary prospectus contain this and other information about the Fund. An investor may obtain a prospectus and summary prospectus by visiting our website at www.pgiminvestments.com or by calling (800) 225-1852. The prospectus and summary prospectus should be read carefully before investing. |
|
| E-DELIVERY |
| To receive your mutual fund documents online, go to www.pgiminvestments.com/edelivery and enroll. Instead of receiving printed documents by mail, you will receive notification via email when new materials are available. You can cancel your enrollment or change your email address at any time by visiting the website address above. |
|
| SHAREHOLDER COMMUNICATIONS WITH TRUSTEES |
| Shareholders can communicate directly with the Board of Trustees by writing to the Chair of the Board, PGIM Emerging Markets Debt Hard Currency Fund, PGIM Investments, Attn: Board of Trustees, 655 Broad Street, Newark, NJ 07102. Shareholders can communicate directly with an individual Director by writing to the same address. Communications are not screened before being delivered to the addressee. |
|
| AVAILABILITY OF PORTFOLIO SCHEDULE |
| The Fund files its complete schedule of portfolio holdings with the Securities and Exchange Commission for the first and third quarters of each fiscal year on Form N-Q. The Fund’s Forms N-Q are available on the Commission’s website at www.sec.gov. The Fund’s schedule of portfolio holdings is also available on the Fund’s website as of the end of each month no sooner than 15 days after the end of the month. |
|
| The Fund’s Statement of Additional Information contains additional information about the Fund’s Trustees and is available without charge, upon request, by calling (800) 225-1852. |
Mutual Funds:
| | | | |
| ARE NOT INSURED BY THE FDIC OR ANY FEDERAL GOVERNMENT AGENCY | | MAY LOSE VALUE | | ARE NOT A DEPOSIT OF OR GUARANTEED BY ANY BANK OR ANY BANK AFFILIATE |
PGIM EMERGING MARKETS DEBT HARD CURRENCY FUND
| | | | | | | | |
| SHARE CLASS | | A | | C | | Z | | R6* |
| NASDAQ | | PDHAX | | PDHCX | | PDHVX | | PDHQX |
| CUSIP | | 743969479 | | 743969461 | | 743969446 | | 743969453 |
*Formerly known as Class Q shares.
MF239E
Item 2 – Code of Ethics – – See Exhibit (a)
As of the end of the period covered by this report, the registrant has adopted a code of ethics (the “Section 406 Standards for Investment Companies – Ethical Standards for Principal Executive and Financial Officers”) that applies to the registrant’s Principal Executive Officer and Principal Financial Officer; the registrant’s Principal Financial Officer also serves as the Principal Accounting Officer.
The registrant hereby undertakes to provide any person, without charge, upon request, a copy of the code of ethics. To request a copy of the code of ethics, contact the registrant 800-225-1852, and ask for a copy of the Section 406 Standards for Investment Companies - Ethical Standards for Principal Executive and Financial Officers.
Item 3 – Audit Committee Financial Expert –
The registrant’s Board has determined that Mr. Kevin J. Bannon, member of the Board’s Audit Committee is an “audit committee financial expert,” and that he is “independent,” for purposes of this Item.
Item 4 – Principal Accountant Fees and Services –
(a) Audit Fees
For the fiscal years ended October 31, 2018 and October 31, 2017, KPMG LLP (“KPMG”), the Registrant’s principal accountant, billed the Registrant $248,131 and $205,575 respectively, for professional services rendered for the audit of the Registrant’s annual financial statements or services that are normally provided in connection with statutory and regulatory filings.
(b) Audit-Related Fees
For the fiscal years ended October 31, 2018 and October 31, 2017: none.
(c) Tax Fees
For the fiscal years ended October 31, 2018 and October 31, 2017: none.
(d) All Other Fees
For the fiscal years ended October 31, 2018 and October 31, 2017: none.
(e) (1) Audit Committee Pre-Approval Policies and Procedures
THE PRUDENTIAL MUTUAL FUNDS
AUDIT COMMITTEE POLICY
on
Pre-Approval of Services Provided by the Independent Accountants
The Audit Committee of each Prudential Mutual Fund is charged with the responsibility to monitor the independence of the Fund’s independent accountants. As part of this responsibility, the Audit Committee must pre-approve the independent accounting firm’s engagement to render audit and/or permissible non-audit services, as required by law. In evaluating a proposed engagement of the independent accountants, the Audit Committee will assess the effect that the engagement might reasonably be expected to have on the accountant’s independence. The Committee’s evaluation will be based on:
| | • | | a review of the nature of the professional services expected to be provided, |
| | • | | a review of the safeguards put into place by the accounting firm to safeguard independence, and |
| | • | | periodic meetings with the accounting firm. |
Policy for Audit and Non-Audit Services Provided to the Funds
On an annual basis, the scope of audits for each Fund, audit fees and expenses, and audit-related and non-audit services (and fees proposed in respect thereof) proposed to be performed by the Fund’s independent accountants will be presented by the Treasurer and the independent accountants to the Audit Committee for review and, as appropriate, approval prior to the initiation of such services. Such presentation shall be accompanied by confirmation by both the Treasurer and the independent accountants that the proposed non-audit services will not adversely affect the independence of the independent accountants. Such proposed non-audit services shall be described in sufficient detail to enable the Audit Committee to assess the appropriateness of such services and fees, and the compatibility of the provision of such services with the auditor’s independence. The Committee shall receive periodic reports on the progress of the audit and other services which are approved by the Committee or by the Committee Chair pursuant to authority delegated in this Policy.
The categories of services enumerated under “Audit Services”, “Audit-related Services”, and “Tax Services” are intended to provide guidance to the Treasurer and the independent accountants as to those categories of services which the Committee believes are generally consistent with the independence of the independent accountants and which the Committee (or the Committee Chair) would expect upon the presentation of specific proposals to pre-approve. The enumerated categories are not intended as an exclusive list of audit, audit-related or tax services, which the Committee (or the Committee Chair) would consider for pre-approval.
Audit Services
The following categories of audit services are considered to be consistent with the role of the Fund’s independent accountants:
| | ➣ | Annual Fund financial statement audits |
| | ➣ | Seed audits (related to new product filings, as required) |
| | ➣ | SEC and regulatory filings and consents |
Audit-related Services
The following categories of audit-related services are considered to be consistent with the role of the Fund’s independent accountants:
| | ➣ | Accounting consultations |
| | ➣ | Fund merger support services |
| | ➣ | Agreed Upon Procedure Reports |
| | ➣ | Other Internal Control Reports |
Individual audit-related services that fall within one of these categories (except for fund merger support services) and are not presented to the Audit Committee as part of the annual pre-approval process are subject to an authorized pre-approval by the Audit Committee so long as the estimated fee for those services does not exceed $30,000. Any services provided under such pre-approval will be reported to the Audit Committee at its next regular meeting. Should the amount of such services exceed $30,000 any additional fees will be subject to pre-approval by the Committee Chair (or any other Committee member on whom this responsibility has been delegated). Fees related to fund merger support services are subject to a separate authorized pre-approval by the Audit Committee with fees determined on a per occurrence and merger complexity basis.
Tax Services
The following categories of tax services are considered to be consistent with the role of the Fund’s independent accountants:
| | ➣ | Tax compliance services related to the filing or amendment of the following: |
| | ◾ | Federal, state and local income tax compliance; and, |
| | ◾ | Sales and use tax compliance |
| | ➣ | Timely RIC qualification reviews |
| | ➣ | Tax distribution analysis and planning |
| | ➣ | Tax authority examination services |
| | ➣ | Tax appeals support services |
| | ➣ | Accounting methods studies |
| | ➣ | Fund merger support services |
| | ➣ | Tax consulting services and related projects |
Individual tax services that fall within one of these categories and are not presented to the Audit Committee as part of the annual pre-approval process are subject to an authorized pre-approval by the Audit Committee so long as the estimated fee for those services does not exceed $30,000. Any services provided under such pre-approval will be reported to the Audit Committee at its next regular meeting. Should the amount of such services exceed $30,000 any additional fees will be subject to pre-approval by the Committee Chair (or any other Committee member on whom this responsibility has been delegated).
Other Non-Audit Services
Certain non-audit services that the independent accountants are legally permitted to render will be subject to pre-approval by the Committee or by one or more Committee members to whom the Committee has delegated this authority and who will report to the full Committee any pre-approval decisions made pursuant to this Policy. Non-audit services presented for pre-approval pursuant to this paragraph will be accompanied by a confirmation from both the Treasurer and the independent accountants that the proposed services will not adversely affect the independence of the independent accountants.
Proscribed Services
The Fund’s independent accountants will not render services in the following categories of non-audit services:
➣ Bookkeeping or other services related to the accounting records or financial statements of the Fund
➣ Financial information systems design and implementation
➣ Appraisal or valuation services, fairness opinions, or contribution-in-kind reports
➣ Actuarial services
➣ Internal audit outsourcing services
➣ Management functions or human resources
➣ Broker or dealer, investment adviser, or investment banking services
➣ Legal services and expert services unrelated to the audit
➣ Any other service that the Public Company Accounting Oversight Board determines, by regulation, is impermissible.
Pre-approval of Non-Audit Services Provided to Other Entities Within the Prudential Fund Complex
Certain non-audit services provided to PGIM Investments LLC or any of its affiliates that also provide ongoing services to the Prudential Mutual Funds will be subject to pre-approval by the Audit Committee. The only non-audit services provided to these entities that will require pre-approval are those related directly to the operations and financial reporting of the Funds. Individual projects that are not presented to the Audit Committee as part of the annual pre-approval process will be subject to pre-approval by the Committee Chair (or any other Committee member on whom this responsibility has been delegated) so long as the estimated fee for those services does not exceed $30,000. Services presented for pre-approval pursuant to this paragraph will be accompanied by a confirmation from both the Treasurer and the independent accountants that the proposed services will not adversely affect the independence of the independent accountants.
Although the Audit Committee will not pre-approve all services provided to PGIM Investments LLC and its affiliates, the Committee will receive an annual report from the Fund’s independent accounting firm showing the aggregate fees for all services provided to PGIM Investments and its affiliates.
(e) (2) Percentage of services referred to in 4(b) – 4(d) that were approved by the audit committee –
For the fiscal years ended October 31, 2018 and October 31, 2017: none.
(f) Percentage of hours expended attributable to work performed by other than full time employees of principal accountant if greater than 50%.
The percentage of hours expended on the principal accountant’s engagement to audit the registrant’s financial statements for the most recent fiscal year that were attributed to work performed by persons other than the principal accountant’s full-time, permanent employees was 0%.
(g) Non-Audit Fees
The aggregate non-audit fees billed by KPMG for services rendered to the registrant’s investment adviser and any entity controlling, controlled by, or under common control with the investment adviser that provides ongoing services to the registrant for the fiscal years ended October 31, 2018 and October 31, 2017 was $0 and $0, respectively.
(h) Principal Accountant’s Independence
Not applicable as KPMG has not provided non-audit services to the registrant’s investment adviser and any entity controlling, controlled by, or under common control with the investment adviser that provides ongoing services to the registrant that were not pre-approved pursuant to Rule 2-01(c)(7)(ii) of Regulation S-X.
| | |
Item 5 – | | Audit Committee of Listed Registrants – Not applicable. |
| |
Item 6 – | | Schedule of Investments – The schedule is included as part of the report to shareholders filed under Item 1 of this Form. |
| |
Item 7 – | | Disclosure of Proxy Voting Policies and Procedures for Closed-End Management Investment Companies – Not applicable. |
| |
Item 8 – | | Portfolio Managers of Closed-End Management Investment Companies – Not applicable. |
| |
Item 9 – | | Purchases of Equity Securities by Closed-End Management Investment Company and Affiliated Purchasers – Not applicable. |
| | |
| |
Item 10 – | | Submission of Matters to a Vote of Security Holders – Not applicable. |
| |
Item 11 – | | Controls and Procedures |
| | (a) | It is the conclusion of the registrant’s principal executive officer and principal financial officer that the effectiveness of the registrant’s current disclosure controls and procedures (such disclosure controls and procedures having been evaluated within 90 days of the date of this filing) provide reasonable assurance that the information required to be disclosed by the registrant has been recorded, processed, summarized and reported within the time period specified in the Commission’s rules and forms and that the information required to be disclosed by the registrant has been accumulated and communicated to the registrant’s principal executive officer and principal financial officer in order to allow timely decisions regarding required disclosure. |
| | (b) | There has been no significant change in the registrant’s internal control over financial reporting that occurred during the registrant’s most recent fiscal quarter of the period covered by this report that has materially affected, or is likely to materially affect, the registrant’s internal control over financial reporting. |
| | | | |
| Item 12 – Exhibits |
| | |
| | (a) | | (1) Code of Ethics – Attached hereto as Exhibit EX-99.CODE-ETH |
| | |
| | | | (2) Certifications pursuant to Section 302 of the Sarbanes-Oxley Act – Attached hereto as Exhibit EX-99.CERT. |
| | |
| | | | (3) Any written solicitation to purchase securities under Rule 23c-1. – Not applicable. |
| | |
| | (b) | | Certifications pursuant to Section 906 of the Sarbanes-Oxley Act – Attached hereto as Exhibit EX-99.906CERT. |
SIGNATURES
Pursuant to the requirements of the Securities Exchange Act of 1934 and the Investment Company Act of 1940, the registrant has duly caused this report to be signed on its behalf by the undersigned, thereunto duly authorized.
| | |
| Registrant: | | Prudential World Fund, Inc. |
| |
| By: | | /s/ Andrew R. French |
| | Andrew R. French |
| | Secretary |
| |
| Date: | | December 18, 2018 |
Pursuant to the requirements of the Securities Exchange Act of 1934 and the Investment Company Act of 1940, this report has been signed below by the following persons on behalf of the registrant and in the capacities and on the dates indicated.
| | |
| By: | | /s/ Stuart S. Parker |
| | Stuart S. Parker |
| | President and Principal Executive Officer |
| |
| Date: | | December 18, 2018 |
| |
| By: | | /s/ Brian D. Nee |
| | Brian D. Nee |
| | Treasurer and Principal Financial and Accounting Officer |
| |
| Date: | | December 18, 2018 |