UNITED STATES
SECURITIES AND EXCHANGE COMMISSION
Washington, D.C. 20549
FORM N-CSR
CERTIFIED SHAREHOLDER REPORT OF REGISTERED MANAGEMENT INVESTMENT COMPANIES
| | |
| Investment Company Act file number: | | 811-03981 |
| |
| Exact name of registrant as specified in charter: | | Prudential World Fund, Inc. |
| |
| Address of principal executive offices: | | 655 Broad Street, 17th Floor |
| | Newark, New Jersey 07102 |
| |
| Name and address of agent for service: | | Andrew R. French |
| | 655 Broad Street, 17th Floor |
| | Newark, New Jersey 07102 |
| |
| Registrant’s telephone number, including area code: | | 800-225-1852 |
| |
| Date of fiscal year end: | | 10/31/2020 |
| |
| Date of reporting period: | | 10/31/2020 |
Item 1 – Reports to Stockholders

PGIM QMA INTERNATIONAL EQUITY FUND
ANNUAL REPORT
OCTOBER 31, 2020
COMING SOON: PAPERLESS SHAREHOLDER REPORTS
Beginning on January 1, 2021, as permitted by regulations adopted by the Securities and Exchange Commission, paper copies of the Fund’s annual and semiannual shareholder reports will no longer be sent by mail, unless you specifically request paper copies of the reports. Instead, the reports will be made available on the Fund’s website (pgim.com/investments), and you will be notified by mail each time a report is posted and provided with a website link to access the report.
If you already elected to receive shareholder reports electronically, you will not be affected by this change and you need not take any action. You may elect to receive shareholder reports and other communications from the Fund electronically anytime by contacting your financial intermediary (such as a broker-dealer or bank) or, if you are a direct investor, by calling 1-800-225-1852 or by sending an email request to PGIM Investments at shareholderreports@pgim.com.
You may elect to receive all future reports in paper free of charge. If you invest through a financial intermediary, you can contact your financial intermediary to elect to continue to receive paper copies of your shareholder reports. If you invest directly with the Fund, you can call 1-800-225-1852 or send an email request to shareholderreports@pgim.com to let the Fund know you wish to continue receiving paper copies of your shareholder reports. Your election to receive reports in paper will apply to all funds held in your account if you invest through your financial intermediary or all funds held with the fund complex if you invest directly with the Fund.

To enroll in e-delivery, go to pgim.com/investments/resource/edelivery
Table of Contents
This report is not authorized for distribution to prospective investors unless preceded or accompanied by a current prospectus.
The views expressed in this report and information about the Fund’s portfolio holdings are for the period covered by this report and are subject to change thereafter.
Mutual funds are distributed by Prudential Investment Management Services LLC, a Prudential Financial company, member SIPC. QMA is the primary business name of QMA LLC, a wholly owned subsidiary of PGIM, Inc. (PGIM), a Prudential Financial company. © 2020 Prudential Financial, Inc. and its related entities. PGIM and the PGIM logo are service marks of Prudential Financial, Inc. and its related entities, registered in many jurisdictions worldwide.
Effective June 26, 2020, all of the issued and outstanding Class B shares of the Fund converted into Class A shares.
| | |
| 2 | | Visit our website at pgim.com/investments |
Letter from the President

Dear Shareholder:
We hope you find the annual report for the PGIM QMA International Equity Fund informative and useful. The report covers performance for the 12-month period that ended October 31, 2020.
During the first four months of the period, the global economy remained healthy—particularly in the US—fueled by rising corporate profits and strong job growth. The outlook changed dramatically in March as the coronavirus outbreak quickly and substantially shut down economic activity worldwide, leading to significant job losses and a steep decline in global growth and earnings. Responding to this disruption, the Federal Reserve (the Fed) cut the federal funds rate target to near zero and flooded capital markets with liquidity; and Congress passed stimulus bills worth approximately $3 trillion that offered an economic lifeline to consumers and businesses.
While stocks climbed throughout the first four months of the period, they fell significantly in March amid a spike in volatility, ending the 11-year-long equity bull market. With stores and factories closing and consumers staying at home to limit the spread of the virus, investors sold stocks on fears that corporate earnings would take a serious hit. Equities rallied around the globe throughout the spring and summer as states reopened their economies, but became more volatile during the last two months of the period as investors worried that a surge in coronavirus infections would stall the economic recovery. For the period overall, large-cap US and emerging market stocks rose, small-cap US stocks were virtually unchanged, and stocks in developed foreign markets declined.
The bond market overall—including US and global bonds as well as emerging market debt—rose during the period as investors sought safety in fixed income. A significant rally in interest rates pushed the 10-year US Treasury yield down to a record low. In March, the Fed took several aggressive actions to keep the bond markets running smoothly, restarting many of the relief programs that proved to be successful in helping end the global financial crisis in 2008-09.
Regarding your investments with PGIM, we believe it is important to maintain a diversified portfolio of funds consistent with your tolerance for risk, time horizon, and financial goals. Your financial advisor can help you create a diversified investment plan that may include funds covering all the basic asset classes and that reflects your personal investor profile and risk tolerance. However, diversification and asset allocation strategies do not assure a profit or protect against loss in declining markets.
At PGIM Investments, we consider it a great privilege and responsibility to help investors participate in opportunities across global markets while meeting their toughest investment challenges. PGIM is a top-10 global investment manager with more than $1 trillion in assets under management. This scale and investment expertise allow us to deliver actively managed funds and strategies to meet the needs of investors around the globe.
Thank you for choosing our family of funds.
Sincerely,

Stuart S. Parker, President
PGIM QMA International Equity Fund
December 15, 2020
| | | | |
PGIM QMA International Equity Fund | | | 3 | |
Your Fund’s Performance (unaudited)
Performance data quoted represents past performance. Past performance does not guarantee future results. The investment return and principal value of an investment will fluctuate, so that an investor’s shares, when redeemed, may be worth more or less than their original cost. Current performance may be lower or higher than the past performance data quoted. An investor may obtain performance data as of the most recent month-end by visiting our website at pgim.com/investments or by calling (800) 225-1852.
| | | | | | | | |
| |
| | | Average Annual Total Returns as of 10/31/20 |
| | | One Year (%) | | Five Years (%) | | Ten Years (%) | | Since Inception (%) |
| Class A | | | | | | | | |
| (with sales charges) | | –9.35 | | 1.33 | | 2.48 | | — |
| (without sales charges) | | –4.07 | | 2.48 | | 3.06 | | — |
| Class C | | | | | | | | |
| (with sales charges) | | –6.35 | | 1.61 | | 2.25 | | — |
| (without sales charges) | | –5.42 | | 1.61 | | 2.25 | | — |
| Class Z | | | | | | | | |
| (without sales charges) | | –3.61 | | 2.88 | | 3.40 | | — |
| Class R6 | | | | | | | | |
| (without sales charges) | | –3.26 | | N/A | | N/A | | 4.47 (12/28/16) |
| MSCI All Country World ex-US Index |
| | | –2.61 | | 4.26 | | 3.43 | | — |
| | |
|
| Average Annual Total Returns as of 10/31/20 Since Inception (%) |
| | | Class R6 (12/28/16) |
| MSCI All Country World ex-US Index | | 5.48 |
Since Inception returns are provided for any share class with less than 10 fiscal years of returns. Since Inception returns for the Index are measured from the closest month-end to the class’ inception date.
| | |
| 4 | | Visit our website at pgim.com/investments |
Growth of a $10,000 Investment (unaudited)
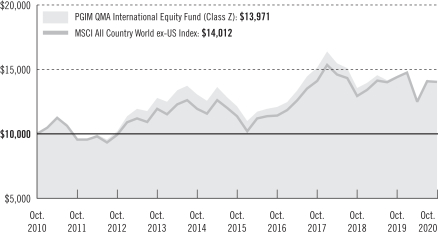
The graph compares a $10,000 investment in the Fund’s Class Z shares with a similar investment in the MSCI All Country World ex-US Index by portraying the initial account values at the beginning of the 10-year period for Class Z shares (October 31, 2010) and the account values at the end of the current fiscal year (October 31, 2020) as measured on a quarterly basis. For purposes of the graph, and unless otherwise indicated, it has been assumed that (a) all recurring fees (including management fees) were deducted; and (b) all dividends and distributions were reinvested. The line graph provides information for Class Z shares only. As indicated in the tables provided earlier, performance for other share classes will vary due to the differing fees and expenses applicable to each share class (as indicated in the following paragraphs). Without waiver of fees and/or expense reimbursements, if any, the Fund’s returns would have been lower.
Past performance does not predict future performance. Total returns and the ending account values in the graph include changes in share price and reinvestment of dividends and capital gains distributions in a hypothetical investment for the periods shown. The Fund’s total returns do not reflect the deduction of income taxes on an individual’s investment. Taxes may reduce your actual investment returns on income or gains paid by the Fund or any gains you may realize if you sell your shares.
| | | | |
PGIM QMA International Equity Fund | | | 5 | |
Your Fund’s Performance (continued)
The returns in the tables do not reflect the deduction of taxes that a shareholder would pay on Fund distributions or following the redemption of Fund shares. The average annual total returns take into account applicable sales charges, which are described for each share class in the table below.
| | | | | | | | |
| | | | | |
| | | Class A | | Class C | | Class Z | | Class R6 |
| Maximum initial sales charge | | 5.50% of the public offering price | | None | | None | | None |
Contingent deferred sales charge (CDSC) (as a percentage of the lower of the original purchase
price or the net asset value at redemption) | | 1.00% on sales of $1 million or more made within 12 months of purchase | | 1.00% on sales made within 12 months of purchase | | None | �� | None |
Annual distribution and service (12b-1) fees
(shown as a percentage of average daily net assets) | | 0.30% | | 1.00% | | None | | None |
Benchmark Definitions
MSCI All Country World ex-US Index—The Morgan Stanley Capital International All Country World ex-US (MSCI ACWI Ex-US) Index is an unmanaged, market-capitalization weighted index designed to provide a broad measure of stock performance throughout the world, with the exception of US based companies. The MSCI ACWI Ex-US Index includes both developed and emerging markets.
Investors cannot invest directly in an index. The returns for the Index would be lower if they included the effects of sales charges, operating expenses of a mutual fund, or taxes that may be paid by an investor.
| | |
| 6 | | Visit our website at pgim.com/investments |
Presentation of Fund Holdings as of 10/31/20
| | | | | | |
| | | |
| Ten Largest Holdings | | Line of Business | | Country | | % of Net Assets |
| Alibaba Group Holding Ltd., ADR | | Internet & Direct Marketing Retail | | China | | 3.4% |
| iShares MSCI EAFE ETF | | Exchange Traded Funds | | United States | | 2.2% |
| Novartis AG | | Pharmaceuticals | | Switzerland | | 1.4% |
| Roche Holding AG | | Pharmaceuticals | | Switzerland | | 1.4% |
| Tencent Holdings Ltd. | | Interactive Media & Services | | China | | 1.4% |
| Taiwan Semiconductor Manufacturing Co. Ltd. | | Semiconductors & Semiconductor Equipment | | Taiwan | | 1.2% |
| Sony Corp. | | Household Durables | | Japan | | 1.2% |
| Nestle SA | | Food Products | | Switzerland | | 1.1% |
| Sanofi | | Pharmaceuticals | | France | | 1.0% |
| Canadian Pacific Railway Ltd. | | Road & Rail | | Canada | | 0.9% |
Holdings reflect only long-term investments and are subject to change.
| | | | |
PGIM QMA International Equity Fund | | | 7 | |
Strategy and Performance Overview (unaudited)
How did the Fund perform?
The PGIM QMA International Equity Fund’s Class Z shares returned -3.61% in the 12-month reporting period that ended October 31, 2020, underperforming the -2.61% return of the MSCI All Country World ex-US Index (the Index).
What were the market conditions?
| | • | | The reporting period was dominated by the proliferation of COVID-19 infections that began in early 2020. While economists continue to debate the shape of the economic recovery, it clearly has been V-shaped in global equity markets, with many markets fully erasing losses from the severe decline in March 2020 by period-end. (A V-shaped recovery refers to a sharp rise back to previous measures of economic performance after a downturn.) |
| | • | | However, performance among equity market segments was divergent during the period. For example, China’s economy bounced back sooner than the rest of the world, as the country’s draconian lockdown was highly effective at curbing the spread of the virus in February. As a result, China’s economy suffered less damage and is likely to post positive growth for 2020. |
| | • | | In international developed markets, information technology was the best-performing sector during the period, gaining about 30%, while energy stocks fared the worst, declining almost 30%. |
| | • | | Growth significantly outperformed value over the period. Geographically, US stocks outpaced non-US developed markets and emerging markets. Nonetheless, by period-end there were already signs that growth was slowing, as uncertainty remained over when the global economy would resume pre-COVID-19 levels of economic activity. |
What worked?
| | • | | Growth and quality measures contributed to the Fund’s performance, particularly among the high-growth information technology holdings across Taiwan, China, and Japan. |
| | • | | High-quality consumer discretionary positions in China and Sweden, along with Taiwanese communication services holdings, furthered gains. |
What didn’t work?
| | • | | The Fund’s investments in relatively inexpensive stocks offset the gains, and the shortfall was particularly significant given that expensive stocks by far outperformed cheaper stocks over the period. |
| | • | | Thus, favoring cheap Brazilian and United Kingdom financial stocks as well as UK-based healthcare companies was particularly detrimental to performance. |
| | |
| 8 | | Visit our website at pgim.com/investments |
Did the Fund use derivatives?
The Fund did not hold futures during the period. However, the Fund may invest in futures, including for the ease of cash management.
Current outlook
| | • | | QMA believes the current market is crowded and not sustainable, and that diversification and the Fund’s investment strategy should prevail as markets normalize and move past fear and uncertainty. Specifically, QMA sees a correction in the extremely high valuations of the momentum-driven stocks responsible for much of the market’s returns during the period, coupled with the recovery of fundamentals and valuations among cheaper stocks with very high relative and nominal earnings and book-value yields. |
| | • | | While the pathway and timing of events leading to this reversion is hard to predict, QMA views the eventual neutralization of the COVID-19 pandemic as a key catalyst in bringing more balance to the equity markets, an environment where QMA’s strategies have historically performed well. |
| | • | | In QMA’s view, the biggest risk appears to be political, as the results of the US presidential election, particularly if contested or prolonged, and new policies from the subsequent administration could prove disruptive to the US and global economy. |
| | | | |
PGIM QMA International Equity Fund | | | 9 | |
Fees and Expenses (unaudited)
As a shareholder of the Fund, you incur two types of costs: (1) transaction costs, including sales charges (loads) on purchase payments and redemptions, as applicable, and (2) ongoing costs, including management fees, distribution, and/or service (12b-1) fees, and other Fund expenses, as applicable. This example is intended to help you understand your ongoing costs (in dollars) of investing in the Fund and to compare these costs with the ongoing costs of investing in other mutual funds.
The example is based on an investment of $1,000 held through the six-month period ended October 31, 2020. The example is for illustrative purposes only; you should consult the Fund’s Prospectus for information on initial and subsequent minimum investment requirements.
Actual Expenses
The first line for each share class in the table on the following page provides information about actual account values and actual expenses. You may use the information on this line, together with the amount you invested, to estimate the expenses that you paid over the period. Simply divide your account value by $1,000 (for example, an $8,600 account value ÷ $1,000 = 8.6), then multiply the result by the number on the first line under the heading “Expenses Paid During the Six-Month Period” to estimate the expenses you paid on your account during this period.
Hypothetical Example for Comparison Purposes
The second line for each share class in the table on the following page provides information about hypothetical account values and hypothetical expenses based on the Fund’s actual expense ratio and an assumed rate of return of 5% per year before expenses, which is not the Fund’s actual return. The hypothetical account values and expenses may not be used to estimate the actual ending account balance or expenses you paid for the period. You may use this information to compare the ongoing costs of investing in the Fund and other funds. To do so, compare this 5% hypothetical example with the 5% hypothetical examples that appear in the shareholder reports of the other funds.
The Fund’s transfer agent may charge additional fees to holders of certain accounts that are not included in the expenses shown in the table on the following page. These fees apply to individual retirement accounts (IRAs) and Section 403(b) accounts. As of the close of the six-month period covered by the table, IRA fees included an annual maintenance fee of $15 per account (subject to a maximum annual maintenance fee of $25 for all accounts held by the same shareholder). Section 403(b) accounts are charged an annual $25 fiduciary maintenance fee. Some of the fees may vary in amount, or may be waived, based on your total account balance or the number of PGIM funds, including the Fund, that you own. You should consider the additional fees that were charged to your Fund account over the six-month period when you estimate the total ongoing expenses paid over the period
| | |
| 10 | | Visit our website at pgiminvestments.com |
and the impact of these fees on your ending account value, as these additional expenses are not reflected in the information provided in the expense table. Additional fees have the effect of reducing investment returns.
Please note that the expenses shown in the table are meant to highlight your ongoing costs only and do not reflect any transactional costs such as sales charges (loads). Therefore, the second line for each share class in the table is useful in comparing ongoing costs only and will not help you determine the relative total costs of owning different funds. In addition, if these transactional costs were included, your costs would have been higher.
| | | | | | | | | | | | | | | | | | |
| | | | |
PGIM QMA
International
Equity Fund | | Beginning Account
Value
May 1, 2020 | | | Ending Account
Value
October 31, 2020 | | | Annualized
Expense Ratio
Based on the
Six-Month Period | | | Expenses Paid
During the
Six-Month Period* | |
| Class A | | Actual | | $ | 1,000.00 | | | $ | 1,119.60 | | | | 1.49 | % | | $ | 7.94 | |
| | Hypothetical | | $ | 1,000.00 | | | $ | 1,017.65 | | | | 1.49 | % | | $ | 7.56 | |
| Class C | | Actual | | $ | 1,000.00 | | | $ | 1,111.50 | | | | 2.93 | % | | $ | 15.55 | |
| | Hypothetical | | $ | 1,000.00 | | | $ | 1,010.41 | | | | 2.93 | % | | $ | 14.81 | |
| Class Z | | Actual | | $ | 1,000.00 | | | $ | 1,121.90 | | | | 1.11 | % | | $ | 5.92 | |
| | Hypothetical | | $ | 1,000.00 | | | $ | 1,019.56 | | | | 1.11 | % | | $ | 5.63 | |
| Class R6 | | Actual | | $ | 1,000.00 | | | $ | 1,125.20 | | | | 0.79 | % | | $ | 4.22 | |
| | | Hypothetical | | $ | 1,000.00 | | | $ | 1,021.17 | | | | 0.79 | % | | $ | 4.01 | |
*Fund expenses (net of fee waivers or subsidies, if any) for each share class are equal to the annualized expense ratio for each share class (provided in the table), multiplied by the average account value over the period, multiplied by the 184 days in the six-month period ended October 31, 2020, and divided by the 366 days in the Fund’s fiscal year ended October 31, 2020 (to reflect the six-month period). Expenses presented in the table include the expenses of any underlying portfolios in which the Fund may invest.
| | | | |
PGIM QMA International Equity Fund | | | 11 | |
Schedule of Investments
as of October 31, 2020
| | | | | | | | |
| Description | | Shares | | | Value | |
| | |
| LONG-TERM INVESTMENTS 99.4% | | | | | | |
| | |
| COMMON STOCKS 96.0% | | | | | | |
| | |
| Australia 4.3% | | | | | | |
Ansell Ltd. | | | 4,556 | | | $ | 128,580 | |
BHP Group Ltd. | | | 25,194 | | | | 598,408 | |
BHP Group PLC | | | 28,452 | | | | 550,746 | |
Charter Hall Group, REIT | | | 30,080 | | | | 260,759 | |
Data#3 Ltd. | | | 22,178 | | | | 97,240 | |
Fortescue Metals Group Ltd. | | | 112,076 | | | | 1,365,026 | |
Goodman Group, REIT | | | 101,567 | | | | 1,313,173 | |
JB Hi-Fi Ltd. | | | 7,668 | | | | 255,671 | |
Magellan Financial Group Ltd. | | | 28,292 | | | | 1,091,909 | |
Newcrest Mining Ltd. | | | 8,656 | | | | 178,230 | |
Platinum Asset Management Ltd. | | | 114,496 | | | | 244,488 | |
Rio Tinto Ltd. | | | 3,508 | | | | 227,895 | |
Rio Tinto PLC | | | 25,628 | | | | 1,446,555 | |
Stockland, REIT | | | 26,500 | | | | 71,596 | |
| | | | | | | | |
| | |
| | | | | | | 7,830,276 | |
| | |
| Belgium 0.9% | | | | | | |
Ageas SA/NV | | | 7,432 | | | | 300,109 | |
Etablissements Franz Colruyt NV | | | 2,145 | | | | 126,858 | |
Euronav NV | | | 89,772 | | | | 659,361 | |
Groupe Bruxelles Lambert SA | | | 2,624 | | | | 215,053 | |
Telenet Group Holding NV | | | 3,535 | | | | 135,982 | |
Tessenderlo Group SA* | | | 5,574 | | | | 189,870 | |
| | | | | | | | |
| | |
| | | | | | | 1,627,233 | |
| | |
| Brazil 2.1% | | | | | | |
B3 SA - Brasil Bolsa Balcao | | | 15,000 | | | | 132,826 | |
Banco do Brasil SA | | | 173,400 | | | | 899,041 | |
Banco Santander Brasil SA, UTS | | | 130,900 | | | | 727,735 | |
Cia de Saneamento do Parana, UTS | | | 54,900 | | | | 226,663 | |
Petroleo Brasileiro SA | | | 33,100 | | | | 109,661 | |
Vale SA | | | 32,100 | | | | 337,618 | |
WEG SA | | | 99,300 | | | | 1,313,513 | |
Wiz Solucoes e Corretagem de Seguros SA | | | 44,000 | | | | 69,168 | |
| | | | | | | | |
| | |
| | | | | | | 3,816,225 | |
| | |
| Canada 6.4% | | | | | | |
Alimentation Couche-Tard, Inc. (Class B Stock) | | | 10,600 | | | | 326,441 | |
B2Gold Corp. | | | 47,400 | | | | 304,900 | |
Bank of Montreal | | | 5,400 | | | | 321,536 | |
See Notes to Financial Statements.
| | | | |
PGIM QMA International Equity Fund | | | 13 | |
Schedule of Investments (continued)
as of October 31, 2020
| | | | | | | | |
| Description | | Shares | | | Value | |
| | |
| COMMON STOCKS (Continued) | | | | | | |
| | |
| Canada (cont’d.) | | | | | | |
Canadian National Railway Co. | | | 1,200 | | | $ | 119,207 | |
Canadian Natural Resources Ltd. | | | 22,600 | | | | 359,619 | |
Canadian Pacific Railway Ltd. | | | 5,300 | | | | 1,583,834 | |
CI Financial Corp. | | | 5,400 | | | | 62,945 | |
DREAM Unlimited Corp. (Class A Stock) | | | 7,500 | | | | 99,415 | |
Great-West Lifeco, Inc. | | | 49,300 | | | | 1,004,650 | |
Home Capital Group, Inc.* | | | 8,400 | | | | 153,398 | |
Loblaw Cos. Ltd. | | | 1,600 | | | | 79,646 | |
Magna International, Inc. | | | 23,600 | | | | 1,205,065 | |
Manulife Financial Corp. | | | 86,100 | | | | 1,167,129 | |
Metro Inc. | | | 2,300 | | | | 107,292 | |
National Bank of Canada | | | 20,900 | | | | 1,003,037 | |
North West Co., Inc. (The) | | | 12,500 | | | | 308,208 | |
Quebecor, Inc. (Class B Stock) | | | 3,100 | | | | 71,921 | |
Restaurant Brands International, Inc. | | | 1,200 | | | | 62,355 | |
Ritchie Bros. Auctioneers, Inc. | | | 1,100 | | | | 66,679 | |
Royal Bank of Canada | | | 5,700 | | | | 398,568 | |
Sun Life Financial, Inc. | | | 34,200 | | | | 1,360,761 | |
TC Energy Corp. | | | 24,100 | | | | 948,588 | |
TFI International, Inc. | | | 8,300 | | | | 369,553 | |
Thomson Reuters Corp. | | | 1,600 | | | | 124,392 | |
| | | | | | | | |
| | |
| | | | | | | 11,609,139 | |
| | |
| Chile 0.4% | | | | | | |
AES Gener SA | | | 1,902,787 | | | | 295,273 | |
Engie Energia Chile SA | | | 336,716 | | | | 354,438 | |
| | | | | | | | |
| | |
| | | | | | | 649,711 | |
| | |
| China 13.6% | | | | | | |
Alibaba Group Holding Ltd., ADR* | | | 20,200 | | | | 6,154,738 | |
Anhui Conch Cement Co. Ltd. (Class H Stock) | | | 143,000 | | | | 895,707 | |
Bank of Beijing Co. Ltd. (Class A Stock) | | | 143,900 | | | | 100,385 | |
Bank of Communications Co. Ltd. (Class H Stock) | | | 1,627,000 | | | | 803,081 | |
Bank of Jiangsu Co. Ltd. (Class A Stock) | | | 86,000 | | | | 77,270 | |
Bank of Shanghai Co. Ltd. (Class A Stock) | | | 64,900 | | | | 76,126 | |
BOC Hong Kong Holdings Ltd. | | | 63,500 | | | | 177,046 | |
China Construction Bank Corp. (Class H Stock) | | | 844,000 | | | | 584,779 | |
China Life Insurance Co. Ltd. (Class H Stock) | | | 474,000 | | | | 1,033,381 | |
China Minsheng Banking Corp. Ltd. (Class H Stock) | | | 1,521,000 | | | | 833,919 | |
China Mobile Ltd. | | | 153,000 | | | | 934,661 | |
China National Building Material Co. Ltd. (Class H Stock) | | | 72,000 | | | | 82,844 | |
China Overseas Land & Investment Ltd. | | | 29,000 | | | | 72,966 | |
China Resources Cement Holdings Ltd. | | | 216,000 | | | | 283,595 | |
See Notes to Financial Statements.
| | | | | | | | |
| Description | | Shares | | | Value | |
| | |
| COMMON STOCKS (Continued) | | | | | | |
| | |
| China (cont’d.) | | | | | | |
China Resources Power Holdings Co. Ltd. | | | 330,000 | | | $ | 343,794 | |
China Unicom Hong Kong Ltd. | | | 1,468,000 | | | | 905,891 | |
CNOOC Ltd. | | | 495,000 | | | | 452,775 | |
COSCO SHIPPING Energy Transportation Co. Ltd. (Class H Stock) | | | 544,000 | | | | 214,353 | |
Country Garden Services Holdings Co. Ltd. | | | 175,000 | | | | 1,102,622 | |
Eve Energy Co. Ltd. (Class A Stock) | | | 13,200 | | | | 105,020 | |
Greenland Holdings Corp. Ltd. (Class A Stock) | | | 80,600 | | | | 74,543 | |
Hengan International Group Co. Ltd. | | | 132,500 | | | | 922,981 | |
Hunan Valin Steel Co. Ltd. (Class A Stock) | | | 94,000 | | | | 71,378 | |
Industrial & Commercial Bank of China Ltd. (Class H Stock) | | | 372,000 | | | | 209,863 | |
JD.com, Inc., ADR* | | | 7,300 | | | | 595,096 | |
Jiangsu Hengli Hydraulic Co. Ltd. (Class A Stock) | | | 10,800 | | | | 122,402 | |
Jiangsu Yuyue Medical Equipment & Supply Co. Ltd. (Class A Stock) | | | 14,700 | | | | 67,927 | |
Jinke Properties Group Co. Ltd. (Class A Stock) | | | 65,000 | | | | 75,285 | |
Lens Technology Co. Ltd. (Class A Stock) | | | 22,400 | | | | 111,028 | |
LONGi Green Energy Technology Co. Ltd. (Class A Stock) | | | 10,700 | | | | 121,852 | |
Luxshare Precision Industry Co. Ltd. (Class A Stock) | | | 14,139 | | | | 115,682 | |
Metallurgical Corp. of China Ltd. (Class A Stock) | | | 197,400 | | | | 76,435 | |
Muyuan Foods Co. Ltd. (Class A Stock) | | | 9,000 | | | | 95,370 | |
NetEase, Inc., ADR | | | 7,300 | | | | 633,567 | |
NIO, Inc., ADR* | | | 8,900 | | | | 272,162 | |
Offcn Education Technology Co. Ltd. (Class A Stock) | | | 16,800 | | | | 99,414 | |
Poly Developments & Holdings Group Co. Ltd. (Class A Stock) | | | 53,900 | | | | 123,574 | |
Sany Heavy Industry Co. Ltd. (Class A Stock) | | | 35,500 | | | | 138,039 | |
SF Holding Co. Ltd. (Class A Stock) | | | 8,600 | | | | 106,494 | |
Shaanxi Coal Industry Co. Ltd. (Class A Stock) | | | 72,900 | | | | 95,311 | |
Shanghai Pudong Development Bank Co. Ltd. (Class A Stock) | | | 67,200 | | | | 92,973 | |
Shenzhen Mindray Bio-Medical Electronics Co. Ltd. (Class A Stock) | | | 1,700 | | | | 98,456 | |
Shenzhou International Group Holdings Ltd. | | | 7,200 | | | | 125,543 | |
Shimao Group Holdings Ltd. | | | 161,000 | | | | 571,084 | |
Sinotruk Hong Kong Ltd. | | | 150,000 | | | | 384,666 | |
Tencent Holdings Ltd. | | | 32,600 | | | | 2,483,896 | |
Wens Foodstuffs Group Co. Ltd. (Class A Stock) | | | 23,640 | | | | 67,004 | |
Wilmar International Ltd. | | | 353,600 | | | | 1,048,169 | |
Wuhu Sanqi Interactive Entertainment Network Technology Group Co. Ltd. (Class A Stock) | | | 17,100 | | | | 75,508 | |
Yum China Holdings, Inc. | | | 3,200 | | | | 170,336 | |
Zhejiang Dingli Machinery Co. Ltd. (Class A Stock) | | | 5,800 | | | | 79,181 | |
Zoomlion Heavy Industry Science & Technology Co. Ltd. (Class A Stock) | | | 119,000 | | | | 131,864 | |
| | | | | | | | |
| | |
| | | | | | | 24,692,036 | |
See Notes to Financial Statements.
| | | | |
PGIM QMA International Equity Fund | | | 15 | |
Schedule of Investments (continued)
as of October 31, 2020
| | | | | | | | |
| Description | | Shares | | | Value | |
| | |
| COMMON STOCKS (Continued) | | | | | | |
| | |
| Colombia 0.2% | | | | | | |
Ecopetrol SA | | | 926,048 | | | $ | 427,571 | |
| | |
| Denmark 0.8% | | | | | | |
AP Moller - Maersk A/S (Class B Stock) | | | 52 | | | | 83,518 | |
D/S Norden A/S | | | 23,771 | | | | 337,285 | |
Jyske Bank A/S* | | | 5,203 | | | | 155,115 | |
Scandinavian Tobacco Group A/S, 144A | | | 56,090 | | | | 793,672 | |
| | | | | | | | |
| | |
| | | | | | | 1,369,590 | |
| | |
| Finland 1.5% | | | | | | |
Fortum OYJ | | | 39,865 | | | | 750,530 | |
Kone OYJ (Class B Stock) | | | 13,886 | | | | 1,103,366 | |
Neste OYJ | | | 18,559 | | | | 966,146 | |
| | | | | | | | |
| | |
| | | | | | | 2,820,042 | |
| | |
| France 4.8% | | | | | | |
Bouygues SA | | | 2,040 | | | | 66,903 | |
Cie de Saint-Gobain* | | | 28,092 | | | | 1,097,901 | |
Cie Generale des Etablissements Michelin SCA | | | 680 | | | | 73,414 | |
Fnac Darty SA* | | | 10,825 | | | | 465,113 | |
Klepierre SA, REIT(a) | | | 47,528 | | | | 603,228 | |
La Francaise des Jeux SAEM, 144A | | | 1,960 | | | | 73,581 | |
LVMH Moet Hennessy Louis Vuitton SE | | | 316 | | | | 148,127 | |
Mercialys SA, REIT | | | 36,506 | | | | 175,238 | |
Orange SA | | | 87,270 | | | | 978,621 | |
Peugeot SA* | | | 55,066 | | | | 990,370 | |
Sanofi | | | 19,639 | | | | 1,772,612 | |
Sartorius Stedim Biotech | | | 2,039 | | | | 774,144 | |
Schneider Electric SE | | | 4,682 | | | | 569,177 | |
Solutions 30 SE* | | | 4,242 | | | | 75,577 | |
Television Francaise 1* | | | 18,420 | | | | 108,278 | |
TOTAL SE | | | 3,502 | | | | 105,761 | |
Trigano SA | | | 3,561 | | | | 472,818 | |
Virbac SA* | | | 375 | | | | 87,314 | |
| | | | | | | | |
| | |
| | | | | | | 8,638,177 | |
| | |
| Germany 4.7% | | | | | | |
Brenntag AG | | | 15,844 | | | | 1,011,976 | |
CropEnergies AG | | | 22,129 | | | | 300,962 | |
Daimler AG | | | 6,930 | | | | 358,315 | |
Deutsche Post AG | | | 28,593 | | | | 1,266,101 | |
Deutsche Telekom AG | | | 47,762 | | | | 728,013 | |
See Notes to Financial Statements.
| | | | | | | | |
| Description | | Shares | | | Value | |
| | |
| COMMON STOCKS (Continued) | | | | | | |
| | |
| Germany (cont’d.) | | | | | | |
Deutsche Wohnen SE | | | 23,336 | | | $ | 1,177,343 | |
Fresenius Medical Care AG & Co. KGaA | | | 13,059 | | | | 997,743 | |
Fresenius SE & Co. KGaA | | | 23,856 | | | | 886,293 | |
HelloFresh SE* | | | 17,424 | | | | 932,373 | |
Henkel AG & Co. KGaA | | | 1,391 | | | | 125,693 | |
Hornbach Holding AG & Co. KGaA | | | 6,458 | | | | 621,991 | |
Vonovia SE | | | 1,870 | | | | 119,269 | |
Zalando SE, 144A* | | | 1,056 | | | | 98,672 | |
| | | | | | | | |
| | |
| | | | | | | 8,624,744 | |
| | |
| Greece 0.1% | | | | | | |
Hellenic Telecommunications Organization SA | | | 5,003 | | | | 66,654 | |
JUMBO SA | | | 8,328 | | | | 115,979 | |
| | | | | | | | |
| | |
| | | | | | | 182,633 | |
| | |
| Hong Kong 1.9% | | | | | | |
CK Infrastructure Holdings Ltd. | | | 165,500 | | | | 779,769 | |
Hong Kong Exchanges & Clearing Ltd. | | | 4,800 | | | | 230,584 | |
K Wah International Holdings Ltd. | | | 239,000 | | | | 113,223 | |
Man Wah Holdings Ltd. | | | 509,600 | | | | 710,354 | |
Techtronic Industries Co. Ltd. | | | 64,000 | | | | 860,545 | |
Vinda International Holdings Ltd. | | | 126,000 | | | | 333,960 | |
VTech Holdings Ltd. | | | 16,000 | | | | 106,487 | |
WH Group Ltd., 144A | | | 402,500 | | | | 317,754 | |
| | | | | | | | |
| | |
| | | | | | | 3,452,676 | |
| | |
| India 2.4% | | | | | | |
Balrampur Chini Mills Ltd. | | | 233,793 | | | | 508,074 | |
EID Parry India Ltd.* | | | 37,771 | | | | 140,967 | |
GAIL India Ltd. | | | 618,731 | | | | 708,073 | |
HCL Technologies Ltd. | | | 58,320 | | | | 663,031 | |
Infosys Ltd. | | | 65,873 | | | | 943,069 | |
Power Grid Corp. of India Ltd. | | | 146,206 | | | | 336,878 | |
Wipro Ltd. | | | 230,120 | | | | 1,055,942 | |
| | | | | | | | |
| | |
| | | | | | | 4,356,034 | |
| | |
| Indonesia 0.1% | | | | | | |
Bank Mandiri Persero Tbk PT | | | 204,000 | | | | 79,711 | |
Gudang Garam Tbk PT* | | | 30,000 | | | | 83,997 | |
| | | | | | | | |
| | |
| | | | | | | 163,708 | |
See Notes to Financial Statements.
| | | | |
PGIM QMA International Equity Fund | | | 17 | |
Schedule of Investments (continued)
as of October 31, 2020
| | | | | | | | |
| Description | | Shares | | | Value | |
| | |
| COMMON STOCKS (Continued) | | | | | | |
| | |
| Ireland 0.1% | | | | | | |
Kingspan Group PLC* | | | 1,320 | | | $ | 115,028 | |
| | |
| Israel 0.6% | | | | | | |
Check Point Software Technologies Ltd.* | | | 10,400 | | | | 1,181,024 | |
| | |
| Italy 0.7% | | | | | | |
Buzzi Unicem SpA | | | 34,827 | | | | 754,703 | |
De’ Longhi SpA* | | | 5,664 | | | | 181,648 | |
Intesa Sanpaolo SpA* | | | 126,098 | | | | 208,954 | |
Sesa SpA* | | | 1,330 | | | | 125,201 | |
| | | | | | | | |
| | |
| | | | | | | 1,270,506 | |
| | |
| Japan 15.1% | | | | | | |
77 Bank Ltd. (The) | | | 39,400 | | | | 549,086 | |
Astellas Pharma, Inc. | | | 23,100 | | | | 317,569 | |
Chubu Electric Power Co., Inc. | | | 6,100 | | | | 68,329 | |
Chugai Pharmaceutical Co. Ltd. | | | 10,800 | | | | 416,011 | |
EDION Corp. | | | 16,400 | | | | 161,359 | |
Fujimi, Inc. | | | 4,800 | | | | 170,812 | |
Fujitsu Ltd. | | | 10,500 | | | | 1,231,494 | |
IR Japan Holdings Ltd. | | | 1,400 | | | | 155,743 | |
Japan Post Holdings Co. Ltd. | | | 10,500 | | | | 71,881 | |
Japan Post Insurance Co. Ltd. | | | 60,400 | | | | 955,970 | |
Japan Tobacco, Inc. | | | 60,700 | | | | 1,144,862 | |
Kansai Electric Power Co., Inc. (The) | | | 8,300 | | | | 75,606 | |
KDDI Corp. | | | 53,500 | | | | 1,433,215 | |
Kyudenko Corp. | | | 24,500 | | | | 668,820 | |
MCJ Co. Ltd. | | | 82,500 | | | | 757,759 | |
Medipal Holdings Corp. | | | 45,600 | | | | 813,517 | |
Mitsui & Co. Ltd. | | | 68,400 | | | | 1,068,499 | |
Mizuho Financial Group, Inc. | | | 94,990 | | | | 1,168,865 | |
MonotaRO Co. Ltd. | | | 4,200 | | | | 233,433 | |
Nexon Co. Ltd. | | | 37,700 | | | | 1,053,151 | |
Nihon M&A Center, Inc. | | | 1,800 | | | | 105,447 | |
Nintendo Co. Ltd. | | | 2,600 | | | | 1,413,882 | |
Nippon Telegraph & Telephone Corp. | | | 33,068 | | | | 693,939 | |
Nishi-Nippon Financial Holdings, Inc. | | | 10,500 | | | | 70,931 | |
Nitori Holdings Co. Ltd. | | | 5,900 | | | | 1,217,637 | |
Nitto Kogyo Corp. | | | 8,400 | | | | 155,322 | |
Nomura Holdings, Inc. | | | 242,600 | | | | 1,083,542 | |
Ono Pharmaceutical Co. Ltd. | | | 34,000 | | | | 965,419 | |
Orix JREIT, Inc., REIT | | | 50 | | | | 70,149 | |
Otsuka Holdings Co. Ltd. | | | 27,800 | | | | 1,027,840 | |
See Notes to Financial Statements.
| | | | | | | | |
| Description | | Shares | | | Value | |
| | |
| COMMON STOCKS (Continued) | | | | | | |
| | |
| Japan (cont’d.) | | | | | | |
Relia, Inc. | | | 11,400 | | | $ | 129,677 | |
SBS Holdings, Inc. | | | 10,500 | | | | 239,152 | |
Secom Co. Ltd. | | | 6,500 | | | | 548,450 | |
Sekisui House Ltd. | | | 5,800 | | | | 95,983 | |
SG Holdings Co. Ltd. | | | 24,200 | | | | 582,645 | |
Shimano, Inc. | | | 3,200 | | | | 728,443 | |
Shionogi & Co. Ltd. | | | 14,000 | | | | 660,096 | |
SoftBank Corp. | | | 23,200 | | | | 269,081 | |
Sompo Holdings, Inc. | | | 2,100 | | | | 78,357 | |
Sony Corp. | | | 25,200 | | | | 2,097,541 | |
Sumitomo Mitsui Financial Group, Inc. | | | 9,100 | | | | 251,589 | |
T&D Holdings, Inc. | | | 7,500 | | | | 74,825 | |
TOKAI Holdings Corp. | | | 18,000 | | | | 178,259 | |
Tokuyama Corp. | | | 36,800 | | | | 818,205 | |
Tokyo Electron Ltd. | | | 4,100 | | | | 1,094,640 | |
Toyota Motor Corp. | | | 4,333 | | | | 282,400 | |
TPR Co. Ltd. | | | 7,100 | | | | 84,726 | |
| | | | | | | | |
| | |
| | | | | | | 27,534,158 | |
| | |
| Jordan 0.4% | | | | | | |
Hikma Pharmaceuticals PLC | | | 20,865 | | | | 678,297 | |
| | |
| Malaysia 0.9% | | | | | | |
Hartalega Holdings Bhd | | | 108,000 | | | | 469,777 | |
MMC Corp. Bhd | | | 640,200 | | | | 111,516 | |
Top Glove Corp. Bhd | | | 473,300 | | | | 978,375 | |
| | | | | | | | |
| | |
| | | | | | | 1,559,668 | |
| | |
| Malta 0.2% | | | | | | |
Kindred Group PLC, SDR* | | | 53,749 | | | | 410,389 | |
| | |
| Mexico 0.7% | | | | | | |
Concentradora Fibra Danhos SA de CV, REIT | | | 129,649 | | | | 117,110 | |
Grupo Financiero Banorte SAB de CV (Class O Stock)* | | | 20,700 | | | | 92,319 | |
Grupo Financiero Inbursa SAB de CV (Class O Stock)* | | | 100,000 | | | | 74,110 | |
Grupo Mexico SAB de CV (Class B Stock) | | | 80,400 | | | | 229,243 | |
Kimberly-Clark de Mexico SAB de CV (Class A Stock) | | | 543,100 | | | | 811,136 | |
| | | | | | | | |
| | |
| | | | | | | 1,323,918 | |
| | |
| Netherlands 1.7% | | | | | | |
ASML Holding NV | | | 329 | | | | 119,101 | |
Koninklijke Ahold Delhaize NV | | | 54,020 | | | | 1,483,390 | |
See Notes to Financial Statements.
| | | | |
PGIM QMA International Equity Fund | | | 19 | |
Schedule of Investments (continued)
as of October 31, 2020
| | | | | | | | |
| Description | | Shares | | | Value | |
| | |
| COMMON STOCKS (Continued) | | | | | | |
| | |
| Netherlands (cont’d.) | | | | | | |
NN Group NV | | | 28,449 | | | $ | 992,616 | |
Royal Dutch Shell PLC (Class A Stock) | | | 34,824 | | | | 436,639 | |
| | | | | | | | |
| | |
| | | | | | | 3,031,746 | |
| | |
| New Zealand 0.1% | | | | | | |
Fisher & Paykel Healthcare Corp. Ltd. | | | 5,866 | | | | 135,563 | |
| | |
| Norway 0.4% | | | | | | |
DNB ASA* | | | 51,557 | | | | 694,472 | |
Frontline Ltd. | | | 17,746 | | | | 97,946 | |
| | | | | | | | |
| | |
| | | | | | | 792,418 | |
| | |
| Pakistan 0.3% | | | | | | |
Engro Fertilizers Ltd. | | | 397,359 | | | | 159,731 | |
Fauji Fertilizer Co. Ltd. | | | 536,500 | | | | 354,005 | |
| | | | | | | | |
| | |
| | | | | | | 513,736 | |
| | |
| Philippines 0.3% | | | | | | |
PLDT, Inc. | | | 19,475 | | | | 534,590 | |
| | |
| Poland 0.2% | | | | | | |
Asseco Poland SA | | | 15,416 | | | | 250,180 | |
KGHM Polska Miedz SA* | | | 6,040 | | | | 180,486 | |
| | | | | | | | |
| | |
| | | | | | | 430,666 | |
| | |
| Russia 1.1% | | | | | | |
Inter RAO UES PJSC | | | 1,120,000 | | | | 71,581 | |
LUKOIL PJSC | | | 1,387 | | | | 70,765 | |
LUKOIL PJSC, ADR | | | 9,253 | | | | 473,967 | |
Polyus PJSC | | | 459 | | | | 89,976 | |
Sberbank of Russia PJSC | | | 308,530 | | | | 780,612 | |
Surgutneftegas PJSC | | | 1,297,700 | | | | 538,201 | |
| | | | | | | | |
| | |
| | | | | | | 2,025,102 | |
| | |
| Singapore 0.8% | | | | | | |
BW LPG Ltd., 144A | | | 64,915 | | | | 283,530 | |
DBS Group Holdings Ltd. | | | 80,000 | | | | 1,195,418 | |
| | | | | | | | |
| | |
| | | | | | | 1,478,948 | |
See Notes to Financial Statements.
| | | | | | | | |
| Description | | Shares | | | Value | |
| | |
| COMMON STOCKS (Continued) | | | | | | |
| | |
| South Africa 2.1% | | | | | | |
African Rainbow Minerals Ltd. | | | 23,913 | | | $ | 335,161 | |
Anglo American Platinum Ltd. | | | 16,247 | | | | 1,065,601 | |
Anglo American PLC | | | 60,058 | | | | 1,410,216 | |
Impala Platinum Holdings Ltd. | | | 47,172 | | | | 416,910 | |
Kumba Iron Ore Ltd. | | | 20,568 | | | | 610,454 | |
| | | | | | | | |
| | |
| | | | | | | 3,838,342 | |
| | |
| South Korea 4.4% | | | | | | |
BNK Financial Group, Inc. | | | 76,093 | | | | 370,712 | |
DGB Financial Group, Inc. | | | 36,784 | | | | 201,533 | |
Hana Financial Group, Inc. | | | 42,845 | | | | 1,153,326 | |
Hyundai Mobis Co. Ltd. | | | 5,781 | | | | 1,152,012 | |
KB Financial Group, Inc. | | | 18,814 | | | | 668,201 | |
Kia Motors Corp. | | | 29,447 | | | | 1,320,385 | |
Korea Petrochemical Ind Co. Ltd. | | | 959 | | | | 164,787 | |
KT&G Corp. | | | 3,728 | | | | 266,359 | |
LG Innotek Co. Ltd. | | | 4,472 | | | | 602,575 | |
Samsung Electronics Co. Ltd. | | | 21,982 | | | | 1,105,231 | |
Shinhan Financial Group Co. Ltd. | | | 32,870 | | | | 881,590 | |
Taekwang Industrial Co. Ltd. | | | 181 | | | | 113,620 | |
| | | | | | | | |
| | |
| | | | | | | 8,000,331 | |
| | |
| Spain 0.4% | | | | | | |
Iberdrola SA | | | 7,994 | | | | 94,047 | |
Naturgy Energy Group SA | | | 31,072 | | | | 577,669 | |
| | | | | | | | |
| | |
| | | | | | | 671,716 | |
| | |
| Sweden 2.2% | | | | | | |
Atlas Copco AB (Class A Stock) | | | 6,596 | | | | 291,305 | |
Atlas Copco AB (Class B Stock) | | | 3,502 | | | | 134,339 | |
Epiroc AB (Class A Stock) | | | 5,346 | | | | 79,913 | |
Evolution Gaming Group AB, 144A | | | 17,476 | | | | 1,298,256 | |
Husqvarna AB (Class B Stock) | | | 94,240 | | | | 975,315 | |
Investor AB (Class B Stock) | | | 1,200 | | | | 72,196 | |
Svenska Handelsbanken AB (Class A Stock)* | | | 12,774 | | | | 103,811 | |
Swedbank AB (Class A Stock)* | | | 66,058 | | | | 1,035,344 | |
| | | | | | | | |
| | |
| | | | | | | 3,990,479 | |
| | |
| Switzerland 7.8% | | | | | | |
ABB Ltd. | | | 29,253 | | | | 709,531 | |
ALSO Holding AG* | | | 1,126 | | | | 263,771 | |
See Notes to Financial Statements.
| | | | |
PGIM QMA International Equity Fund | | | 21 | |
Schedule of Investments (continued)
as of October 31, 2020
| | | | | | | | |
| Description | | Shares | | | Value | |
| | |
| COMMON STOCKS (Continued) | | | | | | |
| | |
| Switzerland (cont’d.) | | | | | | |
Chocoladefabriken Lindt & Spruengli AG | | | 1 | | | $ | 86,552 | |
Credit Suisse Group AG | | | 109,299 | | | | 1,029,733 | |
Geberit AG | | | 1,494 | | | | 849,088 | |
LafargeHolcim Ltd.* | | | 19,295 | | | | 826,939 | |
Logitech International SA | | | 11,861 | | | | 1,002,433 | |
Nestle SA | | | 17,425 | | | | 1,960,291 | |
Novartis AG | | | 32,514 | | | | 2,534,627 | |
Roche Holding AG | | | 7,835 | | | | 2,521,163 | |
STMicroelectronics NV | | | 36,934 | | | | 1,126,916 | |
UBS Group AG | | | 111,696 | | | | 1,297,467 | |
| | | | | | | | |
| | |
| | | | | | | 14,208,511 | |
| | |
| Taiwan 4.7% | | | | | | |
Asustek Computer, Inc. | | | 9,000 | | | | 76,427 | |
Delta Electronics, Inc. | | | 107,000 | | | | 711,946 | |
Hon Hai Precision Industry Co. Ltd. | | | 478,000 | | | | 1,291,488 | |
Huaku Development Co. Ltd. | | | 42,000 | | | | 127,189 | |
International Games System Co. Ltd. | | | 40,000 | | | | 1,057,554 | |
Lite-On Technology Corp. | | | 554,000 | | | | 901,726 | |
Lotes Co. Ltd. | | | 9,000 | | | | 138,013 | |
MediaTek, Inc. | | | 16,000 | | | | 379,543 | |
Quanta Computer, Inc. | | | 75,000 | | | | 189,131 | |
Radiant Opto-Electronics Corp. | | | 150,000 | | | | 592,637 | |
Taiwan Semiconductor Manufacturing Co. Ltd. | | | 147,000 | | | | 2,207,266 | |
TCI Co. Ltd. | | | 61,000 | | | | 488,024 | |
United Microelectronics Corp. | | | 208,000 | | | | 224,903 | |
Wistron Corp. | | | 72,000 | | | | 71,679 | |
| | | | | | | | |
| | |
| | | | | | | 8,457,526 | |
| | |
| Thailand 0.0% | | | | | | |
Charoen Pokphand Foods PCL | | | 88,000 | | | | 71,266 | |
| | |
| Turkey 0.6% | | | | | | |
Anadolu Efes Biracilik Ve Malt Sanayii A/S | | | 42,630 | | | | 99,153 | |
Coca-Cola Icecek A/S | | | 107,736 | | | | 579,374 | |
Enerjisa Enerji A/S, 144A | | | 416,363 | | | | 448,008 | |
| | | | | | | | |
| | |
| | | | | | | 1,126,535 | |
| | |
| United Kingdom 5.2% | | | | | | |
AstraZeneca PLC | | | 1,387 | | | | 139,287 | |
Aviva PLC | | | 295,180 | | | | 986,192 | |
Berkeley Group Holdings PLC | | | 10,136 | | | | 531,108 | |
See Notes to Financial Statements.
| | | | | | | | |
| Description | | Shares | | | Value | |
| | |
| COMMON STOCKS (Continued) | | | | | | |
| | |
| United Kingdom (cont’d.) | | | | | | |
British American Tobacco PLC | | | 48,942 | | | $ | 1,548,681 | |
Bunzl PLC | | | 2,712 | | | | 84,300 | |
Computacenter PLC | | | 7,686 | | | | 226,832 | |
Dialog Semiconductor PLC* | | | 14,019 | | | | 535,545 | |
GlaxoSmithKline PLC | | | 94,512 | | | | 1,577,290 | |
Imperial Brands PLC | | | 56,101 | | | | 888,107 | |
JD Sports Fashion PLC | | | 66,953 | | | | 643,541 | |
Kingfisher PLC* | | | 19,000 | | | | 70,683 | |
M&G PLC | | | 190,511 | | | | 362,333 | |
Persimmon PLC | | | 4,520 | | | | 137,009 | |
Spirent Communications PLC | | | 29,610 | | | | 111,223 | |
Tate & Lyle PLC | | | 52,594 | | | | 405,299 | |
Unilever NV | | | 12,154 | | | | 685,749 | |
Unilever PLC | | | 10,499 | | | | 597,841 | |
| | | | | | | | |
| | |
| | | | | | | 9,531,020 | |
| | |
| United States 0.8% | | | | | | |
Ferguson PLC* | | | 13,825 | | | | 1,380,155 | |
| | | | | | | | |
| | |
TOTAL COMMON STOCKS
(cost $160,569,740) | | | | | | | 174,551,433 | |
| | | | | | | | |
| | |
| EXCHANGE-TRADED FUNDS 3.0% | | | | | | |
| | |
| United States | | | | | | |
iShares MSCI EAFE ETF | | | 63,600 | | | | 3,904,404 | |
iShares MSCI Emerging Markets ETF(a) | | | 33,300 | | | | 1,488,843 | |
| | | | | | | | |
| | |
TOTAL EXCHANGE-TRADED FUNDS
(cost $5,413,551) | | | | | | | 5,393,247 | |
| | | | | | | | |
| | |
| PREFERRED STOCKS 0.4% | | | | | | |
| | |
| Brazil 0.2% | | | | | | |
Cia Paranaense de Energia (PRFC B) | | | 32,800 | | | | 351,554 | |
| | |
| South Korea 0.2% | | | | | | |
Samsung Electronics Co. Ltd. (PRFC) | | | 7,630 | | | | 338,619 | |
| | | | | | | | |
| | |
TOTAL PREFERRED STOCKS
(cost $574,560) | | | | | | | 690,173 | |
| | | | | | | | |
| | |
TOTAL LONG-TERM INVESTMENTS
(cost $166,557,851) | | | | | | | 180,634,853 | |
| | | | | | | | |
See Notes to Financial Statements.
| | | | |
PGIM QMA International Equity Fund | | | 23 | |
Schedule of Investments (continued)
as of October 31, 2020
| | | | | | | | |
| Description | | Shares | | | Value | |
| | |
| SHORT-TERM INVESTMENT 1.2% | | | | | | |
| | |
| AFFILIATED MUTUAL FUND | | | | | | |
PGIM Institutional Money Market Fund
(cost $2,141,508; includes $2,140,944 of cash collateral for securities on loan)(b)(w) | | | 2,143,034 | | | $ | 2,142,391 | |
| | | | | | | | |
| | |
TOTAL INVESTMENTS 100.6%
(cost $168,699,359) | | | | | | | 182,777,244 | |
Liabilities in excess of other assets (0.6)% | | | | | | | (1,052,208 | ) |
| | | | | | | | |
| | |
NET ASSETS 100.0% | | | | | | $ | 181,725,036 | |
| | | | | | | | |
Below is a list of the abbreviation(s) used in the annual report:
144A—Security was purchased pursuant to Rule 144A under the Securities Act of 1933 and, pursuant to the requirements of Rule 144A, may not be resold except to qualified institutional buyers.
ADR—American Depositary Receipt
EAFE—Europe, Australasia, Far East
ETF—Exchange-Traded Fund
LIBOR—London Interbank Offered Rate
MSCI—Morgan Stanley Capital International
PJSC—Public Joint-Stock Company
PRFC—Preference Shares
REITs—Real Estate Investment Trust
SDR—Sweden Depositary Receipt
UTS—Unit Trust Security
| * | Non-income producing security. |
| (a) | All or a portion of security is on loan. The aggregate market value of such securities, including those sold and pending settlement, is $2,077,490; cash collateral of $2,140,944 (included in liabilities) was received with which the Series purchased highly liquid short-term investments. In the event of significant appreciation in value of securities on loan on the last business day of the reporting period, the Series may reflect a collateral value that is less than the market value of the loaned securities and such shortfall is remedied the following business day. |
| (b) | Represents security, or portion thereof, purchased with cash collateral received for securities on loan and includes dividend reinvestment. |
| (w) | PGIM Investments LLC, the manager of the Series, also serves as manager of the PGIM Institutional Money Market Fund. |
Fair Value Measurements:
Various inputs are used in determining the value of the Series’ investments. These inputs are summarized in the three broad levels listed below.
Level 1—unadjusted quoted prices generally in active markets for identical securities.
Level 2—quoted prices for similar securities, interest rates and yield curves, prepayment speeds, foreign currency exchange rates and other observable inputs.
Level 3—unobservable inputs for securities valued in accordance with Board approved fair valuation procedures.
See Notes to Financial Statements.
The following is a summary of the inputs used as of October 31, 2020 in valuing such portfolio securities:
| | | | | | | | | | | | | | | |
| | | Level 1 | | Level 2 | | Level 3 |
| Investments in Securities | | | | | | |
| Assets | | | | | | |
Common Stocks | | | | | | | | | | | | | | | |
Australia | | | $ | — | | | | $ | 7,830,276 | | | | $ | — | |
Belgium | | | | — | | | | | 1,627,233 | | | | | — | |
Brazil | | | | 3,816,225 | | | | | — | | | | | — | |
Canada | | | | 11,609,139 | | | | | — | | | | | — | |
Chile | | | | 649,711 | | | | | — | | | | | — | |
China | | | | 7,825,899 | | | | | 16,866,137 | | | | | — | |
Colombia | | | | 427,571 | | | | | — | | | | | — | |
Denmark | | | | — | | | | | 1,369,590 | | | | | — | |
Finland | | | | — | | | | | 2,820,042 | | | | | — | |
France | | | | — | | | | | 8,638,177 | | | | | — | |
Germany | | | | — | | | | | 8,624,744 | | | | | — | |
Greece | | | | — | | | | | 182,633 | | | | | — | |
Hong Kong | | | | — | | | | | 3,452,676 | | | | | — | |
India | | | | — | | | | | 4,356,034 | | | | | — | |
Indonesia | | | | — | | | | | 163,708 | | | | | — | |
Ireland | | | | — | | | | | 115,028 | | | | | — | |
Israel | | | | 1,181,024 | | | | | — | | | | | — | |
Italy | | | | — | | | | | 1,270,506 | | | | | — | |
Japan | | | | — | | | | | 27,534,158 | | | | | — | |
Jordan | | | | — | | | | | 678,297 | | | | | — | |
Malaysia | | | | — | | | | | 1,559,668 | | | | | — | |
Malta | | | | — | | | | | 410,389 | | | | | — | |
Mexico | | | | 1,323,918 | | | | | — | | | | | — | |
Netherlands | | | | — | | | | | 3,031,746 | | | | | — | |
New Zealand | | | | — | | | | | 135,563 | | | | | — | |
Norway | | | | — | | | | | 792,418 | | | | | — | |
Pakistan | | | | — | | | | | 513,736 | | | | | — | |
Philippines | | | | — | | | | | 534,590 | | | | | — | |
Poland | | | | — | | | | | 430,666 | | | | | — | |
Russia | | | | — | | | | | 2,025,102 | | | | | — | |
Singapore | | | | — | | | | | 1,478,948 | | | | | — | |
South Africa | | | | — | | | | | 3,838,342 | | | | | — | |
South Korea | | | | — | | | | | 8,000,331 | | | | | — | |
Spain | | | | — | | | | | 671,716 | | | | | — | |
Sweden | | | | — | | | | | 3,990,479 | | | | | — | |
Switzerland | | | | — | | | | | 14,208,511 | | | | | — | |
Taiwan | | | | — | | | | | 8,457,526 | | | | | — | |
Thailand | | | | — | | | | | 71,266 | | | | | — | |
Turkey | | | | — | | | | | 1,126,535 | | | | | — | |
United Kingdom | | | | — | | | | | 9,531,020 | | | | | — | |
United States | | | | — | | | | | 1,380,155 | | | | | — | |
Exchange-Traded Funds | | | | | | | | | | | | | | | |
United States | | | | 5,393,247 | | | | | — | | | | | — | |
Preferred Stocks | | | | | | | | | | | | | | | |
Brazil | | | | 351,554 | | | | | — | | | | | — | |
See Notes to Financial Statements.
| | | | |
PGIM QMA International Equity Fund | | | 25 | |
Schedule of Investments (continued)
as of October 31, 2020
| | | | | | | | | | | | | | | |
| | | Level 1 | | Level 2 | | Level 3 |
Investments in Securities (continued) | | | | | | | | | | | | | | | |
Assets (continued) | | | | | | | | | | | | | | | |
Preferred Stocks (continued) | | | | | | | | | | | | | | | |
South Korea | | | $ | — | | | | $ | 338,619 | | | | $ | — | |
Affiliated Mutual Fund | | | | 2,142,391 | | | | | — | | | | | — | |
| | | | | | | | | | | | | | | |
Total | | | $ | 34,720,679 | | | | $ | 148,056,565 | | | | $ | — | |
| | | | | | | | | | | | | | | |
Industry Classification:
The industry classification of investments and liabilities in excess of other assets shown as a percentage of net assets as of October 31, 2020 were as follows (unaudited):
| | | | |
Banks | | | 8.7 | % |
Pharmaceuticals | | | 7.2 | |
Metals & Mining | | | 5.2 | |
Insurance | | | 4.3 | |
Internet & Direct Marketing Retail | | | 4.2 | |
Semiconductors & Semiconductor Equipment | | | 3.5 | |
Oil, Gas & Consumable Fuels | | | 3.4 | |
Exchange-Traded Funds | | | 3.0 | |
Capital Markets | | | 2.8 | |
Household Durables | | | 2.7 | |
Tobacco | | | 2.6 | |
Food Products | | | 2.5 | |
Technology Hardware, Storage & Peripherals | | | 2.4 | |
IT Services | | | 2.3 | |
Entertainment | | | 2.3 | |
Trading Companies & Distributors | | | 2.1 | |
Automobiles | | | 2.1 | |
Specialty Retail | | | 2.0 | |
Electronic Equipment, Instruments & Components | | | 1.9 | |
Machinery | | | 1.9 | |
Diversified Telecommunication Services | | | 1.8 | |
Wireless Telecommunication Services | | | 1.8 | |
Electric Utilities | | | 1.7 | |
Electrical Equipment | | | 1.6 | |
Construction Materials | | | 1.6 | |
Personal Products | | | 1.5 | |
Health Care Providers & Services | | | 1.4 | |
Equity Real Estate Investment Trusts (REITs) | | | 1.4 | |
Real Estate Management & Development | | | 1.4 | |
Interactive Media & Services | | | 1.4 | |
Food & Staples Retailing | | | 1.4 | |
Auto Components | | | 1.3 | |
Chemicals | | | 1.3 | |
| | | | |
Air Freight & Logistics | | | 1.2 | % |
Affiliated Mutual Fund (1.2% represents investments purchased with collateral from securities on loan) | | | 1.2 | |
Road & Rail | | | 1.2 | |
Building Products | | | 1.2 | |
Health Care Equipment & Supplies | | | 1.1 | |
Hotels, Restaurants & Leisure | | | 1.0 | |
Commercial Services & Supplies | | | 1.0 | |
Software | | | 0.7 | |
Gas Utilities | | | 0.7 | |
Household Products | | | 0.7 | |
Construction & Engineering | | | 0.4 | |
Life Sciences Tools & Services | | | 0.4 | |
Leisure Products | | | 0.4 | |
Beverages | | | 0.4 | |
Independent Power & Renewable Electricity Producers | | | 0.4 | |
Diversified Financial Services | | | 0.3 | |
Marine | | | 0.3 | |
Professional Services | | | 0.3 | |
Media | | | 0.2 | |
Textiles, Apparel & Luxury Goods | | | 0.2 | |
Water Utilities | | | 0.1 | |
Communications Equipment | | | 0.1 | |
Industrial Conglomerates | | | 0.1 | |
Thrifts & Mortgage Finance | | | 0.1 | |
Transportation Infrastructure | | | 0.1 | |
Diversified Consumer Services | | | 0.1 | |
| | | | |
| | | 100.6 | |
Liabilities in excess of other assets | | | (0.6 | ) |
| | | | |
| | | 100.0 | % |
| | | | |
See Notes to Financial Statements.
Effects of Derivative Instruments on the Financial Statements and Primary Underlying Risk Exposure:
The Series invested in derivative instruments during the reporting period. The primary type of risk associated with these derivative instruments is equity contracts risk. See the Notes to Financial Statements for additional detail regarding these derivative instruments and their risks. The effect of such derivative instruments on the Series’ financial position and financial performance as reflected in the Statement of Assets and Liabilities and Statement of Operations is presented in the summary below.
The Series did not hold any derivative instruments as of October 31, 2020, accordingly, no derivative positions were presented in the Statement of Assets and Liabilities.
The effects of derivative instruments on the Statement of Operations for the year ended October 31, 2020 are as follows:
| | |
Amount of Realized Gain (Loss) on Derivatives Recognized in Income |
| | | | | |
Derivatives not accounted for as hedging instruments, carried at fair value | | Rights(1) |
Equity contracts | | | $ | (172,124 | ) |
| | | | | |
| (1) | Included in net realized gain (loss) on investment transactions in the Statement of Operations. |
For the year ended October 31, 2020, the Series did not have any net change in unrealized appreciation (depreciation) on derivatives in the Statement of Operations.
Financial Instruments/Transactions—Summary of Offsetting and Netting Arrangements:
The Series entered into financial instruments/transactions during the reporting period that are either offset in accordance with current requirements or are subject to enforceable master netting arrangements or similar agreements that permit offsetting. The information about offsetting and related netting arrangements for financial instruments/transactions where the legal right to set-off exists is presented in the summary below.
Offsetting of financial instrument/transaction assets and liabilities:
| | | | | | | | | | | | | | | |
Description | | Gross Market
Value of
Recognized
Assets/(Liabilities) | | Collateral
Pledged/(Received)(1) | | Net
Amount |
Securities on Loan | | | $ | 2,077,490 | | | | $ | (2,077,490 | ) | | | $ | — | |
| | | | | | | | | | | | | | | |
| (1) | Collateral amount disclosed by the Series is limited to the market value of financial instruments/transactions. |
See Notes to Financial Statements.
| | | | |
PGIM QMA International Equity Fund | | | 27 | |
Statement of Assets and Liabilities
as of October 31, 2020
| | | | | |
Assets | | | | | |
Investments at value, including securities on loan of $2,077,490: | | | | | |
Unaffiliated investments (cost $166,557,851) | | | $ | 180,634,853 | |
Affiliated investments (cost $2,141,508) | | | | 2,142,391 | |
Foreign currency, at value (cost $388,462) | | | | 387,571 | |
Receivable for investments sold | | | | 6,990,608 | |
Tax reclaim receivable | | | | 720,045 | |
Dividends receivable | | | | 404,203 | |
Receivable for Series shares sold | | | | 28,987 | |
Prepaid expenses | | | | 4,889 | |
| | | | | |
Total Assets | | | | 191,313,547 | |
| | | | | |
| |
| Liabilities | | |
Payable for investments purchased | | | | 6,487,489 | |
Payable to broker for collateral for securities on loan | | | | 2,140,944 | |
Payable for Series shares reacquired | | | | 388,636 | |
Loan payable | | | | 193,000 | |
Accrued expenses and other liabilities | | | | 151,702 | |
Management fee payable | | | | 80,378 | |
Affiliated transfer agent fee payable | | | | 53,031 | |
Payable to custodian | | | | 50,832 | |
Distribution fee payable | | | | 41,396 | |
Directors’ fees payable | | | | 1,103 | |
| | | | | |
Total Liabilities | | | | 9,588,511 | |
| | | | | |
| |
Net Assets | | | $ | 181,725,036 | |
| | | | | |
| | | | | |
| | | | | | |
Net assets were comprised of: | | | | | |
Common stock, at par | | | $ | 269,128 | |
Paid-in capital in excess of par | | | | 176,739,767 | |
Total distributable earnings (loss) | | | | 4,716,141 | |
| | | | | |
Net assets, October 31, 2020 | | | $ | 181,725,036 | |
| | | | | |
See Notes to Financial Statements.
| | | | | | |
Class A | | | | | | |
Net asset value and redemption price per share, | | | | | | |
($147,444,794 ÷ 21,862,485 shares of common stock issued and outstanding) | | $ | 6.74 | | | |
Maximum sales charge (5.50% of offering price) | | | 0.39 | | | |
| | | | | | |
Maximum offering price to public | | $ | 7.13 | | | |
| | | | | | |
| | |
Class C | | | | | | |
Net asset value, offering price and redemption price per share, | | | | | | |
($2,381,353 ÷ 372,980 shares of common stock issued and outstanding) | | $ | 6.38 | | | |
| | | | | | |
| | |
Class Z | | | | | | |
Net asset value, offering price and redemption price per share, | | | | | | |
($13,062,061 ÷ 1,918,227 shares of common stock issued and outstanding) | | $ | 6.81 | | | |
| | | | | | |
| | |
Class R6 | | | | | | |
Net asset value, offering price and redemption price per share, | | | | | | |
($18,836,828 ÷ 2,759,062 shares of common stock issued and outstanding) | | $ | 6.83 | | | |
| | | | | | |
See Notes to Financial Statements.
| | | | |
PGIM QMA International Equity Fund | | | 29 | |
Statement of Operations
Year Ended October 31, 2020
| | | | | |
Net Investment Income (Loss) | | | | | |
Income | | | | | |
Unaffiliated dividend income (net of $670,708 foreign withholding tax) | | | $ | 5,785,807 | |
Income from securities lending, net (including affiliated income of $10,014) | | | | 62,362 | |
Affiliated dividend income | | | | 7,130 | |
| | | | | |
Total income | | | | 5,855,299 | |
| | | | | |
| |
Expenses | | | | | |
Management fee | | | | 1,435,058 | |
Distribution fee(a) | | | | 502,471 | |
Transfer agent’s fees and expenses (including affiliated expense of $344,518)(a) | | | | 643,079 | |
Custodian and accounting fees | | | | 187,942 | |
Registration fees(a) | | | | 83,546 | |
Shareholders’ reports | | | | 57,629 | |
Audit fee | | | | 30,762 | |
Legal fees and expenses | | | | 20,519 | |
Directors’ fees | | | | 14,032 | |
Miscellaneous | | | | 65,068 | |
| | | | | |
Total expenses | | | | 3,040,106 | |
Less: Fee waiver and/or expense reimbursement(a) | | | | (358,954 | ) |
| | | | | |
Net expenses | | | | 2,681,152 | |
| | | | | |
Net investment income (loss) | | | | 3,174,147 | |
| | | | | |
| |
Realized And Unrealized Gain (Loss) On Investment And Foreign Currency Transactions | | | | | |
Net realized gain (loss) on: | | | | | |
Investment transactions (including affiliated of $(5,089)) (net of foreign capital gains taxes $(5,262)) | | | | (4,578,646 | ) |
Foreign currency transactions | | | | (110,819 | ) |
| | | | | |
| | | | (4,689,465 | ) |
| | | | | |
Net change in unrealized appreciation (depreciation) on: | | | | | |
Investments (including affiliated of $714) (net of change in foreign capital gains taxes $24,532) | | | | (8,440,329 | ) |
Foreign currencies | | | | 30,776 | |
| | | | | |
| | | | (8,409,553 | ) |
| | | | | |
Net gain (loss) on investment and foreign currency transactions | | | | (13,099,018 | ) |
| | | | | |
Net Increase (Decrease) In Net Assets Resulting From Operations | | | $ | (9,924,871 | ) |
| | | | | |
| (a) | Class specific expenses and waivers were as follows: |
| | | | | | | | | | | | | | | | | | | | | | | | | |
| | | Class A | | Class B | | Class C | | Class Z | | Class R6 |
Distribution fee | | | | 470,855 | | | | | 5,214 | | | | | 26,402 | | | | | — | | | | | — | |
Transfer agent’s fees and expenses | | | | 596,167 | | | | | 12,510 | | | | | 10,411 | | | | | 23,071 | | | | | 920 | |
Registration fees | | | | 16,962 | | | | | 14,918 | | | | | 16,783 | | | | | 16,784 | | | | | 18,099 | |
Fee waiver and/or expense reimbursement | | | | (259,556 | ) | | | | (24,371 | ) | | | | (4,366 | ) | | | | (21,423 | ) | | | | (49,238 | ) |
See Notes to Financial Statements.
Statements of Changes in Net Assets
| | | | | | | | |
| |
| | | Year Ended
October 31, | |
| | |
| | | 2020 | | | 2019 | |
| | |
Increase (Decrease) in Net Assets | | | | | | | | |
Operations | | | | | | | | |
Net investment income (loss) | | $ | 3,174,147 | | | $ | 4,919,888 | |
Net realized gain (loss) on investment and foreign currency transactions | | | (4,689,465 | ) | | | (5,932,231 | ) |
Net change in unrealized appreciation (depreciation) on investments and foreign currencies | | | (8,409,553 | ) | | | 15,303,867 | |
| | | | | | | | |
Net increase (decrease) in net assets resulting from operations | | | (9,924,871 | ) | | | 14,291,524 | |
| | | | | | | | |
Dividends and Distributions | | | | | | | | |
Distributions from distributable earnings | | | | | | | | |
Class A | | | (4,101,945 | ) | | | (4,863,764 | ) |
Class B | | | (14,282 | ) | | | (27,709 | ) |
Class C | | | (50,447 | ) | | | (271,975 | ) |
Class Z | | | (386,163 | ) | | | (443,611 | ) |
Class R6 | | | (550,823 | ) | | | (1,275,473 | ) |
| | | | | | | | |
| | | (5,103,660 | ) | | | (6,882,532 | ) |
| | | | | | | | |
Series share transactions (Net of share conversions) | | | | | | | | |
Net proceeds from shares sold | | | 37,395,853 | | | | 9,994,692 | |
Net asset value of shares issued in reinvestment of dividends and distributions | | | 5,027,591 | | | | 6,792,808 | |
Cost of shares reacquired | | | (42,989,953 | ) | | | (62,908,505 | ) |
| | | | | | | | |
Net increase (decrease) in net assets from Series share transactions | | | (566,509 | ) | | | (46,121,005 | ) |
| | | | | | | | |
Total increase (decrease) | | | (15,595,040 | ) | | | (38,712,013 | ) |
| | |
Net Assets: | | | | | | | | |
Beginning of year | | | 197,320,076 | | | | 236,032,089 | |
| | | | | | | | |
End of year | | $ | 181,725,036 | | | $ | 197,320,076 | |
| | | | | | | | |
See Notes to Financial Statements.
| | | | |
PGIM QMA International Equity Fund | | | 31 | |
Notes to Financial Statements
Prudential World Fund, Inc. (the “Fund”) is registered under the Investment Company Act of 1940, as amended (“1940 Act”), as an open-end management investment company and currently consists of seven series: PGIM Jennison Emerging Markets Equity Opportunities Fund, PGIM Jennison Global Infrastructure Fund, PGIM Jennison Global Opportunities Fund, PGIM Jennison International Opportunities Fund and PGIM QMA International Equity Fund, each of which are diversified funds for purposes of the 1940 Act and PGIM Emerging Markets Debt Hard Currency Fund and PGIM Emerging Markets Debt Local Currency Fund, each of which are non-diversified funds for purposes of the 1940 Act, and therefore, may invest a greater percentage of their assets in the securities of a single company or other issuer than a diversified fund. Investing in a non-diversified fund involves greater risk than investing in a diversified fund because a loss resulting from the decline in value of any one security may represent a greater portion of the total assets of a non-diversified fund. These financial statements relate only to the PGIM QMA International Equity Fund (the “Series”).
The investment objective of the Series is to seek long-term growth of capital.
The Series follows the investment company accounting and reporting guidance of the Financial Accounting Standards Board (“FASB”) Accounting Standard Codification (“ASC”) Topic 946 Financial Services — Investment Companies. The following accounting policies conform to U.S. generally accepted accounting principles. The Series consistently follows such policies in the preparation of its financial statements.
Securities Valuation: The Series holds securities and other assets and liabilities that are fair valued at the close of each day (generally, 4:00 PM Eastern time) the New York Stock Exchange (“NYSE”) is open for trading. Fair value is the price that would be received to sell an asset or paid to transfer a liability in an orderly transaction between market participants on the measurement date. The Board of Directors (the “Board”) has adopted valuation procedures for security valuation under which fair valuation responsibilities have been delegated to PGIM Investments LLC (“PGIM Investments” or the “Manager”). Pursuant to the Board’s delegation, the Manager has established a Valuation Committee responsible for supervising the fair valuation of portfolio securities and other assets and liabilities. The valuation procedures permit the Series to utilize independent pricing vendor services, quotations from market makers, and alternative valuation methods when market quotations are either not readily available or not deemed representative of fair value. A record of the Valuation Committee’s actions is subject to the Board’s review, approval, and ratification at its next regularly scheduled quarterly meeting.
For the fiscal reporting year-end, securities and other assets and liabilities were fair valued at the close of the last U.S. business day. Trading in certain foreign securities may occur when the NYSE is closed (including weekends and holidays). Because such foreign securities trade in markets that are open on weekends and U.S. holidays, the values of some of the Series’ foreign investments may change on days when investors cannot purchase or redeem Series shares.
Various inputs determine how the Series’ investments are valued, all of which are categorized according to the three broad levels (Level 1, 2, or 3) detailed in the Schedule of Investments and referred to herein as the “fair value hierarchy” in accordance with FASB ASC Topic 820 - Fair Value Measurements and Disclosures.
Common or preferred stocks, exchange-traded funds and derivative instruments, if applicable, that are traded on a national securities exchange are valued at the last sale price as of the close of trading on the applicable exchange where the security principally trades. Securities traded via NASDAQ are valued at the NASDAQ official closing price. To the extent these securities are valued at the last sale price or NASDAQ official closing price, they are classified as Level 1 in the fair value hierarchy. In the event that no sale or official closing price on valuation date exists, these securities are generally valued at the mean between the last reported bid and ask prices, or at the last bid price in the absence of an ask price. These securities are classified as Level 2 in the fair value hierarchy.
Foreign equities traded on foreign securities exchanges are generally valued using pricing vendor services that provide model prices derived using adjustment factors based on information such as local closing price, relevant general and sector indices, currency fluctuations, depositary receipts, and futures, as applicable. Securities valued using such model prices are classified as Level 2 in the fair value hierarchy. The models generate an evaluated adjustment factor for each security, which is applied to the local closing price to adjust it for post closing market movements up to the time the Series is valued. Utilizing that evaluated adjustment factor, the vendor provides an evaluated price for each security. If the vendor does not provide an evaluated price, securities are valued in accordance with exchange-traded common and preferred stock valuation policies discussed above.
Investments in open-end funds (other than exchange-traded funds) are valued at their net asset values as of the close of the NYSE on the date of valuation. These securities are classified as Level 1 in the fair value hierarchy since they may be purchased or sold at their net asset values on the date of valuation.
Securities and other assets that cannot be priced according to the methods described above are valued based on pricing methodologies approved by the Board. In the event that unobservable inputs are used when determining such valuations, the securities will be classified as Level 3 in the fair value hierarchy.
When determining the fair value of securities, some of the factors influencing the valuation include: the nature of any restrictions on disposition of the securities; assessment of the
| | | | |
PGIM QMA International Equity Fund | | | 33 | |
Notes to Financial Statements (continued)
general liquidity of the securities; the issuer’s financial condition and the markets in which it does business; the cost of the investment; the size of the holding and the capitalization of the issuer; the prices of any recent transactions or bids/offers for such securities or any comparable securities; any available analyst media or other reports or information deemed reliable by the Manager regarding the issuer or the markets or industry in which it operates. Using fair value to price securities may result in a value that is different from a security’s most recent closing price and from the price used by other unaffiliated mutual funds to calculate their net asset values.
Foreign Currency Translation: The books and records of the Series are maintained in U.S. dollars. Foreign currency amounts are translated into U.S. dollars on the following basis:
(i) market value of investment securities, other assets and liabilities — at the current rates of exchange;
(ii) purchases and sales of investment securities, income and expenses — at the rates of exchange prevailing on the respective dates of such transactions.
Although the net assets of the Series are presented at the foreign exchange rates and market values at the close of the period, the Series does not generally isolate that portion of the results of operations arising as a result of changes in the foreign exchange rates from the fluctuations arising from changes in the market prices of long-term portfolio securities held at the end of the period. Similarly, the Series does not isolate the effect of changes in foreign exchange rates from the fluctuations arising from changes in the market prices of long-term portfolio securities sold during the period. Accordingly, holding period realized foreign currency gains (losses) are included in the reported net realized gains (losses) on investment transactions.
Net realized gains (losses) on foreign currency transactions represent net foreign exchange gains (losses) from the disposition of holdings of foreign currencies, currency gains (losses) realized between the trade and settlement dates on investment transactions, and the difference between the amounts of interest, dividends and foreign withholding taxes recorded on the Series’ books and the U.S. dollar equivalent amounts actually received or paid. Net unrealized currency gains (losses) arise from valuing foreign currency denominated assets and liabilities (other than investments) at period end exchange rates.
Master Netting Arrangements: The Fund, on behalf of the Series, is subject to various Master Agreements, or netting arrangements, with select counterparties. These are agreements which a subadviser may have negotiated and entered into on behalf of all or a portion of the Series. A master netting arrangement between the Series and the counterparty permits the Series to offset amounts payable by the Series to the same counterparty against
amounts to be received; and by the receipt of collateral from the counterparty by the Series to cover the Series’ exposure to the counterparty. However, there is no assurance that such mitigating factors are easily enforceable. In addition to master netting arrangements, the right to set-off exists when all the conditions are met such that each of the parties owes the other determinable amounts, the reporting party has the right to set-off the amount owed with the amount owed by the other party, the reporting party intends to set-off and the right of set-off is enforceable by law. During the reporting period, there was no intention to settle on a net basis and all amounts are presented on a gross basis on the Statement of Assets and Liabilities.
Rights: The Series held rights acquired either through a direct purchase or pursuant to corporate actions. Rights entitle the holder to buy a proportionate amount of common stock, or such other security that the issuer may specify, at a specific price and time through the expiration dates. Such rights are held as long positions by the Series until exercised, sold or expired. Rights are valued at fair value in accordance with the Board approved fair valuation procedures.
Securities Lending: The Series lends its portfolio securities to banks and broker-dealers. The loans are secured by collateral at least equal to the market value of the securities loaned. Collateral pledged by each borrower is invested in an affiliated money market fund and is marked to market daily, based on the previous day’s market value, such that the value of the collateral exceeds the value of the loaned securities. In the event of significant appreciation in value of securities on loan on the last business day of the reporting period, the financial statements may reflect a collateral value that is less than the market value of the loaned securities. Such shortfall is remedied as described above. Loans are subject to termination at the option of the borrower or the Series. Upon termination of the loan, the borrower will return to the Series securities identical to the loaned securities. Should the borrower of the securities fail financially, the Series has the right to repurchase the securities in the open market using the collateral.
The Series recognizes income, net of any rebate and securities lending agent fees, for lending its securities in the form of fees or interest on the investment of any cash received as collateral. The borrower receives all interest and dividends from the securities loaned and such payments are passed back to the lender in amounts equivalent thereto, which are reflected in interest income or unaffiliated dividend income based upon the nature of the payment on the Statement of Operations. The Series also continues to recognize any unrealized gain (loss) in the market price of the securities loaned and on the change in the value of the collateral invested that may occur during the term of the loan. In addition, realized gain (loss) is recognized on changes in the value of the collateral invested upon liquidation of the collateral. Net earnings from securities lending are disclosed in the Statement of Operations.
Securities Transactions and Net Investment Income: Securities transactions are recorded on the trade date. Realized gains (losses) from investment and currency transactions are calculated on the specific identification method. Dividend income is recorded on the
| | | | |
PGIM QMA International Equity Fund | | | 35 | |
Notes to Financial Statements (continued)
ex-date, or for certain foreign securities, when the Series becomes aware of such dividends. Expenses are recorded on an accrual basis, which may require the use of certain estimates by management that may differ from actual. Net investment income or loss (other than class specific expenses and waivers, which are allocated as noted below) and unrealized and realized gains (losses) are allocated daily to each class of shares based upon the relative proportion of adjusted net assets of each class at the beginning of the day. Class specific expenses and waivers, where applicable, are charged to the respective share classes. Class specific expenses include distribution fees and distribution fee waivers, shareholder servicing fees, transfer agent’s fees and expenses, registration fees and fee waivers and/or expense reimbursements, as applicable.
Taxes: It is the Series’ policy to continue to meet the requirements of the Internal Revenue Code applicable to regulated investment companies and to distribute all of its taxable net investment income and capital gains, if any, to its shareholders. Therefore, no federal income tax provision is required. Withholding taxes on foreign dividends, interest and capital gains, if any, are recorded, net of reclaimable amounts, at the time the related income is earned.
The Series is subject to foreign income taxes imposed by certain countries in which it invests. Additionally, capital gains realized upon disposition of securities issued in or by certain foreign countries are subject to capital gains tax imposed by those countries. All taxes are computed in accordance with the applicable foreign tax law, and, to the extent permitted, capital losses are used to offset capital gains. Taxes attributable to income are accrued by the Series as a reduction of income. Current and deferred tax expense attributable to capital gains is reflected as a component of realized or change in unrealized gain/loss on securities in the accompanying financial statements. To the extent that the Series has country specific capital loss carryforwards, such carryforwards are applied against net unrealized gains when determining the deferred tax liability. Any deferred tax liability incurred by the Series is included in either Other liabilities or Deferred tax liability on the accompanying Statement of Assets and Liabilities.
Dividends and Distributions: The Series expects to pay dividends from net investment income and distributions from net realized capital and currency gains, if any, annually. Dividends and distributions to shareholders, which are determined in accordance with federal income tax regulations and which may differ from generally accepted accounting principles, are recorded on the ex-date. Permanent book/tax differences relating to income and gain (loss) are reclassified between total distributable earnings (loss) and paid-in capital in excess of par, as appropriate.
Estimates: The preparation of financial statements requires management to make estimates and assumptions that affect the reported amounts and disclosures in the financial
statements. Actual results could differ from those estimates.
The Fund, on behalf of the Series, has a management agreement with the Manager. Pursuant to this agreement, the Manager has responsibility for all investment advisory services and supervises the subadviser’s performance of such services. In addition, under the management agreement, the Manager provides all of the administrative functions necessary for the organization, operation and management of the Series. The Manager administers the corporate affairs of the Series and, in connection therewith, furnishes the Series with office facilities, together with those ordinary clerical and bookkeeping services which are not being furnished by the Series’ custodian and the Series’ transfer agent. The Manager is also responsible for the staffing and management of dedicated groups of legal, marketing, compliance and related personnel necessary for the operation of the Series. The legal, marketing, compliance and related personnel are also responsible for the management and oversight of the various service providers to the Series, including, but not limited to, the custodian, transfer agent, and accounting agent.
The Manager has entered into a subadvisory agreement with QMA LLC (“QMA”). The subadvisory agreement provides that QMA will furnish investment advisory services in connection with the management of the Series. In connection therewith, QMA is obligated to keep certain books and records of the Series. The Manager pays for the services of QMA, the cost of compensation of officers of the Series, occupancy and certain clerical and bookkeeping costs of the Series. The Series bears all other costs and expenses.
The management fee paid to the Manager is accrued daily and payable monthly at an annual rate of 0.75% of the Series’ average daily net assets up to $2 billion, 0.70% of the next $3 billion and 0.69% of the average daily net assets over $5 billion. The effective management fee rate before any waivers and/or expense reimbursements was 0.75% for the year ended October 31, 2020.
The Manager has contractually agreed, through February 28, 2022, to limit total annual operating expenses after fee waivers and/or expense reimbursements to 0.78% of average daily net assets for Class R6 shares. This contractual waiver excludes interest, brokerage, taxes (such as income and foreign withholding taxes, stamp duty and deferred tax expenses), acquired fund fees and expenses, extraordinary expenses, and certain other Series expenses such as dividend and interest expense and broker charges on short sales.
Where applicable, the Manager agrees to waive management fees or shared operating expenses on any share class to the same extent that it waives such expenses on any other share class and, in addition, total annual operating expenses for Class R6 shares will not exceed total annual operating expenses for Class Z shares. Fees and/or expenses waived and/or reimbursed by the Manager may be recouped by the Manager within the same fiscal
| | | | |
PGIM QMA International Equity Fund | | | 37 | |
Notes to Financial Statements (continued)
year during which such waiver/reimbursement is made if such recoupment can be realized without exceeding the expense limit in effect at the time of the recoupment for that fiscal year.
The Fund, on behalf of the Series, has a distribution agreement with Prudential Investment Management Services LLC (“PIMS”), which acts as the distributor of the Class A, Class C, Class Z and Class R6 shares of the Series. The Series compensates PIMS for distributing and servicing the Series’ Class A and Class C shares, pursuant to the plans of distribution (the “Distribution Plans”), regardless of expenses actually incurred by PIMS. The distribution fees are accrued daily and payable monthly. No distribution or service fees are paid to PIMS as distributor of the Class Z and Class R6 shares of the Series.
Pursuant to the Distribution Plans, the Series compensates PIMS for distribution related activities at an annual rate of up to 0.30% and 1% of the average daily net assets of the Class A and Class C shares, respectively.
For the year ended October 31, 2020, PIMS received $34,661 in front-end sales charges resulting from sales of Class A shares. Additionally, for the year ended October 31, 2020, PIMS received $60 in contingent deferred sales charges imposed upon redemptions by certain Class C shareholders. From these fees, PIMS paid such sales charges to broker-dealers, who in turn paid commissions to salespersons and incurred other distribution costs.
PGIM Investments, PIMS and QMA are indirect, wholly-owned subsidiaries of Prudential Financial, Inc. (“Prudential”).
| 4. | Other Transactions with Affiliates |
Prudential Mutual Fund Services LLC (“PMFS”), an affiliate of PGIM Investments and an indirect, wholly-owned subsidiary of Prudential, serves as the Series’ transfer agent. Transfer agent’s fees and expenses in the Statement of Operations include certain out-of-pocket expenses paid to non-affiliates, where applicable.
The Series may invest its overnight sweep cash in the PGIM Core Ultra Short Bond Fund (the “Core Fund”), and its securities lending cash collateral in the PGIM Institutional Money Market Fund (the “Money Market Fund”), each a series of Prudential Investment Portfolios 2, registered under the 1940 Act and managed by PGIM Investments. Through the Series’ investments in the mentioned underlying funds, PGIM Investments and/or its affiliates are paid fees or reimbursed for providing their services. In addition to the realized and unrealized gains on investments in the Core Fund and Money Market Fund, earnings from
such investments are disclosed on the Statement of Operations as “Affiliated dividend income” and “Income from securities lending, net”, respectively.
The Series may enter into certain securities purchase or sale transactions under Board approved Rule 17a-7 procedures. Rule 17a-7 is an exemptive rule under the 1940 Act, that subject to certain conditions, permits purchase and sale transactions among affiliated investment companies, or between an investment company and a person that is affiliated solely by reason of having a common (or affiliated) investment adviser, common directors, and/or common officers. Pursuant to the Rule 17a-7 procedures and consistent with guidance issued by the Securities and Exchange Commission (“SEC”), the Fund’s Chief Compliance Officer (“CCO”) prepares a quarterly summary of all such transactions for submission to the Board, together with the CCO’s written representation that all such 17a-7 transactions were effected in accordance with the Series’ Rule 17a-7 procedures. For the year ended October 31, 2020, no 17a-7 transactions were entered into by the Series.
The aggregate cost of purchases and proceeds from sales of portfolio securities (excluding short-term investments and U.S. Government securities) for the year ended October 31, 2020, were $241,381,777 and $244,297,164, respectively.
A summary of the cost of purchases and proceeds from sales of shares of affiliated investments for the year ended October 31, 2020, is presented as follows:
| | | | | | | | | | | | | | | | | | | | | | | | | | | | | | | | | | | | | | |
Value,
Beginning
of Year | | Cost of
Purchases | | Proceeds
from Sales | | Change in
Unrealized
Gain
(Loss) | | Realized
Gain
(Loss) | | Value,
End of Year | | Shares,
End
of Year | | Income |
| | | | |
| PGIM Core Ultra Short Bond Fund* | | | | | | | | |
| | $ | 101,823 | | | | $ | 60,409,646 | | | | $ | 60,511,469 | | | | $ | — | | | | $ | — | | | | $ | — | | | | | — | | | | $ | 7,130 | |
| | | |
| PGIM Institutional Money Market Fund* | | | | | | |
| | | 1,221,989 | | | | | 47,715,854 | | | | | 46,791,077 | | | | | 714 | | | | | (5,089 | ) | | | | 2,142,391 | | | | | 2,143,034 | | | | | 10,014 | ** |
| | | | | | | | | | | | | | | | | | | | | | | | | | | | | | | | | | | | | | | |
| | $ | 1,323,812 | | | | $ | 108,125,500 | | | | $ | 107,302,546 | | | | $ | 714 | | | | $ | (5,089 | ) | | | $ | 2,142,391 | | | | | | | | | $ | 17,144 | |
| | | | | | | | | | | | | | | | | | | | | | | | | | | | | | | | | | | | | | | |
| * | The Fund did not have any capital gain distributions during the reporting period. |
| ** | The amount, or a portion thereof, represents the affiliated securities lending income shown on the Statement of Operations. |
| 6. | Distributions and Tax Information |
Distributions to shareholders, which are determined in accordance with federal income tax regulations and which may differ from generally accepted accounting principles, are recorded on the ex-date.
For the year ended October 31, 2020, the tax character of dividends paid by the Series was $5,103,660 of ordinary income. For the year ended October 31, 2019, the tax character of
| | | | |
PGIM QMA International Equity Fund | | | 39 | |
Notes to Financial Statements (continued)
dividends paid by the Series were $6,008,360 of ordinary income and $874,172 of long-term capital gains.
As of October 31, 2020, the accumulated undistributed earnings on a tax basis was $2,465,164 of ordinary income.
The United States federal income tax basis of the Series’ investments and the net unrealized appreciation as of October 31, 2020 were as follows:
| | | | | | | | | | |
| | | Tax Basis | | Gross Unrealized Appreciation | | Gross Unrealized Depreciation | | Net Unrealized Appreciation | | |
| | $169,391,511 | | $26,759,143 | | $(13,373,410) | | $13,385,733 | | |
The difference between book and tax basis was primarily due to deferred losses on wash sales and investments in passive foreign investment companies.
For federal income tax purposes, the Series had a capital loss carryforward as of October 31, 2020 of approximately $11,135,000 which can be carried forward for an unlimited period. No capital gains distributions are expected to be paid to shareholders until net gains have been realized in excess of such losses.
The Manager has analyzed the Series’ tax positions taken on federal, state and local income tax returns for all open tax years and has concluded that no provision for income tax is required in the Series’ financial statements for the current reporting period. Since tax authorities can examine previously filed tax returns, the Series’ U.S. federal and state tax returns for each of the four fiscal years up to the most recent fiscal year ended October 31, 2020 are subject to such review.
The Series offers Class A, Class C, Class Z and Class R6 shares. Class A shares are sold with a maximum front-end sales charge of 5.50%. Investors who purchase $1 million or more of Class A shares and sell these shares within 12 months of purchase are subject to a contingent deferred sales charge (“CDSC”) of 1%, although they are not subject to an initial sales charge. The Class A CDSC is waived for certain retirement and/or benefit plans. A special exchange privilege is also available for shareholders who qualified to purchase Class A shares at net asset value. Effective June 26, 2020, all of the issued and outstanding Class B shares of the Series converted into Class A shares. Class C shares are sold with a CDSC of 1% on sales made within 12 months of purchase. Class C shares will automatically convert to Class A shares on a monthly basis approximately 10 years after purchase. Class Z
and Class R6 shares are not subject to any sales or redemption charges and are available exclusively for sale to a limited group of investors.
Under certain circumstances, an exchange may be made from specified share classes of the Series to one or more other share classes of the Series as presented in the table of transactions in shares of common stock, below.
The Fund is authorized to issue 5.075 billion shares of common stock, $0.01 par value per share, 700 million of which are designated as shares of the Series. The shares are further classified and designated as follows:
| | | | |
Class A | | | 100,000,000 | |
Class B | | | 5,000,000 | |
Class C | | | 100,000,000 | |
Class Z | | | 180,000,000 | |
Class T | | | 135,000,000 | |
Class R6 | | | 180,000,000 | |
The Series currently does not have any Class B or Class T shares outstanding.
As of October 31, 2020, Prudential, through its affiliated entities, including affiliated funds (if applicable), owned shares of the Series as follows:
| | | | |
| | | Number of Shares | | Percentage of Outstanding Shares |
Class A | | 37,701 | | 0.2% |
Class Z | | 54,654 | | 2.8% |
Class R6 | | 1,257,592 | | 45.6% |
At the reporting period end, the number of shareholders holding greater than 5% of the Series are as follows:
| | | | | | |
| Affiliated | | Unaffiliated |
Number of Shareholders | | Percentage of Outstanding Shares | | Number of Shareholders | | Percentage of Outstanding Shares |
— | | —% | | 2 | | 31.5% |
| | | | |
PGIM QMA International Equity Fund | | | 41 | |
Notes to Financial Statements (continued)
Transactions in shares of common stock were as follows:
| | | | | | | | | | |
Class A | | Shares | | Amount |
Year ended October 31, 2020: | | | | | | | | | | |
Shares sold | | | | 363,428 | | | | $ | 2,502,991 | |
Shares issued in reinvestment of dividends and distributions | | | | 543,821 | | | | | 4,029,714 | |
Shares reacquired | | | | (3,165,455 | ) | | | | (21,483,425 | ) |
| | | | | | | | | | |
Net increase (decrease) in shares outstanding before conversion | | | | (2,258,206 | ) | | | | (14,950,720 | ) |
Shares issued upon conversion from other share class(es) | | | | 161,310 | | | | | 1,060,950 | |
Shares reacquired upon conversion into other share class(es) | | | | (115,083 | ) | | | | (742,300 | ) |
| | | | | | | | | | |
Net increase (decrease) in shares outstanding | | | | (2,211,979 | ) | | | $ | (14,632,070 | ) |
| | | | | | | | | | |
Year ended October 31, 2019: | | | | | | | | | | |
Shares sold | | | | 405,337 | | | | $ | 2,805,726 | |
Shares issued in reinvestment of dividends and distributions | | | | 745,110 | | | | | 4,783,606 | |
Shares reacquired | | | | (2,958,509 | ) | | | | (20,532,579 | ) |
| | | | | | | | | | |
Net increase (decrease) in shares outstanding before conversion | | | | (1,808,062 | ) | | | | (12,943,247 | ) |
Shares issued upon conversion from other share class(es) | | | | 1,414,906 | | | | | 10,165,814 | |
Shares reacquired upon conversion into other share class(es) | | | | (163,486 | ) | | | | (1,157,670 | ) |
| | | | | | | | | | |
Net increase (decrease) in shares outstanding | | | | (556,642 | ) | | | $ | (3,935,103 | ) |
| | | | | | | | | | |
| | |
Class B | | | | |
Period ended June 26, 2020*: | | | | | | | | | | |
Shares sold | | | | 1,146 | | | | $ | 8,082 | |
Shares issued in reinvestment of dividends and distributions | | | | 2,005 | | | | | 14,254 | |
Shares reacquired | | | | (11,027 | ) | | | | (74,364 | ) |
| | | | | | | | | | |
Net increase (decrease) in shares outstanding before conversion | | | | (7,876 | ) | | | | (52,028 | ) |
Shares reacquired upon conversion into other share class(es) | | | | (145,104 | ) | | | | (906,295 | ) |
| | | | | | | | | | |
Net increase (decrease) in shares outstanding | | | | (152,980 | ) | | | $ | (958,323 | ) |
| | | | | | | | | | |
Year ended October 31, 2019: | | | | | | | | | | |
Shares sold | | | | 456 | | | | $ | 3,200 | |
Shares issued in reinvestment of dividends and distributions | | | | 4,465 | | | | | 27,594 | |
Shares reacquired | | | | (24,678 | ) | | | | (162,098 | ) |
| | | | | | | | | | |
Net increase (decrease) in shares outstanding before conversion | | | | (19,757 | ) | | | | (131,304 | ) |
Shares reacquired upon conversion into other share class(es) | | | | (87,433 | ) | | | | (579,597 | ) |
| | | | | | | | | | |
Net increase (decrease) in shares outstanding | | | | (107,190 | ) | | | $ | (710,901 | ) |
| | | | | | | | | | |
| | | | | | | | | | |
Class C | | Shares | | Amount |
Year ended October 31, 2020: | | | | | | | | | | |
Shares sold | | | | 40,927 | | | | $ | 274,529 | |
Shares issued in reinvestment of dividends and distributions | | | | 7,008 | | | | | 49,758 | |
Shares reacquired | | | | (78,307 | ) | | | | (518,507 | ) |
| | | | | | | | | | |
Net increase (decrease) in shares outstanding before conversion | | | | (30,372 | ) | | | | (194,220 | ) |
Shares reacquired upon conversion into other share class(es) | | | | (23,655 | ) | | | | (154,655 | ) |
| | | | | | | | | | |
Net increase (decrease) in shares outstanding | | | | (54,027 | ) | | | $ | (348,875 | ) |
| | | | | | | | | | |
Year ended October 31, 2019: | | | | | | | | | | |
Shares sold | | | | 45,851 | | | | $ | 295,704 | |
Shares issued in reinvestment of dividends and distributions | | | | 43,387 | | | | | 267,695 | |
Shares reacquired | | | | (200,703 | ) | | | | (1,325,590 | ) |
| | | | | | | | | | |
Net increase (decrease) in shares outstanding before conversion | | | | (111,465 | ) | | | | (762,191 | ) |
Shares reacquired upon conversion into other share class(es) | | | | (1,349,552 | ) | | | | (9,308,179 | ) |
| | | | | | | | | | |
Net increase (decrease) in shares outstanding | | | | (1,461,017 | ) | | | $ | (10,070,370 | ) |
| | | | | | | | | | |
| | |
Class Z | | | | |
Year ended October 31, 2020: | | | | | | | | | | |
Shares sold | | | | 483,883 | | | | $ | 3,262,094 | |
Shares issued in reinvestment of dividends and distributions | | | | 51,415 | | | | | 383,042 | |
Shares reacquired | | | | (712,115 | ) | | | | (4,770,026 | ) |
| | | | | | | | | | |
Net increase (decrease) in shares outstanding before conversion | | | | (176,817 | ) | | | | (1,124,890 | ) |
Shares issued upon conversion from other share class(es) | | | | 67,705 | | | | | 447,052 | |
Shares reacquired upon conversion into other share class(es) | | | | (4,131 | ) | | | | (24,558 | ) |
| | | | | | | | | | |
Net increase (decrease) in shares outstanding | | | | (113,243 | ) | | | $ | (702,396 | ) |
| | | | | | | | | | |
Year ended October 31, 2019: | | | | | | | | | | |
Shares sold | | | | 184,066 | | | | $ | 1,296,403 | |
Shares issued in reinvestment of dividends and distributions | | | | 67,870 | | | | | 438,440 | |
Shares reacquired | | | | (320,357 | ) | | | | (2,232,317 | ) |
| | | | | | | | | | |
Net increase (decrease) in shares outstanding before conversion | | | | (68,421 | ) | | | | (497,474 | ) |
Shares issued upon conversion from other share class(es) | | | | 166,439 | | | | | 1,187,596 | |
Shares reacquired upon conversion into other share class(es) | | | | (46,515 | ) | | | | (328,493 | ) |
| | | | | | | | | | |
Net increase (decrease) in shares outstanding | | | | 51,503 | | | | $ | 361,629 | |
| | | | | | | | | | |
| | |
Class R6 | | | | |
Year ended October 31, 2020: | | | | | | | | | | |
Shares sold | | | | 4,369,581 | | | | $ | 31,348,157 | |
Shares issued in reinvestment of dividends and distributions | | | | 73,936 | | | | | 550,823 | |
Shares reacquired | | | | (2,489,567 | ) | | | | (16,143,631 | ) |
| | | | | | | | | | |
Net increase (decrease) in shares outstanding before conversion | | | | 1,953,950 | | | | | 15,755,349 | |
Shares issued upon conversion from other share class(es) | | | | 50,529 | | | | | 319,806 | |
| | | | | | | | | | |
Net increase (decrease) in shares outstanding | | | | 2,004,479 | | | | $ | 16,075,155 | |
| | | | | | | | | | |
Year ended October 31, 2019: | | | | | | | | | | |
Shares sold | | | | 797,936 | | | | $ | 5,593,659 | |
Shares issued in reinvestment of dividends and distributions | | | | 197,442 | | | | | 1,275,473 | |
Shares reacquired | | | | (5,440,241 | ) | | | | (38,655,921 | ) |
| | | | | | | | | | |
Net increase (decrease) in shares outstanding before conversion | | | | (4,444,863 | ) | | | | (31,786,789 | ) |
Shares issued upon conversion from other share class(es) | | | | 2,916 | | | | | 20,529 | |
| | | | | | | | | | |
Net increase (decrease) in shares outstanding | | | | (4,441,947 | ) | | | $ | (31,766,260 | ) |
| | | | | | | | | | |
| * | Effective June 26, 2020, all of the issued and outstanding Class B shares of the Series converted into Class A shares. |
| | | | |
PGIM QMA International Equity Fund | | | 43 | |
Notes to Financial Statements (continued)
The Fund, on behalf of the Series, along with other affiliated registered investment companies (the “Participating Funds”), is a party to a Syndicated Credit Agreement (“SCA”) with a group of banks. The purpose of the SCA is to provide an alternative source of temporary funding for capital share redemptions. The table below provides details of the current SCA in effect at the reporting period-end as well as the prior SCA.
| | | | |
| | | Current SCA | | Prior SCA |
| Term of Commitment | | 10/2/2020 – 9/30/2021 | | 10/3/2019 – 10/1/2020 |
| Total Commitment | | $ 1,200,000,000 | | $ 1,222,500,000* |
| Annualized Commitment Fee on the Unused Portion of the SCA | | 0.15% | | 0.15% |
| Annualized Interest Rate on Borrowings | | 1.30% plus the higher of (1)
the effective federal funds
rate, (2) the one-month
LIBOR rate or (3) zero
percent | | 1.20% plus the higher of (1)
the effective federal funds
rate, (2) the one-month
LIBOR rate or (3) zero
percent |
| * Effective March 31, 2020, the SCA’s total commitment was increased from $900,000,000 to $1,162,500,000 and subsequently, effective April 7, 2020 was increased to $1,222,500,000. |
Certain affiliated registered investment companies that are parties to the SCA include portfolios that are subject to a predetermined mathematical formula used to manage certain benefit guarantees offered under variable annuity contracts. The formula may result in large scale asset flows into and out of these portfolios. Consequently, these portfolios may be more likely to utilize the SCA for purposes of funding redemptions. It may be possible for those portfolios to fully exhaust the committed amount of the SCA, thereby requiring the Manager to allocate available funding per a Board-approved methodology designed to treat the Participating Funds in the SCA equitably.
The Series utilized the SCA during the year ended October 31, 2020. The average daily balance for the 72 days that the Series had loans outstanding during the period was approximately $713,250, borrowed at a weighted average interest rate of 1.49%. The maximum loan outstanding amount during the period was $3,404,000. At October 31, 2020, the Series had an outstanding loan balance of $193,000.
| 9. | Risks of Investing in the Series |
The Series’ risks include, but are not limited to, some or all of the risks discussed below. For further information on the Series’ risks, please refer to the Series’ Prospectus and Statement of Additional Information.
Emerging Markets Risk: The risks of foreign investments are greater for investments in or exposed to emerging markets. Emerging market countries typically have economic and political systems that are less fully developed, and can be expected to be less stable, than
those of more developed countries. For example, the economies of such countries can be subject to rapid and unpredictable rates of inflation or deflation. Low trading volumes may result in a lack of liquidity and price volatility. Emerging market countries may have policies that restrict investment by non-US investors, or that prevent non-US investors from withdrawing their money at will. Countries with emerging markets can be found in regions such as Asia, Latin America, Eastern Europe and Africa.
The Series may invest in some emerging markets that subject it to risks such as those associated with illiquidity, custody of assets, different settlement and clearance procedures and asserting legal title under a developing legal and regulatory regime to a greater degree than in developed markets or even in other emerging markets.
Equity and Equity-Related Securities Risks: The value of a particular security could go down and you could lose money. In addition to an individual security losing value, the value of the equity markets or a sector in which the Series invests could go down. Different parts of a market can react differently to adverse issuer, market, regulatory, political and economic developments.
Foreign Securities Risk: The Series’ investments in securities of foreign issuers or issuers with significant exposure to foreign markets involve additional risk. The securities of such issuers may trade in markets that are less liquid, less regulated and more volatile than US markets. The value of the Series’ investments may decline because of factors affecting the particular issuer as well as foreign markets and issuers generally, such as unfavorable government actions, and political or financial instability. Lack of information may also affect the value of these securities.
Investments in China Risk: Investments in China subject the Series to risks specific to China and may make it more volatile than other funds. Over the last few decades, the Chinese government has undertaken reform of economic and market practices and has expanded the sphere of private ownership of property in China. However, Chinese markets generally continue to experience inefficiency, volatility and pricing anomalies resulting from governmental influence, a lack of publicly available information and/or political and social instability. Internal social unrest or confrontations with other neighboring countries, including military conflicts in response to such events, may also disrupt economic development in China and result in a greater risk of currency fluctuations, currency non-convertibility, interest rate fluctuations and higher rates of inflation.
Large Shareholder and Large Scale Redemption Risk: Certain individuals, accounts, funds (including funds affiliated with the Manager) or institutions, including the Manager and its affiliates, may from time to time own or control a substantial amount of the Series’ shares. There is no requirement that these entities maintain their investment in the Series. There is a risk that such large shareholders or that the Series’ shareholders generally may redeem all or a substantial portion of their investments in the Series in a short period of time, which could have a significant negative impact on the Series’ NAV, liquidity, and brokerage costs. Large redemptions could also result in tax consequences to shareholders and impact the
| | | | |
PGIM QMA International Equity Fund | | | 45 | |
Notes to Financial Statements (continued)
Series’ ability to implement its investment strategy. The Series’ ability to pursue its investment objective after one or more large scale redemptions may be impaired and, as a result, the Series may invest a larger portion of its assets in cash or cash equivalents.
Market Disruption and Geopolitical Risks: International wars or conflicts and geopolitical developments in foreign countries, along with instability in regions such as Asia, Eastern Europe, and the Middle East, possible terrorist attacks in the United States or around the world, public health epidemics such as the outbreak of infectious diseases like the recent outbreak of coronavirus globally or the 2014–2016 outbreak in West Africa of the Ebola virus, and other similar events could adversely affect the U.S. and foreign financial markets, including increases in market volatility, reduced liquidity in the securities markets and government intervention, and may cause further long-term economic uncertainties in the United States and worldwide generally.
The coronavirus pandemic and the related governmental and public responses have had and may continue to have an impact on the Series’ investments and net asset value and have led and may continue to lead to increased market volatility and the potential for illiquidity in certain classes of securities and sectors of the market. Preventative or protective actions that governments may take in respect of pandemic or epidemic diseases may result in periods of business disruption, business closures, inability to obtain raw materials, supplies and component parts, and reduced or disrupted operations for the issuers in which the Series invests. Government intervention in markets may impact interest rates, market volatility and security pricing. The occurrence, reoccurrence and pendency of such diseases could adversely affect the economies (including through changes in business activity and increased unemployment) and financial markets either in specific countries or worldwide.
| 10. | Recent Regulatory Developments |
On December 3, 2020, the SEC announced that it voted to adopt a new rule that establishes an updated regulatory framework for fund valuation practices (the “Rule”). The Rule, in part, provides (i) a framework for determining fair value in good faith and (ii) provides for a fund Board’s assignment of its responsibility for the execution of valuation-related activities to a fund’s investment adviser. Further, the SEC is rescinding previously issued guidance on related issues. The Rule will become effective 60 days after publication in the Federal Register, and will have a compliance date 18 months following the effective date. Management is currently evaluating the Rule and its impact to the Funds.
Financial Highlights
| | | | | | | | | | | | | | | | | | | | |
| Class A Shares | | | | | | | | | | | | | | | | | | | | |
| | | Year Ended October 31, | |
| | | 2020 | | | 2019 | | | 2018 | | | 2017 | | | 2016 | |
| Per Share Operating Performance(a): | | | | | | | | | | | | | | | | | | | | |
| Net Asset Value, Beginning of Year | | | $7.19 | | | | $6.96 | | | | $7.95 | | | | $6.48 | | | | $6.65 | |
| Income (loss) from investment operations: | | | | | | | | | | | | | | | | | | | | |
| Net investment income (loss) | | | 0.11 | | | | 0.15 | | | | 0.16 | | | | 0.11 | | | | 0.11 | |
| Net realized and unrealized gain (loss) on investment and foreign currency transactions | | | (0.39 | ) | | | 0.28 | | | | (1.00 | ) | | | 1.49 | | | | (0.17 | ) |
| Total from investment operations | | | (0.28 | ) | | | 0.43 | | | | (0.84 | ) | | | 1.60 | | | | (0.06 | ) |
| Less Dividends and Distributions: | | | | | | | | | | | | | | | | | | | | |
| Dividends from net investment income | | | (0.17 | ) | | | (0.17 | ) | | | (0.15 | ) | | | (0.13 | ) | | | (0.11 | ) |
| Distributions from net realized gains | | | - | | | | (0.03 | ) | | | - | | | | - | | | | - | |
| Total dividends and distributions | | | (0.17 | ) | | | (0.20 | ) | | | (0.15 | ) | | | (0.13 | ) | | | (0.11 | ) |
| Net asset value, end of year | | | $6.74 | | | | $7.19 | | | | $6.96 | | | | $7.95 | | | | $6.48 | |
| Total Return(b): | | | (4.07 | )% | | | 6.53 | % | | | (10.81 | )% | | | 25.17 | % | | | (0.93 | )% |
| | | | | | | | | | | | | | | | | | | | | |
| Ratios/Supplemental Data: | | | | | | | | | | | | | | | |
| Net assets, end of year (000) | | | $147,445 | | | | $173,103 | | | | $171,326 | | | | $207,626 | | | | $185,120 | |
| Average net assets (000) | | | $156,952 | | | | $172,031 | | | | $200,255 | | | | $192,517 | | | | $189,980 | |
| Ratios to average net assets(c)(d): | | | | | | | | | | | | | | | | | | | | |
| Expenses after waivers and/or expense reimbursement | | | 1.47 | % | | | 1.48 | % | | | 1.34 | % | | | 1.58 | % | | | 1.66 | % |
| Expenses before waivers and/or expense reimbursement | | | 1.64 | % | | | 1.62 | % | | | 1.47 | % | | | 1.59 | % | | | 1.66 | % |
| Net investment income (loss) | | | 1.58 | % | | | 2.19 | % | | | 2.08 | % | | | 1.62 | % | | | 1.69 | % |
| Portfolio turnover rate(e) | | | 128 | % | | | 94 | % | | | 114 | % | | | 105 | % | | | 114 | % |
| (a) | Calculated based on average shares outstanding during the year. |
| (b) | Total return does not consider the effects of sales loads. Total return is calculated assuming a purchase of a share on the first day and a sale on the last day of each year reported and includes reinvestment of dividends and distributions, if any. Total returns may reflect adjustments to conform to generally accepted accounting principles. |
| (c) | Effective August 1, 2017, class specific expenses include transfer agent fees and expenses and registration fees, which are charged to their respective share class. |
| (d) | Does not include expenses of the underlying portfolios in which the Series invests. |
| (e) | The Series’ portfolio turnover rate is calculated in accordance with regulatory requirements, without regard to transactions involving short-term investments and certain derivatives. If such transactions were included, the Series’ portfolio turnover rate may be higher. |
See Notes to Financial Statements.
| | | | |
PGIM QMA International Equity Fund | | | 47 | |
Financial Highlights (continued)
| | | | | | | | | | | | | | | | | | | | |
| Class C Shares | | | | | | | | | | | | | | | | | | | | |
| | | Year Ended October 31, | |
| | | 2020 | | | 2019 | | | 2018 | | | 2017 | | | 2016 | |
| Per Share Operating Performance(a): | | | | | | | | | | | | | | | | | | | | |
| Net Asset Value, Beginning of Year | | | $6.86 | | | | $6.64 | | | | $7.60 | | | | $6.20 | | | | $6.37 | |
| Income (loss) from investment operations: | | | | | | | | | | | | | | | | | | | | |
| Net investment income (loss) | | | 0.02 | | | | 0.07 | | | | 0.10 | | | | 0.06 | | | | 0.06 | |
| Net realized and unrealized gain (loss) on investment and foreign currency transactions | | | (0.38 | ) | | | 0.30 | | | | (0.97 | ) | | | 1.43 | | | | (0.17 | ) |
| Total from investment operations | | | (0.36 | ) | | | 0.37 | | | | (0.87 | ) | | | 1.49 | | | | (0.11 | ) |
| Less Dividends and Distributions: | | | | | | | | | | | | | | | | | | | | |
| Dividends from net investment income | | | (0.12 | ) | | | (0.12 | ) | | | (0.09 | ) | | | (0.09 | ) | | | (0.06 | ) |
| Distributions from net realized gains | | | - | | | | (0.03 | ) | | | - | | | | - | | | | - | |
| Total dividends and distributions | | | (0.12 | ) | | | (0.15 | ) | | | (0.09 | ) | | | (0.09 | ) | | | (0.06 | ) |
| Net asset value, end of year | | | $6.38 | | | | $6.86 | | | | $6.64 | | | | $7.60 | | | | $6.20 | |
| Total Return(b): | | | (5.42 | )% | | | 5.77 | % | | | (11.52 | )% | | | 24.33 | % | | | (1.71 | )% |
| | | | | | | | | | | | | | | | | | | | | |
| Ratios/Supplemental Data: | | | | | | | | | | | | | | | |
| Net assets, end of year (000) | | | $2,381 | | | | $2,928 | | | | $12,530 | | | | $16,661 | | | | $15,892 | |
| Average net assets (000) | | | $2,640 | | | | $7,163 | | | | $15,626 | | | | $15,736 | | | | $16,416 | |
| Ratios to average net assets(c)(d): | | | | | | | | | | | | | | | | | | | | |
| Expenses after waivers and/or expense reimbursement | | | 2.81 | % | | | 2.25 | % | | | 2.10 | % | | | 2.32 | % | | | 2.36 | % |
| Expenses before waivers and/or expense reimbursement | | | 2.98 | % | | | 2.39 | % | | | 2.23 | % | | | 2.33 | % | | | 2.36 | % |
| Net investment income (loss) | | | 0.24 | % | | | 1.09 | % | | | 1.32 | % | | | 0.86 | % | | | 0.98 | % |
| Portfolio turnover rate(e) | | | 128 | % | | | 94 | % | | | 114 | % | | | 105 | % | | | 114 | % |
| (a) | Calculated based on average shares outstanding during the year. |
| (b) | Total return does not consider the effects of sales loads. Total return is calculated assuming a purchase of a share on the first day and a sale on the last day of each year reported and includes reinvestment of dividends and distributions, if any. Total returns may reflect adjustments to conform to generally accepted accounting principles. |
| (c) | Effective August 1, 2017, class specific expenses include transfer agent fees and expenses and registration fees, which are charged to their respective share class. |
| (d) | Does not include expenses of the underlying portfolios in which the Series invests. |
| (e) | The Series’ portfolio turnover rate is calculated in accordance with regulatory requirements, without regard to transactions involving short-term investments and certain derivatives. If such transactions were included, the Series’ portfolio turnover rate may be higher. |
See Notes to Financial Statements.
| | | | | | | | | | | | | | | | | | | | |
| Class Z Shares | | | | | | | | | | | | | | | | | | | | |
| | | Year Ended October 31, | |
| | | 2020 | | | 2019 | | | 2018 | | | 2017 | | | 2016 | |
| Per Share Operating Performance(a): | | | | | | | | | | | | | | | | | | | | |
| Net Asset Value, Beginning of Year | | | $7.26 | | | | $7.02 | | | | $8.02 | | | | $6.54 | | | | $6.70 | |
| Income (loss) from investment operations: | | | | | | | | | | | | | | | | | | | | |
| Net investment income (loss) | | | 0.13 | | | | 0.18 | | | | 0.19 | | | | 0.11 | | | | 0.13 | |
| Net realized and unrealized gain (loss) on investment and foreign currency transactions | | | (0.37 | ) | | | 0.29 | | | | (1.02 | ) | | | 1.52 | | | | (0.16 | ) |
| Total from investment operations | | | (0.24 | ) | | | 0.47 | | | | (0.83 | ) | | | 1.63 | | | | (0.03 | ) |
| Less Dividends and Distributions: | | | | | | | | | | | | | | | | | | | | |
| Dividends from net investment income | | | (0.21 | ) | | | (0.20 | ) | | | (0.17 | ) | | | (0.15 | ) | | | (0.13 | ) |
| Distributions from net realized gains | | | - | | | | (0.03 | ) | | | - | | | | - | | | | - | |
| Total dividends and distributions | | | (0.21 | ) | | | (0.23 | ) | | | (0.17 | ) | | | (0.15 | ) | | | (0.13 | ) |
| Net asset value, end of year | | | $6.81 | | | | $7.26 | | | | $7.02 | | | | $8.02 | | | | $6.54 | |
| Total Return(b): | | | (3.61 | )% | | | 7.05 | % | | | (10.59 | )% | | | 25.46 | % | | | (0.44 | )% |
| | | | | | | | | | | | | | | | | | | | | |
| Ratios/Supplemental Data: | | | | | | | | | | | | | | | |
| Net assets, end of year (000) | | | $13,062 | | | | $14,753 | | | | $13,901 | | | | $17,344 | | | | $49,675 | |
| Average net assets (000) | | | $12,955 | | | | $13,815 | | | | $17,055 | | | | $21,567 | | | | $50,923 | |
| Ratios to average net assets(c)(d): | | | | | | | | | | | | | | | | | | | | |
| Expenses after waivers and/or expense reimbursement | | | 1.09 | % | | | 1.03 | % | | | 1.00 | % | | | 1.31 | % | | | 1.36 | % |
| Expenses before waivers and/or expense reimbursement | | | 1.26 | % | | | 1.17 | % | | | 1.13 | % | | | 1.32 | % | | | 1.36 | % |
| Net investment income (loss) | | | 1.97 | % | | | 2.58 | % | | | 2.44 | % | | | 1.57 | % | | | 1.99 | % |
| Portfolio turnover rate(e) | | | 128 | % | | | 94 | % | | | 114 | % | | | 105 | % | | | 114 | % |
| (a) | Calculated based on average shares outstanding during the year. |
| (b) | Total return is calculated assuming a purchase of a share on the first day and a sale on the last day of each year reported and includes reinvestment of dividends and distributions, if any. Total returns may reflect adjustments to conform to generally accepted accounting principles. |
| (c) | Effective August 1, 2017, class specific expenses include transfer agent fees and expenses and registration fees, which are charged to their respective share class. |
| (d) | Does not include expenses of the underlying portfolios in which the Series invests. |
| (e) | The Series’ portfolio turnover rate is calculated in accordance with regulatory requirements, without regard to transactions involving short-term investments and certain derivatives. If such transactions were included, the Series’ portfolio turnover rate may be higher. |
See Notes to Financial Statements.
| | | | |
PGIM QMA International Equity Fund | | | 49 | |
Financial Highlights (continued)
| | | | | | | | | | | | | | | | | | | | | | |
| Class R6 Shares | | | | | | | | | | | | | | | | | | | | | | |
| | | Year Ended October 31, | | December 28, 2016(a)
through October 31,
2017 | | |
| | | 2020 | | 2019 | | 2018 |
| Per Share Operating Performance(b): | | | | | | | | | | | | | | | | | | | | | | |
| Net Asset Value, Beginning of Period | | | | $7.27 | | | | | $7.03 | | | | | $8.04 | | | | | $6.32 | | | |
| Income (loss) from investment operations: | | | | | | | | | | | | | | | | | | | | | | |
| Net investment income (loss) | | | | 0.16 | | | | | 0.21 | | | | | 0.21 | | | | | 0.15 | | | |
| Net realized and unrealized gain (loss) on investment and foreign currency transactions | | | | (0.38 | ) | | | | 0.27 | | | | | (1.03 | ) | | | | 1.57 | | | |
| Total from investment operations | | | | (0.22 | ) | | | | 0.48 | | | | | (0.82 | ) | | | | 1.72 | | | |
| Less Dividends and Distributions: | | | | | | | | | | | | | | | | | | | | | | |
| Dividends from net investment income | | | | (0.22 | ) | | | | (0.21 | ) | | | | (0.19 | ) | | | | - | | | |
| Distributions from net realized gains | | | | - | | | | | (0.03 | ) | | | | - | | | | | - | | | |
| Total dividends and distributions | | | | (0.22 | ) | | | | (0.24 | ) | | | | (0.19 | ) | | | | - | | | |
| Net asset value, end of period | | | | $6.83 | | | | | $7.27 | | | | | $7.03 | | | | | $8.04 | | | |
| Total Return(c): | | | | (3.26 | )% | | | | 7.33 | % | | | | (10.43 | )% | | | | 27.22 | % | | |
| | | | | | | | | | | | | | | | | | | | | | | |
| Ratios/Supplemental Data: | | | | | | | | | | |
| Net assets, end of period (000) | | | | $18,837 | | | | | $5,487 | | | | | $36,552 | | | | | $39,379 | | | |
| Average net assets (000) | | | | $18,273 | | | | | $23,216 | | | | | $38,947 | | | | | $37,891 | | | |
| Ratios to average net assets(d)(e): | | | | | | | | | | | | | | | | | | | | | | |
| Expenses after waivers and/or expense reimbursement | | | | 0.78 | % | | | | 0.78 | % | | | | 0.78 | % | | | | 0.95 | %(f) | | |
| Expenses before waivers and/or expense reimbursement | | | | 1.05 | % | | | | 0.95 | % | | | | 0.95 | % | | | | 0.99 | %(f) | | |
| Net investment income (loss) | | | | 2.33 | % | | | | 3.06 | % | | | | 2.61 | % | | | | 2.45 | %(f) | | |
| Portfolio turnover rate(g) | | | | 128 | % | | | | 94 | % | | | | 114 | % | | | | 105 | % | | |
| (a) | Commencement of offering. |
| (b) | Calculated based on average shares outstanding during the period. |
| (c) | Total return is calculated assuming a purchase of a share on the first day and a sale on the last day of each period reported and includes reinvestment of dividends and distributions, if any. Total returns may reflect adjustments to conform to generally accepted accounting principles. Total returns for periods less than one full year are not annualized. |
| (d) | Effective August 1, 2017, class specific expenses include transfer agent fees and expenses and registration fees, which are charged to their respective share class. |
| (e) | Does not include expenses of the underlying portfolios in which the Series invests. |
| (g) | The Series’ portfolio turnover rate is calculated in accordance with regulatory requirements, without regard to transactions involving short-term investments and certain derivatives. If such transactions were included, the Series’ portfolio turnover rate may be higher. |
See Notes to Financial Statements.
Report of Independent Registered Public Accounting Firm
To the Board of Directors of Prudential World Fund, Inc. and Shareholders of PGIM QMA International Equity Fund
Opinion on the Financial Statements
We have audited the accompanying statement of assets and liabilities, including the schedule of investments, of PGIM QMA International Equity Fund (one of the funds constituting Prudential World Fund, Inc., referred to hereafter as the “Fund”) as of October 31, 2020, and the related statements of operations and changes in net assets, including the related notes, and the financial highlights for the year ended October 31, 2020 (collectively referred to as the “financial statements”). In our opinion, the financial statements present fairly, in all material respects, the financial position of the Fund as of October 31, 2020, and the results of its operations, changes in its net assets, and the financial highlights for the year ended October 31, 2020 in conformity with accounting principles generally accepted in the United States of America.
The financial statements of the Fund as of and for the year ended October 31, 2019 and the financial highlights for each of the periods ended on or prior to October 31, 2019 (not presented herein, other than the statement of changes in net assets and the financial highlights) were audited by other auditors whose report dated December 16, 2019 expressed an unqualified opinion on those financial statements and financial highlights.
Basis for Opinion
These financial statements are the responsibility of the Fund’s management. Our responsibility is to express an opinion on the Fund’s financial statements based on our audit. We are a public accounting firm registered with the Public Company Accounting Oversight Board (United States) (PCAOB) and are required to be independent with respect to the Fund in accordance with the U.S. federal securities laws and the applicable rules and regulations of the Securities and Exchange Commission and the PCAOB.
We conducted our audit of these financial statements in accordance with the standards of the PCAOB. Those standards require that we plan and perform the audit to obtain reasonable assurance about whether the financial statements are free of material misstatement, whether due to error or fraud.
Our audit included performing procedures to assess the risks of material misstatement of the financial statements, whether due to error or fraud, and performing procedures that respond to those risks. Such procedures included examining, on a test basis, evidence regarding the amounts and disclosures in the financial statements. Our audit also included evaluating the accounting principles used and significant estimates made by management, as well as evaluating the overall presentation of the financial statements. Our procedures included confirmation of securities owned as of October 31, 2020 by correspondence with the custodian, transfer agent and brokers; when replies were not received from brokers, we performed other auditing procedures. We believe that our audit provides a reasonable basis for our opinion.
/s/ PricewaterhouseCoopers LLP
New York, New York
December 16, 2020
We have served as the auditor of one or more investment companies in the PGIM Retail Funds complex since 2020.
| | | | |
PGIM QMA International Equity Fund | | | 51 | |
Federal Income Tax Information (unaudited)
For the year ended October 31, 2020, the Series reports, the maximum amount allowable under Section 854 of the Internal Revenue Code, but not less than, the following percentage of the ordinary income dividends paid as qualified dividend income (QDI):
| | | | |
| | | QDI | |
PGIM QMA International Equity Fund | | | 100% | |
For the year ended October 31, 2020, the Series made an election to pass through the maximum amount of the portion of the ordinary income dividends paid derived from foreign source income as well as any foreign taxes paid by the Series in accordance with Section 853 of the Internal Revenue Code of the following amounts: $632,238 foreign tax credit from recognized foreign source income of $6,377,338.
In January 2021, you will be advised on IRS Form 1099-DIV or substitute 1099-DIV as to the federal tax status of dividends received by you in calendar year 2020.
INFORMATION ABOUT BOARD MEMBERS AND OFFICERS (unaudited)
Information about Board Members and Officers of the Fund is set forth below. Board Members who are not deemed to be “interested persons” of the Fund, as defined in the 1940 Act, are referred to as “Independent Board Members.” Board Members who are deemed to be “interested persons” of the Fund are referred to as “Interested Board Members.” The Board Members are responsible for the overall supervision of the operations of the Fund and perform the various duties imposed on the directors of investment companies by the 1940 Act. The Board in turn elects the Officers, who are responsible for administering the day-to-day operations of the Fund.
| | | | | | |
| Independent Board Members | | | | |
| | | | |
Name Year of Birth Position(s) Portfolios Overseen | | Principal Occupation(s) During Past Five Years | | Other Directorships Held During Past Five Years | | Length of Board Service |
| | | | |
Ellen S. Alberding 1958 Board Member Portfolios Overseen: 95 | | President and Board Member, The Joyce Foundation (charitable foundation) (since 2002); Vice Chair, City Colleges of Chicago (community college system) (2011-2015); Trustee, National Park Foundation (charitable foundation for national park system) (2009-2018); Trustee, Economic Club of Chicago (2009-2016); Trustee, Loyola University (since 2018). | | None. | | Since September 2013 |
| | | | |
Kevin J. Bannon 1952 Board Member Portfolios Overseen: 95 | | Retired; Managing Director (April 2008-May 2015) and Chief Investment Officer (October 2008-November 2013) of Highmount Capital LLC (registered investment adviser); formerly Executive Vice President and Chief Investment Officer (April 1993-August 2007) of Bank of New York Company; President (May 2003-May 2007) of BNY Hamilton Family of Mutual Funds. | | Director of Urstadt Biddle Properties (equity real estate investment trust) (since September 2008). | | Since July 2008 |
PGIM QMA International Equity Fund
| | | | | | |
| Independent Board Members | | | | |
| | | | |
Name Year of Birth Position(s) Portfolios Overseen | | Principal Occupation(s) During Past Five Years | | Other Directorships Held During Past Five Years | | Length of Board Service |
| | | | |
Linda W. Bynoe 1952 Board Member Portfolios Overseen: 95 | | President and Chief Executive Officer (since March 1995) and formerly Chief Operating Officer (December 1989-February 1995) of Telemat Limited LLC (formerly, Telemat Ltd). (management consulting); formerly Vice President (January 1985-June 1989) at Morgan Stanley & Co. (broker-dealer). | | Director of Anixter International, Inc. (communication products distributor) (since January 2006–June 2020); Director of Northern Trust Corporation (financial services) (since April 2006); Trustee of Equity Residential (residential real estate) (since December 2009). | | Since March 2005 |
| | | | |
Barry H. Evans 1960 Board Member Portfolios Overseen: 94 | | Retired; formerly President (2005 – 2016), Global Chief Operating Officer (2014–2016), Chief Investment Officer – Global Head of Fixed Income (1998-2014), and various portfolio manager roles (1986-2006), Manulife Asset Management U.S. | | Formerly Director, Manulife Trust Company (2011-2018); formerly Director, Manulife Asset Management Limited (2015-2017); formerly Chairman of the Board of Directors of Manulife Asset Management U.S. (2005-2016); formerly Chairman of the Board, Declaration Investment Management and Research (2008-2016). | | Since September 2017 |
| | | | |
Keith F. Hartstein 1956 Board Member & Independent Chair Portfolios Overseen: 95 | | Executive Committee of the IDC Board of Governors (since October 2019); Retired; Member (since November 2014) of the Governing Council of the Independent Directors Council (IDC) (organization of independent mutual fund directors); formerly President and Chief Executive Officer (2005-2012), Senior Vice President (2004-2005), Senior Vice President of Sales and Marketing (1997-2004), and various executive management positions (1990-1997), John Hancock Funds, LLC (asset management); Chairman, Investment Company Institute’s Sales Force Marketing Committee (2003-2008). | | None. | | Since September 2013 |
Visit our website at pgim.com/investments
| | | | | | |
| Independent Board Members | | | | |
| | | | |
Name Year of Birth Position(s) Portfolios Overseen | | Principal Occupation(s) During Past Five Years | | Other Directorships Held During Past Five Years | | Length of Board Service |
| | | | |
Laurie Simon Hodrick 1962 Board Member Portfolios Overseen: 94 | | A. Barton Hepburn Professor Emerita of Economics in the Faculty of Business, Columbia Business School (since 2018); Visiting Professor of Law, Stanford Law School (since 2015); Visiting Fellow at the Hoover Institution, Stanford University (since 2015); Sole Member, ReidCourt LLC (since 2008) (a consulting firm); formerly A. Barton Hepburn Professor of Economics in the Faculty of Business, Columbia Business School (1996-2017); formerly Managing Director, Global Head of Alternative Investment Strategies, Deutsche Bank (2006-2008). | | Independent Director, Synnex Corporation (since 2019) (information technology); Independent Director, Kabbage, Inc. (2018-2020) (financial services); Independent Director, Corporate Capital Trust (2017-2018) (a business development company). | | Since September 2017 |
| | | | |
Michael S. Hyland, CFA 1945 Board Member Portfolios Overseen: 95 | | Retired (since February 2005); formerly Senior Managing Director (July 2001-February 2005) of Bear Stearns & Co, Inc.; Global Partner, INVESCO (1999-2001); Managing Director and President of Salomon Brothers Asset Management (1989-1999). | | None. | | Since July 2008 |
| | | | |
Brian K. Reid 1961 Board Member Portfolios Overseen: 94 | | Retired; formerly Chief Economist for the Investment Company Institute (ICI) (2005-2017); formerly Senior Economist and Director of Industry and Financial Analysis at the ICI (1998-2004); formerly Senior Economist, Industry and Financial Analysis at the ICI (1996-1998); formerly Staff Economist at the Federal Reserve Board (1989-1996); Director, ICI Mutual Insurance Company (2012-2017). | | None. | | Since March 2018 |
PGIM QMA International Equity Fund
| | | | | | |
| Independent Board Members | | | | |
| | | | |
Name Year of Birth Position(s) Portfolios Overseen | | Principal Occupation(s) During Past Five Years | | Other Directorships Held During Past Five Years | | Length of Board Service |
| | | | |
Grace C. Torres 1959 Board Member Portfolios Overseen: 94 | | Retired; formerly Treasurer and Principal Financial and Accounting Officer of the PGIM Funds, Target Funds, Advanced Series Trust, Prudential Variable Contract Accounts and The Prudential Series Fund (1998-June 2014); Assistant Treasurer (March 1999-June 2014) and Senior Vice President (September 1999-June 2014) of PGIM Investments LLC; Assistant Treasurer (May 2003-June 2014) and Vice President (June 2005-June 2014) of AST Investment Services, Inc.; Senior Vice President and Assistant Treasurer (May 2003-June 2014) of Prudential Annuities Advisory Services, Inc. | | Formerly Director (July 2015-January 2018) of Sun Bancorp, Inc. N.A. and Sun National Bank; Director (since January 2018) of OceanFirst Financial Corp. and OceanFirst Bank. | | Since November 2014 |
| | | | | | |
Interested Board Members | | | | |
| | | | |
Name Year of Birth Position(s) Portfolios Overseen | | Principal Occupation(s) During Past Five Years | | Other Directorships Held During Past Five Years | | Length of Board Service |
| | | | |
Stuart S. Parker 1962 Board Member & President Portfolios Overseen: 96 | | President of PGIM Investments LLC (formerly known as Prudential Investments LLC) (since January 2012); Executive Vice President of Prudential Investment Management Services LLC (since December 2012); formerly Executive Vice President of Jennison Associates LLC and Head of Retail Distribution of PGIM Investments LLC (June 2005-December 2011). | | None. | | Since January 2012 |
Visit our website at pgim.com/investments
| | | | | | |
Interested Board Members | | | | |
| | | | |
Name Year of Birth Position(s) Portfolios Overseen | | Principal Occupation(s) During Past Five Years | | Other Directorships Held During Past Five Years | | Length of Board Service |
| | | | |
Scott E. Benjamin 1973 Board Member & Vice President Portfolios Overseen: 96 | | Executive Vice President (since June 2009) of PGIM Investments LLC; Vice President (since June 2012) of Prudential Investment Management Services LLC; Executive Vice President (since September 2009) of AST Investment Services, Inc.; Senior Vice President of Product Development and Marketing, PGIM Investments (since February 2006); formerly Vice President of Product Development and Product Management, PGIM Investments LLC (2003-2006). | | None. | | Since March 2010 |
(1) The year that each Board Member joined the Board is as follows:
Ellen S. Alberding, 2013; Kevin J. Bannon, 2008; Linda W. Bynoe, 2005; Barry H. Evans, 2017; Keith F. Hartstein, 2013; Laurie Simon Hodrick, 2017; Michael S. Hyland, 2008; James E. Quinn, 2013; Richard A. Redeker, 2000; Stephen G. Stoneburn, 2003; Stuart S. Parker, Board Member and President since 2012; Scott E. Benjamin, Board Member since 2010 and Vice President since 2009; Grace C. Torres, 2014.
| | | | |
| Fund Officers(a) | | | | |
| | | |
Name Year of Birth Fund Position | | Principal Occupation(s) During Past Five Years | | Length of Service as Fund Officer |
| | | |
Claudia DiGiacomo 1974 Chief Legal Officer | | Chief Legal Officer of PGIM Investments LLC (since August 2020); Chief Legal Officer of Prudential Mutual Fund Services LLC (since August 2020); Chief Legal Officer of PIFM Holdco, LLC (since August 2020); Vice President and Corporate Counsel (since January 2005) of Prudential; and Corporate Counsel of AST Investment Services, Inc. (since August 2020); formerly Associate at Sidley Austin Brown & Wood LLP (1999-2004). | | Since December 2005 |
| | | |
Dino Capasso 1974 Chief Compliance Officer | | Chief Compliance Officer (July 2019-Present) of PGIM Investments LLC; Chief Compliance Officer (July 2019-Present) of the PGIM Funds, Target Funds, Advanced Series Trust, The Prudential Series Fund, Prudential’s Gibraltar Fund, Inc., PGIM Global High Yield Fund, Inc., and PGIM High Yield Bond Fund, Inc.; Vice President and Deputy Chief Compliance Officer (June 2017-2019) of PGIM Investments LLC; formerly, Senior Vice President and Senior Counsel (January 2016-June 2017), and Vice President and Counsel (February 2012-December 2015) of Pacific Investment Management Company LLC. | | Since March 2018 |
PGIM QMA International Equity Fund
| | | | |
| Fund Officers(a) | | | | |
| | | |
Name Year of Birth Fund Position | | Principal Occupation(s) During Past Five Years | | Length of Service as Fund Officer |
| | | |
Andrew R. French 1962 Secretary | | Vice President (since December 2018 - present) of PGIM Investments LLC; Formerly, Vice President and Corporate Counsel (2010-2018) of Prudential; formerly Director and Corporate Counsel (2006-2010) of Prudential; Vice President and Assistant Secretary (since January 2007) of PGIM Investments LLC; Vice President and Assistant Secretary (since January 2007) of Prudential Mutual Fund Services LLC. | | Since October 2006 |
| | | |
Diana N. Huffman 1982 Assistant Secretary | | Vice President and Corporate Counsel (since September 2015) of Prudential; Vice President and Assistant Secretary (since August 2020) of PGIM Investments LLC; formerly Associate at Willkie Farr & Gallagher LLP (2009-2015). | | Since March 2019 |
| | | |
Melissa Gonzalez 1980 Assistant Secretary | | Vice President and Corporate Counsel (since September 2018) of Prudential; Vice President and Assistant Secretary (since August 2020) of PGIM Investments LLC; formerly Director and Corporate Counsel (March 2014-September 2018) of Prudential. | | Since March 2020 |
| | | |
Patrick E. McGuinness 1986 Assistant Secretary | | Vice President and Assistant Secretary (since August 2020) of PGIM Investments LLC; Director and Corporate Counsel (since February 2017) of Prudential; and Corporate Counsel (2012 – 2017) of IIL, Inc. | | Since June 2020 |
| | | |
Kelly A. Coyne 1968 Assistant Secretary | | Director, Investment Operations of Prudential Mutual Fund Services LLC (since 2010). | | Since March 2015 |
| | | |
Christian J. Kelly 1975 Treasurer and Principal Financial and Accounting Officer | | Vice President, Head of Fund Administration of PGIM Investments LLC (since November 2018); formerly, Director of Fund Administration of Lord Abbett & Co. LLC (2009-2018), Treasurer and Principal Accounting Officer of the Lord Abbett Family of Funds (2017-2018); Director of Accounting, Avenue Capital Group (2008-2009); Senior Manager, Investment Management Practice of Deloitte & Touche LLP (1998-2007). | | Since January 2019 |
| | | |
Lana Lomuti 1967 Assistant Treasurer | | Vice President (since 2007) and Director (2005-2007), within PGIM Investments Fund Administration; formerly Assistant Treasurer (December 2007-February 2014) of The Greater China Fund, Inc. | | Since April 2014 |
| | | |
Russ Shupak 1973 Assistant Treasurer | | Vice President (since 2017) and Director (2013-2017), within PGIM Investments Fund Administration. | | Since October 2019 |
| | | |
Deborah Conway 1969 Assistant Treasurer | | Vice President (since 2017) and Director (2007-2017), within PGIM Investments Fund Administration. | | Since October 2019 |
| | | |
Elyse M. McLaughlin 1974 Assistant Treasurer | | Vice President (since 2017) and Director (2011-2017), within PGIM Investments Fund Administration. | | Since October 2019 |
Visit our website at pgim.com/investments
| | | | |
| Fund Officers(a) | | | | |
| | | |
Name Year of Birth Fund Position | | Principal Occupation(s) During Past Five Years | | Length of Service as Fund Officer |
| | | |
Charles H. Smith 1973 Anti-Money Laundering Compliance Officer | | Vice President, Corporate Compliance, Anti-Money Laundering Unit (since January 2015) of Prudential; committee member of the American Council of Life Insurers Anti-Money Laundering and Critical Infrastructure Committee (since January 2016); formerly Global Head of Economic Sanctions Compliance at AIG Property Casualty (February 2007-December 2014); Assistant Attorney General at the New York State Attorney General’s Office, Division of Public Advocacy. (August 1998-January 2007). | | Since January 2017 |
(a) Excludes Mr. Parker and Mr. Benjamin, interested Board Members who also serve as President and Vice President, respectively.
Explanatory Notes to Tables:
| ∎ | | Board Members are deemed to be “Interested,” as defined in the 1940 Act, by reason of their affiliation with PGIM Investments LLC and/or an affiliate of PGIM Investments LLC. |
| ∎ | | Unless otherwise noted, the address of all Board Members and Officers is c/o PGIM Investments LLC, 655 Broad Street, Newark, New Jersey 07102-4410. |
| ∎ | | There is no set term of office for Board Members or Officers. The Board Members have adopted a retirement policy, which calls for the retirement of Board Members on December 31 of the year in which they reach the age of 75. |
| ∎ | | “Other Directorships Held” includes all directorships of companies required to register or file reports with the SEC under the 1934 Act (that is, “public companies”) or other investment companies registered under the 1940 Act. |
| ∎ | | “Portfolios Overseen” includes all investment companies managed by PGIM Investments LLC. The investment companies for which PGIM Investments LLC serves as manager include the PGIM Funds, The Prudential Variable Contract Accounts, PGIM ETF Trust, PGIM High Yield Bond Fund, Inc., PGIM Global High Yield Fund, Inc., The Prudential Series Fund, Prudential’s Gibraltar Fund, Inc. and the Advanced Series Trust. |
| ∎ | | As used in the Fund Officers table “Prudential” means The Prudential Insurance Company of America. |
PGIM QMA International Equity Fund
Approval of Advisory Agreements (unaudited)
The Fund’s Board of Directors
The Board of Directors (the “Board”) of PGIM QMA International Equity Fund (the “Fund”)1 consists of eleven individuals, nine of whom are not “interested persons” of the Fund, as defined in the Investment Company Act of 1940, as amended (the “1940 Act”) (the “Independent Directors”). The Board is responsible for the oversight of the Fund and its operations, and performs the various duties imposed on the directors of investment companies by the 1940 Act. The Independent Directors have retained independent legal counsel to assist them in connection with their duties. The Chair of the Board is an Independent Director. The Board has established four standing committees: the Audit Committee, the Nominating and Governance Committee, and two Investment Committees. Each committee is chaired by, and composed of, Independent Directors.
Annual Approval of the Fund’s Advisory Agreements
As required under the 1940 Act, the Board determines annually whether to renew the Fund’s management agreement with PGIM Investments LLC (“PGIM Investments”) and the Fund’s subadvisory agreement with QMA LLC (“QMA”). In considering the renewal of the agreements, the Board, including all of the Independent Directors, met on May 27, 2020 and on June 9-11, 2020 and approved the renewal of the agreements through July 31, 2021, after concluding that the renewal of the agreements was in the best interests of the Fund and its shareholders.
In advance of the meetings, the Board requested and received materials relating to the agreements, and had the opportunity to ask questions and request further information in connection with its consideration. Among other things, the Board considered comparative fee information from PGIM Investments and QMA. Also, the Board considered comparisons with other mutual funds in relevant Peer Universes and Peer Groups, as is further discussed below.
In approving the agreements, the Board, including the Independent Directors advised by independent legal counsel, considered the factors it deemed relevant, including the nature, quality and extent of services provided by PGIM Investments and the subadviser, the performance of the Fund, the profitability of PGIM Investments and its affiliates, expenses and fees, and the potential for economies of scale that may be shared with the Fund and its shareholders as the Fund’s assets grow. In their deliberations, the Directors did not identify any single factor which alone was responsible for the Board’s decision to approve the agreements with respect to the Fund. In connection with its deliberations, the Board
| 1 | PGIM QMA International Equity Fund is a series of Prudential World Fund, Inc. |
PGIM QMA International Equity Fund
Approval of Advisory Agreements (continued)
considered information provided by PGIM Investments throughout the year at regular Board meetings, presentations from portfolio managers and other information, as well as information furnished at or in advance of the meetings on May 27, 2020 and on June 9-11, 2020.
The Directors determined that the overall arrangements between the Fund and PGIM Investments, which serves as the Fund’s investment manager pursuant to a management agreement, and between PGIM Investments and QMA, which serves as the Fund’s subadviser pursuant to the terms of a subadvisory agreement with PGIM Investments, are in the best interests of the Fund and its shareholders in light of the services performed, fees charged and such other matters as the Directors considered relevant in the exercise of their business judgment.
The material factors and conclusions that formed the basis for the Directors’ reaching their determinations to approve the continuance of the agreements are separately discussed below.
Nature, Quality and Extent of Services
The Board received and considered information regarding the nature, quality and extent of services provided to the Fund by PGIM Investments and QMA. The Board noted that QMA is affiliated with PGIM Investments. The Board considered the services provided by PGIM Investments, including but not limited to the oversight of the subadviser for the Fund, as well as the provision of fund recordkeeping, compliance and other services to the Fund, and PGIM Investments’ role as administrator for the Fund’s liquidity risk management program. With respect to PGIM Investments’ oversight of the subadviser, the Board noted that PGIM Investments’ Strategic Investment Research Group (“SIRG”), which is a business unit of PGIM Investments, is responsible for monitoring and reporting to PGIM Investments’ senior management on the performance and operations of the subadviser. The Board also considered that PGIM Investments pays the salaries of all of the officers and interested Directors of the Fund who are part of Fund management. The Board also considered the investment subadvisory services provided by QMA, including investment research and security selection, as well as adherence to the Fund’s investment restrictions and compliance with applicable Fund policies and procedures. The Board considered PGIM Investments’ evaluation of the subadviser, as well as PGIM Investments’ recommendation, based on its review of the subadviser, to renew the subadvisory agreement.
The Board considered the qualifications, backgrounds and responsibilities of PGIM Investments’ senior management responsible for the oversight of the Fund and QMA, and also considered the qualifications, backgrounds and responsibilities of QMA’s portfolio managers who are responsible for the day-to-day management of the Fund’s portfolio. The Board was provided with information pertaining to PGIM Investments’ and QMA’s organizational structure, senior management, investment operations, and other relevant
Visit our website at pgim.com/investments
information pertaining to both PGIM Investments and QMA. The Board also noted that it received favorable compliance reports from the Fund’s Chief Compliance Officer (“CCO”) as to both PGIM Investments and QMA.
The Board concluded that it was satisfied with the nature, extent and quality of the investment management services provided by PGIM Investments and the subadvisory services provided to the Fund by QMA, and that there was a reasonable basis on which to conclude that the Fund benefits from the services provided by PGIM Investments and QMA under the management and subadvisory agreements.
Costs of Services and Profits Realized by PGIM Investments
The Board was provided with information on the profitability of PGIM Investments and its affiliates in serving as the Fund’s investment manager. The Board discussed with PGIM Investments the methodology utilized in assembling the information regarding profitability and considered its reasonableness. The Board recognized that it is difficult to make comparisons of profitability from fund management contracts because comparative information is not generally publicly available and is affected by numerous factors, including the structure of the particular adviser, the types of funds it manages, its business mix, numerous assumptions regarding allocations and the adviser’s capital structure and cost of capital. Taking these factors into account, the Board concluded that the profitability of PGIM Investments and its affiliates in relation to the services rendered was not unreasonable.
Economies of Scale
The Board received and discussed information concerning economies of scale that PGIM Investments may realize as the Fund’s assets grow beyond current levels. The Board noted that the management fee schedule for the Fund includes breakpoints. During the course of time, the Board has considered information regarding the launch date of the Fund, the management fees of the Fund compared to those of similarly managed funds and PGIM Investments’ investment in the Fund over time. The Board noted that economies of scale can be shared with the Fund in other ways, including low management fees from inception, additional technological and personnel investments to enhance shareholder services, and maintaining existing expense structures in the face of a rising cost environment. The Board also considered PGIM Investments’ assertion that it continually evaluates the management fee schedule of the Fund and the potential to share economies of scale through breakpoints or fee waivers as asset levels increase.
The Board recognized the inherent limitations of any analysis of economies of scale, stemming largely from the Board’s understanding that most of PGIM Investments’ costs are not specific to individual funds, but rather are incurred across a variety of products and services.
PGIM QMA International Equity Fund
Approval of Advisory Agreements (continued)
Other Benefits to PGIM Investments and QMA
The Board considered potential ancillary benefits that might be received by PGIM Investments, QMA and their affiliates as a result of their relationship with the Fund. The Board concluded that potential benefits to be derived by PGIM Investments included transfer agency fees received by the Fund’s transfer agent (which is affiliated with PGIM Investments), and benefits to its reputation as well as other intangible benefits resulting from PGIM Investments’ association with the Fund. The Board concluded that the potential benefits to be derived by QMA included its ability to use soft dollar credits, as well as the potential benefits consistent with those generally resulting from an increase in assets under management, specifically, potential access to additional research resources and benefits to its reputation. The Board concluded that the benefits derived by PGIM Investments and QMA were consistent with the types of benefits generally derived by investment managers and subadvisers to mutual funds.
Performance of the Fund / Fees and Expenses
The Board considered certain additional factors and made related conclusions relating to the historical performance of the Fund for the one-, three-, five- and ten-year periods ended December 31, 2019.
The Board also considered the Fund’s actual management fee, as well as the Fund’s net total expense ratio, for the fiscal year ended October 31, 2019. The Board considered the management fee for the Fund as compared to the management fee charged by PGIM Investments to other funds and the fee charged by other advisers to comparable mutual funds in a Peer Group. The actual management fee represents the fee rate actually paid by Fund shareholders and includes any fee waivers or reimbursements. The net total expense ratio for the Fund represents the actual expense ratio incurred by Fund shareholders.
The mutual funds included in the Peer Universe, which was used to consider performance, and the Peer Group, which was used to consider expenses and fees, were objectively determined by Broadridge, an independent provider of mutual fund data. In certain circumstances, PGIM Investments also provided supplemental Peer Universe or Peer Group information for reasons addressed with the Board. The comparisons placed the Fund in various quartiles over various periods, with the first quartile being the best 25% of the mutual funds (for performance, the best performing mutual funds and, for expenses, the lowest cost mutual funds).
The section below summarizes key factors considered by the Board and the Board’s conclusions regarding the Fund’s performance, fees and overall expenses. The table sets forth net performance comparisons (which reflect the impact on performance of fund expenses, or any subsidies, expense caps or waivers that may be applicable) with the Peer
Visit our website at pgim.com/investments
Universe, actual management fees with the Peer Group (which reflect the impact of any subsidies or fee waivers), and net total expenses with the Peer Group, each of which were key factors considered by the Board.
| | | | | | | | |
| Net Performance | | 1 Year | | 3 Years | | 5 Years | | 10 Years |
| | | 3rd Quartile | | 3rd Quartile | | 3rd Quartile | | 3rd Quartile |
| Actual Management Fees: 2nd Quartile |
| Net Total Expenses: 3rd Quartile |
| • | | The Board noted that the Fund underperformed its benchmark index over all periods. |
| • | | The Board considered PGIM Investments’ assertions that the Fund’s underperformance was primarily driven by the Fund’s exposure to stocks that traded at deep discounts to book value (value style factor), which continued to trail the broader markets, as well as its growth and quality counterparts in 2019. The Board also considered that the Fund’s three-year rolling annualized return was above benchmark and peers from 2012 through 2017. |
| • | | The Board noted that the Fund outperformed its benchmark index and Peer Group during the 4th quarter of 2019. |
| • | | The Board and PGIM Investments agreed to retain the Fund’s existing contractual expense cap, which (exclusive of certain fees and expenses) caps total annual operating expenses at 0.78% for Class R6 shares through February 28, 2021. |
| • | | In addition, PGIM Investments will waive management fees or shared operating expenses on any share class to the same extent that it waives such expenses on any other share class, and has agreed that total annual fund operating expenses for Class R6 shares will not exceed total annual fund operating expenses for Class Z shares. |
| • | | The Board noted information provided by PGIM Investments indicating that the Fund’s net total expense ratio was three basis points from the median of the Peer Group. |
| • | | The Board concluded that, in light of the above, it would be in the best interests of the Fund and its shareholders to renew the agreements. |
| • | | The Board concluded that the management fees (including subadvisory fees) and total expenses were reasonable in light of the services provided. |
* * *
After full consideration of these factors, the Board concluded that approval of the agreements was in the best interests of the Fund and its shareholders.
PGIM QMA International Equity Fund
| | | | |
| | |
| ∎ MAIL | | ∎ TELEPHONE | | ∎ WEBSITE |
655 Broad Street Newark, NJ 07102 | | (800) 225-1852 | | pgim.com/investments |
|
| PROXY VOTING |
| The Board of Directors of the Fund has delegated to the Fund’s subadviser the responsibility for voting any proxies and maintaining proxy recordkeeping with respect to the Fund. A description of these proxy voting policies and procedures is available without charge, upon request, by calling (800) 225-1852 or by visiting the Securities and Exchange Commission’s website at sec.gov. Information regarding how the Fund voted proxies relating to portfolio securities during the most recent 12-month period ended June 30 is available on the Fund’s website and on the Securities and Exchange Commission’s website. |
|
| DIRECTORS |
| Ellen S. Alberding • Kevin J. Bannon • Scott E. Benjamin • Linda W. Bynoe • Barry H. Evans • Keith F. Hartstein • Laurie Simon Hodrick • Michael S. Hyland • Stuart S. Parker • Brian K. Reid • Grace C. Torres |
|
| OFFICERS |
| Stuart S. Parker, President • Scott E. Benjamin, Vice President • Christian J. Kelly, Treasurer and Principal Financial and Accounting Officer • Claudia DiGiacomo, Chief Legal Officer • Dino Capasso, Chief Compliance Officer • Charles H. Smith, Anti-Money Laundering Compliance Officer • Andrew R. French, Secretary • Melissa Gonzalez, Assistant Secretary • Diana N. Huffman, Assistant Secretary • Kelly A. Coyne, Assistant Secretary • Patrick McGuinness, Assistant Secretary • Lana Lomuti, Assistant Treasurer • Russ Shupak, Assistant Treasurer • Elyse McLaughlin, Assistant Treasurer • Deborah Conway, Assistant Treasurer |
| | | | |
| MANAGER | | PGIM Investments LLC | | 655 Broad Street
Newark, NJ 07102 |
|
| SUBADVISER | | QMA LLC | | Gateway Center Two
100 Mulberry Street
Newark, NJ 07102 |
|
| DISTRIBUTOR | | Prudential Investment
Management Services LLC | | 655 Broad Street
Newark, NJ 07102 |
|
| CUSTODIAN | | The Bank of New York Mellon | | 240 Greenwich Street New York, NY 10286 |
|
| TRANSFER AGENT | | Prudential Mutual Fund
Services LLC | | PO Box 9658
Providence, RI 02940 |
|
| INDEPENDENT REGISTERED PUBLIC ACCOUNTING FIRM | | PricewaterhouseCoopers LLP | | 300 Madison Avenue
New York, NY 10017 |
|
| FUND COUNSEL | | Willkie Farr & Gallagher LLP | | 787 Seventh Avenue
New York, NY 10019 |
|
|
| An investor should consider the investment objectives, risks, charges, and expenses of the Fund carefully before investing. The prospectus and summary prospectus contain this and other information about the Fund. An investor may obtain the prospectus and summary prospectus by visiting our website at pgim.com/investments or by calling (800) 225-1852. The prospectus and summary prospectus should be read carefully before investing. |
|
| E-DELIVERY |
| To receive your mutual fund documents online, go to pgim.com/investments/resource/edelivery and enroll. Instead of receiving printed documents by mail, you will receive notification via email when new materials are available. You can cancel your enrollment or change your email address at any time by visiting the website address above. |
|
| SHAREHOLDER COMMUNICATIONS WITH DIRECTORS |
| Shareholders can communicate directly with the Board of Directors by writing to the Chair of the Board, PGIM QMA International Equity Fund, PGIM Investments, Attn: Board of Directors, 655 Broad Street, Newark, NJ 07102. Shareholders can communicate directly with an individual Director by writing that Director at to the same address. Communications are not screened before being delivered to the addressee. |
|
| AVAILABILITY OF PORTFOLIO HOLDINGS |
| The Fund files its complete schedule of portfolio holdings with the Securities and Exchange Commission for the first and third quarters of each fiscal year as an exhibit to its reports on Form N-PORT. The Fund’s Form N-PORT filings are available on the Commission’s website at sec.gov. |
|
| The Fund’s Statement of Additional Information contains additional information about the Fund’s Directors and is available without charge, upon request, by calling (800) 225-1852. |
Mutual Funds:
| | | | |
ARE NOT INSURED BY THE FDIC OR ANY
FEDERAL GOVERNMENT AGENCY | | MAY LOSE VALUE | | ARE NOT A DEPOSIT OF OR GUARANTEED
BY ANY BANK OR ANY BANK AFFILIATE |
PGIM QMA INTERNATIONAL EQUITY FUND
| | | | | | | | |
| SHARE CLASS | | A | | C | | Z | | R6 |
| NASDAQ | | PJRAX | | PJRCX | | PJIZX | | PJRQX |
| CUSIP | | 743969859 | | 743969875 | | 743969883 | | 743969578 |
MF190E

PGIM EMERGING MARKETS DEBT
LOCAL CURRENCY FUND
ANNUAL REPORT
OCTOBER 31, 2020
COMING SOON: PAPERLESS SHAREHOLDER REPORTS
Beginning on January 1, 2021, as permitted by regulations adopted by the Securities and Exchange Commission, paper copies of the Fund’s annual and semiannual shareholder reports will no longer be sent by mail, unless you specifically request paper copies of the reports. Instead, the reports will be made available on the Fund’s website (pgim.com/investments), and you will be notified by mail each time a report is posted and provided with a website link to access the report.
If you already elected to receive shareholder reports electronically, you will not be affected by this change and you need not take any action. You may elect to receive shareholder reports and other communications from the Fund electronically anytime by contacting your financial intermediary (such as a broker-dealer or bank) or, if you are a direct investor, by calling 1-800-225-1852 or by sending an email request to PGIM Investments at shareholderreports@pgim.com.
You may elect to receive all future reports in paper free of charge. If you invest through a financial intermediary, you can contact your financial intermediary to elect to continue to receive paper copies of your shareholder reports. If you invest directly with the Fund, you can call 1-800-225-1852 or send an email request to shareholderreports@pgim.com to let the Fund know you wish to continue receiving paper copies of your shareholder reports. Your election to receive reports in paper will apply to all funds held in your account if you invest through your financial intermediary or all funds held with the fund complex if you invest directly with the Fund.

To enroll in e-delivery, go to pgim.com/investments/resource/edelivery
Table of Contents
This report is not authorized for distribution to prospective investors unless preceded or accompanied by a current prospectus.
The views expressed in this report and information about the Fund’s portfolio holdings are for the period covered by this report and are subject to change thereafter.
Mutual funds are distributed by Prudential Investment Management Services LLC (PIMS), member SIPC. PGIM Fixed Income is a unit of PGIM, Inc. (PGIM), a registered investment adviser. PIMS and PGIM are Prudential Financial companies. © 2020 Prudential Financial, Inc. and its related entities. PGIM and the PGIM logo are service marks of Prudential Financial, Inc. and its related entities, registered in many jurisdictions worldwide.
| | |
| 2 | | Visit our website at pgim.com/investments |
Letter from the President

Dear Shareholder:
We hope you find the annual report for the PGIM Emerging Markets Debt Local Currency Fund informative and useful. The report covers performance for the 12-month period that ended October 31, 2020.
During the first four months of the period, the global economy remained healthy—particularly in the US—fueled by rising corporate profits and strong job growth. The outlook changed dramatically in March as the coronavirus outbreak quickly and substantially shut down economic activity worldwide, leading to significant job losses and a steep decline in global growth and earnings. Responding to this disruption, the Federal Reserve (the Fed) cut the federal funds rate target to near zero and flooded capital markets with liquidity; and Congress passed stimulus bills worth approximately $3 trillion that offered an economic lifeline to consumers and businesses.
While stocks climbed throughout the first four months of the period, they fell significantly in March amid a spike in volatility, ending the 11-year-long equity bull market. With stores and factories closing and consumers staying at home to limit the spread of the virus, investors sold stocks on fears that corporate earnings would take a serious hit. Equities rallied around the globe throughout the spring and summer as states reopened their economies, but became more volatile during the last two months of the period as investors worried that a surge in coronavirus infections would stall the economic recovery. For the period overall, large-cap US and emerging market stocks rose, small-cap US stocks were virtually unchanged, and stocks in developed foreign markets declined.
The bond market overall—including US and global bonds as well as emerging market debt—rose during the period as investors sought safety in fixed income. A significant rally in interest rates pushed the 10-year US Treasury yield down to a record low. In March, the Fed took several aggressive actions to keep the bond markets running smoothly, restarting many of the relief programs that proved to be successful in helping end the global financial crisis in 2008-09.
Regarding your investments with PGIM, we believe it is important to maintain a diversified portfolio of funds consistent with your tolerance for risk, time horizon, and financial goals. Your financial advisor can help you create a diversified investment plan that may include funds covering all the basic asset classes and that reflects your personal investor profile and risk tolerance. However, diversification and asset allocation strategies do not assure a profit or protect against loss in declining markets.
At PGIM Investments, we consider it a great privilege and responsibility to help investors participate in opportunities across global markets while meeting their toughest investment challenges. PGIM is a top-10 global investment manager with more than $1 trillion in assets under management. This scale and investment expertise allow us to deliver actively managed funds and strategies to meet the needs of investors around the globe.
Thank you for choosing our family of funds.
Sincerely,

Stuart S. Parker, President
PGIM Emerging Markets Debt Local Currency Fund
December 15, 2020
| | | | |
PGIM Emerging Markets Debt Local Currency Fund | | | 3 | |
Your Fund’s Performance (unaudited)
Performance data quoted represents past performance. Past performance does not guarantee future results. The investment return and principal value of an investment will fluctuate, so that an investor’s shares, when redeemed, may be worth more or less than their original cost. Current performance may be lower or higher than the past performance data quoted. An investor may obtain performance data as of the most recent month-end by visiting our website at pgim.com/investments or by calling (800) 225-1852.
| | | | | | |
| |
| | | Average Annual Total Returns as of 10/31/20 |
| | | One Year (%) | | Five Years (%) | | Since Inception (%) |
| Class A | | | | | | |
| (with sales charges) | | –6.87 | | 2.61 | | –0.61 (3/30/11) |
| (without sales charges) | | –3.75 | | 3.29 | | –0.27 (3/30/11) |
| Class C | | | | | | |
| (with sales charges) | | –5.33 | | 2.50 | | –0.93 (3/30/11) |
| (without sales charges) | | –4.41 | | 2.50 | | –0.93 (3/30/11) |
| Class Z | | | | | | |
| (without sales charges) | | –3.45 | | 3.48 | | 0.03 (3/30/11) |
| Class R6 | | | | | | |
| (without sales charges) | | –3.24 | | 3.60 | | 0.09 (3/30/11) |
| JP Morgan Government Bond Index-Emerging Markets Global Diversified Index |
| | | –3.81 | | 3.94 | | 0.34 |
Since Inception returns are provided since the Fund has less than 10 fiscal years of returns. Since Inception returns for the Index are measured from the closest month-end to the Fund’s inception date.
| | |
| 4 | | Visit our website at pgim.com/investments |
Growth of a $10,000 Investment (unaudited)
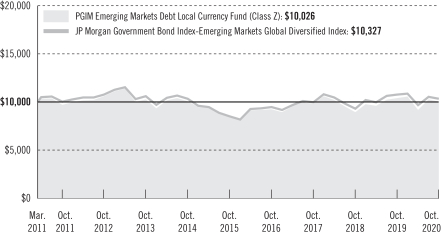
The graph compares a $10,000 investment in the Fund’s Class Z shares with a similar investment in the JP Morgan Government Bond Index-Emerging Markets Global Diversified Index by portraying the initial account values at the commencement of operations for Class Z shares (March 30, 2011) and the account values at the end of the current fiscal year (October 31, 2020), as measured on a quarterly basis. For purposes of the graph, and unless otherwise indicated, it has been assumed that (a) all recurring fees (including management fees) were deducted; and (b) all dividends and distributions were reinvested. The line graph provides information for Class Z shares only. As indicated in the tables provided earlier, performance for other share classes will vary due to the differing fees and expenses applicable to each share class (as indicated in the following paragraphs). Without waiver of fees and/or expense reimbursements, if any, the Fund’s returns would have been lower.
Past performance does not predict future performance. Total returns and the ending account values in the graph include changes in share price and reinvestment of dividends and capital gains distributions in a hypothetical investment for the periods shown. The Fund’s total returns do not reflect the deduction of income taxes on an individual’s investment. Taxes may reduce your actual investment returns on income or gains paid by the Fund or any gains you may realize if you sell your shares.
| | | | |
PGIM Emerging Markets Debt Local Currency Fund | | | 5 | |
Your Fund’s Performance (continued)
The returns in the tables do not reflect the deduction of taxes that a shareholder would pay on Fund distributions or following the redemption of Fund shares. The average annual total returns take into account applicable sales charges, which are described for each share class in the table below.
| | | | | | | | |
| | | | | |
| | | Class A | | Class C | | Class Z | | Class R6 |
| Maximum initial sales charge | | 3.25% of the public offering price | | None | | None | | None |
| Contingent deferred sales charge (CDSC) (as a percentage of the lower of the original purchase price or the net asset value at redemption) | | 1.00% on sales of $500,000 or more made within 12 months of purchase | | 1.00% on sales made within 12 months of purchase | | None | | None |
| Annual distribution and service (12b-1) fees (shown as a percentage of average daily net assets) | | 0.25% | | 1.00% | | None | | None |
Benchmark Definitions
JP Morgan Government Bond Index-Emerging Markets Global Diversified Index—The JP Morgan Government Bond Index-Emerging Markets Global Diversified Index, an unmanaged index, is a comprehensive emerging markets debt benchmark that tracks local currency bonds issued by emerging market governments.
Investors cannot invest directly in an index. The returns for the Index would be lower if they included the effects of sales charges, operating expenses of a mutual fund, or taxes that may be paid by an investor.
| | |
| 6 | | Visit our website at pgim.com/investments |
| | | | | | |
|
| Distributions and Yields as of 10/31/20 |
| | Total Distributions
Paid for
One Year ($) | | SEC 30-Day
Subsidized
Yield* (%) | | SEC 30-Day
Unsubsidized
Yield** (%) |
| Class A | | 0.27 | | 3.61 | | 2.42 |
| Class C | | 0.23 | | 2.97 | | –2.79 |
| Class Z | | 0.30 | | 4.15 | | 4.25 |
| Class R6 | | 0.30 | | 4.22 | | –43.22 |
*SEC 30-Day Subsidized Yield (%)—A standardized yield calculation created by the Securities and Exchange Commission, it reflects the income earned during a 30-day period, after the deduction of the Fund’s net expenses (net of any expense waivers or reimbursements). The investor experience is represented by the SEC 30-Day Subsidized Yield.
**SEC 30-Day Unsubsidized Yield (%)—A standardized yield calculation created by the Securities and Exchange Commission, it reflects the income earned during a 30-day period, after the deduction of the Fund’s gross expenses. The investor experience is represented by the SEC 30-Day Subsidized Yield.
| | | | |
|
| Credit Quality expressed as a percentage of total investments as of 10/31/20 (%) | |
| AAA | | | 1.5 | |
| AA | | | 6.0 | |
| A | | | 32.1 | |
| BBB | | | 29.7 | |
| BB | | | 19.0 | |
| B | | | 3.4 | |
| CCC | | | 2.1 | |
| CC | | | 0.2 | |
| Not Rated | | | 1.4 | |
| Cash/Cash Equivalents | | | 4.6 | |
| Total Investments | | | 100.0 | |
Credit ratings reflect the highest rating assigned by a nationally recognized statistical rating organization (NRSRO) such as Moody’s Investors Service, Inc. (Moody’s), S&P Global Ratings (S&P), or Fitch, Inc. (Fitch). Credit ratings reflect the common nomenclature used by both S&P and Fitch. Where applicable, ratings are converted to the comparable S&P/Fitch rating tier nomenclature. These rating agencies are independent and are widely used. The Not Rated category consists of securities that have not been rated by a NRSRO. Credit ratings are subject to change.
| | | | |
PGIM Emerging Markets Debt Local Currency Fund | | | 7 | |
Strategy and Performance Overview (unaudited)
How did the Fund perform?
The PGIM Emerging Markets Debt Local Currency Fund’s Class Z shares returned -3.45% in the 12-month reporting period that ended October 31, 2020, outperforming the -3.81% return of the JP Morgan Government Bond Index–Emerging Markets Global Diversified Index (the Index).
What were the market conditions?
| | • | | Following several stable months, the last part of the reporting period was dominated by the global outbreak of COVID-19, its economic impact, and the resulting decline in risk sentiment around the globe. After generating stable returns during the latter part of 2019, emerging market debt declined sharply during the first quarter of 2020 as the dramatic global liquidity and confidence shocks related to the spread of COVID-19 and a drop in oil prices led to acute declines across most fixed income spread sectors. In response to unprecedented monetary and fiscal stimulus programs aimed at stabilizing the economy and financial markets, emerging market assets subsequently rose sharply, but spreads remained wider than their pre-COVID-19 levels at the end of the period. |
| | • | | While persistent trade war uncertainties and local episodes of social protest provided some headwinds, during the latter part of 2019 emerging market debt continued to benefit from accommodative central banks, low and range-bound developed markets rates, and an extended (albeit slow) global economic expansion. At the start of 2020, the global economy appeared poised to stabilize and perhaps even improve, with manufacturing bottoming out across a number of countries and a pipeline of monetary stimulus in place following a global round of central bank easing in the second half of 2019. The optimism generated by the US-China trade deal, a positive turn in the global technology cycle, and central banks’ bias to ease further, if needed, shifted perceived economic risks from being skewed to the downside to being more balanced. But then COVID-19 hit headlines, with person-to-person transmission reported in January 2020 marking a turning point. Financial markets then witnessed a dramatic turn of events, perhaps best exemplified by the sharp drop in US Treasury yields. |
| | • | | After generating gains throughout the latter part of 2019, emerging market debt declined sharply during the first quarter of 2020, with the intensity of the sell-off characterized by severe dislocations from retail outflows, particularly out of passive emerging market exchange-traded funds. Although policy measures implemented by fiscal authorities, the Federal Reserve (the Fed), and other developed market central banks provided necessary liquidity and support during the latter part of the quarter, emerging market debt spreads and yields widened dramatically. Emerging market hard currency spreads widened 335 basis points (bps) during the quarter, while emerging market corporate bond spreads widened by 288 bps. (One basis point is 0.01%.) Emerging market local rates and emerging market currencies suffered similar sell-offs. |
| | |
| 8 | | Visit our website at pgim.com/investments |
| | • | | With the global economy decelerating rapidly and financial markets selling off sharply due to the pandemic and related lockdowns, the Fed and the European Central Bank reacted by cutting policy rates, initiating (or increasing) asset purchases, and expanding liquidity facilities. The unprecedented easing provided a tailwind for emerging market policymakers, allowing the main policy rates to be cut to all-time lows in most countries. While emerging market issuers did not benefit from the support offered to developed markets credit-related issuers, the sector benefited from the broad improvement in liquidity, a better growth outlook, a rise in oil prices, market access, and support from the International Monetary Fund’s Rapid Financing Instrument. |
| | • | | Following a difficult first quarter, emerging market assets staged a strong recovery in the second and third quarters of 2020. Risk-on sentiment amid improving economic data, a gradual reopening of economies, and broad policy support saw spreads and yields decline sharply from oversold levels over the last seven months of the period. In October, flows into emerging market bond funds continued to reverse the outflows seen earlier in the year by posting one of the strongest months of retail inflows into emerging market fixed income bond funds in all of 2020. For the month, local currency funds posted inflows of $2.8 billion. At the beginning of April, year-to-date emerging market bond fund flows reached almost -$30 billion; but as of the end of the period, they had reversed nearly all those outflows. |
| | • | | However, at period-end, most emerging market assets remained wider than where they began 2020. Emerging market hard currency and corporate spreads continued to tighten in the third quarter of 2020 and ended the period at 421 bps and 366 bps, respectively, but remained wider than where they began the year. Local rates staged a stronger recovery, with yields tightening below their beginning-of-the-year levels by the end of the period. Meanwhile, emerging market currency performance was positive in the second and third quarters but remained in negative territory for the year as of period-end. |
What worked?
| | • | | Duration positioning added to the Fund’s performance over the reporting period. (Duration is a measure of the interest rate sensitivity of a bond portfolio or debt securities that is expressed as a number of years.) Long duration positioning in South Africa, Mexico, Russia, China, and South Korea, along with short duration positioning in Colombia, added value. The year saw unprecedented accommodative monetary policy from global central banks in response to COVID-19, and the Fund benefited from long duration in countries with high real yields and ample room to ease policy rates coming into the year. |
| | • | | Although security selection overall detracted from performance, positioning in Brazil, Mexico, and Russia added value. The Fund’s allocation to off-Index hard currency bonds was also positive. |
| | | | |
PGIM Emerging Markets Debt Local Currency Fund | | | 9 | |
Strategy and Performance Review (continued)
| | • | | While overall currency selection was negative, overweights to the Chinese yuan and South Korean won, along with underweights to the Turkish lira and Brazilian real, all contributed to performance. |
What didn’t work?
| | • | | Positioning in Turkey, along with short duration positioning in Malaysia and long duration positioning in Brazil, detracted from the Fund’s returns over the period. |
| | • | | Overall yield curve positioning and security selection hurt performance, with positioning in Indonesia, South Africa, and Colombia the largest detractors. |
| | • | | Overweights to the Indonesia rupiah, Czech koruna, and Polish zloty were negative. The impact of COVID-19 weighed on riskier currencies. In this environment, developed market currencies such as the US dollar outperformed emerging market foreign currencies. Commodity currencies also lagged. |
Did the Fund use derivatives?
Currency positioning in the Fund was partially facilitated by the use of currency forward and option contracts. During the reporting period, the Fund’s currency positioning detracted from relative performance. The Fund also used futures and interest rate swaps, in part, to help manage duration and yield curve exposure, which collectively had a negative impact on performance.
Current outlook
| | • | | PGIM Fixed Income continues to believe current market dynamics present an attractive opportunity to actively add alpha-generating trades across hard currency bonds, local rates, and emerging market currencies. While remaining focused on the long term, PGIM Fixed Income believes there are certain high-conviction trades likely to perform in the near term. |
| | • | | In local bonds, PGIM Fixed Income continues to focus on markets where real yields are higher, seeing the potential for further compression. Its main overweights include China, South Africa, and Peru. PGIM Fixed Income believes exposure to the Chinese bond market is the most attractive risk-reward trade in emerging market local markets, and the market remains the Fund’s top overweight. The People’s Bank of China injected sizable liquidity into its bond market in September and October of 2020, and the market should see favorable technicals in the coming months as China’s weight increases in several major fixed income indices. |
| | • | | In emerging market currencies, PGIM Fixed Income is short the US dollar, taking the view that fiscal and monetary stimulus will be ample enough over the medium term to support global growth and, in turn, cause the US dollar to either remain stable or weaken further. PGIM Fixed Income favors higher-quality currencies in Asia and Europe. |
| | |
| 10 | | Visit our website at pgim.com/investments |
Fees and Expenses (unaudited)
As a shareholder of the Fund, you incur two types of costs: (1) transaction costs, including sales charges (loads) on purchase payments and redemptions, as applicable, and (2) ongoing costs, including management fees, distribution, and/or service (12b-1) fees, and other Fund expenses, as applicable. This example is intended to help you understand your ongoing costs (in dollars) of investing in the Fund and to compare these costs with the ongoing costs of investing in other mutual funds.
The example is based on an investment of $1,000 held through the six-month period ended October 31, 2020. The example is for illustrative purposes only; you should consult the Fund’s Prospectus for information on initial and subsequent minimum investment requirements.
Actual Expenses
The first line for each share class in the table on the following page provides information about actual account values and actual expenses. You may use the information on this line, together with the amount you invested, to estimate the expenses that you paid over the period. Simply divide your account value by $1,000 (for example, an $8,600 account value ÷ $1,000 = 8.6), then multiply the result by the number on the first line under the heading “Expenses Paid During the Six-Month Period” to estimate the expenses you paid on your account during this period.
Hypothetical Example for Comparison Purposes
The second line for each share class in the table on the following page provides information about hypothetical account values and hypothetical expenses based on the Fund’s actual expense ratio and an assumed rate of return of 5% per year before expenses, which is not the Fund’s actual return. The hypothetical account values and expenses may not be used to estimate the actual ending account balance or expenses you paid for the period. You may use this information to compare the ongoing costs of investing in the Fund and other funds. To do so, compare this 5% hypothetical example with the 5% hypothetical examples that appear in the shareholder reports of the other funds.
The Fund’s transfer agent may charge additional fees to holders of certain accounts that are not included in the expenses shown in the table on the following page. These fees apply to individual retirement accounts (IRAs) and Section 403(b) accounts. As of the close of the six-month period covered by the table, IRA fees included an annual maintenance fee of $15 per account (subject to a maximum annual maintenance fee of $25 for all accounts held by the same shareholder). Section 403(b) accounts are charged an annual $25 fiduciary maintenance fee. Some of the fees may vary in amount, or may be waived, based on your total account balance or the number of PGIM funds, including the Fund, that you own. You should consider the additional fees that were charged to your Fund account over the six-month period when you estimate the total ongoing expenses paid over the period
| | | | |
PGIM Emerging Markets Debt Local Currency Fund | | | 11 | |
Fees and Expenses (continued)
and the impact of these fees on your ending account value, as these additional expenses are not reflected in the information provided in the expense table. Additional fees have the effect of reducing investment returns.
Please note that the expenses shown in the table are meant to highlight your ongoing costs only and do not reflect any transactional costs such as sales charges (loads). Therefore, the second line for each share class in the table is useful in comparing ongoing costs only and will not help you determine the relative total costs of owning different funds. In addition, if these transactional costs were included, your costs would have been higher.
| | | | | | | | | | | | | | | | | | |
| | | | |
PGIM
Emerging Markets Debt
Local Currency Fund | | Beginning Account
Value
May 1, 2020 | | | Ending Account
Value
October 31, 2020 | | | Annualized
Expense Ratio
Based on the
Six-Month Period | | | Expenses Paid
During the
Six-Month Period* | |
| Class A | | Actual | | $ | 1,000.00 | | | $ | 1,091.50 | | | | 1.13 | % | | $ | 5.94 | |
| | Hypothetical | | $ | 1,000.00 | | | $ | 1,019.46 | | | | 1.13 | % | | $ | 5.74 | |
| Class C | | Actual | | $ | 1,000.00 | | | $ | 1,086.80 | | | | 1.88 | % | | $ | 9.86 | |
| | Hypothetical | | $ | 1,000.00 | | | $ | 1,015.69 | | | | 1.88 | % | | $ | 9.53 | |
| Class Z | | Actual | | $ | 1,000.00 | | | $ | 1,093.00 | | | | 0.72 | % | | $ | 3.79 | |
| | Hypothetical | | $ | 1,000.00 | | | $ | 1,021.52 | | | | 0.72 | % | | $ | 3.66 | |
| Class R6 | | Actual | | $ | 1,000.00 | | | $ | 1,093.40 | | | | 0.65 | % | | $ | 3.42 | |
| | | Hypothetical | | $ | 1,000.00 | | | $ | 1,021.87 | | | | 0.65 | % | | $ | 3.30 | |
*Fund expenses (net of fee waivers or subsidies, if any) for each share class are equal to the annualized expense ratio for each share class (provided in the table), multiplied by the average account value over the period, multiplied by the 184 days in the six-month period ended October 31, 2020, and divided by the 366 days in the Fund’s fiscal year ended October 31, 2020 (to reflect the six-month period). Expenses presented in the table include the expenses of any underlying portfolios in which the Fund may invest.
| | |
| 12 | | Visit our website at pgim.com/investments |
Schedule of Investments
as of October 31, 2020
| | | | | | | | | | | | | | | | |
| | | | |
| Description | | Interest
Rate | | | Maturity
Date | | | Principal
Amount
(000)# | | | Value | |
| | | | |
LONG-TERM INVESTMENTS 93.2% | | | | | | | | | | | | | | | | |
| | | | |
SOVEREIGN BONDS 84.9% | | | | | | | | | | | | | | | | |
| | | | |
Angola 0.6% | | | | | | | | | | | | | | | | |
Angolan Government International Bond,
Sr. Unsec’d. Notes | | | 9.500 | % | | | 11/12/25 | | | | 400 | | | $ | 343,049 | |
| | | | | | | | | | | | | | | | |
| | | | |
Argentina 0.5% | | | | | | | | | | | | | | | | |
Argentine Republic Government International Bond, | | | | | | | | | | | | | | | | |
Sr. Unsec’d. Notes | | | 0.125 | (cc) | | | 07/09/30 | | | | 465 | | | | 170,380 | |
Sr. Unsec’d. Notes | | | 1.000 | | | | 07/09/29 | | | | 24 | | | | 9,766 | |
Provincia de Buenos Aires, | | | | | | | | | | | | | | | | |
Sr. Unsec’d. Notes | | | 9.125 | | | | 03/16/24 | | | | 200 | | | | 65,135 | |
Sr. Unsec’d. Notes | | | 9.950 | | | | 06/09/21 | | | | 140 | | | | 45,905 | |
| | | | | | | | | | | | | | | | |
| | | | |
| | | | | | | | | | | | | | | 291,186 | |
| | | | |
Brazil 5.0% | | | | | | | | | | | | | | | | |
Brazil Minas SPE via State of Minas Gerais, | | | | | | | | | | | | | | | | |
Gov’t. Gtd. Notes | | | 5.333 | | | | 02/15/28 | | | | 188 | | | | 198,292 | |
Brazil Notas do Tesouro Nacional, | | | | | | | | | | | | | | | | |
Notes, Series NTNF | | | 10.000 | | | | 01/01/23 | | | BRL | 5,500 | | | | 1,050,456 | |
Notes, Series NTNF | | | 10.000 | | | | 01/01/25 | | | BRL | 6,050 | | | | 1,180,806 | |
Notes, Series NTNF | | | 10.000 | | | | 01/01/27 | | | BRL | 1,600 | | | | 314,491 | |
Notes, Series NTNF | | | 10.000 | | | | 01/01/29 | | | BRL | 1,400 | | | | 278,847 | |
Notes, Series NTNF | | | 10.000 | | | | 01/01/31 | | | BRL | 200 | | | | 39,851 | |
Brazilian Government International Bond, | | | | | | | | | | | | | | | | |
Sr. Unsec’d. Notes | | | 8.500 | | | | 01/05/24 | | | BRL | 54 | | | | 10,329 | |
| | | | | | | | | | | | | | | | |
| | | | |
| | | | | | | | | | | | | | | 3,073,072 | |
| | | | |
Chile 2.7% | | | | | | | | | | | | | | | | |
Bonos de la Tesoreria de la Republica en pesos, | | | | | | | | | | | | | | | | |
Bonds | | | 4.500 | | | | 03/01/26 | | | CLP | 280,000 | | | | 418,101 | |
Bonds | | | 5.000 | | | | 03/01/35 | | | CLP | 240,000 | | | | 373,053 | |
Bonds, Series 30YR | | | 6.000 | | | | 01/01/43 | | | CLP | 190,000 | | | | 340,080 | |
Unsec’d. Notes, 144A | | | 4.700 | | | | 09/01/30 | | | CLP | 360,000 | | | | 549,542 | |
| | | | | | | | | | | | | | | | |
| | | | |
| | | | | | | | | | | | | | | 1,680,776 | |
| | | | |
China 8.6% | | | | | | | | | | | | | | | | |
China Government Bond, | | | | | | | | | | | | | | | | |
Bonds, Series 1906 | | | 3.290 | | | | 05/23/29 | | | CNH | 6,690 | | | | 1,005,231 | |
Bonds, Series INBK | | | 2.850 | | | | 06/04/27 | | | CNH | 12,500 | | | | 1,822,701 | |
Bonds, Series 1910 | | | 3.860 | | | | 07/22/49 | | | CNH | 3,110 | | | | 463,343 | |
See Notes to Financial Statements.
| | | | |
| PGIM Emerging Markets Debt Local Currency Fund | | | 13 | |
Schedule of Investments (continued)
as of October 31, 2020
| | | | | | | | | | | | | | | | |
| | | | |
| Description | | Interest
Rate | | | Maturity
Date | | | Principal Amount (000)# | | | Value | |
|
SOVEREIGN BONDS (Continued) | |
| | | | |
China (cont’d.) | | | | | | | | | | | | | | | | |
China Government Bond, (cont’d.) | | | | | | | | | | | | | | | | |
Bonds, Series INBK | | | 1.990 | % | | | 04/09/25 | | | CNH | 6,500 | | | $ | 929,468 | |
Bonds, Series INBK | | | 2.680 | | | | 05/21/30 | | | CNH | 7,700 | | | | 1,102,661 | |
| | | | | | | | | | | | | | | | |
| | | | |
| | | | | | | | | | | | | | | 5,323,404 | |
| | | | |
Colombia 4.6% | | | | | | | | | | | | | | | | |
Colombian TES, | | | | | | | | | | | | | | | | |
Bonds, Series B | | | 6.000 | | | | 04/28/28 | | | COP | 4,531,000 | | | | 1,220,927 | |
Bonds, Series B | | | 7.500 | | | | 08/26/26 | | | COP | 1,400,000 | | | | 413,634 | |
Bonds, Series B | | | 6.250 | | | | 11/26/25 | | | COP | 500,000 | | | | 140,614 | |
Bonds, Series B | | | 7.000 | | | | 06/30/32 | | | COP | 1,947,600 | | | | 536,102 | |
Bonds, Series B | | | 7.250 | | | | 10/18/34 | | | COP | 829,000 | | | | 229,260 | |
Bonds, Series B | | | 7.250 | | | | 10/26/50 | | | COP | 581,000 | | | | 155,063 | |
Bonds, Series B | | | 7.750 | | | | 09/18/30 | | | COP | 500,000 | | | | 147,664 | |
| | | | | | | | | | | | | | | | |
| | | | |
| | | | | | | | | | | | | | | 2,843,264 | |
| | | | |
Czech Republic 3.2% | | | | | | | | | | | | | | | | |
Czech Republic Government Bond, | | | | | | | | | | | | | | | | |
Bonds, Series 049 | | | 4.200 | | | | 12/04/36 | | | CZK | 3,500 | | | | 215,601 | |
Bonds, Series 078 | | | 2.500 | | | | 08/25/28 | | | CZK | 2,100 | | | | 101,027 | |
Bonds, Series 089 | | | 2.400 | | | | 09/17/25 | | | CZK | 3,200 | | | | 148,803 | |
Bonds, Series 094 | | | 0.950 | | | | 05/15/30 | | | CZK | 12,090 | | | | 514,556 | |
Bonds, Series 100 | | | 0.250 | | | | 02/10/27 | | | CZK | 8,800 | | | | 364,047 | |
Bonds, Series 103 | | | 2.000 | | | | 10/13/33 | | | CZK | 5,620 | | | | 265,334 | |
Bonds, Series 105 | | | 2.750 | | | | 07/23/29 | | | CZK | 3,500 | | | | 172,799 | |
Bonds, Series 121 | | | 1.200 | | | | 03/13/31 | | | CZK | 4,800 | | | | 208,332 | |
| | | | | | | | | | | | | | | | |
| | | | |
| | | | | | | | | | | | | | | 1,990,499 | |
| | | | |
Dominican Republic 0.2% | | | | | | | | | | | | | | | | |
Dominican Republic International Bond, | | | | | | | | | | | | | | | | |
Sr. Unsec’d. Notes | | | 9.750 | | | | 06/05/26 | | | DOP | 8,000 | | | | 141,329 | |
| | | | | | | | | | | | | | | | |
| | | | |
El Salvador 0.2% | | | | | | | | | | | | | | | | |
El Salvador Government International Bond, | | | | | | | | | | | | | | | | |
Sr. Unsec’d. Notes | | | 7.750 | | | | 01/24/23 | | | | 125 | | | | 113,820 | |
| | | | | | | | | | | | | | | | |
See Notes to Financial Statements.
| | | | | | | | | | | | | | | | |
| | | | |
| Description | | Interest
Rate | | | Maturity
Date | | | Principal
Amount
(000)# | | | Value | |
|
SOVEREIGN BONDS (Continued) | |
| | | | |
Gabon 0.6% | | | | | | | | | | | | | | | | |
Gabon Government International Bond, | | | | | | | | | | | | | | | | |
Bonds | | | 6.375 | % | | | 12/12/24 | | | | 200 | | | $ | 191,002 | |
Sr. Unsec’d. Notes | | | 6.950 | | | | 06/16/25 | | | | 200 | | | | 189,491 | |
| | | | | | | | | | | | | | | | |
| | | | |
| | | | | | | | | | | | | | | 380,493 | |
| | | | |
Ghana 0.5% | | | | | | | | | | | | | | | | |
Ghana Government International Bond, | | | | | | | | | | | | | | | | |
Sr. Unsec’d. Notes | | | 8.125 | | | | 01/18/26 | | | | 285 | | | | 287,380 | |
| | | | | | | | | | | | | | | | |
| | | | |
Hungary 3.5% | | | | | | | | | | | | | | | | |
Hungary Government Bond, | | | | | | | | | | | | | | | | |
Bonds, Series 28/A | | | 6.750 | | | | 10/22/28 | | | HUF | 56,680 | | | | 244,573 | |
Bonds, Series 24/C | | | 2.500 | | | | 10/24/24 | | | HUF | 40,000 | | | | 132,595 | |
Bonds, Series 25/B | | | 5.500 | | | | 06/24/25 | | | HUF | 219,080 | | | | 822,695 | |
Bonds, Series 26/D | | | 2.750 | | | | 12/22/26 | | | HUF | 50,000 | | | | 167,992 | |
Bonds, Series 26/E | | | 1.500 | | | | 04/22/26 | | | HUF | 100,000 | | | | 313,623 | |
Bonds, Series 27/A | | | 3.000 | | | | 10/27/27 | | | HUF | 42,680 | | | | 146,197 | |
Bonds, Series 30/A | | | 3.000 | | | | 08/21/30 | | | HUF | 77,000 | | | | 262,611 | |
Bonds, Series 38/A | | | 3.000 | | | | 10/27/38 | | | HUF | 21,890 | | | | 74,845 | |
| | | | | | | | | | | | | | | | |
| | | | |
| | | | | | | | | | | | | | | 2,165,131 | |
| | | | |
Indonesia 8.8% | | | | | | | | | | | | | | | | |
Indonesia Treasury Bond, | | | | | | | | | | | | | | | | |
Bonds, Series 056 | | | 8.375 | | | | 09/15/26 | | | IDR | 6,561,000 | | | | 502,535 | |
Bonds, Series 059 | | | 7.000 | | | | 05/15/27 | | | IDR | 7,765,000 | | | | 552,266 | |
Bonds, Series 064 | | | 6.125 | | | | 05/15/28 | | | IDR | 2,400,000 | | | | 160,339 | |
Bonds, Series 065 | | | 6.625 | | | | 05/15/33 | | | IDR | 3,200,000 | | | | 212,312 | |
Bonds, Series 068 | | | 8.375 | | | | 03/15/34 | | | IDR | 8,950,000 | | | | 670,440 | |
Bonds, Series 070 | | | 8.375 | | | | 03/15/24 | | | IDR | 7,910,000 | | | | 593,484 | |
Bonds, Series 071 | | | 9.000 | | | | 03/15/29 | | | IDR | 6,310,000 | | | | 495,262 | |
Bonds, Series 072 | | | 8.250 | | | | 05/15/36 | | | IDR | 4,760,000 | | | | 351,508 | |
Bonds, Series 073 | | | 8.750 | | | | 05/15/31 | | | IDR | 8,805,000 | | | | 682,448 | |
Bonds, Series 075 | | | 7.500 | | | | 05/15/38 | | | IDR | 4,900,000 | | | | 340,778 | |
Bonds, Series 077 | | | 8.125 | | | | 05/15/24 | | | IDR | 3,500,000 | | | | 261,355 | |
Bonds, Series 078 | | | 8.250 | | | | 05/15/29 | | | IDR | 5,050,000 | | | | 382,000 | |
Bonds, Series 082 | | | 7.000 | | | | 09/15/30 | | | IDR | 3,500,000 | | | | 246,487 | |
| | | | | | | | | | | | | | | | |
| | | | |
| | | | | | | | | | | | | | | 5,451,214 | |
See Notes to Financial Statements.
| | | | |
| PGIM Emerging Markets Debt Local Currency Fund | | | 15 | |
Schedule of Investments (continued)
as of October 31, 2020
| | | | | | | | | | | | | | | | |
| | | | |
| Description | | Interest
Rate | | | Maturity
Date | | | Principal
Amount
(000)# | | | Value | |
|
SOVEREIGN BONDS (Continued) | |
| | | | |
Ivory Coast 0.5% | | | | | | | | | | | | | | | | |
Ivory Coast Government International Bond, | | | | | | | | | | | | | | | | |
Sr. Unsec’d. Notes | | | 5.125 | % | | | 06/15/25 | | | EUR | 265 | | | $ | 321,033 | |
| | | | | | | | | | | | | | | | |
| | | | |
Malaysia 6.2% | | | | | | | | | | | | | | | | |
Malaysia Government Bond, | | | | | | | | | | | | | | | | |
Bonds, Series 115 | | | 3.955 | | | | 09/15/25 | | | MYR | 1,150 | | | | 301,409 | |
Bonds, Series 116 | | | 3.800 | | | | 08/17/23 | | | MYR | 750 | | | | 190,334 | |
Bonds, Series 118 | | | 3.882 | | | | 03/14/25 | | | MYR | 1,977 | | | | 512,171 | |
Bonds, Series 217 | | | 4.059 | | | | 09/30/24 | | | MYR | 335 | | | | 87,016 | |
Bonds, Series 219 | | | 3.885 | | | | 08/15/29 | | | MYR | 1,800 | | | | 474,910 | |
Bonds, Series 310 | | | 4.498 | | | | 04/15/30 | | | MYR | 400 | | | | 110,380 | |
Bonds, Series 311 | | | 4.392 | | | | 04/15/26 | | | MYR | 285 | | | | 76,316 | |
Bonds, Series 316 | | | 3.900 | | | | 11/30/26 | | | MYR | 2,970 | | | | 780,063 | |
Bonds, Series 317 | | | 4.762 | | | | 04/07/37 | | | MYR | 700 | | | | 197,298 | |
Bonds, Series 411 | | | 4.232 | | | | 06/30/31 | | | MYR | 280 | | | | 76,189 | |
Bonds, Series 413 | | | 3.844 | | | | 04/15/33 | | | MYR | 140 | | | | 36,209 | |
Bonds, Series 417 | | | 3.899 | | | | 11/16/27 | | | MYR | 1,370 | | | | 360,989 | |
Bonds, Series 419 | | | 3.828 | | | | 07/05/34 | | | MYR | 500 | | | | 129,910 | |
Bonds, Series 513 | | | 3.733 | | | | 06/15/28 | | | MYR | 730 | | | | 190,320 | |
Bonds, Series 518 | | | 4.921 | | | | 07/06/48 | | | MYR | 445 | | | | 123,780 | |
Malaysia Government Investment Issue, | | | | | | | | | | | | | | | | |
Bonds, Series 617 | | | 4.724 | | | | 06/15/33 | | | MYR | 600 | | | | 166,870 | |
| | | | | | | | | | | | | | | | |
| | | | |
| | | | | | | | | | | | | | | 3,814,164 | |
| | | | |
Mexico 4.4% | | | | | | | | | | | | | | | | |
Mexican Bonos, | | | | | | | | | | | | | | | | |
Bonds, Series M | | | 8.000 | | | | 11/07/47 | | | MXN | 4,150 | | | | 212,289 | |
Bonds, Series M | | | 7.750 | | | | 05/29/31 | | | MXN | 17,100 | | | | 899,231 | |
Bonds, Series M20 | | | 7.500 | | | | 06/03/27 | | | MXN | 10,000 | | | | 518,934 | |
Bonds, Series M30 | | | 10.000 | | | | 11/20/36 | | | MXN | 4,600 | | | | 283,064 | |
Sr. Unsec’d. Notes, Series M | | | 7.750 | | | | 11/13/42 | | | MXN | 5,400 | | | | 270,581 | |
Sr. Unsec’d. Notes, Series M20 | | | 8.500 | | | | 05/31/29 | | | MXN | 2,500 | | | | 137,333 | |
Sr. Unsec’d. Notes, Series M30 | | | 8.500 | | | | 11/18/38 | | | MXN | 7,000 | | | | 378,916 | |
| | | | | | | | | | | | | | | | |
| | | | |
| | | | | | | | | | | | | | | 2,700,348 | |
| | | | |
Nigeria 0.3% | | | | | | | | | | | | | | | | |
Nigeria Government International Bond, | | | | | | | | | | | | | | | | |
Sr. Unsec’d. Notes | | | 7.625 | | | | 11/21/25 | | | | 200 | | | | 210,016 | |
| | | | | | | | | | | | | | | | |
See Notes to Financial Statements.
| | | | | | | | | | | | | | | | |
| | | | |
| Description | | Interest
Rate | | | Maturity
Date | | | Principal
Amount
(000)# | | | Value | |
|
SOVEREIGN BONDS (Continued) | |
| | | | |
Pakistan 0.6% | | | | | | | | | | | | | | | | |
Third Pakistan International Sukuk Co. Ltd. (The), | | | | | | | | | | | | | | | | |
Sr. Unsec’d. Notes, 144A | | | 5.625 | % | | | 12/05/22 | | | | 400 | | | $ | 398,554 | |
| | | | | | | | | | | | | | | | |
| | | | |
Peru 3.6% | | | | | | | | | | | | | | | | |
Peru Government Bond, | | | | | | | | | | | | | | | | |
Bonds | | | 6.950 | | | | 08/12/31 | | | PEN | 190 | | | | 64,761 | |
Sr. Unsec’d. Notes | | | 5.350 | | | | 08/12/40 | | | PEN | 1,000 | | | | 269,229 | |
Sr. Unsec’d. Notes | | | 5.400 | | | | 08/12/34 | | | PEN | 580 | | | | 168,981 | |
Sr. Unsec’d. Notes | | | 5.940 | | | | 02/12/29 | | | PEN | 200 | | | | 65,918 | |
Sr. Unsec’d. Notes | | | 6.150 | | | | 08/12/32 | | | PEN | 1,150 | | | | 366,417 | |
Peruvian Government International Bond, | | | | | | | | | | | | | | | | |
Sr. Unsec’d. Notes | | | 6.350 | | | | 08/12/28 | | | PEN | 305 | | | | 103,020 | |
Sr. Unsec’d. Notes | | | 6.900 | | | | 08/12/37 | | | PEN | 871 | | | | 284,646 | |
Sr. Unsec’d. Notes | | | 6.950 | | | | 08/12/31 | | | PEN | 1,548 | | | | 528,352 | |
Sr. Unsec’d. Notes | | | 8.200 | | | | 08/12/26 | | | PEN | 1,032 | | | | 383,888 | |
| | | | | | | | | | | | | | | | |
| | | | |
| | | | | | | | | | | | | | | 2,235,212 | |
| | | | |
Philippines 0.2% | | | | | | | | | | | | | | | | |
Philippine Government Bond, | | | | | | | | | | | | | | | | |
Bonds, Series 1060 | | | 3.625 | | | | 09/09/25 | | | PHP | 5,600 | | | | 119,813 | |
| | | | | | | | | | | | | | | | |
| | | | |
Poland 4.8% | | | | | | | | | | | | | | | | |
Republic of Poland Government Bond, | | | | | | | | | | | | | | | | |
Bonds, Series 428 | | | 2.750 | | | | 04/25/28 | | | PLN | 1,250 | | | | 357,067 | |
Bonds, Series 727 | | | 2.500 | | | | 07/25/27 | | | PLN | 1,300 | | | | 364,755 | |
Bonds, Series 0725 | | | 3.250 | | | | 07/25/25 | | | PLN | 1,671 | | | | 478,778 | |
Bonds, Series 0726 | | | 2.500 | | | | 07/25/26 | | | PLN | 3,740 | | | | 1,044,648 | |
Bonds, Series 1029 | | | 2.750 | | | | 10/25/29 | | | PLN | 1,740 | | | | 501,501 | |
Bonds, Series 1030 | | | 1.250 | | | | 10/25/30 | | | PLN | 750 | | | | 190,587 | |
| | | | | | | | | | | | | | | | |
| | | | |
| | | | | | | | | | | | | | | 2,937,336 | |
| | | | |
Romania 2.6% | | | | | | | | | | | | | | | | |
Romania Government Bond, | | | | | | | | | | | | | | | | |
Bonds, Series 15 Year | | | 3.650 | | | | 09/24/31 | | | RON | 590 | | | | 143,193 | |
Bonds, Series 05YR | | | 3.650 | | | | 07/28/25 | | | RON | 1,000 | | | | 244,806 | |
Bonds, Series 05YR | | | 4.250 | | | | 06/28/23 | | | RON | 2,670 | | | | 661,536 | |
Bonds, Series 07YR | | | 3.250 | | | | 04/29/24 | | | RON | 750 | | | | 181,715 | |
Bonds, Series 07YR | | | 4.850 | | | | 04/22/26 | | | RON | 500 | | | | 129,642 | |
See Notes to Financial Statements.
| | | | |
| PGIM Emerging Markets Debt Local Currency Fund | | | 17 | |
Schedule of Investments (continued)
as of October 31, 2020
| | | | | | | | | | | | | | | | |
| | | | |
| Description | | Interest
Rate | | | Maturity
Date | | | Principal
Amount
(000)# | | | Value | |
|
SOVEREIGN BONDS (Continued) | |
| | | | |
Romania (cont’d.) | | | | | | | | | | | | | | | | |
Romania Government Bond, (cont’d.) | | | | | | | | | | | | | | | | |
Bonds, Series 10YR | | | 5.000 | % | | | 02/12/29 | | | RON | 500 | | | $ | 134,914 | |
Bonds, Series 10YR | | | 5.850 | | | | 04/26/23 | | | RON | 460 | | | | 117,941 | |
| | | | | | | | | | | | | | | | |
| | | | |
| | | | | | | | | | | | | | | 1,613,747 | |
| | | | |
Russia 2.7% | | | | | | | | | | | | | | | | |
Russian Federal Bond - OFZ, | | | | | | | | | | | | | | | | |
Bonds, Series 6224 | | | 6.900 | | | | 05/23/29 | | | RUB | 15,000 | | | | 200,492 | |
Bonds, Series 6212 | | | 7.050 | | | | 01/19/28 | | | RUB | 19,800 | | | | 267,727 | |
Bonds, Series 6218 | | | 8.500 | | | | 09/17/31 | | | RUB | 24,092 | | | | 356,147 | |
Bonds, Series 6221 | | | 7.700 | | | | 03/23/33 | | | RUB | 27,090 | | | | 380,570 | |
Bonds, Series 6228 | | | 7.650 | | | | 04/10/30 | | | RUB | 13,800 | | | | 192,851 | |
Bonds, Series 6230 | | | 7.700 | | | | 03/16/39 | | | RUB | 9,200 | | | | 131,638 | |
Bonds, Series 6232 | | | 6.000 | | | | 10/06/27 | | | RUB | 8,500 | | | | 108,307 | |
| | | | | | | | | | | | | | | | |
| | | | |
| | | | | | | | | | | | | | | 1,637,732 | |
| | | | |
South Africa 9.6% | | | | | | | | | | | | | | | | |
Republic of South Africa Government Bond, | | | | | | | | | | | | | | | | |
Sr. Unsec’d. Notes, Series 2035 | | | 8.875 | | | | 02/28/35 | | | ZAR | 2,490 | | | | 127,988 | |
Sr. Unsec’d. Notes, Series R186 | | | 10.500 | | | | 12/21/26 | | | ZAR | 24,648 | | | | 1,768,938 | |
Sr. Unsec’d. Notes, Series R213 | | | 7.000 | | | | 02/28/31 | | | ZAR | 7,830 | | | | 393,996 | |
Sr. Unsec’d. Notes, Series 2023 | | | 7.750 | | | | 02/28/23 | | | ZAR | 1,500 | | | | 99,303 | |
Sr. Unsec’d. Notes, Series 2030 | | | 8.000 | | | | 01/31/30 | | | ZAR | 19,200 | | | | 1,085,056 | |
Sr. Unsec’d. Notes, Series 2032 | | | 8.250 | | | | 03/31/32 | | | ZAR | 17,240 | | | | 910,440 | |
Sr. Unsec’d. Notes, Series 2037 | | | 8.500 | | | | 01/31/37 | | | ZAR | 6,180 | | | | 297,738 | |
Sr. Unsec’d. Notes, Series 2040 | | | 9.000 | | | | 01/31/40 | | | ZAR | 4,130 | | | | 202,816 | |
Sr. Unsec’d. Notes, Series 2044 | | | 8.750 | | | | 01/31/44 | | | ZAR | 5,485 | | | | 256,750 | |
Sr. Unsec’d. Notes, Series 2048 | | | 8.750 | | | | 02/28/48 | | | ZAR | 10,375 | | | | 483,546 | |
Sr. Unsec’d. Notes, Series R209 | | | 6.250 | | | | 03/31/36 | | | ZAR | 3,850 | | | | 155,193 | |
Sr. Unsec’d. Notes, Series R214 | | | 6.500 | | | | 02/28/41 | | | ZAR | 4,470 | | | | 168,278 | |
| | | | | | | | | | | | | | | | |
| | | | |
| | | | | | | | | | | | | | | 5,950,042 | |
| | | | |
Thailand 7.5% | | | | | | | | | | | | | | | | |
Thailand Government Bond, | | | | | | | | | | | | | | | | |
Bonds | | | 1.600 | | | | 12/17/29 | | | THB | 9,735 | | | | 319,082 | |
Bonds | | | 2.875 | | | | 12/17/28 | | | THB | 24,740 | | | | 892,178 | |
Bonds | | | 2.875 | | | | 06/17/46 | | | THB | 7,150 | | | | 265,662 | |
Bonds | | | 3.300 | | | | 06/17/38 | | | THB | 8,300 | | | | 323,098 | |
Bonds | | | 3.400 | | | | 06/17/36 | | | THB | 11,040 | | | | 436,484 | |
Sr. Unsec’d. Notes | | | 1.600 | | | | 06/17/35 | | | THB | 3,900 | | | | 125,220 | |
See Notes to Financial Statements.
| | | | | | | | | | | | | | | | |
| | | | |
| Description | | Interest
Rate | | | Maturity
Date | | | Principal
Amount
(000)# | | | Value | |
|
SOVEREIGN BONDS (Continued) | |
| | | | |
Thailand (cont’d.) | | | | | | | | | | | | | | | | |
Thailand Government Bond, (cont’d.) | | | | | | | | | | | | | | | | |
Sr. Unsec’d. Notes | | | 2.125 | % | | | 12/17/26 | | | THB | 20,320 | | | $ | 695,160 | |
Sr. Unsec’d. Notes | | | 3.625 | | | | 06/16/23 | | | THB | 8,530 | | | | 295,211 | |
Sr. Unsec’d. Notes | | | 3.650 | | | | 06/20/31 | | | THB | 17,100 | | | | 666,774 | |
Sr. Unsec’d. Notes | | | 3.775 | | | | 06/25/32 | | | THB | 15,300 | | | | 609,232 | |
| | | | | | | | | | | | | | | | |
| | | | |
| | | | | | | | | | | | | | | 4,628,101 | |
| | | | |
Turkey 1.6% | | | | | | | | | | | | | | | | |
Turkey Government Bond, | | | | | | | | | | | | | | | | |
Bonds | | | 8.500 | | | | 09/14/22 | | | TRY | 395 | | | | 42,586 | |
Bonds | | | 8.800 | | | | 09/27/23 | | | TRY | 500 | | | | 51,660 | |
Bonds | | | 9.000 | | | | 07/24/24 | | | TRY | 2,700 | | | | 274,582 | |
Bonds | | | 10.600 | | | | 02/11/26 | | | TRY | 2,210 | | | | 231,889 | |
Bonds | | | 12.200 | | | | 01/18/23 | | | TRY | 2,315 | | | | 263,548 | |
Bonds | | | 12.400 | | | | 03/08/28 | | | TRY | 1,000 | | | | 109,910 | |
| | | | | | | | | | | | | | | | |
| | | | |
| | | | | | | | | | | | | | | 974,175 | |
| | | | |
Ukraine 1.1% | | | | | | | | | | | | | | | | |
Ukraine Government International Bond, | | | | | | | | | | | | | | | | |
Bonds | | | 16.000 | | | | 08/11/21 | | | UAH | 500 | | | | 18,215 | |
Bonds | | | 17.000 | | | | 05/11/22 | | | UAH | 500 | | | | 18,893 | |
Bonds, 144A | | | 11.670 | | | | 11/22/23 | | | UAH | 2,414 | | | | 84,657 | |
Bonds, 144A | | | 18.000 | | | | 03/24/21 | | | UAH | 604 | | | | 21,814 | |
Sr. Unsec’d. Notes | | | 7.750 | | | | 09/01/24 | | | | 402 | | | | 416,816 | |
Unsec’d. Notes, 144A | | | 15.360 | | | | 09/29/21 | | | UAH | 2,070 | | | | 75,481 | |
Unsec’d. Notes, 144A | | | 17.250 | | | | 01/05/22 | | | UAH | 1,328 | | | | 49,753 | |
| | | | | | | | | | | | | | | | |
| | | | |
| | | | | | | | | | | | | | | 685,629 | |
| | | | |
Uruguay 0.2% | | | | | | | | | | | | | | | | |
Uruguay Government International Bond, | | | | | | | | | | | | | | | | |
Sr. Unsec’d. Notes | | | 9.875 | | | | 06/20/22 | | | UYU | 3,260 | | | | 78,358 | |
Sr. Unsec’d. Notes, 144A | | | 8.500 | | | | 03/15/28 | | | UYU | 1,870 | | | | 45,514 | |
| | | | | | | | | | | | | | | | |
| | | | |
| | | | | | | | | | | | | | | 123,872 | |
| | | | | | | | | | | | | | | | |
| | | | |
TOTAL SOVEREIGN BONDS | | | | | | | | | | | | | | | | |
(cost $54,302,963) | | | | | | | | | | | | | | | 52,434,391 | |
| | | | | | | | | | | | | | | | |
See Notes to Financial Statements.
| | | | |
| PGIM Emerging Markets Debt Local Currency Fund | | | 19 | |
Schedule of Investments (continued)
as of October 31, 2020
| | | | | | | | | | | | | | | | |
| | | | |
| Description | | Interest
Rate | | | Maturity
Date | | | Principal
Amount
(000)# | | | Value | |
|
CORPORATE BONDS 8.3% | |
| | | | |
Belarus 0.3% | | | | | | | | | | | | | | | | |
Development Bank of the Republic of Belarus JSC, | | | | | | | | | | | | | | | | |
Sr. Unsec’d. Notes, 144A | | | 6.750 | % | | | 05/02/24 | | | | 200 | | | $ | 190,652 | |
| | | | | | | | | | | | | | | | |
| | | | |
Brazil 0.7% | | | | | | | | | | | | | | | | |
JSM Global Sarl, | | | | | | | | | | | | | | | | |
Gtd. Notes, 144A | | | 4.750 | | | | 10/20/30 | | | | 200 | | | | 202,042 | |
Petrobras Global Finance BV, | | | | | | | | | | | | | | | | |
Gtd. Notes | | | 8.750 | | | | 05/23/26 | | | | 165 | | | | 210,222 | |
| | | | | | | | | | | | | | | | |
| | | | |
| | | | | | | | | | | | | | | 412,264 | |
| | | | |
Indonesia 0.6% | | | | | | | | | | | | | | | | |
Saka Energi Indonesia PT, | | | | | | | | | | | | | | | | |
Sr. Unsec’d. Notes | | | 4.450 | | | | 05/05/24 | | | | 225 | | | | 206,822 | |
Wijaya Karya Persero Tbk PT, | | | | | | | | | | | | | | | | |
Sr. Unsec’d. Notes | | | 7.700 | | | | 01/31/21 | | | IDR | 2,000,000 | | | | 128,237 | |
| | | | | | | | | | | | | | | | |
| | | | |
| | | | | | | | | | | | | | | 335,059 | |
| | | | |
Jamaica 0.2% | | | | | | | | | | | | | | | | |
Digicel Ltd., | | | | | | | | | | | | | | | | |
Gtd. Notes | | | 6.750 | | | | 03/01/23 | | | | 235 | | | | 145,704 | |
| | | | | | | | | | | | | | | | |
| | | | |
Malaysia 0.3% | | | | | | | | | | | | | | | | |
Gohl Capital Ltd., | | | | | | | | | | | | | | | | |
Gtd. Notes | | | 4.250 | | | | 01/24/27 | | | | 200 | | | | 196,969 | |
| | | | | | | | | | | | | | | | |
| | | | |
Mexico 2.0% | | | | | | | | | | | | | | | | |
America Movil SAB de CV, | | | | | | | | | | | | | | | | |
Sr. Unsec’d. Notes | | | 6.450 | | | | 12/05/22 | | | MXN | 14,250 | | | | 681,228 | |
Petroleos Mexicanos, | | | | | | | | | | | | | | | | |
Gtd. Notes | | | 6.490 | | | | 01/23/27 | | | | 55 | | | | 51,186 | |
Gtd. Notes | | | 6.500 | | | | 03/13/27 | | | | 80 | | | | 74,349 | |
Gtd. Notes, 144A | | | 7.650 | | | | 11/24/21 | | | MXN | 4,120 | | | | 192,336 | |
Gtd. Notes, MTN | | | 6.875 | | | | 08/04/26 | | | | 235 | | | | 225,967 | |
| | | | | | | | | | | | | | | | |
| | | | |
| | | | | | | | | | | | | | | 1,225,066 | |
See Notes to Financial Statements.
| | | | | | | | | | | | | | | | |
| | | | |
| Description | | Interest
Rate | | | Maturity
Date | | | Principal
Amount
(000)# | | | Value | |
|
CORPORATE BONDS (Continued) | |
| | | | |
Russia 1.9% | | | | | | | | | | | | | | | | |
Gazprom Capital OOO, | | | | | | | | | | | | | | | | |
Gtd. Notes, Series BO03 | | | 7.150 | %(cc) | | | 02/15/28 | | | RUB | 45,000 | | | $ | 589,406 | |
Gtd. Notes, Series BO05 | | | 8.900 | (cc) | | | 02/03/27 | | | RUB | 42,000 | | | | 562,667 | |
| | | | | | | | | | | | | | | | |
| | | | |
| | | | | | | | | | | | | | | 1,152,073 | |
| | | | |
South Africa 0.6% | | | | | | | | | | | | | | | | |
Eskom Holdings SOC Ltd., | | | | | | | | | | | | | | | | |
Sr. Unsec’d. Notes, 144A, MTN | | | 6.750 | | | | 08/06/23 | | | | 200 | | | | 189,583 | |
Sasol Financing USA LLC, | | | | | | | | | | | | | | | | |
Gtd. Notes | | | 5.875 | | | | 03/27/24 | | | | 200 | | | | 192,168 | |
| | | | | | | | | | | | | | | | |
| | | | |
| | | | | | | | | | | | | | | 381,751 | |
| | | | |
Supranational Bank 1.4% | | | | | | | | | | | | | | | | |
European Bank for Reconstruction & Development, | | | | | | | | | | | | | | | | |
Sr. Unsec’d. Notes, EMTN | | | 7.500 | | | | 05/15/22 | | | IDR | 900,000 | | | | 63,714 | |
Sr. Unsec’d. Notes, GMTN | | | 6.450 | | | | 12/13/22 | | | IDR | 7,500,000 | | | | 528,119 | |
European Investment Bank, | | | | | | | | | | | | | | | | |
Sr. Unsec’d. Notes, EMTN | | | 12.576 | (s) | | | 09/05/22 | | | TRY | 1,260 | | | | 112,524 | |
International Bank for Reconstruction & Development, | | | | | | | | | | | | | | | | |
Sr. Unsec’d. Notes, EMTN | | | 7.450 | | | | 08/20/21 | | | IDR | 2,500,000 | | | | 174,403 | |
| | | | | | | | | | | | | | | | |
| | | | | | | | | | | | | | | 878,760 | |
| | | | |
Tunisia 0.3% | | | | | | | | | | | | | | | | |
Banque Centrale de Tunisie International Bond, | | | | | | | | | | | | | | | | |
Sr. Unsec’d. Notes | | | 5.625 | | | | 02/17/24 | | | EUR | 180 | | | | 179,934 | |
| | | | | | | | | | | | | | | | |
| | | | |
TOTAL CORPORATE BONDS | | | | | | | | | | | | | | | | |
(cost $5,782,458) | | | | | | | | | | | | | | | 5,098,232 | |
| | | | | | | | | | | | | | | | |
| | | | |
TOTAL LONG-TERM INVESTMENTS | | | | | | | | | | | | | | | | |
(cost $60,085,421) | | | | | | | | | | | | | | | 57,532,623 | |
| | | | | | | | | | | | | | | | |
| | | | |
| | | | | | | | | Shares | | | | |
| | | | |
SHORT-TERM INVESTMENT 3.5% | | | | | | | | | | | | | | | | |
| | | | |
AFFILIATED MUTUAL FUND 3.5% | | | | | | | | | | | | | | | | |
PGIM Core Ultra Short Bond Fund | | | | | | | | | | | | | | | | |
(cost $2,133,355)(w) | | | | | | | | | | | 2,133,355 | | | | 2,133,355 | |
| | | | | | | | | | | | | | | | |
See Notes to Financial Statements.
| | | | |
| PGIM Emerging Markets Debt Local Currency Fund | | | 21 | |
Schedule of Investments (continued)
as of October 31, 2020
| | | | | | | | |
| | |
| Description | | | | | Value | |
| | |
TOTAL INVESTMENTS, BEFORE OPTIONS WRITTEN | | | | | | | | |
(cost $62,218,776) | | | | | | | 59,665,978 | |
| | | | | | | | |
| | |
OPTIONS WRITTEN*~ (0.1)% | | | | | | | | |
(premiums received $(28,594)) | | | | | | $ | (33,291 | ) |
| | | | | | | | |
| | |
TOTAL INVESTMENTS, NET OF OPTIONS WRITTEN 96.6% | | | | | | | | |
(cost $62,190,182) | | | | | | | 59,632,687 | |
Other assets in excess of liabilities(z) 3.4% | | | | | | | 2,128,333 | |
| | | | | | | | |
| | |
NET ASSETS 100.0% | | | | | | $ | 61,761,020 | |
| | | | | | | | |
Below is a list of the abbreviation(s) used in the annual report:
AUD—Australian Dollar
BRL—Brazilian Real
CLP—Chilean Peso
CNH—Chinese Renminbi
COP—Colombian Peso
CZK—Czech Koruna
DOP—Dominican Peso
EUR—Euro
HUF—Hungarian Forint
IDR—Indonesian Rupiah
ILS—Israeli Shekel
INR—Indian Rupee
JPY—Japanese Yen
KRW—South Korean Won
MXN—Mexican Peso
MYR—Malaysian Ringgit
NZD—New Zealand Dollar
PEN—Peruvian Nuevo Sol
PHP—Philippine Peso
PLN—Polish Zloty
RON—Romanian Leu
RUB—Russian Ruble
SGD—Singapore Dollar
THB—Thai Baht
TRY—Turkish Lira
TWD—New Taiwanese Dollar
UAH—Ukraine Hryvna
USD—US Dollar
UYU—Uruguayan Peso
ZAR—South African Rand
144A—Security was purchased pursuant to Rule 144A under the Securities Act of 1933 and, pursuant to the requirements of Rule 144A, may not be resold except to qualified institutional buyers.
A—Annual payment frequency for swaps
BROIS—Brazil Overnight Index Swap
COOIS—Colombia Overnight Interbank Reference Rate
EMTN—Euro Medium Term Note
GMTN—Global Medium Term Note
See Notes to Financial Statements.
JIBAR—Johannesburg Interbank Agreed Rate
KLIBOR—Kuala Lumpur Interbank Offered Rate
KWCDC—Korean Won Certificate of Deposit
LIBOR—London Interbank Offered Rate
M—Monthly payment frequency for swaps
MTN—Medium Term Note
OFZ—Obligatsyi Federal’novo Zaima (Federal Loan Obligations)
OTC—Over-the-counter
Q—Quarterly payment frequency for swaps
S—Semiannual payment frequency for swaps
T—Swap payment upon termination
WIBOR—Warsaw Interbank Offered Rate
| * | Non-income producing security. |
| # | Principal or notional amount is shown in U.S. dollars unless otherwise stated. |
| ~ | See tables subsequent to the Schedule of Investments for options detail. |
| (cc) | Variable rate instrument. The rate shown is based on the latest available information as of October 31, 2020. Certain variable rate securities are not based on a published reference rate and spread but are determined by the issuer or agent and are based on current market conditions. These securities do not indicate a reference rate and spread in their description. |
| (s) | Represents zero coupon bond or principal only security. Rate represents yield to maturity at purchase date. |
| (w) | PGIM Investments LLC, the manager of the Series, also serves as manager of the PGIM Core Ultra Short Bond Fund. |
| (z) | Includes net unrealized appreciation/(depreciation) and/or market value of the below holdings which are excluded from the Schedule of Investments: |
Options Written:
OTC Traded
| | | | | | | | | | | | | | | | | | | | | | |
Description | | Call/
Put | | Counterparty | | Expiration
Date | | Strike | | | Contracts | | | Notional
Amount
(000)# | | | Value | |
Currency Option USD vs CLP | | Call | | Morgan Stanley & Co. International PLC | | 11/12/20 | | | 800.00 | | | | — | | | | 139 | | | $ | (378 | ) |
Currency Option USD vs COP | | Call | | JPMorgan Chase Bank, N.A. | | 11/10/20 | | | 3,850.00 | | | | — | | | | 249 | | | | (3,829 | ) |
Currency Option USD vs COP | | Call | | JPMorgan Chase Bank, N.A. | | 11/10/20 | | | 3,850.00 | | | | — | | | | 206 | | | | (3,170 | ) |
Currency Option USD vs CNH | | Put | | Morgan Stanley & Co. International PLC | | 11/11/20 | | | 6.80 | | | | — | | | | 858 | | | | (15,923 | ) |
Currency Option USD vs KRW | | Put | | Citibank, N.A. | | 11/11/20 | | | 1,140.00 | | | | — | | | | 276 | | | | (3,350 | ) |
Currency Option USD vs MXN | | Put | | JPMorgan Chase Bank, N.A. | | 11/05/20 | | | 20.80 | | | | — | | | | 277 | | | | (1,343 | ) |
Currency Option USD vs MXN | | Put | | JPMorgan Chase Bank, N.A. | | 11/05/20 | | | 21.35 | | | | — | | | | 164 | | | | (2,615 | ) |
Currency Option USD vs MXN | | Put | | Morgan Stanley & Co. International PLC | | 11/05/20 | | | 21.35 | | | | — | | | | 166 | | | | (2,647 | ) |
Currency Option USD vs RUB | | Put | | Citibank, N.A. | | 11/05/20 | | | 75.00 | | | | — | | | | 219 | | | | (36 | ) |
| | | | | | | | | | | | | | | | | | | | | | |
| Total Options Written (premiums received $28,594) | | | | | | | | | | | $ | (33,291 | ) |
| | | | | | | | | | | | | | | | | | | | | | |
See Notes to Financial Statements.
| | | | |
| PGIM Emerging Markets Debt Local Currency Fund | | | 23 | |
Schedule of Investments (continued)
as of October 31, 2020
Futures contracts outstanding at October 31, 2020:
| | | | | | | | | | | | | | |
Number of Contracts | | Type | | Expiration
Date | | | Current
Notional
Amount | | | Value /
Unrealized
Appreciation
(Depreciation) | |
| Short Positions: | | | | | | | | | | | | |
| 6 | | 2 Year U.S. Treasury Notes | | | Dec. 2020 | | | $ | 1,325,063 | | | $ | 122 | |
| 3 | | 5 Year Euro-Bobl | | | Dec. 2020 | | | | 474,723 | | | | (2,693 | ) |
| 20 | | 5 Year U.S. Treasury Notes | | | Dec. 2020 | | | | 2,512,031 | | | | 5,710 | |
| 5 | | 10 Year U.S. Treasury Notes | | | Dec. 2020 | | | | 691,094 | | | | 4,299 | |
| 1 | | Euro Schatz Index | | | Dec. 2020 | | | | 130,982 | | | | (234 | ) |
| | | | | | | | | | | | | | |
| | | | | | | | | | | | $ | 7,204 | |
| | | | | | | | | | | | | | |
Forward foreign currency exchange contracts outstanding at October 31, 2020:
| | | | | | | | | | | | | | | | | | | | | | | | | | |
Purchase Contracts | | Counterparty | | Notional
Amount
(000) | | | Value at
Settlement
Date | | | Current
Value | | | Unrealized
Appreciation | | | Unrealized
Depreciation | |
|
| OTC Forward Foreign Currency Exchange Contracts: | |
Brazilian Real, | | | | | | | | | | | | | | | | | | | | | | | | |
Expiring 11/04/20 | | JPMorgan Chase Bank, N.A. | | | BRL | | | | 16,174 | | | $ | 2,930,911 | | | $ | 2,817,986 | | | $ | — | | | $ | (112,925 | ) |
Expiring 11/04/20 | | Morgan Stanley & Co. International PLC | | | BRL | | | | 419 | | | | 74,478 | | | | 73,029 | | | | — | | | | (1,449 | ) |
Expiring 12/02/20 | | Morgan Stanley & Co. International PLC | | | BRL | | | | 12,408 | | | | 2,201,903 | | | | 2,159,120 | | | | — | | | | (42,783 | ) |
Chilean Peso, | | | | | | | | | | | | | | | | | | | | | | | | | | |
Expiring 12/16/20 | | Citibank, N.A. | | | CLP | | | | 95,691 | | | | 124,000 | | | | 123,733 | | | | — | | | | (267 | ) |
Expiring 12/16/20 | | Citibank, N.A. | | | CLP | | | | 65,846 | | | | 86,000 | | | | 85,142 | | | | — | | | | (858 | ) |
Expiring 12/16/20 | | Citibank, N.A. | | | CLP | | | | 50,006 | | | | 65,715 | | | | 64,660 | | | | — | | | | (1,055 | ) |
Expiring 12/16/20 | | HSBC Bank USA, N.A. | | | CLP | | | | 156,030 | | | | 196,255 | | | | 201,754 | | | | 5,499 | | | | — | |
Expiring 12/16/20 | | HSBC Bank USA, N.A. | | | CLP | | | | 131,450 | | | | 164,436 | | | | 169,971 | | | | 5,535 | | | | — | |
Expiring 12/16/20 | | HSBC Bank USA, N.A. | | | CLP | | | | 116,172 | | | | 146,000 | | | | 150,216 | | | | 4,216 | | | | — | |
Expiring 12/16/20 | | JPMorgan Chase Bank, N.A. | | | CLP | | | | 61,851 | | | | 77,800 | | | | 79,976 | | | | 2,176 | | | | — | |
Chinese Renminbi, | | | | | | | | | | | | | | | | | | | | | | | | | | |
Expiring 11/06/20 | | BNP Paribas S.A. | | | CNH | | | | 1,025 | | | | 149,306 | | | | 152,974 | | | | 3,668 | | | | — | |
Expiring 11/06/20 | | BNP Paribas S.A. | | | CNH | | | | 625 | | | | 89,629 | | | | 93,291 | | | | 3,662 | | | | — | |
Expiring 11/06/20 | | Citibank, N.A. | | | CNH | | | | 8,356 | | | | 1,188,877 | | | | 1,247,295 | | | | 58,418 | | | | — | |
Expiring 11/06/20 | | Citibank, N.A. | | | CNH | | | | 1,826 | | | | 262,865 | | | | 272,529 | | | | 9,664 | | | | — | |
Expiring 11/06/20 | | Goldman Sachs International | | | CNH | | | | 2,938 | | | | 432,051 | | | | 438,470 | | | | 6,419 | | | | — | |
Expiring 11/06/20 | | HSBC Bank USA, N.A. | | | CNH | | | | 7,776 | | | | 1,111,852 | | | | 1,160,610 | | | | 48,758 | | | | — | |
Expiring 11/06/20 | | HSBC Bank USA, N.A. | | | CNH | | | | 3,197 | | | | 478,521 | | | | 477,164 | | | | — | | | | (1,357 | ) |
Expiring 11/06/20 | | HSBC Bank USA, N.A. | | | CNH | | | | 1,124 | | | | 160,000 | | | | 167,746 | | | | 7,746 | | | | — | |
Expiring 11/06/20 | | HSBC Bank USA, N.A. | | | CNH | | | | 918 | | | | 131,514 | | | | 137,033 | | | | 5,519 | | | | — | |
Expiring 11/06/20 | | HSBC Bank USA, N.A. | | | CNH | | | | 745 | | | | 110,000 | | | | 111,239 | | | | 1,239 | | | | — | |
Expiring 11/06/20 | | HSBC Bank USA, N.A. | | | CNH | | | | 149 | | | | 21,904 | | | | 22,217 | | | | 313 | | | | — | |
See Notes to Financial Statements.
Forward foreign currency exchange contracts outstanding at October 31, 2020 (continued):
| | | | | | | | | | | | | | | | | | | | | | | | | | |
Purchase Contracts | | Counterparty | | Notional
Amount
(000) | | | Value at
Settlement
Date | | | Current
Value | | | Unrealized
Appreciation | | | Unrealized
Depreciation | |
|
| OTC Forward Foreign Currency Exchange Contracts (cont’d.): | |
Chinese Renminbi (cont’d.), | | | | | | | | | | | | | | | | | | | | | | | | |
Expiring 11/06/20 | | JPMorgan Chase Bank, N.A. | | | CNH | | | | 4,094 | | | $ | 583,560 | | | $ | 611,099 | | | $ | 27,539 | | | $ | — | |
Expiring 11/06/20 | | JPMorgan Chase Bank, N.A. | | | CNH | | | | 3,318 | | | | 482,287 | | | | 495,193 | | | | 12,906 | | | | — | |
Expiring 11/06/20 | | JPMorgan Chase Bank, N.A. | | | CNH | | | | 2,254 | | | | 333,569 | | | | 336,450 | | | | 2,881 | | | | — | |
Expiring 11/06/20 | | JPMorgan Chase Bank, N.A. | | | CNH | | | | 1,204 | | | | 172,000 | | | | 179,728 | | | | 7,728 | | | | — | |
Expiring 11/06/20 | | JPMorgan Chase Bank, N.A. | | | CNH | | | | 947 | | | | 140,155 | | | | 141,287 | | | | 1,132 | | | | — | |
Expiring 11/06/20 | | UBS AG | | | CNH | | | | 1,167 | | | | 167,000 | | | | 174,245 | | | | 7,245 | | | | — | |
Expiring 11/06/20 | | UBS AG | | | CNH | | | | 1,099 | | | | 158,115 | | | | 164,101 | | | | 5,986 | | | | — | |
Expiring 02/08/21 | | JPMorgan Chase Bank, N.A. | | | CNH | | | | 4,225 | | | | 626,679 | | | | 626,345 | | | | — | | | | (334 | ) |
Expiring 05/14/21 | | Citibank, N.A. | | | CNH | | | | 4,640 | | | | 664,965 | | | | 683,383 | | | | 18,418 | | | | — | |
Colombian Peso, | | | | | | | | | | | | | | | | | | | | | | | | | | |
Expiring 12/16/20 | | BNP Paribas S.A. | | | COP | | | | 263,235 | | | | 69,000 | | | | 67,869 | | | | — | | | | (1,131 | ) |
Expiring 12/16/20 | | Citibank, N.A. | | | COP | | | | 388,542 | | | | 101,000 | | | | 100,176 | | | | — | | | | (824 | ) |
Expiring 12/16/20 | | Citibank, N.A. | | | COP | | | | 378,534 | | | | 97,844 | | | | 97,595 | | | | — | | | | (249 | ) |
Expiring 12/16/20 | | Citibank, N.A. | | | COP | | | | 304,682 | | | | 81,693 | | | | 78,555 | | | | — | | | | (3,138 | ) |
Expiring 12/16/20 | | Goldman Sachs International | | | COP | | | | 258,055 | | | | 67,000 | | | | 66,533 | | | | — | | | | (467 | ) |
Expiring 12/16/20 | | Morgan Stanley & Co. International PLC | | | COP | | | | 367,379 | | | | 95,000 | | | | 94,720 | | | | — | | | | (280 | ) |
Expiring 12/16/20 | | Morgan Stanley & Co. International PLC | | | COP | | | | 246,848 | | | | 64,000 | | | | 63,644 | | | | — | | | | (356 | ) |
Expiring 12/16/20 | | Morgan Stanley & Co. International PLC | | | COP | | | | 243,007 | | | | 63,000 | | | | 62,654 | | | | — | | | | (346 | ) |
Expiring 12/16/20 | | Morgan Stanley & Co. International PLC | | | COP | | | | 117,410 | | | | 30,336 | | | | 30,271 | | | | — | | | | (65 | ) |
Czech Koruna, | | | | | | | | | | | | | | | | | | | | | | | | | | |
Expiring 01/19/21 | | Bank of America, N.A. | | | CZK | | | | 3,176 | | | | 138,840 | | | | 135,968 | | | | — | | | | (2,872 | ) |
Expiring 01/19/21 | | Bank of America, N.A. | | | CZK | | | | 1,826 | | | | 78,989 | | | | 78,167 | | | | — | | | | (822 | ) |
Expiring 01/19/21 | | Barclays Bank PLC | | | CZK | | | | 2,477 | | | | 108,000 | | | | 106,030 | | | | — | | | | (1,970 | ) |
Expiring 01/19/21 | | BNP Paribas S.A. | | | CZK | | | | 5,484 | | | | 235,439 | | | | 234,794 | | | | — | | | | (645 | ) |
Expiring 01/19/21 | | Citibank, N.A. | | | CZK | | | | 9,040 | | | | 390,234 | | | | 387,022 | | | | — | | | | (3,212 | ) |
Expiring 01/19/21 | | JPMorgan Chase Bank, N.A. | | | CZK | | | | 3,832 | | | | 164,728 | | | | 164,071 | | | | — | | | | (657 | ) |
Expiring 01/19/21 | | Morgan Stanley & Co. International PLC | | | CZK | | | | 15,609 | | | | 669,577 | | | | 668,260 | | | | — | | | | (1,317 | ) |
Euro, | | | | | | | | | | | | | | | | | | | | | | | | | | |
Expiring 01/19/21 | | Citibank, N.A. | | | EUR | | | | 2,339 | | | | 2,752,523 | | | | 2,730,021 | | | | — | | | | (22,502 | ) |
See Notes to Financial Statements.
| | | | |
| PGIM Emerging Markets Debt Local Currency Fund | | | 25 | |
Schedule of Investments (continued)
as of October 31, 2020
Forward foreign currency exchange contracts outstanding at October 31, 2020 (continued):
| | | | | | | | | | | | | | | | | | | | | | | | | | |
Purchase Contracts | | Counterparty | | Notional
Amount
(000) | | | Value at
Settlement
Date | | | Current
Value | | | Unrealized
Appreciation | | | Unrealized
Depreciation | |
|
| OTC Forward Foreign Currency Exchange Contracts (cont’d.): | |
Hungarian Forint, | | | | | | | | | | | | | | | | | | | | | | | | |
Expiring 01/19/21 | | Bank of America, N.A. | | | HUF | | | | 46,308 | | | $ | 151,000 | | | $ | 146,881 | | | $ | — | | | $ | (4,119 | ) |
Expiring 01/19/21 | | Bank of America, N.A. | | | HUF | | | | 37,909 | | | | 123,000 | | | | 120,241 | | | | — | | | | (2,759 | ) |
Expiring 01/19/21 | | HSBC Bank USA, N.A. | | | HUF | | | | 3,826 | | | | 12,376 | | | | 12,135 | | | | — | | | | (241 | ) |
Expiring 01/19/21 | | JPMorgan Chase Bank, N.A. | | | HUF | | | | 33,035 | | | | 107,305 | | | | 104,784 | | | | — | | | | (2,521 | ) |
Expiring 01/19/21 | | Morgan Stanley & Co. International PLC | | | HUF | | | | 73,490 | | | | 240,777 | | | | 233,099 | | | | — | | | | (7,678 | ) |
Indian Rupee, | | | | | | | | | | | | | | | | | | | | | | | | | | |
Expiring 12/16/20 | | Barclays Bank PLC | | | INR | | | | 18,616 | | | | 252,465 | | | | 248,620 | | | | — | | | | (3,845 | ) |
Expiring 12/16/20 | | BNP Paribas S.A. | | | INR | | | | 15,491 | | | | 209,000 | | | | 206,892 | | | | — | | | | (2,108 | ) |
Expiring 12/16/20 | | Citibank, N.A. | | | INR | | | | 44,893 | | | | 607,547 | | | | 599,564 | | | | — | | | | (7,983 | ) |
Expiring 12/16/20 | | Citibank, N.A. | | | INR | | | | 16,372 | | | | 221,000 | | | | 218,655 | | | | — | | | | (2,345 | ) |
Expiring 12/16/20 | | Citibank, N.A. | | | INR | | | | 11,540 | | | | 156,000 | | | | 154,129 | | | | — | | | | (1,871 | ) |
Expiring 12/16/20 | | Citibank, N.A. | | | INR | | | | 10,153 | | | | 138,137 | | | | 135,592 | | | | — | | | | (2,545 | ) |
Expiring 12/16/20 | | Citibank, N.A. | | | INR | | | | 7,129 | | | | 96,447 | | | | 95,214 | | | | — | | | | (1,233 | ) |
Expiring 12/16/20 | | HSBC Bank USA, N.A. | | | INR | | | | 13,288 | | | | 180,000 | | | | 177,463 | | | | — | | | | (2,537 | ) |
Expiring 12/16/20 | | JPMorgan Chase Bank, N.A. | | | INR | | | | 14,547 | | | | 196,000 | | | | 194,278 | | | | — | | | | (1,722 | ) |
Expiring 12/16/20 | | JPMorgan Chase Bank, N.A. | | | INR | | | | 10,955 | | | | 148,000 | | | | 146,304 | | | | — | | | | (1,696 | ) |
Expiring 12/16/20 | | JPMorgan Chase Bank, N.A. | | | INR | | | | 9,184 | | | | 124,000 | | | | 122,662 | | | | — | | | | (1,338 | ) |
Expiring 12/16/20 | | UBS AG | | | INR | | | | 10,102 | | | | 136,322 | | | | 134,913 | | | | — | | | | (1,409 | ) |
Indonesian Rupiah, | | | | | | | | | | | | | | | | | | | | | | | | | | |
Expiring 12/16/20 | | Barclays Bank PLC | | | IDR | | | | 1,477,810 | | | | 100,000 | | | | 99,510 | | | | — | | | | (490 | ) |
Expiring 12/16/20 | | BNP Paribas S.A. | | | IDR | | | | 2,299,133 | | | | 155,200 | | | | 154,815 | | | | — | | | | (385 | ) |
Expiring 12/16/20 | | Citibank, N.A. | | | IDR | | | | 4,857,105 | | | | 326,732 | | | | 327,059 | | | | 327 | | | | — | |
Expiring 12/16/20 | | Citibank, N.A. | | | IDR | | | | 2,054,963 | | | | 138,568 | | | | 138,374 | | | | — | | | | (194 | ) |
Expiring 12/16/20 | | Citibank, N.A. | | | IDR | | | | 1,954,913 | | | | 131,000 | | | | 131,637 | | | | 637 | | | | — | |
Expiring 12/16/20 | | Citibank, N.A. | | | IDR | | | | 1,910,748 | | | | 129,000 | | | | 128,663 | | | | — | | | | (337 | ) |
Expiring 12/16/20 | | Citibank, N.A. | | | IDR | | | | 1,661,936 | | | | 111,000 | | | | 111,909 | | | | 909 | | | | — | |
Expiring 12/16/20 | | Citibank, N.A. | | | IDR | | | | 818,000 | | | | 54,519 | | | | 55,081 | | | | 562 | | | | — | |
Expiring 12/16/20 | | Goldman Sachs International | | | IDR | | | | 2,337,114 | | | | 156,000 | | | | 157,373 | | | | 1,373 | | | | — | |
Expiring 12/16/20 | | HSBC Bank USA, N.A. | | | IDR | | | | 2,416,475 | | | | 163,000 | | | | 162,717 | | | | — | | | | (283 | ) |
Expiring 12/16/20 | | HSBC Bank USA, N.A. | | | IDR | | | | 2,362,636 | | | | 157,000 | | | | 159,091 | | | | 2,091 | | | | — | |
Expiring 12/16/20 | | HSBC Bank USA, N.A. | | | IDR | | | | 2,289,400 | | | | 153,000 | | | | 154,160 | | | | 1,160 | | | | — | |
Expiring 12/16/20 | | HSBC Bank USA, N.A. | | | IDR | | | | 2,226,216 | | | | 148,000 | | | | 149,905 | | | | 1,905 | | | | — | |
Expiring 12/16/20 | | HSBC Bank USA, N.A. | | | IDR | | | | 1,910,103 | | | | 129,000 | | | | 128,619 | | | | — | | | | (381 | ) |
Expiring 12/16/20 | | HSBC Bank USA, N.A. | | | IDR | | | | 1,898,752 | | | | 128,000 | | | | 127,855 | | | | — | | | | (145 | ) |
Expiring 12/16/20 | | HSBC Bank USA, N.A. | | | IDR | | | | 1,021,359 | | | | 69,000 | | | | 68,775 | | | | — | | | | (225 | ) |
See Notes to Financial Statements.
Forward foreign currency exchange contracts outstanding at October 31, 2020 (continued):
| | | | | | | | | | | | | | | | | | | | | | | | | | |
Purchase Contracts | | Counterparty | | Notional
Amount
(000) | | | Value at
Settlement
Date | | | Current
Value | | | Unrealized
Appreciation | | | Unrealized
Depreciation | |
|
| OTC Forward Foreign Currency Exchange Contracts (cont’d.): | |
Indonesian Rupiah (cont’d.), | | | | | | | | | | | | | | | | | | | | | | | | |
Expiring 12/16/20 | | JPMorgan Chase Bank, N.A. | | | IDR | | | | 2,291,922 | | | $ | 156,000 | | | $ | 154,330 | | | $ | — | | | $ | (1,670 | ) |
Expiring 12/16/20 | | JPMorgan Chase Bank, N.A. | | | IDR | | | | 1,401,621 | | | | 95,000 | | | | 94,380 | | | | — | | | | (620 | ) |
Expiring 12/16/20 | | JPMorgan Chase Bank, N.A. | | | IDR | | | | 824,319 | | | | 55,105 | | | | 55,506 | | | | 401 | | | | — | |
Expiring 12/16/20 | | Morgan Stanley & Co. International PLC | | | IDR | | | | 1,274,717 | | | | 85,043 | | | | 85,834 | | | | 791 | | | | — | |
Israeli Shekel, | | | | | | | | | | | | | | | | | | | | | | | | | | |
Expiring 12/16/20 | | Barclays Bank PLC | | | ILS | | | | 885 | | | | 260,000 | | | | 259,528 | | | | — | | | | (472 | ) |
Expiring 12/16/20 | | Barclays Bank PLC | | | ILS | | | | 548 | | | | 158,000 | | | | 160,583 | | | | 2,583 | | | | — | |
Expiring 12/16/20 | | Barclays Bank PLC | | | ILS | | | | 544 | | | | 158,000 | | | | 159,585 | | | | 1,585 | | | | — | |
Expiring 12/16/20 | | Barclays Bank PLC | | | ILS | | | | 532 | | | | 156,000 | | | | 155,940 | | | | — | | | | (60 | ) |
Expiring 12/16/20 | | Barclays Bank PLC | | | ILS | | | | 489 | | | | 145,000 | | | | 143,402 | | | | — | | | | (1,598 | ) |
Expiring 12/16/20 | | Barclays Bank PLC | | | ILS | | | | 397 | | | | 117,000 | | | | 116,284 | | | | — | | | | (716 | ) |
Expiring 12/16/20 | | Citibank, N.A. | | | ILS | | | | 555 | | | | 162,000 | | | | 162,840 | | | | 840 | | | | — | |
Expiring 12/16/20 | | Citibank, N.A. | | | ILS | | | | 517 | | | | 149,000 | | | | 151,614 | | | | 2,614 | | | | — | |
Expiring 12/16/20 | | HSBC Bank USA, N.A. | | | ILS | | | | 641 | | | | 189,483 | | | | 187,949 | | | | — | | | | (1,534 | ) |
Expiring 12/16/20 | | JPMorgan Chase Bank, N.A. | | | ILS | | | | 1,178 | | | | 347,026 | | | | 345,519 | | | | — | | | | (1,507 | ) |
Expiring 12/16/20 | | JPMorgan Chase Bank, N.A. | | | ILS | | | | 883 | | | | 262,564 | | | | 258,968 | | | | — | | | | (3,596 | ) |
Expiring 12/16/20 | | JPMorgan Chase Bank, N.A. | | | ILS | | | | 442 | | | | 128,000 | | | | 129,617 | | | | 1,617 | | | | — | |
Expiring 12/16/20 | | JPMorgan Chase Bank, N.A. | | | ILS | | | | 302 | | | | 89,026 | | | | 88,438 | | | | — | | | | (588 | ) |
Japanese Yen, | | | | | | | | | | | | | | | | | | | | | | | | | | |
Expiring 01/19/21 | | Citibank, N.A. | | | JPY | | | | 14,724 | | | | 140,155 | | | | 140,810 | | | | 655 | | | | — | |
Expiring 01/19/21 | | HSBC Bank USA, N.A. | | | JPY | | | | 8,970 | | | | 85,157 | | | | 85,781 | | | | 624 | | | | — | |
Expiring 01/19/21 | | JPMorgan Chase Bank, N.A. | | | JPY | | | | 16,261 | | | | 156,000 | | | | 155,508 | | | | — | | | | (492 | ) |
Expiring 01/19/21 | | JPMorgan Chase Bank, N.A. | | | JPY | | | | 2,703 | | | | 25,650 | | | | 25,850 | | | | 200 | | | | — | |
Expiring 01/19/21 | | The Toronto-Dominion Bank | | | JPY | | | | 49,573 | | | | 471,259 | | | | 474,081 | | | | 2,822 | | | | — | |
Malaysian Ringgit, | | | | | | | | | | | | | | | | | | | | | | | | | | |
Expiring 12/16/20 | | Barclays Bank PLC | | | MYR | | | | 2,226 | | | | 533,949 | | | | 533,599 | | | | — | | | | (350 | ) |
Expiring 12/16/20 | | Barclays Bank PLC | | | MYR | | | | 642 | | | | 155,000 | | | | 153,873 | | | | — | | | | (1,127 | ) |
Expiring 12/16/20 | | Barclays Bank PLC | | | MYR | | | | 316 | | | | 76,010 | | | | 75,658 | | | | — | | | | (352 | ) |
Expiring 12/16/20 | | Barclays Bank PLC | | | MYR | | | | 133 | | | | 32,000 | | | | 31,863 | | | | — | | | | (137 | ) |
Mexican Peso, | | | | | | | | | | | | | | | | | | | | | | | | | | |
Expiring 12/16/20 | | Bank of America, N.A. | | | MXN | | | | 3,020 | | | | 135,976 | | | | 141,632 | | | | 5,656 | | | | — | |
See Notes to Financial Statements.
| | | | |
| PGIM Emerging Markets Debt Local Currency Fund | | | 27 | |
Schedule of Investments (continued)
as of October 31, 2020
Forward foreign currency exchange contracts outstanding at October 31, 2020 (continued):
| | | | | | | | | | | | | | | | | | | | | | | | | | |
Purchase Contracts | | Counterparty | | Notional
Amount
(000) | | | Value at
Settlement
Date | | | Current
Value | | | Unrealized
Appreciation | | | Unrealized
Depreciation | |
|
| OTC Forward Foreign Currency Exchange Contracts (cont’d.): | |
Mexican Peso (cont’d.), | | | | | | | | | | | | | | | | | | | | | | | | |
Expiring 12/16/20 | | Citibank, N.A. | | | MXN | | | | 49,100 | | | $ | 2,226,865 | | | $ | 2,302,746 | | | $ | 75,881 | | | $ | — | |
Expiring 12/16/20 | | Citibank, N.A. | | | MXN | | | | 1,483 | | | | 69,000 | | | | 69,556 | | | | 556 | | | | — | |
Expiring 12/16/20 | | Goldman Sachs International | | | MXN | | | | 3,147 | | | | 138,568 | | | | 147,582 | | | | 9,014 | | | | — | |
Expiring 12/16/20 | | HSBC Bank USA, N.A. | | | MXN | | | | 6,815 | | | | 320,800 | | | | 319,630 | | | | — | | | | (1,170 | ) |
Expiring 12/16/20 | | JPMorgan Chase Bank, N.A. | | | MXN | | | | 7,120 | | | | 330,442 | | | | 333,902 | | | | 3,460 | | | | — | |
Expiring 12/16/20 | | JPMorgan Chase Bank, N.A. | | | MXN | | | | 3,311 | | | | 157,000 | | | | 155,264 | | | | — | | | | (1,736 | ) |
Expiring 12/16/20 | | JPMorgan Chase Bank, N.A. | | | MXN | | | | 2,992 | | | | 140,155 | | | | 140,318 | | | | 163 | | | | — | |
Expiring 12/16/20 | | JPMorgan Chase Bank, N.A. | | | MXN | | | | 2,989 | | | | 136,023 | | | | 140,193 | | | | 4,170 | | | | — | |
Expiring 12/16/20 | | JPMorgan Chase Bank, N.A. | | | MXN | | | | 2,962 | | | | 133,007 | | | | 138,932 | | | | 5,925 | | | | — | |
Expiring 12/16/20 | | JPMorgan Chase Bank, N.A. | | | MXN | | | | 2,103 | | | | 94,450 | | | | 98,650 | | | | 4,200 | | | | — | |
Expiring 12/16/20 | | JPMorgan Chase Bank, N.A. | | | MXN | | | | 1,846 | | | | 84,000 | | | | 86,593 | | | | 2,593 | | | | — | |
Expiring 12/16/20 | | JPMorgan Chase Bank, N.A. | | | MXN | | | | 1,810 | | | | 85,000 | | | | 84,891 | | | | — | | | | (109 | ) |
Expiring 12/16/20 | | JPMorgan Chase Bank, N.A. | | | MXN | | | | 1,763 | | | | 83,000 | | | | 82,673 | | | | — | | | | (327 | ) |
Expiring 12/16/20 | | JPMorgan Chase Bank, N.A. | | | MXN | | | | 1,515 | | | | 71,000 | | | | 71,043 | | | | 43 | | | | — | |
Expiring 12/16/20 | | Morgan Stanley & Co. International PLC | | | MXN | | | | 3,017 | | | | 140,155 | | | | 141,506 | | | | 1,351 | | | | — | |
Expiring 12/16/20 | | Morgan Stanley & Co. International PLC | | | MXN | | | | 2,409 | | | | 110,000 | | | | 112,967 | | | | 2,967 | | | | — | |
New Taiwanese Dollar, | | | | | | | | | | | | | | | | | | | | | | | | | | |
Expiring 12/16/20 | | Credit Suisse International | | | TWD | | | | 8,711 | | | | 303,000 | | | | 308,246 | | | | 5,246 | | | | — | |
Expiring 12/16/20 | | Credit Suisse International | | | TWD | | | | 5,371 | | | | 189,000 | | | | 190,079 | | | | 1,079 | | | | — | |
Expiring 12/16/20 | | JPMorgan Chase Bank, N.A. | | | TWD | | | | 1,584 | | | | 55,124 | | | | 56,037 | | | | 913 | | | | — | |
Expiring 12/16/20 | | UBS AG | | | TWD | | | | 38,767 | | | | 1,333,121 | | | | 1,371,865 | | | | 38,744 | | | | — | |
New Zealand Dollar, | | | | | | | | | | | | | | | | | | | | | | | | | | |
Expiring 01/20/21 | | JPMorgan Chase Bank, N.A. | | | NZD | | | | 186 | | | | 122,750 | | | | 123,213 | | | | 463 | | | | — | |
Peruvian Nuevo Sol, | | | | | | | | | | | | | | | | | | | | | | | | | | |
Expiring 12/16/20 | | Citibank, N.A. | | | PEN | | | | 750 | | | | 212,000 | | | | 207,586 | | | | — | | | | (4,414 | ) |
Expiring 12/16/20 | | Citibank, N.A. | | | PEN | | | | 688 | | | | 195,000 | | | | 190,216 | | | | — | | | | (4,784 | ) |
Expiring 12/16/20 | | Citibank, N.A. | | | PEN | | | | 521 | | | | 146,000 | | | | 144,038 | | | | — | | | | (1,962 | ) |
See Notes to Financial Statements.
Forward foreign currency exchange contracts outstanding at October 31, 2020 (continued):
| | | | | | | | | | | | | | | | | | | | | | | | | | |
Purchase Contracts | | Counterparty | | Notional
Amount
(000) | | | Value at
Settlement
Date | | | Current
Value | | | Unrealized
Appreciation | | | Unrealized
Depreciation | |
|
| OTC Forward Foreign Currency Exchange Contracts (cont’d.): | |
Peruvian Nuevo Sol (cont’d.), | | | | | | | | | | | | | | | | | | | | | | | | |
Expiring 12/16/20 | | Citibank, N.A. | | | PEN | | | | 488 | | | $ | 137,613 | | | $ | 135,022 | | | $ | — | | | $ | (2,591 | ) |
Expiring 12/16/20 | | Citibank, N.A. | | | PEN | | | | 430 | | | | 121,000 | | | | 118,877 | | | | — | | | | (2,123 | ) |
Expiring 12/16/20 | | Citibank, N.A. | | | PEN | | | | 256 | | | | 71,214 | | | | 70,866 | | | | — | | | | (348 | ) |
Philippine Peso, | | | | | | | | | | | | | | | | | | | | | | | | | | |
Expiring 11/16/20 | | HSBC Bank USA, N.A. | | | PHP | | | | 6,845 | | | | 140,155 | | | | 140,959 | | | | 804 | | | | — | |
Expiring 12/16/20 | | Barclays Bank PLC | | | PHP | | | | 3,122 | | | | 64,110 | | | | 64,252 | | | | 142 | | | | — | |
Expiring 12/16/20 | | Citibank, N.A. | | | PHP | | | | 13,044 | | | | 268,000 | | | | 268,460 | | | | 460 | | | | — | |
Expiring 12/16/20 | | Goldman Sachs International | | | PHP | | | | 12,993 | | | | 268,000 | | | | 267,423 | | | | — | | | | (577 | ) |
Expiring 12/16/20 | | Goldman Sachs International | | | PHP | | | | 7,870 | | | | 161,000 | | | | 161,972 | | | | 972 | | | | — | |
Expiring 12/16/20 | | HSBC Bank USA, N.A. | | | PHP | | | | 13,948 | | | | 286,000 | | | | 287,072 | | | | 1,072 | | | | — | |
Expiring 12/16/20 | | HSBC Bank USA, N.A. | | | PHP | | | | 10,036 | | | | 205,000 | | | | 206,556 | | | | 1,556 | | | | — | |
Expiring 12/16/20 | | HSBC Bank USA, N.A. | | | PHP | | | | 8,545 | | | | 174,720 | | | | 175,869 | | | | 1,149 | | | | — | |
Expiring 12/16/20 | | HSBC Bank USA, N.A. | | | PHP | | | | 7,889 | | | | 161,280 | | | | 162,371 | | | | 1,091 | | | | — | |
Expiring 12/16/20 | | JPMorgan Chase Bank, N.A. | | | PHP | | | | 9,158 | | | | 188,000 | | | | 188,493 | | | | 493 | | | | — | |
Polish Zloty, | | | | | | | | | | | | | | | | | | | | | | | | | | |
Expiring 01/19/21 | | Bank of America, N.A. | | | PLN | | | | 1,545 | | | | 398,022 | | | | 390,436 | | | | — | | | | (7,586 | ) |
Expiring 01/19/21 | | Barclays Bank PLC | | | PLN | | | | 600 | | | | 156,000 | | | | 151,598 | | | | — | | | | (4,402 | ) |
Expiring 01/19/21 | | Goldman Sachs International | | | PLN | | | | 178 | | | | 45,910 | | | | 45,032 | | | | — | | | | (878 | ) |
Expiring 01/19/21 | | HSBC Bank USA, N.A. | | | PLN | | | | 6,829 | | | | 1,793,597 | | | | 1,725,589 | | | | — | | | | (68,008 | ) |
Expiring 01/19/21 | | JPMorgan Chase Bank, N.A. | | | PLN | | | | 410 | | | | 106,000 | | | | 103,526 | | | | — | | | | (2,474 | ) |
Romanian Leu, | | | | | | | | | | | | | | | | | | | | | | | | | | |
Expiring 01/19/21 | | Bank of America, N.A. | | | RON | | | | 525 | | | | 126,077 | | | | 125,126 | | | | — | | | | (951 | ) |
Expiring 01/19/21 | | Goldman Sachs International | | | RON | | | | 544 | | | | 129,594 | | | | 129,565 | | | | — | | | | (29 | ) |
Expiring 01/19/21 | | HSBC Bank USA, N.A. | | | RON | | | | 513 | | | | 123,231 | | | | 122,194 | | | | — | | | | (1,037 | ) |
Expiring 01/19/21 | | JPMorgan Chase Bank, N.A. | | | RON | | | | 349 | | | | 83,446 | | | | 83,138 | | | | — | | | | (308 | ) |
Russian Ruble, | | | | | | | | | | | | | | | | | | | | | | | | | | |
Expiring 12/16/20 | | Barclays Bank PLC | | | RUB | | | | 9,643 | | | | 125,000 | | | | 120,717 | | | | — | | | | (4,283 | ) |
Expiring 12/16/20 | | Barclays Bank PLC | | | RUB | | | | 5,425 | | | | 71,000 | | | | 67,918 | | | | — | | | | (3,082 | ) |
Expiring 12/16/20 | | Barclays Bank PLC | | | RUB | | | | 4,673 | | | | 60,000 | | | | 58,505 | | | | — | | | | (1,495 | ) |
Expiring 12/16/20 | | Citibank, N.A. | | | RUB | | | | 3,468 | | | | 46,323 | | | | 43,419 | | | | — | | | | (2,904 | ) |
Expiring 12/16/20 | | Citibank, N.A. | | | RUB | | | | 1,393 | | | | 18,123 | | | | 17,442 | | | | — | | | | (681 | ) |
Expiring 12/16/20 | | Citibank, N.A. | | | RUB | | | | 597 | | | | 7,660 | | | | 7,477 | | | | — | | | | (183 | ) |
Expiring 12/16/20 | | Goldman Sachs International | | | RUB | | | | 4,922 | | | | 62,919 | | | | 61,620 | | | | — | | | | (1,299 | ) |
See Notes to Financial Statements.
| | | | |
| PGIM Emerging Markets Debt Local Currency Fund | | | 29 | |
Schedule of Investments (continued)
as of October 31, 2020
Forward foreign currency exchange contracts outstanding at October 31, 2020 (continued):
| | | | | | | | | | | | | | | | | | | | | | | | | | |
Purchase Contracts | | Counterparty | | Notional
Amount
(000) | | | Value at
Settlement
Date | | | Current
Value | | | Unrealized
Appreciation | | | Unrealized
Depreciation | |
|
| OTC Forward Foreign Currency Exchange Contracts (cont’d.): | |
Russian Ruble (cont’d.), | | | | | | | | | | | | | | | | | | | | | | | | |
Expiring 12/16/20 | | JPMorgan Chase Bank, N.A. | | | RUB | | | | 2,689 | | | $ | 35,910 | | | $ | 33,662 | | | $ | — | | | $ | (2,248 | ) |
Expiring 12/16/20 | | Morgan Stanley & Co. International PLC | | | RUB | | | | 142,656 | | | | 1,859,501 | | | | 1,785,946 | | | | — | | | | (73,555 | ) |
Expiring 12/16/20 | | Morgan Stanley & Co. International PLC | | | RUB | | | | 9,963 | | | | 131,000 | | | | 124,723 | | | | — | | | | (6,277 | ) |
Expiring 12/16/20 | | Morgan Stanley & Co. International PLC | | | RUB | | | | 9,694 | | | | 126,000 | | | | 121,367 | | | | — | | | | (4,633 | ) |
Expiring 12/16/20 | | Morgan Stanley & Co. International PLC | | | RUB | | | | 8,491 | | | | 114,016 | | | | 106,305 | | | | — | | | | (7,711 | ) |
Expiring 12/16/20 | | Morgan Stanley & Co. International PLC | | | RUB | | | | 6,369 | | | | 83,000 | | | | 79,729 | | | | — | | | | (3,271 | ) |
Expiring 12/16/20 | | Morgan Stanley & Co. International PLC | | | RUB | | | | 5,929 | | | | 75,805 | | | | 74,221 | | | | — | | | | (1,584 | ) |
Expiring 12/16/20 | | Morgan Stanley & Co. International PLC | | | RUB | | | | 4,165 | | | | 55,131 | | | | 52,138 | | | | — | | | | (2,993 | ) |
Expiring 12/16/20 | | Morgan Stanley & Co. International PLC | | | RUB | | | | 4,164 | | | | 55,000 | | | | 52,128 | | | | — | | | | (2,872 | ) |
Singapore Dollar, | | | | | | | | | | | | | | | | | | | | | | | | | | |
Expiring 12/16/20 | | BNP Paribas S.A. | | | SGD | | | | 75 | | | | 55,175 | | | | 54,798 | | | | — | | | | (377 | ) |
Expiring 12/16/20 | | JPMorgan Chase Bank, N.A. | | | SGD | | | | 2,155 | | | | 1,578,444 | | | | 1,577,329 | | | | — | | | | (1,115 | ) |
Expiring 12/16/20 | | JPMorgan Chase Bank, N.A. | | | SGD | | | | 186 | | | | 136,285 | | | | 136,058 | | | | — | | | | (227 | ) |
Expiring 12/16/20 | | JPMorgan Chase Bank, N.A. | | | SGD | | | | 31 | | | | 23,010 | | | | 22,913 | | | | — | | | | (97 | ) |
South African Rand, | | | | | | | | | | | | | | | | | | | | | | | | | | |
Expiring 12/17/20 | | Barclays Bank PLC | | | ZAR | | | | 1,105 | | | | 67,000 | | | | 67,531 | | | | 531 | | | | — | |
Expiring 12/17/20 | | Barclays Bank PLC | | | ZAR | | | | 419 | | | | 25,103 | | | | 25,602 | | | | 499 | | | | — | |
Expiring 12/17/20 | | Deutsche Bank AG | | | ZAR | | | | 754 | | | | 44,862 | | | | 46,067 | | | | 1,205 | | | | — | |
Expiring 12/17/20 | | JPMorgan Chase Bank, N.A. | | | ZAR | | | | 2,405 | | | | 144,502 | | | | 146,973 | | | | 2,471 | | | | — | |
Expiring 12/17/20 | | JPMorgan Chase Bank, N.A. | | | ZAR | | | | 1,099 | | | | 65,000 | | | | 67,127 | | | | 2,127 | | | | — | |
Expiring 12/17/20 | | Morgan Stanley & Co. International PLC | | | ZAR | | | | 2,041 | | | | 125,000 | | | | 124,730 | | | | — | | | | (270 | ) |
South Korean Won, | | | | | | | | | | | | | | | | | | | | | | | | | | |
Expiring 12/16/20 | | Barclays Bank PLC | | | KRW | | | | 100,231 | | | | 87,956 | | | | 88,159 | | | | 203 | | | | — | |
Expiring 12/16/20 | | Citibank, N.A. | | | KRW | | | | 121,359 | | | | 105,566 | | | | 106,742 | | | | 1,176 | | | | — | |
Expiring 12/16/20 | | HSBC Bank USA, N.A. | | | KRW | | | | 1,110,850 | | | | 934,336 | | | | 977,057 | | | | 42,721 | | | | — | |
Expiring 12/16/20 | | HSBC Bank USA, N.A. | | | KRW | | | | 252,805 | | | | 217,000 | | | | 222,356 | | | | 5,356 | | | | — | |
See Notes to Financial Statements.
Forward foreign currency exchange contracts outstanding at October 31, 2020 (continued):
| | | | | | | | | | | | | | | | | | | | | | | | | | |
Purchase Contracts | | Counterparty | | Notional
Amount
(000) | | | Value at
Settlement
Date | | | Current
Value | | | Unrealized
Appreciation | | | Unrealized
Depreciation | |
|
| OTC Forward Foreign Currency Exchange Contracts (cont’d.): | |
South Korean Won (cont’d.), | | | | | | | | | | | | | | | | | | | | | | | | |
Expiring 12/16/20 | | JPMorgan Chase Bank, N.A. | | | KRW | | | | 797,827 | | | $ | 670,853 | | | $ | 701,734 | | | $ | 30,881 | | | $ | — | |
Expiring 12/16/20 | | JPMorgan Chase Bank, N.A. | | | KRW | | | | 193,591 | | | | 164,349 | | | | 170,274 | | | | 5,925 | | | | — | |
Expiring 12/16/20 | | JPMorgan Chase Bank, N.A. | | | KRW | | | | 169,687 | | | | 146,000 | | | | 149,249 | | | | 3,249 | | | | — | |
Expiring 12/16/20 | | JPMorgan Chase Bank, N.A. | | | KRW | | | | 162,206 | | | | 138,413 | | | | 142,670 | | | | 4,257 | | | | — | |
Expiring 12/16/20 | | JPMorgan Chase Bank, N.A. | | | KRW | | | | 160,864 | | | | 138,568 | | | | 141,489 | | | | 2,921 | | | | — | |
Expiring 12/16/20 | | JPMorgan Chase Bank, N.A. | | | KRW | | | | 128,417 | | | | 109,566 | | | | 112,950 | | | | 3,384 | | | | — | |
Expiring 12/16/20 | | Morgan Stanley & Co. International PLC | | | KRW | | | | 42,877 | | | | 36,822 | | | | 37,712 | | | | 890 | | | | — | |
Thai Baht, | | | | | | | | | | | | | | | | | | | | | | | | | | |
Expiring 12/16/20 | | Citibank, N.A. | | | THB | | | | 29,649 | | | | 940,018 | | | | 951,065 | | | | 11,047 | | | | — | |
Expiring 12/16/20 | | Citibank, N.A. | | | THB | | | | 8,440 | | | | 266,698 | | | | 270,747 | | | | 4,049 | | | | — | |
Expiring 12/16/20 | | Credit Suisse International | | | THB | | | | 13,761 | | | | 438,388 | | | | 441,416 | | | | 3,028 | | | | — | |
Expiring 12/16/20 | | HSBC Bank USA, N.A. | | | THB | | | | 5,165 | | | | 164,436 | | | | 165,674 | | | | 1,238 | | | | — | |
Expiring 12/16/20 | | HSBC Bank USA, N.A. | | | THB | | | | 4,845 | | | | 155,000 | | | | 155,409 | | | | 409 | | | | — | |
Expiring 12/16/20 | | HSBC Bank USA, N.A. | | | THB | | | | 1,721 | | | | 55,262 | | | | 55,206 | | | | — | | | | (56 | ) |
Expiring 12/16/20 | | JPMorgan Chase Bank, N.A. | | | THB | | | | 18,961 | | | | 602,885 | | | | 608,210 | | | | 5,325 | | | | — | |
Expiring 12/16/20 | | JPMorgan Chase Bank, N.A. | | | THB | | | | 17,826 | | | | 566,625 | | | | 571,811 | | | | 5,186 | | | | — | |
Expiring 12/16/20 | | JPMorgan Chase Bank, N.A. | | | THB | | | | 5,206 | | | | 166,262 | | | | 166,995 | | | | 733 | | | | — | |
Turkish Lira, | | | | | | | | | | | | | | | | | | | | | | | | | | |
Expiring 12/16/20 | | Barclays Bank PLC | | | TRY | | | | 1,811 | | | | 215,000 | | | | 211,086 | | | | — | | | | (3,914 | ) |
Expiring 12/16/20 | | Barclays Bank PLC | | | TRY | | | | 1,567 | | | | 201,350 | | | | 182,635 | | | | — | | | | (18,715 | ) |
Expiring 12/16/20 | | Barclays Bank PLC | | | TRY | | | | 1,535 | | | | 190,000 | | | | 178,857 | | | | — | | | | (11,143 | ) |
Expiring 12/16/20 | | Barclays Bank PLC | | | TRY | | | | 1,162 | | | | 137,000 | | | | 135,354 | | | | — | | | | (1,646 | ) |
Expiring 12/16/20 | | Barclays Bank PLC | | | TRY | | | | 821 | | | | 102,000 | | | | 95,719 | | | | — | | | | (6,281 | ) |
Expiring 12/16/20 | | Barclays Bank PLC | | | TRY | | | | 117 | | | | 15,246 | | | | 13,648 | | | | — | | | | (1,598 | ) |
Expiring 12/16/20 | | HSBC Bank USA, N.A. | | | TRY | | | | 947 | | | | 118,082 | | | | 110,382 | | | | — | | | | (7,700 | ) |
Expiring 12/16/20 | | JPMorgan Chase Bank, N.A. | | | TRY | | | | 1,838 | | | | 214,890 | | | | 214,137 | | | | — | | | | (753 | ) |
Expiring 12/16/20 | | Morgan Stanley & Co. International PLC | | | TRY | | | | 3,158 | | | | 368,865 | | | | 367,975 | | | | — | | | | (890 | ) |
Expiring 12/16/20 | | Morgan Stanley & Co. International PLC | | | TRY | | | | 827 | | | | 102,000 | | | | 96,376 | | | | — | | | | (5,624 | ) |
See Notes to Financial Statements.
| | | | |
| PGIM Emerging Markets Debt Local Currency Fund | | | 31 | |
Schedule of Investments (continued)
as of October 31, 2020
Forward foreign currency exchange contracts outstanding at October 31, 2020 (continued):
| | | | | | | | | | | | | | | | | | | | | | | | | | |
Purchase Contracts | | Counterparty | | Notional
Amount
(000) | | | Value at
Settlement
Date | | | Current
Value | | | Unrealized
Appreciation | | | Unrealized
Depreciation | |
|
| OTC Forward Foreign Currency Exchange Contracts (cont’d.): | |
Ukraine Hryvna, | | | | | | | | | | | | | | | | | | | | | | | | |
Expiring 01/11/21 | | Citibank, N.A. | | | UAH | | | | 1,175 | | | $ | 40,569 | | | $ | 40,255 | | | $ | — | | | $ | (314 | ) |
| | | | | | | | | | | | | | | | | | | | | | | | | | |
| | | | | | | | | | | | $ | 53,695,551 | | | $ | 53,722,193 | | | | 579,337 | | | | (552,695 | ) |
| | | | | | | | | | | | | | | | | | | | | | | | | | |
| | | | | | |
Sale Contracts | | Counterparty | | Notional
Amount
(000) | | | Value at
Settlement
Date | | | Current
Value | | | Unrealized
Appreciation | | | Unrealized
Depreciation | |
|
| OTC Forward Foreign Currency Exchange Contracts: | |
Australian Dollar, | | | | | | | | | | | | | | | | | | | | | | | | |
Expiring 01/20/21 | | BNP Paribas S.A. | | | AUD | | | | 504 | | | $ | 357,742 | | | $ | 354,686 | | | $ | 3,056 | | | $ | — | |
Expiring 01/20/21 | | HSBC Bank USA, N.A. | | | AUD | | | | 72 | | | | 50,791 | | | | 50,356 | | | | 435 | | | | — | |
Brazilian Real, | | | | | | | | | | | | | | | | | | | | | | | | |
Expiring 11/04/20 | | Citibank, N.A. | | | BRL | | | | 1,113 | | | | 199,344 | | | | 193,881 | | | | 5,463 | | | | — | |
Expiring 11/04/20 | | Citibank, N.A. | | | BRL | | | | 427 | | | | 76,000 | | | | 74,418 | | | | 1,582 | | | | — | |
Expiring 11/04/20 | | Goldman Sachs International | | | BRL | | | | 234 | | | | 41,418 | | | | 40,713 | | | | 705 | | | | — | |
Expiring 11/04/20 | | JPMorgan Chase Bank, N.A. | | | BRL | | | | 870 | | | | 154,600 | | | | 151,530 | | | | 3,070 | | | | — | |
Expiring 11/04/20 | | JPMorgan Chase Bank, N.A. | | | BRL | | | | 383 | | | | 69,000 | | | | 66,812 | | | | 2,188 | | | | — | |
Expiring 11/04/20 | | Morgan Stanley & Co. International PLC | | | BRL | | | | 12,408 | | | | 2,203,702 | | | | 2,161,856 | | | | 41,846 | | | | — | |
Expiring 11/04/20 | | Morgan Stanley & Co. International PLC | | | BRL | | | | 817 | | | | 146,207 | | | | 142,340 | | | | 3,867 | | | | — | |
Expiring 11/04/20 | | UBS AG | | | BRL | | | | 341 | | | | 61,000 | | | | 59,464 | | | | 1,536 | | | | — | |
Expiring 12/02/20 | | JPMorgan Chase Bank, N.A. | | | BRL | | | | 385 | | | | 68,000 | | | | 66,910 | | | | 1,090 | | | | — | |
Expiring 12/02/20 | | Morgan Stanley & Co. International PLC | | | BRL | | | | 1,300 | | | | 224,000 | | | | 226,194 | | | | — | | | | (2,194 | ) |
Expiring 12/02/20 | | Morgan Stanley & Co. International PLC | | | BRL | | | | 416 | | | | 72,000 | | | | 72,425 | | | | — | | | | (425 | ) |
Chilean Peso, | | | | | | | | | | | | | | | | | | | | | | | | |
Expiring 12/16/20 | | BNP Paribas S.A. | | | CLP | | | | 207,330 | | | | 270,366 | | | | 268,087 | | | | 2,279 | | | | — | |
Expiring 12/16/20 | | BNP Paribas S.A. | | | CLP | | | | 65,354 | | | | 83,000 | | | | 84,506 | | | | — | | | | (1,506 | ) |
Expiring 12/16/20 | | Citibank, N.A. | | | CLP | | | | 42,119 | | | | 52,915 | | | | 54,461 | | | | — | | | | (1,546 | ) |
Expiring 12/16/20 | | Goldman Sachs International | | | CLP | | | | 28,803 | | | | 37,212 | | | | 37,244 | | | | — | | | | (32 | ) |
Expiring 12/16/20 | | Goldman Sachs International | | | CLP | | | | 27,131 | | | | 34,441 | | | | 35,081 | | | | — | | | | (640 | ) |
Expiring 12/16/20 | | HSBC Bank USA, N.A. | | | CLP | | | | 298,353 | | | | 387,990 | | | | 385,784 | | | | 2,206 | | | | — | |
Expiring 12/16/20 | | HSBC Bank USA, N.A. | | | CLP | | | | 65,270 | | | | 82,000 | | | | 84,397 | | | | — | | | | (2,397 | ) |
See Notes to Financial Statements.
Forward foreign currency exchange contracts outstanding at October 31, 2020 (continued):
| | | | | | | | | | | | | | | | | | | | | | | | | | |
Sale Contracts | | Counterparty | | Notional
Amount
(000) | | | Value at
Settlement
Date | | | Current
Value | | | Unrealized
Appreciation | | | Unrealized
Depreciation | |
|
| OTC Forward Foreign Currency Exchange Contracts (cont’d.): | |
Chilean Peso (cont’d.), | | | | | | | | | | | | | | | | | | | | | | | | |
Expiring 12/16/20 | | HSBC Bank USA, N.A. | | | CLP | | | | 58,772 | | | $ | 74,678 | | | $ | 75,994 | | | $ | — | | | $ | (1,316 | ) |
Expiring 12/16/20 | | JPMorgan Chase Bank, N.A. | | | CLP | | | | 106,161 | | | | 134,281 | | | | 137,271 | | | | — | | | | (2,990 | ) |
Expiring 12/16/20 | | Morgan Stanley & Co. International PLC | | | CLP | | | | 113,072 | | | | 141,000 | | | | 146,208 | | | | — | | | | (5,208 | ) |
Chinese Renminbi, | | | | | | | | | | | | | | | | | | | | | | | | |
Expiring 11/06/20 | | Citibank, N.A. | | | CNH | | | | 1,937 | | | | 288,113 | | | | 289,191 | | | | — | | | | (1,078 | ) |
Expiring 11/06/20 | | Citibank, N.A. | | | CNH | | | | 1,722 | | | | 248,000 | | | | 257,050 | | | | — | | | | (9,050 | ) |
Expiring 11/06/20 | | Credit Suisse International | | | CNH | | | | 3,665 | | | | 544,000 | | | | 547,065 | | | | — | | | | (3,065 | ) |
Expiring 11/06/20 | | Goldman Sachs International | | | CNH | | | | 1,681 | | | | 245,000 | | | | 250,967 | | | | — | | | | (5,967 | ) |
Expiring 11/06/20 | | HSBC Bank USA, N.A. | | | CNH | | | | 4,450 | | | | 648,137 | | | | 664,279 | | | | — | | | | (16,142 | ) |
Expiring 11/06/20 | | HSBC Bank USA, N.A. | | | CNH | | | | 3,957 | | | | 592,575 | | | | 590,706 | | | | 1,869 | | | | — | |
Expiring 11/06/20 | | HSBC Bank USA, N.A. | | | CNH | | | | 3,588 | | | | 535,000 | | | | 535,565 | | | | — | | | | (565 | ) |
Expiring 11/06/20 | | HSBC Bank USA, N.A. | | | CNH | | | | 2,951 | | | | 437,970 | | | | 440,429 | | | | — | | | | (2,459 | ) |
Expiring 11/06/20 | | HSBC Bank USA, N.A. | | | CNH | | | | 2,050 | | | | 301,362 | | | | 305,928 | | | | — | | | | (4,566 | ) |
Expiring 11/06/20 | | HSBC Bank USA, N.A. | | | CNH | | | | 1,482 | | | | 223,000 | | | | 221,238 | | | | 1,762 | | | | — | |
Expiring 11/06/20 | | HSBC Bank USA, N.A. | | | CNH | | | | 1,162 | | | | 173,000 | | | | 173,423 | | | | — | | | | (423 | ) |
Expiring 11/06/20 | | HSBC Bank USA, N.A. | | | CNH | | | | 1,134 | | | | 170,000 | | | | 169,253 | | | | 747 | | | | — | |
Expiring 11/06/20 | | HSBC Bank USA, N.A. | | | CNH | | | | 992 | | | | 144,439 | | | | 148,036 | | | | — | | | | (3,597 | ) |
Expiring 11/06/20 | | HSBC Bank USA, N.A. | | | CNH | | | | 963 | | | | 142,000 | | | | 143,798 | | | | — | | | | (1,798 | ) |
Expiring 11/06/20 | | JPMorgan Chase Bank, N.A. | | | CNH | | | | 2,533 | | | | 373,661 | | | | 378,153 | | | | — | | | | (4,492 | ) |
Expiring 11/06/20 | | UBS AG | | | CNH | | | | 1,005 | | | | 147,000 | | | | 149,958 | | | | — | | | | (2,958 | ) |
Expiring 05/14/21 | | JPMorgan Chase Bank, N.A. | | | CNH | | | | 4,640 | | | | 666,044 | | | | 683,383 | | | | — | | | | (17,339 | ) |
Colombian Peso, | | | | | | | | | | | | | | | | | | | | | | | | |
Expiring 12/16/20 | | BNP Paribas S.A. | | | COP | | | | 671,937 | | | | 179,153 | | | | 173,243 | | | | 5,910 | | | | — | |
Expiring 12/16/20 | | BNP Paribas S.A. | | | COP | | | | 283,135 | | | | 74,075 | | | | 72,999 | | | | 1,076 | | | | — | |
Expiring 12/16/20 | | Citibank, N.A. | | | COP | | | | 1,044,688 | | | | 270,513 | | | | 269,348 | | | | 1,165 | | | | — | |
Expiring 12/16/20 | | Citibank, N.A. | | | COP | | | | 515,309 | | | | 133,349 | | | | 132,860 | | | | 489 | | | | — | |
Expiring 12/16/20 | | Citibank, N.A. | | | COP | | | | 331,840 | | | | 88,607 | | | | 85,558 | | | | 3,049 | | | | — | |
Expiring 12/16/20 | | Citibank, N.A. | | | COP | | | | 215,176 | | | | 57,580 | | | | 55,478 | | | | 2,102 | | | | — | |
Expiring 12/16/20 | | JPMorgan Chase Bank, N.A. | | | COP | | | | 747,309 | | | | 194,073 | | | | 192,675 | | | | 1,398 | | | | — | |
Expiring 12/16/20 | | JPMorgan Chase Bank, N.A. | | | COP | | | | 423,493 | | | | 114,316 | | | | 109,188 | | | | 5,128 | | | | — | |
Expiring 12/16/20 | | JPMorgan Chase Bank, N.A. | | | COP | | | | 356,296 | | | | 95,753 | | | | 91,863 | | | | 3,890 | | | | — | |
Expiring 12/16/20 | | JPMorgan Chase Bank, N.A. | | | COP | | | | 335,649 | | | | 86,889 | | | | 86,540 | | | | 349 | | | | — | |
See Notes to Financial Statements.
| | | | |
| PGIM Emerging Markets Debt Local Currency Fund | | | 33 | |
Schedule of Investments (continued)
as of October 31, 2020
Forward foreign currency exchange contracts outstanding at October 31, 2020 (continued):
| | | | | | | | | | | | | | | | | | | | | | | | | | |
Sale Contracts | | Counterparty | | Notional
Amount
(000) | | | Value at
Settlement
Date | | | Current
Value | | | Unrealized
Appreciation | | | Unrealized
Depreciation | |
|
| OTC Forward Foreign Currency Exchange Contracts (cont’d.): | |
Czech Koruna, | | | | | | | | | | | | | | | | | | | | | | | | |
Expiring 01/19/21 | | Bank of America, N.A. | | | CZK | | | | 5,186 | | | $ | 222,672 | | | $ | 222,046 | | | $ | 626 | | | $ | — | |
Expiring 01/19/21 | | Barclays Bank PLC | | | CZK | | | | 2,546 | | | | 109,000 | | | | 109,016 | | | | — | | | | (16 | ) |
Expiring 01/19/21 | | JPMorgan Chase Bank, N.A. | | | CZK | | | | 3,105 | | | | 133,000 | | | | 132,954 | | | | 46 | | | | — | |
Expiring 01/19/21 | | JPMorgan Chase Bank, N.A. | | | CZK | | | | 3,015 | | | | 129,000 | | | | 129,063 | | | | — | | | | (63 | ) |
Expiring 01/19/21 | | JPMorgan Chase Bank, N.A. | | | CZK | | | | 1,593 | | | | 68,113 | | | | 68,202 | | | | — | | | | (89 | ) |
Hungarian Forint, | | | | | | | | | | | | | | | | | | | | | | | | |
Expiring 01/19/21 | | Barclays Bank PLC | | | HUF | | | | 41,891 | | | | 134,000 | | | | 132,873 | | | | 1,127 | | | | — | |
Expiring 01/19/21 | | Goldman Sachs International | | | HUF | | | | 49,517 | | | | 159,713 | | | | 157,061 | | | | 2,652 | | | | — | |
Expiring 01/19/21 | | Goldman Sachs International | | | HUF | | | | 18,393 | | | | 59,652 | | | | 58,341 | | | | 1,311 | | | | — | |
Indian Rupee, | | | | | | | | | | | | | | | | | | | | | | | | |
Expiring 12/16/20 | | Citibank, N.A. | | | INR | | | | 10,429 | | | | 141,000 | | | | 139,283 | | | | 1,717 | | | | — | |
Expiring 12/16/20 | | Goldman Sachs International | | | INR | | | | 18,280 | | | | 248,000 | | | | 244,144 | | | | 3,856 | | | | — | |
Expiring 12/16/20 | | Morgan Stanley & Co. International PLC | | | INR | | | | 10,642 | | | | 144,000 | | | | 142,126 | | | | 1,874 | | | | — | |
Indonesian Rupiah, | | | | | | | | | | | | | | | | | | | | | | | | |
Expiring 12/16/20 | | Goldman Sachs International | | | IDR | | | | 1,859,064 | | | | 123,748 | | | | 125,183 | | | | — | | | | (1,435 | ) |
Expiring 12/16/20 | | HSBC Bank USA, N.A. | | | IDR | | | | 15,662,461 | | | | 1,043,156 | | | | 1,054,653 | | | | — | | | | (11,497 | ) |
Expiring 12/16/20 | | JPMorgan Chase Bank, N.A. | | | IDR | | | | 3,027,481 | | | | 204,380 | | | | 203,859 | | | | 521 | | | | — | |
Expiring 12/16/20 | | JPMorgan Chase Bank, N.A. | | | IDR | | | | 1,905,830 | | | | 126,440 | | | | 128,332 | | | | — | | | | (1,892 | ) |
Israeli Shekel, | | | | | | | | | | | | | | | | | | | | | | | | |
Expiring 12/16/20 | | Citibank, N.A. | | | ILS | | | | 680 | | | | 199,000 | | | | 199,513 | | | | — | | | | (513 | ) |
Expiring 12/16/20 | | Citibank, N.A. | | | ILS | | | | 422 | | | | 123,000 | | | | 123,672 | | | | — | | | | (672 | ) |
Malaysian Ringgit, | | | | | | | | | | | | | | | | | | | | | | | | |
Expiring 12/16/20 | | Barclays Bank PLC | | | MYR | | | | 611 | | | | 146,209 | | | | 146,478 | | | | — | | | | (269 | ) |
Expiring 12/16/20 | | Goldman Sachs International | | | MYR | | | | 229 | | | | 55,000 | | | | 54,864 | | | | 136 | | | | — | |
Mexican Peso, | | | | | | | | | | | | | | | | | | | | | | | | |
Expiring 12/16/20 | | Deutsche Bank AG | | | MXN | | | | 12,762 | | | | 593,201 | | | | 598,547 | | | | — | | | | (5,346 | ) |
Expiring 12/16/20 | | Goldman Sachs International | | | MXN | | | | 3,118 | | | | 138,568 | | | | 146,220 | | | | — | | | | (7,652 | ) |
Expiring 12/16/20 | | Goldman Sachs International | | | MXN | | | | 2,701 | | | | 121,300 | | | | 126,683 | | | | — | | | | (5,383 | ) |
See Notes to Financial Statements.
Forward foreign currency exchange contracts outstanding at October 31, 2020 (continued):
| | | | | | | | | | | | | | | | | | | | | | | | | | |
Sale Contracts | | Counterparty | | Notional
Amount
(000) | | | Value at
Settlement
Date | | | Current
Value | | | Unrealized
Appreciation | | | Unrealized
Depreciation | |
|
| OTC Forward Foreign Currency Exchange Contracts (cont’d.): | |
Mexican Peso (cont’d.), | | | | | | | | | | | | | | | | | | | | | | | | |
Expiring 12/16/20 | | Goldman Sachs International | | | MXN | | | | 1,728 | | | $ | 78,293 | | | $ | 81,060 | | | $ | — | | | $ | (2,767 | ) |
Expiring 12/16/20 | | JPMorgan Chase Bank, N.A. | | | MXN | | | | 4,146 | | | | 193,957 | | | | 194,461 | | | | — | | | | (504 | ) |
Expiring 12/16/20 | | Morgan Stanley & Co. International PLC | | | MXN | | | | 965 | | | | 43,318 | | | | 45,258 | | | | — | | | | (1,940 | ) |
New Taiwanese Dollar, | | | | | | | | | | | | | | | | | | | | | | | | |
Expiring 12/16/20 | | Barclays Bank PLC | | | TWD | | | | 4,809 | | | | 169,327 | | | | 170,179 | | | | — | | | | (852 | ) |
Expiring 12/16/20 | | Credit Suisse International | | | TWD | | | | 15,443 | | | | 541,000 | | | | 546,484 | | | | — | | | | (5,484 | ) |
Expiring 12/16/20 | | Credit Suisse International | | | TWD | | | | 9,106 | | | | 322,000 | | | | 322,220 | | | | — | | | | (220 | ) |
Expiring 12/16/20 | | Credit Suisse International | | | TWD | | | | 7,958 | | | | 280,000 | | | | 281,613 | | | | — | | | | (1,613 | ) |
Expiring 12/16/20 | | Credit Suisse International | | | TWD | | | | 6,311 | | | | 222,000 | | | | 223,345 | | | | — | | | | (1,345 | ) |
Expiring 12/16/20 | | Credit Suisse International | | | TWD | | | | 4,492 | | | | 155,000 | | | | 158,945 | | | | — | | | | (3,945 | ) |
Expiring 12/16/20 | | HSBC Bank USA, N.A. | | | TWD | | | | 14,356 | | | | 502,000 | | | | 508,022 | | | | — | | | | (6,022 | ) |
Expiring 12/16/20 | | HSBC Bank USA, N.A. | | | TWD | | | | 13,876 | | | | 482,000 | | | | 491,028 | | | | — | | | | (9,028 | ) |
Expiring 12/16/20 | | JPMorgan Chase Bank, N.A. | | | TWD | | | | 19,891 | | | | 701,000 | | | | 703,897 | | | | — | | | | (2,897 | ) |
Expiring 12/16/20 | | JPMorgan Chase Bank, N.A. | | | TWD | | | | 11,308 | | | | 396,000 | | | | 400,152 | | | | — | | | | (4,152 | ) |
Expiring 12/16/20 | | Morgan Stanley & Co. International PLC | | | TWD | | | | 14,755 | | | | 518,000 | | | | 522,133 | | | | — | | | | (4,133 | ) |
New Zealand Dollar, | | | | | | | | | | | | | | | | | | | | | | | | |
Expiring 01/20/21 | | Citibank, N.A. | | | NZD | | | | 143 | | | | 94,000 | | | | 94,551 | | | | — | | | | (551 | ) |
Expiring 01/20/21 | | Citibank, N.A. | | | NZD | | | | 42 | | | | 28,014 | | | | 28,017 | | | | — | | | | (3 | ) |
Peruvian Nuevo Sol, | | | | | | | | | | | | | | | | | | | | | | | | |
Expiring 12/16/20 | | BNP Paribas S.A. | | | PEN | | | | 697 | | | | 192,288 | | | | 192,793 | | | | — | | | | (505 | ) |
Expiring 12/16/20 | | Citibank, N.A. | | | PEN | | | | 3,138 | | | | 887,698 | | | | 868,060 | | | | 19,638 | | | | — | |
Expiring 12/16/20 | | Citibank, N.A. | | | PEN | | | | 384 | | | | 106,680 | | | | 106,229 | | | | 451 | | | | — | |
Expiring 12/16/20 | | Citibank, N.A. | | | PEN | | | | 251 | | | | 70,000 | | | | 69,480 | | | | 520 | | | | — | |
Expiring 12/16/20 | | Citibank, N.A. | | | PEN | | | | 197 | | | | 55,000 | | | | 54,618 | | | | 382 | | | | — | |
Expiring 12/16/20 | | Goldman Sachs International | | | PEN | | | | 200 | | | | 55,281 | | | | 55,320 | | | | — | | | | (39 | ) |
Expiring 12/16/20 | | Goldman Sachs International | | | PEN | | | | 184 | | | | 51,179 | | | | 50,963 | | | | 216 | | | | — | |
Expiring 12/16/20 | | JPMorgan Chase Bank, N.A. | | | PEN | | | | 825 | | | | 232,669 | | | | 228,114 | | | | 4,555 | | | | — | |
See Notes to Financial Statements.
| | | | |
| PGIM Emerging Markets Debt Local Currency Fund | | | 35 | |
Schedule of Investments (continued)
as of October 31, 2020
Forward foreign currency exchange contracts outstanding at October 31, 2020 (continued):
| | | | | | | | | | | | | | | | | | | | | | | | | | |
Sale Contracts | | Counterparty | | Notional
Amount
(000) | | | Value at
Settlement
Date | | | Current
Value | | | Unrealized
Appreciation | | | Unrealized
Depreciation | |
|
| OTC Forward Foreign Currency Exchange Contracts (cont’d.): | |
Philippine Peso, | | | | | | | | | | | | | | | | | | | | | | | | |
Expiring 12/16/20 | | HSBC Bank USA, N.A. | | | PHP | | | | 26,714 | | | $ | 551,000 | | | $ | 549,824 | | | $ | 1,176 | | | $ | — | |
Expiring 12/16/20 | | HSBC Bank USA, N.A. | | | PHP | | | | 17,009 | | | | 351,000 | | | | 350,081 | | | | 919 | | | | — | |
Expiring 12/16/20 | | HSBC Bank USA, N.A. | | | PHP | | | | 13,557 | | | | 279,000 | | | | 279,025 | | | | — | | | | (25 | ) |
Expiring 12/16/20 | | HSBC Bank USA, N.A. | | | PHP | | | | 6,977 | | | | 144,000 | | | | 143,589 | | | | 411 | | | | — | |
Expiring 12/16/20 | | JPMorgan Chase Bank, N.A. | | | PHP | | | | 26,767 | | | | 548,429 | | | | 550,905 | | | | — | | | | (2,476 | ) |
Polish Zloty, | | | | | | | | | | | | | | | | | | | | | | | | |
Expiring 01/19/21 | | Citibank, N.A. | | | PLN | | | | 398 | | | | 104,069 | | | | 100,604 | | | | 3,465 | | | | — | |
Expiring 01/19/21 | | HSBC Bank USA, N.A. | | | PLN | | | | 472 | | | | 123,000 | | | | 119,302 | | | | 3,698 | | | | — | |
Romanian Leu, | | | | | | | | | | | | | | | | | | | | | | | | |
Expiring 01/19/21 | | Goldman Sachs International | | | RON | | | | 551 | | | | 131,942 | | | | 131,252 | | | | 690 | | | | — | |
Russian Ruble, | | | | | | | | | | | | | | | | | | | | | | | | |
Expiring 12/16/20 | | Citibank, N.A. | | | RUB | | | | 9,846 | | | | 124,000 | | | | 123,259 | | | | 741 | | | | — | |
Expiring 12/16/20 | | Citibank, N.A. | | | RUB | | | | 4,329 | | | | 57,000 | | | | 54,199 | | | | 2,801 | | | | — | |
Expiring 12/16/20 | | Goldman Sachs International | | | RUB | | | | 6,020 | | | | 75,370 | | | | 75,360 | | | | 10 | | | | — | |
Singapore Dollar, | | | | | | | | | | | | | | | | | | | | | | | | |
Expiring 12/16/20 | | BNP Paribas S.A. | | | SGD | | | | 225 | | | | 165,000 | | | | 164,806 | | | | 194 | | | | — | |
Expiring 12/16/20 | | Credit Suisse International | | | SGD | | | | 226 | | | | 165,000 | | | | 165,089 | | | | — | | | | (89 | ) |
Expiring 12/16/20 | | Credit Suisse International | | | SGD | | | | 218 | | | | 158,000 | | | | 159,500 | | | | — | | | | (1,500 | ) |
Expiring 12/16/20 | | JPMorgan Chase Bank, N.A. | | | SGD | | | | 369 | | | | 271,000 | | | | 270,493 | | | | 507 | | | | — | |
Expiring 12/16/20 | | JPMorgan Chase Bank, N.A. | | | SGD | | | | 213 | | | | 157,000 | | | | 156,264 | | | | 736 | | | | — | |
Expiring 12/16/20 | | JPMorgan Chase Bank, N.A. | | | SGD | | | | 212 | | | | 154,000 | | | | 154,938 | | | | — | | | | (938 | ) |
Expiring 12/16/20 | | JPMorgan Chase Bank, N.A. | | | SGD | | | | 209 | | | | 153,000 | | | | 153,313 | | | | — | | | | (313 | ) |
Expiring 12/16/20 | | The Toronto-Dominion Bank | | | SGD | | | | 208 | | | | 151,000 | | | | 152,274 | | | | — | | | | (1,274 | ) |
South African Rand, | | | | | | | | | | | | | | | | | | | | | | | | |
Expiring 12/17/20 | | Barclays Bank PLC | | | ZAR | | | | 11,760 | | | | 694,682 | | | | 718,589 | | | | — | | | | (23,907 | ) |
Expiring 12/17/20 | | Citibank, N.A. | | | ZAR | | | | 16,906 | | | | 1,008,502 | | | | 1,032,997 | | | | — | | | | (24,495 | ) |
Expiring 12/17/20 | | Citibank, N.A. | | | ZAR | | | | 2,819 | | | | 163,171 | | | | 172,271 | | | | — | | | | (9,100 | ) |
Expiring 12/17/20 | | Citibank, N.A. | | | ZAR | | | | 2,308 | | | | 133,318 | | | | 140,998 | | | | — | | | | (7,680 | ) |
Expiring 12/17/20 | | Goldman Sachs International | | | ZAR | | | | 1,123 | | | | 66,738 | | | | 68,642 | | | | — | | | | (1,904 | ) |
Expiring 12/17/20 | | JPMorgan Chase Bank, N.A. | | | ZAR | | | | 11,299 | | | | 670,045 | | | | 690,410 | | | | — | | | | (20,365 | ) |
See Notes to Financial Statements.
Forward foreign currency exchange contracts outstanding at October 31, 2020 (continued):
| | | | | | | | | | | | | | | | | | | | | | | | | | |
Sale Contracts | | Counterparty | | Notional
Amount
(000) | | | Value at
Settlement
Date | | | Current
Value | | | Unrealized
Appreciation | | | Unrealized
Depreciation | |
|
| OTC Forward Foreign Currency Exchange Contracts (cont’d.): | |
South African Rand (cont’d.), | | | | | | | | | | | | | | | | | | | | | | | | |
Expiring 12/17/20 | | JPMorgan Chase Bank, N.A. | | | ZAR | | | | 2,301 | | | $ | 136,141 | | | $ | 140,622 | | | $ | — | | | $ | (4,481 | ) |
Expiring 12/17/20 | | JPMorgan Chase Bank, N.A. | | | ZAR | | | | 868 | | | | 53,157 | | | | 53,057 | | | | 100 | | | | — | |
Expiring 12/17/20 | | Morgan Stanley & Co. International PLC | | | ZAR | | | | 2,699 | | | | 162,919 | | | | 164,912 | | | | — | | | | (1,993 | ) |
Expiring 12/17/20 | | Morgan Stanley & Co. International PLC | | | ZAR | | | | 1,684 | | | | 101,371 | | | | 102,868 | | | | — | | | | (1,497 | ) |
South Korean Won, | | | | | | | | | | | | | | | | | | | | | | | | |
Expiring 12/16/20 | | Citibank, N.A. | | | KRW | | | | 221,651 | | | | 187,000 | | | | 194,955 | | | | — | | | | (7,955 | ) |
Expiring 12/16/20 | | Credit Suisse International | | | KRW | | | | 159,705 | | | | 141,000 | | | | 140,470 | | | | 530 | | | | — | |
Expiring 12/16/20 | | HSBC Bank USA, N.A. | | | KRW | | | | 190,233 | | | | 167,000 | | | | 167,321 | | | | — | | | | (321 | ) |
Expiring 12/16/20 | | HSBC Bank USA, N.A. | | | KRW | | | | 177,804 | | | | 157,000 | | | | 156,389 | | | | 611 | | | | — | |
Expiring 12/16/20 | | JPMorgan Chase Bank, N.A. | | | KRW | | | | 163,692 | | | | 144,000 | | | | 143,976 | | | | 24 | | | | — | |
Expiring 12/16/20 | | JPMorgan Chase Bank, N.A. | | | KRW | | | | 157,639 | | | | 138,413 | | | | 138,652 | | | | — | | | | (239 | ) |
Expiring 12/16/20 | | JPMorgan Chase Bank, N.A. | | | KRW | | | | 121,584 | | | | 107,000 | | | | 106,940 | | | | 60 | | | | — | |
Expiring 12/16/20 | | Morgan Stanley & Co. International PLC | | | KRW | | | | 197,965 | | | | 170,000 | | | | 174,121 | | | | — | | | | (4,121 | ) |
Expiring 12/16/20 | | Morgan Stanley & Co. International PLC | | | KRW | | | | 113,460 | | | | 100,000 | | | | 99,795 | | | | 205 | | | | — | |
Thai Baht, | | | | | | | | | | | | | | | | | | | | | | | | |
Expiring 12/16/20 | | BNP Paribas S.A. | | | THB | | | | 4,272 | | | | 137,000 | | | | 137,020 | | | | — | | | | (20 | ) |
Expiring 12/16/20 | | Citibank, N.A. | | | THB | | | | 8,116 | | | | 259,000 | | | | 260,349 | | | | — | | | | (1,349 | ) |
Expiring 12/16/20 | | Citibank, N.A. | | | THB | | | | 4,640 | | | | 146,000 | | | | 148,826 | | | | — | | | | (2,826 | ) |
Expiring 12/16/20 | | Credit Suisse International | | | THB | | | | 4,729 | | | | 149,000 | | | | 151,707 | | | | — | | | | (2,707 | ) |
Expiring 12/16/20 | | Goldman Sachs International | | | THB | | | | 870 | | | | 27,459 | | | | 27,907 | | | | — | | | | (448 | ) |
Expiring 12/16/20 | | HSBC Bank USA, N.A. | | | THB | | | | 9,245 | | | | 292,000 | | | | 296,546 | | | | — | | | | (4,546 | ) |
Expiring 12/16/20 | | HSBC Bank USA, N.A. | | | THB | | | | 4,950 | | | | 156,000 | | | | 158,783 | | | | — | | | | (2,783 | ) |
Expiring 12/16/20 | | JPMorgan Chase Bank, N.A. | | | THB | | | | 5,048 | | | | 159,000 | | | | 161,914 | | | | — | | | | (2,914 | ) |
Turkish Lira, | | | | | | | | | | | | | | | | | | | | | | | | |
Expiring 12/16/20 | | Barclays Bank PLC | | | TRY | | | | 1,511 | | | | 196,589 | | | | 176,116 | | | | 20,473 | | | | — | |
Expiring 12/16/20 | | Barclays Bank PLC | | | TRY | | | | 1,511 | | | | 194,265 | | | | 176,117 | | | | 18,148 | | | | — | |
Expiring 12/16/20 | | Barclays Bank PLC | | | TRY | | | | 1,362 | | | | 177,690 | | | | 158,709 | | | | 18,981 | | | | — | |
Expiring 12/16/20 | | Barclays Bank PLC | | | TRY | | | | 1,129 | | | | 147,612 | | | | 131,603 | | | | 16,009 | | | | — | |
Expiring 12/16/20 | | Barclays Bank PLC | | | TRY | | | | 1,120 | | | | 145,753 | | | | 130,489 | | | | 15,264 | | | | — | |
See Notes to Financial Statements.
| | | | |
| PGIM Emerging Markets Debt Local Currency Fund | | | 37 | |
Schedule of Investments (continued)
as of October 31, 2020
Forward foreign currency exchange contracts outstanding at October 31, 2020 (continued):
| | | | | | | | | | | | | | | | | | | | | | | | | | |
Sale Contracts | | Counterparty | | Notional
Amount
(000) | | | Value at
Settlement
Date | | | Current
Value | | | Unrealized
Appreciation | | | Unrealized
Depreciation | |
|
OTC Forward Foreign Currency Exchange Contracts (cont’d.): | |
Turkish Lira (cont’d.), | | | | | | | | | | | | | | | | | |
Expiring 12/16/20 | | Barclays Bank PLC | | | TRY | | | | 1,065 | | | $ | 133,000 | | | $ | 124,113 | | | $ | 8,887 | | | $ | — | |
Expiring 12/16/20 | | Barclays Bank PLC | | | TRY | | | | 919 | | | | 119,000 | | | | 107,041 | | | | 11,959 | | | | — | |
Expiring 12/16/20 | | Barclays Bank PLC | | | TRY | | | | 710 | | | | 92,000 | | | | 82,749 | | | | 9,251 | | | | — | |
Expiring 12/16/20 | | Barclays Bank PLC | | | TRY | | | | 662 | | | | 82,000 | | | | 77,096 | | | | 4,904 | | | | — | |
Expiring 12/16/20 | | Barclays Bank PLC | | | TRY | | | | 620 | | | | 78,000 | | | | 72,285 | | | | 5,715 | | | | — | |
Expiring 12/16/20 | | Barclays Bank PLC | | | TRY | | | | 577 | | | | 74,000 | | | | 67,239 | | | | 6,761 | | | | — | |
Expiring 12/16/20 | | Goldman Sachs International | | | TRY | | | | 304 | | | | 38,554 | | | | 35,438 | | | | 3,116 | | | | — | |
Expiring 12/16/20 | | JPMorgan Chase Bank, N.A. | | | TRY | | | | 1,057 | | | | 136,200 | | | | 123,119 | | | | 13,081 | | | | — | |
| | | | | | | | | | | | | | | | | | | | | | | | | | |
| | | | | | | | | | | | $ | 34,298,541 | | | $ | 34,296,075 | | | | 307,312 | | | | (304,846 | ) |
| | | | | | | | | | | | | | | | | | | | | | | | | | |
| | | | | | | | | | | | | | | | | | | | $ | 886,649 | | | $ | (857,541 | ) |
| | | | | | | | | | | | | | | | | | | | | | | | | | |
Cross currency exchange contracts outstanding at October 31, 2020:
| | | | | | | | | | | | | | | | | | | | |
Settlement | | Type | | Notional
Amount
(000) | | | In Exchange
For (000) | | | Unrealized
Appreciation | | | Unrealized
Depreciation | | | Counterparty |
|
OTC Cross Currency Exchange Contracts: |
01/20/21 | | Buy | | EUR | 149 | | | AUD | 248 | | | $ | — | | | $ | (255 | ) | | JPMorgan Chase Bank, N.A. |
| | | | | | | | | | | | | | | | | | | | |
Interest rate swap agreements outstanding at October 31, 2020:
| | | | | | | | | | | | | | | | | | | | | | | | |
Notional
Amount
(000)# | | | Termination
Date | | | Fixed
Rate | | Floating
Rate | | Value at
Trade Date | | | Value at
October 31,
2020 | | | Unrealized
Appreciation
(Depreciation) | |
|
Centrally Cleared Interest Rate Swap Agreements: | |
| BRL | | | 6,947 | | | | 01/02/23 | | | 5.690%(T) | | 1 Day BROIS(2)(T) | | $ | — | | | $ | 49,901 | | | $ | 49,901 | |
| BRL | | | 1,374 | | | | 01/02/24 | | | 4.590%(T) | | 1 Day BROIS(2)(T) | | | — | | | | (8,931 | ) | | | (8,931 | ) |
| BRL | | | 5,769 | | | | 01/02/25 | | | 5.755%(T) | | 1 Day BROIS(2)(T) | | | — | | | | (17,483 | ) | | | (17,483 | ) |
| BRL | | | 1,466 | | | | 01/02/25 | | | 5.820%(T) | | 1 Day BROIS(2)(T) | | | — | | | | (4,374 | ) | | | (4,374 | ) |
| BRL | | | 1,478 | | | | 01/02/25 | | | 5.840%(T) | | 1 Day BROIS(2)(T) | | | — | | | | (1,689 | ) | | | (1,689 | ) |
| BRL | | | 1,158 | | | | 01/02/25 | | | 6.365%(T) | | 1 Day BROIS(2)(T) | | | — | | | | (1,770 | ) | | | (1,770 | ) |
| BRL | | | 668 | | | | 01/04/27 | | | 6.325%(T) | | 1 Day BROIS(2)(T) | | | — | | | | (7,051 | ) | | | (7,051 | ) |
| BRL | | | 1,056 | | | | 01/04/27 | | | 6.529%(T) | | 1 Day BROIS(2)(T) | | | — | | | | (5,580 | ) | | | (5,580 | ) |
| CNH | | | 2,100 | | | | 06/15/25 | | | 2.175%(Q) | | 7 Day China Fixing Repo Rates(2)(Q) | | | (2 | ) | | | (5,722 | ) | | | (5,720 | ) |
| CNH | | | 3,515 | | | | 06/19/25 | | | 2.200%(Q) | | 7 Day China Fixing Repo Rates(2)(Q) | | | (5 | ) | | | (9,095 | ) | | | (9,090 | ) |
See Notes to Financial Statements.
Interest rate swap agreements outstanding at October 31, 2020 (continued):
| | | | | | | | | | | | | | | | | | | | | | | | | | |
Notional
Amount
(000)# | | | Termination
Date | | | Fixed
Rate | | Floating
Rate | | Value at
Trade Date | | | Value at
October 31,
2020 | | | Unrealized
Appreciation
(Depreciation) | |
|
| | Centrally Cleared Interest Rate Swap Agreements (cont’d.): | |
| | CNH | | | | 3,085 | | | | 10/30/25 | | | 2.535%(Q) | | 7 Day China Fixing Repo Rates(2)(Q) | | $ | 23 | | | $ | (1,459 | ) | | $ | (1,482 | ) |
| | COP | | | | 950,000 | | | | 12/12/23 | | | 5.530%(Q) | | 1 Day COOIS(2)(Q) | | | — | | | | 23,536 | | | | 23,536 | |
| | COP | | | | 7,442,000 | | | | 12/19/24 | | | 4.900%(Q) | | 1 Day COOIS(1)(Q) | | | (10,911 | ) | | | (160,213 | ) | | | (149,302 | ) |
| | COP | | | | 2,400,000 | | | | 03/03/25 | | | 4.525%(Q) | | 1 Day COOIS(1)(Q) | | | — | | | | (42,991 | ) | | | (42,991 | ) |
| | COP | | | | 5,300,000 | | | | 03/27/25 | | | 4.300%(Q) | | 1 Day COOIS(2)(Q) | | | 4,633 | | | | 79,215 | | | | 74,582 | |
| | COP | | | | 1,900,000 | | | | 04/28/25 | | | 3.830%(Q) | | 1 Day COOIS(2)(Q) | | | 99 | | | | 17,344 | | | | 17,245 | |
| | COP | | | | 1,700,000 | | | | 05/11/25 | | | 3.550%(Q) | | 1 Day COOIS(2)(Q) | | | 4,000 | | | | 11,650 | | | | 7,650 | |
| | COP | | | | 800,000 | | | | 08/05/25 | | | 3.005%(Q) | | 1 Day COOIS(2)(Q) | | | — | | | | (291 | ) | | | (291 | ) |
| | KRW | | | | 1,200,000 | | | | 01/20/25 | | | 1.425%(Q) | | 3 Month KWCDC(2)(Q) | | | 7 | | | | 22,176 | | | | 22,169 | |
| | KRW | | | | 800,000 | | | | 04/03/25 | | | 1.077%(Q) | | 3 Month KWCDC(2)(Q) | | | 977 | | | | 4,347 | | | | 3,370 | |
| | KRW | | | | 300,000 | | | | 04/23/25 | | | 0.975%(Q) | | 3 Month KWCDC(2)(Q) | | | 1 | | | | 328 | | | | 327 | |
| | MXN | | | | 20,156 | | | | 03/20/24 | | | 7.702%(M) | | 28 Day Mexican Interbank Rate(2)(M) | | | 3,654 | | | | 88,670 | | | | 85,016 | |
| | MXN | | | | 27,450 | | | | 02/03/25 | | | 6.405%(M) | | 28 Day Mexican Interbank Rate(2)(M) | | | — | | | | 71,545 | | | | 71,545 | |
| | MXN | | | | 6,470 | | | | 02/26/25 | | | 6.145%(M) | | 28 Day Mexican Interbank Rate(2)(M) | | | 9 | | | | 13,827 | | | | 13,818 | |
| | MXN | | | | 1,757 | | | | 03/03/25 | | | 6.090%(M) | | 28 Day Mexican Interbank Rate(2)(M) | | | 3 | | | | 3,555 | | | | 3,552 | |
| | MXN | | | | 1,757 | | | | 03/03/25 | | | 6.140%(M) | | 28 Day Mexican Interbank Rate(2)(M) | | | 2 | | | | 3,722 | | | | 3,720 | |
| | MXN | | | | 27,880 | | | | 05/02/25 | | | 5.285%(M) | | 28 Day Mexican Interbank Rate(2)(M) | | | 82 | | | | 12,615 | | | | 12,533 | |
| | MXN | | | | 14,927 | | | | 07/14/25 | | | 4.880%(M) | | 28 Day Mexican Interbank Rate(2)(M) | | | (614 | ) | | | (6,281 | ) | | | (5,667 | ) |
| | MXN | | | | 16,040 | | | | 01/28/30 | | | 6.640%(M) | | 28 Day Mexican Interbank Rate(2)(M) | | | — | | | | 48,268 | | | | 48,268 | |
| | PLN | | | | 2,700 | | | | 07/24/24 | | | 1.798%(A) | | 6 Month WIBOR(2)(S) | | | — | | | | 39,808 | | | | 39,808 | |
| | PLN | | | | 3,062 | | | | 08/31/25 | | | 0.715%(A) | | 6 Month WIBOR(1)(S) | | | (3,780 | ) | | | (9,809 | ) | | | (6,029 | ) |
See Notes to Financial Statements.
| | | | |
| PGIM Emerging Markets Debt Local Currency Fund | | | 39 | |
Schedule of Investments (continued)
as of October 31, 2020
Interest rate swap agreements outstanding at October 31, 2020 (continued):
| | | | | | | | | | | | | | | | | | | | | | | | | | |
Notional
Amount
(000)# | | | Termination
Date | | | Fixed
Rate | | Floating Rate | | Value at
Trade Date | | | Value at
October 31,
2020 | | | Unrealized
Appreciation
(Depreciation) | |
| | Centrally Cleared Interest Rate Swap Agreements (cont’d.): | |
| | ZAR | | | | 4,500 | | | | 06/25/25 | | | 5.010%(Q) | | 3 Month JIBAR(2)(Q) | | $ | (29 | ) | | $ | 4,112 | | | $ | 4,141 | |
| | ZAR | | | | 11,525 | | | | 08/21/25 | | | 4.978%(Q) | | 3 Month JIBAR(1)(Q) | | | 522 | | | | (8,184 | ) | | | (8,706 | ) |
| | ZAR | | | | 4,220 | | | | 09/16/25 | | | 5.186%(Q) | | 3 Month JIBAR(1)(Q) | | | — | | | | (4,813 | ) | | | (4,813 | ) |
| | ZAR | | | | 3,860 | | | | 09/16/25 | | | 5.215%(Q) | | 3 Month JIBAR(1)(Q) | | | — | | | | (4,708 | ) | | | (4,708 | ) |
| | | | | | | | | | | | | | | | | | | | | | | | | | |
| | | | | | | | | | | | | | | | $ | (1,329 | ) | | $ | 194,175 | | | $ | 195,504 | |
| | | | | | | | | | | | | | | | | | | | | | | | | | |
| | | | | | | | | | | | | | | | | | | | | | | | | | | | | | | | | | |
Notional
Amount
(000)# | | Termination
Date | | Fixed
Rate | | Floating Rate | | Fair
Value | | Upfront
Premiums
Paid(Received) | | Unrealized
Appreciation
(Depreciation) | | Counterparty |
| | | OTC Interest Rate Swap Agreements: | | | | | |
| | | MYR | | | | | 3,700 | | | | | 02/06/25 | | | 2.938%(Q) | | 3 Month KLIBOR(1)(Q) | | | $ | (39,013 | ) | | | $ | (15 | ) | | | $ | (38,998 | ) | | Morgan Stanley & Co. International PLC |
| | | MYR | | | | | 2,800 | | | | | 08/28/25 | | | 2.105%(Q) | | 3 Month KLIBOR(1)(Q) | | | | (4,325 | ) | | | | 12 | | | | | (4,337 | ) | | Citibank, N.A. |
| | | RUB | | | | | 50,000 | | | | | 08/19/23 | | | 5.100%(A) | | 3 Month MosPRIME(2)(Q) | | | | (1,154 | ) | | | | (9 | ) | | | | (1,145 | ) | | Goldman Sachs International |
| | | RUB | | | | | 46,000 | | | | | 03/04/25 | | | 6.305%(A) | | 3 Month MosPRIME(2)(Q) | | | | 37,728 | | | | | (1 | ) | | | | 37,729 | | | Goldman Sachs International |
| | | RUB | | | | | 46,000 | | | | | 06/17/25 | | | 6.150%(A) | | 3 Month MosPRIME(2)(Q) | | | | 24,236 | | | | | — | | | | | 24,236 | | | Goldman Sachs International |
| | | RUB | | | | | 83,000 | | | | | 06/17/25 | | | 7.733%(A) | | 3 Month MosPRIME(2)(Q) | | | | 118,339 | | | | | — | | | | | 118,339 | | | Goldman Sachs International |
| | | | | | | | | | | | | | | | | | | | | | | | | | | | | | | | | | | |
| | | | | | | | | | | | | | | | | | | | | $ | 135,811 | | | | $ | (13 | ) | | | $ | 135,824 | | | |
| | | | | | | | | | | | | | | | | | | | | | | | | | | | | | | | | | | |
| (1) | The Series pays the fixed rate and receives the floating rate. |
| (2) | The Series pays the floating rate and receives the fixed rate. |
Balances Reported in the Statement of Assets and Liabilities for OTC Swap Agreements:
| | | | | | | | | | | | | | | | | |
| | | Premiums Paid | | Premiums Received | | Unrealized
Appreciation | | Unrealized
Depreciation |
| OTC Swap Agreements | | | | $12 | | | | | $(25) | | | $180,304 | | | $ | (44,480 | ) |
See Notes to Financial Statements.
Summary of Collateral for Centrally Cleared/Exchange-traded Derivatives:
Cash and securities segregated as collateral, including pending settlement for closed positions, to cover requirements for centrally cleared/exchange-traded derivatives are listed by broker as follows:
| | | | | | | | | | |
Broker | | Cash and/or Foreign Currency | | Securities Market Value |
Citigroup Global Markets, Inc. | | | $ | 800,000 | | | | $ | — | |
J.P. Morgan Securities LLC | | | | 170,000 | | | | | — | |
| | | | | | | | | | |
Total | | | $ | 970,000 | | | | $ | — | |
| | | | | | | | | | |
Fair Value Measurements:
Various inputs are used in determining the value of the Series’ investments. These inputs are summarized in the three broad levels listed below.
Level 1—unadjusted quoted prices generally in active markets for identical securities.
Level 2—quoted prices for similar securities, interest rates and yield curves, prepayment speeds, foreign currency exchange rates and other observable inputs.
Level 3—unobservable inputs for securities valued in accordance with Board approved fair valuation procedures.
The following is a summary of the inputs used as of October 31, 2020 in valuing such portfolio securities:
| | | | | | | | | | | | |
| | | Level 1 | | | Level 2 | | | Level 3 | |
Investments in Securities | | | | | | | | | | | | |
Assets | | | | | | | | | | | | |
Sovereign Bonds | | | | | | | | | | | | |
Angola | | $ | — | | | $ | 343,049 | | | $ | — | |
Argentina | | | — | | | | 291,186 | | | | — | |
Brazil | | | — | | | | 3,073,072 | | | | — | |
Chile | | | — | | | | 1,680,776 | | | | — | |
China | | | — | | | | 5,323,404 | | | | — | |
Colombia | | | — | | | | 2,843,264 | | | | — | |
Czech Republic | | | — | | | | 1,990,499 | | | | — | |
Dominican Republic | | | — | | | | 141,329 | | | | — | |
El Salvador | | | — | | | | 113,820 | | | | — | |
Gabon | | | — | | | | 380,493 | | | | — | |
Ghana | | | — | | | | 287,380 | | | | — | |
Hungary | | | — | | | | 2,165,131 | | | | — | |
Indonesia | | | — | | | | 5,451,214 | | | | — | |
Ivory Coast | | | — | | | | 321,033 | | | | — | |
Malaysia | | | — | | | | 3,814,164 | | | | — | |
Mexico | | | — | | | | 2,700,348 | | | | — | |
Nigeria | | | — | | | | 210,016 | | | | — | |
Pakistan | | | — | | | | 398,554 | | | | — | |
Peru | | | — | | | | 2,235,212 | | | | — | |
Philippines | | | — | | | | 119,813 | | | | — | |
Poland | | | — | | | | 2,937,336 | | | | — | |
Romania | | | — | | | | 1,613,747 | | | | — | |
See Notes to Financial Statements.
| | | | |
| PGIM Emerging Markets Debt Local Currency Fund | | | 41 | |
Schedule of Investments (continued)
as of October 31, 2020
| | | | | | | | | | | | |
| | | Level 1 | | | Level 2 | | | Level 3 | |
Investments in Securities (continued) | | | | | | | | | | | | |
Assets (continued) | | | | | | | | | | | | |
Sovereign Bonds (continued) | | | | | | | | | | | | |
Russia | | $ | — | | | $ | 1,637,732 | | | $ | — | |
South Africa | | | — | | | | 5,950,042 | | | | — | |
Thailand | | | — | | | | 4,628,101 | | | | — | |
Turkey | | | — | | | | 974,175 | | | | — | |
Ukraine | | | — | | | | 685,629 | | | | — | |
Uruguay | | | — | | | | 123,872 | | | | — | |
Corporate Bonds | | | | | | | | | | | | |
Belarus | | | — | | | | 190,652 | | | | — | |
Brazil | | | — | | | | 412,264 | | | | — | |
Indonesia | | | — | | | | 335,059 | | | | — | |
Jamaica | | | — | | | | 145,704 | | | | — | |
Malaysia | | | — | | | | 196,969 | | | | — | |
Mexico | | | — | | | | 1,225,066 | | | | — | |
Russia | | | — | | | | 1,152,073 | | | | — | |
South Africa | | | — | | | | 381,751 | | | | — | |
Supranational Bank | | | — | | | | 878,760 | | | | — | |
Tunisia | | | — | | | | 179,934 | | | | — | |
Affiliated Mutual Fund | | | 2,133,355 | | | | — | | | | — | |
| | | | | | | | | | | | |
Total | | $ | 2,133,355 | | | $ | 57,532,623 | | | $ | — | |
| | | | | | | | | | | | |
| | | |
Liabilities | | | | | | | | | | | | |
Options Written | | $ | — | | | $ | (33,291 | ) | | $ | — | |
| | | | | | | | | | | | |
Other Financial Instruments* | | | | | | | | | | | | |
Assets | | | | | | | | | | | | |
Futures Contracts | | $ | 10,131 | | | $ | — | | | $ | — | |
OTC Forward Foreign Currency Exchange Contracts | | | — | | | | 886,649 | | | | — | |
Centrally Cleared Interest Rate Swap Agreements | | | — | | | | 481,181 | | | | — | |
OTC Interest Rate Swap Agreements | | | — | | | | 180,303 | | | | — | |
| | | | | | | | | | | | |
Total | | $ | 10,131 | | | $ | 1,548,133 | | | $ | — | |
| | | | | | | | | | | | |
| | | |
Liabilities | | | | | | | | | | | | |
Futures Contracts | | $ | (2,927 | ) | | $ | — | | | $ | — | |
OTC Forward Foreign Currency Exchange Contracts | | | — | | | | (857,541 | ) | | | — | |
OTC Cross Currency Exchange Contracts | | | — | | | | (255 | ) | | | — | |
Centrally Cleared Interest Rate Swap Agreements | | | — | | | | (285,677 | ) | | | — | |
OTC Interest Rate Swap Agreements | | | — | | | | (44,492 | ) | | | — | |
| | | | | | | | | | | | |
Total | | $ | (2,927 | ) | | $ | (1,187,965 | ) | | $ | — | |
| | | | | | | | | | | | |
| * | Other financial instruments are derivative instruments not reflected in the Schedule of Investments, such as futures, forwards and centrally cleared swap contracts, which are recorded at the unrealized appreciation (depreciation) on the instrument, and OTC swap contracts which are recorded at fair value. |
See Notes to Financial Statements.
Industry Classification:
The industry classification of investments and other assets in excess of liabilities shown as a percentage of net assets as of October 31, 2020 were as follows (unaudited):
| | | | |
Sovereign Bonds | | | 84.9 | % |
Affiliated Mutual Fund | | | 3.5 | |
Investment Companies | | | 1.9 | |
Oil & Gas | | | 1.7 | |
Multi-National | | | 1.4 | |
Telecommunications | | | 1.3 | |
Banks | | | 0.6 | |
Retail | | | 0.3 | |
Lodging | | | 0.3 | |
| | | | |
Chemicals | | | 0.3 | % |
Electric | | | 0.3 | |
Engineering & Construction | | | 0.2 | |
| | | | |
| | | 96.7 | |
Options Written | | | (0.1 | ) |
Other assets in excess of liabilities | | | 3.4 | |
| | | | |
| | | 100.0 | % |
| | | | |
Effects of Derivative Instruments on the Financial Statements and Primary Underlying Risk Exposure:
The Series invested in derivative instruments during the reporting period. The primary types of risk associated with these derivative instruments are foreign exchange contracts risk and interest rate contracts risk. See the Notes to Financial Statements for additional detail regarding these derivative instruments and their risks. The effect of such derivative instruments on the Series’ financial position and financial performance as reflected in the Statement of Assets and Liabilities and Statement of Operations is presented in the summary below.
Fair values of derivative instruments as of October 31, 2020 as presented in the Statement of Assets and Liabilities:
| | | | | | | | | | | | |
| | | Asset Derivatives | | | Liability Derivatives | |
Derivatives not accounted for as hedging instruments, carried at fair value | | Statement of Assets and
Liabilities Location | | Fair
Value | | | Statement of Assets and
Liabilities Location | | Fair
Value | |
Foreign exchange contracts | | | | $ | — | | | Options written outstanding, at value | | $ | 33,291 | |
Foreign exchange contracts | | — | | | — | | | Unrealized depreciation on OTC cross currency exchange contracts | | | 255 | |
Foreign exchange contracts | | Unrealized appreciation on OTC forward foreign currency exchange contracts | | | 886,649 | | | Unrealized depreciation on OTC forward foreign currency exchange contracts | | | 857,541 | |
Interest rate contracts | | Due from/to broker-variation margin futures | | | 10,131 | * | | Due from/to broker-variation margin futures | | | 2,927 | * |
Interest rate contracts | | Due from/to broker-variation margin swaps | | | 481,181 | * | | Due from/to broker-variation margin swaps | | | 285,677 | * |
Interest rate contracts | | Premiums paid for OTC swap agreements | | | 12 | | | Premiums received for OTC swap agreements | | | 25 | |
See Notes to Financial Statements.
| | | | |
| PGIM Emerging Markets Debt Local Currency Fund | | | 43 | |
Schedule of Investments (continued)
as of October 31, 2020
| | | | | | | | | | | | |
| | | Asset Derivatives | | | Liability Derivatives | |
Derivatives not accounted for
as hedging instruments,
carried at fair value | | Statement of
Assets and
Liabilities Location | | Fair
Value | | | Statement of
Assets and
Liabilities Location | | Fair
Value | |
| Interest rate contracts | | Unrealized appreciation on OTC swap agreements | | $ | 180,304 | | | Unrealized depreciation on OTC swap agreements | | $ | 44,480 | |
| | | | | | | | | | | | |
| | | | $ | 1,558,277 | | | | | $ | 1,224,196 | |
| | | | | | | | | | | | |
| * | Includes cumulative appreciation (depreciation) as reported in the schedule of open futures and centrally cleared swap contracts. Only unsettled variation margin receivable (payable) is reported within the Statement of Assets and Liabilities. |
The effects of derivative instruments on the Statement of Operations for the year ended October 31, 2020 are as follows:
| | | | | | | | | | | | | | | | | | |
Amount of Realized Gain (Loss) on Derivatives Recognized in Income | |
Derivatives not accounted for as hedging
instruments, carried at fair value | | Options
Purchased(1) | | Options
Written | | | Futures | | | Forward
&Cross
Currency
Exchange
Contracts | | | Swaps | |
Foreign exchange contracts | | $(467) | | $ | 37,177 | | | $ | — | | | $ | (2,098,604 | ) | | $ | — | |
Interest rate contracts | | — | | | — | | | | (17,247 | ) | | | — | | | | 999,096 | |
| | | | | | | | | | | | | | | | | | |
Total | | $(467) | | $ | 37,177 | | | $ | (17,247 | ) | | $ | (2,098,604 | ) | | $ | 999,096 | |
| | | | | | | | | | | | | | | | | | |
| (1) | Included in net realized gain (loss) on investment transactions in the Statement of Operations. |
| | | | | | | | | | | | | | | | |
Change in Unrealized Appreciation (Depreciation) on Derivatives Recognized in Income | |
Derivatives not accounted for
as hedging instruments,
carried at fair value | | Options
Written | | | Futures | | | Forward
& Cross
Currency
Exchange
Contracts | | | Swaps | |
Foreign exchange contracts | | $ | (4,697 | ) | | $ | — | | | $ | (246,253 | ) | | $ | — | |
Interest rate contracts | | | — | | | | 7,204 | | | | — | | | | 73,907 | |
| | | | | | | | | | | | | | | | |
Total | | $ | (4,697 | ) | | $ | 7,204 | | | $ | (246,253 | ) | | $ | 73,907 | |
| | | | | | | | | | | | | | | | |
See Notes to Financial Statements.
For the year ended October 31, 2020, the Series’ average volume of derivative activities is as follows:
| | | | | | | | |
Options
Purchased(1) | | Options
Written(2) | | | Futures
Contracts—
Short
Positions(2) | | Forward Foreign
Currency Exchange
Contracts—Purchased(3) |
| $6 | | $ | 510,770 | | | $2,980,662 | | $53,794,662 |
| | | | | | | | | | | | |
Forward Foreign
Currency Exchange
Contracts - Sold(3) | | | | | Cross Currency
Exchange
Contracts(4) | | | | Interest Rate
Swap
Agreements(2) | |
| $40,859,957 | | | | | | $216,578 | | | | $ | 33,716,251 | |
| (2) | Notional Amount in USD. |
| (3) | Value at Settlement Date. |
Average volume is based on average quarter end balances as noted for the year ended October 31, 2020.
Financial Instruments/Transactions—Summary of Offsetting and Netting Arrangements:
The Series invested in OTC derivatives during the reporting period that are either offset in accordance with current requirements or are subject to enforceable master netting arrangements or similar agreements that permit offsetting. The information about offsetting and related netting arrangements for OTC derivatives where the legal right to set-off exists is presented in the summary below.
Offsetting of OTC derivative assets and liabilities:
| | | | | | | | | | | | | | | | | | | | |
Counterparty | | Gross Amounts of
Recognized
Assets(1) | | | Gross Amounts of
Recognized
Liabilities(1) | | | Net Amounts of
Recognized
Assets/(Liabilities) | | | Collateral
Pledged/(Received)(2) | | | Net Amount | |
Bank of America, N.A. | | $ | 6,282 | | | $ | (19,109 | ) | | $ | (12,827 | ) | | $ | — | | | $ | (12,827 | ) |
Barclays Bank PLC | | | 143,022 | | | | (92,720 | ) | | | 50,302 | | | | — | | | | 50,302 | |
BNP Paribas S.A. | | | 19,845 | | | | (6,677 | ) | | | 13,168 | | | | — | | | | 13,168 | |
Citibank, N.A. | | | 229,790 | | | | (143,458 | ) | | | 86,332 | | | | — | | | | 86,332 | |
Credit Suisse International | | | 9,883 | | | | (19,968 | ) | | | (10,085 | ) | | | — | | | | (10,085 | ) |
Deutsche Bank AG | | | 1,205 | | | | (5,346 | ) | | | (4,141 | ) | | | — | | | | (4,141 | ) |
Goldman Sachs International | | | 210,774 | | | | (30,672 | ) | | | 180,102 | | | | (180,102 | ) | | | — | |
HSBC Bank USA, N.A. | | | 153,835 | | | | (152,159 | ) | | | 1,676 | | | | — | | | | 1,676 | |
JPMorgan Chase Bank, N.A. | | | 182,205 | | | | (216,416 | ) | | | (34,211 | ) | | | — | | | | (34,211 | ) |
See Notes to Financial Statements.
| | | | |
| PGIM Emerging Markets Debt Local Currency Fund | | | 45 | |
Schedule of Investments (continued)
as of October 31, 2020
| | | | | | | | | | | | | | | | | | | | |
Counterparty | | Gross Amounts of
Recognized
Assets(1) | | | Gross Amounts of
Recognized
Liabilities(1) | | | Net Amounts of
Recognized
Assets/(Liabilities) | | | Collateral
Pledged/(Received)(2) | | | Net Amount | |
Morgan Stanley & Co. International PLC | | $ | 53,791 | | | $ | (243,426 | ) | | $ | (189,635 | ) | | $ | — | | | $ | (189,635 | ) |
The Toronto-Dominion Bank | | | 2,822 | | | | (1,274 | ) | | | 1,548 | | | | — | | | | 1,548 | |
UBS AG | | | 53,511 | | | | (4,367 | ) | | | 49,144 | | | | — | | | | 49,144 | |
| | | | | | | | | | | | | | | | | | | | |
| | $ | 1,066,965 | | | $ | (935,592 | ) | | $ | 131,373 | | | $ | (180,102 | ) | | $ | (48,729 | ) |
| | | | | | | | | | | | | | | | | | | | |
| (1) | Includes unrealized appreciation/(depreciation) on swaps and forwards, premiums paid/(received) on swap agreements and market value of purchased and written options, as represented on the Statement of Assets and Liabilities. |
| (2) | Collateral amount disclosed by the Series is limited to the market value of financial instruments/transactions and the Series’ OTC derivative exposure by counterparty. |
See Notes to Financial Statements.
Statement of Assets and Liabilities
as of October 31, 2020
| | | | |
Assets | | | | |
Investments at value: | | | | |
Unaffiliated investments (cost $60,085,421) | | $ | 57,532,623 | |
Affiliated investments (cost $2,133,355) | | | 2,133,355 | |
Foreign currency, at value (cost $353,122) | | | 350,220 | |
Dividends and interest receivable | | | 993,842 | |
Deposit with broker for centrally cleared/exchange-traded derivatives | | | 970,000 | |
Unrealized appreciation on OTC forward foreign currency exchange contracts | | | 886,649 | |
Unrealized appreciation on OTC swap agreements | | | 180,304 | |
Tax reclaim receivable | | | 64,674 | |
Receivable for investments sold | | | 16,911 | |
Receivable for Series shares sold | | | 12,262 | |
Due from broker—variation margin futures | | | 2,181 | |
Premiums paid for OTC swap agreements | | | 12 | |
Prepaid expenses and other assets | | | 6,392 | |
| | | | |
Total Assets | | | 63,149,425 | |
| | | | |
| |
Liabilities | | | | |
Unrealized depreciation on OTC forward foreign currency exchange contracts | | | 857,541 | |
Payable for investments purchased | | | 251,125 | |
Accrued expenses and other liabilities | | | 130,499 | |
Unrealized depreciation on OTC swap agreements | | | 44,480 | |
Options written outstanding, at value (proceeds received $28,594) | | | 33,291 | |
Management fee payable | | | 27,292 | |
Payable for Series shares reacquired | | | 27,259 | |
Due to broker—variation margin swaps | | | 13,773 | |
Distribution fee payable | | | 1,222 | |
Directors’ fees payable | | | 903 | |
Affiliated transfer agent fee payable | | | 499 | |
Unrealized depreciation on OTC cross currency exchange contracts | | | 255 | |
Dividends payable | | | 241 | |
Premiums received for OTC swap agreements | | | 25 | |
| | | | |
Total Liabilities | | | 1,388,405 | |
| | | | |
| |
Net Assets | | $ | 61,761,020 | |
| | | | |
| |
| | | | | |
Net assets were comprised of: | | | | |
Common stock, at par | | $ | 109,887 | |
Paid-in capital in excess of par | | | 69,672,000 | |
Total distributable earnings (loss) | | | (8,020,867 | ) |
| | | | |
Net assets, October 31, 2020 | | $ | 61,761,020 | |
| | | | |
See Notes to Financial Statements.
| | | | |
| PGIM Emerging Markets Debt Local Currency Fund | | | 47 | |
Statement of Assets and Liabilities
as of October 31, 2020
| | | | |
Class A | | | | |
Net asset value and redemption price per share,
($3,853,410 ÷ 691,658 shares of common stock issued and outstanding) | | $ | 5.57 | |
Maximum sales charge (3.25% of offering price) | | | 0.19 | |
| | | | |
Maximum offering price to public | | $ | 5.76 | |
| | | | |
| |
Class C | | | | |
Net asset value, offering price and redemption price per share,
($465,513 ÷ 82,986 shares of common stock issued and outstanding) | | $ | 5.61 | |
| | | | |
| |
Class Z | | | | |
Net asset value, offering price and redemption price per share,
($57,392,293 ÷ 10,205,156 shares of common stock issued and outstanding) | | $ | 5.62 | |
| | | | |
| |
Class R6 | | | | |
Net asset value, offering price and redemption price per share,
($49,804 ÷ 8,863 shares of common stock issued and outstanding) | | $ | 5.62 | |
| | | | |
See Notes to Financial Statements.
Statement of Operations
Year Ended October 31, 2020
| | | | |
Net Investment Income (Loss) | | | | |
Income | | | | |
Interest income (net of $60,606 foreign withholding tax) | | $ | 3,300,929 | |
Affiliated dividend income | | | 24,641 | |
Income from securities lending, net (including affiliated income of $23) | | | 24 | |
| | | | |
Total income | | | 3,325,594 | |
| | | | |
| |
Expenses | | | | |
Management fee | | | 408,951 | |
Distribution fee(a) | | | 13,636 | |
Custodian and accounting fees | | | 140,253 | |
Registration fees(a) | | | 71,844 | |
Transfer agent’s fees and expenses (including affiliated expense of $3,836)(a) | | | 66,766 | |
Audit fee | | | 64,362 | |
Legal fees and expenses | | | 23,029 | |
Shareholders’ reports | | | 20,280 | |
Directors’ fees | | | 11,569 | |
Miscellaneous | | | 20,616 | |
| | | | |
| |
Total expenses | | | 841,306 | |
Less: Fee waiver and/or expense reimbursement(a) | | | (371,378 | ) |
| | | | |
| |
Net expenses | | | 469,928 | |
| | | | |
Net investment income (loss) | | | 2,855,666 | |
| | | | |
| |
Realized And Unrealized Gain (Loss) On Investment And Foreign Currency Transactions | | | | |
Net realized gain (loss) on: | | | | |
Investment transactions (net of foreign capital gains taxes $(5,062)) | | | (420,512 | ) |
Futures transactions | | | (17,247 | ) |
Forward currency contract transactions | | | (2,098,604 | ) |
Options written transactions | | | 37,177 | |
Swap agreement transactions | | | 999,096 | |
Foreign currency transactions | | | (3,485,778 | ) |
| | | | |
| | | (4,985,868 | ) |
| | | | |
Net change in unrealized appreciation (depreciation) on: | | | | |
Investments (net of change in foreign capital gains taxes $6,980) | | | (3,705,728 | ) |
Futures | | | 7,204 | |
Forward and cross currency contracts | | | (246,253 | ) |
Options written | | | (4,697 | ) |
Swap agreements | | | 73,907 | |
Foreign currencies | | | 60,179 | |
| | | | |
| | | (3,815,388 | ) |
| | | | |
Net gain (loss) on investment and foreign currency transactions | | | (8,801,256 | ) |
| | | | |
Net Increase (Decrease) In Net Assets Resulting From Operations | | $ | (5,945,590 | ) |
| | | | |
See Notes to Financial Statements.
| | | | |
| PGIM Emerging Markets Debt Local Currency Fund | | | 49 | |
Statement of Operations
Year Ended October 31, 2020
| (a) | Class specific expenses and waivers were as follows: |
| | | | | | | | | | | | | | | | |
| | | Class A | | | Class C | | | Class Z | | | Class R6 | |
Distribution fee | | | 8,796 | | | | 4,840 | | | | — | | | | — | |
Registration fees | | | 17,645 | | | | 16,635 | | | | 20,929 | | | | 16,635 | |
Transfer agent’s fees and expenses | | | 5,143 | | | | 1,187 | | | | 60,363 | | | | 73 | |
Fee waiver and/or expense reimbursement | | | (31,872 | ) | | | (19,062 | ) | | | (303,530 | ) | | | (16,914 | ) |
See Notes to Financial Statements.
Statements of Changes in Net Assets
| | | | | | | | |
| |
| | | Year Ended
October 31, | |
| | |
| | | 2020 | | | 2019 | |
| | |
Increase (Decrease) in Net Assets | | | | | | | | |
Operations | | | | | | | | |
Net investment income (loss) | | $ | 2,855,666 | | | $ | 3,571,535 | |
Net realized gain (loss) on investment and foreign currency transactions | | | (4,985,868 | ) | | | (1,942,406 | ) |
Net change in unrealized appreciation (depreciation) on investments and foreign currencies | | | (3,815,388 | ) | | | 8,411,654 | |
| | | | | | | | |
Net increase (decrease) in net assets resulting from operations | | | (5,945,590 | ) | | | 10,040,783 | |
| | | | | | | | |
| | |
Dividends and Distributions | | | | | | | | |
Distributions from distributable earnings | | | | | | | | |
Class A | | | — | | | | (173,207 | ) |
Class C | | | — | | | | (26,238 | ) |
Class Z | | | — | | | | (3,540,771 | ) |
Class R6 | | | — | | | | (804 | ) |
| | | | | | | | |
| | | — | | | | (3,741,020 | ) |
| | | | | | | | |
Tax return of capital distributions | | | | | | | | |
Class A | | | (167,490 | ) | | | (3,312 | ) |
Class C | | | (19,547 | ) | | | (502 | ) |
Class Z | | | (2,965,432 | ) | | | (67,701 | ) |
Class R6 | | | (2,195 | ) | | | (15 | ) |
| | | | | | | | |
| | | (3,154,664 | ) | | | (71,530 | ) |
| | | | | | | | |
Series share transactions (Net of share conversions) | | | | | | | | |
Net proceeds from shares sold | | | 25,439,494 | | | | 18,954,796 | |
Net asset value of shares issued in reinvestment of dividends and distributions | | | 3,077,906 | | | | 3,793,522 | |
Cost of shares reacquired | | | (30,057,181 | ) | | | (15,260,204 | ) |
| | | | | | | | |
Net increase (decrease) in net assets from Series share transactions | | | (1,539,781 | ) | | | 7,488,114 | |
| | | | | | | | |
Total increase (decrease) | | | (10,640,035 | ) | | | 13,716,347 | |
| | |
Net Assets: | | | | | | | | |
Beginning of year | | | 72,401,055 | | | | 58,684,708 | |
| | | | | | | | |
End of year | | $ | 61,761,020 | | | $ | 72,401,055 | |
| | | | | | | | |
See Notes to Financial Statements.
| | | | |
| PGIM Emerging Markets Debt Local Currency Fund | | | 51 | |
Notes to Financial Statements
1. Organization
Prudential World Fund, Inc. (the “Fund”) is registered under the Investment Company Act of 1940, as amended (“1940 Act”), as an open-end management investment company and currently consists of seven series: PGIM Jennison Emerging Markets Equity Opportunities Fund, PGIM Jennison Global Infrastructure Fund, PGIM Jennison Global Opportunities Fund, PGIM Jennison International Opportunities Fund and PGIM QMA International Equity Fund, each of which are diversified funds for purposes of the 1940 Act and PGIM Emerging Markets Debt Hard Currency Fund and PGIM Emerging Markets Debt Local Currency Fund, each of which are non-diversified funds for purposes of the 1940 Act, and therefore, may invest a greater percentage of their assets in the securities of a single company or other issuer than a diversified fund. Investing in a non-diversified fund involves greater risk than investing in a diversified fund because a loss resulting from the decline in value of any one security may represent a greater portion of the total assets of a non-diversified fund. These financial statements relate only to the PGIM Emerging Markets Debt Local Currency Fund (the “Series”).
The investment objective of the Series is total return, through a combination of current income and capital appreciation.
2. Accounting Policies
The Series follows the investment company accounting and reporting guidance of the Financial Accounting Standards Board (“FASB”) Accounting Standard Codification (“ASC”) Topic 946 Financial Services — Investment Companies. The following accounting policies conform to U.S. generally accepted accounting principles. The Series consistently follows such policies in the preparation of its financial statements.
Securities Valuation: The Series holds securities and other assets and liabilities that are fair valued at the close of each day (generally, 4:00 PM Eastern time) the New York Stock Exchange (“NYSE”) is open for trading. Fair value is the price that would be received to sell an asset or paid to transfer a liability in an orderly transaction between market participants on the measurement date. The Fund’s Board of Directors (the “Board”) has adopted valuation procedures for security valuation under which fair valuation responsibilities have been delegated to PGIM Investments LLC (“PGIM Investments” or the “Manager”). Pursuant to the Board’s delegation, the Manager has established a Valuation Committee responsible for supervising the fair valuation of portfolio securities and other assets and liabilities. The valuation procedures permit the Series to utilize independent pricing vendor services, quotations from market makers, and alternative valuation methods when market quotations are either not readily available or not deemed representative of fair value. A record of the Valuation Committee’s actions is subject to the Board’s review, approval, and ratification at its next regularly scheduled quarterly meeting.
For the fiscal reporting year-end, securities and other assets and liabilities were fair valued at the close of the last U.S. business day. Trading in certain foreign securities may occur when the NYSE is closed (including weekends and holidays). Because such foreign securities trade in markets that are open on weekends and U.S. holidays, the values of some of the Series’ foreign investments may change on days when investors cannot purchase or redeem Series shares.
Various inputs determine how the Series’ investments are valued, all of which are categorized according to the three broad levels (Level 1, 2, or 3) detailed in the Schedule of Investments and referred to herein as the “fair value hierarchy” in accordance with FASB ASC Topic 820 - Fair Value Measurements and Disclosures.
Investments in open-end funds (other than exchange-traded funds) are valued at their net asset values as of the close of the NYSE on the date of valuation. These securities are classified as Level 1 in the fair value hierarchy since they may be purchased or sold at their net asset values on the date of valuation.
Fixed income securities traded in the OTC market are generally classified as Level 2 in the fair value hierarchy. Such fixed income securities are typically valued using the market approach which generally involves obtaining data from an approved independent third-party vendor source. The Series utilizes the market approach as the primary method to value securities when market prices of identical or comparable instruments are available. The third-party vendors’ valuation techniques used to derive the evaluated bid price are based on evaluating observable inputs, including but not limited to, yield curves, yield spreads, credit ratings, deal terms, tranche level attributes, default rates, cash flows, prepayment speeds, broker/dealer quotations and reported trades. Certain Level 3 securities are also valued using the market approach when obtaining a single broker quote or when utilizing transaction prices for identical securities that have been used in excess of five business days. During the reporting period, there were no changes to report with respect to the valuation approach and/or valuation techniques discussed above.
OTC and centrally cleared derivative instruments are generally classified as Level 2 in the fair value hierarchy. Such derivative instruments are typically valued using the market approach and/or income approach which generally involves obtaining data from an approved independent third-party vendor source. The Series utilizes the market approach when quoted prices in broker-dealer markets are available but also includes consideration of alternative valuation approaches, including the income approach. In the absence of reliable market quotations, the income approach is typically utilized for purposes of valuing derivatives such as interest rate swaps based on a discounted cash flow analysis whereby the value of the instrument is equal to the present value of its future cash inflows or outflows. Such analysis includes projecting future cash flows and determining the discount rate (including the present value factors that affect the discount rate) used to discount the future cash flows. In addition, the third-party vendors’ valuation techniques used to derive the evaluated derivative price is based on evaluating observable inputs, including but not limited to, underlying asset prices, indices, spreads, interest rates and exchange rates. Certain
| | | | |
| PGIM Emerging Markets Debt Local Currency Fund | | | 53 | |
Notes to Financial Statements (continued)
derivatives may be classified as Level 3 when valued using the market approach by obtaining a single broker quote or when utilizing unobservable inputs in the income approach. During the reporting period, there were no changes to report with respect to the valuation approach and/or valuation techniques discussed above.
Securities and other assets that cannot be priced according to the methods described above are valued based on pricing methodologies approved by the Board. In the event that unobservable inputs are used when determining such valuations, the securities will be classified as Level 3 in the fair value hierarchy.
When determining the fair value of securities, some of the factors influencing the valuation include: the nature of any restrictions on disposition of the securities; assessment of the general liquidity of the securities; the issuer’s financial condition and the markets in which it does business; the cost of the investment; the size of the holding and the capitalization of the issuer; the prices of any recent transactions or bids/offers for such securities or any comparable securities; any available analyst media or other reports or information deemed reliable by the Manager regarding the issuer or the markets or industry in which it operates. Using fair value to price securities may result in a value that is different from a security’s most recent closing price and from the price used by other unaffiliated mutual funds to calculate their net asset values.
Foreign Currency Translation: The books and records of the Series are maintained in U.S. dollars. Foreign currency amounts are translated into U.S. dollars on the following basis:
(i) market value of investment securities, other assets and liabilities — at the current rates of exchange;
(ii) purchases and sales of investment securities, income and expenses — at the rates of exchange prevailing on the respective dates of such transactions.
Although the net assets of the Series are presented at the foreign exchange rates and market values at the close of the period, the Series does not generally isolate that portion of the results of operations arising as a result of changes in the foreign exchange rates from the fluctuations arising from changes in the market prices of long-term portfolio securities held at the end of the period. Similarly, the Series does not isolate the effect of changes in foreign exchange rates from the fluctuations arising from changes in the market prices of long-term portfolio securities sold during the period. Accordingly, holding period realized foreign currency gains (losses) are included in the reported net realized gains (losses) on investment transactions. Notwithstanding the above, the Series does isolate the effect of fluctuations in foreign currency exchange rates when determining the gain (loss) upon the
sale or maturity of foreign currency denominated debt obligations; such amounts are included in net realized gains (losses) on foreign currency transactions.
Additionally, net realized gains (losses) on foreign currency transactions represent net foreign exchange gains (losses) from the disposition of holdings of foreign currencies, currency gains (losses) realized between the trade and settlement dates on investment transactions, and the difference between the amounts of interest, dividends and foreign withholding taxes recorded on the Series’ books and the U.S. dollar equivalent amounts actually received or paid. Net unrealized currency gains (losses) arise from valuing foreign currency denominated assets and liabilities (other than investments) at period end exchange rates.
Forward and Cross Currency Contracts: A forward currency contract is a commitment to purchase or sell a foreign currency at a future date at a negotiated forward rate. The Series enters into forward currency contracts, as defined in the prospectus, in order to hedge its exposure to changes in foreign currency exchange rates on its foreign portfolio holdings or on specific receivables and payables denominated in a foreign currency and to gain exposure to certain currencies. The contracts are valued daily at current forward exchange rates and any unrealized gain (loss) is included in net unrealized appreciation or depreciation on forward and cross currency contracts. Gain (loss) is realized on the settlement date of the contract equal to the difference between the settlement value of the original and negotiated forward contracts. This gain (loss), if any, is included in net realized gain (loss) on forward and cross currency contract transactions. Risks may arise upon entering into these contracts from the potential inability of the counterparties to meet the terms of their contracts. Forward currency contracts involve risks from currency exchange rate and credit risk in excess of the amounts reflected on the Statement of Assets and Liabilities. The Series’ maximum risk of loss from counterparty credit risk is the net value of the cash flows to be received from the counterparty at the end of the contract’s life. A cross currency contract is a forward contract where a specified amount of one foreign currency will be exchanged for a specified amount of another foreign currency.
Options: The Series purchased and/or wrote options in order to hedge against adverse market movements or fluctuations in value caused by changes in prevailing interest rates, value of equities or foreign currency exchange rates with respect to securities or financial instruments which the Series currently owns or intends to purchase. The Series may also use options to gain additional market exposure. The Series’ principal reason for writing options is to realize, through receipt of premiums, a greater current return than would be realized on the underlying security alone. When the Series purchases an option, it pays a premium and an amount equal to that premium is recorded as an asset. When the Series writes an option, it receives a premium and an amount equal to that premium is recorded as a liability. The asset or liability is adjusted daily to reflect the current market value of the option. If an option expires unexercised, the Series realizes a gain (loss) to the extent of the premium received or paid. If an option is exercised, the premium received or paid is recorded as an adjustment to the proceeds from the sale or the cost of the purchase in determining whether the Series has realized a gain (loss). The difference between the
| | | | |
| PGIM Emerging Markets Debt Local Currency Fund | | | 55 | |
Notes to Financial Statements (continued)
premium and the amount received or paid at the closing of a purchase or sale transaction is also treated as a realized gain (loss). Gain (loss) on purchased options is included in net realized gain (loss) on investment transactions. Gain (loss) on written options is presented separately as net realized gain (loss) on options written transactions.
The Series, as writer of an option, may have no control over whether the underlying securities or financial instruments may be sold (called) or purchased (put). As a result, the Series bears the market risk of an unfavorable change in the price of the security or financial instrument underlying the written option. The Series, as purchaser of an OTC option, bears the risk of the potential inability of the counterparties to meet the terms of their contracts. With exchange-traded options contracts, there is minimal counterparty credit risk to the Series since the exchanges’ clearinghouse acts as counterparty to all exchange-traded options and guarantees the options contracts against default.
When the Series writes an option on a swap, an amount equal to any premium received by the Series is recorded as a liability and is subsequently adjusted to the current market value of the written option on the swap. If a call option on a swap is exercised, the Series becomes obligated to pay a fixed interest rate (noted as the strike price) and receive a variable interest rate on a notional amount. If a put option on a swap is exercised, the Series becomes obligated to pay a variable interest rate and receive a fixed interest rate (noted as the strike price) on a notional amount. Premiums received from writing options on swaps that expire or are exercised are treated as realized gains upon the expiration or exercise of such options on swaps. The risk associated with writing put and call options on swaps is that the Series will be obligated to be party to a swap agreement if an option on a swap is exercised.
Financial Futures Contracts: A financial futures contract is an agreement to purchase (long) or sell (short) an agreed amount of securities at a set price for delivery on a future date. Upon entering into a financial futures contract, the Series is required to pledge to the broker an amount of cash and/or other assets equal to a certain percentage of the contract amount. This amount is known as the “initial margin.” Subsequent payments, known as “variation margin,” are made or received by the Series each day, depending on the daily fluctuations in the value of the underlying security. Such variation margin is recorded for financial statement purposes on a daily basis as unrealized gain (loss). When the contract expires or is closed, the gain (loss) is realized and is presented in the Statement of Operations as net realized gain (loss) on futures transactions.
The Series invested in financial futures contracts in order to hedge its existing portfolio securities, or securities the Series intends to purchase, against fluctuations in value caused by changes in prevailing interest rates. Should interest rates move unexpectedly, the Series may not achieve the anticipated benefits of the financial futures contracts and may realize a loss. The use of futures transactions involves the risk of imperfect correlation in movements
in the price of futures contracts, interest rates and the underlying hedged assets. Since futures contracts are exchange-traded, there is minimal counterparty credit risk to the Series since the exchanges’ clearinghouse acts as counterparty to all exchange-traded futures and guarantees the futures contracts against default.
Swap Agreements: The Series entered into certain types of swap agreements detailed in the disclosures below. A swap agreement is an agreement to exchange the return generated by one instrument for the return generated by another instrument. Swap agreements are negotiated in the OTC market and may be executed either directly with a counterparty (“OTC-traded”) or through a central clearing facility, such as a registered exchange. Swap agreements are valued daily at current market value and any change in value is included in the net unrealized appreciation or depreciation on swap agreements. Centrally cleared swaps pay or receive an amount known as “variation margin”, based on daily changes in the valuation of the swap contract. For OTC-traded, upfront premiums paid and received are shown as swap premiums paid and swap premiums received in the Statement of Assets and Liabilities. Risk of loss may exceed amounts recognized on the Statement of Assets and Liabilities. Swap agreements outstanding at period end, if any, are listed on the Schedule of Investments.
Interest Rate Swaps: Interest rate swaps represent an agreement between counterparties to exchange cash flows based on the difference between two interest rates, applied to a notional principal amount for a specified period. The Series is subject to interest rate risk exposure in the normal course of pursuing its investment objective. The Series used interest rate swaps to maintain its ability to generate steady cash flow by receiving a stream of fixed rate payments or to increase exposure to prevailing market rates by receiving floating rate payments. The Series’ maximum risk of loss from counterparty credit risk is the discounted net present value of the cash flows to be received from the counterparty over the contract’s remaining life.
Master Netting Arrangements: The Fund, on behalf of the Series, is subject to various Master Agreements, or netting arrangements, with select counterparties. These are agreements which a subadviser may have negotiated and entered into on behalf of all or a portion of the Series. A master netting arrangement between the Series and the counterparty permits the Series to offset amounts payable by the Series to the same counterparty against amounts to be received; and by the receipt of collateral from the counterparty by the Series to cover the Series’ exposure to the counterparty. However, there is no assurance that such mitigating factors are easily enforceable. In addition to master netting arrangements, the right to set-off exists when all the conditions are met such that each of the parties owes the other determinable amounts, the reporting party has the right to set-off the amount owed with the amount owed by the other party, the reporting party intends to set-off and the right of set-off is enforceable by law. During the reporting period, there was no intention to settle on a net basis and all amounts are presented on a gross basis on the Statement of Assets and Liabilities.
| | | | |
| PGIM Emerging Markets Debt Local Currency Fund | | | 57 | |
Notes to Financial Statements (continued)
The Fund, on behalf of the Series, is a party to International Swaps and Derivatives Association, Inc. (“ISDA”) Master Agreements with certain counterparties that govern OTC derivative and foreign exchange contracts entered into from time to time. The Master Agreements may contain provisions regarding, among other things, the parties’ general obligations, representations, agreements, collateral requirements, events of default and early termination. With respect to certain counterparties, in accordance with the terms of the Master Agreements, collateral posted to the Series is held in a segregated account by the Series’ custodian and with respect to those amounts which can be sold or re-pledged, is presented in the Schedule of Investments. Collateral pledged by the Series is segregated by the Series’ custodian and identified in the Schedule of Investments. Collateral can be in the form of cash or debt securities issued by the U.S. Government or related agencies or other securities as agreed to by the Series and the applicable counterparty. Collateral requirements are determined based on the Series’ net position with each counterparty. Termination events applicable to the Series may occur upon a decline in the Series’ net assets below a specified threshold over a certain period of time. Termination events applicable to counterparties may occur upon a decline in the counterparty’s long-term and short-term credit ratings below a specified level. In each case, upon occurrence, the other party may elect to terminate early and cause settlement of all derivative and foreign exchange contracts outstanding, including the payment of any losses and costs resulting from such early termination, as reasonably determined by the terminating party. Any decision by one or more of the Series’ counterparties to elect early termination could impact the Series’ future derivative activity.
In addition to each instrument’s primary underlying risk exposure (e.g. interest rate, credit, equity or foreign exchange, etc.), swap agreements involve, to varying degrees, elements of credit, market and documentation risk. Such risks involve the possibility that no liquid market for these agreements will exist, the counterparty to the agreement may default on its obligation to perform or disagree on the contractual terms of the agreement, and changes in net interest rates will be unfavorable. In connection with these agreements, securities in the portfolio may be identified or received as collateral from the counterparty in accordance with the terms of the respective swap agreements to provide or receive assets of value and to serve as recourse in the event of default or bankruptcy/insolvency of either party. Such OTC derivative agreements include conditions which, when materialized, give the counterparty the right to cause an early termination of the transactions under those agreements. Any election by the counterparty for early termination of the contract(s) may impact the amounts reported on financial statements.
Short sales and OTC contracts, including forward foreign currency exchange contracts, swaps, forward rate agreements and written options involve elements of both market and credit risk in excess of the amounts reflected on the Statement of Assets and Liabilities, if applicable. Such risks may be mitigated by engaging in master netting arrangements.
Securities Lending: The Series lends its portfolio securities to banks and broker-dealers. The loans are secured by collateral at least equal to the market value of the securities loaned. Collateral pledged by each borrower is invested in an affiliated money market fund and is marked to market daily, based on the previous day’s market value, such that the value of the collateral exceeds the value of the loaned securities. In the event of significant appreciation in value of securities on loan on the last business day of the reporting period, the financial statements may reflect a collateral value that is less than the market value of the loaned securities. Such shortfall is remedied as described above. Loans are subject to termination at the option of the borrower or the Series. Upon termination of the loan, the borrower will return to the Series securities identical to the loaned securities. Should the borrower of the securities fail financially, the Series has the right to repurchase the securities in the open market using the collateral.
The Series recognizes income, net of any rebate and securities lending agent fees, for lending its securities in the form of fees or interest on the investment of any cash received as collateral. The borrower receives all interest and dividends from the securities loaned and such payments are passed back to the lender in amounts equivalent thereto, which are reflected in interest income or unaffiliated dividend income based upon the nature of the payment on the Statement of Operations. The Series also continues to recognize any unrealized gain (loss) in the market price of the securities loaned and on the change in the value of the collateral invested that may occur during the term of the loan. In addition, realized gain (loss) is recognized on changes in the value of the collateral invested upon liquidation of the collateral. Net earnings from securities lending are disclosed in the Statement of Operations.
Securities Transactions and Net Investment Income: Securities transactions are recorded on the trade date. Realized gains (losses) from investment and currency transactions are calculated on the specific identification method. Dividend income is recorded on the ex-date, or for certain foreign securities, when the Series becomes aware of such dividends. Interest income, including amortization of premium and accretion of discount on debt securities, as required, is recorded on the accrual basis. Expenses are recorded on an accrual basis, which may require the use of certain estimates by management that may differ from actual. Net investment income or loss (other than class specific expenses and waivers, which are allocated as noted below) and unrealized and realized gains (losses) are allocated daily to each class of shares based upon the relative proportion of adjusted net assets of each class at the beginning of the day. Class specific expenses and waivers, where applicable, are charged to the respective share classes. Class specific expenses include distribution fees and distribution fee waivers, shareholder servicing fees, transfer agent’s fees and expenses, registration fees and fee waivers and/or expense reimbursements, as applicable.
Taxes: It is the Series’ policy to continue to meet the requirements of the Internal Revenue Code applicable to regulated investment companies and to distribute all of its taxable net investment income and capital gains, if any, to its shareholders. Therefore, no federal
| | | | |
| PGIM Emerging Markets Debt Local Currency Fund | | | 59 | |
Notes to Financial Statements (continued)
income tax provision is required. Withholding taxes on foreign dividends, interest and capital gains, if any, are recorded, net of reclaimable amounts, at the time the related income is earned.
The Series is subject to foreign income taxes imposed by certain countries in which it invests. Additionally, capital gains realized upon disposition of securities issued in or by certain foreign countries are subject to capital gains tax imposed by those countries. All taxes are computed in accordance with the applicable foreign tax law, and, to the extent permitted, capital losses are used to offset capital gains. Taxes attributable to income are accrued by the Series as a reduction of income. Current and deferred tax expense attributable to capital gains is reflected as a component of realized or change in unrealized gain/loss on securities in the accompanying financial statements. To the extent that the Series has country specific capital loss carryforwards, such carryforwards are applied against net unrealized gains when determining the deferred tax liability. Any deferred tax liability incurred by the Series is included in either Other liabilities or Deferred tax liability on the accompanying Statement of Assets and Liabilities.
Dividends and Distributions: The Series expects to declare dividends of its net investment income daily and pay such dividends monthly. Distributions of net realized capital and currency gains, if any, are declared and paid at least annually. Dividends and distributions to shareholders, which are determined in accordance with federal income tax regulations and which may differ from generally accepted accounting principles, are recorded on the ex-date. Permanent book/tax differences relating to income and gain (loss) are reclassified between total distributable earnings (loss) and paid-in capital in excess of par, as appropriate.
Estimates: The preparation of financial statements requires management to make estimates and assumptions that affect the reported amounts and disclosures in the financial statements. Actual results could differ from those estimates.
3. Agreements
The Fund, on behalf of the Series, has a management agreement with the Manager. Pursuant to this agreement, the Manager has responsibility for all investment advisory services and supervises the subadvisers’ performance of such services. In addition, under the management agreement, the Manager provides all of the administrative functions necessary for the organization, operation and management of the Series. The Manager administers the corporate affairs of the Series and, in connection therewith, furnishes the Series with office facilities, together with those ordinary clerical and bookkeeping services which are not being furnished by the Series’ custodian and the Series’ transfer agent. The Manager is also responsible for the staffing and management of dedicated groups of legal,
marketing, compliance and related personnel necessary for the operation of the Series. The legal, marketing, compliance and related personnel are also responsible for the management and oversight of the various service providers to the Series, including, but not limited to, the custodian, transfer agent, and accounting agent.
The Manager has entered into a subadvisory agreement with PGIM, Inc., which provides subadvisory services to the Series through its PGIM Fixed Income unit, and PGIM Limited (each a subadviser and collectively, the subadvisers). The subadvisory agreement provides that the subadvisers will furnish investment advisory services in connection with the management of the Series. In connection therewith, the subadvisers are obligated to keep certain books and records of the Series. The Manager pays for the services of the subadvisers, the cost of compensation of officers of the Series, occupancy and certain clerical and bookkeeping costs of the Series. The Series bears all other costs and expenses.
Effective December 13, 2019, the management fee paid to the Manager is accrued daily and payable monthly at an annual rate of 0.65% of the Series’ average daily net assets up to and including $1 billion; 0.63% from $1 billion to $3 billion of average daily net assets; 0.61% from $3 billion to $5 billion of average daily net assets; 0.60% from $5 billion to $10 billion of average daily net assets; and 0.59% of the average daily net assets exceeding $10 billion. Prior to December 13, 2019, the management fee paid to the Manager is accrued daily and payable monthly at an annual rate of 0.80% of the Series’ average daily net assets up to and including $1 billion; 0.78% on the next $2 billion of average daily net assets; 0.76% on the next $2 billion of average daily net assets; 0.75% on the next $5 billion of average daily net assets; and 0.74% on average daily net assets exceeding $10 billion. The effective management fee rate before any waivers and/or expense reimbursements was 0.67% for the year ended October 31, 2020.
Effective December 1, 2019, the Manager has contractually agreed, through February 28, 2022, to limit total annual operating expenses after fee waivers and/or expense reimbursements to 1.13% of average daily net assets for Class A shares, 1.88% of average daily net assets for Class C shares, 0.72% of average daily net assets for Class Z shares and 0.65% of average daily net assets for Class R6 shares. Prior to December 1, 2019, the Manager had contractually agreed to limit total annual operating expenses after fee waivers and/or expense reimbursements to 1.13% of average daily net assets for Class A shares, 1.88% of average daily net assets for Class C shares, 0.88% of average daily net assets for Class Z shares and 0.88% of average daily net assets for Class R6 shares. This contractual waiver excludes interest, brokerage, taxes (such as income and foreign withholding taxes, stamp duty and deferred tax expenses), acquired fund fees and expenses, extraordinary expenses, and certain other Series expenses such as dividend and interest expense and broker charges on short sales.
Where applicable, the Manager agrees to waive management fees or shared operating expenses on any share class to the same extent that it waives similar expenses on any other share class. In addition, total annual operating expenses for Class R6 shares will not exceed total annual operating expenses for Class Z shares. Fees and/or expenses waived and/or
| | | | |
| PGIM Emerging Markets Debt Local Currency Fund | | | 61 | |
Notes to Financial Statements (continued)
reimbursed by the Manager may be recouped by the Manager within the same fiscal year during which such waiver and/or reimbursement is made if such recoupment can be realized without exceeding the expense limit in effect at the time of the recoupment for that fiscal year.
The Fund, on behalf of the Series, has a distribution agreement with Prudential Investment Management Services LLC (“PIMS”), which acts as the distributor of the Class A, Class C, Class Z and Class R6 shares of the Series. The Series compensates PIMS for distributing and servicing the Series’ Class A and Class C shares, pursuant to the plans of distribution (the “Distribution Plans”), regardless of expenses actually incurred by PIMS. The distribution fees are accrued daily and payable monthly. No distribution or service fees are paid to PIMS as distributor of the Class Z or Class R6 shares of the Series.
Pursuant to the Distribution Plans, the Series compensates PIMS for distribution related activities at an annual rate of up to 0.25% and 1% of the average daily net assets of the Class A and Class C shares, respectively.
For the year ended October 31, 2020, PIMS received $529 in front-end sales charges resulting from sales of Class A shares. Additionally, for the year ended October 31, 2020, PIMS received $6 in contingent deferred sales charges imposed upon redemptions by certain Class C shareholders. From these fees, PIMS paid such sales charges to broker-dealers, who in turn paid commissions to salespersons and incurred other distribution costs.
PGIM Investments, PGIM, Inc. and PIMS are indirect, wholly-owned subsidiaries of Prudential Financial, Inc. (“Prudential”).
4. Other Transactions with Affiliates
Prudential Mutual Fund Services LLC (“PMFS”), an affiliate of PGIM Investments and an indirect, wholly-owned subsidiary of Prudential, serves as the Series’ transfer agent. Transfer agent’s fees and expenses in the Statement of Operations include certain out-of-pocket expenses paid to non-affiliates, where applicable.
The Series may invest its overnight sweep cash in the PGIM Core Ultra Short Bond Fund (the “Core Fund”), and its securities lending cash collateral in the PGIM Institutional Money Market Fund (the “Money Market Fund”), each a series of Prudential Investment Portfolios 2, registered under the 1940 Act and managed by PGIM Investments. Through the Series’ investments in the mentioned underlying funds, PGIM Investments and/or its affiliates are paid fees or reimbursed for providing their services. In addition to the realized and unrealized gains on investments in the Core Fund and Money Market Fund, earnings from
such investments are disclosed on the Statement of Operations as “Affiliated dividend income” and “Income from securities lending, net”, respectively.
The Series may enter into certain securities purchase or sale transactions under Board approved Rule 17a-7 procedures. Rule 17a-7 is an exemptive rule under the 1940 Act, that subject to certain conditions, permits purchase and sale transactions among affiliated investment companies, or between an investment company and a person that is affiliated solely by reason of having a common (or affiliated) investment adviser, common directors, and/or common officers. Pursuant to the Rule 17a-7 procedures and consistent with guidance issued by the Securities and Exchange Commission (“SEC”), the Fund’s Chief Compliance Officer (“CCO”) prepares a quarterly summary of all such transactions for submission to the Board, together with the CCO’s written representation that all such 17a-7 transactions were effected in accordance with the Series’ Rule 17a-7 procedures. For the year ended October 31, 2020, no 17a-7 transactions were entered into by the Series.
5. Portfolio Securities
The aggregate cost of purchases and proceeds from sales of portfolio securities (excluding short-term investments and U.S. Government securities) for the year ended October 31, 2020, were $36,268,783 and $38,561,401, respectively.
A summary of the cost of purchases and proceeds from sales of shares of affiliated investments for the year ended October 31, 2020, is presented as follows:
| | | | | | | | | | | | | | | | | | | | | | | | | | | | |
Value,
Beginning
of Year | | Cost of
Purchases | | | Proceeds
from Sales | | | Change in
Unrealized
Gain
(Loss) | | | Realized
Gain
(Loss) | | | Value,
End of Year | | | Shares,
End
of Year | | | Income | |
| | | | | |
PGIM Core Ultra Short Bond Fund* | | | | | | | | | | | | | | | | | | | | | |
| $2,483,525 | | $ | 37,964,556 | | | $ | 38,314,726 | | | $ | — | | | $ | — | | | $ | 2,133,355 | | | | 2,133,355 | | | $ | 24,641 | |
| | | | |
PGIM Institutional Money Market Fund* | | | | | | | | | | | | | | | | | |
| — | | | 152,655 | | | | 152,655 | | | | — | | | | — | | | | — | | | | — | | | | 23 | ** |
| | | | | | | | | | | | | | | | | | | | | | | | | | | | |
| $2,483,525 | | $ | 38,117,211 | | | $ | 38,467,381 | | | $ | — | | | $ | — | | | $ | 2,133,355 | | | | | | | $ | 24,664 | |
| | | | | | | | | | | | | | | | | | | | | | | | | | | | |
| * | The Fund did not have any capital gain distributions during the reporting period. |
| ** | The amount, or a portion thereof, represents the affiliated securities lending income shown on the Statement of Operations. |
6. Distributions and Tax Information
Distributions to shareholders, which are determined in accordance with federal income tax regulations and which may differ from generally accepted accounting principles, are recorded on the ex-date. In order to present total distributable earnings (loss) and paid-in capital in excess of par on the Statement of Assets and Liabilities that more closely represent their tax character, certain adjustments have been made to total distributable earnings (loss) and paid-in capital in excess of par. For the tax year ended October 31, 2020, the
| | | | |
| PGIM Emerging Markets Debt Local Currency Fund | | | 63 | |
Notes to Financial Statements (continued)
adjustments were to decrease total distributable loss and decrease paid-in capital in excess of par by $2,922,362 due to a net operating loss. Net investment income, net realized gain (loss) on investments and foreign currency transactions and net assets were not affected by this change.
For the year ended October 31, 2020, the tax character of dividends paid by the Series was $3,154,664 of tax return of capital. For the year ended October 31, 2019, the tax character of dividends paid by the Series were $3,741,020 of ordinary income and $71,530 of tax return of capital.
As of October 31, 2020, there were no undistributed earnings on a tax basis.
The United States federal income tax basis of the Series’ investments and the net unrealized depreciation as of October 31, 2020 were as follows:
| | | | | | |
Tax Basis | | Gross Unrealized Appreciation | | Gross Unrealized Depreciation | | Net Unrealized Depreciation |
| $63,605,999 | | $1,466,631 | | $(5,072,571) | | $(3,605,940) |
The difference between book basis and tax basis is primarily attributable to the difference in the treatment of amortization of premiums, swaps, wash sales, straddle loss deferrals and other cost basis differences between financial and tax accounting.
For federal income tax purposes, the Series had a capital loss carryforward as of October 31, 2020 of approximately $4,412,000 which can be carried forward for an unlimited period. No capital gains distributions are expected to be paid to shareholders until net gains have been realized in excess of such losses.
The Manager has analyzed the Series’ tax positions taken on federal, state and local income tax returns for all open tax years and has concluded that no provision for income tax is required in the Series’ financial statements for the current reporting period. Since tax authorities can examine previously filed tax returns, the Series’ U.S. federal and state tax returns for each of the four fiscal years up to the most recent fiscal year ended October 31, 2020 are subject to such review.
7. Capital and Ownership
The Series offers Class A, Class C, Class Z and Class R6 shares. Class A shares are sold with a maximum front-end sales charge of 3.25%. Investors who purchase $500,000 or more of Class A shares and sell those shares within 12 months of purchase are subject to a contingent deferred sales charge (“CDSC”) of 1.00% on sales although these purchases are
not subject to a front-end sales charge. The Class A CDSC is waived for certain retirement and/or benefit plans. A special exchange privilege is also available for shareholders who qualified to purchase Class A shares at net asset value. Class C shares are sold with a CDSC of 1% on sales made within 12 months of purchase. Class C shares will automatically convert to Class A shares on a monthly basis approximately 10 years after purchase. Class Z and Class R6 shares are not subject to any sales or redemption charges and are available exclusively for sale to a limited group of investors.
Under certain circumstances, an exchange may be made from specified share classes of the Series to one or more other share classes of the Series as presented in the table of transactions in shares of common stock, below.
The Fund is authorized to issue 5.075 billion shares of common stock, $0.01 par value per share, 550 million of which are designated as shares of the Series. The shares are further classified and designated as follows:
| | | | |
Class A | | | 10,000,000 | |
Class C | | | 50,000,000 | |
Class Z | | | 250,000,000 | |
Class T | | | 190,000,000 | |
Class R6 | | | 50,000,000 | |
The Series currently does not have any Class T shares outstanding.
As of October 31, 2020, Prudential, through its affiliated entities, including affiliated funds (if applicable), owned shares of the Series as follows:
| | | | | | | | | | |
| | | Number of Shares | | Percentage of
Outstanding Shares |
Class Z | | | | 3,655,306 | | | | | 35.8 | % |
Class R6 | | | | 180 | | | | | 2.0 | % |
At the reporting period end, the number of shareholders holding greater than 5% of the Series are as follows:
| | | | | | |
| Affiliated | | Unaffiliated |
Number of Shareholders | | Percentage of Outstanding Shares | | Number of Shareholders | | Percentage of Outstanding Shares |
| 1 | | 33.3% | | 3 | | 59.7% |
| | | | |
| PGIM Emerging Markets Debt Local Currency Fund | | | 65 | |
Notes to Financial Statements (continued)
Transactions in shares of common stock were as follows:
| | | | | | | | |
Class A | | Shares | | | Amount | |
| | |
Year ended October 31, 2020: | | | | | | | | |
Shares sold | | | 151,614 | | | $ | 859,877 | |
Shares issued in reinvestment of dividends and distributions | | | 28,771 | | | | 163,559 | |
Shares reacquired | | | (102,959 | ) | | | (560,731 | ) |
| | | | | | | | |
Net increase (decrease) in shares outstanding before conversion | | | 77,426 | | | | 462,705 | |
Shares issued upon conversion from other share class(es) | | | 5,898 | | | | 31,679 | |
| | | | | | | | |
Net increase (decrease) in shares outstanding | | | 83,324 | | | $ | 494,384 | |
| | | | | | | | |
Year ended October 31, 2019: | | | | | | | | |
Shares sold | | | 139,070 | | | $ | 811,691 | |
Shares issued in reinvestment of dividends and distributions | | | 29,166 | | | | 171,313 | |
Shares reacquired | | | (136,489 | ) | | | (783,730 | ) |
| | | | | | | | |
Net increase (decrease) in shares outstanding before conversion | | | 31,747 | | | | 199,274 | |
Shares issued upon conversion from other share class(es) | | | 6,376 | | | | 37,347 | |
| | | | | | | | |
Net increase (decrease) in shares outstanding | | | 38,123 | | | $ | 236,621 | |
| | | | | | | | |
Class C | | | | | | |
| | |
Year ended October 31, 2020: | | | | | | | | |
Shares sold | | | 8,600 | | | $ | 49,850 | |
Shares issued in reinvestment of dividends and distributions | | | 3,393 | | | | 19,430 | |
Shares reacquired | | | (17,874 | ) | | | (104,373 | ) |
| | | | | | | | |
Net increase (decrease) in shares outstanding before conversion | | | (5,881 | ) | | | (35,093 | ) |
Shares reacquired upon conversion into other share class(es) | | | (5,855 | ) | | | (31,679 | ) |
| | | | | | | | |
Net increase (decrease) in shares outstanding | | | (11,736 | ) | | $ | (66,772 | ) |
| | | | | | | | |
Year ended October 31, 2019: | | | | | | | | |
Shares sold | | | 24,117 | | | $ | 142,221 | |
Shares issued in reinvestment of dividends and distributions | | | 4,486 | | | | 26,541 | |
Shares reacquired | | | (24,338 | ) | | | (144,141 | ) |
| | | | | | | | |
Net increase (decrease) in shares outstanding before conversion | | | 4,265 | | | | 24,621 | |
Shares reacquired upon conversion into other share class(es) | | | (6,333 | ) | | | (37,347 | ) |
| | | | | | | | |
Net increase (decrease) in shares outstanding | | | (2,068 | ) | | $ | (12,726 | ) |
| | | | | | | | |
Class Z | | | | | | |
Year ended October 31, 2020: | | | | | | | | |
Shares sold | | | 4,164,373 | | | $ | 24,507,148 | |
Shares issued in reinvestment of dividends and distributions | | | 504,320 | | | | 2,892,722 | |
Shares reacquired | | | (5,579,432 | ) | | | (29,392,019 | ) |
| | | | | | | | |
Net increase (decrease) in shares outstanding | | | (910,739 | ) | | $ | (1,992,149 | ) |
| | | | | | | | |
| | |
Year ended October 31, 2019: | | | | | | | | |
Shares sold | | | 3,011,000 | | | $ | 17,974,545 | |
Shares issued in reinvestment of dividends and distributions | | | 606,181 | | | | 3,594,849 | |
Shares reacquired | | | (2,375,568 | ) | | | (14,332,305 | ) |
| | | | | | | | |
Net increase (decrease) in shares outstanding | | | 1,241,613 | | | $ | 7,237,089 | |
| | | | | | | | |
| | | | | | | | |
Class R6 | | Shares | | | Amount | |
Year ended October 31, 2020: | | | | | | | | |
Shares sold | | | 3,743 | | | $ | 22,619 | |
Shares issued in reinvestment of dividends and distributions | | | 386 | | | | 2,195 | |
Shares reacquired | | | (9 | ) | | | (58 | ) |
| | | | | | | | |
Net increase (decrease) in shares outstanding | | | 4,120 | | | $ | 24,756 | |
| | | | | | | | |
Year ended October 31, 2019: | | | | | | | | |
Shares sold | | | 4,450 | | | $ | 26,339 | |
Shares issued in reinvestment of dividends and distributions | | | 137 | | | | 819 | |
Shares reacquired | | | (5 | ) | | | (28 | ) |
| | | | | | | | |
Net increase (decrease) in shares outstanding | | | 4,582 | | | $ | 27,130 | |
| | | | | | | | |
8. Borrowings
The Fund, on behalf of the Series, along with other affiliated registered investment companies (the “Participating Funds”), is a party to a Syndicated Credit Agreement (“SCA”) with a group of banks. The purpose of the SCA is to provide an alternative source of temporary funding for capital share redemptions. The table below provides details of the current SCA in effect at the reporting period-end as well as the prior SCA.
| | | | |
| | | Current SCA | | Prior SCA |
| Term of Commitment | | 10/2/2020 – 9/30/2021 | | 10/3/2019 – 10/1/2020 |
| Total Commitment | | $ 1,200,000,000 | | $ 1,222,500,000* |
| Annualized Commitment Fee on the Unused Portion of the SCA | | 0.15% | | 0.15% |
| Annualized Interest Rate on Borrowings | | 1.30% plus the higher of (1) the effective federal funds rate, (2) the one-month LIBOR rate or (3) zero percent | | 1.20% plus the higher of (1) the effective federal funds rate, (2) the one-month LIBOR rate or (3) zero percent |
| * Effective March 31, 2020, the SCA’s total commitment was increased from $900,000,000 to $1,162,500,000 and subsequently, effective April 7, 2020 was increased to $1,222,500,000. |
Certain affiliated registered investment companies that are parties to the SCA include portfolios that are subject to a predetermined mathematical formula used to manage certain benefit guarantees offered under variable annuity contracts. The formula may result in large scale asset flows into and out of these portfolios. Consequently, these portfolios may be more likely to utilize the SCA for purposes of funding redemptions. It may be possible for those portfolios to fully exhaust the committed amount of the SCA, thereby requiring the Manager to allocate available funding per a Board-approved methodology designed to treat the Participating Funds in the SCA equitably.
The Series utilized the SCA during the year ended October 31, 2020. The average daily balance for the 23 days that the Series had loans outstanding during the period was approximately $1,235,435, borrowed at a weighted average interest rate of 2.14%. The maximum loan outstanding amount during the period was $8,796,000. At October 31, 2020, the Series did not have an outstanding loan amount.
| | | | |
| PGIM Emerging Markets Debt Local Currency Fund | | | 67 | |
Notes to Financial Statements (continued)
9. Risks of Investing in the Series
The Series’ risks include, but are not limited to, some or all of the risks discussed below. For further information on the Series’ risks, please refer to the Series’ Prospectus and Statement of Additional Information.
Bond Obligations Risk: As with credit risk, market risk and interest rate risk, the Series’ holdings, share price, yield and total return may fluctuate in response to bond market movements. The value of bonds may decline for issuer-related reasons, including management performance, financial leverage and reduced demand for the issuer’s goods and services. Certain types of fixed income obligations also may be subject to “call and redemption risk,” which is the risk that the issuer may call a bond held by the Series for redemption before it matures and the Series may lose income.
Credit Risk: This is the risk that the issuer, the guarantor or the insurer of a fixed income security, or the counterparty to a contract, may be unable or unwilling to make timely principal and interest payments, or to otherwise honor its obligations. Additionally, fixed income securities could lose value due to a loss of confidence in the ability of the issuer, guarantor, insurer or counterparty to pay back debt. The longer the maturity and the lower the credit quality of a bond, the more sensitive it is to credit risk.
Derivatives Risk: Derivatives involve special risks and costs and may result in losses to the Series. The successful use of derivatives requires sophisticated management, and, to the extent that derivatives are used, the Series will depend on the subadviser’s ability to analyze and manage derivative transactions. The prices of derivatives may move in unexpected ways, especially in abnormal market conditions. Some derivatives are “leveraged” and therefore may magnify or otherwise increase investment losses to the Series. The Series’ use of derivatives may also increase the amount of taxes payable by shareholders. Other risks arise from the potential inability to terminate or sell derivatives positions. A liquid secondary market may not always exist for the Series’ derivatives positions. In fact, many OTC derivative instruments lack liquidity beyond the counterparty to the instrument. OTC derivative instruments also involve the risk that the other party will not meet its obligations to the Series.
Emerging Markets Risk: The risks of foreign investments are greater for investments in or exposed to emerging markets. Emerging market countries typically have economic and political systems that are less fully developed, and can be expected to be less stable, than those of more developed countries. For example, the economies of such countries can be subject to rapid and unpredictable rates of inflation or deflation. Low trading volumes may result in a lack of liquidity and price volatility. Emerging market countries may have policies that restrict investment by non-US investors, or that prevent non-US investors from
withdrawing their money at will. Countries with emerging markets can be found in regions such as Asia, Latin America, Eastern Europe and Africa.
The Series may invest in some emerging markets that subject it to risks such as those associated with illiquidity, custody of assets, different settlement and clearance procedures and asserting legal title under a developing legal and regulatory regime to a greater degree than in developed markets or even in other emerging markets.
Foreign Securities Risk: The Series’ investments in securities of foreign issuers or issuers with significant exposure to foreign markets involve additional risk. The securities of such issuers may trade in markets that are less liquid, less regulated and more volatile than US markets. The value of the Series’ investments may decline because of factors affecting the particular issuer as well as foreign markets and issuers generally, such as unfavorable government actions, and political or financial instability. Lack of information may also affect the value of these securities.
Interest Rate Risk: The value of an investment may go down when interest rates rise. A rise in rates tends to have a greater impact on the prices of longer term or duration debt securities. When interest rates fall, the issuers of debt obligations may prepay principal more quickly than expected, and the Series may be required to reinvest the proceeds at a lower interest rate. This is referred to as “prepayment risk.” When interest rates rise, debt obligations may be repaid more slowly than expected, and the value of the Series’ holdings may fall sharply. This is referred to as “extension risk”. The Series may face a heightened level of interest rate risk as a result of the U.S. Federal Reserve Board’s rate-setting policies. The Series may lose money if short-term or long-term interest rates rise sharply or in a manner not anticipated by the subadviser.
Large Shareholder and Large Scale Redemption Risk: Certain individuals, accounts, funds (including funds affiliated with the Manager) or institutions, including the Manager and its affiliates, may from time to time own or control a substantial amount of the Series’ shares. There is no requirement that these entities maintain their investment in the Series. There is a risk that such large shareholders or that the Series’ shareholders generally may redeem all or a substantial portion of their investments in the Series in a short period of time, which could have a significant negative impact on the Series’ NAV, liquidity, and brokerage costs. Large redemptions could also result in tax consequences to shareholders and impact the Series’ ability to implement its investment strategy. The Series’ ability to pursue its investment objective after one or more large scale redemptions may be impaired and, as a result, the Series may invest a larger portion of its assets in cash or cash equivalents.
LIBOR Risk: Many financial instruments use or may use a floating rate based on the London Interbank Offered Rate, or “LIBOR,” which is the offered rate for short-term Eurodollar deposits between major international banks. On July 27, 2017, the Financial Conduct Authority announced a desire to phase out the use of LIBOR by the end of 2021. There remains uncertainty regarding the future utilization of LIBOR and the nature of any replacement rate. As such, the potential impact of a transition away from LIBOR on the
| | | | |
| PGIM Emerging Markets Debt Local Currency Fund | | | 69 | |
Notes to Financial Statements (continued)
Series or the financial instruments in which the Series invest cannot yet be determined. The elimination of LIBOR or changes to other reference rates or any other changes or reforms to the determination or supervision of reference rates could have an adverse impact on the market for, or value of, any securities or payments linked to those reference rates, which may adversely affect the Series’ performance and/or net asset value. Furthermore, the risks associated with the expected discontinuation of LIBOR and transition may be exacerbated if the work necessary to effect an orderly transition to an alternative reference rate is not completed in a timely manner. Because the usefulness of LIBOR as a benchmark could deteriorate during the transition period, these effects could occur prior to the end of 2021.
Liquidity Risk: Liquidity risk is the risk that the Fund could not meet requests to redeem shares issued by the Series without significant dilution of remaining investors’ interests in the Series. The Series may invest in instruments that trade in lower volumes and are more illiquid than other investments. If the Series is forced to sell these investments to pay redemption proceeds or for other reasons, the Series may lose money. In addition, when there is no willing buyer and investments cannot be readily sold at the desired time or price, the Series may have to accept a lower price or may not be able to sell the instrument at all. The reduction in dealer market-making capacity in the fixed income markets that has occurred in recent years also has the potential to reduce liquidity. An inability to sell a portfolio position can adversely affect the Series’ value or prevent the Series from being able to take advantage of other investment opportunities.
Market Risk: Securities markets may be volatile and the market prices of the Series’ securities may decline. Securities fluctuate in price based on changes in an issuer’s financial condition and overall market and economic conditions. If the market prices of the securities owned by the Series fall, the value of an investment in the Series will decline.
Market Disruption and Geopolitical Risks: International wars or conflicts and geopolitical developments in foreign countries, along with instability in regions such as Asia, Eastern Europe, and the Middle East, possible terrorist attacks in the United States or around the world, public health epidemics such as the outbreak of infectious diseases like the recent outbreak of coronavirus globally or the 2014–2016 outbreak in West Africa of the Ebola virus, and other similar events could adversely affect the U.S. and foreign financial markets, including increases in market volatility, reduced liquidity in the securities markets and government intervention, and may cause further long-term economic uncertainties in the United States and worldwide generally.
The coronavirus pandemic and the related governmental and public responses have had and may continue to have an impact on the Series’ investments and net asset value and have led and may continue to lead to increased market volatility and the potential for illiquidity in certain classes of securities and sectors of the market. Preventative or protective
actions that governments may take in respect of pandemic or epidemic diseases may result in periods of business disruption, business closures, inability to obtain raw materials, supplies and component parts, and reduced or disrupted operations for the issuers in which the Series invests. Government intervention in markets may impact interest rates, market volatility and security pricing. The occurrence, reoccurrence and pendency of such diseases could adversely affect the economies (including through changes in business activity and increased unemployment) and financial markets either in specific countries or worldwide.
Non-diversification Risk: A non-diversified Series may invest a greater percentage of its assets in the securities of a single company or industry than a diversified fund. Investing in a non-diversified fund involves greater risk than investing in a diversified fund because a loss resulting from the decline in value of any one security may represent a greater portion of the total assets of a non-diversified fund.
10. Recent Accounting Pronouncement and Regulatory Developments
In March 2020, the FASB issued Accounting Standard Update (“ASU”) No. 2020-04, which provides optional guidance for applying GAAP to contract modifications, hedging relationships and other transactions affected by the reference rate reform if certain criteria are met. ASU 2020-04 is elective and is effective on March 12, 2020 through December 31, 2022. At this time, management is evaluating the implications of certain provisions of the ASU and any impact on the financial statement disclosures has not yet been determined.
On December 3, 2020, the SEC announced that it voted to adopt a new rule that establishes an updated regulatory framework for fund valuation practices (the “Rule”). The Rule, in part, provides (i) a framework for determining fair value in good faith and (ii) provides for a fund Board’s assignment of its responsibility for the execution of valuation-related activities to a fund’s investment adviser. Further, the SEC is rescinding previously issued guidance on related issues. The Rule will become effective 60 days after publication in the Federal Register, and will have a compliance date 18 months following the effective date. Management is currently evaluating the Rule and its impact to the Funds.
| | | | |
| PGIM Emerging Markets Debt Local Currency Fund | | | 71 | |
Financial Highlights
| | | | | | | | | | | | | | | | | | | | |
| Class A Shares | |
| | | Year Ended October 31, | |
| | | 2020 | | | 2019 | | | 2018 | | | 2017 | | | 2016 | |
| Per Share Operating Performance(a): | | | | | | | | | | | | | | | | | | | | |
| Net Asset Value, Beginning of Year | | | $6.07 | | | | $5.52 | | | | $6.40 | | | | $6.44 | | | | $6.24 | |
| Income (loss) from investment operations: | | | | | | | | | | | | | | | | | | | | |
| Net investment income (loss) | | | 0.24 | | | | 0.30 | | | | 0.33 | | | | 0.35 | | | | 0.33 | |
| Net realized and unrealized gain (loss) on investment and foreign currency transactions | | | (0.47 | ) | | | 0.57 | | | | (0.86 | ) | | | (0.02 | ) | | | 0.23 | |
| Total from investment operations | | | (0.23 | ) | | | 0.87 | | | | (0.53 | ) | | | 0.33 | | | | 0.56 | |
| Less Dividends and Distributions: | | | | | | | | | | | | | | | | | | | | |
| Dividends from net investment income* | | | - | | | | (0.31 | ) | | | - | | | | (0.15 | ) | | | - | (b) |
| Tax return of capital distributions | | | (0.27 | ) | | | (0.01 | ) | | | (0.35 | ) | | | (0.22 | ) | | | (0.36 | ) |
| Total dividends and distributions | | | (0.27 | ) | | | (0.32 | ) | | | (0.35 | ) | | | (0.37 | ) | | | (0.36 | ) |
| Net asset value, end of year | | | $5.57 | | | | $6.07 | | | | $5.52 | | | | $6.40 | | | | $6.44 | |
| Total Return(c): | | | (3.75 | )% | | | 16.14 | % | | | (8.68 | )% | | | 5.36 | % | | | 9.29 | % |
| | | | | | | | | | | | | | | | | | | | | |
| Ratios/Supplemental Data: | | | | | | | | | | | | | | | |
| Net assets, end of year (000) | | | $3,853 | | | | $3,692 | | | | $3,146 | | | | $3,085 | | | | $3,990 | |
| Average net assets (000) | | | $3,518 | | | | $3,223 | | | | $4,105 | | | | $3,639 | | | | $3,343 | |
| Ratios to average net assets(d)(e): | | | | | | | | | | | | | | | | | | | | |
| Expenses after waivers and/or expense reimbursement | | | 1.13 | % | | | 1.13 | % | | | 1.13 | % | | | 1.13 | % | | | 1.28 | % |
| Expenses before waivers and/or expense reimbursement | | | 2.04 | % | | | 2.03 | % | | | 2.16 | % | | | 2.15 | % | | | 2.33 | % |
| Net investment income (loss) | | | 4.24 | % | | | 5.13 | % | | | 5.34 | % | | | 5.42 | % | | | 5.20 | % |
| Portfolio turnover rate(f) | | | 64 | % | | | 69 | % | | | 113 | % | | | 186 | % | | | 196 | % |
| * | Dividends from net investment income may include other items that are ordinary income for tax purposes. |
| (a) | Calculated based on average shares outstanding during the year. |
| (b) | Less than $0.005 per share. |
| (c) | Total return does not consider the effects of sales loads. Total return is calculated assuming a purchase of a share on the first day and a sale on the last day of each year reported and includes reinvestment of dividends and distributions, if any. Total returns may reflect adjustments to conform to generally accepted accounting principles. |
| (d) | Does not include expenses of the underlying funds in which the Series invests. |
| (e) | Effective November 1, 2017, class specific expenses include transfer agent fees and expenses and registration fees, which are charged to their respective share class. |
| (f) | The Series’ portfolio turnover rate is calculated in accordance with regulatory requirements, without regard to transactions involving short-term investments and certain derivatives. If such transactions were included, the Series’ portfolio turnover rate may be higher. |
See Notes to Financial Statements.
| | | | | | | | | | | | | | | | | | | | |
| Class C Shares | |
| | | Year Ended October 31, | |
| | | 2020 | | | 2019 | | | 2018 | | | 2017 | | | 2016 | |
| Per Share Operating Performance(a): | | | | | | | | | | | | | | | | | | | | |
| Net Asset Value, Beginning of Year | | | $6.11 | | | | $5.56 | | | | $6.46 | | | | $6.49 | | | | $6.28 | |
| Income (loss) from investment operations: | | | | | | | | | | | | | | | | | | | | |
| Net investment income (loss) | | | 0.20 | | | | 0.26 | | | | 0.29 | | | | 0.30 | | | | 0.28 | |
| Net realized and unrealized gain (loss) on investment and foreign currency transactions | | | (0.47 | ) | | | 0.57 | | | | (0.88 | ) | | | (0.01 | ) | | | 0.25 | |
| Total from investment operations | | | (0.27 | ) | | | 0.83 | | | | (0.59 | ) | | | 0.29 | | | | 0.53 | |
| Less Dividends and Distributions: | | | | | | | | | | | | | | | | | | | | |
| Dividends from net investment income* | | | - | | | | (0.27 | ) | | | - | | | | (0.13 | ) | | | - | (b) |
| Tax return of capital distributions | | | (0.23 | ) | | | (0.01 | ) | | | (0.31 | ) | | | (0.19 | ) | | | (0.32 | ) |
| Total dividends and distributions | | | (0.23 | ) | | | (0.28 | ) | | | (0.31 | ) | | | (0.32 | ) | | | (0.32 | ) |
| Net asset value, end of year | | | $5.61 | | | | $6.11 | | | | $5.56 | | | | $6.46 | | | | $6.49 | |
| Total Return(c): | | | (4.41 | )% | | | 15.18 | % | | | (9.61 | )% | | | 4.66 | % | | | 8.61 | % |
| | | | | | | | | | | | | | | | | | | | | |
| Ratios/Supplemental Data: | | | | | | | | | | | | | | | |
| Net assets, end of year (000) | | | $466 | | | | $579 | | | | $538 | | | | $718 | | | | $787 | |
| Average net assets (000) | | | $484 | | | | $566 | | | | $672 | | | | $649 | | | | $721 | |
| Ratios to average net assets(d)(e): | | | | | | | | | | | | | | | | | | | | |
| Expenses after waivers and/or expense reimbursement | | | 1.88 | % | | | 1.88 | % | | | 1.88 | % | | | 1.88 | % | | | 2.03 | % |
| Expenses before waivers and/or expense reimbursement | | | 5.82 | % | | | 4.82 | % | | | 4.89 | % | | | 2.88 | % | | | 3.07 | % |
| Net investment income (loss) | | | 3.54 | % | | | 4.37 | % | | | 4.56 | % | | | 4.63 | % | | | 4.40 | % |
| Portfolio turnover rate(f) | | | 64 | % | | | 69 | % | | | 113 | % | | | 186 | % | | | 196 | % |
| * | Dividends from net investment income may include other items that are ordinary income for tax purposes. |
| (a) | Calculated based on average shares outstanding during the year. |
| (b) | Less than $0.005 per share. |
| (c) | Total return does not consider the effects of sales loads. Total return is calculated assuming a purchase of a share on the first day and a sale on the last day of each year reported and includes reinvestment of dividends and distributions, if any. Total returns may reflect adjustments to conform to generally accepted accounting principles. |
| (d) | Does not include expenses of the underlying funds in which the Series invests. |
| (e) | Effective November 1, 2017, class specific expenses include transfer agent fees and expenses and registration fees, which are charged to their respective share class. |
| (f) | The Series’ portfolio turnover rate is calculated in accordance with regulatory requirements, without regard to transactions involving short-term investments and certain derivatives. If such transactions were included, the Series’ portfolio turnover rate may be higher. |
See Notes to Financial Statements.
| | | | |
| PGIM Emerging Markets Debt Local Currency Fund | | | 73 | |
Financial Highlights (continued)
| | | | | | | | | | | | | | | | | | | | |
| Class Z Shares | | | | | | | | | | | | | | | |
| | | | | | Year Ended October 31, | | | | |
| | | 2020 | | | 2019 | | | 2018 | | | 2017 | | | 2016 | |
| Per Share Operating Performance(a): | | | | | | | | | | | | | | | | | | | | |
| Net Asset Value, Beginning of Year | | | $6.13 | | | | $5.57 | | | | $6.48 | | | | $6.50 | | | | $6.31 | |
| Income (loss) from investment operations: | | | | | | | | | | | | | | | | | | | | |
| Net investment income (loss) | | | 0.27 | | | | 0.32 | | | | 0.34 | | | | 0.36 | | | | 0.34 | |
| Net realized and unrealized gain (loss) on investment and foreign currency transactions | | | (0.48 | ) | | | 0.58 | | | | (0.88 | ) | | | 0.01 | | | | 0.23 | |
| Total from investment operations | | | (0.21 | ) | | | 0.90 | | | | (0.54 | ) | | | 0.37 | | | | 0.57 | |
| Less Dividends and Distributions: | | | | | | | | | | | | | | | | | | | | |
| Dividends from net investment income* | | | - | | | | (0.33 | ) | | | - | | | | (0.16 | ) | | | - | (b) |
| Tax return of capital distributions | | | (0.30 | ) | | | (0.01 | ) | | | (0.37 | ) | | | (0.23 | ) | | | (0.38 | ) |
| Total dividends and distributions | | | (0.30 | ) | | | (0.34 | ) | | | (0.37 | ) | | | (0.39 | ) | | | (0.38 | ) |
| Net asset value, end of year | | | $5.62 | | | | $6.13 | | | | $5.57 | | | | $6.48 | | | | $6.50 | |
| Total Return(c): | | | (3.45 | )% | | | 16.50 | % | | | (8.83 | )% | | | 5.85 | % | | | 9.31 | % |
| | | | | | | | | | | | | | | | | | | | | |
| Ratios/Supplemental Data: | | | | | | | | | | | | | | | |
| Net assets, end of year (000) | | | $57,392 | | | | $68,101 | | | | $55,000 | | | | $27,020 | | | | $27,462 | |
| Average net assets (000) | | | $56,989 | | | | $63,219 | | | | $49,644 | | | | $26,437 | | | | $25,994 | |
| Ratios to average net assets(d)(e): | | | | | | | | | | | | | | | | | | | | |
| Expenses after waivers and/or expense reimbursement | | | 0.74 | % | | | 0.88 | % | | | 0.88 | % | | | 0.88 | % | | | 1.03 | % |
| Expenses before waivers and/or expense reimbursement | | | 1.27 | % | | | 1.31 | % | | | 1.41 | % | | | 1.88 | % | | | 2.06 | % |
| Net investment income (loss) | | | 4.72 | % | | | 5.35 | % | | | 5.50 | % | | | 5.58 | % | | | 5.36 | % |
| Portfolio turnover rate(f) | | | 64 | % | | | 69 | % | | | 113 | % | | | 186 | % | | | 196 | % |
| * | Dividends from net investment income may include other items that are ordinary income for tax purposes. |
| (a) | Calculated based on average shares outstanding during the year. |
| (b) | Less than $0.005 per share. |
| (c) | Total return is calculated assuming a purchase of a share on the first day and a sale on the last day of each year reported and includes reinvestment of dividends and distributions, if any. Total returns may reflect adjustments to conform to generally accepted accounting principles. |
| (d) | Does not include expenses of the underlying funds in which the Series invests. |
| (e) | Effective November 1, 2017, class specific expenses include transfer agent fees and expenses and registration fees, which are charged to their respective share class. |
| (f) | The Series’ portfolio turnover rate is calculated in accordance with regulatory requirements, without regard to transactions involving short-term investments and certain derivatives. If such transactions were included, the Series’ portfolio turnover rate may be higher. |
See Notes to Financial Statements.
| | | | | | | | | | | | | | | | | | | | |
| Class R6 Shares | |
| | | Year Ended October 31, | |
| | | 2020 | | | 2019 | | | 2018 | | | 2017 | | | 2016 | |
| Per Share Operating Performance(a): | | | | | | | | | | | | | | | | | | | | |
| Net Asset Value, Beginning of Year | | | $6.12 | | | | $5.56 | | | | $6.47 | | | | $6.50 | | | | $6.30 | |
| Income (loss) from investment operations: | | | | | | | | | | | | | | | | | | | | |
| Net investment income (loss) | | | 0.27 | | | | 0.31 | | | | 0.36 | | | | 0.37 | | | | 0.35 | |
| Net realized and unrealized gain (loss) on investment and foreign currency transactions | | | (0.47 | ) | | | 0.58 | | | | (0.89 | ) | | | - | (b) | | | 0.23 | |
| Total from investment operations | | | (0.20 | ) | | | 0.89 | | | | (0.53 | ) | | | 0.37 | | | | 0.58 | |
| Less Dividends and Distributions: | | | | | | | | | | | | | | | | | | | | |
| Dividends from net investment income* | | | - | | | | (0.32 | ) | | | - | | | | (0.16 | ) | | | - | (b) |
| Tax return of capital distributions | | | (0.30 | ) | | | (0.01 | ) | | | (0.38 | ) | | | (0.24 | ) | | | (0.38 | ) |
| Total dividends and distributions | | | (0.30 | ) | | | (0.33 | ) | | | (0.38 | ) | | | (0.40 | ) | | | (0.38 | ) |
| Net asset value, end of year | | | $5.62 | | | | $6.12 | | | | $5.56 | | | | $6.47 | | | | $6.50 | |
| Total Return(c): | | | (3.24 | )% | | | 16.41 | % | | | (8.63 | )% | | | 5.82 | % | | | 9.55 | % |
| | | | | | | | | | | | | | | | | | | | | |
| Ratios/Supplemental Data: | | | | | | | | | | | | | | | |
| Net assets, end of year (000) | | | $50 | | | | $29 | | | | $1 | | | | $1 | | | | $1 | |
| Average net assets (000) | | | $42 | | | | $15 | | | | $1 | | | | $1 | | | | $1 | |
| Ratios to average net assets(d)(e): | | | | | | | | | | | | | | | | | | | | |
| Expenses after waivers and/or expense reimbursement | | | 0.67 | % | | | 0.88 | % | | | 0.88 | % | | | 0.88 | % | | | 1.03 | % |
| Expenses before waivers and/or expense reimbursement | | | 40.50 | % | | | 92.22 | % | | | 1,595.87 | % | | | 1.83 | % | | | 2.06 | % |
| Net investment income (loss) | | | 4.64 | % | | | 5.20 | % | | | 5.73 | % | | | 5.73 | % | | | 5.47 | % |
| Portfolio turnover rate(f) | | | 64 | % | | | 69 | % | | | 113 | % | | | 186 | % | | | 196 | % |
| * | Dividends from net investment income may include other items that are ordinary income for tax purposes. |
| (a) | Calculated based on average shares outstanding during the year. |
| (b) | Less than $0.005 per share. |
| (c) | Total return is calculated assuming a purchase of a share on the first day and a sale on the last day of each year reported and includes reinvestment of dividends and distributions, if any. Total returns may reflect adjustments to conform to generally accepted accounting principles. |
| (d) | Does not include expenses of the underlying funds in which the Series invests. |
| (e) | Effective November 1, 2017, class specific expenses include transfer agent fees and expenses and registration fees, which are charged to their respective share class. |
| (f) | The Series’ portfolio turnover rate is calculated in accordance with regulatory requirements, without regard to transactions involving short-term investments and certain derivatives. If such transactions were included, the Series’ portfolio turnover rate may be higher. |
See Notes to Financial Statements.
| | | | |
| PGIM Emerging Markets Debt Local Currency Fund | | | 75 | |
Report of Independent Registered Public Accounting Firm
To the Board of Directors of Prudential World Fund, Inc. and Shareholders of PGIM Emerging Markets Debt Local Currency Fund
Opinion on the Financial Statements
We have audited the accompanying statement of assets and liabilities, including the schedule of investments, of PGIM Emerging Markets Debt Local Currency Fund (one of the funds constituting Prudential World Fund, Inc., referred to hereafter as the “Fund”) as of October 31, 2020, and the related statements of operations and changes in net assets, including the related notes, and the financial highlights for the year ended October 31, 2020 (collectively referred to as the “financial statements”). In our opinion, the financial statements present fairly, in all material respects, the financial position of the Fund as of October 31, 2020, and the results of its operations, changes in its net assets, and the financial highlights for the year ended October 31, 2020 in conformity with accounting principles generally accepted in the United States of America.
The financial statements of the Fund as of and for the year ended October 31, 2019 and the financial highlights for each of the periods ended on or prior to October 31, 2019 (not presented herein, other than the statement of changes in net assets and the financial highlights) were audited by other auditors whose report dated December 19, 2019 expressed an unqualified opinion on those financial statements and financial highlights.
Basis for Opinion
These financial statements are the responsibility of the Fund’s management. Our responsibility is to express an opinion on the Fund’s financial statements based on our audit. We are a public accounting firm registered with the Public Company Accounting Oversight Board (United States) (PCAOB) and are required to be independent with respect to the Fund in accordance with the U.S. federal securities laws and the applicable rules and regulations of the Securities and Exchange Commission and the PCAOB.
We conducted our audit of these financial statements in accordance with the standards of the PCAOB. Those standards require that we plan and perform the audit to obtain reasonable assurance about whether the financial statements are free of material misstatement, whether due to error or fraud.
Our audit included performing procedures to assess the risks of material misstatement of the financial statements, whether due to error or fraud, and performing procedures that respond to those risks. Such procedures included examining, on a test basis, evidence regarding the amounts and disclosures in the financial statements. Our audit also included evaluating the accounting principles used and significant estimates made by management, as well as evaluating the overall presentation of the financial statements. Our procedures included confirmation of securities owned as of October 31, 2020 by correspondence with the custodian, transfer agent and brokers; when replies were not received from brokers, we performed other auditing procedures. We believe that our audit provides a reasonable basis for our opinion.
/s/PricewaterhouseCoopers LLP
New York, New York
December 17, 2020
We have served as the auditor of one or more investment companies in the PGIM Retail Funds complex since 2020.
INFORMATION ABOUT BOARD MEMBERS AND OFFICERS (unaudited)
Information about Board Members and Officers of the Fund is set forth below. Board Members who are not deemed to be “interested persons” of the Fund, as defined in the 1940 Act, are referred to as “Independent Board Members.” Board Members who are deemed to be “interested persons” of the Fund are referred to as “Interested Board Members.” The Board Members are responsible for the overall supervision of the operations of the Fund and perform the various duties imposed on the directors of investment companies by the 1940 Act. The Board in turn elects the Officers, who are responsible for administering the day-to-day operations of the Fund.
| | | | | | |
| Independent Board Members | | | | |
| | | | |
Name Year of Birth Position(s) Portfolios Overseen | | Principal Occupation(s) During Past Five Years | | Other Directorships Held During Past Five Years | | Length of
Board Service |
| | | | |
Ellen S. Alberding 1958 Board Member Portfolios Overseen: 95 | | President and Board Member, The Joyce Foundation (charitable foundation) (since 2002); Vice Chair, City Colleges of Chicago (community college system) (2011-2015); Trustee, National Park Foundation (charitable foundation for national park system) (2009-2018); Trustee, Economic Club of Chicago (2009-2016); Trustee, Loyola University (since 2018). | | None. | | Since September 2013 |
| | | | |
Kevin J. Bannon 1952 Board Member Portfolios Overseen: 95 | | Retired; Managing Director (April 2008-May 2015) and Chief Investment Officer (October 2008-November 2013) of Highmount Capital LLC (registered investment adviser); formerly Executive Vice President and Chief Investment Officer (April 1993-August 2007) of Bank of New York Company; President (May 2003-May 2007) of BNY Hamilton Family of Mutual Funds. | | Director of Urstadt Biddle Properties (equity real estate investment trust) (since September 2008). | | Since July 2008 |
PGIM Emerging Markets Debt Local Currency Fund
| | | | | | |
| Independent Board Members | | | | |
| | | | |
Name Year of Birth Position(s) Portfolios Overseen | | Principal Occupation(s) During Past Five Years | | Other Directorships Held During Past Five Years | | Length of
Board Service |
| | | | |
Linda W. Bynoe 1952 Board Member Portfolios Overseen: 95 | | President and Chief Executive Officer (since March 1995) and formerly Chief Operating Officer (December 1989-February 1995) of Telemat Limited LLC (formerly, Telemat Ltd). (management consulting); formerly Vice President (January 1985-June 1989) at Morgan Stanley & Co. (broker-dealer). | | Director of Anixter International, Inc. (communication products distributor) (since January 2006–June 2020); Director of Northern Trust Corporation (financial services) (since April 2006); Trustee of Equity Residential (residential real estate) (since December 2009). | | Since March 2005 |
| | | | |
Barry H. Evans 1960 Board Member Portfolios Overseen: 94 | | Retired; formerly President (2005 – 2016), Global Chief Operating Officer (2014–2016), Chief Investment Officer – Global Head of Fixed Income (1998-2014), and various portfolio manager roles (1986-2006), Manulife Asset Management U.S. | | Formerly Director, Manulife Trust Company (2011-2018); formerly Director, Manulife Asset Management Limited (2015-2017); formerly Chairman of the Board of Directors of Manulife Asset Management U.S. (2005-2016); formerly Chairman of the Board, Declaration Investment Management and Research (2008-2016). | | Since September 2017 |
| | | | |
Keith F. Hartstein 1956 Board Member & Independent Chair Portfolios Overseen: 95 | | Executive Committee of the IDC Board of Governors (since October 2019); Retired; Member (since November 2014) of the Governing Council of the Independent Directors Council (IDC) (organization of independent mutual fund directors); formerly President and Chief Executive Officer (2005-2012), Senior Vice President (2004-2005), Senior Vice President of Sales and Marketing (1997-2004), and various executive management positions (1990-1997), John Hancock Funds, LLC (asset management); Chairman, Investment Company Institute’s Sales Force Marketing Committee (2003-2008). | | None. | | Since September 2013 |
Visit our website at pgim.com/investments
| | | | | | |
| Independent Board Members | | | | |
| | | | |
Name Year of Birth Position(s) Portfolios Overseen | | Principal Occupation(s) During Past Five Years | | Other Directorships Held During Past Five Years | | Length of
Board Service |
| | | | |
Laurie Simon Hodrick 1962 Board Member Portfolios Overseen: 94 | | A. Barton Hepburn Professor Emerita of Economics in the Faculty of Business, Columbia Business School (since 2018); Visiting Professor of Law, Stanford Law School (since 2015); Visiting Fellow at the Hoover Institution, Stanford University (since 2015); Sole Member, ReidCourt LLC (since 2008) (a consulting firm); formerly A. Barton Hepburn Professor of Economics in the Faculty of Business, Columbia Business School (1996-2017); formerly Managing Director, Global Head of Alternative Investment Strategies, Deutsche Bank (2006-2008). | | Independent Director, Synnex Corporation (since 2019) (information technology); Independent Director, Kabbage, Inc. (2018-2020) (financial services); Independent Director, Corporate Capital Trust (2017-2018) (a business development company). | | Since September 2017 |
| | | | |
Michael S. Hyland, CFA 1945 Board Member Portfolios Overseen: 95 | | Retired (since February 2005); formerly Senior Managing Director (July 2001-February 2005) of Bear Stearns & Co, Inc.; Global Partner, INVESCO (1999-2001); Managing Director and President of Salomon Brothers Asset Management (1989-1999). | | None. | | Since July 2008 |
| | | | |
Brian K. Reid 1961 Board Member Portfolios Overseen: 94 | | Retired; formerly Chief Economist for the Investment Company Institute (ICI) (2005-2017); formerly Senior Economist and Director of Industry and Financial Analysis at the ICI (1998-2004); formerly Senior Economist, Industry and Financial Analysis at the ICI (1996-1998); formerly Staff Economist at the Federal Reserve Board (1989-1996); Director, ICI Mutual Insurance Company (2012-2017). | | None. | | Since March 2018 |
PGIM Emerging Markets Debt Local Currency Fund
| | | | | | |
| Independent Board Members | | | | |
| | | | |
Name Year of Birth Position(s) Portfolios Overseen | | Principal Occupation(s) During Past Five Years | | Other Directorships Held During Past Five Years | | Length of
Board Service |
| | | | |
Grace C. Torres 1959 Board Member Portfolios Overseen: 94 | | Retired; formerly Treasurer and Principal Financial and Accounting Officer of the PGIM Funds, Target Funds, Advanced Series Trust, Prudential Variable Contract Accounts and The Prudential Series Fund (1998-June 2014); Assistant Treasurer (March 1999-June 2014) and Senior Vice President (September 1999-June 2014) of PGIM Investments LLC; Assistant Treasurer (May 2003-June 2014) and Vice President (June 2005-June 2014) of AST Investment Services, Inc.; Senior Vice President and Assistant Treasurer (May 2003-June 2014) of Prudential Annuities Advisory Services, Inc. | | Formerly Director (July 2015-January 2018) of Sun Bancorp, Inc. N.A. and Sun National Bank; Director (since January 2018) of OceanFirst Financial Corp. and OceanFirst Bank. | | Since November 2014 |
| | | | | | |
| Interested Board Members | | | | |
| | | | |
Name Year of Birth Position(s) Portfolios Overseen | | Principal Occupation(s) During Past Five Years | | Other Directorships Held During Past Five Years | | Length of
Board Service |
| | | | |
Stuart S. Parker 1962 Board Member & President Portfolios Overseen: 96 | | President of PGIM Investments LLC (formerly known as Prudential Investments LLC) (since January 2012); Executive Vice President of Prudential Investment Management Services LLC (since December 2012); formerly Executive Vice President of Jennison Associates LLC and Head of Retail Distribution of PGIM Investments LLC (June 2005-December 2011). | | None. | | Since January 2012 |
Visit our website at pgim.com/investments
| | | | | | |
Interested Board Members | | | | |
| | | | |
Name Year of Birth Position(s) Portfolios Overseen | | Principal Occupation(s) During Past Five Years | | Other Directorships Held During Past Five Years | | Length of
Board Service |
| | | | |
Scott E. Benjamin 1973 Board Member & Vice President Portfolios Overseen: 96 | | Executive Vice President (since June 2009) of PGIM Investments LLC; Vice President (since June 2012) of Prudential Investment Management Services LLC; Executive Vice President (since September 2009) of AST Investment Services, Inc.; Senior Vice President of Product Development and Marketing, PGIM Investments (since February 2006); formerly Vice President of Product Development and Product Management, PGIM Investments LLC (2003-2006). | | None. | | Since March 2010 |
(1) The year that each Board Member joined the Board is as follows:
Ellen S. Alberding, 2013; Kevin J. Bannon, 2008; Linda W. Bynoe, 2005; Barry H. Evans, 2017; Keith F. Hartstein, 2013; Laurie Simon Hodrick, 2017; Michael S. Hyland, 2008; James E. Quinn, 2013; Richard A. Redeker, 2000; Stephen G. Stoneburn, 2003; Stuart S. Parker, Board Member and President since 2012; Scott E. Benjamin, Board Member since 2010 and Vice President since 2009; Grace C. Torres, 2014.
| | | | |
| Fund Officers(a) | | | | |
| | | |
Name Year of Birth Fund Position | | Principal Occupation(s) During Past Five Years | | Length of
Service as Fund
Officer |
| | | |
Claudia DiGiacomo 1974 Chief Legal Officer | | Chief Legal Officer of PGIM Investments LLC (since August 2020); Chief Legal Officer of Prudential Mutual Fund Services LLC (since August 2020); Chief Legal Officer of PIFM Holdco, LLC (since August 2020); Vice President and Corporate Counsel (since January 2005) of Prudential; and Corporate Counsel of AST Investment Services, Inc. (since August 2020); formerly Associate at Sidley Austin Brown & Wood LLP (1999-2004). | | Since December 2005 |
| | | |
Dino Capasso 1974 Chief Compliance Officer | | Chief Compliance Officer (July 2019-Present) of PGIM Investments LLC; Chief Compliance Officer (July 2019-Present) of the PGIM Funds, Target Funds, Advanced Series Trust, The Prudential Series Fund, Prudential’s Gibraltar Fund, Inc., PGIM Global High Yield Fund, Inc., and PGIM High Yield Bond Fund, Inc.; Vice President and Deputy Chief Compliance Officer (June 2017-2019) of PGIM Investments LLC; formerly, Senior Vice President and Senior Counsel (January 2016-June 2017), and Vice President and Counsel (February 2012-December 2015) of Pacific Investment Management Company LLC. | | Since March 2018 |
PGIM Emerging Markets Debt Local Currency Fund
| | | | |
| Fund Officers(a) | | | | |
| | | |
Name Year of Birth Fund Position | | Principal Occupation(s) During Past Five Years | | Length of Service as Fund Officer |
| | | |
Andrew R. French 1962 Secretary | | Vice President (since December 2018 - present) of PGIM Investments LLC; Formerly, Vice President and Corporate Counsel (2010-2018) of Prudential; formerly Director and Corporate Counsel (2006-2010) of Prudential; Vice President and Assistant Secretary (since January 2007) of PGIM Investments LLC; Vice President and Assistant Secretary (since January 2007) of Prudential Mutual Fund Services LLC. | | Since October 2006 |
| | | |
Diana N. Huffman 1982 Assistant Secretary | | Vice President and Corporate Counsel (since September 2015) of Prudential; Vice President and Assistant Secretary (since August 2020) of PGIM Investments LLC; formerly Associate at Willkie Farr & Gallagher LLP (2009-2015). | | Since March 2019 |
| | | |
Melissa Gonzalez 1980 Assistant Secretary | | Vice President and Corporate Counsel (since September 2018) of Prudential; Vice President and Assistant Secretary (since August 2020) of PGIM Investments LLC; formerly Director and Corporate Counsel (March 2014-September 2018) of Prudential. | | Since March 2020 |
| | | |
Patrick E. McGuinness 1986 Assistant Secretary | | Vice President and Assistant Secretary (since August 2020) of PGIM Investments LLC; Director and Corporate Counsel (since February 2017) of Prudential; and Corporate Counsel (2012 – 2017) of IIL, Inc. | | Since June 2020 |
| | | |
Kelly A. Coyne 1968 Assistant Secretary | | Director, Investment Operations of Prudential Mutual Fund Services LLC (since 2010). | | Since March 2015 |
| | | |
Christian J. Kelly 1975 Treasurer and Principal Financial and Accounting Officer | | Vice President, Head of Fund Administration of PGIM Investments LLC (since November 2018); formerly, Director of Fund Administration of Lord Abbett & Co. LLC (2009-2018), Treasurer and Principal Accounting Officer of the Lord Abbett Family of Funds (2017-2018); Director of Accounting, Avenue Capital Group (2008-2009); Senior Manager, Investment Management Practice of Deloitte & Touche LLP (1998-2007). | | Since January 2019 |
| | | |
Lana Lomuti 1967 Assistant Treasurer | | Vice President (since 2007) and Director (2005-2007), within PGIM Investments Fund Administration; formerly Assistant Treasurer (December 2007-February 2014) of The Greater China Fund, Inc. | | Since April 2014 |
| | | |
Russ Shupak 1973 Assistant Treasurer | | Vice President (since 2017) and Director (2013-2017), within PGIM Investments Fund Administration. | | Since October 2019 |
| | | |
Deborah Conway 1969 Assistant Treasurer | | Vice President (since 2017) and Director (2007-2017), within PGIM Investments Fund Administration. | | Since October 2019 |
| | | |
Elyse M. McLaughlin 1974 Assistant Treasurer | | Vice President (since 2017) and Director (2011-2017), within PGIM Investments Fund Administration. | | Since October 2019 |
Visit our website at pgim.com/investments
| | | | |
| Fund Officers(a) | | | | |
| | | |
Name Year of Birth Fund Position | | Principal Occupation(s) During Past Five Years | | Length of Service as Fund Officer |
| | | |
Charles H. Smith 1973 Anti-Money Laundering Compliance Officer | | Vice President, Corporate Compliance, Anti-Money Laundering Unit (since January 2015) of Prudential; committee member of the American Council of Life Insurers Anti-Money Laundering and Critical Infrastructure Committee (since January 2016); formerly Global Head of Economic Sanctions Compliance at AIG Property Casualty (February 2007-December 2014); Assistant Attorney General at the New York State Attorney General’s Office, Division of Public Advocacy. (August 1998-January 2007). | | Since January 2017 |
(a) Excludes Mr. Parker and Mr. Benjamin, interested Board Members who also serve as President and Vice President, respectively.
Explanatory Notes to Tables:
| ∎ | | Board Members are deemed to be “Interested,” as defined in the 1940 Act, by reason of their affiliation with PGIM Investments LLC and/or an affiliate of PGIM Investments LLC. |
| ∎ | | Unless otherwise noted, the address of all Board Members and Officers is c/o PGIM Investments LLC, 655 Broad Street, Newark, New Jersey 07102-4410. |
| ∎ | | There is no set term of office for Board Members or Officers. The Board Members have adopted a retirement policy, which calls for the retirement of Board Members on December 31 of the year in which they reach the age of 75. |
| ∎ | | “Other Directorships Held” includes all directorships of companies required to register or file reports with the SEC under the 1934 Act (that is, “public companies”) or other investment companies registered under the 1940 Act. |
| ∎ | | “Portfolios Overseen” includes all investment companies managed by PGIM Investments LLC. The investment companies for which PGIM Investments LLC serves as manager include the PGIM Funds, The Prudential Variable Contract Accounts, PGIM ETF Trust, PGIM High Yield Bond Fund, Inc., PGIM Global High Yield Fund, Inc., The Prudential Series Fund, Prudential’s Gibraltar Fund, Inc. and the Advanced Series Trust. |
| ∎ | | As used in the Fund Officers table “Prudential” means The Prudential Insurance Company of America. |
PGIM Emerging Markets Debt Local Currency Fund
Approval of Advisory Agreements (unaudited)
The Fund’s Board of Directors
The Board of Directors (the “Board”) of PGIM Emerging Markets Debt Local Currency Fund (the “Fund”)1 consists of eleven individuals, nine of whom are not “interested persons” of the Fund, as defined in the Investment Company Act of 1940, as amended (the “1940 Act”) (the “Independent Directors”). The Board is responsible for the oversight of the Fund and its operations, and performs the various duties imposed on the directors of investment companies by the 1940 Act. The Independent Directors have retained independent legal counsel to assist them in connection with their duties. The Chair of the Board is an Independent Director. The Board has established four standing committees: the Audit Committee, the Nominating and Governance Committee, and two Investment Committees. Each committee is chaired by, and composed of, Independent Directors.
Annual Approval of the Fund’s Advisory Agreements
As required under the 1940 Act, the Board determines annually whether to renew the Fund’s management agreement with PGIM Investments LLC (“PGIM Investments”), the Fund’s subadvisory agreement with PGIM, Inc. (“PGIM”) on behalf of its PGIM Fixed Income unit (“PGIM Fixed Income”), and the Fund’s sub-subadvisory agreement with PGIM Limited (“PGIML”). In considering the renewal of the agreements, the Board, including all of the Independent Directors, met on May 27, 2020 and on June 9-11, 2020 and approved the renewal of the agreements through July 31, 2021, after concluding that the renewal of the agreements was in the best interests of the Fund and its shareholders.
In advance of the meetings, the Board requested and received materials relating to the agreements, and had the opportunity to ask questions and request further information in connection with its consideration. Among other things, the Board considered comparative fee information from PGIM Investments, PGIM, and, where appropriate, affiliates of PGIM. Also, the Board considered comparisons with other mutual funds in relevant Peer Universes and Peer Groups, as is further discussed below.
In approving the agreements, the Board, including the Independent Directors advised by independent legal counsel, considered the factors it deemed relevant, including the nature, quality and extent of services provided by PGIM Investments, the subadviser, and, as relevant, its affiliates, the performance of the Fund, the profitability of PGIM Investments and its affiliates, expenses and fees, and the potential for economies of scale that may be shared with the Fund and its shareholders as the Fund’s assets grow. In their deliberations, the Directors did not identify any single factor which alone was responsible for the Board’s decision to approve the agreements with respect to the Fund. In connection with its
| `1 | PGIM Emerging Markets Debt Local Currency Fund is a series of Prudential World Fund, Inc. |
PGIM Emerging Markets Debt Local Currency Fund
Approval of Advisory Agreements (continued)
deliberations, the Board considered information provided by PGIM Investments throughout the year at regular Board meetings, presentations from portfolio managers and other information, as well as information furnished at or in advance of the meetings on May 27, 2020 and on June 9-11, 2020.
The Directors determined that the overall arrangements between the Fund and PGIM Investments, which serves as the Fund’s investment manager pursuant to a management agreement, between PGIM Investments and PGIM, which, through its PGIM Fixed Income unit, serves as the Fund’s subadviser pursuant to the terms of a subadvisory agreement with PGIM Investments, and between PGIM and PGIML, which serves as the Fund’s sub-subadviser pursuant to the terms of a sub-subadvisory agreement with PGIM, are in the best interests of the Fund and its shareholders in light of the services performed, fees charged and such other matters as the Directors considered relevant in the exercise of their business judgment.
The material factors and conclusions that formed the basis for the Directors’ reaching their determinations to approve the continuance of the agreements are separately discussed below.
Nature, Quality and Extent of Services
The Board received and considered information regarding the nature, quality and extent of services provided to the Fund by PGIM Investments, PGIM Fixed Income, and PGIML. The Board noted that PGIM Fixed Income and PGIML are affiliated with PGIM Investments. The Board considered the services provided by PGIM Investments, including but not limited to the oversight of the subadviser and sub-subadviser for the Fund, as well as the provision of fund recordkeeping, compliance and other services to the Fund, and PGIM Investments’ role as administrator for the Fund’s liquidity risk management program. With respect to PGIM Investments’ oversight of the subadviser and sub-subadviser, the Board noted that PGIM Investments’ Strategic Investment Research Group (“SIRG”), which is a business unit of PGIM Investments, is responsible for monitoring and reporting to PGIM Investments’ senior management on the performance and operations of the subadviser and sub-subadviser. The Board also considered that PGIM Investments pays the salaries of all of the officers and interested Directors of the Fund who are part of Fund management. The Board also considered the investment subadvisory services provided by PGIM Fixed Income and PGIML, including investment research and security selection, as well as adherence to the Fund’s investment restrictions and compliance with applicable Fund policies and procedures. The Board considered PGIM Investments’ evaluation of the subadviser and sub-subadviser, as well as PGIM Investments’ recommendation, based on its review of the subadviser and sub-subadviser, to renew the subadvisory and sub-subadvisory agreements.
Visit our website at pgim.com/investments
The Board considered the qualifications, backgrounds and responsibilities of PGIM Investments’ senior management responsible for the oversight of the Fund, PGIM, and PGIML, and also considered the qualifications, backgrounds and responsibilities of PGIM Fixed Income’s portfolio managers who are responsible for the day-to-day management of the Fund’s portfolio. The Board was provided with information pertaining to PGIM Investments, PGIM Fixed Income’s, and PGIML’s organizational structure, senior management, investment operations, and other relevant information pertaining to PGIM Investments, PGIM Fixed Income, and PGIML. The Board also noted that it received favorable compliance reports from the Fund’s Chief Compliance Officer (“CCO”) as to PGIM Investments, PGIM Fixed Income, and PGIML.
The Board concluded that it was satisfied with the nature, extent and quality of the investment management services provided by PGIM Investments, the subadvisory services provided to the Fund by PGIM Fixed Income, and the sub-subadvisory services provided by PGIML, and that there was a reasonable basis on which to conclude that the Fund benefits from the services provided by PGIM Investments, PGIM Fixed Income, and PGIML under the management, subadvisory and sub-subadvisory agreements.
Costs of Services and Profits Realized by PGIM Investments
The Board was provided with information on the profitability of PGIM Investments and its affiliates in serving as the Fund’s investment manager. The Board discussed with PGIM Investments the methodology utilized in assembling the information regarding profitability and considered its reasonableness. The Board recognized that it is difficult to make comparisons of profitability from fund management contracts because comparative information is not generally publicly available and is affected by numerous factors, including the structure of the particular adviser, the types of funds it manages, its business mix, numerous assumptions regarding allocations and the adviser’s capital structure and cost of capital. However, the Board considered that the cost of services provided by PGIM Investments for the year ended December 31, 2019 exceeded the management fees received by PGIM Investments, resulting in an operating loss to PGIM Investments. Taking these factors into account, the Board concluded that the profitability of PGIM Investments and its affiliates in relation to the services rendered was not unreasonable.
Economies of Scale
The Board received and discussed information concerning economies of scale that PGIM Investments may realize as the Fund’s assets grow beyond current levels. The Board noted that the management fee schedule for the Fund includes breakpoints, which have the effect of decreasing the fee rate as assets increase. During the course of time, the Board has considered information regarding the launch date of the Fund, the management fees of the Fund compared to those of similarly managed funds and PGIM Investments investment
PGIM Emerging Markets Debt Local Currency Fund
Approval of Advisory Agreements (continued)
in the Fund over time. The Board noted that economies of scale may be shared with the Fund in several ways, including low management fees from inception, additional technological and personnel investments to enhance shareholder services, and maintaining existing expense structures in the face of a rising cost environment. The Board considered PGIM Investments’ assertion that it continually evaluates the management fee schedule of the Fund and the potential to share economies of scale through breakpoints or fee waivers as asset levels increase.
The Board recognized the inherent limitations of any analysis of economies of scale, stemming largely from the Board’s understanding that most of PGIM Investments’ costs are not specific to individual funds, but rather are incurred across a variety of products and services.
Other Benefits to PGIM Investments, PGIM Fixed Income, and PGIML
The Board considered potential ancillary benefits that might be received by PGIM Investments, PGIM Fixed Income, PGIML and their affiliates as a result of their relationship with the Fund. The Board concluded that potential benefits to be derived by PGIM Investments included transfer agency fees received by the Fund’s transfer agent (which is affiliated with PGIM Investments), as well as benefits to its reputation or other intangible benefits resulting from PGIM Investments’ association with the Fund. The Board concluded that the potential benefits to be derived by PGIM Fixed Income and PGIML included the ability to use soft dollar credits, as well as the potential benefits consistent with those generally resulting from an increase in assets under management, specifically, potential access to additional research resources and benefits to their reputations. The Board concluded that the benefits derived by PGIM Investments, PGIM Fixed Income, and PGIML were consistent with the types of benefits generally derived by investment managers and subadvisers to mutual funds.
Performance of the Fund / Fees and Expenses
The Board considered certain additional factors and made related conclusions relating to the historical performance of the Fund for the one-, three- and five-year periods ended December 31, 2019.
The Board also considered the Fund’s actual management fee, as well as the Fund’s net total expense ratio, for the fiscal year ended October 31, 2019. The Board considered the management fee for the Fund as compared to the management fee charged by PGIM Investments to other funds and the fee charged by other advisers to comparable mutual funds in a Peer Group. The actual management fee represents the fee rate actually paid by Fund shareholders and includes any fee waivers or reimbursements. The net total expense ratio for the Fund represents the actual expense ratio incurred by Fund shareholders.
Visit our website at pgim.com/investments
The mutual funds included in the Peer Universe, which was used to consider performance, and the Peer Group, which was used to consider fees and expenses, were objectively determined by Broadridge, an independent provider of mutual fund data. In certain circumstances, PGIM Investments also provided supplemental Peer Universe or Peer Group information, for reasons addressed with the Board. The comparisons placed the Fund in various quartiles over various periods, with the first quartile being the best 25% of the mutual funds (for performance, the best performing mutual funds and, for expenses, the lowest cost mutual funds).
The section below summarizes key factors considered by the Board and the Board’s conclusions regarding the Fund’s performance, fees and overall expenses. The table sets forth net performance comparisons (which reflect the impact on performance of fund expenses, or any subsidies, expense caps or waivers that may be applicable) with the Peer Universe, actual management fees with the Peer Group (which reflect the impact of any subsidies or fee waivers), and net total expenses with the Peer Group, each of which were key factors considered by the Board.
| | | | | | | | |
| Net Performance | | 1 Year | | 3 Years | | 5 Years | | 10 Years |
| | 2nd Quartile | | 2nd Quartile | | 2nd Quartile | | N/A |
| Actual Management Fees: 1st Quartile |
| Net Total Expenses: 1st Quartile |
| • | | The Board noted that the Fund outperformed its benchmark index over all periods. |
| • | | The Board and PGIM Investments agreed to retain the existing contractual expense cap that caps the Fund’s annual operating expenses at 1.13% for Class A shares, 1.88% for Class C shares, 0.65% for Class R6 shares, and 0.72% for Class Z shares through February 28, 2021. |
| • | | In addition, PGIM Investments will waive management fees or shared operating expenses on any share class to the same extent that it waives such expenses on any other share class, and has agreed that total annual fund operating expenses for Class R6 shares will not exceed total annual fund operating expenses for Class Z shares. |
| • | | The Board concluded that, in light of the above, it would be in the best interests of the Fund and its shareholders to renew the agreements. |
| • | | The Board concluded that the management fees (including subadvisory fees) and total expenses were reasonable in light of the services provided. |
* * *
After full consideration of these factors, the Board concluded that the approval of the agreements was in the best interests of the Fund and its shareholders.
PGIM Emerging Markets Debt Local Currency Fund
| | | | |
| | |
| ∎ MAIL | | ∎ TELEPHONE | | ∎ WEBSITE |
655 Broad Street Newark, NJ 07102 | | (800) 225-1852 | | pgim.com/investments |
|
| PROXY VOTING |
The Board of Directors of the Fund has delegated to the Fund’s subadviser the responsibility for voting any proxies and maintaining proxy recordkeeping with respect to the Fund. A description of these proxy voting policies and procedures is available without charge, upon request, by calling
(800) 225-1852 or by visiting the Securities and Exchange Commission’s website at sec.gov. Information regarding how the Fund voted proxies relating to portfolio securities during the most recent 12-month period ended June 30 is available on the Fund’s website and on the Securities and Exchange Commission’s website. |
|
| DIRECTORS |
| Ellen S. Alberding • Kevin J. Bannon • Scott E. Benjamin • Linda W. Bynoe • Barry H. Evans • Keith F. Hartstein • Laurie Simon Hodrick • Michael S. Hyland • Stuart S. Parker • Brian K. Reid • Grace C. Torres |
|
| OFFICERS |
Stuart S. Parker, President • Scott E. Benjamin, Vice President • Christian J. Kelly, Treasurer and Principal Financial and Accounting Officer • Claudia DiGiacomo, Chief Legal Officer • Dino Capasso, Chief Compliance Officer • Charles H. Smith, Anti-Money Laundering Compliance Officer • Andrew R. French, Secretary • Melissa Gonzalez, Assistant Secretary • Diana N. Huffman, Assistant Secretary • Kelly A. Coyne, Assistant Secretary • Patrick McGuinness, Assistant Secretary • Lana Lomuti, Assistant Treasurer • Russ Shupak, Assistant Treasurer • Elyse McLaughlin, Assistant Treasurer • Deborah Conway, Assistant Treasurer |
| | | | |
| MANAGER | | PGIM Investments LLC | | 655 Broad Street
Newark, NJ 07102 |
|
| SUBADVISER | | PGIM Fixed Income | | 655 Broad Street
Newark, NJ 07102 |
| | |
| | PGIM Limited | | Grand Buildings, 1-3 Strand
Trafalgar Square
London, WC2N 5HR
United Kingdom |
|
| DISTRIBUTOR | | Prudential Investment
Management Services LLC | | 655 Broad Street
Newark, NJ 07102 |
|
| CUSTODIAN | | The Bank of New York Mellon | | 240 Greenwich Street
New York, NY 10286 |
|
| TRANSFER AGENT | | Prudential Mutual Fund
Services LLC | | PO Box 9658
Providence, RI 02940 |
|
INDEPENDENT REGISTERED
PUBLIC ACCOUNTING FIRM | | PricewaterhouseCoopers LLP | | 300 Madison Avenue
New York, NY 10017 |
|
| FUND COUNSEL | | Willkie Farr & Gallagher LLP | | 787 Seventh Avenue
New York, NY 10019 |
|
|
| An investor should consider the investment objectives, risks, charges, and expenses of the Fund carefully before investing. The prospectus and summary prospectus contain this and other information about the Fund. An investor may obtain the prospectus and summary prospectus by visiting our website at pgim.com/investments or by calling (800) 225-1852. The prospectus and summary prospectus should be read carefully before investing. |
|
| E-DELIVERY |
| To receive your mutual fund documents online, go to pgim.com/investments/resource/edelivery and enroll. Instead of receiving printed documents by mail, you will receive notification via email when new materials are available. You can cancel your enrollment or change your email address at any time by visiting the website address above. |
|
| SHAREHOLDER COMMUNICATIONS WITH DIRECTORS |
| Shareholders can communicate directly with the Board of Directors by writing to the Chair of the Board, PGIM Emerging Markets Debt Local Currency Fund, PGIM Investments, Attn: Board of Directors, 655 Broad Street, Newark, NJ 07102. Shareholders can communicate directly with an individual Director by writing to that Director at the same address. Communications are not screened before being delivered to the addressee. |
|
| AVAILABILITY OF PORTFOLIO HOLDINGS |
| The Fund files its complete schedule of portfolio holdings with the Securities and Exchange Commission for the first and third quarters of each fiscal year as an exhibit to its reports on Form N-PORT. The Fund’s Form N-PORT filings are available on the Commission’s website at sec.gov. |
|
| The Fund’s Statement of Additional Information contains additional information about the Fund’s Directors and is available without charge, upon request, by calling (800) 225-1852. |
Mutual Funds:
| | | | |
| ARE NOT INSURED BY THE FDIC OR ANY FEDERAL GOVERNMENT AGENCY | | MAY LOSE VALUE | | ARE NOT A DEPOSIT OF OR GUARANTEED BY ANY BANK OR ANY BANK AFFILIATE |
PGIM EMERGING MARKETS DEBT LOCAL CURRENCY FUND
| | | | | | | | |
| SHARE CLASS | | A | | C | | Z | | R6 |
| NASDAQ | | EMDAX | | EMDCX | | EMDZX | | EMDQX |
| CUSIP | | 743969750 | | 743969743 | | 743969727 | | 743969735 |
MF212E

PGIM JENNISON EMERGING MARKETS EQUITY OPPORTUNITIES FUND
ANNUAL REPORT
OCTOBER 31, 2020
COMING SOON: PAPERLESS SHAREHOLDER REPORTS
Beginning on January 1, 2021, as permitted by regulations adopted by the Securities and Exchange Commission, paper copies of the Fund’s annual and semiannual shareholder reports will no longer be sent by mail, unless you specifically request paper copies of the reports. Instead, the reports will be made available on the Fund’s website (pgim.com/investments), and you will be notified by mail each time a report is posted and provided with a website link to access the report.
If you already elected to receive shareholder reports electronically, you will not be affected by this change and you need not take any action. You may elect to receive shareholder reports and other communications from the Fund electronically anytime by contacting your financial intermediary (such as a broker-dealer or bank) or, if you are a direct investor, by calling 1-800-225-1852 or by sending an email request to PGIM Investments at shareholderreports@pgim.com.
You may elect to receive all future reports in paper free of charge. If you invest through a financial intermediary, you can contact your financial intermediary to elect to continue to receive paper copies of your shareholder reports. If you invest directly with the Fund, you can call 1-800-225-1852 or send an email request to shareholderreports@pgim.com to let the Fund know you wish to continue receiving paper copies of your shareholder reports. Your election to receive reports in paper will apply to all funds held in your account if you invest through your financial intermediary or all funds held with the fund complex if you invest directly with the Fund.

To enroll in e-delivery, go to pgim.com/investments/resource/edelivery
Table of Contents
This report is not authorized for distribution to prospective investors unless preceded or accompanied by a current prospectus.
The views expressed in this report and information about the Fund’s portfolio holdings are for the period covered by this report and are subject to change thereafter.
Mutual funds are distributed by Prudential Investment Management Services LLC, member SIPC. Jennison Associates LLC is a registered investment adviser. Both are Prudential Financial companies. © 2020 Prudential Financial, Inc. and its related entities. Jennison Associates, Jennison, PGIM, and the PGIM logo are service marks of Prudential Financial, Inc. and its related entities, registered in many jurisdictions worldwide.
| | |
| 2 | | Visit our website at pgim.com/investments |
Letter from the President

Dear Shareholder:
We hope you find the annual report for the PGIM Jennison Emerging Markets Equity Opportunities Fund informative and useful. The report covers performance for the 12-month period that ended October 31, 2020.
During the first four months of the period, the global economy remained healthy—particularly in the US—fueled by rising corporate profits and strong job growth. The outlook changed dramatically in March as the coronavirus outbreak quickly and substantially shut down economic activity worldwide, leading to significant job losses and a steep decline in global growth and earnings. Responding to this disruption, the Federal Reserve (the Fed) cut the federal funds rate target to near zero and flooded capital markets with liquidity; and Congress passed stimulus bills worth approximately $3 trillion that offered an economic lifeline to consumers and businesses.
While stocks climbed throughout the first four months of the period, they fell significantly in March amid a spike in volatility, ending the 11-year-long equity bull market. With stores and factories closing and consumers staying at home to limit the spread of the virus, investors sold stocks on fears that corporate earnings would take a serious hit. Equities rallied around the globe throughout the spring and summer as states reopened their economies, but became more volatile during the last two months of the period as investors worried that a surge in coronavirus infections would stall the economic recovery. For the period overall, large-cap US and emerging market stocks rose, small-cap US stocks were virtually unchanged, and stocks in developed foreign markets declined.
The bond market overall—including US and global bonds as well as emerging market debt—rose during the period as investors sought safety in fixed income. A significant rally in interest rates pushed the 10-year US Treasury yield down to a record low. In March, the Fed took several aggressive actions to keep the bond markets running smoothly, restarting many of the relief programs that proved to be successful in helping end the global financial crisis in 2008-09.
Regarding your investments with PGIM, we believe it is important to maintain a diversified portfolio of funds consistent with your tolerance for risk, time horizon, and financial goals. Your financial advisor can help you create a diversified investment plan that may include funds covering all the basic asset classes and that reflects your personal investor profile and risk tolerance. However, diversification and asset allocation strategies do not assure a profit or protect against loss in declining markets.
At PGIM Investments, we consider it a great privilege and responsibility to help investors participate in opportunities across global markets while meeting their toughest investment challenges. PGIM is a top-10 global investment manager with more than $1 trillion in assets under management. This scale and investment expertise allow us to deliver actively managed funds and strategies to meet the needs of investors around the globe.
Thank you for choosing our family of funds.
Sincerely,

Stuart S. Parker, President
PGIM Jennison Emerging Markets Equity Opportunities Fund
December 15, 2020
| | | | |
PGIM Jennison Emerging Markets Equity Opportunities Fund | | | 3 | |
Your Fund’s Performance (unaudited)
Performance data quoted represents past performance. Past performance does not guarantee future results. The investment return and principal value of an investment will fluctuate, so that an investor’s shares, when redeemed, may be worth more or less than their original cost. Current performance may be lower or higher than the past performance data quoted. An investor may obtain performance data as of the most recent month-end by visiting our website at pgim.com/investments or by calling (800) 225-1852.
| | | | | | |
| |
| | | Average Annual Total Returns as of 10/31/20 |
| | | One Year (%) | | Five Years (%) | | Since Inception (%) |
| Class A | | | | | | |
| (with sales charges) | | 37.24 | | 13.63 | | 8.72 (9/16/14) |
| (without sales charges) | | 45.23 | | 14.92 | | 9.73 (9/16/14) |
| Class C | | | | | | |
| (with sales charges) | | 43.06 | | 14.06 | | 8.91 (9/16/14) |
| (without sales charges) | | 44.06 | | 14.06 | | 8.91 (9/16/14) |
| Class Z | | | | | | |
| (without sales charges) | | 45.65 | | 15.25 | | 10.00 (9/16/14) |
| Class R6 | | | | | | |
| (without sales charges) | | 45.65 | | 15.22 | | 10.01 (9/16/14) |
| MSCI Emerging Markets Index | | | | |
| | | 8.25 | | 7.92 | | 3.95 |
Since Inception returns are provided since the Fund has less than 10 fiscal years of returns. Since Inception returns for the Index are measured from the closest month-end to the Fund’s inception date.
| | |
| 4 | | Visit our website at pgim.com/investments |
Growth of a $10,000 Investment (unaudited)
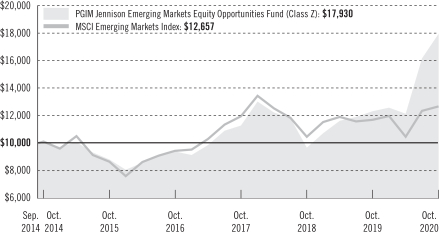
The graph compares a $10,000 investment in the Fund’s Class Z shares with a similar investment in the MSCI Emerging Markets Index, by portraying the initial account values at the commencement of operations for Class Z shares (September 16, 2014) and the account values at the end of the current fiscal year (October 31, 2020) as measured on a quarterly basis. For purposes of the graph, and unless otherwise indicated, it has been assumed that (a) all recurring fees (including management fees) were deducted; and (b) all dividends and distributions were reinvested. The line graph provides information for Class Z shares only. As indicated in the tables provided earlier, performance for other share classes will vary due to the differing fees and expenses applicable to each share class (as indicated in the following paragraphs). Without waiver of fees and/or expense reimbursements, if any, the Fund’s returns would have been lower.
Past performance does not predict future performance. Total returns and the ending account values in the graph include changes in share price and reinvestment of dividends and capital gains distributions in a hypothetical investment for the periods shown. The Fund’s total returns do not reflect the deduction of income taxes on an individual’s investment. Taxes may reduce your actual investment returns on income or gains paid by the Fund or any gains you may realize if you sell your shares.
| | | | |
PGIM Jennison Emerging Markets Equity Opportunities Fund | | | 5 | |
Your Fund’s Performance (continued)
The returns in the tables do not reflect the deduction of taxes that a shareholder would pay on Fund distributions or following the redemption of Fund shares. The average annual total returns take into account applicable sales charges, which are described for each share class in the table below.
| | | | | | | | |
| | | | | |
| | | Class A | | Class C | | Class Z | | Class R6 |
| Maximum initial sales charge | | 5.50% of the public offering price | | None | | None | | None |
| Contingent deferred sales charge (CDSC) (as a percentage of the lower of the original purchase price or the net asset value at redemption) | | 1.00% on sales of $1 million or more made within 12 months of purchase | | 1.00% on sales made within 12 months of purchase | | None | | None |
| Annual distribution and service (12b-1) fees (shown as a percentage of average daily net assets) | | 0.30% (0.25% currently) | | 1.00% | | None | | None |
Benchmark Definitions
MSCI Emerging Markets Index—The MSCI Emerging Markets Index is an unmanaged free float-adjusted market capitalization-weighted index that is designed to measure equity market performance of emerging markets. The MSCI Emerging Markets Index consists of the following 24 emerging market country indexes: Brazil, Chile, China, Colombia, the Czech Republic, Egypt, Greece, Hungary, India, Indonesia, Korea, Malaysia, Mexico, Pakistan, Peru, the Philippines, Poland, Qatar, Russia, South Africa, Taiwan, Thailand, Turkey, and the United Arab Emirates.
Investors cannot invest directly in an index. The returns for the Index would be lower if they included the effects of sales charges, operating expenses of a mutual fund, or taxes that may be paid by an investor.
| | |
| 6 | | Visit our website at pgim.com/investments |
Presentation of Fund Holdings as of 10/31/20
| | | | | | |
| | | |
| Ten Largest Holdings | | Line of Business | | Country | | % of Net Assets |
| Alibaba Group Holding Ltd., ADR | | Internet & Direct Marketing Retail | | China | | 6.3% |
| MercadoLibre, Inc. | | Internet & Direct Marketing Retail | | Argentina | | 6.3% |
| Meituan (Class B Stock) | | Internet & Direct Marketing Retail | | China | | 6.1% |
| Sea Ltd., ADR | | Entertainment | | Taiwan | | 5.1% |
| Tencent Holdings Ltd. | | Interactive Media & Services | | China | | 4.5% |
| Magazine Luiza SA | | Multiline Retail | | Brazil | | 3.8% |
| Wuxi Biologics Cayman, Inc., 144A | | Life Sciences Tools & Services | | China | | 3.5% |
| Jiangsu Hengrui Medicine Co. Ltd. (Class A Stock) | | Pharmaceuticals | | China | | 3.1% |
| Li Ning Co. Ltd. | | Textiles, Apparel & Luxury Goods | | China | | 2.7% |
| JD.com, Inc., ADR | | Internet & Direct Marketing Retail | | China | | 2.5% |
Holdings reflect only long-term investments and are subject to change.
| | | | |
PGIM Jennison Emerging Markets Equity Opportunities Fund | | | 7 | |
Strategy and Performance Overview (unaudited)
How did the Fund perform?
The PGIM Jennison Emerging Markets Equity Opportunities Fund’s Class Z shares returned 45.65% in the 12-month reporting period that ended October 31, 2020, outperforming the 8.25% return of the MSCI Emerging Markets Index (the Index).
What was the market environment?
| | • | | Markets were extremely volatile during the reporting period, unsettled by US-China trade discord and the COVID-19 pandemic. |
| | • | | Stocks peaked at new highs in early 2020 and then dropped dramatically as COVID-19 spread around the globe, disrupting markets and life everywhere. |
| | • | | The realities of COVID-19 dictated daily conduct for individuals, businesses, and governments worldwide. Shelter-in-place and work-from-home policies became standard. Global infection and mortality rates reflected varying policy and social behaviors, with the number of infections and deaths highest in the US. Developing a vaccine became an overwhelming focus. |
| | • | | Markets rebounded rapidly during the period’s final months, but the pandemic’s economic damage continued to accumulate. |
What worked?
Both stock selection and sector allocations added value over the course of the reporting period. Holdings in communication services, consumer discretionary, and healthcare—the Fund’s three largest sector weightings—were especially strong contributors to outperformance. Underweighting cyclical and defensive sectors relative to the Index was also beneficial.
| | • | | In communication services: |
| | • | | Tencent Holdings Ltd. is the world’s largest video-game publisher by revenue but is best known in China for its WeChat and QQ messaging and mobile-payment apps. Jennison expects the company’s growth to be driven by its dominant position in China’s online gaming and instant messaging markets and by its growing advertising and payment service efforts. Advertising revenue gains and strong growth in its mobile-gaming and financial technology divisions should continue to drive growth, in Jennison’s view. |
| | • | | Sea Ltd., a leading Southeast Asia internet company focused on digital entertainment, continues to gain momentum as a key beneficiary of the growth in both online gaming and e-commerce transactions. COVID-19 has accelerated the shift toward the digital economy, benefitting Sea’s business across multiple fronts. |
| | |
| 8 | | Visit our website at pgim.com/investments |
| | • | | In consumer discretionary: |
| | • | | Meituan-Dianping is a Chinese consumer services marketplace website. The company has a strong growth outlook as China’s leading domestic consumption story and has improved operating margins across all business segments. Despite the continued impact and uncertainties of COVID-19, the core food delivery business should continue to show a robust recovery. |
| | • | | Mercado Libre is an online trading service based in Buenos Aires, Argentina, that enables individuals and businesses to electronically sell and buy items in thousands of categories. The company’s growth has accelerated materially since the COVID-19 pandemic began, and it is becoming increasingly clear that the digital gains from this disruption can have long-term benefits, in Jennison’s view. |
| | • | | Magazine Luiza SA, or Magalu, is one of the largest Brazilian omni-channel retailers that distributes its products through physical stores and websites. Its online sales materially accelerated during the period, and Jennison believes its diversification into new and higher-frequency retail categories should continue to attract new clients. Jennison favors the company for its healthy balance sheet and well-developed omni-channel platform, which continue to support its operations. |
What didn’t work?
| | • | | The consumer discretionary sector added value in aggregate; however, a few positions were among the Fund’s largest detractors. |
| | • | | Lojas Renner SA operates retail department stores in Brazil and is the largest apparel retailer in the country. The position was sold due to an expected downturn in the business brought on by COVID-19. |
| | • | | PT Mitra Adiperkasa Tbk, an Indonesian retail department store, detracted from returns as all mall-based stores, except supermarkets, closed for several months due to the pandemic. Jennison eliminated the position, as the reopening process has been slower than expected. |
| | • | | MakeMy Trip Ltd. is India’s largest online travel agency. While the business has been hurt by the pandemic, online market share gains, stable net revenue margins, and a shift in the company’s revenue mix toward the high-margin hotel business make it an attractive long-term investment, in Jennison’s view. |
| | • | | In healthcare, the share price of Notre Dame Intermedica Participacoes SA, a Brazilian company that provides health and dental plans, declined during the period, and the position was eliminated from the Fund when the pandemic began. The Fund subsequently bought shares again, as Jennison viewed the long-term structural drivers |
| | | | |
PGIM Jennison Emerging Markets Equity Opportunities Fund | | | 9 | |
Strategy and Performance Overview (continued)
| | for the Brazilian healthcare market and the company’s vertically integrated business model as attractive. |
| | • | | In financials, the Fund’s position in Indian bank HDFC Bank Ltd. was eliminated early in the period due to concerns over the quality of its loan portfolio. Shares were added again later to the Fund’s holdings, as Jennison likes the company’s strong capital position and liquidity and believes it is well positioned to expand its market share and sustain an attractive growth rate. |
Current outlook
| | • | | Jennison believes that many of the winners of the last few years offer differentiated and disruptive business models that are even more compelling in the current period of economic turmoil and social distancing. E-commerce companies, healthcare innovators, and digital payments systems are among the companies positioned for continued growth, in Jennison’s view. As companies and individuals in developing countries gain an enhanced appreciation of their distinct value and utility, especially in times of unprecedented disruption and restricted mobility, Jennison believes demand for and adoption of their services and products are set to accelerate, leading to greater penetration and market share gains. |
| | • | | Despite strong performance during the period, Jennison remains comfortable with portfolio level valuations and the reasons behind their expansion. The growth profiles of the companies the Fund owns remain attractive, in Jennison’s view, especially the secular growth stocks in which the Fund invests versus other segments of the market. |
| | • | | In Jennison’s view, many long-term Fund holdings continue to have solid and resilient fundamentals and should see their business models and brands prevail in the marketplace over time. Jennison believes overall conditions favor its strategy over a reasonable investment time horizon and that its bottom-up approach is the best way to navigate market volatility. |
| | • | | China, the Fund’s largest weighting by country at the end of the period, continues on its path to drive economic growth through domestic consumer demand rather than exports and massive public works programs. Fund positions in Chinese equities were focused on rapidly growing e-commerce, internet platform opportunities, and innovative healthcare companies that are less exposed to the more volatile sectors of the Chinese economy and US-China trade friction. |
| | |
| 10 | | Visit our website at pgim.com/investments |
Fees and Expenses (unaudited)
As a shareholder of the Fund, you incur two types of costs: (1) transaction costs, including sales charges (loads) on purchase payments and redemptions, as applicable, and (2) ongoing costs, including management fees, distribution, and/or service (12b-1) fees, and other Fund expenses, as applicable. This example is intended to help you understand your ongoing costs (in dollars) of investing in the Fund and to compare these costs with the ongoing costs of investing in other mutual funds.
The example is based on an investment of $1,000 held through the six-month period ended October 31, 2020. The example is for illustrative purposes only; you should consult the Fund’s Prospectus for information on initial and subsequent minimum investment requirements.
Actual Expenses
The first line for each share class in the table on the following page provides information about actual account values and actual expenses. You may use the information on this line, together with the amount you invested, to estimate the expenses that you paid over the period. Simply divide your account value by $1,000 (for example, an $8,600 account value ÷ $1,000 = 8.6), then multiply the result by the number on the first line under the heading “Expenses Paid During the Six-Month Period” to estimate the expenses you paid on your account during this period.
Hypothetical Example for Comparison Purposes
The second line for each share class in the table on the following page provides information about hypothetical account values and hypothetical expenses based on the Fund’s actual expense ratio and an assumed rate of return of 5% per year before expenses, which is not the Fund’s actual return. The hypothetical account values and expenses may not be used to estimate the actual ending account balance or expenses you paid for the period. You may use this information to compare the ongoing costs of investing in the Fund and other funds. To do so, compare this 5% hypothetical example with the 5% hypothetical examples that appear in the shareholder reports of the other funds.
The Fund’s transfer agent may charge additional fees to holders of certain accounts that are not included in the expenses shown in the table on the following page. These fees apply to individual retirement accounts (IRAs) and Section 403(b) accounts. As of the close of the six-month period covered by the table, IRA fees included an annual maintenance fee of $15 per account (subject to a maximum annual maintenance fee of $25 for all accounts held by the same shareholder). Section 403(b) accounts are charged an annual $25 fiduciary maintenance fee. Some of the fees may vary in amount, or may be waived, based on your total account balance or the number of PGIM funds, including the Fund, that you own. You should consider the additional fees that were charged to your Fund account over the six-month period when you estimate the total ongoing expenses paid over the period
| | | | |
PGIM Jennison Emerging Markets Equity Opportunities Fund | | | 11 | |
Fees and Expenses (continued)
and the impact of these fees on your ending account value, as these additional expenses are not reflected in the information provided in the expense table. Additional fees have the effect of reducing investment returns.
Please note that the expenses shown in the table are meant to highlight your ongoing costs only and do not reflect any transactional costs such as sales charges (loads). Therefore, the second line for each share class in the table is useful in comparing ongoing costs only and will not help you determine the relative total costs of owning different funds. In addition, if these transactional costs were included, your costs would have been higher.
| | | | | | | | | | | | | | | | | | |
| | | | |
PGIM
Jennison Emerging
Markets Equity
Opportunities Fund | | Beginning Account
Value
May 1, 2020 | | | Ending Account
Value
October 31, 2020 | | | Annualized
Expense Ratio
Based on the
Six-Month Period | | | Expenses Paid
During the
Six-Month Period* | |
| Class A | | Actual | | $ | 1,000.00 | | | $ | 1,475.40 | | | | 1.45 | % | | $ | 9.02 | |
| | Hypothetical | | $ | 1,000.00 | | | $ | 1,017.85 | | | | 1.45 | % | | $ | 7.35 | |
| Class C | | Actual | | $ | 1,000.00 | | | $ | 1,469.50 | | | | 2.20 | % | | $ | 13.66 | |
| | Hypothetical | | $ | 1,000.00 | | | $ | 1,014.08 | | | | 2.20 | % | | $ | 11.14 | |
| Class Z | | Actual | | $ | 1,000.00 | | | $ | 1,476.90 | | | | 1.20 | % | | $ | 7.47 | |
| | Hypothetical | | $ | 1,000.00 | | | $ | 1,019.10 | | | | 1.20 | % | | $ | 6.09 | |
| Class R6 | | Actual | | $ | 1,000.00 | | | $ | 1,476.90 | | | | 1.20 | % | | $ | 7.47 | |
| | | Hypothetical | | $ | 1,000.00 | | | $ | 1,019.10 | | | | 1.20 | % | | $ | 6.09 | |
*Fund expenses (net of fee waivers or subsidies, if any) for each share class are equal to the annualized expense ratio for each share class (provided in the table), multiplied by the average account value over the period, multiplied by the 184 days in the six-month period ended October 31, 2020, and divided by the 366 days in the Fund's fiscal year ended October 31, 2020 (to reflect the six-month period). Expenses presented in the table include the expenses of any underlying portfolios in which the Fund may invest.
| | |
| 12 | | Visit our website at pgim.com/investments |
Schedule of Investments
as of October 31, 2020
| | | | | | | | |
| | |
| Description | | Shares | | | Value | |
| | |
LONG-TERM INVESTMENTS 93.7% | | | | | | | | |
| | |
COMMON STOCKS | | | | | | | | |
| | |
Argentina 8.6% | | | | | | | | |
Globant SA*(a) | | | 7,681 | | | $ | 1,387,266 | |
MercadoLibre, Inc.* | | | 3,163 | | | | 3,840,040 | |
| | | | | | | | |
| | |
| | | | | | | 5,227,306 | |
| | |
Brazil 6.6% | | | | | | | | |
Arco Platform Ltd. (Class A Stock)* | | | 17,368 | | | | 591,902 | |
Magazine Luiza SA | | | 550,309 | | | | 2,352,596 | |
Notre Dame Intermedica Participacoes SA | | | 53,601 | | | | 612,054 | |
Raia Drogasil SA | | | 111,530 | | | | 469,215 | |
| | | | | | | | |
| | |
| | | | | | | 4,025,767 | |
| | |
China 55.0% | | | | | | | | |
Aier Eye Hospital Group Co. Ltd. (Class A Stock) | | | 123,177 | | | | 1,144,524 | |
Alibaba Group Holding Ltd., ADR* | | | 12,650 | | | | 3,854,328 | |
Alibaba Health Information Technology Ltd.* | | | 308,138 | | | | 813,648 | |
BeiGene Ltd., ADR* | | | 2,814 | | | | 834,407 | |
Bilibili, Inc., ADR* | | | 32,407 | | | | 1,447,621 | |
Burning Rock Biotech Ltd., ADR* | | | 25,563 | | | | 789,130 | |
Contemporary Amperex Technology Co. Ltd. (Class A Stock) | | | 25,600 | | | | 947,609 | |
Genetron Holdings Ltd., ADR* | | | 35,540 | | | | 358,954 | |
Glodon Co. Ltd. (Class A Stock) | | | 62,200 | | | | 660,661 | |
Hangzhou Tigermed Consulting Co. Ltd. (Class H Stock), 144A* | | | 77,605 | | | | 1,247,499 | |
Hansoh Pharmaceutical Group Co. Ltd., 144A* | | | 184,909 | | | | 829,140 | |
Innovent Biologics, Inc., 144A* | | | 151,522 | | | | 1,124,867 | |
JD.com, Inc., ADR* | | | 18,934 | | | | 1,543,500 | |
Jiangsu Hengrui Medicine Co. Ltd. (Class A Stock) | | | 144,831 | | | | 1,923,647 | |
Li Ning Co. Ltd. | | | 320,045 | | | | 1,665,957 | |
Meituan (Class B Stock)* | | | 99,783 | | | | 3,707,013 | |
Silergy Corp. | | | 25,000 | | | | 1,542,926 | |
Tencent Holdings Ltd. | | | 36,126 | | | | 2,752,553 | |
Weimob, Inc., 144A*(a) | | | 499,323 | | | | 643,933 | |
Wuliangye Yibin Co. Ltd. (Class A Stock) | | | 24,600 | | | | 896,937 | |
WuXi AppTec Co. Ltd. (Class H Stock), 144A(a) | | | 92,096 | | | | 1,479,435 | |
Wuxi Biologics Cayman, Inc., 144A* | | | 75,451 | | | | 2,119,862 | |
Zai Lab Ltd., ADR* | | | 14,998 | | | | 1,230,586 | |
| | | | | | | | |
| | |
| | | | | | | 33,558,737 | |
| | |
India 5.1% | | | | | | | | |
Asian Paints Ltd. | | | 21,045 | | | | 628,649 | |
HDFC Bank Ltd., ADR* | | | 12,650 | | | | 726,616 | |
See Notes to Financial Statements.
| | | | |
| PGIM Jennison Emerging Markets Equity Opportunities Fund | | | 13 | |
Schedule of Investments (continued)
as of October 31, 2020
| | | | | | | | |
| | |
| Description | | Shares | | | Value | |
| | |
COMMON STOCKS (Continued) | | | | | | | | |
| | |
India (cont’d.) | | | | | | | | |
Hindustan Unilever Ltd. | | | 20,278 | | | $ | 566,515 | |
MakeMyTrip Ltd.*(a) | | | 64,375 | | | | 1,208,319 | |
| | | | | | | | |
| | |
| | | | | | | 3,130,099 | |
| | |
Indonesia 0.9% | | | | | | | | |
Ace Hardware Indonesia Tbk PT | | | 5,314,239 | | | | 568,847 | |
| | |
Poland 1.6% | | | | | | | | |
Dino Polska SA, 144A* | | | 17,952 | | | | 984,979 | |
| | |
South Korea 6.1% | | | | | | | | |
Kakao Corp. | | | 3,805 | | | | 1,106,087 | |
NAVER Corp. | | | 5,130 | | | | 1,314,055 | |
Samsung SDI Co. Ltd. | | | 3,294 | | | | 1,286,661 | |
| | | | | | | | |
| | |
| | | | | | | 3,706,803 | |
| | |
Taiwan 9.2% | | | | | | | | |
MediaTek, Inc. | | | 44,000 | | | | 1,043,744 | |
Sea Ltd., ADR* | | | 19,653 | | | | 3,099,278 | |
Taiwan Semiconductor Manufacturing Co. Ltd., ADR | | | 17,548 | | | | 1,471,751 | |
| | | | | | | | |
| | |
| | | | | | | 5,614,773 | |
| | |
Thailand 0.6% | | | | | | | | |
Minor International PCL* | | | 640,658 | | | | 344,018 | |
| | | | | | | | |
| | |
TOTAL LONG-TERM INVESTMENTS
(cost $38,920,276) | | | | | | | 57,161,329 | |
| | | | | | | | |
| | |
SHORT-TERM INVESTMENTS 15.8% | | | | | | | | |
| | |
AFFILIATED MUTUAL FUNDS | | | | | | | | |
PGIM Core Ultra Short Bond Fund(w) | | | 5,578,205 | | | | 5,578,205 | |
See Notes to Financial Statements.
| | | | | | | | |
| | |
| Description | | Shares | | | Value | |
| | |
AFFILIATED MUTUAL FUNDS (Continued) | | | | | | | | |
PGIM Institutional Money Market Fund
(cost $4,072,159; includes $4,071,290 of cash collateral for securities on loan)(b)(w) | | | 4,073,983 | | | $ | 4,072,761 | |
| | | | | | | | |
| | |
TOTAL SHORT-TERM INVESTMENTS
(cost $9,650,364) | | | | | | | 9,650,966 | |
| | | | | | | | |
| | |
TOTAL INVESTMENTS 109.5%
(cost $48,570,640) | | | | | | | 66,812,295 | |
Liabilities in excess of other assets (9.5)% | | | | | | | (5,772,188 | ) |
| | | | | | | | |
| | |
NET ASSETS 100.0% | | | | | | $ | 61,040,107 | |
| | | | | | | | |
Below is a list of the abbreviation(s) used in the annual report:
144A—Security was purchased pursuant to Rule 144A under the Securities Act of 1933 and, pursuant to the requirements of Rule 144A, may not be resold except to qualified institutional buyers.
ADR—American Depositary Receipt
LIBOR—London Interbank Offered Rate
| * | Non-income producing security. |
| (a) | All or a portion of security is on loan. The aggregate market value of such securities, including those sold and pending settlement, is $3,937,327; cash collateral of $4,071,290 (included in liabilities) was received with which the Series purchased highly liquid short-term investments. In the event of significant appreciation in value of securities on loan on the last business day of the reporting period, the Series may reflect a collateral value that is less than the market value of the loaned securities and such shortfall is remedied the following business day. |
| (b) | Represents security, or portion thereof, purchased with cash collateral received for securities on loan and includes dividend reinvestment. |
| (w) | PGIM Investments LLC, the manager of the Series, also serves as manager of the PGIM Core Ultra Short Bond Fund and PGIM Institutional Money Market Fund. |
Fair Value Measurements:
Various inputs are used in determining the value of the Series’ investments. These inputs are summarized in the three broad levels listed below.
Level 1—unadjusted quoted prices generally in active markets for identical securities.
Level 2—quoted prices for similar securities, interest rates and yield curves, prepayment speeds, foreign currency exchange rates and other observable inputs.
Level 3—unobservable inputs for securities valued in accordance with Board approved fair valuation procedures.
The following is a summary of the inputs used as of October 31, 2020 in valuing such portfolio securities:
| | | | | | | | | | | | |
| | | Level 1 | | | Level 2 | | | Level 3 | |
Investments in Securities | | | | | | | | | | | | |
Assets | | | | | | | | | | | | |
Common Stocks | | | | | | | | | | | | |
Argentina | | $ | 5,227,306 | | | $ | — | | | | $— | |
See Notes to Financial Statements.
| | | | |
| PGIM Jennison Emerging Markets Equity Opportunities Fund | | | 15 | |
Schedule of Investments (continued)
as of October 31, 2020
| | | | | | | | | | | | | | | |
| | | Level 1 | | Level 2 | | Level 3 |
Investments in Securities (continued) | | | | | | | | | | | | | | | |
Assets (continued) | | | | | | | | | | | | | | | |
Common Stocks (continued) | | | | | | | | | | | | | | | |
Brazil | | | $ | 4,025,767 | | | | $ | — | | | | | $— | |
China | | | | 10,058,526 | | | | | 23,500,211 | | | | | — | |
India | | | | 1,934,935 | | | | | 1,195,164 | | | | | — | |
Indonesia | | | | — | | | | | 568,847 | | | | | — | |
Poland | | | | — | | | | | 984,979 | | | | | — | |
South Korea | | | | — | | | | | 3,706,803 | | | | | — | |
Taiwan | | | | 4,571,029 | | | | | 1,043,744 | | | | | — | |
Thailand | | | | — | | | | | 344,018 | | | | | — | |
Affiliated Mutual Funds | | | | 9,650,966 | | | | | — | | | | | — | |
| | | | | | | | | | | | | | | |
Total | | | $ | 35,468,529 | | | | $ | 31,343,766 | | | | | $— | |
| | | | | | | | | | | | | | | |
Industry Classification:
The industry classification of investments and liabilities in excess of other assets shown as a percentage of net assets as of October 31, 2020 were as follows (unaudited):
| | | | |
Internet & Direct Marketing Retail | | | 23.2 | % |
Affiliated Mutual Funds (6.7% represents investments purchased with collateral from securities on loan) | | | 15.8 | |
Interactive Media & Services | | | 8.5 | |
Life Sciences Tools & Services | | | 7.9 | |
Entertainment | | | 7.5 | |
Biotechnology | | | 7.1 | |
Semiconductors & Semiconductor Equipment | | | 6.6 | |
Pharmaceuticals | | | 4.5 | |
Software | | | 4.5 | |
Multiline Retail | | | 3.8 | |
Health Care Providers & Services | | | 2.9 | |
Textiles, Apparel & Luxury Goods | | | 2.7 | |
Food & Staples Retailing | | | 2.4 | |
Electronic Equipment, Instruments & Components | | | 2.1 | |
| | | | |
Electrical Equipment | | | 1.6 | % |
Beverages | | | 1.5 | |
Health Care Technology | | | 1.3 | |
Banks | | | 1.2 | |
Chemicals | | | 1.0 | |
Diversified Consumer Services | | | 1.0 | |
Specialty Retail | | | 0.9 | |
Household Products | | | 0.9 | |
Hotels, Restaurants & Leisure | | | 0.6 | |
| | | | |
| | | 109.5 | |
Liabilities in excess of other assets | | | (9.5 | ) |
| | | | |
| |
| | | 100.0 | % |
| | | | |
Financial Instruments/Transactions—Summary of Offsetting and Netting Arrangements:
The Series entered into financial instruments/transactions during the reporting period that are either offset in accordance with current requirements or are subject to enforceable master netting arrangements or similar agreements that permit offsetting. The information about offsetting and related netting arrangements for financial instruments/transactions where the legal right to set-off exists is presented in the summary below.
See Notes to Financial Statements.
Offsetting of financial instrument/transaction assets and liabilities:
| | | | | | | | | | | | | | | |
Description | | Gross Market
Value of
Recognized
Assets/(Liabilities) | | Collateral
Pledged/(Received)(1) | | Net
Amount |
Securities on Loan | | | | $3,937,327 | | | | $ | (3,937,327 | ) | | | $ | — | |
| | | | | | | | | | | | | | | |
| (1) | Collateral amount disclosed by the Series is limited to the market value of financial instruments/transactions. |
See Notes to Financial Statements.
| | | | |
| PGIM Jennison Emerging Markets Equity Opportunities Fund | | | 17 | |
Statement of Assets and Liabilities
as of October 31, 2020
| | | | |
Assets | | | | |
Investments at value, including securities on loan of $3,937,327: | | | | |
Unaffiliated investments (cost $38,920,276) | | $ | 57,161,329 | |
Affiliated investments (cost $9,650,364) | | | 9,650,966 | |
Foreign currency, at value (cost $1,285,515) | | | 1,285,515 | |
Receivable for Series shares sold | | | 1,001,984 | |
Receivable for investments sold | | | 407,805 | |
Dividends receivable | | | 7,026 | |
Due from Manager | | | 4,384 | |
Prepaid expenses | | | 3,601 | |
| | | | |
Total Assets | | | 69,522,610 | |
| | | | |
| |
Liabilities | | | | |
Payable to broker for collateral for securities on loan | | | 4,071,290 | |
Payable for investments purchased | | | 3,409,327 | |
Payable for Series shares reacquired | | | 915,379 | |
Accrued expenses and other liabilities | | | 77,442 | |
Foreign capital gains tax liability accrued | | | 4,027 | |
Distribution fee payable | | | 2,618 | |
Affiliated transfer agent fee payable | | | 1,517 | |
Directors’ fees payable | | | 903 | |
| | | | |
Total Liabilities | | | 8,482,503 | |
| | | | |
| |
Net Assets | | $ | 61,040,107 | |
| | | | |
| |
| | | | | |
Net assets were comprised of: | | | | |
Common stock, at par | | $ | 34,152 | |
Paid-in capital in excess of par | | | 44,190,300 | |
Total distributable earnings (loss) | | | 16,815,655 | |
| | | | |
Net assets, October 31, 2020 | | $ | 61,040,107 | |
| | | | |
See Notes to Financial Statements.
| | | | |
Class A | | | | |
Net asset value and redemption price per share,
($6,144,165 ÷ 347,840 shares of common stock issued and outstanding) | | $ | 17.66 | |
Maximum sales charge (5.50% of offering price) | | | 1.03 | |
| | | | |
Maximum offering price to public | | $ | 18.69 | |
| | | | |
| |
Class C | | | | |
Net asset value, offering price and redemption price per share,
($1,563,487 ÷ 92,649 shares of common stock issued and outstanding) | | $ | 16.88 | |
| | | | |
| |
Class Z | | | | |
Net asset value, offering price and redemption price per share,
($34,992,735 ÷ 1,951,764 shares of common stock issued and outstanding) | | $ | 17.93 | |
| | | | |
| |
Class R6 | | | | |
Net asset value, offering price and redemption price per share,
($18,339,720 ÷ 1,022,931 shares of common stock issued and outstanding) | | $ | 17.93 | |
| | | | |
See Notes to Financial Statements.
| | | | |
| PGIM Jennison Emerging Markets Equity Opportunities Fund | | | 19 | |
Statement of Operations
Year Ended October 31, 2020
| | | | |
Net Investment Income (Loss) | | | | |
Income | | | | |
Unaffiliated dividend income (net of $17,072 foreign withholding tax) | | $ | 111,728 | |
Affiliated dividend income | | | 10,942 | |
Income from securities lending, net (including affiliated income of $6,604) | | | 10,550 | |
| | | | |
Total income | | | 133,220 | |
| | | | |
| |
Expenses | | | | |
Management fee | | | 326,439 | |
Distribution fee(a) | | | 25,961 | |
Custodian and accounting fees | | | 83,053 | |
Registration fees(a) | | | 74,780 | |
Audit fee | | | 29,662 | |
Transfer agent’s fees and expenses (including affiliated expense of $8,176)(a) | | | 27,878 | |
Legal fees and expenses | | | 19,344 | |
Shareholders’ reports | | | 11,277 | |
Directors’ fees | | | 10,914 | |
Miscellaneous | | | 30,752 | |
| | | | |
Total expenses | | | 640,060 | |
Less: Fee waiver and/or expense reimbursement(a) | | | (241,027 | ) |
Distribution fee waiver(a) | | | (2,253 | ) |
| | | | |
Net expenses | | | 396,780 | |
| | | | |
Net investment income (loss) | | | (263,560 | ) |
| | | | |
| |
Realized And Unrealized Gain (Loss) On Investment And Foreign Currency Transactions | | | | |
Net realized gain (loss) on: | | | | |
Investment transactions (including affiliated of $(72)) (net of foreign capital gains taxes $(3,773)) | | | 737,606 | |
Foreign currency transactions | | | (37,415 | ) |
| �� | | | |
| | | 700,191 | |
| | | | |
Net change in unrealized appreciation (depreciation) on: | | | | |
Investments (including affiliated of $383) (net of change in foreign capital gains taxes $25,603) | | | 12,806,329 | |
Foreign currencies | | | (3,976 | ) |
| | | | |
| | | 12,802,353 | |
| | | | |
Net gain (loss) on investment and foreign currency transactions | | | 13,502,544 | |
| | | | |
Net Increase (Decrease) In Net Assets Resulting From Operations | | $ | 13,238,984 | |
| | | | |
| (a) | Class specific expenses and waivers were as follows: |
| | | | | | | | | | | | | | | | |
| | | Class A | | | Class C | | | Class Z | | | Class R6 | |
Distribution fee | | | 13,520 | | | | 12,441 | | | | — | | | | — | |
Registration fees | | | 17,070 | | | | 17,070 | | | | 23,570 | | | | 17,070 | |
Transfer agent’s fees and expenses | | | 11,311 | | | | 1,155 | | | | 15,289 | | | | 123 | |
Fee waiver and/or expense reimbursement | | | (50,007 | ) | | | (24,243 | ) | | | (81,731 | ) | | | (85,046 | ) |
Distribution fee waiver | | | (2,253 | ) | | | — | | | | — | | | | — | |
See Notes to Financial Statements.
Statements of Changes in Net Assets
| | | | | | | | |
| | | Year Ended
October 31, | |
| | |
| | | 2020 | | | 2019 | |
| | |
Increase (Decrease) in Net Assets | | | | | | | | |
Operations | | | | | | | | |
Net investment income (loss) | | $ | (263,560 | ) | | $ | (39,894 | ) |
Net realized gain (loss) on investment and foreign currency transactions | | | 700,191 | | | | 435,532 | |
Net change in unrealized appreciation (depreciation) on investments and foreign currencies | | | 12,802,353 | | | | 3,689,760 | |
| | | | | | | | |
Net increase (decrease) in net assets resulting from operations | | | 13,238,984 | | | | 4,085,398 | |
| | | | | | | | |
Series share transactions (Net of share conversions) | | | | | | | | |
Net proceeds from shares sold | | | 33,021,175 | | | | 2,787,608 | |
Cost of shares reacquired | | | (4,808,707 | ) | | | (1,852,092 | ) |
| | | | | | | | |
Net increase (decrease) in net assets from Series share transactions | | | 28,212,468 | | | | 935,516 | |
| | | | | | | | |
Total increase (decrease) | | | 41,451,452 | | | | 5,020,914 | |
| | |
Net Assets: | | | | | | | | |
Beginning of year | | | 19,588,655 | | | | 14,567,741 | |
| | | | | | | | |
End of year | | $ | 61,040,107 | | | $ | 19,588,655 | |
| | | | | | | | |
See Notes to Financial Statements.
| | | | |
| PGIM Jennison Emerging Markets Equity Opportunities Fund | | | 21 | |
Notes to Financial Statements
Prudential World Fund, Inc. (the “Fund”) is registered under the Investment Company Act of 1940, as amended (“1940 Act”), as an open-end management investment company and currently consists of seven series: PGIM Jennison Emerging Markets Equity Opportunities Fund, PGIM Jennison Global Infrastructure Fund, PGIM Jennison Global Opportunities Fund, PGIM Jennison International Opportunities Fund and PGIM QMA International Equity Fund, each of which are diversified funds for purposes of the 1940 Act and PGIM Emerging Markets Debt Hard Currency Fund and PGIM Emerging Markets Debt Local Currency Fund, each of which are non-diversified funds for purposes of the 1940 Act, and therefore, may invest a greater percentage of their assets in the securities of a single company or other issuer than a diversified fund. Investing in a non-diversified fund involves greater risk than investing in a diversified fund because a loss resulting from the decline in value of any one security may represent a greater portion of the total assets of a non-diversified fund. These financial statements relate only to the PGIM Jennison Emerging Markets Equity Opportunities Fund (the “Series”).
The investment objective of the Series is to seek long-term growth of capital.
The Series follows the investment company accounting and reporting guidance of the Financial Accounting Standards Board (“FASB”) Accounting Standard Codification (“ASC”) Topic 946 Financial Services — Investment Companies. The following accounting policies conform to U.S. generally accepted accounting principles. The Series consistently follows such policies in the preparation of its financial statements.
Securities Valuation: The Series holds securities and other assets and liabilities that are fair valued at the close of each day (generally, 4:00 PM Eastern time) the New York Stock Exchange (“NYSE”) is open for trading. Fair value is the price that would be received to sell an asset or paid to transfer a liability in an orderly transaction between market participants on the measurement date. The Fund’s Board of Directors (the “Board”) has adopted valuation procedures for security valuation under which fair valuation responsibilities have been delegated to PGIM Investments LLC (“PGIM Investments” or the “Manager”). Pursuant to the Board’s delegation, the Manager has established a Valuation Committee responsible for supervising the fair valuation of portfolio securities and other assets and liabilities. The valuation procedures permit the Series to utilize independent pricing vendor services, quotations from market makers, and alternative valuation methods when market quotations are either not readily available or not deemed representative of fair value. A record of the Valuation Committee’s actions is subject to the Board’s review, approval, and ratification at its next regularly scheduled quarterly meeting.
For the fiscal reporting year-end, securities and other assets and liabilities were fair valued at the close of the last U.S. business day. Trading in certain foreign securities may occur when the NYSE is closed (including weekends and holidays). Because such foreign securities trade in markets that are open on weekends and U.S. holidays, the values of some of the Series’ foreign investments may change on days when investors cannot purchase or redeem Series shares.
Various inputs determine how the Series’ investments are valued, all of which are categorized according to the three broad levels (Level 1, 2, or 3) detailed in the Schedule of Investments and referred to herein as the “fair value hierarchy” in accordance with FASB ASC Topic 820 - Fair Value Measurements and Disclosures.
Common or preferred stocks, exchange-traded funds and derivative instruments, if applicable, that are traded on a national securities exchange are valued at the last sale price as of the close of trading on the applicable exchange where the security principally trades. Securities traded via NASDAQ are valued at the NASDAQ official closing price. To the extent these securities are valued at the last sale price or NASDAQ official closing price, they are classified as Level 1 in the fair value hierarchy. In the event that no sale or official closing price on valuation date exists, these securities are generally valued at the mean between the last reported bid and ask prices, or at the last bid price in the absence of an ask price. These securities are classified as Level 2 in the fair value hierarchy.
Foreign equities traded on foreign securities exchanges are generally valued using pricing vendor services that provide model prices derived using adjustment factors based on information such as local closing price, relevant general and sector indices, currency fluctuations, depositary receipts, and futures, as applicable. Securities valued using such model prices are classified as Level 2 in the fair value hierarchy. The models generate an evaluated adjustment factor for each security, which is applied to the local closing price to adjust it for post closing market movements up to the time the Series is valued. Utilizing that evaluated adjustment factor, the vendor provides an evaluated price for each security. If the vendor does not provide an evaluated price, securities are valued in accordance with exchange-traded common and preferred stock valuation policies discussed above.
Investments in open-end funds (other than exchange-traded funds) are valued at their net asset values as of the close of the NYSE on the date of valuation. These securities are classified as Level 1 in the fair value hierarchy since they may be purchased or sold at their net asset values on the date of valuation.
Securities and other assets that cannot be priced according to the methods described above are valued based on pricing methodologies approved by the Board. In the event that unobservable inputs are used when determining such valuations, the securities will be classified as Level 3 in the fair value hierarchy.
When determining the fair value of securities, some of the factors influencing the valuation include: the nature of any restrictions on disposition of the securities; assessment of the
| | | | |
| PGIM Jennison Emerging Markets Equity Opportunities Fund | | | 23 | |
Notes to Financial Statements (continued)
general liquidity of the securities; the issuer’s financial condition and the markets in which it does business; the cost of the investment; the size of the holding and the capitalization of the issuer; the prices of any recent transactions or bids/offers for such securities or any comparable securities; any available analyst media or other reports or information deemed reliable by the Manager regarding the issuer or the markets or industry in which it operates. Using fair value to price securities may result in a value that is different from a security’s most recent closing price and from the price used by other unaffiliated mutual funds to calculate their net asset values.
Foreign Currency Translation: The books and records of the Series are maintained in U.S. dollars. Foreign currency amounts are translated into U.S. dollars on the following basis:
(i) market value of investment securities, other assets and liabilities — at the current rates of exchange;
(ii) purchases and sales of investment securities, income and expenses — at the rates of exchange prevailing on the respective dates of such transactions.
Although the net assets of the Series are presented at the foreign exchange rates and market values at the close of the period, the Series does not generally isolate that portion of the results of operations arising as a result of changes in the foreign exchange rates from the fluctuations arising from changes in the market prices of long-term portfolio securities held at the end of the period. Similarly, the Series does not isolate the effect of changes in foreign exchange rates from the fluctuations arising from changes in the market prices of long-term portfolio securities sold during the period. Accordingly, holding period realized foreign currency gains (losses) are included in the reported net realized gains (losses) on investment transactions.
Net realized gains (losses) on foreign currency transactions represent net foreign exchange gains (losses) from the disposition of holdings of foreign currencies, currency gains (losses) realized between the trade and settlement dates on investment transactions, and the difference between the amounts of interest, dividends and foreign withholding taxes recorded on the Series’ books and the U.S. dollar equivalent amounts actually received or paid. Net unrealized currency gains (losses) arise from valuing foreign currency denominated assets and liabilities (other than investments) at period end exchange rates.
Master Netting Arrangements: The Fund, on behalf of the Series, is subject to various Master Agreements, or netting arrangements, with select counterparties. These are agreements which a subadviser may have negotiated and entered into on behalf of all or a portion of the Series. A master netting arrangement between the Series and the counterparty permits the Series to offset amounts payable by the Series to the same counterparty against
amounts to be received; and by the receipt of collateral from the counterparty by the Series to cover the Series’ exposure to the counterparty. However, there is no assurance that such mitigating factors are easily enforceable. In addition to master netting arrangements, the right to set-off exists when all the conditions are met such that each of the parties owes the other determinable amounts, the reporting party has the right to set-off the amount owed with the amount owed by the other party, the reporting party intends to set-off and the right of set-off is enforceable by law. During the reporting period, there was no intention to settle on a net basis and all amounts are presented on a gross basis on the Statement of Assets and Liabilities.
Securities Lending: The Series lends its portfolio securities to banks and broker-dealers. The loans are secured by collateral at least equal to the market value of the securities loaned. Collateral pledged by each borrower is invested in an affiliated money market fund and is marked to market daily, based on the previous day’s market value, such that the value of the collateral exceeds the value of the loaned securities. In the event of significant appreciation in value of securities on loan on the last business day of the reporting period, the financial statements may reflect a collateral value that is less than the market value of the loaned securities. Such shortfall is remedied as described above. Loans are subject to termination at the option of the borrower or the Series. Upon termination of the loan, the borrower will return to the Series securities identical to the loaned securities. Should the borrower of the securities fail financially, the Series has the right to repurchase the securities in the open market using the collateral.
The Series recognizes income, net of any rebate and securities lending agent fees, for lending its securities in the form of fees or interest on the investment of any cash received as collateral. The borrower receives all interest and dividends from the securities loaned and such payments are passed back to the lender in amounts equivalent thereto, which are reflected in interest income or unaffiliated dividend income based upon the nature of the payment on the Statement of Operations. The Series also continues to recognize any unrealized gain (loss) in the market price of the securities loaned and on the change in the value of the collateral invested that may occur during the term of the loan. In addition, realized gain (loss) is recognized on changes in the value of the collateral invested upon liquidation of the collateral. Net earnings from securities lending are disclosed in the Statement of Operations.
Securities Transactions and Net Investment Income: Securities transactions are recorded on the trade date. Realized gains (losses) from investment and currency transactions are calculated on the specific identification method. Dividend income is recorded on the ex-date, or for certain foreign securities, when the Series becomes aware of such dividends. Expenses are recorded on an accrual basis, which may require the use of certain estimates by management that may differ from actual. Net investment income or loss (other than class specific expenses and waivers, which are allocated as noted below) and unrealized and realized gains (losses) are allocated daily to each class of shares based upon the relative proportion of adjusted net assets of each class at the beginning of the day. Class specific expenses and waivers, where applicable, are charged to the respective share classes. Class
| | | | |
| PGIM Jennison Emerging Markets Equity Opportunities Fund | | | 25 | |
Notes to Financial Statements (continued)
specific expenses include distribution fees and distribution fee waivers, shareholder servicing fees, transfer agent’s fees and expenses, registration fees and fee waivers and/or expense reimbursements, as applicable.
Taxes: It is the Series’ policy to continue to meet the requirements of the Internal Revenue Code applicable to regulated investment companies and to distribute all of its taxable net investment income and capital gains, if any, to its shareholders. Therefore, no federal income tax provision is required. Withholding taxes on foreign dividends, interest and capital gains, if any, are recorded, net of reclaimable amounts, at the time the related income is earned.
The Series is subject to foreign income taxes imposed by certain countries in which it invests. Additionally, capital gains realized upon disposition of securities issued in or by certain foreign countries are subject to capital gains tax imposed by those countries. All taxes are computed in accordance with the applicable foreign tax law, and, to the extent permitted, capital losses are used to offset capital gains. Taxes attributable to income are accrued by the Series as a reduction of income. Current and deferred tax expense attributable to capital gains is reflected as a component of realized or change in unrealized gain/loss on securities in the accompanying financial statements. To the extent that the Series has country specific capital loss carryforwards, such carryforwards are applied against net unrealized gains when determining the deferred tax liability. Any deferred tax liability incurred by the Series is included in either Other liabilities or Deferred tax liability on the accompanying Statement of Assets and Liabilities.
Dividends and Distributions: The Series expects to pay dividends from net investment income and distributions from net realized capital and currency gains, if any, annually. Dividends and distributions to shareholders, which are determined in accordance with federal income tax regulations and which may differ from generally accepted accounting principles, are recorded on the ex-date. Permanent book/tax differences relating to income and gain (loss) are reclassified between total distributable earnings (loss) and paid-in capital in excess of par, as appropriate.
Estimates: The preparation of financial statements requires management to make estimates and assumptions that affect the reported amounts and disclosures in the financial statements. Actual results could differ from those estimates.
The Fund, on behalf of the Series, has a management agreement with the Manager. Pursuant to this agreement, the Manager has responsibility for all investment advisory services and supervises the subadviser’s performance of such services. In addition, under
the management agreement, the Manager provides all of the administrative functions necessary for the organization, operation and management of the Series. The Manager administers the corporate affairs of the Series and, in connection therewith, furnishes the Series with office facilities, together with those ordinary clerical and bookkeeping services which are not being furnished by the Series’ custodian and the Series’ transfer agent. The Manager is also responsible for the staffing and management of dedicated groups of legal, marketing, compliance and related personnel necessary for the operation of the Series. The legal, marketing, compliance and related personnel are also responsible for the management and oversight of the various service providers to the Series, including, but not limited to, the custodian, transfer agent, and accounting agent.
The Manager has entered into a subadvisory agreement with Jennison Associates LLC (“Jennison”). The subadvisory agreement provides that Jennison will furnish investment advisory services in connection with the management of the Series. In connection therewith, Jennison is obligated to keep certain books and records of the Series. The Manager pays for the services of Jennison, the cost of compensation of officers of the Series, occupancy and certain clerical and bookkeeping costs of the Series. The Series bears all other costs and expenses.
The management fee paid to the Manager is accrued daily and payable monthly at an annual rate of 1.05% of the Series’ average daily net assets up to $5 billion and 1.025% of the Series’ average daily net assets in excess of $5 billion. The effective management fee rate before any waivers and/or expense reimbursements was 1.05% for the year ended October 31, 2020.
The Manager has contractually agreed, through February 28, 2022, to limit total annual operating expenses after fee waivers and/or expense reimbursements to 1.45% of average daily net assets for Class A shares, 2.20% of average daily net assets for Class C shares, 1.20% of average daily net assets for Class Z shares and 1.20% of average daily net assets for Class R6 shares. The contractual waiver excludes interest, brokerage, taxes (such as income and foreign withholding taxes, stamp duty and deferred tax expenses), acquired fund fees and expenses, extra ordinary expenses and certain other Series expenses such as dividend and interest expense and broker charges on short sales.
Where applicable, the Manager agrees to waive management fees or shared operating expenses on any share class to the same extent that it waives such expenses on any other share class. In addition, total annual operating expenses for Class R6 shares will not exceed total annual operating expenses for Class Z shares. Fees and/or expenses waived and/or reimbursed by the Manager may be recouped by the Manager within the same fiscal year during which such waiver and/or reimbursement is made if such recoupment can be realized without exceeding the expense limit in effect at the time of the recoupment for that fiscal year.
The Fund, on behalf of the Series, has a distribution agreement with Prudential Investment Management Services LLC (“PIMS”), which acts as the distributor of the Class A, Class C,
| | | | |
| PGIM Jennison Emerging Markets Equity Opportunities Fund | | | 27 | |
Notes to Financial Statements (continued)
Class Z and Class R6 shares of the Series. The Series compensates PIMS for distributing and servicing the Series’ Class A and Class C shares, pursuant to the plans of distribution (the “Distribution Plans”), regardless of expenses actually incurred by PIMS. The distribution fees are accrued daily and payable monthly. No distribution or service fees are paid to PIMS as distributor of the Class Z and Class R6 shares of the Series.
Pursuant to the Distribution Plans, the Series compensates PIMS for distribution related activities at an annual rate of up to 0.30% and 1% of the average daily net assets of the Class A and Class C shares, respectively. PIMS has contractually agreed through February 28, 2022 to limit such fee to 0.25% of the average daily net assets of the Class A shares.
For the year ended October 31, 2020, PIMS received $20,556 in front-end sales charges resulting from sales of Class A shares. Additionally, for the year ended October 31, 2020, PIMS received $51 in contingent deferred sales charges imposed upon redemptions by certain Class C shareholders. From these fees, PIMS paid such sales charges to broker-dealers, who in turn paid commissions to salespersons and incurred other distribution costs.
PGIM Investments, PIMS and Jennison are indirect, wholly-owned subsidiaries of Prudential Financial, Inc. (“Prudential”).
| 4. | Other Transactions with Affiliates |
Prudential Mutual Fund Services LLC (“PMFS”), an affiliate of PGIM Investments and an indirect, wholly-owned subsidiary of Prudential, serves as the Series’ transfer agent. Transfer agent’s fees and expenses in the Statement of Operations include certain out-of-pocket expenses paid to non-affiliates, where applicable.
The Series may invest its overnight sweep cash in the PGIM Core Ultra Short Bond Fund (the “Core Fund”), and its securities lending cash collateral in the PGIM Institutional Money Market Fund (the “Money Market Fund”), each a series of Prudential Investment Portfolios 2, registered under the 1940 Act and managed by PGIM Investments. Through the Series’ investments in the mentioned underlying funds, PGIM Investments and/or its affiliates are paid fees or reimbursed for providing their services. In addition to the realized and unrealized gains on investments in the Core Fund and Money Market Fund, earnings from such investments are disclosed on the Statement of Operations as “Affiliated dividend income” and “Income from securities lending, net”, respectively.
The Series may enter into certain securities purchase or sale transactions under Board approved Rule 17a-7 procedures. Rule 17a-7 is an exemptive rule under the 1940 Act, that
subject to certain conditions, permits purchase and sale transactions among affiliated investment companies, or between an investment company and a person that is affiliated solely by reason of having a common (or affiliated) investment adviser, common directors, and/or common officers. Pursuant to the Rule 17a-7 procedures and consistent with guidance issued by the Securities and Exchange Commission (“SEC”), the Fund’s Chief Compliance Officer (“CCO”) prepares a quarterly summary of all such transactions for submission to the Board, together with the CCO’s written representation that all such 17a-7 transactions were effected in accordance with the Series’ Rule 17a-7 procedures. For the year ended October 31, 2020, no 17a-7 transactions were entered into by the Series.
The aggregate cost of purchases and proceeds from sales of portfolio securities (excluding short-term investments and U.S. Government securities) for the year ended October 31, 2020, were $42,498,482 and $17,600,290, respectively.
A summary of the cost of purchases and proceeds from sales of shares of affiliated investments for the year ended October 31, 2020, is presented as follows:
| | | | | | | | | | | | | | | | | | | | | | | | | | | | | | |
Value, Beginning of Year | | | Cost of
Purchases | | | Proceeds
from Sales | | | Change in
Unrealized
Gain
(Loss) | | | Realized
Gain
(Loss) | | | Value,
End of Year | | | Shares,
End
of Year | | | Income | |
| | | | |
| | PGIM Core Ultra Short Bond Fund* | | | | | | | | | | | | | | | | | |
| $ | 980,284 | | | $ | 32,670,037 | | | $ | 28,072,116 | | | $ | — | | | $ | — | | | $ | 5,578,205 | | | | 5,578,205 | | | $ | 10,942 | |
| | | | |
| | PGIM Institutional Money Market Fund* | | | | | | | | | | | | | | | | | |
| | 840,097 | | | | 25,395,196 | | | | 22,162,843 | | | | 383 | | | | (72 | ) | | | 4,072,761 | | | | 4,073,983 | | | | 6,604 | ** |
| | | | | | | | | | | | | | | | | | | | | | | | | | | | | | |
| $ | 1,820,381 | | | $ | 58,065,233 | | | $ | 50,234,959 | | | $ | 383 | | | $ | (72 | ) | | $ | 9,650,966 | | | | | | | $ | 17,546 | |
| | | | | | | | | | | | | | | | | | | | | | | | | | | | | | |
| * | The Fund did not have any capital gain distributions during the reporting period. |
| ** | The amount, or a portion thereof, represents the affiliated securities lending income shown on the Statement of Operations. |
| 6. | Distributions and Tax Information |
Distributions to shareholders, which are determined in accordance with federal income tax regulations and which may differ from generally accepted accounting principles, are recorded on the ex-date. In order to present total distributable earnings (loss) and paid-in capital in excess of par on the Statement of Assets and Liabilities that more closely represent their tax character, certain adjustments have been made to total distributable earnings (loss) and paid-in capital in excess of par. For the tax year ended October 31, 2020, the adjustments were to increase total distributable earnings and decrease paid-in capital in excess of par by $80,906 due to a net operating loss. Net investment income, net realized gain (loss) on investments and foreign currency transactions and net assets were not affected by this change.
| | | | |
| PGIM Jennison Emerging Markets Equity Opportunities Fund | | | 29 | |
Notes to Financial Statements (continued)
For the fiscal years ended October 31, 2020, and October 31, 2019, there were no distributions paid by the Series.
As of October 31, 2020, there were no accumulated undistributed earnings on a tax basis.
The United States federal income tax basis of the Series’ investments and the net unrealized appreciation as of October 31, 2020 were as follows:
| | | | | | |
Tax Basis | | Gross
Unrealized
Appreciation | | Gross
Unrealized
Depreciation | | Net
Unrealized
Appreciation |
| $48,663,196 | | $19,374,683 | | $(1,225,584) | | $18,149,099 |
The book basis may differ from tax basis due to deferred losses on wash sales.
For federal income tax purposes, the Series had a capital loss carryforward as of October 31, 2020 of approximately $1,093,000 which can be carried forward for an unlimited period.The Fund utilized approximately $826,000 of its capital loss carryforward to offset net taxable gains realized in the fiscal year ended October 31, 2020. No capital gains distributions are expected to be paid to shareholders until net gains have been realized in excess of such losses.
The Series elected to treat late year ordinary income losses of approximately $240,000 as having been incurred in the following fiscal year (October 31, 2021).
The Manager has analyzed the Series’ tax positions taken on federal, state and local income tax returns for all open tax years and has concluded that no provision for income tax is required in the Series’ financial statements for the current reporting period. Since tax authorities can examine previously filed tax returns, the Series’ U.S. federal and state tax returns for each of the four fiscal years up to the most recent fiscal year ended October 31, 2020 are subject to such review.
The Series offers Class A, Class C, Class Z and Class R6 shares. Class A shares are sold with a maximum front-end sales charge of 5.50%. Investors who purchase $1 million or more of Class A shares and sell these shares within 12 months of purchase are subject to a contingent deferred sales charge (“CDSC”) of 1%, although they are not subject to an initial sales charge. The Class A CDSC is waived for certain retirement and/or benefit plans. A special exchange privilege is also available for shareholders who qualified to purchase Class A shares at net asset value. Class C shares are sold with a CDSC of 1% on sales made within 12 months of purchase. Class C shares will automatically convert to Class A shares on
a monthly basis approximately 10 years after purchase. Class Z and Class R6 shares are not subject to any sales or redemption charges and are available exclusively for sale to a limited group of investors.
Under certain circumstances, an exchange may be made from specified share classes of the Series to one or more other share classes of the Series as presented in the table of transactions in shares of common stock, below.
The Fund is authorized to issue 5.075 billion shares of common stock, $0.01 par value per share, 865 million of which are designated as shares of the Series. The shares are further classified and designated as follows:
| | | | |
Class A | | | 25,000,000 | |
Class C | | | 65,000,000 | |
Class Z | | | 300,000,000 | |
Class T | | | 225,000,000 | |
Class R6 | | | 250,000,000 | |
The Series currently does not have any Class T shares outstanding.
As of October 31, 2020, Prudential, through its affiliated entities, including affiliated funds (if applicable), owned shares of the Series as follows:
| | | | |
| | | Number of Shares | | Percentage of
Outstanding Shares |
Class R6 | | 1,000,515 | | 97.8% |
At the reporting period end, the number of shareholders holding greater than 5% of the Series are as follows:
| | | | | | |
| Affiliated | | Unaffiliated |
Number of
Shareholders | | Percentage of
Outstanding Shares | | Number of
Shareholders | | Percentage of
Outstanding Shares |
1 | | 29.4% | | 2 | | 55.6% |
| | | | |
| PGIM Jennison Emerging Markets Equity Opportunities Fund | | | 31 | |
Notes to Financial Statements (continued)
Transactions in shares of common stock were as follows:
| | | | | | | | |
Class A | | Shares | | | Amount | |
Year ended October 31, 2020: | | | | | | | | |
Shares sold | | | 103,935 | | | $ | 1,518,736 | |
Shares reacquired | | | (71,824 | ) | | | (955,318 | ) |
| | | | | | | | |
Net increase (decrease) in shares outstanding before conversion | | | 32,111 | | | | 563,418 | |
Shares issued upon conversion from other share class(es) | | | 3,633 | | | | 54,429 | |
Shares reacquired upon conversion into other share class(es) | | | (902 | ) | | | (11,761 | ) |
| | | | | | | | |
Net increase (decrease) in shares outstanding | | | 34,842 | | | $ | 606,086 | |
| | | | | | | | |
Year ended October 31, 2019: | | | | | | | | |
Shares sold | | | 68,342 | | | $ | 742,030 | |
Shares reacquired | | | (49,407 | ) | | | (551,008 | ) |
| | | | | | | | |
Net increase (decrease) in shares outstanding before conversion | | | 18,935 | | | | 191,022 | |
Shares issued upon conversion from other share class(es) | | | 54,791 | | | | 650,850 | |
Shares reacquired upon conversion into other share class(es) | | | (2,537 | ) | | | (29,217 | ) |
| | | | | | | | |
Net increase (decrease) in shares outstanding | | | 71,189 | | | $ | 812,655 | |
| | | | | | | | |
Class C | | | | | | |
Year ended October 31, 2020: | | | | | | | | |
Shares sold | | | 13,233 | | | $ | 188,787 | |
Shares reacquired | | | (11,358 | ) | | | (155,204 | ) |
| | | | | | | | |
Net increase (decrease) in shares outstanding before conversion | | | 1,875 | | | | 33,583 | |
Shares reacquired upon conversion into other share class(es) | | | (3,792 | ) | | | (54,429 | ) |
| | | | | | | | |
Net increase (decrease) in shares outstanding | | | (1,917 | ) | | $ | (20,846 | ) |
| | | | | | | | |
Year ended October 31, 2019: | | | | | | | | |
Shares sold | | | 21,925 | | | $ | 221,071 | |
Shares reacquired | | | (16,064 | ) | | | (176,097 | ) |
| | | | | | | | |
Net increase (decrease) in shares outstanding before conversion | | | 5,861 | | | | 44,974 | |
Shares reacquired upon conversion into other share class(es) | | | (58,037 | ) | | | (663,567 | ) |
| | | | | | | | |
Net increase (decrease) in shares outstanding | | | (52,176 | ) | | $ | (618,593 | ) |
| | | | | | | | |
Class Z | | | | | | |
Year ended October 31, 2020: | | | | | | | | |
Shares sold | | | 2,007,443 | | | $ | 30,937,061 | |
Shares reacquired | | | (247,957 | ) | | | (3,693,491 | ) |
| | | | | | | | |
Net increase (decrease) in shares outstanding before conversion | | | 1,759,486 | | | | 27,243,570 | |
Shares issued upon conversion from other share class(es) | | | 890 | | | | 11,761 | |
| | | | | | | | |
Net increase (decrease) in shares outstanding | | | 1,760,376 | | | $ | 27,255,331 | |
| | | | | | | | |
Year ended October 31, 2019: | | | | | | | | |
Shares sold | | | 161,778 | | | $ | 1,824,507 | |
Shares reacquired | | | (99,711 | ) | | | (1,124,987 | ) |
| | | | | | | | |
Net increase (decrease) in shares outstanding before conversion | | | 62,067 | | | | 699,520 | |
Shares issued upon conversion from other share class(es) | | | 3,723 | | | | 41,934 | |
| | | | | | | | |
Net increase (decrease) in shares outstanding | | | 65,790 | | | $ | 741,454 | |
| | | | | | | | |
| | | | | | | | |
Class R6 | | Shares | | | Amount | |
Year ended October 31, 2020: | | | | | | | | |
Shares sold | | | 22,744 | | | $ | 376,591 | |
Shares reacquired | | | (328 | ) | | | (4,694 | ) |
| | | | | | | | |
Net increase (decrease) in shares outstanding | | | 22,416 | | | $ | 371,897 | |
| | | | | | | | |
Year ended October 31, 2019: | | | | | | | | |
| | | | | | | | |
Net increase (decrease) in shares outstanding | | | — | | | $ | — | |
| | | | | | | | |
The Fund, on behalf of the Series, along with other affiliated registered investment companies (the “Participating Funds”), is a party to a Syndicated Credit Agreement (“SCA”) with a group of banks. The purpose of the SCA is to provide an alternative source of temporary funding for capital share redemptions. The table below provides details of the current SCA in effect at the reporting period-end as well as the prior SCA.
| | | | |
| | | Current SCA | | Prior SCA |
| Term of Commitment | | 10/2/2020 – 9/30/2021 | | 10/3/2019 – 10/1/2020 |
Total Commitment | | $ 1,200,000,000 | | $ 1,222,500,000* |
Annualized Commitment Fee on the Unused Portion of the SCA | | 0.15% | | 0.15% |
Annualized Interest Rate on Borrowings | | 1.30% plus the higher of (1) the effective federal funds rate, (2) the one-month LIBOR rate or (3) zero percent | | 1.20% plus the higher of (1) the effective federal funds rate, (2) the one-month LIBOR rate or (3) zero percent |
| * Effective March 31, 2020, the SCA’s total commitment was increased from $900,000,000 to $1,162,500,000 and subsequently, effective April 7, 2020 was increased to $1,222,500,000. |
Certain affiliated registered investment companies that are parties to the SCA include portfolios that are subject to a predetermined mathematical formula used to manage certain benefit guarantees offered under variable annuity contracts. The formula may result in large scale asset flows into and out of these portfolios. Consequently, these portfolios may be more likely to utilize the SCA for purposes of funding redemptions. It may be possible for those portfolios to fully exhaust the committed amount of the SCA, thereby requiring the Manager to allocate available funding per a Board-approved methodology designed to treat the Participating Funds in the SCA equitably.
The Series did not utilize the SCA during the year ended October 31, 2020.
| 9. | Risks of Investing in the Series |
The Series’ risks include, but are not limited to, some or all of the risks discussed below. For further information on the Series’ risks, please refer to the Series’ Prospectus and Statement of Additional Information.
Emerging Markets Risk: The risks of foreign investments are greater for investments in or exposed to emerging markets. Emerging market countries typically have economic and
| | | | |
| PGIM Jennison Emerging Markets Equity Opportunities Fund | | | 33 | |
Notes to Financial Statements (continued)
political systems that are less fully developed, and can be expected to be less stable, than those of more developed countries. For example, the economies of such countries can be subject to rapid and unpredictable rates of inflation or deflation. Low trading volumes may result in a lack of liquidity and price volatility. Emerging market countries may have policies that restrict investment by non-US investors, or that prevent non-US investors from withdrawing their money at will. Countries with emerging markets can be found in regions such as Asia, Latin America, Eastern Europe and Africa.
The Series may invest in some emerging markets that subject it to risks such as those associated with illiquidity, custody of assets, different settlement and clearance procedures and asserting legal title under a developing legal and regulatory regime to a greater degree than in developed markets or even in other emerging markets.
Equity and Equity-Related Securities Risks: The value of a particular security could go down and you could lose money. In addition to an individual security losing value, the value of the equity markets or a sector in which the Series invests could go down. Different parts of a market can react differently to adverse issuer, market, regulatory, political and economic developments.
Foreign Securities Risk: The Series’ investments in securities of foreign issuers or issuers with significant exposure to foreign markets involve additional risk. The securities of such issuers may trade in markets that are less liquid, less regulated and more volatile than US markets. The value of the Series’ investments may decline because of factors affecting the particular issuer as well as foreign markets and issuers generally, such as unfavorable government actions, and political or financial instability. Lack of information may also affect the value of these securities.
Geographic Concentration Risk: The Series’ performance may be closely tied to the market, economic, political, regulatory or other conditions in the countries or regions in which the Series invests. This can result in more pronounced risks based upon conditions that impact one or more countries or regions more or less than other countries or regions.
Investments in China Risk: Investments in China subject the Series to risks specific to China and may make it more volatile than other funds. Over the last few decades, the Chinese government has undertaken reform of economic and market practices and has expanded the sphere of private ownership of property in China. However, Chinese markets generally continue to experience inefficiency, volatility and pricing anomalies resulting from governmental influence, a lack of publicly available information and/or political and social instability. Internal social unrest or confrontations with other neighboring countries, including military conflicts in response to such events, may also disrupt economic
development in China and result in a greater risk of currency fluctuations, currency non-convertibility, interest rate fluctuations and higher rates of inflation.
Large Shareholder and Large Scale Redemption Risk: Certain individuals, accounts, funds (including funds affiliated with the Manager) or institutions, including the Manager and its affiliates, may from time to time own or control a substantial amount of the Series’ shares. There is no requirement that these entities maintain their investment in the Series. There is a risk that such large shareholders or that the Series’ shareholders generally may redeem all or a substantial portion of their investments in the Series in a short period of time, which could have a significant negative impact on the Series’ NAV, liquidity, and brokerage costs. Large redemptions could also result in tax consequences to shareholders and impact the Series’ ability to implement its investment strategy. The Series’ ability to pursue its investment objective after one or more large scale redemptions may be impaired and, as a result, the Series may invest a larger portion of its assets in cash or cash equivalents.
Market Disruption and Geopolitical Risks: International wars or conflicts and geopolitical developments in foreign countries, along with instability in regions such as Asia, Eastern Europe, and the Middle East, possible terrorist attacks in the United States or around the world, public health epidemics such as the outbreak of infectious diseases like the recent outbreak of coronavirus globally or the 2014–2016 outbreak in West Africa of the Ebola virus, and other similar events could adversely affect the U.S. and foreign financial markets, including increases in market volatility, reduced liquidity in the securities markets and government intervention, and may cause further long-term economic uncertainties in the United States and worldwide generally.
The coronavirus pandemic and the related governmental and public responses have had and may continue to have an impact on the Series’ investments and net asset value and have led and may continue to lead to increased market volatility and the potential for illiquidity in certain classes of securities and sectors of the market. Preventative or protective actions that governments may take in respect of pandemic or epidemic diseases may result in periods of business disruption, business closures, inability to obtain raw materials, supplies and component parts, and reduced or disrupted operations for the issuers in which the Series invests. Government intervention in markets may impact interest rates, market volatility and security pricing. The occurrence, reoccurrence and pendency of such diseases could adversely affect the economies (including through changes in business activity and increased unemployment) and financial markets either in specific countries or worldwide.
Market Risk: Securities markets may be volatile and the market prices of the Series’ securities may decline. Securities fluctuate in price based on changes in an issuer’s financial condition and overall market and economic conditions. If the market prices of the securities owned by the Series fall, the value of an investment in the Series will decline.
| | | | |
| PGIM Jennison Emerging Markets Equity Opportunities Fund | | | 35 | |
Notes to Financial Statements (continued)
| 10. | Recent Regulatory Developments |
On December 3, 2020, the SEC announced that it voted to adopt a new rule that establishes an updated regulatory framework for fund valuation practices (the “Rule”). The Rule, in part, provides (i) a framework for determining fair value in good faith and (ii) provides for a fund Board’s assignment of its responsibility for the execution of valuation-related activities to a fund’s investment adviser. Further, the SEC is rescinding previously issued guidance on related issues. The Rule will become effective 60 days after publication in the Federal Register, and will have a compliance date 18 months following the effective date. Management is currently evaluating the Rule and its impact to the Funds.
Financial Highlights
| | | | | | | | | | | | | | | | | | | | |
| Class A Shares | | | | | | | | | | | | | | | |
| | | Year Ended October 31, | |
| | | 2020 | | | 2019 | | | 2018 | | | 2017 | | | 2016 | |
| Per Share Operating Performance(a): | | | | | | | | | | | | | | | | | | | | |
| Net Asset Value, Beginning of Year | | | $12.16 | | | | $9.58 | | | | $11.19 | | | | $9.34 | | | | $8.81 | |
| Income (loss) from investment operations: | | | | | | | | | | | | | | | | | |
| Net investment income (loss) | | | (0.14 | ) | | | (0.04 | ) | | | (0.04 | ) | | | (0.04 | ) | | | (0.04 | ) |
| Net realized and unrealized gain (loss) on investment and foreign currency transactions | | | 5.64 | | | | 2.62 | | | | (1.57 | ) | | | 1.89 | | | | 0.57 | |
| Total from investment operations | | | 5.50 | | | | 2.58 | | | | (1.61 | ) | | | 1.85 | | | | 0.53 | |
| Net asset value, end of year | | | $17.66 | | | | $12.16 | | | | $9.58 | | | | $11.19 | | | | $9.34 | |
| Total Return(b): | | | 45.23 | % | | | 26.93 | % | | | (14.39 | )% | | | 19.81 | % | | | 6.02 | % |
| | | | | | | | | | | | | | | | | | | | | |
| Ratios/Supplemental Data: | | | | | | | | | | | | | | | |
| Net assets, end of year (000) | | | $6,144 | | | | $3,806 | | | | $2,316 | | | | $2,204 | | | | $869 | |
| Average net assets (000) | | | $4,507 | | | | $3,074 | | | | $2,956 | | | | $1,363 | | | | $528 | |
| Ratios to average net assets(c)(d): | | | | | | | | | | | | | | | | | | | | |
| Expenses after waivers and/or expense reimbursement | | | 1.45 | % | | | 1.45 | % | | | 1.45 | % | | | 1.45 | % | | | 1.45 | % |
| Expenses before waivers and/or expense reimbursement | | | 2.61 | % | | | 3.35 | % | | | 3.27 | % | | | 3.28 | % | | | 3.87 | % |
| Net investment income (loss) | | | (0.99 | )% | | | (0.37 | )% | | | (0.35 | )% | | | (0.35 | )% | | | (0.49 | )% |
| Portfolio turnover rate(e) | | | 58 | % | | | 33 | % | | | 23 | % | | | 45 | % | | | 44 | % |
| (a) | Calculated based on average shares outstanding during the year. |
| (b) | Total return does not consider the effects of sales loads. Total return is calculated assuming a purchase of a share on the first day and a sale on the last day of each year reported and includes reinvestment of dividends and distributions, if any. Total returns may reflect adjustments to conform to generally accepted accounting principles. |
| (c) | Does not include expenses of the underlying funds in which the Series invests. |
| (d) | Effective November 1, 2017, class specific expenses include transfer agent fees and expenses and registration fees, which are charged to their respective share class. |
| (e) | The Series’ portfolio turnover rate is calculated in accordance with regulatory requirements, without regard to transactions involving short-term investments and certain derivatives. If such transactions were included, the Series’ portfolio turnover rate may be higher. |
See Notes to Financial Statements.
| | | | |
| PGIM Jennison Emerging Markets Equity Opportunities Fund | | | 37 | |
Financial Highlights(continued)
| | | | | | | | | | | | | | | | | | | | |
| Class C Shares | | | | | | | | | | | | | | | |
| | | Year Ended October 31, | |
| | | 2020 | | | 2019 | | | 2018 | | | 2017 | | | 2016 | |
| Per Share Operating Performance(a): | | | | | | | | | | | | | | | | | | | | |
| Net Asset Value, Beginning of Year | | | $11.71 | | | | $9.29 | | | | $10.93 | | | | $9.20 | | | | $8.74 | |
| Income (loss) from investment operations: | | | | | | | | | | | | | | | | | | | | |
| Net investment income (loss) | | | (0.23 | ) | | | (0.11 | ) | | | (0.13 | ) | | | (0.11 | ) | | | (0.11 | ) |
| Net realized and unrealized gain (loss) on investment and foreign currency transactions | | | 5.40 | | | | 2.53 | | | | (1.51 | ) | | | 1.84 | | | | 0.57 | |
| Total from investment operations | | | 5.17 | | | | 2.42 | | | | (1.64 | ) | | | 1.73 | | | | 0.46 | |
| Net asset value, end of year | | | $16.88 | | | | $11.71 | | | | $9.29 | | | | $10.93 | | | | $9.20 | |
| Total Return(b): | | | 44.06 | % | | | 26.05 | % | | | (15.00 | )% | | | 18.80 | % | | | 5.26 | % |
| | | | | | | | | | | | | | | | | | | | | |
| Ratios/Supplemental Data: | | | | | | | | | | | | | | | |
| Net assets, end of year (000) | | | $1,563 | | | | $1,107 | | | | $1,363 | | | | $1,516 | | | | $734 | |
| Average net assets (000) | | | $1,244 | | | | $1,438 | | | | $1,775 | | | | $973 | | | | $672 | |
| Ratios to average net assets(c)(d): | | | | | | | | | | | | | | | | | | | | |
| Expenses after waivers and/or expense reimbursement | | | 2.20 | % | | | 2.20 | % | | | 2.20 | % | | | 2.20 | % | | | 2.20 | % |
| Expenses before waivers and/or expense reimbursement | | | 4.15 | % | | | 4.23 | % | | | 4.20 | % | | | 4.00 | % | | | 4.62 | % |
| Net investment income (loss) | | | (1.73 | )% | | | (1.05 | )% | | | (1.14 | )% | | | (1.17 | )% | | | (1.29 | )% |
| Portfolio turnover rate(e) | | | 58 | % | | | 33 | % | | | 23 | % | | | 45 | % | | | 44 | % |
| (a) | Calculated based on average shares outstanding during the year. |
| (b) | Total return does not consider the effects of sales loads. Total return is calculated assuming a purchase of a share on the first day and a sale on the last day of each year reported and includes reinvestment of dividends and distributions, if any. Total returns may reflect adjustments to conform to generally accepted accounting principles. |
| (c) | Does not include expenses of the underlying funds in which the Series invests. |
| (d) | Effective November 1, 2017, class specific expenses include transfer agent fees and expenses and registration fees, which are charged to their respective share class. |
| (e) | The Series’ portfolio turnover rate is calculated in accordance with regulatory requirements, without regard to transactions involving short-term investments and certain derivatives. If such transactions were included, the Series’ portfolio turnover rate may be higher. |
See Notes to Financial Statements.
| | | | | | | | | | | | | | | | | | | | |
| Class Z Shares | | | | | | | | | | | | | | | |
| | | Year Ended October 31, | |
| | | 2020 | | | 2019 | | | 2018 | | | 2017 | | | 2016 | |
| Per Share Operating Performance(a): | | | | | | | | | | | | | | | | | | | | |
| Net Asset Value, Beginning of Year | | | $12.31 | | | | $9.67 | | | | $11.27 | | | | $9.39 | | | | $8.82 | |
| Income (loss) from investment operations: | | | | | | | | | | | | | | | | | | | | |
| Net investment income (loss) | | | (0.13 | ) | | | (0.01 | ) | | | (0.01 | ) | | | (0.02 | ) | | | (0.03 | ) |
| Net realized and unrealized gain (loss) on investment and foreign currency transactions | | | 5.75 | | | | 2.65 | | | | (1.59 | ) | | | 1.90 | | | | 0.60 | |
| Total from investment operations | | | 5.62 | | | | 2.64 | | | | (1.60 | ) | | | 1.88 | | | | 0.57 | |
| Net asset value, end of year | | | $17.93 | | | | $12.31 | | | | $9.67 | | | | $11.27 | | | | $9.39 | |
| Total Return(b): | | | 45.65 | % | | | 27.30 | % | | | (14.20 | )% | | | 20.02 | % | | | 6.46 | % |
| | | | | | | | | | | | | | | | | | | | | |
| Ratios/Supplemental Data: | | | | | | | | | | | | | | | |
| Net assets, end of year (000) | | | $34,993 | | | | $2,357 | | | | $1,215 | | | | $980 | | | | $183 | |
| Average net assets (000) | | | $11,195 | | | | $1,866 | | | | $1,443 | | | | $490 | | | | $102 | |
| Ratios to average net assets(c)(d): | | | | | | | | | | | | | | | | | | | | |
| Expenses after waivers and/or expense reimbursement | | | 1.20 | % | | | 1.20 | % | | | 1.20 | % | | | 1.20 | % | | | 1.20 | % |
| Expenses before waivers and/or expense reimbursement | | | 1.93 | % | | | 3.17 | % | | | 3.56 | % | | | 2.94 | % | | | 3.55 | % |
| Net investment income (loss) | | | (0.83 | )% | | | (0.08 | )% | | | (0.13 | )% | | | (0.19 | )% | | | (0.31 | )% |
| Portfolio turnover rate(e) | | | 58 | % | | | 33 | % | | | 23 | % | | | 45 | % | | | 44 | % |
| (a) | Calculated based on average shares outstanding during the year. |
| (b) | Total return is calculated assuming a purchase of a share on the first day and a sale on the last day of each year reported and includes reinvestment of dividends and distributions, if any. Total returns may reflect adjustments to conform to generally accepted accounting principles. |
| (c) | Does not include expenses of the underlying funds in which the Series invests. |
| (d) | Effective November 1, 2017, class specific expenses include transfer agent fees and expenses and registration fees, which are charged to their respective share class. |
| (e) | The Series’ portfolio turnover rate is calculated in accordance with regulatory requirements, without regard to transactions involving short-term investments and certain derivatives. If such transactions were included, the Series’ portfolio turnover rate may be higher. |
See Notes to Financial Statements.
| | | | |
| PGIM Jennison Emerging Markets Equity Opportunities Fund | | | 39 | |
Financial Highlights(continued)
| | | | | | | | | | | | | | | | | | | | |
| Class R6 Shares | | | | | | | | | | | | | | | |
| | | Year Ended October 31, | |
| | | 2020 | | | 2019 | | | 2018 | | | 2017 | | | 2016 | |
| Per Share Operating Performance(a): | | | | | | | | | | | | | | | | | | | | |
| Net Asset Value, Beginning of Year | | | $12.31 | | | | $9.67 | | | | $11.27 | | | | $9.39 | | | | $8.83 | |
| Income (loss) from investment operations: | | | | | | | | | | | | | | | | | | | | |
| Net investment income (loss) | | | (0.10 | ) | | | (0.01 | ) | | | (0.02 | ) | | | (0.01 | ) | | | (0.03 | ) |
| Net realized and unrealized gain (loss) on investment and foreign currency transactions | | | 5.72 | | | | 2.65 | | | | (1.58 | ) | | | 1.89 | | | | 0.59 | |
| Total from investment operations | | | 5.62 | | | | 2.64 | | | | (1.60 | ) | | | 1.88 | | | | 0.56 | |
| Net asset value, end of year | | | $17.93 | | | | $12.31 | | | | $9.67 | | | | $11.27 | | | | $9.39 | |
| Total Return(b): | | | 45.65 | % | | | 27.30 | % | | | (14.20 | )% | | | 20.02 | % | | | 6.34 | % |
| | | | | | | | | | | | | | | | | | | | | |
| Ratios/Supplemental Data: | | | | | | | | | | | | | | | |
| Net assets, end of year (000) | | | $18,340 | | | | $12,319 | | | | $9,675 | | | | $11,271 | | | | $9,404 | |
| Average net assets (000) | | | $14,144 | | | | $11,249 | | | | $11,852 | | | | $9,893 | | | | $8,722 | |
| Ratios to average net assets(c)(d): | | | | | | | | | | | | | | | | | | | | |
| Expenses after waivers and/or expense reimbursement | | | 1.20 | % | | | 1.20 | % | | | 1.20 | % | | | 1.20 | % | | | 1.20 | % |
| Expenses before waivers and/or expense reimbursement | | | 1.80 | % | | | 2.41 | % | | | 2.32 | % | | | 2.78 | % | | | 3.13 | % |
| Net investment income (loss) | | | (0.74 | )% | | | (0.11 | )% | | | (0.17 | )% | | | (0.13 | )% | | | (0.29 | )% |
| Portfolio turnover rate(e) | | | 58 | % | | | 33 | % | | | 23 | % | | | 45 | % | | | 44 | % |
| (a) | Calculated based on average shares outstanding during the year. |
| (b) | Total return is calculated assuming a purchase of a share on the first day and a sale on the last day of each year reported and includes reinvestment of dividends and distributions, if any. Total returns may reflect adjustments to conform to generally accepted accounting principles. |
| (c) | Does not include expenses of the underlying funds in which the Series invests. |
| (d) | Effective November 1, 2017, class specific expenses include transfer agent fees and expenses and registration fees, which are charged to their respective share class. |
| (e) | The Series’ portfolio turnover rate is calculated in accordance with regulatory requirements, without regard to transactions involving short-term investments and certain derivatives. If such transactions were included, the Series’ portfolio turnover rate may be higher. |
See Notes to Financial Statements.
Report of Independent Registered Public Accounting Firm
To the Board of Directors of Prudential World Fund, Inc. and Shareholders of PGIM Jennison Emerging Markets Equity Opportunities Fund
Opinion on the Financial Statements
We have audited the accompanying statement of assets and liabilities, including the schedule of investments, of PGIM Jennison Emerging Markets Equity Opportunities Fund (one of the funds constituting Prudential World Fund, Inc., referred to hereafter as the “Fund”) as of October 31, 2020, and the related statements of operations and changes in net assets, including the related notes, and the financial highlights for the year ended October 31, 2020 (collectively referred to as the “financial statements”). In our opinion, the financial statements present fairly, in all material respects, the financial position of the Fund as of October 31, 2020, and the results of its operations, changes in its net assets, and the financial highlights for the year ended October 31, 2020 in conformity with accounting principles generally accepted in the United States of America.
The financial statements of the Fund as of and for the year ended October 31, 2019 and the financial highlights for each of the periods ended on or prior to October 31, 2019 (not presented herein, other than the statement of changes in net assets and the financial highlights) were audited by other auditors whose report dated December 19, 2019 expressed an unqualified opinion on those financial statements and financial highlights.
Basis for Opinion
These financial statements are the responsibility of the Fund’s management. Our responsibility is to express an opinion on the Fund’s financial statements based on our audit. We are a public accounting firm registered with the Public Company Accounting Oversight Board (United States) (PCAOB) and are required to be independent with respect to the Fund in accordance with the U.S. federal securities laws and the applicable rules and regulations of the Securities and Exchange Commission and the PCAOB.
We conducted our audit of these financial statements in accordance with the standards of the PCAOB. Those standards require that we plan and perform the audit to obtain reasonable assurance about whether the financial statements are free of material misstatement, whether due to error or fraud.
Our audit included performing procedures to assess the risks of material misstatement of the financial statements, whether due to error or fraud, and performing procedures that respond to those risks. Such procedures included examining, on a test basis, evidence regarding the amounts and disclosures in the financial statements. Our audit also included evaluating the accounting principles used and significant estimates made by management, as well as evaluating the overall presentation of the financial statements. Our procedures included confirmation of securities owned as of October 31, 2020 by correspondence with the custodian, transfer agent and brokers; when replies were not received from brokers, we performed other auditing procedures. We believe that our audit provides a reasonable basis for our opinion.
/s/ PricewaterhouseCoopers LLP
New York, New York
December 17, 2020
We have served as the auditor of one or more investment companies in the PGIM Retail Funds complex since 2020.
| | | | |
PGIM Jennison Emerging Markets Equity Opportunities Fund | | | 41 | |
INFORMATION ABOUT BOARD MEMBERS AND OFFICERS (unaudited)
Information about Board Members and Officers of the Fund is set forth below. Board Members who are not deemed to be “interested persons” of the Fund, as defined in the 1940 Act, are referred to as “Independent Board Members.” Board Members who are deemed to be “interested persons” of the Fund are referred to as “Interested Board Members.” The Board Members are responsible for the overall supervision of the operations of the Fund and perform the various duties imposed on the directors of investment companies by the 1940 Act. The Board in turn elects the Officers, who are responsible for administering the day-to-day operations of the Fund.
| | | | | | |
| Independent Board Members | | | | |
| | | | |
Name Year of Birth Position(s) Portfolios Overseen | | Principal Occupation(s) During Past Five Years | | Other Directorships Held During Past Five Years | | Length of Board Service |
| | | | |
Ellen S. Alberding 1958 Board Member Portfolios Overseen: 95 | | President and Board Member, The Joyce Foundation (charitable foundation) (since 2002); Vice Chair, City Colleges of Chicago (community college system) (2011-2015); Trustee, National Park Foundation (charitable foundation for national park system) (2009-2018); Trustee, Economic Club of Chicago (2009-2016); Trustee, Loyola University (since 2018). | | None. | | Since September 2013 |
| | | | |
Kevin J. Bannon 1952 Board Member Portfolios Overseen: 95 | | Retired; Managing Director (April 2008-May 2015) and Chief Investment Officer (October 2008-November 2013) of Highmount Capital LLC (registered investment adviser); formerly Executive Vice President and Chief Investment Officer (April 1993-August 2007) of Bank of New York Company; President (May 2003-May 2007) of BNY Hamilton Family of Mutual Funds. | | Director of Urstadt Biddle Properties (equity real estate investment trust) (since September 2008). | | Since July 2008 |
PGIM Jennison Emerging Markets Equity Opportunities Fund
| | | | | | |
| Independent Board Members | | | | |
| | | | |
Name Year of Birth Position(s) Portfolios Overseen | | Principal Occupation(s) During Past Five Years | | Other Directorships Held During Past Five Years | | Length of Board Service |
| | | | |
Linda W. Bynoe 1952 Board Member Portfolios Overseen: 95 | | President and Chief Executive Officer (since March 1995) and formerly Chief Operating Officer (December 1989-February 1995) of Telemat Limited LLC (formerly, Telemat Ltd). (management consulting); formerly Vice President (January 1985-June 1989) at Morgan Stanley & Co. (broker-dealer). | | Director of Anixter International, Inc. (communication products distributor) (since January 2006–June 2020); Director of Northern Trust Corporation (financial services) (since April 2006); Trustee of Equity Residential (residential real estate) (since December 2009). | | Since March 2005 |
| | | | |
Barry H. Evans 1960 Board Member Portfolios Overseen: 94 | | Retired; formerly President (2005 – 2016), Global Chief Operating Officer (2014– 2016), Chief Investment Officer – Global Head of Fixed Income (1998-2014), and various portfolio manager roles (1986-2006), Manulife Asset Management U.S. | | Formerly Director, Manulife Trust Company (2011-2018); formerly Director, Manulife Asset Management Limited (2015-2017); formerly Chairman of the Board of Directors of Manulife Asset Management U.S. (2005-2016); formerly Chairman of the Board, Declaration Investment Management and Research (2008-2016). | | Since September 2017 |
| | | | |
Keith F. Hartstein 1956 Board Member & Independent Chair Portfolios Overseen: 95 | | Executive Committee of the IDC Board of Governors (since October 2019); Retired; Member (since November 2014) of the Governing Council of the Independent Directors Council (IDC) (organization of independent mutual fund directors); formerly President and Chief Executive Officer (2005-2012), Senior Vice President (2004-2005), Senior Vice President of Sales and Marketing (1997-2004), and various executive management positions (1990-1997), John Hancock Funds, LLC (asset management); Chairman, Investment Company Institute’s Sales Force Marketing Committee (2003-2008). | | None. | | Since September 2013 |
Visit our website at pgim.com/investments
| | | | | | |
| Independent Board Members | | | | |
| | | | |
Name Year of Birth Position(s) Portfolios Overseen | | Principal Occupation(s) During Past Five Years | | Other Directorships Held During Past Five Years | | Length of Board Service |
| | | | |
Laurie Simon Hodrick 1962 Board Member Portfolios Overseen: 94 | | A. Barton Hepburn Professor Emerita of Economics in the Faculty of Business, Columbia Business School (since 2018); Visiting Professor of Law, Stanford Law School (since 2015); Visiting Fellow at the Hoover Institution, Stanford University (since 2015); Sole Member, ReidCourt LLC (since 2008) (a consulting firm); formerly A. Barton Hepburn Professor of Economics in the Faculty of Business, Columbia Business School (1996-2017); formerly Managing Director, Global Head of Alternative Investment Strategies, Deutsche Bank (2006-2008). | | Independent Director, Synnex Corporation (since 2019) (information technology); Independent Director, Kabbage, Inc. (2018-2020) (financial services); Independent Director, Corporate Capital Trust (2017-2018) (a business development company). | | Since September 2017 |
| | | | |
Michael S. Hyland, CFA 1945 Board Member Portfolios Overseen: 95 | | Retired (since February 2005); formerly Senior Managing Director (July 2001-February 2005) of Bear Stearns & Co, Inc.; Global Partner, INVESCO (1999-2001); Managing Director and President of Salomon Brothers Asset Management (1989-1999). | | None. | | Since July 2008 |
| | | | |
Brian K. Reid 1961 Board Member Portfolios Overseen: 94 | | Retired; formerly Chief Economist for the Investment Company Institute (ICI) (2005-2017); formerly Senior Economist and Director of Industry and Financial Analysis at the ICI (1998-2004); formerly Senior Economist, Industry and Financial Analysis at the ICI (1996-1998); formerly Staff Economist at the Federal Reserve Board (1989-1996); Director, ICI Mutual Insurance Company (2012-2017). | | None. | | Since March 2018 |
PGIM Jennison Emerging Markets Equity Opportunities Fund
| | | | | | |
| Independent Board Members | | | | |
| | | | |
Name Year of Birth Position(s) Portfolios Overseen | | Principal Occupation(s) During Past Five Years | | Other Directorships Held During Past Five Years | | Length of Board Service |
| | | | |
Grace C. Torres 1959 Board Member Portfolios Overseen: 94 | | Retired; formerly Treasurer and Principal Financial and Accounting Officer of the PGIM Funds, Target Funds, Advanced Series Trust, Prudential Variable Contract Accounts and The Prudential Series Fund (1998-June 2014); Assistant Treasurer (March 1999-June 2014) and Senior Vice President (September 1999-June 2014) of PGIM Investments LLC; Assistant Treasurer (May 2003-June 2014) and Vice President (June 2005-June 2014) of AST Investment Services, Inc.; Senior Vice President and Assistant Treasurer (May 2003-June 2014) of Prudential Annuities Advisory Services, Inc. | | Formerly Director (July 2015-January 2018) of Sun Bancorp, Inc. N.A. and Sun National Bank; Director (since January 2018) of OceanFirst Financial Corp. and OceanFirst Bank. | | Since November 2014 |
| | | | | | |
| Interested Board Members | | | | |
| | | | |
Name Year of Birth Position(s) Portfolios Overseen | | Principal Occupation(s) During Past Five Years | | Other Directorships Held During Past Five Years | | Length of Board Service |
| | | | |
Stuart S. Parker 1962 Board Member & President Portfolios Overseen: 96 | | President of PGIM Investments LLC (formerly known as Prudential Investments LLC) (since January 2012); Executive Vice President of Prudential Investment Management Services LLC (since December 2012); formerly Executive Vice President of Jennison Associates LLC and Head of Retail Distribution of PGIM Investments LLC (June 2005-December 2011). | | None. | | Since January 2012 |
Visit our website at pgim.com/investments
| | | | | | |
| Interested Board Members | | | | |
| | | | |
Name Year of Birth Position(s) Portfolios Overseen | | Principal Occupation(s) During Past Five Years | | Other Directorships Held During Past Five Years | | Length of Board Service |
| | | | |
Scott E. Benjamin 1973 Board Member & Vice President Portfolios Overseen: 96 | | Executive Vice President (since June 2009) of PGIM Investments LLC; Vice President (since June 2012) of Prudential Investment Management Services LLC; Executive Vice President (since September 2009) of AST Investment Services, Inc.; Senior Vice President of Product Development and Marketing, PGIM Investments (since February 2006); formerly Vice President of Product Development and Product Management, PGIM Investments LLC (2003-2006). | | None. | | Since March 2010 |
(1) The year that each Board Member joined the Board is as follows:
Ellen S. Alberding, 2013; Kevin J. Bannon, 2008; Linda W. Bynoe, 2005; Barry H. Evans, 2017; Keith F. Hartstein, 2013; Laurie Simon Hodrick, 2017; Michael S. Hyland, 2008; James E. Quinn, 2013; Richard A. Redeker, 2000; Stephen G. Stoneburn, 2003; Stuart S. Parker, Board Member and President since 2012; Scott E. Benjamin, Board Member since 2010 and Vice President since 2009; Grace C. Torres, 2014.
| | | | |
| Fund Officers(a) | | | | |
| | | |
Name Year of Birth Fund Position | | Principal Occupation(s) During Past Five Years | | Length of Service as Fund Officer |
| | | |
Claudia DiGiacomo 1974 Chief Legal Officer | | Chief Legal Officer of PGIM Investments LLC (since August 2020); Chief Legal Officer of Prudential Mutual Fund Services LLC (since August 2020); Chief Legal Officer of PIFM Holdco, LLC (since August 2020); Vice President and Corporate Counsel (since January 2005) of Prudential; and Corporate Counsel of AST Investment Services, Inc. (since August 2020); formerly Associate at Sidley Austin Brown & Wood LLP (1999-2004). | | Since December 2005 |
| | | |
Dino Capasso 1974 Chief Compliance Officer | | Chief Compliance Officer (July 2019-Present) of PGIM Investments LLC; Chief Compliance Officer (July 2019-Present) of the PGIM Funds, Target Funds, Advanced Series Trust, The Prudential Series Fund, Prudential’s Gibraltar Fund, Inc., PGIM Global High Yield Fund, Inc., and PGIM High Yield Bond Fund, Inc.; Vice President and Deputy Chief Compliance Officer (June 2017-2019) of PGIM Investments LLC; formerly, Senior Vice President and Senior Counsel (January 2016-June 2017), and Vice President and Counsel (February 2012-December 2015) of Pacific Investment Management Company LLC. | | Since March 2018 |
PGIM Jennison Emerging Markets Equity Opportunities Fund
| | | | |
| Fund Officers(a) | | | | |
| | | |
Name Year of Birth Fund Position | | Principal Occupation(s) During Past Five Years | | Length of Service as Fund Officer |
| | | |
Andrew R. French 1962 Secretary | | Vice President (since December 2018 - present) of PGIM Investments LLC; Formerly, Vice President and Corporate Counsel (2010-2018) of Prudential; formerly Director and Corporate Counsel (2006-2010) of Prudential; Vice President and Assistant Secretary (since January 2007) of PGIM Investments LLC; Vice President and Assistant Secretary (since January 2007) of Prudential Mutual Fund Services LLC. | | Since October 2006 |
| | | |
Diana N. Huffman 1982 Assistant Secretary | | Vice President and Corporate Counsel (since September 2015) of Prudential; Vice President and Assistant Secretary (since August 2020) of PGIM Investments LLC; formerly Associate at Willkie Farr & Gallagher LLP (2009-2015). | | Since March 2019 |
| | | |
Melissa Gonzalez 1980 Assistant Secretary | | Vice President and Corporate Counsel (since September 2018) of Prudential; Vice President and Assistant Secretary (since August 2020) of PGIM Investments LLC; formerly Director and Corporate Counsel (March 2014-September 2018) of Prudential. | | Since March 2020 |
| | | |
Patrick E. McGuinness 1986 Assistant Secretary | | Vice President and Assistant Secretary (since August 2020) of PGIM Investments LLC; Director and Corporate Counsel (since February 2017) of Prudential; and Corporate Counsel (2012 – 2017) of IIL, Inc. | | Since June 2020 |
| | | |
Kelly A. Coyne 1968 Assistant Secretary | | Director, Investment Operations of Prudential Mutual Fund Services LLC (since 2010). | | Since March 2015 |
| | | |
Christian J. Kelly 1975 Treasurer and Principal Financial and Accounting Officer | | Vice President, Head of Fund Administration of PGIM Investments LLC (since November 2018); formerly, Director of Fund Administration of Lord Abbett & Co. LLC (2009-2018), Treasurer and Principal Accounting Officer of the Lord Abbett Family of Funds (2017-2018); Director of Accounting, Avenue Capital Group (2008-2009); Senior Manager, Investment Management Practice of Deloitte & Touche LLP (1998-2007). | | Since January 2019 |
| | | |
Lana Lomuti 1967 Assistant Treasurer | | Vice President (since 2007) and Director (2005-2007), within PGIM Investments Fund Administration; formerly Assistant Treasurer (December 2007-February 2014) of The Greater China Fund, Inc. | | Since April 2014 |
| | | |
Russ Shupak 1973 Assistant Treasurer | | Vice President (since 2017) and Director (2013-2017), within PGIM Investments Fund Administration. | | Since October 2019 |
| | | |
Deborah Conway 1969 Assistant Treasurer | | Vice President (since 2017) and Director (2007-2017), within PGIM Investments Fund Administration. | | Since October 2019 |
| | | |
Elyse M. McLaughlin 1974 Assistant Treasurer | | Vice President (since 2017) and Director (2011-2017), within PGIM Investments Fund Administration. | | Since October 2019 |
Visit our website at pgim.com/investments
| | | | |
| Fund Officers(a) | | | | |
| | | |
Name Year of Birth Fund Position | | Principal Occupation(s) During Past Five Years | | Length of Service as Fund Officer |
| | | |
Charles H. Smith 1973 Anti-Money Laundering Compliance Officer | | Vice President, Corporate Compliance, Anti-Money Laundering Unit (since January 2015) of Prudential; committee member of the American Council of Life Insurers Anti-Money Laundering and Critical Infrastructure Committee (since January 2016); formerly Global Head of Economic Sanctions Compliance at AIG Property Casualty (February 2007-December 2014); Assistant Attorney General at the New York State Attorney General’s Office, Division of Public Advocacy. (August 1998-January 2007). | | Since January 2017 |
(a) Excludes Mr. Parker and Mr. Benjamin, interested Board Members who also serve as President and Vice President, respectively.
Explanatory Notes to Tables:
| ∎ | | Board Members are deemed to be “Interested,” as defined in the 1940 Act, by reason of their affiliation with PGIM Investments LLC and/or an affiliate of PGIM Investments LLC. |
| ∎ | | Unless otherwise noted, the address of all Board Members and Officers is c/o PGIM Investments LLC, 655 Broad Street, Newark, New Jersey 07102-4410. |
| ∎ | | There is no set term of office for Board Members or Officers. The Board Members have adopted a retirement policy, which calls for the retirement of Board Members on December 31 of the year in which they reach the age of 75. |
| ∎ | | “Other Directorships Held” includes all directorships of companies required to register or file reports with the SEC under the 1934 Act (that is, “public companies”) or other investment companies registered under the 1940 Act. |
| ∎ | | “Portfolios Overseen” includes all investment companies managed by PGIM Investments LLC. The investment companies for which PGIM Investments LLC serves as manager include the PGIM Funds, The Prudential Variable Contract Accounts, PGIM ETF Trust, PGIM High Yield Bond Fund, Inc., PGIM Global High Yield Fund, Inc., The Prudential Series Fund, Prudential’s Gibraltar Fund, Inc. and the Advanced Series Trust. |
| ∎ | | As used in the Fund Officers table “Prudential” means The Prudential Insurance Company of America. |
PGIM Jennison Emerging Markets Equity Opportunities Fund
Approval of Advisory Agreements (unaudited)
The Fund’s Board of Trustees
The Board of Directors (the “Board”) of PGIM Jennison Emerging Markets Equity Opportunities Fund (the “Fund”)1 consists of eleven individuals, nine of whom are not “interested persons” of the Fund, as defined in the Investment Company Act of 1940, as amended (the “1940 Act”) (the “Independent Directors”). The Board is responsible for the oversight of the Fund and its operations, and performs the various duties imposed on the directors of investment companies by the 1940 Act. The Independent Directors have retained independent legal counsel to assist them in connection with their duties. The Chair of the Board is an Independent Director. The Board has established four standing committees: the Audit Committee, the Nominating and Governance Committee, and two Investment Committees. Each committee is chaired by, and composed of, Independent Directors.
Annual Approval of the Fund’s Advisory Agreements
As required under the 1940 Act, the Board determines annually whether to renew the Fund’s management agreement with PGIM Investments LLC (“PGIM Investments”) and the Fund’s subadvisory agreement with Jennison Associates LLC (“Jennison”). In considering the renewal of the agreements, the Board, including all of the Independent Directors, met on May 27, 2020 and on June 9-11, 2020 and approved the renewal of the agreements through July 31, 2021, after concluding that the renewal of the agreements was in the best interests of the Fund and its shareholders.
In advance of the meetings, the Board requested and received materials relating to the agreements, and had the opportunity to ask questions and request further information in connection with its consideration. Among other things, the Board considered comparative fee information from PGIM Investments and Jennison. Also, the Board considered comparisons with other mutual funds in relevant Peer Universes and Peer Groups, as is further discussed below.
In approving the agreements, the Board, including the Independent Directors advised by independent legal counsel, considered the factors it deemed relevant, including the nature, quality and extent of services provided by PGIM Investments and the subadviser, the performance of the Fund, the profitability of PGIM Investments and its affiliates, expenses and fees, and the potential for economies of scale that may be shared with the Fund and its shareholders as the Fund’s assets grow. In their deliberations, the Directors did not identify any single factor which alone was responsible for the Board’s decision to approve the agreements with respect to the Fund. In connection with its deliberations, the Board considered information provided by PGIM Investments throughout the year at regular Board meetings, presentations from portfolio managers and other information, as well as information furnished at or in advance of the meetings on May 27, 2020 and on June 9-11, 2020.
| 1 | PGIM Jennison Emerging Markets Equity Opportunities Fund is a series of Prudential World Fund, Inc. |
PGIM Jennison Emerging Markets Equity Opportunities Fund
Approval of Advisory Agreements (continued)
The Directors determined that the overall arrangements between the Fund and PGIM Investments, which serves as the Fund’s investment manager pursuant to a management agreement, and between PGIM Investments and Jennison, which serves as the Fund’s subadviser pursuant to the terms of a subadvisory agreement with PGIM Investments, are in the best interests of the Fund and its shareholders in light of the services performed, fees charged and such other matters as the Directors considered relevant in the exercise of their business judgment.
The material factors and conclusions that formed the basis for the Directors’ determinations to approve the renewal of the agreements are discussed separately below.
Nature, Quality and Extent of Services
The Board received and considered information regarding the nature, quality and extent of services provided to the Fund by PGIM Investments and Jennison. The Board noted that Jennison is affiliated with PGIM Investments. The Board considered the services provided by PGIM Investments, including but not limited to the oversight of the subadviser for the Fund, as well as the provision of fund recordkeeping, compliance and other services to the Fund, and PGIM Investments’ role as administrator for the Fund’s liquidity risk management program. With respect to PGIM Investments’ oversight of the subadviser, the Board noted that PGIM Investments’ Strategic Investment Research Group (“SIRG”), a business unit of PGIM Investments, is responsible for monitoring and reporting to PGIM Investments’ senior management on the performance and operations of the subadviser. The Board also considered that PGIM Investments pays the salaries of all of the officers and interested Directors of the Fund who are part of Fund management. The Board also considered the investment subadvisory services provided by Jennison, including investment research and security selection, as well as compliance with the Fund’s investment restrictions, policies and procedures. The Board considered PGIM Investments’ evaluation of Jennison as well as PGIM Investments’ recommendation, based on its review of Jennison, to renew the subadvisory agreement.
The Board considered the qualifications, backgrounds and responsibilities of PGIM Investments’ senior management responsible for the oversight of the Fund and Jennison, and also considered the qualifications, backgrounds and responsibilities of Jennison’s portfolio managers who are responsible for the day-to-day management of the Fund’s portfolio. The Board was provided with information pertaining to PGIM Investments’ and Jennison’s organizational structure, senior management, investment operations, and other relevant information pertaining to both PGIM Investments and Jennison. The Board also noted that it received favorable compliance reports from the Fund’s Chief Compliance Officer (“CCO”) as to both PGIM Investments and Jennison.
Visit our website at pgim.com/investments
The Board concluded that it was satisfied with the nature, extent and quality of the investment management services provided by PGIM Investments and the subadvisory services provided to the Fund by Jennison, and that there was a reasonable basis on which to conclude that the Fund benefits from the services provided by PGIM Investments and Jennison under the management and subadvisory agreements.
Costs of Services and Profits Realized by PGIM Investments
The Board was provided with information on the profitability of PGIM Investments and its affiliates in serving as the Fund’s investment manager. The Board discussed with PGIM Investments the methodology utilized in assembling the information regarding profitability and considered its reasonableness. The Board recognized that it is difficult to make comparisons of profitability from fund management contracts because comparative information is not generally publicly available and is affected by numerous factors, including the structure of the particular adviser, the types of funds it manages, its business mix, numerous assumptions regarding allocations and the adviser’s capital structure and cost of capital. However, the Board considered that the cost of services provided by PGIM Investments for the year ended December 31, 2019 exceeded the management fees received by PGIM Investments, resulting in an operating loss to PGIM Investments. Taking these factors into account, the Board concluded that the profitability of PGIM Investments and its affiliates in relation to the services rendered was not unreasonable.
Economies of Scale
The Board received and discussed information concerning economies of scale that PGIM Investments may realize as the Fund’s assets grow beyond current levels. The Board noted that the management fee schedule for the Fund includes breakpoints, which have the effect of decreasing the fee rate as assets increase. During the course of time, the Board has considered information regarding the launch date of the Fund, the management fees of the Fund compared to those of similarly managed funds and PGIM Investments’ investment in the Fund over time. The Board noted that economies of scale can be shared with the Fund in other ways, including low management fees from inception, additional technological and personnel investments to enhance shareholder services, and maintaining existing expense structures in the face of a rising cost environment. The Board also considered PGIM Investments’ assertion that it continually evaluates the management fee schedule of the Fund and the potential to share economies of scale through breakpoints or fee waivers as asset levels increase.
The Board recognized the inherent limitations of any analysis of economies of scale, stemming largely from the Board’s understanding that most of PGIM Investments’ costs are not specific to individual funds, but rather are incurred across a variety of products and services.
PGIM Jennison Emerging Markets Equity Opportunities Fund
Approval of Advisory Agreements (continued)
Other Benefits to PGIM Investments and Jennison
The Board considered potential ancillary benefits that might be received by PGIM Investments and Jennison and their affiliates as a result of their relationship with the Fund. The Board concluded that potential benefits to be derived by PGIM Investments included transfer agency fees received by the Fund’s transfer agent (which is affiliated with PGIM Investments), as well as benefits to its reputation or other intangible benefits resulting from PGIM Investments’ association with the Fund. The Board concluded that the potential benefits to be derived by Jennison included its ability to use soft dollar credits, as well as the potential benefits consistent with those generally resulting from an increase in assets under management, specifically, potential access to additional research resources and benefits to its reputation. The Board concluded that the benefits derived by PGIM Investments and Jennison were consistent with the types of benefits generally derived by investment managers and subadvisers to mutual funds.
Performance of the Fund / Fees and Expenses
The Board considered certain additional factors and made related conclusions relating to the historical performance of the Fund for the one-, three- and five-year periods ended December 31, 2019. The Board considered that the Fund commenced operations on September 16, 2014 and that longer-term performance was not yet available.
The Board also considered the Fund’s actual management fee, as well as the Fund’s net total expense ratio, for the fiscal year ended October 31, 2019. The Board considered the management fee for the Fund as compared to the management fee charged by PGIM Investments to other funds and the fee charged by other advisers to comparable mutual funds in a Peer Group. The actual management fee represents the fee rate actually paid by Fund shareholders and includes any fee waivers or reimbursements. The net total expense ratio for the Fund represents the actual expense ratio incurred by Fund shareholders.
The mutual funds included in the Peer Universe, which was used to consider performance, and the Peer Group, which was used to consider fees and expenses, were objectively determined by Broadridge, an independent provider of mutual fund data. In certain circumstances, PGIM Investments also provided supplemental Peer Universe or Peer Group information, for reasons addressed with the Board. The comparisons placed the Fund in various quartiles over various periods, with the first quartile being the best 25% of the mutual funds (for performance, the best performing mutual funds and, for expenses, the lowest cost mutual funds).
The section below summarizes key factors considered by the Board and the Board’s conclusions regarding the Fund’s performance, fees and overall expenses. The table sets forth net performance comparisons (which reflect the impact on performance of fund expenses, or any subsidies, expense caps or waivers that may be applicable) with the Peer
Visit our website at pgim.com/investments
Universe, actual management fees with the Peer Group (which reflect the impact of any subsidies or fee waivers), and net total expenses with the Peer Group, each of which were key factors considered by the Board.
| | | | | | | | |
| Net Performance | | 1 Year | | 3 Years | | 5 Years | | 10 Years |
| | | 1st Quartile | | 1st Quartile | | 2nd Quartile | | N/A |
| Actual Management Fees: 1st Quartile |
| Net Total Expenses: 2nd Quartile |
| • | | The Board noted that the Fund outperformed its benchmark index over all periods. |
| • | | The Board and PGIM Investments agreed to retain the Fund’s existing contractual expense cap, which (exclusive of certain fees and expenses) caps the Fund’s annual operating expenses at 1.45% for Class A shares, 2.20% for Class C shares, 1.20% for Class R6 shares, and 1.20% for Class Z shares through February 28, 2021. |
| • | | In addition, PGIM Investments will waive management fees or shared operating expenses on any share class to the same extent that it waives such expenses on any other share class, and has agreed that total annual fund operating expenses for Class R6 shares will not exceed total annual fund operating expenses for Class Z shares. |
| • | | The Board concluded that, in light of the above, it would be in the best interests of the Fund and its shareholders to renew the agreements. |
| • | | The Board concluded that the management fees (including subadvisory fees) and total expenses were reasonable in light of the services provided. |
* * *
After full consideration of these factors, the Board concluded that approval of the agreements was in the best interests of the Fund and its shareholders.
PGIM Jennison Emerging Markets Equity Opportunities Fund
| | | | |
| | |
| ∎ MAIL | | ∎ TELEPHONE | | ∎ WEBSITE |
655 Broad Street Newark, NJ 07102 | | (800) 225-1852 | | pgim.com/investments |
|
| PROXY VOTING |
| The Board of Directors of the Fund has delegated to the Fund’s subadviser the responsibility for voting any proxies and maintaining proxy recordkeeping with respect to the Fund. A description of these proxy voting policies and procedures is available without charge, upon request, by calling (800) 225-1852 or by visiting the Securities and Exchange Commission’s website at sec.gov. Information regarding how the Fund voted proxies relating to portfolio securities during the most recent 12-month period ended June 30 is available on the Fund’s website and on the Securities and Exchange Commission’s website. |
|
| DIRECTORS |
| Ellen S. Alberding • Kevin J. Bannon • Scott E. Benjamin • Linda W. Bynoe • Barry H. Evans • Keith F. Hartstein • Laurie Simon Hodrick • Michael S. Hyland • Stuart S. Parker • Brian K. Reid • Grace C. Torres |
|
| OFFICERS |
| Stuart S. Parker, President • Scott E. Benjamin, Vice President • Christian J. Kelly, Treasurer and Principal Financial and Accounting Officer • Claudia DiGiacomo, Chief Legal Officer • Dino Capasso, Chief Compliance Officer • Charles H. Smith, Anti-Money Laundering Compliance Officer • Andrew R. French, Secretary • Melissa Gonzalez, Assistant Secretary • Diana N. Huffman, Assistant Secretary • Kelly A. Coyne, Assistant Secretary • Patrick McGuinness, Assistant Secretary • Lana Lomuti, Assistant Treasurer • Russ Shupak, Assistant Treasurer • Elyse McLaughlin, Assistant Treasurer • Deborah Conway, Assistant Treasurer |
| | | | |
| MANAGER | | PGIM Investments LLC | | 655 Broad Street
Newark, NJ 07102 |
|
| SUBADVISER | | Jennison Associates LLC | | 466 Lexington Avenue
New York, NY 10017 |
|
| DISTRIBUTOR | | Prudential Investment
Management Services LLC | | 655 Broad Street
Newark, NJ 07102 |
|
| CUSTODIAN | | The Bank of New York Mellon | | 240 Greenwich Street New York, NY 10286 |
|
| TRANSFER AGENT | | Prudential Mutual Fund
Services LLC | | PO Box 9658
Providence, RI 02940 |
|
INDEPENDENT REGISTERED
PUBLIC ACCOUNTING FIRM | | PricewaterhouseCoopers LLP | | 300 Madison Avenue New York, NY 10017 |
|
| FUND COUNSEL | | Willkie Farr & Gallagher LLP | | 787 Seventh Avenue
New York, NY 10019 |
|
|
| An investor should consider the investment objectives, risks, charges, and expenses of the Fund carefully before investing. The prospectus and summary prospectus contain this and other information about the Fund. An investor may obtain the prospectus and summary prospectus by visiting our website at pgim.com/investments or by calling (800) 225-1852. The prospectus and summary prospectus should be read carefully before investing. |
|
| E-DELIVERY |
| To receive your mutual fund documents online, go to pgim.com/investments/resource/edelivery and enroll. Instead of receiving printed documents by mail, you will receive notification via email when new materials are available. You can cancel your enrollment or change your email address at any time by visiting the website address above. |
|
| SHAREHOLDER COMMUNICATIONS WITH DIRECTORS |
| Shareholders can communicate directly with the Board of Directors by writing to the Chair of the Board, PGIM Jennison Emerging Markets Equity Opportunities Fund, PGIM Investments, Attn: Board of Directors, 655 Broad Street, Newark, NJ 07102. Shareholders can communicate directly with an individual Director by writing to that Director at the same address. Communications are not screened before being delivered to the addressee. |
|
| AVAILABILITY OF PORTFOLIO HOLDINGS |
| The Fund files its complete schedule of portfolio holdings with the Securities and Exchange Commission for the first and third quarters of each fiscal year as an exhibit to its reports on Form N-PORT. The Fund’s Form N-PORT filings are available on the Commission’s website at sec.gov. |
|
| The Fund’s Statement of Additional Information contains additional information about the Fund’s Directors and is available without charge, upon request, by calling (800) 225-1852. |
Mutual Funds:
| | | | |
| ARE NOT INSURED BY THE FDIC OR ANY FEDERAL GOVERNMENT AGENCY | | MAY LOSE VALUE | | ARE NOT A DEPOSIT OF OR GUARANTEED BY ANY BANK OR ANY BANK AFFILIATE |
PGIM JENNISON EMERGING MARKETS EQUITY OPPORTUNITIES FUND
| | | | | | | | |
| SHARE CLASS | | A | | C | | Z | | R6 |
| NASDAQ | | PDEAX | | PDECX | | PDEZX | | PDEQX |
| CUSIP | | 743969644 | | 743969636 | | 743969610 | | 743969628 |
MF225E

PGIM JENNISON GLOBAL OPPORTUNITIES FUND
ANNUAL REPORT
OCTOBER 31, 2020
COMING SOON: PAPERLESS SHAREHOLDER REPORTS
Beginning on January 1, 2021, as permitted by regulations adopted by the Securities and Exchange Commission, paper copies of the Fund’s annual and semiannual shareholder reports will no longer be sent by mail, unless you specifically request paper copies of the reports. Instead, the reports will be made available on the Fund’s website (pgim.com/investments), and you will be notified by mail each time a report is posted and provided with a website link to access the report.
If you already elected to receive shareholder reports electronically, you will not be affected by this change and you need not take any action. You may elect to receive shareholder reports and other communications from the Fund electronically anytime by contacting your financial intermediary (such as a broker-dealer or bank) or, if you are a direct investor, by calling 1-800-225-1852 or by sending an email request to PGIM Investments at shareholderreports@pgim.com.
You may elect to receive all future reports in paper free of charge. If you invest through a financial intermediary, you can contact your financial intermediary to elect to continue to receive paper copies of your shareholder reports. If you invest directly with the Fund, you can call 1-800-225-1852 or send an email request to shareholderreports@pgim.com to let the Fund know you wish to continue receiving paper copies of your shareholder reports. Your election to receive reports in paper will apply to all funds held in your account if you invest through your financial intermediary or all funds held with the fund complex if you invest directly with the Fund.

To enroll in e-delivery, go to pgim.com/investments/resource/edelivery
Table of Contents
This report is not authorized for distribution to prospective investors unless preceded or accompanied by a current prospectus.
The views expressed in this report and information about the Fund’s portfolio holdings are for the period covered by this report and are subject to change thereafter.
Mutual funds are distributed by Prudential Investment Management Services LLC, member SIPC. Jennison Associates LLC is a registered investment adviser. Both are Prudential Financial companies. © 2020 Prudential Financial, Inc. and its related entities. Jennison Associates, Jennison, PGIM, and the PGIM logo are service marks of Prudential Financial, Inc. and its related entities, registered in many jurisdictions worldwide.
| | |
| 2 | | Visit our website at pgim.com/investments |
Letter from the President

Dear Shareholder:
We hope you find the annual report for the PGIM Jennison Global Opportunities Fund informative and useful. The report covers performance for the 12-month period that ended October 31, 2020.
During the first four months of the period, the global economy remained healthy—particularly in the US—fueled by rising corporate profits and strong job growth. The outlook changed dramatically in March as the coronavirus outbreak quickly and substantially shut down economic activity worldwide, leading to significant job losses and a steep decline in global growth and earnings. Responding to this disruption, the Federal Reserve (the Fed) cut the federal funds rate target to near zero and flooded capital markets with liquidity; and Congress passed stimulus bills worth approximately $3 trillion that offered an economic lifeline to consumers and businesses.
While stocks climbed throughout the first four months of the period, they fell significantly in March amid a spike in volatility, ending the 11-year-long equity bull market. With stores and factories closing and consumers staying at home to limit the spread of the virus, investors sold stocks on fears that corporate earnings would take a serious hit. Equities rallied around the globe throughout the spring and summer as states reopened their economies, but became more volatile during the last two months of the period as investors worried that a surge in coronavirus infections would stall the economic recovery. For the period overall, large-cap US and emerging market stocks rose, small-cap US stocks were virtually unchanged, and stocks in developed foreign markets declined.
The bond market overall—including US and global bonds as well as emerging market debt—rose during the period as investors sought safety in fixed income. A significant rally in interest rates pushed the 10-year US Treasury yield down to a record low. In March, the Fed took several aggressive actions to keep the bond markets running smoothly, restarting many of the relief programs that proved to be successful in helping end the global financial crisis in 2008-09.
Regarding your investments with PGIM, we believe it is important to maintain a diversified portfolio of funds consistent with your tolerance for risk, time horizon, and financial goals. Your financial advisor can help you create a diversified investment plan that may include funds covering all the basic asset classes and that reflects your personal investor profile and risk tolerance. However, diversification and asset allocation strategies do not assure a profit or protect against loss in declining markets.
At PGIM Investments, we consider it a great privilege and responsibility to help investors participate in opportunities across global markets while meeting their toughest investment challenges. PGIM is a top-10 global investment manager with more than $1 trillion in assets under management. This scale and investment expertise allow us to deliver actively managed funds and strategies to meet the needs of investors around the globe.
Thank you for choosing our family of funds.
Sincerely,

Stuart S. Parker, President
PGIM Jennison Global Opportunities Fund
December 15, 2020
| | | | |
PGIM Jennison Global Opportunities Fund | | | 3 | |
Your Fund’s Performance (unaudited)
Performance data quoted represents past performance. Past performance does not guarantee future results. The investment return and principal value of an investment will fluctuate, so that an investor’s shares, when redeemed, may be worth more or less than their original cost. Current performance may be lower or higher than the past performance data quoted. An investor may obtain performance data as of the most recent month-end by visiting our website at pgim.com/investments or by calling (800) 225-1852.
| | | | | | | | | | |
| |
| | | Average Annual Total Returns as of 10/31/20 | |
| | | One Year (%) | | Five Years (%) | | | Since Inception (%) | |
| Class A | | | | | | | | | | |
| (with sales charges) | | 48.02 | | | 18.41 | | | | 16.13 (3/14/12) | |
| (without sales charges) | | 56.63 | | | 19.76 | | | | 16.90 (3/14/12) | |
| Class C | | | | | | | | | | |
| (with sales charges) | | 54.31 | | | 18.80 | | | | 15.98 (3/14/12) | |
| (without sales charges) | | 55.31 | | | 18.80 | | | | 15.98 (3/14/12) | |
| Class Z | | | | | | | | | | |
| (without sales charges) | | 56.90 | | | 20.00 | | | | 17.15 (3/14/12) | |
| Class R2 | | | | | | | | | | |
| (without sales charges) | | 56.27 | | | N/A | | | | 41.49 (12/27/18) | |
| Class R4 | | | | | | | | | | |
| (without sales charges) | | 56.74 | | | N/A | | | | 41.90 (12/27/18) | |
| Class R6 | | | | | | | | | | |
| (without sales charges) | | 57.02 | | | 20.12 | | | | 19.12 (12/22/14) | |
| MSCI ACWI ND Index | |
| | | 4.89 | | | 8.11 | | | | — | |
| | | | | | | | | | |
|
| Average Annual Total Returns as of 10/31/20 Since Inception (%) | |
| | | Class A, C, Z (3/14/12) | | Class R2, R4 (12/27/18) | | | Class R6 (12/22/14) | |
| MSCI ACWI ND Index | | 8.20 | | | 13.05 | | | | 6.96 | |
Since Inception returns are provided since the Fund has less than 10 fiscal years of returns. Since Inception returns for the Index are measured from the closest month-end to each class’ inception date.
| | |
| 4 | | Visit our website at pgim.com/investments |
Growth of a $10,000 Investment (unaudited)
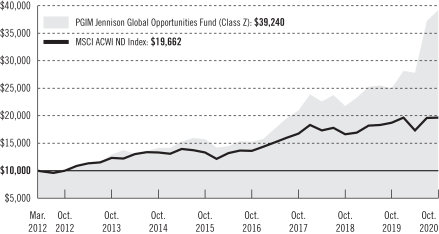
The graph compares a $10,000 investment in the Fund’s Class Z shares with a similar investment in the MSCI ACWI ND Index by portraying the initial account values at the commencement of operations for Class Z shares (March 14, 2012) and the account values at the end of the current fiscal year (October 31, 2020), as measured on a quarterly basis. For purposes of the graph, and unless otherwise indicated, it has been assumed that (a) all recurring fees (including management fees) were deducted; and (b) all dividends and distributions were reinvested. The line graph provides information for Class Z shares only. As indicated in the tables provided earlier, performance for other share classes will vary due to the differing fees and expenses applicable to each share class (as indicated in the following paragraphs). Without waiver of fees and/or expense reimbursements, if any, the returns would have been lower.
Past performance does not predict future performance. Total returns and the ending account values in the graph include changes in share price and reinvestment of dividends and capital gains distributions in a hypothetical investment for the periods shown. The Fund’s total returns do not reflect the deduction of income taxes on an individual’s investment. Taxes may reduce your actual investment returns on income or gains paid by the Fund or any gains you may realize if you sell your shares.
| | | | |
PGIM Jennison Global Opportunities Fund | | | 5 | |
Your Fund’s Performance (continued)
The returns in the tables do not reflect the deduction of taxes that a shareholder would pay on Fund distributions or following the redemption of Fund shares. The average annual total returns take into account applicable sales charges, which are described for each share class in the table below.
| | | | | | | | | | | | |
| | | | | | | |
| | | Class A | | Class C | | Class Z | | Class R2 | | Class R4 | | Class R6 |
| Maximum initial sales charge | | 5.50% of the public offering price | | None | | None | | None | | None | | None |
| Contingent deferred sales charge (CDSC) (as a percentage of the lower of the original purchase price or the net asset value at redemption) | | 1.00% on sales of $1 million or more made within 12 months of purchase | | 1.00% on sales made within 12 months of purchase | | None | | None | | None | | None |
| Annual distribution or distribution and service (12b-1) fees (shown as a percentage of average daily net assets) | | 0.30% (0.25% currently) | | 1.00% | | None | | 0.25% | | None | | None |
| Shareholder service fee | | None | | None | | None | | 0.10%* | | 0.10%* | | None |
*Shareholder service fee reflects maximum allowable fees under a shareholder services plan.
Benchmark Definitions
MSCI ACWI ND Index—The Morgan Stanley Capital International All Country World (MSCI ACWI) Net Dividends (ND) Index is a free float-adjusted market capitalization weighted index that is designed to measure the equity market performance of developed and emerging markets. The MSCI ACWI consists of 47 country indexes comprising 23 developed and 24 emerging market country indexes. The developed market country indexes included are: Australia, Austria, Belgium, Canada, Denmark, Finland, France, Germany, Hong Kong, Ireland, Israel, Italy, Japan, Netherlands, New Zealand, Norway, Portugal, Singapore, Spain, Sweden, Switzerland, the United Kingdom, and the United States. The emerging market country indexes included are: Brazil, Chile, China, Colombia, Czech Republic, Egypt, Greece, Hungary, India, Indonesia, Korea, Malaysia, Mexico, Pakistan, Peru, Philippines, Poland, Qatar, Russia, South Africa, Taiwan, Thailand, Turkey, and United Arab Emirates. The ND version of the MSCI ACWI Index reflects the impact of the maximum withholding taxes on reinvested dividends. The MSCI ACWI ND Index is unmanaged and the total return includes the reinvestment of all dividends.
Investors cannot invest directly in an index. The returns for the Index would be lower if they included the effects of sales charges, operating expenses of a mutual fund, or taxes that may be paid by an investor.
| | |
| 6 | | Visit our website at pgim.com/investments |
Presentation of Fund Holdings as of 10/31/20
| | | | | | |
| | | |
| Ten Largest Holdings | | Line of Business | | Country | | % of Net Assets |
| Tesla, Inc. | | Automobiles | | United States | | 6.6% |
| Amazon.com, Inc. | | Internet & Direct Marketing Retail | | United States | | 6.4% |
| Apple, Inc. | | Technology Hardware, Storage & Peripherals | | United States | | 6.0% |
| MercadoLibre, Inc. | | Internet & Direct Marketing Retail | | Argentina | | 5.0% |
| Adyen NV, 144A | | IT Services | | Netherlands | | 4.4% |
| Meituan (Class B Stock) | | Internet & Direct Marketing Retail | | China | | 4.2% |
| Netflix, Inc. | | Entertainment | | United States | | 3.9% |
| Shopify, Inc. (Class A Stock) | | IT Services | | Canada | | 3.7% |
| Tencent Holdings Ltd. | | Interactive Media & Services | | China | | 3.5% |
| Wuxi Biologics Cayman, Inc., 144A | | Life Sciences Tools & Services | | China | | 3.3% |
Holdings reflect only long-term investments and are subject to change.
| | | | |
PGIM Jennison Global Opportunities Fund | | | 7 | |
Strategy and Performance Overview (unaudited)
How did the Fund perform?
The PGIM Jennison Global Opportunities Fund’s Class Z shares returned 56.90% in the 12-month reporting period that ended October 31, 2020, outperforming the 4.89% return of the MSCI All Country World ND Index (the Index).
What was the market environment?
| | • | | Markets were extremely volatile during the reporting period, unsettled by US-China trade discord and the COVID-19 pandemic. |
| | • | | Stocks peaked at new highs in early 2020 and then dropped dramatically as COVID-19 spread around the globe, disrupting markets and life everywhere. |
| | • | | The realities of COVID-19 dictated daily conduct for individuals, businesses, and governments worldwide. Shelter-in-place and work-from-home policies became standard. Global infection and mortality rates reflected varying policy and social behaviors, with the number of infections and deaths highest in the US. Developing a vaccine became an overwhelming focus, with both human and capital resources deployed. |
| | • | | Markets rebounded rapidly during the period’s final months, but the pandemic’s economic damage continued to accumulate. |
| | • | | The effects of fiscal stimulus—trillions of US dollars disbursed through the US federal government’s Coronavirus Aid, Relief, and Economic Security (CARES) Act and Payroll Protection Plan—blunted COVID-19’s impacts on employment and spending. The Federal Reserve’s comprehensive monetary policy initiatives to bolster liquidity and stabilize asset prices contributed to record-low interest rates. |
What worked?
| | • | | Stock selection and allocations across most Index sectors benefited the Fund’s relative performance during the reporting period. Holdings in consumer discretionary and information technology—the Fund’s two largest sector weightings—were especially strong contributors to outperformance, as both stock selection and overweights in those sectors were beneficial. Underweighting cyclical sectors such as financials, energy, and industrials also boosted performance. |
| • | | In consumer discretionary: |
| | • | | Tesla, Inc. continued to surge on a host of impressive financial results made possible by solid production, increased capacity, and strong execution. The company’s technology, scale, and low-cost advantage make it not only the breakaway leader in the electric-vehicle market, but also position it to disrupt the overall automotive industry. |
| | • | | Consumer businesses that have migrated to digital direct-to-consumer business models were notably strong performers during the period. Amazon.com, Inc. has operated in |
| | |
| 8 | | Visit our website at pgim.com/investments |
| | this mode for years, and its relevance and dominance became even more apparent during the pandemic. The company continues to benefit from economies of scale and a platform-based business model. Through reinvestment, Amazon continues to strengthen its competitive edge. Its Amazon Web Services business is a significant additional driver of revenue and profit. |
| | • | | Meituan-Dianping is a Chinese consumer services marketplace website. The company has a strong growth outlook as China’s leading domestic consumption story, with an uptrend in food delivery market share and an opportunity to improve margins. The company has improved operating margins across all business segments. Despite the continued impact and uncertainties of COVID-19, the core food delivery business should continue to show a robust recovery while new initiatives should continue to ramp up, in Jennison’s view. |
| • | | In information technology: |
| | • | | Adyen has developed a single, dynamic, reliable, and secure payment platform that supports omni-channel commerce with end-to-end gateway, risk management, and processing services. |
| | • | | Recognition of the importance of digital commerce in times of restricted personal mobility is also benefiting Shopify, Inc., which provides cloud-based, easy-to-use infrastructure tools to enable omni-channel e-commerce capability. |
What didn’t work?
| • | | Stock selection in industrials detracted from the Fund’s performance, in aggregate: |
| | • | | A leading detractor was Safran SA, which was sold during the reporting period because of the company’s exposure to the airline industry. Most of Safran’s revenue is generated by its aerospace propulsion business, which includes the company’s joint venture with General Electric that makes 75% of the world’s narrow-body aircraft engines (including all of Boeing’s 737s and about half of Airbus’s A320s). |
| • | | In consumer discretionary, the Fund’s position in Adidas AG was eliminated due to the company’s softer-than-expected gross margins, COVID-19-related sporting event cancellations, and an anticipated backup in wholesale inventories. |
| • | | While stock selection contributed to a relative gain in the healthcare sector, a few holdings were notable detractors. |
| | • | | Straumann Group, a Swiss dental supply maker, and Intuitive Surgical, Inc., a US corporation that produces robotics to improve clinical outcomes of patients through minimally invasive surgery, were eliminated from the Fund as Jennison expected elective procedures to be delayed amid the COVID-19 pandemic. |
| | | | |
PGIM Jennison Global Opportunities Fund | | | 9 | |
Strategy and Performance Overview (continued)
| | • | | Edwards Lifesciences Corp. is the leader in the global transcatheter valve market. Jennison eliminated the position in favor of other secular growth companies. |
Current outlook
| | • | | The US economy continues to recover from the worst effects of the pandemic, but the pace of the rebound appears to be moderating. At the end of the reporting period, Congress had failed to agree on additional stimulus to take up the slack from the massive, but largely exhausted, programs approved in March 2020. Further job reductions at large companies, particularly where the effects of COVID-19 have created the most disruption, are an additional headwind. The uneven pace of reopening heightens the need for further US government action. |
| | • | | Corporate profit recovery is set to continue, aided by reduced labor and travel costs that could further expand profit margin opportunities. However, the outlook overall remains uncertain, not least because of the disruptive aftermath of the US presidential election and the pandemic’s ongoing impact. |
| | • | | COVID-19 continues to disrupt activity around the globe. Jennison is optimistic that promising results from a number of clinical trials will result in an effective vaccine in the near term. However, it may be another 12 to 18 months before a finished product—the likely prerequisite for a broad-based recovery in confidence and activity—is globally available. Sectors where share prices and operating fundamentals have been disproportionately hit by the disease will likely experience a relief rally once distribution of a vaccine begins, but a return to pre-COVID-19 operating levels will probably not transpire for some time thereafter. |
| | • | | Investors have demonstrated their preference for businesses that were thriving before COVID-19 and that have benefited from pandemic-related tailwinds and enhanced competitive positions. The Fund holds many technology, consumer, and communications services companies in this category. Prospects for their continued growth at above-average rates remain strong, in Jennison’s view. |
| | |
| 10 | | Visit our website at pgim.com/investments |
Fees and Expenses (unaudited)
As a shareholder of the Fund, you incur two types of costs: (1) transaction costs, including sales charges (loads) on purchase payments and redemptions, as applicable, and (2) ongoing costs, including management fees, distribution, and/or service (12b-1) fees, and other Fund expenses, as applicable. This example is intended to help you understand your ongoing costs (in dollars) of investing in the Fund and to compare these costs with the ongoing costs of investing in other mutual funds.
The example is based on an investment of $1,000 held through the six-month period ended October 31, 2020. The example is for illustrative purposes only; you should consult the Fund’s Prospectus for information on initial and subsequent minimum investment requirements.
Actual Expenses
The first line for each share class in the table on the following page provides information about actual account values and actual expenses. You may use the information on this line, together with the amount you invested, to estimate the expenses that you paid over the period. Simply divide your account value by $1,000 (for example, an $8,600 account value ÷ $1,000 = 8.6), then multiply the result by the number on the first line under the heading “Expenses Paid During the Six-Month Period” to estimate the expenses you paid on your account during this period.
Hypothetical Example for Comparison Purposes
The second line for each share class in the table on the following page provides information about hypothetical account values and hypothetical expenses based on the Fund’s actual expense ratio and an assumed rate of return of 5% per year before expenses, which is not the Fund’s actual return. The hypothetical account values and expenses may not be used to estimate the actual ending account balance or expenses you paid for the period. You may use this information to compare the ongoing costs of investing in the Fund and other funds. To do so, compare this 5% hypothetical example with the 5% hypothetical examples that appear in the shareholder reports of the other funds.
The Fund’s transfer agent may charge additional fees to holders of certain accounts that are not included in the expenses shown in the table on the following page. These fees apply to individual retirement accounts (IRAs) and Section 403(b) accounts. As of the close of the six-month period covered by the table, IRA fees included an annual maintenance fee of $15 per account (subject to a maximum annual maintenance fee of $25 for all accounts held by the same shareholder). Section 403(b) accounts are charged an annual $25 fiduciary maintenance fee. Some of the fees may vary in amount, or may be waived, based on your total account balance or the number of PGIM funds, including the Fund, that you own. You should consider the additional fees that were charged to your Fund account over the six-month period when you estimate the total ongoing expenses paid over the period
| | | | |
PGIM Jennison Global Opportunities Fund | | | 11 | |
Fees and Expenses (continued)
and the impact of these fees on your ending account value, as these additional expenses are not reflected in the information provided in the expense table. Additional fees have the effect of reducing investment returns.
Please note that the expenses shown in the table are meant to highlight your ongoing costs only and do not reflect any transactional costs such as sales charges (loads). Therefore, the second line for each share class in the table is useful in comparing ongoing costs only and will not help you determine the relative total costs of owning different funds. In addition, if these transactional costs were included, your costs would have been higher.
| | | | | | | | | | | | | | | | | | |
| | | | |
PGIM Jennison Global
Opportunities Fund | | Beginning Account
Value
May 1, 2020 | | | Ending Account
Value
October 31, 2020 | | | Annualized
Expense Ratio
Based on the
Six-Month Period | | | Expenses Paid
During the
Six-Month Period* | |
| Class A | | Actual | | $ | 1,000.00 | | | $ | 1,407.70 | | | | 1.08 | % | | $ | 6.54 | |
| | Hypothetical | | $ | 1,000.00 | | | $ | 1,019.71 | | | | 1.08 | % | | $ | 5.48 | |
| Class C | | Actual | | $ | 1,000.00 | | | $ | 1,401.20 | | | | 1.92 | % | | $ | 11.59 | |
| | Hypothetical | | $ | 1,000.00 | | | $ | 1,015.48 | | | | 1.92 | % | | $ | 9.73 | |
| Class Z | | Actual | | $ | 1,000.00 | | | $ | 1,408.50 | | | | 0.93 | % | | $ | 5.63 | |
| | Hypothetical | | $ | 1,000.00 | | | $ | 1,020.46 | | | | 0.93 | % | | $ | 4.72 | |
| Class R2 | | Actual | | $ | 1,000.00 | | | $ | 1,405.50 | | | | 1.38 | % | | $ | 8.34 | |
| | Hypothetical | | $ | 1,000.00 | | | $ | 1,018.20 | | | | 1.38 | % | | $ | 7.00 | |
| Class R4 | | Actual | | $ | 1,000.00 | | | $ | 1,408.00 | | | | 1.06 | % | | $ | 6.42 | |
| | Hypothetical | | $ | 1,000.00 | | | $ | 1,019.81 | | | | 1.06 | % | | $ | 5.38 | |
| Class R6 | | Actual | | $ | 1,000.00 | | | $ | 1,409.30 | | | | 0.84 | % | | $ | 5.09 | |
| | | Hypothetical | | $ | 1,000.00 | | | $ | 1,020.91 | | | | 0.84 | % | | $ | 4.27 | |
*Fund expenses (net of fee waivers or subsidies, if any) for each share class are equal to the annualized expense ratio for each share class (provided in the table), multiplied by the average account value over the period, multiplied by the 184 days in the six-month period ended October 31, 2020, and divided by the 366 days in the Fund’s fiscal year ended October 31, 2020 (to reflect the six-month period). Expenses presented in the table include the expenses of any underlying portfolios in which the Fund may invest.
| | |
| 12 | | Visit our website at pgim.com/investments |
Schedule of Investments
as of October 31, 2020
| | | | | | | | |
| | |
| Description | | Shares | | | Value | |
| | |
LONG-TERM INVESTMENTS 97.3% | | | | | | | | |
| | |
COMMON STOCKS | | | | | | | | |
| | |
Argentina 5.0% | | | | | | | | |
MercadoLibre, Inc.* | | | 247,060 | | | $ | 299,943,193 | |
| | |
Canada 3.7% | | | | | | | | |
Shopify, Inc. (Class A Stock)* | | | 242,391 | | | | 224,315,903 | |
| | |
China 12.4% | | | | | | | | |
Alibaba Group Holding Ltd., ADR* | | | 274,184 | | | | 83,541,123 | |
Meituan (Class B Stock)* | | | 6,840,469 | | | | 254,128,555 | |
Tencent Holdings Ltd. | | | 2,810,327 | | | | 214,127,635 | |
Wuxi Biologics Cayman, Inc., 144A* | | | 6,997,352 | | | | 196,596,705 | |
| | | | | | | | |
| | |
| | | | | | | 748,394,018 | |
| | |
France 11.7% | | | | | | | | |
Hermes International | | | 110,863 | | | | 102,988,791 | |
Kering SA | | | 255,875 | | | | 154,637,270 | |
L’Oreal SA | | | 349,565 | | | | 112,925,198 | |
LVMH Moet Hennessy Louis Vuitton SE | | | 393,173 | | | | 184,302,646 | |
Pernod Ricard SA | | | 436,389 | | | | 70,251,358 | |
Remy Cointreau SA(a) | | | 510,002 | | | | 86,095,241 | |
| | | | | | | | |
| | |
| | | | | | | 711,200,504 | |
| | |
Italy 2.7% | | | | | | | | |
Ferrari NV | | | 913,814 | | | | 163,085,291 | |
| | |
Netherlands 4.4% | | | | | | | | |
Adyen NV, 144A* | | | 159,600 | | | | 268,010,845 | |
| | |
Switzerland 2.0% | | | | | | | | |
Givaudan SA | | | 29,263 | | | | 119,464,189 | |
| | |
United Kingdom 1.7% | | | | | | | | |
Experian PLC | | | 2,900,208 | | | | 105,913,864 | |
| | |
United States 53.7% | | | | | | | | |
Adobe, Inc.* | | | 224,008 | | | | 100,153,977 | |
Amazon.com, Inc.* | | | 127,437 | | | | 386,917,848 | |
Apple, Inc. | | | 3,316,586 | | �� | | 361,043,552 | |
Atlassian Corp. PLC (Class A Stock)* | | | 332,406 | | | | 63,695,638 | |
DexCom, Inc.* | | | 143,239 | | | | 45,776,320 | |
DocuSign, Inc.*(a) | | | 694,810 | | | | 140,525,322 | |
See Notes to Financial Statements.
| | | | |
| PGIM Jennison Global Opportunities Fund | | | 13 | |
Schedule of Investments (continued)
as of October 31, 2020
| | | | | | | | |
| | |
| Description | | Shares | | | Value | |
| | |
COMMON STOCKS (Continued) | | | | | | | | |
| | |
United States (cont’d.) | | | | | | | | |
Dynatrace, Inc.*(a) | | | 2,972,251 | | | $ | 104,950,183 | |
Lululemon Athletica, Inc.* | | | 380,647 | | | | 121,536,781 | |
Mastercard, Inc. (Class A Stock) | | | 193,686 | | | | 55,905,527 | |
Match Group, Inc.* | | | 1,105,245 | | | | 129,070,511 | |
Microsoft Corp. | | | 880,871 | | | | 178,349,951 | |
Netflix, Inc.* | | | 490,379 | | | | 233,292,905 | |
NIKE, Inc. (Class B Stock) | | | 479,279 | | | | 57,551,822 | |
NVIDIA Corp. | | | 362,709 | | | | 181,847,784 | |
Peloton Interactive, Inc. (Class A Stock)* | | | 1,666,628 | | | | 183,679,072 | |
RingCentral, Inc. (Class A Stock)*(a) | | | 550,401 | | | | 142,190,594 | |
Snowflake, Inc. (Class A Stock)* | | | 7,669 | | | | 1,917,403 | |
Teladoc Health, Inc.*(a) | | | 433,799 | | | | 85,224,152 | |
Tesla, Inc.*(a) | | | 1,021,530 | | | | 396,394,501 | |
Trade Desk, Inc. (The) (Class A Stock)*(a) | | | 200,245 | | | | 113,428,780 | |
Twilio, Inc. (Class A Stock)* | | | 492,450 | | | | 137,378,777 | |
Zoom Video Communications, Inc. (Class A Stock)* | | | 59,633 | | | | 27,485,446 | |
| | | | | | | | |
| | | | | | | 3,248,316,846 | |
| | | | | | | | |
TOTAL LONG-TERM INVESTMENTS
(cost $3,823,516,891) | | | | | | | 5,888,644,653 | |
| | | | | | | | |
| | |
SHORT-TERM INVESTMENTS 10.6% | | | | | | | | |
| | |
AFFILIATED MUTUAL FUNDS | | | | | | | | |
PGIM Core Ultra Short Bond Fund(w) | | | 179,094,560 | | | | 179,094,560 | |
PGIM Institutional Money Market Fund
(cost $462,358,608; includes $462,227,194 of cash collateral for securities on loan)(b)(w) | | | 462,690,249 | | | | 462,551,442 | |
| | | | | | | | |
| | |
TOTAL SHORT-TERM INVESTMENTS
(cost $641,453,168) | | | | | | | 641,646,002 | |
| | | | | | | | |
| | |
TOTAL INVESTMENTS 107.9%
(cost $4,464,970,059) | | | | | | | 6,530,290,655 | |
Liabilities in excess of other assets (7.9)% | | | | | | | (477,051,423 | ) |
| | | | | | | | |
| | |
NET ASSETS 100.0% | | | | | | $ | 6,053,239,232 | |
| | | | | | | | |
Below is a list of the abbreviation(s) used in the annual report:
144A—Security was purchased pursuant to Rule 144A under the Securities Act of 1933 and, pursuant to the requirements of Rule 144A, may not be resold except to qualified institutional buyers.
ADR—American Depositary Receipt
LIBOR—London Interbank Offered Rate
| * | Non-income producing security. |
See Notes to Financial Statements.
| (a) | All or a portion of security is on loan. The aggregate market value of such securities, including those sold and pending settlement, is $422,368,170; cash collateral of $462,227,194 (included in liabilities) was received with which the Series purchased highly liquid short-term investments. In the event of significant appreciation in value of securities on loan on the last business day of the reporting period, the Series may reflect a collateral value that is less than the market value of the loaned securities and such shortfall is remedied the following business day. |
| (b) | Represents security, or portion thereof, purchased with cash collateral received for securities on loan and includes dividend reinvestment. |
| (w) | PGIM Investments LLC, the manager of the Series, also serves as manager of the PGIM Core Ultra Short Bond Fund and PGIM Institutional Money Market Fund. |
Fair Value Measurements:
Various inputs are used in determining the value of the Series’ investments. These inputs are summarized in the three broad levels listed below.
Level 1—unadjusted quoted prices generally in active markets for identical securities.
Level 2—quoted prices for similar securities, interest rates and yield curves, prepayment speeds, foreign currency exchange rates and other observable inputs.
Level 3—unobservable inputs for securities valued in accordance with Board approved fair valuation procedures.
The following is a summary of the inputs used as of October 31, 2020 in valuing such portfolio securities:
| | | | | | | | | | | | |
| | | Level 1 | | | Level 2 | | | Level 3 | |
Investments in Securities | | | | | | | | | | | | |
Assets | | | | | | | | | | | | |
Common Stocks | | | | | | | | | | | | |
Argentina | | $ | 299,943,193 | | | $ | — | | | $ | — | |
Canada | | | 224,315,903 | | | | — | | | | — | |
China | | | 83,541,123 | | | | 664,852,895 | | | | — | |
France | | | — | | | | 711,200,504 | | | | — | |
Italy | | | — | | | | 163,085,291 | | | | — | |
Netherlands | | | — | | | | 268,010,845 | | | | — | |
Switzerland | | | — | | | | 119,464,189 | | | | — | |
United Kingdom | | | — | | | | 105,913,864 | | | | — | |
United States | | | 3,248,316,846 | | | | — | | | | — | |
Affiliated Mutual Funds | | | 641,646,002 | | | | — | | | | — | |
| | | | | | | | | | | | |
Total | | $ | 4,497,763,067 | | | $ | 2,032,527,588 | | | $ | — | |
| | | | | | | | | | | | |
Industry Classification:
The industry classification of investments and liabilities in excess of other assets shown as a percentage of net assets as of October 31, 2020 were as follows (unaudited):
| | | | |
Internet & Direct Marketing Retail | | | 17.0 | % |
Software | | | 14.4 | |
IT Services | | | 11.3 | |
| | | | |
Affiliated Mutual Funds (7.6% represents investments purchased with collateral from securities on loan) | | | 10.6 | % |
Textiles, Apparel & Luxury Goods | | | 10.2 | |
Automobiles | | | 9.2 | |
See Notes to Financial Statements.
| | | | |
| PGIM Jennison Global Opportunities Fund | | | 15 | |
Schedule of Investments (continued)
as of October 31, 2020
Industry Classification (continued):
| | | | |
Technology Hardware, Storage & Peripherals | | | 6.0 | % |
Interactive Media & Services | | | 5.6 | |
Entertainment | | | 3.9 | |
Life Sciences Tools & Services | | | 3.3 | |
Leisure Products | | | 3.0 | |
Semiconductors & Semiconductor Equipment | | | 3.0 | |
Beverages | | | 2.6 | |
Chemicals | | | 2.0 | |
Personal Products | | | 1.9 | |
| | | | |
Professional Services | | | 1.7 | % |
Health Care Technology | | | 1.4 | |
Health Care Equipment & Supplies | | | 0.8 | |
| | | | |
| | | 107.9 | |
Liabilities in excess of other assets | | | (7.9 | ) |
| | | | |
| | | 100.0 | % |
| | | | |
Financial Instruments/Transactions—Summary of Offsetting and Netting Arrangements:
The Series entered into financial instruments/transactions during the reporting period that are either offset in accordance with current requirements or are subject to enforceable master netting arrangements or similar agreements that permit offsetting. The information about offsetting and related netting arrangements for financial instruments/transactions where the legal right to set-off exists is presented in the summary below.
Offsetting of financial instrument/transaction assets and liabilities:
| | | | | | | | | | | | | | | |
Description | | Gross Market
Value of Recognized
Assets/(Liabilities) | | Collateral
Pledged/(Received)(1) | | Net
Amount |
Securities on Loan | | | $ | 422,368,170 | | | | $ | (422,368,170 | ) | | | $ | — | |
| | | | | | | | | | | | | | | |
| (1) | Collateral amount disclosed by the Series is limited to the market value of financial instruments/transactions. |
See Notes to Financial Statements.
Statement of Assets and Liabilities
as of October 31, 2020
| | | | |
Assets | | | | |
Investments at value, including securities on loan of $422,368,170: | | | | |
Unaffiliated investments (cost $3,823,516,891) | | $ | 5,888,644,653 | |
Affiliated investments (cost $641,453,168) | | | 641,646,002 | |
Receivable for Series shares sold | | | 37,344,980 | |
Receivable for investments sold | | | 2,289,466 | |
Tax reclaim receivable | | | 812,403 | |
Dividends receivable | | | 191,846 | |
Prepaid expenses | | | 36,786 | |
| | | | |
Total Assets | | | 6,570,966,136 | |
| | | | |
| |
Liabilities | | | | |
Payable to broker for collateral for securities on loan | | | 462,227,194 | |
Payable for investments purchased | | | 26,269,050 | |
Payable for Series shares reacquired | | | 23,028,454 | |
Management fee payable | | | 4,157,651 | |
Accrued expenses and other liabilities | | | 1,566,184 | |
Distribution fee payable | | | 436,552 | |
Affiliated transfer agent fee payable | | | 33,889 | |
Directors’ fees payable | | | 5,933 | |
Payable to custodian | | | 1,997 | |
| | | | |
Total Liabilities | | | 517,726,904 | |
| | | | |
| |
Net Assets | | $ | 6,053,239,232 | |
| | | | |
| |
| | | | | |
Net assets were comprised of: | | | | |
Common stock, at par | | $ | 1,550,868 | |
Paid-in capital in excess of par | | | 3,901,984,150 | |
Total distributable earnings (loss) | | | 2,149,704,214 | |
| | | | |
Net assets, October 31, 2020 | | $ | 6,053,239,232 | |
| | | | |
See Notes to Financial Statements.
| | | | |
| PGIM Jennison Global Opportunities Fund | | | 17 | |
Statement of Assets and Liabilities
as of October 31, 2020
| | | | |
Class A | | | | |
Net asset value and redemption price per share,
($494,173,409 ÷ 12,834,457 shares of common stock issued and outstanding) | | $ | 38.50 | |
Maximum sales charge (5.50% of offering price) | | | 2.24 | |
| | | | |
Maximum offering price to public | | $ | 40.74 | |
| | | | |
| |
Class C | | | | |
Net asset value, offering price and redemption price per share,
($364,557,429 ÷ 10,133,296 shares of common stock issued and outstanding) | | $ | 35.98 | |
| | | | |
| |
Class Z | | | | |
Net asset value, offering price and redemption price per share,
($3,390,005,751 ÷ 86,386,784 shares of common stock issued and outstanding) | | $ | 39.24 | |
| | | | |
| |
Class R2 | | | | |
Net asset value, offering price and redemption price per share,
($376,879 ÷ 9,638 shares of common stock issued and outstanding) | | $ | 39.10 | |
| | | | |
| |
Class R4 | | | | |
Net asset value, offering price and redemption price per share,
($505,375 ÷ 12,856 shares of common stock issued and outstanding) | | $ | 39.31 | |
| | | | |
| |
Class R6 | | | | |
Net asset value, offering price and redemption price per share,
($1,803,620,389 ÷ 45,709,811 shares of common stock issued and outstanding) | | $ | 39.46 | |
| | | | |
See Notes to Financial Statements.
Statement of Operations
Year Ended October 31, 2020
| | | | |
Net Investment Income (Loss) | | | | |
Income | | | | |
Unaffiliated dividend income (net of $1,413,587 foreign withholding tax) | | $ | 13,859,404 | |
Income from securities lending, net (including affiliated income of $1,145,819) | | | 1,318,708 | |
Affiliated dividend income | | | 550,600 | |
| | | | |
Total income | | | 15,728,712 | |
| | | | |
| |
Expenses | | | | |
Management fee | | | 32,542,240 | |
Distribution fee(a) | | | 3,826,119 | |
Shareholder servicing fees(a) | | | 356 | |
Transfer agent’s fees and expenses (including affiliated expense of $215,148)(a) | | | 2,740,272 | |
Custodian and accounting fees | | | 567,936 | |
Registration fees(a) | | | 394,677 | |
Shareholders’ reports | | | 146,011 | |
SEC registration fees | | | 104,752 | |
Directors’ fees | | | 61,423 | |
Legal fees and expenses | | | 37,766 | |
Audit fee | | | 27,762 | |
Miscellaneous | | | 63,327 | |
| | | | |
Total expenses | | | 40,512,641 | |
Less: Fee waiver and/or expense reimbursement(a) | | | (501,442 | ) |
Distribution fee waiver(a) | | | (172,141 | ) |
| | | | |
Net expenses | | | 39,839,058 | |
| | | | |
Net investment income (loss) | | | (24,110,346 | ) |
| | | | |
| |
Realized And Unrealized Gain (Loss) On Investment And Foreign Currency Transactions | | | | |
Net realized gain (loss) on: | | | | |
Investment transactions (including affiliated of $(454,674)) | | | 185,957,690 | |
Foreign currency transactions | | | (79,651 | ) |
| | | | |
| | | 185,878,039 | |
| | | | |
Net change in unrealized appreciation (depreciation) on: | | | | |
Investments (including affiliated of $147,128) | | | 1,677,130,615 | |
Foreign currencies | | | (16,416 | ) |
| | | | |
| | | 1,677,114,199 | |
| | | | |
Net gain (loss) on investment and foreign currency transactions | | | 1,862,992,238 | |
| | | | |
Net Increase (Decrease) In Net Assets Resulting From Operations | | $ | 1,838,881,892 | |
| | | | |
| (a) | Class specific expenses and waivers were as follows: |
| | | | | | | | | | | | | | | | | | | | | | | | |
| | | Class A | | | Class C | | | Class Z | | | Class R2 | | | Class R4 | | | Class R6 | |
Distribution fee | | | 1,032,849 | | | | 2,792,718 | | | | — | | | | 552 | | | | — | | | | — | |
Shareholder servicing fees | | | — | | | | — | | | | — | | | | 162 | | | | 194 | | | | — | |
Transfer agent’s fees and expenses | | | 325,220 | | | | 245,531 | | | | 2,160,185 | | | | 357 | | | | 693 | | | | 8,286 | |
Registration fees | | | 51,916 | | | | 32,823 | | | | 136,828 | | | | 14,041 | | | | 14,041 | | | | 145,028 | |
Fee waiver and/or expense reimbursement | | | (381,601 | ) | | | (8,525 | ) | | | (30,326 | ) | | | (14,019 | ) | | | (14,131 | ) | | | (52,840 | ) |
Distribution fee waiver | | | (172,141 | ) | | | — | | | | — | | | | — | | | | — | | | | — | |
See Notes to Financial Statements.
| | | | |
| PGIM Jennison Global Opportunities Fund | | | 19 | |
Statements of Changes in Net Assets
| | | | | | | | |
| | | Year Ended
October 31, | |
| | |
| | | 2020 | | | 2019 | |
| | |
Increase (Decrease) in Net Assets | | | | | | | | |
Operations | | | | | | | | |
Net investment income (loss) | | $ | (24,110,346 | ) | | $ | (8,341,596 | ) |
Net realized gain (loss) on investment and foreign currency transactions | | | 185,878,039 | | | | (15,157,102 | ) |
Net change in unrealized appreciation (depreciation) on investments and foreign currencies | | | 1,677,114,199 | | | | 265,888,200 | |
| | | | | | | | |
Net increase (decrease) in net assets resulting from operations | | | 1,838,881,892 | | | | 242,389,502 | |
| | | | | | | | |
Series share transactions (Net of share conversions) | | | | | | | | |
Net proceeds from shares sold | | | 2,869,534,185 | | | | 1,382,201,174 | |
Cost of shares reacquired | | | (1,210,949,163 | ) | | | (582,671,951 | ) |
| | | | | | | | |
Net increase (decrease) in net assets from Series share transactions | | | 1,658,585,022 | | | | 799,529,223 | |
| | | | | | | | |
Total increase (decrease) | | | 3,497,466,914 | | | | 1,041,918,725 | |
| | |
Net Assets: | | | | | | | | |
Beginning of year | | | 2,555,772,318 | | | | 1,513,853,593 | |
| | | | | | | | |
End of year | | $ | 6,053,239,232 | | | $ | 2,555,772,318 | |
| | | | | | | | |
See Notes to Financial Statements.
Notes to Financial Statements
Prudential World Fund, Inc. (the “Fund”) is registered under the Investment Company Act of 1940, as amended (“1940 Act”), as an open-end management investment company and currently consists of seven series: PGIM Jennison Emerging Markets Equity Opportunities Fund, PGIM Jennison Global Infrastructure Fund, PGIM Jennison Global Opportunities Fund, PGIM Jennison International Opportunities Fund and PGIM QMA International Equity Fund, each of which are diversified funds for purposes of the 1940 Act and PGIM Emerging Markets Debt Hard Currency Fund and PGIM Emerging Markets Debt Local Currency Fund, each of which are non-diversified funds for purposes of the 1940 Act, and therefore, may invest a greater percentage of their assets in the securities of a single company or other issuer than a diversified fund. Investing in a non-diversified fund involves greater risk than investing in a diversified fund because a loss resulting from the decline in value of any one security may represent a greater portion of the total assets of a non-diversified fund. These financial statements relate only to the PGIM Jennison Global Opportunities Fund (the “Series”).
The investment objective of the Series is to seek long-term growth of capital.
The Series follows the investment company accounting and reporting guidance of the Financial Accounting Standards Board (“FASB”) Accounting Standard Codification (“ASC”) Topic 946 Financial Services — Investment Companies. The following accounting policies conform to U.S. generally accepted accounting principles. The Series consistently follows such policies in the preparation of its financial statements.
Securities Valuation: The Series holds securities and other assets and liabilities that are fair valued at the close of each day (generally, 4:00 PM Eastern time) the New York Stock Exchange (“NYSE”) is open for trading. Fair value is the price that would be received to sell an asset or paid to transfer a liability in an orderly transaction between market participants on the measurement date. The Fund’s Board of Directors (the “Board”) has adopted valuation procedures for security valuation under which fair valuation responsibilities have been delegated to PGIM Investments LLC (“PGIM Investments” or the “Manager”). Pursuant to the Board’s delegation, the Manager has established a Valuation Committee responsible for supervising the fair valuation of portfolio securities and other assets and liabilities. The valuation procedures permit the Series to utilize independent pricing vendor services, quotations from market makers, and alternative valuation methods when market quotations are either not readily available or not deemed representative of fair value. A record of the Valuation Committee’s actions is subject to the Board’s review, approval, and ratification at its next regularly scheduled quarterly meeting.
| | | | |
| PGIM Jennison Global Opportunities Fund | | | 21 | |
Notes to Financial Statements (continued)
For the fiscal reporting year-end, securities and other assets and liabilities were fair valued at the close of the last U.S. business day. Trading in certain foreign securities may occur when the NYSE is closed (including weekends and holidays). Because such foreign securities trade in markets that are open on weekends and U.S. holidays, the values of some of the Series’ foreign investments may change on days when investors cannot purchase or redeem Series shares.
Various inputs determine how the Series’ investments are valued, all of which are categorized according to the three broad levels (Level 1, 2, or 3) detailed in the Schedule of Investments and referred to herein as the “fair value hierarchy” in accordance with FASB ASC Topic 820 - Fair Value Measurements and Disclosures.
Common or preferred stocks, exchange-traded funds and derivative instruments, if applicable, that are traded on a national securities exchange are valued at the last sale price as of the close of trading on the applicable exchange where the security principally trades. Securities traded via NASDAQ are valued at the NASDAQ official closing price. To the extent these securities are valued at the last sale price or NASDAQ official closing price, they are classified as Level 1 in the fair value hierarchy. In the event that no sale or official closing price on valuation date exists, these securities are generally valued at the mean between the last reported bid and ask prices, or at the last bid price in the absence of an ask price. These securities are classified as Level 2 in the fair value hierarchy.
Foreign equities traded on foreign securities exchanges are generally valued using pricing vendor services that provide model prices derived using adjustment factors based on information such as local closing price, relevant general and sector indices, currency fluctuations, depositary receipts, and futures, as applicable. Securities valued using such model prices are classified as Level 2 in the fair value hierarchy. The models generate an evaluated adjustment factor for each security, which is applied to the local closing price to adjust it for post closing market movements up to the time the Series is valued. Utilizing that evaluated adjustment factor, the vendor provides an evaluated price for each security. If the vendor does not provide an evaluated price, securities are valued in accordance with exchange-traded common and preferred stock valuation policies discussed above.
Investments in open-end funds (other than exchange-traded funds) are valued at their net asset values as of the close of the NYSE on the date of valuation. These securities are classified as Level 1 in the fair value hierarchy since they may be purchased or sold at their net asset values on the date of valuation.
Securities and other assets that cannot be priced according to the methods described above are valued based on pricing methodologies approved by the Board. In the event that
unobservable inputs are used when determining such valuations, the securities will be classified as Level 3 in the fair value hierarchy.
When determining the fair value of securities, some of the factors influencing the valuation include: the nature of any restrictions on disposition of the securities; assessment of the general liquidity of the securities; the issuer’s financial condition and the markets in which it does business; the cost of the investment; the size of the holding and the capitalization of the issuer; the prices of any recent transactions or bids/offers for such securities or any comparable securities; any available analyst media or other reports or information deemed reliable by the Manager regarding the issuer or the markets or industry in which it operates. Using fair value to price securities may result in a value that is different from a security’s most recent closing price and from the price used by other unaffiliated mutual funds to calculate their net asset values.
Foreign Currency Translation: The books and records of the Series are maintained in U.S. dollars. Foreign currency amounts are translated into U.S. dollars on the following basis:
(i) market value of investment securities, other assets and liabilities — at the current rates of exchange;
(ii) purchases and sales of investment securities, income and expenses — at the rates of exchange prevailing on the respective dates of such transactions.
Although the net assets of the Series are presented at the foreign exchange rates and market values at the close of the period, the Series does not generally isolate that portion of the results of operations arising as a result of changes in the foreign exchange rates from the fluctuations arising from changes in the market prices of long-term portfolio securities held at the end of the period. Similarly, the Series does not isolate the effect of changes in foreign exchange rates from the fluctuations arising from changes in the market prices of long-term portfolio securities sold during the period. Accordingly, holding period realized foreign currency gains (losses) are included in the reported net realized gains (losses) on investment transactions.
Net realized gains (losses) on foreign currency transactions represent net foreign exchange gains (losses) from the disposition of holdings of foreign currencies, currency gains (losses) realized between the trade and settlement dates on investment transactions, and the difference between the amounts of interest, dividends and foreign withholding taxes recorded on the Series’ books and the U.S. dollar equivalent amounts actually received or paid. Net unrealized currency gains (losses) arise from valuing foreign currency denominated assets and liabilities (other than investments) at period end exchange rates.
Master Netting Arrangements: The Fund, on behalf of the Series, is subject to various Master Agreements, or netting arrangements, with select counterparties. These are agreements which a subadviser may have negotiated and entered into on behalf of all or a portion of the Series. A master netting arrangement between the Series and the counterparty
| | | | |
| PGIM Jennison Global Opportunities Fund | | | 23 | |
Notes to Financial Statements (continued)
permits the Series to offset amounts payable by the Series to the same counterparty against amounts to be received; and by the receipt of collateral from the counterparty by the Series to cover the Series’ exposure to the counterparty. However, there is no assurance that such mitigating factors are easily enforceable. In addition to master netting arrangements, the right to set-off exists when all the conditions are met such that each of the parties owes the other determinable amounts, the reporting party has the right to set-off the amount owed with the amount owed by the other party, the reporting party intends to set-off and the right of set-off is enforceable by law. During the reporting period, there was no intention to settle on a net basis and all amounts are presented on a gross basis on the Statement of Assets and Liabilities.
Securities Lending: The Series lends its portfolio securities to banks and broker-dealers. The loans are secured by collateral at least equal to the market value of the securities loaned. Collateral pledged by each borrower is invested in an affiliated money market fund and is marked to market daily, based on the previous day’s market value, such that the value of the collateral exceeds the value of the loaned securities. In the event of significant appreciation in value of securities on loan on the last business day of the reporting period, the financial statements may reflect a collateral value that is less than the market value of the loaned securities. Such shortfall is remedied as described above. Loans are subject to termination at the option of the borrower or the Series. Upon termination of the loan, the borrower will return to the Series securities identical to the loaned securities. Should the borrower of the securities fail financially, the Series has the right to repurchase the securities in the open market using the collateral.
The Series recognizes income, net of any rebate and securities lending agent fees, for lending its securities in the form of fees or interest on the investment of any cash received as collateral. The borrower receives all interest and dividends from the securities loaned and such payments are passed back to the lender in amounts equivalent thereto, which are reflected in interest income or unaffiliated dividend income based upon the nature of the payment on the Statement of Operations. The Series also continues to recognize any unrealized gain (loss) in the market price of the securities loaned and on the change in the value of the collateral invested that may occur during the term of the loan. In addition, realized gain (loss) is recognized on changes in the value of the collateral invested upon liquidation of the collateral. Net earnings from securities lending are disclosed in the Statement of Operations.
Securities Transactions and Net Investment Income: Securities transactions are recorded on the trade date. Realized gains (losses) from investment and currency transactions are calculated on the specific identification method. Dividend income is recorded on the ex-date, or for certain foreign securities, when the Series becomes aware of such dividends. Expenses are recorded on an accrual basis, which may require the use of certain estimates
by management that may differ from actual. Net investment income or loss (other than class specific expenses and waivers, which are allocated as noted below) and unrealized and realized gains (losses) are allocated daily to each class of shares based upon the relative proportion of adjusted net assets of each class at the beginning of the day. Class specific expenses and waivers, where applicable, are charged to the respective share classes. Class specific expenses include distribution fees and distribution fee waivers, shareholder servicing fees, transfer agent’s fees and expenses, registration fees and fee waivers and/or expense reimbursements, as applicable.
Taxes: It is the Series’ policy to continue to meet the requirements of the Internal Revenue Code applicable to regulated investment companies and to distribute all of its taxable net investment income and capital gains, if any, to its shareholders. Therefore, no federal income tax provision is required. Withholding taxes on foreign dividends, interest and capital gains, if any, are recorded, net of reclaimable amounts, at the time the related income is earned.
Dividends and Distributions: The Series expects to pay dividends from net investment income and distributions from net realized capital and currency gains, if any, annually. Dividends and distributions to shareholders, which are determined in accordance with federal income tax regulations and which may differ from generally accepted accounting principles, are recorded on the ex-date. Permanent book/tax differences relating to income and gain (loss) are reclassified between total distributable earnings (loss) and paid-in capital in excess of par, as appropriate.
Estimates: The preparation of financial statements requires management to make estimates and assumptions that affect the reported amounts and disclosures in the financial statements. Actual results could differ from those estimates.
The Fund, on behalf of the Series, has a management agreement with the Manager. Pursuant to this agreement, the Manager has responsibility for all investment advisory services and supervises the subadviser’s performance of such services. In addition, under the management agreement, the Manager provides all of the administrative functions necessary for the organization, operation and management of the Series. The Manager administers the corporate affairs of the Series and, in connection therewith, furnishes the Series with office facilities, together with those ordinary clerical and bookkeeping services which are not being furnished by the Series’ custodian and the Series’ transfer agent. The Manager is also responsible for the staffing and management of dedicated groups of legal, marketing, compliance and related personnel necessary for the operation of the Series. The legal, marketing, compliance and related personnel are also responsible for the management and oversight of the various service providers to the Series, including, but not limited to, the custodian, transfer agent, and accounting agent.
| | | | |
| PGIM Jennison Global Opportunities Fund | | | 25 | |
Notes to Financial Statements (continued)
The Manager has entered into a subadvisory agreement with Jennison Associates LLC (“Jennison”). The subadvisory agreement provides that Jennison will furnish investment advisory services in connection with the management of the Series. In connection therewith, Jennison is obligated to keep certain books and records of the Series. The Manager pays for the services of Jennison, the cost of compensation of officers of the Series, occupancy and certain clerical and bookkeeping costs of the Series. The Series bears all other costs and expenses.
The management fee paid to the Manager is accrued daily and payable monthly at an annual rate of 0.825% of the Series’ average daily net assets up to $1 billion and 0.800% of such assets in excess of $1 billion. The effective management fee rate before any waivers and/or expense reimbursements was 0.806% for the year ended October 31, 2020.
Effective March 1, 2020, the Manager has contractually agreed, through February 28, 2022, to limit net annual operating expenses (exclusive of distribution and service (12b-1) fees, shareholder servicing fee, and transfer agency expenses (including sub-transfer agency and networking fees), of each class of shares to 0.84% of the Series’ average daily net assets. Prior to March 1, 2020, the Manager had contractually agreed, to limit net annual operating expenses (exclusive of distribution and service (12b-1) fees and transfer agency expenses (including sub-transfer agency and networking fees), of each class of shares to 0.84% of the Series’ average daily net assets. Separately, the Manager has contractually agreed, through February 28, 2022, to limit transfer agency, shareholder servicing, sub-transfer agency, and blue sky fees, as applicable, to the extent that such fees cause the net Series annual operating expenses to exceed 1.34% of average daily net assets for Class R2 shares or 1.09% of average daily net assets for Class R4 shares.Additionally, the Manager has contractually agreed, through February 28, 2022, to limit annual operating expenses after fee waivers and/or expense reimbursements to 1.08% of average daily net assets for Class A shares. These contractual waivers exclude interest, brokerage, taxes (such as income and foreign withholding taxes, stamp duty and deferred tax expenses), acquired fund fees and expenses, extraordinary expenses, and certain other Series expenses such as dividend and interest expense and broker charges on short sales.
Where applicable, the Manager agrees to waive management fees or shared operating expenses on any share class to the same extent that it waives such expenses on any other share class and, in addition, total annual operating expenses for Class R6 shares will not exceed total annual operating expenses for Class Z shares. Fees and/or expenses waived and/or reimbursed by the Manager may be recouped by the Manager within the same fiscal year during which such waiver/reimbursement is made if such recoupment can be realized without exceeding the expense limit in effect at the time of the recoupment for that fiscal year.
The Fund, on behalf of the Series, has a distribution agreement with Prudential Investment Management Services LLC (“PIMS”), which acts as the distributor of the Class A, Class C, Class Z, Class R2, Class R4 and Class R6 shares of the Series. The Series compensates PIMS for distributing and servicing the Series’ Class A, Class C and Class R2 shares, pursuant to the plans of distribution (the “Distribution Plans”), regardless of expenses actually incurred by PIMS. The distribution fees are accrued daily and payable monthly. No distribution or service fees are paid to PIMS as distributor of the Class Z, Class R4 and Class R6 shares of the Series.
Pursuant to the Distribution Plans, the Series compensates PIMS for distribution related activities at an annual rate of up to 0.30%, 1% and 0.25% of the average daily net assets of the Class A, Class C and Class R2 shares, respectively. PIMS has contractually agreed through February 28, 2022 to limit such fees to 0.25% of the average daily net assets of the Class A shares.
The Series has adopted a Shareholder Services Plan with respect to Class R2 and Class R4 shares. Under the terms of the Shareholder Services Plan, Class R2 and Class R4 shares are authorized to pay to Prudential Mutual Fund Services LLC (“PMFS”), its affiliates or third-party service providers, as compensation for services rendered to the shareholders of such Class R2 or Class R4 shares, a shareholder service fee at an annual rate of up to 0.10% of the average daily net assets attributable to Class R2 and Class R4 shares. The shareholder service fee is accrued daily and paid monthly, as applicable.
For the year ended October 31, 2020, PIMS received $2,799,025 in front-end sales charges resulting from sales of Class A shares. Additionally, for the year ended October 31, 2020, PIMS received $4,761 and $31,933 in contingent deferred sales charges imposed upon redemptions by certain Class A and Class C shareholders, respectively. From these fees, PIMS paid such sales charges to broker-dealers, who in turn paid commissions to salespersons and incurred other distribution costs.
PGIM Investments, PIMS, PMFS and Jennison are indirect, wholly-owned subsidiaries of Prudential Financial, Inc. (“Prudential”).
4. Other Transactions with Affiliates
PMFS serves as the Series’ transfer agent. Transfer agent’s fees and expenses in the Statement of Operations include certain out-of-pocket expenses paid to non-affiliates, where applicable.
The Series may invest its overnight sweep cash in the PGIM Core Ultra Short Bond Fund (the “Core Fund”), and its securities lending cash collateral in the PGIM Institutional Money Market Fund (the “Money Market Fund”), each a series of Prudential Investment Portfolios 2, registered under the 1940 Act and managed by PGIM Investments. Through the Series’ investments in the mentioned underlying funds, PGIM Investments and/or its affiliates are paid fees or reimbursed for providing their services. In addition to the realized and
| | | | |
| PGIM Jennison Global Opportunities Fund | | | 27 | |
Notes to Financial Statements (continued)
unrealized gains on investments in the Core Fund and Money Market Fund, earnings from such investments are disclosed on the Statement of Operations as “Affiliated dividend income” and “Income from securities lending, net”, respectively.
The Series may enter into certain securities purchase or sale transactions under Board approved Rule 17a-7 procedures. Rule 17a-7 is an exemptive rule under the 1940 Act, that subject to certain conditions, permits purchase and sale transactions among affiliated investment companies, or between an investment company and a person that is affiliated solely by reason of having a common (or affiliated) investment adviser, common directors, and/or common officers. Pursuant to the Rule 17a-7 procedures and consistent with guidance issued by the Securities and Exchange Commission (“SEC”), the Fund’s Chief Compliance Officer (“CCO”) prepares a quarterly summary of all such transactions for submission to the Board, together with the CCO’s written representation that all such 17a-7 transactions were effected in accordance with the Series’ Rule 17a-7 procedures. For the year ended October 31, 2020, no 17a-7 transactions were entered into by the Series.
5. Portfolio Securities
The aggregate cost of purchases and proceeds from sales of portfolio securities (excluding short-term investments and U.S. Government securities) for the year ended October 31, 2020, were $3,764,823,926 and $2,275,311,879, respectively.
A summary of the cost of purchases and proceeds from sales of shares of affiliated investments for the year ended October 31, 2020, is presented as follows:
| | | | | | | | | | | | | | | | | | | | | | | | | | | | |
Value,
Beginning
of Year | | Cost of
Purchases | | | Proceeds
from Sales | | | Change in
Unrealized
Gain
(Loss) | | | Realized
Gain
(Loss) | | | Value, End
of Year | | | Shares,
End
of Year | | | Income | |
| | | | |
PGIM Core Ultra Short Bond Fund* | | | | | | | | | | | | | | | | | |
| $39,563,382 | | $ | 1,725,553,540 | | | $ | 1,586,022,362 | | | $ | — | | | $ | — | | | $ | 179,094,560 | | | | 179,094,560 | | | $ | 550,600 | |
| | | | |
PGIM Institutional Money Market Fund* | | | | | | | | | | | | | | | | | |
| 216,507,339 | | | 4,400,128,382 | | | | 4,153,776,733 | | | | 147,128 | | | | (454,674 | ) | | | 462,551,442 | | | | 462,690,249 | | | | 1,145,819 | ** |
| | | | | | | | | | | | | | | | | | | | | | | | | | | | |
| $256,070,721 | | $ | 6,125,681,922 | | | $ | 5,739,799,095 | | | $ | 147,128 | | | $ | (454,674 | ) | | $ | 641,646,002 | | | | | | | $ | 1,696,419 | |
| | | | | | | | | | | | | | | | | | | | | | | | | | | | |
| * | The Fund did not have any capital gain distributions during the reporting period. |
| ** | The amount, or a portion thereof, represents the affiliated securities lending income shown on the Statement of Operations. |
6. Distributions and Tax Information
Distributions to shareholders, which are determined in accordance with federal income tax regulations and which may differ from generally accepted accounting principles, are recorded on the ex-date.
For the years ended October 31, 2020, and October 31, 2019, there were no distributions paid by the Series.
As of October 31, 2020, the accumulated undistributed earnings on a tax basis were $879,787 of ordinary income and $119,203,167 of long-term capital gains.
The United States federal income tax basis of the Series’ investments and the net unrealized appreciation as of October 31, 2020 were as follows:
| | | | | | |
Tax Basis | | Gross
Unrealized
Appreciation | | Gross
Unrealized
Depreciation | | Net
Unrealized
Appreciation |
| $4,484,259,130 | | $2,070,356,284 | | $(24,324,759) | | $2,046,031,525 |
The difference between book basis and tax basis was primarily due to deferred losses on wash sales and corporate spin-off adjustment.
The Series utilized approximately $55,063,000 of its capital loss carryforward to offset net taxable gains realized in the fiscal year ended October 31, 2020.
The Series elected to treat certain late-year ordinary income losses of approximately $16,406,000 as having been incurred in the following fiscal year (October 31, 2021).
The Manager has analyzed the Series’ tax positions taken on federal, state and local income tax returns for all open tax years and has concluded that no provision for income tax is required in the Series’ financial statements for the current reporting period. Since tax authorities can examine previously filed tax returns, the Series’ U.S. federal and state tax returns for each of the four fiscal years up to the most recent fiscal year ended October 31, 2020 are subject to such review.
7. Capital and Ownership
The Series offers Class A, Class C, Class Z, Class R2, Class R4 and Class R6 shares. Class A shares are sold with a maximum front-end sales charge of 5.50%. Investors who purchase $1 million or more of Class A shares and sell these shares within 12 months of purchase are subject to a contingent deferred sales charge (“CDSC”) of 1%, although they are not subject to an initial sales charge. The Class A CDSC is waived for certain retirement and/or benefit plans. A special exchange privilege is also available for shareholders who qualified to purchase Class A shares at net asset value. Class C shares are sold with a CDSC of 1% on sales made within 12 months of purchase. Class C shares will automatically convert to Class A shares on a monthly basis approximately 10 years after purchase. Class Z, Class R2,
| | | | |
| PGIM Jennison Global Opportunities Fund | | | 29 | |
Notes to Financial Statements (continued)
Class R4 and Class R6 shares are not subject to any sales or redemption charges and are available exclusively for sale to a limited group of investors.
Under certain circumstances, an exchange may be made from specified share classes of the Series to one or more other share classes of the Series as presented in the table of transactions in shares of common stock, below.
The Fund is authorized to issue 5.075 billion shares of common stock, $0.01 par value per share, 950 million of which are designated as shares of the Series. The shares are further classified and designated as follows:
| | | | |
Class A | | | 50,000,000 | |
Class C | | | 70,000,000 | |
Class Z | | | 300,000,000 | |
Class T | | | 125,000,000 | |
Class R2 | | | 75,000,000 | |
Class R4 | | | 75,000,000 | |
Class R6 | | | 255,000,000 | |
The Series currently does not have any Class T shares outstanding.
As of October 31, 2020, Prudential, through its affiliated entities, including affiliated funds (if applicable), owned shares of the Series as follows:
| | | | | | | | | | |
| | | Number of Shares | | Percentage of
Outstanding Shares |
Class R2 | | 486 | | 5.0% |
Class R4 | | 486 | | 3.8% |
At the reporting period end, the number of shareholders holding greater than 5% of the Series are as follows:
| | | | | | |
| Affiliated | | Unaffiliated |
Number of
Shareholders | | Percentage of
Outstanding Shares | | Number of
Shareholders | | Percentage of
Outstanding Shares |
— | | —% | | 6 | | 76.9% |
Transactions in shares of common stock were as follows:
| | | | | | | | |
Class A | | Shares | | | Amount | |
Year ended October 31, 2020: | | | | | | | | |
Shares sold | | | 5,738,717 | | | $ | 181,584,437 | |
Shares reacquired | | | (2,465,079 | ) | | | (74,149,989 | ) |
| | | | | | | | |
Net increase (decrease) in shares outstanding before conversion | | | 3,273,638 | | | | 107,434,448 | |
Shares issued upon conversion from other share class(es) | | | 428,288 | | | | 13,295,901 | |
Shares reacquired upon conversion into other share class(es) | | | (474,524 | ) | | | (15,077,525 | ) |
| | | | | | | | |
Net increase (decrease) in shares outstanding | | | 3,227,402 | | | $ | 105,652,824 | |
| | | | | | | | |
Year ended October 31, 2019: | | | | | | | | |
Shares sold | | | 3,574,488 | | | $ | 84,046,392 | |
Shares reacquired | | | (1,608,919 | ) | | | (37,497,401 | ) |
| | | | | | | | |
Net increase (decrease) in shares outstanding before conversion | | | 1,965,569 | | | | 46,548,991 | |
Shares issued upon conversion from other share class(es) | | | 474,149 | | | | 11,517,082 | |
Shares reacquired upon conversion into other share class(es) | | | (505,773 | ) | | | (12,200,682 | ) |
| | | | | | | | |
Net increase (decrease) in shares outstanding | | | 1,933,945 | | | $ | 45,865,391 | |
| | | | | | | | |
Class C | | | | | | |
Year ended October 31, 2020: | | | | | | | | |
Shares sold | | | 3,153,742 | | | $ | 91,465,665 | |
Shares reacquired | | | (1,559,131 | ) | | | (43,284,069 | ) |
| | | | | | | | |
Net increase (decrease) in shares outstanding before conversion | | | 1,594,611 | | | | 48,181,596 | |
Shares reacquired upon conversion into other share class(es) | | | (584,386 | ) | | | (16,711,305 | ) |
| | | | | | | | |
Net increase (decrease) in shares outstanding | | | 1,010,225 | | | $ | 31,470,291 | |
| | | | | | | | |
Year ended October 31, 2019: | | | | | | | | |
Shares sold | | | 2,968,766 | | | $ | 65,835,812 | |
Shares reacquired | | | (1,453,589 | ) | | | (31,834,459 | ) |
| | | | | | | | |
Net increase (decrease) in shares outstanding before conversion | | | 1,515,177 | | | | 34,001,353 | |
Shares reacquired upon conversion into other share class(es) | | | (651,781 | ) | | | (14,977,319 | ) |
| | | | | | | | |
Net increase (decrease) in shares outstanding | | | 863,396 | | | $ | 19,024,034 | |
| | | | | | | | |
Class Z | | | | | | |
Year ended October 31, 2020: | | | | | | | | |
Shares sold | | | 54,820,204 | | | $ | 1,691,528,205 | |
Shares reacquired | | | (27,602,817 | ) | | | (875,896,188 | ) |
| | | | | | | | |
Net increase (decrease) in shares outstanding before conversion | | | 27,217,387 | | | | 815,632,017 | |
Shares issued upon conversion from other share class(es) | | | 853,698 | | | | 26,946,718 | |
Shares reacquired upon conversion into other share class(es) | | | (323,337 | ) | | | (10,207,454 | ) |
| | | | | | | | |
Net increase (decrease) in shares outstanding | | | 27,747,748 | | | $ | 832,371,281 | |
| | | | | | | | |
Year ended October 31, 2019: | | | | | | | | |
Shares sold | | | 34,742,508 | | | $ | 829,611,273 | |
Shares reacquired | | | (19,222,576 | ) | | | (449,656,211 | ) |
| | | | | | | | |
Net increase (decrease) in shares outstanding before conversion | | | 15,519,932 | | | | 379,955,062 | |
Shares issued upon conversion from other share class(es) | | | 823,877 | | | | 20,194,422 | |
Shares reacquired upon conversion into other share class(es) | | | (211,940 | ) | | | (5,148,266 | ) |
| | | | | | | | |
Net increase (decrease) in shares outstanding | | | 16,131,869 | | | $ | 395,001,218 | |
| | | | | | | | |
| | | | |
| PGIM Jennison Global Opportunities Fund | | | 31 | |
Notes to Financial Statements (continued)
| | | | | | | | |
Class R2 | | Shares | | | Amount | |
Year ended October 31, 2020: | | | | | | | | |
Shares sold | | | 9,568 | | | $ | 296,916 | |
Shares reacquired | | | (416 | ) | | | (15,390 | ) |
| | | | | | | | |
Net increase (decrease) in shares outstanding | | | 9,152 | | | $ | 281,526 | |
| | | | | | | | |
Period ended October 31, 2019*: | | | | | | | | |
Shares sold | | | 1,288 | | | $ | 30,000 | |
| | | | | | | | |
Net increase (decrease) in shares outstanding before conversion | | | 1,288 | | | | 30,000 | |
Shares reacquired upon conversion into other share class(es) | | | (802 | ) | | | (19,896 | ) |
| | | | | | | | |
Net increase (decrease) in shares outstanding | | | 486 | | | $ | 10,104 | |
| | | | | | | | |
Class R4 | | | | | | |
Year ended October 31, 2020: | | | | | | | | |
Shares sold | | | 1,345 | | | $ | 40,198 | |
Shares reacquired | | | (2,925 | ) | | | (101,382 | ) |
| | | | | | | | |
Net increase (decrease) in shares outstanding | | | (1,580 | ) | | $ | (61,184 | ) |
| | | | | | | | |
Period ended October 31, 2019*: | | | | | | | | |
Shares sold | | | 15,428 | | | $ | 381,279 | |
Shares reacquired | | | —** | | | | (4 | ) |
| | | | | | | | |
Net increase (decrease) in shares outstanding before conversion | | | 15,428 | | | | 381,275 | |
Shares reacquired upon conversion into other share class(es) | | | (992 | ) | | | (24,682 | ) |
| | | | | | | | |
Net increase (decrease) in shares outstanding | | | 14,436 | | | $ | 356,593 | |
| | | | | | | | |
Class R6 | | | | | | |
Year ended October 31, 2020: | | | | | | | | |
Shares sold | | | 26,781,782 | | | $ | 904,618,764 | |
Shares reacquired | | | (6,652,807 | ) | | | (217,502,145 | ) |
| | | | | | | | |
Net increase (decrease) in shares outstanding before conversion | | | 20,128,975 | | | | 687,116,619 | |
Shares issued upon conversion from other share class(es) | | | 59,984 | | | | 1,964,598 | |
Shares reacquired upon conversion into other share class(es) | | | (6,636 | ) | | | (210,933 | ) |
| | | | | | | | |
Net increase (decrease) in shares outstanding | | | 20,182,323 | | | $ | 688,870,284 | |
| | | | | | | | |
Year ended October 31, 2019: | | | | | | | | |
Shares sold | | | 16,578,431 | | | $ | 402,296,418 | |
Shares reacquired | | | (2,630,526 | ) | | | (63,683,876 | ) |
| | | | | | | | |
Net increase (decrease) in shares outstanding before conversion | | | 13,947,905 | | | | 338,612,542 | |
Shares issued upon conversion from other share class(es) | | | 26,917 | | | | 659,341 | |
| | | | | | | | |
Net increase (decrease) in shares outstanding | | | 13,974,822 | | | $ | 339,271,883 | |
| | | | | | | | |
| * | Commencement of offering was December 27, 2018. |
8. Borrowings
The Fund, on behalf of the Series, along with other affiliated registered investment companies (the “Participating Funds”), is a party to a Syndicated Credit Agreement (“SCA”) with a group of banks. The purpose of the SCA is to provide an alternative source of
temporary funding for capital share redemptions. The table below provides details of the current SCA in effect at the reporting period-end as well as the prior SCA.
| | | | |
| | | Current SCA | | Prior SCA |
| Term of Commitment | | 10/2/2020 –9/30/2021 | | 10/3/2019 –10/1/2020 |
Total Commitment | | $1,200,000,000 | | $1,222,500,000* |
Annualized Commitment Fee on the Unused Portion of the SCA | | 0.15% | | 0.15% |
Annualized Interest Rate on Borrowings | | 1.30% plus the higher of (1) the effective federal funds rate, (2) the one-month LIBOR rate or (3) zero percent | | 1.20% plus the higher of (1) the effective federal funds rate, (2) the one-month LIBOR rate or (3) zero percent |
* Effective March 31, 2020, the SCA’s total commitment was increased from $900,000,000 to $1,162,500,000 and subsequently, effective April 7, 2020 was increased to $1,222,500,000. |
Certain affiliated registered investment companies that are parties to the SCA include portfolios that are subject to a predetermined mathematical formula used to manage certain benefit guarantees offered under variable annuity contracts. The formula may result in large scale asset flows into and out of these portfolios. Consequently, these portfolios may be more likely to utilize the SCA for purposes of funding redemptions. It may be possible for those portfolios to fully exhaust the committed amount of the SCA, thereby requiring the Manager to allocate available funding per a Board-approved methodology designed to treat the Participating Funds in the SCA equitably.
The Series did not utilize the SCA during the year ended October 31, 2020.
9. Risks of Investing in the Series
The Series’ risks include, but are not limited to, some or all of the risks discussed below. For further information on the Series’ risks, please refer to the Series’ Prospectus and Statement of Additional Information.
Emerging Markets Risk: The risks of foreign investments are greater for investments in or exposed to emerging markets. Emerging market countries typically have economic and political systems that are less fully developed, and can be expected to be less stable, than those of more developed countries. For example, the economies of such countries can be subject to rapid and unpredictable rates of inflation or deflation. Low trading volumes may result in a lack of liquidity and price volatility. Emerging market countries may have policies that restrict investment by non-US investors, or that prevent non-US investors from withdrawing their money at will. Countries with emerging markets can be found in regions such as Asia, Latin America, Eastern Europe and Africa.
The Series may invest in some emerging markets that subject it to risks such as those associated with illiquidity, custody of assets, different settlement and clearance procedures and asserting legal title under a developing legal and regulatory regime to a greater degree than in developed markets or even in other emerging markets.
| | | | |
| PGIM Jennison Global Opportunities Fund | | | 33 | |
Notes to Financial Statements (continued)
Equity and Equity-Related Securities Risks: The value of a particular security could go down and you could lose money. In addition to an individual security losing value, the value of the equity markets or a sector in which the Series invests could go down. Different parts of a market can react differently to adverse issuer, market, regulatory, political and economic developments.
Foreign Securities Risk: The Series’ investments in securities of foreign issuers or issuers with significant exposure to foreign markets involve additional risk. The securities of such issuers may trade in markets that are less liquid, less regulated and more volatile than US markets. The value of the Series’ investments may decline because of factors affecting the particular issuer as well as foreign markets and issuers generally, such as unfavorable government actions, and political or financial instability. Lack of information may also affect the value of these securities.
Investments in China Risk: Investments in China subject the Series to risks specific to China and may make it more volatile than other funds. Over the last few decades, the Chinese government has undertaken reform of economic and market practices and has expanded the sphere of private ownership of property in China. However, Chinese markets generally continue to experience inefficiency, volatility and pricing anomalies resulting from governmental influence, a lack of publicly available information and/or political and social instability. Internal social unrest or confrontations with other neighboring countries, including military conflicts in response to such events, may also disrupt economic development in China and result in a greater risk of currency fluctuations, currency non-convertibility, interest rate fluctuations and higher rates of inflation.
Large Shareholder and Large Scale Redemption Risk: Certain individuals, accounts, funds (including funds affiliated with the Manager) or institutions, including the Manager and its affiliates, may from time to time own or control a substantial amount of the Series’ shares. There is no requirement that these entities maintain their investment in the Series. There is a risk that such large shareholders or that the Series’ shareholders generally may redeem all or a substantial portion of their investments in the Series in a short period of time, which could have a significant negative impact on the Series’ NAV, liquidity, and brokerage costs. Large redemptions could also result in tax consequences to shareholders and impact the Series’ ability to implement its investment strategy. The Series’ ability to pursue its investment objective after one or more large scale redemptions may be impaired and, as a result, the Series may invest a larger portion of its assets in cash or cash equivalents.
Market Disruption and Geopolitical Risks: International wars or conflicts and geopolitical developments in foreign countries, along with instability in regions such as Asia, Eastern Europe, and the Middle East, possible terrorist attacks in the United States or around the world, public health epidemics such as the outbreak of infectious diseases like the recent
outbreak of coronavirus globally or the 2014–2016 outbreak in West Africa of the Ebola virus, and other similar events could adversely affect the U.S. and foreign financial markets, including increases in market volatility, reduced liquidity in the securities markets and government intervention, and may cause further long-term economic uncertainties in the United States and worldwide generally.
The coronavirus pandemic and the related governmental and public responses have had and may continue to have an impact on the Series’ investments and net asset value and have led and may continue to lead to increased market volatility and the potential for illiquidity in certain classes of securities and sectors of the market. Preventative or protective actions that governments may take in respect of pandemic or epidemic diseases may result in periods of business disruption, business closures, inability to obtain raw materials, supplies and component parts, and reduced or disrupted operations for the issuers in which the Series invests. Government intervention in markets may impact interest rates, market volatility and security pricing. The occurrence, reoccurrence and pendency of such diseases could adversely affect the economies (including through changes in business activity and increased unemployment) and financial markets either in specific countries or worldwide.
Market Risk: Securities markets may be volatile and the market prices of the Series’ securities may decline. Securities fluctuate in price based on changes in an issuer’s financial condition and overall market and economic conditions. If the market prices of the securities owned by the Series fall, the value of an investment in the Series will decline.
10. Recent Regulatory Developments
On December 3, 2020, the SEC announced that it voted to adopt a new rule that establishes an updated regulatory framework for fund valuation practices (the “Rule”). The Rule, in part, provides (i) a framework for determining fair value in good faith and (ii) provides for a fund Board’s assignment of its responsibility for the execution of valuation-related activities to a fund’s investment adviser. Further, the SEC is rescinding previously issued guidance on related issues. The Rule will become effective 60 days after publication in the Federal Register, and will have a compliance date 18 months following the effective date. Management is currently evaluating the Rule and its impact to the Funds.
| | | | |
| PGIM Jennison Global Opportunities Fund | | | 35 | |
Financial Highlights
| | | | | | | | | | | | | | | | | | | | |
| Class A Shares | |
| | | Year Ended October 31, | |
| | | 2020 | | | 2019 | | | 2018 | | | 2017 | | | 2016 | |
| Per Share Operating Performance(a): | | | | | | | | | | | | | | | | | |
| Net Asset Value, Beginning of Year | | | $24.58 | | | | $21.47 | | | | $20.72 | | | | $15.14 | | | | $15.63 | |
| Income (loss) from investment operations: | | | | | | | | | | | | | | | | | |
| Net investment income (loss) | | | (0.22) | | | | (0.11) | | | | (0.13) | | | | (0.09) | | | | (0.05) | |
| Net realized and unrealized gain (loss) on investment and foreign currency transactions | | | 14.14 | | | | 3.22 | | | | 0.88 | | | | 5.67 | | | | (0.44 | ) |
| Total from investment operations | | | 13.92 | | | | 3.11 | | | | 0.75 | | | | 5.58 | | | | (0.49 | ) |
| Net asset value, end of year | | | $38.50 | | | | $24.58 | | | | $21.47 | | | | $20.72 | | | | $15.14 | |
| Total Return(b): | | | 56.63 | % | | | 14.49 | % | | | 3.62 | % | | | 36.86 | % | | | (3.13 | )% |
| | | | | | | | | | | | | | | | | | | | |
| Ratios/Supplemental Data: | | | | | | | | | | | | | | | |
| Net assets, end of year (000) | | | $494,173 | | | | $236,118 | | | | $164,764 | | | | $90,247 | | | | $89,579 | |
| Average net assets (000) | | | $344,283 | | | | $205,653 | | | | $142,313 | | | | $70,810 | | | | $100,220 | |
| Ratios to average net assets(c)(d): | | | | | | | | | | | | | | | | | | | | |
| Expenses after waivers and/or expense reimbursement | | | 1.08 | % | | | 1.08 | % | | | 1.14 | % | | | 1.19 | % | | | 1.20 | % |
| Expenses before waivers and/or expense reimbursement | | | 1.24 | % | | | 1.28 | % | | | 1.30 | % | | | 1.33 | % | | | 1.36 | % |
| Net investment income (loss) | | | (0.69 | )% | | | (0.45 | )% | | | (0.55 | )% | | | (0.55 | )% | | | (0.31 | )% |
| Portfolio turnover rate(e) | | | 57 | % | | | 52 | % | | | 62 | % | | | 79 | % | | | 88 | % |
| (a) | Calculated based on average shares outstanding during the year. |
| (b) | Total return does not consider the effects of sales loads. Total return is calculated assuming a purchase of a share on the first day and a sale on the last day of each year reported and includes reinvestment of dividends and distributions, if any. Total returns may reflect adjustments to conform to generally accepted accounting principles. |
| (c) | Does not include expenses of the underlying funds in which the Series invests. |
| (d) | Effective November 1, 2017, class specific expenses include transfer agent fees and expenses and registration fees, which are charged to their respective share class. |
| (e) | The Series’ portfolio turnover rate is calculated in accordance with regulatory requirements, without regard to transactions involving short-term investments and certain derivatives. If such transactions were included, the Series’ portfolio turnover rate may be higher. |
See Notes to Financial Statements.
| | | | | | | | | | | | | | | | | | | | |
| Class C Shares | | | | | | | | | | | | | | | |
| | | Year Ended October 31, | |
| | | 2020 | | | 2019 | | | 2018 | | | 2017 | | | 2016 | |
| Per Share Operating Performance(a): | | | | | | | | | | | | | | | | | | | | |
| Net Asset Value, Beginning of Year | | | $23.16 | | | | $20.41 | | | | $19.85 | | | | $14.61 | | | | $15.20 | |
| Income (loss) from investment operations: | | | | | | | | | | | | | | | | | | | | |
| Net investment income (loss) | | | (0.45 | ) | | | (0.29 | ) | | | (0.30 | ) | | | (0.22 | ) | | | (0.15 | ) |
| Net realized and unrealized gain (loss) on investment and foreign currency transactions | | | 13.27 | | | | 3.04 | | | | 0.86 | | | | 5.46 | | | | (0.44 | ) |
| Total from investment operations | | | 12.82 | | | | 2.75 | | | | 0.56 | | | | 5.24 | | | | (0.59 | ) |
| Net asset value, end of year | | | $35.98 | | | | $23.16 | | | | $20.41 | | | | $19.85 | | | | $14.61 | |
| Total Return(b): | | | 55.31 | % | | | 13.47 | % | | | 2.82 | % | | | 35.87 | % | | | (3.88 | )% |
| | | | | | | | | | | | | | | | | | | | |
| Ratios/Supplemental Data: | | | | | | | | | | | | | | | |
| Net assets, end of year (000) | | | $364,557 | | | | $211,290 | | | | $168,587 | | | | $79,531 | | | | $52,246 | |
| Average net assets (000) | | | $279,272 | | | | $198,518 | | | | $136,788 | | | | $55,922 | | | | $50,113 | |
| Ratios to average net assets(c)(d): | | | | | | | | | | | | | | | | | | | | |
| Expenses after waivers and/or expense reimbursement | | | 1.93 | % | | | 1.94 | % | | | 1.94 | % | | | 1.94 | % | | | 1.95 | % |
| Expenses before waivers and/or expense reimbursement | | | 1.93 | % | | | 1.97 | % | | | 1.99 | % | | | 2.03 | % | | | 2.06 | % |
| Net investment income (loss) | | | (1.53 | )% | | | (1.31 | )% | | | (1.35 | )% | | | (1.28 | )% | | | (1.07 | )% |
| Portfolio turnover rate(e) | | | 57 | % | | | 52 | % | | | 62 | % | | | 79 | % | | | 88 | % |
| (a) | Calculated based on average shares outstanding during the year. |
| (b) | Total return does not consider the effects of sales loads. Total return is calculated assuming a purchase of a share on the first day and a sale on the last day of each year reported and includes reinvestment of dividends and distributions, if any. Total returns may reflect adjustments to conform to generally accepted accounting principles. |
| (c) | Does not include expenses of the underlying funds in which the Series invests. |
| (d) | Effective November 1, 2017, class specific expenses include transfer agent fees and expenses and registration fees, which are charged to their respective share class. |
| (e) | The Series’ portfolio turnover rate is calculated in accordance with regulatory requirements, without regard to transactions involving short-term investments and certain derivatives. If such transactions were included, the Series’ portfolio turnover rate may be higher. |
See Notes to Financial Statements.
| | | | |
| PGIM Jennison Global Opportunities Fund | | | 37 | |
Financial Highlights (continued)
| | | | | | | | | | | | | | | | | | | | |
| Class Z Shares | |
| | | Year Ended October 31, | |
| | | 2020 | | | 2019 | | | 2018 | | | 2017 | | | 2016 | |
| Per Share Operating Performance(a): | | | | | | | | | | | | | | | | | | | | |
| Net Asset Value, Beginning of Year | | | $25.01 | | | | $21.82 | | | | $21.00 | | | | $15.31 | | | | $15.77 | |
| Income (loss) from investment operations: | | | | | | | | | | | | | | | | | | | | |
| Net investment income (loss) | | | (0.17 | ) | | | (0.07 | ) | | | (0.08 | ) | | | (0.05 | ) | | | (0.01 | ) |
| Net realized and unrealized gain (loss) on investment and foreign currency transactions | | | 14.40 | | | | 3.26 | | | | 0.90 | | | | 5.74 | | | | (0.45 | ) |
| Total from investment operations | | | 14.23 | | | | 3.19 | | | | 0.82 | | | | 5.69 | | | | (0.46 | ) |
| Net asset value, end of year | | | $39.24 | | | | $25.01 | | | | $21.82 | | | | $21.00 | | | | $15.31 | |
| Total Return(b): | | | 56.90 | % | | | 14.62 | % | | | 3.90 | % | | | 37.17 | % | | | (2.92 | )% |
| | | | | | | | | | | | | | | | | | | | |
| Ratios/Supplemental Data: | |
| Net assets, end of year (000) | | | $3,390,006 | | | | $1,466,571 | | | | $927,492 | | | | $334,783 | | | | $114,228 | |
| Average net assets (000) | | | $2,338,060 | | | | $1,228,375 | | | | $693,749 | | | | $193,977 | | | | $131,042 | |
| Ratios to average net assets(c)(d): | | | | | | | | | | | | | | | | | | | | |
| Expenses after waivers and/or expense reimbursement | | | 0.93 | % | | | 0.94 | % | | | 0.93 | % | | | 0.94 | % | | | 0.95 | % |
| Expenses before waivers and/or expense reimbursement | | | 0.93 | % | | | 0.96 | % | | | 0.97 | % | | | 1.02 | % | | | 1.06 | % |
| Net investment income (loss) | | | (0.54 | )% | | | (0.31 | )% | | | (0.35 | )% | | | (0.28 | )% | | | (0.07 | )% |
| Portfolio turnover rate(e) | | | 57 | % | | | 52 | % | | | 62 | % | | | 79 | % | | | 88 | % |
| (a) | Calculated based on average shares outstanding during the year. |
| (b) | Total return is calculated assuming a purchase of a share on the first day and a sale on the last day of each year reported and includes reinvestment of dividends and distributions, if any. Total returns may reflect adjustments to conform to generally accepted accounting principles. |
| (c) | Does not include expenses of the underlying funds in which the Series invests. |
| (d) | Effective November 1, 2017, class specific expenses include transfer agent fees and expenses and registration fees, which are charged to their respective share class. |
| (e) | The Series’ portfolio turnover rate is calculated in accordance with regulatory requirements, without regard to transactions involving short-term investments and certain derivatives. If such transactions were included, the Series’ portfolio turnover rate may be higher. |
See Notes to Financial Statements.
| | | | | | | | | | | | |
| Class R2 Shares | | | | | | | | | |
| | | Year Ended October 31,
2020 | | | | | | December 27, 2018(a) through October 31,
2019 | |
| Per Share Operating Performance(b): | | | | | | | | | | | | |
| Net Asset Value, Beginning of Period | | | $25.02 | | | | | | | | $20.59 | |
| Income (loss) from investment operations: | | | | | | | | | | | | |
| Net investment income (loss) | | | (0.31 | ) | | | | | | | (0.12 | ) |
| Net realized and unrealized gain (loss) on investment and foreign currency transactions | | | 14.39 | | | | | | | | 4.55 | |
| Total from investment operations | | | 14.08 | | | | | | | | 4.43 | |
| Net asset value, end of period | | | $39.10 | | | | | | | | $25.02 | |
| Total Return(c): | | | 56.27 | % | | | | | | | 21.52 | % |
| | | | | | | | | | | | |
| Ratios/Supplemental Data: | | | | | | | | | |
| Net assets, end of period (000) | | | $377 | | | | | | | | $12 | |
| Average net assets (000) | | | $221 | | | | | | | | $13 | |
| Ratios to average net assets(d): | | | | | | | | | | | | |
| Expenses after waivers and/or expense reimbursement | | | 1.33 | % | | | | | | | 1.34 | %(e) |
| Expenses before waivers and/or expense reimbursement | | | 7.68 | % | | | | | | | 216.05 | %(e) |
| Net investment income (loss) | | | (0.92 | )% | | | | | | | (0.58 | )%(e) |
| Portfolio turnover rate(f) | | | 57 | % | | | | | | | 52 | % |
| (a) | Commencement of offering. |
| (b) | Calculated based on average shares outstanding during the period. |
| (c) | Total return is calculated assuming a purchase of a share on the first day and a sale on the last day of each period reported and includes reinvestment of dividends and distributions, if any. Total returns may reflect adjustments to conform to generally accepted accounting principles. Total returns for periods less than one full year are not annualized. |
| (d) | Does not include expenses of the underlying funds in which the Series invests. |
| (f) | The Series’ portfolio turnover rate is calculated in accordance with regulatory requirements, without regard to transactions involving short-term investments and certain derivatives. If such transactions were included, the Series’ portfolio turnover rate may be higher. |
See Notes to Financial Statements.
| | | | |
| PGIM Jennison Global Opportunities Fund | | | 39 | |
Financial Highlights (continued)
| | | | | | | | | | | | |
| Class R4 Shares | | | | | | | | | |
| | | Year Ended October 31,
2020 | | | | | | December 27, 2018(a)
through October 31,
2019 | |
| Per Share Operating Performance(b): | | | | | | | | | | | | |
| Net Asset Value, Beginning of Period | | | $25.08 | | | | | | | | $20.59 | |
| Income (loss) from investment operations: | | | | | | | | | | | | |
| Net investment income (loss) | | | (0.19 | ) | | | | | | | (0.10 | ) |
| Net realized and unrealized gain (loss) on investment and foreign currency transactions | | | 14.42 | | | | | | | | 4.59 | |
| Total from investment operations | | | 14.23 | | | | | | | | 4.49 | |
| Net asset value, end of period | | | $39.31 | | | | | | | | $25.08 | |
| Total Return(c): | | | 56.74 | % | | | | | | | 21.81 | % |
| | | | | | | | | | | | |
| Ratios/Supplemental Data: | | | | | | | | | |
| Net assets, end of period (000) | | | $505 | | | | | | | | $362 | |
| Average net assets (000) | | | $433 | | | | | | | | $122 | |
| Ratios to average net assets(d): | | | | | | | | | | | | |
| Expenses after waivers and/or expense reimbursement | | | 1.02 | % | | | | | | | 0.97 | %(e) |
| Expenses before waivers and/or expense reimbursement | | | 4.28 | % | | | | | | | 23.67 | %(e) |
| Net investment income (loss) | | | (0.60 | )% | | | | | | | (0.46 | )%(e) |
| Portfolio turnover rate(f) | | | 57 | % | | | | | | | 52 | % |
| (a) | Commencement of offering. |
| (b) | Calculated based on average shares outstanding during the period. |
| (c) | Total return is calculated assuming a purchase of a share on the first day and a sale on the last day of each period reported and includes reinvestment of dividends and distributions, if any. Total returns may reflect adjustments to conform to generally accepted accounting principles. Total returns for periods less than one full year are not annualized. |
| (d) | Does not include expenses of the underlying funds in which the Series invests. |
| (f) | The Series’ portfolio turnover rate is calculated in accordance with regulatory requirements, without regard to transactions involving short-term investments and certain derivatives. If such transactions were included, the Series’ portfolio turnover rate may be higher. |
See Notes to Financial Statements.
| | | | | | | | | | | | | | | | | | | | |
| Class R6 Shares | |
| | | Year Ended October 31, | |
| | | 2020 | | | 2019 | | | 2018 | | | 2017 | | | 2016 | |
| Per Share Operating Performance(a): | | | | | | | | | | | | | | | | | | | | |
| Net Asset Value, Beginning of Year | | | $25.13 | | | | $21.90 | | | | $21.06 | | | | $15.33 | | | | $15.78 | |
| Income (loss) from investment operations: | | | | | | | | | | | | | | | | | | | | |
| Net investment income (loss) | | | (0.15 | ) | | | (0.06 | ) | | | (0.06 | ) | | | (0.04 | ) | | | 0.01 | |
| Net realized and unrealized gain (loss) on investment and foreign currency transactions | | | 14.48 | | | | 3.29 | | | | 0.90 | | | | 5.77 | | | | (0.46 | ) |
| Total from investment operations | | | 14.33 | | | | 3.23 | | | | 0.84 | | | | 5.73 | | | | (0.45 | ) |
| Net asset value, end of year | | | $39.46 | | | | $25.13 | | | | $21.90 | | | | $21.06 | | | | $15.33 | |
| Total Return(b): | | | 57.02 | % | | | 14.75 | % | | | 3.99 | % | | | 37.38 | % | | | (2.85 | )% |
| | | | | | | | | | | | | | | | | | | | | |
| Ratios/Supplemental Data: | |
| Net assets, end of year (000) | | | $1,803,620 | | | | $641,419 | | | | $253,010 | | | | $29,023 | | | | $8,647 | |
| Average net assets (000) | | | $1,074,262 | | | | $448,178 | | | | $133,984 | | | | $14,700 | | | | $7,736 | |
| Ratios to average net assets(c)(d): | | | | | | | | | | | | | | | | | | | | |
| Expenses after waivers and/or expense reimbursement | | | 0.84 | % | | | 0.84 | % | | | 0.84 | % | | | 0.84 | % | | | 0.84 | % |
| Expenses before waivers and/or expense reimbursement | | | 0.84 | % | | | 0.87 | % | | | 0.90 | % | | | 0.92 | % | | | 0.95 | % |
| Net investment income (loss) | | | (0.46 | )% | | | (0.23 | )% | | | (0.26 | )% | | | (0.23 | )% | | | 0.05 | % |
| Portfolio turnover rate(e) | | | 57 | % | | | 52 | % | | | 62 | % | | | 79 | % | | | 88 | % |
| (a) | Calculated based on average shares outstanding during the year. |
| (b) | Total return is calculated assuming a purchase of a share on the first day and a sale on the last day of each year reported and includes reinvestment of dividends and distributions, if any. Total returns may reflect adjustments to conform to generally accepted accounting principles. |
| (c) | Does not include expenses of the underlying funds in which the Series invests. |
| (d) | Effective November 1, 2017, class specific expenses include transfer agent fees and expenses and registration fees, which are charged to their respective share class. |
| (e) | The Series’ portfolio turnover rate is calculated in accordance with regulatory requirements, without regard to transactions involving short-term investments and certain derivatives. If such transactions were included, the Series’ portfolio turnover rate may be higher. |
See Notes to Financial Statements.
| | | | |
| PGIM Jennison Global Opportunities Fund | | | 41 | |
Report of Independent Registered Public Accounting Firm
To the Board of Directors of Prudential World Fund, Inc. and Shareholders of PGIM Jennison Global Opportunities Fund
Opinion on the Financial Statements
We have audited the accompanying statement of assets and liabilities, including the schedule of investments, of PGIM Jennison Global Opportunities Fund (one of the funds constituting Prudential World Fund, Inc., referred to hereafter as the “Fund”) as of October 31, 2020, and the related statements of operations and changes in net assets, including the related notes, and the financial highlights for the year ended October 31, 2020 (collectively referred to as the “financial statements”). In our opinion, the financial statements present fairly, in all material respects, the financial position of the Fund as of October 31, 2020, and the results of its operations, changes in its net assets, and the financial highlights for the year ended October 31, 2020 in conformity with accounting principles generally accepted in the United States of America.
The financial statements of the Fund as of and for the year ended October 31, 2019 and the financial highlights for each of the periods ended on or prior to October 31, 2019 (not presented herein, other than the statement of changes in net assets and the financial highlights) were audited by other auditors whose report dated December 16, 2019 expressed an unqualified opinion on those financial statements and financial highlights.
Basis for Opinion
These financial statements are the responsibility of the Fund’s management. Our responsibility is to express an opinion on the Fund’s financial statements based on our audit. We are a public accounting firm registered with the Public Company Accounting Oversight Board (United States) (PCAOB) and are required to be independent with respect to the Fund in accordance with the U.S. federal securities laws and the applicable rules and regulations of the Securities and Exchange Commission and the PCAOB.
We conducted our audit of these financial statements in accordance with the standards of the PCAOB. Those standards require that we plan and perform the audit to obtain reasonable assurance about whether the financial statements are free of material misstatement, whether due to error or fraud.
Our audit included performing procedures to assess the risks of material misstatement of the financial statements, whether due to error or fraud, and performing procedures that respond to those risks. Such procedures included examining, on a test basis, evidence regarding the amounts and disclosures in the financial statements. Our audit also included evaluating the accounting principles used and significant estimates made by management, as well as evaluating the overall presentation of the financial statements. Our procedures included confirmation of securities owned as of October 31, 2020 by correspondence with the custodian, transfer agent and brokers; when replies were not received from brokers, we performed other auditing procedures. We believe that our audit provides a reasonable basis for our opinion.
/s/PricewaterhouseCoopers LLP
New York, New York
December 16, 2020
We have served as the auditor of one or more investment companies in the PGIM Retail Funds complex since 2020.
INFORMATION ABOUT BOARD MEMBERS AND OFFICERS (unaudited)
Information about Board Members and Officers of the Fund is set forth below. Board Members who are not deemed to be “interested persons” of the Fund, as defined in the 1940 Act, are referred to as “Independent Board Members.” Board Members who are deemed to be “interested persons” of the Fund are referred to as “Interested Board Members.” The Board Members are responsible for the overall supervision of the operations of the Fund and perform the various duties imposed on the directors of investment companies by the 1940 Act. The Board in turn elects the Officers, who are responsible for administering the day-to-day operations of the Fund.
| | | | | | |
| Independent Board Members | | | | |
| | | | |
Name Year of Birth Position(s) Portfolios Overseen | | Principal Occupation(s) During Past Five Years | | Other Directorships Held During Past Five Years | | Length of
Board Service |
| | | | |
Ellen S. Alberding 1958 Board Member Portfolios Overseen: 95 | | President and Board Member, The Joyce Foundation (charitable foundation) (since 2002); Vice Chair, City Colleges of Chicago (community college system) (2011-2015); Trustee, National Park Foundation (charitable foundation for national park system) (2009-2018); Trustee, Economic Club of Chicago (2009-2016); Trustee, Loyola University (since 2018). | | None. | | Since September 2013 |
| | | | |
Kevin J. Bannon 1952 Board Member Portfolios Overseen: 95 | | Retired; Managing Director (April 2008-May 2015) and Chief Investment Officer (October 2008-November 2013) of Highmount Capital LLC (registered investment adviser); formerly Executive Vice President and Chief Investment Officer (April 1993-August 2007) of Bank of New York Company; President (May 2003-May 2007) of BNY Hamilton Family of Mutual Funds. | | Director of Urstadt Biddle Properties (equity real estate investment trust) (since September 2008). | | Since July 2008 |
PGIM Jennison Global Opportunities Fund
| | | | | | |
Independent Board Members | | | | |
| | | | |
Name Year of Birth Position(s) Portfolios Overseen | | Principal Occupation(s) During Past Five Years | | Other Directorships Held During Past Five Years | | Length of
Board Service |
| | | | |
Linda W. Bynoe 1952 Board Member Portfolios Overseen: 95 | | President and Chief Executive Officer (since March 1995) and formerly Chief Operating Officer (December 1989-February 1995) of Telemat Limited LLC (formerly, Telemat Ltd). (management consulting); formerly Vice President (January 1985-June 1989) at Morgan Stanley & Co. (broker-dealer). | | Director of Anixter International, Inc. (communication products distributor) (since January 2006–June 2020); Director of Northern Trust Corporation (financial services) (since April 2006); Trustee of Equity Residential (residential real estate) (since December 2009). | | Since March 2005 |
| | | | |
Barry H. Evans 1960 Board Member Portfolios Overseen: 94 | | Retired; formerly President (2005 – 2016), Global Chief Operating Officer (2014– 2016), Chief Investment Officer – Global Head of Fixed Income (1998-2014), and various portfolio manager roles (1986-2006), Manulife Asset Management U.S. | | Formerly Director, Manulife Trust Company (2011-2018); formerly Director, Manulife Asset Management Limited (2015-2017); formerly Chairman of the Board of Directors of Manulife Asset Management U.S. (2005-2016); formerly Chairman of the Board, Declaration Investment Management and Research (2008-2016). | | Since September 2017 |
| | | | |
Keith F. Hartstein 1956 Board Member & Independent Chair Portfolios Overseen: 95 | | Executive Committee of the IDC Board of Governors (since October 2019); Retired; Member (since November 2014) of the Governing Council of the Independent Directors Council (IDC) (organization of independent mutual fund directors); formerly President and Chief Executive Officer (2005-2012), Senior Vice President (2004-2005), Senior Vice President of Sales and Marketing (1997-2004), and various executive management positions (1990-1997), John Hancock Funds, LLC (asset management); Chairman, Investment Company Institute’s Sales Force Marketing Committee (2003-2008). | | None. | | Since September 2013 |
Visit our website at pgim.com/investments
| | | | | | |
Independent Board Members | | | | |
| | | | |
Name Year of Birth Position(s) Portfolios Overseen | | Principal Occupation(s) During Past Five Years | | Other Directorships Held During Past Five Years | | Length of
Board Service |
| | | | |
Laurie Simon Hodrick 1962 Board Member Portfolios Overseen: 94 | | A. Barton Hepburn Professor Emerita of Economics in the Faculty of Business, Columbia Business School (since 2018); Visiting Professor of Law, Stanford Law School (since 2015); Visiting Fellow at the Hoover Institution, Stanford University (since 2015); Sole Member, ReidCourt LLC (since 2008) (a consulting firm); formerly A. Barton Hepburn Professor of Economics in the Faculty of Business, Columbia Business School (1996-2017); formerly Managing Director, Global Head of Alternative Investment Strategies, Deutsche Bank (2006-2008). | | Independent Director, Synnex Corporation (since 2019) (information technology); Independent Director, Kabbage, Inc. (2018-2020) (financial services); Independent Director, Corporate Capital Trust (2017-2018) (a business development company). | | Since September 2017 |
| | | | |
Michael S. Hyland, CFA 1945 Board Member Portfolios Overseen: 95 | | Retired (since February 2005); formerly Senior Managing Director (July 2001-February 2005) of Bear Stearns & Co, Inc.; Global Partner, INVESCO (1999-2001); Managing Director and President of Salomon Brothers Asset Management (1989-1999). | | None. | | Since July 2008 |
| | | | |
Brian K. Reid 1961 Board Member Portfolios Overseen: 94 | | Retired; formerly Chief Economist for the Investment Company Institute (ICI) (2005-2017); formerly Senior Economist and Director of Industry and Financial Analysis at the ICI (1998-2004); formerly Senior Economist, Industry and Financial Analysis at the ICI (1996-1998); formerly Staff Economist at the Federal Reserve Board (1989-1996); Director, ICI Mutual Insurance Company (2012-2017). | | None. | | Since March 2018 |
PGIM Jennison Global Opportunities Fund
| | | | | | |
| Independent Board Members | | | | |
| | | | |
Name Year of Birth Position(s) Portfolios Overseen | | Principal Occupation(s) During Past Five Years | | Other Directorships Held During Past Five Years | | Length of Board Service |
| | | | |
Grace C. Torres 1959 Board Member Portfolios Overseen: 94 | | Retired; formerly Treasurer and Principal Financial and Accounting Officer of the PGIM Funds, Target Funds, Advanced Series Trust, Prudential Variable Contract Accounts and The Prudential Series Fund (1998-June 2014); Assistant Treasurer (March 1999-June 2014) and Senior Vice President (September 1999-June 2014) of PGIM Investments LLC; Assistant Treasurer (May 2003-June 2014) and Vice President (June 2005-June 2014) of AST Investment Services, Inc.; Senior Vice President and Assistant Treasurer (May 2003-June 2014) of Prudential Annuities Advisory Services, Inc. | | Formerly Director (July 2015-January 2018) of Sun Bancorp, Inc. N.A. and Sun National Bank; Director (since January 2018) of OceanFirst Financial Corp. and OceanFirst Bank. | | Since November 2014 |
| | | | | | |
| Interested Board Members | | | | |
| | | | |
Name Year of Birth Position(s) Portfolios Overseen | | Principal Occupation(s) During Past Five Years | | Other Directorships Held During Past Five Years | | Length of Board Service |
| | | | |
Stuart S. Parker 1962 Board Member & President Portfolios Overseen: 96 | | President of PGIM Investments LLC (formerly known as Prudential Investments LLC) (since January 2012); Executive Vice President of Prudential Investment Management Services LLC (since December 2012); formerly Executive Vice President of Jennison Associates LLC and Head of Retail Distribution of PGIM Investments LLC (June 2005-December 2011). | | None. | | Since January 2012 |
Visit our website at pgim.com/investments
| | | | | | |
| Interested Board Members | | | | |
| | | | |
Name Year of Birth Position(s) Portfolios Overseen | | Principal Occupation(s) During Past Five Years | | Other Directorships Held During Past Five Years | | Length of Board Service |
| | | | |
Scott E. Benjamin 1973 Board Member & Vice President Portfolios Overseen: 96 | | Executive Vice President (since June 2009) of PGIM Investments LLC; Vice President (since June 2012) of Prudential Investment Management Services LLC; Executive Vice President (since September 2009) of AST Investment Services, Inc.; Senior Vice President of Product Development and Marketing, PGIM Investments (since February 2006); formerly Vice President of Product Development and Product Management, PGIM Investments LLC (2003-2006). | | None. | | Since March 2010 |
(1) The year that each Board Member joined the Board is as follows:
Ellen S. Alberding, 2013; Kevin J. Bannon, 2008; Linda W. Bynoe, 2005; Barry H. Evans, 2017; Keith F. Hartstein, 2013; Laurie Simon Hodrick, 2017; Michael S. Hyland, 2008; James E. Quinn, 2013; Richard A. Redeker, 2000; Stephen G. Stoneburn, 2003; Stuart S. Parker, Board Member and President since 2012; Scott E. Benjamin, Board Member since 2010 and Vice President since 2009; Grace C. Torres, 2014.
| | | | |
| Fund Officers(a) | | | | |
| | | |
Name Year of Birth Fund Position | | Principal Occupation(s) During Past Five Years | | Length of
Service as Fund
Officer |
| | | |
Claudia DiGiacomo 1974 Chief Legal Officer | | Chief Legal Officer of PGIM Investments LLC (since August 2020); Chief Legal Officer of Prudential Mutual Fund Services LLC (since August 2020); Chief Legal Officer of PIFM Holdco, LLC (since August 2020); Vice President and Corporate Counsel (since January 2005) of Prudential; and Corporate Counsel of AST Investment Services, Inc. (since August 2020); formerly Associate at Sidley Austin Brown & Wood LLP (1999-2004). | | Since December 2005 |
| | | |
Dino Capasso 1974 Chief Compliance Officer | | Chief Compliance Officer (July 2019-Present) of PGIM Investments LLC; Chief Compliance Officer (July 2019-Present) of the PGIM Funds, Target Funds, Advanced Series Trust, The Prudential Series Fund, Prudential’s Gibraltar Fund, Inc., PGIM Global High Yield Fund, Inc., and PGIM High Yield Bond Fund, Inc.; Vice President and Deputy Chief Compliance Officer (June 2017-2019) of PGIM Investments LLC; formerly, Senior Vice President and Senior Counsel (January 2016-June 2017), and Vice President and Counsel (February 2012-December 2015) of Pacific Investment Management Company LLC. | | Since March 2018 |
PGIM Jennison Global Opportunities Fund
| | | | |
| Fund Officers(a) | | | | |
| | | |
Name Year of Birth Fund Position | | Principal Occupation(s) During Past Five Years | | Length of
Service as Fund
Officer |
| | | |
Andrew R. French 1962 Secretary | | Vice President (since December 2018 - present) of PGIM Investments LLC; Formerly, Vice President and Corporate Counsel (2010-2018) of Prudential; formerly Director and Corporate Counsel (2006-2010) of Prudential; Vice President and Assistant Secretary (since January 2007) of PGIM Investments LLC; Vice President and Assistant Secretary (since January 2007) of Prudential Mutual Fund Services LLC. | | Since October 2006 |
| | | |
Diana N. Huffman 1982 Assistant Secretary | | Vice President and Corporate Counsel (since September 2015) of Prudential; Vice President and Assistant Secretary (since August 2020) of PGIM Investments LLC; formerly Associate at Willkie Farr & Gallagher LLP (2009-2015). | | Since March 2019 |
| | | |
Melissa Gonzalez 1980 Assistant Secretary | | Vice President and Corporate Counsel (since September 2018) of Prudential; Vice President and Assistant Secretary (since August 2020) of PGIM Investments LLC; formerly Director and Corporate Counsel (March 2014-September 2018) of Prudential. | | Since March 2020 |
| | | |
Patrick E. McGuinness 1986 Assistant Secretary | | Vice President and Assistant Secretary (since August 2020) of PGIM Investments LLC; Director and Corporate Counsel (since February 2017) of Prudential; and Corporate Counsel (2012 – 2017) of IIL, Inc. | | Since June 2020 |
| | | |
Kelly A. Coyne 1968 Assistant Secretary | | Director, Investment Operations of Prudential Mutual Fund Services LLC (since 2010). | | Since March 2015 |
| | | |
Christian J. Kelly 1975 Treasurer and Principal Financial and Accounting Officer | | Vice President, Head of Fund Administration of PGIM Investments LLC (since November 2018); formerly, Director of Fund Administration of Lord Abbett & Co. LLC (2009-2018), Treasurer and Principal Accounting Officer of the Lord Abbett Family of Funds (2017-2018); Director of Accounting, Avenue Capital Group (2008-2009); Senior Manager, Investment Management Practice of Deloitte & Touche LLP (1998-2007). | | Since January 2019 |
| | | |
Lana Lomuti 1967 Assistant Treasurer | | Vice President (since 2007) and Director (2005-2007), within PGIM Investments Fund Administration; formerly Assistant Treasurer (December 2007-February 2014) of The Greater China Fund, Inc. | | Since April 2014 |
| | | |
Russ Shupak 1973 Assistant Treasurer | | Vice President (since 2017) and Director (2013-2017), within PGIM Investments Fund Administration. | | Since October 2019 |
| | | |
Deborah Conway 1969 Assistant Treasurer | | Vice President (since 2017) and Director (2007-2017), within PGIM Investments Fund Administration. | | Since October 2019 |
| | | |
Elyse M. McLaughlin 1974 Assistant Treasurer | | Vice President (since 2017) and Director (2011-2017), within PGIM Investments Fund Administration. | | Since October 2019 |
Visit our website at pgim.com/investments
| | | | |
| Fund Officers(a) | | | | |
| | | |
Name Year of Birth Fund Position | | Principal Occupation(s) During Past Five Years | | Length of
Service as
Fund Officer |
| | | |
Charles H. Smith 1973 Anti-Money Laundering Compliance Officer | | Vice President, Corporate Compliance, Anti-Money Laundering Unit (since January 2015) of Prudential; committee member of the American Council of Life Insurers Anti-Money Laundering and Critical Infrastructure Committee (since January 2016); formerly Global Head of Economic Sanctions Compliance at AIG Property Casualty (February 2007-December 2014); Assistant Attorney General at the New York State Attorney General’s Office, Division of Public Advocacy. (August 1998-January 2007). | | Since January 2017 |
(a) Excludes Mr. Parker and Mr. Benjamin, interested Board Members who also serve as President and Vice President, respectively.
Explanatory Notes to Tables:
| ∎ | | Board Members are deemed to be “Interested,” as defined in the 1940 Act, by reason of their affiliation with PGIM Investments LLC and/or an affiliate of PGIM Investments LLC. |
| ∎ | | Unless otherwise noted, the address of all Board Members and Officers is c/o PGIM Investments LLC, 655 Broad Street, Newark, New Jersey 07102-4410. |
| ∎ | | There is no set term of office for Board Members or Officers. The Board Members have adopted a retirement policy, which calls for the retirement of Board Members on December 31 of the year in which they reach the age of 75. |
| ∎ | | “Other Directorships Held” includes all directorships of companies required to register or file reports with the SEC under the 1934 Act (that is, “public companies”) or other investment companies registered under the 1940 Act. |
| ∎ | | “Portfolios Overseen” includes all investment companies managed by PGIM Investments LLC. The investment companies for which PGIM Investments LLC serves as manager include the PGIM Funds, The Prudential Variable Contract Accounts, PGIM ETF Trust, PGIM High Yield Bond Fund, Inc., PGIM Global High Yield Fund, Inc., The Prudential Series Fund, Prudential’s Gibraltar Fund, Inc. and the Advanced Series Trust. |
| ∎ | | As used in the Fund Officers table “Prudential” means The Prudential Insurance Company of America. |
PGIM Jennison Global Opportunities Fund
Approval of Advisory Agreements (unaudited)
The Fund’s Board of Directors
The Board of Directors (the “Board”) of PGIM Jennison Global Opportunities Fund (the “Fund”)1 consists of eleven individuals, nine of whom are not “interested persons” of the Fund, as defined in the Investment Company Act of 1940, as amended (the “1940 Act”) (the “Independent Directors”). The Board is responsible for the oversight of the Fund and its operations, and performs the various duties imposed on the directors of investment companies by the 1940 Act. The Independent Directors have retained independent legal counsel to assist them in connection with their duties. The Chair of the Board is an Independent Director. The Board has established four standing committees: the Audit Committee, the Nominating and Governance Committee, and two Investment Committees. Each committee is chaired by, and composed of, Independent Directors.
Annual Approval of the Fund’s Advisory Agreements
As required under the 1940 Act, the Board determines annually whether to renew the Fund’s management agreement with PGIM Investments LLC (“PGIM Investments”) and the Fund’s subadvisory agreement with Jennison Associates LLC (“Jennison”). In considering the renewal of the agreements, the Board, including all of the Independent Directors, met on May 27, 2020 and on June 9-11, 2020 and approved the renewal of the agreements through July 31, 2021, after concluding that the renewal of the agreements was in the best interests of the Fund and its shareholders.
In advance of the meetings, the Board requested and received materials relating to the agreements, and had the opportunity to ask questions and request further information in connection with its consideration. Among other things, the Board considered comparative fee information from PGIM Investments and Jennison. Also, the Board considered comparisons with other mutual funds in relevant Peer Universes and Peer Groups, as is further discussed below.
In approving the agreements, the Board, including the Independent Directors advised by independent legal counsel, considered the factors it deemed relevant, including the nature, quality and extent of services provided by PGIM Investments and the subadviser, the performance of the Fund, the profitability of PGIM Investments and its affiliates, expenses and fees, and the potential for economies of scale that may be shared with the Fund and its shareholders as the Fund’s assets grow. In their deliberations, the Directors did not identify any single factor which alone was responsible for the Board’s decision to approve the agreements with respect to the Fund. In connection with its deliberations, the Board considered information provided by PGIM Investments throughout the year at regular Board
| 1 | PGIM Jennison Global Opportunities Fund is a series of Prudential World Fund, Inc. |
`
PGIM Jennison Global Opportunities Fund
Approval of Advisory Agreements (continued)
meetings, presentations from portfolio managers and other information, as well as information furnished at or in advance of the meetings on May 27, 2020 and on June 9-11, 2020.
The Directors determined that the overall arrangements between the Fund and PGIM Investments, which serves as the Fund’s investment manager pursuant to a management agreement, and between PGIM Investments and Jennison, which serves as the Fund’s subadviser pursuant to the terms of a subadvisory agreement with PGIM Investments, are in the best interests of the Fund and its shareholders in light of the services performed, fees charged and such other matters as the Directors considered relevant in the exercise of their business judgment.
The material factors and conclusions that formed the basis for the Directors’ reaching their determinations to approve the continuance of the agreements are separately discussed below.
Nature, Quality and Extent of Services
The Board received and considered information regarding the nature, quality and extent of services provided to the Fund by PGIM Investments and Jennison. The Board noted that Jennison is affiliated with PGIM Investments. The Board considered the services provided by PGIM Investments, including but not limited to the oversight of the subadviser for the Fund, as well as the provision of fund recordkeeping, compliance and other services to the Fund, and PGIM Investments’ role as administrator for the Fund’s liquidity risk management program. With respect to PGIM Investments’ oversight of the subadviser, the Board noted that PGIM Investments’ Strategic Investment Research Group (“SIRG”), which is a business unit of PGIM Investments, is responsible for monitoring and reporting to PGIM Investments’ senior management on the performance and operations of the subadviser. The Board also considered that PGIM Investments pays the salaries of all of the officers and interested Directors of the Fund who are part of Fund management. The Board also considered the investment subadvisory services provided by Jennison, including investment research and security selection, as well as adherence to the Fund’s investment restrictions and compliance with applicable Fund policies and procedures. The Board considered PGIM Investments’ evaluation of the subadviser, as well as PGIM Investments’ recommendation, based on its review of the subadviser, to renew the subadvisory agreement.
The Board considered the qualifications, backgrounds and responsibilities of PGIM Investments’ senior management responsible for the oversight of the Fund and Jennison, and also considered the qualifications, backgrounds and responsibilities of Jennison’s portfolio managers who are responsible for the day-to-day management of the Fund’s portfolio. The Board was provided with information pertaining to PGIM Investments’ and Jennison’s organizational structure, senior management, investment operations, and other
Visit our website at pgim.com/investments
relevant information pertaining to both PGIM Investments and Jennison. The Board also noted that it received favorable compliance reports from the Fund’s Chief Compliance Officer (“CCO”) as to both PGIM Investments and Jennison.
The Board concluded that it was satisfied with the nature, extent and quality of the investment management services provided by PGIM Investments and the subadvisory services provided to the Fund by Jennison, and that there was a reasonable basis on which to conclude that the Fund benefits from the services provided by PGIM Investments and Jennison under the management and subadvisory agreements.
Costs of Services and Profits Realized by PGIM Investments
The Board was provided with information on the profitability of PGIM Investments and its affiliates in serving as the Fund’s investment manager. The Board discussed with PGIM Investments the methodology utilized in assembling the information regarding profitability and considered its reasonableness. The Board recognized that it is difficult to make comparisons of profitability from fund management contracts because comparative information is not generally publicly available and is affected by numerous factors, including the structure of the particular adviser, the types of funds it manages, its business mix, numerous assumptions regarding allocations and the adviser’s capital structure and cost of capital. However, the Board considered that the cost of services provided by PGIM Investments to the Fund during the year ended December 31, 2019 exceeded the management fees paid by the Fund, resulting in an operating loss to PGIM Investments. Taking these factors into account, the Board concluded that the profitability of PGIM Investments and its affiliates in relation to the services rendered was not unreasonable.
Economies of Scale
The Board received and discussed information concerning economies of scale that PGIM Investments may realize as the Fund’s assets grow beyond current levels. The Board noted that the management fee schedule for the Fund includes breakpoints, which have the effect of decreasing the fee rate as assets increase. During the course of time, the Board has considered information regarding the launch date of the Fund, the management fees of the Fund compared to those of similarly managed funds and PGIM Investments’ investment in the Fund over time. The Board noted that economies of scale may be shared with the Fund in several ways, including low management fees from inception, additional technological and personnel investments to enhance shareholder services, and maintaining existing expense structures in the face of a rising cost environment. The Board considered PGIM Investments’ assertion that it continually evaluates the management fee schedule of the Fund and the potential to share economies of scale through breakpoints or fee waivers as asset levels increase.
PGIM Jennison Global Opportunities Fund
Approval of Advisory Agreements (continued)
The Board recognized the inherent limitations of any analysis of economies of scale, stemming largely from the Board’s understanding that most of PGIM Investments’ costs are not specific to individual funds, but rather are incurred across a variety of products and services.
Other Benefits to PGIM Investments and Jennison
The Board considered potential ancillary benefits that might be received by PGIM Investments, Jennison and their affiliates as a result of their relationship with the Fund. The Board concluded that potential benefits to be derived by PGIM Investments included transfer agency fees received by the Fund’s transfer agent (which is affiliated with PGIM Investments), as well as benefits to its reputation or other intangible benefits resulting from PGIM Investments’ association with the Fund. The Board concluded that the potential benefits to be derived by Jennison included the ability to use soft dollar credits, as well as the potential benefits consistent with those generally resulting from an increase in assets under management, specifically, potential access to additional research resources and benefits to its reputation. The Board concluded that the benefits derived by PGIM Investments and Jennison were consistent with the types of benefits generally derived by investment managers and subadvisers to mutual funds.
Performance of the Fund / Fees and Expenses
The Board considered certain additional factors and made related conclusions relating to the historical performance of the Fund for the one-, three- and five-year periods ended December 31, 2019.
The Board also considered the Fund’s actual management fee, as well as the Fund’s net total expense ratio, for the fiscal year ended October 31, 2019. The Board considered the management fee for the Fund as compared to the management fee charged by PGIM Investments to other funds and the fee charged by other advisers to comparable mutual funds in a Peer Group. The actual management fee represents the fee rate actually paid by Fund shareholders and includes any fee waivers or reimbursements. The net total expense ratio for the Fund represents the actual expense ratio incurred by Fund shareholders.
The mutual funds included in the Peer Universe, which was used to consider performance, and the Peer Group, which was used to consider fees and expenses, were objectively determined by Broadridge, an independent provider of mutual fund data. In certain circumstances, PGIM Investments also provided supplemental Peer Universe or Peer Group information for reasons addressed with the Board. The comparisons placed the Fund in various quartiles over various periods, with the first quartile being the best 25% of the mutual funds (for performance, the best performing mutual funds and, for expenses, the lowest cost mutual funds).
Visit our website at pgim.com/investments
The section below summarizes key factors considered by the Board and the Board’s conclusions regarding the Fund’s performance, fees and overall expenses. The table sets forth net performance comparisons (which reflect the impact on performance of fund expenses, or any subsidies, expense caps or waivers that may be applicable) with the Peer Universe, actual management fees with the Peer Group (which reflect the impact of any subsidies or fee waivers), and net total expenses with the Peer Group, each of which were key factors considered by the Board.
| | | | | | | | |
| Net Performance | | 1 Year | | 3 Years | | 5 Years | | 10 Years |
| | 2nd Quartile | | 1st Quartile | | 1st Quartile | | N/A |
| Actual Management Fees: 2nd Quartile |
| Net Total Expenses: 2nd Quartile |
| • | | The Board noted that Fund outperformed its benchmark index over all periods. |
| • | | The Board and PGIM Investments agreed to retain the Fund’s existing contractual expense cap that (exclusive of certain fees and expenses) limits total annual operating expenses at 0.84% for each class of the Fund’s shares, and limits transfer agency, shareholder servicing, sub-transfer agency and blue sky fees to the extent that such fees cause net annual Fund operating expenses to exceed 1.34% for Class R2 shares or 1.09% for Class R4 shares through February 28, 2021. |
| • | | The Board and PGIM Investments has also agreed to retain the Fund’s existing contractual expense cap with respect to Class A shares, which (exclusive of certain fees and expenses) limits total annual fund operating expenses to 1.08% for Class A shares through February 28, 2021. |
| • | | In addition, PGIM Investments will waive management fees or shared operating expenses on any share class to the same extent that it waives such expenses on any other share class, and has agreed that total annual fund operating expenses for Class R6 shares will not exceed total annual fund operating expenses for Class Z shares. |
| • | | The Board concluded that, in light of the above, it would be in the best interests of the Fund and its shareholders to renew the agreements. |
| • | | The Board concluded that the management fees (including subadvisory fees) and total expenses were reasonable in light of the services provided. |
* * *
After full consideration of these factors, the Board concluded that the approval of the agreements was in the best interests of the Fund and its shareholders.
PGIM Jennison Global Opportunities Fund
| | | | |
| | |
| ∎ MAIL | | ∎ TELEPHONE | | ∎ WEBSITE |
655 Broad Street Newark, NJ 07102 | | (800) 225-1852 | | pgim.com/investments |
|
| PROXY VOTING |
| The Board of Directors of the Fund has delegated to the Fund’s subadviser the responsibility for voting any proxies and maintaining proxy recordkeeping with respect to the Fund. A description of these proxy voting policies and procedures is available without charge, upon request, by calling (800) 225-1852 or by visiting the Securities and Exchange Commission’s website at sec.gov. Information regarding how the Fund voted proxies relating to portfolio securities during the most recent 12-month period ended June 30 is available on the Fund’s website and on the Securities and Exchange Commission’s website. |
|
| DIRECTORS |
| Ellen S. Alberding • Kevin J. Bannon • Scott E. Benjamin • Linda W. Bynoe • Barry H. Evans • Keith F. Hartstein • Laurie Simon Hodrick • Michael S. Hyland • Stuart S. Parker • Brian K. Reid • Grace C. Torres |
|
| OFFICERS |
Stuart S. Parker, President • Scott E. Benjamin, Vice President • Christian J. Kelly, Treasurer and Principal Financial and Accounting Officer • Claudia DiGiacomo, Chief Legal Officer • Dino Capasso, Chief Compliance Officer • Charles H. Smith, Anti-Money Laundering Compliance Officer • Andrew R. French, Secretary • Melissa Gonzalez, Assistant Secretary • Diana N. Huffman, Assistant Secretary • Kelly A. Coyne, Assistant Secretary • Patrick McGuinness, Assistant Secretary • Lana Lomuti, Assistant Treasurer • Russ Shupak, Assistant Treasurer • Elyse McLaughlin, Assistant Treasurer • Deborah Conway, Assistant Treasurer |
| | | | |
| MANAGER | | PGIM Investments LLC | | 655 Broad Street
Newark, NJ 07102 |
|
| SUBADVISER | | Jennison Associates LLC | | 466 Lexington Avenue
New York, NY 10017 |
|
| DISTRIBUTOR | | Prudential Investment
Management Services LLC | | 655 Broad Street
Newark, NJ 07102 |
|
| CUSTODIAN | | The Bank of New York Mellon | | 240 Greenwich Street New York, NY 10286 |
|
| TRANSFER AGENT | | Prudential Mutual Fund
Services LLC | | PO Box 9658
Providence, RI 02940 |
|
| INDEPENDENT REGISTERED PUBLIC ACCOUNTING FIRM | | PricewaterhouseCoopers LLP | | 300 Madison Avenue New York, NY 10017 |
|
| FUND COUNSEL | | Willkie Farr & Gallagher LLP | | 787 Seventh Avenue
New York, NY 10019 |
|
|
| An investor should consider the investment objectives, risks, charges, and expenses of the Fund carefully before investing. The prospectus and summary prospectus contain this and other information about the Fund. An investor may obtain the prospectus and summary prospectus by visiting our website at pgim.com/investments or by calling (800) 225-1852. The prospectus and summary prospectus should be read carefully before investing. |
|
| E-DELIVERY |
| To receive your mutual fund documents online, go to pgim.com/investments/resource/edelivery and enroll. Instead of receiving printed documents by mail, you will receive notification via email when new materials are available. You can cancel your enrollment or change your email address at any time by visiting the website address above. |
|
| SHAREHOLDER COMMUNICATIONS WITH DIRECTORS |
| Shareholders can communicate directly with the Board of Directors by writing to the Chair of the Board, PGIM Jennison Global Opportunities Fund, PGIM Investments, Attn: Board of Directors, 655 Broad Street, Newark, NJ 07102. Shareholders can communicate directly with an individual Director by writing that Director at to the same address. Communications are not screened before being delivered to the addressee. |
|
| AVAILABILITY OF PORTFOLIO HOLDINGS |
| The Fund files its complete schedule of portfolio holdings with the Securities and Exchange Commission for the first and third quarters of each fiscal year as an exhibit to its reports on Form N-PORT. The Fund’s Form N-PORT filings are available on the Commission’s website at sec.gov. |
|
| The Fund’s Statement of Additional Information contains additional information about the Fund’s Directors and is available without charge, upon request, by calling (800) 225-1852. |
Mutual Funds:
| | | | |
| ARE NOT INSURED BY THE FDIC OR ANY FEDERAL GOVERNMENT AGENCY | | MAY LOSE VALUE | | ARE NOT A DEPOSIT OF OR GUARANTEED BY ANY BANK OR ANY BANK AFFILIATE |
PGIM JENNISON GLOBAL OPPORTUNITIES FUND
| | | | | | | | | | | | |
| SHARE CLASS | | A | | C | | Z | | R2 | | R4 | | R6 |
| NASDAQ | | PRJAX | | PRJCX | | PRJZX | | PRJBX | | PRJDX | | PRJQX |
| CUSIP | | 743969719 | | 743969693 | | 743969685 | | 743969438 | | 743969420 | | 743969594 |
MF214E

PGIM JENNISON INTERNATIONAL OPPORTUNITIES FUND
ANNUAL REPORT
OCTOBER 31, 2020
COMING SOON: PAPERLESS SHAREHOLDER REPORTS
Beginning on January 1, 2021, as permitted by regulations adopted by the Securities and Exchange Commission, paper copies of the Fund’s annual and semiannual shareholder reports will no longer be sent by mail, unless you specifically request paper copies of the reports. Instead, the reports will be made available on the Fund’s website (pgim.com/investments), and you will be notified by mail each time a report is posted and provided with a website link to access the report.
If you already elected to receive shareholder reports electronically, you will not be affected by this change and you need not take any action. You may elect to receive shareholder reports and other communications from the Fund electronically anytime by contacting your financial intermediary (such as a broker-dealer or bank) or, if you are a direct investor, by calling 1-800-225-1852 or by sending an email request to PGIM Investments at shareholderreports@pgim.com.
You may elect to receive all future reports in paper free of charge. If you invest through a financial intermediary, you can contact your financial intermediary to elect to continue to receive paper copies of your shareholder reports. If you invest directly with the Fund, you can call 1-800-225-1852 or send an email request to shareholderreports@pgim.com to let the Fund know you wish to continue receiving paper copies of your shareholder reports. Your election to receive reports in paper will apply to all funds held in your account if you invest through your financial intermediary or all funds held with the fund complex if you invest directly with the Fund.

To enroll in e-delivery, go to pgim.com/investments/resource/edelivery
Table of Contents
This report is not authorized for distribution to prospective investors unless preceded or accompanied by a current prospectus.
The views expressed in this report and information about the Fund’s portfolio holdings are for the period covered by this report and are subject to change thereafter.
Mutual funds are distributed by Prudential Investment Management Services LLC, member SIPC. Jennison Associates LLC is a registered investment adviser. Both are Prudential Financial companies. © 2020 Prudential Financial, Inc. and its related entities. Jennison Associates, Jennison, PGIM, and the PGIM logo are service marks of Prudential Financial, Inc. and its related entities, registered in many jurisdictions worldwide.
| | |
| 2 | | Visit our website at pgim.com/investments |
Letter from the President

Dear Shareholder:
We hope you find the annual report for the PGIM Jennison International Opportunities Fund informative and useful. The report covers performance for the 12-month period that ended October 31, 2020.
During the first four months of the period, the global economy remained healthy—particularly in the US—fueled by rising corporate profits and strong job growth. The outlook changed dramatically in March as the coronavirus outbreak quickly and substantially shut down economic activity worldwide, leading to significant job losses and a steep decline in global growth and earnings. Responding to this disruption, the Federal Reserve (the Fed) cut the federal funds rate target to near zero and flooded capital markets with liquidity; and Congress passed stimulus bills worth approximately $3 trillion that offered an economic lifeline to consumers and businesses.
While stocks climbed throughout the first four months of the period, they fell significantly in March amid a spike in volatility, ending the 11-year-long equity bull market. With stores and factories closing and consumers staying at home to limit the spread of the virus, investors sold stocks on fears that corporate earnings would take a serious hit. Equities rallied around the globe throughout the spring and summer as states reopened their economies, but became more volatile during the last two months of the period as investors worried that a surge in coronavirus infections would stall the economic recovery. For the period overall, large-cap US and emerging market stocks rose, small-cap US stocks were virtually unchanged, and stocks in developed foreign markets declined.
The bond market overall—including US and global bonds as well as emerging market debt—rose during the period as investors sought safety in fixed income. A significant rally in interest rates pushed the 10-year US Treasury yield down to a record low. In March, the Fed took several aggressive actions to keep the bond markets running smoothly, restarting many of the relief programs that proved to be successful in helping end the global financial crisis in 2008-09.
Regarding your investments with PGIM, we believe it is important to maintain a diversified portfolio of funds consistent with your tolerance for risk, time horizon, and financial goals. Your financial advisor can help you create a diversified investment plan that may include funds covering all the basic asset classes and that reflects your personal investor profile and risk tolerance. However, diversification and asset allocation strategies do not assure a profit or protect against loss in declining markets.
At PGIM Investments, we consider it a great privilege and responsibility to help investors participate in opportunities across global markets while meeting their toughest investment challenges. PGIM is a top-10 global investment manager with more than $1 trillion in assets under management. This scale and investment expertise allow us to deliver actively managed funds and strategies to meet the needs of investors around the globe.
Thank you for choosing our family of funds.
Sincerely,

Stuart S. Parker, President
PGIM Jennison International Opportunities Fund
December 15, 2020
| | | | |
PGIM Jennison International Opportunities Fund | | | 3 | |
Your Fund’s Performance (unaudited)
Performance data quoted represents past performance. Past performance does not guarantee future results. The investment return and principal value of an investment will fluctuate, so that an investor’s shares, when redeemed, may be worth more or less than their original cost. Current performance may be lower or higher than the past performance data quoted. An investor may obtain performance data as of the most recent month-end by visiting our website at pgim.com/investments or by calling (800) 225-1852.
| | | | | | | | | | | | | | |
| | |
| | | | | Average Annual Total Returns as of 10/31/20 | |
| | | | | One Year (%) | | | Five Years (%) | | | Since Inception (%) | |
| Class A | | | | | | | | | | | | | | |
| (with sales charges) | | | | | 36.18 | | | | 15.22 | | | | 12.87 (6/5/12) | |
| (without sales charges) | | | | | 44.11 | | | | 16.53 | | | | 13.63 (6/5/12) | |
| Class C | | | | | | | | | | | | | | |
| (with sales charges) | | | | | 42.00 | | | | 15.61 | | | | 12.76 (6/5/12) | |
| (without sales charges) | | | | | 43.00 | | | | 15.61 | | | | 12.76 (6/5/12) | |
| Class R | | | | | | | | | | | | | | |
| (without sales charges) | | | | | 43.56 | | | | N/A | | | | 16.98 (11/20/17) | |
| Class Z | | | | | | | | | | | | | | |
| (without sales charges) | | | | | 44.46 | | | | 16.80 | | | | 13.90 (6/5/12) | |
| Class R2 | | | | | | | | | | | | | | |
| (without sales charges) | | | | | 43.91 | | | | N/A | | | | 40.62 (12/27/18) | |
| Class R4 | | | | | | | | | | | | | | |
| (without sales charges) | | | | | 44.20 | | | | N/A | | | | 40.96 (12/27/18) | |
| Class R6 | | | | | | | | | | | | | | |
| (without sales charges) | | | | | 44.54 | | | | N/A | | | | 17.30 (12/23/15) | |
| MSCI All Country World ex-US Index | | | | | | | | | | | | |
| | | | | | –2.61 | | | | 4.26 | | | | — | |
| | | | | | | | | | | | | | |
|
| Average Annual Total Returns as of 10/31/20 Since Inception (%) | |
| | | Class A, C, Z
(6/5/12) | | Class R
(11/20/17) | | | Class R2, R4
(12/27/18) | | | Class R6
(12/23/15) | |
| MSCI All Country World ex-US Index | | 5.85 | | | –0.47 | | | | 6.60 | | | | 5.28 | |
Since Inception returns are provided since the Fund has less than 10 fiscal years of returns. Since Inception returns for the Index are measured from the closest month-end to each class’ inception date.
| | |
| 4 | | Visit our website at pgim.com/investments |
Growth of a $10,000 Investment (unaudited)
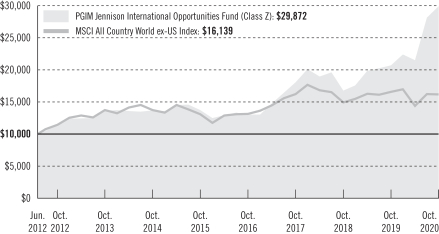
The graph compares a $10,000 investment in the Fund’s Class Z shares with a similar investment in the MSCI All Country World ex-US Index by portraying the initial account values at the commencement of operations for Class Z shares (June 5, 2012) and the account values at the end of the current fiscal year (October 31, 2020), as measured on a quarterly basis. For purposes of the graph, and unless otherwise indicated, it has been assumed that (a) all recurring fees (including management fees) were deducted; and (b) all dividends and distributions were reinvested. The line graph provides information for Class Z shares only. As indicated in the tables provided earlier, performance for other share classes will vary due to the differing fees and expenses applicable to each share class (as indicated in the following paragraphs). Without waiver of fees and/or expense reimbursements, if any, the Fund’s returns would have been lower.
Past performance does not predict future performance. Total returns and the ending account values in the graph include changes in share price and reinvestment of dividends and capital gains distributions in a hypothetical investment for the periods shown. The Fund’s total returns do not reflect the deduction of income taxes on an individual’s investment. Taxes may reduce your actual investment returns on income or gains paid by the Fund or any gains you may realize if you sell your shares.
| | | | |
PGIM Jennison International Opportunities Fund | | | 5 | |
Your Fund’s Performance (continued)
The returns in the tables do not reflect the deduction of taxes that a shareholder would pay on Fund distributions or following the redemption of Fund shares. The average annual total returns take into account applicable sales charges, which are described for each share class in the table below.
| | | | | | | | | | | | | | |
| | | | | | | | |
| | | Class A | | Class C | | Class R | | Class Z | | Class R2 | | Class R4 | | Class R6 |
| Maximum initial sales charge | | 5.50% of the public offering price | | None | | None | | None | | None | | None | | None |
Contingent deferred sales charge (CDSC)
(as a percentage of the lower of the original purchase price or the net asset value at redemption) | | 1.00% on sales of $1 million or more made within 12 months of purchase | | 1.00% on sales made within 12 months of purchase | | None | | None | | None | | None | | None |
Annual distribution or distribution and service (12b-1) fees
(shown as a percentage of average daily net assets) | | 0.30%
(0.25% currently) | | 1.00% | | 0.75%
(0.50% currently) | | None | | 0.25% | | None | | None |
| Shareholder service fee | | None | | None | | None | | None | | 0.10%* | | 0.10%* | | None |
*Shareholder service fee reflects maximum allowable fees under a shareholder services plan.
Benchmark Definitions
MSCI All Country World ex-US Index—The Morgan Stanley Capital International All Country World ex-US Index is an unmanaged free float-adjusted market capitalization-weighted index that is designed to provide a broad measure of stock performance throughout the world, with the exception of US-based companies. The Index includes both developed and emerging markets.
Investors cannot invest directly in an index. The returns for the Index would be lower if they included the effects of sales charges, operating expenses of a mutual fund, or taxes that may be paid by an investor.
| | |
| 6 | | Visit our website at pgim.com/investments |
Presentation of Fund Holdings as of 10/31/20
| | | | | | |
| | | |
| Ten Largest Holdings | | Line of Business | | Country | | % of Net Assets |
| Sea Ltd., ADR | | Entertainment | | Taiwan | | 5.5% |
| Adyen NV, 144A | | IT Services | | Netherlands | | 5.5% |
| Shopify, Inc. (Class A Stock) | | IT Services | | Canada | | 5.3% |
| MercadoLibre, Inc. | | Internet & Direct Marketing Retail | | Argentina | | 5.0% |
| Meituan (Class B Stock) | | Internet & Direct Marketing Retail | | China | | 4.8% |
| Sartorius AG (PRFC) | | Healthcare Equipment & Supplies | | Germany | | 4.4% |
| Tencent Holdings Ltd. | | Interactive Media & Services | | China | | 4.3% |
| Alibaba Group Holding Ltd., ADR | | Internet & Direct Marketing Retail | | China | | 3.9% |
| LVMH Moet Hennessy Louis Vuitton SE | | Textiles, Apparel & Luxury Goods | | France | | 3.5% |
| Wuxi Biologics Cayman, Inc., 144A | | Life Sciences Tools & Services | | China | | 3.2% |
Holdings reflect only long-term investments and are subject to change.
| | | | |
PGIM Jennison International Opportunities Fund | | | 7 | |
Strategy and Performance Overview (unaudited)
How did the Fund perform?
The PGIM Jennison International Opportunities Fund’s Class Z shares returned 44.46% in the 12-month reporting period that ended October 31, 2020, outperforming the -2.61% return of the MSCI All Country World ex-US Index (the Index).
What was the market environment?
| • | | Markets were extremely volatile during the reporting period, unsettled by US-China trade discord and the COVID-19 pandemic. |
| • | | Stocks peaked at new highs in early 2020 and then dropped dramatically as COVID-19 spread around the globe, disrupting markets and life everywhere. |
| • | | The realities of COVID-19 dictated daily conduct for individuals, businesses, and governments worldwide. Shelter-in-place and work-from-home policies became standard. Global infection and mortality rates reflected varying policy and social behaviors, with the number of infections and deaths highest in the US. Developing a vaccine became an overwhelming focus, with both human and capital resources deployed. |
| • | | Markets rebounded rapidly during the period’s final months, but the pandemic’s economic damage continued to accumulate. |
What worked?
| • | | Stock selection and allocations across nearly all Index sectors benefited the Fund’s relative performance during the reporting period. Holdings in consumer discretionary, information technology, and healthcare—the Fund’s three largest sector weightings—were especially strong contributors to outperformance, as both stock selection and overweights in those sectors were beneficial. |
| • | | In consumer discretionary: |
| | • | | Meituan-Dianping is a Chinese consumer services marketplace website. The company has a strong growth outlook as China’s leading domestic consumption story, and it has improved operating margins across all business segments. Despite the continued impact and uncertainties of COVID-19, the core food delivery business should continue to show a robust recovery. |
| | • | | Mercado Libre is an online trading service based in Buenos Aires, Argentina, that enables individuals and businesses to electronically sell and buy items in thousands of categories. The company’ growth has accelerated materially since the COVID-19 pandemic began, and it is becoming increasingly clear that the digital gains from this disruption can have long-term benefits, in Jennison’s view. |
| | |
| 8 | | Visit our website at pgim.com/investments |
| • | | In information technology: |
| | • | | Netherlands-based payment processor Adyen has developed a single, dynamic, reliable, and secure payment platform that supports omni-channel commerce with end-to-end gateway, risk management, and processing services. |
| | • | | Recognition of the importance of digital commerce in times of restricted personal mobility is also benefiting Canadian e-commerce platform Shopify, Inc., which provides cloud-based, easy-to-use infrastructure tools to enable omni-channel e-commerce capability. |
| • | | In communication services, Sea Ltd., a leading Southeast Asian internet company focused on digital entertainment, continues to gain momentum as a key beneficiary of growth from online gaming and e-commerce transactions. The pandemic has accelerated the shift toward the digital economy, benefiting Sea’s business across multiple fronts. |
What didn’t work?
| | • | | A leading detractor was French aerospace company Safran SA, which was sold during the reporting period because of the company’s exposure to the airline industry. Most of Safran’s revenue is generated by its aerospace propulsion business, which includes the company’s joint venture with General Electric that makes 75% of the world’s narrow-body aircraft engines (including all of Boeing’s 737s and about half of Airbus’s A320s). |
| | • | | Similarly, material restrictions on travel related to the pandemic have created financial strains on airlines. Jennison eliminated Dutch aerospace giant Airbus SE during the period based on the company’s exposure to the industry’s challenges. |
| | • | | UK-based Ashtead Group rents construction and industrial equipment, principally in the US and the United Kingdom. The Fund’s position was sold during the period as Jennison reduced overall cyclical exposure amid the COVID-19 outbreak. |
| • | | In consumer discretionary, the Fund’s position in German athleisure company Adidas AG was eliminated due to the company’s softer-than-expected gross margins, COVID-19-related sporting event cancellations, and an anticipated backup in wholesale inventories. |
| • | | In healthcare, the Fund’s position in Swiss dental supply maker Straumann Group was eliminated as Jennison believed that many elective procedures would be delayed amid the outbreak. |
| | | | |
PGIM Jennison International Opportunities Fund | | | 9 | |
Strategy and Performance Overview (continued)
Current outlook
| • | | Corporate profit recovery is set to continue, aided by reduced labor and travel costs that could further expand profit margin opportunities. However, the outlook overall remains uncertain, not least because of the disruptive aftermath of the US presidential election and the pandemic’s ongoing impact. |
| • | | COVID-19 continues to disrupt activity around the globe. Jennison is optimistic that promising results from a number of clinical trials will result in an effective vaccine in the near term. However, it may be another 12 to 18 months before a finished product—the likely prerequisite for a broad-based recovery in confidence and activity—is globally available. Sectors where share prices and operating fundamentals have been disproportionately hit by the disease will likely experience a relief rally once distribution of a vaccine begins, but a return to pre-COVID-19 operating levels will probably not transpire for some time thereafter. |
| • | | Investors have demonstrated their preference for businesses that were thriving before COVID-19 and that have benefited from pandemic-related tailwinds and enhanced competitive positions. The Fund holds many technology, consumer, and communications services companies in this category. Prospects for their continued growth at above-average rates remain strong, in Jennison’s view. |
| | |
| 10 | | Visit our website at pgim.com/investments |
Fees and Expenses (unaudited)
As a shareholder of the Fund, you incur two types of costs: (1) transaction costs, including sales charges (loads) on purchase payments and redemptions, as applicable, and (2) ongoing costs, including management fees, distribution, and/or service (12b-1) fees, and other Fund expenses, as applicable. This example is intended to help you understand your ongoing costs (in dollars) of investing in the Fund and to compare these costs with the ongoing costs of investing in other mutual funds.
The example is based on an investment of $1,000 held through the six-month period ended October 31, 2020. The example is for illustrative purposes only; you should consult the Fund’s Prospectus for information on initial and subsequent minimum investment requirements.
Actual Expenses
The first line for each share class in the table on the following page provides information about actual account values and actual expenses. You may use the information on this line, together with the amount you invested, to estimate the expenses that you paid over the period. Simply divide your account value by $1,000 (for example, an $8,600 account value ÷ $1,000 = 8.6), then multiply the result by the number on the first line under the heading “Expenses Paid During the Six-Month Period” to estimate the expenses you paid on your account during this period.
Hypothetical Example for Comparison Purposes
The second line for each share class in the table on the following page provides information about hypothetical account values and hypothetical expenses based on the Fund’s actual expense ratio and an assumed rate of return of 5% per year before expenses, which is not the Fund’s actual return. The hypothetical account values and expenses may not be used to estimate the actual ending account balance or expenses you paid for the period. You may use this information to compare the ongoing costs of investing in the Fund and other funds. To do so, compare this 5% hypothetical example with the 5% hypothetical examples that appear in the shareholder reports of the other funds.
The Fund’s transfer agent may charge additional fees to holders of certain accounts that are not included in the expenses shown in the table on the following page. These fees apply to individual retirement accounts (IRAs) and Section 403(b) accounts. As of the close of the six-month period covered by the table, IRA fees included an annual maintenance fee of $15 per account (subject to a maximum annual maintenance fee of $25 for all accounts held by the same shareholder). Section 403(b) accounts are charged an annual $25 fiduciary maintenance fee. Some of the fees may vary in amount, or may be waived, based on your total account balance or the number of PGIM funds, including the Fund, that you own. You should consider the additional fees that were charged to your Fund account over the six-month period when you estimate the total ongoing expenses paid over the period
| | | | |
PGIM Jennison International Opportunities Fund | | | 11 | |
Fees and Expenses (continued)
and the impact of these fees on your ending account value, as these additional expenses are not reflected in the information provided in the expense table. Additional fees have the effect of reducing investment returns.
Please note that the expenses shown in the table are meant to highlight your ongoing costs only and do not reflect any transactional costs such as sales charges (loads). Therefore, the second line for each share class in the table is useful in comparing ongoing costs only and will not help you determine the relative total costs of owning different funds. In addition, if these transactional costs were included, your costs would have been higher.
| | | | | | | | | | | | | | | | | | |
| | | | |
PGIM
Jennison International
Opportunities Fund | | Beginning Account
Value
May 1, 2020 | | | Ending Account
Value
October 31, 2020 | | | Annualized
Expense Ratio
Based on the
Six-Month Period | | | Expenses Paid
During the
Six-Month Period* | |
| Class A | | Actual | | $ | 1,000.00 | | | $ | 1,387.10 | | | | 1.09 | % | | $ | 6.54 | |
| | Hypothetical | | $ | 1,000.00 | | | $ | 1,019.66 | | | | 1.09 | % | | $ | 5.53 | |
| Class C | | Actual | | $ | 1,000.00 | | | $ | 1,381.40 | | | | 1.90 | % | | $ | 11.37 | |
| | Hypothetical | | $ | 1,000.00 | | | $ | 1,015.58 | | | | 1.90 | % | | $ | 9.63 | |
| Class R | | Actual | | $ | 1,000.00 | | | $ | 1,384.50 | | | | 1.47 | % | | $ | 8.81 | |
| | Hypothetical | | $ | 1,000.00 | | | $ | 1,017.75 | | | | 1.47 | % | | $ | 7.46 | |
| Class Z | | Actual | | $ | 1,000.00 | | | $ | 1,389.10 | | | | 0.90 | % | | $ | 5.40 | |
| | Hypothetical | | $ | 1,000.00 | | | $ | 1,020.61 | | | | 0.90 | % | | $ | 4.57 | |
| Class R2 | | Actual | | $ | 1,000.00 | | | $ | 1,385.60 | | | | 1.33 | % | | $ | 7.98 | |
| | Hypothetical | | $ | 1,000.00 | | | $ | 1,018.45 | | | | 1.33 | % | | $ | 6.75 | |
| Class R4 | | Actual | | $ | 1,000.00 | | | $ | 1,387.20 | | | | 1.09 | % | | $ | 6.54 | |
| | Hypothetical | | $ | 1,000.00 | | | $ | 1,019.66 | | | | 1.09 | % | | $ | 5.53 | |
| Class R6 | | Actual | | $ | 1,000.00 | | | $ | 1,389.20 | | | | 0.84 | % | | $ | 5.04 | |
| | | Hypothetical | | $ | 1,000.00 | | | $ | 1,020.91 | | | | 0.84 | % | | $ | 4.27 | |
*Fund expenses (net of fee waivers or subsidies, if any) for each share class are equal to the annualized expense ratio for each share class (provided in the table), multiplied by the average account value over the period, multiplied by the 184 days in the six-month period ended October 31, 2020, and divided by the 366 days in the Fund’s fiscal year ended October 31, 2020 (to reflect the six-month period). Expenses presented in the table include the expenses of any underlying portfolios in which the Fund may invest.
| | |
| 12 | | Visit our website at pgim.com/investments |
Schedule of Investments
as of October 31, 2020
| | | | | | | | |
| Description | | Shares | | | Value | |
| | |
LONG-TERM INVESTMENTS 94.7% | | | | | | | | |
| | |
COMMON STOCKS 90.3% | | | | | | | | |
| | |
Argentina 5.0% | | | | | | | | |
MercadoLibre, Inc.* | | | 100,764 | | | $ | 122,332,534 | |
| | |
Australia 1.6% | | | | | | | | |
Cochlear Ltd. | | | 254,585 | | | | 37,972,528 | |
| | |
Canada 5.3% | | | | | | | | |
Shopify, Inc. (Class A Stock)* | | | 138,838 | | | | 128,484,850 | |
| | |
China 17.8% | | | | | | | | |
Alibaba Group Holding Ltd., ADR* | | | 310,403 | | | | 94,576,690 | |
Jiangsu Hengrui Medicine Co. Ltd. (Class A Stock) | | | 3,166,797 | | | | 42,061,436 | |
Meituan (Class B Stock)* | | | 3,121,988 | | | | 115,984,196 | |
Tencent Holdings Ltd. | | | 1,360,566 | | | | 103,665,794 | |
Wuxi Biologics Cayman, Inc., 144A* | | | 2,733,910 | | | | 76,811,585 | |
| | | | | | | | |
| | | | | | | 433,099,701 | |
| | |
Denmark 0.5% | | | | | | | | |
Novo Nordisk A/S (Class B Stock) | | | 205,812 | | | | 13,208,404 | |
| | |
France 14.8% | | | | | | | | |
Dassault Systemes SE | | | 316,042 | | | | 53,990,586 | |
Kering SA | | | 108,825 | | | | 65,768,055 | |
L’Oreal SA | | | 220,277 | | | | 71,159,366 | |
LVMH Moet Hennessy Louis Vuitton SE | | | 179,019 | | | | 83,916,432 | |
Pernod Ricard SA | | | 295,988 | | | | 47,649,136 | |
Remy Cointreau SA(a) | | | 221,503 | | | | 37,392,705 | |
| | | | | | | | |
| | | | | | | 359,876,280 | |
| | |
Germany 0.6% | | | | | | | | |
Hypoport SE* | | | 29,751 | | | | 15,585,373 | |
| | |
Hong Kong 0.5% | | | | | | | | |
Techtronic Industries Co. Ltd. | | | 961,312 | | | | 12,925,814 | |
| | |
Israel 4.8% | | | | | | | | |
Nice Ltd., ADR* | | | 291,334 | | | | 66,499,899 | |
Wix.com Ltd.*(a) | | | 202,482 | | | | 50,077,848 | |
| | | | | | | | |
| | | | | | | 116,577,747 | |
See Notes to Financial Statements.
| | | | |
| PGIM Jennison International Opportunities Fund | | | 13 | |
Schedule of Investments (continued)
as of October 31, 2020
| | | | | | | | |
| Description | | Shares | | | Value | |
| | |
COMMON STOCKS (Continued) | | | | | | | | |
| | |
Italy 4.5% | | | | | | | | |
Brunello Cucinelli SpA*(a) | | | 1,211,570 | | | $ | 36,489,335 | |
Ferrari NV | | | 411,042 | | | | 73,357,274 | |
| | | | | | | | |
| | | | | | | 109,846,609 | |
| | |
Japan 3.8% | | | | | | | | |
GMO Payment Gateway, Inc. | | | 330,338 | | | | 40,472,158 | |
Menicon Co. Ltd. | | | 727,453 | | | | 51,350,653 | |
| | | | | | | | |
| | | | | | | 91,822,811 | |
| | |
Netherlands 6.9% | | | | | | | | |
Adyen NV, 144A* | | | 79,315 | | | | 133,190,978 | |
ASML Holding NV | | | 91,487 | | | | 33,119,224 | |
| | | | | | | | |
| | | | | | | 166,310,202 | |
| | |
Switzerland 3.6% | | | | | | | | |
Alcon, Inc.* | | | 285,070 | | | | 16,174,314 | |
Givaudan SA | | | 17,196 | | | | 70,201,490 | |
| | | | | | | | |
| | | | | | | 86,375,804 | |
| | |
Taiwan 8.5% | | | | | | | | |
Sea Ltd., ADR* | | | 846,323 | | | | 133,465,138 | |
Taiwan Semiconductor Manufacturing Co. Ltd., ADR | | | 855,147 | | | | 71,721,179 | |
| | | | | | | | |
| | | | | | | 205,186,317 | |
| | |
United Kingdom 5.2% | | | | | | | | |
Abcam PLC | | | 2,066,115 | | | | 39,361,584 | |
AstraZeneca PLC | | | 233,896 | | | | 23,488,619 | |
Experian PLC | | | 1,733,905 | | | | 63,321,175 | |
| | | | | | | | |
| | | | | | | 126,171,378 | |
| | |
United States 6.9% | | | | | | | | |
Atlassian Corp. PLC (Class A Stock)* | | | 340,138 | | | | 65,177,244 | |
Lululemon Athletica, Inc.* | | | 214,356 | | | | 68,441,727 | |
Spotify Technology SA* | | | 136,919 | | | | 32,845,499 | |
| | | | | | | | |
| | | | | | | 166,464,470 | |
| | | | | | | | |
TOTAL COMMON STOCKS
(cost $1,617,228,698) | | | | | | | 2,192,240,822 | |
| | | | | | | | |
See Notes to Financial Statements.
| | | | | | | | |
| Description | | Shares | | | Value | |
| | |
PREFERRED STOCK 4.4% | | | | | | | | |
| | |
Germany | | | | | | | | |
Sartorius AG (PRFC)
(cost $60,188,504) | | | 252,115 | | | $ | 106,743,483 | |
| | | | | | | | |
| | |
TOTAL LONG-TERM INVESTMENTS
(cost $1,677,417,202) | | | | | | | 2,298,984,305 | |
| | | | | | | | |
SHORT-TERM INVESTMENTS 5.9% | | | | | | | | |
| | |
AFFILIATED MUTUAL FUNDS | | | | | | | | |
PGIM Core Ultra Short Bond Fund(w) | | | 103,564,166 | | | | 103,564,166 | |
PGIM Institutional Money Market Fund
(cost $39,497,760; includes $39,489,158 of cash collateral for securities on loan)(b)(w) | | | 39,585,522 | | | | 39,573,646 | |
| | | | | | | | |
| | |
TOTAL SHORT-TERM INVESTMENTS
(cost $143,061,926) | | | | | | | 143,137,812 | |
| | | | | | | | |
| | |
TOTAL INVESTMENTS 100.6%
(cost $1,820,479,128) | | | | | | | 2,442,122,117 | |
Liabilities in excess of other assets (0.6)% | | | | | | | (13,797,739 | ) |
| | | | | | | | |
| | |
NET ASSETS 100.0% | | | | | | $ | 2,428,324,378 | |
| | | | | | | | |
Below is a list of the abbreviation(s) used in the annual report:
144A—Security was purchased pursuant to Rule 144A under the Securities Act of 1933 and, pursuant to the requirements of Rule 144A, may not be resold except to qualified institutional buyers.
ADR—American Depositary Receipt
LIBOR—London Interbank Offered Rate
PRFC—Preference Shares
| * | Non-income producing security. |
| (a) | All or a portion of security is on loan. The aggregate market value of such securities, including those sold and pending settlement, is $36,386,636; cash collateral of $39,489,158 (included in liabilities) was received with which the Series purchased highly liquid short-term investments. In the event of significant appreciation in value of securities on loan on the last business day of the reporting period, the Series may reflect a collateral value that is less than the market value of the loaned securities and such shortfall is remedied the following business day. |
| (b) | Represents security, or portion thereof, purchased with cash collateral received for securities on loan and includes dividend reinvestment. |
| (w) | PGIM Investments LLC, the manager of the Series, also serves as manager of the PGIM Core Ultra Short Bond Fund and PGIM Institutional Money Market Fund. |
See Notes to Financial Statements.
| | | | |
| PGIM Jennison International Opportunities Fund | | | 15 | |
Schedule of Investments (continued)
as of October 31, 2020
Fair Value Measurements:
Various inputs are used in determining the value of the Series’ investments. These inputs are summarized in the three broad levels listed below.
Level 1—unadjusted quoted prices generally in active markets for identical securities.
Level 2—quoted prices for similar securities, interest rates and yield curves, prepayment speeds, foreign currency exchange rates and other observable inputs.
Level 3—unobservable inputs for securities valued in accordance with Board approved fair valuation procedures.
The following is a summary of the inputs used as of October 31, 2020 in valuing such portfolio securities:
| | | | | | | | | | | | |
| | | Level 1 | | | Level 2 | | | Level 3 | |
Investments in Securities | | | | | | | | | | | | |
Assets | | | | | | | | | | | | |
Common Stocks | | | | | | | | | | | | |
Argentina | | $ | 122,332,534 | | | $ | — | | | $ | — | |
Australia | | | — | | | | 37,972,528 | | | | — | |
Canada | | | 128,484,850 | | | | — | | | | — | |
China | | | 94,576,690 | | | | 338,523,011 | | | | — | |
Denmark | | | — | | | | 13,208,404 | | | | — | |
France | | | — | | | | 359,876,280 | | | | — | |
Germany | | | — | | | | 15,585,373 | | | | — | |
Hong Kong | | | — | | | | 12,925,814 | | | | — | |
Israel | | | 116,577,747 | | | | — | | | | — | |
Italy | | | — | | | | 109,846,609 | | | | — | |
Japan | | | — | | | | 91,822,811 | | | | — | |
Netherlands | | | — | | | | 166,310,202 | | | | — | |
Switzerland | | | — | | | | 86,375,804 | | | | — | |
Taiwan | | | 205,186,317 | | | | — | | | | — | |
United Kingdom | | | — | | | | 126,171,378 | | | | — | |
United States | | | 166,464,470 | | | | — | | | | — | |
Preferred Stock | | | | | | | | | | | | |
Germany | | | — | | | | 106,743,483 | | | | — | |
Affiliated Mutual Funds | | | 143,137,812 | | | | — | | | | — | |
| | | | | | | | | | | | |
Total | | $ | 976,760,420 | | | $ | 1,465,361,697 | | | $ | — | |
| | | | | | | | | | | | |
See Notes to Financial Statements.
Industry Classification:
The industry classification of investments and liabilities in excess of other assets shown as a percentage of net assets as of October 31, 2020 were as follows (unaudited):
| | | | |
IT Services | | | 14.6 | % |
Internet & Direct Marketing Retail | | | 13.7 | |
Textiles, Apparel & Luxury Goods | | | 10.5 | |
Health Care Equipment & Supplies | | | 8.8 | |
Software | | | 7.6 | |
Entertainment | | | 6.9 | |
Affiliated Mutual Funds (1.6% represents investments purchased with collateral from securities on loan) | | | 5.9 | |
Semiconductors & Semiconductor Equipment | | | 4.4 | |
Interactive Media & Services | | | 4.3 | |
Beverages | | | 3.5 | |
Pharmaceuticals | | | 3.2 | |
Life Sciences Tools & Services | | | 3.1 | |
| | | | |
Automobiles | | | 3.0 | % |
Personal Products | | | 2.9 | |
Chemicals | | | 2.9 | |
Professional Services | | | 2.6 | |
Biotechnology | | | 1.6 | |
Diversified Financial Services | | | 0.6 | |
Machinery | | | 0.5 | |
| | | | |
| | | 100.6 | |
Liabilities in excess of other assets | | | (0.6 | ) |
| | | | |
| | | 100.0 | % |
| | | | |
Financial Instruments/Transactions—Summary of Offsetting and Netting Arrangements:
The Series entered into financial instruments/transactions during the reporting period that are either offset in accordance with current requirements or are subject to enforceable master netting arrangements or similar agreements that permit offsetting. The information about offsetting and related netting arrangements for financial instruments/transactions where the legal right to set-off exists is presented in the summary below.
Offsetting of financial instrument/transaction assets and liabilities:
| | | | | | | | | | | | | | | |
Description | | Gross Market
Value of
Recognized
Assets/(Liabilities) | | Collateral
Pledged/(Received)(1) | | Net
Amount |
Securities on Loan | | | $ | 36,386,636 | | | | | $(36,386,636 | ) | | | $ | — | |
| | | | | | | | | | | | | | | |
| (1) | Collateral amount disclosed by the Series is limited to the market value of financial instruments/transactions. |
See Notes to Financial Statements.
| | | | |
| PGIM Jennison International Opportunities Fund | | | 17 | |
Statement of Assets and Liabilities
as of October 31, 2020
| | | | |
Assets | | | | |
Investments at value, including securities on loan of $36,386,636: | | | | |
Unaffiliated investments (cost $1,677,417,202) | | $ | 2,298,984,305 | |
Affiliated investments (cost $143,061,926) | | | 143,137,812 | |
Cash | | | 1,427 | |
Foreign currency, at value (cost $27,956,434) | | | 27,955,426 | |
Receivable for investments sold | | | 27,979,631 | |
Receivable for Series shares sold | | | 27,585,699 | |
Tax reclaim receivable | | | 1,244,121 | |
Dividends and interest receivable | | | 133,282 | |
Prepaid expenses | | | 12,988 | |
| | | | |
Total Assets | | | 2,527,034,691 | |
| | | | |
| |
Liabilities | | | | |
Payable for investments purchased | | | 40,939,377 | |
Payable to broker for collateral for securities on loan | | | 39,489,158 | |
Payable for Series shares reacquired | | | 16,247,964 | |
Management fee payable | | | 1,264,021 | |
Accrued expenses and other liabilities | | | 535,397 | |
Distribution fee payable | | | 159,445 | |
Affiliated transfer agent fee payable | | | 71,912 | |
Directors’ fees payable | | | 2,664 | |
Affiliated shareholder servicing fees payable | | | 375 | |
| | | | |
Total Liabilities | | | 98,710,313 | |
| | | | |
| |
Net Assets | | $ | 2,428,324,378 | |
| | | | |
| |
| | | | | |
Net assets were comprised of: | | | | |
Common stock, at par | | $ | 852,961 | |
Paid-in capital in excess of par | | | 1,844,555,316 | |
Total distributable earnings (loss) | | | 582,916,101 | |
| | | | |
Net assets, October 31, 2020 | | $ | 2,428,324,378 | |
| | | | |
See Notes to Financial Statements.
| | | | |
Class A | | | | |
Net asset value and redemption price per share,
($76,093,249 ÷ 2,704,572 shares of common stock issued and outstanding) | | $ | 28.14 | |
Maximum sales charge (5.50% of offering price) | | | 1.64 | |
| | | | |
Maximum offering price to public | | $ | 29.78 | |
| | | | |
| |
Class C | | | | |
Net asset value, offering price and redemption price per share,
($16,411,189 ÷ 622,179 shares of common stock issued and outstanding) | | $ | 26.38 | |
| | | | |
| |
Class R | | | | |
Net asset value, offering price and redemption price per share,
($291,162,238 ÷ 10,404,252 shares of common stock issued and outstanding) | | $ | 27.98 | |
| | | | |
| |
Class Z | | | | |
Net asset value, offering price and redemption price per share,
($1,364,898,986 ÷ 47,790,279 shares of common stock issued and outstanding) | | $ | 28.56 | |
| | | | |
| |
Class R2 | | | | |
Net asset value, offering price and redemption price per share,
($4,664,445 ÷ 164,532 shares of common stock issued and outstanding) | | $ | 28.35 | |
| | | | |
| |
Class R4 | | | | |
Net asset value, offering price and redemption price per share,
($1,358,753 ÷ 47,700 shares of common stock issued and outstanding) | | $ | 28.49 | |
| | | | |
| |
Class R6 | | | | |
Net asset value, offering price and redemption price per share,
($673,735,518 ÷ 23,562,535 shares of common stock issued and outstanding) | | $ | 28.59 | |
| | | | |
See Notes to Financial Statements.
| | | | |
| PGIM Jennison International Opportunities Fund | | | 19 | |
Statement of Operations
Year Ended October 31, 2020
| | | | |
Net Investment Income (Loss) | | | | |
Income | | | | |
Unaffiliated dividend income (net of $1,059,684 foreign withholding tax) | | $ | 6,261,615 | |
Income from securities lending, net (including affiliated income of $214,644) | | | 371,289 | |
Affiliated dividend income | | | 244,464 | |
| | | | |
Total income | | | 6,877,368 | |
| | | | |
| |
Expenses | | | | |
Management fee | | | 10,449,701 | |
Distribution fee(a) | | | 2,350,295 | |
Shareholder servicing fees (including affiliated expense of $1,484)(a) | | | 2,524 | |
Transfer agent’s fees and expenses (including affiliated expense of $393,859)(a) | | | 1,002,620 | |
Custodian and accounting fees | | | 413,951 | |
Registration fees(a) | | | 327,820 | |
SEC registration fees | | | 139,525 | |
Shareholders’ reports | | | 91,495 | |
Directors’ fees | | | 27,543 | |
Audit fee | | | 27,162 | |
Legal fees and expenses | | | 24,760 | |
Miscellaneous | | | 40,865 | |
| | | | |
Total expenses | | | 14,898,261 | |
Less: Fee waiver and/or expense reimbursement(a) | | | (1,082,659 | ) |
Distribution fee waiver(a) | | | (726,124 | ) |
| | | | |
Net expenses | | | 13,089,478 | |
| | | | |
Net investment income (loss) | | | (6,212,110 | ) |
| | | | |
| |
Realized And Unrealized Gain (Loss) On Investment And Foreign Currency Transactions | | | | |
Net realized gain (loss) on: | | | | |
Investment transactions (including affiliated of $(54,158)) | | | (3,842,895 | ) |
Foreign currency transactions | | | (173,022 | ) |
| | | | |
| | | (4,015,917 | ) |
| | | | |
Net change in unrealized appreciation (depreciation) on: | | | | |
Investments (including affiliated of $74,755) | | | 502,151,171 | |
Foreign currencies | | | 29,492 | |
| | | | |
| | | 502,180,663 | |
| | | | |
Net gain (loss) on investment and foreign currency transactions | | | 498,164,746 | |
| | | | |
Net Increase (Decrease) In Net Assets Resulting From Operations | | $ | 491,952,636 | |
| | | | |
See Notes to Financial Statements.
| (a) | Class specific expenses and waivers were as follows: |
| | | | | | | | | | | | | | | | | | | | | | | | | | | | |
| | | Class A | | | Class C | | | Class R | | | Class Z | | | Class R2 | | | Class R4 | | | Class R6 | |
Distribution fee | | | 138,178 | | | | 98,940 | | | | 2,109,283 | | | | — | | | | 3,894 | | | | — | | | | — | |
Shareholder servicing fees | | | — | | | | — | | | | — | | | | — | | | | 1,501 | | | | 1,023 | | | | — | |
Transfer agent’s fees and expenses | | | 51,638 | | | | 9,184 | | | | 360,517 | | | | 575,360 | | | | 2,128 | | | | 1,644 | | | | 2,149 | |
Registration fees | | | 22,234 | | | | 17,545 | | | | 17,934 | | | | 144,426 | | | | 13,559 | | | | 13,559 | | | | 98,563 | |
Fee waiver and/or expense reimbursement | | | (92,397 | ) | | | (24,782 | ) | | | (136,610 | ) | | | (582,845 | ) | | | (14,193 | ) | | | (14,618 | ) | | | (217,214 | ) |
Distribution fee waiver | | | (23,030 | ) | | | — | | | | (703,094 | ) | | | — | | | | — | | | | — | | | | — | |
See Notes to Financial Statements.
| | | | |
| PGIM Jennison International Opportunities Fund | | | 21 | |
Statements of Changes in Net Assets
| | | | | | | | |
| |
| | | Year Ended
October 31, | |
| | |
| | | 2020 | | | 2019 | |
| | |
Increase (Decrease) in Net Assets | | | | | | | | |
Operations | | | | | | | | |
Net investment income (loss) | | $ | (6,212,110 | ) | | $ | (727,376 | ) |
Net realized gain (loss) on investment and foreign currency transactions | | | (4,015,917 | ) | | | (18,527,930 | ) |
Net change in unrealized appreciation (depreciation) on investments and foreign currencies | | | 502,180,663 | | | | 124,133,290 | |
| | | | | | | | |
Net increase (decrease) in net assets resulting from operations | | | 491,952,636 | | | | 104,877,984 | |
| | | | | | | | |
| | |
Dividends and Distributions | | | | | | | | |
Distributions from distributable earnings | | | | | | | | |
Class Z | | | — | | | | (60,708 | ) |
Class R6 | | | — | | | | (50,751 | ) |
| | | | | | | | |
| | | — | | | | (111,459 | ) |
| | | | | | | | |
| | |
Series share transactions (Net of share conversions) | | | | | | | | |
Net proceeds from shares sold | | | 1,727,331,268 | | | | 276,400,116 | |
Net asset value of shares issued in reinvestment of dividends and distributions | | | — | | | | 111,341 | |
Cost of shares reacquired | | | (415,033,423 | ) | | | (181,047,151 | ) |
| | | | | | | | |
Net increase (decrease) in net assets from Series share transactions | | | 1,312,297,845 | | | | 95,464,306 | |
| | | | | | | | |
Total increase (decrease) | | | 1,804,250,481 | | | | 200,230,831 | |
| | |
Net Assets: | | | | | | | | |
Beginning of year | | | 624,073,897 | | | | 423,843,066 | |
| | | | | | | | |
End of year | | $ | 2,428,324,378 | | | $ | 624,073,897 | |
| | | | | | | | |
See Notes to Financial Statements.
Notes to Financial Statements
Prudential World Fund, Inc. (the “Fund”) is registered under the Investment Company Act of 1940, as amended (“1940 Act”), as an open-end management investment company and currently consists of seven series: PGIM Jennison Emerging Markets Equity Opportunities Fund, PGIM Jennison Global Infrastructure Fund, PGIM Jennison Global Opportunities Fund, PGIM Jennison International Opportunities Fund and PGIM QMA International Equity Fund, each of which are diversified funds for purposes of the 1940 Act and PGIM Emerging Markets Debt Hard Currency Fund and PGIM Emerging Markets Debt Local Currency Fund, each of which are non-diversified funds for purposes of the 1940 Act, and therefore, may invest a greater percentage of their assets in the securities of a single company or other issuer than a diversified fund. Investing in a non-diversified fund involves greater risk than investing in a diversified fund because a loss resulting from the decline in value of any one security may represent a greater portion of the total assets of a non-diversified fund. These financial statements relate only to the PGIM Jennison International Opportunities Fund (the “Series”).
The investment objective of the Series is to seek long-term growth of capital.
The Series follows the investment company accounting and reporting guidance of the Financial Accounting Standards Board (“FASB”) Accounting Standard Codification (“ASC”) Topic 946 Financial Services — Investment Companies. The following accounting policies conform to U.S. generally accepted accounting principles. The Series consistently follows such policies in the preparation of its financial statements.
Securities Valuation: The Series holds securities and other assets and liabilities that are fair valued at the close of each day (generally, 4:00 PM Eastern time) the New York Stock Exchange (“NYSE”) is open for trading. Fair value is the price that would be received to sell an asset or paid to transfer a liability in an orderly transaction between market participants on the measurement date. The Fund’s Board of Directors (the “Board”) has adopted valuation procedures for security valuation under which fair valuation responsibilities have been delegated to PGIM Investments LLC (“PGIM Investments” or the “Manager”). Pursuant to the Board’s delegation, the Manager has established a Valuation Committee responsible for supervising the fair valuation of portfolio securities and other assets and liabilities. The valuation procedures permit the Series to utilize independent pricing vendor services, quotations from market makers, and alternative valuation methods when market quotations are either not readily available or not deemed representative of fair value. A record of the Valuation Committee’s actions is subject to the Board’s review, approval, and ratification at its next regularly scheduled quarterly meeting.
| | | | |
| PGIM Jennison International Opportunities Fund | | | 23 | |
Notes to Financial Statements (continued)
For the fiscal reporting year-end, securities and other assets and liabilities were fair valued at the close of the last U.S. business day. Trading in certain foreign securities may occur when the NYSE is closed (including weekends and holidays). Because such foreign securities trade in markets that are open on weekends and U.S. holidays, the values of some of the Series’ foreign investments may change on days when investors cannot purchase or redeem Series shares.
Various inputs determine how the Series’ investments are valued, all of which are categorized according to the three broad levels (Level 1, 2, or 3) detailed in the Schedule of Investments and referred to herein as the “fair value hierarchy” in accordance with FASB ASC Topic 820 - Fair Value Measurements and Disclosures.
Common or preferred stocks, exchange-traded funds and derivative instruments, if applicable, that are traded on a national securities exchange are valued at the last sale price as of the close of trading on the applicable exchange where the security principally trades. Securities traded via NASDAQ are valued at the NASDAQ official closing price. To the extent these securities are valued at the last sale price or NASDAQ official closing price, they are classified as Level 1 in the fair value hierarchy. In the event that no sale or official closing price on valuation date exists, these securities are generally valued at the mean between the last reported bid and ask prices, or at the last bid price in the absence of an ask price. These securities are classified as Level 2 in the fair value hierarchy.
Foreign equities traded on foreign securities exchanges are generally valued using pricing vendor services that provide model prices derived using adjustment factors based on information such as local closing price, relevant general and sector indices, currency fluctuations, depositary receipts, and futures, as applicable. Securities valued using such model prices are classified as Level 2 in the fair value hierarchy. The models generate an evaluated adjustment factor for each security, which is applied to the local closing price to adjust it for post closing market movements up to the time the Series is valued. Utilizing that evaluated adjustment factor, the vendor provides an evaluated price for each security. If the vendor does not provide an evaluated price, securities are valued in accordance with exchange-traded common and preferred stock valuation policies discussed above.
Investments in open-end funds (other than exchange-traded funds) are valued at their net asset values as of the close of the NYSE on the date of valuation. These securities are classified as Level 1 in the fair value hierarchy since they may be purchased or sold at their net asset values on the date of valuation.
Securities and other assets that cannot be priced according to the methods described above are valued based on pricing methodologies approved by the Board. In the event that
unobservable inputs are used when determining such valuations, the securities will be classified as Level 3 in the fair value hierarchy.
When determining the fair value of securities, some of the factors influencing the valuation include: the nature of any restrictions on disposition of the securities; assessment of the general liquidity of the securities; the issuer’s financial condition and the markets in which it does business; the cost of the investment; the size of the holding and the capitalization of the issuer; the prices of any recent transactions or bids/offers for such securities or any comparable securities; any available analyst media or other reports or information deemed reliable by the Manager regarding the issuer or the markets or industry in which it operates. Using fair value to price securities may result in a value that is different from a security’s most recent closing price and from the price used by other unaffiliated mutual funds to calculate their net asset values.
Foreign Currency Translation: The books and records of the Series are maintained in U.S. dollars. Foreign currency amounts are translated into U.S. dollars on the following basis:
(i) market value of investment securities, other assets and liabilities — at the current rates of exchange;
(ii) purchases and sales of investment securities, income and expenses — at the rates of exchange prevailing on the respective dates of such transactions.
Although the net assets of the Series are presented at the foreign exchange rates and market values at the close of the period, the Series does not generally isolate that portion of the results of operations arising as a result of changes in the foreign exchange rates from the fluctuations arising from changes in the market prices of long-term portfolio securities held at the end of the period. Similarly, the Series does not isolate the effect of changes in foreign exchange rates from the fluctuations arising from changes in the market prices of long-term portfolio securities sold during the period. Accordingly, holding period realized foreign currency gains (losses) are included in the reported net realized gains (losses) on investment transactions.
Net realized gains (losses) on foreign currency transactions represent net foreign exchange gains (losses) from the disposition of holdings of foreign currencies, currency gains (losses) realized between the trade and settlement dates on investment transactions, and the difference between the amounts of interest, dividends and foreign withholding taxes recorded on the Series’ books and the U.S. dollar equivalent amounts actually received or paid. Net unrealized currency gains (losses) arise from valuing foreign currency denominated assets and liabilities (other than investments) at period end exchange rates.
Master Netting Arrangements: The Fund, on behalf of the Series, is subject to various Master Agreements, or netting arrangements, with select counterparties. These are agreements which a subadviser may have negotiated and entered into on behalf of all or a portion of the Series. A master netting arrangement between the Series and the counterparty
| | | | |
| PGIM Jennison International Opportunities Fund | | | 25 | |
Notes to Financial Statements (continued)
permits the Series to offset amounts payable by the Series to the same counterparty against amounts to be received; and by the receipt of collateral from the counterparty by the Series to cover the Series’ exposure to the counterparty. However, there is no assurance that such mitigating factors are easily enforceable. In addition to master netting arrangements, the right to set-off exists when all the conditions are met such that each of the parties owes the other determinable amounts, the reporting party has the right to set-off the amount owed with the amount owed by the other party, the reporting party intends to set-off and the right of set-off is enforceable by law. During the reporting period, there was no intention to settle on a net basis and all amounts are presented on a gross basis on the Statement of Assets and Liabilities.
Securities Lending: The Series lends its portfolio securities to banks and broker-dealers. The loans are secured by collateral at least equal to the market value of the securities loaned. Collateral pledged by each borrower is invested in an affiliated money market fund and is marked to market daily, based on the previous day’s market value, such that the value of the collateral exceeds the value of the loaned securities. In the event of significant appreciation in value of securities on loan on the last business day of the reporting period, the financial statements may reflect a collateral value that is less than the market value of the loaned securities. Such shortfall is remedied as described above. Loans are subject to termination at the option of the borrower or the Series. Upon termination of the loan, the borrower will return to the Series securities identical to the loaned securities. Should the borrower of the securities fail financially, the Series has the right to repurchase the securities in the open market using the collateral.
The Series recognizes income, net of any rebate and securities lending agent fees, for lending its securities in the form of fees or interest on the investment of any cash received as collateral. The borrower receives all interest and dividends from the securities loaned and such payments are passed back to the lender in amounts equivalent thereto, which are reflected in interest income or unaffiliated dividend income based upon the nature of the payment on the Statement of Operations. The Series also continues to recognize any unrealized gain (loss) in the market price of the securities loaned and on the change in the value of the collateral invested that may occur during the term of the loan. In addition, realized gain (loss) is recognized on changes in the value of the collateral invested upon liquidation of the collateral. Net earnings from securities lending are disclosed in the Statement of Operations.
Securities Transactions and Net Investment Income: Securities transactions are recorded on the trade date. Realized gains (losses) from investment and currency transactions are calculated on the specific identification method. Dividend income is recorded on the ex-date, or for certain foreign securities, when the Series becomes aware of such dividends. Expenses are recorded on an accrual basis, which may require the use of certain estimates
by management that may differ from actual. Net investment income or loss (other than class specific expenses and waivers, which are allocated as noted below) and unrealized and realized gains (losses) are allocated daily to each class of shares based upon the relative proportion of adjusted net assets of each class at the beginning of the day. Class specific expenses and waivers, where applicable, are charged to the respective share classes. Class specific expenses include distribution fees and distribution fee waivers, shareholder servicing fees, transfer agent’s fees and expenses, registration fees and fee waivers and/or expense reimbursements, as applicable.
Taxes: It is the Series’ policy to continue to meet the requirements of the Internal Revenue Code applicable to regulated investment companies and to distribute all of its taxable net investment income and capital gains, if any, to its shareholders. Therefore, no federal income tax provision is required. Withholding taxes on foreign dividends, interest and capital gains, if any, are recorded, net of reclaimable amounts, at the time the related income is earned.
Dividends and Distributions: The Series expects to pay dividends from net investment income and distributions from net realized capital and currency gains, if any, annually. Dividends and distributions to shareholders, which are determined in accordance with federal income tax regulations and which may differ from generally accepted accounting principles, are recorded on the ex-date. Permanent book/tax differences relating to income and gain (loss) are reclassified between total distributable earnings (loss) and paid-in capital in excess of par, as appropriate.
Estimates: The preparation of financial statements requires management to make estimates and assumptions that affect the reported amounts and disclosures in the financial statements. Actual results could differ from those estimates.
The Fund, on behalf of the Series, has a management agreement with the Manager. Pursuant to this agreement, the Manager has responsibility for all investment advisory services and supervises the subadviser’s performance of such services. In addition, under the management agreement, the Manager provides all of the administrative functions necessary for the organization, operation and management of the Series. The Manager administers the corporate affairs of the Series and, in connection therewith, furnishes the Series with office facilities, together with those ordinary clerical and bookkeeping services which are not being furnished by the Series’ custodian and the Series’ transfer agent. The Manager is also responsible for the staffing and management of dedicated groups of legal, marketing, compliance and related personnel necessary for the operation of the Series. The legal, marketing, compliance and related personnel are also responsible for the management and oversight of the various service providers to the Series, including, but not limited to, the custodian, transfer agent, and accounting agent.
| | | | |
| PGIM Jennison International Opportunities Fund | | | 27 | |
Notes to Financial Statements (continued)
The Manager has entered into a subadvisory agreement with Jennison Associates LLC (“Jennison”). The subadvisory agreement provides that Jennison will furnish investment advisory services in connection with the management of the Series. In connection therewith, Jennison is obligated to keep certain books and records of the Series. The Manager pays for the services of Jennison, the cost of compensation of officers of the Series, occupancy and certain clerical and bookkeeping costs of the Series. The Series bears all other costs and expenses.
The management fee paid to the Manager is accrued daily and payable monthly at an annual rate of 0.825% of the Series’ average daily net assets up to and including $1 billion and 0.800% of such assets in excess of $1 billion. The effective management fee rate before any waivers and/or expense reimbursements was 0.820% for the year ended October 31, 2020.
Effective March 1, 2020, the Manager has contractually agreed, through February 28, 2022, to reimburse and/or waive fees so that the Series’ net annual operating expenses of each share class does not exceed 0.84% of the Series’ average daily net assets (exclusive of distribution and service (12b-1) fees, shareholder servicing fee, and transfer agency expenses (including sub-transfer agency and networking fees)). Prior to March 1, 2020, the Manager had contractually agreed, to reimburse and/or waive fees so that the Series’ net annual operating expenses of each share class does not exceed 0.84% of the Series’ average daily net assets (exclusive of distribution and service (12b-1) fees and transfer agency expenses (including sub-transfer agency and networking fees)). Seperately, the Manager has contractually agreed, through February 28, 2022, to limit transfer agency, shareholder servicing, sub-transfer agency, and blue sky fees, as applicable, to the extent that such fees cause the net annual operating expenses to exceed 1.34% of average daily net assets for Class R2 shares or 1.09% of average daily net assets for Class R4 shares. Additionally, the Manager has contractually agreed, through February 28, 2022, to limit total annual operating expenses after fee waivers and/or expense reimbursements to 1.09% of average daily net assets for Class A shares. Separately, the Manager has contractually agreed to waive and/or reimburse up to 0.06% of certain other expenses on an annualized basis, through February 28, 2022, to the extent that the total net annual operating expenses exceed 1.90% of average daily net assets for Class C shares, 1.48% of average daily net assets for Class R shares. 0.90% of average daily net assets for Class Z shares and 0.84% of average daily net assets for Class R6 shares. The contractual waivers and expense limitation above exclude interest, brokerage, taxes (such as income and foreign withholding taxes, stamp duty and deferred tax expenses), acquired fund fees and expenses, extraordinary expenses, and certain other Series expenses such as dividend and interest expense and broker charges on short sales.
Where applicable, the Manager agrees to waive management fees or shared operating expenses on any share class to the same extent that it waives such expenses on any other share class. In addition, total annual operating expenses for Class R6 shares will not exceed total annual operating expenses for Class Z shares. Fees and/or expenses waived and/or reimbursed by the Manager may be recouped by the Manager within the same fiscal year during which such waiver and/or reimbursement is made if such recoupment can be realized without exceeding the expense limit in effect at the time of the recoupment for the fiscal year.
The Fund, on behalf of the Series, has a distribution agreement with Prudential Investment Management Services LLC (“PIMS”), which acts as the distributor of the Class A, Class C, Class R, Class Z, Class R2, Class R4 and Class R6 shares of the Series. The Series compensates PIMS for distributing and servicing the Series’ Class A, Class C, Class R and Class R2 shares, pursuant to the plans of distribution (the “Distribution Plans”), regardless of expenses actually incurred by PIMS. The distribution fees are accrued daily and payable monthly. No distribution or service fees are paid to PIMS as distributor of the Class Z, Class R4 and Class R6 shares of the Series.
Pursuant to the Distribution Plans, the Series compensates PIMS for distribution related activities at an annual rate of up to 0.30%, 1%, 0.75% and 0.25% of the average daily net assets of the Class A, Class C, Class R and Class R2 shares, respectively. PIMS has contractually agreed through February 28, 2022 to limit such fees to 0.25% and 0.50% of the average daily net assets of the Class A and Class R shares, respectively.
The Series has adopted a Shareholder Services Plan with respect to Class R2 and Class R4 shares. Under the terms of the Shareholder Services Plan, Class R2 and Class R4 shares are authorized to pay to Prudential Mutual Fund Services LLC (“PMFS”), its affiliates or third-party service providers, as compensation for services rendered to the shareholders of such Class R2 or Class R4 shares, a shareholder service fee at an annual rate of up to 0.10% of the average daily net assets attributable to Class R2 and Class R4 shares. The shareholder service fee is accrued daily and paid monthly, as applicable.
For the year ended October 31, 2020, PIMS received $455,438 in front-end sales charges resulting from sales of Class A shares. Additionally, for the year ended October 31, 2020, PIMS received $1,024 and $712 in contingent deferred sales charges imposed upon redemptions by certain Class A and Class C shareholders, respectively. From these fees, PIMS paid such sales charges to broker-dealers, who in turn paid commissions to salespersons and incurred other distribution costs.
PGIM Investments, PIMS, PMFS and Jennison are indirect, wholly-owned subsidiaries of Prudential Financial, Inc. (“Prudential”).
| | | | |
| PGIM Jennison International Opportunities Fund | | | 29 | |
Notes to Financial Statements (continued)
| 4. | Other Transactions with Affiliates |
PMFS serves as the Series’ transfer agent. Transfer agent’s fees and expenses in the Statement of Operations include certain out-of-pocket expenses paid to non-affiliates, where applicable.
The Series may invest its overnight sweep cash in the PGIM Core Ultra Short Bond Fund (the “Core Fund”), and its securities lending cash collateral in the PGIM Institutional Money Market Fund (the “Money Market Fund”), each a series of Prudential Investment Portfolios 2, registered under the 1940 Act and managed by PGIM Investments. Through the Series’ investments in the mentioned underlying funds, PGIM Investments and/or its affiliates are paid fees or reimbursed for providing their services. In addition to the realized and unrealized gains on investments in the Core Fund and Money Market Fund, earnings from such investments are disclosed on the Statement of Operations as “Affiliated dividend income” and “Income from securities lending, net”, respectively.
The Series may enter into certain securities purchase or sale transactions under Board approved Rule 17a-7 procedures. Rule 17a-7 is an exemptive rule under the 1940 Act, that subject to certain conditions, permits purchase and sale transactions among affiliated investment companies, or between an investment company and a person that is affiliated solely by reason of having a common (or affiliated) investment adviser, common directors, and/or common officers. Pursuant to the Rule 17a-7 procedures and consistent with guidance issued by the Securities and Exchange Commission (“SEC”), the Fund’s Chief Compliance Officer (“CCO”) prepares a quarterly summary of all such transactions for submission to the Board, together with the CCO’s written representation that all such 17a-7 transactions were effected in accordance with the Series’ Rule 17a-7 procedures. For the year ended October 31, 2020, no 17a-7 transactions were entered into by the Series.
The aggregate cost of purchases and proceeds from sales of portfolio securities (excluding short-term investments and U.S. Government securities) for the year ended October 31, 2020, were $1,733,142,310 and $546,758,126, respectively.
A summary of the cost of purchases and proceeds from sales of shares of affiliated investments for the year ended October 31, 2020, is presented as follows:
| | | | | | | | | | | | | | | | | | | | | | | | | | | | |
Value,
Beginning
of Year | | Cost of
Purchases | | | Proceeds
from Sales | | | Change in
Unrealized
Gain
(Loss) | | | Realized
Gain
(Loss) | | | Value,
End of Year | | | Shares,
End
of Year | | | Income | |
|
PGIM Core Ultra Short Bond Fund* | |
| $11,654,389 | | $ | 722,457,806 | | | $ | 630,548,029 | | | $ | — | | | $ | — | | | $ | 103,564,166 | | | | 103,564,166 | | | $ | 244,464 | |
| | | | | | | | | | | | | | | | | | | | | | | | | | | | | | |
Value,
Beginning
of Year | | | Cost of
Purchases | | | Proceeds
from Sales | | | Change in
Unrealized
Gain
(Loss) | | | Realized
Gain
(Loss) | | | Value,
End of Year | | | Shares,
End
of Year | | | Income | |
| | PGIM Institutional Money Market Fund* | |
| $ | 12,383,731 | | | $ | 608,619,569 | | | $ | 581,450,251 | | | $ | 74,755 | | | $ | (54,158 | ) | | $ | 39,573,646 | | | | 39,585,522 | | | $ | 214,644 | ** |
| | | | | | | | | | | | | | | | | | | | | | | | | | | | | | |
| $ | 24,038,120 | | | $ | 1,331,077,375 | | | $ | 1,211,998,280 | | | $ | 74,755 | | | $ | (54,158 | ) | | $ | 143,137,812 | | | | | | | $ | 459,108 | |
| | | | | | | | | | | | | | | | | | | | | | | | | | | | | | |
| * | The Fund did not have any capital gain distributions during the reporting period. |
| ** | The amount, or a portion thereof, represents the affiliated securities lending income shown on the Statement of Operations. |
| 6. | Distributions and Tax Information |
Distributions to shareholders, which are determined in accordance with federal income tax regulations and which may differ from generally accepted accounting principles, are recorded on the ex-date. In order to present total distributable earnings (loss) and paid-in-capital in excess of par on the Statement of Assets and Liabilities that more closely represent their tax character, certain adjustments have been made to total distributable earnings (loss) and paid-in capital in excess of par. For the year ended October 31, 2020, the adjustments were to increase total distributable earnings and decrease paid-in capital in excess of par by $6,385,152 primarily due to a net operating loss. Net investment income, net realized gain (loss) on investments and foreign currency transactions and net assets were not affected by this change.
For the year ended October 31, 2020, there was no distribution paid by the Series. For the year ended October 31, 2019, the tax character of dividends paid by the Series was $111,459 of ordinary income.
As of October 31, 2020, there were no accumulated undistributed earnings on a tax basis.
The United States federal income tax basis of the Series’ investments and the net unrealized appreciation as of October 31, 2020 were as follows:
| | | | | | |
| Tax Basis | | Gross
Unrealized
Appreciation | | Gross
Unrealized
Depreciation | | Net
Unrealized
Appreciation |
| $1,836,220,810 | | $638,335,836 | | $(32,434,529) | | $605,901,307 |
The difference between book basis and tax basis is primarily attributable to deferred losses on wash sales and corporate spin-offs.
For federal income tax purposes, the Series had a capital loss carryforward as of October 31, 2020 of approximately $22,985,000 which can be carried forward for an unlimited period. The Series utilized approximately $3,278,000 of its capital loss carryforward to offset net taxable gains realized in the fiscal year ended October 31, 2020. No capital gains
| | | | |
| PGIM Jennison International Opportunities Fund | | | 31 | |
Notes to Financial Statements (continued)
distributions are expected to be paid to shareholders until net gains have been realized in excess of such losses.
The Manager has analyzed the Series’ tax positions taken on federal, state and local income tax returns for all open tax years and has concluded that no provision for income tax is required in the Series’ financial statements for the current reporting period. Since tax authorities can examine previously filed tax returns, the Series’ U.S. federal and state tax returns for each of the four fiscal years up to the most recent fiscal year ended October 31, 2020 are subject to such review.
The Series offers Class A, Class C, Class R, Class Z, Class R2, Class R4 and Class R6 shares. Class A shares are sold with a maximum front-end sales charge of 5.50%. Investors who purchase $1 million or more of Class A shares and sell these shares within 12 months of purchase are subject to a contingent deferred sales charge (“CDSC”) of 1%, although they are not subject to an initial sales charge. The Class A CDSC is waived for certain retirement and/or benefit plans. A special exchange privilege is also available for shareholders who qualified to purchase Class A shares at net asset value. Class C shares are sold with a CDSC of 1% on sales made within 12 months of purchase. Class C shares will automatically convert to Class A shares on a monthly basis approximately 10 years after purchase. Class R, Class Z, Class R2, Class R4 and Class R6 shares are not subject to any sales or redemption charges and are available exclusively for sale to a limited group of investors.
Under certain circumstances, an exchange may be made from specified share classes of the Series to one or more other share classes of the Series as presented in the table of transactions in shares of common stock, below.
The Fund is authorized to issue 5.075 billion shares of common stock, $0.01 par value per share, 900 million of which are designated as shares of the Series. The shares are further classified and designated as follows:
| | |
Class A | | 50,000,000 |
Class C | | 50,000,000 |
Class R | | 150,000,000 |
Class Z | | 175,000,000 |
Class T | | 125,000,000 |
Class R2 | | 75,000,000 |
Class R4 | | 75,000,000 |
Class R6 | | 200,000,000 |
The Series currently does not have any Class T shares outstanding.
As of October 31, 2020, Prudential, through its affiliated entities, including affiliated funds (if applicable), owned shares of the Series as follows:
| | | | | | | | | | | | |
| | | Number of Shares | | | Percentage of
Outstanding Shares | |
Class R | | | 10,402,081 | | | | 99.9 | % | | | | |
Class R2 | | | 662 | | | | 0.4 | % | | | | |
Class R4 | | | 10,647 | | | | 22.3 | % | | | | |
At the reporting period end, the number of shareholders holding greater than 5% of the Series are as follows:
| | | | | | |
| Affiliated | | Unaffiliated |
Number of
Shareholders | | Percentage of
Outstanding Shares | | Number of
Shareholders | | Percentage of
Outstanding Shares |
1 | | 12.0% | | 5 | | 68.6% |
Transactions in shares of common stock were as follows:
| | | | | | | | |
Class A | | Shares | | | Amount | |
| | |
Year ended October 31, 2020: | | | | | | | | |
Shares sold | | | 1,695,560 | | | $ | 40,214,421 | |
Shares reacquired | | | (420,360 | ) | | | (9,438,204 | ) |
| | | | | | | | |
Net increase (decrease) in shares outstanding before conversion | | | 1,275,200 | | | | 30,776,217 | |
Shares issued upon conversion from other share class(es) | | | 95,713 | | | | 2,224,143 | |
Shares reacquired upon conversion into other share class(es) | | | (38,524 | ) | | | (927,812 | ) |
| | | | | | | | |
Net increase (decrease) in shares outstanding | | | 1,332,389 | | | $ | 32,072,548 | |
| | | | | | | | |
Year ended October 31, 2019: | | | | | | | | |
Shares sold | | | 886,104 | | | $ | 15,632,195 | |
Shares reacquired | | | (462,602 | ) | | | (8,013,084 | ) |
| | | | | | | | |
Net increase (decrease) in shares outstanding before conversion | | | 423,502 | | | | 7,619,111 | |
Shares issued upon conversion from other share class(es) | | | 70,212 | | | | 1,217,757 | |
Shares reacquired upon conversion into other share class(es) | | | (37,544 | ) | | | (681,733 | ) |
| | | | | | | | |
Net increase (decrease) in shares outstanding | | | 456,170 | | | $ | 8,155,135 | |
| | | | | | | | |
| | |
Class C | | | | | | |
Year ended October 31, 2020: | | | | | | | | |
Shares sold | | | 410,402 | | | $ | 9,190,379 | |
Shares reacquired | | | (62,287 | ) | | | (1,217,976 | ) |
| | | | | | | | |
Net increase (decrease) in shares outstanding before conversion | | | 348,115 | | | | 7,972,403 | |
Shares reacquired upon conversion into other share class(es) | | | (13,404 | ) | | | (290,342 | ) |
| | | | | | | | |
Net increase (decrease) in shares outstanding | | | 334,711 | | | $ | 7,682,061 | |
| | | | | | | | |
Year ended October 31, 2019: | | | | | | | | |
Shares sold | | | 161,032 | | | $ | 2,618,485 | |
Shares reacquired | | | (104,446 | ) | | | (1,712,809 | ) |
| | | | | | | | |
Net increase (decrease) in shares outstanding before conversion | | | 56,586 | | | | 905,676 | |
Shares reacquired upon conversion into other share class(es) | | | (21,102 | ) | | | (374,296 | ) |
| | | | | | | | |
Net increase (decrease) in shares outstanding | | | 35,484 | | | $ | 531,380 | |
| | | | | | | | |
| | | | |
| PGIM Jennison International Opportunities Fund | | | 33 | |
Notes to Financial Statements (continued)
| | | | | | | | |
Class R | | Shares | | | Amount | |
Year ended October 31, 2020: | | | | | | | | |
Shares sold | | | 378,910 | | | $ | 7,835,637 | |
Shares reacquired | | | (4,361,022 | ) | | | (97,013,298 | ) |
| | | | | | | | |
Net increase (decrease) in shares outstanding | | | (3,982,112 | ) | | $ | (89,177,661 | ) |
| | | | | | | | |
Year ended October 31, 2019: | | | | | | | | |
Shares sold | | | 1,569,074 | | | $ | 25,316,140 | |
Shares reacquired | | | (3,973,963 | ) | | | (71,057,632 | ) |
| | | | | | | | |
Net increase (decrease) in shares outstanding | | | (2,404,889 | ) | | $ | (45,741,492 | ) |
| | | | | | | | |
Class Z | | | | | | |
Year ended October 31, 2020: | | | | | | | | |
Shares sold | | | 47,468,230 | | | $ | 1,144,158,328 | |
Shares reacquired | | | (10,173,878 | ) | | | (246,291,300 | ) |
| | | | | | | | |
Net increase (decrease) in shares outstanding before conversion | | | 37,294,352 | | | | 897,867,028 | |
Shares issued upon conversion from other share class(es) | | | 44,259 | | | | 1,069,933 | |
Shares reacquired upon conversion into other share class(es) | | | (99,914 | ) | | | (2,358,141 | ) |
| | | | | | | | |
Net increase (decrease) in shares outstanding | | | 37,238,697 | | | $ | 896,578,820 | |
| | | | | | | | |
Year ended October 31, 2019: | | | | | | | | |
Shares sold | | | 7,751,651 | | | $ | 141,168,748 | |
Shares issued in reinvestment of dividends and distributions | | | 3,966 | | | | 60,590 | |
Shares reacquired | | | (3,691,880 | ) | | | (64,859,207 | ) |
| | | | | | | | |
Net increase (decrease) in shares outstanding before conversion | | | 4,063,737 | | | | 76,370,131 | |
Shares issued upon conversion from other share class(es) | | | 40,055 | | | | 738,030 | |
Shares reacquired upon conversion into other share class(es) | | | (54,165 | ) | | | (928,258 | ) |
| | | | | | | | |
Net increase (decrease) in shares outstanding | | | 4,049,627 | | | $ | 76,179,903 | |
| | | | | | | | |
Class R2 | | | | | | |
Year ended October 31, 2020: | | | | | | | | |
Shares sold | | | 163,996 | | | $ | 4,301,050 | |
Shares reacquired | | | (11,299 | ) | | | (312,729 | ) |
| | | | | | | | |
Net increase (decrease) in shares outstanding | | | 152,697 | | | $ | 3,988,321 | |
| | | | | | | | |
Period ended October 31, 2019*: | | | | | | | | |
Shares sold | | | 11,835 | | | $ | 224,514 | |
Shares reacquired | | | — | | | | (1 | ) |
| | | | | | | | |
Net increase (decrease) in shares outstanding | | | 11,835 | | | $ | 224,513 | |
| | | | | | | | |
Class R4 | | | | | | |
Year ended October 31, 2020: | | | | | | | | |
Shares sold | | | 11,923 | | | $ | 287,951 | |
Shares reacquired | | | (7,067 | ) | | | (150,270 | ) |
| | | | | | | | |
Net increase (decrease) in shares outstanding | | | 4,856 | | | $ | 137,681 | |
| | | | | | | | |
Period ended October 31, 2019*: | | | | | | | | |
Shares sold | | | 44,181 | | | $ | 838,319 | |
Shares reacquired | | | (1,337 | ) | | | (25,439 | ) |
| | | | | | | | |
Net increase (decrease) in shares outstanding | | | 42,844 | | | $ | 812,880 | |
| | | | | | | | |
| | | | | | | | |
Class R6 | | Shares | | | Amount | |
Year ended October 31, 2020: | | | | | | | | |
Shares sold | | | 20,878,982 | | | $ | 521,343,502 | |
Shares reacquired | | | (2,482,915 | ) | | | (60,609,646 | ) |
| | | | | | | | |
Net increase (decrease) in shares outstanding before conversion | | | 18,396,067 | | | | 460,733,856 | |
Shares issued upon conversion from other share class(es) | | | 13,891 | | | | 331,285 | |
Shares reacquired upon conversion into other share class(es) | | | (2,198 | ) | | | (49,066 | ) |
| | | | | | | | |
Net increase (decrease) in shares outstanding | | | 18,407,760 | | | $ | 461,016,075 | |
| | | | | | | | |
Year ended October 31, 2019: | | | | | | | | |
Shares sold | | | 4,858,514 | | | $ | 90,601,715 | |
Shares issued in reinvestment of dividends and distributions | | | 3,322 | | | | 50,751 | |
Shares reacquired | | | (1,901,872 | ) | | | (35,378,979 | ) |
| | | | | | | | |
Net increase (decrease) in shares outstanding before conversion | | | 2,959,964 | | | | 55,273,487 | |
Shares issued upon conversion from other share class(es) | | | 1,565 | | | | 28,500 | |
| | | | | | | | |
Net increase (decrease) in shares outstanding | | | 2,961,529 | | | $ | 55,301,987 | |
| | | | | | | | |
| * | Commencement of offering was December 27, 2018. |
8. Borrowings
The Fund, on behalf of the Series, along with other affiliated registered investment companies (the “Participating Funds”), is a party to a Syndicated Credit Agreement (“SCA”) with a group of banks. The purpose of the SCA is to provide an alternative source of temporary funding for capital share redemptions. The table below provides details of the current SCA in effect at the reporting period-end as well as the prior SCA.
| | | | |
| | | Current SCA | | Prior SCA |
Term of Commitment | | 10/2/2020 – 9/30/2021 | | 10/3/2019 – 10/1/2020 |
Total Commitment | | $ 1,200,000,000 | | $ 1,222,500,000* |
Annualized Commitment Fee on the Unused Portion of the SCA | | 0.15% | | 0.15% |
Annualized Interest Rate on Borrowings | | 1.30% plus the higher of (1) the effective federal funds rate, (2) the one-month LIBOR rate or (3) zero percent | | 1.20% plus the higher of (1) the effective federal funds rate, (2) the one-month LIBOR rate or (3) zero percent |
| * Effective March 31, 2020, the SCA’s total commitment was increased from $900,000,000 to $1,162,500,000 and subsequently, effective April 7, 2020 was increased to $1,222,500,000. |
Certain affiliated registered investment companies that are parties to the SCA include portfolios that are subject to a predetermined mathematical formula used to manage certain benefit guarantees offered under variable annuity contracts. The formula may result in large scale asset flows into and out of these portfolios. Consequently, these portfolios may be more likely to utilize the SCA for purposes of funding redemptions. It may be possible for those portfolios to fully exhaust the committed amount of the SCA, thereby requiring the Manager to allocate available funding per a Board-approved methodology designed to treat the Participating Funds in the SCA equitably.
The Series did not utilize the SCA during the year ended October 31, 2020.
| | | | |
| PGIM Jennison International Opportunities Fund | | | 35 | |
Notes to Financial Statements (continued)
9. Risks of Investing in the Series
The Series’ risks include, but are not limited to, some or all of the risks discussed below. For further information on the Series’ risks, please refer to the Series’ Prospectus and Statement of Additional Information.
Emerging Markets Risk: The risks of foreign investments are greater for investments in or exposed to emerging markets. Emerging market countries typically have economic and political systems that are less fully developed, and can be expected to be less stable, than those of more developed countries. For example, the economies of such countries can be subject to rapid and unpredictable rates of inflation or deflation. Low trading volumes may result in a lack of liquidity and price volatility. Emerging market countries may have policies that restrict investment by non-US investors, or that prevent non-US investors from withdrawing their money at will. Countries with emerging markets can be found in regions such as Asia, Latin America, Eastern Europe and Africa.
The Series may invest in some emerging markets that subject it to risks such as those associated with illiquidity, custody of assets, different settlement and clearance procedures and asserting legal title under a developing legal and regulatory regime to a greater degree than in developed markets or even in other emerging markets.
Equity and Equity-Related Securities Risks: The value of a particular security could go down and you could lose money. In addition to an individual security losing value, the value of the equity markets or a sector in which the Series invests could go down. Different parts of a market can react differently to adverse issuer, market, regulatory, political and economic developments.
Foreign Securities Risk: Investments in securities of non-US issuers (including those denominated in US dollars) generally involve more risk than investing in securities of US issuers. Foreign political, economic and legal systems, especially those in developing and emerging market countries, may be less stable and more volatile than in the US. Foreign legal systems generally have fewer regulatory requirements than the US legal system. In general, less information is publicly available about non-US companies than about US companies. Non-US companies generally are not subject to the same accounting, auditing, and financial reporting standards as are US companies. Additionally, the changing value of foreign currencies and changes in exchange rates could also affect the value of the assets the Series holds and the Series’ performance. Certain foreign countries may impose restrictions on the ability of issuers of foreign securities to make payment of principal and interest or dividends to investors located outside the country, due to blockage of foreign currency exchanges or otherwise. Investments in emerging markets are subject to greater volatility and price declines. In addition, the Series’ investments in non-US securities may be subject to the risks of nationalization or expropriation of assets, imposition of currency
exchange controls or restrictions on the repatriation of non-US currency, confiscatory taxation and adverse diplomatic developments. Special US tax considerations may apply.
Investments in China Risk: Investments in China subject the Series to risks specific to China and may make it more volatile than other funds. Over the last few decades, the Chinese government has undertaken reform of economic and market practices and has expanded the sphere of private ownership of property in China. However, Chinese markets generally continue to experience inefficiency, volatility and pricing anomalies resulting from governmental influence, a lack of publicly available information and/or political and social instability. Internal social unrest or confrontations with other neighboring countries, including military conflicts in response to such events, may also disrupt economic development in China and result in a greater risk of currency fluctuations, currency non-convertibility, interest rate fluctuations and higher rates of inflation.
Large Shareholder and Large Scale Redemption Risk: Certain individuals, accounts, funds (including funds affiliated with the Manager) or institutions, including the Manager and its affiliates, may from time to time own or control a substantial amount of the Series’ shares. There is no requirement that these entities maintain their investment in the Series. There is a risk that such large shareholders or that the Series’ shareholders generally may redeem all or a substantial portion of their investments in the Series in a short period of time, which could have a significant negative impact on the Series’ NAV, liquidity, and brokerage costs. Large redemptions could also result in tax consequences to shareholders and impact the Series’ ability to implement its investment strategy. The Series’ ability to pursue its investment objective after one or more large scale redemptions may be impaired and, as a result, the Series may invest a larger portion of its assets in cash or cash equivalents.
Market Disruption and Geopolitical Risks: International wars or conflicts and geopolitical developments in foreign countries, along with instability in regions such as Asia, Eastern Europe, and the Middle East, possible terrorist attacks in the United States or around the world, public health epidemics such as the outbreak of infectious diseases like the recent outbreak of coronavirus globally or the 2014–2016 outbreak in West Africa of the Ebola virus, and other similar events could adversely affect the U.S. and foreign financial markets, including increases in market volatility, reduced liquidity in the securities markets and government intervention, and may cause further long-term economic uncertainties in the United States and worldwide generally.
The coronavirus pandemic and the related governmental and public responses have had and may continue to have an impact on the Series’ investments and net asset value and have led and may continue to lead to increased market volatility and the potential for illiquidity in certain classes of securities and sectors of the market. Preventative or protective actions that governments may take in respect of pandemic or epidemic diseases may result in periods of business disruption, business closures, inability to obtain raw materials, supplies and component parts, and reduced or disrupted operations for the issuers in which the Series invests. Government intervention in markets may impact interest rates, market volatility and security pricing. The occurrence, reoccurrence and pendency of such diseases
| | | | |
| PGIM Jennison International Opportunities Fund | | | 37 | |
Notes to Financial Statements (continued)
could adversely affect the economies (including through changes in business activity and increased unemployment) and financial markets either in specific countries or worldwide.
Market Risk: Securities markets may be volatile and the market prices of the Series’ securities may decline. Securities fluctuate in price based on changes in an issuer’s financial condition and overall market and economic conditions. If the market prices of the securities owned by the Series fall, the value of an investment in the Series will decline.
10. Recent Regulatory Developments
On December 3, 2020, the SEC announced that it voted to adopt a new rule that establishes an updated regulatory framework for fund valuation practices (the “Rule”). The Rule, in part, provides (i) a framework for determining fair value in good faith and (ii) provides for a fund Board’s assignment of its responsibility for the execution of valuation-related activities to a fund’s investment adviser. Further, the SEC is rescinding previously issued guidance on related issues. The Rule will become effective 60 days after publication in the Federal Register, and will have a compliance date 18 months following the effective date. Management is currently evaluating the Rule and its impact to the Funds.
Financial Highlights
| | | | | | | | | | | | | | | | | | | | |
| Class A Shares | | | | | | | | | | | | | | | |
| | | | | | Year Ended October 31, | | | | |
| | | 2020 | | | 2019 | | | 2018 | | | 2017 | | | 2016 | |
| Per Share Operating Performance(a): | | | | | | | | | | | | | | | | | | | | |
| Net Asset Value, Beginning of Year | | | $19.51 | | | | $15.82 | | | | $17.10 | | | | $12.36 | | | | $13.09 | |
| Income (loss) from investment operations: | | | | | | | | | | | | | | | | | | | | |
| Net investment income (loss) | | | (0.12 | ) | | | 0.01 | | | | (0.06 | ) | | | (0.01 | ) | | | 0.02 | |
| Net realized and unrealized gain (loss) on investment and foreign currency transactions | | | 8.75 | | | | 3.68 | | | | (1.22 | ) | | | 4.75 | | | | (0.75 | ) |
| Total from investment operations | | | 8.63 | | | | 3.69 | | | | (1.28 | ) | | | 4.74 | | | | (0.73 | ) |
| Net asset value, end of year | | | $28.14 | | | | $19.51 | | | | $15.82 | | | | $17.10 | | | | $12.36 | |
| Total Return(b): | | | 44.11 | % | | | 23.39 | % | | | (7.49 | )% | | | 38.35 | % | | | (5.58 | )% |
| | | | | | | | | | | | | | | | | | | | |
| Ratios/Supplemental Data: | | | | | | | | | | | | | | | |
| Net assets, end of year (000) | | | $76,093 | | | | $26,778 | | | | $14,496 | | | | $5,303 | | | | $2,918 | |
| Average net assets (000) | | | $46,059 | | | | $20,599 | | | | $10,393 | | | | $3,121 | | | | $3,575 | |
| Ratios to average net assets(c)(d): | | | | | | | | | | | | | | | | | | | | |
| Expenses after waivers and/or expense reimbursement | | | 1.09 | % | | | 1.09 | % | | | 1.13 | % | | | 1.15 | % | | | 1.15 | % |
| Expenses before waivers and/or expense reimbursement | | | 1.34 | % | | | 1.46 | % | | | 1.55 | % | | | 1.63 | % | | | 1.74 | % |
| Net investment income (loss) | | | (0.52 | )% | | | 0.04 | % | | | (0.32 | )% | | | (0.07 | )% | | | 0.15 | % |
| Portfolio turnover rate(e) | | | 43 | % | | | 53 | % | | | 59 | % | | | 69 | % | | | 65 | % |
| (a) | Calculated based on average shares outstanding during the year. |
| (b) | Total return does not consider the effects of sales loads. Total return is calculated assuming a purchase of a share on the first day and a sale on the last day of each year reported and includes reinvestment of dividends and distributions, if any. Total returns may reflect adjustments to conform to generally accepted accounting principles. |
| (c) | Does not include expenses of the underlying funds in which the Series invests. |
| (d) | Effective November 1, 2017, class specific expenses include transfer agent fees and expenses and registration fees, which are charged to their respective share class. |
| (e) | The Series’ portfolio turnover rate is calculated in accordance with regulatory requirements, without regard to transactions involving short-term investments and certain derivatives. If such transactions were included, the Series’ portfolio turnover rate may be higher. |
See Notes to Financial Statements.
| | | | |
| PGIM Jennison International Opportunities Fund | | | 39 | |
Financial Highlights (continued)
| | | | | | | | | | | | | | | | | | | | |
| Class C Shares | | | | | | | | | | | | | | | |
| | | Year Ended October 31, | |
| | | 2020 | | | 2019 | | | 2018 | | | 2017 | | | 2016 | |
| Per Share Operating Performance(a): | | | | | | | | | | | | | | | | | | | | |
| Net Asset Value, Beginning of Year | | | $18.44 | | | | $15.08 | | | | $16.43 | | | | $11.96 | | | | $12.77 | |
| Income (loss) from investment operations: | | | | | | | | | | | | | | | | | | | | |
| Net investment income (loss) | | | (0.29 | ) | | | (0.13 | ) | | | (0.18 | ) | | | (0.11 | ) | | | (0.08 | ) |
| Net realized and unrealized gain (loss) on investment and foreign currency transactions | | | 8.23 | | | | 3.49 | | | | (1.17 | ) | | | 4.58 | | | | (0.73 | ) |
| Total from investment operations | | | 7.94 | | | | 3.36 | | | | (1.35 | ) | | | 4.47 | | | | (0.81 | ) |
| Net asset value, end of year | | | $26.38 | | | | $18.44 | | | | $15.08 | | | | $16.43 | | | | $11.96 | |
| Total Return(b): | | | 43.00 | % | | | 22.28 | % | | | (8.22 | )% | | | 37.37 | % | | | (6.34 | )% |
| | | | | | | | | | | | | | | | | | | | |
| Ratios/Supplemental Data: | | | | | | | | | | | | | | | |
| Net assets, end of year (000) | | | $16,411 | | | | $5,302 | | | | $3,800 | | | | $1,759 | | | | $779 | |
| Average net assets (000) | | | $9,894 | | | | $4,683 | | | | $3,449 | | | | $1,080 | | | | $895 | |
| Ratios to average net assets(c)(d): | | | | | | | | | | | | | | | | | | | | |
| Expenses after waivers and/or expense reimbursement | | | 1.90 | % | | | 1.91 | % | | | 1.92 | % | | | 1.89 | % | | | 1.90 | % |
| Expenses before waivers and/or expense reimbursement | | | 2.15 | % | | | 2.33 | % | | | 2.54 | % | | | 2.32 | % | | | 2.44 | % |
| Net investment income (loss) | | | (1.32 | )% | | | (0.80 | )% | | | (1.05 | )% | | | (0.80 | )% | | | (0.67 | )% |
| Portfolio turnover rate(e) | | | 43 | % | | | 53 | % | | | 59 | % | | | 69 | % | | | 65 | % |
| (a) | Calculated based on average shares outstanding during the year. |
| (b) | Total return does not consider the effects of sales loads. Total return is calculated assuming a purchase of a share on the first day and a sale on the last day of each year reported and includes reinvestment of dividends and distributions, if any. Total returns may reflect adjustments to conform to generally accepted accounting principles. |
| (c) | Does not include expenses of the underlying funds in which the Series invests. |
| (d) | Effective November 1, 2017, class specific expenses include transfer agent fees and expenses and registration fees, which are charged to their respective share class. |
| (e) | The Series’ portfolio turnover rate is calculated in accordance with regulatory requirements, without regard to transactions involving short-term investments and certain derivatives. If such transactions were included, the Series’ portfolio turnover rate may be higher. |
See Notes to Financial Statements.
| | | | | | | | | | | | | | | | | | | | |
| Class R Shares | | | | | | | | | | | | | | | |
| | | Year Ended October 31, | | | | | | November 20, 2017(a) through October 31, 2018 | |
| | | 2020 | | | | | | 2019 | | | | |
| Per Share Operating Performance(b): | | | | | | | | | | | | | | | | | | | | |
| Net Asset Value, Beginning of Period | | | $19.48 | | | | | | | | $15.86 | | | | | | | | $17.62 | |
| Income (loss) from investment operations: | | | | | | | | | | | | | | | | | | | | |
| Net investment income (loss) | | | (0.20 | ) | | | | | | | (0.06 | ) | | | | | | | (0.09 | ) |
| Net realized and unrealized gain (loss) on investment and foreign currency transactions | | | 8.70 | | | | | | | | 3.68 | | | | | | | | (1.67 | ) |
| Total from investment operations | | | 8.50 | | | | | | | | 3.62 | | | | | | | | (1.76 | ) |
| Net asset value, end of period | | | $27.98 | | | | | | | | $19.48 | | | | | | | | $15.86 | |
| Total Return(c): | | | 43.56 | % | | | | | | | 22.89 | % | | | | | | | (9.99 | )% |
| | | | | | | | | | | | | | | | | | | | |
| Ratios/Supplemental Data: | | | | | | | | | | | | | | | |
| Net assets, end of period (000) | | | $291,162 | | | | | | | | $280,311 | | | | | | | | $266,294 | |
| Average net assets (000) | | | $281,238 | | | | | | | | $278,086 | | | | | | | | $299,955 | |
| Ratios to average net assets(d): | | | | | | | | | | | | | | | | | | | | |
| Expenses after waivers and/or expense reimbursement | | | 1.47 | % | | | | | | | 1.47 | % | | | | | | | 1.46 | %(e) |
| Expenses before waivers and/or expense reimbursement | | | 1.77 | % | | | | | | | 1.81 | % | | | | | | | 1.80 | %(e) |
| Net investment income (loss) | | | (0.87 | )% | | | | | | | (0.36 | )% | | | | | | | (0.53 | )%(e) |
| Portfolio turnover rate(f) | | | 43 | % | | | | | | | 53 | % | | | | | | | 59 | % |
| (a) | Commencement of offering. |
| (b) | Calculated based on average shares outstanding during the period. |
| (c) | Total return is calculated assuming a purchase of a share on the first day and a sale on the last day of each period reported and includes reinvestment of dividends and distributions, if any. Total returns may reflect adjustments to conform to generally accepted accounting principles. Total returns for periods less than one full year are not annualized. |
| (d) | Does not include expenses of the underlying funds in which the Series invests. |
| (f) | The Series’ portfolio turnover rate is calculated in accordance with regulatory requirements, without regard to transactions involving short-term investments and certain derivatives. If such transactions were included, the Series’ portfolio turnover rate may be higher. |
See Notes to Financial Statements.
| | | | |
| PGIM Jennison International Opportunities Fund | | | 41 | |
Financial Highlights (continued)
| | | | | | | | | | | | | | | | | | | | |
| Class Z Shares | | | | | | | | | | | | | | | |
| | | | | | Year Ended October 31, | | | | |
| | | 2020 | | | 2019 | | | 2018 | | | 2017 | | | 2016 | |
| Per Share Operating Performance(a): | | | | | | | | | | | | | | | | | | | | |
| Net Asset Value, Beginning of Year | | | $19.77 | | | | $16.01 | | | | $17.29 | | | | $12.50 | | | | $13.20 | |
| Income (loss) from investment operations: | | | | | | | | | | | | | | | | | | | | |
| Net investment income (loss) | | | (0.10 | ) | | | 0.03 | | | | (0.01 | ) | | | 0.03 | | | | 0.03 | |
| Net realized and unrealized gain (loss) on investment and foreign currency transactions | | | 8.89 | | | | 3.74 | | | | (1.24 | ) | | | 4.79 | | | | (0.73 | ) |
| Total from investment operations | | | 8.79 | | | | 3.77 | | | | (1.25 | ) | | | 4.82 | | | | (0.70 | ) |
| Less Dividends and Distributions: | | | | | | | | | | | | | | | | | | | | |
| Dividends from net investment income | | | - | | | | (0.01 | ) | | | (0.03 | ) | | | (0.03 | ) | | | - | |
| Net asset value, end of year | | | $28.56 | | | | $19.77 | | | | $16.01 | | | | $17.29 | | | | $12.50 | |
| Total Return(b): | | | 44.46 | % | | | 23.56 | % | | | (7.24 | )% | | | 38.65 | % | | | (5.30 | )% |
| | | | | | | | | | | | | | | | | | | | |
| Ratios/Supplemental Data: | | | | | | | | | | | | | | | |
| Net assets, end of year (000) | | | $1,364,899 | | | | $208,629 | | | | $104,113 | | | | $28,612 | | | | $18,667 | |
| Average net assets (000) | | | $639,223 | | | | $139,982 | | | | $75,711 | | | | $21,756 | | | | $23,274 | |
| Ratios to average net assets(c)(d): | | | | | | | | | | | | | | | | | | | | |
| Expenses after waivers and/or expense reimbursement | | | 0.90 | % | | | 0.90 | % | | | 0.89 | % | | | 0.89 | % | | | 0.90 | % |
| Expenses before waivers and/or expense reimbursement | | | 0.99 | % | | | 1.04 | % | | | 1.04 | % | | | 1.34 | % | | | 1.41 | % |
| Net investment income (loss) | | | (0.38 | )% | | | 0.15 | % | | | (0.08 | )% | | | 0.23 | % | | | 0.25 | % |
| Portfolio turnover rate(e) | | | 43 | % | | | 53 | % | | | 59 | % | | | 69 | % | | | 65 | % |
| (a) | Calculated based on average shares outstanding during the year. |
| (b) | Total return is calculated assuming a purchase of a share on the first day and a sale on the last day of each year reported and includes reinvestment of dividends and distributions, if any. Total returns may reflect adjustments to conform to generally accepted accounting principles. |
| (c) | Does not include expenses of the underlying funds in which the Series invests. |
| (d) | Effective November 1, 2017, class specific expenses include transfer agent fees and expenses and registration fees, which are charged to their respective share class. |
| (e) | The Series’ portfolio turnover rate is calculated in accordance with regulatory requirements, without regard to transactions involving short-term investments and certain derivatives. If such transactions were included, the Series’ portfolio turnover rate may be higher. |
See Notes to Financial Statements.
| | | | | | | | | | |
| Class R2 Shares | | | | | | | | |
| | | Year Ended October 31,
2020 | | | | | December 27, 2018(a)
through October 31,
2019 | |
| Per Share Operating Performance(b): | | | | | | | | | | |
| Net Asset Value, Beginning of Period | | | $19.70 | | | | | | $15.10 | |
| Income (loss) from investment operations: | | | | | | | | | | |
| Net investment income (loss) | | | (0.29 | ) | | | | | (0.12 | ) |
| Net realized and unrealized gain (loss) on investment and foreign currency transactions | | | 8.94 | | | | | | 4.72 | |
| Total from investment operations | | | 8.65 | | | | | | 4.60 | |
| Net asset value, end of period | | | $28.35 | | | | | | $19.70 | |
| Total Return(c): | | | 43.91 | % | | | | | 30.46 | % |
| | | | | | | | | | |
| Ratios/Supplemental Data: | | | | | | | | |
| Net assets, end of period (000) | | | $4,664 | | | | | | $233 | |
| Average net assets (000) | | | $1,557 | | | | | | $44 | |
| Ratios to average net assets(d): | | | | | | | | | | |
| Expenses after waivers and/or expense reimbursement | | | 1.32 | % | | | | | 1.26 | %(e) |
| Expenses before waivers and/or expense reimbursement | | | 2.23 | % | | | | | 64.97 | %(e) |
| Net investment income (loss) | | | (1.06 | )% | | | | | (0.76 | )%(e) |
| Portfolio turnover rate(f) | | | 43 | % | | | | | 53 | % |
| (a) | Commencement of offering. |
| (b) | Calculated based on average shares outstanding during the period. |
| (c) | Total return is calculated assuming a purchase of a share on the first day and a sale on the last day of each period reported and includes reinvestment of dividends and distributions, if any. Total returns may reflect adjustments to conform to generally accepted accounting principles. Total returns for periods less than one full year are not annualized. |
| (d) | Does not include expenses of the underlying funds in which the Series invests. |
| (f) | The Series’ portfolio turnover rate is calculated in accordance with regulatory requirements, without regard to transactions involving short-term investments and certain derivatives. If such transactions were included, the Series’ portfolio turnover rate may be higher. |
See Notes to Financial Statements.
| | | | |
| PGIM Jennison International Opportunities Fund | | | 43 | |
Financial Highlights (continued)
| | | | | | | | | | | | |
| Class R4 Shares | | | | | | | | | |
| | | Year Ended October 31,
2020 | | | | | | December 27, 2018(a)
through October 31,
2019 | |
| Per Share Operating Performance(b): | | | | | | | | | | | | |
| Net Asset Value, Beginning of Period | | | $19.75 | | | | | | | | $15.10 | |
| Income (loss) from investment operations: | | | | | | | | | | | | |
| Net investment income (loss) | | | (0.11 | ) | | | | | | | (0.02 | ) |
| Net realized and unrealized gain (loss) on investment and foreign currency transactions | | | 8.85 | | | | | | | | 4.67 | |
| Total from investment operations | | | 8.74 | | | | | | | | 4.65 | |
| Net asset value, end of period | | | $28.49 | | | | | | | | $19.75 | |
| Total Return(c): | | | 44.20 | % | | | | | | | 30.79 | % |
| | | | | | | | | | | | |
| Ratios/Supplemental Data: | | | | | | | | | |
| Net assets, end of period (000) | | | $1,359 | | | | | | | | $846 | |
| Average net assets (000) | | | $1,023 | | | | | | | | $293 | |
| Ratios to average net assets(d): | | | | | | | | | | | | |
| Expenses after waivers and/or expense reimbursement | | | 1.04 | % | | | | | | | 0.95 | %(e) |
| Expenses before waivers and/or expense reimbursement | | | 2.47 | % | | | | | | | 10.65 | %(e) |
| Net investment income (loss) | | | (0.46 | )% | | | | | | | (0.11 | )%(e) |
| Portfolio turnover rate(f) | | | 43 | % | | | | | | | 53 | % |
| (a) | Commencement of offering. |
| (b) | Calculated based on average shares outstanding during the period. |
| (c) | Total return is calculated assuming a purchase of a share on the first day and a sale on the last day of each period reported and includes reinvestment of dividends and distributions, if any. Total returns may reflect adjustments to conform to generally accepted accounting principles. Total returns for periods less than one full year are not annualized. |
| (d) | Does not include expenses of the underlying funds in which the Series invests. |
| (f) | The Series’ portfolio turnover rate is calculated in accordance with regulatory requirements, without regard to transactions involving short-term investments and certain derivatives. If such transactions were included, the Series’ portfolio turnover rate may be higher. |
See Notes to Financial Statements.
| | | | | | | | | | | | | | | | | | | | |
| Class R6 Shares | | | | | | | | | | | | | | | |
| | | Year Ended October 31, | | | December 23, 2015(a) through October 31, 2016 | |
| | | 2020 | | | 2019 | | | 2018 | | | 2017 | |
| Per Share Operating Performance(b): | | | | | | | | | | | | | | | | | | | | |
| Net Asset Value, Beginning of Period | | | $19.78 | | | | $16.02 | | | | $17.29 | | | | $12.50 | | | | $13.25 | |
| Income (loss) from investment operations: | | | | | | | | | | | | | | | | | | | | |
| Net investment income (loss) | | | (0.08 | ) | | | 0.04 | | | | (0.01 | ) | | | 0.04 | | | | 0.06 | |
| Net realized and unrealized gain (loss) on investment and foreign currency transactions | | | 8.89 | | | | 3.74 | | | | (1.22 | ) | | | 4.79 | | | | (0.81 | ) |
| Total from investment operations | | | 8.81 | | | | 3.78 | | | | (1.23 | ) | | | 4.83 | | | | (0.75 | ) |
| Less Dividends and Distributions: | | | | | | | | | | | | | | | | | | | | |
| Dividends from net investment income | | | - | | | | (0.02 | ) | | | (0.04 | ) | | | (0.04 | ) | | | - | |
| Net asset value, end of period | | | $28.59 | | | | $19.78 | | | | $16.02 | | | | $17.29 | | | | $12.50 | |
| Total Return(c): | | | 44.54 | % | | | 23.72 | % | | | (7.15 | )% | | | 38.75 | % | | | (5.66 | )% |
| | | | | | | | | | | | | | | | | | | | |
| Ratios/Supplemental Data: | | | | | | | | | | | | | | | |
| Net assets, end of period (000) | | | $673,736 | | | | $101,975 | | | | $35,141 | | | | $26,252 | | | | $23,073 | |
| Average net assets (000) | | | $295,968 | | | | $54,900 | | | | $26,736 | | | | $24,927 | | | | $23,677 | |
| Ratios to average net assets(d)(e): | | | | | | | | | | | | | | | | | | | | |
| Expenses after waivers and/or expense reimbursement | | | 0.84 | % | | | 0.84 | % | | | 0.84 | % | | | 0.84 | % | | | 0.84 | %(f) |
| Expenses before waivers and/or expense reimbursement | | | 0.91 | % | | | 0.98 | % | | | 1.00 | % | | | 1.30 | % | | | 1.43 | %(f) |
| Net investment income (loss) | | | (0.32 | )% | | | 0.20 | % | | | (0.05 | )% | | | 0.28 | % | | | 0.60 | %(f) |
| Portfolio turnover rate(g) | | | 43 | % | | | 53 | % | | | 59 | % | | | 69 | % | | | 65 | % |
| (a) | Commencement of offering. |
| (b) | Calculated based on average shares outstanding during the period. |
| (c) | Total return is calculated assuming a purchase of a share on the first day and a sale on the last day of each period reported and includes reinvestment of dividends and distributions, if any. Total returns may reflect adjustments to conform to generally accepted accounting principles. Total returns for periods less than one full year are not annualized. |
| (d) | Does not include expenses of the underlying funds in which the Series invests. |
| (e) | Effective November 1, 2017, class specific expenses include transfer agent fees and expenses and registration fees, which are charged to their respective share class. |
| (g) | The Series’ portfolio turnover rate is calculated in accordance with regulatory requirements, without regard to transactions involving short-term investments and certain derivatives. If such transactions were included, the Series’ portfolio turnover rate may be higher. |
See Notes to Financial Statements.
| | | | |
| PGIM Jennison International Opportunities Fund | | | 45 | |
Report of Independent Registered Public Accounting Firm
To the Board of Directors of Prudential World Fund, Inc. and Shareholders of PGIM Jennison International Opportunities Fund
Opinion on the Financial Statements
We have audited the accompanying statement of assets and liabilities, including the schedule of investments, of PGIM Jennison International Opportunities Fund (one of the funds constituting Prudential World Fund, Inc., referred to hereafter as the “Fund”) as of October 31, 2020, and the related statements of operations and changes in net assets, including the related notes, and the financial highlights for the year ended October 31, 2020 (collectively referred to as the “financial statements”). In our opinion, the financial statements present fairly, in all material respects, the financial position of the Fund as of October 31, 2020, and the results of its operations, changes in its net assets, and the financial highlights for the year ended October 31, 2020 in conformity with accounting principles generally accepted in the United States of America.
The financial statements of the Fund as of and for the year ended October 31, 2019 and the financial highlights for each of the periods ended on or prior to October 31, 2019 (not presented herein, other than the statement of changes in net assets and the financial highlights) were audited by other auditors whose report dated December 16, 2019 expressed an unqualified opinion on those financial statements and financial highlights.
Basis for Opinion
These financial statements are the responsibility of the Fund’s management. Our responsibility is to express an opinion on the Fund’s financial statements based on our audit. We are a public accounting firm registered with the Public Company Accounting Oversight Board (United States) (PCAOB) and are required to be independent with respect to the Fund in accordance with the U.S. federal securities laws and the applicable rules and regulations of the Securities and Exchange Commission and the PCAOB.
We conducted our audit of these financial statements in accordance with the standards of the PCAOB. Those standards require that we plan and perform the audit to obtain reasonable assurance about whether the financial statements are free of material misstatement, whether due to error or fraud.
Our audit included performing procedures to assess the risks of material misstatement of the financial statements, whether due to error or fraud, and performing procedures that respond to those risks. Such procedures included examining, on a test basis, evidence regarding the amounts and disclosures in the financial statements. Our audit also included evaluating the accounting principles used and significant estimates made by management, as well as evaluating the overall presentation of the financial statements. Our procedures included confirmation of securities owned as of October 31, 2020 by correspondence with the custodian, transfer agent and brokers; when replies were not received from brokers, we performed other auditing procedures. We believe that our audit provides a reasonable basis for our opinion.
/s/PricewaterhouseCoopers LLP
New York, New York
December 16, 2020
We have served as the auditor of one or more investment companies in the PGIM Retail Funds complex since 2020.
INFORMATION ABOUT BOARD MEMBERS AND OFFICERS (unaudited)
Information about Board Members and Officers of the Fund is set forth below. Board Members who are not deemed to be “interested persons” of the Fund, as defined in the 1940 Act, are referred to as “Independent Board Members.” Board Members who are deemed to be “interested persons” of the Fund are referred to as “Interested Board Members.” The Board Members are responsible for the overall supervision of the operations of the Fund and perform the various duties imposed on the directors of investment companies by the 1940 Act. The Board in turn elects the Officers, who are responsible for administering the day-to-day operations of the Fund.
| | | | | | |
| Independent Board Members | | | | |
| | | | |
Name Year of Birth Position(s) Portfolios Overseen | | Principal Occupation(s) During Past Five Years | | Other Directorships Held During Past Five Years | | Length of Board Service |
| | | | |
Ellen S. Alberding 1958 Board Member Portfolios Overseen: 95 | | President and Board Member, The Joyce Foundation (charitable foundation) (since 2002); Vice Chair, City Colleges of Chicago (community college system) (2011-2015); Trustee, National Park Foundation (charitable foundation for national park system) (2009-2018); Trustee, Economic Club of Chicago (2009-2016); Trustee, Loyola University (since 2018). | | None. | | Since September 2013 |
| | | | |
Kevin J. Bannon 1952 Board Member Portfolios Overseen: 95 | | Retired; Managing Director (April 2008-May 2015) and Chief Investment Officer (October 2008-November 2013) of Highmount Capital LLC (registered investment adviser); formerly Executive Vice President and Chief Investment Officer (April 1993-August 2007) of Bank of New York Company; President (May 2003-May 2007) of BNY Hamilton Family of Mutual Funds. | | Director of Urstadt Biddle Properties (equity real estate investment trust) (since September 2008). | | Since July 2008 |
PGIM Jennison International Opportunities Fund
| | | | | | |
Independent Board Members | | | | |
| | | | |
Name Year of Birth Position(s) Portfolios Overseen | | Principal Occupation(s) During Past Five Years | | Other Directorships Held During Past Five Years | | Length of Board Service |
| | | | |
Linda W. Bynoe 1952 Board Member Portfolios Overseen: 95 | | President and Chief Executive Officer (since March 1995) and formerly Chief Operating Officer (December 1989-February 1995) of Telemat Limited LLC (formerly, Telemat Ltd). (management consulting); formerly Vice President (January 1985-June 1989) at Morgan Stanley & Co. (broker-dealer). | | Director of Anixter International, Inc. (communication products distributor) (since January 2006–June 2020); Director of Northern Trust Corporation (financial services) (since April 2006); Trustee of Equity Residential (residential real estate) (since December 2009). | | Since March 2005 |
| | | | |
Barry H. Evans 1960 Board Member Portfolios Overseen: 94 | | Retired; formerly President (2005 – 2016), Global Chief Operating Officer (2014– 2016), Chief Investment Officer – Global Head of Fixed Income (1998-2014), and various portfolio manager roles (1986-2006), Manulife Asset Management U.S. | | Formerly Director, Manulife Trust Company (2011-2018); formerly Director, Manulife Asset Management Limited (2015-2017); formerly Chairman of the Board of Directors of Manulife Asset Management U.S. (2005-2016); formerly Chairman of the Board, Declaration Investment Management and Research (2008-2016). | | Since September 2017 |
| | | | |
Keith F. Hartstein 1956 Board Member & Independent Chair Portfolios Overseen: 95 | | Executive Committee of the IDC Board of Governors (since October 2019); Retired; Member (since November 2014) of the Governing Council of the Independent Directors Council (IDC) (organization of independent mutual fund directors); formerly President and Chief Executive Officer (2005-2012), Senior Vice President (2004-2005), Senior Vice President of Sales and Marketing (1997-2004), and various executive management positions (1990-1997), John Hancock Funds, LLC (asset management); Chairman, Investment Company Institute’s Sales Force Marketing Committee (2003-2008). | | None. | | Since September 2013 |
Visit our website at pgim.com/investments
| | | | | | |
Independent Board Members | | | | |
| | | | |
Name Year of Birth Position(s) Portfolios Overseen | | Principal Occupation(s) During Past Five Years | | Other Directorships Held During Past Five Years | | Length of Board Service |
| | | | |
Laurie Simon Hodrick 1962 Board Member Portfolios Overseen: 94 | | A. Barton Hepburn Professor Emerita of Economics in the Faculty of Business, Columbia Business School (since 2018); Visiting Professor of Law, Stanford Law School (since 2015); Visiting Fellow at the Hoover Institution, Stanford University (since 2015); Sole Member, ReidCourt LLC (since 2008) (a consulting firm); formerly A. Barton Hepburn Professor of Economics in the Faculty of Business, Columbia Business School (1996-2017); formerly Managing Director, Global Head of Alternative Investment Strategies, Deutsche Bank (2006-2008). | | Independent Director, Synnex Corporation (since 2019) (information technology); Independent Director, Kabbage, Inc. (2018-2020) (financial services); Independent Director, Corporate Capital Trust (2017-2018) (a business development company). | | Since September 2017 |
| | | | |
Michael S. Hyland, CFA 1945 Board Member Portfolios Overseen: 95 | | Retired (since February 2005); formerly Senior Managing Director (July 2001-February 2005) of Bear Stearns & Co, Inc.; Global Partner, INVESCO (1999-2001); Managing Director and President of Salomon Brothers Asset Management (1989-1999). | | None. | | Since July 2008 |
| | | | |
Brian K. Reid 1961 Board Member Portfolios Overseen: 94 | | Retired; formerly Chief Economist for the Investment Company Institute (ICI) (2005-2017); formerly Senior Economist and Director of Industry and Financial Analysis at the ICI (1998-2004); formerly Senior Economist, Industry and Financial Analysis at the ICI (1996-1998); formerly Staff Economist at the Federal Reserve Board (1989-1996); Director, ICI Mutual Insurance Company (2012-2017). | | None. | | Since March 2018 |
PGIM Jennison International Opportunities Fund
| | | | | | |
Independent Board Members | | | | |
| | | | |
Name Year of Birth Position(s) Portfolios Overseen | | Principal Occupation(s) During Past Five Years | | Other Directorships Held During Past Five Years | | Length of Board Service |
| | | | |
Grace C. Torres 1959 Board Member Portfolios Overseen: 94 | | Retired; formerly Treasurer and Principal Financial and Accounting Officer of the PGIM Funds, Target Funds, Advanced Series Trust, Prudential Variable Contract Accounts and The Prudential Series Fund (1998-June 2014); Assistant Treasurer (March 1999-June 2014) and Senior Vice President (September 1999-June 2014) of PGIM Investments LLC; Assistant Treasurer (May 2003-June 2014) and Vice President (June 2005-June 2014) of AST Investment Services, Inc.; Senior Vice President and Assistant Treasurer (May 2003-June 2014) of Prudential Annuities Advisory Services, Inc. | | Formerly Director (July 2015-January 2018) of Sun Bancorp, Inc. N.A. and Sun National Bank; Director (since January 2018) of OceanFirst Financial Corp. and OceanFirst Bank. | | Since November 2014 |
| | | |
| | | | | | |
Interested Board Members |
| | | | |
Name Year of Birth Position(s) Portfolios Overseen | | Principal Occupation(s) During Past Five Years | | Other Directorships Held During Past Five Years | | Length of Board Service |
| | | | |
Stuart S. Parker 1962 Board Member & President Portfolios Overseen: 96 | | President of PGIM Investments LLC (formerly known as Prudential Investments LLC) (since January 2012); Executive Vice President of Prudential Investment Management Services LLC (since December 2012); formerly Executive Vice President of Jennison Associates LLC and Head of Retail Distribution of PGIM Investments LLC (June 2005-December 2011). | | None. | | Since January 2012 |
Visit our website at pgim.com/investments
| | | | | | |
Interested Board Members | | | | | | |
| | | | |
Name Year of Birth Position(s) Portfolios Overseen | | Principal Occupation(s) During Past Five Years | | Other Directorships Held During Past Five Years | | Length of Board Service |
| | | | |
Scott E. Benjamin 1973 Board Member & Vice President Portfolios Overseen: 96 | | Executive Vice President (since June 2009) of PGIM Investments LLC; Vice President (since June 2012) of Prudential Investment Management Services LLC; Executive Vice President (since September 2009) of AST Investment Services, Inc.; Senior Vice President of Product Development and Marketing, PGIM Investments (since February 2006); formerly Vice President of Product Development and Product Management, PGIM Investments LLC (2003-2006). | | None. | | Since March 2010 |
(1) The year that each Board Member joined the Board is as follows:
Ellen S. Alberding, 2013; Kevin J. Bannon, 2008; Linda W. Bynoe, 2005; Barry H. Evans, 2017; Keith F. Hartstein, 2013; Laurie Simon Hodrick, 2017; Michael S. Hyland, 2008; James E. Quinn, 2013; Richard A. Redeker, 2000; Stephen G. Stoneburn, 2003; Stuart S. Parker, Board Member and President since 2012; Scott E. Benjamin, Board Member since 2010 and Vice President since 2009; Grace C. Torres, 2014.
| | | | |
| Fund Officers(a) | | | | |
| | | |
Name Year of Birth Fund Position | | Principal Occupation(s) During Past Five Years | | Length of Service as Fund Officer |
| | | |
Claudia DiGiacomo 1974 Chief Legal Officer | | Chief Legal Officer of PGIM Investments LLC (since August 2020); Chief Legal Officer of Prudential Mutual Fund Services LLC (since August 2020); Chief Legal Officer of PIFM Holdco, LLC (since August 2020); Vice President and Corporate Counsel (since January 2005) of Prudential; and Corporate Counsel of AST Investment Services, Inc. (since August 2020); formerly Associate at Sidley Austin Brown & Wood LLP (1999-2004). | | Since December 2005 |
| | | |
Dino Capasso 1974 Chief Compliance Officer | | Chief Compliance Officer (July 2019-Present) of PGIM Investments LLC; Chief Compliance Officer (July 2019-Present) of the PGIM Funds, Target Funds, Advanced Series Trust, The Prudential Series Fund, Prudential’s Gibraltar Fund, Inc., PGIM Global High Yield Fund, Inc., and PGIM High Yield Bond Fund, Inc.; Vice President and Deputy Chief Compliance Officer (June 2017-2019) of PGIM Investments LLC; formerly, Senior Vice President and Senior Counsel (January 2016-June 2017), and Vice President and Counsel (February 2012-December 2015) of Pacific Investment Management Company LLC. | | Since March 2018 |
PGIM Jennison International Opportunities Fund
| | | | |
Fund Officers(a) | | | | |
| | | |
Name Year of Birth Fund Position | | Principal Occupation(s) During Past Five Years | | Length of Service as Fund Officer |
| | | |
Andrew R. French 1962 Secretary | | Vice President (since December 2018 - present) of PGIM Investments LLC; Formerly, Vice President and Corporate Counsel (2010-2018) of Prudential; formerly Director and Corporate Counsel (2006-2010) of Prudential; Vice President and Assistant Secretary (since January 2007) of PGIM Investments LLC; Vice President and Assistant Secretary (since January 2007) of Prudential Mutual Fund Services LLC. | | Since October 2006 |
| | | |
Diana N. Huffman 1982 Assistant Secretary | | Vice President and Corporate Counsel (since September 2015) of Prudential; Vice President and Assistant Secretary (since August 2020) of PGIM Investments LLC; formerly Associate at Willkie Farr & Gallagher LLP (2009-2015). | | Since March 2019 |
| | | |
Melissa Gonzalez 1980 Assistant Secretary | | Vice President and Corporate Counsel (since September 2018) of Prudential; Vice President and Assistant Secretary (since August 2020) of PGIM Investments LLC; formerly Director and Corporate Counsel (March 2014-September 2018) of Prudential. | | Since March 2020 |
| | | |
Patrick E. McGuinness 1986 Assistant Secretary | | Vice President and Assistant Secretary (since August 2020) of PGIM Investments LLC; Director and Corporate Counsel (since February 2017) of Prudential; and Corporate Counsel (2012 – 2017) of IIL, Inc. | | Since June 2020 |
| | | |
Kelly A. Coyne 1968 Assistant Secretary | | Director, Investment Operations of Prudential Mutual Fund Services LLC (since 2010). | | Since March 2015 |
| | | |
Christian J. Kelly 1975 Treasurer and Principal Financial and Accounting Officer | | Vice President, Head of Fund Administration of PGIM Investments LLC (since November 2018); formerly, Director of Fund Administration of Lord Abbett & Co. LLC (2009-2018), Treasurer and Principal Accounting Officer of the Lord Abbett Family of Funds (2017-2018); Director of Accounting, Avenue Capital Group (2008-2009); Senior Manager, Investment Management Practice of Deloitte & Touche LLP (1998-2007). | | Since January 2019 |
| | | |
Lana Lomuti 1967 Assistant Treasurer | | Vice President (since 2007) and Director (2005-2007), within PGIM Investments Fund Administration; formerly Assistant Treasurer (December 2007-February 2014) of The Greater China Fund, Inc. | | Since April 2014 |
| | | |
Russ Shupak 1973 Assistant Treasurer | | Vice President (since 2017) and Director (2013-2017), within PGIM Investments Fund Administration. | | Since October 2019 |
| | | |
Deborah Conway 1969 Assistant Treasurer | | Vice President (since 2017) and Director (2007-2017), within PGIM Investments Fund Administration. | | Since October 2019 |
| | | |
Elyse M. McLaughlin 1974 Assistant Treasurer | | Vice President (since 2017) and Director (2011-2017), within PGIM Investments Fund Administration. | | Since October 2019 |
Visit our website at pgim.com/investments
| | | | |
Fund Officers(a) | | | | |
| | | |
Name Year of Birth Fund Position | | Principal Occupation(s) During Past Five Years | | Length of Service as Fund Officer |
| | | |
Charles H. Smith 1973 Anti-Money Laundering Compliance Officer | | Vice President, Corporate Compliance, Anti-Money Laundering Unit (since January 2015) of Prudential; committee member of the American Council of Life Insurers Anti-Money Laundering and Critical Infrastructure Committee (since January 2016); formerly Global Head of Economic Sanctions Compliance at AIG Property Casualty (February 2007-December 2014); Assistant Attorney General at the New York State Attorney General’s Office, Division of Public Advocacy. (August 1998-January 2007). | | Since January 2017 |
(a) Excludes Mr. Parker and Mr. Benjamin, interested Board Members who also serve as President and Vice President, respectively.
Explanatory Notes to Tables:
| ∎ | Board Members are deemed to be “Interested,” as defined in the 1940 Act, by reason of their affiliation with PGIM Investments LLC and/or an affiliate of PGIM Investments LLC. |
| ∎ | Unless otherwise noted, the address of all Board Members and Officers is c/o PGIM Investments LLC, 655 Broad Street, Newark, New Jersey 07102-4410. |
| ∎ | There is no set term of office for Board Members or Officers. The Board Members have adopted a retirement policy, which calls for the retirement of Board Members on December 31 of the year in which they reach the age of 75. |
| ∎ | “Other Directorships Held” includes all directorships of companies required to register or file reports with the SEC under the 1934 Act (that is, “public companies”) or other investment companies registered under the 1940 Act. |
| ∎ | “Portfolios Overseen” includes all investment companies managed by PGIM Investments LLC. The investment companies for which PGIM Investments LLC serves as manager include the PGIM Funds, The Prudential Variable Contract Accounts, PGIM ETF Trust, PGIM High Yield Bond Fund, Inc., PGIM Global High Yield Fund, Inc., The Prudential Series Fund, Prudential’s Gibraltar Fund, Inc. and the Advanced Series Trust. |
| ∎ | As used in the Fund Officers table “Prudential” means The Prudential Insurance Company of America. |
PGIM Jennison International Opportunities Fund
Approval of Advisory Agreements (unaudited)
The Fund’s Board of Directors
The Board of Directors (the “Board”) of PGIM Jennison International Opportunities Fund (the “Fund”)1 consists of eleven individuals, nine of whom are not “interested persons” of the Fund, as defined in the Investment Company Act of 1940, as amended (the “1940 Act”) (the “Independent Directors”). The Board is responsible for the oversight of the Fund and its operations, and performs the various duties imposed on the directors of investment companies by the 1940 Act. The Independent Directors have retained independent legal counsel to assist them in connection with their duties. The Chair of the Board is an Independent Director. The Board has established four standing committees: the Audit Committee, the Nominating and Governance Committee, and two Investment Committees. Each committee is chaired by, and composed of, Independent Directors.
Annual Approval of the Fund’s Advisory Agreements
As required under the 1940 Act, the Board determines annually whether to renew the Fund’s management agreement with PGIM Investments LLC (“PGIM Investments”) and the Fund’s subadvisory agreement with Jennison Associates LLC (“Jennison”). In considering the renewal of the agreements, the Board, including all of the Independent Directors, met on May 27, 2020 and on June 9-11, 2020 and approved the renewal of the agreements through July 31, 2021, after concluding that the renewal of the agreements was in the best interests of the Fund and its shareholders.
In advance of the meetings, the Board requested and received materials relating to the agreements, and had the opportunity to ask questions and request further information in connection with its consideration. Among other things, the Board considered comparative fee information from PGIM Investments and Jennison. Also, the Board considered comparisons with other mutual funds in relevant Peer Universes and Peer Groups, as is further discussed below.
In approving the agreements, the Board, including the Independent Directors advised by independent legal counsel, considered the factors it deemed relevant, including the nature, quality and extent of services provided by PGIM Investments and the subadviser, the performance of the Fund, the profitability of PGIM Investments and its affiliates, expenses and fees, and the potential for economies of scale that may be shared with the Fund and its shareholders as the Fund’s assets grow. In their deliberations, the Directors did not identify any single factor which alone was responsible for the Board’s decision to approve the agreements with respect to the Fund. In connection with its deliberations, the Board considered information provided by PGIM Investments throughout the year at regular Board
| 1 | PGIM Jennison International Opportunities Fund is a series of Prudential World Fund, Inc. |
PGIM Jennison International Opportunities Fund
Approval of Advisory Agreements (continued)
meetings, presentations from portfolio managers and other information, as well as information furnished at or in advance of the meetings on May 27, 2020 and on June 9-11, 2020.
The Directors determined that the overall arrangements between the Fund and PGIM Investments, which serves as the Fund’s investment manager pursuant to a management agreement, and between PGIM Investments and Jennison, which serves as the Fund’s subadviser pursuant to the terms of a subadvisory agreement with PGIM Investments, are in the best interests of the Fund and its shareholders in light of the services performed, fees charged and such other matters as the Directors considered relevant in the exercise of their business judgment.
The material factors and conclusions that formed the basis for the Directors’ reaching their determinations to approve the continuance of the agreements are separately discussed below.
Nature, Quality and Extent of Services
The Board received and considered information regarding the nature, quality and extent of services provided to the Fund by PGIM Investments and Jennison. The Board noted that Jennison is affiliated with PGIM Investments. The Board considered the services provided by PGIM Investments, including but not limited to the oversight of the subadviser for the Fund, as well as the provision of fund recordkeeping, compliance and other services to the Fund, and PGIM Investments’ role as administrator for the Fund’s liquidity risk management program. With respect to PGIM Investments’ oversight of the subadviser, the Board noted that PGIM Investments’ Strategic Investment Research Group (“SIRG”), which is a business unit of PGIM Investments, is responsible for monitoring and reporting to PGIM Investments’ senior management on the performance and operations of the subadviser. The Board also considered that PGIM Investments pays the salaries of all of the officers and interested Directors of the Fund who are part of Fund management. The Board also considered the investment subadvisory services provided by Jennison, including investment research and security selection, as well as adherence to the Fund’s investment restrictions and compliance with applicable Fund policies and procedures. The Board considered PGIM Investments’ evaluation of the subadviser, as well as PGIM Investments’ recommendation, based on its review of the subadviser, to renew the subadvisory agreement.
The Board considered the qualifications, backgrounds and responsibilities of PGIM Investments’ senior management responsible for the oversight of the Fund and Jennison, and also considered the qualifications, backgrounds and responsibilities of Jennison’s portfolio managers who are responsible for the day-to-day management of the Fund’s portfolio. The Board was provided with information pertaining to PGIM Investments’ and Jennison’s organizational structure, senior management, investment operations, and other relevant information pertaining to both PGIM Investments and Jennison. The Board also
Visit our website at pgim.com/investments
noted that it received favorable compliance reports from the Fund’s Chief Compliance Officer (“CCO”) as to both PGIM Investments and Jennison.
The Board concluded that it was satisfied with the nature, extent and quality of the investment management services provided by PGIM Investments and the subadvisory services provided to the Fund by Jennison, and that there was a reasonable basis on which to conclude that the Fund benefits from the services provided by PGIM Investments and Jennison under the management and subadvisory agreements.
Costs of Services and Profits Realized by PGIM Investments
The Board was provided with information on the profitability of PGIM Investments and its affiliates in serving as the Fund’s investment manager. The Board discussed with PGIM Investments the methodology utilized in assembling the information regarding profitability and considered its reasonableness. The Board recognized that it is difficult to make comparisons of profitability from fund management contracts because comparative information is not generally publicly available and is affected by numerous factors, including the structure of the particular adviser, the types of funds it manages, its business mix, numerous assumptions regarding allocations and the adviser’s capital structure and cost of capital. However, the Board considered that the cost of services provided by PGIM Investments to the Fund during the year ended December 31, 2019 exceeded the management fees paid by the Fund, resulting in an operating loss to PGIM Investments. Taking these factors into account, the Board concluded that the profitability of PGIM Investments and its affiliates in relation to the services rendered was not unreasonable.
Economies of Scale
The Board received and discussed information concerning economies of scale that PGIM Investments may realize as the Fund’s assets grow beyond current levels. The Board noted that the management fee schedule for the Fund includes breakpoints, which have the effect of reducing the fee rate as assets increase. During the course of time, the Board has considered information regarding the launch date of the Fund, the management fees of the Fund compared to those of similarly managed funds, and PGIM Investments’ investment in the Fund over time. The Board noted that economies of scale may be shared with the Fund in several ways, including low management fees from inception, additional technological and personnel investments to enhance shareholder services, and maintaining existing expense structures in the face of a rising cost environment. The Board considered PGIM Investments’ assertion that it continually evaluates the management fee schedule of the Fund and the potential to share economies of scale through breakpoints or fee waivers as asset levels increase.
PGIM Jennison International Opportunities Fund
Approval of Advisory Agreements (continued)
The Board recognized the inherent limitations of any analysis of economies of scale, stemming largely from the Board’s understanding that most of PGIM Investments’ costs are not specific to individual funds, but rather are incurred across a variety of products and services.
Other Benefits to PGIM Investments and Jennison
The Board considered potential ancillary benefits that might be received by PGIM Investments, Jennison and their affiliates as a result of their relationship with the Fund. The Board concluded that potential benefits to be derived by PGIM Investments included transfer agency fees received by the Fund’s transfer agent (which is affiliated with PGIM Investments), as well as benefits to its reputation or other intangible benefits resulting from PGIM Investments’ association with the Fund. The Board concluded that the potential benefits to be derived by Jennison included the ability to use soft dollar credits, as well as the potential benefits consistent with those generally resulting from an increase in assets under management, specifically, potential access to additional research resources and benefits to its reputation. The Board concluded that the benefits derived by PGIM Investments and Jennison were consistent with the types of benefits generally derived by investment managers and subadvisers to mutual funds.
Performance of the Fund / Fees and Expenses
The Board considered certain additional factors and made related conclusions relating to the historical performance of the Fund for the one-, three- and five-year periods ended December 31, 2019.
The Board also considered the Fund’s actual management fee, as well as the Fund’s net total expense ratio, for the fiscal year ended October 31, 2019. The Board considered the management fee for the Fund as compared to the management fee charged by PGIM Investments to other funds and the fee charged by other advisers to comparable mutual funds in a Peer Group. The actual management fee represents the fee rate actually paid by Fund shareholders and includes any fee waivers or reimbursements. The net total expense ratio for the Fund represents the actual expense ratio incurred by Fund shareholders.
The mutual funds included in the Peer Universe, which was used to consider performance, and the Peer Group, which was used to consider fees and expenses, were objectively determined by Broadridge, an independent provider of mutual fund data. In certain circumstances, PGIM Investments also provided supplemental Peer Universe or Peer Group information for reasons addressed with the Board. The comparisons placed the Fund in various quartiles over various periods, with the first quartile being the best 25% of the mutual funds (for performance, the best performing mutual funds and, for expenses, the lowest cost mutual funds).
The section below summarizes key factors considered by the Board and the Board’s conclusions regarding the Fund’s performance, fees and overall expenses. The table sets
Visit our website at pgim.com/investments
forth net performance comparisons (which reflect the impact on performance of fund expenses, or any subsidies, expense caps or waivers that may be applicable) with the Peer Universe, actual management fees with the Peer Group (which reflect the impact of any subsidies or fee waivers), and net total expenses with the Peer Group, each of which were key factors considered by the Board.
| | | | | | | | |
| Net Performance | | 1 Year | | 3 Years | | 5 Years | | 10 Years |
| | 1st Quartile | | 1st Quartile | | 1st Quartile | | N/A |
| Actual Management Fees: 2nd Quartile |
| Net Total Expenses: 3rd Quartile |
| • | | The Board noted that Fund outperformed its benchmark index over all periods. |
| • | | The Board and PGIM Investments agreed to retain the Fund’s existing contractual expense cap that (exclusive of certain fees and expenses) caps net annual operating expenses at 0.84% for each class of the Fund’s shares, and that limits transfer agency, shareholder servicing, sub-transfer agency and blue sky fees, as applicable, to the extent that such fees cause the net annual operating expenses to exceed 1.34% of average daily net assets for Class R2 shares or 1.09% of average daily net assets for Class R4 shares through February 28, 2021. |
| • | | The Board and PGIM Investments agreed to retain the Fund’s existing contractual expense cap with respect to Class A shares, pursuant to which PGIM Investments agrees to limit total annual operating expenses for Class A shares to 1.09% through February 28, 2021. |
| • | | The Board and PGIM Investments agreed to retain the Fund’s existing contractual expense waiver, pursuant to which (exclusive of certain fees and expenses) PGIM Investments waives and/or reimburses up to 0.06% of certain other expenses through February 28, 2021 to the extent that total annual operating expenses exceed 1.90% for Class C shares, 1.48% for Class R shares, 0.90% for Class Z shares, and 0.84% for Class R6 shares. |
| • | | In addition, PGIM Investments will waive management fees or shared operating expenses on any share class to the same extent that it waives such expenses on any other share class, and has agreed that total annual fund operating expenses for Class R6 shares will not exceed total annual fund operating expenses for Class Z shares. |
| • | | The Board concluded that, in light of the above, it would be in the best interests of the Fund and its shareholders to renew the agreements. |
| • | | The Board concluded that the management fees (including subadvisory fees) and total expenses were reasonable in light of the services provided. |
* * *
After full consideration of these factors, the Board concluded that the approval of the agreements was in the best interests of the Fund and its shareholders.
PGIM Jennison International Opportunities Fund
| | | | |
| | |
| ∎ MAIL | | ∎ TELEPHONE | | ∎ WEBSITE |
655 Broad Street Newark, NJ 07102 | | (800) 225-1852 | | pgim.com/investments |
|
| PROXY VOTING |
| The Board of Directors of the Fund has delegated to the Fund’s subadviser the responsibility for voting any proxies and maintaining proxy recordkeeping with respect to the Fund. A description of these proxy voting policies and procedures is available without charge, upon request, by calling (800) 225-1852 or by visiting the Securities and Exchange Commission’s website at sec.gov. Information regarding how the Fund voted proxies relating to portfolio securities during the most recent 12-month period ended June 30 is available on the Fund’s website and on the Securities and Exchange Commission’s website. |
|
| DIRECTORS |
| Ellen S. Alberding • Kevin J. Bannon • Scott E. Benjamin • Linda W. Bynoe • Barry H. Evans • Keith F. Hartstein • Laurie Simon Hodrick • Michael S. Hyland • Stuart S. Parker • Brian K. Reid • Grace C. Torres |
|
| OFFICERS |
| Stuart S. Parker, President • Scott E. Benjamin, Vice President • Christian J. Kelly, Treasurer and Principal Financial and Accounting Officer • Claudia DiGiacomo, Chief Legal Officer • Dino Capasso, Chief Compliance Officer • Charles H. Smith, Anti-Money Laundering Compliance Officer • Andrew R. French, Secretary • Melissa Gonzalez, Assistant Secretary • Diana N. Huffman, Assistant Secretary • Kelly A. Coyne, Assistant Secretary • Patrick McGuinness, Assistant Secretary • Lana Lomuti, Assistant Treasurer • Russ Shupak, Assistant Treasurer • Elyse McLaughlin, Assistant Treasurer • Deborah Conway, Assistant Treasurer |
| | | | |
| MANAGER | | PGIM Investments LLC | | 655 Broad Street Newark, NJ 07102 |
|
| SUBADVISER | | Jennison Associates LLC | | 466 Lexington Avenue
New York, NY 10017 |
|
| DISTRIBUTOR | | Prudential Investment
Management Services LLC | | 655 Broad Street Newark, NJ 07102 |
|
| CUSTODIAN | | The Bank of New York Mellon | | 240 Greenwich Street
New York, NY 10286 |
|
| TRANSFER AGENT | | Prudential Mutual Fund
Services LLC | | PO Box 9658
Providence, RI 02940 |
|
| INDEPENDENT REGISTERED PUBLIC ACCOUNTING FIRM | | PricewaterhouseCoopers LLP | | 300 Madison Avenue New York, NY 10017 |
|
| FUND COUNSEL | | Willkie Farr & Gallagher LLP | | 787 Seventh Avenue
New York, NY 10019 |
|
|
| An investor should consider the investment objectives, risks, charges, and expenses of the Fund carefully before investing. The prospectus and summary prospectus contain this and other information about the Fund. An investor may obtain the prospectus and summary prospectus by visiting our website at pgim.com/investments or by calling (800) 225-1852. The prospectus and summary prospectus should be read carefully before investing. |
|
| E-DELIVERY |
| To receive your mutual fund documents online, go to pgim.com/investments/resource/edelivery and enroll. Instead of receiving printed documents by mail, you will receive notification via email when new materials are available. You can cancel your enrollment or change your email address at any time by visiting the website address above. |
|
| SHAREHOLDER COMMUNICATIONS WITH DIRECTORS |
| Shareholders can communicate directly with the Board of Directors by writing to the Chair of the Board, PGIM Jennison International Opportunities Fund, PGIM Investments, Attn: Board of Directors, 655 Broad Street, Newark, NJ 07102. Shareholders can communicate directly with an individual Director by writing that Director at to the same address. Communications are not screened before being delivered to the addressee. |
|
| AVAILABILITY OF PORTFOLIO HOLDINGS |
The Fund files its complete schedule of portfolio holdings with the Securities and Exchange Commission for the first and third quarters of each fiscal year as an exhibit to its reports on Form N-PORT. The Fund’s Form N-PORT filings are available on the Commission’s website at sec.gov. |
|
| The Fund’s Statement of Additional Information contains additional information about the Fund’s Directors and is available without charge, upon request, by calling (800) 225-1852. |
Mutual Funds:
| | | | |
| ARE NOT INSURED BY THE FDIC OR ANY FEDERAL GOVERNMENT AGENCY | | MAY LOSE VALUE | | ARE NOT A DEPOSIT OF OR GUARANTEED BY ANY BANK OR ANY BANK AFFILIATE |
PGIM JENNISON INTERNATIONAL OPPORTUNITIES FUND
| | | | | | | | | | | | | | |
| SHARE CLASS | | A | | C | | R | | Z | | R2 | | R4 | | R6 |
| NASDAQ | | PWJAX | | PWJCX | | PWJRX | | PWJZX | | PWJBX | | PWJDX | | PWJQX |
| CUSIP | | 743969677 | | 743969669 | | 743969487 | | 743969651 | | 743969412 | | 743969396 | | 743969586 |
MF215E

PGIM JENNISON GLOBAL INFRASTRUCTURE FUND
ANNUAL REPORT
OCTOBER 31, 2020
COMING SOON: PAPERLESS SHAREHOLDER REPORTS
Beginning on January 1, 2021, as permitted by regulations adopted by the Securities and Exchange Commission, paper copies of the Fund’s annual and semiannual shareholder reports will no longer be sent by mail, unless you specifically request paper copies of the reports. Instead, the reports will be made available on the Fund’s website (pgim.com/investments), and you will be notified by mail each time a report is posted and provided with a website link to access the report.
If you already elected to receive shareholder reports electronically, you will not be affected by this change and you need not take any action. You may elect to receive shareholder reports and other communications from the Fund electronically anytime by contacting your financial intermediary (such as a broker-dealer or bank) or, if you are a direct investor, by calling 1-800-225-1852 or by sending an email request to PGIM Investments at shareholderreports@pgim.com.
You may elect to receive all future reports in paper free of charge. If you invest through a financial intermediary, you can contact your financial intermediary to elect to continue to receive paper copies of your shareholder reports. If you invest directly with the Fund, you can call 1-800-225-1852 or send an email request to shareholderreports@pgim.com to let the Fund know you wish to continue receiving paper copies of your shareholder reports. Your election to receive reports in paper will apply to all funds held in your account if you invest through your financial intermediary or all funds held with the fund complex if you invest directly with the Fund.

To enroll in e-delivery, go to pgim.com/investments/resource/edelivery
Table of Contents
This report is not authorized for distribution to prospective investors unless preceded or accompanied by a current prospectus.
The views expressed in this report and information about the Fund’s portfolio holdings are for the period covered by this report and are subject to change thereafter.
Mutual funds are distributed by Prudential Investment Management Services LLC, member SIPC. Jennison Associates LLC is a registered investment adviser. Both are Prudential Financial companies. © 2020 Prudential Financial, Inc. and its related entities. Jennison Associates, Jennison, PGIM, and the PGIM logo are service marks of Prudential Financial, Inc. and its related entities, registered in many jurisdictions worldwide.
| | |
| 2 | | Visit our website at pgim.com/investments |
Letter from the President

Dear Shareholder:
We hope you find the annual report for the PGIM Jennison Global Infrastructure Fund informative and useful. The report covers performance for the 12-month period that ended October 31, 2020.
During the first four months of the period, the global economy remained healthy—particularly in the US—fueled by rising corporate profits and strong job growth. The outlook changed dramatically in March as the coronavirus outbreak quickly and substantially shut down economic activity worldwide, leading to significant job losses and a steep decline in global growth and earnings. Responding to this disruption, the Federal Reserve (the Fed) cut the federal funds rate target to near zero and flooded capital markets with liquidity; and Congress passed stimulus bills worth approximately $3 trillion that offered an economic lifeline to consumers and businesses.
While stocks climbed throughout the first four months of the period, they fell significantly in March amid a spike in volatility, ending the 11-year-long equity bull market. With stores and factories closing and consumers staying at home to limit the spread of the virus, investors sold stocks on fears that corporate earnings would take a serious hit. Equities rallied around the globe throughout the spring and summer as states reopened their economies, but became more volatile during the last two months of the period as investors worried that a surge in coronavirus infections would stall the economic recovery. For the period overall, large-cap US and emerging market stocks rose, small-cap US stocks were virtually unchanged, and stocks in developed foreign markets declined.
The bond market overall—including US and global bonds as well as emerging market debt—rose during the period as investors sought safety in fixed income. A significant rally in interest rates pushed the 10-year US Treasury yield down to a record low. In March, the Fed took several aggressive actions to keep the bond markets running smoothly, restarting many of the relief programs that proved to be successful in helping end the global financial crisis in 2008-09.
Regarding your investments with PGIM, we believe it is important to maintain a diversified portfolio of funds consistent with your tolerance for risk, time horizon, and financial goals. Your financial advisor can help you create a diversified investment plan that may include funds covering all the basic asset classes and that reflects your personal investor profile and risk tolerance. However, diversification and asset allocation strategies do not assure a profit or protect against loss in declining markets.
At PGIM Investments, we consider it a great privilege and responsibility to help investors participate in opportunities across global markets while meeting their toughest investment challenges. PGIM is a top-10 global investment manager with more than $1 trillion in assets under management. This scale and investment expertise allow us to deliver actively managed funds and strategies to meet the needs of investors around the globe.
Thank you for choosing our family of funds.
Sincerely,

Stuart S. Parker, President
PGIM Jennison Global Infrastructure Fund
December 15, 2020
| | | | |
PGIM Jennison Global Infrastructure Fund | | | 3 | |
Your Fund’s Performance (unaudited)
Performance data quoted represents past performance. Past performance does not guarantee future results. The investment return and principal value of an investment will fluctuate, so that an investor’s shares, when redeemed, may be worth more or less than their original cost. Current performance may be lower or higher than the past performance data quoted. An investor may obtain performance data as of the most recent month-end by visiting our website at pgim.com/investments or by calling (800) 225-1852.
| | | | | | |
| |
| | | Average Annual Total Returns as of 10/31/20 |
| | | One Year (%) | | Five Years (%) | | Since Inception (%) |
| Class A | | | | | | |
| (with sales charges) | | –10.16 | | 4.03 | | 5.12 (9/25/13) |
| (without sales charges) | | –4.93 | | 5.22 | | 5.96 (9/25/13) |
| Class C | | | | | | |
| (with sales charges) | | –6.57 | | 4.44 | | 5.16 (9/25/13) |
| (without sales charges) | | –5.63 | | 4.44 | | 5.16 (9/25/13) |
| Class Z | | | | | | |
| (without sales charges) | | –4.56 | | 5.54 | | 6.25 (9/25/13) |
| Class R6 | | | | | | |
| (without sales charges) | | –4.62 | | N/A | | 6.79 (12/28/16) |
| S&P Global Infrastructure Index |
| | –16.79 | | 2.32 | | — |
| S&P 500 Index* | | | | | | |
| | | 9.71 | | 11.70 | | — |
| | | | |
|
| Average Annual Total Returns as of 10/31/20 Since Inception (%) |
| | | Class A, C, Z (9/25/13) | | Class R6 (12/28/16) |
| S&P Global Infrastructure Index | | 3.05 | | 2.04 |
| S&P 500 Index | | 12.08 | | 12.56 |
*The S&P 500 Index (“Index”) is a product of S&P Dow Jones Indices LLC and/or its affiliates and has been licensed for use by PGIM, Inc. Copyright © 2020 S&P Dow Jones Indices LLC, a division of S&P Global, Inc., and/or its affiliates. All rights reserved. Redistribution or reproduction in whole or in part are prohibited without written permission of S&P Dow Jones Indices LLC. For more information on any of S&P Dow Jones Indices LLC’s indices please visit www.spdji.com. S&P® is a registered trademark of S&P Global and Dow Jones® is a registered trademark of Dow Jones Trademark Holdings LLC.
Since Inception returns are provided since the Fund has less than 10 fiscal years of returns. Since Inception returns for the Indexes are measured from the closest month-end to the class’ inception date.
| | |
| 4 | | Visit our website at pgim.com/investments |
Growth of a $10,000 Investment (unaudited)
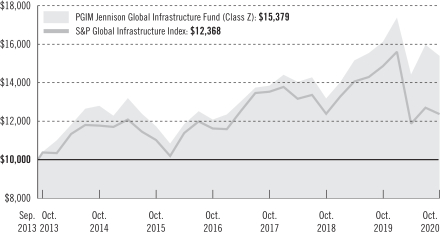
The graph compares a $10,000 investment in the Fund’s Class Z shares with a similar investment in the S&P Global Infrastructure Index by portraying the initial account values at the commencement of operations of Class Z shares (September 25, 2013) and the account values at the end of the current fiscal year (October 31, 2020), as measured on a quarterly basis. For purposes of the graph, and unless otherwise indicated, it has been assumed that (a) all recurring fees (including management fees) were deducted; and (b) all dividends and distributions were reinvested. The line graph provides information for Class Z shares only. As indicated in the tables provided earlier, performance for other share classes will vary due to the differing fees and expenses applicable to each share class (as indicated in the following paragraphs). Without waiver of fees and/or expense reimbursements, if any, the Fund’s returns would have been lower.
Past performance does not predict future performance. Total returns and the ending account values in the graphs include changes in share price and reinvestment of dividends and capital gains distributions in a hypothetical investment for the periods shown. The Fund’s total returns do not reflect the deduction of income taxes on an individual’s investment. Taxes may reduce your actual investment returns on income or gains paid by the Fund or any gains you may realize if you sell your shares.
| | | | |
PGIM Jennison Global Infrastructure Fund | | | 5 | |
Your Fund’s Performance (continued)
The returns in the tables do not reflect the deduction of taxes that a shareholder would pay on Fund distributions or following the redemption of Fund shares. The average annual total returns take into account applicable sales charges, which are described for each share class in the table below.
| | | | | | | | |
| | | | | |
| | | Class A | | Class C | | Class Z | | Class R6 |
| Maximum initial sales charge | | 5.50% of the public offering price | | None | | None | | None |
| Contingent deferred sales charge (CDSC) (as a percentage of the lower of the original purchase price or the net asset value at redemption) | | 1.00% on sales of $1 million or more made within 12 months of purchase | | 1.00% on sales made within 12 months of purchase | | None | | None |
| Annual distribution and service (12b-1) fees (shown as a percentage of average daily net assets) | | 0.30% (0.25% currently) | | 1.00% | | None | | None |
Benchmark Definitions
S&P Global Infrastructure Index—The S&P Global Infrastructure Index is an unmanaged index that consists of 75 companies from around the world that represent the listed infrastructure universe. To create diversified exposure across the global listed infrastructure market, the Index has balanced weights across three distinct infrastructure clusters: Utilities, Transportation, and Energy.
S&P 500 Index—The S&P 500 Index is an unmanaged index of over 500 stocks of large US public companies. It gives a broad look at how stock prices in the United States have performed.
Investors cannot invest directly in an index. The returns for the Indexes would be lower if they included the effects of sales charges, operating expenses of a mutual fund, or taxes that may be paid by an investor.
| | |
| 6 | | Visit our website at pgim.com/investments |
Presentation of Fund Holdings as of 10/31/20
| | | | | | |
| | | |
| Ten Largest Holdings | | Line of Business | | Country | | % of Net Assets |
| Cellnex Telecom SA, 144A | | Diversified Telecommunication Services | | Spain | | 6.3% |
| NextEra Energy, Inc. | | Electric Utilities | | United States | | 6.2% |
| RWE AG | | Multi-Utilities | | Germany | | 4.6% |
| Union Pacific Corp. | | Road & Rail | | United States | | 4.2% |
| Norfolk Southern Corp. | | Road & Rail | | United States | | 3.7% |
| Enel SpA | | Electric Utilities | | Italy | | 3.4% |
| Iberdrola SA | | Electric Utilities | | Spain | | 3.3% |
| Orsted A/S, 144A | | Electric Utilities | | Denmark | | 3.3% |
| Equinix, Inc., REIT | | Equity Real Estate Investment Trusts (REITs) | | United States | | 3.0% |
| Dominion Energy, Inc. | | Multi-Utilities | | United States | | 2.9% |
Holdings reflect only long-term investments and are subject to change.
| | | | |
PGIM Jennison Global Infrastructure Fund | | | 7 | |
Strategy and Performance Overview (unaudited)
How did the Fund perform?
The PGIM Jennison Global Infrastructure Fund’s Class Z shares returned -4.56% in the 12-month reporting period that ended October 31, 2020, outperforming the -16.79% return of the S&P Global Infrastructure Index (the Index).
What was the market environment?
| | • | | The financial markets experienced periods of heightened volatility during the reporting period, partially driven by the COVID-19 pandemic and its repercussions around the world. |
| | • | | After rising over the first three months of the period, stocks fell sharply in February and March 2020 as the virus spread, triggering lockdowns and a global recession. |
| | • | | Markets reversed course again from April through August, recouping much of their losses. This turnaround was driven by a number of factors, including unprecedented monetary policy accommodation from the Federal Reserve and other global central banks. Aggressive fiscal policies, signs of improving growth, and hopes for a COVID-19 vaccine also supported investor sentiment. |
| | • | | Markets experienced another setback in September and October due to a second wave of COVID-19 cases, weakening economic growth, and geopolitical uncertainties. |
| | • | | For the full reporting period, US and emerging-markets equities generated strong results, while international developed-markets equities posted poor returns. |
| | • | | The global infrastructure market, as measured by the Index, generated weak results during the period. Within the industrials segment, airport services, marine ports & services, and highways & rail tracks all fell more than 20%. In the energy segment, oil & gas storage & transportation declined 27% given weak demand. Results were mixed in the utility space. Gas utilities generated poor results, whereas electric utilities and water utilities posted modest gains during the period. |
What worked?
| | • | | Stock selection within multi-utilities was the largest contributor to performance during the reporting period, led by the Fund’s holding in RWE AG. Positioning within airport services was also beneficial, driven by an underweight position in Aena SME SA and not owning shares of Index component Grupo Aeroportuario del Pacifico, S.A.B de C.V., both of which performed poorly over the period. |
| | • | | Holdings within electric utilities also strongly contributed to both absolute and relative performance over the period, led by NextEra Energy, Inc. |
| | • | | Other notable contributors included Cellnex Telecom S.A., Orsted A/S, and Equinix, Inc. |
| | |
| 8 | | Visit our website at pgim.com/investments |
What didn’t work?
| | • | | Stock selection in oil & gas storage & transportation was the largest detector from the Fund’s performance during the period. Specifically, positions in ONEOK Inc., Equitrans Midstream Corp., and Targa Resources Corp. were headwinds for returns. |
| | • | | Stock selection within highways & railtracks also hurt performance, with Atlantia SpA, Getlink SE, and Atlas Arteria among the Fund’s largest detractors from returns. |
| | • | | Other notable detractors included Ferrovial SA, FirstEnergy Corp., and Eiffage SA. |
Current outlook
| | • | | Demand trends within transportation infrastructure have been volatile in 2020 due to COVID-19-related impacts across toll roads, airports, and rails. Jennison’s focus remains on stocks of companies with solid balance sheets and the free-cash-flow generation capability to weather a variety of virus-related economic recovery scenarios. After paring exposure to the transportation industry in the first quarter of 2020, Jennison increased holdings in the third quarter amid solid sequential improvement in US freight volumes and signs of stabilization in toll roads and airports. Transportation infrastructure levered to the movement of goods has continued to recover, while infrastructure tied to the movement of people (e.g., toll roads and airports) remains more volatile. Within transportation, Jennison continues to favor rail companies that are well positioned to leverage accelerating freight volumes over the next year while adding costs at a much slower pace, which Jennison believes should enable solid incremental margins and free-cash-flow growth for these firms. Jennison also prefers rail companies with exposure to precision-scheduled railroading and continues to own waste companies with solid pricing power and free-cash-flow generation despite the negative impact of the pandemic. Jennison continues to prefer toll roads over airports, given the potential for the former group to benefit from more normalized demand in 2021 and greater clarity on pricing and regulation. Jennison incrementally added airport exposure in the third quarter, favoring names exposed to short-haul leisure demand, which should recover first. However, Jennison expects it will take multiple years for airport traffic to recover to 2019 levels as the industry continues to face a more uncertain regulatory outlook that existed even before the pandemic. |
| | • | | Utility sector fundamentals remain healthy, and Jennison believes companies in the sector should generate to mid-to-high-single-digit earnings growth with commensurate dividend growth, benefiting from highly visible capital expenditure trajectories and improving regulatory compacts. Utilities are particularly well-positioned in the secular trend of the transition to cleaner energy sources. They stand to benefit from rising demand for renewable energy supply and the subsequent grid infrastructure investment needed to modernize aging networks and absorb the intermittent nature of renewable generation. The majority of the Fund’s utility exposure is in US utility holdings. Jennison |
| | | | |
PGIM Jennison Global Infrastructure Fund | | | 9 | |
Strategy and Performance Overview (continued)
| | prefers domestic utilities as these regulated investment opportunities typically offer higher rates of return than their foreign peers and, in turn, tend to generate better earnings and cash-flow growth, on average. Overall, Jennison continues to favor utilities with solid and sustainable dividend yields and above-average projected earnings and/or dividend growth that are operating in constructive regulatory environments that support timely and attractive returns on capital deployed. Looking beyond US utilities, renewable energy continues to be a dominant theme in the utilities sector—both in the US and abroad—and most of the Fund’s non-US utility exposure is leveraged to the trend toward greater investment in renewable electric generation, specifically in Europe. Jennison believes any project setbacks due to supply chain and/or construction disruptions stemming from COVID-19 will be manageable and should not have a significant impact on long-term shareholder return. |
| | • | | Turning to the Fund’s midstream infrastructure exposure, Jennison consolidated its holdings in companies that it believes are well-positioned to thrive during the COVID-19 crisis and beyond due to their exposure to prolific natural gas basins tied to more visible long-term demand, their focus on North America, and their lack of some geopolitical oil risks. In Jennison’s view, companies with strong balance sheets; integrated asset systems with multiple touchpoints across the entire energy value chain; transparency; and strong environmental, social, and corporate governance metrics with a focus on reducing carbon footprint will continue to fare better going forward. |
| | • | | Lastly, regarding communications infrastructure, Jennison continues to favor wireless towers and datacenter operators. Jennison does not expect any material impact from COVID-19 on tower companies with long-term contracts with wireless operators, which Jennison views to be low counterparty risk. In Europe, Jennison continues to see compelling growth potential through merger-and-acquisition activity in the independent tower sector, along with organic secular growth opportunities. In the data center space, the demand for data has increased during the pandemic as shelter-in-place policies have been imposed. Fundamentally, both industries should also capitalize on exponential data demand growth around the world. |
| | |
| 10 | | Visit our website at pgim.com/investments |
Fees and Expenses (unaudited)
As a shareholder of the Fund, you incur two types of costs: (1) transaction costs, including sales charges (loads) on purchase payments and redemptions, as applicable, and (2) ongoing costs, including management fees, distribution, and/or service (12b-1) fees, and other Fund expenses, as applicable. This example is intended to help you understand your ongoing costs (in dollars) of investing in the Fund and to compare these costs with the ongoing costs of investing in other mutual funds.
The example is based on an investment of $1,000 held through the six-month period ended October 31, 2020. The example is for illustrative purposes only; you should consult the Fund’s Prospectus for information on initial and subsequent minimum investment requirements.
Actual Expenses
The first line for each share class in the table on the following page provides information about actual account values and actual expenses. You may use the information on this line, together with the amount you invested, to estimate the expenses that you paid over the period. Simply divide your account value by $1,000 (for example, an $8,600 account value ÷ $1,000 = 8.6), then multiply the result by the number on the first line under the heading “Expenses Paid During the Six-Month Period” to estimate the expenses you paid on your account during this period.
Hypothetical Example for Comparison Purposes
The second line for each share class in the table on the following page provides information about hypothetical account values and hypothetical expenses based on the Fund’s actual expense ratio and an assumed rate of return of 5% per year before expenses, which is not the Fund’s actual return. The hypothetical account values and expenses may not be used to estimate the actual ending account balance or expenses you paid for the period. You may use this information to compare the ongoing costs of investing in the Fund and other funds. To do so, compare this 5% hypothetical example with the 5% hypothetical examples that appear in the shareholder reports of the other funds.
The Fund’s transfer agent may charge additional fees to holders of certain accounts that are not included in the expenses shown in the table on the following page. These fees apply to individual retirement accounts (IRAs) and Section 403(b) accounts. As of the close of the six-month period covered by the table, IRA fees included an annual maintenance fee of $15 per account (subject to a maximum annual maintenance fee of $25 for all accounts held by the same shareholder). Section 403(b) accounts are charged an annual $25 fiduciary maintenance fee. Some of the fees may vary in amount, or may be waived, based on your total account balance or the number of PGIM funds, including the Fund, that you own. You should consider the additional fees that were charged to your Fund account over the six-month period when you estimate the total ongoing expenses paid over the period
| | | | |
PGIM Jennison Global Infrastructure Fund | | | 11 | |
Fees and Expenses (continued)
and the impact of these fees on your ending account value, as these additional expenses are not reflected in the information provided in the expense table. Additional fees have the effect of reducing investment returns.
Please note that the expenses shown in the table are meant to highlight your ongoing costs only and do not reflect any transactional costs such as sales charges (loads). Therefore, the second line for each share class in the table is useful in comparing ongoing costs only and will not help you determine the relative total costs of owning different funds. In addition, if these transactional costs were included, your costs would have been higher.
| | | | | | | | | | | | | | | | | | |
| | | | |
PGIM
Jennison Global
Infrastructure Fund | | Beginning Account
Value
May 1, 2020 | | | Ending Account
Value
October 31, 2020 | | | Annualized
Expense Ratio
Based on the
Six-Month Period | | | Expenses Paid
During the
Six-Month Period* | |
| Class A | | Actual | | $ | 1,000.00 | | | $ | 1,063.80 | | | | 1.50 | % | | $ | 7.78 | |
| | Hypothetical | | $ | 1,000.00 | | | $ | 1,017.60 | | | | 1.50 | % | | $ | 7.61 | |
| Class C | | Actual | | $ | 1,000.00 | | | $ | 1,059.40 | | | | 2.25 | % | | $ | 11.65 | |
| | Hypothetical | | $ | 1,000.00 | | | $ | 1,013.83 | | | | 2.25 | % | | $ | 11.39 | |
| Class Z | | Actual | | $ | 1,000.00 | | | $ | 1,066.30 | | | | 1.17 | % | | $ | 6.08 | |
| | Hypothetical | | $ | 1,000.00 | | | $ | 1,019.25 | | | | 1.17 | % | | $ | 5.94 | |
| Class R6 | | Actual | | $ | 1,000.00 | | | $ | 1,065.50 | | | | 1.17 | % | | $ | 6.07 | |
| | | Hypothetical | | $ | 1,000.00 | | | $ | 1,019.25 | | | | 1.17 | % | | $ | 5.94 | |
*Fund expenses (net of fee waivers or subsidies, if any) for each share class are equal to the annualized expense ratio for each share class (provided in the table), multiplied by the average account value over the period, multiplied by the 184 days in the six-month period ended October 31, 2020, and divided by the 366 days in the Fund’s fiscal year ended October 31, 2020 (to reflect the six-month period). Expenses presented in the table include the expenses of any underlying portfolios in which the Fund may invest.
| | |
| 12 | | Visit our website at pgim.com/investments |
Schedule of Investments
as of October 31, 2020
| | | | | | | | |
| Description | | Shares | | | Value | |
| | |
LONG-TERM INVESTMENTS 97.6% | | | | | | | | |
| | |
COMMON STOCKS 93.5% | | | | | | | | |
| | |
Australia 7.8% | | | | | | | | |
APA Group | | | 48,878 | | | $ | 359,598 | |
Atlas Arteria Ltd. | | | 195,799 | | | | 773,114 | |
Spark Infrastructure Group | | | 401,316 | | | | 560,812 | |
Sydney Airport | | | 99,287 | | | | 380,389 | |
Transurban Group | | | 71,432 | | | | 671,820 | |
| | | | | | | | |
| | | | | | | 2,745,733 | |
| | |
Brazil 0.9% | | | | | | | | |
Hidrovias do Brasil SA* | | | 318,485 | | | | 328,590 | |
| | |
Canada 4.5% | | | | | | | | |
Canadian National Railway Co. | | | 7,239 | | | | 719,118 | |
Enbridge, Inc. | | | 15,108 | | | | 416,284 | |
TC Energy Corp. | | | 11,592 | | | | 456,267 | |
| | | | | | | | |
| | | | | | | 1,591,669 | |
| | |
China 0.7% | | | | | | | | |
China Tower Corp. Ltd. (Class H Stock), 144A | | | 1,474,316 | | | | 230,761 | |
| | |
Denmark 3.3% | | | | | | | | |
Orsted A/S, 144A | | | 7,212 | | | | 1,144,928 | |
| | |
France 5.6% | | | | | | | | |
Eiffage SA* | | | 9,742 | | | | 707,011 | |
Engie SA* | | | 26,765 | | | | 324,196 | |
Getlink SE* | | | 25,644 | | | | 344,440 | |
Vinci SA | | | 7,277 | | | | 573,927 | |
| | | | | | | | |
| | | | | | | 1,949,574 | |
| | |
Germany 4.6% | | | | | | | | |
RWE AG | | | 43,504 | | | | 1,608,933 | |
| | |
Italy 4.1% | | | | | | | | |
Atlantia SpA* | | | 14,480 | | | | 222,615 | |
Enel SpA | | | 150,755 | | | | 1,201,379 | |
| | | | | | | | |
| | | | | | | 1,423,994 | |
| | |
Mexico 1.2% | | | | | | | | |
Grupo Aeroportuario del Pacifico SAB de CV (Class B Stock) | | | 48,352 | | | | 402,563 | |
See Notes to Financial Statements.
| | | | |
| PGIM Jennison Global Infrastructure Fund | | | 13 | |
Schedule of Investments (continued)
as of October 31, 2020
| | | | | | | | |
| Description | | Shares | | | Value | |
| | |
COMMON STOCKS (Continued) | | | | | | | | |
| | |
Spain 11.4% | | | | | | | | |
Aena SME SA, 144A* | | | 2,382 | | | $ | 320,851 | |
Cellnex Telecom SA, 144A | | | 34,038 | | | | 2,186,825 | |
Ferrovial SA | | | 15,286 | | | | 329,518 | |
Iberdrola SA | | | 98,626 | | | | 1,160,310 | |
| | | | | | | | |
| | | | | | | 3,997,504 | |
| | |
United States 49.4% | | | | | | | | |
Alliant Energy Corp. | | | 10,741 | | | | 593,763 | |
Ameren Corp. | | | 9,318 | | | | 755,876 | |
American Electric Power Co., Inc. | | | 4,515 | | | | 406,034 | |
American Tower Corp., REIT | | | 2,485 | | | | 570,680 | |
American Water Works Co., Inc. | | | 2,608 | | | | 392,530 | |
Cheniere Energy, Inc.* | | | 14,853 | | | | 711,013 | |
Crown Castle International Corp., REIT | | | 4,255 | | | | 664,631 | |
Dominion Energy, Inc. | | | 12,719 | | | | 1,021,844 | |
Duke Energy Corp. | | | 5,914 | | | | 544,739 | |
Edison International | | | 6,880 | | | | 385,555 | |
Equinix, Inc., REIT | | | 1,424 | | | | 1,041,286 | |
Equitrans Midstream Corp. | | | 64,283 | | | | 466,695 | |
Essential Utilities, Inc. | | | 12,806 | | | | 527,607 | |
FirstEnergy Corp. | | | 26,160 | | | | 777,475 | |
NextEra Energy Partners LP | | | 7,424 | | | | 466,227 | |
NextEra Energy, Inc. | | | 29,552 | | | | 2,163,502 | |
Norfolk Southern Corp. | | | 6,119 | | | | 1,279,605 | |
SBA Communications Corp., REIT | | | 2,313 | | | | 671,626 | |
Sempra Energy | | | 5,676 | | | | 711,543 | |
Union Pacific Corp. | | | 8,282 | | | | 1,467,488 | |
Waste Connections, Inc. | | | 8,857 | | | | 879,677 | |
Williams Cos., Inc. (The) | | | 40,231 | | | | 772,033 | |
| | | | | | | | |
| | | | | | | 17,271,429 | |
| | | | | | | | |
TOTAL COMMON STOCKS
(cost $26,019,376) | | | | | | | 32,695,678 | |
| | | | | | | | |
| | |
PREFERRED STOCKS 4.1% | | | | | | | | |
| | |
Canada 2.5% | | | | | | | | |
GFL Environmental, Inc., CVT, 6.000%, Maturity Date
03/15/2023 | | | 17,500 | | | | 868,700 | |
See Notes to Financial Statements.
| | | | | | | | |
| Description | | Shares | | | Value | |
| | |
PREFERRED STOCKS (Continued) | | | | | | | | |
| | |
United States 1.6% | | | | | | | | |
NextEra Energy, Inc., CVT, 6.219%, Maturity Date 09/01/2023* | | | 11,553 | | | $ | 569,910 | |
| | | | | | | | |
| | |
TOTAL PREFERRED STOCKS
(cost $1,456,481) | | | | | | | 1,438,610 | |
| | | | | | | | |
| | |
TOTAL LONG-TERM INVESTMENTS
(cost $27,475,857) | | | | | | | 34,134,288 | |
| | | | | | | | |
| | |
SHORT-TERM INVESTMENT 1.9% | | | | | | | | |
| | |
AFFILIATED MUTUAL FUND | | | | | | | | |
PGIM Core Ultra Short Bond Fund
(cost $665,468)(w) | | | 665,468 | | | | 665,468 | |
| | | | | | | | |
| | |
TOTAL INVESTMENTS 99.5%
(cost $28,141,325) | | | | | | | 34,799,756 | |
Other assets in excess of liabilities 0.5% | | | | | | | 187,323 | |
| | | | | | | | |
| | |
NET ASSETS 100.0% | | | | | | $ | 34,987,079 | |
| | | | | | | | |
Below is a list of the abbreviation(s) used in the annual report:
144A—Security was purchased pursuant to Rule 144A under the Securities Act of 1933 and, pursuant to the requirements of Rule 144A, may not be resold except to qualified institutional buyers.
CVT—Convertible Security
LIBOR—London Interbank Offered Rate
LP—Limited Partnership
REITs—Real Estate Investment Trust
| * | Non-income producing security. |
| (w) | PGIM Investments LLC, the manager of the Series, also serves as manager of the PGIM Core Ultra Short Bond Fund. |
Fair Value Measurements:
Various inputs are used in determining the value of the Series’ investments. These inputs are summarized in the three broad levels listed below.
Level 1—unadjusted quoted prices generally in active markets for identical securities.
Level 2—quoted prices for similar securities, interest rates and yield curves, prepayment speeds, foreign currency exchange rates and other observable inputs.
Level 3—unobservable inputs for securities valued in accordance with Board approved fair valuation procedures.
See Notes to Financial Statements.
| | | | |
| PGIM Jennison Global Infrastructure Fund | | | 15 | |
Schedule of Investments (continued)
as of October 31, 2020
The following is a summary of the inputs used as of October 31, 2020 in valuing such portfolio securities:
| | | | | | | | | | |
| | | Level 1 | | | Level 2 | | | Level 3 |
Investments in Securities | | | | | | | | | | |
Assets | | | | | | | | | | |
| Common Stocks | | | | | | | | | | |
Australia | | $ | — | | | $ | 2,745,733 | | | $— |
Brazil | | | 328,590 | | | | — | | | — |
Canada | | | 1,591,669 | | | | — | | | — |
China | | | — | | | | 230,761 | | | — |
Denmark | | | — | | | | 1,144,928 | | | — |
France | | | — | | | | 1,949,574 | | | — |
Germany | | | — | | | | 1,608,933 | | | — |
Italy | | | — | | | | 1,423,994 | | | — |
Mexico | | | 402,563 | | | | — | | | — |
Spain | | | — | | | | 3,997,504 | | | — |
United States | | | 17,271,429 | | | | — | | | — |
| Preferred Stocks | | | | | | | | | | |
Canada | | | 868,700 | | | | — | | | — |
United States | | | 569,910 | | | | — | | | — |
Affiliated Mutual Fund | | | 665,468 | | | | — | | | — |
| | | | | | | | | | |
Total | | $ | 21,698,329 | | | $ | 13,101,427 | | | $— |
| | | | | | | | | | |
Industry Classification:
The industry classification of investments and other assets in excess of liabilities shown as a percentage of net assets as of October 31, 2020 were as follows (unaudited):
| | | | |
Electric Utilities | | | 27.2 | % |
Multi-Utilities | | | 12.6 | |
Road & Rail | | | 9.9 | |
Transportation Infrastructure | | | 9.0 | |
Equity Real Estate Investment Trusts (REITs) | | | 8.4 | |
Oil, Gas & Consumable Fuels | | | 8.1 | |
Diversified Telecommunication Services | | | 7.0 | |
Commercial Services & Supplies | | | 5.0 | |
Construction & Engineering | | | 4.6 | |
Water Utilities | | | 2.6 | |
| | | | |
Affiliated Mutual Fund | | | 1.9 | % |
Independent Power & Renewable Electricity Producers | | | 1.3 | |
Gas Utilities | | | 1.0 | |
Marine | | | 0.9 | |
| | | | |
| | | 99.5 | |
Other assets in excess of liabilities | | | 0.5 | |
| | | | |
| | | 100.0 | % |
| | | | |
See Notes to Financial Statements.
Statement of Assets and Liabilities
as of October 31, 2020
| | | | |
Assets | | | | |
Investments at value: | | | | |
Unaffiliated investments (cost $27,475,857) | | $ | 34,134,288 | |
Affiliated investments (cost $665,468) | | | 665,468 | |
Receivable for investments sold | | | 327,155 | |
Receivable for Series shares sold | | | 20,313 | |
Tax reclaim receivable | | | 20,240 | |
Dividends receivable | | | 10,072 | |
Prepaid expenses and other assets | | | 8,933 | |
| | | | |
Total Assets | | | 35,186,469 | |
| | | | |
| |
Liabilities | | | | |
Payable for Series shares reacquired | | | 110,536 | |
Audit fee payable | | | 28,001 | |
Custodian and accounting fees payable | | | 25,522 | |
Accrued expenses and other liabilities | | | 15,651 | |
Shareholders’ reports payable | | | 11,652 | |
Distribution fee payable | | | 4,293 | |
Affiliated transfer agent fee payable | | | 1,330 | |
Management fee payable | | | 1,252 | |
Directors’ fees payable | | | 977 | |
Payable for investments purchased | | | 155 | |
Payable to custodian | | | 21 | |
| | | | |
Total Liabilities | | | 199,390 | |
| | | | |
| |
Net Assets | | $ | 34,987,079 | |
| | | | |
| |
| | | | |
Net assets were comprised of: | | | | |
Common stock, at par | | $ | 25,377 | |
Paid-in capital in excess of par | | | 29,031,318 | |
Total distributable earnings (loss) | | | 5,930,384 | |
| | | | |
Net assets, October 31, 2020 | | $ | 34,987,079 | |
| | | | |
See Notes to Financial Statements.
| | | | |
| PGIM Jennison Global Infrastructure Fund | | | 17 | |
Statement of Assets and Liabilities
as of October 31, 2020
| | | | |
Class A | | | | |
Net asset value and redemption price per share,
($ 5,960,957 ÷ 431,985 shares of common stock issued and outstanding) | | $ | 13.80 | |
Maximum sales charge (5.50% of offering price) | | | 0.80 | |
| | | | |
Maximum offering price to public | | $ | 14.60 | |
| | | | |
| |
Class C | | | | |
Net asset value, offering price and redemption price per share,
($ 3,242,279 ÷ 237,827 shares of common stock issued and outstanding) | | $ | 13.63 | |
| | | | |
| |
Class Z | | | | |
Net asset value, offering price and redemption price per share,
($ 20,148,056 ÷ 1,459,517 shares of common stock issued and outstanding) | | $ | 13.80 | |
| | | | |
| |
Class R6 | | | | |
Net asset value, offering price and redemption price per share,
($ 5,635,787 ÷ 408,359 shares of common stock issued and outstanding) | | $ | 13.80 | |
| | | | |
See Notes to Financial Statements.
Statement of Operations
Year Ended October 31, 2020
| | | | |
Net Investment Income (Loss) | | | | |
Income | | | | |
Unaffiliated dividend income (net of $55,132 foreign withholding tax) | | $ | 972,897 | |
Affiliated dividend income | | | 8,521 | |
Income from securities lending, net (including affiliated income of $53) | | | 177 | |
| | | | |
Total income | | | 981,595 | |
| | | | |
| |
Expenses | | | | |
Management fee | | | 402,427 | |
Distribution fee(a) | | | 58,286 | |
Custodian and accounting fees | | | 83,463 | |
Registration fees(a) | | | 66,919 | |
Transfer agent’s fees and expenses (including affiliated expense of $10,460)(a) | | | 44,518 | |
Audit fee | | | 28,163 | |
Shareholders’ reports | | | 22,265 | |
Legal fees and expenses | | | 19,273 | |
Directors’ fees | | | 11,127 | |
Miscellaneous | | | 20,667 | |
| | | | |
Total expenses | | | 757,108 | |
Less: Fee waiver and/or expense reimbursement(a) | | | (218,749 | ) |
Distribution fee waiver(a) | | | (3,429 | ) |
| | | | |
Net expenses | | | 534,930 | |
| | | | |
Net investment income (loss) | | | 446,665 | |
| | | | |
| |
Realized And Unrealized Gain (Loss) On Investment And Foreign Currency Transactions | | | | |
Net realized gain (loss) on: | | | | |
Investment transactions (including affiliated of $(17)) | | | 662,271 | |
Foreign currency transactions | | | (12,939 | ) |
| | | | |
| | | 649,332 | |
| | | | |
Net change in unrealized appreciation (depreciation) on: | | | | |
Investments | | | (3,572,114 | ) |
Foreign currencies | | | 2,062 | |
| | | | |
| | | (3,570,052 | ) |
| | | | |
Net gain (loss) on investment and foreign currency transactions | | | (2,920,720 | ) |
| | | | |
Net Increase (Decrease) In Net Assets Resulting From Operations | | $ | (2,474,055 | ) |
| | | | |
| (a) | Class specific expenses and waivers were as follows: |
| | | | | | | | | | | | | | | | | | | | |
| | | Class A | | Class C | | Class Z | | Class R6 |
Distribution fee | | | | 20,575 | | | | | 37,711 | | | | | — | | | | | — | |
Registration fees | | | | 16,470 | | | | | 16,470 | | | | | 16,469 | | | | | 17,510 | |
Transfer agent’s fees and expenses | | | | 13,601 | | | | | 5,868 | | | | | 24,959 | | | | | 90 | |
Fee waiver and/or expense reimbursement | | | | (44,359 | ) | | | | (30,218 | ) | | | | (102,477 | ) | | | | (41,695 | ) |
Distribution fee waiver | | | | (3,429 | ) | | | | — | | | | | — | | | | | — | |
See Notes to Financial Statements.
| | | | |
| PGIM Jennison Global Infrastructure Fund | | | 19 | |
Statements of Changes in Net Assets
| | | | | | | | |
| |
| | | Year Ended
October 31, | |
| | |
| | | 2020 | | | 2019 | |
| | |
Increase (Decrease) in Net Assets | | | | | | | | |
Operations | | | | | | | | |
Net investment income (loss) | | $ | 446,665 | | | $ | 721,693 | |
Net realized gain (loss) on investment and foreign currency transactions | | | 649,332 | | | | 3,320,407 | |
Net change in unrealized appreciation (depreciation) on investments and foreign currencies | | | (3,570,052 | ) | | | 5,353,721 | |
| | | | | | | | |
Net increase (decrease) in net assets resulting from operations | | | (2,474,055 | ) | | | 9,395,821 | |
| | | | | | | | |
| | |
Dividends and Distributions | | | | | | | | |
Distributions from distributable earnings | | | | | | | | |
Class A | | | (61,847 | ) | | | (117,355 | ) |
Class C | | | (15,905 | ) | | | (40,973 | ) |
Class Z | | | (253,973 | ) | | | (388,838 | ) |
Class R6 | | | (102,001 | ) | | | (263,857 | ) |
| | | | | | | | |
| | | (433,726 | ) | | | (811,023 | ) |
| | | | | | | | |
Tax return of capital distributions | | | | | | | | |
Class A | | | (6,071 | ) | | | (6,757 | ) |
Class C | | | (1,561 | ) | | | (2,359 | ) |
Class Z | | | (24,932 | ) | | | (22,389 | ) |
Class R6 | | | (10,013 | ) | | | (15,193 | ) |
| | | | | | | | |
| | | (42,577 | ) | | | (46,698 | ) |
| | | | | | | | |
| | |
Series share transactions (Net of share conversions) | | | | | | | | |
Net proceeds from shares sold | | | 7,990,286 | | | | 7,794,683 | |
Net asset value of shares issued in reinvestment of dividends and distributions | | | 473,968 | | | | 852,911 | |
Cost of shares reacquired | | | (16,121,559 | ) | | | (20,811,750 | ) |
| | | | | | | | |
Net increase (decrease) in net assets from Series share transactions | | | (7,657,305 | ) | | | (12,164,156 | ) |
| | | | | | | | |
Total increase (decrease) | | | (10,607,663 | ) | | | (3,626,056 | ) |
| | |
Net Assets: | | | | | | | | |
Beginning of year | | | 45,594,742 | | | | 49,220,798 | |
| | | | | | | | |
End of year | | $ | 34,987,079 | | | $ | 45,594,742 | |
| | | | | | | | |
See Notes to Financial Statements.
Notes to Financial Statements
Prudential World Fund, Inc. (the “Fund”) is registered under the Investment Company Act of 1940, as amended (“1940 Act”), as an open-end management investment company and currently consists of seven series: PGIM Jennison Emerging Markets Equity Opportunities Fund, PGIM Jennison Global Infrastructure Fund, PGIM Jennison Global Opportunities Fund, PGIM Jennison International Opportunities Fund and PGIM QMA International Equity Fund, each of which are diversified funds for purposes of the 1940 Act and PGIM Emerging Markets Debt Hard Currency Fund and PGIM Emerging Markets Debt Local Currency Fund, each of which are non-diversified funds for purposes of the 1940 Act, and therefore, may invest a greater percentage of their assets in the securities of a single company or other issuer than a diversified fund. Investing in a non-diversified fund involves greater risk than investing in a diversified fund because a loss resulting from the decline in value of any one security may represent a greater portion of the total assets of a non-diversified fund. These financial statements relate only to the PGIM Jennison Global Infrastructure Fund (the “Series”).
The investment objective of the Series is to seek total return.
The Series follows the investment company accounting and reporting guidance of the Financial Accounting Standards Board (“FASB”) Accounting Standard Codification (“ASC”) Topic 946 Financial Services — Investment Companies. The following accounting policies conform to U.S. generally accepted accounting principles. The Series consistently follows such policies in the preparation of its financial statements.
Securities Valuation: The Series holds securities and other assets and liabilities that are fair valued at the close of each day (generally, 4:00 PM Eastern time) the New York Stock Exchange (“NYSE”) is open for trading. Fair value is the price that would be received to sell an asset or paid to transfer a liability in an orderly transaction between market participants on the measurement date. The Fund’s Board of Directors (the “Board”) has adopted valuation procedures for security valuation under which fair valuation responsibilities have been delegated to PGIM Investments LLC (“PGIM Investments” or the “Manager”). Pursuant to the Board’s delegation, the Manager has established a Valuation Committee responsible for supervising the fair valuation of portfolio securities and other assets and liabilities. The valuation procedures permit the Series to utilize independent pricing vendor services, quotations from market makers, and alternative valuation methods when market quotations are either not readily available or not deemed representative of fair value. A record of the Valuation Committee’s actions is subject to the Board’s review, approval, and ratification at its next regularly scheduled quarterly meeting.
| | | | |
| PGIM Jennison Global Infrastructure Fund | | | 21 | |
Notes to Financial Statements (continued)
For the fiscal reporting year-end, securities and other assets and liabilities were fair valued at the close of the last U.S. business day. Trading in certain foreign securities may occur when the NYSE is closed (including weekends and holidays). Because such foreign securities trade in markets that are open on weekends and U.S. holidays, the values of some of the Series’ foreign investments may change on days when investors cannot purchase or redeem Series shares.
Various inputs determine how the Series’ investments are valued, all of which are categorized according to the three broad levels (Level 1, 2, or 3) detailed in the Schedule of Investments and referred to herein as the “fair value hierarchy” in accordance with FASB ASC Topic 820 - Fair Value Measurements and Disclosures.
Common or preferred stocks, exchange-traded funds and derivative instruments, if applicable, that are traded on a national securities exchange are valued at the last sale price as of the close of trading on the applicable exchange where the security principally trades. Securities traded via NASDAQ are valued at the NASDAQ official closing price. To the extent these securities are valued at the last sale price or NASDAQ official closing price, they are classified as Level 1 in the fair value hierarchy. In the event that no sale or official closing price on valuation date exists, these securities are generally valued at the mean between the last reported bid and ask prices, or at the last bid price in the absence of an ask price. These securities are classified as Level 2 in the fair value hierarchy.
Foreign equities traded on foreign securities exchanges are generally valued using pricing vendor services that provide model prices derived using adjustment factors based on information such as local closing price, relevant general and sector indices, currency fluctuations, depositary receipts, and futures, as applicable. Securities valued using such model prices are classified as Level 2 in the fair value hierarchy. The models generate an evaluated adjustment factor for each security, which is applied to the local closing price to adjust it for post closing market movements up to the time the Series is valued. Utilizing that evaluated adjustment factor, the vendor provides an evaluated price for each security. If the vendor does not provide an evaluated price, securities are valued in accordance with exchange-traded common and preferred stock valuation policies discussed above.
Investments in open-end funds (other than exchange-traded funds) are valued at their net asset values as of the close of the NYSE on the date of valuation. These securities are classified as Level 1 in the fair value hierarchy since they may be purchased or sold at their net asset values on the date of valuation.
Securities and other assets that cannot be priced according to the methods described above are valued based on pricing methodologies approved by the Board. In the event that
unobservable inputs are used when determining such valuations, the securities will be classified as Level 3 in the fair value hierarchy.
When determining the fair value of securities, some of the factors influencing the valuation include: the nature of any restrictions on disposition of the securities; assessment of the general liquidity of the securities; the issuer’s financial condition and the markets in which it does business; the cost of the investment; the size of the holding and the capitalization of the issuer; the prices of any recent transactions or bids/offers for such securities or any comparable securities; any available analyst media or other reports or information deemed reliable by the Manager regarding the issuer or the markets or industry in which it operates. Using fair value to price securities may result in a value that is different from a security’s most recent closing price and from the price used by other unaffiliated mutual funds to calculate their net asset values.
Foreign Currency Translation: The books and records of the Series are maintained in U.S. dollars. Foreign currency amounts are translated into U.S. dollars on the following basis:
(i) market value of investment securities, other assets and liabilities — at the current rates of exchange;
(ii) purchases and sales of investment securities, income and expenses — at the rates of exchange prevailing on the respective dates of such transactions.
Although the net assets of the Series are presented at the foreign exchange rates and market values at the close of the period, the Series does not generally isolate that portion of the results of operations arising as a result of changes in the foreign exchange rates from the fluctuations arising from changes in the market prices of long-term portfolio securities held at the end of the period. Similarly, the Series does not isolate the effect of changes in foreign exchange rates from the fluctuations arising from changes in the market prices of long-term portfolio securities sold during the period. Accordingly, holding period realized foreign currency gains (losses) are included in the reported net realized gains (losses) on investment transactions.
Net realized gains (losses) on foreign currency transactions represent net foreign exchange gains (losses) from the disposition of holdings of foreign currencies, currency gains (losses) realized between the trade and settlement dates on investment transactions, and the difference between the amounts of interest, dividends and foreign withholding taxes recorded on the Series’ books and the U.S. dollar equivalent amounts actually received or paid. Net unrealized currency gains (losses) arise from valuing foreign currency denominated assets and liabilities (other than investments) at period end exchange rates.
Master Netting Arrangements: The Fund, on behalf of the Series, is subject to various Master Agreements, or netting arrangements, with select counterparties. These are agreements which a subadviser may have negotiated and entered into on behalf of all or a portion of the Series. A master netting arrangement between the Series and the counterparty
| | | | |
| PGIM Jennison Global Infrastructure Fund | | | 23 | |
Notes to Financial Statements (continued)
permits the Series to offset amounts payable by the Series to the same counterparty against amounts to be received; and by the receipt of collateral from the counterparty by the Series to cover the Series’ exposure to the counterparty. However, there is no assurance that such mitigating factors are easily enforceable. In addition to master netting arrangements, the right to set-off exists when all the conditions are met such that each of the parties owes the other determinable amounts, the reporting party has the right to set-off the amount owed with the amount owed by the other party, the reporting party intends to set-off and the right of set-off is enforceable by law. During the reporting period, there was no intention to settle on a net basis and all amounts are presented on a gross basis on the Statement of Assets and Liabilities.
Securities Lending: The Series lends its portfolio securities to banks and broker-dealers. The loans are secured by collateral at least equal to the market value of the securities loaned. Collateral pledged by each borrower is invested in an affiliated money market fund and is marked to market daily, based on the previous day’s market value, such that the value of the collateral exceeds the value of the loaned securities. In the event of significant appreciation in value of securities on loan on the last business day of the reporting period, the financial statements may reflect a collateral value that is less than the market value of the loaned securities. Such shortfall is remedied as described above. Loans are subject to termination at the option of the borrower or the Series. Upon termination of the loan, the borrower will return to the Series securities identical to the loaned securities. Should the borrower of the securities fail financially, the Series has the right to repurchase the securities in the open market using the collateral.
The Series recognizes income, net of any rebate and securities lending agent fees, for lending its securities in the form of fees or interest on the investment of any cash received as collateral. The borrower receives all interest and dividends from the securities loaned and such payments are passed back to the lender in amounts equivalent thereto, which are reflected in interest income or unaffiliated dividend income based upon the nature of the payment on the Statement of Operations. The Series also continues to recognize any unrealized gain (loss) in the market price of the securities loaned and on the change in the value of the collateral invested that may occur during the term of the loan. In addition, realized gain (loss) is recognized on changes in the value of the collateral invested upon liquidation of the collateral. Net earnings from securities lending are disclosed in the Statement of Operations.
Equity and Mortgage Real Estate Investment Trusts (collectively equity REITs): The Series invested in equity REITs, which report information on the source of their distributions annually. Based on current and historical information, a portion of distributions received from equity REITs during the period is estimated to be dividend income, capital gain or
return of capital and recorded accordingly. When material, these estimates are adjusted periodically when the actual source of distributions is disclosed by the equity REITs.
Securities Transactions and Net Investment Income: Securities transactions are recorded on the trade date. Realized gains (losses) from investment and currency transactions are calculated on the specific identification method. Dividend income is recorded on the ex-date, or for certain foreign securities, when the Series becomes aware of such dividends. Expenses are recorded on an accrual basis, which may require the use of certain estimates by management that may differ from actual. Net investment income or loss (other than class specific expenses and waivers, which are allocated as noted below) and unrealized and realized gains (losses) are allocated daily to each class of shares based upon the relative proportion of adjusted net assets of each class at the beginning of the day. Class specific expenses and waivers, where applicable, are charged to the respective share classes. Class specific expenses include distribution fees and distribution fee waivers, shareholder servicing fees, transfer agent’s fees and expenses, registration fees and fee waivers and/or expense reimbursements, as applicable.
Taxes: It is the Series’ policy to continue to meet the requirements of the Internal Revenue Code applicable to regulated investment companies and to distribute all of its taxable net investment income and capital gains, if any, to its shareholders. Therefore, no federal income tax provision is required. Withholding taxes on foreign dividends, interest and capital gains, if any, are recorded, net of reclaimable amounts, at the time the related income is earned.
Dividends and Distributions: The Series expects to pay dividends from net investment income quarterly. Distributions from net realized capital and currency gains, if any, are declared and paid annually. Dividends and distributions to shareholders, which are determined in accordance with federal income tax regulations and which may differ from generally accepted accounting principles, are recorded on the ex-date. Permanent book/tax differences relating to income and gain (loss) are reclassified between total distributable earnings (loss) and paid-in capital in excess of par, as appropriate.
Estimates: The preparation of financial statements requires management to make estimates and assumptions that affect the reported amounts and disclosures in the financial statements. Actual results could differ from those estimates.
The Fund, on behalf of the Series, has a management agreement with the Manager. Pursuant to this agreement, the Manager has responsibility for all investment advisory services and supervises the subadviser’s performance of such services. In addition, under the management agreement, the Manager provides all of the administrative functions necessary for the organization, operation and management of the Series. The Manager administers the corporate affairs of the Series and, in connection therewith, furnishes the Series with office facilities, together with those ordinary clerical and bookkeeping services
| | | | |
| PGIM Jennison Global Infrastructure Fund | | | 25 | |
Notes to Financial Statements (continued)
which are not being furnished by the Series’ custodian and the Series’ transfer agent. The Manager is also responsible for the staffing and management of dedicated groups of legal, marketing, compliance and related personnel necessary for the operation of the Series. The legal, marketing, compliance and related personnel are also responsible for the management and oversight of the various service providers to the Series, including, but not limited to, the custodian, transfer agent, and accounting agent.
The Manager has entered into a subadvisory agreement with Jennison Associates LLC (“Jennison”). The subadvisory agreement provides that Jennison will furnish investment advisory services in connection with the management of the Series. In connection therewith, Jennison is obligated to keep certain books and records of the Series. The Manager pays for the services of Jennison, the cost of compensation of officers of the Series, occupancy and certain clerical and bookkeeping costs of the Series. The Series bears all other costs and expenses.
The management fee paid to the Manager is accrued daily and payable monthly at an annual rate of 1.00% of the Series’ average daily net assets up to $1 billion, 0.98% of the next $2 billion, 0.96% of the next $2 billion, 0.95% of the next $5 billion and 0.94% of the Series’ average daily net assets in excess of $10 billion. The effective management fee rate before any waivers and/or expense reimbursements was 1.00% for the year ended October 31, 2020.
The Manager has contractually agreed, through February 28, 2022, to limit total annual operating expenses after fee waivers and/or expense reimbursements to 1.50% of average daily net assets for Class A shares, 2.25% of average daily net assets for Class C shares, 1.17% of average daily net assets for Class Z shares and 1.17% of average daily net assets for Class R6 shares. This contractual waiver excludes interest, brokerage, taxes (such as income and foreign withholding taxes, stamp duty and deferred tax expenses), acquired fund fees and expenses, extraordinary expenses, and certain other Series expenses such as dividend and interest expense and broker charges on short sales.
Where applicable, the Manager agrees to waive management fees or shared operating expenses on any share class to the same extent that it waives similar expenses on any other share class. In addition, total annual operating expenses for Class R6 shares will not exceed total annual operating expenses for Class Z shares. Fees and/or expenses waived and/or reimbursed by the Manager may be recouped by the Manager within the same fiscal year during which such waiver and/or reimbursement is made if such recoupment can be realized without exceeding the expense limit in effect at the time of the recoupment for the fiscal year.
The Fund, on behalf of the Series, has a distribution agreement with Prudential Investment Management Services LLC (“PIMS”), which acts as the distributor of the Class A, Class C, Class Z and Class R6 shares of the Series. The Series compensates PIMS for distributing and servicing the Series’ Class A and Class C shares, pursuant to the plans of distribution (the “Distribution Plans”), regardless of expenses actually incurred by PIMS. The distribution fees are accrued daily and payable monthly. No distribution or service fees are paid to PIMS as distributor of the Class Z and Class R6 shares of the Series.
Pursuant to the Distribution Plans, the Series compensates PIMS for distribution related activities at an annual rate of up to 0.30%, and 1% of the average daily net assets of the Class A and Class C shares, respectively. PIMS has contractually agreed through February 28, 2022 to limit such fees to 0.25% of the average daily net assets of the Class A shares.
For the year ended October 31, 2020, PIMS received $11,493 in front-end sales charges resulting from sales of Class A shares. Additionally, for the year ended October 31, 2020, PIMS received $16 in contingent deferred sales charges imposed upon redemptions by certain Class C shareholders. From these fees, PIMS paid such sales charges to broker-dealers, who in turn paid commissions to salespersons and incurred other distribution costs.
PGIM Investments, PIMS and Jennison are indirect, wholly-owned subsidiaries of Prudential Financial, Inc. (“Prudential”).
| 4. | Other Transactions with Affiliates |
Prudential Mutual Fund Services LLC (“PMFS”), an affiliate of PGIM Investments and an indirect, wholly-owned subsidiary of Prudential, serves as the Series’ transfer agent. Transfer agent’s fees and expenses in the Statement of Operations include certain out-of-pocket expenses paid to non-affiliates, where applicable.
The Series may invest its overnight sweep cash in the PGIM Core Ultra Short Bond Fund (the “Core Fund”), and its securities lending cash collateral in the PGIM Institutional Money Market Fund (the “Money Market Fund”), each a series of Prudential Investment Portfolios 2, registered under the 1940 Act and managed by PGIM Investments Through the Series’ investments in the mentioned underlying funds, PGIM Investments and/or its affiliates are paid fees or reimbursed for providing their services. In addition to the realized and unrealized gains on investments in the Core Fund, earnings from such investments are disclosed on the Statement of Operations as “Affiliated dividend income”and “Income from securities lending, net”, respectively.
The Series may enter into certain securities purchase or sale transactions under Board approved Rule 17a-7 procedures. Rule 17a-7 is an exemptive rule under the 1940 Act, that subject to certain conditions, permits purchase and sale transactions among affiliated investment companies, or between an investment company and a person that is affiliated
| | | | |
| PGIM Jennison Global Infrastructure Fund | | | 27 | |
Notes to Financial Statements (continued)
solely by reason of having a common (or affiliated) investment adviser, common directors, and/or common officers. Pursuant to the Rule 17a-7 procedures and consistent with guidance issued by the Securities and Exchange Commission (“SEC”), the Fund’s Chief Compliance Officer (“CCO”) prepares a quarterly summary of all such transactions for submission to the Board, together with the CCO’s written representation that all such 17a-7 transactions were effected in accordance with the Series’ Rule 17a-7 procedures. For the year ended October 31, 2020, no 17a-7 transactions were entered into by the Series.
The aggregate cost of purchases and proceeds from sales of portfolio securities (excluding short-term investments and U.S. Government securities) for the year ended October 31, 2020, were $24,350,091 and $32,595,204, respectively.
A summary of the cost of purchases and proceeds from sales of shares of affiliated investments for the year ended October 31, 2020, is presented as follows:
| | | | | | | | | | | | | | | | | | | | | | | | | | | | | | |
Value,
Beginning of Year | | | Cost of
Purchases | | | Proceeds
from Sales | | | Change in
Unrealized
Gain
(Loss) | | | Realized
Gain
(Loss) | | | Value,
End of Year | | | Shares,
End
of Year | | | Income | |
| | | | |
| | PGIM Core Ultra Short Bond Fund* | | | | | | | | | | | | | | | | | |
| | $598,186 | | | $ | 21,865,436 | | | $ | 21,798,154 | | | $ | — | | | $ | — | | | $ | 665,468 | | | | 665,468 | | | $ | 8,521 | |
| | | | |
| | PGIM Institutional Money Market Fund* | | | | | | | | | | | | | | | | | |
| | — | | | | 1,306,526 | | | | 1,306,509 | | | | — | | | | (17 | ) | | | — | | | | — | | | | 53 | ** |
| | | | | | | | | | | | | | | | | | | | | | | | | | | | | | |
| | $598,186 | | | $ | 23,171,962 | | | $ | 23,104,663 | | | $ | — | | | $ | (17 | ) | | $ | 665,468 | | | | | | | $ | 8,574 | |
| | | | | | | | | | | | | | | | | | | | | | | | | | | | | | |
| * | The Fund did not have any capital gain distributions during the reporting period. |
| ** | The amount, or a portion thereof, represents the affiliated securities lending income shown on the Statement of Operations. |
| 6. | Distributions and Tax Information |
Distributions to shareholders, which are determined in accordance with federal income tax regulations and which may differ from generally accepted accounting principles, are recorded on the ex-date.
For the year ended October 31, 2020, the tax character of dividends paid by the Series were $433,726 of ordinary income and $42,577 of tax return of capital. For the year ended October 31, 2019, the tax character of dividends paid by the Series were $811,023 of ordinary income and $46,698 of tax return of capital.
As of October 31, 2020, there were no accumulated undistributed earnings on a tax basis.
The United States federal income tax basis of the Series’ investments and the net unrealized appreciation as of October 31, 2020 were as follows:
| | | | | | |
| Tax Basis | | Gross Unrealized Appreciation | | Gross Unrealized Depreciation | | Net Unrealized Appreciation |
| $28,351,584 | | $7,644,186 | | $(1,196,014) | | $6,448,172 |
The difference between book basis and tax basis was primarily due to deferred losses on wash sales.
For federal income tax purposes, the Series had a capital loss carryforward as of October 31, 2020 of approximately $518,000, which can be carried forward for an unlimited period. The Series utilized approximately $751,000 of its capital loss carryforward to offset net taxable gains realized in the fiscal year ended October 31, 2020. No capital gains distributions are expected to be paid to shareholders until net gains have been realized in excess of such losses.
The Manager has analyzed the Series’ tax positions taken on federal, state and local income tax returns for all open tax years and has concluded that no provision for income tax is required in the Series’ financial statements for the current reporting period. Since tax authorities can examine previously filed tax returns, the Series’ U.S. federal and state tax returns for each of the four fiscal years up to the most recent fiscal year ended October 31, 2020 are subject to such review.
The Series offers Class A, Class C, Class Z and Class R6 shares. Class A shares are sold with a maximum front-end sales charge of 5.50%. Investors who purchase $1 million or more of Class A shares and sell these shares within 12 months of purchase are subject to a contingent deferred sales charge (“CDSC”) of 1%, although they are not subject to an initial sales charge. The Class A CDSC is waived for certain retirement and/or benefit plans. A special exchange privilege is also available for shareholders who qualified to purchase Class A shares at net asset value. Class C shares are sold with a CDSC of 1% on sales made within 12 months of purchase. Class C shares will automatically convert to Class A shares on a monthly basis approximately 10 years after purchase. Class Z and Class R6 shares are not subject to any sales or redemption charges and are available exclusively for sale to a limited group of investors.
Under certain circumstances, an exchange may be made from specified share classes of the Series to one or more other share classes of the Series as presented in the table of transactions in shares of common stock, below.
| | | | |
| PGIM Jennison Global Infrastructure Fund | | | 29 | |
Notes to Financial Statements (continued)
The Fund is authorized to issue 5.075 billion shares of common stock, with a par value of $0.01 per share, which is divided into seven series. There are 510 million shares authorized for the Series, divided into five classes as follows:
| | | | |
Class A | | | 20,000,000 | |
Class C | | | 100,000,000 | |
Class Z | | | 150,000,000 | |
Class T | | | 115,000,000 | |
Class R6 | | | 125,000,000 | |
The Series currently does not have any Class T shares outstanding.
As of October 31, 2020, Prudential, through its affiliated entities, including affiliated funds (if applicable), owned shares of the Series as follows:
| | | | |
| | | Number of Shares | | Percentage of
Outstanding Shares |
Class Z | | 556,822 | | 38.2% |
Class R6 | | 405,510 | | 99.3% |
At the reporting period end, the number of shareholders holding greater than 5% of the Series are as follows:
| | | | | | |
| Affiliated | | Unaffiliated |
Number of
Shareholders | | Percentage of
Outstanding Shares | | Number of
Shareholders | | Percentage of
Outstanding Shares |
2 | | 38.0% | | 3 | | 42.3% |
Transactions in shares of common stock were as follows:
| | | | | | | | |
Class A | | Shares | | | Amount | |
Year ended October 31, 2020: | | | | | | | | |
Shares sold | | | 40,098 | | | $ | 569,464 | |
Shares issued in reinvestment of dividends and distributions | | | 4,619 | | | | 67,705 | |
Shares reacquired | | | (137,855 | ) | | | (1,881,572 | ) |
| | | | | | | | |
Net increase (decrease) in shares outstanding before conversion | | | (93,138 | ) | | | (1,244,403 | ) |
Shares issued upon conversion from other share class(es) | | | 4,972 | | | | 68,903 | |
Shares reacquired upon conversion into other share class(es) | | | (878 | ) | | | (13,161 | ) |
| | | | | | | | |
Net increase (decrease) in shares outstanding | | | (89,044 | ) | | $ | (1,188,661 | ) |
| | | | | | | | |
Year ended October 31, 2019: | | | | | | | | |
Shares sold | | | 47,121 | | | $ | 656,918 | |
Shares issued in reinvestment of dividends and distributions | | | 9,224 | | | | 123,554 | |
Shares reacquired | | | (168,355 | ) | | | (2,251,714 | ) |
| | | | | | | | |
Net increase (decrease) in shares outstanding before conversion | | | (112,010 | ) | | | (1,471,242 | ) |
Shares issued upon conversion from other share class(es) | | | 8,917 | | | | 124,418 | |
Shares reacquired upon conversion into other share class(es) | | | (36,937 | ) | | | (502,336 | ) |
| | | | | | | | |
Net increase (decrease) in shares outstanding | | | (140,030 | ) | | $ | (1,849,160 | ) |
| | | | | | | | |
| | | | | | | | |
Class C | | Shares | | | Amount | |
Year ended October 31, 2020: | | | | | | | | |
Shares sold | | | 6,868 | | | $ | 98,374 | |
Shares issued in reinvestment of dividends and distributions | | | 1,083 | | | | 15,727 | |
Shares reacquired | | | (48,016 | ) | | | (671,692 | ) |
| | | | | | | | |
Net increase (decrease) in shares outstanding before conversion | | | (40,065 | ) | | | (557,591 | ) |
Shares reacquired upon conversion into other share class(es) | | | (7,028 | ) | | | (100,339 | ) |
| | | | | | | | |
Net increase (decrease) in shares outstanding | | | (47,093 | ) | | $ | (657,930 | ) |
| | | | | | | | |
Year ended October 31, 2019: | | | | | | | | |
Shares sold | | | 20,243 | | | $ | 257,217 | |
Shares issued in reinvestment of dividends and distributions | | | 2,966 | | | | 39,509 | |
Shares reacquired | | | (60,723 | ) | | | (790,603 | ) |
| | | | | | | | |
Net increase (decrease) in shares outstanding before conversion | | | (37,514 | ) | | | (493,877 | ) |
Shares reacquired upon conversion into other share class(es) | | | (21,090 | ) | | | (289,346 | ) |
| | | | | | | | |
Net increase (decrease) in shares outstanding | | | (58,604 | ) | | $ | (783,223 | ) |
| | | | | | | | |
Class Z | | | | | | |
Year ended October 31, 2020: | | | | | | | | |
Shares sold | | | 246,053 | | | $ | 3,526,924 | |
Shares issued in reinvestment of dividends and distributions | | | 19,133 | | | | 278,522 | |
Shares reacquired | | | (299,875 | ) | | | (4,159,893 | ) |
| | | | | | | | |
Net increase (decrease) in shares outstanding before conversion | | | (34,689 | ) | | | (354,447 | ) |
Shares issued upon conversion from other share class(es) | | | 2,853 | | | | 44,597 | |
| | | | | | | | |
Net increase (decrease) in shares outstanding | | | (31,836 | ) | | $ | (309,850 | ) |
| | | | | | | | |
Year ended October 31, 2019: | | | | | | | | |
Shares sold | | | 82,330 | | | $ | 1,114,151 | |
Shares issued in reinvestment of dividends and distributions | | | 30,480 | | | | 410,798 | |
Shares reacquired | | | (559,502 | ) | | | (7,329,772 | ) |
| | | | | | | | |
Net increase (decrease) in shares outstanding before conversion | | | (446,692 | ) | | | (5,804,823 | ) |
Shares issued upon conversion from other share class(es) | | | 49,142 | | | | 670,622 | |
Shares reacquired upon conversion into other share class(es) | | | (232 | ) | | | (3,358 | ) |
| | | | | | | | |
Net increase (decrease) in shares outstanding | | | (397,782 | ) | | $ | (5,137,559 | ) |
| | | | | | | | |
Class R6 | | | | | | |
Year ended October 31, 2020: | | | | | | | | |
Shares sold | | | 261,907 | | | $ | 3,795,524 | |
Shares issued in reinvestment of dividends and distributions | | | 7,666 | | | | 112,014 | |
Shares reacquired | | | (676,564 | ) | | | (9,408,402 | ) |
| | | | | | | | |
Net increase (decrease) in shares outstanding | | | (406,991 | ) | | $ | (5,500,864 | ) |
| | | | | | | | |
Year ended October 31, 2019: | | | | | | | | |
Shares sold | | | 436,752 | | | $ | 5,766,397 | |
Shares issued in reinvestment of dividends and distributions | | | 20,791 | | | | 279,050 | |
Shares reacquired | | | (781,357 | ) | | | (10,439,661 | ) |
| | | | | | | | |
Net increase (decrease) in shares outstanding | | | (323,814 | ) | | $ | (4,394,214 | ) |
| | | | | | | | |
The Fund, on behalf of the Series, along with other affiliated registered investment companies (the “Participating Funds”), is a party to a Syndicated Credit Agreement (“SCA”) with a group of banks. The purpose of the SCA is to provide an alternative source of
| | | | |
| PGIM Jennison Global Infrastructure Fund | | | 31 | |
Notes to Financial Statements (continued)
temporary funding for capital share redemptions. The table below provides details of the current SCA in effect at the reporting period-end as well as the prior SCA.
| | | | |
| | | Current SCA | | Prior SCA |
Term of Commitment | | 10/2/2020 – 9/30/2021 | | 10/3/2019 – 10/1/2020 |
Total Commitment | | $ 1,200,000,000 | | $ 1,222,500,000* |
| Annualized Commitment Fee on the Unused Portion of the SCA | | 0.15% | | 0.15% |
| Annualized Interest Rate on Borrowings | | 1.30% plus the higher of (1) the effective federal funds rate, (2) the one-month LIBOR rate or (3) zero percent | | 1.20% plus the higher of (1) the effective federal funds rate, (2) the one-month LIBOR rate or (3) zero percent |
| * Effective March 31, 2020, the SCA’s total commitment was increased from $900,000,000 to $1,162,500,000 and subsequently, effective April 7, 2020 was increased to $1,222,500,000. |
Certain affiliated registered investment companies that are parties to the SCA include portfolios that are subject to a predetermined mathematical formula used to manage certain benefit guarantees offered under variable annuity contracts. The formula may result in large scale asset flows into and out of these portfolios. Consequently, these portfolios may be more likely to utilize the SCA for purposes of funding redemptions. It may be possible for those portfolios to fully exhaust the committed amount of the SCA, thereby requiring the Manager to allocate available funding per a Board-approved methodology designed to treat the Participating Funds in the SCA equitably.
The Series utilized the SCA during the year ended October 31, 2020. The average daily balance for the 14 days that the Series had loans outstanding during the period was approximately $871,214, borrowed at a weighted average interest rate of 2.16%. The maximum loan outstanding amount during the period was $1,762,000. At October 31, 2020, the Series did not have an outstanding loan amount.
| 9. | Risks of Investing in the Series |
The Series’ risks include, but are not limited to, some or all of the risks discussed below. For further information on the Series’ risks, please refer to the Series’ Prospectus and Statement of Additional Information.
Equity and Equity-Related Securities Risks: The value of a particular security could go down and you could lose money. In addition to an individual security losing value, the value of the equity markets or a sector in which the Series invests could go down. Different parts of a market can react differently to adverse issuer, market, regulatory, political and economic developments.
Foreign Securities Risk: Investments in securities of non-US issuers (including those denominated in US dollars) generally involve more risk than investing in securities of US issuers. Foreign political, economic and legal systems, especially those in developing and emerging market countries, may be less stable and more volatile than in the US. Foreign legal systems generally have fewer regulatory requirements than the US legal system. In general, less information is publicly available about non-US companies than about US companies. Non-US companies generally are not subject to the same accounting, auditing, and financial reporting standards as are US companies. Additionally, the changing value of foreign currencies and changes in exchange rates could also affect the value of the assets the Series holds and the Series’ performance. Certain foreign countries may impose restrictions on the ability of issuers of foreign securities to make payment of principal and interest or dividends to investors located outside the country, due to blockage of foreign currency exchanges or otherwise. Investments in emerging markets are subject to greater volatility and price declines. In addition, the Series’ investments in non-US securities may be subject to the risks of nationalization or expropriation of assets, imposition of currency exchange controls or restrictions on the repatriation of non-US currency, confiscatory taxation and adverse diplomatic developments. Special US tax considerations may apply.
Investing in Infrastructure Companies Risk: Securities of infrastructure companies are more susceptible to adverse economic, social, political and regulatory occurrences affecting their industries. Infrastructure companies may be subject to a variety of factors that may adversely affect their business or operations, including high interest costs in connection with capital construction programs, high leverage, costs associated with environmental and other regulations, the effects of economic slowdown, surplus capacity, insufficient supply of necessary resources, increased competition from other providers of similar services, uncertainties concerning the availability of fuel at reasonable prices, the effects of energy conservation policies and other factors. Certain infrastructure companies may operate in limited areas or have few sources of revenue.
Large Shareholder and Large Scale Redemption Risk: Certain individuals, accounts, funds (including funds affiliated with the Manager) or institutions, including the Manager and its affiliates, may from time to time own or control a substantial amount of the Series’ shares. There is no requirement that these entities maintain their investment in the Series. There is a risk that such large shareholders or that the Series’ shareholders generally may redeem all or a substantial portion of their investments in the Series in a short period of time, which could have a significant negative impact on the Series’ NAV, liquidity, and brokerage costs. Large redemptions could also result in tax consequences to shareholders and impact the Series’ ability to implement its investment strategy. The Series’ ability to pursue its investment objective after one or more large scale redemptions may be impaired and, as a result, the Series may invest a larger portion of its assets in cash or cash equivalents.
Market Disruption and Geopolitical Risks: International wars or conflicts and geopolitical developments in foreign countries, along with instability in regions such as Asia, Eastern Europe, and the Middle East, possible terrorist attacks in the United States or around the world, public health epidemics such as the outbreak of infectious diseases like the recent
| | | | |
| PGIM Jennison Global Infrastructure Fund | | | 33 | |
Notes to Financial Statements (continued)
outbreak of coronavirus globally or the 2014–2016 outbreak in West Africa of the Ebola virus, and other similar events could adversely affect the U.S. and foreign financial markets, including increases in market volatility, reduced liquidity in the securities markets and government intervention, and may cause further long-term economic uncertainties in the United States and worldwide generally.
The coronavirus pandemic and the related governmental and public responses have had and may continue to have an impact on the Series’ investments and net asset value and have led and may continue to lead to increased market volatility and the potential for illiquidity in certain classes of securities and sectors of the market. Preventative or protective actions that governments may take in respect of pandemic or epidemic diseases may result in periods of business disruption, business closures, inability to obtain raw materials, supplies and component parts, and reduced or disrupted operations for the issuers in which the Series invests. Government intervention in markets may impact interest rates, market volatility and security pricing. The occurrence, reoccurrence and pendency of such diseases could adversely affect the economies (including through changes in business activity and increased unemployment) and financial markets either in specific countries or worldwide.
Market Risk: Securities markets may be volatile and the market prices of the Series’ securities may decline. Securities fluctuate in price based on changes in an issuer’s financial condition and overall market and economic conditions. If the market prices of the securities owned by the Series fall, the value of an investment in the Series will decline.
Real Estate Investment Trust (REIT) Risk: Investing in REITs involves certain unique risks in addition to those risks associated with investing in the real estate industry in general. Equity REITs may be affected by changes in the value of the underlying property owned by the REITs, while mortgage REITs may be affected by the quality of any credit extended. REITs are dependent upon management skills, may not be diversified geographically or by property/mortgage asset type, and are subject to heavy cash flow dependency, default by borrowers and self-liquidation. REITs may be more volatile and/or more illiquid than other types of equity securities. REITs (especially mortgage REITs) are subject to interest rate risks. REITs may incur significant amounts of leverage. The Series will indirectly bear a portion of the expenses, including management fees, paid by each REIT in which it invests, in addition to the expenses of the Series.
REITs must also meet certain requirements under the Internal Revenue Code of 1986, as amended (the Code) to avoid entity level tax and be eligible to pass-through certain tax attributes of their income to shareholders. REITs are consequently subject to the risk of failing to meet these requirements for favorable tax treatment and of failing to maintain their exemptions from registration under the Investment Company Act of 1940. REITs are subject to the risks of changes in the Code affecting their tax status.
Because the Series invests in real estate securities, including REITs, the Series is subject to the risks of investing in the real estate industry, such as changes in general and local economic conditions, the supply and demand for real estate and changes in zoning and tax laws. Since the Series concentrates in the real estate industry, its holdings can vary significantly from broad market indexes. As a result, the Series’ performance can deviate from the performance of such indexes. Because the Series invests in stocks, there is the risk that the price of a particular stock owned by the Series could go down or pay lower-than-expected or no dividends. In addition to an individual stock losing value, the value of the equity markets or of companies comprising the real estate industry could go down.
| 10. | Recent Regulatory Developments |
On December 3, 2020, the SEC announced that it voted to adopt a new rule that establishes an updated regulatory framework for fund valuation practices (the “Rule”). The Rule, in part, provides (i) a framework for determining fair value in good faith and (ii) provides for a fund Board’s assignment of its responsibility for the execution of valuation-related activities to a fund’s investment adviser. Further, the SEC is rescinding previously issued guidance on related issues. The Rule will become effective 60 days after publication in the Federal Register, and will have a compliance date 18 months following the effective date. Management is currently evaluating the Rule and its impact to the Funds.
| | | | |
| PGIM Jennison Global Infrastructure Fund | | | 35 | |
Financial Highlights
| | | | | | | | | | | | | | | | | | | | |
| Class A Shares | |
| | | Year Ended October 31, | |
| | | 2020 | | | 2019 | | | 2018 | | | 2017 | | | 2016 | |
| Per Share Operating Performance(a): | | | | | | | | | | | | | | | | | | | | |
| Net Asset Value, Beginning of Year | | | $14.66 | | | | $12.21 | | | | $13.05 | | | | $11.61 | | | | $11.48 | |
| Income (loss) from investment operations: | | | | | | | | | | | | | | | | | | | | |
| Net investment income (loss) | | | 0.14 | | | | 0.18 | | | | 0.16 | | | | 0.14 | | | | 0.09 | |
| Net realized and unrealized gain (loss) on investment and foreign currency transactions | | | (0.86 | ) | | | 2.49 | | | | (0.81 | ) | | | 1.49 | | | | 0.21 | |
| Total from investment operations | | | (0.72 | ) | | | 2.67 | | | | (0.65 | ) | | | 1.63 | | | | 0.30 | |
| Less Dividends and Distributions: | | | | | | | | | | | | | | | | | | | | |
| Dividends from net investment income | | | (0.12 | ) | | | (0.21 | ) | | | (0.19 | ) | | | (0.13 | ) | | | (0.08 | ) |
| Tax return of capital distributions | | | (0.02 | ) | | | (0.01 | ) | |
| -
|
| | | (0.06 | ) | | | (0.09 | ) |
| Total dividends and distributions | | | (0.14 | ) | | | (0.22 | ) | | | (0.19 | ) | | | (0.19 | ) | | | (0.17 | ) |
| Net asset value, end of year | | | $13.80 | | | | $14.66 | | | | $12.21 | | | | $13.05 | | | | $11.61 | |
| Total Return(b): | | | (4.93 | )% | | | 22.01 | % | | | (5.10 | )% | | | 14.15 | % | | | 2.62 | % |
| | | | | | | | | | | | | | | | | | | | | |
| Ratios/Supplemental Data: | | | | | | | | | | | | | | | |
| Net assets, end of year (000) | | | $5,961 | | | | $7,637 | | | | $8,073 | | | | $11,689 | | | | $12,277 | |
| Average net assets (000) | | | $6,859 | | | | $7,718 | | | | $10,218 | | | | $11,433 | | | | $16,694 | |
| Ratios to average net assets(c)(d): | | | | | | | | | | | | | | | | | | | | |
| Expenses after waivers and/or expense reimbursement | | | 1.50 | % | | | 1.50 | % | | | 1.50 | % | | | 1.50 | % | | | 1.50 | % |
| Expenses before waivers and/or expense reimbursement | | | 2.20 | % | | | 2.10 | % | | | 2.00 | % | | | 1.81 | % | | | 1.79 | % |
| Net investment income (loss) | | | 0.95 | % | | | 1.34 | % | | | 1.21 | % | | | 1.10 | % | | | 0.76 | % |
| Portfolio turnover rate(e) | | | 62 | % | | | 62 | % | | | 75 | % | | | 80 | % | | | 82 | % |
| (a) | Calculated based on average shares outstanding during the year. |
| (b) | Total return does not consider the effects of sales loads. Total return is calculated assuming a purchase of a share on the first day and a sale on the last day of each year reported and includes reinvestment of dividends and distributions, if any. Total returns may reflect adjustments to conform to generally accepted accounting principles. |
| (c) | Does not include expenses of the underlying funds in which the Series invests. |
| (d) | Effective November 1, 2017, class specific expenses include transfer agent fees and expenses and registration fees, which are charged to their respective share class. |
| (e) | The Series’ portfolio turnover rate is calculated in accordance with regulatory requirements, without regard to transactions involving short-term investments and certain derivatives. If such transactions were included, the Series’ portfolio turnover rate may be higher. |
See Notes to Financial Statements.
| | | | | | | | | | | | | | | | | | | | |
| Class C Shares | | | | | | | | | | | | | | | |
| | | Year Ended October 31, | |
| | | 2020 | | | 2019 | | | 2018 | | | 2017 | | | 2016 | |
| Per Share Operating Performance(a): | | | | | | | | | | | | | | | | | | | | |
| Net Asset Value, Beginning of Year | | | $14.51 | | | | $12.12 | | | | $12.97 | | | | $11.55 | | | | $11.42 | |
| Income (loss) from investment operations: | | | | | | | | | | | | | | | | | | | | |
| Net investment income (loss) | | | 0.03 | | | | 0.08 | | | | 0.06 | | | | 0.04 | | | | - | (b) |
| Net realized and unrealized gain (loss) on investment and foreign currency transactions | | | (0.84 | ) | | | 2.45 | | | | (0.81 | ) | | | 1.50 | | | | 0.21 | |
| Total from investment operations | | | (0.81 | ) | | | 2.53 | | | | (0.75 | ) | | | 1.54 | | | | 0.21 | |
| Less Dividends and Distributions: | | | | | | | | | | | | | | | | | | | | |
| Dividends from net investment income | | | (0.05 | ) | | | (0.13 | ) | | | (0.10 | ) | | | (0.08 | ) | | | (0.04 | ) |
| Tax return of capital distributions | | | (0.02 | ) | | | (0.01 | ) | | | - | | | | (0.04 | ) | | | (0.04 | ) |
| Total dividends and distributions | | | (0.07 | ) | | | (0.14 | ) | | | (0.10 | ) | | | (0.12 | ) | | | (0.08 | ) |
| Net asset value, end of year | | | $13.63 | | | | $14.51 | | | | $12.12 | | | | $12.97 | | | | $11.55 | |
| Total Return(c): | | | (5.63 | )% | | | 21.01 | % | | | (5.82 | )% | | | 13.39 | % | | | 1.88 | % |
| | | | | | | | | | | | | | | | | | | | | |
| Ratios/Supplemental Data: | | | | | | | | | | | | | | | |
| Net assets, end of year (000) | | | $3,242 | | | | $4,135 | | | | $4,162 | | | | $6,101 | | | | $5,738 | |
| Average net assets (000) | | | $3,771 | | | | $4,131 | | | | $5,464 | | | | $6,111 | | | | $5,783 | |
| Ratios to average net assets(d)(e): | | | | | | | | | | | | | | | | | | | | |
| Expenses after waivers and/or expense reimbursement | | | 2.25 | % | | | 2.25 | % | | | 2.25 | % | | | 2.25 | % | | | 2.25 | % |
| Expenses before waivers and/or expense reimbursement | | | 3.05 | % | | | 2.90 | % | | | 2.81 | % | | | 2.51 | % | | | 2.49 | % |
| Net investment income (loss) | | | 0.21 | % | | | 0.59 | % | | | 0.48 | % | | | 0.34 | % | | | (0.02 | )% |
| Portfolio turnover rate(f) | | | 62 | % | | | 62 | % | | | 75 | % | | | 80 | % | | | 82 | % |
| (a) | Calculated based on average shares outstanding during the year. |
| (b) | Less than $0.005 per share. |
| (c) | Total return does not consider the effects of sales loads. Total return is calculated assuming a purchase of a share on the first day and a sale on the last day of each year reported and includes reinvestment of dividends and distributions, if any. Total returns may reflect adjustments to conform to generally accepted accounting principles. |
| (d) | Does not include expenses of the underlying funds in which the Series invests. |
| (e) | Effective November 1, 2017, class specific expenses include transfer agent fees and expenses and registration fees, which are charged to their respective share class. |
| (f) | The Series’ portfolio turnover rate is calculated in accordance with regulatory requirements, without regard to transactions involving short-term investments and certain derivatives. If such transactions were included, the Series’ portfolio turnover rate may be higher. |
See Notes to Financial Statements.
| | | | |
| PGIM Jennison Global Infrastructure Fund | | | 37 | |
Financial Highlights(continued)
| | | | | | | | | | | | | | | | | | | | |
| Class Z Shares | | | | | | | | | | | | | | | |
| | | Year Ended October 31, | |
| | | 2020 | | | 2019 | | | 2018 | | | 2017 | | | 2016 | |
| Per Share Operating Performance(a): | | | | | | | | | | | | | | | | | | | | |
| Net Asset Value, Beginning of Year | | | $14.66 | | | | $12.21 | | | | $13.06 | | | | $11.61 | | | | $11.47 | |
| Income (loss) from investment operations: | | | | | | | | | | | | | | | | | | | | |
| Net investment income (loss) | | | 0.18 | | | | 0.23 | | | | 0.19 | | | | 0.18 | | | | 0.11 | |
| Net realized and unrealized gain (loss) on investment and foreign currency transactions | | | (0.85 | ) | | | 2.48 | | | | (0.82 | ) | | | 1.49 | | | | 0.23 | |
| Total from investment operations | | | (0.67 | ) | | | 2.71 | | | | (0.63 | ) | | | 1.67 | | | | 0.34 | |
| Less Dividends and Distributions: | | | | | | | | | | | | | | | | | | | | |
| Dividends from net investment income | | | (0.17 | ) | | | (0.25 | ) | | | (0.22 | ) | | | (0.14 | ) | | | (0.09 | ) |
| Tax return of capital distributions | | | (0.02 | ) | | | (0.01 | ) | | | - | | | | (0.08 | ) | | | (0.11 | ) |
| Total dividends and distributions | | | (0.19 | ) | | | (0.26 | ) | | | (0.22 | ) | | | (0.22 | ) | | | (0.20 | ) |
| Net asset value, end of year | | | $13.80 | | | | $14.66 | | | | $12.21 | | | | $13.06 | | | | $11.61 | |
| Total Return(b): | | | (4.56 | )% | | | 22.30 | % | | | (4.94 | )% | | | 14.51 | % | | | 2.96 | % |
| | | | | | | | | | | | | | | | | | | | | |
| Ratios/Supplemental Data: | | | | | | | | | | | | | | | |
| Net assets, end of year (000) | | | $20,148 | | | | $21,868 | | | | $23,074 | | | | $28,831 | | | | $40,811 | |
| Average net assets (000) | | | $21,048 | | | | $21,608 | | | | $27,549 | | | | $29,597 | | | | $40,236 | |
| Ratios to average net assets(c)(d): | | | | | | | | | | | | | | | | | | | | |
| Expenses after waivers and/or expense reimbursement | | | 1.17 | % | | | 1.17 | % | | | 1.25 | % | | | 1.25 | % | | | 1.25 | % |
| Expenses before waivers and/or expense reimbursement | | | 1.66 | % | | | 1.57 | % | | | 1.52 | % | | | 1.51 | % | | | 1.49 | % |
| Net investment income (loss) | | | 1.25 | % | | | 1.66 | % | | | 1.45 | % | | | 1.49 | % | | | 0.94 | % |
| Portfolio turnover rate(e) | | | 62 | % | | | 62 | % | | | 75 | % | | | 80 | % | | | 82 | % |
| (a) | Calculated based on average shares outstanding during the year. |
| (b) | Total return is calculated assuming a purchase of a share on the first day and a sale on the last day of each year reported and includes reinvestment of dividends and distributions, if any. Total returns may reflect adjustments to conform to generally accepted accounting principles. |
| (c) | Does not include expenses of the underlying funds in which the Series invests. |
| (d) | Effective November 1, 2017, class specific expenses include transfer agent fees and expenses and registration fees, which are charged to their respective share class. |
| (e) | The Series’ portfolio turnover rate is calculated in accordance with regulatory requirements, without regard to transactions involving short-term investments and certain derivatives. If such transactions were included, the Series’ portfolio turnover rate may be higher. |
See Notes to Financial Statements.
| | | | | | | | | | | | | | | | | | | | | | | | | | | | | | | | | | | |
| Class R6 Shares | | | | |
| | | Year Ended October 31, | | | | December 28, 2016(a) through October 31, 2017 | | | | |
| | | 2020 | | 2019 | | 2018 |
| Per Share Operating Performance(b): | | | | | | | | | | | | | | | | | | | | | | | | | | | | | | | | | | | |
| Net Asset Value, Beginning of Period | | | | $ 14.66 | | | | | $12.21 | | | | | $13.06 | | | | | | | | | | $11.39 | | | | | | | | | | | |
| Income (loss) from investment operations: | | | | | | | | | | | | | | | | | | | | | | | | | | | | | | | | | | | |
| Net investment income (loss) | | | | 0.18 | | | | | 0.23 | | | | | 0.18 | | | | | | | | | | 0.11 | | | | | | | | | | | |
| Net realized and unrealized gain (loss) on investment and foreign currency transactions | | | | (0.85 | ) | | | | 2.48 | | | | | (0.81 | ) | | | | | | | | | 1.71 | | | | | | | | | | | |
| Total from investment operations | | | | (0.67 | ) | | | | 2.71 | | | | | (0.63 | ) | | | | | | | | | 1.82 | | | | | | | | | | | |
| Less Dividends and Distributions: | | | | | | | | | | | | | | | | | | | | | | | | | | | | | | | | | | | |
| Dividends from net investment income | | | | (0.17 | ) | | | | (0.25 | ) | | | | (0.22 | ) | | | | | | | | | (0.10 | ) | | | | | | | | | | |
| Tax return of capital distributions | | | | (0.02 | ) | | | | (0.01 | ) | | | | - | | | | | | | | | | (0.05 | ) | | | | | | | | | | |
| Total dividends and distributions | | | | (0.19 | ) | | | | (0.26 | ) | | | | (0.22 | ) | | | | | | | | | (0.15 | ) | | | | | | | | | | |
| Net asset value, end of period | | | | $ 13.80 | | | | | $14.66 | | | | | $12.21 | | | | | | | | | | $13.06 | | | | | | | | | | | |
| Total Return(c): | | | | (4.62 | )% | | | | 22.40 | % | | | | (4.94 | )% | | | | | | | | | 16.02 | % | | | | | | | | | | |
| | | | | | | | | | | | | | | | | | | | | | | | | | | | | | | | | | | | |
| Ratios/Supplemental Data: | | | | | | | | | | | | | | |
| Net assets, end of period (000) | | | | $ 5,636 | | | | | $11,954 | | | | | $13,912 | | | | | | | | | | $21,979 | | | | | | | | | | | |
| Average net assets (000) | | | | $ 8,565 | | | | | $13,787 | | | | | $17,657 | | | | | | | | | | $19,274 | | | | | | | | | | | |
| Ratios to average net assets(d)(e): | | | | | | | | | | | | | | | | | | | | | | | | | | | | | | | | | | | |
| Expenses after waivers and/or expense reimbursement | | | | 1.17 | % | | | | 1.17 | % | | | | 1.25 | % | | | | | | | | | 1.25 | %(f) | | | | | | | | | | |
| Expenses before waivers and/or expense reimbursement | | | | 1.66 | % | | | | 1.48 | % | | | | 1.44 | % | | | | | | | | | 1.40 | %(f) | | | | | | | | | | |
| Net investment income (loss) | | | | 1.28 | % | | | | 1.70 | % | | | | 1.39 | % | | | | | | | | | 1.00 | %(f) | | | | | | | | | | |
| Portfolio turnover rate(g) | | | | 62 | % | | | | 62 | % | | | | 75 | % | | | | | | | | | 80 | % | | | | | | | | | | |
| (a) | Commencement of offering. |
| (b) | Calculated based on average shares outstanding during the period. |
| (c) | Total return is calculated assuming a purchase of a share on the first day and a sale on the last day of each period reported and includes reinvestment of dividends and distributions, if any. Total returns may reflect adjustments to conform to generally accepted accounting principles. Total returns for periods less than one full year are not annualized. |
| (d) | Does not include expenses of the underlying funds in which the Series invests. |
| (e) | Effective November 1, 2017, class specific expenses include transfer agent fees and expenses and registration fees, which are charged to their respective share class. |
| (g) | The Series’ portfolio turnover rate is calculated in accordance with regulatory requirements, without regard to transactions involving short-term investments and certain derivatives. If such transactions were included, the Series’ portfolio turnover rate may be higher. |
See Notes to Financial Statements.
| | | | |
| PGIM Jennison Global Infrastructure Fund | | | 39 | |
Report of Independent Registered Public
Accounting Firm
To the Board of Directors of Prudential World Fund, Inc. and Shareholders of PGIM Jennison Global Infrastructure Fund
Opinion on the Financial Statements
We have audited the accompanying statement of assets and liabilities, including the schedule of investments, of PGIM Jennison Global Infrastructure Fund (one of the funds constituting Prudential World Fund, Inc., referred to hereafter as the “Fund”) as of October 31, 2020, and the related statements of operations and changes in net assets, including the related notes, and the financial highlights for the year ended October 31, 2020 (collectively referred to as the “financial statements”). In our opinion, the financial statements present fairly, in all material respects, the financial position of the Fund as of October 31, 2020, and the results of its operations, changes in its net assets, and the financial highlights for the year ended October 31, 2020 in conformity with accounting principles generally accepted in the United States of America.
The financial statements of the Fund as of and for the year ended October 31, 2019 and the financial highlights for each of the periods ended on or prior to October 31, 2019 (not presented herein, other than the statement of changes in net assets and the financial highlights) were audited by other auditors whose report dated December 19, 2019 expressed an unqualified opinion on those financial statements and financial highlights.
Basis for Opinion
These financial statements are the responsibility of the Fund’s management. Our responsibility is to express an opinion on the Fund’s financial statements based on our audit. We are a public accounting firm registered with the Public Company Accounting Oversight Board (United States) (PCAOB) and are required to be independent with respect to the Fund in accordance with the U.S. federal securities laws and the applicable rules and regulations of the Securities and Exchange Commission and the PCAOB.
We conducted our audit of these financial statements in accordance with the standards of the PCAOB. Those standards require that we plan and perform the audit to obtain reasonable assurance about whether the financial statements are free of material misstatement, whether due to error or fraud.
Our audit included performing procedures to assess the risks of material misstatement of the financial statements, whether due to error or fraud, and performing procedures that respond to those risks. Such procedures included examining, on a test basis, evidence regarding the amounts and disclosures in the financial statements. Our audit also included evaluating the accounting principles used and significant estimates made by management, as well as evaluating the overall presentation of the financial statements. Our procedures included confirmation of securities owned as of October 31, 2020 by correspondence with the custodian and transfer agent. We believe that our audit provides a reasonable basis for our opinion.
/s/PricewaterhouseCoopers LLP
New York, New York
December 17, 2020
We have served as the auditor of one or more investment companies in the PGIM Retail Funds complex since 2020.
Federal Income Tax Information (unaudited)
For the year ended October 31, 2020, the Series reports under Section 854 of the Internal Revenue Code, the following percentages of the ordinary income dividends paid as 1) qualified dividend income (QDI); and 2) eligible for corporate dividends received deduction (DRD):
| | | | | | | | |
| | | QDI | | | DRD | |
PGIM Jennison Global Infrastructure Fund | | | 100.00 | % | | | 74.57 | % |
In January 2021, you will be advised on IRS Form 1099-DIV or substitute 1099-DIV, as to the federal tax status of dividends and distributions received by you in calendar year 2020.
| | | | |
PGIM Jennison Global Infrastructure Fund | | | 41 | |
INFORMATION ABOUT BOARD MEMBERS AND OFFICERS (unaudited)
Information about Board Members and Officers of the Fund is set forth below. Board Members who are not deemed to be “interested persons” of the Fund, as defined in the 1940 Act, are referred to as “Independent Board Members.” Board Members who are deemed to be “interested persons” of the Fund are referred to as “Interested Board Members.” The Board Members are responsible for the overall supervision of the operations of the Fund and perform the various duties imposed on the directors of investment companies by the 1940 Act. The Board in turn elects the Officers, who are responsible for administering the day-to-day operations of the Fund.
| | | | | | |
| | | |
| Independent Board Members | | | | |
| | | | |
Name Year of Birth Position(s) Portfolios Overseen | | Principal Occupation(s) During Past Five Years | | Other Directorships Held During Past Five Years | | Length of Board Service |
| | | | |
Ellen S. Alberding 1958 Board Member Portfolios Overseen: 95 | | President and Board Member, The Joyce Foundation (charitable foundation) (since 2002); Vice Chair, City Colleges of Chicago (community college system) (2011-2015); Trustee, National Park Foundation (charitable foundation for national park system) (2009-2018); Trustee, Economic Club of Chicago (2009-2016); Trustee, Loyola University (since 2018). | | None. | | Since September 2013 |
| | | | |
Kevin J. Bannon 1952 Board Member Portfolios Overseen: 95 | | Retired; Managing Director (April 2008-May 2015) and Chief Investment Officer (October 2008-November 2013) of Highmount Capital LLC (registered investment adviser); formerly Executive Vice President and Chief Investment Officer (April 1993-August 2007) of Bank of New York Company; President (May 2003-May 2007) of BNY Hamilton Family of Mutual Funds. | | Director of Urstadt Biddle Properties (equity real estate investment trust) (since September 2008). | | Since July 2008 |
PGIM Jennison Global Infrastructure Fund
| | | | | | |
| | | |
| Independent Board Members | | | | |
| | | | |
Name Year of Birth Position(s) Portfolios Overseen | | Principal Occupation(s) During Past Five Years | | Other Directorships Held During Past Five Years | | Length of Board Service |
| | | | |
Linda W. Bynoe 1952 Board Member Portfolios Overseen: 95 | | President and Chief Executive Officer (since March 1995) and formerly Chief Operating Officer (December 1989-February 1995) of Telemat Limited LLC (formerly, Telemat Ltd). (management consulting); formerly Vice President (January 1985-June 1989) at Morgan Stanley & Co. (broker-dealer). | | Director of Anixter International, Inc. (communication products distributor) (since January 2006–June 2020); Director of Northern Trust Corporation (financial services) (since April 2006); Trustee of Equity Residential (residential real estate) (since December 2009). | | Since March 2005 |
| | | | |
Barry H. Evans 1960 Board Member Portfolios Overseen: 94 | | Retired; formerly President (2005 – 2016), Global Chief Operating Officer (2014– 2016), Chief Investment Officer – Global Head of Fixed Income (1998-2014), and various portfolio manager roles (1986-2006), Manulife Asset Management U.S. | | Formerly Director, Manulife Trust Company (2011-2018); formerly Director, Manulife Asset Management Limited (2015-2017); formerly Chairman of the Board of Directors of Manulife Asset Management U.S. (2005-2016); formerly Chairman of the Board, Declaration Investment Management and Research (2008-2016). | | Since September 2017 |
| | | | |
Keith F. Hartstein 1956 Board Member & Independent Chair
Portfolios Overseen: 95 | | Executive Committee of the IDC Board of Governors (since October 2019); Retired; Member (since November 2014) of the Governing Council of the Independent Directors Council (IDC) (organization of independent mutual fund directors); formerly President and Chief Executive Officer (2005-2012), Senior Vice President (2004-2005), Senior Vice President of Sales and Marketing (1997-2004), and various executive management positions (1990-1997), John Hancock Funds, LLC (asset management); Chairman, Investment Company Institute’s Sales Force Marketing Committee (2003-2008). | | None. | | Since September 2013 |
Visit our website at pgim.com/investments
| | | | | | |
| | | |
| Independent Board Members | | | | |
| | | | |
Name Year of Birth Position(s) Portfolios Overseen | | Principal Occupation(s) During Past Five Years | | Other Directorships Held During Past Five Years | | Length of Board Service |
| | | | |
Laurie Simon Hodrick 1962 Board Member Portfolios Overseen: 94 | | A. Barton Hepburn Professor Emerita of Economics in the Faculty of Business, Columbia Business School (since 2018); Visiting Professor of Law, Stanford Law School (since 2015); Visiting Fellow at the Hoover Institution, Stanford University (since 2015); Sole Member, ReidCourt LLC (since 2008) (a consulting firm); formerly A. Barton Hepburn Professor of Economics in the Faculty of Business, Columbia Business School (1996-2017); formerly Managing Director, Global Head of Alternative Investment Strategies, Deutsche Bank (2006-2008). | | Independent Director, Synnex Corporation (since 2019) (information technology); Independent Director, Kabbage, Inc. (2018-2020) (financial services); Independent Director, Corporate Capital Trust (2017-2018) (a business development company). | | Since September 2017 |
| | | | |
Michael S. Hyland, CFA 1945 Board Member Portfolios Overseen: 95 | | Retired (since February 2005); formerly Senior Managing Director (July 2001-February 2005) of Bear Stearns & Co, Inc.; Global Partner, INVESCO (1999-2001); Managing Director and President of Salomon Brothers Asset Management (1989-1999). | | None. | | Since July 2008 |
| | | | |
Brian K. Reid 1961 Board Member Portfolios Overseen: 94 | | Retired; formerly Chief Economist for the Investment Company Institute (ICI) (2005-2017); formerly Senior Economist and Director of Industry and Financial Analysis at the ICI (1998-2004); formerly Senior Economist, Industry and Financial Analysis at the ICI (1996-1998); formerly Staff Economist at the Federal Reserve Board (1989-1996); Director, ICI Mutual Insurance Company (2012-2017). | | None. | | Since March 2018 |
PGIM Jennison Global Infrastructure Fund
| | | | | | |
| | | |
| Independent Board Members | | | | |
| | | | |
Name Year of Birth Position(s) Portfolios Overseen | | Principal Occupation(s) During Past Five Years | | Other Directorships Held During Past Five Years | | Length of Board Service |
| | | | |
Grace C. Torres 1959 Board Member Portfolios Overseen: 94 | | Retired; formerly Treasurer and Principal Financial and Accounting Officer of the PGIM Funds, Target Funds, Advanced Series Trust, Prudential Variable Contract Accounts and The Prudential Series Fund (1998-June 2014); Assistant Treasurer (March 1999-June 2014) and Senior Vice President (September 1999-June 2014) of PGIM Investments LLC; Assistant Treasurer (May 2003-June 2014) and Vice President (June 2005-June 2014) of AST Investment Services, Inc.; Senior Vice President and Assistant Treasurer (May 2003-June 2014) of Prudential Annuities Advisory Services, Inc. | | Formerly Director (July 2015-January 2018) of Sun Bancorp, Inc. N.A. and Sun National Bank; Director (since January 2018) of OceanFirst Financial Corp. and OceanFirst Bank. | | Since November 2014 |
| | | | | | |
| | | |
| Interested Board Members | | | | |
| | | | |
Name Year of Birth Position(s) Portfolios Overseen | | Principal Occupation(s) During Past Five Years | | Other Directorships Held During Past Five Years | | Length of Board Service |
| | | | |
Stuart S. Parker 1962 Board Member & President Portfolios Overseen: 96 | | President of PGIM Investments LLC (formerly known as Prudential Investments LLC) (since January 2012); Executive Vice President of Prudential Investment Management Services LLC (since December 2012); formerly Executive Vice President of Jennison Associates LLC and Head of Retail Distribution of PGIM Investments LLC (June 2005-December 2011). | | None. | | Since January 2012 |
Visit our website at pgim.com/investments
| | | | | | |
| | | |
| Interested Board Members | | | | |
| | | | |
Name Year of Birth Position(s) Portfolios Overseen | | Principal Occupation(s) During Past Five Years | | Other Directorships Held During Past Five Years | | Length of Board Service |
| | | | |
Scott E. Benjamin 1973 Board Member & Vice President Portfolios Overseen: 96 | | Executive Vice President (since June 2009) of PGIM Investments LLC; Vice President (since June 2012) of Prudential Investment Management Services LLC; Executive Vice President (since September 2009) of AST Investment Services, Inc.; Senior Vice President of Product Development and Marketing, PGIM Investments (since February 2006); formerly Vice President of Product Development and Product Management, PGIM Investments LLC (2003-2006). | | None. | | Since March 2010 |
(1) The year that each Board Member joined the Board is as follows:
Ellen S. Alberding, 2013; Kevin J. Bannon, 2008; Linda W. Bynoe, 2005; Barry H. Evans, 2017; Keith F. Hartstein, 2013; Laurie Simon Hodrick, 2017; Michael S. Hyland, 2008; James E. Quinn, 2013; Richard A. Redeker, 2000; Stephen G. Stoneburn, 2003; Stuart S. Parker, Board Member and President since 2012; Scott E. Benjamin, Board Member since 2010 and Vice President since 2009; Grace C. Torres, 2014.
| | | | |
| |
| Fund Officers(a) |
| | | |
Name Year of Birth Fund Position | | Principal Occupation(s) During Past Five Years | | Length of Service as Fund Officer |
| | | |
Claudia DiGiacomo 1974 Chief Legal Officer | | Chief Legal Officer of PGIM Investments LLC (since August 2020); Chief Legal Officer of Prudential Mutual Fund Services LLC (since August 2020); Chief Legal Officer of PIFM Holdco, LLC (since August 2020); Vice President and Corporate Counsel (since January 2005) of Prudential; and Corporate Counsel of AST Investment Services, Inc. (since August 2020); formerly Associate at Sidley Austin Brown & Wood LLP (1999-2004). | | Since December 2005 |
| | | |
Dino Capasso 1974 Chief Compliance Officer | | Chief Compliance Officer (July 2019-Present) of PGIM Investments LLC; Chief Compliance Officer (July 2019-Present) of the PGIM Funds, Target Funds, Advanced Series Trust, The Prudential Series Fund, Prudential’s Gibraltar Fund, Inc., PGIM Global High Yield Fund, Inc., and PGIM High Yield Bond Fund, Inc.; Vice President and Deputy Chief Compliance Officer (June 2017-2019) of PGIM Investments LLC; formerly, Senior Vice President and Senior Counsel (January 2016-June 2017), and Vice President and Counsel (February 2012-December 2015) of Pacific Investment Management Company LLC. | | Since March 2018 |
PGIM Jennison Global Infrastructure Fund
| | | | |
| |
| Fund Officers(a) |
| | | |
Name Year of Birth Fund Position | | Principal Occupation(s) During Past Five Years | | Length of Service as Fund Officer |
| | | |
Andrew R. French 1962 Secretary | | Vice President (since December 2018 - present) of PGIM Investments LLC; Formerly, Vice President and Corporate Counsel (2010-2018) of Prudential; formerly Director and Corporate Counsel (2006-2010) of Prudential; Vice President and Assistant Secretary (since January 2007) of PGIM Investments LLC; Vice President and Assistant Secretary (since January 2007) of Prudential Mutual Fund Services LLC. | | Since October 2006 |
| | | |
Diana N. Huffman 1982 Assistant Secretary | | Vice President and Corporate Counsel (since September 2015) of Prudential; Vice President and Assistant Secretary (since August 2020) of PGIM Investments LLC; formerly Associate at Willkie Farr & Gallagher LLP (2009-2015). | | Since March 2019 |
| | | |
Melissa Gonzalez 1980 Assistant Secretary | | Vice President and Corporate Counsel (since September 2018) of Prudential; Vice President and Assistant Secretary (since August 2020) of PGIM Investments LLC; formerly Director and Corporate Counsel (March 2014-September 2018) of Prudential. | | Since March 2020 |
| | | |
Patrick E. McGuinness 1986 Assistant Secretary | | Vice President and Assistant Secretary (since August 2020) of PGIM Investments LLC; Director and Corporate Counsel (since February 2017) of Prudential; and Corporate Counsel (2012 – 2017) of IIL, Inc. | | Since June 2020 |
| | | |
Kelly A. Coyne 1968 Assistant Secretary | | Director, Investment Operations of Prudential Mutual Fund Services LLC (since 2010). | | Since March 2015 |
| | | |
Christian J. Kelly 1975 Treasurer and Principal Financial and Accounting Officer | | Vice President, Head of Fund Administration of PGIM Investments LLC (since November 2018); formerly, Director of Fund Administration of Lord Abbett & Co. LLC (2009-2018), Treasurer and Principal Accounting Officer of the Lord Abbett Family of Funds (2017-2018); Director of Accounting, Avenue Capital Group (2008-2009); Senior Manager, Investment Management Practice of Deloitte & Touche LLP (1998-2007). | | Since January 2019 |
| | | |
Lana Lomuti 1967 Assistant Treasurer | | Vice President (since 2007) and Director (2005-2007), within PGIM Investments Fund Administration; formerly Assistant Treasurer (December 2007-February 2014) of The Greater China Fund, Inc. | | Since April 2014 |
| | | |
Russ Shupak 1973 Assistant Treasurer | | Vice President (since 2017) and Director (2013-2017), within PGIM Investments Fund Administration. | | Since October 2019 |
| | | |
Deborah Conway 1969 Assistant Treasurer | | Vice President (since 2017) and Director (2007-2017), within PGIM Investments Fund Administration. | | Since October 2019 |
| | | |
Elyse M. McLaughlin 1974 Assistant Treasurer | | Vice President (since 2017) and Director (2011-2017), within PGIM Investments Fund Administration. | | Since October 2019 |
Visit our website at pgim.com/investments
| | | | |
| |
| Fund Officers(a) |
| | | |
Name Year of Birth Fund Position | | Principal Occupation(s) During Past Five Years | | Length of Service as Fund Officer |
| | | |
Charles H. Smith 1973 Anti-Money Laundering Compliance Officer | | Vice President, Corporate Compliance, Anti-Money Laundering Unit (since January 2015) of Prudential; committee member of the American Council of Life Insurers Anti-Money Laundering and Critical Infrastructure Committee (since January 2016); formerly Global Head of Economic Sanctions Compliance at AIG Property Casualty (February 2007-December 2014); Assistant Attorney General at the New York State Attorney General’s Office, Division of Public Advocacy. (August 1998-January 2007). | | Since January 2017 |
| (a) | Excludes Mr. Parker and Mr. Benjamin, interested Board Members who also serve as President and Vice President, respectively. |
Explanatory Notes to Tables:
| | ∎ | Board Members are deemed to be “Interested,” as defined in the 1940 Act, by reason of their affiliation with PGIM Investments LLC and/or an affiliate of PGIM Investments LLC. |
| | ∎ | Unless otherwise noted, the address of all Board Members and Officers is c/o PGIM Investments LLC, 655 Broad Street, Newark, New Jersey 07102-4410. |
| | ∎ | There is no set term of office for Board Members or Officers. The Board Members have adopted a retirement policy, which calls for the retirement of Board Members on December 31 of the year in which they reach the age of 75. |
| | ∎ | “Other Directorships Held” includes all directorships of companies required to register or file reports with the SEC under the 1934 Act (that is, “public companies”) or other investment companies registered under the 1940 Act. |
| | ∎ | “Portfolios Overseen” includes all investment companies managed by PGIM Investments LLC. The investment companies for which PGIM Investments LLC serves as manager include the PGIM Funds, The Prudential Variable Contract Accounts, PGIM ETF Trust, PGIM High Yield Bond Fund, Inc., PGIM Global High Yield Fund, Inc., The Prudential Series Fund, Prudential’s Gibraltar Fund, Inc. and the Advanced Series Trust. |
| | ∎ | As used in the Fund Officers table “Prudential” means The Prudential Insurance Company of America. |
PGIM Jennison Global Infrastructure Fund
Approval of Advisory Agreements (unaudited)
The Fund’s Board of Directors
The Board of Directors (the “Board”) of PGIM Jennison Global Infrastructure Fund (the “Fund”)1 consists of eleven individuals, nine of whom are not “interested persons” of the Fund, as defined in the Investment Company Act of 1940, as amended (the “1940 Act”) (the “Independent Directors”). The Board is responsible for the oversight of the Fund and its operations, and performs the various duties imposed on the directors of investment companies by the 1940 Act. The Independent Directors have retained independent legal counsel to assist them in connection with their duties. The Chair of the Board is an Independent Director. The Board has established four standing committees: the Audit Committee, the Nominating and Governance Committee, and two Investment Committees. Each committee is chaired by, and composed of, Independent Directors.
Annual Approval of the Fund’s Advisory Agreements
As required under the 1940 Act, the Board determines annually whether to renew the Fund’s management agreement with PGIM Investments LLC (“PGIM Investments”) and the Fund’s subadvisory agreement with Jennison Associates LLC (“Jennison”). In considering the renewal of the agreements, the Board, including all of the Independent Directors, met on May 27, 2020 and on June 9-11, 2020 and approved the renewal of the agreements through July 31, 2021, after concluding that the renewal of the agreements was in the best interests of the Fund and its shareholders.
In advance of the meetings, the Board requested and received materials relating to the agreements, and had the opportunity to ask questions and request further information in connection with its consideration. Among other things, the Board considered comparative fee information from PGIM Investments and Jennison. Also, the Board considered comparisons with other mutual funds in relevant Peer Universes and Peer Groups, as is further discussed below.
In approving the agreements, the Board, including the Independent Directors advised by independent legal counsel, considered the factors it deemed relevant, including the nature, quality and extent of services provided by PGIM Investments and the subadviser, the performance of the Fund, the profitability of PGIM Investments and its affiliates, expenses and fees, and the potential for economies of scale that may be shared with the Fund and its shareholders as the Fund’s assets grow. In their deliberations, the Directors did not identify any single factor which alone was responsible for the Board’s decision to approve the agreements with respect to the Fund. In connection with its deliberations, the Board considered information provided by PGIM Investments throughout the year at regular Board
| 1 | PGIM Jennison Global Infrastructure Fund is a series of Prudential World Fund, Inc. |
`
PGIM Jennison Global Infrastructure Fund
Approval of Advisory Agreements (continued)
meetings, presentations from portfolio managers and other information, as well as information furnished at or in advance of the meetings on May 27, 2020 and on June 9-11, 2020.
The Directors determined that the overall arrangements between the Fund and PGIM Investments, which serves as the Fund’s investment manager pursuant to a management agreement, and between PGIM Investments and Jennison, which serves as the Fund’s subadviser pursuant to the terms of a subadvisory agreement with PGIM Investments, are in the best interests of the Fund and its shareholders in light of the services performed, fees charged and such other matters as the Directors considered relevant in the exercise of their business judgment.
The material factors and conclusions that formed the basis for the Directors’ reaching their determinations to approve the continuance of the agreements are separately discussed below.
Nature, Quality and Extent of Services
The Board received and considered information regarding the nature, quality and extent of services provided to the Fund by PGIM Investments and Jennison. The Board noted that Jennison is affiliated with PGIM Investments. The Board considered the services provided by PGIM Investments, including but not limited to the oversight of the subadviser for the Fund, as well as the provision of fund recordkeeping, compliance and other services to the Fund, and PGIM Investments’ role as administrator for the Fund’s liquidity risk management program. With respect to PGIM Investments’ oversight of the subadviser, the Board noted that PGIM Investments’ Strategic Investment Research Group (“SIRG”), which is a business unit of PGIM Investments, is responsible for monitoring and reporting to PGIM Investments’ senior management on the performance and operations of the subadviser. The Board also considered that PGIM Investments pays the salaries of all of the officers and interested Directors of the Fund who are part of Fund management. The Board also considered the investment subadvisory services provided by Jennison, including investment research and security selection, as well as adherence to the Fund’s investment restrictions and compliance with applicable Fund policies and procedures. The Board considered PGIM Investments’ evaluation of the subadviser, as well as PGIM Investments’ recommendation, based on its review of the subadviser, to renew the subadvisory agreement.
The Board considered the qualifications, backgrounds and responsibilities of PGIM Investments’ senior management responsible for the oversight of the Fund and Jennison, and also considered the qualifications, backgrounds and responsibilities of Jennison’s portfolio managers who are responsible for the day-to-day management of the Fund’s portfolio. The Board was provided with information pertaining to PGIM Investments’ and Jennison’s organizational structure, senior management, investment operations, and other relevant information pertaining to both PGIM Investments and Jennison. The Board also
Visit our website at pgim.com/investments
noted that it received favorable compliance reports from the Fund’s Chief Compliance Officer (“CCO”) as to both PGIM Investments and Jennison.
The Board concluded that it was satisfied with the nature, extent and quality of the investment management services provided by PGIM Investments and the subadvisory services provided to the Fund by Jennison, and that there was a reasonable basis on which to conclude that the Fund benefits from the services provided by PGIM Investments and Jennison under the management and subadvisory agreements.
Costs of Services and Profits Realized by PGIM Investments
The Board was provided with information on the profitability of PGIM Investments and its affiliates in serving as the Fund’s investment manager. The Board discussed with PGIM Investments the methodology utilized in assembling the information regarding profitability and considered its reasonableness. The Board recognized that it is difficult to make comparisons of profitability from fund management contracts because comparative information is not generally publicly available and is affected by numerous factors, including the structure of the particular adviser, the types of funds it manages, its business mix, numerous assumptions regarding allocations and the adviser’s capital structure and cost of capital. However, the Board considered that the cost of services provided by PGIM Investments to the Fund during the year ended December 31, 2019 exceeded the management fees paid by the Fund, resulting in an operating loss to PGIM Investments. Taking these factors into account, the Board concluded that the profitability of PGIM Investments and its affiliates in relation to the services rendered was not unreasonable.
Economies of Scale
The Board received and discussed information concerning economies of scale that PGIM Investments may realize as the Fund’s assets grow beyond current levels. The Board noted that the management fee schedule for the Fund includes breakpoints, which have the effect of decreasing the fee rate as assets increase. During the course of time, the Board has considered information regarding the launch date of the Fund, the management fees of the Fund compared to those of similarly managed funds and PGIM Investments’ investment in the Fund over time. The Board noted that economies of scale may be shared with the Fund in several ways, including low management fees from inception, additional technological and personnel investments to enhance shareholder services, and maintaining existing expense structures in the face of a rising cost environment. The Board considered PGIM Investments’ assertion that it continually evaluates the management fee schedule of the Fund and the potential to share economies of scale through breakpoints or fee waivers as asset levels increase.
PGIM Jennison Global Infrastructure Fund
Approval of Advisory Agreements (continued)
The Board recognized the inherent limitations of any analysis of economies of scale, stemming largely from the Board’s understanding that most of PGIM Investments’ costs are not specific to individual funds, but rather are incurred across a variety of products and services.
Other Benefits to PGIM Investments and Jennison
The Board considered potential ancillary benefits that might be received by PGIM Investments and Jennison and their affiliates as a result of their relationship with the Fund. The Board concluded that potential benefits to be derived by PGIM Investments included transfer agency fees received by the Fund’s transfer agent (which is affiliated with PGIM Investments), benefits to its reputation as well as other intangible benefits resulting from PGIM Investments’ association with the Fund. The Board concluded that the potential benefits to be derived by Jennison included its ability to use soft dollar credits, as well as the potential benefits consistent with those generally resulting from an increase in assets under management, specifically, potential access to additional research resources and benefits to its reputation. The Board concluded that the benefits derived by PGIM Investments and Jennison were consistent with the types of benefits generally derived by investment managers and subadvisers to mutual funds.
Performance of the Fund / Fees and Expenses
The Board considered certain additional factors and made related conclusions relating to the historical performance of the Fund for the one-, three- and five-year periods ended December 31, 2019.
The Board also considered the Fund’s actual management fee, as well as the Fund’s net total expense ratio, for the fiscal year ended October 31, 2019. The Board considered the management fee for the Fund as compared to the management fee charged by PGIM Investments to other funds and the fee charged by other advisers to comparable mutual funds in a Peer Group. The actual management fee represents the fee rate actually paid by Fund shareholders and includes any fee waivers or reimbursements. The net total expense ratio for the Fund represents the actual expense ratio incurred by Fund shareholders.
The mutual funds included in the Peer Universe, which was used to consider performance, and the Peer Group, which was used to consider fees and expenses, were objectively determined by Broadridge, an independent provider of mutual fund data. In certain circumstances, PGIM Investments also provided supplemental Peer Universe or Peer Group information for reasons addressed with the Board. The comparisons placed the Fund in various quartiles over various periods, with the first quartile being the best 25% of the mutual funds (for performance, the best performing mutual funds and, for expenses, the lowest cost mutual funds).
Visit our website at pgim.com/investments
The section below summarizes key factors considered by the Board and the Board’s conclusions regarding the Fund’s performance, fees and overall expenses. The table sets forth net performance comparisons (which reflect the impact on performance of fund expenses, or any subsidies, expense caps or waivers that may be applicable) with the Peer Universe, actual management fees with the Peer Group (which reflect the impact of any subsidies or fee waivers), and net total expenses with the Peer Group, each of which were key factors considered by the Board.
| | | | | | | | |
| Net Performance | | 1 Year | | 3 Years | | 5 Years | | 10 Years |
| | 2nd Quartile | | 2nd Quartile | | 2nd Quartile | | N/A |
| Actual Management Fees: 1st Quartile |
| Net Total Expenses: 4th Quartile |
| • | | The Board noted that the Fund outperformed its benchmark index over all periods. |
| • | | The Board and PGIM Investments agreed to retain the Fund’s existing contractual expense cap that (exclusive of certain fees and expenses) caps total annual operating expenses at 1.50% for Class A shares 2.25% for Class C shares, 1.17% for Class R6 shares, and 1.17% for Class Z shares through February 28, 2021. |
| • | | In addition, PGIM Investments will waive management fees or shared operating expenses on any share class to the same extent that it waives such expenses on any other share class, and has agreed that total annual fund operating expenses for Class R6 shares will not exceed total annual fund operating expenses for Class Z shares. |
| • | | The Board concluded that, in light of the above, it would be in the best interests of the Fund and its shareholders to renew the agreements. |
| • | | The Board concluded that the management fees (including subadvisory fees) and total expenses were reasonable in light of the services provided. |
* * *
After full consideration of these factors, the Board concluded that approval of the agreements was in the best interests of the Fund and its shareholders.
PGIM Jennison Global Infrastructure Fund
| | | | |
| | |
| ∎ MAIL | | ∎ TELEPHONE | | ∎ WEBSITE |
655 Broad Street Newark, NJ 07102 | | (800) 225-1852 | | pgim.com/investments |
|
| PROXY VOTING |
| The Board of Directors of the Fund has delegated to the Fund’s subadviser the responsibility for voting any proxies and maintaining proxy recordkeeping with respect to the Fund. A description of these proxy voting policies and procedures is available without charge, upon request, by calling (800) 225-1852 or by visiting the Securities and Exchange Commission’s website at sec.gov. Information regarding how the Fund voted proxies relating to portfolio securities during the most recent 12-month period ended June 30 is available on the Fund’s website and on the Securities and Exchange Commission’s website. |
|
| DIRECTORS |
| Ellen S. Alberding • Kevin J. Bannon • Scott E. Benjamin • Linda W. Bynoe • Barry H. Evans • Keith F. Hartstein • Laurie Simon Hodrick • Michael S. Hyland • Stuart S. Parker • Brian K. Reid • Grace C. Torres |
|
| OFFICERS |
Stuart S. Parker, President • Scott E. Benjamin, Vice President • Christian J. Kelly, Treasurer and Principal Financial and Accounting Officer • Claudia DiGiacomo, Chief Legal Officer • Dino Capasso, Chief Compliance Officer • Charles H. Smith, Anti-Money Laundering Compliance Officer • Andrew R. French, Secretary • Melissa Gonzalez, Assistant Secretary • Diana N. Huffman, Assistant Secretary • Kelly A. Coyne, Assistant Secretary • Patrick McGuinness, Assistant Secretary • Lana Lomuti, Assistant Treasurer • Russ Shupak, Assistant Treasurer • Elyse McLaughlin, Assistant Treasurer • Deborah Conway, Assistant Treasurer |
| | | | |
| MANAGER | | PGIM Investments LLC | | 655 Broad Street
Newark, NJ 07102 |
|
| SUBADVISER | | Jennison Associates LLC | | 466 Lexington Avenue
New York, NY 10017 |
|
| DISTRIBUTOR | | Prudential Investment
Management Services LLC | | 655 Broad Street
Newark, NJ 07102 |
|
| CUSTODIAN | | The Bank of New York Mellon | | 240 Greenwich Street
New York, NY 10286 |
|
| TRANSFER AGENT | | Prudential Mutual Fund
Services LLC | | PO Box 9658
Providence, RI 02940 |
|
| INDEPENDENT REGISTERED PUBLIC ACCOUNTING FIRM | | PricewaterhouseCoopers LLP | | 300 Madison Avenue
New York, NY 10017 |
|
| FUND COUNSEL | | Willkie Farr & Gallagher LLP | | 787 Seventh Avenue
New York, NY 10019 |
|
|
| An investor should consider the investment objectives, risks, charges, and expenses of the Fund carefully before investing. The prospectus and summary prospectus contain this and other information about the Fund. An investor may obtain the prospectus and summary prospectus by visiting our website at pgim.com/investments or by calling (800) 225-1852. The prospectus and summary prospectus should be read carefully before investing. |
|
| E-DELIVERY |
| To receive your mutual fund documents online, go to pgim.com/investments/resource/edelivery and enroll. Instead of receiving printed documents by mail, you will receive notification via email when new materials are available. You can cancel your enrollment or change your email address at any time by visiting the website address above. |
|
| SHAREHOLDER COMMUNICATIONS WITH DIRECTORS |
| Shareholders can communicate directly with the Board of Directors by writing to the Chair of the Board, PGIM Jennison Global Infrastructure Fund, PGIM Investments, Attn: Board of Directors, 655 Broad Street, Newark, NJ 07102. Shareholders can communicate directly with an individual Director by writing to that Director at the same address. Communications are not screened before being delivered to the addressee. |
|
| AVAILABILITY OF PORTFOLIO HOLDINGS |
| The Fund files its complete schedule of portfolio holdings with the Securities and Exchange Commission for the first and third quarters of each fiscal year as an exhibit to its reports on Form N-PORT. The Fund’s Form N-PORT filings are available on the Commission’s website at sec.gov. |
|
| The Fund’s Statement of Additional Information contains additional information about the Fund’s Directors and is available without charge, upon request, by calling (800) 225-1852. |
Mutual Funds:
| | | | |
| ARE NOT INSURED BY THE FDIC OR ANY FEDERAL GOVERNMENT AGENCY | | MAY LOSE VALUE | | ARE NOT A DEPOSIT OF OR GUARANTEED BY ANY BANK OR ANY BANK AFFILIATE |
PGIM JENNISON GLOBAL INFRASTRUCTURE FUND
| | | | | | | | |
| SHARE CLASS | | A | | C | | Z | | R6 |
| NASDAQ | | PGJAX | | PGJCX | | PGJZX | | PGJQX |
| CUSIP | | 743969792 | | 743969784 | | 743969776 | | 743969560 |
MF217E

PGIM EMERGING MARKETS DEBT HARD
CURRENCY FUND
ANNUAL REPORT
OCTOBER 31, 2020
COMING SOON: PAPERLESS SHAREHOLDER REPORTS
Beginning on January 1, 2021, as permitted by regulations adopted by the Securities and Exchange Commission, paper copies of the Fund’s annual and semiannual shareholder reports will no longer be sent by mail, unless you specifically request paper copies of the reports. Instead, the reports will be made available on the Fund’s website (pgim.com/investments), and you will be notified by mail each time a report is posted and provided with a website link to access the report.
If you already elected to receive shareholder reports electronically, you will not be affected by this change and you need not take any action. You may elect to receive shareholder reports and other communications from the Fund electronically anytime by contacting your financial intermediary (such as a broker-dealer or bank) or, if you are a direct investor, by calling 1-800-225-1852 or by sending an email request to PGIM Investments at shareholderreports@pgim.com.
You may elect to receive all future reports in paper free of charge. If you invest through a financial intermediary, you can contact your financial intermediary to elect to continue to receive paper copies of your shareholder reports. If you invest directly with the Fund, you can call 1-800-225-1852 or send an email request to shareholderreports@pgim.com to let the Fund know you wish to continue receiving paper copies of your shareholder reports. Your election to receive reports in paper will apply to all funds held in your account if you invest through your financial intermediary or all funds held with the fund complex if you invest directly with the Fund.

To enroll in e-delivery, go to pgim.com/investments/resource/edelivery
Table of Contents
This report is not authorized for distribution to prospective investors unless preceded or accompanied by a current prospectus.
The views expressed in this report and information about the Fund’s portfolio holdings are for the period covered by this report and are subject to change thereafter.
Mutual funds are distributed by Prudential Investment Management Services LLC (PIMS), member SIPC. PGIM Fixed Income is a unit of PGIM, Inc. (PGIM), a registered investment adviser. PIMS and PGIM are Prudential Financial companies. © 2020 Prudential Financial, Inc. and its related entities. PGIM and the PGIM logo are service marks of Prudential Financial, Inc. and its related entities, registered in many jurisdictions worldwide.
| | |
| 2 | | Visit our website at pgim.com/investments |
Letter from the President

Dear Shareholder:
We hope you find the annual report for the PGIM Emerging Markets Debt Hard Currency Fund informative and useful. The report covers performance for the 12-month period that ended October 31, 2020.
During the first four months of the period, the global economy remained healthy—particularly in the US—fueled by rising corporate profits and strong job growth. The outlook changed dramatically in March as the coronavirus outbreak quickly and substantially shut down economic activity worldwide, leading to significant job losses and a steep decline in global growth and earnings. Responding to this disruption, the Federal Reserve (the Fed) cut the federal funds rate target to near zero and flooded capital markets with liquidity; and Congress passed stimulus bills worth approximately $3 trillion that offered an economic lifeline to consumers and businesses.
While stocks climbed throughout the first four months of the period, they fell significantly in March amid a spike in volatility, ending the 11-year-long equity bull market. With stores and factories closing and consumers staying at home to limit the spread of the virus, investors sold stocks on fears that corporate earnings would take a serious hit. Equities rallied around the globe throughout the spring and summer as states reopened their economies, but became more volatile during the last two months of the period as investors worried that a surge in coronavirus infections would stall the economic recovery. For the period overall, large-cap US and emerging market stocks rose, small-cap US stocks were virtually unchanged, and stocks in developed foreign markets declined.
The bond market overall—including US and global bonds as well as emerging market debt—rose during the period as investors sought safety in fixed income. A significant rally in interest rates pushed the 10-year US Treasury yield down to a record low. In March, the Fed took several aggressive actions to keep the bond markets running smoothly, restarting many of the relief programs that proved to be successful in helping end the global financial crisis in 2008-09.
Regarding your investments with PGIM, we believe it is important to maintain a diversified portfolio of funds consistent with your tolerance for risk, time horizon, and financial goals. Your financial advisor can help you create a diversified investment plan that may include funds covering all the basic asset classes and that reflects your personal investor profile and risk tolerance. However, diversification and asset allocation strategies do not assure a profit or protect against loss in declining markets.
At PGIM Investments, we consider it a great privilege and responsibility to help investors participate in opportunities across global markets while meeting their toughest investment challenges. PGIM is a top-10 global investment manager with more than $1 trillion in assets under management. This scale and investment expertise allow us to deliver actively managed funds and strategies to meet the needs of investors around the globe.
Thank you for choosing our family of funds.
Sincerely,

Stuart S. Parker, President
PGIM Emerging Markets Debt Hard Currency Fund
December 15, 2020
| | | | |
PGIM Emerging Markets Debt Hard Currency Fund | | | 3 | |
Your Fund’s Performance (unaudited)
Performance data quoted represents past performance. Past performance does not guarantee future results. The investment return and principal value of an investment will fluctuate, so that an investor’s shares, when redeemed, may be worth more or less than their original cost. Current performance may be lower or higher than the past performance data quoted. An investor may obtain performance data as of the most recent month-end by visiting our website at pgim.com/investments or by calling (800) 225-1852.
| | | | |
| |
| | | Average Annual Total Returns as of 10/31/20 |
| | | One Year (%) | | Since Inception (%) |
| Class A | | | | |
| (with sales charges) | | –5.01 | | 0.02 (12/12/17) |
| (without sales charges) | | –1.82 | | 1.17 (12/12/17) |
| Class C | | | | |
| (with sales charges) | | –3.48 | | 0.42 (12/12/17) |
| (without sales charges) | | –2.55 | | 0.42 (12/12/17) |
| Class Z | | | | |
| (without sales charges) | | –1.43 | | 1.46 (12/12/17) |
| Class R6 | | | | |
| (without sales charges) | | –1.44 | | 1.51 (12/12/17) |
| JP Morgan Emerging Markets Bond Global Diversified Index |
| | | 0.98 | | 3.43 |
Since Inception returns are provided since the Fund has less than 10 fiscal years of returns. Since Inception returns for the Index are measured from the closest month-end to the Fund’s inception date.
| | |
| 4 | | Visit our website at pgim.com/investments |
Growth of a $10,000 Investment (unaudited)
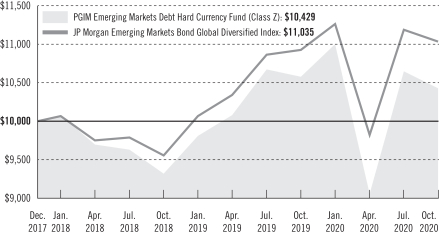
The graph compares a $10,000 investment in the Fund’s Class Z shares with a similar investment in the JP Morgan Emerging Markets Bond Global Diversified Index by portraying the initial account values at the commencement of operations for Class Z shares (December 12, 2017) and the account values at the end of the current fiscal year (October 31, 2020) as measured on a quarterly basis. For purposes of the graph, and unless otherwise indicated, it has been assumed that (a) all recurring fees (including management fees) were deducted; and (b) all dividends and distributions were reinvested. The line graph provides information for Class Z shares only. As indicated in the tables provided earlier, performance for other share classes will vary due to the differing fees and expenses applicable to each share class (as indicated in the following paragraphs). Without waiver of fees and/or expense reimbursements, if any, the Fund’s returns would have been lower.
Past performance does not predict future performance. Total returns and the ending account values in the graph include changes in share price and reinvestment of dividends and capital gains distributions in a hypothetical investment for the periods shown. The Fund’s total returns do not reflect the deduction of income taxes on an individual’s investment. Taxes may reduce your actual investment returns on income or gains paid by the Fund or any gains you may realize if you sell your shares.
| | | | |
PGIM Emerging Markets Debt Hard Currency Fund | | | 5 | |
Your Fund’s Performance (continued)
The returns in the tables do not reflect the deduction of taxes that a shareholder would pay on Fund distributions or following the redemption of Fund shares. The average annual total returns take into account applicable sales charges, which are described for each share class in the table below.
| | | | | | | | |
| | | | | |
| | | Class A | | Class C | | Class Z | | Class R6 |
| Maximum initial sales charge | | 3.25% of the public offering price | | None | | None | | None |
| Contingent deferred sales charge (CDSC) (as a percentage of the lower of the original purchase price or the net asset value at redemption) | | 1.00% on sales of $500,000 or more made within 12 months of purchase | | 1.00% on sales made within 12 months of purchase | | None | | None |
| Annual distribution and service (12b-1) fees (shown as a percentage of average daily net assets) | | 0.25% | | 1.00% | | None | | None |
Benchmark Definitions
JP Morgan Emerging Markets Bond Global Diversified Index—The JP Morgan Emerging Markets Bond Global Diversified Index tracks total returns for USD-denominated debt instruments issued by emerging market sovereign and quasi-sovereign entities: Brady bonds, loans, and eurobonds. It limits the weights of those index countries with larger debt stocks by only including specified portions of these countries’ eligible current face amounts of debt outstanding.
Investors cannot invest directly in an index. The returns for the Index would be lower if they included the effects of sales charges, operating expenses of a mutual fund, or taxes that may be paid by an investor.
| | |
| 6 | | Visit our website at pgim.com/investments |
| | | | |
|
| Credit Quality expressed as a percentage of total investments as of 10/31/20 (%) | |
| AA | | | 5.5 | |
| A | | | 8.0 | |
| BBB | | | 29.1 | |
| BB | | | 20.9 | |
| B | | | 22.8 | |
| CCC | | | 6.6 | |
| CC | | | 0.9 | |
| C | | | 0.4 | |
| Not Rated | | | 2.3 | |
| Cash/Cash Equivalents | | | 3.5 | |
| Total | | | 100.0 | |
Credit ratings reflect the highest rating assigned by a nationally recognized statistical rating organization (NRSRO) such as Moody’s Investors Service, Inc. (Moody’s), S&P Global Ratings (S&P), or Fitch, Inc. (Fitch). Credit ratings reflect the common nomenclature used by both S&P and Fitch. Where applicable, ratings are converted to the comparable S&P/Fitch rating tier nomenclature. These rating agencies are independent and are widely used. The Not Rated category consists of securities that have not been rated by a NRSRO. Credit ratings are subject to change.
| | | | | | |
|
| Distributions and Yields as of 10/31/20 |
| | Total Distributions
Paid for
One Year ($) | | SEC 30-Day
Subsidized
Yield* (%) | | SEC 30-Day
Unsubsidized
Yield** (%) |
| Class A | | 0.47 | | 4.63 | | 56.75 |
| Class C | | 0.40 | | 4.04 | | 185.13 |
| Class Z | | 0.50 | | 5.12 | | 4.14 |
| Class R6 | | 0.51 | �� | 5.36 | | 5.08 |
*SEC 30-Day Subsidized Yield (%)—A standardized yield calculation created by the Securities and Exchange Commission, it reflects the income earned during a 30-day period, after the deduction of the Fund’s net expenses (net of any expense waivers or reimbursements). The investor experience is represented by the SEC 30-Day Subsidized Yield.
**SEC 30-Day Unsubsidized Yield (%)—A standardized yield calculation created by the Securities and Exchange Commission, it reflects the income earned during a 30-day period, after the deduction of the Fund’s gross expenses. The investor experience is represented by the SEC 30-Day Subsidized Yield.
| | | | |
PGIM Emerging Markets Debt Hard Currency Fund | | | 7 | |
Strategy and Performance Overview (unaudited)
How did the Fund perform?
The PGIM Emerging Markets Debt Hard Currency Fund’s Class Z shares returned -1.43% in the 12-month reporting period that ended October 31, 2020, underperforming the 0.98% return of the JP Morgan Emerging Markets Bond Global Diversified Index (the Index).
What were the market conditions?
| | • | | Following several stable months, the last part of the reporting period was dominated by the global outbreak of COVID-19, its economic impact, and the resulting decline in risk sentiment around the globe. After generating stable returns during the latter part of 2019, emerging market debt declined sharply during the first quarter of 2020 as the dramatic global liquidity and confidence shocks related to the spread of COVID-19 and a drop in oil prices led to acute declines across most fixed income spread sectors. In response to unprecedented monetary and fiscal stimulus programs aimed at stabilizing the economy and financial markets, emerging market assets subsequently rose sharply, but spreads remained wider than their pre-COVID-19 levels at the end of the period. |
| | • | | While persistent trade war uncertainties and local episodes of social protest provided some headwinds, during the latter part of 2019 emerging market debt continued to benefit from accommodative central banks, low and range-bound developed markets rates, and an extended (albeit slow) global economic expansion. At the start of 2020, the global economy appeared poised to stabilize and perhaps even improve, with manufacturing bottoming out across a number of countries and a pipeline of monetary stimulus in place following a global round of central bank easing in the second half of 2019. The optimism generated by the US-China trade deal, a positive turn in the global technology cycle, and central banks’ bias to ease further, if needed, shifted perceived economic risks from being skewed to the downside to being more balanced. But then COVID-19 hit headlines, with person-to-person transmission reported in January 2020 marking a turning point. Financial markets then witnessed a dramatic turn of events, perhaps best exemplified by the sharp drop in US Treasury yields. |
| | • | | After generating gains throughout the latter part of 2019, emerging market debt declined sharply during the first quarter of 2020, with the intensity of the sell-off characterized by severe dislocations from retail outflows, particularly out of passive emerging market exchange-traded funds (ETFs). Although policy measures implemented by fiscal authorities, the Federal Reserve (the Fed), and other developed market central banks provided necessary liquidity and support during the latter part of the quarter, emerging market debt spreads and yields widened dramatically. Emerging market hard currency spreads widened 335 basis points (bps) during the quarter, while emerging market corporate bond spreads widened by 288 bps. (One basis point is 0.01%.) Emerging market local rates and emerging market currencies suffered similar sell-offs. |
| | |
| 8 | | Visit our website at pgim.com/investments |
| | • | | With the global economy decelerating rapidly and financial markets selling off sharply due to the pandemic and related lockdowns, the Fed and the European Central Bank reacted by cutting policy rates, initiating (or increasing) asset purchases, and expanding liquidity facilities. The unprecedented easing provided a tailwind for emerging market policymakers, allowing the main policy rates to be cut to all-time lows in most countries. While emerging market issuers did not benefit from the support offered to developed markets credit-related issuers, the sector benefited from the broad improvement in liquidity, a better growth outlook, a rise in oil prices, market access, and support from the International Monetary Fund’s Rapid Financing Instrument. |
| | • | | Following a difficult first quarter, emerging market assets staged a strong recovery in the second and third quarters of 2020. Risk-on sentiment amid improving economic data, a gradual reopening of economies, and broad policy support saw spreads and yields decline sharply from oversold levels over the last seven months of the period. In October, flows into emerging market bond funds continued to reverse the outflows seen earlier in the year by posting one of the strongest months of retail inflows into emerging market fixed income bond funds in all of 2020. For the month, hard currency funds saw almost $8 billion of inflows. At the beginning of April, year-to-date emerging market bond fund flows reached almost -$30 billion; but as of the end of the period, they had reversed nearly all those outflows. |
| | • | | However, at period-end, most emerging market assets remained wider than where they began 2020. Emerging market hard currency and corporate spreads ended the period at 421 bps and 366 bps, respectively, but remained wider than where they began the year. Meanwhile, emerging market currency performance was positive in the second and third quarters but remained in negative territory for the year as of period-end. |
What worked?
| | • | | Although overall country selection was negative, underweights to Lebanon, United Arab Emirates, Malaysia, and the Philippines, along with off-Index positioning in Serbia, contributed to the Fund’s performance during the reporting period. |
| | • | | While security selection overall detracted from performance, positioning in Argentina, Israel, Luxembourg, and Kuwait was positive. |
| | • | | Within currencies, overweights to the Chinese yuan and South Korean won, along with underweights to the Brazilian real and Turkish lira, contributed to performance. |
What didn’t work?
| | • | | Overall country selection was the largest detractor from the Fund’s performance during the period, with overweights to Argentina, Sri Lanka, Angola, Ghana, Mexico, and Indonesia being the largest detractors. The negative performance came primarily from an overweight in lower-quality assets and was exacerbated by the lack of liquidity in the |
| | | | |
PGIM Emerging Markets Debt Hard Currency Fund | | | 9 | |
Strategy and Performance Overview (continued)
| | market, as ETF outflows pushed prices lower. Sri Lanka was an underperformer in October, despite paying its $1 billion maturity, as hopes for an imminent International Monetary Fund program darkened amid a challenging growth outlook and high government debt load. Mexico sold off in the first quarter of 2020 and outperformed in subsequent months. Although it was downgraded, it started to improve given the risk-on environment along with a recovery in oil prices. |
| | • | | Security selection within Lebanon, Mexico, Indonesia, South Africa, and Venezuela detracted from returns over the period. |
| | • | | Within currencies, overweights to the Indonesia rupiah, Czech koruna, and Polish zloty were negative. The impact of COVID-19 weighed on riskier currencies. In this environment, developed market currencies such as the US dollar outperformed emerging market foreign currencies. Commodity currencies also lagged. |
Did the Fund use derivatives?
Currency positioning in the Fund was partially facilitated by the use of currency forward and option contracts. During the reporting period, the Fund’s currency positioning added to relative performance. The Fund also used futures and interest rate swaps, in part, to help manage duration and yield curve exposure, which collectively had a positive impact on performance.
Current outlook
| | • | | PGIM Fixed Income continues to believe current market dynamics present an attractive opportunity to actively add alpha-generating trades across hard currency bonds, local rates, and emerging market currencies. While remaining focused on the long term, PGIM Fixed Income believes there are certain high-conviction trades likely to perform in the near term. |
| | • | | Within hard currency and corporates, PGIM Fixed Income continues to see value in high-quality issuers and is adding long duration, investment grade, emerging market issuers with market access and substantial room for spread compression. PGIM Fixed Income’s focus has been adding selectively to higher-quality new issuance coming with concessions, such as China, while trimming higher-beta names, such as Sri Lanka, Bahrain, and Iraq, where it has less conviction. It continues to overweight single-B-rated issuers relative to the Index but has been reducing exposure due to uncertainty surrounding growth, commodities, and possibly less access to financial markets. PGIM Fixed Income sees select opportunities in emerging market corporates given their generally high credit ratings and spreads that have widened relative to sovereigns. |
| | • | | In emerging market currencies, PGIM Fixed Income is short the US dollar, taking the view that fiscal and monetary stimulus will be ample enough over the medium term to support global growth and, in turn, cause the US dollar to either remain stable or weaken further. PGIM Fixed Income favors higher-quality currencies in Asia and Europe. |
| | |
| 10 | | Visit our website at pgim.com/investments |
Fees and Expenses (unaudited)
As a shareholder of the Fund, you incur two types of costs: (1) transaction costs, including sales charges (loads) on purchase payments and redemptions, as applicable, and (2) ongoing costs, including management fees, distribution, and/or service (12b-1) fees, and other Fund expenses, as applicable. This example is intended to help you understand your ongoing costs (in dollars) of investing in the Fund and to compare these costs with the ongoing costs of investing in other mutual funds.
The example is based on an investment of $1,000 held through the six-month period ended October 31, 2020. The example is for illustrative purposes only; you should consult the Fund’s Prospectus for information on initial and subsequent minimum investment requirements.
Actual Expenses
The first line for each share class in the table on the following page provides information about actual account values and actual expenses. You may use the information on this line, together with the amount you invested, to estimate the expenses that you paid over the period. Simply divide your account value by $1,000 (for example, an $8,600 account value ÷ $1,000 = 8.6), then multiply the result by the number on the first line under the heading “Expenses Paid During the Six-Month Period” to estimate the expenses you paid on your account during this period.
Hypothetical Example for Comparison Purposes
The second line for each share class in the table on the following page provides information about hypothetical account values and hypothetical expenses based on the Fund’s actual expense ratio and an assumed rate of return of 5% per year before expenses, which is not the Fund’s actual return. The hypothetical account values and expenses may not be used to estimate the actual ending account balance or expenses you paid for the period. You may use this information to compare the ongoing costs of investing in the Fund and other funds. To do so, compare this 5% hypothetical example with the 5% hypothetical examples that appear in the shareholder reports of the other funds.
The Fund’s transfer agent may charge additional fees to holders of certain accounts that are not included in the expenses shown in the table on the following page. These fees apply to individual retirement accounts (IRAs) and Section 403(b) accounts. As of the close of the six-month period covered by the table, IRA fees included an annual maintenance fee of $15 per account (subject to a maximum annual maintenance fee of $25 for all accounts held by the same shareholder). Section 403(b) accounts are charged an annual $25 fiduciary maintenance fee. Some of the fees may vary in amount, or may be waived, based on your total account balance or the number of PGIM funds, including the Fund, that you own. You should consider the additional fees that were charged to your Fund account over the six-month period when you estimate the total ongoing expenses paid over the period
| | | | |
PGIM Emerging Markets Debt Hard Currency Fund | | | 11 | |
Fees and Expenses (continued)
and the impact of these fees on your ending account value, as these additional expenses are not reflected in the information provided in the expense table. Additional fees have the effect of reducing investment returns.
Please note that the expenses shown in the table are meant to highlight your ongoing costs only and do not reflect any transactional costs such as sales charges (loads). Therefore, the second line for each share class in the table is useful in comparing ongoing costs only and will not help you determine the relative total costs of owning different funds. In addition, if these transactional costs were included, your costs would have been higher.
| | | | | | | | | | | | | | | | | | |
| | | | |
PGIM Emerging
Markets Debt Hard
Currency Fund | | Beginning Account
Value
May 1, 2020 | | | Ending Account
Value
October 31, 2020 | | | Annualized
Expense Ratio
Based on the
Six-Month Period | | | Expenses Paid
During the
Six-Month Period* | |
| Class A | | Actual | | $ | 1,000.00 | | | $ | 1,149.70 | | | | 1.05 | % | | $ | 5.67 | |
| | Hypothetical | | $ | 1,000.00 | | | $ | 1,019.86 | | | | 1.05 | % | | $ | 5.33 | |
| Class C | | Actual | | $ | 1,000.00 | | | $ | 1,145.30 | | | | 1.80 | % | | $ | 9.71 | |
| | Hypothetical | | $ | 1,000.00 | | | $ | 1,016.09 | | | | 1.80 | % | | $ | 9.12 | |
| Class Z | | Actual | | $ | 1,000.00 | | | $ | 1,151.20 | | | | 0.75 | % | | $ | 4.06 | |
| | Hypothetical | | $ | 1,000.00 | | | $ | 1,021.37 | | | | 0.75 | % | | $ | 3.81 | |
| Class R6 | | Actual | | $ | 1,000.00 | | | $ | 1,150.50 | | | | 0.65 | % | | $ | 3.51 | |
| | | Hypothetical | | $ | 1,000.00 | | | $ | 1,021.87 | | | | 0.65 | % | | $ | 3.30 | |
*Fund expenses (net of fee waivers or subsidies, if any) for each share class are equal to the annualized expense ratio for each share class (provided in the table), multiplied by the average account value over the period, multiplied by the 184 days in the six-month period ended October 31, 2020, and divided by the 366 days in the Fund’s fiscal year ended October 31, 2020 (to reflect the six-month period). Expenses presented in the table include the expenses of any underlying portfolios in which the Fund may invest.
| | |
| 12 | | Visit our website at pgim.com/investments |
Schedule of Investments
as of October 31, 2020
| | | | | | | | | | | | | | |
| Description | | Interest Rate | | Maturity Date | | Principal Amount (000)# | | | Value | |
| | | | |
LONG-TERM INVESTMENTS 95.0% | | | | | | | | | | | | | | |
| | | | |
CORPORATE BONDS 24.4% | | | | | | | | | | | | | | |
| | | | |
Argentina 0.1% | | | | | | | | | | | | | | |
YPF SA, | | | | | | | | | | | | | | |
Sr. Unsec’d. Notes | | | 8.500 | % | | 07/28/25 | | | 155 | | | $ | 92,191 | |
| | | | |
Azerbaijan 0.4% | | | | | | | | | | | | | | |
Southern Gas Corridor CJSC, | | | | | | | | | | | | | | |
Gov’t. Gtd. Notes, 144A | | | 6.875 | | | 03/24/26 | | | 250 | | | | 284,485 | |
State Oil Co. of the Azerbaijan Republic, | | | | | | | | | | | | | | |
Sr. Unsec’d. Notes | | | 6.950 | | | 03/18/30 | | | 200 | | | | 237,629 | |
| | | | | | | | | | | | | | |
| | | | |
| | | | | | | | | | | | | 522,114 | |
| | | | |
Bahrain 0.4% | | | | | | | | | | | | | | |
Oil & Gas Holding Co. BSCC (The), | | | | | | | | | | | | | | |
Sr. Unsec’d. Notes | | | 7.625 | | | 11/07/24 | | | 200 | | | | 213,315 | |
Sr. Unsec’d. Notes | | | 8.375 | | | 11/07/28 | | | 200 | | | | 219,772 | |
| | | | | | | | | | | | | | |
| | | | |
| | | | | | | | | | | | | 433,087 | |
| | | | |
Brazil 2.4% | | | | | | | | | | | | | | |
Braskem America Finance Co., | | | | | | | | | | | | | | |
Gtd. Notes, 144A | | | 7.125 | | | 07/22/41 | | | 200 | | | | 213,323 | |
JSM Global Sarl, | | | | | | | | | | | | | | |
Gtd. Notes, 144A | | | 4.750 | | | 10/20/30 | | | 400 | | | | 404,084 | |
Petrobras Global Finance BV, | | | | | | | | | | | | | | |
Gtd. Notes | | | 5.093 | | | 01/15/30 | | | 467 | | | | 488,698 | |
Gtd. Notes | | | 5.600 | | | 01/03/31 | | | 200 | | | | 215,519 | |
Gtd. Notes | | | 5.999 | | | 01/27/28 | | | 95 | | | | 106,435 | |
Gtd. Notes | | | 6.900 | | | 03/19/49 | | | 250 | | | | 282,938 | |
Gtd. Notes | | | 7.375 | | | 01/17/27 | | | 261 | | | | 314,614 | |
Gtd. Notes | | | 8.750 | | | 05/23/26 | | | 387 | | | | 493,067 | |
Suzano Austria GmbH, | | | | | | | | | | | | | | |
Gtd. Notes | | | 3.750 | | | 01/15/31 | | | 150 | | | | 153,914 | |
Vale Overseas Ltd., | | | | | | | | | | | | | | |
Gtd. Notes | | | 3.750 | | | 07/08/30 | | | 90 | | | | 94,413 | |
| | | | | | | | | | | | | | |
| | | | |
| | | | | | | | | | | | | 2,767,005 | |
| | | | |
Chile 1.0% | | | | | | | | | | | | | | |
Corp. Nacional del Cobre de Chile, | | | | | | | | | | | | | | |
Sr. Unsec’d. Notes | | | 4.875 | | | 11/04/44 | | | 600 | | | | 733,288 | |
Sr. Unsec’d. Notes, 144A | | | 4.875 | | | 11/04/44 | | | 200 | | | | 244,429 | |
See Notes to Financial Statements.
PGIM Emerging Markets Debt Hard Currency Fund 13
Schedule of Investments (continued)
as of October 31, 2020
| | | | | | | | | | | | | | |
| Description | | Interest Rate | | Maturity Date | | Principal Amount (000)# | | | Value | |
| | | | |
CORPORATE BONDS (Continued) | | | | | | | | | | | | | | |
| | | | |
Chile (cont’d.) | | | | | | | | | | | | | | |
VTR Finance NV, | | | | | | | | | | | | | | |
Sr. Unsec’d. Notes | | | 6.375 | % | | 07/15/28 | | | 200 | | | $ | 213,761 | |
| | | | | | | | | | | | | | |
| | | | |
| | | | | | | | | | | | | 1,191,478 | |
| | | | |
China 1.7% | | | | | | | | | | | | | | |
CNAC HK Finbridge Co. Ltd., | | | | | | | | | | | | | | |
Gtd. Notes | | | 3.875 | | | 06/19/29 | | | 600 | | | | 631,534 | |
Country Garden Holdings Co. Ltd., | | | | | | | | | | | | | | |
Sr. Sec’d. Notes | | | 4.200 | | | 02/06/26 | | | 210 | | | | 218,395 | |
Sinochem Overseas Capital Co. Ltd., | | | | | | | | | | | | | | |
Gtd. Notes | | | 6.300 | | | 11/12/40 | | | 130 | | | | 187,251 | |
Sinopec Group Overseas Development 2012 Ltd., | | | | | | | | | | | | | | |
Gtd. Notes | | | 4.875 | | | 05/17/42 | | | 200 | | | | 257,872 | |
Sinopec Group Overseas Development 2017 Ltd., | | | | | | | | | | | | | | |
Gtd. Notes | | | 4.000 | | | 09/13/47 | | | 200 | | | | 235,119 | |
Sinopec Group Overseas Development 2018 Ltd., | | | | | | | | | | | | | | |
Gtd. Notes, 144A | | | 3.680 | | | 08/08/49 | | | 400 | | | | 448,073 | |
| | | | | | | | | | | | | | |
| | | | |
| | | | | | | | | | | | | 1,978,244 | |
| | | | |
Colombia 0.2% | | | | | | | | | | | | | | |
Grupo Aval Ltd., | | | | | | | | | | | | | | |
Gtd. Notes, 144A | | | 4.375 | | | 02/04/30 | | | 200 | | | | 194,693 | |
| | | | |
Guatemala 0.2% | | | | | | | | | | | | | | |
Energuate Trust, | | | | | | | | | | | | | | |
Gtd. Notes | | | 5.875 | | | 05/03/27 | | | 200 | | | | 207,438 | |
| | | | |
India 0.9% | | | | | | | | | | | | | | |
Azure Power Solar Energy Pvt. Ltd., | | | | | | | | | | | | | | |
Sr. Sec’d. Notes, 144A, MTN | | | 5.650 | | | 12/24/24 | | | 200 | | | | 210,772 | |
GMR Hyderabad International Airport Ltd., | | | | | | | | | | | | | | |
Sr. Sec’d. Notes | | | 4.250 | | | 10/27/27 | | | 200 | | | | 180,320 | |
HPCL-Mittal Energy Ltd., | | | | | | | | | | | | | | |
Sr. Unsec’d. Notes | | | 5.250 | | | 04/28/27 | | | 200 | | | | 203,277 | |
Indian Railway Finance Corp. Ltd., | | | | | | | | | | | | | | |
Sr. Unsec’d. Notes, EMTN | | | 3.950 | | | 02/13/50 | | | 200 | | | | 186,052 | |
Power Finance Corp. Ltd., | | | | | | | | | | | | | | |
Sr. Unsec’d. Notes, 144A, MTN | | | 6.150 | | | 12/06/28 | | | 200 | | | | 226,864 | |
| | | | | | | | | | | | | | |
| | | | |
| | | | | | | | | | | | | 1,007,285 | |
See Notes to Financial Statements.
14
| | | | | | | | | | | | | | |
| Description | | Interest Rate | | Maturity Date | | Principal Amount (000)# | | | Value | |
| | | | |
CORPORATE BONDS (Continued) | | | | | | | | | | | | | | |
| | | | |
Indonesia 2.6% | | | | | | | | | | | | | | |
Cikarang Listrindo Tbk PT, | | | | | | | | | | | | | | |
Sr. Unsec’d. Notes, 144A | | | 4.950 | % | | 09/14/26 | | | 200 | | | $ | 205,057 | |
Indonesia Asahan Aluminium Persero PT, | | | | | | | | | | | | | | |
Sr. Unsec’d. Notes | | | 6.530 | | | 11/15/28 | | | 220 | | | | 266,785 | |
Sr. Unsec’d. Notes, 144A | | | 4.750 | | | 05/15/25 | | | 200 | | | | 217,689 | |
Pelabuhan Indonesia III Persero PT, | | | | | | | | | | | | | | |
Sr. Unsec’d. Notes | | | 4.875 | | | 10/01/24 | | | 400 | | | | 438,578 | |
Pertamina Persero PT, | | | | | | | | | | | | | | |
Sr. Unsec’d. Notes | | | 6.000 | | | 05/03/42 | | | 200 | | | | 242,471 | |
Sr. Unsec’d. Notes, EMTN | | | 4.700 | | | 07/30/49 | | | 200 | | | | 213,248 | |
Sr. Unsec’d. Notes, EMTN | | | 6.500 | | | 11/07/48 | | | 200 | | | | 263,203 | |
Perusahaan Listrik Negara PT, | | | | | | | | | | | | | | |
Sr. Unsec’d. Notes | | | 2.875 | | | 10/25/25 | | EUR | 200 | | | | 248,404 | |
Perusahaan Perseroan Persero PT Perusahaan Listrik Negara, | | | | | | | | | | | | | | |
Sr. Unsec’d. Notes, 144A, MTN | | | 5.450 | | | 05/21/28 | | | 420 | | | | 493,508 | |
Saka Energi Indonesia PT, | | | | | | | | | | | | | | |
Sr. Unsec’d. Notes | | | 4.450 | | | 05/05/24 | | | 250 | | | | 229,802 | |
Sr. Unsec’d. Notes, 144A | | | 4.450 | | | 05/05/24 | | | 200 | | | | 183,842 | |
| | | | | | | | | | | | | | |
| | | | |
| | | | | | | | | | | | | 3,002,587 | |
| | | | |
Israel 0.2% | | | | | | | | | | | | | | |
Leviathan Bond Ltd., | | | | | | | | | | | | | | |
Sr. Sec’d. Notes, 144A | | | 6.125 | | | 06/30/25 | | | 200 | | | | 207,133 | |
| | | | |
Jamaica 0.1% | | | | | | | | | | | | | | |
Digicel International Finance Ltd./Digicel Holdings Bermuda Ltd., | | | | | | | | | | | | | | |
Gtd. Notes, 144A | | | 8.000 | | | 12/31/26 | | | 39 | | | | 28,833 | |
Gtd. Notes, 144A, Cash coupon 6.000% and PIK 7.000% | | | 13.000 | | | 12/31/25 | | | 49 | | | | 45,698 | |
Sr. Sec’d. Notes, 144A | | | 8.750 | | | 05/25/24 | | | 97 | | | | 96,888 | |
| | | | | | | | | | | | | | |
| | | | |
| | | | | | | | | | | | | 171,419 | |
| | | | |
Kazakhstan 1.3% | | | | | | | | | | | | | | |
Kazakhstan Temir Zholy Finance BV, | | | | | | | | | | | | | | |
Gtd. Notes | | | 6.950 | | | 07/10/42 | | | 400 | | | | 547,777 | |
KazMunayGas National Co. JSC, | | | | | | | | | | | | | | |
Sr. Unsec’d. Notes | | | 5.375 | | | 04/24/30 | | | 200 | | | | 238,676 | |
See Notes to Financial Statements.
PGIM Emerging Markets Debt Hard Currency Fund 15
Schedule of Investments (continued)
as of October 31, 2020
| | | | | | | | | | | | | | |
| Description | | Interest Rate | | Maturity Date | | Principal Amount (000)# | | | Value | |
| | | | |
CORPORATE BONDS (Continued) | | | | | | | | | | | | | | |
| | | | |
Kazakhstan (cont’d.) | | | | | | | | | | | | | | |
KazMunayGas National Co. JSC, (cont’d.) | | | | | | | | | | | | | | |
Sr. Unsec’d. Notes | | | 5.750 | % | | 04/19/47 | | | 400 | | | $ | 496,392 | |
Sr. Unsec’d. Notes | | | 6.375 | | | 10/24/48 | | | 200 | | | | 266,160 | |
| | | | | | | | | | | | | | |
| | | | |
| | | | | | | | | | | | | 1,549,005 | |
| | | | |
Kuwait 0.4% | | | | | | | | | | | | | | |
MEGlobal Canada ULC, | | | | | | | | | | | | | | |
Gtd. Notes, 144A, MTN | | | 5.875 | | | 05/18/30 | | | 400 | | | | 476,149 | |
| | | | |
Malaysia 1.3% | | | | | | | | | | | | | | |
Petroliam Nasional Bhd, | | | | | | | | | | | | | | |
Sr. Unsec’d. Notes | | | 7.625 | | | 10/15/26 | | | 250 | | | | 337,949 | |
Petronas Capital Ltd., | | | | | | | | | | | | | | |
Gtd. Notes, 144A, MTN | | | 4.550 | | | 04/21/50(a) | | | 800 | | | | 997,571 | |
Gtd. Notes, EMTN | | | 4.550 | | | 04/21/50 | | | 200 | | | | 249,393 | |
| | | | | | | | | | | | | | |
| | | | |
| | | | | | | | | | | | | 1,584,913 | |
| | | | |
Mexico 4.7% | | | | | | | | | | | | | | |
Cemex SAB de CV, | | | | | | | | | | | | | | |
Sr. Sec’d. Notes | | | 5.450 | | | 11/19/29 | | | 400 | | | | 422,876 | |
Mexico City Airport Trust, | | | | | | | | | | | | | | |
Sr. Sec’d. Notes | | | 4.250 | | | 10/31/26 | | | 400 | | | | 374,821 | |
Sr. Sec’d. Notes | | | 5.500 | | | 07/31/47 | | | 200 | | | | 170,662 | |
Nemak SAB de CV, | | | | | | | | | | | | | | |
Sr. Unsec’d. Notes | | | 4.750 | | | 01/23/25 | | | 200 | | | | 204,436 | |
Orbia Advance Corp. SAB de CV, | | | | | | | | | | | | | | |
Gtd. Notes | | | 5.500 | | | 01/15/48 | | | 200 | | | | 224,814 | |
Gtd. Notes, 144A | | | 5.500 | | | 01/15/48 | | | 225 | | | | 252,916 | |
Petroleos Mexicanos, | | | | | | | | | | | | | | |
Gtd. Notes | | | 4.750 | | | 02/26/29 | | EUR | 100 | | | | 102,255 | |
Gtd. Notes | | | 5.950 | | | 01/28/31 | | | 250 | | | | 208,967 | |
Gtd. Notes | | | 6.350 | | | 02/12/48 | | | 594 | | | | 453,691 | |
Gtd. Notes | | | 6.490 | | | 01/23/27 | | | 315 | | | | 293,156 | |
Gtd. Notes | | | 6.500 | | | 03/13/27 | | | 975 | | | | 906,125 | |
Gtd. Notes | | | 6.500 | | | 01/23/29 | | | 435 | | | | 388,007 | |
Gtd. Notes | | | 6.500 | | | 06/02/41 | | | 630 | | | | 484,871 | |
Gtd. Notes | | | 6.840 | | | 01/23/30 | | | 143 | | | | 127,453 | |
Gtd. Notes | | | 7.690 | | | 01/23/50 | | | 550 | | | | 459,761 | |
Gtd. Notes, MTN | | | 6.875 | | | 08/04/26 | | | 415 | | | | 399,048 | |
| | | | | | | | | | | | | | |
| | | | |
| | | | | | | | | | | | | 5,473,859 | |
See Notes to Financial Statements.
16
| | | | | | | | | | | | | | |
| Description | | Interest Rate | | Maturity Date | | Principal Amount (000)# | | | Value | |
| | | | |
CORPORATE BONDS (Continued) | | | | | | | | | | | | | | |
| | | | |
Peru 0.2% | | | | | | | | | | | | | | |
Nexa Resources SA, | | | | | | | | | | | | | | |
Gtd. Notes, 144A | | | 5.375 | % | | 05/04/27 | | | 210 | | | $ | 221,359 | |
| | | | |
Russia 1.1% | | | | | | | | | | | | | | |
Gazprom PJSC Via Gaz Capital SA, | | | | | | | | | | | | | | |
Sr. Unsec’d. Notes, EMTN | | | 7.288 | | | 08/16/37 | | | 300 | | | | 420,336 | |
Sr. Unsec’d. Notes, EMTN | | | 8.625 | | | 04/28/34 | | | 615 | | | | 918,098 | |
| | | | | | | | | | | | | | |
| | | | |
| | | | | | | | | | | | | 1,338,434 | |
| | | | |
Saudi Arabia 0.2% | | | | | | | | | | | | | | |
Saudi Arabian Oil Co., | | | | | | | | | | | | | | |
Sr. Unsec’d. Notes, EMTN | | | 4.250 | | | 04/16/39 | | | 200 | | | | 226,185 | |
| | | | |
South Africa 1.9% | | | | | | | | | | | | | | |
Eskom Holdings SOC Ltd., | | | | | | | | | | | | | | |
Gov’t. Gtd. Notes, MTN | | | 6.350 | | | 08/10/28 | | | 400 | | | | 413,027 | |
Sr. Unsec’d. Notes | | | 7.125 | | | 02/11/25 | | | 600 | | | | 561,987 | |
Sr. Unsec’d. Notes, EMTN | | | 6.750 | | | 08/06/23 | | | 400 | | | | 379,165 | |
Sr. Unsec’d. Notes, MTN | | | 8.450 | | | 08/10/28 | | | 660 | | | | 628,940 | |
MTN Mauritius Investments Ltd., | | | | | | | | | | | | | | |
Gtd. Notes, 144A | | | 6.500 | | | 10/13/26 | | | 200 | | | | 223,390 | |
| | | | | | | | | | | | | | |
| | | | |
| | | | | | | | | | | | | 2,206,509 | |
| | | | |
Thailand 0.1% | | | | | | | | | | | | | | |
Thaioil Treasury Center Co. Ltd., | | | | | | | | | | | | | | |
Gtd. Notes, 144A, MTN | | | 3.750 | | | 06/18/50 | | | 200 | | | | 183,980 | |
| | | | |
Trinidad & Tobago 0.2% | | | | | | | | | | | | | | |
Trinidad Petroleum Holdings Ltd., | | | | | | | | | | | | | | |
Sr. Sec’d. Notes, 144A | | | 9.750 | | | 06/15/26 | | | 166 | | | | 185,668 | |
| | | | |
Tunisia 0.4% | | | | | | | | | | | | | | |
Banque Centrale de Tunisie International Bond, | | | | | | | | | | | | | | |
Sr. Unsec’d. Notes | | | 5.625 | | | 02/17/24 | | EUR | 140 | | | | 139,949 | |
Sr. Unsec’d. Notes | | | 5.750 | | | 01/30/25 | | | 200 | | | | 168,976 | |
Sr. Unsec’d. Notes | | | 6.750 | | | 10/31/23 | | EUR | 200 | | | | 209,439 | |
| | | | | | | | | | | | | | |
| | | | |
| | | | | | | | | | | | | 518,364 | |
See Notes to Financial Statements.
PGIM Emerging Markets Debt Hard Currency Fund 17
Schedule of Investments (continued)
as of October 31, 2020
| | | | | | | | | | | | | | |
| Description | | Interest Rate | | Maturity Date | | Principal Amount (000)# | | | Value | |
| | | | |
CORPORATE BONDS (Continued) | | | | | | | | | | | | | | |
| | | | |
Turkey 0.2% | | | | | | | | | | | | | | |
Turkiye Sinai Kalkinma Bankasi A/S, | | | | | | | | | | | | | | |
Sr. Unsec’d. Notes, 144A | | | 6.000 | % | | 01/23/25 | | | 200 | | | $ | 186,380 | |
| | | | |
Ukraine 0.4% | | | | | | | | | | | | | | |
NAK Naftogaz Ukraine via Kondor Finance PLC, | | | | | | | | | | | | | | |
Sr. Unsec’d. Notes | | | 7.125 | | | 07/19/24 | | EUR | 300 | | | | 334,241 | |
State Savings Bank of Ukraine Via SSB #1 PLC, | | | | | | | | | | | | | | |
Sr. Unsec’d. Notes | | | 9.625 | | | 03/20/25 | | | 90 | | | | 91,534 | |
| | | | | | | | | | | | | | |
| | | | |
| | | | | | | | | | | | | 425,775 | |
| | | | |
United Arab Emirates 1.4% | | | | | | | | | | | | | | |
Abu Dhabi Crude Oil Pipeline LLC, | | | | | | | | | | | | | | |
Sr. Sec’d. Notes | | | 3.650 | | | 11/02/29 | | | 200 | | | | 225,980 | |
Sr. Sec’d. Notes | | | 4.600 | | | 11/02/47 | | | 200 | | | | 238,327 | |
Abu Dhabi National Energy Co. PJSC, | | | | | | | | | | | | | | |
Sr. Unsec’d. Notes, 144A | | | 4.000 | | | 10/03/49 | | | 200 | | | | 233,052 | |
DP World PLC, | | | | | | | | | | | | | | |
Sr. Unsec’d. Notes, EMTN | | | 6.850 | | | 07/02/37 | | | 600 | | | | 751,852 | |
ICD Funding Ltd., | | | | | | | | | | | | | | |
Gtd. Notes | | | 4.625 | | | 05/21/24 | | | 200 | | | | 212,767 | |
| | | | | | | | | | | | | | |
| | | | |
| | | | | | | | | | | | | 1,661,978 | |
| | | | |
United States 0.2% | | | | | | | | | | | | | | |
JBS Investments II GmbH, | | | | | | | | | | | | | | |
Gtd. Notes, 144A | | | 5.750 | | | 01/15/28 | | | 200 | | | | 210,673 | |
| | | | |
Venezuela 0.0% | | | | | | | | | | | | | | |
Petroleos de Venezuela SA, | | | | | | | | | | | | | | |
First Lien | | | 8.500 | | | 10/27/20(d) | | | 205 | | | | 51,250 | |
Sr. Unsec’d. Notes | | | 5.375 | | | 04/12/27(d) | | | 205 | | | | 6,970 | |
Sr. Unsec’d. Notes | | | 6.000 | | | 05/16/24(d) | | | 45 | | | | 1,620 | |
Sr. Unsec’d. Notes | | | 6.000 | | | 11/15/26(d) | | | 65 | | | | 2,210 | |
| | | | | | | | | | | | | | |
| | | | |
| | | | | | | | | | | | | 62,050 | |
| | | | |
Vietnam 0.2% | | | | | | | | | | | | | | |
Mong Duong Finance Holdings BV, | | | | | | | | | | | | | | |
Sr. Sec’d. Notes | | | 5.125 | | | 05/07/29 | | | 250 | | | | 255,160 | |
| | | | | | | | | | | | | | |
| | | | |
TOTAL CORPORATE BONDS
(cost $29,077,297) | | | | | | | | | | | | | 28,541,115 | |
| | | | | | | | | | | | | | |
See Notes to Financial Statements.
18
| | | | | | | | | | | | | | |
| Description | | Interest Rate | | Maturity Date | | Principal Amount (000)# | | | Value | |
| | | | |
SOVEREIGN BONDS 70.6% | | | | | | | | | | | | | | |
| | | | |
Angola 1.6% | | | | | | | | | | | | | | |
Angolan Government International Bond, | | | | | | | | | | | | | | |
Sr. Unsec’d. Notes | | | 8.250 | % | | 05/09/28 | | | 600 | | | $ | 472,090 | |
Sr. Unsec’d. Notes | | | 9.375 | | | 05/08/48 | | | 200 | | | | 152,933 | |
Sr. Unsec’d. Notes | | | 9.500 | | | 11/12/25 | | | 750 | | | | 643,216 | |
Sr. Unsec’d. Notes, 144A | | | 9.375 | | | 05/08/48 | | | 200 | | | | 152,933 | |
Sr. Unsec’d. Notes, 144A, MTN | | | 8.000 | | | 11/26/29 | | | 200 | | | | 155,196 | |
Sr. Unsec’d. Notes, EMTN | | | 8.000 | | | 11/26/29 | | | 400 | | | | 310,392 | |
| | | | | | | | | | | | | | |
| | | | |
| | | | | | | | | | | | | 1,886,760 | |
| | | | |
Argentina 2.4% | | | | | | | | | | | | | | |
Argentina Bonar Bonds, | | | | | | | | | | | | | | |
Bonds | | | 0.125 | (cc) | | 07/09/30 | | | 2 | | | | 595 | |
Unsec’d. Notes | | | 1.000 | | | 07/09/29 | | | 12 | | | | 4,614 | |
Argentine Republic Government International Bond, | | | | | | | | | | | | | | |
Sr. Unsec’d. Notes | | | 0.125 | (cc) | | 07/09/30 | | | 3,160 | | | | 1,156,401 | |
Sr. Unsec’d. Notes | | | 0.125 | (cc) | | 07/09/35 | | | 102 | | | | 33,266 | |
Sr. Unsec’d. Notes | | | 0.125 | (cc) | | 01/09/38 | | | 1,930 | | | | 719,430 | |
Sr. Unsec’d. Notes | | | 0.125 | (cc) | | 07/09/41 | | | 847 | | | | 285,790 | |
Sr. Unsec’d. Notes | | | 0.125 | (cc) | | 07/09/46 | | | 335 | | | | 109,608 | |
Sr. Unsec’d. Notes | | | 1.000 | | | 07/09/29 | | | 254 | | | | 104,473 | |
Provincia de Buenos Aires, | | | | | | | | | | | | | | |
Sr. Unsec’d. Notes | | | 4.000 | | | 05/01/20(d) | | EUR | 15 | | | | 6,504 | |
Sr. Unsec’d. Notes | | | 5.375 | | | 01/20/23 | | EUR | 100 | | | | 35,350 | |
Sr. Unsec’d. Notes | | | 9.125 | | | 03/16/24 | | | 300 | | | | 97,703 | |
Sr. Unsec’d. Notes | | | 9.950 | | | 06/09/21 | | | 620 | | | | 203,291 | |
Sr. Unsec’d. Notes, 144A | | | 9.125 | | | 03/16/24 | | | 245 | | | | 79,790 | |
| | | | | | | | | | | | | | |
| | | | |
| | | | | | | | | | | | | 2,836,815 | |
| | | | |
Bahrain 1.3% | | | | | | | | | | | | | | |
Bahrain Government International Bond, | | | | | | | | | | | | | | |
Sr. Unsec’d. Notes | | | 6.750 | | | 09/20/29 | | | 200 | | | | 216,154 | |
Sr. Unsec’d. Notes | | | 7.000 | | | 01/26/26 | | | 200 | | | | 225,334 | |
Sr. Unsec’d. Notes | | | 7.000 | | | 10/12/28 | | | 400 | | | | 440,869 | |
Sr. Unsec’d. Notes | | | 7.375 | | | 05/14/30 | | | 200 | | | | 221,785 | |
Sr. Unsec’d. Notes | | | 7.500 | | | 09/20/47 | | | 400 | | | | 421,690 | |
| | | | | | | | | | | | | | |
| | | | |
| | | | | | | | | | | | | 1,525,832 | |
See Notes to Financial Statements.
PGIM Emerging Markets Debt Hard Currency Fund 19
Schedule of Investments (continued)
as of October 31, 2020
| | | | | | | | | | | | | | |
| Description | | Interest Rate | | Maturity Date | | Principal Amount (000)# | | | Value | |
| | | | |
SOVEREIGN BONDS (Continued) | | | | | | | | | | | | | | |
| | | | |
Belarus 0.5% | | | | | | | | | | | | | | |
Republic of Belarus International Bond, | | | | | | | | | | | | | | |
Sr. Unsec’d. Notes | | | 6.875 | % | | 02/28/23 | | | 200 | | | $ | 197,597 | |
Sr. Unsec’d. Notes | | | 7.625 | | | 06/29/27 | | | 425 | | | | 421,554 | |
| | | | | | | | | | | | | | |
| | | | |
| | | | | | | | | | | | | 619,151 | |
| | | | |
Brazil 2.4% | | | | | | | | | | | | | | |
Brazil Minas SPE via State of Minas Gerais, | | | | | | | | | | | | | | |
Gov’t. Gtd. Notes | | | 5.333 | | | 02/15/28 | | | 228 | | | | 240,482 | |
Brazilian Government International Bond, | | | | | | | | | | | | | | |
Sr. Unsec’d. Notes | | | 5.625 | | | 01/07/41 | | | 270 | | | | 295,508 | |
Sr. Unsec’d. Notes | | | 7.125 | | | 01/20/37 | | | 950 | | | | 1,191,389 | |
Sr. Unsec’d. Notes | | | 8.250 | | | 01/20/34 | | | 828 | | | | 1,121,536 | |
| | | | | | | | | | | | | | |
| | | | |
| | | | | | | | | | | | | 2,848,915 | |
| | | | |
Cameroon 0.4% | | | | | | | | | | | | | | |
Republic of Cameroon International Bond, | | | | | | | | | | | | | | |
Sr. Unsec’d. Notes | | | 9.500 | | | 11/19/25 | | | 400 | | | | 420,634 | |
| | | | |
Colombia 1.9% | | | | | | | | | | | | | | |
Colombia Government International Bond, | | | | | | | | | | | | | | |
Sr. Unsec’d. Notes | | | 6.125 | | | 01/18/41 | | | 360 | | | | 463,135 | |
Sr. Unsec’d. Notes | | | 7.375 | | | 09/18/37 | | | 1,015 | | | | 1,425,004 | |
Sr. Unsec’d. Notes | | | 10.375 | | | 01/28/33 | | | 200 | | | | 311,265 | |
| | | | | | | | | | | | | | |
| | | | |
| | | | | | | | | | | | | 2,199,404 | |
| | | | |
Congo (Republic) 0.2% | | | | | | | | | | | | | | |
Congolese International Bond, | | | | | | | | | | | | | | |
Sr. Unsec’d. Notes | | | 6.000 | | | 06/30/29 | | | 268 | | | | 205,149 | |
| | | | |
Costa Rica 1.2% | | | | | | | | | | | | | | |
Costa Rica Government International Bond, | | | | | | | | | | | | | | |
Sr. Unsec’d. Notes | | | 4.250 | | | 01/26/23 | | | 200 | | | | 184,234 | |
Sr. Unsec’d. Notes | | | 4.375 | | | 04/30/25 | | | 600 | | | | 509,521 | |
Sr. Unsec’d. Notes | | | 6.125 | | | 02/19/31 | | | 200 | | | | 167,080 | |
Sr. Unsec’d. Notes | | | 7.000 | | | 04/04/44 | | | 200 | | | | 158,956 | |
Sr. Unsec’d. Notes | | | 7.158 | | | 03/12/45 | | | 400 | | | | 315,941 | |
| | | | | | | | | | | | | | |
| | | | |
| | | | | | | | | | | | | 1,335,732 | |
See Notes to Financial Statements.
20
| | | | | | | | | | | | | | |
| Description | | Interest Rate | | Maturity Date | | Principal Amount (000)# | | | Value | |
| | | | |
SOVEREIGN BONDS (Continued) | | | | | | | | | | | | | | |
| | | | |
Croatia 0.3% | | | | | | | | | | | | | | |
Croatia Government International Bond, | | | | | | | | | | | | | | |
Unsec’d. Notes | | | 1.500 | % | | 06/17/31 | | EUR | 285 | | | $ | 349,543 | |
| | | | |
Dominican Republic 3.0% | | | | | | | | | | | | | | |
Dominican Republic International Bond, | | | | | | | | | | | | | | |
Sr. Unsec’d. Notes | | | 5.500 | | | 01/27/25 | | | 100 | | | | 107,075 | |
Sr. Unsec’d. Notes | | | 5.875 | | | 04/18/24 | | | 555 | | | | 588,424 | |
Sr. Unsec’d. Notes | | | 6.875 | | | 01/29/26 | | | 400 | | | | 453,038 | |
Sr. Unsec’d. Notes | | | 7.450 | | | 04/30/44 | | | 1,400 | | | | 1,600,637 | |
Sr. Unsec’d. Notes, 144A | | | 5.875 | | | 01/30/60 | | | 425 | | | | 407,606 | |
Sr. Unsec’d. Notes, 144A | | | 6.000 | | | 07/19/28 | | | 320 | | | | 353,315 | |
| | | | | | | | | | | | | | |
| | | | |
| | | | | | | | | | | | | 3,510,095 | |
| | | | |
Ecuador 1.6% | | | | | | | | | | | | | | |
Ecuador Government International Bond, | | | | | | | | | | | | | | |
Sr. Unsec’d. Notes, 144A | | | 0.500 | (cc) | | 07/31/30 | | | 639 | | | | 424,873 | |
Sr. Unsec’d. Notes, 144A | | | 0.500 | (cc) | | 07/31/35 | | | 1,488 | | | | 822,318 | |
Sr. Unsec’d. Notes, 144A | | | 0.500 | (cc) | | 07/31/40 | | | 1,111 | | | | 552,932 | |
Sr. Unsec’d. Notes, 144A | | | 7.187 | (s) | | 07/31/30 | | | 179 | | | | 81,221 | |
| | | | | | | | | | | | | | |
| | | | |
| | | | | | | | | | | | | 1,881,344 | |
| | | | |
Egypt 2.2% | | | | | | | | | | | | | | |
Egypt Government International Bond, | | | | | | | | | | | | | | |
Sr. Unsec’d. Notes | | | 7.625 | | | 05/29/32 | | | 200 | | | | 202,404 | |
Sr. Unsec’d. Notes, 144A | | | 8.700 | | | 03/01/49 | | | 210 | | | | 210,898 | |
Sr. Unsec’d. Notes, 144A, MTN | | | 4.750 | | | 04/11/25 | | EUR | 100 | | | | 114,821 | |
Sr. Unsec’d. Notes, 144A, MTN | | | 4.750 | | | 04/16/26 | | EUR | 200 | | | | 224,830 | |
Sr. Unsec’d. Notes, 144A, MTN | | | 6.375 | | | 04/11/31 | | EUR | 420 | | | | 467,957 | |
Sr. Unsec’d. Notes, 144A, MTN | | | 7.600 | | | 03/01/29 | | | 200 | | | | 207,949 | |
Sr. Unsec’d. Notes, 144A, MTN | | | 8.500 | | | 01/31/47 | | | 255 | | | | 253,211 | |
Sr. Unsec’d. Notes, EMTN | | | 4.750 | | | 04/11/25 | | EUR | 100 | | | | 114,821 | |
Sr. Unsec’d. Notes, EMTN | | | 4.750 | | | 04/16/26 | | EUR | 200 | | | | 224,830 | |
Sr. Unsec’d. Notes, EMTN | | | 5.625 | | | 04/16/30 | | EUR | 100 | | | | 108,021 | |
Sr. Unsec’d. Notes, MTN | | | 7.500 | | | 01/31/27 | | | 200 | | | | 212,231 | |
Sr. Unsec’d. Notes, MTN | | | 8.500 | | | 01/31/47 | | | 250 | | | | 248,246 | |
| | | | | | | | | | | | | | |
| | | | |
| | | | | | | | | | | | | 2,590,219 | |
| | | | |
El Salvador 1.1% | | | | | | | | | | | | | | |
El Salvador Government International Bond, | | | | | | | | | | | | | | |
Sr. Unsec’d. Notes | | | 5.875 | | | 01/30/25 | | | 355 | | | | 293,838 | |
See Notes to Financial Statements.
PGIM Emerging Markets Debt Hard Currency Fund 21
Schedule of Investments (continued)
as of October 31, 2020
| | | | | | | | | | | | | | |
| Description | | Interest Rate | | Maturity Date | | Principal Amount (000)# | | | Value | |
| | | | |
SOVEREIGN BONDS (Continued) | | | | | | | | | | | | | | |
| | | | |
El Salvador (cont’d.) | | | | | | | | | | | | | | |
El Salvador Government International Bond, (cont’d.) | | | | | | | | | | | | | | |
Sr. Unsec’d. Notes | | | 6.375 | % | | 01/18/27 | | | 425 | | | $ | 348,669 | |
Sr. Unsec’d. Notes | | | 7.625 | | | 02/01/41 | | | 150 | | | | 116,228 | |
Sr. Unsec’d. Notes | | | 7.650 | | | 06/15/35 | | | 57 | | | | 45,255 | |
Sr. Unsec’d. Notes | | | 7.750 | | | 01/24/23 | | | 145 | | | | 132,032 | |
Sr. Unsec’d. Notes | | | 8.250 | | | 04/10/32 | | | 425 | | | | 354,852 | |
| | | | | | | | | | | | | | |
| | | | |
| | | | | | | | | | | | | 1,290,874 | |
| | | | |
Gabon 0.7% | | | | | | | | | | | | | | |
Gabon Government International Bond, | | | | | | | | | | | | | | |
Bonds | | | 6.375 | | | 12/12/24 | | | 200 | | | | 191,002 | |
Sr. Unsec’d. Notes | | | 6.950 | | | 06/16/25 | | | 400 | | | | 378,982 | |
Sr. Unsec’d. Notes, 144A | | | 6.625 | | | 02/06/31 | | | 215 | | | | 192,774 | |
| | | | | | | | | | | | | | |
| | | | |
| | | | | | | | | | | | | 762,758 | |
| | | | |
Ghana 1.7% | | | | | | | | | | | | | | |
Ghana Government International Bond, | | | | | | | | | | | | | | |
Bank Gtd. Notes | | | 10.750 | | | 10/14/30 | | | 400 | | | | 489,584 | |
Sr. Unsec’d. Notes | | | 7.875 | | | 03/26/27 | | | 400 | | | | 388,327 | |
Sr. Unsec’d. Notes | | | 8.125 | | | 01/18/26 | | | 200 | | | | 201,670 | |
Sr. Unsec’d. Notes | | | 8.125 | | | 03/26/32 | | | 200 | | | | 183,883 | |
Sr. Unsec’d. Notes, 144A | | | 6.375 | | | 02/11/27 | | | 400 | | | | 372,013 | |
Sr. Unsec’d. Notes, 144A | | | 7.875 | | | 02/11/35 | | | 200 | | | | 177,471 | |
Sr. Unsec’d. Notes, 144A | | | 8.950 | | | 03/26/51 | | | 205 | | | | 183,792 | |
| | | | | | | | | | | | | | |
| | | | |
| | | | | | | | | | | | | 1,996,740 | |
| | | | |
Guatemala 0.8% | | | | | | | | | | | | | | |
Guatemala Government Bond, | | | | | | | | | | | | | | |
Sr. Unsec’d. Notes | | | 4.875 | | | 02/13/28 | | | 400 | | | | 450,136 | |
Sr. Unsec’d. Notes | | | 6.125 | | | 06/01/50 | | | 400 | | | | 493,189 | |
| | | | | | | | | | | | | | |
| | | | |
| | | | | | | | | | | | | 943,325 | |
| | | | |
Honduras 0.5% | | | | | | | | | | | | | | |
Honduras Government International Bond, | | | | | | | | | | | | | | |
Sr. Unsec’d. Notes | | | 6.250 | | | 01/19/27 | | | 150 | | | | 168,465 | |
Sr. Unsec’d. Notes | | | 7.500 | | | 03/15/24 | | | 400 | | | | 440,456 | |
| | | | | | | | | | | | | | |
| | | | |
| | | | | | | | | | | | | 608,921 | |
See Notes to Financial Statements.
22
| | | | | | | | | | | | | | |
| Description | | Interest Rate | | Maturity Date | | Principal Amount (000)# | | | Value | |
| | | | |
SOVEREIGN BONDS (Continued) | | | | | | | | | | | | | | |
| | | | |
Hungary 1.3% | | | | | | | | | | | | | | |
Hungary Government International Bond, | | | | | | | | | | | | | | |
Sr. Unsec’d. Notes | | | 1.750 | % | | 06/05/35 | | EUR | 415 | | | $ | 521,337 | |
Sr. Unsec’d. Notes | | | 7.625 | | | 03/29/41 | | | 546 | | | | 970,071 | |
| | | | | | | | | | | | | | |
| | | | |
| | | | | | | | | | | | | 1,491,408 | |
| | | | |
India 0.4% | | | | | | | | | | | | | | |
Export-Import Bank of India, | | | | | | | | | | | | | | |
Sr. Unsec’d. Notes, 144A, MTN | | | 3.250 | | | 01/15/30 | | | 400 | | | | 407,241 | |
| | | | |
Indonesia 2.3% | | | | | | | | | | | | | | |
Indonesia Government International Bond, | | | | | | | | | | | | | | |
Sr. Unsec’d. Notes | | | 1.450 | | | 09/18/26 | | EUR | 100 | | | | 119,128 | |
Sr. Unsec’d. Notes | | | 4.450 | | | 04/15/70 | | | 200 | | | | 235,248 | |
Sr. Unsec’d. Notes | | | 7.750 | | | 01/17/38 | | | 360 | | | | 553,976 | |
Sr. Unsec’d. Notes | | | 8.500 | | | 10/12/35 | | | 450 | | | | 719,455 | |
Sr. Unsec’d. Notes, EMTN | | | 3.750 | | | 06/14/28 | | EUR | 100 | | | | 136,661 | |
Sr. Unsec’d. Notes, EMTN | | | 4.625 | | | 04/15/43 | | | 200 | | | | 233,852 | |
Sr. Unsec’d. Notes, EMTN | | | 5.125 | | | 01/15/45 | | | 200 | | | | 250,646 | |
Sr. Unsec’d. Notes, EMTN | | | 5.250 | | | 01/17/42 | | | 200 | | | | 251,279 | |
Sr. Unsec’d. Notes, EMTN | | | 6.750 | | | 01/15/44 | | | 100 | | | | 149,901 | |
| | | | | | | | | | | | | | |
| | | | |
| | | | | | | | | | | | | 2,650,146 | |
| | | | |
Iraq 0.8% | | | | | | | | | | | | | | |
Iraq International Bond, | | | | | | | | | | | | | | |
Sr. Unsec’d. Notes | | | 5.800 | | | 01/15/28 | | | 469 | | | | 403,413 | |
Sr. Unsec’d. Notes | | | 6.752 | | | 03/09/23 | | | 600 | | | | 558,038 | |
| | | | | | | | | | | | | | |
| | | | |
| | | | | | | | | | | | | 961,451 | |
| | | | |
Israel 1.3% | | | | | | | | | | | | | | |
Israel Government International Bond, | | | | | | | | | | | | | | |
Sr. Unsec’d. Notes | | | 3.875 | | | 07/03/50 | | | 200 | | | | 230,748 | |
Sr. Unsec’d. Notes | | | 4.500 | | | 01/30/43 | | | 600 | | | | 775,420 | |
Sr. Unsec’d. Notes | | | 4.500 | | | 04/03/2120 | | | 400 | | | | 520,403 | |
| | | | | | | | | | | | | | |
| | | | |
| | | | | | | | | | | | | 1,526,571 | |
| | | | |
Ivory Coast 1.2% | | | | | | | | | | | | | | |
Ivory Coast Government International Bond, | | | | | | | | | | | | | | |
Sr. Unsec’d. Notes | | | 5.250 | | | 03/22/30 | | EUR | 200 | | | | 225,799 | |
Sr. Unsec’d. Notes | | | 5.875 | | | 10/17/31 | | EUR | 200 | | | | 228,135 | |
See Notes to Financial Statements.
PGIM Emerging Markets Debt Hard Currency Fund 23
Schedule of Investments (continued)
as of October 31, 2020
| | | | | | | | | | | | | | |
| Description | | Interest Rate | | Maturity Date | | Principal Amount (000)# | | | Value | |
| | | | |
SOVEREIGN BONDS (Continued) | | | | | | | | | | | | | | |
| | | | |
Ivory Coast (cont’d.) | | | | | | | | | | | | | | |
Ivory Coast Government International Bond, (cont’d.) | | | | | | | | | | | | | | |
Sr. Unsec’d. Notes | | | 6.375 | % | | 03/03/28 | | | 400 | | | $ | 419,989 | |
Sr. Unsec’d. Notes | | | 6.625 | | | 03/22/48 | | EUR | 240 | | | | 263,238 | |
Sr. Unsec’d. Notes | | | 6.875 | | | 10/17/40 | | EUR | 250 | | | | 284,853 | |
| | | | | | | | | | | | | | |
| | | | |
| | | | | | | | | | | | | 1,422,014 | |
| | | | |
Jamaica 0.9% | | | | | | | | | | | | | | |
Jamaica Government International Bond, | | | | | | | | | | | | | | |
Sr. Unsec’d. Notes | | | 7.625 | | | 07/09/25 | | | 225 | | | | 258,127 | |
Sr. Unsec’d. Notes | | | 7.875 | | | 07/28/45 | | | 200 | | | | 259,159 | |
Sr. Unsec’d. Notes | | | 8.000 | | | 03/15/39 | | | 200 | | | | 265,229 | |
Sr. Unsec’d. Notes | | | 9.250 | | | 10/17/25 | | | 200 | | | | 241,163 | |
| | | | | | | | | | | | | | |
| | | | |
| | | | | | | | | | | | | 1,023,678 | |
| | | | |
Jordan 0.5% | | | | | | | | | | | | | | |
Jordan Government International Bond, | | | | | | | | | | | | | | |
Sr. Unsec’d. Notes | | | 6.125 | | | 01/29/26 | | | 200 | | | | 209,991 | |
Sr. Unsec’d. Notes | | | 7.375 | | | 10/10/47 | | | 400 | | | | 412,320 | |
| | | | | | | | | | | | | | |
| | | | |
| | | | | | | | | | | | | 622,311 | |
| | | | |
Kazakhstan 0.5% | | | | | | | | | | | | | | |
Kazakhstan Government International Bond, | | | | | | | | | | | | | | |
Sr. Unsec’d. Notes, EMTN | | | 6.500 | | | 07/21/45 | | | 400 | | | | 628,187 | |
| | | | |
Kenya 0.9% | | | | | | | | | | | | | | |
Kenya Government International Bond, | | | | | | | | | | | | | | |
Sr. Unsec’d. Notes | | | 6.875 | | | 06/24/24 | | | 200 | | | | 211,741 | |
Sr. Unsec’d. Notes | | | 7.000 | | | 05/22/27 | | | 400 | | | | 416,126 | |
Sr. Unsec’d. Notes | | | 8.250 | | | 02/28/48 | | | 200 | | | | 203,918 | |
Sr. Unsec’d. Notes, 144A | | | 8.250 | | | 02/28/48 | | | 200 | | | | 203,918 | |
| | | | | | | | | | | | | | |
| | | | |
| | | | | | | | | | | | | 1,035,703 | |
| | | | |
Lebanon 0.4% | | | | | | | | | | | | | | |
Lebanon Government International Bond, | | | | | | | | | | | | | | |
Sr. Unsec’d. Notes | | | 6.000 | | | 01/27/23(d) | | | 191 | | | | 27,443 | |
Sr. Unsec’d. Notes | | | 6.650 | | | 04/22/24(d) | | | 172 | | | | 24,494 | |
Sr. Unsec’d. Notes | | | 6.750 | | | 11/29/27(d) | | | 170 | | | | 24,279 | |
Sr. Unsec’d. Notes | | | 7.000 | | | 04/22/31(d) | | | 115 | | | | 16,362 | |
Sr. Unsec’d. Notes, EMTN | | | 6.100 | | | 10/04/22(d) | | | 75 | | | | 11,099 | |
See Notes to Financial Statements.
24
| | | | | | | | | | | | | | |
| Description | | Interest Rate | | Maturity Date | | Principal Amount (000)# | | | Value | |
| | | | |
SOVEREIGN BONDS (Continued) | | | | | | | | | | | | | | |
| | | | |
Lebanon (cont’d.) | | | | | | | | | | | | | | |
Lebanon Government International Bond, (cont’d.) | | | | | | | | | | | | | | |
Sr. Unsec’d. Notes, EMTN | | | 6.850 | % | | 05/25/29(d) | | | 335 | | | $ | 47,372 | |
Sr. Unsec’d. Notes, GMTN | | | 6.250 | | | 05/27/22(d) | | | 245 | | | | 36,576 | |
Sr. Unsec’d. Notes, GMTN | | | 6.250 | | | 11/04/24(d) | | | 320 | | | | 45,477 | |
Sr. Unsec’d. Notes, GMTN | | | 6.375 | | | 03/09/20(d) | | | 220 | | | | 36,107 | |
Sr. Unsec’d. Notes, GMTN | | | 6.400 | | | 05/26/23(d) | | | 250 | | | | 36,013 | |
Sr. Unsec’d. Notes, GMTN | | | 6.600 | | | 11/27/26(d) | | | 30 | | | | 4,378 | |
Sr. Unsec’d. Notes, GMTN | | | 6.650 | | | 02/26/30(d) | | | 715 | | | | 100,819 | |
Sr. Unsec’d. Notes, GMTN | | | 7.150 | | | 11/20/31(d) | | | 415 | | | | 57,947 | |
| | | | | | | | | | | | | | |
| | | | |
| | | | | | | | | | | | | 468,366 | |
| | | | |
Luxembourg 0.1% | | | | | | | | | | | | | | |
Ecuador Social Bond Sarl, | | | | | | | | | | | | | | |
Gov’t. Gtd. Notes, 144A | | | 4.573 | (s) | | 01/30/35 | | | 193 | | | | 135,592 | |
| | | | |
Malaysia 1.7% | | | | | | | | | | | | | | |
1MDB Global Investments Ltd., | | | | | | | | | | | | | | |
Sr. Unsec’d. Notes | | | 4.400 | | | 03/09/23 | | | 2,000 | | | | 1,986,497 | |
| | | | |
Mexico 0.9% | | | | | | | | | | | | | | |
Mexico Government International Bond, | | | | | | | | | | | | | | |
Sr. Unsec’d. Notes, GMTN | | | 5.750 | | | 10/12/2110 | | | 126 | | | | 146,142 | |
Sr. Unsec’d. Notes, MTN | | | 6.050 | | | 01/11/40 | | | 484 | | | | 607,496 | |
Sr. Unsec’d. Notes, MTN | | | 6.750 | | | 09/27/34 | | | 203 | | | | 271,856 | |
| | | | | | | | | | | | | | |
| | | | |
| | | | | | | | | | | | | 1,025,494 | |
| | | | |
Morocco 0.2% | | | | | | | | | | | | | | |
Morocco Government International Bond, | | | | | | | | | | | | | | |
Sr. Unsec’d. Notes | | | 1.500 | | | 11/27/31 | | EUR | 200 | | | | 216,123 | |
| | | | |
Mozambique 0.4% | | | | | | | | | | | | | | |
Mozambique International Bond, | | | | | | | | | | | | | | |
Unsec’d. Notes | | | 5.000 | | | 09/15/31 | | | 400 | | | | 329,717 | |
Unsec’d. Notes, 144A | | | 5.000 | | | 09/15/31 | | | 200 | | | | 164,858 | |
| | | | | | | | | | | | | | |
| | | | |
| | | | | | | | | | | | | 494,575 | |
| | | | |
Namibia 0.2% | | | | | | | | | | | | | | |
Namibia International Bonds, | | | | | | | | | | | | | | |
Sr. Unsec’d. Notes | | | 5.250 | | | 10/29/25 | | | 200 | | | | 202,360 | |
See Notes to Financial Statements.
PGIM Emerging Markets Debt Hard Currency Fund 25
Schedule of Investments (continued)
as of October 31, 2020
| | | | | | | | | | | | | | |
| Description | | Interest Rate | | Maturity Date | | Principal Amount (000)# | | | Value | |
| | | | |
SOVEREIGN BONDS (Continued) | | | | | | | | | | | | | | |
| | | | |
Nigeria 1.9% | | | | | | | | | | | | | | |
Nigeria Government International Bond, | | | | | | | | | | | | | | |
Sr. Unsec’d. Notes | | | 7.625 | % | | 11/21/25 | | | 600 | | | $ | 630,048 | |
Sr. Unsec’d. Notes | | | 7.875 | | | 02/16/32 | | | 200 | | | | 193,857 | |
Sr. Unsec’d. Notes | | | 8.747 | | | 01/21/31 | | | 800 | | | | 829,706 | |
Sr. Unsec’d. Notes, 144A | | | 7.696 | | | 02/23/38 | | | 200 | | | | 184,152 | |
Sr. Unsec’d. Notes, EMTN | | | 6.500 | | | 11/28/27 | | | 400 | | | | 387,829 | |
| | | | | | | | | | | | | | |
| | | | |
| | | | | | | | | | | | | 2,225,592 | |
| | | | |
Oman 1.4% | | | | | | | | | | | | | | |
Oman Government International Bond, | | | | | | | | | | | | | | |
Sr. Unsec’d. Notes | | | 4.750 | | | 06/15/26 | | | 630 | | | | 576,389 | |
Sr. Unsec’d. Notes | | | 5.375 | | | 03/08/27 | | | 200 | | | | 183,392 | |
Sr. Unsec’d. Notes | | | 6.500 | | | 03/08/47 | | | 625 | | | | 504,791 | |
Sr. Unsec’d. Notes | | | 6.750 | | | 01/17/48 | | | 200 | | | | 163,099 | |
Sr. Unsec’d. Notes, 144A | | | 6.750 | | | 01/17/48 | | | 200 | | | | 163,099 | |
| | | | | | | | | | | | | | |
| | | | |
| | | | | | | | | | | | | 1,590,770 | |
| | | | |
Pakistan 1.0% | | | | | | | | | | | | | | |
Pakistan Government International Bond, | | | | | | | | | | | | | | |
Sr. Unsec’d. Notes | | | 6.875 | | | 12/05/27 | | | 400 | | | | 391,158 | |
Sr. Unsec’d. Notes | | | 8.250 | | | 09/30/25 | | | 770 | | | | 808,400 | |
| | | | | | | | | | | | | | |
| | | | |
| | | | | | | | | | | | | 1,199,558 | |
| | | | |
Panama 1.7% | | | | | | | | | | | | | | |
Panama Government International Bond, | | | | | | | | | | | | | | |
Sr. Unsec’d. Notes | | | 3.870 | | | 07/23/60 | | | 200 | | | | 225,327 | |
Sr. Unsec’d. Notes | | | 4.500 | | | 04/16/50 | | | 200 | | | | 246,099 | |
Sr. Unsec’d. Notes | | | 4.500 | | | 04/01/56 | | | 200 | | | | 246,736 | |
Sr. Unsec’d. Notes | | | 6.700 | | | 01/26/36 | | | 760 | | | | 1,096,763 | |
Sr. Unsec’d. Notes | | | 9.375 | | | 04/01/29 | | | 105 | | | | 161,187 | |
| | | | | | | | | | | | | | |
| | | | |
| | | | | | | | | | | | | 1,976,112 | |
| | | | |
Papua New Guinea 0.3% | | | | | | | | | | | | | | |
Papua New Guinea Government International Bond, | | | | | | | | | | | | | | |
Sr. Unsec’d. Notes, 144A | | | 8.375 | | | 10/04/28 | | | 400 | | | | 395,809 | |
See Notes to Financial Statements.
26
| | | | | | | | | | | | | | |
| Description | | Interest Rate | | Maturity Date | | Principal Amount (000)# | | | Value | |
| | | | |
SOVEREIGN BONDS (Continued) | | | | | | | | | | | | | | |
| | | | |
Paraguay 0.4% | | | | | | | | | | | | | | |
Paraguay Government International Bond, | | | | | | | | | | | | | | |
Sr. Unsec’d. Notes | | | 4.700 | % | | 03/27/27 | | | 200 | | | $ | 225,733 | |
Sr. Unsec’d. Notes | | | 6.100 | | | 08/11/44 | | | 200 | | | | 257,882 | |
| | | | | | | | | | | | | | |
| | | | |
| | | | | | | | | | | | | 483,615 | |
| | | | |
Peru 1.6% | | | | | | | | | | | | | | |
Peruvian Government International Bond, | | | | | | | | | | | | | | |
Sr. Unsec’d. Notes | | | 2.783 | | | 01/23/31 | | | 30 | | | | 32,402 | |
Sr. Unsec’d. Notes | | | 5.625 | | | 11/18/50 | | | 140 | | | | 222,641 | |
Sr. Unsec’d. Notes | | | 6.550 | | | 03/14/37 | | | 225 | | | | 339,887 | |
Sr. Unsec’d. Notes | | | 8.750 | | | 11/21/33 | | | 780 | | | | 1,314,736 | |
| | | | | | | | | | | | | | |
| | | | |
| | | | | | | | | | | | | 1,909,666 | |
| | | | |
Philippines 2.1% | | | | | | | | | | | | | | |
Philippine Government International Bond, | | | | | | | | | | | | | | |
Sr. Unsec’d. Notes | | | 2.950 | | | 05/05/45 | | | 400 | | | | 419,189 | |
Sr. Unsec’d. Notes | | | 3.700 | | | 03/01/41 | | | 400 | | | | 456,947 | |
Sr. Unsec’d. Notes | | | 3.950 | | | 01/20/40 | | | 700 | | | | 821,848 | |
Sr. Unsec’d. Notes | | | 6.375 | | | 10/23/34 | | | 100 | | | | 144,563 | |
Sr. Unsec’d. Notes | | | 7.750 | | | 01/14/31 | | | 420 | | | | 635,877 | |
| | | | | | | | | | | | | | |
| | | | |
| | | | | | | | | | | | | 2,478,424 | |
| | | | |
Qatar 3.0% | | | | | | | | | | | | | | |
Qatar Government International Bond, | | | | | | | | | | | | | | |
Sr. Unsec’d. Notes | | | 4.400 | | | 04/16/50 | | | 200 | | | | 253,817 | |
Sr. Unsec’d. Notes | | | 5.103 | | | 04/23/48 | | | 1,200 | | | | 1,650,570 | |
Sr. Unsec’d. Notes, 144A | | | 4.400 | | | 04/16/50 | | | 200 | | | | 253,816 | |
Sr. Unsec’d. Notes, 144A | | | 4.817 | | | 03/14/49 | | | 810 | | | | 1,075,545 | |
Sr. Unsec’d. Notes, 144A | | | 5.103 | | | 04/23/48 | | | 200 | | | | 275,095 | |
| | | | | | | | | | | | | | |
| | | | |
| | | | | | | | | | | | | 3,508,843 | |
| | | | |
Romania 1.8% | | | | | | | | | | | | | | |
Romanian Government International Bond, | | | | | | | | | | | | | | |
Sr. Unsec’d. Notes | | | 5.125 | | | 06/15/48 | | | 344 | | | | 414,092 | |
Sr. Unsec’d. Notes, 144A | | | 4.000 | | | 02/14/51 | | | 70 | | | | 71,124 | |
Sr. Unsec’d. Notes, 144A | | | 5.125 | | | 06/15/48 | | | 44 | | | | 52,965 | |
Sr. Unsec’d. Notes, 144A, MTN | | | 4.625 | | | 04/03/49 | | EUR | 71 | | | | 102,579 | |
Sr. Unsec’d. Notes, EMTN | | | 3.875 | | | 10/29/35 | | EUR | 40 | | | | 54,099 | |
Sr. Unsec’d. Notes, EMTN | | | 4.125 | | | 03/11/39 | | EUR | 310 | | | | 426,436 | |
See Notes to Financial Statements.
PGIM Emerging Markets Debt Hard Currency Fund 27
Schedule of Investments (continued)
as of October 31, 2020
| | | | | | | | | | | | | | | | |
| Description | | Interest Rate | | Maturity Date | | | Principal Amount (000)# | | | Value | |
| | | | |
SOVEREIGN BONDS (Continued) | | | | | | | | | | | | | | | | |
| | | | |
Romania (cont’d.) | | | | | | | | | | | | | | | | |
Romanian Government International Bond, (cont’d.) | | | | | | | | | | | | | | | | |
Sr. Unsec’d. Notes, EMTN | | | 4.625 | % | | | 04/03/49 | | | EUR | 257 | | | $ | 371,307 | |
Sr. Unsec’d. Notes, EMTN | | | 6.125 | | | | 01/22/44 | | | | 456 | | | | 612,348 | |
| | | | | | | | | | | | | | | | |
| | | | |
| | | | | | | | | | | | | | | 2,104,950 | |
| | | | |
Russia 2.4% | | | | | | | | | | | | | | | | |
Russian Foreign Bond - Eurobond, | | | | | | | | | | | | | | | | |
Sr. Unsec’d. Notes | | | 5.100 | | | | 03/28/35 | | | | 1,000 | | | | 1,214,641 | |
Sr. Unsec’d. Notes | | | 5.625 | | | | 04/04/42 | | | | 1,000 | | | | 1,311,976 | |
Sr. Unsec’d. Notes | | | 12.750 | | | | 06/24/28 | | | | 140 | | | | 238,517 | |
| | | | | | | | | | | | | | | | |
| | | | |
| | | | | | | | | | | | | | | 2,765,134 | |
| | | | |
Saudi Arabia 2.3% | | | | | | | | | | | | | | | | |
Saudi Government International Bond, | | | | | | | | | | | | | | | | |
Sr. Unsec’d. Notes | | | 5.250 | | | | 01/16/50 | | | | 200 | | | | 263,551 | |
Sr. Unsec’d. Notes, 144A | | | 5.250 | | | | 01/16/50 | | | | 400 | | | | 527,102 | |
Sr. Unsec’d. Notes, EMTN | | | 4.500 | | | | 10/26/46 | | | | 800 | | | | 944,629 | |
Sr. Unsec’d. Notes, EMTN | | | 4.625 | | | | 10/04/47 | | | | 400 | | | | 481,871 | |
Sr. Unsec’d. Notes, EMTN | | | 5.000 | | | | 04/17/49 | | | | 400 | | | | 509,088 | |
| | | | | | | | | | | | | | | | |
| | | | |
| | | | | | | | | | | | | | | 2,726,241 | |
| | | | |
Senegal 0.3% | | | | | | | | | | | | | | | | |
Senegal Government International Bond, | | | | | | | | | | | | | | | | |
Sr. Unsec’d. Notes, 144A | | | 6.750 | | | | 03/13/48 | | | | 405 | | | | 395,178 | |
| | | | |
Serbia 0.6% | | | | | | | | | | | | | | | | |
Serbia International Bond, | | | | | | | | | | | | | | | | |
Sr. Unsec’d. Notes | | | 1.500 | | | | 06/26/29 | | | EUR | 500 | | | | 568,065 | |
Sr. Unsec’d. Notes, 144A | | | 3.125 | | | | 05/15/27 | | | EUR | 100 | | | | 126,725 | |
| | | | | | | | | | | | | | | | |
| | | | |
| | | | | | | | | | | | | | | 694,790 | |
| | | | |
South Africa 1.0% | | | | | | | | | | | | | | | | |
Republic of South Africa Government International | | | | | | | | | | | | | | | | |
Bond, | | | | | | | | | | | | | | | | |
Sr. Unsec’d. Notes | | | 4.300 | | | | 10/12/28 | | | | 200 | | | | 193,947 | |
Sr. Unsec’d. Notes | | | 4.875 | | | | 04/14/26 | | | | 200 | | | | 207,377 | |
Sr. Unsec’d. Notes | | | 5.000 | | | | 10/12/46 | | | | 200 | | | | 168,210 | |
Sr. Unsec’d. Notes | | | 5.650 | | | | 09/27/47 | | | | 200 | | | | 179,922 | |
See Notes to Financial Statements.
28
| | | | | | | | | | | | | | | | |
| Description | | Interest Rate | | Maturity Date | | | Principal Amount (000)# | | | Value | |
| | | | |
SOVEREIGN BONDS (Continued) | | | | | | | | | | | | | | | | |
| | | | |
South Africa (cont’d.) | | | | | | | | | | | | | | | | |
Republic of South Africa Government International Bond, (cont’d.) | | | | | | | | | | | | | |
Sr. Unsec’d. Notes | | | 5.750 | % | | | 09/30/49 | | | | 200 | | | $ | 179,902 | |
Sr. Unsec’d. Notes | | | 6.250 | | | | 03/08/41 | | | | 200 | | | | 196,773 | |
| | | | |
| | | | | | | | | | | | | | | 1,126,131 | |
| | | | |
Sri Lanka 1.4% | | | | | | | | | | | | | | | | |
Sri Lanka Government International Bond, | | | | | | | | | | | | | | | | |
Sr. Unsec’d. Notes | | | 5.750 | | | | 01/18/22 | | | | 200 | | | | 135,354 | |
Sr. Unsec’d. Notes | | | 5.750 | | | | 04/18/23 | | | | 400 | | | | 230,185 | |
Sr. Unsec’d. Notes | | | 6.200 | | | | 05/11/27 | | | | 200 | | | | 108,059 | |
Sr. Unsec’d. Notes | | | 6.350 | | | | 06/28/24 | | | | 200 | | | | 113,210 | |
Sr. Unsec’d. Notes | | | 6.850 | | | | 11/03/25 | | | | 750 | | | | 420,269 | |
Sr. Unsec’d. Notes | | | 7.850 | | | | 03/14/29 | | | | 250 | | | | 136,171 | |
Sr. Unsec’d. Notes, 144A | | | 5.750 | | | | 04/18/23 | | | | 200 | | | | 115,093 | |
Sr. Unsec’d. Notes, 144A | | | 6.750 | | | | 04/18/28 | | | | 200 | | | | 107,913 | |
Sr. Unsec’d. Notes, 144A | | | 6.850 | | | | 03/14/24 | | | | 265 | | | | 151,048 | |
Sr. Unsec’d. Notes, 144A | | | 7.850 | | | | 03/14/29 | | | | 200 | | | | 108,937 | |
| | | | |
| | | | | | | | | | | | | | | 1,626,239 | |
| | | | |
Turkey 2.6% | | | | | | | | | | | | | | | | |
Turkey Government International Bond, | | | | | | | | | | | | | | | | |
Sr. Unsec’d. Notes | | | 4.250 | | | | 04/14/26 | | | | 400 | | | | 355,523 | |
Sr. Unsec’d. Notes | | | 4.875 | | | | 10/09/26 | | | | 300 | | | | 270,840 | |
Sr. Unsec’d. Notes | | | 5.600 | | | | 11/14/24 | | | | 320 | | | | 307,771 | |
Sr. Unsec’d. Notes | | | 5.750 | | | | 03/22/24 | | | | 600 | | | | 583,367 | |
Sr. Unsec’d. Notes | | | 5.750 | | | | 05/11/47 | | | | 200 | | | | 154,545 | |
Sr. Unsec’d. Notes | | | 6.000 | | | | 03/25/27 | | | | 280 | | | | 264,320 | |
Sr. Unsec’d. Notes | | | 6.000 | | | | 01/14/41 | | | | 400 | | | | 322,743 | |
Sr. Unsec’d. Notes | | | 6.350 | | | | 08/10/24 | | | | 200 | | | | 196,964 | |
Sr. Unsec’d. Notes | | | 6.875 | | | | 03/17/36 | | | | 194 | | | | 178,102 | |
Sr. Unsec’d. Notes | | | 7.375 | | | | 02/05/25 | | | | 100 | | | | 102,219 | |
Sr. Unsec’d. Notes | | | 7.625 | | | | 04/26/29 | | | | 80 | | | | 80,539 | |
Turkiye Ihracat Kredi Bankasi A/S, | | | | | | | | | | | | | | | | |
Sr. Unsec’d. Notes | | | 8.250 | | | | 01/24/24 | | | | 200 | | | | 202,464 | |
| | | | |
| | | | | | | | | | | | | | | 3,019,397 | |
| | | | |
Ukraine 3.7% | | | | | | | | | | | | | | | | |
Ukraine Government International Bond, | | | | | | | | | | | | | | | | |
Sr. Unsec’d. Notes | | | 0.000 | (cc) | | | 05/31/40 | | | | 285 | | | | 247,473 | |
Sr. Unsec’d. Notes | | | 4.375 | | | | 01/27/30 | | | EUR | 110 | | | | 107,331 | |
See Notes to Financial Statements.
PGIM Emerging Markets Debt Hard Currency Fund 29
Schedule of Investments (continued)
as of October 31, 2020
| | | | | | | | | | | | | | | | |
| Description | | Interest Rate | | Maturity Date | | | Principal Amount (000)# | | | Value | |
| | | | |
SOVEREIGN BONDS (Continued) | | | | | | | | | | | | | | | | |
| | | | |
Ukraine (cont’d.) | | | | | | | | | | | | | | | | |
Ukraine Government International Bond, (cont’d.) | | | | | | | | | | | | | | | | |
Sr. Unsec’d. Notes | | | 6.750 | % | | | 06/20/26 | | | EUR | 800 | | | $ | 918,252 | |
Sr. Unsec’d. Notes | | | 7.750 | | | | 09/01/25 | | | | 475 | | | | 486,160 | |
Sr. Unsec’d. Notes | | | 7.750 | | | | 09/01/26 | | | | 600 | | | | 608,342 | |
Sr. Unsec’d. Notes | | | 7.750 | | | | 09/01/27 | | | | 200 | | | | 201,888 | |
Sr. Unsec’d. Notes | | | 8.994 | | | | 02/01/24 | | | | 200 | | | | 213,502 | |
Sr. Unsec’d. Notes | | | 9.750 | | | | 11/01/28 | | | | 965 | | | | 1,052,359 | |
Sr. Unsec’d. Notes, 144A | | | 0.000 | (cc) | | | 05/31/40 | | | | 35 | | | | 30,392 | |
Sr. Unsec’d. Notes, 144A | | | 4.375 | | | | 01/27/30 | | | EUR | 100 | | | | 97,573 | |
Sr. Unsec’d. Notes, 144A | | | 7.253 | | | | 03/15/33 | | | | 200 | | | | 188,209 | |
Ukreximbank Via Biz Finance PLC, | | | | | | | | | | | | | | | | |
Sr. Unsec’d. Notes | | | 9.750 | | | | 01/22/25 | | | | 200 | | | | 205,174 | |
| | | | |
| | | | | | | | | | | | | | | 4,356,655 | |
| | | | |
United Arab Emirates 1.3% | | | | | | | | | | | | | | | | |
Abu Dhabi Government International Bond, | | | | | | | | | | | | | | | | |
Sr. Unsec’d. Notes | | | 3.125 | | | | 09/30/49 | | | | 200 | | | | 209,729 | |
Sr. Unsec’d. Notes, 144A | | | 3.125 | | | | 09/30/49 | | | | 200 | | | | 209,729 | |
Sr. Unsec’d. Notes, 144A, MTN | | | 3.875 | | | | 04/16/50 | | | | 200 | | | | 236,828 | |
Emirate of Dubai Government International Bonds, | | | | | | | | | | | | | | | | |
Sr. Unsec’d. Notes, EMTN | | | 5.250 | | | | 01/30/43 | | | | 400 | | | | 454,271 | |
Finance Department Government of Sharjah, | | | | | | | | | | | | | | | | |
Sr. Unsec’d. Notes, 144A, MTN | | | 4.000 | | | | 07/28/50 | | | | 200 | | | | 198,504 | |
Sr. Unsec’d. Notes, MTN | | | 4.000 | | | | 07/28/50 | | | | 200 | | | | 198,504 | |
| | | | |
| | | | | | | | | | | | | | | 1,507,565 | |
| | | | |
Uruguay 1.5% | | | | | | | | | | | | | | | | |
Uruguay Government International Bond, | | | | | | | | | | | | | | | | |
Sr. Unsec’d. Notes | | | 4.125 | | | | 11/20/45 | | | | 120 | | | | 142,168 | |
Sr. Unsec’d. Notes | | | 4.975 | | | | 04/20/55 | | | | 350 | | | | 462,885 | |
Sr. Unsec’d. Notes | | | 5.100 | | | | 06/18/50 | | | | 350 | | | | 466,601 | |
Sr. Unsec’d. Notes | | | 7.625 | | | | 03/21/36 | | | | 430 | | | | 669,531 | |
| | | | |
| | | | | | | | | | | | | | | 1,741,185 | |
| | | | |
Venezuela 0.0% | | | | | | | | | | | | | | | | |
Venezuela Government International Bond, | | | | | | | | | | | | | | | | |
Sr. Unsec’d. Notes | | | 12.750 | | | | 08/23/22(d) | | | | 180 | | | | 16,625 | |
See Notes to Financial Statements.
30
| | | | | | | | | | | | | | | | |
Description | | Interest Rate | | Maturity Date | | | Principal Amount (000)# | | | Value | |
| | | | |
SOVEREIGN BONDS (Continued) | | | | | | | | | | | | | | | | |
| | | | |
Zambia 0.5% | | | | | | | | | | | | | | | | |
Zambia Government International Bond, | | | | | | | | | | | | | | | | |
Sr. Unsec’d. Notes | | | 8.500 | % | | | 04/14/24 | | | | 600 | | | $ | 262,201 | |
Sr. Unsec’d. Notes | | | 8.970 | | | | 07/30/27 | | | | 400 | | | | 170,912 | |
Unsec’d. Notes | | | 5.375 | | | | 09/20/22 | | | | 200 | | | | 87,094 | |
| | | | |
| | | | | | | | | | | | | | | 520,207 | |
| | | | |
TOTAL SOVEREIGN BONDS
(cost $85,186,876) | | | | | | | | | | | | | | | 82,478,614 | |
| | | | |
| | | | | | | | Shares | | | | |
| | | | |
COMMON STOCK 0.0% | | | | | | | | | | | | | | | | |
| | | | |
Colombia | | | | | | | | | | | | | | | | |
Frontera Energy Corp.
(cost $4,017) | | | | | | | | | | | 2,232 | | | | 3,571 | |
| | | | |
TOTAL LONG-TERM INVESTMENTS
(cost $114,268,190) | | | | | | | | | | | | | | | 111,023,300 | |
| | | | |
SHORT-TERM INVESTMENTS 4.2% | | | | | | | | | | | | | | | | |
| | | | |
AFFILIATED MUTUAL FUNDS 4.2% | | | | | | | | | | | | | | | | |
PGIM Core Ultra Short Bond Fund(w) | | | | | | | | | | | 3,839,427 | | | | 3,839,427 | |
PGIM Institutional Money Market Fund
(cost $1,047,645; includes $1,047,614 of cash collateral for securities on loan)(b)(w) | | | | | | | | | | | 1,047,959 | | | | 1,047,645 | |
| | | | |
TOTAL SHORT-TERM INVESTMENTS
(cost $4,887,072) | | | | | | | | | | | | | | | 4,887,072 | |
| | | | |
TOTAL INVESTMENTS, BEFORE OPTIONS WRITTEN 99.2%
(cost $119,155,262) | | | | | | | | | | | | | | | 115,910,372 | |
| | | | |
OPTIONS WRITTEN*~ (0.0)%
(premiums received $30,544) | | | | | | | | | | | | | | | (30,447 | ) |
| | | | |
TOTAL INVESTMENTS, NET OF OPTIONS WRITTEN 99.2%
(cost $119,124,718) | | | | | | | | | | | | | | | 115,879,925 | |
Other assets in excess of liabilities(z) 0.8% | | | | | | | | | | | | | | | 911,357 | |
| | | | |
NET ASSETS 100.0% | | | | | | | | | | | | | | $ | 116,791,282 | |
| | | | | | | | | | | | | | | | |
See Notes to Financial Statements.
PGIM Emerging Markets Debt Hard Currency Fund 31
Schedule of Investments (continued)
as of October 31, 2020
Below is a list of the abbreviation(s) used in the annual report:
AUD—Australian Dollar
BRL—Brazilian Real
CLP—Chilean Peso
CNH—Chinese Renminbi
COP—Colombian Peso
CZK—Czech Koruna
EUR—Euro
HUF—Hungarian Forint
IDR—Indonesian Rupiah
ILS—Israeli Shekel
INR—Indian Rupee
JPY—Japanese Yen
KRW—South Korean Won
MXN—Mexican Peso
NZD—New Zealand Dollar
PEN—Peruvian Nuevo Sol
PHP—Philippine Peso
PLN—Polish Zloty
RUB—Russian Ruble
SGD—Singapore Dollar
THB—Thai Baht
TRY—Turkish Lira
TWD—New Taiwanese Dollar
USD—US Dollar
ZAR—South African Rand
144A—Security was purchased pursuant to Rule 144A under the Securities Act of 1933 and, pursuant to the requirements of Rule 144A, may not be resold except to qualified institutional buyers.
EMTN—Euro Medium Term Note
GMTN—Global Medium Term Note
LIBOR—London Interbank Offered Rate
M—Monthly payment frequency for swaps
MTN—Medium Term Note
OTC—Over-the-counter
PIK—Payment-in-Kind
PJSC—Public Joint-Stock Company
Q—Quarterly payment frequency for swaps
| * | Non-income producing security. |
| # | Principal or notional amount is shown in U.S. dollars unless otherwise stated. |
| ~ | See tables subsequent to the Schedule of Investments for options detail. |
| (a) | All or a portion of security is on loan. The aggregate market value of such securities, including those sold and pending settlement, is $1,005,308; cash collateral of $1,047,614 (included in liabilities) was received with which the Series purchased highly liquid short-term investments. In the event of significant appreciation in value of securities on loan on the last business day of the reporting period, the Series may reflect a collateral value that is less than the market value of the loaned securities and such shortfall is remedied the following business day. |
| (b) | Represents security, or portion thereof, purchased with cash collateral received for securities on loan and includes dividend reinvestment. |
| (cc) | Variable rate instrument. The rate shown is based on the latest available information as of October 31, 2020. Certain variable rate securities are not based on a published reference rate and spread but are determined by the issuer or agent and are based on current market conditions. These securities do not indicate a reference rate and spread in their description. |
See Notes to Financial Statements.
32
| (d) | Represents issuer in default on interest payments and/or principal repayment. Non-income producing security. Such securities may be post-maturity. |
| (s) | Represents zero coupon bond or principal only security. Rate represents yield to maturity at purchase date. |
| (w) | PGIM Investments LLC, the manager of the Series, also serves as manager of the PGIM Core Ultra Short Bond Fund and PGIM Institutional Money Market Fund. |
| (z) | Includes net unrealized appreciation/(depreciation) and/or market value of the below holdings which are excluded from the Schedule of Investments: |
Options Written:
OTC Traded
| | | | | | | | | | | | | | | | | | | | | | |
Description | | Call/ Put | | Counterparty | | Expiration
Date | | | Strike | | | Contracts | | Notional
Amount
(000)# | | Value | |
Currency Option USD vs CLP | | Call | | Morgan Stanley & Co. International PLC | | | 11/12/20 | | | | 800.00 | | | — | | | 73 | | | $ | (198 | ) |
Currency Option USD vs CLP | | Call | | Morgan Stanley & Co. International PLC | | | 11/12/20 | | | | 800.00 | | | — | | | 73 | | | | (198 | ) |
Currency Option USD vs COP | | Call | | JPMorgan Chase Bank, N.A. | | | 11/10/20 | | | | 3,850.00 | | | — | | | 96 | | | | (1,470 | ) |
Currency Option USD vs COP | | Call | | JPMorgan Chase Bank, N.A. | | | 11/10/20 | | | | 3,850.00 | | | — | | | 98 | | | | (1,508 | ) |
Currency Option USD vs COP | | Call | | JPMorgan Chase Bank, N.A. | | | 11/10/20 | | | | 3,850.00 | | | — | | | 96 | | | | (1,470 | ) |
Currency Option USD vs COP | | Call | | JPMorgan Chase Bank, N.A. | | | 11/10/20 | | | | 3,850.00 | | | — | | | 98 | | | | (1,508 | ) |
Currency Option USD vs CNH | | Put | | Morgan Stanley & Co. International PLC | | | 11/11/20 | | | | 6.80 | | | — | | | 440 | | | | (8,166 | ) |
Currency Option USD vs CNH | | Put | | Morgan Stanley & Co. International PLC | | | 11/11/20 | | | | 6.80 | | | — | | | 440 | | | | (8,166 | ) |
Currency Option USD vs KRW | | Put | | Citibank, N.A. | | | 11/11/20 | | | | 1,140.00 | | | — | | | 146 | | | | (1,772 | ) |
Currency Option USD vs KRW | | Put | | Citibank, N.A. | | | 11/11/20 | | | | 1,140.00 | | | — | | | 146 | | | | (1,772 | ) |
Currency Option USD vs MXN | | Put | | Goldman Sachs International | | | 11/05/20 | | | | 20.80 | | | — | | | 145 | | | | (703 | ) |
Currency Option USD vs MXN | | Put | | JPMorgan Chase Bank, N.A. | | | 11/05/20 | | | | 20.80 | | | — | | | 145 | | | | (703 | ) |
Currency Option USD vs MXN | | Put | | Goldman Sachs International | | | 11/05/20 | | | | 21.35 | | | — | | | 87 | | | | (1,387 | ) |
Currency Option USD vs MXN | | Put | | JPMorgan Chase Bank, N.A. | | | 11/05/20 | | | | 21.35 | | | — | | | 87 | | | | (1,388 | ) |
Currency Option USD vs RUB | | Put | | Citibank, N.A. | | | 11/05/20 | | | | 75.00 | | | — | | | 115 | | | | (19 | ) |
Currency Option USD vs RUB | | Put | | Citibank, N.A. | | | 11/05/20 | | | | 75.00 | | | — | | | 115 | | | | (19 | ) |
| | | | | | | | | | | | | | | | | | | | | | |
Total Options Written (premiums received $30,544) | | | | | | | | | | | | | | | | $ | (30,447 | ) |
| | | | | | | | | | | | | | | | | | | | | | |
See Notes to Financial Statements.
PGIM Emerging Markets Debt Hard Currency Fund 33
Schedule of Investments (continued)
as of October 31, 2020
Futures contracts outstanding at October 31, 2020:
| | | | | | | | | | | | | | | | | | |
Number of Contracts | | Type | | Expiration
Date | | | Current
Notional
Amount | | | Value /
Unrealized
Appreciation
(Depreciation) | |
Long Positions: | | | | | | | | | | | | | | | | |
6 | | 5 Year U.S. Treasury Notes | | | Dec. 2020 | | | $ | 753,609 | | | $ | 39 | | | | | |
64 | | 10 Year U.S. Treasury Notes | | | Dec. 2020 | | | | 8,846,000 | | | | (43,388 | ) | | | | |
4 | | 30 Year U.S. Ultra Treasury Bonds | | | Dec. 2020 | | | | 860,000 | | | | (18,729 | ) | | | | |
| | | | | | | | | | | | | | | | | | |
| | | | | | | | | | | | | (62,078 | ) | | | | |
| | | | | | | | | | | | | | | | | | |
Short Positions: | | | | | | | | | | | | | | | | |
16 | | 2 Year U.S. Treasury Notes | | | Dec. 2020 | | | | 3,533,500 | | | | 419 | | | | | |
4 | | 5 Year Euro-Bobl | | | Dec. 2020 | | | | 632,964 | | | | (4,092 | ) | | | | |
22 | | 10 Year Euro-Bund | | | Dec. 2020 | | | | 4,513,368 | | | | (55,154 | ) | | | | |
38 | | 20 Year U.S. Treasury Bonds | | | Dec. 2020 | | | | 6,553,813 | | | | 90,453 | | | | | |
1 | | Euro Schatz Index | | | Dec. 2020 | | | | 130,982 | | | | (234 | ) | | | | |
| | | | | | | | | | | | | | | | | | |
| | | | | | | | | | | | | 31,392 | | | | | |
| | | | | | | | | | | | | | | | | | |
| | | | | | | | | | | | $ | (30,686 | ) | | | | |
| | | | | | | | | | | | | | | | | | |
Forward foreign currency exchange contracts outstanding at October��31, 2020:
| | | | | | | | | | | | | | | | | | | | | | | | | | |
Purchase Contracts | | Counterparty | | Notional
Amount
(000) | | | Value at
Settlement
Date | | | Current
Value | | | Unrealized
Appreciation | | Unrealized
Depreciation | |
OTC Forward Foreign Currency Exchange Contracts: | | | | | | | | | | | | | | | | | | | | | |
Brazilian Real, | | | | | | | | | | | | | | | | | | | | | | | | | | |
Expiring 11/04/20 | | JPMorgan Chase Bank, N.A. | | | BRL | | | | 1,612 | | | $ | 292,136 | | | $ | 280,880 | | | $ | — | | | $ | (11,256 | ) |
Expiring 12/02/20 | | Morgan Stanley & Co. International PLC | | | BRL | | | | 199 | | | | 35,324 | | | | 34,638 | | | | — | | | | (686 | ) |
Chilean Peso, | | | | | | | | | | | | | | | | | | | | | | | | | | |
Expiring 12/16/20 | | Citibank, N.A. | | | CLP | | | | 60,865 | | | | 80,000 | | | | 78,702 | | | | — | | | | (1,298 | ) |
Expiring 12/16/20 | | HSBC Bank USA, N.A. | | | CLP | | | | 82,118 | | | | 103,288 | | | | 106,182 | | | | 2,894 | | | | — | |
Expiring 12/16/20 | | HSBC Bank USA, N.A. | | | CLP | | | | 69,187 | | | | 86,549 | | | | 89,462 | | | | 2,913 | | | | — | |
Expiring 12/16/20 | | HSBC Bank USA, N.A. | | | CLP | | | | 58,882 | | | | 74,000 | | | | 76,137 | | | | 2,137 | | | | — | |
Expiring 12/16/20 | | JPMorgan Chase Bank, N.A. | | | CLP | | | | 13,515 | | | | 17,000 | | | | 17,475 | | | | 475 | | | | — | |
Chinese Renminbi, | | | | | | | | | | | | | | | | | | | | | | | | | | |
Expiring 11/06/20 | | Citibank, N.A. | | | CNH | | | | 4,753 | | | | 676,278 | | | | 709,508 | | | | 33,230 | | | | — | |
Expiring 11/06/20 | | Citibank, N.A. | | | CNH | | | | 977 | | | | 140,720 | | | | 145,893 | | | | 5,173 | | | | — | |
Expiring 11/06/20 | | HSBC Bank USA, N.A. | | | CNH | | | | 9,891 | | | | 1,482,156 | | | | 1,476,296 | | | | — | | | | (5,860 | ) |
Expiring 11/06/20 | | HSBC Bank USA, N.A. | | | CNH | | | | 4,423 | | | | 632,463 | | | | 660,199 | | | | 27,736 | | | | — | |
Expiring 11/06/20 | | HSBC Bank USA, N.A. | | | CNH | | | | 428 | | | | 61,301 | | | | 63,874 | | | | 2,573 | | | | — | |
Expiring 11/06/20 | | JPMorgan Chase Bank, N.A. | | | CNH | | | | 498 | | | | 73,788 | | | | 74,384 | | | | 596 | | | | — | |
Expiring 11/06/20 | | UBS AG | | | CNH | | | | 1,671 | | | | 240,638 | | | | 249,431 | | | | 8,793 | | | | — | |
Expiring 11/06/20 | | UBS AG | | | CNH | | | | 1,070 | | | | 153,000 | | | | 159,638 | | | | 6,638 | | | | — | |
See Notes to Financial Statements.
34
Forward foreign currency exchange contracts outstanding at October 31, 2020 (continued):
| | | | | | | | | | | | | | | | | | | | | | | | | | |
Purchase Contracts | | Counterparty | | Notional
Amount
(000) | | | Value at
Settlement
Date | | | Current
Value | | | Unrealized
Appreciation | | Unrealized
Depreciation | |
OTC Forward Foreign Currency Exchange Contracts (cont’d.): | | | | | | | | | | | | | | | | | |
Chinese Renminbi (cont’d.), | | | | | | | | | | | | | | | | | | | | | | | | |
Expiring 11/06/20 | | UBS AG | | | CNH | | | | 512 | | | $ | 73,680 | | | $ | 76,470 | | | $ | 2,790 | | | $ | — | |
Expiring 05/14/21 | | Citibank, N.A. | | | CNH | | | | 994 | | | | 142,393 | | | | 146,337 | | | | 3,944 | | | | — | |
Colombian Peso, | | | | | | | | | | | | | | | | | | | | | | | | | | |
Expiring 12/16/20 | | BNP Paribas S.A. | | | COP | | | | 251,790 | | | | 66,000 | | | | 64,918 | | | | — | | | | (1,082 | ) |
Expiring 12/16/20 | | Citibank, N.A. | | | COP | | | | 369,307 | | | | 96,000 | | | | 95,217 | | | | — | | | | (783 | ) |
Expiring 12/16/20 | | Goldman Sachs International | | | COP | | | | 261,907 | | | | 68,000 | | | | 67,526 | | | | — | | | | (474 | ) |
Expiring 12/16/20 | | Morgan Stanley & Co. International PLC | | | COP | | | | 308,560 | | | | 80,000 | | | | 79,555 | | | | — | | | | (445 | ) |
Czech Koruna, | | | | | | | | | | | | | | | | | | | | | | | | | | |
Expiring 01/19/21 | | Bank of America, N.A. | | | CZK | | | | 1,676 | | | | 73,275 | | | | 71,759 | | | | — | | | | (1,516 | ) |
Expiring 01/19/21 | | BNP Paribas S.A. | | | CZK | | | | 1,551 | | | | 66,568 | | | | 66,385 | | | | — | | | | (183 | ) |
Expiring 01/19/21 | | Citibank, N.A. | | | CZK | | | | 2,556 | | | | 110,335 | | | | 109,427 | | | | — | | | | (908 | ) |
Expiring 01/19/21 | | Goldman Sachs International | | | CZK | | | | 10,903 | | | | 474,438 | | | | 466,783 | | | | — | | | | (7,655 | ) |
Expiring 01/19/21 | | Morgan Stanley & Co. International PLC | | | CZK | | | | 4,413 | | | | 189,317 | | | | 188,945 | | | | — | | | | (372 | ) |
Euro, | | | | | | | | | | | | | | | | | | | | | | | | | | |
Expiring 11/03/20 | | Bank of America, N.A. | | | EUR | | | | 122 | | | | 144,214 | | | | 141,560 | | | | — | | | | (2,654 | ) |
Hungarian Forint, | | | | | | | | | | | | | | | | | | | | | | | | | | |
Expiring 01/19/21 | | Bank of America, N.A. | | | HUF | | | | 22,080 | | | | 72,000 | | | | 70,036 | | | | — | | | | (1,964 | ) |
Expiring 01/19/21 | | Bank of America, N.A. | | | HUF | | | | 18,184 | | | | 59,000 | | | | 57,676 | | | | — | | | | (1,324 | ) |
Expiring 01/19/21 | | Goldman Sachs International | | | HUF | | | | 20,910 | | | | 67,637 | | | | 66,322 | | | | — | | | | (1,315 | ) |
Indian Rupee, | | | | | | | | | | | | | | | | | | | | | | | | | | |
Expiring 12/16/20 | | BNP Paribas S.A. | | | INR | | | | 8,227 | | | | 111,000 | | | | 109,880 | | | | �� | | | | (1,120 | ) |
Expiring 12/16/20 | | Citibank, N.A. | | | INR | | | | 26,151 | | | | 353,912 | | | | 349,262 | | | | — | | | | (4,650 | ) |
Expiring 12/16/20 | | Citibank, N.A. | | | INR | | | | 10,875 | | | | 147,000 | | | | 145,237 | | | | — | | | | (1,763 | ) |
Expiring 12/16/20 | | Citibank, N.A. | | | INR | | | | 8,667 | | | | 117,000 | | | | 115,758 | | | | — | | | | (1,242 | ) |
Expiring 12/16/20 | | Citibank, N.A. | | | INR | | | | 5,350 | | | | 72,795 | | | | 71,454 | | | | — | | | | (1,341 | ) |
Expiring 12/16/20 | | HSBC Bank USA, N.A. | | | INR | | | | 54,956 | | | | 740,543 | | | | 733,963 | | | | — | | | | (6,580 | ) |
Expiring 12/16/20 | | JPMorgan Chase Bank, N.A. | | | INR | | | | 12,691 | | | | 171,000 | | | | 169,498 | | | | — | | | | (1,502 | ) |
Expiring 12/16/20 | | JPMorgan Chase Bank, N.A. | | | INR | | | | 10,362 | | | | 140,000 | | | | 138,396 | | | | — | | | | (1,604 | ) |
Expiring 12/16/20 | | UBS AG | | | INR | | | | 5,403 | | | | 72,915 | | | | 72,161 | | | | — | | | | (754 | ) |
Indonesian Rupiah, | | | | | | | | | | | | | | | | | | | | | | | | | | |
Expiring 12/16/20 | | Citibank, N.A. | | | IDR | | | | 1,910,144 | | | | 128,000 | | | | 128,622 | | | | 622 | | | | — | |
Expiring 12/16/20 | | Citibank, N.A. | | | IDR | | | | 1,747,816 | | | | 118,000 | | | | 117,692 | | | | — | | | | (308 | ) |
Expiring 12/16/20 | | Citibank, N.A. | | | IDR | | | | 1,081,077 | | | | 72,898 | | | | 72,796 | | | | — | | | | (102 | ) |
Expiring 12/16/20 | | Goldman Sachs International | | | IDR | | | | 1,258,446 | | | | 84,000 | | | | 84,739 | | | | 739 | | | | — | |
See Notes to Financial Statements.
PGIM Emerging Markets Debt Hard Currency Fund 35
Schedule of Investments (continued)
as of October 31, 2020
Forward foreign currency exchange contracts outstanding at October 31, 2020 (continued):
| | | | | | | | | | | | | | | | | | | | | | | | | | |
Purchase Contracts | | Counterparty | | Notional
Amount
(000) | | | Value at
Settlement
Date | | | Current
Value | | | Unrealized
Appreciation | | Unrealized
Depreciation | |
OTC Forward Foreign Currency Exchange Contracts (cont’d.): | | | | | | | | | | | | | | | | | |
Indonesian Rupiah (cont’d.), | | | | | | | | | | | | | | | | | | | | | | | | |
Expiring 12/16/20 | | HSBC Bank USA, N.A. | | | IDR | | | | 12,323,800 | | | $ | 835,909 | | | $ | 829,840 | | | $ | — | | | $ | (6,069 | ) |
Expiring 12/16/20 | | HSBC Bank USA, N.A. | | | IDR | | | | 1,987,756 | | | | 134,000 | | | | 133,848 | | | | — | | | | (152 | ) |
Expiring 12/16/20 | | HSBC Bank USA, N.A. | | | IDR | | | | 1,289,775 | | | | 87,000 | | | | 86,849 | | | | — | | | | (151 | ) |
Expiring 12/16/20 | | HSBC Bank USA, N.A. | | | IDR | | | | 1,249,037 | | | | 83,000 | | | | 84,106 | | | | 1,106 | | | | — | |
Expiring 12/16/20 | | HSBC Bank USA, N.A. | | | IDR | | | | 1,226,999 | | | | 82,000 | | | | 82,622 | | | | 622 | | | | — | |
Expiring 12/16/20 | | HSBC Bank USA, N.A. | | | IDR | | | | 1,188,318 | | | | 79,000 | | | | 80,017 | | | | 1,017 | | | | — | |
Expiring 12/16/20 | | HSBC Bank USA, N.A. | | | IDR | | | | 1,067,601 | | | | 72,124 | | | | 71,888 | | | | — | | | | (236 | ) |
Expiring 12/16/20 | | JPMorgan Chase Bank, N.A. | | | IDR | | | | 1,087,194 | | | | 74,000 | | | | 73,208 | | | | — | | | | (792 | ) |
Israeli Shekel, | | | | | | | | | | | | | | | | | | | | | | | | | | |
Expiring 12/16/20 | | Barclays Bank PLC | | | ILS | | | | 579 | | | | 168,000 | | | | 169,686 | | | | 1,686 | | | | — | |
Expiring 12/16/20 | | Barclays Bank PLC | | | ILS | | | | 463 | | | | 136,000 | | | | 135,753 | | | | — | | | | (247 | ) |
Expiring 12/16/20 | | Barclays Bank PLC | | | ILS | | | | 435 | | | | 129,000 | | | | 127,578 | | | | — | | | | (1,422 | ) |
Expiring 12/16/20 | | Citibank, N.A. | | | ILS | | | | 3,249 | | | | 962,112 | | | | 952,802 | | | | — | | | | (9,310 | ) |
Expiring 12/16/20 | | Citibank, N.A. | | | ILS | | | | 566 | | | | 163,000 | | | | 165,860 | | | | 2,860 | | | | — | |
Expiring 12/16/20 | | JPMorgan Chase Bank, N.A. | | | ILS | | | | 608 | | | | 178,943 | | | | 178,166 | | | | — | | | | (777 | ) |
Expiring 12/16/20 | | JPMorgan Chase Bank, N.A. | | | ILS | | | | 515 | | | | 149,000 | | | | 150,883 | | | | 1,883 | | | | — | |
Expiring 12/16/20 | | JPMorgan Chase Bank, N.A. | | | ILS | | | | 479 | | | | 142,491 | | | | 140,539 | | | | — | | | | (1,952 | ) |
Japanese Yen, | | | | | | | | | | | | | | | | | | | | | | | | | | |
Expiring 01/19/21 | | Citibank, N.A. | | | JPY | | | | 7,752 | | | | 73,788 | | | | 74,133 | | | | 345 | | | | — | |
Expiring 01/19/21 | | Goldman Sachs International | | | JPY | | | | 38,633 | | | | 368,985 | | | | 369,455 | | | | 470 | | | | — | |
Expiring 01/19/21 | | JPMorgan Chase Bank, N.A. | | | JPY | | | | 7,714 | | | | 74,000 | | | | 73,766 | | | | — | | | | (234 | ) |
Expiring 01/19/21 | | The Toronto-Dominion Bank | | | JPY | | | | 23,148 | | | | 220,055 | | | | 221,373 | | | | 1,318 | | | | — | |
Mexican Peso, | | | | | | | | | | | | | | | | | | | | | | | | | | |
Expiring 12/16/20 | | Bank of America, N.A. | | | MXN | | | | 1,597 | | | | 71,921 | | | | 74,912 | | | | 2,991 | | | | — | |
Expiring 12/16/20 | | Citibank, N.A. | | | MXN | | | | 5,798 | | | | 262,945 | | | | 271,905 | | | | 8,960 | | | | — | |
Expiring 12/16/20 | | Goldman Sachs International | | | MXN | | | | 18,178 | | | | 865,090 | | | | 852,519 | | | | — | | | | (12,571 | ) |
Expiring 12/16/20 | | Goldman Sachs International | | | MXN | | | | 1,655 | | | | 72,898 | | | | 77,640 | | | | 4,742 | | | | — | |
Expiring 12/16/20 | | JPMorgan Chase Bank, N.A. | | | MXN | | | | 1,827 | | | | 86,000 | | | | 85,662 | | | | — | | | | (338 | ) |
Expiring 12/16/20 | | JPMorgan Chase Bank, N.A. | | | MXN | | | | 1,596 | | | | 72,638 | | | | 74,865 | | | | 2,227 | | | | — | |
Expiring 12/16/20 | | JPMorgan Chase Bank, N.A. | | | MXN | | | | 1,592 | | | | 71,496 | | | | 74,681 | | | | 3,185 | | | | — | |
See Notes to Financial Statements.
36
Forward foreign currency exchange contracts outstanding at October 31, 2020 (continued):
| | | | | | | | | | | | | | | | | | | | | | | | | | |
Purchase Contracts | | Counterparty | | Notional
Amount
(000) | | | Value at
Settlement
Date | | | Current
Value | | | Unrealized
Appreciation | | Unrealized
Depreciation | |
OTC Forward Foreign Currency Exchange Contracts (cont’d.): | | | | | | | | | | | | | | | | | |
Mexican Peso (cont’d.), | | | | | | | | | | | | | | | | | | | | | | | | |
Expiring 12/16/20 | | JPMorgan Chase Bank, N.A. | | | MXN | | | | 1,575 | | | $ | 73,788 | | | $ | 73,874 | | | $ | 86 | | | $ | — | |
Expiring 12/16/20 | | JPMorgan Chase Bank, N.A. | | | MXN | | | | 1,560 | | | | 74,000 | | | | 73,182 | | | | — | | | | (818 | ) |
Expiring 12/16/20 | | JPMorgan Chase Bank, N.A. | | | MXN | | | | 1,414 | | | | 65,000 | | | | 66,312 | | | | 1,312 | | | | — | |
Expiring 12/16/20 | | Morgan Stanley & Co. International PLC | | | MXN | | | | 1,589 | | | | 73,788 | | | | 74,499 | | | | 711 | | | | — | |
New Taiwanese Dollar, | | | | | | | | | | | | | | | | | | | | | | | | |
Expiring 12/16/20 | | Credit Suisse International | | | TWD | | | | 4,715 | | | | 164,000 | | | | 166,839 | | | | 2,839 | | | | — | |
Expiring 12/16/20 | | UBS AG | | | TWD | | | | 20,762 | | | | 713,969 | | | | 734,719 | | | | 20,750 | | | | — | |
New Zealand Dollar, | | | | | | | | | | | | | | | | | | | | | | | | | | |
Expiring 01/20/21 | | JPMorgan Chase Bank, N.A. | | | NZD | | | | 106 | | | | 70,081 | | | | 70,346 | | | | 265 | | | | — | |
Peruvian Nuevo Sol, | | | | | | | | | | | | | | | | | | | | | | | | | | |
Expiring 12/16/20 | | Citibank, N.A. | | | PEN | | | | 407 | | | | 114,000 | | | | 112,468 | | | | — | | | | (1,532 | ) |
Expiring 12/16/20 | | Citibank, N.A. | | | PEN | | | | 396 | | | | 112,000 | | | | 109,668 | | | | — | | | | (2,332 | ) |
Expiring 12/16/20 | | Citibank, N.A. | | | PEN | | | | 257 | | | | 72,898 | | | | 71,109 | | | | — | | | | (1,789 | ) |
Philippine Peso, | | | | | | | | | | | | | | | | | | | | | | | | | | |
Expiring 11/16/20 | | HSBC Bank USA, N.A. | | | PHP | | | | 3,603 | | | | 73,788 | | | | 74,211 | | | | 423 | | | | — | |
Expiring 12/16/20 | | Citibank, N.A. | | | PHP | | | | 6,230 | | | | 128,000 | | | | 128,220 | | | | 220 | | | | — | |
Expiring 12/16/20 | | Goldman Sachs International | | | PHP | | | | 6,981 | | | | 144,000 | | | | 143,690 | | | | — | | | | (310 | ) |
Expiring 12/16/20 | | HSBC Bank USA, N.A. | | | PHP | | | | 32,647 | | | | 673,818 | | | | 671,923 | | | | — | | | | (1,895 | ) |
Expiring 12/16/20 | | HSBC Bank USA, N.A. | | | PHP | | | | 10,973 | | | | 225,000 | | | | 225,843 | | | | 843 | | | | — | |
Expiring 12/16/20 | | HSBC Bank USA, N.A. | | | PHP | | | | 6,968 | | | | 142,480 | | | | 143,417 | | | | 937 | | | | — | |
Expiring 12/16/20 | | HSBC Bank USA, N.A. | | | PHP | | | | 6,433 | | | | 131,520 | | | | 132,410 | | | | 890 | | | | — | |
Expiring 12/16/20 | | JPMorgan Chase Bank, N.A. | | | PHP | | | | 6,869 | | | | 141,000 | | | | 141,370 | | | | 370 | | | | — | |
Polish Zloty, | | | | | | | | | | | | | | | | | | | | | | | | | | |
Expiring 01/19/21 | | Barclays Bank PLC | | | PLN | | | | 285 | | | | 74,000 | | | | 71,912 | | | | — | | | | (2,088 | ) |
Expiring 01/19/21 | | Goldman Sachs International | | | PLN | | | | 715 | | | | 185,115 | | | | 180,648 | | | | — | | | | (4,467 | ) |
Expiring 01/19/21 | | HSBC Bank USA, N.A. | | | PLN | | | | 425 | | | | 111,659 | | | | 107,425 | | | | — | | | | (4,234 | ) |
Russian Ruble, | | | | | | | | | | | | | | | | | | | | | | | | | | |
Expiring 12/16/20 | | Barclays Bank PLC | | | RUB | | | | 7,717 | | | | 101,000 | | | | 96,615 | | | | — | | | | (4,385 | ) |
Expiring 12/16/20 | | Barclays Bank PLC | | | RUB | | | | 3,677 | | | | 48,000 | | | | 46,034 | | | | — | | | | (1,966 | ) |
Expiring 12/16/20 | | Barclays Bank PLC | | | RUB | | | | 2,314 | | | | 30,000 | | | | 28,972 | | | | — | | | | (1,028 | ) |
Expiring 12/16/20 | | Citibank, N.A. | | | RUB | | | | 25,410 | | | | 331,551 | | | | 318,114 | | | | — | | | | (13,437 | ) |
Expiring 12/16/20 | | Morgan Stanley & Co. International PLC | | | RUB | | | | 20,968 | | | | 273,310 | | | | 262,499 | | | | — | | | | (10,811 | ) |
See Notes to Financial Statements.
PGIM Emerging Markets Debt Hard Currency Fund 37
Schedule of Investments (continued)
as of October 31, 2020
Forward foreign currency exchange contracts outstanding at October 31, 2020 (continued):
| | | | | | | | | | | | | | | | | | | | | | | | | | |
Purchase Contracts | | Counterparty | | Notional
Amount
(000) | | | Value at
Settlement
Date | | | Current
Value | | | Unrealized
Appreciation | | Unrealized
Depreciation | |
OTC Forward Foreign Currency Exchange Contracts (cont’d.): | | | | | | | | | | | | | | | | | |
Russian Ruble (cont’d.), | | | | | | | | | | | | | | | | | | | | | | | | |
Expiring 12/16/20 | | Morgan Stanley & Co. International PLC | | | RUB | | | | 4,539 | | | $ | 59,000 | | | $ | 56,830 | | | $ | — | | | $ | (2,170 | ) |
Singapore Dollar, | | | | | | | | | | | | | | | | | | | | | | | | | | |
Expiring 12/16/20 | | Goldman Sachs International | | | SGD | | | | 154 | | | | 113,533 | | | | 113,000 | | | | — | | | | (533 | ) |
Expiring 12/16/20 | | JPMorgan Chase Bank, N.A. | | | SGD | | | | 1,150 | | | | 842,389 | | | | 841,794 | | | | — | | | | (595 | ) |
Expiring 12/16/20 | | JPMorgan Chase Bank, N.A. | | | SGD | | | | 99 | | | | 72,614 | | | | 72,493 | | | | — | | | | (121 | ) |
South African Rand, | | | | | | | | | | | | | | | | | | | | | | | | | | |
Expiring 12/17/20 | | Barclays Bank PLC | | | ZAR | | | | 1,171 | | | | 71,000 | | | | 71,562 | | | | 562 | | | | — | |
South Korean Won, | | | | | | | | | | | | | | | | | | | | | | | | | | |
Expiring 12/16/20 | | Citibank, N.A. | | | KRW | | | | 1,007,621 | | | | 891,258 | | | | 886,260 | | | | — | | | | (4,998 | ) |
Expiring 12/16/20 | | HSBC Bank USA, N.A. | | | KRW | | | | 524,155 | | | | 440,867 | | | | 461,025 | | | | 20,158 | | | | — | |
Expiring 12/16/20 | | HSBC Bank USA, N.A. | | | KRW | | | | 132,810 | | | | 114,000 | | | | 116,814 | | | | 2,814 | | | | — | |
Expiring 12/16/20 | | JPMorgan Chase Bank, N.A. | | | KRW | | | | 376,455 | | | | 316,542 | | | | 331,113 | | | | 14,571 | | | | — | |
Expiring 12/16/20 | | JPMorgan Chase Bank, N.A. | | | KRW | | | | 142,401 | | | | 122,000 | | | | 125,250 | | | | 3,250 | | | | — | |
Expiring 12/16/20 | | JPMorgan Chase Bank, N.A. | | | KRW | | | | 103,194 | | | | 87,607 | | | | 90,765 | | | | 3,158 | | | | — | |
Expiring 12/16/20 | | JPMorgan Chase Bank, N.A. | | | KRW | | | | 85,733 | | | | 73,157 | | | | 75,407 | | | | 2,250 | | | | — | |
Expiring 12/16/20 | | JPMorgan Chase Bank, N.A. | | | KRW | | | | 84,627 | | | | 72,898 | | | | 74,434 | | | | 1,536 | | | | — | |
Expiring 12/16/20 | | JPMorgan Chase Bank, N.A. | | | KRW | | | | 68,454 | | | | 58,405 | | | | 60,209 | | | | 1,804 | | | | — | |
Thai Baht, | | | | | | | | | | | | | | | | | | | | | | | | | | |
Expiring 12/16/20 | | Citibank, N.A. | | | THB | | | | 19,567 | | | | 624,008 | | | | 627,647 | | | | 3,639 | | | | — | |
Expiring 12/16/20 | | Citibank, N.A. | | | THB | | | | 10,549 | | | | 334,443 | | | | 338,373 | | | | 3,930 | | | | — | |
Expiring 12/16/20 | | Citibank, N.A. | | | THB | | | | 4,529 | | | | 143,100 | | | | 145,273 | | | | 2,173 | | | | — | |
Expiring 12/16/20 | | Credit Suisse International | | | THB | | | | 4,896 | | | | 155,971 | | | | 157,048 | | | | 1,077 | | | | — | |
Expiring 12/16/20 | | HSBC Bank USA, N.A. | | | THB | | | | 2,718 | | | | 86,549 | | | | 87,200 | | | | 651 | | | | — | |
Expiring 12/16/20 | | JPMorgan Chase Bank, N.A. | | | THB | | | | 7,335 | | | | 233,157 | | | | 235,291 | | | | 2,134 | | | | — | |
Expiring 12/16/20 | | JPMorgan Chase Bank, N.A. | | | THB | | | | 6,746 | | | | 214,497 | | | | 216,392 | | | | 1,895 | | | | — | |
Turkish Lira, | | | | | | | | | | | | | | | | | | | | | | | | | | |
Expiring 12/16/20 | | Barclays Bank PLC | | | TRY | | | | 1,710 | | | | 203,000 | | | | 199,305 | | | | — | | | | (3,695 | ) |
Expiring 12/16/20 | | Barclays Bank PLC | | | TRY | | | | 1,102 | | | | 130,000 | | | | 128,438 | | | | — | | | | (1,562 | ) |
Expiring 12/16/20 | | Barclays Bank PLC | | | TRY | | | | 902 | | | | 115,900 | | | | 105,127 | | | | — | | | | (10,773 | ) |
See Notes to Financial Statements.
38
Forward foreign currency exchange contracts outstanding at October 31, 2020 (continued):
| | | | | | | | | | | | | | | | | | | | | | | | | | | | | | |
Purchase Contracts | | Counterparty | | Notional
Amount
(000) | | | Value at
Settlement
Date | | | Current
Value | | | Unrealized
Appreciation | | Unrealized
Depreciation |
OTC Forward Foreign Currency Exchange Contracts (cont’d.): | | | | | | | | | | | | | | | | | | | | | |
Turkish Lira (cont’d.), | | | | | | | | | | | | | | | | | | | | | | | | | | | | | | |
Expiring 12/16/20 | | Barclays Bank PLC | | | TRY | | | | 420 | | | $ | 52,000 | | | $ | 48,950 | | | $ | — | | | | | | | $ | (3,050 | ) |
Expiring 12/16/20 | | Barclays Bank PLC | | | TRY | | | | 411 | | | | 51,000 | | | | 47,860 | | | | — | | | | | | | | (3,140 | ) |
Expiring 12/16/20 | | Citibank, N.A. | | | TRY | | | | 1,065 | | | | 127,774 | | | | 124,101 | | | | — | | | | | | | | (3,673 | ) |
Expiring 12/16/20 | | Citibank, N.A. | | | TRY | | | | 558 | | | | 69,252 | | | | 65,074 | | | | — | | | | | | | | (4,178 | ) |
Expiring 12/16/20 | | JPMorgan Chase Bank, N.A. | | | TRY | | | | 2,035 | | | | 238,000 | | | | 237,166 | | | | — | | | | | | | | (834 | ) |
Expiring 12/16/20 | | Morgan Stanley & Co. International PLC | | | TRY | | | | 3,305 | | | | 386,030 | | | | 385,098 | | | | — | | | | | | | | (932 | ) |
Expiring 12/16/20 | | Morgan Stanley & Co. International PLC | | | TRY | | | | 422 | | | | 52,000 | | | | 49,133 | | | | — | | | | | | | | (2,867 | ) |
| | | | | | | | | | | | | | | | | | | | | | | | | | | | | | |
| | | | | | | | | | | | $ | 24,875,672 | | | $ | 24,916,380 | | | | 229,913 | | | | | | | | (189,205 | ) |
| | | | | | | | | | | | | | | | | | | | | | | | | | | | | | |
| | | | | | |
Sale Contracts | | Counterparty | | Notional
Amount
(000) | | | Value at
Settlement
Date | | | Current
Value | | | Unrealized
Appreciation | | Unrealized
Depreciation |
OTC Forward Foreign Currency Exchange Contracts: | | | | | | | | | | | | | | | | | | | | | | | | | |
Australian Dollar, | | | | | | | | | | | | | | | | | | | | | | | | | | | | | | |
Expiring 01/20/21 | | BNP Paribas S.A. | | | AUD | | | | 251 | | | $ | 178,272 | | | $ | 176,749 | | | $ | 1,523 | | | | | | | $ | — | |
Expiring 01/20/21 | | Goldman Sachs International | | | AUD | | | | 378 | | | | 268,724 | | | | 265,953 | | | | 2,771 | | | | | | | | — | |
Brazilian Real, | | | | | | | | | | | | | | | | | | | | | | | | | | | | | | |
Expiring 11/04/20 | | Citibank, N.A. | | | BRL | | | | 405 | | | | 72,000 | | | | 70,501 | | | | 1,499 | | | | | | | | — | |
Expiring 11/04/20 | | JPMorgan Chase Bank, N.A. | | | BRL | | | | 384 | | | | 68,300 | | | | 66,944 | | | | 1,356 | | | | | | | | — | |
Expiring 11/04/20 | | JPMorgan Chase Bank, N.A. | | | BRL | | | | 211 | | | | 38,000 | | | | 36,795 | | | | 1,205 | | | | | | | | — | |
Expiring 11/04/20 | | Morgan Stanley & Co. International PLC | | | BRL | | | | 413 | | | | 73,914 | | | | 71,959 | | | | 1,955 | | | | | | | | — | |
Expiring 11/04/20 | | Morgan Stanley & Co. International PLC | | | BRL | | | | 199 | | | | 35,353 | | | | 34,682 | | | | 671 | | | | | | | | — | |
Expiring 12/02/20 | | JPMorgan Chase Bank, N.A. | | | BRL | | | | 368 | | | | 65,000 | | | | 63,958 | | | | 1,042 | | | | | | | | — | |
Expiring 12/02/20 | | Morgan Stanley & Co. International PLC | | | BRL | | | | 1,242 | | | | 214,000 | | | | 216,096 | | | | — | | | | | | | | (2,096 | ) |
Expiring 12/02/20 | | Morgan Stanley & Co. International PLC | | | BRL | | | | 387 | | | | 67,000 | | | | 67,395 | | | | — | | | | | | | | (395 | ) |
Chilean Peso, | | | | | | | | | | | | | | | | | | | | | | | | | | | | | | |
Expiring 12/16/20 | | BNP Paribas S.A. | | | CLP | | | | 112,543 | | | | 146,760 | | | | 145,523 | | | | 1,237 | | | | | | | | — | |
Expiring 12/16/20 | | Citibank, N.A. | | | CLP | | | | 129,509 | | | | 166,736 | | | | 167,461 | | | | — | | | | | | | | (725 | ) |
Expiring 12/16/20 | | HSBC Bank USA, N.A. | | | CLP | | | | 161,952 | | | | 210,609 | | | | 209,411 | | | | 1,198 | | | | | | | | — | |
See Notes to Financial Statements.
PGIM Emerging Markets Debt Hard Currency Fund 39
Schedule of Investments (continued)
as of October 31, 2020
Forward foreign currency exchange contracts outstanding at October 31, 2020 (continued):
| | | | | | | | | | | | | | | | | | | | | | | | | | |
Sale Contracts | | Counterparty | | Notional
Amount
(000) | | | Value at
Settlement
Date | | | Current
Value | | | Unrealized
Appreciation | | Unrealized
Depreciation |
OTC Forward Foreign Currency Exchange Contracts (cont’d.): | | | | | | | | | | | | | | | | | |
Chilean Peso (cont’d.), | | | | | | | | | | | | | | | | | | | | | | | | |
Expiring 12/16/20 | | JPMorgan Chase Bank, N.A. | | | CLP | | | | 71,940 | | | $ | 90,000 | | | $ | 93,022 | | | $ | — | | | $ | (3,022 | ) |
Expiring 12/16/20 | | JPMorgan Chase Bank, N.A. | | | CLP | | | | 56,476 | | | | 71,436 | | | | 73,027 | | | | — | | | | (1,591 | ) |
Chinese Renminbi, | | | | | | | | | | | | | | | | | | | | | | | | | | |
Expiring 11/06/20 | | Citibank, N.A. | | | CNH | | | | 821 | | | | 123,000 | | | | 122,517 | | | | 483 | | | | — | |
Expiring 11/06/20 | | Credit Suisse International | | | CNH | | | | 3,443 | | | | 511,000 | | | | 513,879 | | | | — | | | | (2,879 | ) |
Expiring 11/06/20 | | Goldman Sachs International | | | CNH | | | | 899 | | | | 131,000 | | | | 134,191 | | | | — | | | | (3,191 | ) |
Expiring 11/06/20 | | HSBC Bank USA, N.A. | | | CNH | | | | 3,380 | | | | 504,000 | | | | 504,533 | | | | — | | | | (533 | ) |
Expiring 11/06/20 | | HSBC Bank USA, N.A. | | | CNH | | | | 1,101 | | | | 164,000 | | | | 164,401 | | | | — | | | | (401 | ) |
Expiring 11/06/20 | | HSBC Bank USA, N.A. | | | CNH | | | | 801 | | | | 118,000 | | | | 119,494 | | | | — | | | | (1,494 | ) |
Expiring 05/14/21 | | JPMorgan Chase Bank, N.A. | | | CNH | | | | 994 | | | | 142,624 | | | | 146,337 | | | | — | | | | (3,713 | ) |
Colombian Peso, | | | | | | | | | | | | | | | | | | | | | | | | | | |
Expiring 12/16/20 | | BNP Paribas S.A. | | | COP | | | | 776,156 | | | | 206,940 | | | | 200,113 | | | | 6,827 | | | | — | |
Expiring 12/16/20 | | Citibank, N.A. | | | COP | | | | 2,014,893 | | | | 532,196 | | | | 519,492 | | | | 12,704 | | | | — | |
Expiring 12/16/20 | | Citibank, N.A. | | | COP | | | | 383,309 | | | | 102,350 | | | | 98,828 | | | | 3,522 | | | | — | |
Expiring 12/16/20 | | Citibank, N.A. | | | COP | | | | 276,495 | | | | 71,550 | | | | 71,288 | | | | 262 | | | | — | |
Expiring 12/16/20 | | JPMorgan Chase Bank, N.A. | | | COP | | | | 724,079 | | | | 188,041 | | | | 186,687 | | | | 1,354 | | | | — | |
Expiring 12/16/20 | | JPMorgan Chase Bank, N.A. | | | COP | | | | 489,178 | | | | 132,046 | | | | 126,123 | | | | 5,923 | | | | — | |
Czech Koruna, | | | | | | | | | | | | | | | | | | | | | | | | | | |
Expiring 01/19/21 | | Barclays Bank PLC | | | CZK | | | | 2,430 | | | | 104,000 | | | | 104,015 | | | | — | | | | (15 | ) |
Expiring 01/19/21 | | JPMorgan Chase Bank, N.A. | | | CZK | | | | 3,059 | | | | 131,000 | | | | 130,954 | | | | 46 | | | | — | |
Expiring 01/19/21 | | JPMorgan Chase Bank, N.A. | | | CZK | | | | 2,033 | | | | 87,000 | | | | 87,043 | | | | — | | | | (43 | ) |
Expiring 01/19/21 | | Morgan Stanley & Co. International PLC | | | CZK | | | | 2,352 | | | | 102,000 | | | | 100,702 | | | | 1,298 | | | | — | |
Euro, | | | | | | | | | | | | | | | | | | | | | | | | | | |
Expiring 11/03/20 | | Citibank, N.A. | | | EUR | | | | 98 | | | | 117,014 | | | | 114,309 | | | | 2,705 | | | | — | |
Expiring 11/03/20 | | Morgan Stanley & Co. International PLC | | | EUR | | | | 1,005 | | | | 1,136,889 | | | | 1,171,009 | | | | — | | | | (34,120 | ) |
Expiring 11/03/20 | | Morgan Stanley & Co. International PLC | | | EUR | | | | 34 | | | | 39,723 | | | | 39,383 | | | | 340 | | | | — | |
Expiring 01/19/21 | | Citibank, N.A. | | | EUR | | | | 1,008 | | | | 1,176,650 | | | | 1,176,873 | | | | — | | | | (223 | ) |
Expiring 01/19/21 | | Citibank, N.A. | | | EUR | | | | 83 | | | | 98,373 | | | | 96,943 | | | | 1,430 | | | | — | |
Expiring 01/19/21 | | Morgan Stanley & Co. International PLC | | | EUR | | | | 1,220 | | | | 1,435,784 | | | | 1,423,654 | | | | 12,130 | | | | — | |
See Notes to Financial Statements.
40
Forward foreign currency exchange contracts outstanding at October 31, 2020 (continued):
| | | | | | | | | | | | | | | | | | | | | | | | | | |
Sale Contracts | | Counterparty | | Notional
Amount
(000) | | | Value at
Settlement
Date | | | Current
Value | | | Unrealized
Appreciation | | Unrealized
Depreciation |
OTC Forward Foreign Currency Exchange Contracts (cont’d.): | | | | | | | | | | | | | | | | | |
Euro (cont’d.), | | | | | | | | | | | | | | | | | | | | | | | | | | |
Expiring 01/20/21 | | Goldman Sachs International | | | EUR | | | | 1,233 | | | $ | 1,461,753 | | | $ | 1,438,374 | | | $ | 23,379 | | | $ | — | |
Hungarian Forint, | | | | | | | | | | | | | | | | | | | | | | | | | | |
Expiring 01/19/21 | | Barclays Bank PLC | | | HUF | | | | 20,946 | | | | 67,000 | | | | 66,437 | | | | 563 | | | | — | |
Indonesian Rupiah, | | | | | | | | | | | | | | | | | | | | | | | | | | |
Expiring 12/16/20 | | HSBC Bank USA, N.A. | | | IDR | | | | 2,832,862 | | | | 188,675 | | | | 190,754 | | | | — | | | | (2,079 | ) |
Israeli Shekel, | | | | | | | | | | | | | | | | | | | | | | | | | | |
Expiring 12/16/20 | | Citibank, N.A. | | | ILS | | | | 646 | | | | 189,000 | | | | 189,487 | | | | — | | | | (487 | ) |
Expiring 12/16/20 | | Citibank, N.A. | | | ILS | | | | 446 | | | | 130,000 | | | | 130,711 | | | | — | | | | (711 | ) |
Mexican Peso, | | | | | | | | | | | | | | | | | | | | | | | | | | |
Expiring 12/16/20 | | Goldman Sachs International | | | MXN | | | | 1,640 | | | | 72,898 | | | | 76,924 | | | | — | | | | (4,026 | ) |
New Taiwanese Dollar, | | | | | | | | | | | | | | | | | | | | | | | | |
Expiring 12/16/20 | | Citibank, N.A. | | | TWD | | | | 29,248 | | | | 1,030,588 | | | | 1,035,007 | | | | — | | | | (4,419 | ) |
Expiring 12/16/20 | | Credit Suisse International | | | TWD | | | | 8,107 | | | | 284,000 | | | | 286,879 | | | | — | | | | (2,879 | ) |
Expiring 12/16/20 | | Credit Suisse International | | | TWD | | | | 3,808 | | | | 134,000 | | | | 134,772 | | | | — | | | | (772 | ) |
Expiring 12/16/20 | | Credit Suisse International | | | TWD | | | | 3,184 | | | | 112,000 | | | | 112,679 | | | | — | | | | (679 | ) |
Expiring 12/16/20 | | HSBC Bank USA, N.A. | | | TWD | | | | 7,607 | | | | 266,000 | | | | 269,191 | | | | — | | | | (3,191 | ) |
Expiring 12/16/20 | | HSBC Bank USA, N.A. | | | TWD | | | | 7,341 | | | | 255,000 | | | | 259,776 | | | | — | | | | (4,776 | ) |
Expiring 12/16/20 | | HSBC Bank USA, N.A. | | | TWD | | | | 6,468 | | | | 228,000 | | | | 228,899 | | | | — | | | | (899 | ) |
Expiring 12/16/20 | | JPMorgan Chase Bank, N.A. | | | TWD | | | | 7,094 | | | | 250,000 | | | | 251,033 | | | | — | | | | (1,033 | ) |
Expiring 12/16/20 | | JPMorgan Chase Bank, N.A. | | | TWD | | | | 5,054 | | | | 177,000 | | | | 178,856 | | | | — | | | | (1,856 | ) |
Expiring 12/16/20 | | Morgan Stanley & Co. International PLC | | | TWD | | | | 5,782 | | | | 203,000 | | | | 204,620 | | | | — | | | | (1,620 | ) |
New Zealand Dollar, | | | | | | | | | | | | | | | | | | | | | | | | | | |
Expiring 01/20/21 | | Citibank, N.A. | | | NZD | | | | 82 | | | | 54,000 | | | | 54,316 | | | | — | | | | (316 | ) |
Expiring 01/20/21 | | Citibank, N.A. | | | NZD | | | | 24 | | | | 16,116 | | | | 16,117 | | | | — | | | | (1 | ) |
Peruvian Nuevo Sol, | | | | | | | | | | | | | | | | | | | | | | | | | | |
Expiring 12/16/20 | | BNP Paribas S.A. | | | PEN | | | | 367 | | | | 101,160 | | | | 101,426 | | | | — | | | | (266 | ) |
Expiring 12/16/20 | | Citibank, N.A. | | | PEN | | | | 1,159 | | | | 327,934 | | | | 320,680 | | | | 7,254 | | | | — | |
Expiring 12/16/20 | | Citibank, N.A. | | | PEN | | | | 776 | | | | 215,214 | | | | 214,727 | | | | 487 | | | | — | |
Expiring 12/16/20 | | JPMorgan Chase Bank, N.A. | | | PEN | | | | 305 | | | | 85,953 | | | | 84,270 | | | | 1,683 | | | | — | |
Philippine Peso, | | | | | | | | | | | | | | | | | | | | | | | | | | |
Expiring 12/16/20 | | Goldman Sachs International | | | PHP | | | | 12,827 | | | | 265,000 | | | | 264,009 | | | | 991 | | | | — | |
Expiring 12/16/20 | | HSBC Bank USA, N.A. | | | PHP | | | | 20,751 | | | | 428,000 | | | | 427,087 | | | | 913 | | | | — | |
Expiring 12/16/20 | | HSBC Bank USA, N.A. | | | PHP | | | | 16,185 | | | | 334,000 | | | | 333,125 | | | | 875 | | | | — | |
Expiring 12/16/20 | | HSBC Bank USA, N.A. | | | PHP | | | | 12,828 | | | | 264,000 | | | | 264,024 | | | | — | | | | (24 | ) |
See Notes to Financial Statements.
PGIM Emerging Markets Debt Hard Currency Fund 41
Schedule of Investments (continued)
as of October 31, 2020
Forward foreign currency exchange contracts outstanding at October 31, 2020 (continued):
| | | | | | | | | | | | | | | | | | | | | | | | | | |
Sale Contracts | | Counterparty | | Notional
Amount
(000) | | | Value at
Settlement
Date | | | Current
Value | | | Unrealized
Appreciation | | Unrealized
Depreciation |
OTC Forward Foreign Currency Exchange Contracts (cont’d.): | |
Philippine Peso (cont’d.), | | | | | | | | | | | | | | | | | | | | | | | | |
Expiring 12/16/20 | | JPMorgan Chase Bank, N.A. | | | PHP | | | | 15,705 | | | $ | 321,785 | | | $ | 323,238 | | | $ | — | | | $ | (1,453 | ) |
Russian Ruble, | | | | | | | | | | | | | | | | | | | | | | | | | | |
Expiring 12/16/20 | | Citibank, N.A. | | | RUB | | | | 9,290 | | | | 117,000 | | | | 116,301 | | | | 699 | | | | — | |
Expiring 12/16/20 | | Citibank, N.A. | | | RUB | | | | 6,076 | | | | 80,000 | | | | 76,069 | | | | 3,931 | | | | — | |
Singapore Dollar, | | | | | | | | | | | | | | | | | | | | | | | | | | |
Expiring 12/16/20 | | Citibank, N.A. | | | SGD | | | | 206 | | | | 151,000 | | | | 150,598 | | | | 402 | | | | — | |
Expiring 12/16/20 | | Credit Suisse International | | | SGD | | | | 242 | | | | 177,000 | | | | 177,096 | | | | — | | | | (96 | ) |
Expiring 12/16/20 | | Credit Suisse International | | | SGD | | | | 226 | | | | 164,000 | | | | 165,557 | | | | — | | | | (1,557 | ) |
Expiring 12/16/20 | | JPMorgan Chase Bank, N.A. | | | SGD | | | | 227 | | | | 166,000 | | | | 166,339 | | | | — | | | | (339 | ) |
Expiring 12/16/20 | | JPMorgan Chase Bank, N.A. | | | SGD | | | | 195 | | | | 143,000 | | | | 142,733 | | | | 267 | | | | — | |
South African Rand, | | | | | | | | | | | | | | | | | | | | | | | | | | |
Expiring 12/17/20 | | Barclays Bank PLC | | | ZAR | | | | 1,769 | | | | 104,479 | | | | 108,074 | | | | — | | | | (3,595 | ) |
Expiring 12/17/20 | | Citibank, N.A. | | | ZAR | | | | 2,769 | | | | 165,189 | | | | 169,201 | | | | — | | | | (4,012 | ) |
Expiring 12/17/20 | | Citibank, N.A. | | | ZAR | | | | 1,491 | | | | 86,305 | | | | 91,118 | | | | — | | | | (4,813 | ) |
Expiring 12/17/20 | | Citibank, N.A. | | | ZAR | | | | 1,231 | | | | 71,102 | | | | 75,198 | | | | — | | | | (4,096 | ) |
Expiring 12/17/20 | | Goldman Sachs International | | | ZAR | | | | 7,206 | | | | 441,729 | | | | 440,327 | | | | 1,402 | | | | — | |
Expiring 12/17/20 | | JPMorgan Chase Bank, N.A. | | | ZAR | | | | 1,699 | | | | 100,773 | | | | 103,835 | | | | — | | | | (3,062 | ) |
Expiring 12/17/20 | | JPMorgan Chase Bank, N.A. | | | ZAR | | | | 1,219 | | | | 72,092 | | | | 74,465 | | | | — | | | | (2,373 | ) |
South Korean Won, | | | | | | | | | | | | | | | | | | | | | | | | | | |
Expiring 12/16/20 | | Citibank, N.A. | | | KRW | | | | 118,530 | | | | 100,000 | | | | 104,254 | | | | — | | | | (4,254 | ) |
Expiring 12/16/20 | | Credit Suisse International | | | KRW | | | | 147,246 | | | | 130,000 | | | | 129,511 | | | | 489 | | | | — | |
Expiring 12/16/20 | | HSBC Bank USA, N.A. | | | KRW | | | | 164,214 | | | | 145,000 | | | | 144,436 | | | | 564 | | | | — | |
Expiring 12/16/20 | | JPMorgan Chase Bank, N.A. | | | KRW | | | | 153,461 | | | | 135,000 | | | | 134,978 | | | | 22 | | | | — | |
Expiring 12/16/20 | | JPMorgan Chase Bank, N.A. | | | KRW | | | | 148,855 | | | | 131,000 | | | | 130,927 | | | | 73 | | | | — | |
Expiring 12/16/20 | | JPMorgan Chase Bank, N.A. | | | KRW | | | | 83,319 | | | | 73,157 | | | | 73,283 | | | | — | | | | (126 | ) |
Expiring 12/16/20 | | Morgan Stanley & Co. International PLC | | | KRW | | | | 157,208 | | | | 135,000 | | | | 138,273 | | | | — | | | | (3,273 | ) |
Thai Baht, | | | | | | | | | | | | | | | | | | | | | | | | | | |
Expiring 12/16/20 | | Citibank, N.A. | | | THB | | | | 7,584 | | | | 242,000 | | | | 243,260 | | | | — | | | | (1,260 | ) |
Expiring 12/16/20 | | HSBC Bank USA, N.A. | | | THB | | | | 7,124 | | | | 225,000 | | | | 228,503 | | | | — | | | | (3,503 | ) |
Expiring 12/16/20 | | HSBC Bank USA, N.A. | | | THB | | | | 5,172 | | | | 163,000 | | | | 165,908 | | | | — | | | | (2,908 | ) |
Expiring 12/16/20 | | JPMorgan Chase Bank, N.A. | | | THB | | | | 5,206 | | | | 164,000 | | | | 167,006 | | | | — | | | | (3,006 | ) |
See Notes to Financial Statements.
42
Forward foreign currency exchange contracts outstanding at October 31, 2020 (continued):
| | | | | | | | | | | | | | | | | | | | | | | | | | | | | | | | | | | | | | | | | | |
Sale Contracts | | Counterparty | | Notional
Amount
(000) | | | Value at
Settlement
Date | | | Current
Value | | | Unrealized
Appreciation | | | Unrealized
Depreciation | |
OTC Forward Foreign Currency Exchange Contracts (cont’d.): | | | | | | | | | | | | | | | | | | | | | | | | | | | | | | | | | |
Turkish Lira, | | | | | | | | | | | | | | | | | | | | | | | | | | | | | | | | | | | | | | | | | | |
Expiring 12/16/20 | | Barclays Bank PLC | | | TRY | | | | 4,468 | | | $ | 551,786 | | | $ | 520,654 | | | | | | | $ | 31,132 | | | | | | | | | | | $ | — | | | | | |
Expiring 12/16/20 | | Barclays Bank PLC | | | TRY | | | | 722 | | | | 93,977 | | | | 84,190 | | | | | | | | 9,787 | | | | | | | | | | | | — | | | | | |
Expiring 12/16/20 | | Barclays Bank PLC | | | TRY | | | | 722 | | | | 92,866 | | | | 84,190 | | | | | | | | 8,676 | | | | | | | | | | | | — | | | | | |
Expiring 12/16/20 | | Barclays Bank PLC | | | TRY | | | | 651 | | | | 84,942 | | | | 75,869 | | | | | | | | 9,073 | | | | | | | | | | | | — | | | | | |
Expiring 12/16/20 | | Barclays Bank PLC | | | TRY | | | | 636 | | | | 80,000 | | | | 74,138 | | | | | | | | 5,862 | | | | | | | | | | | | — | | | | | |
Expiring 12/16/20 | | Barclays Bank PLC | | | TRY | | | | 569 | | | | 71,000 | | | | 66,256 | | | | | | | �� | 4,744 | | | | | | | | | | | | — | | | | | |
Expiring 12/16/20 | | Barclays Bank PLC | | | TRY | | | | 540 | | | | 70,564 | | | | 62,911 | | | | | | | | 7,653 | | | | | | | | | | | | — | | | | | |
Expiring 12/16/20 | | Barclays Bank PLC | | | TRY | | | | 432 | | | | 56,000 | | | | 50,372 | | | | | | | | 5,628 | | | | | | | | | | | | — | | | | | |
Expiring 12/16/20 | | Barclays Bank PLC | | | TRY | | | | 381 | | | | 49,405 | | | | 44,440 | | | | | | | | 4,965 | | | | | | | | | | | | — | | | | | |
Expiring 12/16/20 | | Barclays Bank PLC | | | TRY | | | | 371 | | | | 48,000 | | | | 43,174 | | | | | | | | 4,826 | | | | | | | | | | | | — | | | | | |
Expiring 12/16/20 | | Citibank, N.A. | | | TRY | | | | 558 | | | | 71,000 | | | | 65,040 | | | | | | | | 5,960 | | | | | | | | | | | | — | | | | | |
Expiring 12/16/20 | | Goldman Sachs International | | | TRY | | | | 461 | | | | 58,182 | | | | 53,696 | | | | | | | | 4,486 | | | | | | | | | | | | — | | | | | |
Expiring 12/16/20 | | JPMorgan Chase Bank, N.A. | | | TRY | | | | 574 | | | | 73,000 | | | | 66,844 | | | | | | | | 6,156 | | | | | | | | | | | | — | | | | | |
Expiring 12/16/20 | | JPMorgan Chase Bank, N.A. | | | TRY | | | | 565 | | | | 72,800 | | | | 65,808 | | | | | | | | 6,992 | | | | | | | | | | | | — | | | | | |
| | | | | | | | | | | | | | | | | | | | | | | | | | | | | | | | | | | | | | | | | | |
| | | | | | | | | | | | $ | 21,739,708 | | | $ | 21,644,494 | | | | | | | | 223,415 | | | | | | | | | | | | (128,201 | ) | | | | |
| | | | | | | | | | | | | | | | | | | | | | | | | | | | | | | | | | | | | | | | | | |
| | | | | | | | | | | | | | | | | | | | | | | | $ | 453,328 | | | | | | | | | | | $ | (317,406 | ) | | | | |
| | | | | | | | | | | | | | | | | | | | | | | | | | | | | | | | | | | | | | | | | | |
Cross currency exchange contracts outstanding at October 31, 2020:
| | | | | | | | | | | | | | | | | | | | | | | | | | | | | | |
Settlement | | Type | | Notional Amount (000) | | In Exchange
For (000) | | Unrealized Appreciation | | Unrealized
Depreciation | | Counterparty |
OTC Cross Currency Exchange Contracts: | | | | | | | | | | | | | | | | | | | | | |
| | | | | | |
01/20/21 | | | | Buy | | | | EUR | 76 | | | | | AUD 126 | | | | $ | — | | | | $ | (130 | ) | | |
| JPMorgan Chase Bank,
N.A. |
|
| | | | | | | | | | | | | | | | | | | | | | | | | | | | | | |
Interest rate swap agreements outstanding at October 31, 2020:
| | | | | | | | | | | | | | | | | | | | |
Notional
Amount (000)# | | Termination
Date | | | Fixed
Rate | | Floating Rate | | Value at
Trade Date | | | Value at
October 31,
2020 | | Unrealized
Appreciation
(Depreciation) |
Centrally Cleared Interest Rate Swap Agreements: | | | | | | | | | | | | |
CNH 2,200 | | | 05/11/25 | | | 1.900%(Q) | | 7 Day China Fixing Repo Rates(2)(Q) | | $ | (2 | ) | | $ | (9,982 | ) | | $ | (9,980 | ) |
CNH 2,200 | | | 05/29/25 | | | 2.020%(Q) | | 7 Day China Fixing Repo Rates(2)(Q) | | | 4 | | | | (8,301 | ) | | | (8,305 | ) |
See Notes to Financial Statements.
PGIM Emerging Markets Debt Hard Currency Fund 43
Schedule of Investments (continued)
as of October 31, 2020
Interest rate swap agreements outstanding at October 31, 2020 (continued):
| | | | | | | | | | | | | | | | | | | | | | | | | | | | | | | | | | | | | | | | | | | | | | |
Notional Amount (000)# | | Termination
Date | | | Fixed
Rate | | | Floating Rate | | Value at
Trade Date | | | Value at
October 31,
2020 | | | Unrealized
Appreciation
(Depreciation) | |
Centrally Cleared Interest Rate Swap Agreements (cont’d.): | | | | | |
CNH 7,600 | | | 07/24/25 | | | | 2.525%(Q) | | | 7 Day China Fixing Repo Rates(2)(Q) | | | | | | $ | (4,817 | ) | | | | | | | | | | $ | (3,333 | ) | | | | | | | | | | $ | 1,484 | | | | | |
MXN 34,655 | | | 04/28/27 | | | | 5.930%(M) | | | 28 Day Mexican Interbank Rate(2)(M) | | | | | | | 41,131 | | | | | | | | | | | | 48,739 | | | | | | | | | | | | 7,608 | | | | | |
| | | | | | | | | | | | | | | | | | | | | | | | | | | | | | | | | | | | | | | | | | | | | | |
| | | | | | | | | | | | | | | | $ | 36,316 | | | | | | | | | | | $ | 27,123 | | | | | | | | | | | $ | (9,193 | ) | | | | |
| | | | | | | | | | | | | | | | | | | | | | | | | | | | | | | | | | | | | | | | | | | | | | |
| (1) | The Series pays the fixed rate and receives the floating rate. |
| (2) | The Series pays the floating rate and receives the fixed rate. |
Summary of Collateral for Centrally Cleared/Exchange-traded Derivatives:
Cash and securities segregated as collateral, including pending settlement for closed positions, to cover requirements for centrally cleared/exchange-traded derivatives are listed by broker as follows:
| | | | | | | | | | |
Broker | | Cash and/or Foreign Currency | | Securities Market Value |
J.P. Morgan Securities LLC | | | $ | 500,000 | | | | $ | — | |
| | | | | | | | | | |
Fair Value Measurements:
Various inputs are used in determining the value of the Series’ investments. These inputs are summarized in the three broad levels listed below.
Level 1—unadjusted quoted prices generally in active markets for identical securities.
Level 2—quoted prices for similar securities, interest rates and yield curves, prepayment speeds, foreign currency exchange rates and other observable inputs.
Level 3—unobservable inputs for securities valued in accordance with Board approved fair valuation procedures.
The following is a summary of the inputs used as of October 31, 2020 in valuing such portfolio securities:
| | | | | | | | | | |
| | | Level 1 | | | Level 2 | | | Level 3 |
Investments in Securities | | | | | | | | | | |
Assets | | | | | | | | | | |
Corporate Bonds | | | | | | | | | | |
Argentina | | $ | — | | | $ | 92,191 | | | $— |
Azerbaijan | | | — | | | | 522,114 | | | — |
Bahrain | | | — | | | | 433,087 | | | — |
Brazil | | | — | | | | 2,767,005 | | | — |
Chile | | | — | | | | 1,191,478 | | | — |
China | | | — | | | | 1,978,244 | | | — |
Colombia | | | — | | | | 194,693 | | | — |
Guatemala | | | — | | | | 207,438 | | | — |
India | | | — | | | | 1,007,285 | | | — |
See Notes to Financial Statements.
44
| | | | | | | | | | |
| | | Level 1 | | | Level 2 | | | Level 3 |
Investments in Securities (continued) | | | | | | | | | | |
Assets (continued) | | | | | | | | | | |
Corporate Bonds (continued) | | | | | | | | | | |
Indonesia | | $ | — | | | $ | 3,002,587 | | | $— |
Israel | | | — | | | | 207,133 | | | — |
Jamaica | | | — | | | | 171,419 | | | — |
Kazakhstan | | | — | | | | 1,549,005 | | | — |
Kuwait | | | — | | | | 476,149 | | | — |
Malaysia | | | — | | | | 1,584,913 | | | — |
Mexico | | | — | | | | 5,473,859 | | | — |
Peru | | | — | | | | 221,359 | | | — |
Russia | | | — | | | | 1,338,434 | | | — |
Saudi Arabia | | | — | | | | 226,185 | | | — |
South Africa | | | — | | | | 2,206,509 | | | — |
Thailand | | | — | | | | 183,980 | | | — |
Trinidad & Tobago | | | — | | | | 185,668 | | | — |
Tunisia | | | — | | | | 518,364 | | | — |
Turkey | | | — | | | | 186,380 | | | — |
Ukraine | | | — | | | | 425,775 | | | — |
United Arab Emirates | | | — | | | | 1,661,978 | | | — |
United States | | | — | | | | 210,673 | | | — |
Venezuela | | | — | | | | 62,050 | | | — |
Vietnam | | | — | | | | 255,160 | | | — |
Sovereign Bonds | | | | | | | | | | |
Angola | | | — | | | | 1,886,760 | | | — |
Argentina | | | — | | | | 2,836,815 | | | — |
Bahrain | | | — | | | | 1,525,832 | | | — |
Belarus | | | — | | | | 619,151 | | | — |
Brazil | | | — | | | | 2,848,915 | | | — |
Cameroon | | | — | | | | 420,634 | | | — |
Colombia | | | — | | | | 2,199,404 | | | — |
Congo (Republic) | | | — | | | | 205,149 | | | — |
Costa Rica | | | — | | | | 1,335,732 | | | — |
Croatia | | | — | | | | 349,543 | | | — |
Dominican Republic | | | — | | | | 3,510,095 | | | — |
Ecuador | | | — | | | | 1,881,344 | | | — |
Egypt | | | — | | | | 2,590,219 | | | — |
El Salvador | | | — | | | | 1,290,874 | | | — |
Gabon | | | — | | | | 762,758 | | | — |
Ghana | | | — | | | | 1,996,740 | | | — |
Guatemala | | | — | | | | 943,325 | | | — |
Honduras | | | — | | | | 608,921 | | | — |
Hungary | | | — | | | | 1,491,408 | | | — |
India | | | — | | | | 407,241 | | | — |
Indonesia | | | — | | | | 2,650,146 | | | — |
Iraq | | | — | | | | 961,451 | | | — |
Israel | | | — | | | | 1,526,571 | | | — |
Ivory Coast | | | — | | | | 1,422,014 | | | — |
Jamaica | | | — | | | | 1,023,678 | | | — |
See Notes to Financial Statements.
PGIM Emerging Markets Debt Hard Currency Fund 45
Schedule of Investments (continued)
as of October 31, 2020
| | | | | | | | | | |
| | | Level 1 | | | Level 2 | | | Level 3 |
Investments in Securities (continued) | | | | | | | | | | |
Assets (continued) | | | | | | | | | | |
Sovereign Bonds (continued) | | | | | | | | | | |
Jordan | | $ | — | | | $ | 622,311 | | | $— |
Kazakhstan | | | — | | | | 628,187 | | | — |
Kenya | | | — | | | | 1,035,703 | | | — |
Lebanon | | | — | | | | 468,366 | | | — |
Luxembourg | | | — | | | | 135,592 | | | — |
Malaysia | | | — | | | | 1,986,497 | | | — |
Mexico | | | — | | | | 1,025,494 | | | — |
Morocco | | | — | | | | 216,123 | | | — |
Mozambique | | | — | | | | 494,575 | | | — |
Namibia | | | — | | | | 202,360 | | | — |
Nigeria | | | — | | | | 2,225,592 | | | — |
Oman | | | — | | | | 1,590,770 | | | — |
Pakistan | | | — | | | | 1,199,558 | | | — |
Panama | | | — | | | | 1,976,112 | | | — |
Papua New Guinea | | | — | | | | 395,809 | | | — |
Paraguay | | | — | | | | 483,615 | | | — |
Peru | | | — | | | | 1,909,666 | | | — |
Philippines | | | — | | | | 2,478,424 | | | — |
Qatar | | | — | | | | 3,508,843 | | | — |
Romania | | | — | | | | 2,104,950 | | | — |
Russia | | | — | | | | 2,765,134 | | | — |
Saudi Arabia | | | — | | | | 2,726,241 | | | — |
Senegal | | | — | | | | 395,178 | | | — |
Serbia | | | — | | | | 694,790 | | | — |
South Africa | | | — | | | | 1,126,131 | | | — |
Sri Lanka | | | — | | | | 1,626,239 | | | — |
Turkey | | | — | | | | 3,019,397 | | | — |
Ukraine | | | — | | | | 4,356,655 | | | — |
United Arab Emirates | | | — | | | | 1,507,565 | | | — |
Uruguay | | | — | | | | 1,741,185 | | | — |
Venezuela | | | — | | | | 16,625 | | | — |
Zambia | | | — | | | | 520,207 | | | — |
Common Stock | | | 3,571 | | | | — | | | — |
Affiliated Mutual Funds | | | 4,887,072 | | | | — | | | — |
| | | | | | | | | | |
Total | | $ | 4,890,643 | | | $ | 111,019,729 | | | $— |
| | | | | | | | | | |
| | | |
Liabilities | | | | | | | | | | |
Options Written | | $ | — | | | $ | (30,447 | ) | | $— |
| | | | | | | | | | |
| | | |
Other Financial Instruments* | | | | | | | | | | |
Assets | | | | | | | | | | |
Futures Contracts | | $ | 90,911 | | | $ | — | | | $— |
See Notes to Financial Statements.
46
| | | | | | | | | | |
| | | Level 1 | | | Level 2 | | | Level 3 |
Other Financial Instruments* (continued) | | | | | | | | | | |
Assets (continued) | | | | | | | | | | |
OTC Forward Foreign Currency Exchange Contracts | | $ | — | | | $ | 453,328 | | | $— |
Centrally Cleared Interest Rate Swap Agreements | | | — | | | | 9,092 | | | — |
| | | | | | | | | | |
Total | | $ | 90,911 | | | $ | 462,420 | | | $— |
| | | | | | | | | | |
| | | |
Liabilities | | | | | | | | | | |
Futures Contracts | | $ | (121,597 | ) | | $ | — | | | $— |
OTC Forward Foreign Currency Exchange Contracts | | | — | | | | (317,406 | ) | | — |
OTC Cross Currency Exchange Contracts | | | — | | | | (130 | ) | | — |
Centrally Cleared Interest Rate Swap Agreements | | | — | | | | (18,285 | ) | | — |
| | | | | | | | | | |
Total | | $ | (121,597 | ) | | $ | (335,821 | ) | | $— |
| | | | | | | | | | |
| * | Other financial instruments are derivative instruments not reflected in the Schedule of Investments, such as futures, forwards and centrally cleared swap contracts, which are recorded at the unrealized appreciation (depreciation) on the instrument, and OTC swap contracts which are recorded at fair value. |
Industry Classification:
The industry classification of investments and other assets in excess of liabilities shown as a percentage of net assets as of October 31, 2020 were as follows (unaudited):
| | | | |
Sovereign Bonds | | | 70.6 | % |
Oil & Gas | | | 11.8 | |
Affiliated Mutual Funds (0.9% represents investments purchased with collateral from securities on loan) | | | 4.2 | |
Electric | | | 3.1 | |
Chemicals | | | 1.5 | |
Mining | | | 1.4 | |
Transportation | | | 1.1 | |
Banks | | | 0.9 | |
Commercial Services | | | 0.6 | |
Pipelines | | | 0.6 | |
Engineering & Construction | | | 0.5 | |
Building Materials | | | 0.4 | |
Real Estate | | | 0.4 | |
Retail | | | 0.4 | |
Telecommunications | | | 0.3 | |
Diversified Financial Services | | | 0.2 | |
| | | | |
Media | | | 0.2 | % |
Investment Companies | | | 0.2 | |
Energy-Alternate Sources | | | 0.2 | |
Agriculture | | | 0.2 | |
Auto Parts & Equipment | | | 0.2 | |
Forest Products & Paper | | | 0.1 | |
Iron/Steel | | | 0.1 | |
Oil, Gas & Consumable Fuels | | | 0.0 | * |
| | | | |
| | | 99.2 | |
Options Written | | | (0.0 | )* |
Other assets in excess of liabilities | | | 0.8 | |
| | | | |
| |
| | | 100.0 | % |
| | | | |
Effects of Derivative Instruments on the Financial Statements and Primary Underlying Risk Exposure:
The Series invested in derivative instruments during the reporting period. The primary types of risk associated with these derivative instruments are foreign exchange contracts risk and interest rate contracts risk. See the Notes to Financial
See Notes to Financial Statements.
PGIM Emerging Markets Debt Hard Currency Fund 47
Schedule of Investments (continued)
as of October 31, 2020
Statements for additional detail regarding these derivative instruments and their risks. The effect of such derivative instruments on the Series’ financial position and financial performance as reflected in the Statement of Assets and Liabilities and Statement of Operations is presented in the summary below.
Fair values of derivative instruments as of October 31, 2020 as presented in the Statement of Assets and Liabilities:
| | | | | | | | | | | | | | | | |
| | | Asset Derivatives | | | Liability Derivatives | |
Derivatives not accounted for as hedging instruments, carried at fair value | | Statement of
Assets and
Liabilities Location | | | Fair
Value | | | Statement of
Assets and
Liabilities Location | | | Fair
Value | |
Foreign exchange contracts | | | | | | $ | — | | |
| Options written
outstanding, at value |
| | $ | 30,447 | |
Foreign exchange contracts | | | — | | | | — | | |
| Unrealized depreciation
on OTC cross currency
exchange contracts |
| | | 130 | |
Foreign exchange contracts | |
| Unrealized appreciation
on OTC forward foreign
currency exchange
contracts |
| | | 453,328 | | |
| Unrealized depreciation
on OTC forward foreign
currency exchange
contracts |
| | | 317,406 | |
Interest rate contracts | |
| Due from/to broker-
variation margin futures |
| | | 90,911 | * | |
| Due from/to broker-
variation margin futures |
| | | 121,597 | * |
Interest rate contracts | |
| Due from/to broker-
variation margin swaps |
| | | 9,092 | * | |
| Due from/to broker-
variation margin swaps |
| | | 18,285 | * |
| | | | | | | | | | | | | | | | |
| | | | | | $ | 553,331 | | | | | | | $ | 487,865 | |
| | | | | | | | | | | | | | | | |
| * | Includes cumulative appreciation (depreciation) as reported in the schedule of open futures and centrally cleared swap contracts. Only unsettled variation margin receivable (payable) is reported within the Statement of Assets and Liabilities. |
The effects of derivative instruments on the Statement of Operations for the year ended October 31, 2020 are as follows:
| | | | | | | | | | | | | | | | | | | | | | | | | |
Amount of Realized Gain (Loss) on Derivatives Recognized in Income |
Derivatives not accounted for as hedging instruments, carried at fair value | | Options
Purchased(1) | | Options
Written | | Futures | | Forward
& Cross
Currency
Exchange
Contracts | | Swaps |
Foreign exchange contracts | | | $ | (321 | ) | | | $ | 34,072 | | | | $ | — | | | | $ | (207,974 | ) | | | $ | — | |
Interest rate contracts | | | | — | | | | | — | | | | | (20,245 | ) | | | | — | | | | | (715 | ) |
| | | | | | | | | | | | | | | | | | | | | | | | | |
Total | | | $ | (321 | ) | | | $ | 34,072 | | | | $ | (20,245 | ) | | | $ | (207,974 | ) | | | $ | (715 | ) |
| | | | | | | | | | | | | | | | | | | | | | | | | |
| (1) | Included in net realized gain (loss) on investment transactions in the Statement of Operations. |
See Notes to Financial Statements.
48
| | | | | | | | | | | | | | | | | | | | |
Change in Unrealized Appreciation (Depreciation) on Derivatives Recognized in Income |
Derivatives not accounted for as hedging instruments, carried at fair value | | Options
Written | | Futures | | Forward & Cross
Currency
Exchange
Contracts | | Swaps |
Foreign exchange contracts | | | $ | 97 | | | | $ | — | | | | $ | 149,689 | | | | $ | — | |
Interest rate contracts | | | | — | | | | | (30,686 | ) | | | | — | | | | | (9,193 | ) |
| | | | | | | | | | | | | | | | | | | | |
Total | | | $ | 97 | | | | $ | (30,686 | ) | | | $ | 149,689 | | | | $ | (9,193 | ) |
| | | | | | | | | | | | | | | | | | | | |
For the year ended October 31, 2020, the Series’ average volume of derivative activities is as follows:
| | | | | | | | |
Options Purchased(1) | | Options Written(2) | | Futures Contracts— Long Positions(2) | | Futures Contracts— Short Positions(2) | | Forward Foreign Currency Exchange Contracts—Purchased(3) |
$3 | | $479,820 | | $2,862,400 | | $4,599,367 | | $11,067,652 |
| | | | |
Forward Foreign Currency Exchange Contracts - Sold(3) | | Cross Currency Exchange Contracts(4) | | Interest Rate Swap Agreements(2) |
$11,748,690 | | $53,915 | | $969,432 |
| (2) | Notional Amount in USD. |
| (3) | Value at Settlement Date. |
Average volume is based on average quarter end balances as noted for the year ended October 31, 2020.
Financial Instruments/Transactions—Summary of Offsetting and Netting Arrangements:
The Series invested in OTC derivatives and entered into financial instruments/transactions during the reporting period that are either offset in accordance with current requirements or are subject to enforceable master netting arrangements or similar agreements that permit offsetting. The information about offsetting and related netting arrangements for OTC derivatives and financial instruments/transactions where the legal right to set-off exists is presented in the summary below.
Offsetting of financial instrument/transaction assets and liabilities:
| | | | | | | | | | | | | | | |
Description | | Gross Market
Value of
Recognized
Assets/(Liabilities) | | Collateral
Pledged/(Received)(2) | | Net
Amount |
Securities on Loan | | | $ | 1,005,308 | | | | $ | (1,005,308 | ) | | | $ | — | |
| | | | | | | | | | | | | | | |
See Notes to Financial Statements.
PGIM Emerging Markets Debt Hard Currency Fund 49
Schedule of Investments (continued)
as of October 31, 2020
Offsetting of OTC derivative assets and liabilities:
| | | | | | | | | | | | | | | | | | | | | | | | | |
Counterparty | | Gross Amounts of
Recognized
Assets(1) | | Gross Amounts of
Recognized
Liabilities(1) | | Net Amounts of
Recognized
Assets/(Liabilities) | | Collateral
Pledged/(Received)(2) | | Net Amount |
Bank of America, N.A. | | | $ | 2,991 | | | | $ | (7,458 | ) | | | $ | (4,467 | ) | | | $ | — | | | | $ | (4,467 | ) |
Barclays Bank PLC | | | | 95,157 | | | | | (36,966 | ) | | | | 58,191 | | | | | — | | | | | 58,191 | |
BNP Paribas S.A. | | | | 9,587 | | | | | (2,651 | ) | | | | 6,936 | | | | | — | | | | | 6,936 | |
Citibank, N.A. | | | | 106,434 | | | | | (82,543 | ) | | | | 23,891 | | | | | — | | | | | 23,891 | |
Credit Suisse International | | | | 4,405 | | | | | (8,862 | ) | | | | (4,457 | ) | | | | — | | | | | (4,457 | ) |
Goldman Sachs International | | | | 38,980 | | | | | (36,632 | ) | | | | 2,348 | | | | | — | | | | | 2,348 | |
HSBC Bank USA, N.A. | | | | 71,264 | | | | | (44,985 | ) | | | | 26,279 | | | | | — | | | | | 26,279 | |
JPMorgan Chase Bank, N.A. | | | | 67,116 | | | | | (50,617 | ) | | | | 16,499 | | | | | — | | | | | 16,499 | |
Morgan Stanley & Co. International PLC | | | | 17,105 | | | | | (76,515 | ) | | | | (59,410 | ) | | | | — | | | | | (59,410 | ) |
The Toronto-Dominion Bank | | | | 1,318 | | | | | — | | | | | 1,318 | | | | | — | | | | | 1,318 | |
UBS AG | | | | 38,971 | | | | | (754 | ) | | | | 38,217 | | | | | — | | | | | 38,217 | |
| | | | | | | | | | | | | | | | | | | | | | | | | |
| | | $ | 453,328 | | | | $ | (347,983 | ) | | | $ | 105,345 | | | | $ | — | | | | $ | 105,345 | |
| | | | | | | | | | | | | | | | | | | | | | | | | |
| (1) | Includes unrealized appreciation/(depreciation) on swaps and forwards, premiums paid/(received) on swap agreements and market value of purchased and written options, as represented on the Statement of Assets and Liabilities. |
| (2) | Collateral amount disclosed by the Series is limited to the market value of financial instruments/transactions and the Series’ OTC derivative exposure by counterparty. |
See Notes to Financial Statements.
50
Statement of Assets and Liabilities
as of October 31, 2020
| | | | |
Assets | | | | |
Investments at value, including securities on loan of $1,005,308: | | | | |
Unaffiliated investments (cost $114,268,190) | | $ | 111,023,300 | |
Affiliated investments (cost $4,887,072) | | | 4,887,072 | |
Cash | | | 12,506 | |
Foreign currency, at value (cost $14,986) | | | 15,004 | |
Dividends and interest receivable | | | 1,559,839 | |
Deposit with broker for centrally cleared/exchange-traded derivatives | | | 500,000 | |
Unrealized appreciation on OTC forward foreign currency exchange contracts | | | 453,328 | |
Receivable for Series shares sold | | | 192,026 | |
Due from broker—variation margin futures | | | 4,388 | |
Receivable for investments sold | | | 2,591 | |
Prepaid expenses and other assets | | | 27,082 | |
| | | | |
Total Assets | | | 118,677,136 | |
| | | | |
| |
Liabilities | | | | |
Payable to broker for collateral for securities on loan | | | 1,047,614 | |
Unrealized depreciation on OTC forward foreign currency exchange contracts | | | 317,406 | |
Payable for investments purchased | | | 270,748 | |
Payable for Series shares reacquired | | | 101,110 | |
Accrued expenses and other liabilities | | | 98,383 | |
Options written outstanding, at value (proceeds received $30,544) | | | 30,447 | |
Management fee payable | | | 14,139 | |
Due to broker—variation margin swaps | | | 3,718 | |
Affiliated transfer agent fee payable | | | 1,126 | |
Directors’ fees payable | | | 909 | |
Unrealized depreciation on OTC cross currency exchange contracts | | | 130 | |
Dividends payable | | | 110 | |
Distribution fee payable | | | 14 | |
| | | | |
Total Liabilities | | | 1,885,854 | |
| | | | |
| |
Net Assets | | $ | 116,791,282 | |
| | | | |
| | | | | |
Net assets were comprised of: | | | | |
Common stock, at par | | $ | 131,747 | |
Paid-in capital in excess of par | | | 121,679,602 | |
Total distributable earnings (loss) | | | (5,020,067 | ) |
| | | | |
Net assets, October 31, 2020 | | $ | 116,791,282 | |
| | | | |
See Notes to Financial Statements.
PGIM Emerging Markets Debt Hard Currency Fund 51
Statement of Assets and Liabilities
as of October 31, 2020
| | | | | | | | |
Class A | | | | | | | | |
Net asset value, offering price and redemption price per share, ($28,047 ÷ 3,165 shares of beneficial interest issued and outstanding) | | $ | 8.86 | | | | | |
Maximum sales charge (3.25% of offering price) | | | 0.30 | | | | | |
| | | | | | | | |
Maximum offering price to public | | $ | 9.16 | | | | | |
| | | | | | | | |
| | |
Class C | | | | | | | | |
Net asset value, offering price and redemption price per share, ($10,125 ÷ 1,143 shares of beneficial interest issued and outstanding) | | $ | 8.86 | | | | | |
| | | | | | | | |
| | |
Class Z | | | | | | | | |
Net asset value, offering price and redemption price per share, ($18,981,912 ÷ 2,140,157 shares of beneficial interest issued and outstanding) | | $ | 8.87 | | | | | |
| | | | | | | | |
| | |
Class R6 | | | | | | | | |
Net asset value, offering price and redemption price per share, ($97,771,198 ÷ 11,030,221 shares of beneficial interest issued and outstanding) | | $ | 8.86 | | | | | |
| | | | | | | | |
See Notes to Financial Statements.
52
Statement of Operations
Year Ended October 31, 2020
| | | | |
Net Investment Income (Loss) | | | | |
Income | | | | |
Interest income | | $ | 2,166,975 | |
Affiliated dividend income | | | 10,972 | |
Affiliated income from securities lending, net | | | 256 | |
| | | | |
Total income | | | 2,178,203 | |
| | | | |
| |
Expenses | | | | |
Management fee | | | 269,208 | |
Distribution fee(a) | | | 144 | |
Custodian and accounting fees | | | 80,887 | |
Registration fees(a) | | | 52,028 | |
Audit fee | | | 38,163 | |
Transfer agent’s fees and expenses (including affiliated expense of $9,185)(a) | | | 30,258 | |
Legal fees and expenses | | | 22,904 | |
Shareholders’ reports | | | 17,445 | |
Directors’ fees | | | 11,016 | |
Miscellaneous | | | 17,227 | |
| | | | |
Total expenses | | | 539,280 | |
Less: Fee waiver and/or expense reimbursement(a) | | | (259,354 | ) |
| | | | |
Net expenses | | | 279,926 | |
| | | | |
Net investment income (loss) | | | 1,898,277 | |
| | | | |
| |
Realized And Unrealized Gain (Loss) On Investment And Foreign Currency Transactions | | | | |
Net realized gain (loss) on: | | | | |
Investment transactions (including affiliated of $(36)) | | | (788,072 | ) |
Futures transactions | | | (20,245 | ) |
Forward and cross currency contract transactions | | | (207,974 | ) |
Options written transactions | | | 34,072 | |
Swap agreement transactions | | | (715 | ) |
Foreign currency transactions | | | 14,365 | |
| | | | |
| | | (968,569 | ) |
| | | | |
Net change in unrealized appreciation (depreciation) on: | | | | |
Investments | | | (2,716,098 | ) |
Futures | | | (30,686 | ) |
Forward and cross currency contracts | | | 149,689 | |
Options written | | | 97 | |
Swap agreements | | | (9,193 | ) |
Foreign currencies | | | (38,733 | ) |
| | | | |
| | | (2,644,924 | ) |
| | | | |
Net gain (loss) on investment and foreign currency transactions | | | (3,613,493 | ) |
| | | | |
Net Increase (Decrease) In Net Assets Resulting From Operations | | $ | (1,715,216 | ) |
| | | | |
See Notes to Financial Statements.
PGIM Emerging Markets Debt Hard Currency Fund 53
Statement of Operations
Year Ended October 31, 2020
| (a) | Class specific expenses and waivers were as follows: |
| | | | | | | | | | | | | | | | |
| | | Class A | | | Class C | | | Class Z | | | Class R6 | |
Distribution fee | | | 44 | | | | 100 | | | | — | | | | — | |
Registration fees | | | 11,249 | | | | 11,249 | | | | 18,279 | | | | 11,251 | |
Transfer agent’s fees and expenses | | | 142 | | | | 42 | | | | 29,941 | | | | 133 | |
Fee waiver and/or expense reimbursement | | | (11,442 | ) | | | (11,326 | ) | | | (85,763 | ) | | | (150,823 | ) |
See Notes to Financial Statements.
54
Statements of Changes in Net Assets
| | | | | | | | |
| | | Year Ended | |
| | | October 31, | |
| | | 2020 | | | 2019 | |
Increase (Decrease) in Net Assets | | | | | | | | |
Operations | | | | | | | | |
Net investment income (loss) | | $ | 1,898,277 | | | $ | 1,505,185 | |
Net realized gain (loss) on investment and foreign currency transactions | | | (968,569 | ) | | | 82,884 | |
Net change in unrealized appreciation (depreciation) on investments and foreign currencies | | | (2,644,924 | ) | | | 1,955,940 | |
| | | | | | | | |
Net increase (decrease) in net assets resulting from operations | | | (1,715,216 | ) | | | 3,544,009 | |
| | | | | | | | |
Dividends and Distributions | | | | | | | | |
Distributions from distributable earnings | | | | | | | | |
Class A | | | (875 | ) | | | (662 | ) |
Class C | | | (450 | ) | | | (480 | ) |
Class Z | | | (567,453 | ) | | | (200,243 | ) |
Class R6 | | | (1,662,605 | ) | | | (1,481,664 | ) |
| | | | | | | | |
| | | (2,231,383 | ) | | | (1,683,049 | ) |
| | | | | | | | |
Series share transactions | | | | | | | | |
Net proceeds from shares sold | | | 92,242,382 | | | | 4,632,832 | |
Net asset value of shares issued in reinvestment of dividends and distributions | | | 2,227,284 | | | | 1,681,976 | |
Cost of shares reacquired | | | (6,029,574 | ) | | | (1,464,362 | ) |
| | | | | | | | |
Net increase (decrease) in net assets from Series share transactions | | | 88,440,092 | | | | 4,850,446 | |
| | | | | | | | |
Total increase (decrease) | | | 84,493,493 | | | | 6,711,406 | |
Net Assets: | | | | | | | | |
Beginning of year | | | 32,297,789 | | | | 25,586,383 | |
| | | | | | | | |
End of year | | $ | 116,791,282 | | | $ | 32,297,789 | |
| | | | | | | | |
See Notes to Financial Statements.
PGIM Emerging Markets Debt Hard Currency Fund 55
Notes to Financial Statements
Prudential World Fund, Inc. (the “Fund”) is registered under the Investment Company Act of 1940, as amended (“1940 Act”), as an open-end management investment company and currently consists of seven series: PGIM Jennison Emerging Markets Equity Opportunities Fund, PGIM Jennison Global Infrastructure Fund, PGIM Jennison Global Opportunities Fund, PGIM Jennison International Opportunities Fund and PGIM QMA International Equity Fund, each of which are diversified funds for purposes of the 1940 Act and PGIM Emerging Markets Debt Hard Currency Fund and PGIM Emerging Markets Debt Local Currency Fund, each of which are non-diversified funds for purposes of the 1940 Act, and therefore, may invest a greater percentage of their assets in the securities of a single company or other issuer than a diversified fund. Investing in a non-diversified fund involves greater risk than investing in a diversified fund because a loss resulting from the decline in value of any one security may represent a greater portion of the total assets of a non-diversified fund. These financial statements relate only to the PGIM Emerging Markets Debt Hard Currency Fund (the “Series”).
The investment objective of the Series is total return, through a combination of current income and capital appreciation.
The Series follows the investment company accounting and reporting guidance of the Financial Accounting Standards Board (“FASB”) Accounting Standard Codification (“ASC”) Topic 946 Financial Services — Investment Companies. The following accounting policies conform to U.S. generally accepted accounting principles. The Series consistently follows such policies in the preparation of its financial statements.
Securities Valuation: The Series holds securities and other assets and liabilities that are fair valued at the close of each day (generally, 4:00 PM Eastern time) the New York Stock Exchange (“NYSE”) is open for trading. Fair value is the price that would be received to sell an asset or paid to transfer a liability in an orderly transaction between market participants on the measurement date. The Board of Directors (the “Board”) has adopted valuation procedures for security valuation under which fair valuation responsibilities have been delegated to PGIM Investments LLC (“PGIM Investments” or the “Manager”). Pursuant to the Board’s delegation, the Manager has established a Valuation Committee responsible for supervising the fair valuation of portfolio securities and other assets and liabilities. The valuation procedures permit the Series to utilize independent pricing vendor services, quotations from market makers, and alternative valuation methods when market quotations are either not readily available or not deemed representative of fair value. A record of the Valuation Committee’s actions is subject to the Board’s review, approval, and ratification at its next regularly scheduled quarterly meeting.
56
For the fiscal reporting year-end, securities and other assets and liabilities were fair valued at the close of the last U.S. business day. Trading in certain foreign securities may occur when the NYSE is closed (including weekends and holidays). Because such foreign securities trade in markets that are open on weekends and U.S. holidays, the values of some of the Series’ foreign investments may change on days when investors cannot purchase or redeem Series shares.
Various inputs determine how the Series’ investments are valued, all of which are categorized according to the three broad levels (Level 1, 2, or 3) detailed in the Schedule of Investments and referred to herein as the “fair value hierarchy” in accordance with FASB ASC Topic 820 - Fair Value Measurements and Disclosures.
Common or preferred stocks, exchange-traded funds and derivative instruments, if applicable, that are traded on a national securities exchange are valued at the last sale price as of the close of trading on the applicable exchange where the security principally trades. Securities traded via NASDAQ are valued at the NASDAQ official closing price. To the extent these securities are valued at the last sale price or NASDAQ official closing price, they are classified as Level 1 in the fair value hierarchy. In the event that no sale or official closing price on valuation date exists, these securities are generally valued at the mean between the last reported bid and ask prices, or at the last bid price in the absence of an ask price. These securities are classified as Level 2 in the fair value hierarchy.
Investments in open-end funds (other than exchange-traded funds) are valued at their net asset values as of the close of the NYSE on the date of valuation. These securities are classified as Level 1 in the fair value hierarchy since they may be purchased or sold at their net asset values on the date of valuation.
Fixed income securities traded in the OTC market are generally classified as Level 2 in the fair value hierarchy. Such fixed income securities are typically valued using the market approach which generally involves obtaining data from an approved independent third-party vendor source. The Series utilizes the market approach as the primary method to value securities when market prices of identical or comparable instruments are available. The third-party vendors’ valuation techniques used to derive the evaluated bid price are based on evaluating observable inputs, including but not limited to, yield curves, yield spreads, credit ratings, deal terms, tranche level attributes, default rates, cash flows, prepayment speeds, broker/dealer quotations and reported trades. Certain Level 3 securities are also valued using the market approach when obtaining a single broker quote or when utilizing transaction prices for identical securities that have been used in excess of five business days. During the reporting period, there were no changes to report with respect to the valuation approach and/or valuation techniques discussed above.
OTC and centrally cleared derivative instruments are generally classified as Level 2 in the fair value hierarchy. Such derivative instruments are typically valued using the market approach and/or income approach which generally involves obtaining data from an approved independent third-party vendor source. The Series utilizes the market approach
PGIM Emerging Markets Debt Hard Currency Fund 57
Notes to Financial Statements (continued)
when quoted prices in broker-dealer markets are available but also includes consideration of alternative valuation approaches, including the income approach. In the absence of reliable market quotations, the income approach is typically utilized for purposes of valuing derivatives such as interest rate swaps based on a discounted cash flow analysis whereby the value of the instrument is equal to the present value of its future cash inflows or outflows. Such analysis includes projecting future cash flows and determining the discount rate (including the present value factors that affect the discount rate) used to discount the future cash flows. In addition, the third-party vendors’ valuation techniques used to derive the evaluated derivative price is based on evaluating observable inputs, including but not limited to, underlying asset prices, indices, spreads, interest rates and exchange rates. Certain derivatives may be classified as Level 3 when valued using the market approach by obtaining a single broker quote or when utilizing unobservable inputs in the income approach. During the reporting period, there were no changes to report with respect to the valuation approach and/or valuation techniques discussed above.
Securities and other assets that cannot be priced according to the methods described above are valued based on pricing methodologies approved by the Board. In the event that unobservable inputs are used when determining such valuations, the securities will be classified as Level 3 in the fair value hierarchy.
When determining the fair value of securities, some of the factors influencing the valuation include: the nature of any restrictions on disposition of the securities; assessment of the general liquidity of the securities; the issuer’s financial condition and the markets in which it does business; the cost of the investment; the size of the holding and the capitalization of the issuer; the prices of any recent transactions or bids/offers for such securities or any comparable securities; any available analyst media or other reports or information deemed reliable by the Manager regarding the issuer or the markets or industry in which it operates. Using fair value to price securities may result in a value that is different from a security’s most recent closing price and from the price used by other unaffiliated mutual funds to calculate their net asset values.
Foreign Currency Translation: The books and records of the Series are maintained in U.S. dollars. Foreign currency amounts are translated into U.S. dollars on the following basis:
(i) market value of investment securities, other assets and liabilities — at the current rates of exchange;
(ii) purchases and sales of investment securities, income and expenses — at the rates of exchange prevailing on the respective dates of such transactions.
58
Although the net assets of the Series are presented at the foreign exchange rates and market values at the close of the period, the Series does not generally isolate that portion of the results of operations arising as a result of changes in the foreign exchange rates from the fluctuations arising from changes in the market prices of long-term portfolio securities held at the end of the period. Similarly, the Series does not isolate the effect of changes in foreign exchange rates from the fluctuations arising from changes in the market prices of long-term portfolio securities sold during the period. Accordingly, holding period realized foreign currency gains (losses) are included in the reported net realized gains (losses) on investment transactions. Notwithstanding the above, the Series does isolate the effect of fluctuations in foreign currency exchange rates when determining the gain (loss) upon the sale or maturity of foreign currency denominated debt obligations; such amounts are included in net
Additionally, net realized gains (losses) on foreign currency transactions represent net foreign exchange gains (losses) from the disposition of holdings of foreign currencies, currency gains (losses) realized between the trade and settlement dates on investment transactions, and the difference between the amounts of interest, dividends and foreign withholding taxes recorded on the Series’ books and the U.S. dollar equivalent amounts actually received or paid. Net unrealized currency gains (losses) arise from valuing foreign currency denominated assets and liabilities (other than investments) at period end exchange rates.
Forward and Cross Currency Contracts: A forward currency contract is a commitment to purchase or sell a foreign currency at a future date at a negotiated forward rate. The Series enters into forward currency contracts, as defined in the prospectus, in order to hedge its exposure to changes in foreign currency exchange rates on its foreign portfolio holdings or on specific receivables and payables denominated in a foreign currency and to gain exposure to certain currencies. The contracts are valued daily at current forward exchange rates and any unrealized gain (loss) is included in net unrealized appreciation or depreciation on forward and cross currency contracts. Gain (loss) is realized on the settlement date of the contract equal to the difference between the settlement value of the original and negotiated forward contracts. This gain (loss), if any, is included in net realized gain (loss) on forward and cross currency contract transactions. Risks may arise upon entering into these contracts from the potential inability of the counterparties to meet the terms of their contracts. Forward currency contracts involve risks from currency exchange rate and credit risk in excess of the amounts reflected on the Statement of Assets and Liabilities. The Series’ maximum risk of loss from counterparty credit risk is the net value of the cash flows to be received from the counterparty at the end of the contract’s life. A cross currency contract is a forward contract where a specified amount of one foreign currency will be exchanged for a specified amount of another foreign currency.
Options: The Series purchased and/or wrote options in order to hedge against adverse market movements or fluctuations in value caused by changes in prevailing interest rates, value of equities or foreign currency exchange rates with respect to securities or financial instruments which the Series currently owns or intends to purchase. The Series may also
PGIM Emerging Markets Debt Hard Currency Fund 59
Notes to Financial Statements (continued)
use options to gain additional market exposure. The Series’ principal reason for writing options is to realize, through receipt of premiums, a greater current return than would be realized on the underlying security alone. When the Series purchases an option, it pays a premium and an amount equal to that premium is recorded as an asset. When the Series writes an option, it receives a premium and an amount equal to that premium is recorded as a liability. The asset or liability is adjusted daily to reflect the current market value of the option. If an option expires unexercised, the Series realizes a gain (loss) to the extent of the premium received or paid. If an option is exercised, the premium received or paid is recorded as an adjustment to the proceeds from the sale or the cost of the purchase in determining whether the Series has realized a gain (loss). The difference between the premium and the amount received or paid at the closing of a purchase or sale transaction is also treated as a realized gain (loss). Gain (loss) on purchased options is included in net realized gain (loss) on investment transactions. Gain (loss) on written options is presented separately as net realized gain (loss) on options written transactions.
The Series, as writer of an option, may have no control over whether the underlying securities or financial instruments may be sold (called) or purchased (put). As a result, the Series bears the market risk of an unfavorable change in the price of the security or financial instrument underlying the written option. The Series, as purchaser of an OTC option, bears the risk of the potential inability of the counterparties to meet the terms of their contracts. With exchange-traded options contracts, there is minimal counterparty credit risk to the Series since the exchanges’ clearinghouse acts as counterparty to all exchange-traded options and guarantees the options contracts against default.
When the Series writes an option on a swap, an amount equal to any premium received by the Series is recorded as a liability and is subsequently adjusted to the current market value of the written option on the swap. If a call option on a swap is exercised, the Series becomes obligated to pay a fixed interest rate (noted as the strike price) and receive a variable interest rate on a notional amount. If a put option on a swap is exercised, the Series becomes obligated to pay a variable interest rate and receive a fixed interest rate (noted as the strike price) on a notional amount. Premiums received from writing options on swaps that expire or are exercised are treated as realized gains upon the expiration or exercise of such options on swaps. The risk associated with writing put and call options on swaps is that the Series will be obligated to be party to a swap agreement if an option on a swap is exercised.
Financial Futures Contracts: A financial futures contract is an agreement to purchase (long) or sell (short) an agreed amount of securities at a set price for delivery on a future date. Upon entering into a financial futures contract, the Series is required to pledge to the broker an amount of cash and/or other assets equal to a certain percentage of the contract amount. This amount is known as the “initial margin.” Subsequent payments, known as “variation margin,” are made or received by the Series each day, depending on the daily fluctuations
60
in the value of the underlying security. Such variation margin is recorded for financial statement purposes on a daily basis as unrealized gain (loss). When the contract expires or is closed, the gain (loss) is realized and is presented in the Statement of Operations as net realized gain (loss) on futures transactions.
The Series invested in financial futures contracts in order to hedge its existing portfolio securities, or securities the Series intends to purchase, against fluctuations in value caused by changes in prevailing interest rates. Should interest rates move unexpectedly, the Series may not achieve the anticipated benefits of the financial futures contracts and may realize a loss. The use of futures transactions involves the risk of imperfect correlation in movements in the price of futures contracts, interest rates and the underlying hedged assets. Since futures contracts are exchange-traded, there is minimal counterparty credit risk to the Series since the exchanges’ clearinghouse acts as counterparty to all exchange-traded futures and guarantees the futures contracts against default.
Swap Agreements: The Series entered into certain types of swap agreements detailed in the disclosures below. A swap agreement is an agreement to exchange the return generated by one instrument for the return generated by another instrument. Swap agreements are negotiated in the OTC market and may be executed either directly with a counterparty (“OTC-traded”) or through a central clearing facility, such as a registered exchange. Swap agreements are valued daily at current market value and any change in value is included in the net unrealized appreciation or depreciation on swap agreements. Centrally cleared swaps pay or receive an amount known as “variation margin”, based on daily changes in the valuation of the swap contract. For OTC-traded, upfront premiums paid and received are shown as swap premiums paid and swap premiums received in the Statement of Assets and Liabilities. Risk of loss may exceed amounts recognized on the Statement of Assets and Liabilities. Swap agreements outstanding at period end, if any, are listed on the Schedule of Investments.
Interest Rate Swaps: Interest rate swaps represent an agreement between counterparties to exchange cash flows based on the difference between two interest rates, applied to a notional principal amount for a specified period. The Series is subject to interest rate risk exposure in the normal course of pursuing its investment objective. The Series used interest rate swaps to maintain its ability to generate steady cash flow by receiving a stream of fixed rate payments or to increase exposure to prevailing market rates by receiving floating rate payments. The Series’ maximum risk of loss from counterparty credit risk is the discounted net present value of the cash flows to be received from the counterparty over the contract’s remaining life.
Master Netting Arrangements: The Fund, on behalf of the Series, is subject to various Master Agreements, or netting arrangements, with select counterparties. These are agreements which a subadviser may have negotiated and entered into on behalf of all or a portion of the Series. A master netting arrangement between the Series and the counterparty permits the Series to offset amounts payable by the Series to the same counterparty against amounts to be received; and by the receipt of collateral from the counterparty by the Series
PGIM Emerging Markets Debt Hard Currency Fund 61
Notes to Financial Statements (continued)
to cover the Series’ exposure to the counterparty. However, there is no assurance that such mitigating factors are easily enforceable. In addition to master netting arrangements, the right to set-off exists when all the conditions are met such that each of the parties owes the other determinable amounts, the reporting party has the right to set-off the amount owed with the amount owed by the other party, the reporting party intends to set-off and the right of set-off is enforceable by law. During the reporting period, there was no intention to settle on a net basis and all amounts are presented on a gross basis on the Statement of Assets and Liabilities.
The Fund, on behalf of the Series, is a party to International Swaps and Derivatives Association, Inc. (“ISDA”) Master Agreements with certain counterparties that govern OTC derivative and foreign exchange contracts entered into from time to time. The Master Agreements may contain provisions regarding, among other things, the parties’ general obligations, representations, agreements, collateral requirements, events of default and early termination. With respect to certain counterparties, in accordance with the terms of the Master Agreements, collateral posted to the Series is held in a segregated account by the Series’ custodian and with respect to those amounts which can be sold or re-pledged, is presented in the Schedule of Investments. Collateral pledged by the Series is segregated by the Series’ custodian and identified in the Schedule of Investments. Collateral can be in the form of cash or debt securities issued by the U.S. Government or related agencies or other securities as agreed to by the Series and the applicable counterparty. Collateral requirements are determined based on the Series’ net position with each counterparty. Termination events applicable to the Series may occur upon a decline in the Series’ net assets below a specified threshold over a certain period of time. Termination events applicable to counterparties may occur upon a decline in the counterparty’s long-term and short-term credit ratings below a specified level. In each case, upon occurrence, the other party may elect to terminate early and cause settlement of all derivative and foreign exchange contracts outstanding, including the payment of any losses and costs resulting from such early termination, as reasonably determined by the terminating party. Any decision by one or more of the Series’ counterparties to elect early termination could impact the Series’ future derivative activity.
In addition to each instrument’s primary underlying risk exposure (e.g. interest rate, credit, equity or foreign exchange, etc.), swap agreements involve, to varying degrees, elements of credit, market and documentation risk. Such risks involve the possibility that no liquid market for these agreements will exist, the counterparty to the agreement may default on its obligation to perform or disagree on the contractual terms of the agreement, and changes in net interest rates will be unfavorable. In connection with these agreements, securities in the portfolio may be identified or received as collateral from the counterparty in accordance with the terms of the respective swap agreements to provide or receive assets of value and to serve as recourse in the event of default or bankruptcy/insolvency of either party. Such OTC
62
derivative agreements include conditions which, when materialized, give the counterparty the right to cause an early termination of the transactions under those agreements. Any election by the counterparty for early termination of the contract(s) may impact the amounts reported on financial statements.
Short sales and OTC contracts, including forward foreign currency exchange contracts, swaps, forward rate agreements and written options involve elements of both market and credit risk in excess of the amounts reflected on the Statement of Assets and Liabilities, if applicable. Such risks may be mitigated by engaging in master netting arrangements.
Payment-In-Kind: The Series invested in the open market or received pursuant to debt restructuring, securities that pay-in-kind (PIK) the interest due on such debt instruments. The PIK interest, computed at the contractual rate specified, is added to the existing principal balance of the debt when issued bonds have same terms as the bond or recorded as a separate bond when terms are different from the existing debt, and is recorded as interest income.
Securities Lending: The Series lends its portfolio securities to banks and broker-dealers. The loans are secured by collateral at least equal to the market value of the securities loaned. Collateral pledged by each borrower is invested in an affiliated money market fund and is marked to market daily, based on the previous day’s market value, such that the value of the collateral exceeds the value of the loaned securities. In the event of significant appreciation in value of securities on loan on the last business day of the reporting period, the financial statements may reflect a collateral value that is less than the market value of the loaned securities. Such shortfall is remedied as described above. Loans are subject to termination at the option of the borrower or the Series. Upon termination of the loan, the borrower will return to the Series securities identical to the loaned securities. Should the borrower of the securities fail financially, the Series has the right to repurchase the securities in the open market using the collateral.
The Series recognizes income, net of any rebate and securities lending agent fees, for lending its securities in the form of fees or interest on the investment of any cash received as collateral. The borrower receives all interest and dividends from the securities loaned and such payments are passed back to the lender in amounts equivalent thereto, which are reflected in interest income or unaffiliated dividend income based upon the nature of the payment on the Statement of Operations. The Series also continues to recognize any unrealized gain (loss) in the market price of the securities loaned and on the change in the value of the collateral invested that may occur during the term of the loan. In addition, realized gain (loss) is recognized on changes in the value of the collateral invested upon liquidation of the collateral. Net earnings from securities lending are disclosed in the Statement of Operations.
Securities Transactions and Net Investment Income: Securities transactions are recorded on the trade date. Realized gains (losses) from investment and currency transactions are calculated on the specific identification method. Dividend income is recorded on the
PGIM Emerging Markets Debt Hard Currency Fund 63
Notes to Financial Statements (continued)
ex-date, or for certain foreign securities, when the Series becomes aware of such dividends. Interest income, including amortization of premium and accretion of discount on debt securities, as required, is recorded on the accrual basis. Expenses are recorded on an accrual basis, which may require the use of certain estimates by management that may differ from actual. Net investment income or loss (other than class specific expenses and waivers, which are allocated as noted below) and unrealized and realized gains (losses) are allocated daily to each class of shares based upon the relative proportion of adjusted net assets of each class at the beginning of the day. Class specific expenses and waivers, where applicable, are charged to the respective share classes. Class specific expenses include distribution fees and distribution fee waivers, shareholder servicing fees, transfer agent’s fees and expenses, registration fees and fee waivers and/or expense reimbursements, as applicable.
Taxes: It is the Series’ policy to continue to meet the requirements of the Internal Revenue Code applicable to regulated investment companies and to distribute all of its taxable net investment income and capital gains, if any, to its shareholders. Therefore, no federal income tax provision is required. Withholding taxes on foreign dividends, interest and capital gains, if any, are recorded, net of reclaimable amounts, at the time the related income is earned.
Dividends and Distributions: The Series expects to declare dividends of its net investment income daily and pay such dividends monthly. Distributions of net realized capital and currency gains, if any, are declared and paid at least annually. Dividends and distributions to shareholders, which are determined in accordance with federal income tax regulations and which may differ from generally accepted accounting principles, are recorded on the ex-date. Permanent book/tax differences relating to income and gain (loss) are reclassified between total distributable earnings (loss) and paid-in capital in excess of par, as appropriate.
Estimates: The preparation of financial statements requires management to make estimates and assumptions that affect the reported amounts and disclosures in the financial statements. Actual results could differ from those estimates.
The Fund, on behalf of the Series, has a management agreement with the Manager. Pursuant to this agreement, the Manager has responsibility for all investment advisory services and supervises the subadvisers’ performance of such services. In addition, under the management agreement, the Manager provides all of the administrative functions necessary for the organization, operation and management of the Series. The Manager administers the corporate affairs of the Series and, in connection therewith, furnishes the
64
Series with office facilities, together with those ordinary clerical and bookkeeping services which are not being furnished by the Series’ custodian and the Series’ transfer agent. The Manager is also responsible for the staffing and management of dedicated groups of legal, marketing, compliance and related personnel necessary for the operation of the Series. The legal, marketing, compliance and related personnel are also responsible for the management and oversight of the various service providers to the Series, including, but not limited to, the custodian, transfer agent, and accounting agent.
The Manager has entered into a subadvisory agreement with PGIM, Inc., which provides subadvisory services to the Series through its business unit PGIM Fixed Income, and PGIM Limited (each a “subadviser” and collectively the “subadvisers”). The subadvisory agreement provides that the subadvisers will furnish investment advisory services in connection with the management of the Series. In connection therewith, the subadvisers are obligated to keep certain books and records of the Series. The Manager pays for the services of the subadvisers, the cost of compensation of officers of the Series, occupancy and certain clerical and bookkeeping costs of the Series. The Series bears all other costs and expenses.
Effective December 13, 2019, the management fee paid to the Manager is accrued daily and payable monthly at an annual rate of 0.65% of the Series’ average daily net assets up to and including $1 billion; 0.63% from $1 billion to $3 billion of average daily net assets; 0.61% from $3 billion to $5 billion of average daily net assets; 0.60% from $5 billion to $10 billion of average daily net assets; and 0.59% of the average daily net assets exceeding $10 billion. Prior to December 13, 2019, the management fee paid to the Manager was accrued daily and payable monthly at an annual rate of 0.72% of the Series’ average daily net assets up to and including $1 billion; 0.70% from $1 billion to $3 billion of average daily net assets; 0.68% from $3 billion to $5 billion of average daily net assets; 0.67% from $5 billion to $10 billion of average daily net assets; and 0.66% of the average daily net assets exceeding $10 billion. The effective management fee rate before any waivers and/or expense reimbursements was 0.66% for the year ended October 31, 2020.
Effective December 1, 2019, the Manager has contractually agreed, through February 28, 2022, to limit total annual operating expenses after fee waivers and/or expense reimbursements to 1.05% of average daily net assets for Class A shares, 1.80% of average daily net assets for Class C shares, 0.75% of average daily net assets for Class Z shares and 0.65% of average daily net assets for Class R6 shares. Prior to December 1, 2019, the Manager had contractually agreed to limit total annual operating expenses after fee waivers and/or expense reimbursements to 1.05% of average daily net assets for Class A shares, 1.80% of average daily net assets for Class C shares, 0.80% of average daily net assets for Class Z shares and 0.74% of average daily net assets for Class R6 shares. This contractual waiver excludes interest, brokerage, taxes (such as income and foreign withholding taxes, stamp duty and deferred tax expenses), acquired fund fees and expenses, extraordinary expenses, and certain other Series expenses such as dividend and interest expense and broker charges on short sales.
PGIM Emerging Markets Debt Hard Currency Fund 65
Notes to Financial Statements (continued)
Where applicable, the Manager agrees to waive management fees or shared operating expenses on any share class to the same extent that it waives such expenses on any other share class. In addition, total annual operating expenses for Class R6 shares will not exceed total annual operating expenses for Class Z shares. Fees and/or expenses waived and/or reimbursed by the Manager may be recouped by the Manager within the same fiscal year during which such waiver/reimbursement is made if such recoupment can be realized without exceeding the expense limit in effect at the time of the recoupment for that fiscal year.
The Fund, on behalf of the Series, has a distribution agreement with Prudential Investment Management Services LLC (“PIMS”), which acts as the distributor of the Class A, Class C, Class Z and Class R6 shares of the Series. The Series compensates PIMS for distributing and servicing the Series’ Class A and Class C shares, pursuant to the plans of distribution (the “Distribution Plans”), regardless of expenses actually incurred by PIMS. The distribution fees are accrued daily and payable monthly. No distribution or service fees are paid to PIMS as distributor of the Class Z or Class R6 shares of the Series.
Pursuant to the Distribution Plans, the Series compensates PIMS for distribution related activities at an annual rate of up to 0.25% and 1% of the average daily net assets of the Class A and Class C shares, respectively.
For the year ended October 31, 2020, PIMS has not received any front-end sales charges resulting from sales of Class A shares. Additionally, for the year ended October 31, 2020, PIMS did not receive any contingent deferred sales charges imposed upon redemptions by certain Class A and Class C shareholders.
PGIM Investments, PGIM, Inc., PGIM Limited and PIMS are indirect, wholly-owned subsidiaries of Prudential Financial, Inc. (“Prudential”).
| 4. | Other Transactions with Affiliates |
Prudential Mutual Fund Services LLC (“PMFS”), an affiliate of PGIM Investments and an indirect, wholly-owned subsidiary of Prudential, serves as the Series’ transfer agent. Transfer agent’s fees and expenses in the Statement of Operations include certain out-of-pocket expenses paid to non-affiliates, where applicable.
The Series may invest its overnight sweep cash in the PGIM Core Ultra Short Bond Fund (the “Core Fund”), and its securities lending cash collateral in the PGIM Institutional Money Market Fund (the “Money Market Fund”), each a series of Prudential Investment Portfolios 2, registered under the 1940 Act and managed by PGIM Investments. Through the Series’ investments in the mentioned underlying funds, PGIM Investments and/or its affiliates are
66
paid fees or reimbursed for providing their services. In addition to the realized and unrealized gains on investments in the Core Fund and Money Market Fund, earnings from such investments are disclosed on the Statement of Operations as “Affiliated dividend income” and “Income from securities lending, net”, respectively.
The Series may enter into certain securities purchase or sale transactions under Board approved Rule 17a-7 procedures. Rule 17a-7 is an exemptive rule under the 1940 Act, that subject to certain conditions, permits purchase and sale transactions among affiliated investment companies, or between an investment company and a person that is affiliated solely by reason of having a common (or affiliated) investment adviser, common directors, and/or common officers. Pursuant to the Rule 17a-7 procedures and consistent with guidance issued by the Securities and Exchange Commission (“SEC”), the Fund’s Chief Compliance Officer (“CCO”) prepares a quarterly summary of all such transactions for submission to the Board, together with the CCO’s written representation that all such 17a-7 transactions were effected in accordance with the Series’ Rule 17a-7 procedures. For the year ended October 31, 2020, no 17a-7 transactions were entered into by the Series.
The aggregate cost of purchases and proceeds from sales of portfolio securities (excluding short-term investments, in-kind transactions and U.S. Government securities) for the year ended October 31, 2020, were $36,907,889 and $9,029,458, respectively.
A summary of the cost of purchases and proceeds from sales of shares of an affiliated investment for the year ended October 31, 2020, is presented as follows:
| | | | | | | | | | | | | | | | | | | | | | | | | | | | | | | | | | | |
Value, Beginning of Year | | Cost of Purchases | | Proceeds from Sales | | Change in Unrealized Gain (Loss) | | Realized Gain (Loss) | | Value, End of Year | | Shares, End of Year | | Income |
|
PGIM Core Ultra Short Bond Fund* | |
$1,254,895 | | | $ | 29,285,011 | | | | $ | 26,700,479 | | | | $ | — | | | | $ | — | | | | $ | 3,839,427 | | | | | 3,839,427 | | | | $ | 10,972 | |
|
PGIM Institutional Money Market Fund* | |
— | | | | 1,428,900 | | | | | 381,219 | | | | | — | | | | | (36 | ) | | | | 1,047,645 | | | | | 1,047,959 | | | | | 256 | ** |
| | | | | | | | | | | | | | | | | | | | | | | | | | | | | | | | | | | |
$1,254,895 | | | $ | 30,713,911 | | | | $ | 27,081,698 | | | | $ | — | | | | $ | (36 | ) | | | $ | 4,887,072 | | | | | | | | | $ | 11,228 | |
| | | | | | | | | | | | | | | | | | | | | | | | | | | | | | | | | | | |
| * | The Fund did not have any capital gain distributions during the reporting period. |
| ** | The amount, or a portion thereof, represents the affiliated securities lending income shown on the Statement of Operations. |
| 6. | Distributions and Tax Information |
Distributions to shareholders, which are determined in accordance with federal income tax regulations and which may differ from generally accepted accounting principles, are recorded on the ex-date.
PGIM Emerging Markets Debt Hard Currency Fund 67
Notes to Financial Statements (continued)
For the year ended October 31, 2020, the tax character of dividends paid by the Series was $2,231,383 of ordinary income. For the year ended October 31, 2019, the tax character of dividends paid by the Series was $1,683,049 of ordinary income.
As of October 31, 2020, the accumulated undistributed earnings on a tax basis was $32,905 of ordinary income.
The United States federal income tax basis of the Series’ investments and the net unrealized depreciation as of October 31, 2020 were as follows:
| | | | | | |
Tax Basis | | Gross Unrealized Appreciation | | Gross Unrealized Depreciation | | Net Unrealized Depreciation |
| $119,861,444 | | $363,727 | | $(4,249,333) | | $(3,885,606) |
The difference between book basis and tax basis was primarily due to deferred losses on wash sales, amortization of bond premium, foreign currency forwards, defaulted securities and other book to tax differences.
For federal income tax purposes, the Series had a capital loss carryforward as of October 31, 2020 of approximately $1,167,000 which can be carried forward for an unlimited period. No capital gains distributions are expected to be paid to shareholders until net gains have been realized in excess of such losses.
The Manager has analyzed the Series’ tax positions taken on federal, state and local income tax returns for all open tax years and has concluded that no provision for income tax is required in the Series’ financial statements for the current reporting period. Since tax authorities can examine previously filed tax returns, the Series’ U.S. federal and state tax returns for each of the three fiscal years up to the most recent fiscal year ended October 31, 2020 are subject to such review.
The Series offers Class A, Class C, Class Z and Class R6 shares. Class A shares are sold with a maximum front-end sales charge of 3.25%. Investors who purchase $500,000 or more of Class A shares and sell those shares within 12 months of purchase are subject to a contingent deferred sales charge (“CDSC”) of 1.00% on sales although these purchases are not subject to a front-end sales charge. The Class A CDSC is waived for certain retirement and/or benefit plans. A special exchange privilege is also available for shareholders who qualified to purchase Class A shares at net asset value. Class C shares are sold with a CDSC of 1% on sales made within 12 months of purchase. Class C shares will automatically convert to Class A shares on a monthly basis approximately 10 years after purchase. Class Z
68
and Class R6 shares are not subject to any sales or redemption charges and are available exclusively for sale to a limited group of investors.
Under certain circumstances, an exchange may be made from specified share classes of the Series to one or more other share classes of the Series as presented in the table of transactions in shares of common stock, below.
The Fund is authorized to issue 5.075 billion shares of common stock, $0.01 par value per share, 600 million of which are designated as shares of the Series. The shares are further classified and designated as follows:
| | | | |
Class A | | | 100,000,000 | |
Class C | | | 100,000,000 | |
Class Z | | | 200,000,000 | |
Class R6 | | | 200,000,000 | |
As of October 31, 2020, Prudential, through its affiliated entities, including affiliated funds (if applicable), owned shares of the Series as follows:
| | | | | | |
| | | Number of Shares | | | Percentage of Outstanding Shares |
Class A | | | 1,167 | | | 36.9% |
Class C | | | 1,143 | | | 100.0% |
Class R6 | | | 9,453,163 | | | 85.7% |
At the reporting period end, the number of shareholders holding greater than 5% of the Series are as follows:
| | | | | | |
| Affiliated | | Unaffiliated |
Number of Shareholders | | Percentage of Outstanding Shares | | Number of Shareholders | | Percentage of Outstanding Shares |
2 | | 71.7% | | 2 | | 25.9% |
Transactions in shares of common stock were as follows:
| | | | | | | | | | | | |
Class A | | Shares | | | | | | Amount | |
Year ended October 31, 2020: | | | | | | | | | | | | |
Shares sold | | | 1,688 | | | | | | | $ | 15,061 | |
Shares issued in reinvestment of dividends and distributions | | | 98 | | | | | | | | 875 | |
Shares reacquired | | | (12 | ) | | | | | | | (114 | ) |
| | | | | | | | | | | | |
| | | |
Net increase (decrease) in shares outstanding | | | 1,774 | | | | | | | $ | 15,822 | |
| | | | | | | | | | | | |
Year ended October 31, 2019: | | | | | | | | | | | | |
Shares sold | | | 272 | | | | | | | $ | 2,501 | |
Shares issued in reinvestment of dividends and distributions | | | 71 | | | | | | | | 661 | |
| | | | | | | | | | | | |
Net increase (decrease) in shares outstanding | | | 343 | | | | | | | $ | 3,162 | |
| | | | | | | | | | | | |
PGIM Emerging Markets Debt Hard Currency Fund 69
Notes to Financial Statements (continued)
| | | | | | | | | | |
Class C | | Shares | | | | | Amount | |
Year ended October 31, 2020: | | | | | | | | | | |
Shares issued in reinvestment of dividends and distributions | | | 51 | | | | | $ | 451 | |
| | | | | | | | | | |
Net increase (decrease) in shares outstanding | | | 51 | | | | | $ | 451 | |
| | | | | | | | | | |
Year ended October 31, 2019: | | | | | | | | | | |
Shares issued in reinvestment of dividends and distributions | | | 51 | | | | | $ | 480 | |
| | | | | | | | | | |
| | | |
Net increase (decrease) in shares outstanding | | | 51 | | | | | $ | 480 | |
| | | | | | | | | | |
Class Z | | | | | | | | | | |
Year ended October 31, 2020: | | | | | | | | | | |
Shares sold | | | 2,197,725 | | | | | $ | 19,583,643 | |
Shares issued in reinvestment of dividends and distributions | | | 63,662 | | | | | | 566,499 | |
Shares reacquired | | | (729,035 | ) | | | | | (6,023,373 | ) |
| | | | | | | | | | |
| | | |
Net increase (decrease) in shares outstanding | | | 1,532,352 | | | | | $ | 14,126,769 | |
| | | | | | | | | | |
Year ended October 31, 2019: | | | | | | | | | | |
Shares sold | | | 491,936 | | | | | $ | 4,630,331 | |
Shares issued in reinvestment of dividends and distributions | | | 21,227 | | | | | | 199,171 | |
Shares reacquired | | | (156,847 | ) | | | | | (1,464,362 | ) |
| | | | | | | | | | |
| | | |
Net increase (decrease) in shares outstanding | | | 356,316 | | | | | $ | 3,365,140 | |
| | | | | | | | | | |
| | | |
Class R6 | | | | | | | | | | |
Year ended October 31, 2020: | | | | | | | | | | |
Shares sold | | | 8,059,230 | | | | | $ | 72,643,678 | |
Shares issued in reinvestment of dividends and distributions | | | 185,305 | | | | | | 1,659,459 | |
Shares reacquired | | | (643 | ) | | | | | (6,087 | ) |
| | | | | | | | | | |
| | | |
Net increase (decrease) in shares outstanding | | | 8,243,892 | | | | | $ | 74,297,050 | |
| | | | | | | | | | |
| | | |
Year ended October 31, 2019: | | | | | | | | | | |
Shares issued in reinvestment of dividends and distributions | | | 159,025 | | | | | $ | 1,481,664 | |
| | | | | | | | | | |
Net increase (decrease) in shares outstanding | | | 159,025 | | | | | $ | 1,481,664 | |
| | | | | | | | | | |
The Fund, on behalf of the Series, along with other affiliated registered investment companies (the “Participating Funds”), is a party to a Syndicated Credit Agreement (“SCA”) with a group of banks. The purpose of the SCA is to provide an alternative source of temporary funding for capital share redemptions. The table below provides details of the current SCA in effect at the reporting period-end as well as the prior SCA.
| | | | |
| | | Current SCA | | Prior SCA |
Term of Commitment | | 10/2/2020 – 9/30/2021 | | 10/3/2019 – 10/1/2020 |
Total Commitment | | $ 1,200,000,000 | | $ 1,222,500,000* |
Annualized Commitment Fee on the Unused Portion of the SCA | | 0.15% | | 0.15% |
70
| | | | |
| | | |
| | | Current SCA | | Prior SCA |
Annualized Interest Rate on Borrowings | | 1.30% plus the higher of (1) the effective federal funds rate, (2) the one-month LIBOR rate or (3) zero percent | | 1.20% plus the higher of (1) the effective federal funds rate, (2) the one-month LIBOR rate or (3) zero percent |
* Effective March 31, 2020, the SCA’s total commitment was increased from $900,000,000 to $1,162,500,000 and subsequently, effective April 7, 2020 was increased to $1,222,500,000. |
Certain affiliated registered investment companies that are parties to the SCA include portfolios that are subject to a predetermined mathematical formula used to manage certain benefit guarantees offered under variable annuity contracts. The formula may result in large scale asset flows into and out of these portfolios. Consequently, these portfolios may be more likely to utilize the SCA for purposes of funding redemptions. It may be possible for those portfolios to fully exhaust the committed amount of the SCA, thereby requiring the Manager to allocate available funding per a Board-approved methodology designed to treat the Participating Funds in the SCA equitably.
The Series did not utilize the SCA during the year ended October 31, 2020.
| 9. | Purchases & Redemption In-kind |
On September 15, 2020, the Board approved changes which would change the way an affiliated mutual fund within the PGIM Retail Mutual Fund Complex (“PGIM Income Builder Fund”), obtained exposure to a particular asset class by investing in an applicable PGIM Retail Mutual Fund (the “Underlying Funds”), one of which is the PGIM Emerging Markets Debt Hard Currency Fund, utilizing a substantially similar investment strategy rather than from investing in direct investments.
As of the close of business on October 23, 2020, the PGIM Income Builder Fund delivered portfolio securities and other assets to four Underlying Funds in exchange for Class R6 shares of the Underlying Funds.
The following table is a summary of the value of such securities and other assets that were transferred in-kind and the shares purchased in-kind as applicable to the PGIM Emerging Markets Debt Hard Currency Fund.
| | | | | | |
| Fund/Sleeve | | Market Value of Net Assets Received | | Applicable Underlying Fund | | Applicable Underlying Fund Shares of R6 Transferred |
PGIM Income Builder Fund/Emerging Markets Debt Hard Currency | | $58,302,168 | | PGIM Emerging Markets Debt Hard Currency Fund | | 6,499,684 |
As of the Series’ fiscal year ended October 31, 2020, the value of securities which remained unsettled was $887,516.
PGIM Emerging Markets Debt Hard Currency Fund 71
Notes to Financial Statements (continued)
The dollar amount of in-kind shares is included with net proceeds from shares sold on the Statement of Changes in Net Assets. The share amount of in-kind shares is included within shares sold for Class R6 in Note 7.
For US GAAP purposes, the securities and other assets transferred were recorded at fair value, but the historical cost basis of the assets transferred was not carried forward to the Underlying Funds.
| 10. | Risks of Investing in the Series |
The Series’ risks include, but are not limited to, some or all of the risks discussed below. For further information on the Series’ risks, please refer to the Series’ Prospectus and Statement of Additional Information.
Bond Obligations Risk: As with credit risk, market risk and interest rate risk, the Series’ holdings, share price, yield and total return may fluctuate in response to bond market movements. The value of bonds may decline for issuer-related reasons, including management performance, financial leverage and reduced demand for the issuer’s goods and services. Certain types of fixed income obligations also may be subject to “call and redemption risk,” which is the risk that the issuer may call a bond held by the Series for redemption before it matures and the Series may lose income.
Credit Risk: This is the risk that the issuer, the guarantor or the insurer of a fixed income security, or the counterparty to a contract, may be unable or unwilling to make timely principal and interest payments, or to otherwise honor its obligations. Additionally, fixed income securities could lose value due to a loss of confidence in the ability of the issuer, guarantor, insurer or counterparty to pay back debt. The longer the maturity and the lower the credit quality of a bond, the more sensitive it is to credit risk.
Derivatives Risk: Derivatives involve special risks and costs and may result in losses to the Series. The successful use of derivatives requires sophisticated management, and, to the extent that derivatives are used, the Series will depend on the subadviser’s ability to analyze and manage derivative transactions. The prices of derivatives may move in unexpected ways, especially in abnormal market conditions. Some derivatives are “leveraged” and therefore may magnify or otherwise increase investment losses to the Series. The Series’ use of derivatives may also increase the amount of taxes payable by shareholders. Other risks arise from the potential inability to terminate or sell derivatives positions. A liquid secondary market may not always exist for the Series’ derivatives positions. In fact, many OTC derivative instruments lack liquidity beyond the counterparty to the instrument. OTC derivative instruments also involve the risk that the other party will not meet its obligations to the Series.
72
Emerging Markets Risk: The risks of foreign investments are greater for investments in or exposed to emerging markets. Emerging market countries typically have economic and political systems that are less fully developed, and can be expected to be less stable, than those of more developed countries. For example, the economies of such countries can be subject to rapid and unpredictable rates of inflation or deflation. Low trading volumes may result in a lack of liquidity and price volatility. Emerging market countries may have policies that restrict investment by non-US investors, or that prevent non-US investors from withdrawing their money at will. Countries with emerging markets can be found in regions such as Asia, Latin America, Eastern Europe and Africa.
The Series may invest in some emerging markets that subject it to risks such as those associated with illiquidity, custody of assets, different settlement and clearance procedures and asserting legal title under a developing legal and regulatory regime to a greater degree than in developed markets or even in other emerging markets.
Foreign Securities Risk: The Series’ investments in securities of foreign issuers or issuers with significant exposure to foreign markets involve additional risk. The securities of such issuers may trade in markets that are less liquid, less regulated and more volatile than US markets. The value of the Series’ investments may decline because of factors affecting the particular issuer as well as foreign markets and issuers generally, such as unfavorable government actions, and political or financial instability. Lack of information may also affect the value of these securities.
Interest Rate Risk: The value of an investment may go down when interest rates rise. A rise in rates tends to have a greater impact on the prices of longer term or duration debt securities. When interest rates fall, the issuers of debt obligations may prepay principal more quickly than expected, and the Series may be required to reinvest the proceeds at a lower interest rate. This is referred to as “prepayment risk.” When interest rates rise, debt obligations may be repaid more slowly than expected, and the value of the Series’ holdings may fall sharply. This is referred to as “extension risk”. The Series may face a heightened level of interest rate risk as a result of the U.S. Federal Reserve Board’s rate-setting policies. The Series may lose money if short-term or long-term interest rates rise sharply or in a manner not anticipated by the subadviser.
Large Shareholder and Large Scale Redemption Risk: Certain individuals, accounts, funds (including funds affiliated with the Manager) or institutions, including the Manager and its affiliates, may from time to time own or control a substantial amount of the Series’ shares. There is no requirement that these entities maintain their investment in the Series. There is a risk that such large shareholders or that the Series’ shareholders generally may redeem all or a substantial portion of their investments in the Series in a short period of time, which could have a significant negative impact on the Series’ NAV, liquidity, and brokerage costs. Large redemptions could also result in tax consequences to shareholders and impact the Series’ ability to implement its investment strategy. The Series’ ability to pursue its investment objective after one or more large scale redemptions may be impaired and, as a result, the Series may invest a larger portion of its assets in cash or cash equivalents.
PGIM Emerging Markets Debt Hard Currency Fund 73
Notes to Financial Statements (continued)
LIBOR Risk: Many financial instruments use or may use a floating rate based on the London Interbank Offered Rate, or “LIBOR,” which is the offered rate for short-term Eurodollar deposits between major international banks. On July 27, 2017, the Financial Conduct Authority announced a desire to phase out the use of LIBOR by the end of 2021. There remains uncertainty regarding the future utilization of LIBOR and the nature of any replacement rate. As such, the potential impact of a transition away from LIBOR on the Series or the financial instruments in which the Series invest cannot yet be determined. The elimination of LIBOR or changes to other reference rates or any other changes or reforms to the determination or supervision of reference rates could have an adverse impact on the market for, or value of, any securities or payments linked to those reference rates, which may adversely affect the Series’ performance and/or net asset value. Furthermore, the risks associated with the expected discontinuation of LIBOR and transition may be exacerbated if the work necessary to effect an orderly transition to an alternative reference rate is not completed in a timely manner. Because the usefulness of LIBOR as a benchmark could deteriorate during the transition period, these effects could occur prior to the end of 2021.
Liquidity Risk: Liquidity risk is the risk that the Fund could not meet requests to redeem shares issued by the Series without significant dilution of remaining investors’ interests in the Series. The Series may invest in instruments that trade in lower volumes and are more illiquid than other investments. If the Series is forced to sell these investments to pay redemption proceeds or for other reasons, the Series may lose money. In addition, when there is no willing buyer and investments cannot be readily sold at the desired time or price, the Series may have to accept a lower price or may not be able to sell the instrument at all. The reduction in dealer market-making capacity in the fixed income markets that has occurred in recent years also has the potential to reduce liquidity. An inability to sell a portfolio position can adversely affect the Series’ value or prevent the Series from being able to take advantage of other investment opportunities.
Market Risk: Securities markets may be volatile and the market prices of the Series’ securities may decline. Securities fluctuate in price based on changes in an issuer’s financial condition and overall market and economic conditions. If the market prices of the securities owned by the Series fall, the value of an investment in the Series will decline.
Market Disruption and Geopolitical Risks: International wars or conflicts and geopolitical developments in foreign countries, along with instability in regions such as Asia, Eastern Europe, and the Middle East, possible terrorist attacks in the United States or around the world, public health epidemics such as the outbreak of infectious diseases like the recent outbreak of coronavirus globally or the 2014–2016 outbreak in West Africa of the Ebola virus, and other similar events could adversely affect the U.S. and foreign financial markets, including increases in market volatility, reduced liquidity in the securities markets and
74
government intervention, and may cause further long-term economic uncertainties in the United States and worldwide generally.
The coronavirus pandemic and the related governmental and public responses have had and may continue to have an impact on the Series’ investments and net asset value and have led and may continue to lead to increased market volatility and the potential for illiquidity in certain classes of securities and sectors of the market. Preventative or protective actions that governments may take in respect of pandemic or epidemic diseases may result in periods of business disruption, business closures, inability to obtain raw materials, supplies and component parts, and reduced or disrupted operations for the issuers in which the Series invests. Government intervention in markets may impact interest rates, market volatility and security pricing. The occurrence, reoccurrence and pendency of such diseases could adversely affect the economies (including through changes in business activity and increased unemployment) and financial markets either in specific countries or worldwide.
Non-diversification Risk: A non-diversified Series may invest a greater percentage of its assets in the securities of a single company or industry than a diversified fund. Investing in a non-diversified fund involves greater risk than investing in a diversified fund because a loss resulting from the decline in value of any one security may represent a greater portion of the total assets of a non-diversified fund.
| 11. | Recent Accounting Pronouncement and Regulatory Developments |
In March 2020, the FASB issued Accounting Standard Update (“ASU”) No. 2020-04, which provides optional guidance for applying GAAP to contract modifications, hedging relationships and other transactions affected by the reference rate reform if certain criteria are met. ASU 2020-04 is elective and is effective on March 12, 2020 through December 31, 2022. At this time, management is evaluating the implications of certain provisions of the ASU and any impact on the financial statement disclosures has not yet been determined.
On December 3, 2020, the SEC announced that it voted to adopt a new rule that establishes an updated regulatory framework for fund valuation practices (the “Rule”). The Rule, in part, provides (i) a framework for determining fair value in good faith and (ii) provides for a fund Board’s assignment of its responsibility for the execution of valuation-related activities to a fund’s investment adviser. Further, the SEC is rescinding previously issued guidance on related issues. The Rule will become effective 60 days after publication in the Federal Register, and will have a compliance date 18 months following the effective date. Management is currently evaluating the Rule and its impact to the Funds.
PGIM Emerging Markets Debt Hard Currency Fund 75
Financial Highlights
| | | | | | | | | | | | | | | | | | | | |
Class A Shares | | | | | | | | | | | | | | | | | | | | |
| | | | | December 12, 2017(a)
through October 31,
2018 | | |
| | | Year Ended October 31, | | |
| | | | | | | | | | | |
| | | 2020 | | 2019 | | |
| | | | | | | | | | | | | | | | |
| | | | | | | | | | | | | | | | |
Per Share Operating Performance(b) : | | | | | | | | | | | | | | | | | | | | |
Net Asset Value, Beginning of Period | | | | $9.51 | | | | | $8.88 | | | | | $10.00 | | | | | | |
Income (loss) from investment operations: | | | | | | | | | | | | | | | | | | | | |
Net investment income (loss) | | | | 0.38 | | | | | 0.46 | | | | | 0.38 | | | | | | |
Net realized and unrealized gain (loss) on investment and foreign currency transactions | | | | (0.56 | ) | | | | 0.69 | | | | | (1.06 | ) | | | | | |
Total from investment operations | | | | (0.18 | ) | | | | 1.15 | | | | | (0.68 | ) | | | | | |
Less Dividends and Distributions: | | | | | | | | | | | | | | | | | | | | |
Dividends from net investment income | | | | (0.47 | ) | | | | (0.52 | ) | | | | (0.43 | ) | | | | | |
Tax return of capital distributions | | | | - | | | | | - | | | | | (0.01 | ) | | | | | |
Total dividends and distributions | | | | (0.47 | ) | | | | (0.52 | ) | | | | (0.44 | ) | | | | | |
Net asset value, end of period | | | | $8.86 | | | | | $9.51 | | | | | $8.88 | | | | | | |
Total Return(c): | | | | (1.82 | )% | | | | 13.23 | % | | | | (6.97 | )% | | | | | |
| | | | | | | | | | | | | | | | | | | | | |
Ratios/Supplemental Data: | | | | | | | | | | | | | | | | | | | | |
Net assets, end of period (000) | | | | $28 | | | | | $13 | | | | | $9 | | | | | | |
Average net assets (000) | | | | $18 | | | | | $12 | | | | | $10 | | | | | | |
Ratios to average net assets(d): | | | | | | | | | | | | | | | | | | | | |
Expenses after waivers and/or expense reimbursement | | | | 1.05 | % | | | | 1.05 | % | | | | 1.05 | %(e) | | | | | |
Expenses before waivers and/or expense reimbursement | | | | 66.11 | % | | | | 115.95 | % | | | | 358.14 | %(e) | | | | | |
Net investment income (loss) | | | | 4.19 | % | | | | 4.95 | % | | | | 4.49 | %(e) | | | | | |
Portfolio turnover rate(f)(g) | | | | 23 | % | | | | 33 | % | | | | 17 | % | | | | | |
| (a) | Commencement of operations. |
| (b) | Calculated based on average shares outstanding during the period. |
| (c) | Total return does not consider the effects of sales loads. Total return is calculated assuming a purchase of a share on the first day and a sale on the last day of each period reported and includes reinvestment of dividends and distributions, if any. Total returns may reflect adjustments to conform to generally accepted accounting principles. Total returns for periods less than one full year are not annualized. |
| (d) | Does not include expenses of the underlying funds in which the Series invests. |
| (f) | The Series’ portfolio turnover rate is calculated in accordance with regulatory requirements, without regard to transactions involving short-term investments and certain derivatives. If such transactions were included, the Series’ portfolio turnover rate may be higher. |
| (g) | Portfolio turnover excludes the value of portfolio securities received or delivered as a result of in-kind fund share transactions (if any). |
See Notes to Financial Statements.
76
| | | | | | | | | | | | | | | | | | | | |
Class C Shares | | | | | | | | | | | | | | | | | | | | |
| | | Year Ended October 31, | | December 12, 2017(a)
through October 31,
2018 | | |
| | | | | | |
| | | 2020 | | 2019 |
| | | | | | | | | | | | | | | | |
| | | | | | | | | | | | | | | | |
Per Share Operating Performance(b): | | | | | | | | | | | | | | | | | | | | |
Net Asset Value, Beginning of Period | | | | $9.51 | | | | | $8.88 | | | | | $10.00 | | | | | | |
Income (loss) from investment operations: | | | | | | | | | | | | | | | | | | | | |
Net investment income (loss) | | | | 0.32 | | | | | 0.39 | | | | | 0.31 | | | | | | |
Net realized and unrealized gain (loss) on investment and foreign currency transactions | | | | (0.57 | ) | | | | 0.69 | | | | | (1.05 | ) | | | | | |
Total from investment operations | | | | (0.25 | ) | | | | 1.08 | | | | | (0.74 | ) | | | | | |
Less Dividends and Distributions: | | | | | | | | | | | | | | | | | | | | |
Dividends from net investment income | | | | (0.40 | ) | | | | (0.45 | ) | | | | (0.37 | ) | | | | | |
Tax return of capital distributions | | | | - | | | | | - | | | | | (0.01 | ) | | | | | |
Total dividends and distributions | | | | (0.40 | ) | | | | (0.45 | ) | | | | (0.38 | ) | | | | | |
Net asset value, end of period | | | | $8.86 | | | | | $9.51 | | | | | $8.88 | | | | | | |
Total Return(c): | | | | (2.55 | )% | | | | 12.40 | % | | | | (7.58 | )% | | | | | |
| | | | | | | | | | | | | | | | | | | | | |
Ratios/Supplemental Data: | | | | | | | | | | | | | | | | | | | | |
Net assets, end of period (000) | | | | $10 | | | | | $10 | | | | | $9 | | | | | | |
Average net assets (000) | | | | $10 | | | | | $10 | | | | | $10 | | | | | | |
Ratios to average net assets(d): | | | | | | | | | | | | | | | | | | | | |
Expenses after waivers and/or expense reimbursement | | | | 1.80 | % | | | | 1.80 | % | | | | 1.80 | %(e) | | | | | |
Expenses before waivers and/or expense reimbursement | | | | 114.46 | % | | | | 139.02 | % | | | | 359.95 | %(e) | | | | | |
Net investment income (loss) | | | | 3.56 | % | | | | 4.22 | % | | | | 3.73 | %(e) | | | | | |
Portfolio turnover rate(f)(g) | | | | 23 | % | | | | 33 | % | | | | 17 | % | | | | | |
| (a) | Commencement of operations. |
| (b) | Calculated based on average shares outstanding during the period. |
| (c) | Total return does not consider the effects of sales loads. Total return is calculated assuming a purchase of a share on the first day and a sale on the last day of each period reported and includes reinvestment of dividends and distributions, if any. Total returns may reflect adjustments to conform to generally accepted accounting principles. Total returns for periods less than one full year are not annualized. |
| (d) | Does not include expenses of the underlying funds in which the Series invests. |
| (f) | The Series’ portfolio turnover rate is calculated in accordance with regulatory requirements, without regard to transactions involving short-term investments and certain derivatives. If such transactions were included, the Series’ portfolio turnover rate may be higher. |
| (g) | Portfolio turnover excludes the value of portfolio securities received or delivered as a result of in-kind fund share transactions (if any). |
See Notes to Financial Statements.
PGIM Emerging Markets Debt Hard Currency Fund 77
Financial Highlights (continued)
| | | | | | | | | | | | | | | | | | | | |
Class Z Shares | | | | | | | | | | | | | | | | | | | | |
| | | Year Ended October 31, | | December 12, 2017(a)
through October 31,
2018 | | |
| | | | | | |
| | | 2020 | | 2019 |
| | | | | | | | | | | | | | | | |
Per Share Operating Performance(b): | | | | | | | | | | | | | | | | | | | | |
Net Asset Value, Beginning of Period | | | | $9.51 | | | | | $8.88 | | | | | $10.00 | | | | | | |
Income (loss) from investment operations: | | | | | | | | | | | | | | | | | | | | |
Net investment income (loss) | | | | 0.40 | | | | | 0.48 | | | | | 0.39 | | | | | | |
Net realized and unrealized gain (loss) on investment and foreign currency transactions | | | | (0.54 | ) | | | | 0.69 | | | | | (1.05 | ) | | | | | |
Total from investment operations | | | | (0.14 | ) | | | | 1.17 | | | | | (0.66 | ) | | | | | |
Less Dividends and Distributions: | | | | | | | | | | | | | | | | | | | | |
Dividends from net investment income | | | | (0.50 | ) | | | | (0.54 | ) | | | | (0.45 | ) | | | | | |
Tax return of capital distributions | | | | - | | | | | - | | | | | (0.01 | ) | | | | | |
Total dividends and distributions | | | | (0.50 | ) | | | | (0.54 | ) | | | | (0.46 | ) | | | | | |
Net asset value, end of period | | | | $8.87 | | | | | $9.51 | | | | | $8.88 | | | | | | |
Total Return(c): | | | | (1.43 | )% | | | | 13.51 | % | | | | (6.79 | )% | | | | | |
| | | | | | | | | | | | | | | | | | | | | |
Ratios/Supplemental Data: | | | | | | | | | | | | | | | | | | | | |
Net assets, end of period (000) | | | | $18,982 | | | | | $5,782 | | | | | $2,234 | | | | | | |
Average net assets (000) | | | | $10,951 | | | | | $3,498 | | | | | $766 | | | | | | |
Ratios to average net assets(d): | | | | | | | | | | | | | | | | | | | | |
Expenses after waivers and/or expense reimbursement | | | | 0.75 | % | | | | 0.80 | % | | | | 0.80 | %(e) | | | | | |
Expenses before waivers and/or expense reimbursement | | | | 1.53 | % | | | | 2.41 | % | | | | 6.65 | %(e) | | | | | |
Net investment income (loss) | | | | 4.45 | % | | | | 5.12 | % | | | | 4.83 | %(e) | | | | | |
Portfolio turnover rate(f)(g) | | | | 23 | % | | | | 33 | % | | | | 17 | % | | | | | |
| (a) | Commencement of operations. |
| (b) | Calculated based on average shares outstanding during the period. |
| (c) | Total return is calculated assuming a purchase of a share on the first day and a sale on the last day of each period reported and includes reinvestment of dividends and distributions, if any. Total returns may reflect adjustments to conform to generally accepted accounting principles. Total returns for periods less than one full year are not annualized. |
| (d) | Does not include expenses of the underlying funds in which the Series invests. |
| (f) | The Series’ portfolio turnover rate is calculated in accordance with regulatory requirements, without regard to transactions involving short-term investments and certain derivatives. If such transactions were included, the Series’ portfolio turnover rate may be higher. |
| (g) | Portfolio turnover excludes the value of portfolio securities received or delivered as a result of in-kind fund share transactions (if any). |
See Notes to Financial Statements.
78
| | | | | | | | | | | | | | | | | | | | |
Class R6 Shares | | | | | | | | | | | | | | | | | | | | |
| | | Year Ended October 31, | | December 12, 2017(a)
through October 31,
2018 | | |
| | | | | | |
| | | 2020 | | 2019 | | |
| | | | | | | | | | | | | | | | |
Per Share Operating Performance(b): | | | | | | | | | | | | | | | | | | | | |
Net Asset Value, Beginning of Period | | | | $9.51 | | | | | $8.88 | | | | | $10.00 | | | | | | |
Income (loss) from investment operations: | | | | | | | | | | | | | | | | | | | | |
Net investment income (loss) | | | | 0.43 | | | | | 0.49 | | | | | 0.40 | | | | | | |
Net realized and unrealized gain (loss) on investment and foreign currency transactions | | | | (0.57 | ) | | | | 0.69 | | | | | (1.06 | ) | | | | | |
Total from investment operations | | | | (0.14 | ) | | | | 1.18 | | | | | (0.66 | ) | | | | | |
Less Dividends and Distributions: | | | | | | | | | | | | | | | | | | | | |
Dividends from net investment income | | | | (0.51 | ) | | | | (0.55 | ) | | | | (0.45 | ) | | | | | |
Tax return of capital distributions | | | | - | | | | | - | | | | | (0.01 | ) | | | | | |
Total dividends and distributions | | | | (0.51 | ) | | | | (0.55 | ) | | | | (0.46 | ) | | | | | |
Net asset value, end of period | | | | $8.86 | | | | | $9.51 | | | | | $8.88 | | | | | | |
Total Return(c): | | | | (1.44 | )% | | | | 13.58 | % | | | | (6.72 | )% | | | | | |
| | | | | | | | | | | | | | | | | | | | | |
Ratios/Supplemental Data: | | | | | | | | | | | | | | | | | | | | |
Net assets, end of period (000) | | | | $97,771 | | | | | $26,493 | | | | | $23,333 | | | | | | |
Average net assets (000) | | | | $30,037 | | | | | $25,144 | | | | | $24,014 | | | | | | |
Ratios to average net assets(d): | | | | | | | | | | | | | | | | | | | | |
Expenses after waivers and/or expense reimbursement | | | | 0.66 | % | | | | 0.74 | % | | | | 0.74 | %(e) | | | | | |
Expenses before waivers and/or expense reimbursement | | | | 1.16 | % | | | | 1.49 | % | | | | 1.76 | %(e) | | | | | |
Net investment income (loss) | | | | 4.69 | % | | | | 5.27 | % | | | | 4.82 | %(e) | | | | | |
Portfolio turnover rate(f)(g) | | | | 23 | % | | | | 33 | % | | | | 17 | % | | | | | |
| (a) | Commencement of operations. |
| (b) | Calculated based on average shares outstanding during the period. |
| (c) | Total return is calculated assuming a purchase of a share on the first day and a sale on the last day of each period reported and includes reinvestment of dividends and distributions, if any. Total returns may reflect adjustments to conform to generally accepted accounting principles. Total returns for periods less than one full year are not annualized. |
| (d) | Does not include expenses of the underlying funds in which the Series invests. |
| (f) | The Series’ portfolio turnover rate is calculated in accordance with regulatory requirements, without regard to transactions involving short-term investments and certain derivatives. If such transactions were included, the Series’ portfolio turnover rate may be higher. |
| (g) | Portfolio turnover excludes the value of portfolio securities received or delivered as a result of in-kind fund share transactions (if any). |
See Notes to Financial Statements.
PGIM Emerging Markets Debt Hard Currency Fund 79
Report of Independent Registered Public Accounting Firm
To the Board of Directors of Prudential World Fund, Inc. and Shareholders of PGIM Emerging Markets Debt Hard Currency Fund
Opinion on the Financial Statements
We have audited the accompanying statement of assets and liabilities, including the schedule of investments, of PGIM Emerging Markets Debt Hard Currency Fund (one of the funds constituting Prudential World Fund, Inc., referred to hereafter as the “Fund”) as of October 31, 2020, and the related statements of operations and changes in net assets, including the related notes, and the financial highlights for the year ended October 31, 2020 (collectively referred to as the “financial statements”). In our opinion, the financial statements present fairly, in all material respects, the financial position of the Fund as of October 31, 2020, and the results of its operations, changes in its net assets, and the financial highlights for the year ended October 31, 2020 in conformity with accounting principles generally accepted in the United States of America.
The financial statements of the Fund as of and for the year ended October 31, 2019 and the financial highlights for each of the periods ended on or prior to October 31, 2019 (not presented herein, other than the statement of changes in net assets and the financial highlights) were audited by other auditors whose report dated December 19, 2019 expressed an unqualified opinion on those financial statements and financial highlights.
Basis for Opinion
These financial statements are the responsibility of the Fund’s management. Our responsibility is to express an opinion on the Fund’s financial statements based on our audit. We are a public accounting firm registered with the Public Company Accounting Oversight Board (United States) (PCAOB) and are required to be independent with respect to the Fund in accordance with the U.S. federal securities laws and the applicable rules and regulations of the Securities and Exchange Commission and the PCAOB.
We conducted our audit of these financial statements in accordance with the standards of the PCAOB. Those standards require that we plan and perform the audit to obtain reasonable assurance about whether the financial statements are free of material misstatement, whether due to error or fraud.
Our audit included performing procedures to assess the risks of material misstatement of the financial statements, whether due to error or fraud, and performing procedures that respond to those risks. Such procedures included examining, on a test basis, evidence regarding the amounts and disclosures in the financial statements. Our audit also included evaluating the accounting principles used and significant estimates made by management, as well as evaluating the overall presentation of the financial statements. Our procedures included confirmation of securities owned as of October 31, 2020 by correspondence with the custodian, transfer agent and brokers; when replies were not received from brokers, we performed other auditing procedures. We believe that our audit provides a reasonable basis for our opinion.
/s/PricewaterhouseCoopers LLP
New York, New York
December 17, 2020
We have served as the auditor of one or more investment companies in the PGIM Retail Funds complex since 2020.
INFORMATION ABOUT BOARD MEMBERS AND OFFICERS (unaudited)
Information about Board Members and Officers of the Fund is set forth below. Board Members who are not deemed to be “interested persons” of the Fund, as defined in the 1940 Act, are referred to as “Independent Board Members.” Board Members who are deemed to be “interested persons” of the Fund are referred to as “Interested Board Members.” The Board Members are responsible for the overall supervision of the operations of the Fund and perform the various duties imposed on the directors of investment companies by the 1940 Act. The Board in turn elects the Officers, who are responsible for administering the day-to-day operations of the Fund.
| | | | | | |
| Independent Board Members |
| | | | |
Name Year of Birth Position(s) Portfolios Overseen | | Principal Occupation(s) During Past Five Years | | Other Directorships Held During Past Five Years | | Length of
Board Service |
| | | | |
Ellen S. Alberding 1958 Board Member Portfolios Overseen: 95 | | President and Board Member, The Joyce Foundation (charitable foundation) (since 2002); Vice Chair, City Colleges of Chicago (community college system) (2011-2015); Trustee, National Park Foundation (charitable foundation for national park system) (2009-2018); Trustee, Economic Club of Chicago (2009-2016); Trustee, Loyola University (since 2018). | | None. | | Since September 2013 |
| | | | |
Kevin J. Bannon 1952 Board Member Portfolios Overseen: 95 | | Retired; Managing Director (April 2008-May 2015) and Chief Investment Officer (October 2008-November 2013) of Highmount Capital LLC (registered investment adviser); formerly Executive Vice President and Chief Investment Officer (April 1993-August 2007) of Bank of New York Company; President (May 2003-May 2007) of BNY Hamilton Family of Mutual Funds. | | Director of Urstadt Biddle Properties (equity real estate investment trust) (since September 2008). | | Since July 2008 |
PGIM Emerging Markets Debt Hard Currency Fund
| | | | | | |
| Independent Board Members |
| | | | |
Name Year of Birth Position(s) Portfolios Overseen | | Principal Occupation(s) During Past Five Years | | Other Directorships Held During Past Five Years | | Length of
Board Service |
| | | | |
Linda W. Bynoe 1952 Board Member Portfolios Overseen: 95 | | President and Chief Executive Officer (since March 1995) and formerly Chief Operating Officer (December 1989-February 1995) of Telemat Limited LLC (formerly, Telemat Ltd). (management consulting); formerly Vice President (January 1985-June 1989) at Morgan Stanley & Co. (broker-dealer). | | Director of Anixter International, Inc. (communication products distributor) (since January 2006–June 2020); Director of Northern Trust Corporation (financial services) (since April 2006); Trustee of Equity Residential (residential real estate) (since December 2009). | | Since March 2005 |
| | | | |
Barry H. Evans 1960 Board Member Portfolios Overseen: 94 | | Retired; formerly President (2005 – 2016), Global Chief Operating Officer (2014– 2016), Chief Investment Officer – Global Head of Fixed Income (1998-2014), and various portfolio manager roles (1986-2006), Manulife Asset Management U.S. | | Formerly Director, Manulife Trust Company (2011-2018); formerly Director, Manulife Asset Management Limited (2015-2017); formerly Chairman of the Board of Directors of Manulife Asset Management U.S. (2005-2016); formerly Chairman of the Board, Declaration Investment Management and Research (2008-2016). | | Since September 2017 |
| | | | |
Keith F. Hartstein 1956 Board Member & Independent Chair Portfolios Overseen: 95 | | Executive Committee of the IDC Board of Governors (since October 2019); Retired; Member (since November 2014) of the Governing Council of the Independent Directors Council (IDC) (organization of independent mutual fund directors); formerly President and Chief Executive Officer (2005-2012), Senior Vice President (2004-2005), Senior Vice President of Sales and Marketing (1997-2004), and various executive management positions (1990-1997), John Hancock Funds, LLC (asset management); Chairman, Investment Company Institute’s Sales Force Marketing Committee (2003-2008). | | None. | | Since September 2013 |
Visit our website at pgim.com/investments
| | | | | | |
| Independent Board Members |
| | | | |
Name Year of Birth Position(s) Portfolios Overseen | | Principal Occupation(s) During Past Five Years | | Other Directorships Held During Past Five Years | | Length of
Board Service |
| | | | |
Laurie Simon Hodrick 1962 Board Member Portfolios Overseen: 94 | | A. Barton Hepburn Professor Emerita of Economics in the Faculty of Business, Columbia Business School (since 2018); Visiting Professor of Law, Stanford Law School (since 2015); Visiting Fellow at the Hoover Institution, Stanford University (since 2015); Sole Member, ReidCourt LLC (since 2008) (a consulting firm); formerly A. Barton Hepburn Professor of Economics in the Faculty of Business, Columbia Business School (1996-2017); formerly Managing Director, Global Head of Alternative Investment Strategies, Deutsche Bank (2006-2008). | | Independent Director, Synnex Corporation (since 2019) (information technology); Independent Director, Kabbage, Inc. (2018-2020) (financial services); Independent Director, Corporate Capital Trust (2017-2018) (a business development company). | | Since September
2017 |
| | | | |
Michael S. Hyland, CFA 1945 Board Member Portfolios Overseen: 95 | | Retired (since February 2005); formerly Senior Managing Director (July 2001-February 2005) of Bear Stearns & Co, Inc.; Global Partner, INVESCO (1999-2001); Managing Director and President of Salomon Brothers Asset Management (1989-1999). | | None. | | Since July 2008 |
| | | | |
Brian K. Reid 1961 Board Member Portfolios Overseen: 94 | | Retired; formerly Chief Economist for the Investment Company Institute (ICI) (2005-2017); formerly Senior Economist and Director of Industry and Financial Analysis at the ICI (1998-2004); formerly Senior Economist, Industry and Financial Analysis at the ICI (1996-1998); formerly Staff Economist at the Federal Reserve Board (1989-1996); Director, ICI Mutual Insurance Company (2012-2017). | | None. | | Since March 2018 |
PGIM Emerging Markets Debt Hard Currency Fund
| | | | | | |
| Independent Board Members |
| | | | |
Name Year of Birth Position(s) Portfolios Overseen | | Principal Occupation(s) During Past Five Years | | Other Directorships Held During Past Five Years | | Length of
Board Service |
| | | | |
Grace C. Torres 1959 Board Member Portfolios Overseen: 94 | | Retired; formerly Treasurer and Principal Financial and Accounting Officer of the PGIM Funds, Target Funds, Advanced Series Trust, Prudential Variable Contract Accounts and The Prudential Series Fund (1998-June 2014); Assistant Treasurer (March 1999-June 2014) and Senior Vice President (September 1999-June 2014) of PGIM Investments LLC; Assistant Treasurer (May 2003-June 2014) and Vice President (June 2005-June 2014) of AST Investment Services, Inc.; Senior Vice President and Assistant Treasurer (May 2003-June 2014) of Prudential Annuities Advisory Services, Inc. | | Formerly Director (July 2015-January 2018) of Sun Bancorp, Inc. N.A. and Sun National Bank; Director (since January 2018) of OceanFirst Financial Corp. and OceanFirst Bank. | | Since November 2014 |
| | | | | | |
| Interested Board Members |
| | | | |
Name Year of Birth Position(s) Portfolios Overseen | | Principal Occupation(s) During Past Five Years | | Other Directorships Held During Past Five Years | | Length of
Board Service |
| | | | |
Stuart S. Parker 1962 Board Member & President Portfolios Overseen: 96 | | President of PGIM Investments LLC (formerly known as Prudential Investments LLC) (since January 2012); Executive Vice President of Prudential Investment Management Services LLC (since December 2012); formerly Executive Vice President of Jennison Associates LLC and Head of Retail Distribution of PGIM Investments LLC (June 2005-December 2011). | | None. | | Since January 2012 |
Visit our website at pgim.com/investments
| | | | | | |
| Interested Board Members |
| | | | |
Name Year of Birth Position(s) Portfolios Overseen | | Principal Occupation(s) During Past Five Years | | Other Directorships Held During Past Five Years | | Length of
Board Service |
| | | | |
Scott E. Benjamin 1973 Board Member & Vice President Portfolios Overseen: 96 | | Executive Vice President (since June 2009) of PGIM Investments LLC; Vice President (since June 2012) of Prudential Investment Management Services LLC; Executive Vice President (since September 2009) of AST Investment Services, Inc.; Senior Vice President of Product Development and Marketing, PGIM Investments (since February 2006); formerly Vice President of Product Development and Product Management, PGIM Investments LLC (2003-2006). | | None. | | Since March 2010 |
(1) The year that each Board Member joined the Board is as follows:
Ellen S. Alberding, 2013; Kevin J. Bannon, 2008; Linda W. Bynoe, 2005; Barry H. Evans, 2017; Keith F. Hartstein, 2013; Laurie Simon Hodrick, 2017; Michael S. Hyland, 2008; James E. Quinn, 2013; Richard A. Redeker, 2000; Stephen G. Stoneburn, 2003; Stuart S. Parker, Board Member and President since 2012; Scott E. Benjamin, Board Member since 2010 and Vice President since 2009; Grace C. Torres, 2014.
| | | | |
| Fund Officers(a) | | | | |
| | | |
Name Year of Birth Fund Position | | Principal Occupation(s) During Past Five Years | | Length of
Service as Fund
Officer |
| | | |
Claudia DiGiacomo 1974 Chief Legal Officer | | Chief Legal Officer of PGIM Investments LLC (since August 2020); Chief Legal Officer of Prudential Mutual Fund Services LLC (since August 2020); Chief Legal Officer of PIFM Holdco, LLC (since August 2020); Vice President and Corporate Counsel (since January 2005) of Prudential; and Corporate Counsel of AST Investment Services, Inc. (since August 2020); formerly Associate at Sidley Austin Brown & Wood LLP (1999-2004). | | Since December 2005 |
| | | |
Dino Capasso 1974 Chief Compliance Officer | | Chief Compliance Officer (July 2019-Present) of PGIM Investments LLC; Chief Compliance Officer (July 2019-Present) of the PGIM Funds, Target Funds, Advanced Series Trust, The Prudential Series Fund, Prudential’s Gibraltar Fund, Inc., PGIM Global High Yield Fund, Inc., and PGIM High Yield Bond Fund, Inc.; Vice President and Deputy Chief Compliance Officer (June 2017-2019) of PGIM Investments LLC; formerly, Senior Vice President and Senior Counsel (January 2016-June 2017), and Vice President and Counsel (February 2012-December 2015) of Pacific Investment Management Company LLC. | | Since March 2018 |
PGIM Emerging Markets Debt Hard Currency Fund
| | | | |
| Fund Officers(a) | | | | |
| | | |
Name Year of Birth Fund Position | | Principal Occupation(s) During Past Five Years | | Length of Service as Fund Officer |
| | | |
Andrew R. French 1962 Secretary | | Vice President (since December 2018 - present) of PGIM Investments LLC; Formerly, Vice President and Corporate Counsel (2010-2018) of Prudential; formerly Director and Corporate Counsel (2006-2010) of Prudential; Vice President and Assistant Secretary (since January 2007) of PGIM Investments LLC; Vice President and Assistant Secretary (since January 2007) of Prudential Mutual Fund Services LLC. | | Since October 2006 |
| | | |
Diana N. Huffman 1982 Assistant Secretary | | Vice President and Corporate Counsel (since September 2015) of Prudential; Vice President and Assistant Secretary (since August 2020) of PGIM Investments LLC; formerly Associate at Willkie Farr & Gallagher LLP (2009-2015). | | Since March 2019 |
| | | |
Melissa Gonzalez 1980 Assistant Secretary | | Vice President and Corporate Counsel (since September 2018) of Prudential; Vice President and Assistant Secretary (since August 2020) of PGIM Investments LLC; formerly Director and Corporate Counsel (March 2014-September 2018) of Prudential. | | Since March 2020 |
| | | |
Patrick E. McGuinness 1986 Assistant Secretary | | Vice President and Assistant Secretary (since August 2020) of PGIM Investments LLC; Director and Corporate Counsel (since February 2017) of Prudential; and Corporate Counsel (2012 – 2017) of IIL, Inc. | | Since June 2020 |
| | | |
Kelly A. Coyne 1968 Assistant Secretary | | Director, Investment Operations of Prudential Mutual Fund Services LLC (since 2010). | | Since March 2015 |
| | | |
Christian J. Kelly 1975 Treasurer and Principal Financial and Accounting Officer | | Vice President, Head of Fund Administration of PGIM Investments LLC (since November 2018); formerly, Director of Fund Administration of Lord Abbett & Co. LLC (2009-2018), Treasurer and Principal Accounting Officer of the Lord Abbett Family of Funds (2017-2018); Director of Accounting, Avenue Capital Group (2008-2009); Senior Manager, Investment Management Practice of Deloitte & Touche LLP (1998-2007). | | Since January 2019 |
| | | |
Lana Lomuti 1967 Assistant Treasurer | | Vice President (since 2007) and Director (2005-2007), within PGIM Investments Fund Administration; formerly Assistant Treasurer (December 2007-February 2014) of The Greater China Fund, Inc. | | Since April 2014 |
| | | |
Russ Shupak 1973 Assistant Treasurer | | Vice President (since 2017) and Director (2013-2017), within PGIM Investments Fund Administration. | | Since October 2019 |
| | | |
Deborah Conway 1969 Assistant Treasurer | | Vice President (since 2017) and Director (2007-2017), within PGIM Investments Fund Administration. | | Since October 2019 |
| | | |
Elyse M. McLaughlin 1974 Assistant Treasurer | | Vice President (since 2017) and Director (2011-2017), within PGIM Investments Fund Administration. | | Since October 2019 |
Visit our website at pgim.com/investments
| | | | |
| Fund Officers(a) | | | | |
| | | |
Name Year of Birth Fund Position | | Principal Occupation(s) During Past Five Years | | Length of Service as Fund Officer |
| | | |
Charles H. Smith 1973 Anti-Money Laundering Compliance Officer | | Vice President, Corporate Compliance, Anti-Money Laundering Unit (since January 2015) of Prudential; committee member of the American Council of Life Insurers Anti-Money Laundering and Critical Infrastructure Committee (since January 2016); formerly Global Head of Economic Sanctions Compliance at AIG Property Casualty (February 2007-December 2014); Assistant Attorney General at the New York State Attorney General’s Office, Division of Public Advocacy. (August 1998-January 2007). | | Since January 2017 |
(a) Excludes Mr. Parker and Mr. Benjamin, interested Board Members who also serve as President and Vice President, respectively.
Explanatory Notes to Tables:
| ∎ | | Board Members are deemed to be “Interested,” as defined in the 1940 Act, by reason of their affiliation with PGIM Investments LLC and/or an affiliate of PGIM Investments LLC. |
| ∎ | | Unless otherwise noted, the address of all Board Members and Officers is c/o PGIM Investments LLC, 655 Broad Street, Newark, New Jersey 07102-4410. |
| ∎ | | There is no set term of office for Board Members or Officers. The Board Members have adopted a retirement policy, which calls for the retirement of Board Members on December 31 of the year in which they reach the age of 75. |
| ∎ | | “Other Directorships Held” includes all directorships of companies required to register or file reports with the SEC under the 1934 Act (that is, “public companies”) or other investment companies registered under the 1940 Act. |
| ∎ | | “Portfolios Overseen” includes all investment companies managed by PGIM Investments LLC. The investment companies for which PGIM Investments LLC serves as manager include the PGIM Funds, The Prudential Variable Contract Accounts, PGIM ETF Trust, PGIM High Yield Bond Fund, Inc., PGIM Global High Yield Fund, Inc., The Prudential Series Fund, Prudential’s Gibraltar Fund, Inc. and the Advanced Series Trust. |
| ∎ | | As used in the Fund Officers table “Prudential” means The Prudential Insurance Company of America. |
PGIM Emerging Markets Debt Hard Currency Fund
Approval of Advisory Agreements (unaudited)
The Fund’s Board of Directors
The Board of Directors (the “Board”) of PGIM Emerging Markets Debt Hard Currency Fund (the “Fund”)1 consists of eleven individuals, nine of whom are not “interested persons” of the Fund, as defined in the Investment Company Act of 1940, as amended (the “1940 Act”) (the “Independent Directors”). The Board is responsible for the oversight of the Fund and its operations, and performs the various duties imposed on the directors of investment companies by the 1940 Act. The Independent Directors have retained independent legal counsel to assist them in connection with their duties. The Chair of the Board is an Independent Director. The Board has established four standing committees: the Audit Committee, the Nominating and Governance Committee, and two Investment Committees. Each committee is chaired by, and composed of, Independent Directors.
Annual Approval of the Fund’s Advisory Agreements
As required under the 1940 Act, the Board determines annually whether to renew the Fund’s management agreement with PGIM Investments LLC (“PGIM Investments”) and the Fund’s subadvisory agreement with PGIM, Inc. (“PGIM”) on behalf of its PGIM Fixed Income unit (“PGIM Fixed Income”) and PGIM Limited (“PGIML”). In considering the renewal of the agreements, the Board, including all of the Independent Directors, met on May 27, 2020 and on June 9-11, 2020 and approved the renewal of the agreements through July 31, 2021, after concluding that the renewal of the agreements was in the best interests of the Fund and its shareholders.
In advance of the meetings, the Board requested and received materials relating to the agreements, and had the opportunity to ask questions and request further information in connection with its consideration. Among other things, the Board considered comparative fee information from PGIM Investments, PGIM Fixed Income and PGIML. Also, the Board considered comparisons with other mutual funds in relevant Peer Universes and Peer Groups, as is further discussed below.
In approving the agreements, the Board, including the Independent Directors advised by independent legal counsel, considered the factors it deemed relevant, including the nature, quality and extent of services provided by PGIM Investments and the subadvisers, the performance of the Fund, the profitability of PGIM Investments and its affiliates, expenses and fees, and the potential for economies of scale that may be shared with the Fund and its shareholders as the Fund’s assets grow. In their deliberations, the Directors did not identify any single factor which alone was responsible for the Board’s decision to approve the
| 1 | PGIM Emerging Markets Debt Hard Currency Fund is a series of Prudential World Fund, Inc.` |
PGIM Emerging Markets Debt Hard Currency Fund
Approval of Advisory Agreements (continued)
agreements with respect to the Fund. In connection with its deliberations, the Board considered information provided by PGIM Investments throughout the year at regular Board meetings, presentations from portfolio managers and other information, as well as information furnished at or in advance of the meetings on May 27, 2020 and on June 9-11, 2020.
The Directors determined that the overall arrangements between the Fund and PGIM Investments, which serves as the Fund’s investment manager pursuant to a management agreement, and between each of PGIM Investments and PGIM, which, through its PGIM Fixed Income unit, and PGIML, which serve as the Fund’s subadvisers pursuant to the terms of a subadvisory agreement with PGIM Investments, are in the best interests of the Fund and its shareholders in light of the services performed, fees charged and such other matters as the Directors considered relevant in the exercise of their business judgment.
The material factors and conclusions that formed the basis for the Directors’ reaching their determinations to approve the continuance of the agreements are separately discussed below.
Nature, Quality and Extent of Services
The Board received and considered information regarding the nature, quality and extent of services provided to the Fund by PGIM Investments, PGIM Fixed Income, and PGIML. The Board noted that PGIM Fixed Income and PGIML are affiliated with PGIM Investments. The Board considered the services provided by PGIM Investments, including but not limited to the oversight of the subadvisers for the Fund, as well as the provision of fund recordkeeping, compliance and other services to the Fund, and PGIM Investments’ role as administrator for the Fund’s liquidity risk management program. With respect to PGIM Investments’ oversight of the subadvisers, the Board noted that PGIM Investments’ Strategic Investment Research Group (“SIRG”), which is a business unit of PGIM Investments, is responsible for monitoring and reporting to PGIM Investments senior management on the performance and operations of the subadvisers. The Board also considered that PGIM Investments pays the salaries of all of the officers and interested Directors of the Fund who are part of Fund management. The Board also considered the investment subadvisory services provided by PGIM Fixed Income and PGIML, including investment research and security selection, as well as adherence to the Fund’s investment restrictions and compliance with applicable Fund policies and procedures. The Board considered PGIM Investments’ evaluation of the subadvisers, as well as PGIM Investments’ recommendation, based on its review of the subadvisers, to renew the subadvisory agreement.
The Board considered the qualifications, backgrounds and responsibilities of PGIM Investments’ senior management responsible for the oversight of the Fund, PGIM Fixed Income, and PGIML, and also considered the qualifications, backgrounds and responsibilities of PGIM Fixed Income’s portfolio managers who are responsible for the
| | |
| Visit our website at pgim.com/investments | | |
day-to-day management of the Fund’s portfolio. The Board was provided with information pertaining to PGIM Investments’, PGIM Fixed Income’s, and PGIML’s organizational structure, senior management, investment operations, and other relevant information pertaining to PGIM Investments, PGIM Fixed Income, and PGIML. The Board also noted that it received favorable compliance reports from the Fund’s Chief Compliance Officer (“CCO”) as to PGIM Investments, PGIM Fixed Income, and PGIML.
The Board concluded that it was satisfied with the nature, extent and quality of the investment management services provided by PGIM Investments, the subadvisory services provided to the Fund by PGIM Fixed Income and PGIML, and that there was a reasonable basis on which to conclude that the Fund benefits from the services provided by PGIM Investments, PGIM Fixed Income, and PGIML under the management and subadvisory agreements.
Costs of Services and Profits Realized by PGIM Investments
The Board was provided with information on the profitability of PGIM Investments and its affiliates in serving as the Fund’s investment manager. The Board discussed with PGIM Investments the methodology utilized in assembling the information regarding profitability and considered its reasonableness. The Board recognized that it is difficult to make comparisons of profitability from fund management contracts because comparative information is not generally publicly available and is affected by numerous factors, including the structure of the particular adviser, the types of funds it manages, its business mix, numerous assumptions regarding allocations and the adviser’s capital structure and cost of capital. Taking these factors into account, the Board concluded that the profitability of PGIM Investments and its affiliates in relation to the services rendered was not unreasonable.
Economies of Scale
The Board received and discussed information concerning economies of scale that PGIM Investments may realize as the Fund’s assets grow beyond current levels. The Board noted that the management fee schedule for the Fund includes breakpoints, which have the effect of decreasing the fee rate as assets increase. During the course of time, the Board has considered information regarding the launch date of the Fund, the management fees of the Fund compared to those of similarly managed funds and PGIM Investments’ investment in the Fund over time. The Board noted that economies of scale can be shared with the Fund in other ways, including low management fees from inception, additional technological and personnel investments to enhance shareholder services, and maintaining existing expense structures in the face of a rising cost environment. The Board also considered PGIM Investments’ assertion that it continually evaluates the management fee schedule of the Fund and the potential to share economies of scale through breakpoints or fee waivers as asset levels increase.
|
PGIM Emerging Markets Debt Hard Currency Fund |
Approval of Advisory Agreements (continued)
The Board recognized the inherent limitations of any analysis of economies of scale, stemming largely from the Board’s understanding that most of PGIM Investments’ costs are not specific to individual funds, but rather are incurred across a variety of products and services.
Other Benefits to PGIM Investments, PGIM Fixed Income, and PGIML
The Board considered potential ancillary benefits that might be received by PGIM Investments, PGIM Fixed Income, PGIML and their affiliates as a result of their relationship with the Fund. The Board concluded that potential benefits to be derived by PGIM Investments included transfer agency fees received by the Fund’s transfer agent (which is affiliated with PGIM Investments), as well as benefits to its reputation or other intangible benefits resulting from PGIM Investments’ association with the Fund. The Board concluded that the potential benefits to be derived by PGIM Fixed Income and PGIML included the ability to use soft dollar credits, as well as the potential benefits consistent with those generally resulting from an increase in assets under management, specifically, potential access to additional research resources and benefits to their reputations. The Board concluded that the benefits derived by PGIM Investments, PGIM Fixed Income, and PGIML were consistent with the types of benefits generally derived by investment managers and subadvisers to mutual funds.
Performance of the Fund / Fees and Expenses
The Board considered certain additional factors and made related conclusions relating to the historical performance of the Fund for the one-year period ended December 31, 2019. The Board considered that the Fund commenced operations on December 12, 2017 and that longer-term performance was not yet available.
The Board also considered the Fund’s actual management fee, as well as the Fund’s net total expense ratio, for the fiscal period ended October 31, 2019. The Board considered the management fee for the Fund as compared to the management fee charged by PGIM Investments to other funds and the fee charged by other advisers to comparable mutual funds in a Peer Group. The actual management fee represents the fee rate actually paid by Fund shareholders and includes any fee waivers or reimbursements. The net total expense ratio for the Fund represents the actual expense ratio incurred by Fund shareholders.
The mutual funds included in the Peer Universe, which was used to consider performance, and the Peer Group, which was used to consider expenses and fees, were objectively determined by Broadridge, an independent provider of mutual fund data. In certain circumstances, PGIM Investments also provided supplemental Peer Universe or Peer Group information, for reasons addressed with the Board. The comparisons placed the Fund in various quartiles over various periods, with the first quartile being the best 25% of the mutual funds (for performance, the best performing mutual funds and, for expenses, the lowest cost mutual funds).
Visit our website at pgim.com/investments
The section below summarizes key factors considered by the Board and the Board’s conclusions regarding the Fund’s performance, fees and overall expenses. The table sets forth net performance comparisons (which reflect the impact on performance of fund expenses, or any subsidies, expense caps or waivers that may be applicable) with the Peer Universe, actual management fees with the Peer Group (which reflect the impact of any subsidies or fee waivers), and net total expenses with the Peer Group, each of which were key factors considered by the Board.
| | | | | | | | |
| Net Performance | | 1 Year | | 3 Years | | 5 Years | | 10 Years |
| | | 1st Quartile | | N/A | | N/A | | N/A |
| Actual Management Fees: 1st Quartile |
| Net Total Expenses: 2nd Quartile |
| • | | The Board noted that the Fund outperformed its benchmark index over the one-year period. |
| • | | The Board noted that the Fund does not yet have a three-year performance record and that, therefore, the subadviser should have more time to develop that record. |
| • | | The Board and PGIM Investments agreed to retain the existing contractual expense cap that (exclusive of certain fees and expenses) caps total annual operating expenses at 1.05% for Class A shares, 1.80% for Class C shares, 0.75% for Class Z shares, and 0.65% for Class R6 shares through February 28, 2021. |
| • | | In addition, PGIM Investments will waive management fees or shared operating expenses on any share class to the same extent that it waives such expenses on any other share class, and has agreed that total annual fund operating expenses for Class R6 shares will not exceed total annual fund operating expenses for Class Z shares. |
| • | | The Board concluded that, in light of the above, it would be in the best interests of the Fund and its shareholders to continue to allow the Fund to create a longer-term performance record, and to renew the agreements. |
| • | | The Board concluded that the management fees (including subadvisory fees) and total expenses were reasonable in light of the services provided. |
* * *
After full consideration of these factors, the Board concluded that the approval of the agreements was in the best interests of the Fund and its shareholders.
|
PGIM Emerging Markets Debt Hard Currency Fund |
| | | | |
| | |
| ∎ MAIL | | ∎ TELEPHONE | | ∎ WEBSITE |
655 Broad Street Newark, NJ 07102 | | (800) 225-1852 | | pgim.com/investments |
|
| PROXY VOTING |
| The Board of Directors of the Fund has delegated to the Fund’s subadvisers the responsibility for voting any proxies and maintaining proxy recordkeeping with respect to the Fund. A description of these proxy voting policies and procedures is available without charge, upon request, by calling (800) 225-1852 or by visiting the Securities and Exchange Commission’s website at sec.gov. Information regarding how the Fund voted proxies relating to portfolio securities during the most recent 12-month period ended June 30 is available on the Fund’s website and on the Securities and Exchange Commission’s website. |
|
| DIRECTORS |
| Ellen S. Alberding • Kevin J. Bannon • Scott E. Benjamin • Linda W. Bynoe • Barry H. Evans • Keith F. Hartstein • Laurie Simon Hodrick • Michael S. Hyland • Stuart S. Parker • Brian K. Reid • Grace C. Torres |
|
| OFFICERS |
Stuart S. Parker, President • Scott E. Benjamin, Vice President • Christian J. Kelly, Treasurer and Principal Financial and Accounting Officer • Claudia DiGiacomo, Chief Legal Officer • Dino Capasso, Chief Compliance Officer • Charles H. Smith, Anti-Money Laundering Compliance Officer • Andrew R. French, Secretary • Melissa Gonzalez, Assistant Secretary • Diana N. Huffman, Assistant Secretary • Kelly A. Coyne, Assistant Secretary • Patrick McGuinness, Assistant Secretary • Lana Lomuti, Assistant Treasurer • Russ Shupak, Assistant Treasurer • Elyse McLaughlin, Assistant Treasurer • Deborah Conway, Assistant Treasurer |
| | | | |
| MANAGER | | PGIM Investments LLC | | 655 Broad Street
Newark, NJ 07102 |
|
| SUBADVISERS | | PGIM Fixed Income PGIM Limited | | 655 Broad Street
Newark, NJ 07102 Grand Buildings, 1-3 Strand
Trafalgar Square
London, WC2N 5HR
United Kingdom |
|
| DISTRIBUTOR | | Prudential Investment
Management Services LLC | | 655 Broad Street
Newark, NJ 07102 |
|
| CUSTODIAN | | The Bank of New York Mellon | | 240 Greenwich Street
New York, NY 10286 |
|
| TRANSFER AGENT | | Prudential Mutual Fund
Services LLC | | PO Box 9658
Providence, RI 02940 |
|
INDEPENDENT REGISTERED
PUBLIC ACCOUNTING FIRM | | PricewaterhouseCoopers LLP | | 300 Madison Avenue
New York, NY 10017 |
|
| FUND COUNSEL | | Willkie Farr & Gallagher LLP | | 787 Seventh Avenue
New York, NY 10019 |
|
|
| An investor should consider the investment objectives, risks, charges, and expenses of the Fund carefully before investing. The prospectus and summary prospectus contain this and other information about the Fund. An investor may obtain the prospectus and summary prospectus by visiting our website at pgim.com/investments or by calling (800) 225-1852. The prospectus and summary prospectus should be read carefully before investing. |
|
| E-DELIVERY |
| To receive your mutual fund documents online, go to pgim.com/investments/resource/edelivery and enroll. Instead of receiving printed documents by mail, you will receive notification via email when new materials are available. You can cancel your enrollment or change your email address at any time by visiting the website address above. |
|
| SHAREHOLDER COMMUNICATIONS WITH DIRECTORS |
| Shareholders can communicate directly with the Board of Directors by writing to the Chair of the Board, PGIM Emerging Markets Debt Hard Currency Fund, PGIM Investments, Attn: Board of Directors, 655 Broad Street, Newark, NJ 07102. Shareholders can communicate directly with an individual Director by writing to that Director at the same address. Communications are not screened before being delivered to the addressee. |
|
| AVAILABILITY OF PORTFOLIO HOLDINGS |
| The Fund files its complete schedule of portfolio holdings with the Securities and Exchange Commission for the first and third quarters of each fiscal year as an exhibit to its reports on Form N-PORT. The Fund’s Form N-PORT filings are available on the Commission’s website at sec.gov. |
|
The Fund’s Statement of Additional Information contains additional information about the Fund’s Directors and is available without charge, upon request, by calling (800) 225-1852. |
Mutual Funds:
| | | | |
| ARE NOT INSURED BY THE FDIC OR ANY FEDERAL GOVERNMENT AGENCY | | MAY LOSE VALUE | | ARE NOT A DEPOSIT OF OR GUARANTEED BY ANY BANK OR ANY BANK AFFILIATE |
PGIM EMERGING MARKETS DEBT HARD CURRENCY FUND
| | | | | | | | |
| SHARE CLASS | | A | | C | | Z | | R6 |
| NASDAQ | | PDHAX | | PDHCX | | PDHVX | | PDHQX |
| CUSIP | | 743969479 | | 743969461 | | 743969446 | | 743969453 |
MF239E
Item 2 – Code of Ethics — See Exhibit (a)
As of the end of the period covered by this report, the registrant has adopted a code of ethics (the “Section 406 Standards for Investment Companies – Ethical Standards for Principal Executive and Financial Officers”) that applies to the registrant’s Principal Executive Officer and Principal Financial Officer; the registrant’s Principal Financial Officer also serves as the Principal Accounting Officer.
The registrant hereby undertakes to provide any person, without charge, upon request, a copy of the code of ethics. To request a copy of the code of ethics, contact the registrant 800-225-1852, and ask for a copy of the Section 406 Standards for Investment Companies - Ethical Standards for Principal Executive and Financial Officers.
Item 3 – Audit Committee Financial Expert –
The registrant’s Board has determined that Ms. Grace C. Torres, member of the Board’s Audit Committee is an “audit committee financial expert,” and that she is “independent,” for purposes of this item.
Item 4 – Principal Accountant Fees and Services –
(a) Audit Fees
For the fiscal year ended October 31, 2020, the Registrant’s principal accountant was PricewaterhouseCoopers LLP (“PwC”). For the fiscal year ended October 31, 2020, PwC billed the Registrant $244,900 for professional services rendered for the audit of the Registrant’s annual financial statements or services that are normally provided in connection with statutory and regulatory filings.
For the fiscal year ended October 31, 2019, the Registrant’s principal accountant was KPMG LLP (“KPMG”). For the fiscal year ended October 31, 2019, KPMG billed the Registrant $244,707 for professional services rendered for the audit of the Registrant’s annual financial statements or services that are normally provided in connection with statutory and regulatory filings.
(b) Audit-Related Fees
For the fiscal year ended October 31, 2020, PwC did not bill the Registrant for audit-related services.
For the fiscal year ended October 31, 2020, fees of $11,860 were billed to the Registrant for services rendered by KPMG in connection with the auditor transition.
For the fiscal year ended October 31, 2019, fees of $9,926 were billed to the Registrant for services rendered by KPMG in connection with an accounting system conversion and were paid by The Bank of New York Mellon.
(c) Tax Fees
For the fiscal years ended October 31, 2020 and October 31, 2019: none.
(d) All Other Fees
For the fiscal years ended October 31, 2020 and October 31, 2019: none.
(e) (1) Audit Committee Pre-Approval Policies and Procedures
THE PGIM MUTUAL FUNDS
AUDIT COMMITTEE POLICY
on
Pre-Approval of Services Provided by the Independent
Accountants
The Audit Committee of each PGIM Mutual Fund is charged with the responsibility to monitor the independence of the Fund’s independent accountants. As part of this responsibility, the Audit Committee must pre-approve the independent accounting firm’s engagement to render audit and/or permissible non-audit services, as required by law. In evaluating a proposed engagement of the independent accountants, the Audit Committee will assess the effect that the engagement might reasonably be expected to have on the accountant’s independence. The Committee’s evaluation will be based on:
| | • | | a review of the nature of the professional services expected to be provided, |
| | • | | a review of the safeguards put into place by the accounting firm to safeguard independence, and |
| | • | | periodic meetings with the accounting firm. |
Policy for Audit and Non-Audit Services Provided to the Funds
On an annual basis, the scope of audits for each Fund, audit fees and expenses, and audit-related and non-audit services (and fees proposed in respect thereof) proposed to be performed by the Fund’s independent accountants will be presented by the Treasurer and the independent accountants to the Audit Committee for review and, as appropriate, approval prior to the initiation of such services.
Such presentation shall be accompanied by confirmation by both the Treasurer and the independent accountants that the proposed
non-audit services will not adversely affect the independence of the independent accountants. Such proposed non-audit services shall be described in sufficient detail to enable the Audit Committee to assess the appropriateness of such services and fees, and the compatibility of the provision of such services with the auditor’s independence. The Committee shall receive periodic reports on the progress of the audit and other services which are approved by the Committee or by the Committee Chair pursuant to authority delegated in this Policy.
The categories of services enumerated under “Audit Services”, “Audit-related Services”, and “Tax Services” are intended to provide guidance to the Treasurer and the independent accountants as to those categories of services which the Committee believes are generally consistent with the independence of the independent accountants and which the Committee (or the Committee Chair) would expect upon the presentation of specific proposals to pre-approve. The enumerated categories are not intended as an exclusive list of audit, audit-related or tax services, which the Committee (or the Committee Chair) would consider for pre-approval.
Audit Services
The following categories of audit services are considered to be consistent with the role of the Fund’s independent accountants:
| | • | | Annual Fund financial statement audits |
| | • | | Seed audits (related to new product filings, as required) |
| | • | | SEC and regulatory filings and consents |
Audit-related Services
The following categories of audit-related services are considered to be consistent with the role of the Fund’s independent accountants:
| | • | | Accounting consultations |
| | • | | Fund merger support services |
| | • | | Agreed Upon Procedure Reports |
| | • | | Other Internal Control Reports |
Individual audit-related services that fall within one of these categories (except for fund merger support services) and are not presented to the Audit Committee as part of the annual pre-approval process are subject to an authorized pre-approval by the Audit Committee so long as the estimated fee for those services does not exceed $30,000. Any services provided under such pre-approval will be reported to the Audit Committee at its next regular meeting. Should the amount of such services exceed $30,000 any additional fees will be subject to pre-approval by the Committee Chair (or any other Committee member on whom this responsibility has been delegated). Fees related to fund merger support services are subject to a separate authorized pre-approval by the Audit Committee with fees determined on a per occurrence and merger complexity basis.
Tax Services
The following categories of tax services are considered to be consistent with the role of the Fund’s independent accountants:
| | • | | Tax compliance services related to the filing or amendment of the following: |
| | • | | Federal, state and local income tax compliance; and, |
| | • | | Sales and use tax compliance |
| | • | | Timely RIC qualification reviews |
| | • | | Tax distribution analysis and planning |
| | • | | Tax authority examination services |
| | • | | Tax appeals support services |
| | • | | Accounting methods studies |
| | • | | Fund merger support services |
| | • | | Tax consulting services and related projects |
Individual tax services that fall within one of these categories and are not presented to the Audit Committee as part of the annual pre-approval process are subject to an authorized pre-approval by the Audit Committee so long as the estimated fee for those services does not exceed $30,000. Any services provided under such pre-approval will be reported to the Audit Committee at its next regular meeting. Should the amount of such services exceed $30,000 any additional fees will be subject to pre-approval by the Committee Chair (or any other Committee member on whom this responsibility has been delegated).
Other Non-Audit Services
Certain non-audit services that the independent accountants are legally permitted to render will be subject to pre-approval by the Committee or by one or more Committee members to whom the Committee has delegated this authority and who will report to the full Committee any pre-approval decisions made pursuant to this Policy. Non-audit services presented for pre-approval pursuant to this paragraph will be accompanied by a confirmation from both the Treasurer and the independent accountants that the proposed services will not adversely affect the independence of the independent accountants.
Proscribed Services
The Fund’s independent accountants will not render services in the following categories of non-audit services:
| | • | | Bookkeeping or other services related to the accounting records or financial statements of the Fund |
| | • | | Financial information systems design and implementation |
| | • | | Appraisal or valuation services, fairness opinions, or contribution-in-kind reports |
| | • | | Internal audit outsourcing services |
| | • | | Management functions or human resources |
| | • | | Broker or dealer, investment adviser, or investment banking services |
| | • | | Legal services and expert services unrelated to the audit |
| | • | | Any other service that the Public Company Accounting Oversight Board determines, by regulation, is impermissible. |
Pre-approval of Non-Audit Services Provided to Other Entities Within the PGIM Fund Complex
Certain non-audit services provided to PGIM Investments LLC or any of its affiliates that also provide ongoing services to the PGIM Mutual Funds will be subject to pre-approval by the Audit Committee. The only non-audit services provided to these entities that will require pre-approval are those related directly to the operations and financial reporting of the Funds. Individual projects that are not presented to the Audit Committee as part of the annual pre-approval process will be subject to pre-approval by the Committee Chair (or any other Committee member on whom this responsibility has been delegated) so long as the estimated fee for those services does not exceed $30,000. Services presented for pre-approval pursuant to this paragraph will be accompanied by a confirmation from both the Treasurer and the independent accountants that the proposed services will not adversely affect the independence of the independent accountants.
Although the Audit Committee will not pre-approve all services provided to PGIM Investments LLC and its affiliates, the Committee will receive an annual report from the Fund’s independent accounting firm showing the aggregate fees for all services provided to PGIM Investments and its affiliates.
(e) (2) Percentage of services referred to in 4(b) – 4(d) that were approved by the audit committee –
For the fiscal years ended October 31, 2020 and October 31, 2019, 100% of the services referred to in Item 4(b) was approved by the audit committee.
(f) Percentage of hours expended attributable to work performed by other than full time employees of principal accountant if greater than 50%.
The percentage of hours expended on the principal accountant’s engagement to audit the registrant’s financial statements for the most recent fiscal year that were attributed to work performed by persons other than the principal accountant’s full-time, permanent employees was 0%.
(g) Non-Audit Fees
The aggregate non-audit fees billed by KPMG for services rendered to the registrant’s investment adviser and any entity controlling, controlled by, or under common control with the investment adviser that provides ongoing services to the registrant for the fiscal years ended October 31, 2020 and October 31, 2019 was $0 and $0, respectively.
(h) Principal Accountant’s Independence
Not applicable as KPMG has not provided non-audit services to the registrant’s investment adviser and any entity controlling, controlled by, or under common control with the investment adviser that provides ongoing services to the registrant that were not pre-approved pursuant to Rule 2-01(c)(7)(ii) of Regulation S-X.
Item 5 – Audit Committee of Listed Registrants – Not applicable.
Item 6 – Schedule of Investments – The schedule is included as part of the report to shareholders filed under Item 1 of this Form.
Item 7 – Disclosure of Proxy Voting Policies and Procedures for Closed-End Management Investment Companies – Not applicable.
Item 8 – Portfolio Managers of Closed-End Management Investment Companies – Not applicable.
| Item 9 – | Purchases of Equity Securities by Closed-End Management Investment Company and Affiliated Purchasers – Not applicable. |
Item 10 – Submission of Matters to a Vote of Security Holders – There have been no material changes to these procedures.
Item 11 – Controls and Procedures
| | (a) | It is the conclusion of the registrant’s principal executive officer and principal financial officer that the effectiveness of the registrant’s current disclosure controls and procedures (such disclosure controls and procedures having been evaluated within 90 days of the date of this filing) provide reasonable assurance that the information required to be disclosed by the registrant has been recorded, processed, summarized and reported within the time period specified in the Commission’s rules and forms and that the information required to be disclosed by the registrant has been accumulated and communicated to the registrant’s principal executive officer and principal financial officer in order to allow timely decisions regarding required disclosure. |
| | (b) | There has been no significant change in the registrant’s internal control over financial reporting that occurred during the registrant’s most recent fiscal quarter of the period covered by this report that has materially affected, or is likely to materially affect, the registrant’s internal control over financial reporting. |
Item 12 – Controls and Procedures - Disclosure of Securities Lending Activities for Closed-End Management Investment Companies – Not applicable.
Item 13 – Exhibits
| | | (3) Any written solicitation to purchase securities under Rule 23c-1 – Not applicable. |
SIGNATURES
Pursuant to the requirements of the Securities Exchange Act of 1934 and the Investment Company Act of 1940, the registrant has duly caused this report to be signed on its behalf by the undersigned, thereunto duly authorized.
| | |
| Registrant: | | Prudential World Fund, Inc. |
| |
| By: | | /s/ Andrew R. French |
| | Andrew R. French |
| | Secretary |
| |
| Date: | | December 17, 2020 |
Pursuant to the requirements of the Securities Exchange Act of 1934 and the Investment Company Act of 1940, this report has been signed below by the following persons on behalf of the registrant and in the capacities and on the dates indicated.
| | |
| By: | | /s/ Stuart S. Parker |
| | Stuart S. Parker |
| | President and Principal Executive Officer |
| |
| Date: | | December 17, 2020 |
| |
| By: | | /s/ Christian J. Kelly |
| | Christian J. Kelly |
| | Treasurer and Principal Financial and Accounting Officer |
| |
| Date: | | December 17, 2020 |