UNITED STATES
SECURITIES AND EXCHANGE COMMISSION
Washington, D.C. 20549
FORM N-CSR
CERTIFIED SHAREHOLDER REPORT OF REGISTERED MANAGEMENT INVESTMENT
COMPANIES
| | |
| Investment Company Act file number: | | 811-03981 |
| |
| Exact name of registrant as specified in charter: | | Prudential World Fund, Inc. |
| |
| Address of principal executive offices: | | 655 Broad Street, 6th Floor |
| | | Newark, New Jersey 07102 |
| |
| Name and address of agent for service: | | Andrew R. French |
| | | 655 Broad Street, 6th Floor |
| | | Newark, New Jersey 07102 |
| |
| Registrant’s telephone number, including area code: | | 800-225-1852 |
| |
| Date of fiscal year end: | | 10/31/2022 |
| |
| Date of reporting period: | | 10/31/2022 |
Item 1 – Reports to Stockholders

PGIM QUANT SOLUTIONS INTERNATIONAL EQUITY FUND
ANNUAL REPORT
OCTOBER 31, 2022

To enroll in e-delivery, go to pgim.com/investments/resource/edelivery
Table of Contents
This report is not authorized for distribution to prospective investors unless preceded or accompanied by a current prospectus.
The views expressed in this report and information about the Fund’s portfolio holdings are for the period covered by this report and are subject to change thereafter.
Mutual funds are distributed by Prudential Investment Management Services LLC, a Prudential Financial company, member SIPC. PGIM Quantitative Solutions LLC, a wholly owned subsidiary of PGIM, Inc. (PGIM), is a registered investment adviser and Prudential Financial company. © 2022 Prudential Financial, Inc. and its related entities. PGIM and the PGIM logo are service marks of Prudential Financial, Inc. and its related entities, registered in many jurisdictions worldwide.
2 Visit our website at pgim.com/investments
Letter from the President
| | |
 | | Dear Shareholder: We hope you find the annual report for the PGIM Quant Solutions International Equity Fund informative and useful. The report covers performance for the 12-month period that ended October 31, 2022. The attention of the global economy and financial markets pivoted during the period from the COVID-19 pandemic to the challenge of rapidly rising inflation. While job growth remained strong, prices for a wide range of goods and services rose in response to economic re-openings, supply-chain disruptions, governmental stimulus, and Russia s |
invasion of Ukraine. With inflation surging to a 40-year high, the Federal Reserve and other central banks aggressively hiked interest rates, prompting recession concerns.
After rising to record levels at the end of 2021, stocks have fallen sharply in 2022 as investors worried about higher prices, slowing economic growth, geopolitical uncertainty, and new COVID-19 outbreaks. Equities rallied for a time during the summer but began falling again in late August on fears that the Fed would keep raising rates to tame inflation. For the entire 12-month period, equities suffered a broad-based global decline, although large-cap US stocks outperformed their small-cap counterparts. International developed and emerging markets trailed the US market during this time.
Rising rates and economic uncertainty drove fixed income prices broadly lower as well. US and global investment-grade bonds, along with US high yield corporate bonds and emerging market debt, all posted negative returns during the period.
Regarding your investments with PGIM, we believe it is important to maintain a diversified portfolio of funds consistent with your tolerance for risk, time horizon, and financial goals. Your financial advisor can help you create a diversified investment plan that may include funds covering all the basic asset classes and that reflects your personal investor profile and risk tolerance. However, diversification and asset allocation strategies do not assure a profit or protect against loss in declining markets.
At PGIM Investments, we provide access to active investment strategies across the global markets in the pursuit of consistent outperformance for investors. PGIM is the world’s 11th-largest investment manager with more than $1.5 trillion in assets under management. Our scale and investment expertise allow us to deliver a diversified suite of actively managed solutions across a broad spectrum of asset classes and investment styles.
Thank you for choosing our family of funds.
Sincerely,

Stuart S. Parker, President
PGIM Quant Solutions International Equity Fund
December 15, 2022
PGIM Quant Solutions International Equity Fund 3
Your Fund’s Performance (unaudited)
Performance data quoted represent past performance. Past performance does not guarantee future results. The investment return and principal value of an investment will fluctuate so that an investor’s shares, when redeemed, may be worth more or less than their original cost. Current performance may be lower or higher than the past performance data quoted. An investor may obtain performance data as of the most recent month-end by visiting our website at pgim.com/investments or by calling (800) 225-1852.
| | | | | | | | |
| |
| | | Average Annual Total Returns as of 10/31/22 |
| | | One Year (%) | | Five Years (%) | | Ten Years (%) | | Since Inception (%) |
| | | | |
Class A | | | | | | | | |
| | | | |
(with sales charges) | | -29.23 | | -3.57 | | 2.01 | | — |
| | | | |
(without sales charges) | | -25.11 | | -2.47 | | 2.59 | | — |
| | | | |
Class C | | | | | | | | |
| | | | |
(with sales charges) | | -26.65 | | -3.48 | | 1.70 | | — |
| | | | |
(without sales charges) | | -25.98 | | -3.48 | | 1.70 | | — |
| | | | |
Class Z | | | | | | | | |
| | | | |
(without sales charges) | | -24.82 | | -2.07 | | 2.95 | | — |
| | | | |
Class R6 | | | | | | | | |
| | | | |
(without sales charges) | | -24.60 | | -1.84 | | N/A | | 2.56 (12/28/2016) |
| | | | |
MSCI All Country World ex-US Index | | | | | | | | |
| | | | |
| | | -24.73 | | -0.60 | | 3.27 | | — |
| | |
|
| Average Annual Total Returns as of 10/31/22 Since Inception (%) |
| |
| | | Class R6 (12/28/2016) |
| |
MSCI All Country World ex-US Index | | 3.14 |
Since Inception returns are provided for any share class with less than 10 fiscal years of returns. Since Inception returns for the Index are measured from the closest month-end to the class’s inception date.
4 Visit our website at pgim.com/investments
Growth of a $10,000 Investment (unaudited)
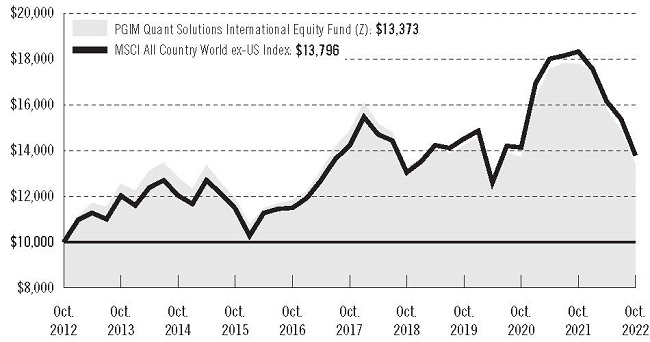
The graph compares a $10,000 investment in the Fund’s Class Z shares with a similar investment in the MSCI All Country World Ex-US Index by portraying the initial account values at the beginning of the 10-year period for Class Z shares (October 31, 2012) and the account values at the end of the current fiscal year (October 31, 2022), as measured on a quarterly basis. For purposes of the graph, and unless otherwise indicated, it has been assumed that (a) all recurring fees (including management fees) were deducted and (b) all dividends and distributions were reinvested. The line graph provides information for Class Z shares only. As indicated in the tables provided earlier, performance for other share classes will vary due to the differing fees and expenses applicable to each share class (as indicated in the following paragraphs). Without waiver of fees and/or expense reimbursements, if any, the returns would have been lower.
Past performance does not predict future performance. Total returns and the ending account values in the graphs include changes in share price and reinvestment of dividends and capital gains distributions in a hypothetical investment for the periods shown. The Fund’s total returns do not reflect the deduction of income taxes on an individual’s investment. Taxes may reduce your actual investment returns on income or gains paid by the Fund or any gains you may realize if you sell your shares.
PGIM Quant Solutions International Equity Fund 5
Your Fund’s Performance (continued)
The returns in the tables do not reflect the deduction of taxes that a shareholder would pay on Fund distributions or following the redemption of Fund shares. The average annual total returns take into account applicable sales charges, which are described for each share class in the table below.
| | | | | | | | |
| | | | | |
| | | Class A | | Class C | | Class Z | | Class R6 |
| | | | | |
| Maximum initial sales charge | | 5.50% of the public offering price | | None | | None | | None |
| Contingent deferred sales charge (CDSC) (as a percentage of the lower of the original purchase price or the net asset value at redemption) | | 1.00% on sales of $1 million or more made within 12 months of purchase | | 1.00% on sales made within 12 months of purchase | | None | | None |
| Annual distribution and service (12b-1) fees (shown as a percentage of average daily net assets) | | 0.30% | | 1.00% | | None | | None |
Benchmark Definition
MSCI All Country World ex-US Index—The Morgan Stanley Capital International All Country World ex-US Index (MSCI ACWI ex-US Index) is an unmanaged, free float-adjusted, market capitalization-weighted index that is designed to provide a broad measure of stock performance throughout the world, with the exception of US-based companies. The Index includes both developed and emerging markets.
Investors cannot invest directly in an index. The returns for the Index would be lower if they included the effects of sales charges, operating expenses of a mutual fund, or taxes that may be paid by an investor.
6 Visit our website at pgim.com/investments
Presentation of Fund Holdings as of 10/31/22
| | | | | | |
| | | |
| Ten Largest Holdings | | Line of Business | | Country | | % of Net Assets |
| | | |
Taiwan Semiconductor | | Semiconductors & Semiconductor | | Taiwan | | 1.8% |
| | | |
Manufacturing Co. Ltd. | | Equipment | | | | |
| | | |
Roche Holding AG | | Pharmaceuticals | | United States | | 1.8% |
| | | |
Shell plc | | Oil, Gas & Consumable Fuels | | Netherlands | | 1.3% |
| | | |
Sanofi | | Pharmaceuticals | | France | | 1.1% |
| | | |
British American Tobacco plc | | Tobacco | | United Kingdom | | 1.1% |
| | | |
iShares MSCI EAFE ETF | | Exchange Traded Funds | | United States | | 1.0% |
| | | |
DBS Group Holdings Ltd. | | Banks | | Singapore | | 0.9% |
| | | |
Nestle SA | | Food Products | | United States | | 0.9% |
| | | |
Suncor Energy, Inc. | | Oil, Gas & Consumable Fuels | | Canada | | 0.9% |
| | | |
GSK plc | | Pharmaceuticals | | United States | | 0.8% |
Holdings reflect only long-term investments and are subject to change.
PGIM Quant Solutions International Equity Fund 7
Strategy and Performance Overview* (Unaudited)
How did the Fund perform?
The PGIM Quantitative Solutions International Equity Fund’s Class Z shares returned –24.82% in the 12-month reporting period that ended October 31, 2022, slightly underperforming the – 24.73% return of the MSCI All Country World ex-US Index (the Index).
What were the market conditions?
| • | | Following sharp equity declines in the first half of 2022, global stock markets rebounded early in the third quarter, but generally gave back most of their gains by the end of the reporting period. |
| • | | The persistence of widespread inflationary pressures and global central bank policy tightening remained at the forefront of investor concerns throughout the period, with geopolitical complications, including the prolonged Russia-Ukraine conflict and uncertainty surrounding China’s growth prospects, amplifying recession fears. Amid this challenging environment, the Fund’s allocation and selection factors performed relatively well overall. Performance for value and top-down measures improved considerably during the third quarter of 2022, particularly among small caps, for which August proved exceedingly difficult. Growth was the best-performing component by far, while quality measures failed to gain traction and struggled. |
| • | | In absolute terms, large-cap stocks outpaced small-cap stocks in developed markets (represented by the EAFE and World regions in the MSCI universe) for the month, year-to-date, and one-year periods. The third quarter of 2022 was the exception; the MSCI World Index underperformed the MSCI World Small Cap Index on the back of outperformance of small caps in the US, particularly in the information technology, communication services, and healthcare sectors. In emerging markets, small caps beat large caps across all time periods. |
| • | | By the end of the period, inflation had not declined as expected, and central banks became increasingly hawkish. |
What worked?
| • | | A shift away from the consumer discretionary, financials, and energy sectors in China, along with a tilt toward the energy sector in Brazil, bolstered the Fund’s performance relative to the Index. |
| • | | Favoring reasonably priced, high-quality companies in the energy and utilities sectors also contributed positively to the Fund’s relative returns, as did a shift away from expensive, low-quality companies in the consumer discretionary and communication services sectors. |
What didn’t work?
| • | | Exposure to Russian financials and utilities amid the Russia-Ukraine conflict slightly detracted from the Fund’s results relative to the Index. |
| • | | Favoring high-quality and high-growth consumer discretionary and healthcare companies further undermined the Fund’s relative performance. |
8 Visit our website at pgim.com/investments
Did the Fund use derivatives?
The Fund held fully collateralized index futures during the period that were used for cash-management purposes. They had a negligible impact on performance.
Current outlook
| • | | While equities have already experienced the type of declines one might expect from a mild recession, still-larger declines remain a real possibility given the odds of monetary policy over-tightening (and thus more significant economic contraction) in the current inflationary environment. |
| • | | The US economy suffered two consecutive quarters of negative GDP growth in the first half of 2022, but these negative numbers could be revised upward. For this and other reasons, PGIM Quantitative Solutions does not believe that 2022 will constitute an “official” US recession. However, given the current high level of inflation and the low unemployment rate, it appears unlikely the US will make it through the Federal Reserve’s hiking cycle without a recession. At the same time, PGIM Quantitative Solutions sees little evidence that a recession is imminent and thinks the recession could occur later rather than sooner. |
| • | | Measured inflation remains high in most major developed economies and did not decline as expected late in the reporting period, even as weaker commodity prices relieved some pressure. Japan remains the exception, with inflation still running at reasonable (albeit elevated) rates. In the Eurozone, the economy is wilting under the pressure of rising natural gas and electricity prices stemming from disruptions related to Russia’s ongoing war in Ukraine. More dire outcomes are possible should Russia permanently cut off gas flows to the Eurozone. |
| • | | China’s economy continues to be hobbled by ongoing COVID-19 restrictions and the country’s real estate bust (and associated deleveraging). A host of structural problems—political, economic, geopolitical, and demographic—plague China’s long-term growth prospects. |
*This strategy and performance overview, which discusses what strategies or holdings (including derivatives, if applicable) affected the Fund’s performance, is compiled based on how the Fund performed relative to the Fund’s benchmark index and is viewed for performance attribution purposes at the aggregate Fund level, which in most instances will not directly correlate to the amounts disclosed in the Statement of Operations which conform to US generally accepted accounting principles.
PGIM Quant Solutions International Equity Fund 9
Fees and Expenses (unaudited)
As a shareholder of the Fund, you incur two types of costs: (1) transaction costs, including sales charges (loads) on purchase payments and redemptions, as applicable, and (2) ongoing costs, including management fees, distribution and/or service (12b-1) fees, and other Fund expenses, as applicable. This example is intended to help you understand your ongoing costs (in dollars) of investing in the Fund and to compare these costs with the ongoing costs of investing in other mutual funds.
The example is based on an investment of $1,000 held through the six-month period ended October 31, 2022. The example is for illustrative purposes only; you should consult the Prospectus for information on initial and subsequent minimum investment requirements.
Actual Expenses
The first line for each share class in the table on the following page provides information about actual account values and actual expenses. You may use the information on this line, together with the amount you invested, to estimate the expenses that you paid over the period. Simply divide your account value by $1,000 (for example, an $8,600 account value ÷ $1,000 = 8.6), then multiply the result by the number on the first line under the heading “Expenses Paid During the Six-Month Period” to estimate the expenses you paid on your account during this period.
Hypothetical Example for Comparison Purposes
The second line for each share class in the table on the following page provides information about hypothetical account values and hypothetical expenses based on the Fund’s actual expense ratio and an assumed rate of return of 5% per year before expenses, which is not the Fund’s actual return. The hypothetical account values and expenses may not be used to estimate the actual ending account balance or expenses you paid for the period. You may use this information to compare the ongoing costs of investing in the Fund and other funds. To do so, compare this 5% hypothetical example with the 5% hypothetical examples that appear in the shareholder reports of the other funds.
The Fund’s transfer agent may charge additional fees to holders of certain accounts that are not included in the expenses shown in the table on the following page. These fees apply to individual retirement accounts (IRAs) and Section 403(b) accounts. As of the close of the six-month period covered by the table, IRA fees included an annual maintenance fee of $15 per account (subject to a maximum annual maintenance fee of $25 for all accounts held by the same shareholder). Section 403(b) accounts are charged an annual $25 fiduciary maintenance fee. Some of the fees may vary in amount, or may be waived, based on your total account balance or the number of PGIM funds, including the Fund, that you own. You should consider the additional fees that were charged to your Fund account over the six-month period when you estimate the total ongoing expenses paid over the period and the impact of these fees on your ending account value, as these additional expenses are not reflected in the information
10 Visit our website at pgim.com/investments
provided in the expense table. Additional fees have the effect of reducing investment returns.
Please note that the expenses shown in the table are meant to highlight your ongoing costs only and do not reflect any transactional costs such as sales charges (loads). Therefore, the second line for each share class in the table is useful in comparing ongoing costs only and will not help you determine the relative total costs of owning different funds. In addition, if these transactional costs were included, your costs would have been higher.
| | | | | | | | | | |
| | | | |
PGIM Quant Solutions International Equity Fund | | Beginning Account Value May 1, 2022 | | Ending Account Value
October 31, 2022 | | Annualized Expense Ratio Based on the Six-Month Period | | Expenses Paid
During the Six-Month Period* |
| | | | | |
Class A | | Actual | | $1,000.00 | | $ 844.60 | | 1.58% | | $ 7.35 |
| | | | | |
| | Hypothetical | | $1,000.00 | | $1,017.24 | | 1.58% | | $ 8.03 |
| | | | | |
Class C | | Actual | | $1,000.00 | | $ 840.30 | | 2.81% | | $13.03 |
| | | | | |
| | Hypothetical | | $1,000.00 | | $1,011.04 | | 2.81% | | $14.24 |
| | | | | |
Class Z | | Actual | | $1,000.00 | | $ 847.40 | | 1.07% | | $ 4.98 |
| | | | | |
| | Hypothetical | | $1,000.00 | | $1,019.81 | | 1.07% | | $ 5.45 |
| | | | | |
Class R6 | | Actual | | $1,000.00 | | $ 847.60 | | 0.78% | | $ 3.63 |
| | | | | |
| | | Hypothetical | | $1,000.00 | | $1,021.27 | | 0.78% | | $ 3.97 |
*Fund expenses (net of fee waivers or subsidies, if any) for each share class are equal to the annualized expense ratio for each share class (provided in the table), multiplied by the average account value over the period, multiplied by the 184 days in the six-month period ended October 31, 2022, and divided by the 365 days in the Fund’s fiscal year ended October 31, 2022 (to reflect the six-month period). Expenses presented in the table include the expenses of any underlying portfolios in which the Fund may invest.
PGIM Quant Solutions International Equity Fund 11
Schedule of Investments
as of October 31, 2022
| | | | | | | | |
| | |
| Description | | Shares | | | Value | |
| | |
LONG-TERM INVESTMENTS 97.1% | | | | | | | | |
| | |
COMMON STOCKS 94.3% | | | | | | | | |
| | |
Australia 4.5% | | | | | | | | |
| | |
Aristocrat Leisure Ltd. | | | 31,410 | | | $ | 745,547 | |
Australia & New Zealand Banking Group Ltd. | | | 23,532 | | | | 385,542 | |
BHP Group Ltd. | | | 7,768 | | | | 186,589 | |
BlueScope Steel Ltd. | | | 17,635 | | | | 177,584 | |
Commonwealth Bank of Australia | | | 4,100 | | | | 274,892 | |
Fortescue Metals Group Ltd. | | | 18,396 | | | | 173,309 | |
Genworth Mortgage Insurance Australia Ltd. | | | 486,518 | | | | 844,520 | |
Glencore PLC | | | 86,620 | | | | 496,599 | |
Goodman Group, REIT | | | 88,860 | | | | 966,860 | |
JB Hi-Fi Ltd. | | | 15,765 | | | | 432,150 | |
Macquarie Group Ltd. | | | 4,335 | | | | 470,273 | |
National Australia Bank Ltd. | | | 24,776 | | | | 514,648 | |
Nine Entertainment Co. Holdings Ltd. | | | 102,648 | | | | 135,559 | |
Rio Tinto Ltd. | | | 3,134 | | | | 177,853 | |
Sonic Healthcare Ltd. | | | 45,137 | | | | 944,965 | |
West African Resources Ltd.* | | | 297,147 | | | | 196,752 | |
Whitehaven Coal Ltd. | | | 14,900 | | | | 86,551 | |
WiseTech Global Ltd. | | | 4,005 | | | | 148,117 | |
Woodside Energy Group Ltd. | | | 4,867 | | | | 112,518 | |
Woolworths Group Ltd. | | | 4,704 | | | | 99,338 | |
| | | | | | | | |
| | |
| | | | | | | 7,570,166 | |
| | |
Belgium 0.2% | | | | | | | | |
| | |
Ageas SA/NV | | | 1,920 | | | | 66,467 | |
Solvay SA | | | 1,715 | | | | 154,763 | |
Tessenderlo Group SA* | | | 3,385 | | | | 102,599 | |
| | | | | | | | |
| | |
| | | | | | | 323,829 | |
| | |
Brazil 2.0% | | | | | | | | |
| | |
Banco do Brasil SA | | | 156,200 | | | | 1,120,963 | |
Centrais Eletricas Brasileiras SA | | | 8,800 | | | | 85,027 | |
Cia de Saneamento do Parana, UTS | | | 54,900 | | | | 203,211 | |
CPFL Energia SA | | | 42,000 | | | | 288,239 | |
Marfrig Global Foods SA | | | 53,100 | | | | 109,788 | |
Petroleo Brasileiro SA | | | 33,100 | | | | 212,934 | |
Suzano SA | | | 49,400 | | | | 509,254 | |
Vale SA | | | 23,200 | | | | 301,009 | |
Yara International ASA | | | 11,967 | | | | 534,105 | |
| | | | | | | | |
| | |
| | | | | | | 3,364,530 | |
See Notes to Financial Statements.
PGIM Quant Solutions International Equity Fund 13
Schedule of Investments (continued)
as of October 31, 2022
| | | | | | | | |
| | |
| Description | | Shares | | | Value | |
| | |
COMMON STOCKS (Continued) | | | | | | | | |
| | |
Canada 7.6% | | | | | | | | |
| | |
Alimentation Couche-Tard, Inc. | | | 14,000 | | | $ | 626,858 | |
ARC Resources Ltd. | | | 5,800 | | | | 81,656 | |
Aritzia, Inc.* | | | 29,200 | | | | 1,132,549 | |
Artis Real Estate Investment Trust, REIT | | | 69,200 | | | | 485,088 | |
Brookfield Asset Management, Inc. (Class A Stock) | | | 13,800 | | | | 546,490 | |
Canadian Natural Resources Ltd. | | | 9,600 | | | | 575,782 | |
Canfor Corp.* | | | 52,900 | | | | 794,849 | |
CGI, Inc.* | | | 13,500 | | | | 1,087,452 | |
Dollarama, Inc. | | | 6,200 | | | | 368,400 | |
ECN Capital Corp. | | | 134,000 | | | | 404,257 | |
Element Fleet Management Corp. | | | 69,500 | | | | 925,918 | |
Fairfax Financial Holdings Ltd. | | | 1,500 | | | | 736,694 | |
George Weston Ltd. | | | 5,500 | | | | 605,369 | |
Gildan Activewear, Inc. | | | 7,700 | | | | 242,979 | |
Imperial Oil Ltd. | | | 9,600 | | | | 522,227 | |
Loblaw Cos. Ltd. | | | 12,900 | | | | 1,056,922 | |
National Bank of Canada | | | 1,900 | | | | 129,368 | |
Nutrien Ltd. | | | 1,500 | | | | 126,741 | |
Onex Corp. | | | 4,900 | | | | 246,628 | |
Royal Bank of Canada | | | 1,500 | | | | 138,786 | |
Russel Metals, Inc. | | | 6,100 | | | | 126,357 | |
Suncor Energy, Inc. | | | 43,000 | | | | 1,479,047 | |
TMX Group Ltd. | | | 1,600 | | | | 153,828 | |
Toronto-Dominion Bank (The) | | | 1,200 | | | | 76,800 | |
West Fraser Timber Co. Ltd. | | | 900 | | | | 67,575 | |
| | | | | | | | |
| | |
| | | | | | | 12,738,620 | |
| | |
Chile 0.0% | | | | | | | | |
| | |
Cencosud SA | | | 53,740 | | | | 72,245 | |
| | |
China 7.1% | | | | | | | | |
| | |
Alibaba Group Holding Ltd.* | | | 38,800 | | | | 301,666 | |
Bank of China Ltd. (Class H Stock) | | | 759,000 | | | | 244,457 | |
Bank of Communications Co. Ltd. (Class H Stock) | | | 224,000 | | | | 109,294 | |
Bank of Jiangsu Co. Ltd. (Class A Stock) | | | 65,100 | | | | 61,462 | |
Bank of Shanghai Co. Ltd. (Class A Stock) | | | 315,700 | | | | 240,298 | |
Beijing Enterprises Holdings Ltd. | | | 30,000 | | | | 76,107 | |
BYD Co. Ltd. (Class H Stock) | | | 40,500 | | | | 907,327 | |
China BlueChemical Ltd. (Class H Stock) | | | 1,792,000 | | | | 342,056 | |
China CITIC Bank Corp. Ltd. (Class H Stock) | | | 402,000 | | | | 151,537 | |
China Construction Bank Corp. (Class H Stock) | | | 787,000 | | | | 417,652 | |
China Medical System Holdings Ltd. | | | 386,000 | | | | 421,869 | |
China Shenhua Energy Co. Ltd. (Class H Stock) | | | 272,000 | | | | 714,506 | |
See Notes to Financial Statements.
14
| | | | | | | | |
| | |
| Description | | Shares | | | Value | |
| | |
COMMON STOCKS (Continued) | | | | | | | | |
| | |
China (cont’d.) | | | | | | | | |
| | |
China Tower Corp. Ltd. (Class H Stock), 144A | | | 2,296,000 | | | $ | 207,731 | |
Chlitina Holding Ltd. | | | 105,000 | | | | 479,868 | |
Chongqing Rural Commercial Bank Co. Ltd. (Class A Stock) | | | 360,000 | | | | 171,332 | |
Chow Tai Fook Jewellery Group Ltd. | | | 607,000 | | | | 1,039,230 | |
CITIC Ltd. | | | 926,000 | | | | 828,626 | |
COSCO SHIPPING Holdings Co. Ltd. (Class H Stock) | | | 152,300 | | | | 164,129 | |
CSPC Pharmaceutical Group Ltd. | | | 84,000 | | | | 86,282 | |
Daqo New Energy Corp., ADR* | | | 1,100 | | | | 48,389 | |
Greentown Management Holdings Co. Ltd., 144A | | | 340,000 | | | | 194,644 | |
Hello Group, Inc., ADR | | | 16,200 | | | | 76,140 | |
Henan Shenhuo Coal & Power Co. Ltd. (Class A Stock) | | | 29,400 | | | | 56,255 | |
Industrial Bank Co. Ltd. (Class A Stock) | | | 119,500 | | | | 245,210 | |
Inner Mongolia Yitai Coal Co. Ltd. (Class B Stock) | | | 52,000 | | | | 73,580 | |
Lenovo Group Ltd. | | | 192,000 | | | | 153,448 | |
Metallurgical Corp. of China Ltd. (Class A Stock) | | | 502,900 | | | | 197,772 | |
NetEase, Inc. | | | 17,400 | | | | 193,057 | |
PetroChina Co. Ltd. (Class H Stock) | | | 172,000 | | | | 65,795 | |
PICC Property & Casualty Co. Ltd. (Class H Stock) | | | 160,000 | | | | 147,570 | |
Pinduoduo, Inc., ADR* | | | 15,000 | | | | 822,450 | |
Ping An Bank Co. Ltd. (Class A Stock) | | | 94,600 | | | | 133,585 | |
Shaanxi Coal Industry Co. Ltd. (Class A Stock) | | | 95,300 | | | | 257,661 | |
Shanghai International Port Group Co. Ltd. (Class A Stock) | | | 348,600 | | | | 245,951 | |
SITC International Holdings Co. Ltd. | | | 26,000 | | | | 42,583 | |
TBEA Co. Ltd. (Class A Stock) | | | 76,000 | | | | 211,863 | |
Tencent Holdings Ltd. | | | 19,900 | | | | 522,908 | |
Tencent Music Entertainment Group, ADR* | | | 16,800 | | | | 60,648 | |
Vipshop Holdings Ltd., ADR* | | | 7,200 | | | | 50,184 | |
Wilmar International Ltd. | | | 385,200 | | | | 1,055,276 | |
Xiamen C & D, Inc. (Class A Stock) | | | 101,400 | | | | 165,944 | |
Yankuang Energy Group Co. Ltd. (Class H Stock) | | | 16,000 | | | | 44,984 | |
| | | | | | | | |
| | |
| | | | | | | 12,031,326 | |
| | |
Denmark 1.7% | | | | | | | | |
| | |
AP Moller - Maersk A/S (Class B Stock) | | | 546 | | | | 1,140,688 | |
D/S Norden A/S | | | 3,799 | | | | 196,617 | |
Novo Nordisk A/S (Class B Stock) | | | 9,442 | | | | 1,026,641 | |
Scandinavian Tobacco Group A/S, 144A | | | 25,822 | | | | 432,536 | |
| | | | | | | | |
| | |
| | | | | | | 2,796,482 | |
| | |
Finland 1.6% | | | | | | | | |
| | |
Kesko OYJ (Class B Stock) | | | 3,540 | | | | 68,891 | |
Nokia OYJ | | | 153,465 | | | | 681,986 | |
See Notes to Financial Statements.
PGIM Quant Solutions International Equity Fund 15
Schedule of Investments (continued)
as of October 31, 2022
| | | | | | | | |
| | |
| Description | | Shares | | | Value | |
| | |
COMMON STOCKS (Continued) | | | | | | | | |
| | |
Finland (cont’d.) | | | | | | | | |
| | |
Nordea Bank Abp | | | 74,128 | | | $ | 708,109 | |
Sampo OYJ (Class A Stock) | | | 28,940 | | | | 1,323,361 | |
| | | | | | | | |
| | |
| | | | | | | 2,782,347 | |
| | |
France 7.3% | | | | | | | | |
| | |
AXA SA | | | 20,372 | | | | 503,085 | |
Capgemini SE | | | 5,874 | | | | 962,695 | |
Cie de Saint-Gobain | | | 28,092 | | | | 1,148,428 | |
Coface SA | | | 34,576 | | | | 384,906 | |
Dassault Systemes SE | | | 22,889 | | | | 767,211 | |
Edenred | | | 3,223 | | | | 165,231 | |
Eiffage SA | | | 712 | | | | 64,380 | |
Engie SA | | | 106,266 | | | | 1,380,753 | |
Hermes International | | | 905 | | | | 1,171,419 | |
Ipsen SA | | | 7,043 | | | | 723,794 | |
Klepierre SA, REIT* | | | 3,440 | | | | 69,138 | |
L’Oreal SA | | | 533 | | | | 167,364 | |
LVMH Moet Hennessy Louis Vuitton SE | | | 2,236 | | | | 1,410,905 | |
Publicis Groupe SA | | | 19,555 | | | | 1,095,166 | |
Sanofi | | | 21,641 | | | | 1,862,378 | |
Thales SA | | | 700 | | | | 89,026 | |
Vinci SA | | | 4,266 | | | | 392,630 | |
| | | | | | | | |
| | |
| | | | | | | 12,358,509 | |
| | |
Georgia 0.1% | | | | | | | | |
| | |
Bank of Georgia Group PLC | | | 5,808 | | | | 141,713 | |
| | |
Germany 2.9% | | | | | | | | |
| | |
AURELIUS Equity Opportunities SE & Co. KGaA | | | 4,239 | | | | 89,630 | |
Bayer AG | | | 14,740 | | | | 775,045 | |
Brenntag SE | | | 1,296 | | | | 78,637 | |
Commerzbank AG* | | | 8,316 | | | | 66,442 | |
Deutsche Bank AG | | | 72,366 | | | | 689,774 | |
Deutsche Telekom AG | | | 45,604 | | | | 860,798 | |
E.ON SE | | | 126,081 | | | | 1,055,802 | |
Infineon Technologies AG | | | 10,743 | | | | 260,684 | |
Merck KGaA | | | 6,537 | | | | 1,065,303 | |
| | | | | | | | |
| | |
| | | | | | | 4,942,115 | |
| | |
Greece 0.2% | | | | | | | | |
| | |
Eurobank Ergasias Services and Holdings SA* | | | 78,880 | | | | 77,870 | |
See Notes to Financial Statements.
16
| | | | | | | | |
| | |
| Description | | Shares | | | Value | |
| | |
COMMON STOCKS (Continued) | | | | | | | | |
| | |
Greece (cont’d.) | | | | | | | | |
| | |
Hellenic Telecommunications Organization SA | | | 11,079 | | | $ | 173,991 | |
National Bank of Greece SA* | | | 19,800 | | | | 71,741 | |
| | | | | | | | |
| | |
| | | | | | | 323,602 | |
| | |
Hong Kong 1.6% | | | | | | | | |
| | |
CK Asset Holdings Ltd. | | | 148,500 | | | | 820,993 | |
Jardine Matheson Holdings Ltd. | | | 21,500 | | | | 990,462 | |
Orient Overseas International Ltd. | | | 14,500 | | | | 211,890 | |
WH Group Ltd., 144A | | | 1,223,000 | | | | 617,629 | |
| | | | | | | | |
| | |
| | | | | | | 2,640,974 | |
| | |
India 3.5% | | | | | | | | |
| | |
Bajaj Consumer Care Ltd. | | | 56,741 | | | | 109,295 | |
Bharat Electronics Ltd. | | | 63,780 | | | | 82,309 | |
Cipla Ltd. | | | 4,640 | | | | 65,466 | |
Coal India Ltd. | | | 28,200 | | | | 83,714 | |
Divi’s Laboratories Ltd. | | | 1,414 | | | | 61,679 | |
GAIL India Ltd. | | | 622,608 | | | | 686,306 | |
HCL Technologies Ltd. | | | 14,966 | | | | 188,401 | |
Hindalco Industries Ltd. | | | 30,775 | | | | 150,769 | |
ITC Ltd. | | | 19,900 | | | | 83,905 | |
Mahindra & Mahindra Ltd. | | | 34,312 | | | | 560,007 | |
National Aluminium Co. Ltd. | | | 97,975 | | | | 83,063 | |
NTPC Ltd. | | | 389,699 | | | | 815,767 | |
Page Industries Ltd. | | | 313 | | | | 188,298 | |
Power Grid Corp. of India Ltd. | | | 420,298 | | | | 1,159,634 | |
Sun Pharmaceutical Industries Ltd. | | | 41,444 | | | | 509,213 | |
Tata Steel Ltd. | | | 873,530 | | | | 1,071,396 | |
| | | | | | | | |
| | |
| | | | | | | 5,899,222 | |
| | |
Indonesia 0.9% | | | | | | | | |
| | |
Adaro Energy Indonesia Tbk PT | | | 260,000 | | | | 66,331 | |
Astra International Tbk PT | | | 2,359,100 | | | | 1,008,116 | |
Bank Mandiri Persero Tbk PT | | | 132,000 | | | | 89,173 | |
First Pacific Co. Ltd. | | | 902,000 | | | | 238,854 | |
Indo Tambangraya Megah Tbk PT | | | 30,000 | | | | 86,420 | |
| | | | | | | | |
| | |
| | | | | | | 1,488,894 | |
| | |
Israel 1.3% | | | | | | | | |
| | |
Bank Hapoalim BM | | | 9,728 | | | | 93,771 | |
Bank Leumi Le-Israel BM | | | 128,108 | | | | 1,222,117 | |
See Notes to Financial Statements.
PGIM Quant Solutions International Equity Fund 17
Schedule of Investments (continued)
as of October 31, 2022
| | | | | | | | |
| | |
| Description | | Shares | | | Value | |
| | |
COMMON STOCKS (Continued) | | | | | | | | |
| | |
Israel (cont’d.) | | | | | | | | |
| | |
Bezeq The Israeli Telecommunication Corp. Ltd. | | | 468,820 | | | $ | 829,922 | |
Check Point Software Technologies Ltd.* | | | 900 | | | | 116,307 | |
| | | | | | | | |
| | |
| | | | | | | 2,262,117 | |
| | |
Italy 1.1% | | | | | | | | |
| | |
Eni SpA | | | 96,357 | | | | 1,265,527 | |
Ferrari NV | | | 1,120 | | | | 220,795 | |
Moncler SpA | | | 1,662 | | | | 71,706 | |
Poste Italiane SpA, 144A | | | 25,720 | | | | 224,131 | |
| | | | | | | | |
| | |
| | | | | | | 1,782,159 | |
| | |
Japan 11.5% | | | | | | | | |
| | |
Astellas Pharma, Inc. | | | 13,400 | | | | 184,896 | |
BML, Inc. | | | 7,000 | | | | 158,238 | |
Bridgestone Corp. | | | 4,500 | | | | 162,749 | |
Chugai Pharmaceutical Co. Ltd. | | | 34,800 | | | | 806,381 | |
Citizen Watch Co. Ltd. | | | 21,600 | | | | 90,714 | |
Cosmo Energy Holdings Co. Ltd. | | | 3,100 | | | | 79,854 | |
Dai-ichi Life Holdings, Inc. | | | 80,000 | | | | 1,270,620 | |
Dentsu Group, Inc. | | | 2,100 | | | | 65,317 | |
Digital Garage, Inc. | | | 17,400 | | | | 416,638 | |
Fast Retailing Co. Ltd. | | | 800 | | | | 445,713 | |
Fujikura Ltd. | | | 60,600 | | | | 358,811 | |
GMO internet group, Inc. | | | 7,800 | | | | 134,479 | |
GungHo Online Entertainment, Inc. | | | 29,400 | | | | 434,565 | |
Hitachi Construction Machinery Co. Ltd. | | | 8,700 | | | | 170,207 | |
Honda Motor Co. Ltd. | | | 3,500 | | | | 79,809 | |
Information Services International-Dentsu Ltd. | | | 5,400 | | | | 165,157 | |
Inpex Corp. | | | 106,500 | | | | 1,074,840 | |
ITOCHU Corp. | | | 41,000 | | | | 1,059,627 | |
Japan Steel Works Ltd. (The) | | | 4,100 | | | | 84,659 | |
Japan Tobacco, Inc. | | | 59,100 | | | | 989,774 | |
Jeol Ltd. | | | 2,300 | | | | 84,164 | |
Koshidaka Holdings Co. Ltd. | | | 39,600 | | | | 297,610 | |
Makino Milling Machine Co. Ltd. | | | 2,800 | | | | 86,516 | |
Marubeni Corp. | | | 114,700 | | | | 1,004,074 | |
Mitsubishi Motors Corp.* | | | 23,400 | | | | 78,828 | |
Mitsui & Co. Ltd. | | | 63,500 | | | | 1,405,203 | |
MIXI, Inc. | | | 5,000 | | | | 78,385 | |
Mizuno Corp. | | | 7,800 | | | | 133,535 | |
MS&AD Insurance Group Holdings, Inc. | | | 39,000 | | | | 1,032,767 | |
NGK Spark Plug Co. Ltd. | | | 10,100 | | | | 184,265 | |
NTT Data Corp. | | | 70,200 | | | | 1,016,767 | |
See Notes to Financial Statements.
18
| | | | | | | | |
| | |
| Description | | Shares | | | Value | |
| | |
COMMON STOCKS (Continued) | | | | | | | | |
| | |
Japan (cont’d.) | | | | | | | | |
| | |
Olympus Corp. | | | 5,900 | | | $ | 124,398 | |
Ono Pharmaceutical Co. Ltd. | | | 3,000 | | | | 70,601 | |
ORIX Corp. | | | 9,800 | | | | 143,939 | |
Pacific Metals Co. Ltd. | | | 5,600 | | | | 69,164 | |
Rohm Co. Ltd. | | | 2,000 | | | | 140,529 | |
Sankyo Co. Ltd. | | | 2,400 | | | | 79,252 | |
Seiko Epson Corp. | | | 29,400 | | | | 399,139 | |
Shimano, Inc. | | | 600 | | | | 92,846 | |
Shin-Etsu Chemical Co. Ltd. | | | 3,100 | | | | 322,183 | |
Shionogi & Co. Ltd. | | | 2,500 | | | | 116,093 | |
SMC Corp. | | | 2,400 | | | | 963,365 | |
Sompo Holdings, Inc. | | | 22,000 | | | | 917,231 | |
Sumitomo Corp. | | | 79,500 | | | | 1,010,745 | |
Takeuchi Manufacturing Co. Ltd. | | | 5,000 | | | | 100,835 | |
TIS, Inc. | | | 2,600 | | | | 70,101 | |
Toridoll Holdings Corp. | | | 43,100 | | | | 838,031 | |
Toyota Motor Corp. | | | 13,665 | | | | 189,597 | |
Transcosmos, Inc. | | | 4,400 | | | | 101,153 | |
| | | | | | | | |
| | |
| | | | | | | 19,384,364 | |
| | |
Kuwait 0.1% | | | | | | | | |
| | |
Humansoft Holding Co. KSC | | | 15,331 | | | | 166,414 | |
Mobile Telecommunications Co. KSCP | | | 37,040 | | | | 71,594 | |
| | | | | | | | |
| | |
| | | | | | | 238,008 | |
| | |
Luxembourg 0.5% | | | | | | | | |
| | |
ArcelorMittal SA | | | 35,566 | | | | 795,030 | |
Eurofins Scientific SE | | | 1,051 | | | | 67,280 | |
| | | | | | | | |
| | |
| | | | | | | 862,310 | |
| | |
Malaysia 0.6% | | | | | | | | |
| | |
Petronas Chemicals Group Bhd | | | 503,600 | | | | 928,450 | |
Telekom Malaysia Bhd | | | 56,700 | | | | 66,686 | |
| | | | | | | | |
| | |
| | | | | | | 995,136 | |
| | |
Netherlands 4.5% | | | | | | | | |
| | |
Arcadis NV | | | 5,125 | | | | 173,928 | |
ASML Holding NV | | | 1,296 | | | | 607,937 | |
Heineken Holding NV | | | 1,000 | | | | 68,234 | |
Heineken NV | | | 2,109 | | | | 176,174 | |
Koninklijke Ahold Delhaize NV | | | 50,420 | | | | 1,406,128 | |
See Notes to Financial Statements.
PGIM Quant Solutions International Equity Fund 19
Schedule of Investments (continued)
as of October 31, 2022
| | | | | | | | |
| | |
| Description | | Shares | | | Value | |
| | |
COMMON STOCKS (Continued) | | | | | | | | |
| | |
Netherlands (cont’d.) | | | | | | | | |
| | |
Koninklijke KPN NV | | | 250,955 | | | $ | 701,948 | |
NN Group NV | | | 24,552 | | | | 1,039,592 | |
OCI NV | | | 1,720 | | | | 65,786 | |
Shell PLC | | | 78,203 | | | | 2,166,349 | |
Wolters Kluwer NV | | | 10,938 | | | | 1,162,257 | |
| | | | | | | | |
| | |
| | | | | | | 7,568,333 | |
| | |
New Zealand 0.0% | | | | | | | | |
| | |
Spark New Zealand Ltd. | | | 27,980 | | | | 83,290 | |
| | |
Nigeria 0.1% | | | | | | | | |
| | |
Airtel Africa PLC, 144A | | | 196,328 | | | | 254,128 | |
| | |
Norway 1.8% | | | | | | | | |
| | |
DNB Bank ASA | | | 59,436 | | | | 1,051,237 | |
Elkem ASA, 144A* | | | 92,160 | | | | 306,179 | |
Equinor ASA | | | 36,343 | | | | 1,324,111 | |
Gjensidige Forsikring ASA | | | 3,580 | | | | 65,438 | |
Kongsberg Gruppen ASA | | | 2,325 | | | | 83,375 | |
Mowi ASA | | | 3,240 | | | | 48,360 | |
Norsk Hydro ASA | | | 11,020 | | | | 69,936 | |
Orkla ASA | | | 9,360 | | | | 63,135 | |
| | | | | | | | |
| | |
| | | | | | | 3,011,771 | |
| | |
Peru 0.0% | | | | | | | | |
| | |
Credicorp Ltd. | | | 500 | | | | 73,180 | |
| | |
Portugal 0.0% | | | | | | | | |
| | |
Sonae SGPS SA | | | 81,802 | | | | 78,562 | |
| | |
Qatar 0.7% | | | | | | | | |
| | |
Industries Qatar QSC | | | 247,955 | | | | 1,073,402 | |
| | |
Ooredoo QPSC | | | 35,300 | | | | 94,639 | |
| | | | | | | | |
| | |
| | | | | | | 1,168,041 | |
| | |
Russia 0.0% | | | | | | | | |
| | |
Inter RAO UES PJSC^ | | | 13,660,000 | | | | 22 | |
LUKOIL PJSC^ | | | 14,283 | | | | — | |
Polyus PJSC*^ | | | 1,450 | | | | — | |
See Notes to Financial Statements.
20
| | | | | | | | |
| | |
| Description | | Shares | | | Value | |
| | |
COMMON STOCKS (Continued) | | | | | | | | |
| | |
Russia (cont’d.) | | | | | | | | |
| | |
Rosneft Oil Co. PJSC^ | | | 155,425 | | | $ | — | |
Sberbank of Russia PJSC*^ | | | 366,709 | | | | 1 | |
| | | | | | | | |
| | |
| | | | | | | 23 | |
| | |
Saudi Arabia 0.7% | | | | | | | | |
| | |
SABIC Agri-Nutrients Co. | | | 26,782 | | | | 1,131,591 | |
Sahara International Petrochemical Co. | | | 5,740 | | | | 61,796 | |
| | | | | | | | |
| | |
| | | | | | | 1,193,387 | |
| | |
Singapore 2.1% | | | | | | | | |
| | |
DBS Group Holdings Ltd. | | | 64,300 | | | | 1,554,537 | |
Oversea-Chinese Banking Corp. Ltd. | | | 128,800 | | | | 1,105,631 | |
STMicroelectronics NV | | | 25,806 | | | | 802,411 | |
| | | | | | | | |
| | |
| | | | | | | 3,462,579 | |
| | |
South Africa 0.2% | | | | | | | | |
| | |
African Rainbow Minerals Ltd. | | | 5,680 | | | | 79,986 | |
Sasol Ltd. | | | 7,752 | | | | 130,312 | |
Sibanye Stillwater Ltd. | | | 34,200 | | | | 80,104 | |
| | | | | | | | |
| | |
| | | | | | | 290,402 | |
| | |
South Korea 4.4% | | | | | | | | |
| | |
BNK Financial Group, Inc. | | | 38,013 | | | | 170,826 | |
Cheil Worldwide, Inc. | | | 18,513 | | | | 317,226 | |
DB Insurance Co. Ltd. | | | 12,339 | | | | 486,970 | |
Doosan Bobcat, Inc. | | | 3,040 | | | | 71,346 | |
GOLFZON Co. Ltd. | | | 962 | | | | 77,725 | |
GS Holdings Corp. | | | 4,817 | | | | 155,375 | |
Hana Financial Group, Inc. | | | 36,077 | | | | 1,043,036 | |
Hyundai Mobis Co. Ltd. | | | 1,097 | | | | 168,257 | |
KB Financial Group, Inc. | | | 2,955 | | | | 99,433 | |
Kia Corp. | | | 21,889 | | | | 1,017,199 | |
LG Energy Solution Ltd.* | | | 240 | | | | 88,805 | |
LG Innotek Co. Ltd. | | | 2,272 | | | | 471,359 | |
MegaStudyEdu Co. Ltd. | | | 5,911 | | | | 355,222 | |
POSCO Holdings, Inc. | | | 5,676 | | | | 989,275 | |
Samsung C&T Corp. | | | 780 | | | | 64,749 | |
Samsung Electronics Co. Ltd. | | | 17,996 | | | | 748,991 | |
Samsung Fire & Marine Insurance Co. Ltd. | | | 868 | | | | 121,737 | |
SD Biosensor, Inc. | | | 6,750 | | | | 139,647 | |
Shinhan Financial Group Co. Ltd. | | | 19,321 | | | | 491,073 | |
See Notes to Financial Statements.
PGIM Quant Solutions International Equity Fund 21
Schedule of Investments (continued)
as of October 31, 2022
| | | | | | | | |
| | |
| Description | | Shares | | | Value | |
| | |
COMMON STOCKS (Continued) | | | | | | | | |
| | |
South Korea (cont’d.) | | | | | | | | |
| | |
SK, Inc. | | | 440 | | | $ | 65,933 | |
Webzen, Inc.* | | | 6,425 | | | | 67,264 | |
Woori Financial Group, Inc. | | | 17,655 | | | | 145,689 | |
| | | | | | | | |
| | |
| | | | | | | 7,357,137 | |
| | |
Spain 0.8% | | | | | | | | |
| | |
Amadeus IT Group SA* | | | 3,762 | | | | 196,208 | |
Endesa SA | | | 4,105 | | | | 68,587 | |
Industria de Diseno Textil SA | | | 45,381 | | | | 1,030,067 | |
| | | | | | | | |
| | |
| | | | | | | 1,294,862 | |
| | |
Sweden 1.5% | | | | | | | | |
| | |
Atlas Copco AB (Class A Stock) | | | 21,655 | | | | 231,129 | |
Atlas Copco AB (Class B Stock) | | | 14,008 | | | | 135,474 | |
Epiroc AB (Class A Stock) | | | 4,600 | | | | 70,419 | |
Evolution AB, 144A | | | 1,408 | | | | 131,342 | |
Investor AB (Class A Stock) | | | 4,011 | | | | 68,206 | |
Inwido AB | | | 9,354 | | | | 84,027 | |
Nibe Industrier AB (Class B Stock) | | | 8,525 | | | | 68,002 | |
Securitas AB (Class B Stock) | | | 7,680 | | | | 62,752 | |
Skandinaviska Enskilda Banken AB (Class A Stock) | | | 43,415 | | | | 457,741 | |
Swedbank AB (Class A Stock) | | | 46,708 | | | | 696,325 | |
Volvo AB (Class B Stock) | | | 33,610 | | | | 550,093 | |
| | | | | | | | |
| | |
| | | | | | | 2,555,510 | |
| | |
Switzerland 2.4% | | | | | | | | |
| | |
Bucher Industries AG | | | 530 | | | | 178,698 | |
Cie Financiere Richemont SA (Class A Stock) | | | 4,685 | | | | 457,882 | |
Kuehne + Nagel International AG | | | 4,721 | | | | 1,004,942 | |
Novartis AG | | | 16,873 | | | | 1,364,870 | |
UBS Group AG | | | 27,492 | | | | 435,862 | |
Zurich Insurance Group AG | | | 1,323 | | | | 563,828 | |
| | | | | | | | |
| | |
| | | | | | | 4,006,082 | |
| | |
Taiwan 4.0% | | | | | | | | |
| | |
Chunghwa Telecom Co. Ltd. | | | 25,000 | | | | 86,198 | |
Compeq Manufacturing Co. Ltd. | | | 382,000 | | | | 516,055 | |
E Ink Holdings, Inc. | | | 62,000 | | | | 393,959 | |
Evergreen Marine Corp. Taiwan Ltd. | | | 134,000 | | | | 570,077 | |
Gold Circuit Electronics Ltd. | | | 109,600 | | | | 290,051 | |
Hon Hai Precision Industry Co. Ltd. | | | 104,000 | | | | 330,312 | |
See Notes to Financial Statements.
22
| | | | | | | | |
| | |
| Description | | Shares | | | Value | |
| | |
COMMON STOCKS (Continued) | | | | | | | | |
| | |
Taiwan (cont’d.) | | | | | | | | |
| | |
Taita Chemical Co. Ltd. | | | 200,130 | | | $ | 123,319 | |
Taiwan Semiconductor Manufacturing Co. Ltd. | | | 258,000 | | | | 3,101,730 | |
Unimicron Technology Corp. | | | 12,000 | | | | 46,108 | |
United Microelectronics Corp.* | | | 783,000 | | | | 941,527 | |
Yang Ming Marine Transport Corp. | | | 171,000 | | | | 318,339 | |
| | | | | | | | |
| | |
| | | | | | | 6,717,675 | |
| | |
Thailand 0.1% | | | | | | | | |
| | |
AP Thailand PCL | | | 432,400 | | | | 111,391 | |
Chularat Hospital PCL | | | 744,400 | | | | 69,254 | |
| | | | | | | | |
| | |
| | | | | | | 180,645 | |
| | |
Turkey 2.0% | | | | | | | | |
| | |
Haci Omer Sabanci Holding A/S | | | 616,137 | | | | 1,109,606 | |
Kardemir Karabuk Demir Celik Sanayi ve Ticaret A/S (Class D Stock) | | | 611,960 | | | | 393,264 | |
KOC Holding A/S | | | 147,500 | | | | 440,009 | |
Koza Anadolu Metal Madencilik Isletmeleri A/S* | | | 398,039 | | | | 681,458 | |
Mavi Giyim Sanayi Ve Ticaret A/S (Class B Stock), 144A | | | 22,420 | | | | 105,021 | |
Turk Hava Yollari AO* | | | 63,755 | | | | 347,004 | |
Turkiye Is Bankasi A/S (Class C Stock) | | | 572,000 | | | | 286,543 | |
| | | | | | | | |
| | |
| | | | | | | 3,362,905 | |
| | |
Ukraine 0.0% | | | | | | | | |
| | |
Ferrexpo PLC | | | 63,241 | | | | 74,174 | |
| | |
United Arab Emirates 0.6% | | | | | | | | |
| | |
Dubai Islamic Bank PJSC | | | 41,500 | | | | 65,747 | |
Emaar Properties PJSC | | | 542,284 | | | | 895,179 | |
| | | | | | | | |
| | |
| | | | | | | 960,926 | |
| | |
United Kingdom 7.3% | | | | | | | | |
| | |
3i Group PLC | | | 54,887 | | | | 731,006 | |
AstraZeneca PLC | | | 3,469 | | | | 407,025 | |
BAE Systems PLC | | | 25,760 | | | | 240,948 | |
Barclays PLC | | | 665,522 | | | | 1,130,891 | |
British American Tobacco PLC | | | 45,782 | | | | 1,808,090 | |
Burberry Group PLC | | | 3,560 | | | | 74,180 | |
Compass Group PLC | | | 15,334 | | | | 322,962 | |
Greggs PLC | | | 6,838 | | | | 158,515 | |
Haleon PLC* | | | 67,548 | | | | 207,133 | |
See Notes to Financial Statements.
PGIM Quant Solutions International Equity Fund 23
Schedule of Investments (continued)
as of October 31, 2022
| | | | | | | | |
| | |
| Description | | Shares | | | Value | |
| | |
COMMON STOCKS (Continued) | | | | | | | | |
| | |
United Kingdom (cont’d.) | | | | | | | | |
| | |
Imperial Brands PLC | | | 56,338 | | | $ | 1,372,343 | |
Informa PLC | | | 12,213 | | | | 77,820 | |
JD Sports Fashion PLC | | | 152,802 | | | | 170,746 | |
Lloyds Banking Group PLC | | | 2,378,872 | | | | 1,142,497 | |
Morgan Sindall Group PLC | | | 5,863 | | | | 103,453 | |
NatWest Group PLC | | | 375,878 | | | | 1,012,354 | |
Reckitt Benckiser Group PLC | | | 5,922 | | | | 393,008 | |
Safestore Holdings PLC, REIT | | | 32,233 | | | | 333,947 | |
Smiths Group PLC | | | 8,755 | | | | 156,824 | |
SSE PLC | | | 9,243 | | | | 165,181 | |
Unilever PLC | | | 30,921 | | | | 1,405,494 | |
WPP PLC | | | 105,496 | | | | 928,381 | |
| | | | | | | | |
| | |
| | | | | | | 12,342,798 | |
| | |
United States 4.8% | | | | | | | | |
| | |
Computershare Ltd. | | | 4,326 | | | | 70,030 | |
GSK PLC | | | 87,086 | | | | 1,426,564 | |
JBS SA | | | 195,200 | | | | 943,596 | |
Nestle SA | | | 13,850 | | | | 1,507,694 | |
Roche Holding AG | | | 9,012 | | | | 2,990,165 | |
Stellantis NV | | | 88,724 | | | | 1,197,027 | |
| | | | | | | | |
| | |
| | | | | | | 8,135,076 | |
| | | | | | | | |
| | |
TOTAL COMMON STOCKS
(cost $176,940,231) | | | | | | | 159,170,154 | |
| | | | | | | | |
| | |
EXCHANGE-TRADED FUND 1.0% | | | | | | | | |
| | |
United States | | | | | | | | |
| | |
iShares MSCI EAFE ETF(a)
(cost $1,644,987) | | | 28,200 | | | | 1,672,542 | |
| | | | | | | | |
| | |
PREFERRED STOCKS 1.8% | | | | | | | | |
| | |
Brazil 1.5% | | | | | | | | |
| | |
Cia Energetica de Minas Gerais (PRFC) | | | 389,469 | | | | 856,523 | |
Cia Paranaense de Energia (PRFC B) | | | 232,000 | | | | 332,808 | |
Gerdau SA (PRFC) | | | 16,000 | | | | 79,822 | |
Petroleo Brasileiro SA (PRFC) | | | 215,200 | | | | 1,241,498 | |
| | | | | | | | |
| | |
| | | | | | | 2,510,651 | |
See Notes to Financial Statements.
24
| | | | | | | | |
| | |
| Description | | Shares | | | Value | |
| | |
PREFERRED STOCKS (Continued) | | | | | | | | |
| | |
Germany 0.1% | | | | | | | | |
| | |
Porsche Automobil Holding SE (PRFC) | | | 3,538 | | | $ | 197,676 | |
| | |
South Korea 0.2% | | | | | | | | |
| | |
Samsung Electronics Co. Ltd. (PRFC) | | | 7,571 | | | | 282,943 | |
| | | | | | | | |
| | |
TOTAL PREFERRED STOCKS
(cost $2,451,960) | | | | | | | 2,991,270 | |
| | | | | | | | |
| | |
TOTAL LONG-TERM INVESTMENTS
(cost $181,037,178) | | | | | | | 163,833,966 | |
| | | | | | | | |
| | |
SHORT-TERM INVESTMENTS 2.8% | | | | | | | | |
| | |
AFFILIATED MUTUAL FUND 1.0% | | | | | | | | |
PGIM Institutional Money Market Fund
(cost $1,713,796; includes $1,710,408 of cash collateral for securities on loan)(b)(wa) | | | 1,715,341 | | | | 1,713,797 | |
| | | | | | | | |
| | | | | | | | | | | | | | |
| | | Interest Rate | | | Maturity Date | | Principal
Amount (000)# | | | | |
| | | | |
U.S. TREASURY OBLIGATION(k)(n) 0.3% | | | | | | | | | | | | | | |
U.S. Treasury Bills
(cost $448,273) | | | 3.163% | | | 12/15/22 | | | 450 | | | | 448,069 | |
| | | | | | | | | | | | | | |
| | | | |
| | | | | | | | Shares | | | | |
| | | | |
UNAFFILIATED FUND 1.5% | | | | | | | | | | | | | | |
Dreyfus Government Cash Management (Institutional Shares)
(cost $2,499,133) | | | | | | | | | 2,499,133 | | | | 2,499,133 | |
| | | | | | | | | | | | | | |
| | | | |
TOTAL SHORT-TERM INVESTMENTS
(cost $4,661,202) | | | | | | | | | | | | | 4,660,999 | |
| | | | | | | | | | | | | | |
| | | | |
TOTAL INVESTMENTS 99.9%
(cost $185,698,380) | | | | | | | | | | | | | 168,494,965 | |
Other assets in excess of liabilities(z) 0.1% | | | | | | | | | | | | | 196,600 | |
| | | | | | | | | | | | | | |
| | | | |
NET ASSETS 100.0% | | | | | | | | | | | | $ | 168,691,565 | |
| | | | | | | | | | | | | | |
Below is a list of the abbreviation(s) used in the annual report:
USD—US Dollar
144A—Security was purchased pursuant to Rule 144A under the Securities Act of 1933 and, pursuant to the requirements of Rule 144A, may not be resold except to qualified institutional buyers.
See Notes to Financial Statements.
PGIM Quant Solutions International Equity Fund 25
Schedule of Investments (continued)
as of October 31, 2022
ADR—American Depositary Receipt
EAFE—Europe, Australasia, Far East
ETF—Exchange-Traded Fund
GS—Goldman Sachs & Co. LLC
LIBOR—London Interbank Offered Rate
MSCI—Morgan Stanley Capital International
PJSC—Public Joint-Stock Company
PRFC—Preference Shares
REITs—Real Estate Investment Trust
SOFR—Secured Overnight Financing Rate
UTS—Unit Trust Security
| * | Non-income producing security. |
| # | Principal amount is shown in U.S. dollars unless otherwise stated. |
| ^ | Indicates a Level 3 instrument. The aggregate value of Level 3 instruments is $23 and 0.0% of net assets. |
| (a) | All or a portion of security is on loan. The aggregate market value of such securities, including those sold and pending settlement, is $1,660,680; cash collateral of $1,710,408 (included in liabilities) was received with which the Fund purchased highly liquid short-term investments. In the event of significant appreciation in value of securities on loan on the last business day of the reporting period, the Fund may reflect a collateral value that is less than the market value of the loaned securities and such shortfall is remedied the following business day. |
| (b) | Represents security, or portion thereof, purchased with cash collateral received for securities on loan and includes dividend reinvestment. |
| (k) | Represents security, or a portion thereof, segregated as collateral for centrally cleared/exchange-traded derivatives. |
| (n) | Rate shown reflects yield to maturity at purchased date. |
| (wa) | PGIM Investments LLC, the manager of the Fund, also serves as manager of the PGIM Core Ultra Short Bond Fund and PGIM Institutional Money Market Fund, if applicable. |
| (z) | Includes net unrealized appreciation/(depreciation) and/or market value of the below holdings which are excluded from the Schedule of Investments: |
Futures contracts outstanding at October 31, 2022:
| | | | | | | | | | | | | | | | | | | | | | |
Number of Contracts | | Type | | Expiration
Date | | | Current
Notional
Amount | | | Value / Unrealized Appreciation (Depreciation) | |
| | | | | |
Long Positions: | | | | | | | | | | | | | | | | | | | | |
47 | | Mini MSCI EAFE Index | | | Dec. 2022 | | | $ | 4,126,365 | | | | | | | $ | 198,446 | | | | | |
37 | | Mini MSCI Emerging Markets Index | | | Dec. 2022 | | | | 1,579,160 | | | | | | | | (159,697 | ) | | | | |
| | | | | | | | | | | | | | | | | | | | | | |
| | | | | | | | | | | | | | | | $ | 38,749 | | | | | |
| | | | | | | | | | | | | | | | | | | | | | |
Summary of Collateral for Centrally Cleared/Exchange-traded Derivatives:
Cash and securities segregated as collateral, including pending settlement for closed positions, to cover requirements for centrally cleared/exchange-traded derivatives are listed by broker as follows:
| | | | | | | | | | | | |
Broker | | Cash and/or Foreign Currency | | Securities Market Value |
GS | | | | $— | | | | | | $448,069 | | |
| | | | | | | | | | | | |
See Notes to Financial Statements.
26
Fair Value Measurements:
Various inputs are used in determining the value of the Fund’s investments. These inputs are summarized in the three broad levels listed below.
Level 1—unadjusted quoted prices generally in active markets for identical securities.
Level 2—quoted prices for similar securities, interest rates and yield curves, prepayment speeds, foreign currency exchange rates and other observable inputs.
Level 3—unobservable inputs for securities valued in accordance with Board approved fair valuation procedures.
The following is a summary of the inputs used as of October 31, 2022 in valuing such portfolio securities:
| | | | | | | | | | | | | | | | | | | | |
| | | Level 1 | | | Level 2 | | | Level 3 | |
Investments in Securities | | | | | | | | | | | | | | | | | | | | |
Assets | | | | | | | | | | | | | | | | | | | | |
Long-Term Investments | | | | | | | | | | | | | | | | | | | | |
Common Stocks | | | | | | | | | | | | | | | | | | | | |
Australia | | $ | — | | | $ | 7,570,166 | | | | | | | $ | — | | | | | |
Belgium | | | — | | | | 323,829 | | | | | | | | — | | | | | |
Brazil | | | 2,830,425 | | | | 534,105 | | | | | | | | — | | | | | |
Canada | | | 12,738,620 | | | | — | | | | | | | | — | | | | | |
Chile | | | — | | | | 72,245 | | | | | | | | — | | | | | |
China | | | 1,057,811 | | | | 10,973,515 | | | | | | | | — | | | | | |
Denmark | | | — | | | | 2,796,482 | | | | | | | | — | | | | | |
Finland | | | — | | | | 2,782,347 | | | | | | | | — | | | | | |
France | | | — | | | | 12,358,509 | | | | | | | | — | | | | | |
Georgia | | | — | | | | 141,713 | | | | | | | | — | | | | | |
Germany | | | — | | | | 4,942,115 | | | | | | | | — | | | | | |
Greece | | | — | | | | 323,602 | | | | | | | | — | | | | | |
Hong Kong | | | — | | | | 2,640,974 | | | | | | | | — | | | | | |
India | | | — | | | | 5,899,222 | | | | | | | | — | | | | | |
Indonesia | | | — | | | | 1,488,894 | | | | | | | | — | | | | | |
Israel | | | 116,307 | | | | 2,145,810 | | | | | | | | — | | | | | |
Italy | | | — | | | | 1,782,159 | | | | | | | | — | | | | | |
Japan | | | — | | | | 19,384,364 | | | | | | | | — | | | | | |
Kuwait | | | — | | | | 238,008 | | | | | | | | — | | | | | |
Luxembourg | | | — | | | | 862,310 | | | | | | | | — | | | | | |
Malaysia | | | — | | | | 995,136 | | | | | | | | — | | | | | |
Netherlands | | | — | | | | 7,568,333 | | | | | | | | — | | | | | |
New Zealand | | | — | | | | 83,290 | | | | | | | | — | | | | | |
Nigeria | | | — | | | | 254,128 | | | | | | | | — | | | | | |
Norway | | | — | | | | 3,011,771 | | | | | | | | — | | | | | |
Peru | | | 73,180 | | | | — | | | | | | | | — | | | | | |
Portugal | | | — | | | | 78,562 | | | | | | | | — | | | | | |
Qatar | | | — | | | | 1,168,041 | | | | | | | | — | | | | | |
Russia | | | — | | | | — | | | | | | | | 23 | | | | | |
Saudi Arabia | | | — | | | | 1,193,387 | | | | | | | | — | | | | | |
Singapore | | | — | | | | 3,462,579 | | | | | | | | — | | | | | |
South Africa | | | — | | | | 290,402 | | | | | | | | — | | | | | |
See Notes to Financial Statements.
PGIM Quant Solutions International Equity Fund 27
Schedule of Investments (continued)
as of October 31, 2022
| | | | | | | | | | | | | | | | | | | | |
| | | Level 1 | | | Level 2 | | | Level 3 | |
Investments in Securities (continued) | | | | | | | | | | | | | | | | | | | | |
Assets (continued) | | | | | | | | | | | | | | | | | | | | |
Long-Term Investments (continued) | | | | | | | | | | | | | | | | | | | | |
Common Stocks (continued) | | | | | | | | | | | | | | | | | | | | |
South Korea | | $ | — | | | $ | 7,357,137 | | | | | | | $ | — | | | | | |
Spain | | | — | | | | 1,294,862 | | | | | | | | — | | | | | |
Sweden | | | — | | | | 2,555,510 | | | | | | | | — | | | | | |
Switzerland | | | — | | | | 4,006,082 | | | | | | | | — | | | | | |
Taiwan | | | — | | | | 6,717,675 | | | | | | | | — | | | | | |
Thailand | | | — | | | | 180,645 | | | | | | | | — | | | | | |
Turkey | | | — | | | | 3,362,905 | | | | | | | | — | | | | | |
Ukraine | | | — | | | | 74,174 | | | | | | | | — | | | | | |
United Arab Emirates | | | — | | | | 960,926 | | | | | | | | — | | | | | |
United Kingdom | | | — | | | | 12,342,798 | | | | | | | | — | | | | | |
United States | | | 943,596 | | | | 7,191,480 | | | | | | | | — | | | | | |
Exchange-Traded Fund | | | | | | | | | | | | | | | | | | | | |
United States | | | 1,672,542 | | | | — | | | | | | | | — | | | | | |
Preferred Stocks | | | | | | | | | | | | | | | | | | | | |
Brazil | | | 2,510,651 | | | | — | | | | | | | | — | | | | | |
Germany | | | — | | | | 197,676 | | | | | | | | — | | | | | |
South Korea | | | — | | | | 282,943 | | | | | | | | — | | | | | |
Short-Term Investments | | | | | | | | | | | | | | | | | | | | |
Affiliated Mutual Fund | | | 1,713,797 | | | | — | | | | | | | | — | | | | | |
U.S. Treasury Obligation | | | — | | | | 448,069 | | | | | | | | — | | | | | |
Unaffiliated Fund | | | 2,499,133 | | | | — | | | | | | | | — | | | | | |
| | | | | | | | | | | | | | | | | | | | |
| | | | | |
Total | | $ | 26,156,062 | | | $ | 142,338,880 | | | | | | | $ | 23 | | | | | |
| | | | | | | | | | | | |
| | | | | |
Other Financial Instruments* | | | | | | | | | | | | | | | | | | | | |
Assets | | | | | | | | | | | | | | | | | | | | |
Futures Contracts | | $ | 198,446 | | | $ | — | | | | | | | $ | — | | | | | |
| | | | | | | | | | | | |
| | | | | |
Liabilities | | | | | | | | | | | | | | | | | | | | |
Futures Contracts | | $ | (159,697 | ) | | $ | — | | | | | | | $ | — | | | | | |
| | | | | | | | | | | | |
| * | Other financial instruments are derivative instruments not reflected in the Schedule of Investments, such as futures, forwards and centrally cleared swap contracts, which are recorded at the unrealized appreciation (depreciation) on the instrument, and OTC swap contracts which are recorded at fair value. |
Industry Classification:
The industry classification of investments and other assets in excess of liabilities shown as a percentage of net assets as of October 31, 2022 were as follows:
| | | | |
Banks | | | 11.1 | % |
Pharmaceuticals | | | 8.2 | |
Oil, Gas & Consumable Fuels | | | 6.8 | |
Insurance | | | 5.1 | |
| | | | |
Metals & Mining | | | 3.8 | % |
Semiconductors & Semiconductor Equipment | | | 3.6 | |
Automobiles | | | 3.0 | |
Tobacco | | | 2.9 | |
See Notes to Financial Statements.
28
Industry Classification (continued):
| | | | |
Trading Companies & Distributors | | | 2.8 | % |
Food Products | | | 2.7 | |
Chemicals | | | 2.7 | |
IT Services | | | 2.6 | |
Specialty Retail | | | 2.5 | |
Food & Staples Retailing | | | 2.3 | |
Industrial Conglomerates | | | 2.2 | |
Textiles, Apparel & Luxury Goods | | | 2.2 | |
Marine | | | 2.1 | |
Capital Markets | | | 2.1 | |
Diversified Telecommunication Services | | | 1.8 | |
Electric Utilities | | | 1.8 | |
Machinery | | | 1.7 | |
Media | | | 1.7 | |
Unaffiliated Fund | | | 1.5 | |
Hotels, Restaurants & Leisure | | | 1.5 | |
Multi-Utilities | | | 1.4 | |
Personal Products | | | 1.4 | |
Electronic Equipment, Instruments & Components | | | 1.3 | |
Equity Real Estate Investment Trusts (REITs) | | | 1.1 | |
Real Estate Management & Development | | | 1.1 | |
Affiliated Mutual Fund (1.0% represents investments purchased with collateral from securities on loan) | | | 1.0 | |
Exchange-Traded Fund | | | 1.0 | |
Technology Hardware, Storage & Peripherals | | | 0.9 | |
Diversified Financial Services | | | 0.9 | |
Paper & Forest Products | | | 0.8 | |
Building Products | | | 0.8 | |
Internet & Direct Marketing Retail | | | 0.7 | |
Health Care Providers & Services | | | 0.7 | |
Professional Services | | | 0.7 | |
Software | | | 0.7 | |
| | | | |
Construction & Engineering | | | 0.6 | % |
Thrifts & Mortgage Finance | | | 0.5 | |
Independent Power & Renewable Electricity Producers | | | 0.5 | |
Gas Utilities | | | 0.5 | |
Entertainment | | | 0.4 | |
Communications Equipment | | | 0.4 | |
Electrical Equipment | | | 0.4 | |
Interactive Media & Services | | | 0.4 | |
Diversified Consumer Services | | | 0.3 | |
Auto Components | | | 0.3 | |
Aerospace & Defense | | | 0.3 | |
U.S. Treasury Obligation | | | 0.3 | |
Leisure Products | | | 0.3 | |
Health Care Equipment & Supplies | | | 0.3 | |
Household Products | | | 0.2 | |
Multiline Retail | | | 0.2 | |
Airlines | | | 0.2 | |
Transportation Infrastructure | | | 0.2 | |
Beverages | | | 0.2 | |
Wireless Telecommunication Services | | | 0.1 | |
Water Utilities | | | 0.1 | |
Life Sciences Tools & Services | | | 0.0 | * |
Commercial Services & Supplies | | | 0.0 | * |
| | | | |
| |
| | | 99.9 | |
Other assets in excess of liabilities | | | 0.1 | |
| | | | |
| |
| | | 100.0 | % |
| | | | |
Effects of Derivative Instruments on the Financial Statements and Primary Underlying Risk Exposure:
The Fund invested in derivative instruments during the reporting period. The primary type of risk associated with these derivative instruments is equity contracts risk. See the Notes to Financial Statements for additional detail regarding these derivative instruments and their risks. The effect of such derivative instruments on the Fund’s financial position and financial performance as reflected in the Statement of Assets and Liabilities and Statement of Operations is presented in the summary below.
Fair values of derivative instruments as of October 31, 2022 as presented in the Statement of Assets and Liabilities:
See Notes to Financial Statements.
PGIM Quant Solutions International Equity Fund 29
Schedule of Investments (continued)
as of October 31, 2022
| | | | | | | | | | | | |
| | | Asset Derivatives | | | Liability Derivatives | |
| | | | |
Derivatives not accounted for as
hedging instruments, carried at
fair value | | Statement of Assets and
Liabilities Location | | Fair
Value | | | Statement of Assets and
Liabilities Location | | Fair
Value | |
| | | | |
Equity contracts | | Due from/to broker-variation margin futures | | $ | 198,446 | * | | Due from/to broker-variation margin futures | | $ | 159,697 | * |
| | | | | | | | | | | | |
| * | Includes cumulative appreciation (depreciation) as reported in the schedule of open futures and centrally cleared swap contracts. Only unsettled variation margin receivable (payable) is reported within the Statement of Assets and Liabilities. |
The effects of derivative instruments on the Statement of Operations for the year ended October 31, 2022 are as follows:
| | | | | | |
Amount of Realized Gain (Loss) on Derivatives Recognized in Income | |
Derivatives not accounted for as hedging instruments, carried at fair value | | | | Futures | |
| | |
Equity contracts | | | | $ | (1,502,773 | ) |
| | | | | | |
| | | | | | |
Change in Unrealized Appreciation (Depreciation) on Derivatives Recognized in Income |
Derivatives not accounted for as hedging instruments, carried at fair value | | | | | | Futures |
| | | |
Equity contracts | | | | | | $120,294 |
| | | | | | |
For the year ended October 31, 2022, the Fund’s average volume of derivative activities is as follows:
| | |
| Derivative Contract Type | | Average Volume of Derivative Activities* |
Futures Contracts - Long Positions (1) | | $5,531,108 |
| * | Average volume is based on average quarter end balances as noted for the year ended October 31, 2022. |
| (1) | Notional Amount in USD. |
Financial Instruments/Transactions—Summary of Offsetting and Netting Arrangements:
The Fund entered into financial instruments/transactions during the reporting period that are either offset in accordance with current requirements or are subject to enforceable master netting arrangements or similar agreements that permit offsetting. The information about offsetting and related netting arrangements for financial instruments/transactions where the legal right to set-off exists is presented in the summary below.
Offsetting of financial instrument/transaction assets and liabilities:
See Notes to Financial Statements.
30
| | | | | | |
| Description | | Gross Market Value of Recognized
Assets/(Liabilities) | | Collateral
Pledged/(Received)(1) | | Net
Amount |
Securities on Loan | | $1,660,680 | | $(1,660,680) | | $— |
| (1) | Collateral amount disclosed by the Fund is limited to the market value of financial instruments/transactions. |
See Notes to Financial Statements.
PGIM Quant Solutions International Equity Fund 31
Statement of Assets and Liabilities
as of October 31, 2022
| | | | |
| |
Assets | | | | |
| |
Investments at value, including securities on loan of $1,660,680: | | | | |
Unaffiliated investments (cost $183,984,584) | | $ | 166,781,168 | |
Affiliated investments (cost $1,713,796) | | | 1,713,797 | |
Foreign currency, at value (cost $1,568,206) | | | 1,569,133 | |
Receivable for investments sold | | | 5,572,572 | |
Tax reclaim receivable | | | 864,935 | |
Dividends and interest receivable | | | 385,301 | |
Receivable for Fund shares sold | | | 199,419 | |
Foreign capital gains tax benefit accrued | | | 294 | |
Prepaid expenses | | | 1,797 | |
| | | | |
| |
Total Assets | | | 177,088,416 | |
| | | | |
| |
Liabilities | | | | |
| |
Payable for investments purchased | | | 5,727,900 | |
Payable to broker for collateral for securities on loan | | | 1,710,408 | |
Payable for Fund shares purchased | | | 578,887 | |
Accrued expenses and other liabilities | | | 159,405 | |
Management fee payable | | | 73,868 | |
Affiliated transfer agent fee payable | | | 71,627 | |
Due to broker—variation margin futures | | | 42,410 | |
Distribution fee payable | | | 31,148 | |
Directors’ fees payable | | | 1,198 | |
| | | | |
| |
Total Liabilities | | | 8,396,851 | |
| | | | |
| |
Net Assets | | $ | 168,691,565 | |
| | | | |
| |
| | | | | |
| |
Net assets were comprised of: | | | | |
Common stock, at par | | $ | 292 | |
Paid-in capital in excess of par | | | 201,618,665 | |
Total distributable earnings (loss) | | | (32,927,392 | ) |
| | | | |
| |
Net assets, October 31, 2022 | | $ | 168,691,565 | |
| | | | |
See Notes to Financial Statements.
32
| | | | | | | | |
| | |
Class A | | | | | | | | |
| | |
Net asset value and redemption price per share, ($119,053,039 ÷ 20,662,278 shares of common stock issued and outstanding) | | $ | 5.76 | | | | | |
Maximum sales charge (5.50% of offering price) | | | 0.34 | | | | | |
| | | | | | | | |
| | |
Maximum offering price to public | | $ | 6.10 | | | | | |
| | | | | | | | |
| | |
Class C | | | | | | | | |
| | |
Net asset value, offering price and redemption price per share, ($1,319,492 ÷ 243,602 shares of common stock issued and outstanding) | | $ | 5.42 | | | | | |
| | | | | | | | |
| | |
Class Z | | | | | | | | |
| | |
Net asset value, offering price and redemption price per share, ($11,634,955 ÷ 1,995,276 shares of common stock issued and outstanding) | | $ | 5.83 | | | | | |
| | | | | | | | |
| | |
Class R6 | | | | | | | | |
| | |
Net asset value, offering price and redemption price per share, ($36,684,079 ÷ 6,275,747 shares of common stock issued and outstanding) | | $ | 5.85 | | | | | |
| | | | | | | | |
See Notes to Financial Statements.
PGIM Quant Solutions International Equity Fund 33
Statement of Operations
Year Ended October 31, 2022
| | | | |
| |
Net Investment Income (Loss) | | | | |
| |
Income | | | | |
Unaffiliated dividend income (net of $1,002,624 foreign withholding tax) | | $ | 8,997,332 | |
Income from securities lending, net (including affiliated income of $4,028) | | | 18,395 | |
Interest income | | | 4,755 | |
Affiliated dividend income | | | 922 | |
| | | | |
| |
Total income | | | 9,021,404 | |
| | | | |
| |
Expenses | | | | |
Management fee | | | 1,629,471 | |
Distribution fee(a) | | | 465,796 | |
Transfer agent’s fees and expenses (including affiliated expense of $377,464)(a) | | | 635,653 | |
Custodian and accounting fees | | | 168,010 | |
Shareholders’ reports | | | 59,736 | |
Registration fees(a) | | | 56,888 | |
Audit fee | | | 30,600 | |
Legal fees and expenses | | | 25,258 | |
Directors’ fees | | | 12,784 | |
Miscellaneous | | | 79,349 | |
| | | | |
| |
Total expenses | | | 3,163,545 | |
Less: Fee waiver and/or expense reimbursement(a) | | | (330,703 | ) |
| | | | |
| |
Net expenses | | | 2,832,842 | |
| | | | |
| |
Net investment income (loss) | | | 6,188,562 | |
| | | | |
| |
Realized And Unrealized Gain (Loss) On Investment And Foreign Currency Transactions | | | | |
| |
Net realized gain (loss) on: | | | | |
Investment transactions (including affiliated of $(422)) (net of foreign capital gains taxes $(29,429)) | | | (17,542,112 | ) |
Futures transactions | | | (1,502,773 | ) |
Foreign currency transactions | | | (409,286 | ) |
| | | | |
| |
| | | (19,454,171 | ) |
| | | | |
Net change in unrealized appreciation (depreciation) on: | | | | |
Investments (including affiliated of $1) (net of change in foreign capital gains taxes $188,033) | | | (47,621,210 | ) |
Futures | | | 120,294 | |
Foreign currencies | | | (97,812 | ) |
| | | | |
| |
| | | (47,598,728 | ) |
| | | | |
| |
Net gain (loss) on investment and foreign currency transactions | | | (67,052,899 | ) |
| | | | |
| |
Net Increase (Decrease) In Net Assets Resulting From Operations | | $ | (60,864,337 | ) |
| | | | |
| (a) | Class specific expenses and waivers were as follows: |
| | | | | | | | | | | | | | | | |
| | | Class A | | Class C | | Class Z | | Class R6 |
Distribution fee | | | 446,502 | | | | 19,294 | | | | — | | | | — | |
Transfer agent’s fees and expenses | | | 594,295 | | | | 9,902 | | | | 28,365 | | | | 3,091 | |
Registration fees | | | 18,950 | | | | 8,386 | | | | 11,096 | | | | 18,456 | |
Fee waiver and/or expense reimbursement | | | (211,784 | ) | | | (2,746 | ) | | | (21,960 | ) | | | (94,213 | ) |
See Notes to Financial Statements.
34
Statements of Changes in Net Assets
| | | | | | | | |
| |
| | | Year Ended October 31, | |
| | | | |
| | |
| | | 2022 | | | 2021 | |
| | |
Increase (Decrease) in Net Assets | | | | | | | | |
| | |
Operations | | | | | | | | |
Net investment income (loss) | | $ | 6,188,562 | | | $ | 5,322,646 | |
Net realized gain (loss) on investment and foreign currency transactions | | | (19,454,171 | ) | | | 30,688,248 | |
Net change in unrealized appreciation (depreciation) on investments and foreign currencies | | | (47,598,728 | ) | | | 16,233,145 | |
| | | | | | | | |
| | |
Net increase (decrease) in net assets resulting from operations | | | (60,864,337 | ) | | | 52,244,039 | |
| | | | | | | | |
| | |
Dividends and Distributions | | | | | | | | |
Distributions from distributable earnings | | | | | | | | |
Class A | | | (17,710,432 | ) | | | (2,396,047 | ) |
Class C | | | (215,704 | ) | | | (9,676 | ) |
Class Z | | | (1,681,493 | ) | | | (272,737 | ) |
Class R6 | | | (6,297,350 | ) | | | (439,796 | ) |
| | | | | | | | |
| | |
| | | (25,904,979 | ) | | | (3,118,256 | ) |
| | | | | | | | |
| | |
Fund share transactions (Net of share conversions) | | | | | | | | |
Net proceeds from shares sold | | | 21,038,306 | | | | 61,325,609 | |
Net asset value of shares issued in reinvestment of dividends and distributions | | | 25,597,840 | | | | 3,075,128 | |
Cost of shares purchased | | | (46,108,812 | ) | | | (40,318,009 | ) |
| | | | | | | | |
| | |
Net increase (decrease) in net assets from Fund share transactions | | | 527,334 | | | | 24,082,728 | |
| | | | | | | | |
| | |
Total increase (decrease) | | | (86,241,982 | ) | | | 73,208,511 | |
| | |
Net Assets: | | | | | | | | |
| | |
Beginning of year | | | 254,933,547 | | | | 181,725,036 | |
| | | | | | | | |
| | |
End of year | | $ | 168,691,565 | | | $ | 254,933,547 | |
| | | | | | | | |
See Notes to Financial Statements.
PGIM Quant Solutions International Equity Fund 35
Financial Highlights
| | | | | | | | | | | | | | | | | | | | |
| | | | | | |
Class A Shares | | | | | | | | | | | | | | | | | | | | |
| | | Year Ended October 31, | |
| | | | | | |
| | | 2022 | | | 2021 | | | 2020 | | | 2019 | | | 2018 | |
| | | | | | |
Per Share Operating Performance(a): | | | | | | | | | | | | | | | | | | | | |
Net Asset Value, Beginning of Year | | | $8.59 | | | | $6.74 | | | | $7.19 | | | | $6.96 | | | | $7.95 | |
Income (loss) from investment operations: | | | | | | | | | | | | | | | | | | | | |
Net investment income (loss) | | | 0.18 | | | | 0.18 | | | | 0.11 | | | | 0.15 | | | | 0.16 | |
Net realized and unrealized gain (loss) on investment and foreign currency transactions | | | (2.14 | ) | | | 1.78 | | | | (0.39 | ) | | | 0.28 | | | | (1.00 | ) |
Total from investment operations | | | (1.96 | ) | | | 1.96 | | | | (0.28 | ) | | | 0.43 | | | | (0.84 | ) |
Less Dividends and Distributions: | | | | | | | | | | | | | | | | | | | | |
Dividends from net investment income | | | (0.24 | ) | | | (0.11 | ) | | | (0.17 | ) | | | (0.17 | ) | | | (0.15 | ) |
Distributions from net realized gains | | | (0.63 | ) | | | - | | | | - | | | | (0.03 | ) | | | - | |
Total dividends and distributions | | | (0.87 | ) | | | (0.11 | ) | | | (0.17 | ) | | | (0.20 | ) | | | (0.15 | ) |
Net asset value, end of year | | | $5.76 | | | | $8.59 | | | | $6.74 | | | | $7.19 | | | | $6.96 | |
Total Return(b): | | | (25.11 | )% | | | 29.28 | % | | | (4.07 | )% | | | 6.53 | % | | | (10.81 | )% |
| | | | | | | | | | | | | | | | | | | | | |
| | | | | | |
Ratios/Supplemental Data: | | | | | | | | | | | | | | | | | | | | |
Net assets, end of year (000) | | | $119,053 | | | | $176,479 | | | | $147,445 | | | | $173,103 | | | | $171,326 | |
Average net assets (000) | | | $148,834 | | | | $176,751 | | | | $156,952 | | | | $172,031 | | | | $200,255 | |
Ratios to average net assets(c): | | | | | | | | | | | | | | | | | | | | |
Expenses after waivers and/or expense reimbursement | | | 1.49 | % | | | 1.43 | % | | | 1.47 | % | | | 1.48 | % | | | 1.34 | % |
Expenses before waivers and/or expense reimbursement | | | 1.63 | % | | | 1.55 | % | | | 1.64 | % | | | 1.62 | % | | | 1.47 | % |
Net investment income (loss) | | | 2.65 | % | | | 2.12 | % | | | 1.58 | % | | | 2.19 | % | | | 2.08 | % |
Portfolio turnover rate(d) | | | 99 | % | | | 104 | % | | | 128 | % | | | 94 | % | | | 114 | % |
| (a) | Calculated based on average shares outstanding during the year. |
| (b) | Total return does not consider the effects of sales loads. Total return is calculated assuming a purchase of a share on the first day and a sale on the last day of each year reported and includes reinvestment of dividends and distributions, if any. Total returns may reflect adjustments to conform to GAAP. |
| (c) | Does not include expenses of the underlying portfolios in which the Fund invests. |
| (d) | The Fund’s portfolio turnover rate is calculated in accordance with regulatory requirements, without regard to transactions involving short-term investments, certain derivatives and in-kind transactions (if any). If such transactions were included, the Fund’s portfolio turnover rate may be higher. |
See Notes to Financial Statements.
36
| | | | | | | | | | | | | | | | | | | | |
| | | | | | |
Class C Shares | | | | | | | | | | | | | | | | | | | | |
| | | Year Ended October 31, | |
| | | | | | |
| | | 2022 | | | 2021 | | | 2020 | | | 2019 | | | 2018 | |
| | | | | | |
Per Share Operating Performance(a): | | | | | | | | | | | | | | | | | | | | |
Net Asset Value, Beginning of Year | | | $8.13 | | | | $6.38 | | | | $6.86 | | | | $6.64 | | | | $7.60 | |
Income (loss) from investment operations: | | | | | | | | | | | | | | | | | | | | |
Net investment income (loss) | | | 0.09 | | | | 0.07 | | | | 0.02 | | | | 0.07 | | | | 0.10 | |
| Net realized and unrealized gain (loss) on investment and foreign currency transactions | | | (2.02 | ) | | | 1.71 | | | | (0.38 | ) | | | 0.30 | | | | (0.97 | ) |
Total from investment operations | | | (1.93 | ) | | | 1.78 | | | | (0.36 | ) | | | 0.37 | | | | (0.87 | ) |
Less Dividends and Distributions: | | | | | | | | | | | | | | | | | | | | |
Dividends from net investment income | | | (0.15 | ) | | | (0.03 | ) | | | (0.12 | ) | | | (0.12 | ) | | | (0.09 | ) |
Distributions from net realized gains | | | (0.63 | ) | | | - | | | | - | | | | (0.03 | ) | | | - | |
Total dividends and distributions | | | (0.78 | ) | | | (0.03 | ) | | | (0.12 | ) | | | (0.15 | ) | | | (0.09 | ) |
Net asset value, end of year | | | $5.42 | | | | $8.13 | | | | $6.38 | | | | $6.86 | | | | $6.64 | |
Total Return(b): | | | (25.98 | )% | | | 27.89 | % | | | (5.42 | )% | | | 5.77 | % | | | (11.52 | )% |
| | | | | | | | | | | | | | | | | | | | | |
| | | | | | |
Ratios/Supplemental Data: | | | | | | | | | | | | | | | | | | | | |
Net assets, end of year (000) | | | $1,319 | | | | $2,335 | | | | $2,381 | | | | $2,928 | | | | $12,530 | |
Average net assets (000) | | | $1,929 | | | | $2,444 | | | | $2,640 | | | | $7,163 | | | | $15,626 | |
Ratios to average net assets(c): | | | | | | | | | | | | | | | | | | | | |
Expenses after waivers and/or expense reimbursement | | | 2.73 | % | | | 2.61 | % | | | 2.81 | % | | | 2.25 | % | | | 2.10 | % |
Expenses before waivers and/or expense reimbursement | | | 2.87 | % | | | 2.73 | % | | | 2.98 | % | | | 2.39 | % | | | 2.23 | % |
Net investment income (loss) | | | 1.43 | % | | | 0.84 | % | | | 0.24 | % | | | 1.09 | % | | | 1.32 | % |
Portfolio turnover rate(d) | | | 99 | % | | | 104 | % | | | 128 | % | | | 94 | % | | | 114 | % |
| (a) | Calculated based on average shares outstanding during the year. |
| (b) | Total return does not consider the effects of sales loads. Total return is calculated assuming a purchase of a share on the first day and a sale on the last day of each year reported and includes reinvestment of dividends and distributions, if any. Total returns may reflect adjustments to conform to GAAP. |
| (c) | Does not include expenses of the underlying portfolios in which the Fund invests. |
| (d) | The Fund’s portfolio turnover rate is calculated in accordance with regulatory requirements, without regard to transactions involving short-term investments, certain derivatives and in-kind transactions (if any). If such transactions were included, the Fund’s portfolio turnover rate may be higher. |
See Notes to Financial Statements.
PGIM Quant Solutions International Equity Fund 37
Financial Highlights (continued)
| | | | | | | | | | | | | | | | | | | | |
| | | | | | |
Class Z Shares | | | | | | | | | | | | | | | | | | | | |
| | | Year Ended October 31, | |
| | | | | | |
| | | 2022 | | | 2021 | | | 2020 | | | 2019 | | | 2018 | |
| | | | | | |
Per Share Operating Performance(a): | | | | | | | | | | | | | | | | | | | | |
Net Asset Value, Beginning of Year | | | $8.68 | | | | $6.81 | | | | $7.26 | | | | $7.02 | | | | $8.02 | |
Income (loss) from investment operations: | | | | | | | | | | | | | | | | | | | | |
Net investment income (loss) | | | 0.22 | | | | 0.22 | | | | 0.13 | | | | 0.18 | | | | 0.19 | |
| Net realized and unrealized gain (loss) on investment and foreign currency transactions | | | (2.16 | ) | | | 1.79 | | | | (0.37 | ) | | | 0.29 | | | | (1.02 | ) |
Total from investment operations | | | (1.94 | ) | | | 2.01 | | | | (0.24 | ) | | | 0.47 | | | | (0.83 | ) |
Less Dividends and Distributions: | | | | | | | | | | | | | | | | | | | | |
Dividends from net investment income | | | (0.28 | ) | | | (0.14 | ) | | | (0.21 | ) | | | (0.20 | ) | | | (0.17 | ) |
Distributions from net realized gains | | | (0.63 | ) | | | - | | | | - | | | | (0.03 | ) | | | - | |
Total dividends and distributions | | | (0.91 | ) | | | (0.14 | ) | | | (0.21 | ) | | | (0.23 | ) | | | (0.17 | ) |
Net asset value, end of year | | | $5.83 | | | | $8.68 | | | | $6.81 | | | | $7.26 | | | | $7.02 | |
Total Return(b): | | | (24.82 | )% | | | 29.85 | % | | | (3.61 | )% | | | 7.05 | % | | | (10.59 | )% |
| | | | | | | | | | | | | | | | | | | | | |
| | | | | | |
Ratios/Supplemental Data: | | | | | | | | | | | | | | | | | | | | |
Net assets, end of year (000) | | | $11,635 | | | | $16,562 | | | | $13,062 | | | | $14,753 | | | | $13,901 | |
Average net assets (000) | | | $15,433 | | | | $17,429 | | | | $12,955 | | | | $13,815 | | | | $17,055 | |
Ratios to average net assets(c): | | | | | | | | | | | | | | | | | | | | |
Expenses after waivers and/or expense reimbursement | | | 1.04 | % | | | 1.01 | % | | | 1.09 | % | | | 1.03 | % | | | 1.00 | % |
Expenses before waivers and/or expense reimbursement | | | 1.18 | % | | | 1.13 | % | | | 1.26 | % | | | 1.17 | % | | | 1.13 | % |
Net investment income (loss) | | | 3.20 | % | | | 2.60 | % | | | 1.97 | % | | | 2.58 | % | | | 2.44 | % |
Portfolio turnover rate(d) | | | 99 | % | | | 104 | % | | | 128 | % | | | 94 | % | | | 114 | % |
| (a) | Calculated based on average shares outstanding during the year. |
| (b) | Total return is calculated assuming a purchase of a share on the first day and a sale on the last day of each year reported and includes reinvestment of dividends and distributions, if any. Total returns may reflect adjustments to conform to GAAP. |
| (c) | Does not include expenses of the underlying portfolios in which the Fund invests. |
| (d) | The Fund’s portfolio turnover rate is calculated in accordance with regulatory requirements, without regard to transactions involving short-term investments, certain derivatives and in-kind transactions (if any). If such transactions were included, the Fund’s portfolio turnover rate may be higher. |
See Notes to Financial Statements.
38
| | | | | | | | | | | | | | | | | | | | |
| | | | | | |
Class R6 Shares | | | | | | | | | | | | | | | | | | | | |
| | | Year Ended October 31, | |
| | | | | | |
| | | 2022 | | | 2021 | | | 2020 | | | 2019 | | | 2018 | |
| | | | | | |
Per Share Operating Performance(a): | | | | | | | | | | | | | | | | | | | | |
Net Asset Value, Beginning of Year | | | $8.70 | | | | $6.83 | | | | $7.27 | | | | $7.03 | | | | $8.04 | |
Income (loss) from investment operations: | | | | | | | | | | | | | | | | | | | | |
Net investment income (loss) | | | 0.24 | | | | 0.25 | | | | 0.16 | | | | 0.21 | | | | 0.21 | |
| Net realized and unrealized gain (loss) on investment and foreign currency transactions | | | (2.16 | ) | | | 1.78 | | | | (0.38 | ) | | | 0.27 | | | | (1.03 | ) |
Total from investment operations | | | (1.92 | ) | | | 2.03 | | | | (0.22 | ) | | | 0.48 | | | | (0.82 | ) |
Less Dividends and Distributions: | | | | | | | | | | | | | | | | | | | | |
Dividends from net investment income | | | (0.30 | ) | | | (0.16 | ) | | | (0.22 | ) | | | (0.21 | ) | | | (0.19 | ) |
Distributions from net realized gains | | | (0.63 | ) | | | - | | | | - | | | | (0.03 | ) | | | - | |
Total dividends and distributions | | | (0.93 | ) | | | (0.16 | ) | | | (0.22 | ) | | | (0.24 | ) | | | (0.19 | ) |
Net asset value, end of year | | | $5.85 | | | | $8.70 | | | | $6.83 | | | | $7.27 | | | | $7.03 | |
Total Return(b): | | | (24.60 | )% | | | 29.96 | % | | | (3.26 | )% | | | 7.33 | % | | | (10.43 | )% |
| | | | | | | | | | | | | | | | | | | | | |
| | | | | | |
Ratios/Supplemental Data: | | | | | | | | | | | | | | | | | | | | |
Net assets, end of year (000) | | | $36,684 | | | | $59,558 | | | | $18,837 | | | | $5,487 | | | | $36,552 | |
Average net assets (000) | | | $51,067 | | | | $37,941 | | | | $18,273 | | | | $23,216 | | | | $38,947 | |
Ratios to average net assets(c): | | | | | | | | | | | | | | | | | | | | |
Expenses after waivers and/or expense reimbursement | | | 0.78 | % | | | 0.78 | % | | | 0.78 | % | | | 0.78 | % | | | 0.78 | % |
Expenses before waivers and/or expense reimbursement | | | 0.96 | % | | | 0.94 | % | | | 1.05 | % | | | 0.95 | % | | | 0.95 | % |
Net investment income (loss) | | | 3.38 | % | | | 2.92 | % | | | 2.33 | % | | | 3.06 | % | | | 2.61 | % |
Portfolio turnover rate(d) | | | 99 | % | | | 104 | % | | | 128 | % | | | 94 | % | | | 114 | % |
| (a) | Calculated based on average shares outstanding during the year. |
| (b) | Total return is calculated assuming a purchase of a share on the first day and a sale on the last day of each year reported and includes reinvestment of dividends and distributions, if any. Total returns may reflect adjustments to conform to GAAP. |
| (c) | Does not include expenses of the underlying portfolios in which the Fund invests. |
| (d) | The Fund’s portfolio turnover rate is calculated in accordance with regulatory requirements, without regard to transactions involving short-term investments, certain derivatives and in-kind transactions (if any). If such transactions were included, the Fund’s portfolio turnover rate may be higher. |
See Notes to Financial Statements.
PGIM Quant Solutions International Equity Fund 39
Notes to Financial Statements
Prudential World Fund, Inc. (the “Registered Investment Company” or “RIC”) is registered under the Investment Company Act of 1940, as amended (“1940 Act”), as an open-end management investment company. The RIC is organized as a Maryland Corporation. These financial statements relate only to the PGIM Quant Solutions International Equity Fund (formerly known as PGIM QMA International Equity Fund) (the “Fund”), a series of the RIC. The Fund is classified as a diversified fund for purposes of the 1940 Act.
The investment objective of the Fund is to seek long-term growth of capital.
The Fund follows the investment company accounting and reporting guidance of the Financial Accounting Standards Board (“FASB”) Accounting Standard Codification (“ASC”) Topic 946 Financial Services — Investment Companies. The following is a summary of significant accounting policies followed by the Fund in the preparation of its financial statements. The policies conform to U.S. generally accepted accounting principles (“GAAP”). The Fund consistently follows such policies in the preparation of its financial statements.
Securities Valuation: The Fund holds securities and other assets and liabilities that are fair valued as of the close of each day (generally, 4:00 PM Eastern time) the New York Stock Exchange (“NYSE”) is open for trading. As described in further detail below, the Fund’s investments are valued daily based on a number of factors, including the type of investment and whether market quotations are readily available. The RIC’s Board of Directors (the “Board”) has approved the Fund’s valuation policies and procedures for security valuation and designated to PGIM Investments LLC (“PGIM Investments” or the “Manager”) as the Valuation Designee pursuant to SEC Rule 2a-5(b) to perform the fair value determination relating to all Fund investments. Pursuant to the Board’s oversight, the Valuation Designee has established a Valuation Committee to perform the duties and responsibilities as valuation designee under SEC Rule 2a-5. The valuation procedures permit the Fund to utilize independent pricing vendor services, quotations from market makers, and alternative valuation methods when market quotations are either not readily available or not deemed representative of fair value. Fair value is the price that would be received to sell an asset or paid to transfer a liability in an orderly transaction between market participants on the measurement date. A record of the Valuation Committee’s actions is provided to the Board at the first quarterly meeting following the quarter in which such actions take place.
For the fiscal reporting year-end, securities and other assets and liabilities were fair valued at the close of the last U.S. business day. Trading in certain foreign securities may occur when the NYSE is closed (including weekends and holidays). Because such foreign securities
40
trade in markets that are open on weekends and U.S. holidays, the values of some of the Fund’s foreign investments may change on days when investors cannot purchase or redeem Fund shares.
Various inputs determine how the Fund’s investments are valued, all of which are categorized according to the three broad levels (Level 1, 2, or 3) detailed in the Schedule of Investments and referred to herein as the “fair value hierarchy” in accordance with FASB ASC Topic 820 - Fair Value Measurement.
Common or preferred stocks, exchange-traded funds and derivative instruments, if applicable, that are traded on a national securities exchange are valued at the last sale price as of the close of trading on the applicable exchange where the security principally trades. Securities traded via NASDAQ are valued at the NASDAQ official closing price. To the extent these securities are valued at the last sale price or NASDAQ official closing price, they are classified as Level 1 in the fair value hierarchy. In the event that no sale or official closing price on valuation date exists, these securities are generally valued at the mean between the last reported bid and ask prices, or at the last bid price in the absence of an ask price. These securities are classified as Level 2 in the fair value hierarchy.
Foreign equities traded on foreign securities exchanges are generally valued using pricing vendor services that provide model prices derived using adjustment factors based on information such as local closing price, relevant general and sector indices, currency fluctuations, depositary receipts, and futures, as applicable. Securities valued using such model prices are classified as Level 2 in the fair value hierarchy. The models generate an evaluated adjustment factor for each security, which is applied to the local closing price to adjust it for post closing market movements up to the time the Fund is valued. Utilizing that evaluated adjustment factor, the vendor provides an evaluated price for each security. If the vendor does not provide an evaluated price, securities are valued in accordance with exchange-traded common and preferred stock valuation policies discussed above.
Investments in open-end funds (other than exchange-traded funds) are valued at their net asset values as of the close of the NYSE on the date of valuation. These securities are classified as Level 1 in the fair value hierarchy since they may be purchased or sold at their net asset values on the date of valuation.
Securities and other assets that cannot be priced according to the methods described above are valued based on policies and procedures approved by the Board. In the event that unobservable inputs are used when determining such valuations, the securities will be classified as Level 3 in the fair value hierarchy. Altering one or more unobservable inputs may result in a significant change to a Level 3 security’s fair value measurement.
When determining the fair value of securities, some of the factors influencing the valuation include: the nature of any restrictions on disposition of the securities; assessment of the general liquidity of the securities; the issuer’s financial condition and the markets in which it does business; the cost of the investment; the size of the holding and the capitalization of
PGIM Quant Solutions International Equity Fund 41
Notes to Financial Statements (continued)
the issuer; the prices of any recent transactions or bids/offers for such securities or any comparable securities; any available analyst media or other reports or information deemed reliable by the Valuation Designee regarding the issuer or the markets or industry in which it operates. Using fair value to price securities may result in a value that is different from a security’s most recent closing price and from the price used by other unaffiliated mutual funds to calculate their net asset values.
Foreign Currency Translation: The books and records of the Fund are maintained in U.S. dollars. Foreign currency amounts are translated into U.S. dollars on the following basis:
(i) market value of investment securities, other assets and liabilities — at the exchange rate as of the valuation date;
(ii) purchases and sales of investment securities, income and expenses — at the rates of exchange prevailing on the respective dates of such transactions.
Although the net assets of the Fund are presented at the foreign exchange rates and market values at the close of the period, the Fund does not generally isolate that portion of the results of operations arising as a result of changes in the foreign exchange rates from the fluctuations arising from changes in the market prices of long-term portfolio securities held at the end of the period. Similarly, the Fund does not isolate the effect of changes in foreign exchange rates from the fluctuations arising from changes in the market prices of long-term portfolio securities sold during the period. Accordingly, holding period unrealized and realized foreign currency gains (losses) are included in the reported net change in unrealized appreciation (depreciation) on investments and net realized gains (losses) on investment transactions on the Statements of Operations.
Net realized gains (losses) on foreign currency transactions represent net foreign exchange gains (losses) from the disposition of holdings of foreign currencies, currency gains (losses) realized between the trade and settlement dates on investment transactions, and the difference between the amounts of interest, dividends and foreign withholding taxes recorded on the Fund’s books and the U.S. dollar equivalent amounts actually received or paid. Net unrealized currency gains (losses) arise from valuing foreign currency denominated assets and liabilities (other than investments) at period end exchange rates.
Financial Futures Contracts: A financial futures contract is an agreement to purchase (long) or sell (short) an agreed amount of securities at a set price for delivery on a future date. Upon entering into a financial futures contract, the Fund is required to pledge to the broker an amount of cash and/or other assets equal to a certain percentage of the contract amount. This amount is known as the “initial margin.” Subsequent payments, known as “variation margin,” are made or received by the Fund each day, depending on the daily fluctuations in
42
the value of the underlying security. Such variation margin is recorded for financial statement purposes on a daily basis as unrealized gain (loss). When the contract expires or is closed, the gain (loss) is realized and is presented in the Statement of Operations as net realized gain (loss) on futures transactions.
The Fund invested in financial futures contracts in order to hedge its existing portfolio securities, or securities the Fund intends to purchase, against fluctuations in value caused by changes in prevailing interest rates. Should interest rates move unexpectedly, the Fund may not achieve the anticipated benefits of the financial futures contracts and may realize a loss. The use of futures transactions involves the risk of imperfect correlation in movements in the price of futures contracts, interest rates and the underlying hedged assets. Since futures contracts are exchange-traded, there is minimal counterparty credit risk to the Fund since the exchanges’ clearinghouse acts as counterparty to all exchange-traded futures and guarantees the futures contracts against default.
Master Netting Arrangements: The RIC, on behalf of the Fund, is subject to various Master Agreements, or netting arrangements, with select counterparties. These are agreements which a subadviser may have negotiated and entered into on behalf of all or a portion of the Fund. A master netting arrangement between the Fund and the counterparty permits the Fund to offset amounts payable by the Fund to the same counterparty against amounts to be received; and by the receipt of collateral from the counterparty by the Fund to cover the Fund’s exposure to the counterparty. However, there is no assurance that such mitigating factors are easily enforceable. In addition to master netting arrangements, the right to set-off exists when all the conditions are met such that each of the parties owes the other determinable amounts, the reporting party has the right to set-off the amount owed with the amount owed by the other party, the reporting party intends to set-off and the right of set-off is enforceable by law.
Securities Lending: The Fund lends its portfolio securities to banks and broker-dealers. The loans are secured by collateral at least equal to the market value of the securities loaned. Collateral pledged by each borrower is invested in an affiliated money market fund and is marked to market daily, based on the previous day’s market value, such that the value of the collateral exceeds the value of the loaned securities. In the event of significant appreciation in value of securities on loan on the last business day of the reporting period, the financial statements may reflect a collateral value that is less than the market value of the loaned securities. Such shortfall is remedied as described above. Loans are subject to termination at the option of the borrower or the Fund. Upon termination of the loan, the borrower will return to the Fund securities identical to the loaned securities. The remaining open loans of the securities lending transactions are considered overnight and continuous. Should the borrower of the securities fail financially, the Fund has the right to repurchase the securities in the open market using the collateral.
The Fund recognizes income, net of any rebate and securities lending agent fees, for lending its securities in the form of fees or interest on the investment of any cash received as collateral. The borrower receives all interest and dividends from the securities loaned and
PGIM Quant Solutions International Equity Fund 43
Notes to Financial Statements (continued)
such payments are passed back to the lender in amounts equivalent thereto, which are reflected in interest income or unaffiliated dividend income based on the nature of the payment on the Statement of Operations. The Fund also continues to recognize any unrealized gain (loss) in the market price of the securities loaned and on the change in the value of the collateral invested that may occur during the term of the loan. In addition, realized gain (loss) is recognized on changes in the value of the collateral invested upon liquidation of the collateral. Net earnings from securities lending are disclosed in the Statement of Operations.
Securities Transactions and Net Investment Income: Securities transactions are recorded on the trade date. Realized gains (losses) from investment and currency transactions are calculated on the specific identification method. Dividend income is recorded on the ex-date, or for certain foreign securities, when the Fund becomes aware of such dividends. Expenses are recorded on an accrual basis, which may require the use of certain estimates by management that may differ from actual. Net investment income or loss (other than class specific expenses and waivers, which are allocated as noted below) and unrealized and realized gains (losses) are allocated daily to each class of shares based upon the relative proportion of adjusted net assets of each class at the beginning of the day. Class specific expenses and waivers, where applicable, are charged to the respective share classes. Such class specific expenses and waivers include distribution fees and distribution fee waivers, shareholder servicing fees, transfer agent’s fees and expenses, registration fees and fee waivers and/or expense reimbursements, as applicable.
Taxes: It is the Fund’s policy to continue to meet the requirements of the Internal Revenue Code applicable to regulated investment companies and to distribute all of its taxable net investment income and capital gains, if any, to its shareholders. Therefore, no federal income tax provision is required. Withholding taxes on foreign dividends, interest and capital gains, if any, are recorded, net of reclaimable amounts, at the time the related income is earned.
The Fund is subject to foreign income taxes imposed by certain countries in which it invests. Additionally, capital gains realized upon disposition of securities issued in or by certain foreign countries are subject to capital gains tax imposed by those countries. All taxes are computed in accordance with the applicable foreign tax law, and, to the extent permitted, capital losses are used to offset capital gains. Taxes attributable to income are accrued by the Fund as a reduction of income. Current and deferred tax expense attributable to capital gains is reflected as a component of realized or change in unrealized gain/loss on securities in the accompanying financial statements. To the extent that the Fund has country specific capital loss carryforwards, such carryforwards are applied against net unrealized gains when determining the deferred tax liability. Any deferred tax liability incurred by the Fund is
44
included in either Other liabilities or Deferred tax liability on the accompanying Statement of Assets and Liabilities.
Dividends and Distributions: Dividends and distributions to shareholders, which are determined in accordance with federal income tax regulations and which may differ from GAAP, are recorded on the ex-date. Permanent book/tax differences relating to income and gain (loss) are reclassified between total distributable earnings (loss) and paid-in capital in excess of par, as appropriate. The chart below sets forth the expected frequency of dividend and capital gains distributions to shareholders. Various factors may impact the frequency of dividend distributions to shareholders, including but not limited to adverse market conditions or portfolio holding-specific events.
| | |
| | |
| Expected Distribution Schedule to Shareholders* | | Frequency |
Net Investment Income | | Annually |
Short-Term Capital Gains | | Annually |
Long-Term Capital Gains | | Annually |
| * | Under certain circumstances, the Fund may make more than one distribution of short-term and/or long-term capital gains during a fiscal year. |
Estimates: The preparation of financial statements requires management to make estimates and assumptions that affect the reported amounts and disclosures in the financial statements. Actual results could differ from those estimates.
The RIC, on behalf of the Fund, has a management agreement with the Manager pursuant to which it has responsibility for all investment advisory services and supervises the subadviser’s performance of such services, and pursuant to which it renders administrative services.
The Manager has entered into a subadvisory agreement with PGIM Quantitative Solutions LLC (“PGIM Quantitative Solutions” or the “subadviser”). The Manager pays for the services of PGIM Quantitative Solutions.
Fees payable under the management agreement are computed daily and paid monthly. For the reporting period ended October 31, 2022, the contractual and effective management fee rates were as follows:
| | | | |
| | |
| Contractual Management Rate | | Effective Management Fee, before any waivers and/or expense reimbursements | |
0.75% of average daily net assets up to $2 billion; | | | 0.75% | |
0.70% of average daily net assets from $2 billion to $5 billion; | | | | |
0.69% of average daily net assets over $5 billion | | | | |
The Manager has contractually agreed, through February 29, 2024, to limit total annual operating expenses after fee waivers and/or expense reimbursements. This contractual
PGIM Quant Solutions International Equity Fund 45
Notes to Financial Statements (continued)
waiver excludes interest, brokerage, taxes (such as income and foreign withholding taxes, stamp duty and deferred tax expenses), acquired fund fees and expenses, extraordinary expenses, and certain other Fund expenses such as dividend and interest expense and broker charges on short sales.
Where applicable, the Manager agrees to waive management fees or shared operating expenses on any share class to the same extent that it waives such expenses on any other share class. In addition, total annual operating expenses for Class R6 shares will not exceed total annual operating expenses for Class Z shares. Fees and/or expenses waived and/or reimbursed by the Manager for the purpose of preventing the expenses from exceeding a certain expense ratio limit may be recouped by the Manager within the same fiscal year during which such waiver/reimbursement is made if such recoupment can be realized without exceeding the expense limit in effect at the time of the recoupment for that fiscal year. The expense limitations attributable to each class are as follows:
| | |
| Class | | Expense Limitations |
| |
| A | | —% |
| |
| C | | — |
| |
| Z | | — |
| |
| R6 | | 0.78 |
The RIC, on behalf of the Fund, has a distribution agreement with Prudential Investment Management Services LLC (“PIMS”), which acts as the distributor of the Class A, Class C, Class Z and Class R6 shares of the Fund. The Fund compensates PIMS for distributing and servicing the Fund’s Class A and Class C shares, pursuant to the plans of distribution (the “Distribution Plans”), regardless of expenses actually incurred by PIMS.
Pursuant to the Distribution Plans, the Fund compensates PIMS for distribution related activities at an annual rate based on average daily net assets per class. The distribution fees are accrued daily and payable monthly.
The Fund’s annual gross and net distribution rate, where applicable, are as follows:
| | | | |
| | | |
| Class | | Gross Distribution Fee | | Net Distribution Fee |
| | |
A | | 0.30% | | 0.30% |
| | |
C | | 1.00 | | 1.00 |
| | |
Z | | N/A | | N/A |
| | |
R6 | | N/A | | N/A |
For the year ended October 31, 2022, PIMS received front-end sales charges (“FESL”) resulting from sales of certain class shares and contingent deferred sales charges (“CDSC”) imposed upon redemptions by certain shareholders. From these fees, PIMS paid such sales
46
charges to broker-dealers, who in turn paid commissions to salespersons and incurred other distribution costs. The sales charges are as follows where applicable:
| | | | | | | | |
| | | |
| Class | | FESL | | | CDSC | |
| | |
A | | $ | 26,762 | | | | $ 3 | |
| | |
C | | | — | | | | 495 | |
PGIM Investments, PIMS and PGIM Quantitative Solutions are indirect, wholly-owned subsidiaries of Prudential Financial, Inc. (“Prudential”).
| 4. | Other Transactions with Affiliates |
Prudential Mutual Fund Services LLC (“PMFS”), an affiliate of PGIM Investments and an indirect, wholly-owned subsidiary of Prudential, serves as the Fund’s transfer agent and shareholder servicing agent. Transfer agent’s fees and expenses in the Statement of Operations include certain out-of-pocket expenses paid to non-affiliates, where applicable.
The Fund may invest its overnight sweep cash in the PGIM Core Ultra Short Bond Fund (the “Core Fund”), and its securities lending cash collateral in the PGIM Institutional Money Market Fund (the “Money Market Fund”), each a fund of Prudential Investment Portfolios 2, registered under the 1940 Act and managed by PGIM Investments. PGIM Investments and/or its affiliates are paid fees or reimbursed for providing their services to the Core Fund and the Money Market Fund. In addition to the realized and unrealized gains on investments in the Core Fund and Money Market Fund, earnings from such investments are disclosed on the Statement of Operations as “Affiliated dividend income” and “Income from securities lending, net”, respectively. Effective January 2022, the Fund changed its overnight cash sweep vehicle from the Core Fund to an unaffiliated money market fund.
The Fund may enter into certain securities purchase or sale transactions under Board approved Rule 17a-7 procedures. Rule 17a-7 is an exemptive rule under the 1940 Act, that subject to certain conditions, permits purchase and sale transactions among affiliated investment companies, or between an investment company and a person that is affiliated solely by reason of having a common (or affiliated) investment adviser, common directors/trustees, and/or common officers. For the year ended October 31, 2022, no 17a-7 transactions were entered into by the Fund.
The aggregate cost of purchases and proceeds from sales of portfolio securities (excluding short-term investments and U.S. Government securities) for the reporting period ended October 31, 2022, were as follows:
| | |
| | |
| Cost of Purchases | | Proceeds from Sales |
$210,074,068 | | $229,163,303 |
PGIM Quant Solutions International Equity Fund 47
Notes to Financial Statements (continued)
A summary of the cost of purchases and proceeds from sales of shares of affiliated mutual funds for the year ended October 31, 2022, is presented as follows:
| | | | | | | | | | | | | | | | | | | | | | | | | | | | |
| | | | | | | | |
Value, Beginning of Year | | Cost of
Purchases | | | Proceeds
from Sales | | | Change in
Unrealized
Gain
(Loss) | | | Realized
Gain
(Loss) | | | Value,
End of Year | | | Shares,
End of Year | | | Income | |
| | | | |
Short-Term Investments - Affiliated Mutual Funds: | | | | | | | | | | | | | | | | | |
| | | | | |
PGIM Core Ultra Short Bond Fund(1)(wa) | | | | | | | | | | | | | | | | | | | | | |
$1,978,232 | | | $14,049,552 | | | | $16,027,784 | | | | $— | | | | $ — | | | | $ — | | | | — | | | | $ 922 | |
| | | | | |
PGIM Institutional Money Market Fund(1)(b)(wa) | | | | | | | | | | | | | | | | | | | | | |
691,865 | | | 42,392,759 | | | | 41,370,406 | | | | 1 | | | | (422) | | | | 1,713,797 | | | | 1,715,341 | | | | 4,028(2) | |
$2,670,097 | | | $56,442,311 | | | | $57,398,190 | | | | $ 1 | | | | $(422) | | | | $1,713,797 | | | | | | | | $4,950 | |
| (1) | The Fund did not have any capital gain distributions during the reporting period. |
| (2) | The amount, or a portion thereof, represents the affiliated securities lending income shown on the Statement of Operations. |
| (b) | Represents security, or portion thereof, purchased with cash collateral received for securities on loan and includes dividend reinvestment. |
| (wa) | PGIM Investments LLC, the manager of the Fund, also serves as manager of the PGIM Core Ultra Short Bond Fund and PGIM Institutional Money Market Fund, if applicable. |
| 6. | Distributions and Tax Information |
Distributions to shareholders, which are determined in accordance with federal income tax regulations and which may differ from GAAP, are recorded on the ex-date.
For the year ended October 31, 2022, the tax character of dividends paid by the Fund were $7,500,340 of ordinary income and $18,404,639 of long-term capital gains. For the year ended October 31, 2021, the tax character of dividends paid by the Fund was $3,118,256 of ordinary income.
As of October 31, 2022, the accumulated undistributed earnings on a tax basis was $5,741,191 of ordinary income.
The United States federal income tax basis of the Fund’s investments and the net unrealized depreciation as of October 31, 2022 were as follows:
| | | | | | |
| | | | |
| Tax Basis | | Gross
Unrealized
Appreciation | | Gross
Unrealized
Depreciation | | Net
Unrealized
Depreciation |
| $187,114,576 | | $15,384,951 | | $(33,965,812) | | $(18,580,861) |
48
The difference between GAAP and tax basis were primarily due to deferred losses on wash sales, investments in passive foreign investment companies, corporate spin-off adjustments and other GAAP to tax differences.
For federal income tax purposes, the Fund had a capital loss carryforward as of October 31, 2022 of approximately $20,088,000 which can be carried forward for an unlimited period. No capital gains distributions are expected to be paid to shareholders until net gains have been realized in excess of such losses.
The Manager has analyzed the Fund’s tax positions taken on federal, state and local income tax returns for all open tax years and has concluded that no provision for income tax is required in the Fund’s financial statements for the current reporting period. Since tax authorities can examine previously filed tax returns, the Fund’s U.S. federal and state tax returns for each of the four fiscal years up to the most recent fiscal year ended October 31, 2022 are subject to such review.
The Fund offers Class A, Class C, Class Z and Class R6 shares. Class A shares are sold with a maximum front-end sales charge of 5.50%. Investors who purchase $1 million or more of Class A shares and sell these shares within 12 months of purchase are subject to a CDSC of 1%, although they are not subject to an initial sales charge. The Class A CDSC is waived for certain retirement and/or benefit plans. A special exchange privilege is also available for shareholders who qualified to purchase Class A shares at net asset value. Class C shares are sold with a CDSC of 1% on sales made within 12 months of purchase. Class C shares will automatically convert to Class A shares on a monthly basis approximately eight years (ten years prior to January 22, 2021) after purchase. Class Z and Class R6 shares are not subject to any sales or redemption charges and are available exclusively for sale to a limited group of investors.
Under certain circumstances, an exchange may be made from specified share classes of the Fund to one or more other share classes of the Fund as presented in the table of transactions in shares of common stock, below.
The RIC is authorized to issue 10,225,000,000 shares of common stock, $0.00001 par value per share, 700,000,000 of which are designated as shares of the Fund. The authorized shares of the Fund are currently classified and designated as follows:
| | |
| Class | | Number of Shares |
A | | 100,000,000 |
B | | 5,000,000 |
C | | 100,000,000 |
Z | | 180,000,000 |
T | | 135,000,000 |
R6 | | 180,000,000 |
PGIM Quant Solutions International Equity Fund 49
Notes to Financial Statements (continued)
The Fund currently does not have any Class B or Class T shares outstanding.
As of October 31, 2022, Prudential, through its affiliated entities, including affiliated funds (if applicable), owned shares of the Fund as follows:
| | | | |
| Class | | Number of Shares | | Percentage of Outstanding Shares |
A | | 32,665 | | 0.2% |
Z | | 63,274 | | 3.2 |
R6 | | 3,543,191 | | 56.5 |
At the reporting period end, the number of shareholders holding greater than 5% of the Fund are as follows:
| | | | |
| | | Number of Shareholders | | Percentage of Outstanding Shares |
Affiliated | | 1 | | 12.3% |
Unaffiliated | | 3 | | 32.5 |
Transactions in shares of common stock were as follows:
| | | | | | | | |
| | | |
| Share Class | | Shares | | | Amount | |
| | |
Class A | | | | | | | | |
Year ended October 31, 2022: | | | | | | | | |
Shares sold | | | 404,803 | | | $ | 2,911,633 | |
Shares issued in reinvestment of dividends and distributions | | | 2,336,663 | | | | 17,408,142 | |
Shares purchased | | | (2,591,505 | ) | | | (18,139,350 | ) |
Net increase (decrease) in shares outstanding before conversion | | | 149,961 | | | | 2,180,425 | |
Shares issued upon conversion from other share class(es) | | | 42,923 | | | | 299,039 | |
Shares purchased upon conversion into other share class(es) | | | (69,077 | ) | | | (504,976 | ) |
Net increase (decrease) in shares outstanding | | | 123,807 | | | $ | 1,974,488 | |
| | |
Year ended October 31, 2021: | | | | | | | | |
Shares sold | | | 522,326 | | | $ | 4,350,877 | |
Shares issued in reinvestment of dividends and distributions | | | 303,876 | | | | 2,355,040 | |
Shares purchased | | | (2,142,395 | ) | | | (17,663,059 | ) |
Net increase (decrease) in shares outstanding before conversion | | | (1,316,193 | ) | | | (10,957,142 | ) |
Shares issued upon conversion from other share class(es) | | | 76,135 | | | | 638,374 | |
Shares purchased upon conversion into other share class(es) | | | (83,956 | ) | | | (687,747 | ) |
Net increase (decrease) in shares outstanding | | | (1,324,014 | ) | | $ | (11,006,515 | ) |
50
| | | | | | | | |
| | | |
| Share Class | | Shares | | | Amount |
| | |
Class C | | | | | | | | |
Year ended October 31, 2022: | | | | | | | | |
Shares sold | | | 33,493 | | | $ | 238,119 | |
Shares issued in reinvestment of dividends and distributions | | | 30,506 | | | | 215,681 | |
Shares purchased | | | (66,948 | ) | | | (415,404 | ) |
Net increase (decrease) in shares outstanding before conversion | | | (2,949 | ) | | | 38,396 | |
Shares purchased upon conversion into other share class(es) | | | (40,820 | ) | | | (272,886 | ) |
Net increase (decrease) in shares outstanding | | | (43,769 | ) | | $ | (234,490 | ) |
| | |
Year ended October 31, 2021: | | | | | | | | |
Shares sold | | | 63,864 | | | $ | 500,477 | |
Shares issued in reinvestment of dividends and distributions | | | 1,308 | | | | 9,676 | |
Shares purchased | | | (78,344 | ) | | | (603,675 | ) |
Net increase (decrease) in shares outstanding before conversion | | | (13,172 | ) | | | (93,522 | ) |
Shares purchased upon conversion into other share class(es) | | | (72,437 | ) | | | (578,256 | ) |
Net increase (decrease) in shares outstanding | | | (85,609 | ) | | $ | (671,778 | ) |
| | |
Class Z | | | | | | | | |
Year ended October 31, 2022: | | | | | | | | |
Shares sold | | | 730,314 | | | $ | 5,112,983 | |
Shares issued in reinvestment of dividends and distributions | | | 223,258 | | | | 1,676,667 | |
Shares purchased | | | (918,453 | ) | | | (6,181,648 | ) |
Net increase (decrease) in shares outstanding before conversion | | | 35,119 | | | | 608,002 | |
Shares issued upon conversion from other share class(es) | | | 58,857 | | | | 440,756 | |
Shares purchased upon conversion into other share class(es) | | | (5,659 | ) | | | (33,978 | ) |
Net increase (decrease) in shares outstanding | | | 88,317 | | | $ | 1,014,780 | |
| | |
Year ended October 31, 2021: | | | | | | | | |
Shares sold | | | 775,378 | | | $ | 6,613,085 | |
Shares issued in reinvestment of dividends and distributions | | | 34,694 | | | | 270,616 | |
Shares purchased | | | (312,006 | ) | | | (2,648,533 | ) |
Net increase (decrease) in shares outstanding before conversion | | | 498,066 | | | | 4,235,168 | |
Shares issued upon conversion from other share class(es) | | | 77,788 | | | | 642,192 | |
Shares purchased upon conversion into other share class(es) | | | (587,122 | ) | | | (5,149,861 | ) |
Net increase (decrease) in shares outstanding | | | (11,268 | ) | | $ | (272,501 | ) |
| | |
Class R6 | | | | | | | | |
Year ended October 31, 2022: | | | | | | | | |
Shares sold | | | 1,776,069 | | | $ | 12,775,571 | |
Shares issued in reinvestment of dividends and distributions | | | 838,529 | | | | 6,297,350 | |
Shares purchased | | | (3,192,802 | ) | | | (21,372,410 | ) |
Net increase (decrease) in shares outstanding before conversion | | | (578,204 | ) | | | (2,299,489 | ) |
Shares issued upon conversion from other share class(es) | | | 10,841 | | | | 72,045 | |
Net increase (decrease) in shares outstanding | | | (567,363 | ) | | $ | (2,227,444 | ) |
PGIM Quant Solutions International Equity Fund 51
Notes to Financial Statements (continued)
| | | | | | | | |
| | | |
| Share Class | | Shares | | | Amount | |
| | |
Year ended October 31, 2021: | | | | | | | | |
Shares sold | | | 5,725,833 | | | $ | 49,861,170 | |
Shares issued in reinvestment of dividends and distributions | | | 56,384 | | | | 439,796 | |
Shares purchased | | | (2,282,912 | ) | | | (19,402,742 | ) |
Net increase (decrease) in shares outstanding before conversion | | | 3,499,305 | | | | 30,898,224 | |
Shares issued upon conversion from other share class(es) | | | 584,743 | | | | 5,135,298 | |
Net increase (decrease) in shares outstanding | | | 4,084,048 | | | $ | 36,033,522 | |
The RIC, on behalf of the Fund, along with other affiliated registered investment companies (the “Participating Funds”), is a party to a Syndicated Credit Agreement (“SCA”) with a group of banks. The purpose of the SCA is to provide an alternative source of temporary funding for capital share redemptions. The table below provides details of the current SCA in effect at the reporting period-end as well as the prior SCA.
| | | | | | |
| | | | |
| | | Current SCA | | | | Prior SCA |
Term of Commitment | | 9/30/2022 - 9/28/2023 | | | | 10/1/2021 – 9/29/2022 |
Total Commitment | | $ 1,200,000,000 | | | | $ 1,200,000,000 |
Annualized Commitment Fee on the Unused Portion of the SCA | | 0.15% | | | | 0.15% |
Annualized Interest Rate on Borrowings | | 1.00% plus the higher of (1) the effective federal funds rate, (2) the daily SOFR rate plus 0.10% or (3) zero
percent | | | | 1.20% plus the higher of (1) the effective federal funds rate, (2) the one-month LIBOR rate or (3) zero percent |
Certain affiliated registered investment companies that are parties to the SCA include portfolios that are subject to a predetermined mathematical formula used to manage certain benefit guarantees offered under variable annuity contracts. The formula may result in large scale asset flows into and out of these portfolios. Consequently, these portfolios may be more likely to utilize the SCA for purposes of funding redemptions. It may be possible for those portfolios to fully exhaust the committed amount of the SCA, thereby requiring the Manager to allocate available funding per a Board-approved methodology designed to treat the Participating Funds in the SCA equitably.
The Fund utilized the SCA during the year ended October 31, 2022. The average daily balance for the 12 days that the Fund had loans outstanding during the period was approximately $547,000, borrowed at a weighted average interest rate of 2.92%. The maximum loan outstanding amount during the period was $2,042,000. At October 31, 2022, the Fund did not have an outstanding loan amount.
52
| 9. | Risks of Investing in the Fund |
The Fund’s risks include, but are not limited to, some or all of the risks discussed below. For further information on the Fund’s risks, please refer to the Fund’s Prospectus and Statement of Additional Information.
Active Trading Risk: The Fund actively and frequently trades its portfolio securities. High portfolio turnover results in higher transaction costs, which can affect the Fund’s performance and have adverse tax consequences. In addition, high portfolio turnover may also mean that a proportionately greater amount of distributions to shareholders will be taxed as ordinary income rather than long-term capital gains compared to investment companies with lower portfolio turnover.
Core Style Risk: The Fund’s core investment style may subject the Fund to risks of both value and growth investing. The portion of the Fund’s portfolio that makes investments pursuant to a growth strategy may be subject to above-average fluctuations as a result of seeking higher than average capital growth. The portion of the Fund’s portfolio that makes investments pursuant to a value strategy may be subject to the risk that the market may not recognize a security’s intrinsic value for long periods of time or at all, or that a stock judged to be undervalued may actually be appropriately priced or overvalued. Issuers of value stocks may have experienced adverse business developments or may be subject to special risks that have caused the stock to be out of favor. If the Fund’s assessment of market conditions or a company’s value is inaccurate, the Fund could suffer losses or produce poor performance relative to other funds. Historically, growth stocks have performed best during later stages of economic expansion and value stocks have performed best during periods of economic recovery. Therefore, both styles may over time go in and out of favor with the markets. At times when a style is out of favor, that portion of the portfolio may lag the other portion of the portfolio, which may cause the Fund to underperform the market in general, its benchmark and other mutual funds. Growth and value stocks have historically produced similar long-term results, though each category has periods when it outperforms the other.
Currency Risk: The Fund’s net asset value could decline as a result of changes in exchange rates, which could adversely affect the Fund’s investments in currencies, or in securities that trade in, and receive revenues related to, currencies, or in derivatives that provide exposure to currencies. Certain foreign countries may impose restrictions on the ability of issuers of foreign securities to make payment of principal and interest or dividends to investors located outside the country, due to blockage of foreign currency exchanges or otherwise.
Economic and Market Events Risk: Events in the U.S. and global financial markets, including actions taken by the U.S. Federal Reserve or foreign central banks to stimulate or stabilize economic growth or the functioning of the securities markets, or otherwise reduce inflation may at times result in unusually high market volatility, which could negatively impact performance. Governmental efforts to curb inflation often have negative effects on the level of economic activity. Relatively reduced liquidity in credit and fixed income markets could adversely affect issuers worldwide.
PGIM Quant Solutions International Equity Fund 53
Notes to Financial Statements (continued)
Emerging Markets Risk: The risks of foreign investments are greater for investments in or exposed to emerging markets. Emerging market countries typically have economic and political systems that are less fully developed, and can be expected to be less stable, than those of more developed countries. For example, the economies of such countries can be subject to rapid and unpredictable rates of inflation or deflation. Low trading volumes may result in a lack of liquidity and price volatility. Emerging market countries may have policies that restrict investment by non-U.S. investors, or that prevent non-U.S. investors from withdrawing their money at will.
The Fund may invest in some emerging markets that subject it to risks such as those associated with illiquidity, custody of assets, different settlement and clearance procedures and asserting legal title under a developing legal and regulatory regime to a greater degree than in developed markets or even in other emerging markets.
Equity and Equity-Related Securities Risk: Equity and equity-related securities may be subject to changes in value, and their values may be more volatile than those of other asset classes. In addition to an individual security losing value, the value of the equity markets or a sector in which the Fund invests could go down. Different parts of a market can react differently to adverse issuer, market, regulatory, political and economic developments.
Foreign Securities Risk: Investments in securities of non-U.S. issuers (including those denominated in U.S. dollars) may involve more risk than investing in securities of U.S. issuers. Foreign political, economic and legal systems, especially those in developing and emerging market countries, may be less stable and more volatile than in the United States. Foreign legal systems generally have fewer regulatory requirements than the U.S. legal system, particularly those of emerging markets. In general, less information is publicly available with respect to non-U.S. companies than U.S. companies. Non-U.S. companies generally are not subject to the same accounting, auditing, and financial reporting standards as are U.S. companies. Additionally, the changing value of foreign currencies and changes in exchange rates could also affect the value of the assets the Fund holds and the Fund’s performance. Certain foreign countries may impose restrictions on the ability of issuers of foreign securities to make payment of principal and interest or dividends to investors located outside the country, due to blockage of foreign currency exchanges or otherwise. Investments in emerging markets are subject to greater volatility and price declines.
In addition, the Fund’s investments in non-U.S. securities may be subject to the risks of nationalization or expropriation of assets, imposition of currency exchange controls or restrictions on the repatriation of non-U.S. currency, confiscatory taxation and adverse diplomatic developments. Special U.S. tax considerations may apply.
54
Geographic Concentration Risk: The Fund’s performance may be closely tied to the market, economic, political, regulatory or other conditions in the countries or regions in which the Fund invests. This can result in more pronounced risks based upon conditions that impact one or more countries or regions more or less than other countries or regions.
Increase in Expenses Risk: Your actual cost of investing in the Fund may be higher than the expenses shown in the expense table in the Fund’s prospectus for a variety of reasons. For example, expense ratios may be higher than those shown if average net assets decrease. Net assets are more likely to decrease and Fund expense ratios are more likely to increase when markets are volatile. Active and frequent trading of Fund securities can increase expenses.
Large Shareholder and Large Scale Redemption Risk: Certain individuals, accounts, funds (including funds affiliated with the Manager) or institutions, including the Manager and its affiliates, may from time to time own or control a substantial amount of the Fund’s shares. There is no requirement that these entities maintain their investment in the Fund. There is a risk that such large shareholders or that the Fund’s shareholders generally may redeem all or a substantial portion of their investments in the Fund in a short period of time, which could have a significant negative impact on the Fund’s NAV, liquidity, and brokerage costs. Large redemptions could also result in tax consequences to shareholders and impact the Fund’s ability to implement its investment strategy. The Fund’s ability to pursue its investment objective after one or more large scale redemptions may be impaired and, as a result, the Fund may invest a larger portion of its assets in cash or cash equivalents.
Liquidity Risk: Liquidity risk is the risk that the Fund could not meet requests to redeem shares issued by the Fund without significant dilution of remaining investors’ interests in the Fund. The Fund may invest in instruments that trade in lower volumes and are more illiquid than other investments. If the Fund is forced to sell these investments to pay redemption proceeds or for other reasons, the Fund may lose money. In addition, when there is no willing buyer and investments cannot be readily sold at the desired time or price, the Fund may have to accept a lower price or may not be able to sell the instrument at all. An inability to sell a portfolio position can adversely affect the Fund’s value or prevent the Fund from being able to take advantage of other investment opportunities.
Management Risk: Actively managed funds are subject to management risk. The subadviser will apply investment techniques and risk analyses in making investment decisions for the Fund, but the subadviser’s judgments about the attractiveness, value or market trends affecting a particular security, industry or sector or about market movements may be incorrect. Additionally, the investments selected for the Fund may underperform the markets in general, the Fund’s benchmark and other funds with similar investment objectives.
Market Capitalization Risk: The Fund may invest in companies of any market capitalization. Generally, the stock prices of small- and mid-cap companies are less stable than the prices of large-cap stocks and may present greater risks. Large capitalization companies as a
PGIM Quant Solutions International Equity Fund 55
Notes to Financial Statements (continued)
group could fall out of favor with the market, causing the Fund to underperform compared to investments that focus on smaller capitalized companies.
Market Disruption and Geopolitical Risks: Market disruption can be caused by economic, financial or political events and factors, including but not limited to, international wars or conflicts (including Russia’s military invasion of Ukraine), geopolitical developments (including trading and tariff arrangements, sanctions and cybersecurity attacks), instability in regions such as Asia, Eastern Europe and the Middle East, terrorism, natural disasters and public health epidemics (including the outbreak of COVID-19 globally).
The extent and duration of such events and resulting market disruptions cannot be predicted, but could be substantial and could magnify the impact of other risks to the Fund. These and other similar events could adversely affect the U.S. and foreign financial markets and lead to increased market volatility, reduced liquidity in the securities markets, significant negative impacts on issuers and the markets for certain securities and commodities and/or government intervention. They may also cause short- or long-term economic uncertainties in the United States and worldwide. As a result, whether or not the Fund invests in securities of issuers located in or with significant exposure to the countries directly affected, the value and liquidity of the Fund’s investments may be negatively impacted. Further, due to closures of certain markets and restrictions on trading certain securities, the value of certain securities held by the Fund could be significantly impacted, which could lead to such securities being valued at zero.
COVID-19 and the related governmental and public responses have had and may continue to have an impact on the Fund’s investments and net asset value and have led and may continue to lead to increased market volatility and the potential for illiquidity in certain classes of securities and sectors of the market. They have also had and may continue to result in periods of business disruption, business closures, inability to obtain raw materials, supplies and component parts, and reduced or disrupted operations for the issuers in which the Fund invests. The occurrence, reoccurrence and pendency of public health epidemics could adversely affect the economies and financial markets either in specific countries or worldwide.
Market Risk: Securities markets may be volatile and the market prices of the Fund’s securities may decline. Securities fluctuate in price based on changes in an issuer’s financial condition and overall market and economic conditions. If the market prices of the securities owned by the Fund fall, the value of your investment in the Fund will decline.
56
Report of Independent Registered Public Accounting Firm
To the Board of Directors of Prudential World Fund, Inc. and Shareholders of PGIM Quant Solutions International Equity Fund
Opinion on the Financial Statements
We have audited the accompanying statement of assets and liabilities, including the schedule of investments, of PGIM Quant Solutions International Equity Fund (one of the funds constituting Prudential World Fund, Inc., referred to hereafter as the “Fund”) as of October 31, 2022, the related statement of operations for the year ended October 31, 2022, the statements of changes in net assets for each of the two years in the period ended October 31, 2022, including the related notes, and the financial highlights for each of the three years in the period ended October 31, 2022 (collectively referred to as the “financial statements”). In our opinion, the financial statements present fairly, in all material respects, the financial position of the Fund as of October 31, 2022, the results of its operations for the year then ended, the changes in its net assets for each of the two years in the period ended October 31 2022 and the financial highlights for each of the three years in the period ended October 31, 2022 in conformity with accounting principles generally accepted in the United States of America.
The financial statements of the Fund as of and for the year ended October 31, 2019 and the financial highlights for each of the periods ended on or prior to October 31, 2019 (not presented herein, other than the financial highlights) were audited by other auditors whose report dated December 16, 2019 expressed an unqualified opinion on those financial statements and financial highlights.
Basis for Opinion
These financial statements are the responsibility of the Fund’s management. Our responsibility is to express an opinion on the Fund’s financial statements based on our audits. We are a public accounting firm registered with the Public Company Accounting Oversight Board (United States) (PCAOB) and are required to be independent with respect to the Fund in accordance with the U.S. federal securities laws and the applicable rules and regulations of the Securities and Exchange Commission and the PCAOB.
We conducted our audits of these financial statements in accordance with the standards of the PCAOB. Those standards require that we plan and perform the audit to obtain reasonable assurance about whether the financial statements are free of material misstatement, whether due to error or fraud.
Our audits included performing procedures to assess the risks of material misstatement of the financial statements, whether due to error or fraud, and performing procedures that respond to those risks. Such procedures included examining, on a test basis, evidence regarding the amounts and disclosures in the financial statements. Our audits also included evaluating the accounting principles used and significant estimates made by management, as well as evaluating the overall presentation of the financial statements. Our procedures included confirmation of securities owned as of October 31, 2022 by correspondence with the custodian, transfer agent and brokers; when replies were not received from brokers, we performed other auditing procedures. We believe that our audits provide a reasonable basis for our opinion.
/s/ PricewaterhouseCoopers LLP
New York, New York
December 16, 2022
We have served as the auditor of one or more investment companies in the PGIM Retail Funds complex since 2020.
PGIM Quant Solutions International Equity Fund 57
Tax Information (unaudited)
We are advising you that during the fiscal year ended October 31, 2022, the Fund reports the maximum amount allowed per share, but not less than $0.63 for Class A, C, Z, and R6 shares as a capital gain distribution in accordance with Section 852(b)(3)(C) of the Internal Revenue Code.
For the year ended October 31, 2022, the Fund reports, the maximum amount allowable under Section 854 of the Internal Revenue Code, but not less than, the following percentage of the ordinary income dividends paid as qualified dividend income (QDI):
| | |
| | |
| Fund | | QDI |
| |
PGIM Quant Solutions International Equity Fund | | 92.74% |
For the year ended October 31, 2022, the Fund made an election to pass through the maximum amount of the portion of the ordinary income dividends paid derived from foreign source income as well as any foreign taxes paid by the Fund in accordance with Section 853 of the Internal Revenue Code of the following amounts: $817,849 foreign tax credit from recognized foreign source income of $11,333,555.
In January 2023, you will be advised on IRS Form 1099-DIV or substitute 1099-DIV as to the federal tax status of dividends received by you in calendar year 2022.
58
INFORMATION ABOUT BOARD MEMBERS AND OFFICERS (unaudited)
Information about Board Members and Officers of the Fund is set forth below. Board Members who are not deemed to be “interested persons” of the Fund, as defined in the 1940 Act, are referred to as “Independent Board Members.” Board Members who are deemed to be “interested persons” of the Fund are referred to as “Interested Board Members.” The Board Members are responsible for the overall supervision of the operations of the Fund and perform the various duties imposed on the directors of investment companies by the 1940 Act. The Board in turn elects the Officers, who are responsible for administering the day-to-day operations of the Fund.
| | | | | | |
| | | |
| Independent Board Members | | | | |
| | | | |
Name Year of Birth Position(s) Portfolios Overseen | | Principal Occupation(s) During Past Five Years | | Other Directorships Held During Past Five Years | | Length of Board Service |
| | | | |
Ellen S. Alberding 1958 Board Member Portfolios Overseen: 97 | | President and Board Member, The Joyce Foundation (charitable foundation) (since 2002); formerly Vice Chair, City Colleges of Chicago (community college system) (2011-2015); Trustee, National Park Foundation (charitable foundation for national park system) (2009-2018); Trustee, Economic Club of Chicago (2009-2016); Trustee, Loyola University (since 2018). | | None. | | Since September 2013 |
| | | | |
Kevin J. Bannon 1952 Board Member Portfolios Overseen: 97 | | Retired; formerly Managing Director (April 2008-May 2015) and Chief Investment Officer (October 2008-November 2013) of Highmount Capital LLC (registered investment adviser); formerly Executive Vice President and Chief Investment Officer (April 1993-August 2007) of Bank of New York Company; President (May 2003-May 2007) of BNY Hamilton Family of Mutual Funds. | | Director of Urstadt Biddle Properties (equity real estate investment trust) (since September 2008). | | Since July 2008 |
PGIM Quant Solutions International Equity Fund
| | | | | | |
| | | |
| Independent Board Members | | | | |
| | | | |
Name Year of Birth Position(s) Portfolios Overseen | | Principal Occupation(s) During Past Five Years | | Other Directorships Held During Past Five Years | | Length of Board Service |
| | | | |
Linda W. Bynoe 1952 Board Member Portfolios Overseen: 94 | | President and Chief Executive Officer (since March 1995) and formerly Chief Operating Officer (December 1989-February 1995) of Telemat Limited LLC (formerly Telemat Ltd) (management consulting); formerly Vice President (January 1985-June 1989) at Morgan Stanley & Co. (broker-dealer). | | Trustee of Equity Residential (residential real estate) (since December 2009); Director of Northern Trust Corporation (financial services) (since April 2006); formerly Director of Anixter International, Inc. (communication products distributor) (January 2006-June 2020). | | Since March 2005 |
| | | | |
Barry H. Evans 1960 Board Member Portfolios Overseen: 96 | | Retired; formerly President (2005-2016), Global Chief Operating Officer (2014-2016), Chief Investment Officer - Global Head of Fixed Income (1998-2014), and various portfolio manager roles (1986-2006), Manulife Asset Management (asset management). | | Formerly Director, Manulife Trust Company (2011-2018); formerly Director, Manulife Asset Management Limited (2015-2017); formerly Chairman of the Board of Directors of Manulife Asset Management U.S. (2005-2016); formerly Chairman of the Board, Declaration Investment Management and Research (2008-2016). | | Since September 2017 |
| | | | |
Keith F. Hartstein 1956 Board Member & Independent Chair Portfolios Overseen: 97 | | Retired; Member (November 2014-September 2022) of the Governing Council of the Independent Directors Council (IDC) (organization of independent mutual fund directors); formerly Executive Committee of the IDC Board of Governors (October 2019-December 2021); formerly President and Chief Executive Officer (2005-2012), Senior Vice President (2004-2005), Senior Vice President of Sales and Marketing (1997-2004), and various executive management positions (1990-1997), John Hancock Funds, LLC (asset management); Chairman, Investment Company Institute’s Sales Force Marketing Committee (2003-2008). | | None. | | Since September 2013 |
Visit our website at pgim.com/investments
| | | | | | |
| | | |
| Independent Board Members | | | | |
| | | | |
Name Year of Birth Position(s) Portfolios Overseen | | Principal Occupation(s) During Past Five Years | | Other Directorships Held During Past Five Years | | Length of Board Service |
| | | | |
Laurie Simon Hodrick 1962 Board Member Portfolios Overseen: 93 | | A. Barton Hepburn Professor Emerita of Economics in the Faculty of Business, Columbia Business School (since 2018); Visiting Fellow at the Hoover Institution, Stanford University (since 2015); Sole Member, ReidCourt LLC (since 2008) (a consulting firm); formerly Visiting Professor of Law, Stanford Law School (2015-2021); formerly A. Barton Hepburn Professor of Economics in the Faculty of Business, Columbia Business School (1996-2017); formerly Managing Director, Global Head of Alternative Investment Strategies, Deutsche Bank (2006-2008). | | Independent Director, Andela (since January 2022) (global talent network); Independent Director, Roku (since December 2020) (communication services); formerly Independent Director, Synnex Corporation (2019-2021) (information technology); formerly Independent Director, Kabbage, Inc. (2018-2020) (financial services); formerly Independent Director, Corporate Capital Trust (2017-2018) (a business development company). | | Since September 2017 |
| | | | |
Brian K. Reid 1961 Board Member Portfolios Overseen: 96 | | Retired; formerly Chief Economist for the Investment Company Institute (ICI) (2005-2017); formerly Senior Economist and Director of Industry and Financial Analysis at the ICI (1998-2004); formerly Senior Economist, Industry and Financial Analysis at the ICI (1996-1998); formerly Staff Economist at the Federal Reserve Board (1989-1996); Director, ICI Mutual Insurance Company (2012-2017). | | None. | | Since March 2018 |
PGIM Quant Solutions International Equity Fund
| | | | | | |
| | | |
| Independent Board Members | | | | |
| | | | |
Name Year of Birth Position(s) Portfolios Overseen | | Principal Occupation(s) During Past Five Years | | Other Directorships Held During Past Five Years | | Length of Board Service |
| | | | |
Grace C. Torres 1959 Board Member Portfolios Overseen: 96 | | Retired; formerly Treasurer and Principal Financial and Accounting Officer of the PGIM Funds, Target Funds, Advanced Series Trust, Prudential Variable Contract Accounts and The Prudential Series Fund (1998-June 2014); Assistant Treasurer (March 1999-June 2014) and Senior Vice President (September 1999-June 2014) of PGIM Investments LLC; Assistant Treasurer (May 2003-June 2014) and Vice President (June 2005-June 2014) of AST Investment Services, Inc.; Senior Vice President and Assistant Treasurer (May 2003-June 2014) of Prudential Annuities Advisory Services, Inc. | | Director (since January 2018) of OceanFirst Financial Corp. and OceanFirst Bank; formerly Director (July 2015-January 2018) of Sun Bancorp, Inc. N.A. and Sun National Bank. | | Since November 2014 |
Visit our website at pgim.com/investments
| | | | | | |
| | | |
| Interested Board Members | | | | |
| | | | |
Name Year of Birth Position(s) Portfolios Overseen | | Principal Occupation(s) During Past Five Years | | Other Directorships Held During Past Five Years | | Length of Board Service |
| | | | |
Stuart S. Parker 1962 Board Member & President Portfolios Overseen: 96 | | President, Chief Executive Officer, Chief Operating Officer and Officer in Charge of PGIM Investments LLC (formerly known as Prudential Investments LLC) (since January 2012); President and Principal Executive Officer (“PEO”) (since September 2022) of the PGIM Private Credit Fund; President and PEO (since March 2022) of the PGIM Private Real Estate Fund, Inc.; formerly Executive Vice President of Jennison Associates LLC and Head of Retail Distribution of PGIM Investments LLC (June 2005-December 2011); Investment Company Institute - Board of Governors (since May 2012). | | None. | | Since January 2012 |
| | | | |
Scott E. Benjamin 1973 Board Member & Vice President Portfolios Overseen: 97 | | Executive Vice President (since May 2009) of PGIM Investments LLC; Vice President (since June 2012) of Prudential Investment Management Services LLC; Executive Vice President (since September 2009) of AST Investment Services, Inc.; Senior Vice President of Product Development and Marketing, PGIM Investments (since February 2006); Vice President (since September 2022) of the PGIM Private Credit Fund; Vice President (since March 2022) of the PGIM Private Real Estate Fund, Inc.; formerly Vice President of Product Development and Product Management, PGIM Investments LLC (2003-2006). | | None. | | Since March 2010 |
PGIM Quant Solutions International Equity Fund
| | | | | | |
| | | |
| Fund Officers(a) | | | | |
| | | |
Name Year of Birth Fund Position | | Principal Occupation(s) During Past Five Years | | Length of Service as Fund Officer |
| | | |
Claudia DiGiacomo 1974 Chief Legal Officer | | Chief Legal Officer (since September 2022) of the PGIM Private Credit Fund; Chief Legal Officer (since July 2022) of the PGIM Private Real Estate Fund, Inc.; Chief Legal Officer, Executive Vice President and Secretary of PGIM Investments LLC (since August 2020); Chief Legal Officer of Prudential Mutual Fund Services LLC (since August 2020); Chief Legal Officer of PIFM Holdco, LLC (since August 2020); Vice President and Corporate Counsel (since January 2005) of Prudential; and Corporate Counsel of AST Investment Services, Inc. (since August 2020); formerly Vice President and Assistant Secretary of PGIM Investments LLC (2005-2020); formerly Associate at Sidley Austin Brown & Wood LLP (1999-2004). | | Since December 2005 |
| | | |
Isabelle Sajous 1976 Chief Compliance Officer | | Chief Compliance Officer (since April 2022) of PGIM Investments LLC, the PGIM Funds, Target Funds, PGIM ETF Trust, PGIM Global High Yield Fund, Inc., PGIM High Yield Bond Fund, Inc., PGIM Short Duration High Yield Opportunities Fund, Advanced Series Trust, The Prudential Series Fund and Prudential’s Gibraltar Fund, Inc.; Chief Compliance Officer (since September 2022) of the PGIM Private Credit Fund; Chief Compliance Officer (since March 2022) of the PGIM Private Real Estate Fund, Inc.; Vice President, Compliance of PGIM Investments LLC (since December 2020); formerly Director, Compliance (July 2018-December 2020) of Credit Suisse Asset Management LLC; and Vice President, Associate General Counsel & Deputy Chief Compliance Officer of Cramer Rosenthal McGlynn, LLC (August 2014-July 2018). | | Since April 2022 |
| | | |
Andrew R. French 1962 Secretary | | Vice President (since December 2018) of PGIM Investments LLC; Secretary (since September 2022) of the PGIM Private Credit Fund; Secretary (since March 2022) of the PGIM Private Real Estate Fund, Inc.; formerly Vice President and Corporate Counsel (2010-2018) of Prudential; formerly Director and Corporate Counsel (2006-2010) of Prudential; Vice President and Assistant Secretary (since January 2007) of PGIM Investments LLC; Vice President and Assistant Secretary (since January 2007) of Prudential Mutual Fund Services LLC. | | Since October 2006 |
| | | |
Melissa Gonzalez 1980 Assistant Secretary | | Vice President and Corporate Counsel (since September 2018) of Prudential; Vice President and Assistant Secretary (since August 2020) of PGIM Investments LLC; Assistant Secretary (since September 2022) of the PGIM Private Credit Fund; Assistant Secretary (since March 2022) of the PGIM Private Real Estate Fund, Inc.; formerly Director and Corporate Counsel (March 2014-September 2018) of Prudential. | | Since March 2020 |
Visit our website at pgim.com/investments
| | | | | | |
| | | |
| Fund Officers(a) | | | | |
| | | |
Name Year of Birth Fund Position | | Principal Occupation(s) During Past Five Years | | Length of Service as Fund Officer |
| | | |
Patrick E. McGuinness 1986 Assistant Secretary | | Vice President and Assistant Secretary (since August 2020) of PGIM Investments LLC; Director and Corporate Counsel (since February 2017) of Prudential; Assistant Secretary (since September 2022) of the PGIM Private Credit Fund; Assistant Secretary (since March 2022) of the PGIM Private Real Estate Fund, Inc. | | Since June 2020 |
| | | |
Debra Rubano 1975 Assistant Secretary | | Vice President and Corporate Counsel (since November 2020) of Prudential; Assistant Secretary (since September 2022) of the PGIM Private Credit Fund; Assistant Secretary (since March 2022) of the PGIM Private Real Estate Fund, Inc; formerly Director and Senior Counsel of Allianz Global Investors U.S. Holdings LLC (2010-2020) and Assistant Secretary of numerous funds in the Allianz fund complex (2015-2020). | | Since December 2020 |
| | | |
Kelly A. Coyne 1968 Assistant Secretary | | Director, Investment Operations of Prudential Mutual Fund Services LLC (since 2010); Assistant Secretary (since September 2022) of the PGIM Private Credit Fund; Assistant Secretary (since March 2022) of the PGIM Private Real Estate Fund, Inc. | | Since March 2015 |
| | | |
Christian J. Kelly 1975 Treasurer and Principal Financial and Accounting Officer | | Vice President, Head of Fund Administration of PGIM Investments LLC (since November 2018); Principal Financial Officer (since September 2022) of the PGIM Private Credit Fund; Principal Financial Officer (since March 2022) of the PGIM Private Real Estate Fund, Inc.; formerly, Treasurer and Principal Accounting Officer (March 2022- July 2022) of the PGIM Private Real Estate Fund, Inc.; formerly Director of Fund Administration of Lord Abbett & Co. LLC (2009-2018), Treasurer and Principal Accounting Officer of the Lord Abbett Family of Funds (2017-2018); Director of Accounting, Avenue Capital Group (2008-2009); Senior Manager, Investment Management Practice of Deloitte & Touche LLP (1998-2007). | | Since January 2019 |
| | | |
Lana Lomuti 1967 Assistant Treasurer | | Vice President (since 2007) and Director (2005-2007), within PGIM Investments Fund Administration; formerly Assistant Treasurer (December 2007-February 2014) of The Greater China Fund, Inc. | | Since April 2014 |
| | | |
Russ Shupak 1973 Assistant Treasurer | | Vice President (since 2017) and Director (2013-2017), within PGIM Investments Fund Administration; Treasurer and Principal Accounting Officer (since July 2022) of the PGIM Private Real Estate Fund, Inc.; Assistant Treasurer (since September 2022) of the PGIM Private Credit Fund; formerly Assistant Treasurer (March 2022 – July 2022) of the PGIM Private Real Estate Fund, Inc. | | Since October 2019 |
| | | |
Deborah Conway 1969 Assistant Treasurer | | Vice President (since 2017) and Director (2007-2017), within PGIM Investments Fund Administration. | | Since October 2019 |
PGIM Quant Solutions International Equity Fund
| | | | | | |
| | | |
| Fund Officers(a) | | | | |
| | | |
Name Year of Birth Fund Position | | Principal Occupation(s) During Past Five Years | | Length of Service as Fund Officer |
| | | |
Elyse M. McLaughlin 1974 Assistant Treasurer | | Vice President (since 2017) and Director (2011-2017), within PGIM Investments Fund Administration; Treasurer and Principal Accounting Officer (since September 2022) of the PGIM Private Credit Fund; Assistant Treasurer (since March 2022) of the PGIM Private Real Estate Fund, Inc. | | Since October 2019 |
| | | |
Kelly Florio 1978 Anti-Money Laundering Compliance Officer | | Vice President, Corporate Compliance, Global Compliance Programs and Compliance Risk Management (since December 2021) of Prudential; formerly, Head of Fraud Risk Management (October 2019 to December 2021) at New York Life Insurance Company; formerly, Head of Key Risk Area Operations (November 2018 to October 2019), Director of the US Anti-Money Laundering Compliance Unit (2009-2018) and Bank Loss Prevention Associate (2006 -2009) at MetLife. | | Since June 2022 |
| (a) | Excludes Mr. Parker and Mr. Benjamin, interested Board Members who also serve as President and Vice President, respectively. |
Explanatory Notes to Tables:
| ∎ | | Board Members are deemed to be “Interested,” as defined in the 1940 Act, by reason of their affiliation with PGIM Investments LLC and/or an affiliate of PGIM Investments LLC. |
| ∎ | | Unless otherwise noted, the address of all Board Members and Officers is c/o PGIM Investments LLC, 655 Broad Street, Newark, New Jersey 07102-4410. |
| ∎ | | There is no set term of office for Board Members or Officers. The Board Members have adopted a retirement policy, which calls for the retirement of Board Members on December 31 of the year in which they reach the age of 75. |
| ∎ | | Other Directorships Held” includes all directorships of companies required to register or file reports with the SEC under the 1934 Act (that is, “public companies”) or other investment companies registered under the 1940 Act. |
| ∎ | | Portfolios Overseen” includes all investment companies managed by PGIM Investments LLC. The investment companies for which PGIM Investments LLC serves as manager include the PGIM Mutual Funds, Target Funds, The Prudential Variable Contract Accounts, PGIM ETF Trust, PGIM Private Real Estate Fund, Inc., PGIM Private Credit Fund, PGIM High Yield Bond Fund, Inc., PGIM Global High Yield Fund, Inc., PGIM Short Duration High Yield Opportunities Fund, The Prudential Series Fund, Prudential’s Gibraltar Fund, Inc. and the Advanced Series Trust. |
| ∎ | | As used in the Fund Officers table “Prudential” means The Prudential Insurance Company of America. |
Visit our website at pgim.com/investments
Approval of Advisory Agreements (unaudited)
The Fund’s Board of Directors
The Board of Directors (the “Board”) of PGIM Quant Solutions International Equity Fund (the “Fund”)1 consists of ten individuals, eight of whom are not “interested persons” of the Fund, as defined in the Investment Company Act of 1940, as amended (the “1940 Act”) (the “Independent Directors”). The Board is responsible for the oversight of the Fund and its operations, and performs the various duties imposed on the directors of investment companies by the 1940 Act. The Independent Directors have retained independent legal counsel to assist them in connection with their duties. The Chair of the Board is an Independent Director. The Board has established five standing committees: the Audit Committee, the Nominating and Governance Committee, the Compliance Committee and two Investment Committees. Each committee is chaired by, and composed of, Independent Directors.
Annual Approval of the Fund’s Advisory Agreements
As required under the 1940 Act, the Board determines annually whether to renew the Fund’s management agreement with PGIM Investments LLC (“PGIM Investments”) and the Fund’s subadvisory agreement with PGIM Quantitative Solutions LLC (“PGIM Quantitative Solutions”). In considering the renewal of the agreements, the Board, including all of the Independent Directors, met on May 26 and June 7-9, 2022 (the “Board Meeting”) and approved the renewal of the agreements through July 31, 2023, after concluding that the renewal of the agreements was in the best interests of the Fund and its shareholders.
In advance of the meetings, the Board requested and received materials relating to the agreements, and had the opportunity to ask questions and request further information in connection with its consideration. Among other things, the Board considered comparative fee information from PGIM Investments and PGIM Quantitative Solutions. Also, the Board considered comparisons with other mutual funds in relevant Peer Universes and Peer Groups, as is further discussed below.
In approving the agreements, the Board, including the Independent Directors advised by independent legal counsel, considered the factors it deemed relevant, including the nature, quality and extent of services provided by PGIM Investments and the subadviser, the performance of the Fund, the profitability of PGIM Investments and its affiliates, expenses and fees, and the potential for economies of scale that may be shared with the Fund and its shareholders as the Fund’s assets grow. In their deliberations, the Directors did not identify any single factor which alone was responsible for the Board’s decision to approve the agreements with respect to the Fund. In connection with its deliberations, the Board considered information provided by PGIM Investments throughout the year at regular Board meetings, presentations from portfolio managers and other information, as well as information furnished at or in advance of the Board Meeting.
1PGIM Quant Solutions International Equity Fund is a series of Prudential World Fund, Inc.
PGIM Quant Solutions International Equity Fund
Approval of Advisory Agreements (continued)
The Directors determined that the overall arrangements between the Fund and PGIM Investments, which serves as the Fund’s investment manager pursuant to a management agreement, and between PGIM Investments and PGIM Quantitative Solutions, which serves as the Fund’s subadviser pursuant to the terms of a subadvisory agreement with PGIM Investments, are in the best interests of the Fund and its shareholders in light of the services performed, fees charged and such other matters as the Directors considered relevant in the exercise of their business judgment.
The material factors and conclusions that formed the basis for the Directors’ reaching their determinations to approve the continuance of the agreements are separately discussed below.
Nature, Quality and Extent of Services
The Board received and considered information regarding the nature, quality and extent of services provided to the Fund by PGIM Investments and PGIM Quantitative Solutions. The Board noted that PGIM Quantitative Solutions is affiliated with PGIM Investments. The Board considered the services provided by PGIM Investments, including but not limited to the oversight of the subadviser for the Fund, as well as the provision of fund recordkeeping, compliance and other services to the Fund, and PGIM Investments’ role as administrator for the Fund’s liquidity risk management program. With respect to PGIM Investments’ oversight of the subadviser, the Board noted that PGIM Investments’ Strategic Investment Research Group (“SIRG”), which is a business unit of PGIM Investments, is responsible for monitoring and reporting to PGIM Investments’ senior management on the performance and operations of the subadviser. The Board also considered that PGIM Investments pays the salaries of all of the officers and interested Directors of the Fund who are part of Fund management. The Board also considered the investment subadvisory services provided by PGIM Quantitative Solutions, including investment research and security selection, as well as adherence to the Fund’s investment restrictions and compliance with applicable Fund policies and procedures. The Board considered PGIM Investments’ evaluation of the subadviser, as well as PGIM Investments’ recommendation, based on its review of the subadviser, to renew the subadvisory agreement.
The Board considered the qualifications, backgrounds and responsibilities of PGIM Investments’ senior management responsible for the oversight of the Fund and PGIM Quantitative Solutions, and also considered the qualifications, backgrounds and responsibilities of PGIM Quantitative Solutions’ portfolio managers who are responsible for the day-to-day management of the Fund’s portfolio. The Board was provided with information pertaining to PGIM Investments’ and PGIM Quantitative Solutions’ organizational structure, senior management, investment operations, and other relevant information pertaining to both PGIM Investments and PGIM Quantitative Solutions. The Board also noted that it received favorable compliance reports from the Fund’s Chief Compliance Officer (“CCO”) as to both PGIM Investments and PGIM Quantitative Solutions.
Visit our website at pgim.com/investments
The Board concluded that it was satisfied with the nature, extent and quality of the investment management services provided by PGIM Investments and the subadvisory services provided to the Fund by PGIM Quantitative Solutions, and that there was a reasonable basis on which to conclude that the Fund benefits from the services provided by PGIM Investments and PGIM Quantitative Solutions under the management and subadvisory agreements.
Costs of Services and Profits Realized by PGIM Investments
The Board was provided with information on the profitability of PGIM Investments and its affiliates in serving as the Fund’s investment manager. The Board discussed with PGIM Investments the methodology utilized in assembling the information regarding profitability and considered its reasonableness. The Board recognized that it is difficult to make comparisons of profitability from fund management contracts because comparative information is not generally publicly available and is affected by numerous factors, including the structure of the particular adviser, the types of funds it manages, its business mix, numerous assumptions regarding allocations and the adviser’s capital structure and cost of capital. Taking these factors into account, the Board concluded that the profitability of PGIM Investments and its affiliates in relation to the services rendered was not unreasonable.
Economies of Scale
The Board received and discussed information concerning economies of scale that PGIM Investments may realize as the Fund’s assets grow beyond current levels. The Board noted that the management fee schedule for the Fund includes breakpoints. During the course of time, the Board has considered information regarding the launch date of the Fund, the management fees of the Fund compared to those of similarly managed funds and PGIM Investments’ investment in the Fund over time. The Board noted that economies of scale can be shared with the Fund in other ways, including low management fees from inception, additional technological and personnel investments to enhance shareholder services, and maintaining existing expense structures in the face of a rising cost environment. The Board also considered PGIM Investments’ assertion that it continually evaluates the management fee schedule of the Fund and the potential to share economies of scale through breakpoints or fee waivers as asset levels increase.
The Board recognized the inherent limitations of any analysis of economies of scale, stemming largely from the Board’s understanding that most of PGIM Investments’ costs are not specific to individual funds, but rather are incurred across a variety of products and services.
Other Benefits to PGIM Investments and PGIM Quantitative Solutions
The Board considered potential ancillary benefits that might be received by PGIM Investments, PGIM Quantitative Solutions and their affiliates as a result of their relationship with the Fund. The Board concluded that potential benefits to be derived by PGIM Investments included transfer agency fees received by the Fund’s transfer agent (which is affiliated with PGIM Investments), and benefits to its reputation as well as
PGIM Quant Solutions International Equity Fund
Approval of Advisory Agreements (continued)
other intangible benefits resulting from PGIM Investments’ association with the Fund. The Board concluded that the potential benefits to be derived by PGIM Quantitative Solutions included its ability to use soft dollar credits, as well as the potential benefits consistent with those generally resulting from an increase in assets under management, specifically, potential access to additional research resources and benefits to its reputation. The Board concluded that the benefits derived by PGIM Investments and PGIM Quantitative Solutions were consistent with the types of benefits generally derived by investment managers and subadvisers to mutual funds.
Performance of the Fund / Fees and Expenses
The Board considered certain additional factors and made related conclusions relating to the historical performance of the Fund for the one-, three-, five- and ten-year periods ended December 31, 2021.
The Board also considered the Fund’s actual management fee, as well as the Fund’s net total expense ratio, for the fiscal year ended October 31, 2021. The Board considered the management fee for the Fund as compared to the management fee charged by PGIM Investments to other funds and the fee charged by other advisers to comparable mutual funds in a Peer Group. The actual management fee represents the fee rate actually paid by Fund shareholders and includes any fee waivers or reimbursements. The net total expense ratio for the Fund represents the actual expense ratio incurred by Fund shareholders.
The mutual funds included in the Peer Universe, which was used to consider performance, and the Peer Group, which was used to consider expenses and fees, were objectively determined by Broadridge, an independent provider of mutual fund data. In certain circumstances, PGIM Investments also provided supplemental Peer Universe or Peer Group information for reasons addressed with the Board. The comparisons placed the Fund in various quartiles over various periods, with the first quartile being the best 25% of the mutual funds (for performance, the best performing mutual funds and, for expenses, the lowest cost mutual funds).
The section below summarizes key factors considered by the Board and the Board’s conclusions regarding the Fund’s performance, fees and overall expenses. The table sets forth net performance comparisons (which reflect the impact on performance of fund expenses, or any subsidies, expense caps or waivers that may be applicable) with the Peer Universe, actual management fees with the Peer Group (which reflect the impact of any subsidies or fee waivers), and net total expenses with the Peer Group, each of which were key factors considered by the Board.
| | | | | | | | |
Net Performance | | 1 Year | | 3 Years | | 5 Years | | 10 Years |
| | 3rd Quartile | | 4th Quartile | | 3rd Quartile | | 3rd Quartile |
| Actual Management Fees: 1st Quartile | | | | |
| Net Total Expenses: 3rd Quartile | | |
Visit our website at pgim.com/investments
| ● | The Board noted that the Fund outperformed its benchmark index over the one-year period and underperformed its benchmark index over the three-, five- and ten-year periods. |
| ● | The Board considered PGIM Investments’ assertions that as the economic impacts related to the COVID-19 pandemic continue to recede and as market conditions normalize, they expect the Fund’s relative returns to improve. The Board further considered PGIM Investment’s assertion that the Fund is continuing to recover its longer-term track record from the underperformance driven by the prolonged downturn in the value style factor from 2018-2020 and that from 2012 through 2017, the Fund’s three-year rolling annualized return was above its benchmark index and peer group. |
| ● | The Board considered that the Fund outperformed its peer group for the first quarter of 2022. |
| ● | The Board and PGIM Investments agreed to retain the Fund’s existing contractual expense cap, which (exclusive of certain fees and expenses) caps total annual operating expenses at 0.78% for Class R6 shares through February 28, 2023. |
| ● | In addition, PGIM Investments will waive management fees or shared operating expenses on any share class to the same extent that it waives such expenses on any other share class, and has agreed that total annual fund operating expenses for Class R6 shares will not exceed total annual fund operating expenses for Class Z shares. |
| ● | The Board concluded that, in light of the above, it would be in the best interests of the Fund and its shareholders to renew the agreements. |
| ● | The Board concluded that the management fees (including subadvisory fees) and total expenses were reasonable in light of the services provided. |
* * *
After full consideration of these factors, the Board concluded that approval of the agreements was in the best interests of the Fund and its shareholders.
PGIM Quant Solutions International Equity Fund
| | | | |
| | | |
⬛ MAIL 655 Broad Street Newark, NJ 07102 | | ⬛ TELEPHONE (800) 225-1852 | | ⬛ WEBSITE pgim.com/investments |
PROXY VOTING
The Board of Directors of the Fund has delegated to the Fund’s subadviser the responsibility for voting any proxies and maintaining proxy recordkeeping with respect to the Fund. A description of these proxy voting policies and procedures is available without charge, upon request, by calling (800) 225-1852 or by visiting the Securities and Exchange Commission’s website at sec.gov. Information regarding how the Fund voted proxies relating to portfolio securities during the most recent 12-month period ended June 30 is available on the Fund’s website and on the Securities and Exchange Commission’s website.
DIRECTORS
Ellen S. Alberding ● Kevin J. Bannon ● Scott E. Benjamin ● Linda W. Bynoe ● Barry H. Evans ● Keith F. Hartstein ● Laurie Simon Hodrick ●
Stuart S. Parker ● Brian K. Reid ● Grace C. Torres
OFFICERS
Stuart S. Parker, President ● Scott E. Benjamin, Vice President ● Christian J. Kelly, Treasurer and Principal Financial and Accounting Officer ●
Claudia DiGiacomo, Chief Legal Officer ● Isabelle Sajous, Chief Compliance Officer ● Kelly Florio, Anti-Money Laundering Compliance Officer ●
Andrew R. French, Secretary ● Melissa Gonzalez, Assistant Secretary ● Kelly A. Coyne, Assistant Secretary ● Patrick E. McGuinness, Assistant Secretary ● Debra Rubano, Assistant Secretary ● Lana Lomuti, Assistant Treasurer ● Russ Shupak, Assistant Treasurer ● Elyse M. McLaughlin, Assistant Treasurer ● Deborah Conway, Assistant Treasurer
| | | | |
| | |
MANAGER | | PGIM Investments LLC | | 655 Broad Street |
| | | | | Newark, NJ 07102 |
| | |
SUBADVISER | | PGIM Quantitative Solutions | | Gateway Center Two |
| | | LLC | | 100 Mulberry Street Newark, NJ 07102 |
| | |
DISTRIBUTOR | | Prudential Investment | | 655 Broad Street |
| | | Management Services LLC | | Newark, NJ 07102 |
| | |
CUSTODIAN | | The Bank of New York Mellon | | 240 Greenwich Street New York, NY 10286 |
| | |
TRANSFER AGENT | | Prudential Mutual Fund Services LLC | | PO Box 9658 Providence, RI 02940 |
| | |
| INDEPENDENT REGISTERED PUBLIC ACCOUNTING FIRM | | PricewaterhouseCoopers LLP | | 300 Madison Avenue New York, NY 10017 |
| | |
| FUND COUNSEL | | Willkie Farr & Gallagher LLP | | 787 Seventh Avenue New York, NY 10019 |
An investor should consider the investment objectives, risks, charges, and expenses of the Fund carefully before investing. The prospectus and summary prospectus contain this and other information about the Fund. An investor may obtain the prospectus and summary prospectus by visiting our website at pgim.com/investments or by calling (800) 225-1852. The prospectus and summary prospectus should be read carefully before investing.
E-DELIVERY
To receive your mutual fund documents online, go to pgim.com/investments/resource/edelivery and enroll. Instead of receiving printed documents by mail, you will receive notification via email when new materials are available. You can cancel your enrollment or change your email address at any time by visiting the website address above.
SHAREHOLDER COMMUNICATIONS WITH DIRECTORS
Shareholders can communicate directly with the Board of Directors by writing to the Chair of the Board, PGIM Quant Solutions International Equity Fund, PGIM Investments, Attn: Board of Directors, 655 Broad Street, Newark, NJ 07102. Shareholders can communicate directly with an individual Director by writing to that Director at the same address. Communications are not screened before being delivered to the addressee.
AVAILABILITY OF PORTFOLIO HOLDINGS
The Fund files its complete schedule of portfolio holdings with the Securities and Exchange Commission for the first and third quarters of each fiscal year as an exhibit to its reports on Form N-PORT. The Fund’s Form N-PORT filings are available on the Commission’s website at sec.gov.
The Fund’s Statement of Additional Information contains additional information about the Fund’s Directors and is available without charge, upon request, by calling (800) 225-1852.
Mutual Funds:
| | | | |
| | | |
| ARE NOT INSURED BY THE FDIC OR ANY FEDERAL GOVERNMENT AGENCY | | MAY LOSE VALUE | | ARE NOT A DEPOSIT OF OR GUARANTEED BY ANY BANK OR ANY BANK AFFILIATE |

PGIM QUANT SOLUTIONS INTERNATIONAL EQUITY FUND
| | | | | | | | | | | | | | | | |
| | | | |
| SHARE CLASS | | A | | | C | | | Z | | | R6 | |
| | | | |
NASDAQ | | | PJRAX | | | | PJRCX | | | | PJIZX | | | | PJRQX | |
| | | | |
CUSIP | | | 743969859 | | | | 743969875 | | | | 743969883 | | | | 743969578 | |
MF190E

PGIM EMERGING MARKETS DEBT LOCAL
CURRENCY FUND
ANNUAL REPORT
OCTOBER 31, 2022

To enroll in e-delivery, go to pgim.com/investments/resource/edelivery
Table of Contents
This report is not authorized for distribution to prospective investors unless preceded or accompanied by a current prospectus.
The views expressed in this report and information about the Fund’s portfolio holdings are for the period covered by this report and are subject to change thereafter.
Mutual funds are distributed by Prudential Investment Management Services LLC (PIMS), member SIPC. PGIM Fixed Income is a unit of PGIM, Inc. (PGIM), a registered investment adviser. PIMS and PGIM are Prudential Financial companies. © 2022 Prudential Financial, Inc. and its related entities. PGIM and the PGIM logo are service marks of Prudential Financial, Inc. and its related entities, registered in many jurisdictions worldwide.
| | |
| 2 | | Visit our website at pgim.com/investments |
Letter from the President
| | |
 | | Dear Shareholder: |
| | We hope you find the annual report for the PGIM Emerging Markets Debt Local Currency Fund informative and useful. The report covers performance for the 12-month period that ended October 31, 2022. The attention of the global economy and financial markets pivoted during the period from the COVID-19 pandemic to the challenge of rapidly rising inflation. While job growth remained strong, prices for a wide range of goods and services rose in response to economic re-openings, supply-chain disruptions, governmental stimulus, and Russia’s invasion of |
| Ukraine. With inflation surging to a 40-year high, the Federal Reserve and other central banks aggressively hiked interest rates, prompting recession concerns. |
After rising to record levels at the end of 2021, stocks have fallen sharply in 2022 as investors worried about higher prices, slowing economic growth, geopolitical uncertainty, and new COVID-19 outbreaks. Equities rallied for a time during the summer but began falling again in late August on fears that the Fed would keep raising rates to tame inflation. For the entire 12-month period, equities suffered a broad-based global decline, although large-cap US stocks outperformed their small-cap counterparts. International developed and emerging markets trailed the US market during this time.
Rising rates and economic uncertainty drove fixed income prices broadly lower as well. US and global investment-grade bonds, along with US high yield corporate bonds and emerging market debt, all posted negative returns during the period.
Regarding your investments with PGIM, we believe it is important to maintain a diversified portfolio of funds consistent with your tolerance for risk, time horizon, and financial goals. Your financial advisor can help you create a diversified investment plan that may include funds covering all the basic asset classes and that reflects your personal investor profile and risk tolerance. However, diversification and asset allocation strategies do not assure a profit or protect against loss in declining markets.
At PGIM Investments, we provide access to active investment strategies across the global markets in the pursuit of consistent outperformance for investors. PGIM is the world’s 11th-largest investment manager with more than $1.5 trillion in assets under management. Our scale and investment expertise allow us to deliver a diversified suite of actively managed solutions across a broad spectrum of asset classes and investment styles.
Thank you for choosing our family of funds.
Sincerely,

Stuart S. Parker, President
PGIM Emerging Markets Debt Local Currency Fund
December 15, 2022
| | |
| PGIM Emerging Markets Debt Local Currency Fund | | 3 |
Your Fund’s Performance (unaudited)
Performance data quoted represent past performance. Past performance does not guarantee future results. The investment return and principal value of an investment will fluctuate so that an investor’s shares, when redeemed, may be worth more or less than their original cost. Current performance may be lower or higher than the past performance data quoted. An investor may obtain performance data as of the most recent month-end by visiting our website at pgim.com/investments or by calling (800) 225-1852.
| | | | | | |
| |
| | | Average Annual Total Returns as of 10/31/22 |
| | | One Year (%) | | Five Years (%) | | Ten Years (%) |
| | | |
Class A | | | | | | |
(with sales charges) | | -20.84 | | -3.76 | | -2.83 |
(without sales charges) | | -18.18 | | -3.12 | | -2.51 |
| | | |
Class C | | | | | | |
(with sales charges) | | -19.61 | | -3.90 | | -3.24 |
(without sales charges) | | -18.82 | | -3.90 | | -3.24 |
Class Z | | | | | | |
(without sales charges) | | -17.83 | | -2.86 | | -2.22 |
| | | |
Class R6 | | | | | | |
(without sales charges) | | -17.77 | | -2.77 | | -2.15 |
JP Morgan Government Bond Index-Emerging Markets Global Diversified Index | | | | | | |
| | | -20.27 | | -3.54 | | -2.56 |
| | |
| 4 | | Visit our website at pgim.com/investments |
Growth of a $10,000 Investment (unaudited)
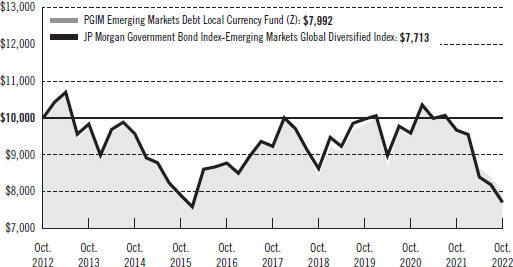
The graph compares a $10,000 investment in the Fund’s Class Z shares with a similar investment in the JP Morgan Government Bond Index-Emerging Markets Global Diversified Index by portraying the initial account values at the beginning of the 10-year period (October 31, 2012) and the account values at the end of the current fiscal year (October 31, 2022), as measured on a quarterly basis. For purposes of the graph, and unless otherwise indicated, it has been assumed that (a) all recurring fees (including management fees) were deducted and (b) all dividends and distributions were reinvested. The line graph provides information for Class Z shares only. As indicated in the tables provided earlier, performance for other share classes will vary due to the differing fees and expenses applicable to each share class (as indicated in the following paragraphs). Without waiver of fees and/or expense reimbursements, if any, the returns would have been lower.
Past performance does not predict future performance. Total returns and the ending account values in the graphs include changes in share price and reinvestment of dividends and capital gains distributions in a hypothetical investment for the periods shown. The Fund’s total returns do not reflect the deduction of income taxes on an individual’s investment. Taxes may reduce your actual investment returns on income or gains paid by the Fund or any gains you may realize if you sell your shares.
| | |
| PGIM Emerging Markets Debt Local Currency Fund | | 5 |
Your Fund’s Performance (continued)
The returns in the tables do not reflect the deduction of taxes that a shareholder would pay on Fund distributions or following the redemption of Fund shares. The average annual total returns take into account applicable sales charges, which are described for each share class in the table below.
| | | | | | | | |
| | | | |
| | | Class A | | Class C | | Class Z | | Class R6 |
| | | | | |
Maximum initial sales charge | | 3.25% of the public offering price | | None | | None | | None |
Contingent deferred sales charge (CDSC) (as a percentage of the lower of the original purchase price or the net asset value at redemption) | | 1.00% on sales of $500,000 or more made within 12 months of purchase | | 1.00% on sales made within 12 months of purchase | | None | | None |
Annual distribution and service (12b-1) fees (shown as a percentage of average daily net assets) | | 0.25% | | 1.00% | | None | | None |
Benchmark Definition
JP Morgan Government Bond Index-Emerging Markets Global Diversified Index—The JP Morgan Government Bond Index-Emerging Markets Global Diversified Index, an unmanaged index, is a comprehensive emerging markets debt benchmark that tracks local currency bonds issued by emerging market governments.
Investors cannot invest directly in an index. The returns for the Index would be lower if they included the effects of sales charges, operating expenses of a mutual fund, or taxes that may be paid by an investor.
| | |
| 6 | | Visit our website at pgim.com/investments |
| | | | |
|
| Credit Quality expressed as a percentage of total investments as of 10/31/22 (%) | |
| |
AAA | | | 8.1 | |
| |
AA | | | 2.7 | |
| |
A | | | 30.6 | |
| |
BBB | | | 29.8 | |
| |
BB | | | 21.4 | |
| |
B | | | 1.5 | |
| |
CCC | | | 1.8 | |
| |
Not Rated | | | -0.7 | |
| |
Cash/Cash Equivalents | | | 4.8 | |
| | |
| Total | | | 100.0 | |
Credit ratings reflect the highest rating assigned by a nationally recognized statistical rating organization (NRSRO) such as Moody’s Investors Service, Inc. (Moody’s), S&P Global Ratings (S&P), or Fitch, Inc. (Fitch). Credit ratings reflect the common nomenclature used by both S&P and Fitch. Where applicable, ratings are converted to the comparable S&P/Fitch rating tier nomenclature. These rating agencies are independent and are widely used. The Not Rated category consists of securities that have not been rated by an NRSRO. Credit ratings are subject to change.
| | | | | | |
|
| Distributions and Yields as of 10/31/22 |
| | | |
| | | Total Distributions
Paid for One Year ($) | | SEC 30-Day
Subsidized
Yield* (%) | | SEC 30-Day Unsubsidized
Yield** (%) |
| | | |
Class A | | 0.21 | | 7.62 | | 6.74 |
| | | |
Class C | | 0.17 | | 7.11 | | -1.74 |
| | | |
Class Z | | 0.23 | | 8.29 | | 7.33 |
| | | |
Class R6 | | 0.23 | | 8.36 | | 9.64 |
*SEC 30-Day Subsidized Yield (%)—A standardized yield calculation created by the Securities and Exchange Commission, it reflects the income earned during a 30-day period, after the deduction of the Fund’s net expenses (net of any expense waivers or reimbursements). The investor experience is represented by the SEC 30-Day Subsidized Yield.
**SEC 30-Day Unsubsidized Yield (%)—A standardized yield calculation created by the Securities and Exchange Commission, it reflects the income earned during a 30-day period, after the deduction of the Fund’s gross expenses. The investor experience is represented by the SEC 30-Day Subsidized Yield.
| | |
| PGIM Emerging Markets Debt Local Currency Fund | | 7 |
Strategy and Performance Overview*
(unaudited)
How did the Fund perform?
The PGIM Emerging Markets Debt Local Currency Fund’s Class Z shares returned —17.83% in the 12-month reporting period that ended October 31, 2022, outperforming the —20.27% return of the JP Morgan Government Bond Index—Emerging Markets Global Diversified Index (the Index).
What were the market conditions?
| ● | | Emerging market debt remained volatile throughout the reporting period, with investor appetite for risk assets challenged by persistent global inflation, commodity price shocks, and geopolitical risks. Concerns about central bank tightening, hard economic landings, and the war in Ukraine led spreads notably wider, with emerging market local currency rates, emerging market foreign exchange, and hard currency all posting negative returns over the period. |
| ● | | In the first quarter of 2022, overall performance remained differentiated and country specific, with oil-sensitive issuers outperforming other issuers as oil prices soared. Most of the spread widening over the period came as the escalating war in Ukraine was met by severe sanctions from western nations and rating agency downgrades of Russia, Belarus, and Ukraine debt. Broad market performance reflected investors’ flight from risky assets as outflows picked up their pace, with underperformance led by Russia as the market anticipated its removal from most indices. Local rates produced negative returns in the quarter, driven by high inflation prints, geopolitical tensions, continued hiking cycles in Latin America and Central Europe, and a more hawkish US Federal Reserve (the Fed). Meanwhile, emerging market foreign exchange declined, but dispersion remained evident as the currencies of commodity exporters generally outperformed those of commodity importers. |
| ● | | The emerging market debt sector saw continued pressure in the second quarter of 2022 as tightening financial conditions and slowing growth in China and Europe provided a challenging macroeconomic backdrop. The impact of higher food and energy prices, in large part a result of the Russia/Ukraine war, negatively impacted many emerging market countries, and fears of stagflation meaningfully increased their risk premium. Meanwhile, China remained a significant underperformer amid its property market slowdown. Local rates suffered one of their worst quarters since the Global Financial Crisis, with the Index yield rising above 7.0%—a level not seen since 2015—due to tightening monetary policies. Local currency yield curves flattened across the board as most emerging market central banks extended their interest rate hiking cycle. Emerging market foreign exchange underperformed as the Russian conflict continued to impact emerging market currencies, while the US dollar outperformed amid expectations of a tighter Fed policy and higher US Treasury yields. |
| ● | | In the third quarter of 2022, emerging market debt performance remained negative as an uncertain global backdrop remained a challenge due to continuing rising rates, slowing growth, and geopolitical tensions. Within local rates, front-end yields in many emerging market countries were significantly higher than long-end yields due to continued pressures on central banks to raise rates, as well as the ongoing surge in |
| | |
| 8 | | Visit our website at pgim.com/investments |
| | the US dollar. Emerging market foreign exchange saw a continuation of declines amid ongoing Fed hawkishness, concerns over slowing global growth, and inflation in both developed and emerging economies. |
| ● | | During October—the last month of the period—emerging market spreads were mixed, and fund flows remained negative. Returns across hard currency and foreign exchange were positive in October, while local currency rates and corporates lagged. Within local currency rates, all regions lagged except for Asia. Meanwhile, emerging market foreign exchange exhibited mixed performance in October, with Europe and Latin America exhibiting positive returns while Asia and Middle/East Africa underperformed. The US dollar rally stalled after four months of positive performance amid expectations that the Fed might pivot, or adopt a less-aggressive rate-hiking policy, following shifts in central bank rhetoric in other developed countries. |
What worked?
| ● | | Overall country selection and issue selection contributed to performance over the reporting period. Short duration positioning in Poland, Colombia, and Hungary contributed to performance. Sovereign debt positioning in Russia, Egypt, Mexico, and Turkey also contributed. (Duration measures the sensitivity of the price—the value of principal—of a bond to a change in interest rates.) |
| ● | | Overall currency selection was also positive, with underweights relative to the Index to the Chinese yuan, Thailand baht, and Taiwan dollar contributing. |
What didn’t work?
| ● | | Long duration positioning in Russia and Brazil, along with short duration positioning in Turkey, detracted from the Fund’s returns over the period. |
| ● | | Sovereign positioning in Poland, Colombia, and South Africa also detracted from performance. |
| ● | | In the Fund’s positions in hard currency that are not included in the Index, positioning in Ukraine, Pakistan, and Jamaica detracted from returns. |
| ● | | Within currencies, overweights relative to the Index to the Russian ruble and Polish zloty, along with an underweight to the Egyptian pound, detracted from returns. |
Did the Fund use derivatives?
Currency positioning in the Fund was partially facilitated by the use of currency forward and option contracts. During the reporting period, the Fund’s currency positioning contributed to relative performance. The Fund also used futures and interest rate swaps, in part, to help manage duration and yield curve exposure, which collectively had a negative impact on performance.
Current outlook
| ● | | PGIM Fixed Income expects rising interest rates, slowing growth, and geopolitical tensions to continue to challenge the emerging market debt sector, and thus has |
| | |
| PGIM Emerging Markets Debt Local Currency Fund | | 9 |
Strategy and Performance Overview* (continued)
| | positioned the Fund cautiously. However, emerging market price action has been front loaded, and PGIM Fixed Income believes current valuations provide an attractive opportunity for investors with a longer-term time horizon. |
| ● | | Within local rates, PGIM Fixed Income’s bias is short duration and a continued lookout for differentiation in monetary policies across countries, but it remains opportunistic and plans to trade tactically. After the recent sell-off, PGIM Fixed Income will be quick to change from short duration to long duration should there be a reversal in the US dollar on the back of a Fed pivot. Many emerging markets yield curves are inverted, reflecting expectations for a cutting cycle to start in a year or so, which favors underweight positions at the front end. |
| ● | | PGIM Fixed Income remains cautious on emerging market currencies but also sees relative-value opportunities, is mindful of two-way risks, and views Asia as the weakest region as all central banks are lagging the Fed in the degree of rate hikes. |
*This strategy and performance overview, which discusses what strategies or holdings (including derivatives, if applicable) affected the Fund’s performance, is compiled based on how the Fund performed relative to the Fund’s benchmark index and is viewed for performance attribution purposes at the aggregate Fund level, which in most instances will not directly correlate to the amounts disclosed in the Statement of Operations which conform to US generally accepted accounting principles.
| | |
| 10 | | Visit our website at pgim.com/investments |
Fees and Expenses (unaudited)
As a shareholder of the Fund, you incur two types of costs: (1) transaction costs, including sales charges (loads) on purchase payments and redemptions, as applicable, and (2) ongoing costs, including management fees, distribution and/or service (12b-1) fees, and other Fund expenses, as applicable. This example is intended to help you understand your ongoing costs (in dollars) of investing in the Fund and to compare these costs with the ongoing costs of investing in other mutual funds.
The example is based on an investment of $1,000 held through the six-month period ended October 31, 2022. The example is for illustrative purposes only; you should consult the Prospectus for information on initial and subsequent minimum investment requirements.
Actual Expenses
The first line for each share class in the table on the following page provides information about actual account values and actual expenses. You may use the information on this line, together with the amount you invested, to estimate the expenses that you paid over the period. Simply divide your account value by $1,000 (for example, an $8,600 account value ÷ $1,000 = 8.6), then multiply the result by the number on the first line under the heading “Expenses Paid During the Six-Month Period” to estimate the expenses you paid on your account during this period.
Hypothetical Example for Comparison Purposes
The second line for each share class in the table on the following page provides information about hypothetical account values and hypothetical expenses based on the Fund’s actual expense ratio and an assumed rate of return of 5% per year before expenses, which is not the Fund’s actual return. The hypothetical account values and expenses may not be used to estimate the actual ending account balance or expenses you paid for the period. You may use this information to compare the ongoing costs of investing in the Fund and other funds. To do so, compare this 5% hypothetical example with the 5% hypothetical examples that appear in the shareholder reports of the other funds.
The Fund’s transfer agent may charge additional fees to holders of certain accounts that are not included in the expenses shown in the table on the following page. These fees apply to individual retirement accounts (IRAs) and Section 403(b) accounts. As of the close of the six-month period covered by the table, IRA fees included an annual maintenance fee of $15 per account (subject to a maximum annual maintenance fee of $25 for all accounts held by the same shareholder). Section 403(b) accounts are charged an annual $25 fiduciary maintenance fee. Some of the fees may vary in amount, or may be waived, based on your total account balance or the number of PGIM funds, including the Fund, that you own. You should consider the additional fees that were charged to your Fund account over the six-month period when you estimate the total ongoing expenses paid over the period and the impact of these fees on your ending account value, as these additional expenses are not reflected in the information
| | |
| PGIM Emerging Markets Debt Local Currency Fund | | 11 |
Fees and Expenses (continued)
provided in the expense table. Additional fees have the effect of reducing investment returns.
Please note that the expenses shown in the table are meant to highlight your ongoing costs only and do not reflect any transactional costs such as sales charges (loads). Therefore, the second line for each share class in the table is useful in comparing ongoing costs only and will not help you determine the relative total costs of owning different funds. In addition, if these transactional costs were included, your costs would have been higher.
| | | | | | | | | | |
| | | | | |
PGIM Emerging Markets Debt Local Currency Fund | | Beginning Account Value May 1, 2022 | | Ending Account Value October 31, 2022 | | Annualized Expense Ratio Based on the Six-Month Period | | Expenses Paid During the Six-Month Period* |
| | | | | |
Class A | | Actual | | $1,000.00 | | $ 920.70 | | 1.15% | | $5.57 |
| | | | | |
| | Hypothetical | | $1,000.00 | | $1,019.41 | | 1.15% | | $5.85 |
| | | | | |
Class C | | Actual | | $1,000.00 | | $ 917.90 | | 1.90% | | $9.18 |
| | | | | |
| | Hypothetical | | $1,000.00 | | $1,015.63 | | 1.90% | | $9.65 |
| | | | | |
Class Z | | Actual | | $1,000.00 | | $ 923.50 | | 0.73% | | $3.54 |
| | | | | |
| | Hypothetical | | $1,000.00 | | $1,021.53 | | 0.73% | | $3.72 |
| | | | | |
Class R6 | | Actual | | $1,000.00 | | $ 923.80 | | 0.67% | | $3.25 |
| | | | | |
| | | Hypothetical | | $1,000.00 | | $1,021.83 | | 0.67% | | $3.41 |
*Fund expenses (net of fee waivers or subsidies, if any) for each share class are equal to the annualized expense ratio for each share class (provided in the table), multiplied by the average account value over the period, multiplied by the 184 days in the six-month period ended October 31, 2022, and divided by the 365 days in the Fund’s fiscal year ended October 31, 2022 (to reflect the six-month period). Expenses presented in the table include the expenses of any underlying portfolios in which the Fund may invest.
| | |
| 12 | | Visit our website at pgim.com/investments |
Schedule of Investments
as of October 31, 2022
| | | | | | | | | | | | | | | | | | | | |
| | | | |
| Description | | Interest
Rate | | | Maturity
Date | | | Principal Amount (000)# | | | Value | |
| | | | | |
LONG-TERM INVESTMENTS 85.9% | | | | | | | | | | | | | | | | | | | | |
| | | | | |
CORPORATE BONDS 6.6% | | | | | | | | | | | | | | | | | | | | |
| | | | | |
Brazil 0.5% | | | | | | | | | | | | | | | | | | | | |
| | | | | |
JSM Global Sarl,
Gtd. Notes, 144A | | | 4.750% | | | | 10/20/30 | | | | | | | | 200 | | | $ | 138,163 | |
| | | | | |
Jamaica 0.4% | | | | | | | | | | | | | | | | | | | | |
| | | | | |
Digicel Ltd.,
Gtd. Notes | | | 6.750 | | | | 03/01/23 | | | | | | | | 235 | | | | 117,500 | |
| | | | | |
Malaysia 0.6% | | | | | | | | | | | | | | | | | | | | |
| | | | | |
Gohl Capital Ltd.,
Gtd. Notes | | | 4.250 | | | | 01/24/27 | | | | | | | | 200 | | | | 148,000 | |
| | | | | |
Mexico 3.2% | | | | | | | | | | | | | | | | | | | | |
| | | | | |
America Movil SAB de CV,
Sr. Unsec’d. Notes | | | 6.450 | | | | 12/05/22 | | | | MXN | | | | 14,250 | | | | 714,415 | |
Petroleos Mexicanos,
Gtd. Notes | | | 6.490 | | | | 01/23/27 | | | | | | | | 55 | | | | 48,037 | |
Gtd. Notes, MTN | | | 6.875 | | | | 08/04/26 | | | | | | | | 105 | | | | 96,773 | |
| | | | | | | | | | | | | | | | | | | | |
| | | | | |
| | | | | | | | | | | | | | | | | | | 859,225 | |
| | | | | |
South Africa 1.5% | | | | | | | | | | | | | | | | | | | | |
| | | | | |
Eskom Holdings SOC Ltd.,
Sr. Unsec’d. Notes,144A, MTN | | | 6.750 | | | | 08/06/23 | | | | | | | | 200 | | | | 195,125 | |
Sasol Financing USA LLC,
Gtd. Notes | | | 5.875 | | | | 03/27/24 | | | | | | | | 200 | | | | 194,250 | |
| | | | | | | | | | | | | | | | | | | | |
| | | | | |
| | | | | | | | | | | | | | | | | | | 389,375 | |
| | | | | |
Supranational Bank 0.4% | | | | | | | | | | | | | | | | | | | | |
| | | | | |
European Investment Bank, | | | | | | | | | | | | | | | | | | | | |
Sr. Unsec’d. Notes, EMTN | | | 3.000 | | | | 05/24/24 | | | | PLN | | | | 600 | | | | 113,615 | |
| | | | | | | | | | | | | | | | | | | | |
| | | | | |
TOTAL CORPORATE BONDS
(cost $2,293,445) | | | | | | | | | | | | | | | | | | | 1,765,878 | |
| | | | | | | | | | | | | | | | | | | | |
| | | | | |
FOREIGN TREASURY OBLIGATION 0.4% | | | | | | | | | | | | | | | | | | | | |
| | | | | |
Brazil | | | | | | | | | | | | | | | | | | | | |
| | | | | |
Brazil Letras do Tesouro Nacional,
Bills,Series LTN
(cost $115,413) | | | 6.144(s) | | | | 01/01/24 | | | | BRL | | | | 668 | | | | 112,322 | |
| | | | | | | | | | | | | | | | | | | | |
See Notes to Financial Statements.
PGIM Emerging Markets Debt Local Currency Fund 13
Schedule of Investments (continued)
as of October 31, 2021
| | | | | | | | | | | | | | | | | | | | |
| | | | |
| Description | | Interest
Rate | | | Maturity
Date | | | Principal Amount (000)# | | | Value | |
| | | | | |
SOVEREIGN BONDS 78.9% | | | | | | | | | | | | | | | | | | | | |
| | | | | |
Angola 0.7% | | | | | | | | | | | | | | | | | | | | |
| | | | | |
Angolan Government International Bond,
Sr. Unsec’d. Notes | | | 9.500% | | | | 11/12/25 | | | | | | | | 200 | | | $ | 194,500 | |
| | | | | |
Argentina 0.3% | | | | | | | | | | | | | | | | | | | | |
| | | | | |
Argentine Republic Government International Bond,
Sr. Unsec’d. Notes | | | 1.000 | | | | 07/09/29 | | | | | | | | 24 | | | | 4,857 | |
Provincia de Buenos Aires,
Sr. Unsec’d. Notes,144A, MTN | | | 5.250(cc) | | | | 09/01/37 | | | | | | | | 249 | | | | 74,863 | |
| | | | | | | | | | | | | | | | | | | | |
| | | | | |
| | | | | | | | | | | | | | | | | | | 79,720 | |
| | | | | |
Brazil 4.9% | | | | | | | | | | | | | | | | | | | | |
| | | | | |
Brazil Minas SPE via State of Minas Gerais,
Gov’t. Gtd. Notes | | | 5.333 | | | | 02/15/28 | | | | | | | | 141 | | | | 135,210 | |
Brazil Notas do Tesouro Nacional, | | | | | | | | | | | | | | | | | | | | |
Notes, Series NTNB | | | 6.000 | | | | 08/15/30 | | | | BRL | | | | 1,842 | | | | 365,277 | |
Notes, Series NTNB | | | 6.000 | | | | 05/15/35 | | | | BRL | | | | 514 | | | | 101,856 | |
Notes, Series NTNF | | | 10.000 | | | | 01/01/25 | | | | BRL | | | | 617 | | | | 115,502 | |
Notes, Series NTNF | | | 10.000 | | | | 01/01/27 | | | | BRL | | | | 2,969 | | | | 545,818 | |
Notes, Series NTNF | | | 10.000 | | | | 01/01/31 | | | | BRL | | | | 200 | | | | 35,242 | |
Brazilian Government International Bond,
Sr. Unsec’d. Notes | | | 8.500 | | | | 01/05/24 | | | | BRL | | | | 54 | | | | 9,785 | |
| | | | | | | | | | | | | | | | | | | | |
| | | | | |
| | | | | | | | | | | | | | | | | | | 1,308,690 | |
| | | | | |
Chile 1.8% | | | | | | | | | | | | | | | | | | | | |
| | | | | |
Bonos de la Tesoreria de la Republica en pesos,
Bonds | | | 5.000 | | | | 03/01/35 | | | | CLP | | | | 115,000 | | | | 107,752 | |
Bonds,144A | | | 5.000 | | | | 10/01/28 | | | | CLP | | | | 110,000 | | | | 106,859 | |
Bonds, Series 30YR | | | 6.000 | | | | 01/01/43 | | | | CLP | | | | 135,000 | | | | 136,882 | |
Unsec’d. Notes,144A | | | 2.800 | | | | 10/01/33 | | | | CLP | | | | 50,000 | | | | 38,099 | |
Unsec’d. Notes, 144A | | | 4.700 | | | | 09/01/30 | | | | CLP | | | | 95,000 | | | | 89,427 | |
| | | | | | | | | | | | | | | | | | | | |
| | | | | |
| | | | | | | | | | | | | | | | | | | 479,019 | |
| | | | | |
China 7.7% | | | | | | | | | | | | | | | | | | | | |
| | | | | |
China Government Bond, | | | | | | | | | | | | | | | | | | | | |
Bonds, Series 1906 | | | 3.290 | | | | 05/23/29 | | | | CNH | | | | 3,690 | | | | 525,342 | |
Bonds, Series 1910 | | | 3.860 | | | | 07/22/49 | | | | CNH | | | | 680 | | | | 104,553 | |
Bonds, Series INBK | | | 1.990 | | | | 04/09/25 | | | | CNH | | | | 5,500 | | | | 745,797 | |
Bonds, Series INBK | | | 2.850 | | | | 06/04/27 | | | | CNH | | | | 1,250 | | | | 173,462 | |
See Notes to Financial Statements.
14
| | | | | | | | | | | | | | | | | | | | |
| | | | |
| Description | | Interest
Rate | | | Maturity
Date | | | Principal Amount (000)# | | | Value | |
| | | | | |
SOVEREIGN BONDS (Continued) | | | | | | | | | | | | | | | | | | | | |
| | | | | |
China (cont’d.) | | | | | | | | | | | | | | | | | | | | |
| | | | | |
China Government Bond, (cont’d.) | | | | | | | | | | | | | | | | | | | | |
Bonds, Series INBK | | | 3.270% | | | | 11/19/30 | | | | CNH | | | | 2,890 | | | $ | 411,734 | |
Unsec’d. Notes,Series INBK | | | 3.810 | | | | 09/14/50 | | | | CNH | | | | 770 | | | | 117,801 | |
| | | | | | | | | | | | | | | | | | | | |
| | | | | |
| | | | | | | | | | | | | | | | | | | 2,078,689 | |
| | | | | |
Colombia 4.6% | | | | | | | | | | | | | | | | | | | | |
| | | | | |
Colombian TES, | | | | | | | | | | | | | | | | | | | | |
Bonds, Series B | | | 5.750 | | | | 11/03/27 | | | | COP | | | | 250,000 | | | | 36,699 | |
Bonds, Series B | | | 6.000 | | | | 04/28/28 | | | | COP | | | | 2,121,000 | | | | 305,145 | |
Bonds, Series B | | | 6.250 | | | | 07/09/36 | | | | COP | | | | 866,000 | | | | 95,016 | |
Bonds, Series B | | | 7.000 | | | | 03/26/31 | | | | COP | | | | 1,288,000 | | | | 174,060 | |
Bonds, Series B | | | 7.000 | | | | 06/30/32 | | | | COP | | | | 1,755,100 | | | | 227,846 | |
Bonds, Series B | | | 7.250 | | | | 10/18/34 | | | | COP | | | | 1,405,800 | | | | 177,819 | |
Bonds, Series B | | | 7.250 | | | | 10/26/50 | | | | COP | | | | 210,000 | | | | 22,718 | |
Bonds, Series B | | | 7.750 | | | | 09/18/30 | | | | COP | | | | 500,000 | | | | 72,491 | |
Bonds, Series G | | | 7.000 | | | | 03/26/31 | | | | COP | | | | 759,800 | | | | 102,844 | |
Sr. Unsec’d. Notes, Series UVR | | | 3.750 | | | | 06/16/49 | | | | COP | | | | 207,651 | | | | 27,449 | |
| | | | | | | | | | | | | | | | | | | | |
| | | | | |
| | | | | | | | | | | | | | | | | | | 1,242,087 | |
| | | | | |
Czech Republic 2.7% | | | | | | | | | | | | | | | | | | | | |
| | | | | |
Czech Republic Government Bond, | | | | | | | | | | | | | | | | | | | | |
Bonds, Series 049 | | | 4.200 | | | | 12/04/36 | | | | CZK | | | | 2,000 | | | | 69,073 | |
Bonds, Series 078 | | | 2.500 | | | | 08/25/28 | | | | CZK | | | | 2,100 | | | | 70,774 | |
Bonds, Series 094 | | | 0.950 | | | | 05/15/30 | | | | CZK | | | | 5,720 | | | | 161,254 | |
Bonds, Series 103 | | | 2.000 | | | | 10/13/33 | | | | CZK | | | | 7,340 | | | | 205,999 | |
Bonds, Series 105 | | | 2.750 | | | | 07/23/29 | | | | CZK | | | | 3,500 | | | | 115,710 | |
Bonds, Series 121 | | | 1.200 | | | | 03/13/31 | | | | CZK | | | | 3,300 | | | | 91,800 | |
| | | | | | | | | | | | | | | | | | | | |
| | | | | |
| | | | | | | | | | | | | | | | | | | 714,610 | |
| | | | | |
Hungary 3.5% | | | | | | | | | | | | | | | | | | | | |
| | | | | |
Hungary Government Bond, | | | | | | | | | | | | | | | | | | | | |
Bonds, Series 26/D | | | 2.750 | | | | 12/22/26 | | | | HUF | | | | 171,150 | | | | 291,842 | |
Bonds, Series 26/E | | | 1.500 | | | | 04/22/26 | | | | HUF | | | | 59,060 | | | | 101,267 | |
Bonds, Series 26/F | | | 1.500 | | | | 08/26/26 | | | | HUF | | | | 65,380 | | | | 108,533 | |
Bonds, Series 27/A | | | 3.000 | | | | 10/27/27 | | | | HUF | | | | 42,680 | | | | 70,817 | |
Bonds, Series 28/A | | | 6.750 | | | | 10/22/28 | | | | HUF | | | | 35,160 | | | | 69,245 | |
Bonds, Series 28/B | | | 4.500 | | | | 03/23/28 | | | | HUF | | | | 20,430 | | | | 35,800 | |
Bonds, Series 29/A | | | 2.000 | | | | 05/23/29 | | | | HUF | | | | 128,070 | | | | 187,684 | |
Bonds, Series 34/A | | | 2.250 | | | | 06/22/34 | | | | HUF | | | | 24,810 | | | | 29,555 | |
See Notes to Financial Statements.
PGIM Emerging Markets Debt Local Currency Fund 15
Schedule of Investments (continued)
as of October 31, 2021
| | | | | | | | | | | | | | | | | | | | |
| | | | |
| Description | | Interest
Rate | | | Maturity
Date | | | Principal Amount (000)# | | | Value | |
| | | | | |
SOVEREIGN BONDS (Continued) | | | | | | | | | | | | | | | | | | | | |
| | | | | |
Hungary (cont’d.) | | | | | | | | | | | | | | | | | | | | |
| | | | | |
Hungary Government Bond, (cont’d.) | | | | | | | | | | | | | | | | | | | | |
Bonds, Series 38/A | | | 3.000% | | | | 10/27/38 | | | | HUF | | | | 21,890 | | | $ | 25,300 | |
Bonds, Series 51/G | | | 4.000 | | | | 04/28/51 | | | | HUF | | | | 29,330 | | | | 33,864 | |
| | | | | | | | | | | | | | | | | | | | |
| | | | | |
| | | | | | | | | | | | | | | | | | | 953,907 | |
| | | | | |
Indonesia 10.7% | | | | | | | | | | | | | | | | | | | | |
| | | | | |
Indonesia Treasury Bond, | | | | | | | | | | | | | | | | | | | | |
Bonds, Series 056 | | | 8.375 | | | | 09/15/26 | | | | IDR | | | | 6,596,000 | | | | 438,112 | |
Bonds, Series 059 | | | 7.000 | | | | 05/15/27 | | | | IDR | | | | 2,362,000 | | | | 149,617 | |
Bonds, Series 068 | | | 8.375 | | | | 03/15/34 | | | | IDR | | | | 6,268,000 | | | | 420,345 | |
Bonds, Series 070 | | | 8.375 | | | | 03/15/24 | | | | IDR | | | | 1,410,000 | | | | 92,117 | |
Bonds, Series 071 | | | 9.000 | | | | 03/15/29 | | | | IDR | | | | 3,640,000 | | | | 250,640 | |
Bonds, Series 072 | | | 8.250 | | | | 05/15/36 | | | | IDR | | | | 2,433,000 | | | | 161,602 | |
Bonds, Series 073 | | | 8.750 | | | | 05/15/31 | | | | IDR | | | | 4,940,000 | | | | 338,096 | |
Bonds, Series 075 | | | 7.500 | | | | 05/15/38 | | | | IDR | | | | 3,754,000 | | | | 237,070 | |
Bonds, Series 078 | | | 8.250 | | | | 05/15/29 | | | | IDR | | | | 4,814,000 | | | | 320,213 | |
Bonds, Series 079 | | | 8.375 | | | | 04/15/39 | | | | IDR | | | | 400,000 | | | | 26,927 | |
Bonds, Series 081 | | | 6.500 | | | | 06/15/25 | | | | IDR | | | | 993,000 | | | | 62,900 | |
Bonds, Series 082 | | | 7.000 | | | | 09/15/30 | | | | IDR | | | | 5,915,000 | | | | 366,903 | |
| | | | | | | | | | | | | | | | | | | | |
| | | | | |
| | | | | | | | | | | | | | | | | | | 2,864,542 | |
| | | | | |
Malaysia 4.6% | | | | | | | | | | | | | | | | | | | | |
| | | | | |
Malaysia Government Bond, | | | | | | | | | | | | | | | | | | | | |
Bonds, Series 115 | | | 3.955 | | | | 09/15/25 | | | | MYR | | | | 680 | | | | 143,908 | |
Bonds, Series 118 | | | 3.882 | | | | 03/14/25 | | | | MYR | | | | 977 | | | | 206,848 | |
Bonds, Series 120 | | | 4.065 | | | | 06/15/50 | | | | MYR | | | | 660 | | | | 120,045 | |
Bonds, Series 219 | | | 3.885 | | | | 08/15/29 | | | | MYR | | | | 1,410 | | | | 287,860 | |
Bonds, Series 317 | | | 4.762 | | | | 04/07/37 | | | | MYR | | | | 842 | | | | 179,735 | |
Bonds, Series 411 | | | 4.232 | | | | 06/30/31 | | | | MYR | | | | 280 | | | | 57,831 | |
Bonds, Series 413 | | | 3.844 | | | | 04/15/33 | | | | MYR | | | | 390 | | | | 76,957 | |
Bonds, Series 419 | | | 3.828 | | | | 07/05/34 | | | | MYR | | | | 400 | | | | 77,901 | |
Malaysia Government Investment Issue, | | | | | | | | | | | | | | | | | | | | |
Bonds, Series 0121 | | | 3.447 | | | | 07/15/36 | | | | MYR | | | | 430 | | | | 78,319 | |
| | | | | | | | | | | | | | | | | | | | |
| | | | | |
| | | | | | | | | | | | | | | | | | | 1,229,404 | |
| | | | | |
Mexico 4.2% | | | | | | | | | | | | | | | | | | | | |
| | | | | |
Mexican Bonos, | | | | | | | | | | | | | | | | | | | | |
Bonds, Series M | | | 7.750 | | | | 05/29/31 | | | | MXN | | | | 6,610 | | | | 293,277 | |
Bonds, Series M | | | 8.000 | | | | 11/07/47 | | | | MXN | | | | 5,313 | | | | 219,419 | |
Bonds, Series M30 | | | 10.000 | | | | 11/20/36 | | | | MXN | | | | 1,718 | | | | 86,980 | |
See Notes to Financial Statements.
16
| | | | | | | | | | | | | | | | | | | | |
| | | | |
| Description | | Interest
Rate | | | Maturity
Date | | | Principal Amount (000)# | | | Value | |
| | | | | |
SOVEREIGN BONDS (Continued) | | | | | | | | | | | | | | | | | | | | |
| | | | | |
Mexico (cont’d.) | | | | | | | | | | | | | | | | | | | | |
| | | | | |
Mexican Bonos, (cont’d.) | | | | | | | | | | | | | | | | | | | | |
Sr. Unsec’d. Notes, Series M | | | 7.750% | | | | 11/13/42 | | | | MXN | | | | 4,192 | | | $ | 170,378 | |
Sr. Unsec’d. Notes, Series M30 | | | 8.500 | | | | 11/18/38 | | | | MXN | | | | 4,817 | | | | 213,716 | |
Mexican Udibonos, | | | | | | | | | | | | | | | | | | | | |
Bonds, Series S | | | 2.750 | | | | 11/27/31 | | | | MXN | | | | 3,210 | | | | 138,288 | |
| | | | | | | | | | | | | | | | | | | | |
| | | | | |
| | | | | | | | | | | | | | | | | | | 1,122,058 | |
| | | | | |
Pakistan 0.7% | | | | | | | | | | | | | | | | | | | | |
| | | | | |
Third Pakistan International Sukuk Co. Ltd. (The),
Sr. Unsec’d. Notes, 144A | | | 5.625 | | | | 12/05/22 | | | | | | | | 200 | | | | 179,022 | |
| | | | | |
Peru 2.4% | | | | | | | | | | | | | | | | | | | | |
| | | | | |
Peru Government Bond, | | | | | | | | | | | | | | | | | | | | |
Bonds | | | 5.940 | | | | 02/12/29 | | | | PEN | | | | 210 | | | | 47,288 | |
Bonds | | | 6.950 | | | | 08/12/31 | | | | PEN | | | | 190 | | | | 43,893 | |
Sr. Unsec’d. Notes | | | 5.350 | | | | 08/12/40 | | | | PEN | | | | 540 | | | | 96,390 | |
Sr. Unsec’d. Notes | | | 5.400 | | | | 08/12/34 | | | | PEN | | | | 580 | | | | 112,705 | |
Sr. Unsec’d. Notes | | | 6.150 | | | | 08/12/32 | | | | PEN | | | | 393 | | | | 84,101 | |
Peruvian Government International Bond, | | | | | | | | | | | | | | | | | | | | |
Sr. Unsec’d. Notes | | | 6.350 | | | | 08/12/28 | | | | PEN | | | | 435 | | | | 101,559 | |
Sr. Unsec’d. Notes | | | 6.850 | | | | 02/12/42 | | | | PEN | | | | 245 | | | | 52,072 | |
Sr. Unsec’d. Notes | | | 6.900 | | | | 08/12/37 | | | | PEN | | | | 7 | | | | 1,512 | |
Sr. Unsec’d. Notes | | | 6.950 | | | | 08/12/31 | | | | PEN | | | | 478 | | | | 110,427 | |
| | | | | | | | | | | | | | | | | | | | |
| | | | | |
| | | | | | | | | | | | | | | | | | | 649,947 | |
| | | | | |
Philippines 0.3% | | | | | | | | | | | | | | | | | | | | |
| | | | | |
Philippine Government Bond,
Bonds, Series 1060 | | | 3.625 | | | | 09/09/25 | | | | PHP | | | | 5,600 | | | | 89,591 | |
| | | | | |
Poland 6.3% | | | | | | | | | | | | | | | | | | | | |
| | | | | |
Republic of Poland Government Bond, | | | | | | | | | | | | | | | | | | | | |
Bonds, Series 0428 | | | 2.750 | | | | 04/25/28 | | | | PLN | | | | 1,480 | | | | 235,391 | |
Bonds, Series 0725 | | | 3.250 | | | | 07/25/25 | | | | PLN | | | | 3,021 | | | | 551,748 | |
Bonds, Series 0726 | | | 2.500 | | | | 07/25/26 | | | | PLN | | | | 2,960 | | | | 501,112 | |
Bonds, Series 1026 | | | 0.250 | | | | 10/25/26 | | | | PLN | | | | 280 | | | | 42,610 | |
Bonds, Series 1029 | | | 2.750 | | | | 10/25/29 | | | | PLN | | | | 1,740 | | | | 259,424 | |
Bonds, Series 1030 | | | 1.250 | | | | 10/25/30 | | | | PLN | | | | 750 | | | | 93,728 | |
| | | | | | | | | | | | | | | | | | | | |
| | | | | |
| | | | | | | | | | | | | | | | | | | 1,684,013 | |
See Notes to Financial Statements.
PGIM Emerging Markets Debt Local Currency Fund 17
Schedule of Investments (continued)
as of October 31, 2021
| | | | | | | | | | | | | | | | | | | | |
| | | | |
| Description | | Interest
Rate | | | Maturity
Date | | | Principal Amount (000)# | | | Value | |
| | | | | |
SOVEREIGN BONDS (Continued) | | | | | | | | | | | | | | | | | | | | |
| | | | | |
Romania 1.8% | | | | | | | | | | | | | | | | | | | | |
| | | | | |
Romania Government Bond, | | | | | | | | | | | | | | | | | | | | |
Bonds, Series 07YR | | | 3.250% | | | | 04/29/24 | | | | RON | | | | 750 | | | $ | 139,890 | |
Bonds, Series 07YR | | | 4.850 | | | | 04/22/26 | | | | RON | | | | 980 | | | | 172,796 | |
Bonds, Series 10YR | | | 5.850 | | | | 04/26/23 | | | | RON | | | | 460 | | | | 91,434 | |
Bonds, Series 15YR | | | 3.650 | | | | 09/24/31 | | | | RON | | | | 590 | | | | 79,941 | |
| | | | | | | | | | | | | | | | | | | | |
| | | | | |
| | | | | | | | | | | | | | | | | | | 484,061 | |
| | | | | |
Serbia 0.4% | | | | | | | | | | | | | | | | | | | | |
| | | | | |
Serbia Treasury Bonds, | | | | | | | | | | | | | | | | | | | | |
Bonds, Series 07YR | | | 4.500 | | | | 01/11/26 | | | | RSD | | | | 9,460 | | | | 73,659 | |
Bonds, Series 12.5 | | | 4.500 | | | | 08/20/32 | | | | RSD | | | | 6,240 | | | | 40,270 | |
| | | | | | | | | | | | | | | | | | | | |
| | | | | |
| | | | | | | | | | | | | | | | | | | 113,929 | |
| | | | | |
South Africa 13.9% | | | | | | | | | | | | | | | | | | | | |
| | | | | |
Republic of South Africa Government Bond, | | | | | | | | | | | | | | | | | | | | |
Sr. Unsec’d. Notes, Series 2030 | | | 8.000 | | | | 01/31/30 | | | | ZAR | | | | 12,695 | | | | 593,525 | |
Sr. Unsec’d. Notes, Series 2032 | | | 8.250 | | | | 03/31/32 | | | | ZAR | | | | 8,470 | | | | 379,620 | |
Sr. Unsec’d. Notes, Series 2035 | | | 8.875 | | | | 02/28/35 | | | | ZAR | | | | 11,074 | | | | 491,838 | |
Sr. Unsec’d. Notes, Series 2037 | | | 8.500 | | | | 01/31/37 | | | | ZAR | | | | 4,863 | | | | 203,819 | |
Sr. Unsec’d. Notes, Series 2040 | | | 9.000 | | | | 01/31/40 | | | | ZAR | | | | 2,480 | | | | 106,264 | |
Sr. Unsec’d. Notes, Series 2044 | | | 8.750 | | | | 01/31/44 | | | | ZAR | | | | 5,485 | | | | 226,341 | |
Sr. Unsec’d. Notes, Series 2048 | | | 8.750 | | | | 02/28/48 | | | | ZAR | | | | 2,955 | | | | 121,423 | |
Sr. Unsec’d. Notes, Series R186 | | | 10.500 | | | | 12/21/26 | | | | ZAR | | | | 17,734 | | | | 1,011,597 | |
Sr. Unsec’d. Notes, Series R209 | | | 6.250 | | | | 03/31/36 | | | | ZAR | | | | 3,850 | | | | 132,821 | |
Sr. Unsec’d. Notes, Series R213 | | | 7.000 | | | | 02/28/31 | | | | ZAR | | | | 7,550 | | | | 318,660 | |
Sr. Unsec’d. Notes, Series R214 | | | 6.500 | | | | 02/28/41 | | | | ZAR | | | | 4,565 | | | | 150,500 | |
| | | | | | | | | | | | | | | | | | | | |
| | | | | |
| | | | | | | | | | | | | | | | | | | 3,736,408 | |
| | | | | |
Thailand 7.0% | | | | | | | | | | | | | | | | | | | | |
| | | | | |
Thailand Government Bond, | | | | | | | | | | | | | | | | | | | | |
Bonds | | | 1.600 | | | | 12/17/29 | | | | THB | | | | 3,885 | | | | 92,845 | |
Bonds | | | 2.000 | | | | 06/17/42 | | | | THB | | | | 2,080 | | | | 39,159 | |
Bonds | | | 2.875 | | | | 12/17/28 | | | | THB | | | | 12,015 | | | | 313,475 | |
Bonds | | | 2.875 | | | | 06/17/46 | | | | THB | | | | 3,065 | | | | 64,119 | |
Bonds | | | 3.300 | | | | 06/17/38 | | | | THB | | | | 4,300 | | | | 104,845 | |
Bonds | | | 3.400 | | | | 06/17/36 | | | | THB | | | | 9,585 | | | | 239,893 | |
Sr. Unsec’d. Notes | | | 1.585 | | | | 12/17/35 | | | | THB | | | | 3,120 | | | | 64,077 | |
Sr. Unsec’d. Notes | | | 1.600 | | | | 06/17/35 | | | | THB | | | | 2,700 | | | | 56,021 | |
Sr. Unsec’d. Notes | | | 1.875 | | | | 06/17/49 | | | | THB | | | | 1,063 | | | | 17,398 | |
Sr. Unsec’d. Notes | | | 2.000 | | | | 12/17/31 | | | | THB | | | | 18,625 | | | | 445,015 | |
See Notes to Financial Statements.
18
| | | | | | | | | | | | | | | | | | | | |
| | | | |
| Description | | Interest
Rate | | | Maturity
Date | | | Principal Amount (000)# | | | Value | |
| | | | | |
SOVEREIGN BONDS (Continued) | | | | | | | | | | | | | | | | | | | | |
| | | | | |
Thailand (cont’d.) | | | | | | | | | | | | | | | | | | | | |
| | | | | |
Thailand Government Bond, (cont’d.) | | | | | | | | | | | | | | | | | | | | |
Sr. Unsec’d. Notes | | | 2.125% | | | | 12/17/26 | | | | THB | | | | 4,535 | | | $ | 116,766 | |
Sr. Unsec’d. Notes | | | 3.650 | | | | 06/20/31 | | | | THB | | | | 2,559 | | | | 69,497 | |
Sr. Unsec’d. Notes | | | 3.775 | | | | 06/25/32 | | | | THB | | | | 9,780 | | | | 268,468 | |
| | | | | | | | | | | | | | | | | | | | |
| | | | | |
| | | | | | | | | | | | | | | | | | | 1,891,578 | |
| | | | | |
Ukraine 0.2% | | | | | | | | | | | | | | | | | | | | |
| | | | | |
Ukraine Government International Bond, | | | | | | | | | | | | | | | | | | | | |
Sr. Unsec’d. Notes | | | 6.750 | | | | 06/20/28 | (d) | | | EUR | | | | 150 | | | | 24,302 | |
Sr. Unsec’d. Notes | | | 7.750 | | | | 09/01/26 | (d) | | | | | | | 222 | | | | 36,602 | |
| | | | | | | | | | | | | | | | | | | | |
| | | | | |
| | | | | | | | | | | | | | | | | | | 60,904 | |
| | | | | |
Uruguay 0.2% | | | | | | | | | | | | | | | | | | | | |
| | | | | |
Uruguay Government International Bond, | | | | | | | | | | | | | | | | | | | | |
Sr. Unsec’d. Notes,144A | | | 8.500 | | | | 03/15/28 | | | | UYU | | | | 1,870 | | | | 40,928 | |
| | | | | | | | | | | | | | | | | | | | |
| | | | | |
TOTAL SOVEREIGN BONDS
(cost $27,908,565) | | | | | | | | | | | | | | | | | | | 21,197,607 | |
| | | | | | | | | | | | | | | | | | | | |
| | | | | |
TOTAL LONG-TERM INVESTMENTS
(cost $30,317,423) | | | | | | | | | | | | | | | | | | | 23,075,807 | |
| | | | | | | | | | | | | | | | | | | | |
| | | | |
| | | | | | | | | Principal Amount (000)# | | | | |
| | | | | |
SHORT-TERM INVESTMENTS 8.5% | | | | | | | | | | | | | | | | | | | | |
| | | | | |
U.S. TREASURY OBLIGATION(n) 7.6% | | | | | | | | | | | | | | | | | | | | |
U.S. Treasury Bills
(cost $2,059,773) | | | 3.974% | | | | 09/07/23 | | | | | | | | 2,130 | | | | 2,050,426 | |
| | | | | | | | | | | | | | | | | | | | |
See Notes to Financial Statements.
PGIM Emerging Markets Debt Local Currency Fund 19
Schedule of Investments (continued)
as of October 31, 2022
| | | | | | | | |
| | |
| Description | | Shares | | | Value | |
| | |
UNAFFILIATED FUND 0.7% | | | | | | | | |
Dreyfus Government Cash Management (Institutional Shares)
(cost $186,299) | | | 186,299 | | | $ | 186,299 | |
| | | | | | | | |
| | |
OPTIONS PURCHASED*~ 0.2%
(cost $13,054) | | | | | | | 49,825 | |
| | | | | | | | |
| | |
TOTAL SHORT-TERM INVESTMENTS
(cost $2,259,126) | | | | | | | 2,286,550 | |
| | | | | | | | |
| | |
TOTAL INVESTMENTS, BEFORE OPTIONS WRITTEN 94.4%
(cost $32,576,549) | | | | | | | 25,362,357 | |
| | | | | | | | |
| | |
OPTIONS WRITTEN*~ (0.5)% | | | | | | | | |
(premiums received $122,089) | | | | | | | (149,315 | ) |
| | | | | | | | |
| | |
TOTAL INVESTMENTS, NET OF OPTIONS WRITTEN 93.9% | | | | | | | | |
(cost $32,454,460) | | | | | | | 25,213,042 | |
| | |
Other assets in excess of liabilities(z) 6.1% | | | | | | | 1,644,810 | |
| | | | | | | | |
| | |
NET ASSETS 100.0% | | | | | | $ | 26,857,852 | |
| | | | | | | | |
Below is a list of the abbreviation(s) used in the annual report:
AUD—Australian Dollar
BRL—Brazilian Real
CLP—Chilean Peso
CNH—Chinese Renminbi
COP—Colombian Peso
CZK—Czech Koruna
EGP—Egyptian Pound
EUR—Euro
HUF—Hungarian Forint
IDR—Indonesian Rupiah
ILS—Israeli Shekel
INR—Indian Rupee
KRW—South Korean Won
MXN—Mexican Peso
MYR—Malaysian Ringgit
PEN—Peruvian Nuevo Sol
PHP—Philippine Peso
PLN—Polish Zloty
RON—Romanian Leu
RSD—Serbian Dinar
SGD—Singapore Dollar
THB—Thai Baht
TRY—Turkish Lira
TWD—New Taiwanese Dollar
USD—US Dollar
UYU—Uruguayan Peso
See Notes to Financial Statements.
20
ZAR—South African Rand
144A—Security was purchased pursuant to Rule 144A under the Securities Act of 1933 and, pursuant to the requirements of Rule 144A, may not be resold except to qualified institutional buyers.
A—Annual payment frequency for swaps
BARC—Barclays Bank PLC
BNP—BNP Paribas S.A.
BOA—Bank of America, N.A.
BROIS—Brazil Overnight Index Swap
BUBOR—Budapest Interbank Offered Rate
CDX—Credit Derivative Index
CIGM—Citigroup Global Markets, Inc.
CITI—Citibank, N.A.
CLOIS—Sinacofi Chile Interbank Rate Average
COOIS—Colombia Overnight Interbank Reference Rate
DB—Deutsche Bank AG
EMTN—Euro Medium Term Note
GSI—Goldman Sachs International
HSBC—HSBC Bank PLC
JIBAR—Johannesburg Interbank Agreed Rate
JPM—JPMorgan Chase Bank N.A.
JPS—J.P. Morgan Securities LLC
KLIBOR—Kuala Lumpur Interbank Offered Rate
KWCDC—Korean Won Certificate of Deposit
LIBOR—London Interbank Offered Rate
M—Monthly payment frequency for swaps
MSI—Morgan Stanley & Co International PLC
MTN—Medium Term Note
OTC—Over-the-counter
PRIBOR—Prague Interbank Offered Rate
Q—Quarterly payment frequency for swaps
S—Semiannual payment frequency for swaps
SCB—Standard Chartered Bank
SOFR—Secured Overnight Financing Rate
T—Swap payment upon termination
TD—The Toronto-Dominion Bank
THOR—Thai Overnight Repurchase Rate
UAG—UBS AG
WIBOR—Warsaw Interbank Offered Rate
| * | Non-income producing security. |
| # | Principal or notional amount is shown in U.S. dollars unless otherwise stated. |
| ~ | See tables subsequent to the Schedule of Investments for options detail. |
| (cc) | Variable rate instrument. The rate shown is based on the latest available information as of October 31, 2022. Certain variable rate securities are not based on a published reference rate and spread but are determined by the issuer or agent and are based on current market conditions. These securities do not indicate a reference rate and spread in their description. |
| (d) | Represents issuer in default on interest payments and/or principal repayment. Non-income producing security. Such securities may be post-maturity. |
| (n) | Rate shown reflects yield to maturity at purchased date. |
| (s) | Represents zero coupon bond or principal only security. Rate represents yield to maturity at purchase date. |
| (z) | Includes net unrealized appreciation/(depreciation) and/or market value of the below holdings which are excluded from the Schedule of Investments: |
See Notes to Financial Statements.
PGIM Emerging Markets Debt Local Currency Fund 21
Schedule of Investments (continued)
as of October 31, 2021
Options Purchased:
OTC Traded
| | | | | | | | | | | | | | | | | | | | | | | | |
Description | | Call/
Put | | | Counterparty | | Expiration
Date | | | Strike | | | Contracts | | Notional
Amount
(000)# | | | Value | |
Currency Option USD vs CNH | | | Call | | | CITI | | | 11/11/22 | | | | 7.15 | | | — | | | 1,152 | | | $ | 29,772 | |
Currency Option USD vs CNH | | | Call | | | MSI | | | 11/11/22 | | | | 7.80 | | | — | | | 1,152 | | | | 145 | |
Currency Option USD vs INR | | | Call | | | JPM | | | 01/05/23 | | | | 81.50 | | | — | | | 717 | | | | 18,860 | |
Currency Option USD vs ZAR | | | Call | | | MSI | | | 01/03/23 | | | | 23.50 | | | — | | | 2,218 | | | | 1,016 | |
Currency Option USD vs CNH | | | Put | | | CITI | | | 11/11/22 | | | | 6.50 | | | — | | | 576 | | | | — | |
Currency Option USD vs CNH | | | Put | | | MSI | | | 11/11/22 | | | | 6.90 | | | — | | | 576 | | | | 22 | |
Currency Option USD vs CNH | | | Put | | | CITI | | | 11/28/22 | | | | 6.55 | | | — | | | 536 | | | | 5 | |
Currency Option USD vs CNH | | | Put | | | MSI | | | 12/08/22 | | | | 6.00 | | | — | | | 274 | | | | — | |
Currency Option USD vs MXN | | | Put | | | MSI | | | 12/05/22 | | | | 17.00 | | | — | | | 1,110 | | | | 5 | |
| | | | | | | | | | | | | | | | | | | | | | | | |
| | | | | |
Total Options Purchased (cost $ 13,054) | | | | | | | | | | | | | | | | $ | 49,825 | |
| | | | | | | | | | | | | | | | | | | | | | | | |
Options Written:
OTC Traded
| | | | | | | | | | | | | | | | | | | | | | |
Description | | Call/
Put | | | Counterparty | | Expiration
Date | | Strike | | | Contracts | | Notional
Amount
(000)# | | | Value | |
Currency Option USD vs CNH | | | Call | | | MSI | | 11/11/22 | | | 7.15 | | | — | | | 1,152 | | | $ | (29,772 | ) |
Currency Option USD vs CNH | | | Call | | | MSI | | 11/11/22 | | | 7.35 | | | — | | | 1,152 | | | | (8,093 | ) |
Currency Option USD vs INR | | | Call | | | JPM | | 01/05/23 | | | 83.50 | | | — | | | 717 | | | | (8,321 | ) |
Currency Option USD vs CNH | | | Put | | | CITI | | 11/11/22 | | | 6.90 | | | — | | | 576 | | | | (22 | ) |
Currency Option USD vs CNH | | | Put | | | CITI | | 11/28/22 | | | 7.05 | | | — | | | 536 | | | | (662 | ) |
Currency Option USD vs MXN | | | Put | | | MSI | | 12/05/22 | | | 21.75 | | | — | | | 1,110 | | | | (102,445 | ) |
| | | | | | | | | | | | | | | | | | | | | | |
| | | | | |
Total Options Written (premiums received $122,089) | | | | | | | | | | | | | | $ | (149,315 | ) |
| | | | | | | | | | | | | | | | | | | | | | |
Futures contracts outstanding at October 31, 2022:
| | | | | | | | | | | | | | |
Number of Contracts | | Type | | Expiration
Date | | | Current
Notional
Amount | | | Value /
Unrealized
Appreciation
(Depreciation) | |
Short Positions: | | | | | | | | | | | | |
6 | | 2 Year U.S. Treasury Notes | | | Dec. 2022 | | | $ | 1,226,297 | | | $ | 12,767 | |
5 | | 5 Year U.S. Treasury Notes | | | Dec. 2022 | | | | 532,968 | | | | 23,119 | |
1 | | 10 Year U.S. Treasury Notes | | | Dec. 2022 | | | | 110,594 | | | | 6,748 | |
| | | | | | | | | | | | | | |
| | | | | | | | | | | | $ | 42,634 | |
| | | | | | | | | | | | | | |
See Notes to Financial Statements.
22
Forward foreign currency exchange contracts outstanding at October 31, 2022:
| | | | | | | | | | | | | | | | | | | | | | | | | | |
Purchase Contracts | | Counterparty | | Notional
Amount
(000) | | | Value at
Settlement
Date | | | Current
Value | | | Unrealized
Appreciation | | | Unrealized
Depreciation | |
OTC Forward Foreign Currency Exchange Contracts: | | | | | | | | | | | | | | | | | |
Australian Dollar, | | | | | | | | | | | | | | | | | | | | | | | | | | |
Expiring 01/19/23 | | BNP | | | AUD | | | | 103 | | | $ | 66,000 | | | $ | 65,983 | | | $ | — | | | $ | (17 | ) |
Expiring 01/19/23 | | JPM | | | AUD | | | | 105 | | | | 67,000 | | | | 67,316 | | | | 316 | | | | — | |
Expiring 01/19/23 | | MSI | | | AUD | | | | 213 | | | | 134,607 | | | | 136,619 | | | | 2,012 | | | | — | |
Brazilian Real, | | | | | | | | | | | | | | | | | | | | | | | | | | |
Expiring 11/03/22 | | CITI | | | BRL | | | | 7,574 | | | | 1,468,417 | | | | 1,465,124 | | | | — | | | | (3,293 | ) |
Expiring 11/03/22 | | CITI | | | BRL | | | | 355 | | | | 67,000 | | | | 68,740 | | | | 1,740 | | | | — | |
Expiring 11/03/22 | | GSI | | | BRL | | | | 605 | | | | 114,000 | | | | 117,127 | | | | 3,127 | | | | — | |
Expiring 11/03/22 | | GSI | | | BRL | | | | 317 | | | | 60,756 | | | | 61,263 | | | | 507 | | | | — | |
Expiring 11/03/22 | | TD | | | BRL | | | | 214 | | | | 41,000 | | | | 41,398 | | | | 398 | | | | — | |
Expiring 12/02/22 | | CITI | | | BRL | | | | 8,694 | | | | 1,613,524 | | | | 1,670,932 | | | | 57,408 | | | | — | |
Chilean Peso, | | | | | | | | | | | | | | | | | | | | | | | | | | |
Expiring 12/21/22 | | BARC | | | CLP | | | | 77,339 | | | | 79,323 | | | | 81,252 | | | | 1,929 | | | | — | |
Expiring 12/21/22 | | BARC | | | CLP | | | | 56,768 | | | | 57,677 | | | | 59,641 | | | | 1,964 | | | | — | |
Expiring 12/21/22 | | UAG | | | CLP | | | | 29,393 | | | | 32,409 | | | | 30,880 | | | | — | | | | (1,529 | ) |
Chinese Renminbi, | | | | | | | | | | | | | | | | | | | | | | | | | | |
Expiring 11/23/22 | | BOA | | | CNH | | | | 2,444 | | | | 354,000 | | | | 333,570 | | | | — | | | | (20,430 | ) |
Expiring 11/23/22 | | BOA | | | CNH | | | | 2,310 | | | | 335,000 | | | | 315,276 | | | | — | | | | (19,724 | ) |
Expiring 11/23/22 | | BOA | | | CNH | | | | 1,901 | | | | 260,000 | | | | 259,474 | | | | — | | | | (526 | ) |
Expiring 11/23/22 | | CITI | | | CNH | | | | 1,999 | | | | 275,999 | | | | 272,785 | | | | — | | | | (3,214 | ) |
Expiring 11/23/22 | | DB | | | CNH | | | | 85 | | | | 11,880 | | | | 11,659 | | | | — | | | | (221 | ) |
Expiring 11/23/22 | | GSI | | | CNH | | | | 1,954 | | | | 273,000 | | | | 266,669 | | | | — | | | | (6,331 | ) |
Expiring 11/23/22 | | GSI | | | CNH | | | | 1,700 | | | | 241,000 | | | | 232,043 | | | | — | | | | (8,957 | ) |
Expiring 11/23/22 | | HSBC | | | CNH | | | | 1,849 | | | | 268,000 | | | | 252,349 | | | | — | | | | (15,651 | ) |
Expiring 11/23/22 | | HSBC | | | CNH | | | | 1,340 | | | | 188,000 | | | | 182,897 | | | | — | | | | (5,103 | ) |
Expiring 11/23/22 | | JPM | | | CNH | | | | 3,830 | | | | 550,000 | | | | 522,745 | | | | — | | | | (27,255 | ) |
Expiring 11/23/22 | | JPM | | | CNH | | | | 2,423 | | | | 348,000 | | | | 330,763 | | | | — | | | | (17,237 | ) |
Expiring 11/23/22 | | JPM | | | CNH | | | | 2,333 | | | | 335,000 | | | | 318,400 | | | | — | | | | (16,600 | ) |
Expiring 11/23/22 | | JPM | | | CNH | | | | 276 | | | | 37,668 | | | | 37,635 | | | | — | | | | (33 | ) |
Expiring 11/23/22 | | JPM | | | CNH | | | | 269 | | | | 39,079 | | | | 36,713 | | | | — | | | | (2,366 | ) |
Colombian Peso, | | | | | | | | | | | | | | | | | | | | | | | | | | |
Expiring 12/21/22 | | CITI | | | COP | | | | 563,327 | | | | 116,000 | | | | 113,046 | | | | — | | | | (2,954 | ) |
Expiring 12/21/22 | | MSI | | | COP | | | | 610,287 | | | | 124,000 | | | | 122,469 | | | | — | | | | (1,531 | ) |
Expiring 12/21/22 | | UAG | | | COP | | | | 1,233,851 | | | | 253,000 | | | | 247,603 | | | | — | | | | (5,397 | ) |
Czech Koruna, | | | | | | | | | | | | | | | | | | | | | | | | | | |
Expiring 01/19/23 | | JPM | | | CZK | | | | 1,420 | | | | 57,066 | | | | 57,050 | | | | — | | | | (16 | ) |
Egyptian Pound, | | | | | | | | | | | | | | | | | | | | | | | | | | |
Expiring 11/30/22 | | CITI | | | EGP | | | | 4,319 | | | | 210,277 | | | | 177,339 | | | | — | | | | (32,938 | ) |
Expiring 11/30/22 | | CITI | | | EGP | | | | 3,247 | | | | 162,200 | | | | 133,330 | | | | — | | | | (28,870 | ) |
Expiring 11/30/22 | | CITI | | | EGP | | | | 1,294 | | | | 64,000 | | | | 53,134 | | | | — | | | | (10,866 | ) |
Expiring 11/30/22 | | CITI | | | EGP | | | | 587 | | | | 28,000 | | | | 24,120 | | | | — | | | | (3,880 | ) |
Expiring 11/30/22 | | CITI | | | EGP | | | | 483 | | | | 23,000 | | | | 19,832 | | | | — | | | | (3,168 | ) |
Expiring 11/30/22 | | MSI | | | EGP | | | | 1,042 | | | | 51,000 | | | | 42,770 | | | | — | | | | (8,230 | ) |
See Notes to Financial Statements.
PGIM Emerging Markets Debt Local Currency Fund 23
Schedule of Investments (continued)
as of October 31, 2022
Forward foreign currency exchange contracts outstanding at October 31, 2022 (continued):
| | | | | | | | | | | | | | | | | | | | | | | | | | |
Purchase Contracts | | Counterparty | | Notional
Amount
(000) | | | Value at
Settlement
Date | | | Current
Value | | | Unrealized
Appreciation | | | Unrealized
Depreciation | |
| | | | | |
OTC Forward Foreign Currency Exchange Contracts (cont’d.): | | | | | | | | | | | | | | | | | | | | | |
Egyptian Pound (cont’d.), | | | | | | | | | | | | | | | | | | | | | | | | | | |
Expiring 12/20/22 | | MSI | | | EGP | | | | 891 | | | $ | 40,119 | | | $ | 36,343 | | | | $ — | | | | $ (3,776) | |
Expiring 12/27/22 | | SCB | | | EGP | | | | 1,058 | | | | 48,000 | | | | 43,095 | | | | — | | | | (4,905) | |
Euro, | | | | | | | | | | | | | | | | | | | | | | | | | | |
Expiring 01/19/23 | | BOA | | | EUR | | | | 172 | | | | 168,081 | | | | 171,237 | | | | 3,156 | | | | — | |
Expiring 01/19/23 | | MSI | | | EUR | | | | 172 | | | | 172,271 | | | | 171,131 | | | | — | | | | (1,140 | ) |
Expiring 01/19/23 | | MSI | | | EUR | | | | 122 | | | | 122,882 | | | | 120,886 | | | | — | | | | (1,996 | ) |
Hungarian Forint, | | | | | | | | | | | | | | | | | | | | | | | | | | |
Expiring 12/21/22 | | MSI | | | HUF | | | | 104,487 | | | | 241,030 | | | | 248,488 | | | | 7,458 | | | | — | |
Expiring 01/19/23 | | BARC | | | HUF | | | | 42,161 | | | | 97,200 | | | | 99,400 | | | | 2,200 | | | | — | |
Expiring 01/19/23 | | GSI | | | HUF | | | | 49,052 | | | | 114,000 | | | | 115,645 | | | | 1,645 | | | | — | |
Expiring 01/19/23 | | MSI | | | HUF | | | | 186,421 | | | | 424,449 | | | | 439,508 | | | | 15,059 | | | | — | |
Expiring 01/19/23 | | MSI | | | HUF | | | | 149,356 | | | | 327,034 | | | | 352,124 | | | | 25,090 | | | | — | |
Indian Rupee, | | | | | | | | | | | | | | | | | | | | | | | | | | |
Expiring 12/21/22 | | MSI | | | INR | | | | 22,468 | | | | 273,000 | | | | 269,743 | | | | — | | | | (3,257 | ) |
Expiring 12/21/22 | | TD | | | INR | | | | 47,827 | | | | 599,003 | | | | 574,201 | | | | — | | | | (24,802 | ) |
Indonesian Rupiah, | | | | | | | | | | | | | | | | | | | | | | | | | | |
Expiring 12/21/22 | | BOA | | | IDR | | | | 3,248,676 | | | | 213,000 | | | | 207,544 | | | | — | | | | (5,456 | ) |
Expiring 12/21/22 | | CITI | | | IDR | | | | 1,525,447 | | | | 101,649 | | | | 97,454 | | | | — | | | | (4,195 | ) |
Expiring 12/21/22 | | HSBC | | | IDR | | | | 5,744,726 | | | | 377,000 | | | | 367,006 | | | | — | | | | (9,994 | ) |
Expiring 12/21/22 | | HSBC | | | IDR | | | | 3,891,968 | | | | 256,000 | | | | 248,641 | | | | — | | | | (7,359 | ) |
Expiring 12/21/22 | | HSBC | | | IDR | | | | 951,700 | | | | 62,000 | | | | 60,800 | | | | — | | | | (1,200 | ) |
Expiring 12/21/22 | | JPM | | | IDR | | | | 4,189,916 | | | | 270,448 | | | | 267,676 | | | | — | | | | (2,772 | ) |
Expiring 12/21/22 | | SCB | | | IDR | | | | 4,908,900 | | | | 319,000 | | | | 313,609 | | | | — | | | | (5,391 | ) |
Expiring 12/21/22 | | SCB | | | IDR | | | | 3,158,309 | | | | 207,000 | | | | 201,771 | | | | — | | | | (5,229 | ) |
Israeli Shekel, | | | | | | | | | | | | | | | | | | | | | | | | | | |
Expiring 12/21/22 | | BARC | | | ILS | | | | 1,123 | | | | 322,000 | | | | 319,277 | | | | — | | | | (2,723 | ) |
Expiring 12/21/22 | | BARC | | | ILS | | | | 146 | | | | 41,000 | | | | 41,447 | | | | 447 | | | | — | |
Expiring 12/21/22 | | BOA | | | ILS | | | | 113 | | | | 32,000 | | | | 32,126 | | | | 126 | | | | — | |
Expiring 12/21/22 | | CITI | | | ILS | | | | 510 | | | | 145,597 | | | | 144,945 | | | | — | | | | (652 | ) |
Expiring 12/21/22 | | UAG | | | ILS | | | | 138 | | | | 40,490 | | | | 39,243 | | | | — | | | | (1,247 | ) |
Malaysian Ringgit, | | | | | | | | | | | | | | | | | | | | | | | | | | |
Expiring 12/21/22 | | BARC | | | MYR | | | | 6,912 | | | | 1,538,600 | | | | 1,462,383 | | | | — | | | | (76,217 | ) |
Expiring 12/21/22 | | BARC | | | MYR | | | | 157 | | | | 33,231 | | | | 33,283 | | | | 52 | | | | — | |
Expiring 12/21/22 | | MSI | | | MYR | | | | 242 | | | | 51,092 | | | | 51,209 | | | | 117 | | | | — | |
Mexican Peso, | | | | | | | | | | | | | | | | | | | | | | | | | | |
Expiring 12/21/22 | | HSBC | | | MXN | | | | 13,690 | | | | 668,072 | | | | 684,615 | | | | 16,543 | | | | — | |
New Taiwanese Dollar, | | | | | | | | | | | | | | | | | | | | | | | | | | |
Expiring 12/21/22 | | BARC | | | TWD | | | | 6,278 | | | | 201,000 | | | | 194,776 | | | | — | | | | (6,224 | ) |
Expiring 12/21/22 | | BOA | | | TWD | | | | 11,119 | | | | 352,000 | | | | 344,960 | | | | — | | | | (7,040 | ) |
Expiring 12/21/22 | | JPM | | | TWD | | | | 12,834 | | | | 405,000 | | | | 398,171 | | | | — | | | | (6,829 | ) |
Expiring 12/21/22 | | JPM | | | TWD | | | | 964 | | | | 31,002 | | | | 29,911 | | | | — | | | | (1,091 | ) |
Expiring 12/21/22 | | MSI | | | TWD | | | | 9,638 | | | | 308,000 | | | | 299,018 | | | | — | | | | (8,982 | ) |
See Notes to Financial Statements.
24
Forward foreign currency exchange contracts outstanding at October 31, 2022 (continued):
| | | | | | | | | | | | | | | | | | | | | | | | | | |
Purchase Contracts | | Counterparty | | Notional
Amount
(000) | | | Value at
Settlement
Date | | | Current
Value | | | Unrealized
Appreciation | | | Unrealized
Depreciation | |
| | | | |
OTC Forward Foreign Currency Exchange Contracts (cont’d.): | | | | | | | | | | | | | | | | | |
Peruvian Nuevo Sol, | | | | | | | | | | | | | | | | | | | | | | | | |
Expiring 12/21/22 | | BARC | | | PEN | | | | 399 | | | $ | 100,010 | | | $ | 99,447 | | | $ | — | | | $ | (563 | ) |
Expiring 12/21/22 | | BARC | | | PEN | | | | 148 | | | | 36,990 | | | | 36,953 | | | | — | | | | (37 | ) |
Expiring 12/21/22 | | BNP | | | PEN | | | | 754 | | | | 191,481 | | | | 188,023 | | | | — | | | | (3,458 | ) |
Philippine Peso, | | | | | | | | | | | | | | | | | | | | | | | | | | |
Expiring 12/21/22 | | CITI | | | PHP | | | | 15,649 | | | | 263,000 | | | | 268,251 | | | | 5,251 | | | | — | |
Polish Zloty, | | | | | | | | | | | | | | | | | | | | | | | | | | |
Expiring 01/19/23 | | DB | | | PLN | | | | 596 | | | | 118,000 | | | | 122,931 | | | | 4,931 | | | | — | |
Expiring 01/19/23 | | JPM | | | PLN | | | | 1,146 | | | | 232,000 | | | | 236,515 | | | | 4,515 | | | | — | |
Expiring 01/19/23 | | JPM | | | PLN | | | | 741 | | | | 146,000 | | | | 152,981 | | | | 6,981 | | | | — | |
Expiring 01/19/23 | | MSI | | | PLN | | | | 752 | | | | 148,000 | | | | 155,129 | | | | 7,129 | | | | — | |
Romanian Leu, | | | | | | | | | | | | | | | | | | | | | | | | | | |
Expiring 01/19/23 | | JPM | | | RON | | | | 2,147 | | | | 417,354 | | | | 428,712 | | | | 11,358 | | | | — | |
Singapore Dollar, | | | | | | | | | | | | | | | | | | | | | | | | | | |
Expiring 12/21/22 | | BNP | | | SGD | | | | 79 | | | | 56,211 | | | | 55,880 | | | | — | | | | (331 | ) |
Expiring 12/21/22 | | JPM | | | SGD | | | | 461 | | | | 321,000 | | | | 325,595 | | | | 4,595 | | | | — | |
South African Rand, | | | | | | | | | | | | | | | | | | | | | | | | | | |
Expiring 12/21/22 | | BOA | | | ZAR | | | | 2,238 | | | | 126,000 | | | | 121,379 | | | | — | | | | (4,621 | ) |
Expiring 12/21/22 | | GSI | | | ZAR | | | | 2,458 | | | | 134,000 | | | | 133,267 | | | | — | | | | (733 | ) |
Expiring 12/21/22 | | JPM | | | ZAR | | | | 3,479 | | | | 191,000 | | | | 188,639 | | | | — | | | | (2,361 | ) |
Expiring 12/21/22 | | JPM | | | ZAR | | | | 2,696 | | | | 153,000 | | | | 146,200 | | | | — | | | | (6,800 | ) |
Expiring 12/21/22 | | JPM | | | ZAR | | | | 2,446 | | | | 132,000 | | | | 132,627 | | | | 627 | | | | — | |
Expiring 12/21/22 | | JPM | | | ZAR | | | | 2,259 | | | | 124,000 | | | | 122,492 | | | | — | | | | (1,508 | ) |
Expiring 12/21/22 | | JPM | | | ZAR | | | | 1,419 | | | | 78,400 | | | | 76,919 | | | | — | | | | (1,481 | ) |
Expiring 12/21/22 | | MSI | | | ZAR | | | | 2,530 | | | | 139,000 | | | | 137,192 | | | | — | | | | (1,808 | ) |
Expiring 12/21/22 | | MSI | | | ZAR | | | | 2,445 | | | | 136,000 | | | | 132,575 | | | | — | | | | (3,425 | ) |
Expiring 12/21/22 | | MSI | | | ZAR | | | | 2,160 | | | | 121,000 | | | | 117,128 | | | | — | | | | (3,872 | ) |
Expiring 12/21/22 | | MSI | | | ZAR | | | | 1,930 | | | | 106,000 | | | | 104,651 | | | | — | | | | (1,349 | ) |
Expiring 12/21/22 | | UAG | | | ZAR | | | | 470 | | | | 25,929 | | | | 25,469 | | | | — | | | | (460 | ) |
South Korean Won, | | | | | | | | | | | | | | | | | | | | | | | | | | |
Expiring 12/21/22 | | BOA | | | KRW | | | | 429,232 | | | | 309,000 | | | | 301,034 | | | | — | | | | (7,966 | ) |
Expiring 12/21/22 | | CITI | | | KRW | | | | 191,529 | | | | 134,000 | | | | 134,326 | | | | 326 | | | | — | |
Expiring 12/21/22 | | JPM | | | KRW | | | | 419,156 | | | | 304,000 | | | | 293,968 | | | | — | | | | (10,032 | ) |
Expiring 12/21/22 | | JPM | | | KRW | | | | 366,392 | | | | 259,000 | | | | 256,963 | | | | — | | | | (2,037 | ) |
Expiring 12/21/22 | | JPM | | | KRW | | | | 334,304 | | | | 244,000 | | | | 234,459 | | | | — | | | | (9,541 | ) |
Thai Baht, | | | | | | | | | | | | | | | | | | | | | | | | | | |
Expiring 12/21/22 | | BOA | | | THB | | | | 2,511 | | | | 66,500 | | | | 66,273 | | | | — | | | | (227 | ) |
Expiring 12/21/22 | | GSI | | | THB | | | | 13,187 | | | | 348,000 | | | | 348,116 | | | | 116 | | | | — | |
Expiring 12/21/22 | | GSI | | | THB | | | | 12,260 | | | | 324,000 | | | | 323,621 | | | | — | | | | (379 | ) |
Expiring 12/21/22 | | HSBC | | | THB | | | | 13,667 | | | | 374,000 | | | | 360,787 | | | | — | | | | (13,213 | ) |
Expiring 12/21/22 | | JPM | | | THB | | | | 8,248 | | | | 222,000 | | | | 217,716 | | | | — | | | | (4,284 | ) |
Expiring 12/21/22 | | JPM | | | THB | | | | 2,504 | | | | 66,500 | | | | 66,111 | | | | — | | | | (389 | ) |
Expiring 12/21/22 | | JPM | | | THB | | | | 2,180 | | | | 58,026 | | | | 57,548 | | | | — | | | | (478 | ) |
See Notes to Financial Statements.
PGIM Emerging Markets Debt Local Currency Fund 25
Schedule of Investments (continued)
as of October 31, 2022
Forward foreign currency exchange contracts outstanding at October 31, 2022 (continued):
| | | | | | | | | | | | | | | | | | | | | | |
| | | | | | | | | | | | | | | | | | | |
Purchase Contracts | | Counterparty | | Notional Amount (000) | | Value at
Settlement
Date | | | Current
Value | | | Unrealized
Appreciation | | | Unrealized
Depreciation | |
|
OTC Forward Foreign Currency Exchange Contracts (cont’d.): | |
Thai Baht (cont’d.), | | | | | | | | | | | | | | | | | | | | |
Expiring 12/21/22 | | MSI | | THB | | 11,056 | | $ | 300,000 | | | $ | 291,852 | | | $ | — | | | $ | (8,148 | ) |
Expiring 12/21/22 | | SCB | | THB | | 8,222 | | | 220,000 | | | | 217,044 | | | | — | | | | (2,956 | ) |
Expiring 12/21/22 | | SCB | | THB | | 3,396 | | | 90,000 | | | | 89,649 | | | | — | | | | (351 | ) |
Turkish Lira, | | | | | | | | | | | | | | | | | | | | |
Expiring 12/21/22 | | JPM | | TRY | | 3,316 | | | 168,781 | | | | 171,101 | | | | 2,320 | | | | — | |
| | | | | | | | | | | | | | | | | | | | | | |
| | | | | | | |
| | | | | | | | $ | 23,993,314 | | | $ | 23,651,135 | | | | 189,443 | | | | (531,622 | ) |
| | | | | | | | | | | | | | | | | | | | | | |
| | | | | | | | | | | | | | | | | | | | | | | | | | | | | | |
Sale Contracts | | Counterparty | | Notional
Amount (000) | | Value at
Settlement
Date | | | Current
Value | | | Unrealized
Appreciation | | | Unrealized
Depreciation | |
|
OTC Forward Foreign Currency Exchange Contracts: | |
Brazilian Real, | | | | | | | | | | | | | | | | | | | | | | | | | | | | | | |
Expiring 11/03/22 | | CITI | | BRL | | 8,694 | | $ | 1,623,770 | | | $ | 1,681,790 | | | $ | — | | | | | | | | $(58,020 | ) | | | | |
Expiring 11/03/22 | | JPM | | BRL | | 371 | | | 68,197 | | | | 71,862 | | | | — | | | | | | | | (3,665 | ) | | | | |
Expiring 12/02/22 | | CITI | | BRL | | 317 | | | 60,071 | | | | 60,892 | | | | — | | | | | | | | (821 | ) | | | | |
Chilean Peso, | | | | | | | | | | | | | | | | | | | | | | | | | | | | | | |
Expiring 12/21/22 | | BNP | | CLP | | 130,088 | | | 137,000 | | | | 136,671 | | | | 329 | | | | | | | | — | | | | | |
Expiring 12/21/22 | | BNP | | CLP | | 50,257 | | | 53,000 | | | | 52,800 | | | | 200 | | | | | | | | — | | | | | |
Expiring 12/21/22 | | CITI | | CLP | | 51,072 | | | 55,884 | | | | 53,657 | | | | 2,227 | | | | | | | | — | | | | | |
Expiring 12/21/22 | | MSI | | CLP | | 112,380 | | | 115,000 | | | | 118,067 | | | | — | | | | | | | | (3,067 | ) | | | | |
Expiring 12/21/22 | | MSI | | CLP | | 106,403 | | | 116,000 | | | | 111,788 | | | | 4,212 | | | | | | | | — | | | | | |
Expiring 12/21/22 | | TD | | CLP | | 121,472 | | | 134,000 | | | | 127,619 | | | | 6,381 | | | | | | | | — | | | | | |
Expiring 12/21/22 | | UAG | | CLP | | 119,651 | | | 121,000 | | | | 125,705 | | | | — | | | | | | | | (4,705 | ) | | | | |
Chinese Renminbi, | | | | | | | | | | | | | | | | | | | | | | | | | | | | | | |
Expiring 11/23/22 | �� | CITI | | CNH | | 1,982 | | | 290,000 | | | | 270,537 | | | | 19,463 | | | | | | | | — | | | | | |
Expiring 11/23/22 | | GSI | | CNH | | 16,075 | | | 2,367,869 | | | | 2,194,083 | | | | 173,786 | | | | | | | | — | | | | | |
Expiring 11/23/22 | | GSI | | CNH | | 2,183 | | | 301,000 | | | | 297,926 | | | | 3,074 | | | | | | | | — | | | | | |
Expiring 11/23/22 | | GSI | | CNH | | 2,106 | | | 292,000 | | | | 287,386 | | | | 4,614 | | | | | | | | — | | | | | |
Expiring 11/23/22 | | GSI | | CNH | | 175 | | | 24,533 | | | | 23,855 | | | | 678 | | | | | | | | — | | | | | |
Expiring 11/23/22 | | JPM | | CNH | | 2,636 | | | 379,000 | | | | 359,740 | | | | 19,260 | | | | | | | | — | | | | | |
Expiring 11/23/22 | | JPM | | CNH | | 2,047 | | | 282,000 | | | | 279,346 | | | | 2,654 | | | | | | | | — | | | | | |
Expiring 11/23/22 | | JPM | | CNH | | 2,002 | | | 279,000 | | | | 273,248 | | | | 5,752 | | | | | | | | — | | | | | |
Expiring 11/23/22 | | JPM | | CNH | | 1,692 | | | 235,000 | | | | 230,927 | | | | 4,073 | | | | | | | | — | | | | | |
Expiring 11/23/22 | | JPM | | CNH | | 1,625 | | | 226,000 | | | | 221,762 | | | | 4,238 | | | | | | | | — | | | | | |
Expiring 11/23/22 | | SCB | | CNH | | 1,945 | | | 275,000 | | | | 265,477 | | | | 9,523 | | | | | | | | — | | | | | |
Expiring 11/23/22 | | UAG | | CNH | | 1,694 | | | 235,000 | | | | 231,190 | | | | 3,810 | | | | | | | | — | | | | | |
Colombian Peso, | | | | | | | | | | | | | | | | | | | | | | | | | | | | | | |
Expiring 12/21/22 | | BARC | | COP | | 1,415,307 | | | 311,002 | | | | 284,016 | | | | 26,986 | | | | | | | | — | | | | | |
Expiring 12/21/22 | | BARC | | COP | | 443,428 | | | 94,818 | | | | 88,985 | | | | 5,833 | | | | | | | | — | | | | | |
Expiring 12/21/22 | | BARC | | COP | | 197,648 | | | 42,182 | | | | 39,663 | | | | 2,519 | | | | | | | | — | | | | | |
See Notes to Financial Statements.
26
Forward foreign currency exchange contracts outstanding at October 31, 2022 (continued):
| | | | | | | | | | | | | | | | | | | | | | | | | | | | | | |
Sale Contracts | | Counterparty | | Notional
Amount (000) | | Value at
Settlement
Date | | | Current
Value | | | Unrealized
Appreciation | | | Unrealized
Depreciation | |
|
OTC Forward Foreign Currency Exchange Contracts (cont’d.): | |
Colombian Peso (cont’d.), | | | | | | | | | | | | | | | | | | | | | | | | | | | | |
Expiring 12/21/22 | | BNP | | COP | | 332,067 | | $ | 71,000 | | | $ | 66,637 | | | $ | 4,363 | | | | | | | $ | — | | | | | |
Czech Koruna, | | | | | | | | | | | | | | | | | | | | | | | | | | | | | | |
Expiring 01/19/23 | | BARC | | CZK | | 7,129 | | | 280,000 | | | | 286,434 | | | | — | | | | | | | | (6,434 | ) | | | | |
Expiring 01/19/23 | | BOA | | CZK | | 9,112 | | | 357,978 | | | | 366,139 | | | | — | | | | | | | | (8,161 | ) | | | | |
Expiring 01/19/23 | | GSI | | CZK | | 11,740 | | | 461,520 | | | | 471,732 | | | | — | | | | | | | | (10,212 | ) | | | | |
Expiring 01/19/23 | | HSBC | | CZK | | 10,983 | | | 431,304 | | | | 441,308 | | | | — | | | | | | | | (10,004 | ) | | | | |
Egyptian Pound, | | | | | | | | | | | | | | | | | | | | | | | | | | | | | | |
Expiring 11/30/22 | | MSI | | EGP | | 2,738 | | | 136,363 | | | | 112,427 | | | | 23,936 | | | | | | | | — | | | | | |
Hungarian Forint, | | | | | | | | | | | | | | | | | | | | | | | | | | | | | | |
Expiring 12/21/22 | | MSI | | HUF | | 54,328 | | | 128,994 | | | | 129,203 | | | | — | | | | | | | | (209 | ) | | | | |
Expiring 12/21/22 | | MSI | | HUF | | 50,158 | | | 121,024 | | | | 119,286 | | | | 1,738 | | | | | | | | — | | | | | |
Expiring 01/19/23 | | MSI | | HUF | | 16,209 | | | 38,177 | | | | 38,214 | | | | — | | | | | | | | (37 | ) | | | | |
Indian Rupee, | | | | | | | | | | | | | | | | | | | | | | | | | | | | | | |
Expiring 12/21/22 | | BOA | | INR | | 19,102 | | | 230,000 | | | | 229,327 | | | | 673 | | | | | | | | — | | | | | |
Expiring 12/21/22 | | HSBC | | INR | | 5,557 | | | 67,000 | | | | 66,711 | | | | 289 | | | | | | | | — | | | | | |
Expiring 12/21/22 | | JPM | | INR | | 22,625 | | | 282,000 | | | | 271,624 | | | | 10,376 | | | | | | | | — | | | | | |
Expiring 12/21/22 | | JPM | | INR | | 19,310 | | | 231,594 | | | | 231,829 | | | | — | | | | | | | | (235 | ) | | | | |
Expiring 12/21/22 | | MSI | | INR | | 8,810 | | | 106,000 | | | | 105,767 | | | | 233 | | | | | | | | — | | | | | |
Expiring 12/21/22 | | SCB | | INR | | 5,577 | | | 67,000 | | | | 66,961 | | | | 39 | | | | | | | | — | | | | | |
Indonesian Rupiah, | | | | | | | | | | | | | | | | | | | | | | | | | | | | | | |
Expiring 12/21/22 | | CITI | | IDR | | 327,577 | | | 21,960 | | | | 20,928 | | | | 1,032 | | | | | | | | — | | | | | |
Expiring 12/21/22 | | JPM | | IDR | | 796,649 | | | 53,156 | | | | 50,895 | | | | 2,261 | | | | | | | | — | | | | | |
Expiring 12/21/22 | | JPM | | IDR | | 600,645 | | | 39,158 | | | | 38,373 | | | | 785 | | | | | | | | — | | | | | |
Expiring 12/21/22 | | MSI | | IDR | | 4,816,114 | | | 309,000 | | | | 307,681 | | | | 1,319 | | | | | | | | — | | | | | |
Expiring 12/21/22 | | SCB | | IDR | | 7,968,438 | | | 531,796 | | | | 509,069 | | | | 22,727 | | | | | | | | — | | | | | |
Israeli Shekel, | | | | | | | | | | | | | | | | | | | | | | | | | | | | | | |
Expiring 12/21/22 | | BARC | | ILS | | 917 | | | 267,000 | | | | 260,681 | | | | 6,319 | | | | | | | | — | | | | | |
Expiring 12/21/22 | | BARC | | ILS | | 723 | | | 206,000 | | | | 205,462 | | | | 538 | | | | | | | | — | | | | | |
Expiring 12/21/22 | | BOA | | ILS | | 699 | | | 196,000 | | | | 198,668 | | | | — | | | | | | | | (2,668 | ) | | | | |
Expiring 12/21/22 | | CITI | | ILS | | 829 | | | 243,113 | | | | 235,563 | | | | 7,550 | | | | | | | | — | | | | | |
Expiring 12/21/22 | | CITI | | ILS | | 814 | | | 231,000 | | | | 231,233 | | | | — | | | | | | | | (233 | ) | | | | |
Expiring 12/21/22 | | CITI | | ILS | | 692 | | | 195,000 | | | | 196,549 | | | | — | | | | | | | | (1,549 | ) | | | | |
Expiring 12/21/22 | | CITI | | ILS | | 449 | | | 131,925 | | | | 127,716 | | | | 4,209 | | | | | | | | — | | | | | |
Expiring 12/21/22 | | CITI | | ILS | | 404 | | | 118,075 | | | | 114,720 | | | | 3,355 | | | | | | | | — | | | | | |
Malaysian Ringgit, | | | | | | | | | | | | | | | | | | | | | | | | | | | | | | |
Expiring 12/21/22 | | BARC | | MYR | | 295 | | | 65,000 | | | | 62,502 | | | | 2,498 | | | | | | | | — | | | | | |
Mexican Peso, | | | | | | | | | | | | | | | | | | | | | | | | | | | | | | |
Expiring 12/21/22 | | BOA | | MXN | | 5,613 | | | 275,000 | | | | 280,684 | | | | — | | | | | | | | (5,684 | ) | | | | |
Expiring 12/21/22 | | JPM | | MXN | | 4,934 | | | 240,000 | | | | 246,760 | | | | — | | | | | | | | (6,760 | ) | | | | |
Expiring 12/21/22 | | JPM | | MXN | | 3,352 | | | 164,000 | | | | 167,611 | | | | — | | | | | | | | (3,611 | ) | | | | |
Expiring 12/21/22 | | JPM | | MXN | | 1,397 | | | 68,521 | | | | 69,886 | | | | — | | | | | | | | (1,365 | ) | | | | |
Expiring 12/21/22 | | JPM | | MXN | | 1,012 | | | 50,558 | | | | 50,621 | | | | — | | | | | | | | (63 | ) | | | | |
See Notes to Financial Statements.
PGIM Emerging Markets Debt Local Currency Fund 27
Schedule of Investments (continued)
as of October 31, 2022
Forward foreign currency exchange contracts outstanding at October 31, 2022 (continued):
| | | | | | | | | | | | | | | | | | | | | | | | | | | | | | |
Sale Contracts | | Counterparty | | Notional
Amount (000) | | Value at
Settlement
Date | | | Current
Value | | | Unrealized
Appreciation | | | Unrealized
Depreciation | |
|
OTC Forward Foreign Currency Exchange Contracts (cont’d.): | |
New Taiwanese Dollar, | | | | | | | | | | | | | | | | | | | | | | | | | | | | | | |
Expiring 12/21/22 | | JPM | | TWD | | 43,769 | | $ | 1,428,031 | | | $ | 1,357,934 | | | $ | 70,097 | | | | | | | $ | — | | | | | |
Peruvian Nuevo Sol, | | | | | | | | | | | | | | | | | | | | | | | | | | | | | | |
Expiring 12/21/22 | | BARC | | PEN | | 628 | | | 160,006 | | | | 156,581 | | | | 3,425 | | | | | | | | — | | | | | |
Expiring 12/21/22 | | BARC | | PEN | | 349 | | | 88,403 | | | | 87,072 | | | | 1,331 | | | | | | | | — | | | | | |
Expiring 12/21/22 | | CITI | | PEN | | 389 | | | 97,000 | | | | 97,109 | | | | — | | | | | | | | (109 | ) | | | | |
Philippine Peso, | | | | | | | | | | | | | | | | | | | | | | | | | | | | | | |
Expiring 12/21/22 | | HSBC | | PHP | | 11,116 | | | 193,440 | | | | 190,545 | | | | 2,895 | | | | | | | | — | | | | | |
Expiring 12/21/22 | | JPM | | PHP | | 1,255 | | | 21,725 | | | | 21,518 | | | | 207 | | | | | | | | — | | | | | |
Expiring 12/21/22 | | MSI | | PHP | | 4,055 | | | 68,000 | | | | 69,509 | | | | — | | | | | | | | (1,509 | ) | | | | |
Expiring 12/21/22 | | SCB | | PHP | | 17,527 | | | 302,000 | | | | 300,430 | | | | 1,570 | | | | | | | | — | | | | | |
Polish Zloty, | | | | | | | | | | | | | | | | | | | | | | | | | | | | | | |
Expiring 01/19/23 | | HSBC | | PLN | | 1,414 | | | 277,652 | | | | 291,758 | | | | — | | | | | | | | (14,106 | ) | | | | |
Serbian Dinar, | | | | | | | | | | | | | | | | | | | | | | | | | | | | | | |
Expiring 12/21/22 | | CITI | | RSD | | 4,985 | | | 42,000 | | | | 41,971 | | | | 29 | | | | | | | | — | | | | | |
Singapore Dollar, | | | | | | | | | | | | | | | | | | | | | | | | | | | | | | |
Expiring 12/21/22 | | DB | | SGD | | 432 | | | 307,000 | | | | 305,201 | | | | 1,799 | | | | | | | | — | | | | | |
Expiring 12/21/22 | | GSI | | SGD | | 482 | | | 337,000 | | | | 340,922 | | | | — | | | | | | | | (3,922 | ) | | | | |
Expiring 12/21/22 | | SCB | | SGD | | 453 | | | 321,000 | | | | 320,426 | | | | 574 | | | | | | | | — | | | | | |
South African Rand, | | | | | | | | | | | | | | | | | | | | | | | | | | | | | | |
Expiring 12/21/22 | | JPM | | ZAR | | 633 | | | 34,319 | | | | 34,329 | | | | — | | | | | | | | (10 | ) | | | | |
Expiring 12/21/22 | | MSI | | ZAR | | 26,746 | | | 1,531,253 | | | | 1,450,285 | | | | 80,968 | | | | | | | | — | | | | | |
Expiring 12/21/22 | | TD | | ZAR | | 1,044 | | | 58,993 | | | | 56,600 | | | | 2,393 | | | | | | | | — | | | | | |
South Korean Won, | | | | | | | | | | | | | | | | | | | | | | | | | | | | | | |
Expiring 12/21/22 | | GSI | | KRW | | 415,819 | | | 291,000 | | | | 291,627 | | | | — | | | | | | | | (627 | ) | | | | |
Expiring 12/21/22 | | JPM | | KRW | | 1,012,115 | | | 733,411 | | | | 709,829 | | | | 23,582 | | | | | | | | — | | | | | |
Expiring 12/21/22 | | JPM | | KRW | | 99,425 | | | 72,000 | | | | 69,730 | | | | 2,270 | | | | | | | | — | | | | | |
Thai Baht, | | | | | | | | | | | | | | | | | | | | | | | | | | | | | | |
Expiring 12/21/22 | | GSI | | THB | | 12,169 | | | 336,000 | | | | 321,234 | | | | 14,766 | | | | | | | | — | | | | | |
Expiring 12/21/22 | | GSI | | THB | | 8,368 | | | 231,000 | | | | 220,900 | | | | 10,100 | | | | | | | | — | | | | | |
Expiring 12/21/22 | | HSBC | | THB | | 10,844 | | | 297,000 | | | | 286,264 | | | | 10,736 | | | | | | | | — | | | | | |
Expiring 12/21/22 | | JPM | | THB | | 44,499 | | | 1,221,346 | | | | 1,174,651 | | | | 46,695 | | | | | | | | — | | | | | |
Expiring 12/21/22 | | JPM | | THB | | 1,252 | | | 34,509 | | | | 33,041 | | | | 1,468 | | | | | | | | — | | | | | |
| | | | | | | | | | | | | | | | | | | | | | | | | | | | | | |
| | | | | | | | | |
| | | | | | | | $ | 23,018,630 | | | $ | 22,497,659 | | | | 668,757 | | | | | | | | (147,786 | ) | | | | |
| | | | | | | | | | | | | | | | | | | | | | | | | | | | | | |
| | | | | | | | | |
| | | | | | | | | | | | | | | | $ | 858,200 | | | | | | | $ | (679,408 | ) | | | | |
| | | | | | | | | | | | | | | | | | | | | | | | | | | | | | |
See Notes to Financial Statements.
28
Cross currency exchange contracts outstanding at October 31, 2022:
| | | | | | | | | | | | | | | | | | | | | | | | | | | | | | | | |
Settlement | | Type | | | Notional
Amount
(000) | | | In Exchange
For (000) | | | Unrealized
Appreciation | | | Unrealized
Depreciation | | | Counterparty | |
OTC Cross Currency Exchange Contracts: | | | | | | | | | | | | | | | | | | | | | | | | | | | | | | | | |
| | | | | | | | |
01/19/23 | | | Buy | | | | AUD | | | | 104 | | | | EUR | | | | 67 | | | $ | 37 | | | $ | — | | | | JPM | |
| | | | | | | | |
01/19/23 | | | Buy | | | | CZK | | | | 6,640 | | | | EUR | | | | 268 | | | | 49 | | | | — | | | | GSI | |
| | | | | | | | |
01/19/23 | | | Buy | | | | HUF | | | | 49,266 | | | | EUR | | | | 116 | | | | 339 | | | | — | | | | BOA | |
| | | | | | | | |
01/19/23 | | | Buy | | | | HUF | | | | 64,404 | | | | EUR | | | | 151 | | | | 1,204 | | | | — | | | | MSI | |
| | | | | | | | |
01/19/23 | | | Buy | | | | PLN | | | | 1,213 | | | | EUR | | | | 252 | | | | — | | | | (259 | ) | | | BOA | |
| | | | | | | | | | | | | | | | | | | | | | | | | | | | | | | | |
| | | | | | | | |
| | | | | | | | | | | | | | | | | | | | | | $ | 1,629 | | | $ | (259 | ) | | | | |
| | | | | | | | | | | | | | | | | | | | | | | | | | | | | | | | |
Credit default swap agreements outstanding at October 31, 2022:
| | | | | | | | | | | | | | | | | | | | | | | | |
Reference Entity/
Obligation | | Termination
Date | | | Fixed
Rate | | | Notional
Amount
(000)#(3) | | | Value at
Trade Date | | | Value at
October 31,
2022 | | | Unrealized
Appreciation
(Depreciation) | |
Centrally Cleared Credit Default Swap Agreement on credit indices – Buy Protection(1): | |
| | | | | | |
CDX.EM.38.V1 | | | 12/20/27 | | | | 1.000 | %(Q) | | | 240 | | | | $19,867 | | | | $19,608 | | | $ | (259 | ) |
| | | | | | | | | | | | | | | | | | | | | | | | |
The Fund entered into credit default swaps (“CDS”) to provide a measure of protection against defaults or to take an active long or short position with respect to the likelihood of a particular issuer’s default or the reference entity’s credit soundness. CDS contracts generally trade based on a spread which represents the cost a protection buyer has to pay the protection seller. The protection buyer is said to be short the credit as the value of the contract rises the more the credit deteriorates. The value of the CDS contract increases for the protection buyer if the spread increases.
| (1) | If the Fund is a buyer of protection, it pays the fixed rate. When a credit event occurs, as defined under the terms of that particular swap agreement, the Fund will either (i) receive from the seller of protection an amount equal to the notional amount of the swap and make delivery of the referenced obligation or underlying securities comprising the referenced index or (ii) receive a net settlement amount in the form of cash or securities equal to the notional amount of the swap less the recovery value of the referenced obligation or underlying securities comprising the referenced index. |
| (2) | If the Fund is a seller of protection, it receives the fixed rate. When a credit event occurs, as defined under the terms of that particular swap agreement, the Fund will either (i) pay to the buyer of protection an amount equal to the notional amount of the swap and take delivery of the referenced obligation or underlying securities comprising the referenced index or (ii) pay a net settlement amount in the form of cash or securities equal to the notional amount of the swap less the recovery value of the referenced obligation or underlying securities comprising the referenced index. |
| (3) | Notional amount represents the maximum potential amount the Fund could be required to pay as a seller of credit protection or receive as a buyer of credit protection if a credit event occurs as defined under the terms of that particular swap agreement. |
| (4) | Implied credit spreads, represented in absolute terms, utilized in determining the fair value of credit default swap |
See Notes to Financial Statements.
PGIM Emerging Markets Debt Local Currency Fund 29
Schedule of Investments (continued)
as of October 31, 2022
| | agreements where the Fund is the seller of protection as of the reporting date serve as an indicator of the current status of the payment/ performance risk and represent the likelihood of risk of default for the credit derivative. The implied credit spread of a particular referenced entity reflects the cost of buying/selling protection and may include up-front payments required to be made to enter into the agreement. Wider credit spreads represent a deterioration of the referenced entity’s credit soundness and a greater likelihood of risk of default or other credit event occurring as defined under the terms of the agreement. |
Interest rate swap agreements outstanding at October 31, 2022:
| | | | | | | | | | | | | | | | | | | | | | | | | | | | |
Notional
Amount
(000)# | | Termination
Date | | Fixed Rate | | | | Floating Rate | | Value at
Trade Date | | Value at
October 31,
2022 | | Unrealized
Appreciation
(Depreciation) |
| | | | | | | | | | | | | | | | | |
| | | | | | | | | | | | | | | | | |
Centrally Cleared Interest Rate Swap Agreements: | | | | | |
BRL | | | | 3,324 | | | 01/02/23 | | 6.450%(T) | | | | 1 Day BROIS(2)(T)/ 0.051% | | | $ | — | | | | $ | (33,898 | ) | | | $ | (33,898 | ) |
BRL | | | | 1,374 | | | 01/02/24 | | 4.590%(T) | | | | 1 Day BROIS(2)(T)/ 0.051% | | | | — | | | | | (39,156 | ) | | | | (39,156 | ) |
BRL | | | | 7,741 | | | 01/02/24 | | 12.900%(T) | | | | 1 Day BROIS(1)(T)/ 0.051% | | | | — | | | | | 667 | | | | | 667 | |
BRL | | | | 1,478 | | | 01/02/25 | | 5.840%(T) | | | | 1 Day BROIS(2)(T)/ 0.051% | | | | — | | | | | (39,021 | ) | | | | (39,021 | ) |
BRL | | | | 2,354 | | | 01/02/25 | | 7.950%(T) | | | | 1 Day BROIS(2)(T)/ 0.051% | | | | — | | | | | (46,627 | ) | | | | (46,627 | ) |
BRL | | | | 2,540 | | | 01/02/25 | | 8.140%(T) | | | | 1 Day BROIS(1)(T)/ 0.051% | | | | — | | | | | 43,916 | | | | | 43,916 | |
BRL | | | | 3,375 | | | 01/02/25 | | 11.535%(T) | | | | 1 Day BROIS(1)(T)/ 0.051% | | | | — | | | | | 1,980 | | | | | 1,980 | |
BRL | | | | 2,677 | | | 01/02/25 | | 11.675%(T) | | | | 1 Day BROIS(2)(T)/ 0.051% | | | | — | | | | | 385 | | | | | 385 | |
BRL | | | | 3,151 | | | 01/02/25 | | 11.840%(T) | | | | 1 Day BROIS(2)(T)/ 0.051% | | | | — | | | | | 594 | | | | | 594 | |
BRL | | | | 2,674 | | | 01/02/25 | | 11.880%(T) | | | | 1 Day BROIS(2)(T)/ 0.051% | | | | — | | | | | 592 | | | | | 592 | |
BRL | | | | 3,354 | | | 01/02/25 | | 12.050%(T) | | | | 1 Day BROIS(2)(T)/ 0.051% | | | | — | | | | | 2,205 | | | | | 2,205 | |
BRL | | | | 1,346 | | | 01/02/26 | | 11.350%(T) | | | | 1 Day BROIS(2)(T)/ 0.051% | | | | — | | | | | (639 | ) | | | | (639 | ) |
See Notes to Financial Statements.
30
Interest rate swap agreements outstanding at October 31, 2022 (continued):
| | | | | | | | | | | | | | | | | | | | | | | | | | | | |
Notional
Amount
(000)# | | Termination Date | | Fixed Rate | | | | Floating Rate | | Value at
Trade Date | | Value at
October 31,
2022 | | Unrealized
Appreciation
(Depreciation) |
| | | | | | | | | | | | | | | | | |
Centrally Cleared Interest Rate Swap Agreements (cont’d.): | | | | | |
BRL | | | | 2,464 | | | 01/02/26 | | 11.400%(T) | | | | 1 Day BROIS(2)(T)/ 0.051% | | | $ | — | | | | $ | (895 | ) | | | $ | (895 | ) |
BRL | | | | 668 | | | 01/04/27 | | 6.325%(T) | | | | 1 Day BROIS(2)(T)/ 0.051% | | | | — | | | | | (27,785 | ) | | | | (27,785 | ) |
BRL | | | | 1,056 | | | 01/04/27 | | 6.529%(T) | | | | 1 Day BROIS(2)(T)/ 0.051% | | | | — | | | | | (41,283 | ) | | | | (41,283 | ) |
BRL | | | | 1,885 | | | 01/04/27 | | 7.745%(T) | | | | 1 Day BROIS(1)(T)/ 0.051% | | | | — | | | | | 61,109 | | | | | 61,109 | |
BRL | | | | 744 | | | 01/04/27 | | 9.300%(T) | | | | 1 Day BROIS(1)(T)/ 0.051% | | | | — | | | | | 14,631 | | | | | 14,631 | |
BRL | | | | 1,788 | | | 01/04/27 | | 10.250%(T) | | | | 1 Day BROIS(1)(T)/ 0.051% | | | | — | | | | | 18,787 | | | | | 18,787 | |
BRL | | | | 4,283 | | | 01/04/27 | | 11.085%(T) | | | | 1 Day BROIS(1)(T)/ 0.051% | | | | 173 | | | | | 18,450 | | | | | 18,277 | |
BRL | | | | 896 | | | 01/04/27 | | 11.110%(T) | | | | 1 Day BROIS(2)(T)/ 0.051% | | | | — | | | | | (2,056 | ) | | | | (2,056 | ) |
BRL | | | | 766 | | | 01/04/27 | | 11.173%(T) | | | | 1 Day BROIS(2)(T)/ 0.051% | | | | — | | | | | (1,403 | ) | | | | (1,403 | ) |
BRL | | | | 3,668 | | | 01/04/27 | | 11.240%(T) | | | | 1 Day BROIS(2)(T)/ 0.051% | | | | 1,378 | | | | | (5,874 | ) | | | | (7,252 | ) |
BRL | | | | 1,948 | | | 01/04/27 | | 11.680%(T) | | | | 1 Day BROIS(2)(T)/ 0.051% | | | | 1,595 | | | | | 1,969 | | | | | 374 | |
BRL | | | | 1,688 | | | 01/04/27 | | 11.755%(T) | | | | 1 Day BROIS(2)(T)/ 0.051% | | | | — | | | | | 6,614 | | | | | 6,614 | |
BRL | | | | 1,601 | | | 01/04/27 | | 12.200%(T) | | | | 1 Day BROIS(2)(T)/ 0.051% | | | | — | | | | | 13,643 | | | | | 13,643 | |
BRL | | | | 1,705 | | | 01/04/27 | | 12.360%(T) | | | | 1 Day BROIS(1)(T)/ 0.051% | | | | — | | | | | (12,162 | ) | | | | (12,162 | ) |
See Notes to Financial Statements.
PGIM Emerging Markets Debt Local Currency Fund 31
Schedule of Investments (continued)
as of October 31, 2022
Interest rate swap agreements outstanding at October 31, 2022 (continued):
| | | | | | | | | | | | | | | | | | | | | | | | | | | | |
Notional Amount (000)# | | Termination
Date | | Fixed Rate | | | | Floating Rate | | Value at
Trade Date | | Value at
October 31,
2022 | | Unrealized
Appreciation
(Depreciation) |
| | | | | | | | | | | | | | | | | |
Centrally Cleared Interest Rate Swap Agreements (cont’d.): | | | | | |
BRL | | | | 2,143 | | | 01/04/27 | | 13.105%(T) | | | | 1 Day BROIS(2)(T)/ 0.051% | | | $ | 4,993 | | | | $ | 29,162 | | | | $ | 24,169 | |
BRL | | | | 518 | | | 01/04/27 | | 13.270%(T) | | | | 1 Day BROIS(1)(T)/ 0.051% | | | | — | | | | | (7,793 | ) | | | | (7,793 | ) |
CLP | | | | 418,310 | | | 12/21/32 | | 6.780%(S) | | | | 1 Day CLOIS(1)(S)/ 11.250% | | | | (2,329 | ) | | | | (17,606 | ) | | | | (15,277 | ) |
CNH | | | | 3,000 | | | 07/28/27 | | 2.438%(Q) | | | | 7 Day China Fixing Repo Rates(2)(Q)/ 1.940% | | | | — | | | | | 1,187 | | | | | 1,187 | |
COP | | | | 950,000 | | | 12/12/23 | | 5.530%(Q) | | | | 1 Day COOIS(2)(Q)/ 10.285% | | | | — | | | | | (13,245 | ) | | | | (13,245 | ) |
COP | | | | 1,382,980 | | | 06/15/27 | | 8.230%(Q) | | | | 1 Day COOIS(2)(Q)/ 10.285% | | | | (6,281 | ) | | | | (28,967 | ) | | | | (22,686 | ) |
COP | | | | 4,265,890 | | | 09/21/27 | | 9.200%(Q) | | | | 1 Day COOIS(1)(Q)/ 10.285% | | | | (154 | ) | | | | 59,239 | | | | | 59,393 | |
COP | | | | 236,760 | | | 12/21/27 | | 10.125%(Q) | | | | 1 Day COOIS(1)(Q)/ 10.285% | | | | — | | | | | 1,574 | | | | | 1,574 | |
COP | | | | 1,416,700 | | | 12/21/27 | | 10.187%(Q) | | | | 1 Day COOIS(1)(Q)/ 10.285% | | | | 447 | | | | | 8,745 | | | | | 8,298 | |
COP | | | | 1,047,000 | | | 12/21/27 | | 10.960%(Q) | | | | 1 Day COOIS(1)(Q)/ 10.285% | | | | — | | | | | 270 | | | | | 270 | |
COP | | | | 1,081,990 | | | 12/21/27 | | 11.966%(Q) | | | | 1 Day COOIS(1)(Q)/ 10.285% | | | | — | | | | | (8,050 | ) | | | | (8,050 | ) |
COP | | | | 211,800 | | | 11/09/31 | | 6.650%(Q) | | | | 1 Day COOIS(2)(Q)/ 10.285% | | | | — | | | | | (10,664 | ) | | | | (10,664 | ) |
CZK | | | | 14,610 | | | 12/21/24 | | 6.880%(A) | | | | 6 Month PRIBOR(1)(S)/ 7.390% | | | | — | | | | | (187 | ) | | | | (187 | ) |
CZK | | | | 6,507 | | | 06/15/31 | | 1.730%(A) | | | | 6 Month PRIBOR(2)(S)/ 7.390% | | | | — | | | | | (76,168 | ) | | | | (76,168 | ) |
See Notes to Financial Statements.
32
Interest rate swap agreements outstanding at October 31, 2022 (continued):
| | | | | | | | | | | | | | | | | | | | | | | | | | | | |
Notional Amount (000)# | | Termination
Date | | Fixed Rate | | | | Floating Rate | | Value at
Trade Date | | Value at
October 31,
2022 | | Unrealized
Appreciation
(Depreciation) |
| | | | | | | | | | | | | | | | | |
Centrally Cleared Interest Rate Swap Agreements (cont’d.): | | | | | |
CZK | | | | 4,930 | | | 12/21/32 | | 5.430%(A) | | | | 6 Month PRIBOR(1)(S)/ 7.390% | | | $ | — | | | | $ | 1,474 | | | | $ | 1,474 | |
HUF | | | | 157,860 | | | 09/03/26 | | 2.660%(A) | | | | 6 Month BUBOR(1)(S)/ 16.740% | | | | 5,523 | | | | | 119,339 | | | | | 113,816 | |
HUF | | | | 150,000 | | | 03/17/27 | | 6.250%(A) | | | | 6 Month BUBOR(1)(S)/ 16.740% | | | | — | | | | | 64,646 | | | | | 64,646 | |
KRW | | | | 600,000 | | | 06/15/27 | | 2.410%(Q) | | | | 3 Month KWCDC(1)(Q)/ 3.960% | | | | 18,212 | | | | | 30,661 | | | | | 12,449 | |
KRW | | | | 1,096,507 | | | 09/21/27 | | 3.087%(Q) | | | | 3 Month KWCDC(2)(Q)/ 3.960% | | | | (894 | ) | | | | (34,503 | ) | | | | (33,609 | ) |
KRW | | | | 600,000 | | | 09/21/27 | | 3.639%(Q) | | | | 3 Month KWCDC(2)(Q)/ 3.960% | | | | 1,403 | | | | | (8,159 | ) | | | | (9,562 | ) |
KRW | | | | 700,000 | | | 12/21/27 | | 4.197%(Q) | | | | 3 Month KWCDC(1)(Q)/ 3.960% | | | | — | | | | | (1,990 | ) | | | | (1,990 | ) |
MXN | | | | 14,446 | | | 03/11/26 | | 4.845%(M) | | | | 28 Day Mexican Interbank Rate(2)(M)/ 9.596% | | | | (10,364 | ) | | | | (97,436 | ) | | | | (87,072 | ) |
MXN | | | | 124 | | | 06/09/27 | | 8.543%(M) | | | | 28 Day Mexican Interbank Rate(1)(M)/ 9.596% | | | | 71 | | | | | 185 | | | | | 114 | |
MXN | | | | 2,110 | | | 09/15/27 | | 8.880%(M) | | | | 28 Day Mexican Interbank Rate(2)(M)/ 9.596% | | | | — | | | | | (1,759 | ) | | | | (1,759 | ) |
MXN | | | | 4,460 | | | 12/15/27 | | 8.950%(M) | | | | 28 Day Mexican Interbank Rate(2)(M)/ 9.596% | | | | — | | | | | (2,752 | ) | | | | (2,752 | ) |
MXN | | | | 5,305 | | | 12/15/27 | | 9.348%(M) | | | | 28 Day Mexican Interbank Rate(2)(M)/ 9.596% | | | | (75 | ) | | | | 897 | | | | | 972 | |
See Notes to Financial Statements.
PGIM Emerging Markets Debt Local Currency Fund 33
Schedule of Investments (continued)
as of October 31, 2022
Interest rate swap agreements outstanding at October 31, 2022 (continued):
| | | | | | | | | | | | | | | | | | | | | | | | | | | | |
Notional Amount (000)# | | Termination Date | | Fixed Rate | | | | Floating Rate | | Value at
Trade Date | | Value at
October 31,
2022 | | Unrealized
Appreciation
(Depreciation) |
| | | | | | | | | | | | | | | | | |
Centrally Cleared Interest Rate Swap Agreements (cont’d.): | | | | | |
MXN | | | | 5,346 | | | 01/28/30 | | 6.640%(M) | | | | 28 Day Mexican Interbank Rate(2)(M)/ 9.596% | | | $ | (30,510 | ) | | | $ | (37,659 | ) | | | $ | (7,149 | ) |
MXN | | | | 4,450 | | | 07/24/31 | | 6.780%(M) | | | | 28 Day Mexican Interbank Rate(2)(M)/ 9.596% | | | | — | | | | | (33,446 | ) | | | | (33,446 | ) |
MXN | | | | 4,000 | | | 12/08/32 | | 9.320%(M) | | | | 28 Day Mexican Interbank Rate(2)(M)/ 9.596% | | | | — | | | | | 636 | | | | | 636 | |
PLN | | | | 2,450 | | | 10/05/23 | | 1.350%(A) | | | | 6 Month WIBOR(1)(S)/ 7.720% | | | | — | | | | | 31,053 | | | | | 31,053 | |
PLN | | | | 2,450 | | | 10/05/23 | | 1.375%(A) | | | | 6 Month WIBOR(1)(S)/ 7.720% | | | | — | | | | | 30,936 | | | | | 30,936 | |
PLN | | | | 2,360 | | | 12/15/23 | | 2.400%(A) | | | | 6 Month WIBOR(1)(S)/ 7.720% | | | | — | | | | | 31,261 | | | | | 31,261 | |
PLN | | | | 2,700 | | | 07/24/24 | | 1.798%(A) | | | | 6 Month WIBOR(2)(S)/ 7.720% | | | | — | | | | | (63,029 | ) | | | | (63,029 | ) |
PLN | | | | 930 | | | 02/01/25 | | 4.300%(A) | | | | 6 Month WIBOR(1)(S)/ 7.720% | | | | — | | | | | 11,626 | | | | | 11,626 | |
PLN | | | | 2,730 | | | 09/08/25 | | 0.637%(A) | | | | 6 Month WIBOR(2)(S)/ 7.720% | | | | (2,157 | ) | | | | (104,777 | ) | | | | (102,620 | ) |
PLN | | | | 4,650 | | | 04/07/27 | | 5.405%(A) | | | | 6 Month WIBOR(1)(S)/ 7.720% | | | | — | | | | | 49,839 | | | | | 49,839 | |
PLN | | | | 1,186 | | | 06/15/27 | | 4.970%(A) | | | | 6 Month WIBOR(2)(S)/ 7.720% | | | | (17,269 | ) | | | | (25,468 | ) | | | | (8,199 | ) |
PLN | | | | 1,670 | | | 08/02/27 | | 5.680%(A) | | | | 6 Month WIBOR(2)(S)/7.720% | | | | — | | | | | (25,776 | ) | | | | (25,776 | ) |
PLN | | | | 4,830 | | | 09/21/27 | | 6.632%(A) | | | | 6 Month WIBOR(1)(S)/ 7.720% | | | | (15,532 | ) | | | | 35,430 | | | | | 50,962 | |
See Notes to Financial Statements.
34
Interest rate swap agreements outstanding at October 31, 2022 (continued):
| | | | | | | | | | | | | | | | | | | | | | | | | | | | |
Notional Amount (000)# | | Termination
Date | | Fixed Rate | | | | Floating Rate | | Value at
Trade Date | | Value at
October 31,
2022 | | Unrealized
Appreciation
(Depreciation) |
| | | | | | | | | | | | | | | | | |
Centrally Cleared Interest Rate Swap Agreements (cont’d.): | | | | | |
PLN | | | | 1,434 | | | 10/06/27 | | 6.826%(A) | | | | 6 Month WIBOR(2)(S)/ 7.720% | | | $ | — | | | | $ | (8,359 | ) | | | $ | (8,359 | ) |
PLN | | | | 1,970 | | | 10/25/27 | | 7.900%(A) | | | | 6 Month WIBOR(2)(S)/ 7.720% | | | | — | | | | | 5,579 | | | | | 5,579 | |
PLN | | | | 700 | | | 06/17/31 | | 1.745%(A) | | | | 6 Month WIBOR(1)(S)/ 7.720% | | | | — | | | | | 51,763 | | | | | 51,763 | |
PLN | | | | 271 | | | 05/10/32 | | 6.410%(A) | | | | 6 Month WIBOR(1)(S)/ 7.720% | | | | — | | | | | 3,626 | | | | | 3,626 | |
PLN | | | | 605 | | | 12/21/32 | | 7.391%(A) | | | | 6 Month WIBOR(1)(S)/ 7.720% | | | | — | | | | | 50 | | | | | 50 | |
THB | | | | 19,200 | | | 12/21/27 | | 3.088%(Q) | | | | 1 Day THOR(1)(Q)/ 0.984% | | | | — | | | | | (6,036 | ) | | | | (6,036 | ) |
THB | | | | 20,100 | | | 12/21/27 | | 3.114%(Q) | | | | 1 Day THOR(1)(Q)/ 0.984% | | | | — | | | | | (6,994 | ) | | | | (6,994 | ) |
ZAR | | | | 5,789 | | | 08/21/25 | | 4.978%(Q) | | | | 3 Month JIBAR(2)(Q)/6.517% | | | | (8,927 | ) | | | | (24,106 | ) | | | | (15,179 | ) |
ZAR | | | | 2,808 | | | 03/16/27 | | 6.960%(Q) | | | | 3 Month JIBAR(1)(Q)/ 6.517% | | | | 5,758 | | | | | 7,536 | | | | | 1,778 | |
ZAR | | | | 32,614 | | | 09/21/27 | | 7.490%(Q) | | | | 3 Month JIBAR(2)(Q)/ 6.517% | | | | (59,848 | ) | | | | (67,471 | ) | | | | (7,623 | ) |
ZAR | | | | 19,350 | | | 09/21/27 | | 8.280%(Q) | | | | 3 Month JIBAR(1)(Q)/ 6.517% | | | | 1,025 | | | | | 5,474 | | | | | 4,449 | |
ZAR | | | | 6,460 | | | 12/21/27 | | 8.615%(Q) | | | | 3 Month JIBAR(2)(Q)/ 6.517% | | | | — | | | | | (149 | ) | | | | (149 | ) |
ZAR | | | | 3,480 | | | 12/21/27 | | 8.860%(Q) | | | | 3 Month JIBAR(2)(Q)/ 6.517% | | | | 1,331 | | | | | 1,807 | | | | | 476 | |
ZAR | | | | 3,244 | | | 04/13/31 | | 7.530%(Q) | | | | 3 Month JIBAR(2)(Q)/ 6.517% | | | | (41 | ) | | | | (19,168 | ) | | | | (19,127 | ) |
ZAR | | | | 6,680 | | | 07/13/31 | | 7.415%(Q) | | | | 3 Month JIBAR(1)(Q)/ 6.517% | | | | 93 | | | | | 43,719 | | | | | 43,626 | |
See Notes to Financial Statements.
PGIM Emerging Markets Debt Local Currency Fund 35
Schedule of Investments (continued)
as of October 31, 2022
Interest rate swap agreements outstanding at October 31, 2022 (continued):
| | | | | | | | | | | | | | | | | | | | | | | | | | | | |
Notional Amount (000)# | | Termination
Date | | Fixed Rate | | | | Floating Rate | | Value at
Trade Date | | Value at
October 31,
2022 | | Unrealized
Appreciation
(Depreciation) |
| | | | | | | | | | | | | | | | | |
Centrally Cleared Interest Rate Swap Agreements (cont’d.): | | | | | |
ZAR | | | | 6,610 | | | 09/27/31 | | 7.493%(Q) | | | | 3 Month JIBAR(1)(Q)/6.517% | | | $ | 1,662 | | | | $ | 42,762 | | | | $ | 41,100 | |
ZAR | | | | 4,635 | | | 01/04/32 | | 7.595%(Q) | | | | 3 Month JIBAR(1)(Q)/6.517% | | | | 5,064 | | | | | 29,553 | | | | | 24,489 | |
| | | | | | | | | | | | | | | | | | | | | | | | | | | | |
| | | | | | | | | | | | | | | | $ | (105,653 | ) | | | $ | (96,945 | ) | | | $ | 8,708 | |
| | | | | | | | | | | | | | | | | | | | | | | | | | | | |
| | | | | | | | | | | | | | | | | | | | | | | | | | | | |
Notional
Amount
(000)# | | Termination
Date | | Fixed Rate | | Floating Rate | | Fair
Value | | Upfront
Premiums
Paid(Received) | | Unrealized
Appreciation
(Depreciation) | | Counterparty |
| | | | | | | | | | | | | | | | | |
OTC Interest Rate Swap Agreements: | | | | |
MYR | | | | 2,300 | | | 07/21/27 | | 3.640%(Q) | | 3 Month KLIBOR(2)(Q)/3.160% | | | $ | (11,141 | ) | | | $ | (13 | ) | | | $ | (11,128 | ) | | GSI |
MYR | | | | 3,000 | | | 07/29/27 | | 3.500%(Q) | | 3 Month KLIBOR(2)(Q)/3.160% | | | | (18,712 | ) | | | | (14 | ) | | | | (18,698 | ) | | JPM |
MYR | | | | 1,230 | | | 10/17/27 | | 4.240%(Q) | | 3 Month KLIBOR(2)(Q)/3.160% | | | | 751 | | | | | (8 | ) | | | | 759 | | | MSI |
MYR | | | | 3,200 | | | 12/21/27 | | 4.370%(Q) | | 3 Month KLIBOR(2)(Q)/3.160% | | | | 4,161 | | | | | — | | | | | 4,161 | | | BOA |
| | | | | | | | | | | | | | | | | | | | | | | | | | | | |
| | | | | | | | | | | | | | $ | (24,941 | ) | | | $ | (35 | ) | | | $ | (24,906 | ) | | |
| | | | | | | | | | | | | | | | | | | | | | | | | | | | |
| (1) | The Fund pays the fixed rate and receives the floating rate. |
| (2) | The Fund pays the floating rate and receives the fixed rate. |
Balances Reported in the Statement of Assets and Liabilities for OTC Swap Agreements:
| | | | | | | | |
| | | Premiums Paid | | Premiums Received | | Unrealized
Appreciation | | Unrealized
Depreciation |
| | | | |
OTC Swap Agreements | | $— | | $(35) | | $4,920 | | $(29,826) |
Summary of Collateral for Centrally Cleared/Exchange-traded Derivatives:
Cash and securities segregated as collateral, including pending settlement for closed positions, to cover requirements for centrally cleared/exchange-traded derivatives are listed by broker as follows:
| | | | | | | | | | |
Broker | | Cash and/or Foreign Currency | | Securities Market Value |
| | |
CIGM | | | $ | 550,000 | | | | $ | — | |
JPS | | | | 170,000 | | | | | — | |
| | | | | | | | | | |
Total | | | $ | 720,000 | | | | $ | — | |
| | | | | | | | | | |
See Notes to Financial Statements.
36
Fair Value Measurements:
Various inputs are used in determining the value of the Fund’s investments. These inputs are summarized in the three broad levels listed below.
Level 1—unadjusted quoted prices generally in active markets for identical securities.
Level 2—quoted prices for similar securities, interest rates and yield curves, prepayment speeds, foreign currency exchange rates and other observable inputs.
Level 3—unobservable inputs for securities valued in accordance with Board approved fair valuation procedures.
The following is a summary of the inputs used as of October 31, 2022 in valuing such portfolio securities:
| | | | | | | | | | |
| | | Level 1 | | | Level 2 | | | Level 3 |
| | | |
Investments in Securities | | | | | | | | | | |
Assets | | | | | | | | | | |
Long-Term Investments | | | | | | | | | | |
Corporate Bonds | | | | | | | | | | |
Brazil | | $ | — | | | $ | 138,163 | | | $— |
Jamaica | | | — | | | | 117,500 | | | — |
Malaysia | | | — | | | | 148,000 | | | — |
Mexico | | | — | | | | 859,225 | | | — |
South Africa | | | — | | | | 389,375 | | | — |
Supranational Bank | | | — | | | | 113,615 | | | — |
Foreign Treasury Obligation | | | | | | | | | | |
Brazil | | | — | | | | 112,322 | | | — |
Sovereign Bonds | | | | | | | | | | |
Angola | | | — | | | | 194,500 | | | — |
Argentina | | | — | | | | 79,720 | | | — |
Brazil | | | — | | | | 1,308,690 | | | — |
Chile | | | — | | | | 479,019 | | | — |
China | | | — | | | | 2,078,689 | | | — |
Colombia | | | — | | | | 1,242,087 | | | — |
Czech Republic | | | — | | | | 714,610 | | | — |
Hungary | | | — | | | | 953,907 | | | — |
Indonesia | | | — | | | | 2,864,542 | | | — |
Malaysia | | | — | | | | 1,229,404 | | | — |
Mexico | | | — | | | | 1,122,058 | | | — |
Pakistan | | | — | | | | 179,022 | | | — |
Peru | | | — | | | | 649,947 | | | — |
Philippines | | | — | | | | 89,591 | | | — |
Poland | | | — | | | | 1,684,013 | | | — |
Romania | | | — | | | | 484,061 | | | — |
Serbia | | | — | | | | 113,929 | | | — |
South Africa | | | — | | | | 3,736,408 | | | — |
Thailand | | | — | | | | 1,891,578 | | | — |
Ukraine | | | — | | | | 60,904 | | | — |
Uruguay | | | — | | | | 40,928 | | | — |
Short-Term Investments | | | | | | | | | | |
U.S. Treasury Obligation | | | — | | | | 2,050,426 | | | — |
See Notes to Financial Statements.
PGIM Emerging Markets Debt Local Currency Fund 37
Schedule of Investments (continued)
as of October 31, 2022
| | | | | | | | | | |
| | | Level 1 | | | Level 2 | | | Level 3 |
| | | |
Investments in Securities (continued) | | | | | | | | | | |
Assets (continued) | | | | | | | | | | |
Short-Term Investments (continued) | | | | | | | | | | |
Unaffiliated Fund | | $ | 186,299 | | | $ | — | | | $— |
Options Purchased | | | — | | | | 49,825 | | | — |
| | | | | | | | | | |
| | | |
Total | | $ | 186,299 | | | $ | 25,176,058 | | | $— |
| | | | | | | | | | |
| | | |
Liabilities | | | | | | | | | | |
Options Written | | $ | — | | | $ | (149,315 | ) | | $— |
| | | | | | | | | | |
| | | |
Other Financial Instruments* | | | | | | | | | | |
Assets | | | | | | | | | | |
Futures Contracts | | $ | 42,634 | | | $ | — | | | $— |
OTC Forward Foreign Currency Exchange Contracts | | | — | | | | 858,200 | | | — |
OTC Cross Currency Exchange Contracts | | | — | | | | 1,629 | | | — |
Centrally Cleared Interest Rate Swap Agreements | | | — | | | | 855,385 | | | — |
OTC Interest Rate Swap Agreements | | | — | | | | 4,912 | | | — |
| | | | | | | | | | |
| | | |
Total | | $ | 42,634 | | | $ | 1,720,126 | | | $— |
| | | | | | | | | | |
| | | |
Liabilities | | | | | | | | | | |
OTC Forward Foreign Currency Exchange Contracts | | $ | — | | | $ | (679,408 | ) | | $— |
OTC Cross Currency Exchange Contracts | | | — | | | | (259 | ) | | — |
Centrally Cleared Credit Default Swap Agreement | | | — | | | | (259 | ) | | — |
Centrally Cleared Interest Rate Swap Agreements | | | — | | | | (846,677 | ) | | — |
OTC Interest Rate Swap Agreements | | | — | | | | (29,853 | ) | | — |
| | | | | | | | | | |
| | | |
Total | | $ | — | | | $ | (1,556,456 | ) | | $— |
| | | | | | | | | | |
| * | Other financial instruments are derivative instruments not reflected in the Schedule of Investments, such as futures, forwards and centrally cleared swap contracts, which are recorded at the unrealized appreciation (depreciation) on the instrument, and OTC swap contracts which are recorded at fair value. |
Industry Classification:
The industry classification of investments and other assets in excess of liabilities shown as a percentage of net assets as of October 31, 2022 were as follows:
| | | | |
Sovereign Bonds | | | 78.9 | % |
U.S. Treasury Obligation | | | 7.6 | |
Telecommunications | | | 3.0 | |
Electric | | | 0.8 | |
Chemicals | | | 0.7 | |
Unaffiliated Fund | | | 0.7 | |
Lodging | | | 0.6 | |
Oil &Gas | | | 0.6 | |
Retail | | | 0.5 | |
| | | | |
Multi-National | | | 0.4 | % |
Foreign Treasury Obligation | | | 0.4 | |
Options Purchased | | | 0.2 | |
| | | | |
| |
| | | 94.4 | |
Options Written | | | (0.5 | ) |
Other assets in excess of liabilities | | | 6.1 | |
| | | | |
| |
| | | 100.0 | % |
| | | | |
See Notes to Financial Statements.
38
Effects of Derivative Instruments on the Financial Statements and Primary Underlying Risk Exposure:
The Fund invested in derivative instruments during the reporting period. The primary types of risk associated with these derivative instruments are credit contracts risk, foreign exchange contracts risk and interest rate contracts risk. See the Notes to Financial Statements for additional detail regarding these derivative instruments and their risks. The effect of such derivative instruments on the Fund’s financial position and financial performance as reflected in the Statement of Assets and Liabilities and Statement of Operations is presented in the summary below.
Fair values of derivative instruments as of October 31, 2022 as presented in the Statement of Assets and Liabilities:
| | | | | | | | | | | | |
| | | Asset Derivatives | | | Liability Derivatives | |
| | | | |
Derivatives not accounted for as hedging instruments, carried at fair value | | Statement of Assets and Liabilities Location | | Fair
Value | | | Statement of Assets and Liabilities Location | | Fair
Value | |
| | | | |
| Credit contracts | | — | | $ | — | | | Due from/to broker-variation margin swaps | | $ | 259 | * |
| Foreign exchange contracts | | Unaffiliated investments | | | 49,825 | | | Options written outstanding, at value | | | 149,315 | |
| Foreign exchange contracts | | Unrealized appreciation on OTC cross currency exchange contracts | | | 1,629 | | | Unrealized depreciation on OTC cross currency exchange contracts | | | 259 | |
| Foreign exchange contracts | | Unrealized appreciation on OTC forward foreign currency exchange contracts | | | 858,200 | | | Unrealized depreciation on OTC forward foreign currency exchange contracts | | | 679,408 | |
| Interest rate contracts | | Due from/to broker-variation margin futures | | | 42,634 | * | | — | | | — | |
| Interest rate contracts | | Due from/to broker-variation margin swaps | | | 855,385 | * | | Due from/to broker-variation margin swaps | | | 846,677 | * |
| Interest rate contracts | | — | | | — | | | Premiums received for OTC swap agreements | | | 35 | |
| Interest rate contracts | | Unrealized appreciation on OTC swap agreements | | | 4,920 | | | Unrealized depreciation on OTC swap agreements | | | 29,826 | |
| | | | | | | | | | | | |
| | | | $ | 1,812,593 | | | | | $ | 1,705,779 | |
| | | | | | | | | | | | |
| * | Includes cumulative appreciation (depreciation) as reported in the schedule of open futures and centrally cleared swap contracts. Only unsettled variation margin receivable (payable) is reported within the Statement of Assets and Liabilities. |
See Notes to Financial Statements.
PGIM Emerging Markets Debt Local Currency Fund 39
Schedule of Investments (continued)
as of October 31, 2022
The effects of derivative instruments on the Statement of Operations for the year ended October 31, 2022 are as follows:
| | | | | | | | | | | | | | | | | | | | |
| Amount of Realized Gain (Loss) on Derivatives Recognized in Income | |
| | | | | |
Derivatives not accounted for as hedging instruments, carried at fair value | | Options
Purchased(1) | | | Options
Written | | | Futures | | | Forward
& Cross
Currency
Exchange
Contracts | | | Swaps | |
| | | | | |
Credit contracts | | $ | — | | | $ | — | | | $ | — | | | $ | — | | | $ | (18,633 | ) |
Foreign exchange contracts | | | 199,197 | | | | (166,316 | ) | | | — | | | | (292,298 | ) | | | — | |
Interest rate contracts | | | — | | | | — | | | | 223,481 | | | | — | | | | (38,783 | ) |
| | | | | | | | | | | | | | | | | | | | |
Total | | $ | 199,197 | | | $ | (166,316 | ) | | $ | 223,481 | | | $ | (292,298 | ) | | $ | (57,416 | ) |
| | | | | | | | | | | | | | | | | | | | |
| (1) | Included in net realized gain (loss) on investment transactions in the Statement of Operations. |
| | | | | | | | | | | | | | | | | | | | |
| Change in Unrealized Appreciation (Depreciation) on Derivatives Recognized in Income | |
| | | | | |
Derivatives not accounted for as hedging instruments, carried at fair value | | Options
Purchased(2) | | | Options
Written | | | Futures | | | Forward
& Cross
Currency
Exchange
Contracts | | | Swaps | |
| | | | | |
Credit contracts | | $ | — | | | $ | — | | | $ | — | | | $ | — | | | $ | (259 | ) |
Foreign exchange contracts | | | 26,685 | | | | (27,214 | ) | | | — | | | | 297,365 | | | | — | |
Interest rate contracts | | | — | | | | — | | | | (2,413 | ) | | | — | | | | 115,721 | |
| | | | | | | | | | | | | | | | | | | | |
Total | | $ | 26,685 | | | $ | (27,214 | ) | | $ | (2,413 | ) | | $ | 297,365 | | | $ | 115,462 | |
| | | | | | | | | | | | | | | | | | | | |
| (2) | Included in net change in unrealized appreciation (depreciation) on investments in the Statement of Operations. |
For the year ended October 31, 2022, the Fund’s average volume of derivative activities is as follows:
| | | | |
| Derivative Contract Type | | Average Volume of Derivative Activities* | |
Options Purchased (1) | | $ | 84,905 | |
Options Written (2) | | | 8,445,482 | |
Futures Contracts - Short Positions (2) | | | 2,801,560 | |
Forward Foreign Currency Exchange Contracts - Purchased (3) | | | 33,982,640 | |
Forward Foreign Currency Exchange Contracts - Sold (3) | | | 35,357,405 | |
Cross Currency Exchange Contracts (4) | | | 311,777 | |
Interest Rate Swap Agreements (2) | | | 41,501,296 | |
Credit Default Swap Agreements - Buy Protection (2) | | | 324,000 | |
| * | Average volume is based on average quarter end balances as noted for the year ended October 31, 2022. |
| (2) | Notional Amount in USD. |
| (3) | Value at Settlement Date. |
See Notes to Financial Statements.
40
Financial Instruments/Transactions—Summary of Offsetting and Netting Arrangements:
The Fund invested in OTC derivatives during the reporting period that are either offset in accordance with current requirements or are subject to enforceable master netting arrangements or similar agreements that permit offsetting. The information about offsetting and related netting arrangements for OTC derivatives where the legal right to set-off exists is presented in the summary below.
Offsetting of OTC derivative assets and liabilities:
| | | | | | | | | | | | | | | | | | | | | | | | | |
Counterparty | | Gross Amounts of
Recognized
Assets(1) | | Gross Amounts of
Recognized
Liabilities(1) | | Net Amounts of
Recognized
Assets/(Liabilities) | | Collateral
Pledged/(Received)(2) | | Net Amount |
| | | | | |
BARC | | | $ | 56,041 | | | | $ | (92,198 | ) | | | $ | (36,157 | ) | | | $ | — | | | | $ | (36,157 | ) |
BNP | | | | 4,892 | | | | | (3,806 | ) | | | | 1,086 | | | | | — | | | | | 1,086 | |
BOA | | | | 8,455 | | | | | (82,762 | ) | | | | (74,307 | ) | | | | — | | | | | (74,307 | ) |
CITI | | | | 132,367 | | | | | (155,446 | ) | | | | (23,079 | ) | | | | — | | | | | (23,079 | ) |
DB | | | | 6,730 | | | | | (221 | ) | | | | 6,509 | | | | | — | | | | | 6,509 | |
GSI | | | | 212,462 | | | | | (42,302 | ) | | | | 170,160 | | | | | — | | | | | 170,160 | |
HSBC | | | | 30,463 | | | | | (76,630 | ) | | | | (46,167 | ) | | | | — | | | | | (46,167 | ) |
JPM | | | | 243,327 | | | | | (155,852 | ) | | | | 87,475 | | | | | — | | | | | 87,475 | |
MSI | | | | 172,422 | | | | | (192,654 | ) | | | | (20,232 | ) | | | | — | | | | | (20,232 | ) |
SCB | | | | 34,433 | | | | | (18,832 | ) | | | | 15,601 | | | | | — | | | | | 15,601 | |
TD | | | | 9,172 | | | | | (24,802 | ) | | | | (15,630 | ) | | | | — | | | | | (15,630 | ) |
UAG | | | | 3,810 | | | | | (13,338 | ) | | | | (9,528 | ) | | | | — | | | | | (9,528 | ) |
| | | | | | | | | | | | | | | | | | | | | | | | | |
| | | $ | 914,574 | | | | $ | (858,843 | ) | | | $ | 55,731 | | | | $ | — | | | | $ | 55,731 | |
| | | | | | | | | | | | | | | | | | | | | | | | | |
| (1) | Includes unrealized appreciation/(depreciation) on swaps and forwards, premiums paid/(received) on swap agreements and market value of purchased and written options, as represented on the Statement of Assets and Liabilities. |
| (2) | Collateral amount disclosed by the Fund is limited to the market value of financial instruments/transactions and the Fund’s OTC derivative exposure by counterparty. |
See Notes to Financial Statements.
PGIM Emerging Markets Debt Local Currency Fund 41
Statement of Assets and Liabilities
as of October 31, 2022
| | | | |
| |
Assets | | | | |
| |
Unaffiliated investments (cost $32,576,549) | | $ | 25,362,357 | |
Foreign currency, at value (cost $392,662) | | | 378,068 | |
Unrealized appreciation on OTC forward foreign currency exchange contracts | | | 858,200 | |
Deposit with broker for centrally cleared/exchange-traded derivatives | | | 720,000 | |
Dividends and interest receivable | | | 434,905 | |
Tax reclaim receivable | | | 66,258 | |
Due from broker—variation margin swaps | | | 12,951 | |
Unrealized appreciation on OTC swap agreements | | | 4,920 | |
Due from Manager | | | 4,871 | |
Due from broker—variation margin futures | | | 3,537 | |
Unrealized appreciation on OTC cross currency exchange contracts | | | 1,629 | |
Prepaid expenses and other assets | | | 1,858 | |
| | | | |
| |
Total Assets | | | 27,849,554 | |
| | | | |
| |
Liabilities | | | | |
| |
Unrealized depreciation on OTC forward foreign currency exchange contracts | | | 679,408 | |
Options written outstanding, at value (premiums received $122,089) | | | 149,315 | |
Audit fee payable | | | 64,200 | |
Accrued expenses and other liabilities | | | 55,450 | |
Unrealized depreciation on OTC swap agreements | | | 29,826 | |
Payable for Fund shares purchased | | | 11,025 | |
Directors’ fees payable | | | 844 | |
Affiliated transfer agent fee payable | | | 766 | |
Distribution fee payable | | | 567 | |
Unrealized depreciation on OTC cross currency exchange contracts | | | 259 | |
Premiums received for OTC swap agreements | | | 35 | |
Dividends payable | | | 7 | |
| | | | |
| |
Total Liabilities | | | 991,702 | |
| | | | |
| |
Net Assets | | $ | 26,857,852 | |
| | | | |
| |
| | | | | |
| |
Net assets were comprised of: | | | | |
Common stock, at par | | $ | 62 | |
Paid-in capital in excess of par | | | 45,933,392 | |
Total distributable earnings (loss) | | | (19,075,602 | ) |
| | | | |
| |
Net assets, October 31, 2022 | | $ | 26,857,852 | |
| | | | |
See Notes to Financial Statements.
42
| | | | | | | | |
| | |
Class A | | | | | | | | |
| | |
Net asset value and redemption price per share, ($2,150,613 ÷ 503,459 shares of common stock issued and outstanding) | | $ | 4.27 | | | | | |
Maximum sales charge (3.25% of offering price) | | | 0.14 | | | | | |
| | | | | | | | |
| | |
Maximum offering price to public | | $ | 4.41 | | | | | |
| | | | | | | | |
| | |
Class C | | | | | | | | |
| | |
Net asset value, offering price and redemption price per share, ($126,155 ÷ 29,327 shares of common stock issued and outstanding) | | $ | 4.30 | | | | | |
| | | | | | | | |
| | |
Class Z | | | | | | | | |
| | |
Net asset value, offering price and redemption price per share, ($23,229,373 ÷ 5,390,612 shares of common stock issued and outstanding) | | $ | 4.31 | | | | | |
| | | | | | | | |
| | |
Class R6 | | | | | | | | |
| | |
Net asset value, offering price and redemption price per share, ($1,351,711 ÷ 313,804 shares of common stock issued and outstanding) | | $ | 4.31 | | | | | |
| | | | | | | | |
See Notes to Financial Statements.
PGIM Emerging Markets Debt Local Currency Fund 43
Statement of Operations
Year Ended October 31, 2022
| | | | |
Net Investment Income (Loss) | | | | |
| |
Income | | | | |
Interest income (net of $84,486 foreign withholding tax) | | $ | 2,314,156 | |
Unaffiliated dividend income (net of $1,244 foreign withholding tax) | | | 6,692 | |
Income from securities lending, net (including affiliated income of $148) | | | 604 | |
Affiliated dividend income | | | 268 | |
| | | | |
| |
Total income | | | 2,321,720 | |
| | | | |
| |
Expenses | | | | |
Management fee | | | 289,056 | |
Distribution fee(a) | | | 8,343 | |
Custodian and accounting fees | | | 79,687 | |
Audit fee | | | 64,200 | |
Transfer agent’s fees and expenses (including affiliated expense of $14,518)(a) | | | 63,109 | |
Registration fees(a) | | | 30,580 | |
Legal fees and expenses | | | 21,399 | |
Shareholders’ reports | | | 19,667 | |
Directors’ fees | | | 9,780 | |
Miscellaneous | | | 29,086 | |
| | | | |
| |
Total expenses | | | 614,907 | |
Less: Fee waiver and/or expense reimbursement(a) | | | (280,303 | ) |
| | | | |
| |
Net expenses | | | 334,604 | |
| | | | |
| |
Net investment income (loss) | | | 1,987,116 | |
| | | | |
| |
Realized And Unrealized Gain (Loss)On Investment And Foreign Currency Transactions | | | | |
| |
Net realized gain (loss) on: | | | | |
Investment transactions (including affiliated of $(114)) | | | (4,475,505 | ) |
Futures transactions | | | 223,481 | |
Forward currency contract transactions | | | (292,298 | ) |
Options written transactions | | | (166,316 | ) |
Swap agreement transactions | | | (57,416 | ) |
Foreign currency transactions | | | (2,491,492 | ) |
| | | | |
| |
| | | (7,259,546 | ) |
| | | | |
Net change in unrealized appreciation (depreciation) on: | | | | |
Investments (including affiliated of $21) | | | (4,198,970 | ) |
Futures | | | (2,413 | ) |
Forward and cross currency contracts | | | 297,365 | |
Options written | | | (27,214 | ) |
Swap agreements | | | 115,462 | |
Foreign currencies | | | (42,586 | ) |
| | | | |
| |
| | | (3,858,356 | ) |
| | | | |
| |
Net gain (loss) on investment and foreign currency transactions | | | (11,117,902 | ) |
| | | | |
| |
Net Increase (Decrease) In Net Assets Resulting From Operations | | $ | (9,130,786 | ) |
| | | | |
See Notes to Financial Statements.
44
| (a) | Class specific expenses and waivers were as follows: |
| | | | | | | | | | | | | | | | |
| | | Class A | | | Class C | | | Class Z | | | Class R6 | |
| | | | |
Distribution fee | | | 6,906 | | | | 1,437 | | | | — | | | | — | |
Transfer agent’s fees and expenses | | | 5,113 | | | | 976 | | | | 56,836 | | | | 184 | |
Registration fees | | | 7,794 | | | | 6,544 | | | | 10,198 | | | | 6,044 | |
Fee waiver and/or expense reimbursement | | | (20,914 | ) | | | (7,925 | ) | | | (235,234 | ) | | | (16,230 | ) |
See Notes to Financial Statements.
PGIM Emerging Markets Debt Local Currency Fund 45
Statements of Changes in Net Assets
| | | | | | | | |
| |
| | | Year Ended October 31, | |
| | | | |
| | |
| | | 2022 | | | 2021 | |
| | |
Increase (Decrease) in Net Assets | | | | | | | | |
| | |
Operations | | | | | | | | |
Net investment income (loss) | | $ | 1,987,116 | | | $ | 2,712,736 | |
Net realized gain (loss) on investment and foreign currency transactions | | | (7,259,546 | ) | | | (14,056 | ) |
Net change in unrealized appreciation (depreciation) on investments and foreign currencies | | | (3,858,356 | ) | | | (974,439 | ) |
| | | | | | | | |
| | |
Net increase (decrease) in net assets resulting from operations | | | (9,130,786 | ) | | | 1,724,241 | |
| | | | | | | | |
| | |
Dividends and Distributions | | | | | | | | |
Distributions from distributable earnings | | | | | | | | |
Class A | | | (32,039 | ) | | | (171,094 | ) |
Class C | | | (1,359 | ) | | | (11,953 | ) |
Class Z | | | (495,733 | ) | | | (2,832,895 | ) |
Class R6 | | | (25,551 | ) | | | (77,566 | ) |
| | | | | | | | |
| | |
| | | (554,682 | ) | | | (3,093,508 | ) |
| | | | | | | | |
Tax return of capital distributions | | | | | | | | |
Class A | | | (85,763 | ) | | | — | |
Class C | | | (3,638 | ) | | | — | |
Class Z | | | (1,326,945 | ) | | | — | |
Class R6 | | | (68,392 | ) | | | — | |
| | | | | | | | |
| | |
| | | (1,484,738 | ) | | | — | |
| | | | | | | | |
Fund share transactions (Net of share conversions) | | | | | | | | |
Net proceeds from shares sold | | | 13,758,267 | | | | 18,589,941 | |
Net asset value of shares issued in reinvestment of dividends and distributions | | | 2,038,819 | | | | 3,084,833 | |
Cost of shares purchased | | | (33,752,375 | ) | | | (26,083,180 | ) |
| | | | | | | | |
| | |
Net increase (decrease) in net assets from Fund share transactions | | | (17,955,289 | ) | | | (4,408,406 | ) |
| | | | | | | | |
| | |
Total increase (decrease) | | | (29,125,495 | ) | | | (5,777,673 | ) |
| | |
Net Assets: | | | | | | | | |
| | |
Beginning of year | | | 55,983,347 | | | | 61,761,020 | |
| | | | | | | | |
| | |
End of year | | $ | 26,857,852 | | | $ | 55,983,347 | |
| | | | | | | | |
See Notes to Financial Statements.
46
Financial Highlights
| | | | | | | | | | | | | | | | | | | | |
Class A Shares | |
| | | Year Ended October 31, | |
| | | | | | |
| | | 2022 | | | 2021 | | | 2020 | | | 2019 | | | 2018 | |
| | | | | | |
Per Share Operating Performance(a): | | | | | | | | | | | | | | | | | | | | |
Net Asset Value, Beginning of Year | | | $5.45 | | | | $5.57 | | | | $6.07 | | | | $5.52 | | | | $6.40 | |
Income (loss) from investment operations: | | | | | | | | | | | | | | | | | | | | |
Net investment income (loss) | | | 0.20 | | | | 0.22 | | | | 0.24 | | | | 0.30 | | | | 0.33 | |
Net realized and unrealized gain (loss) on investment and foreign currency transactions | | | (1.17 | ) | | | (0.09 | ) | | | (0.47 | ) | | | 0.57 | | | | (0.86 | ) |
Total from investment operations | | | (0.97 | ) | | | 0.13 | | | | (0.23 | ) | | | 0.87 | | | | (0.53 | ) |
Less Dividends and Distributions: | | | | | | | | | | | | | | | | | | | | |
Dividends from net investment income* | | | (0.04 | ) | | | (0.25 | ) | | | - | | | | (0.31 | ) | | | - | |
Tax return of capital distributions | | | (0.17 | ) | | | - | | | | (0.27 | ) | | | (0.01 | ) | | | (0.35 | ) |
Total dividends and distributions | | | (0.21 | ) | | | (0.25 | ) | | | (0.27 | ) | | | (0.32 | ) | | | (0.35 | ) |
Net asset value, end of year | | | $4.27 | | | | $5.45 | | | | $5.57 | | | | $6.07 | | | | $5.52 | |
Total Return(b): | | | (18.18 | )% | | | 2.19 | % | | | (3.75 | )% | | | 16.14 | % | | | (8.68 | )% |
| | | | | | | | | | | | | | | | | |
Ratios/Supplemental Data: | | | | | | | | | | | | | | | | | | | | |
Net assets, end of year (000) | | | $2,151 | | | | $3,489 | | | | $3,853 | | | | $3,692 | | | | $3,146 | |
Average net assets (000) | | | $2,762 | | | | $3,950 | | | | $3,518 | | | | $3,223 | | | | $4,105 | |
Ratios to average net assets(c): | | | | | | | | | | | | | | | | | | | | |
Expenses after waivers and/or expense reimbursement | | | 1.14 | %(d) | | | 1.13 | % | | | 1.13 | % | | | 1.13 | % | | | 1.13 | % |
Expenses before waivers and/or expense reimbursement | | | 1.90 | %(d) | | | 1.67 | % | | | 2.04 | % | | | 2.03 | % | | | 2.16 | % |
Net investment income (loss) | | | 4.13 | % | | | 3.75 | % | | | 4.24 | % | | | 5.13 | % | | | 5.34 | % |
Portfolio turnover rate(e) | | | 26 | % | | | 35 | % | | | 64 | % | | | 69 | % | | | 113 | % |
| * | Dividends from net investment income may include other items that are ordinary income for tax purposes. |
| (a) | Calculated based on average shares outstanding during the year. |
| (b) | Total return does not consider the effects of sales loads. Total return is calculated assuming a purchase of a share on the first day and a sale on the last day of each year reported and includes reinvestment of dividends and distributions, if any. Total returns may reflect adjustments to conform to GAAP. |
| (c) | Does not include expenses of the underlying funds in which the Fund invests. |
| (d) | Includes interest expense on borrowings from the Syndicated Credit Agreement of 0.01%, for the year ended October 31, 2022. |
| (e) | The Fund’s portfolio turnover rate is calculated in accordance with regulatory requirements, without regard to transactions involving short-term investments, certain derivatives and in-kind transactions (if any). If such transactions were included, the Fund’s portfolio turnover rate may be higher. |
See Notes to Financial Statements.
PGIM Emerging Markets Debt Local Currency Fund 47
Financial Highlights (continued)
| | | | | | | | | | | | | | | | | | | | |
Class C Shares | |
| | | Year Ended October 31, | |
| | | | | | |
| | | 2022 | | | 2021 | | | 2020 | | | 2019 | | | 2018 | |
| | | | | | |
Per Share Operating Performance(a): | | | | | | | | | | | | | | | | | | | | |
Net Asset Value, Beginning of Year | | | $5.49 | | | | $5.61 | | | | $6.11 | | | | $5.56 | | | | $6.46 | |
Income (loss) from investment operations: | | | | | | | | | | | | | | | | | | | | |
Net investment income (loss) | | | 0.17 | | | | 0.18 | | | | 0.20 | | | | 0.26 | | | | 0.29 | |
Net realized and unrealized gain (loss) on investment and foreign currency transactions | | | (1.19 | ) | | | (0.09 | ) | | | (0.47 | ) | | | 0.57 | | | | (0.88 | ) |
Total from investment operations | | | (1.02 | ) | | | 0.09 | | | | (0.27 | ) | | | 0.83 | | | | (0.59 | ) |
Less Dividends and Distributions: | | | | | | | | | | | | | | | | | | | | |
Dividends from net investment income* | | | - | | | | (0.21 | ) | | | - | | | | (0.27 | ) | | | - | |
Tax return of capital distributions | | | (0.17 | ) | | | - | | | | (0.23 | ) | | | (0.01 | ) | | | (0.31 | ) |
Total dividends and distributions | | | (0.17 | ) | | | (0.21 | ) | | | (0.23 | ) | | | (0.28 | ) | | | (0.31 | ) |
Net asset value, end of year | | | $4.30 | | | | $5.49 | | | | $5.61 | | | | $6.11 | | | | $5.56 | |
Total Return(b): | | | (18.82 | )% | | | 1.44 | % | | | (4.41 | )% | | | 15.18 | % | | | (9.61 | )% |
| | | | | | | | | | | | | | | | | |
Ratios/Supplemental Data: | | | | | | | | | | | | | | | | | | | | |
Net assets, end of year (000) | | | $126 | | | | $190 | | | | $466 | | | | $579 | | | | $538 | |
Average net assets (000) | | | $144 | | | | $331 | | | | $484 | | | | $566 | | | | $672 | |
Ratios to average net assets(c): | | | | | | | | | | | | | | | | | | | | |
Expenses after waivers and/or expense reimbursement | | | 1.89 | %(d) | | | 1.88 | % | | | 1.88 | % | | | 1.88 | % | | | 1.88 | % |
Expenses before waivers and/or expense reimbursement | | | 7.40 | %(d) | | | 4.60 | % | | | 5.82 | % | | | 4.82 | % | | | 4.89 | % |
Net investment income (loss) | | | 3.35 | % | | | 3.00 | % | | | 3.54 | % | | | 4.37 | % | | | 4.56 | % |
Portfolio turnover rate(e) | | | 26 | % | | | 35 | % | | | 64 | % | | | 69 | % | | | 113 | % |
| * | Dividends from net investment income may include other items that are ordinary income for tax purposes. |
| (a) | Calculated based on average shares outstanding during the year. |
| (b) | Total return does not consider the effects of sales loads. Total return is calculated assuming a purchase of a share on the first day and a sale on the last day of each year reported and includes reinvestment of dividends and distributions, if any. Total returns may reflect adjustments to conform to GAAP. |
| (c) | Does not include expenses of the underlying funds in which the Fund invests. |
| (d) | Includes interest expense on borrowings from the Syndicated Credit Agreement of 0.01%, for the year ended October 31, 2022. |
| (e) | The Fund’s portfolio turnover rate is calculated in accordance with regulatory requirements, without regard to transactions involving short-term investments, certain derivatives and in-kind transactions (if any).If such transactions were included, the Fund’s portfolio turnover rate may be higher. |
See Notes to Financial Statements.
48
| | | | | | | | | | | | | | | | | | | | |
Class Z Shares | |
| | | Year Ended October 31, | |
| | | | | | |
| | | 2022 | | | 2021 | | | 2020 | | | 2019 | | | 2018 | |
| | | | | | |
Per Share Operating Performance(a): | | | | | | | | | | | | | | | | | | | | |
Net Asset Value, Beginning of Year | | | $5.50 | | | | $5.62 | | | | $6.13 | | | | $5.57 | | | | $6.48 | |
Income (loss) from investment operations: | | | | | | | | | | | | | | | | | | | | |
Net investment income (loss) | | | 0.22 | | | | 0.24 | | | | 0.27 | | | | 0.32 | | | | 0.34 | |
Net realized and unrealized gain (loss) on investment and foreign currency transactions | | | (1.18 | ) | | | (0.08 | ) | | | (0.48 | ) | | | 0.58 | | | | (0.88 | ) |
Total from investment operations | | | (0.96 | ) | | | 0.16 | | | | (0.21 | ) | | | 0.90 | | | | (0.54 | ) |
Less Dividends and Distributions: | | | | | | | | | | | | | | | | | | | | |
Dividends from net investment income* | | | (0.06 | ) | | | (0.28 | ) | | | - | | | | (0.33 | ) | | | - | |
Tax return of capital distributions | | | (0.17 | ) | | | - | | | | (0.30 | ) | | | (0.01 | ) | | | (0.37 | ) |
Total dividends and distributions | | | (0.23 | ) | | | (0.28 | ) | | | (0.30 | ) | | | (0.34 | ) | | | (0.37 | ) |
Net asset value, end of year | | | $4.31 | | | | $5.50 | | | | $5.62 | | | | $6.13 | | | | $5.57 | |
Total Return(b): | | | (17.83 | )% | | | 2.63 | % | | | (3.45 | )% | | | 16.50 | % | | | (8.83 | )% |
| | | | | | | | | | | | | | | | | |
Ratios/Supplemental Data: | | | | | | | | | | | | | | | | | | | | |
Net assets, end of year (000) | | | $23,229 | | | | $49,067 | | | | $57,392 | | | | $68,101 | | | | $55,000 | |
Average net assets (000) | | | $39,563 | | | | $59,794 | | | | $56,989 | | | | $63,219 | | | | $49,644 | |
Ratios to average net assets(c): | | | | | | | | | | | | | | | | | | | | |
Expenses after waivers and/or expense reimbursement | | | 0.73 | %(d) | | | 0.72 | % | | | 0.74 | % | | | 0.88 | % | | | 0.88 | % |
Expenses before waivers and/or expense reimbursement | | | 1.32 | %(d) | | | 1.16 | % | | | 1.27 | % | | | 1.31 | % | | | 1.41 | % |
Net investment income (loss) | | | 4.49 | % | | | 4.16 | % | | | 4.72 | % | | | 5.35 | % | | | 5.50 | % |
Portfolio turnover rate(e) | | | 26 | % | | | 35 | % | | | 64 | % | | | 69 | % | | | 113 | % |
| * | Dividends from net investment income may include other items that are ordinary income for tax purposes. |
| (a) | Calculated based on average shares outstanding during the year. |
| (b) | Total return is calculated assuming a purchase of a share on the first day and a sale on the last day of each year reported and includes reinvestment of dividends and distributions, if any. Total returns may reflect adjustments to conform to GAAP. |
| (c) | Does not include expenses of the underlying funds in which the Fund invests. |
| (d) | Includes interest expense on borrowings from the Syndicated Credit Agreement of 0.01%, for the year ended October 31, 2022. |
| (e) | The Fund’s portfolio turnover rate is calculated in accordance with regulatory requirements, without regard to transactions involving short-term investments, certain derivatives and in-kind transactions (if any).If such transactions were included, the Fund’s portfolio turnover rate may be higher. |
See Notes to Financial Statements.
PGIM Emerging Markets Debt Local Currency Fund 49
Financial Highlights (continued)
| | | | | | | | | | | | | | | | | | | | |
Class R6 Shares | |
| | | Year Ended October 31, | |
| | | | | | |
| | | 2022 | | | 2021 | | | 2020 | | | 2019 | | | 2018 | |
| | | | | | |
Per Share Operating Performance(a): | | | | | | | | | | | | | | | | | | | | |
Net Asset Value, Beginning of Year | | | $5.50 | | | | $5.62 | | | | $6.12 | | | | $5.56 | | | | $6.47 | |
Income (loss) from investment operations: | | | | | | | | | | | | | | | | | | | | |
Net investment income (loss) | | | 0.23 | | | | 0.25 | | | | 0.27 | | | | 0.31 | | | | 0.36 | |
Net realized and unrealized gain (loss) on investment and foreign currency transactions | | | (1.19 | ) | | | (0.09 | ) | | | (0.47 | ) | | | 0.58 | | | | (0.89 | ) |
Total from investment operations | | | (0.96 | ) | | | 0.16 | | | | (0.20 | ) | | | 0.89 | | | | (0.53 | ) |
Less Dividends and Distributions: | | | | | | | | | | | | | | | | | | | | |
Dividends from net investment income* | | | (0.06 | ) | | | (0.28 | ) | | | - | | | | (0.32 | ) | | | - | |
Tax return of capital distributions | | | (0.17 | ) | | | - | | | | (0.30 | ) | | | (0.01 | ) | | | (0.38 | ) |
Total dividends and distributions | | | (0.23 | ) | | | (0.28 | ) | | | (0.30 | ) | | | (0.33 | ) | | | (0.38 | ) |
Net asset value, end of year | | | $4.31 | | | | $5.50 | | | | $5.62 | | | | $6.12 | | | | $5.56 | |
Total Return(b): | | | (17.77 | )% | | | 2.70 | % | | | (3.24 | )% | | | 16.41 | % | | | (8.63 | )% |
| | | | | | | | | | | | | | | | | |
Ratios/Supplemental Data: | | | | | | | | | | | | | | | | | | | | |
Net assets, end of year (000) | | | $1,352 | | | | $3,237 | | | | $50 | | | | $29 | | | | $1 | |
Average net assets (000) | | | $2,001 | | | | $1,613 | | | | $42 | | | | $15 | | | | $1 | |
Ratios to average net assets(c): | | | | | | | | | | | | | | | | | | | | |
Expenses after waivers and/or expense reimbursement | | | 0.66 | %(d) | | | 0.65 | % | | | 0.67 | % | | | 0.88 | % | | | 0.88 | % |
Expenses before waivers and/or expense reimbursement | | | 1.47 | %(d) | | | 1.63 | % | | | 40.50 | % | | | 92.22 | % | | | 1,595.87 | % |
Net investment income (loss) | | | 4.56 | % | | | 4.27 | % | | | 4.64 | % | | | 5.20 | % | | | 5.73 | % |
Portfolio turnover rate(e) | | | 26 | % | | | 35 | % | | | 64 | % | | | 69 | % | | | 113 | % |
| * | Dividends from net investment income may include other items that are ordinary income for tax purposes. |
| (a) | Calculated based on average shares outstanding during the year. |
| (b) | Total return is calculated assuming a purchase of a share on the first day and a sale on the last day of each year reported and includes reinvestment of dividends and distributions, if any. Total returns may reflect adjustments to conform to GAAP. |
| (c) | Does not include expenses of the underlying funds in which the Fund invests. |
| (d) | Includes interest expense on borrowings from the Syndicated Credit Agreement of 0.01%, for the year ended October 31, 2022. |
| (e) | The Fund’s portfolio turnover rate is calculated in accordance with regulatory requirements, without regard to transactions involving short-term investments, certain derivatives and in-kind transactions (if any).If such transactions were included, the Fund’s portfolio turnover rate may be higher. |
See Notes to Financial Statements.
50
Notes to Financial Statements
Prudential World Fund, Inc. (the “Registered Investment Company” or “RIC”) is registered under the Investment Company Act of 1940, as amended (“1940 Act”), as an open-end management investment company. The RIC is organized as a Maryland Corporation. These financial statements relate only to the PGIM Emerging Markets Debt Local Currency Fund (the “Fund”), a series of the RIC. The Fund is classified as a non-diversified fund for purposes of the 1940 Act.
The investment objective of the Fund is total return, through a combination of current income and capital appreciation.
The Fund follows the investment company accounting and reporting guidance of the Financial Accounting Standards Board (“FASB”) Accounting Standard Codification (“ASC”) Topic 946 Financial Services — Investment Companies. The following is a summary of significant accounting policies followed by the Fund in the preparation of its financial statements. The policies conform to U.S. generally accepted accounting principles (“GAAP”). The Fund consistently follows such policies in the preparation of its financial statements.
Securities Valuation: The Fund holds securities and other assets and liabilities that are fair valued as of the close of each day (generally, 4:00 PM Eastern time) the New York Stock Exchange (“NYSE”) is open for trading. As described in further detail below, the Fund’s investments are valued daily based on a number of factors, including the type of investment and whether market quotations are readily available. The RIC’s Board of Directors (the “Board”) has approved the Fund’s valuation policies and procedures for security valuation and designated to PGIM Investments LLC (“PGIM Investments” or the “Manager”) as the Valuation Designee pursuant to SEC Rule 2a-5(b) to perform the fair value determination relating to all Fund investments. Pursuant to the Board’s oversight, the Valuation Designee has established a Valuation Committee to perform the duties and responsibilities as valuation designee under SEC Rule 2a-5. The valuation procedures permit the Fund to utilize independent pricing vendor services, quotations from market makers, and alternative valuation methods when market quotations are either not readily available or not deemed representative of fair value. Fair value is the price that would be received to sell an asset or paid to transfer a liability in an orderly transaction between market participants on the measurement date. A record of the Valuation Committee’s actions is provided to the Board at the first quarterly meeting following the quarter in which such actions take place.
For the fiscal reporting year-end, securities and other assets and liabilities were fair valued at the close of the last U.S. business day. Trading in certain foreign securities may occur when
PGIM Emerging Markets Debt Local Currency Fund 51
Notes to Financial Statements (continued)
the NYSE is closed (including weekends and holidays). Because such foreign securities trade in markets that are open on weekends and U.S. holidays, the values of some of the Fund’s foreign investments may change on days when investors cannot purchase or redeem Fund shares.
Various inputs determine how the Fund’s investments are valued, all of which are categorized according to the three broad levels (Level 1, 2, or 3) detailed in the Schedule of Investments and referred to herein as the “fair value hierarchy” in accordance with FASB ASC Topic 820 - Fair Value Measurement.
Common or preferred stocks, exchange-traded funds and derivative instruments, if applicable, that are traded on a national securities exchange are valued at the last sale price as of the close of trading on the applicable exchange where the security principally trades. Securities traded via NASDAQ are valued at the NASDAQ official closing price. To the extent these securities are valued at the last sale price or NASDAQ official closing price, they are classified as Level 1 in the fair value hierarchy. In the event that no sale or official closing price on valuation date exists, these securities are generally valued at the mean between the last reported bid and ask prices, or at the last bid price in the absence of an ask price. These securities are classified as Level 2 in the fair value hierarchy.
Investments in open-end funds (other than exchange-traded funds) are valued at their net asset values as of the close of the NYSE on the date of valuation. These securities are classified as Level 1 in the fair value hierarchy since they may be purchased or sold at their net asset values on the date of valuation.
Fixed income securities traded in the OTC market are generally classified as Level 2 in the fair value hierarchy. Such fixed income securities are typically valued using the market approach which generally involves obtaining data from an approved independent third-party vendor source. The Fund utilizes the market approach as the primary method to value securities when market prices of identical or comparable instruments are available. The third-party vendors’ valuation techniques used to derive the evaluated bid price are based on evaluating observable inputs, including but not limited to, yield curves, yield spreads, credit ratings, deal terms, tranche level attributes, default rates, cash flows, prepayment speeds, broker/dealer quotations and reported trades. Certain Level 3 securities are also valued using the market approach when obtaining a single broker quote or when utilizing transaction prices for identical securities that have been used in excess of five business days. During the reporting period, there were no changes to report with respect to the valuation approach and/or valuation techniques discussed above.
OTC and centrally cleared derivative instruments are generally classified as Level 2 in the fair value hierarchy. Such derivative instruments are typically valued using the market
52
approach and/or income approach which generally involves obtaining data from an approved independent third-party vendor source. The Fund utilizes the market approach when quoted prices in broker-dealer markets are available but also includes consideration of alternative valuation approaches, including the income approach. In the absence of reliable market quotations, the income approach is typically utilized for purposes of valuing derivatives such as interest rate swaps based on a discounted cash flow analysis whereby the value of the instrument is equal to the present value of its future cash inflows or outflows. Such analysis includes projecting future cash flows and determining the discount rate (including the present value factors that affect the discount rate) used to discount the future cash flows. In addition, the third-party vendors’ valuation techniques used to derive the evaluated derivative price is based on evaluating observable inputs, including but not limited to, underlying asset prices, indices, spreads, interest rates and exchange rates. Certain derivatives may be classified as Level 3 when valued using the market approach by obtaining a single broker quote or when utilizing unobservable inputs in the income approach. During the reporting period, there were no changes to report with respect to the valuation approach and/or valuation techniques discussed above.
Securities and other assets that cannot be priced according to the methods described above are valued based on policies and procedures approved by the Board. In the event that unobservable inputs are used when determining such valuations, the securities will be classified as Level 3 in the fair value hierarchy. Altering one or more unobservable inputs may result in a significant change to a Level 3 security’s fair value measurement.
When determining the fair value of securities, some of the factors influencing the valuation include: the nature of any restrictions on disposition of the securities; assessment of the general liquidity of the securities; the issuer’s financial condition and the markets in which it does business; the cost of the investment; the size of the holding and the capitalization of the issuer; the prices of any recent transactions or bids/offers for such securities or any comparable securities; any available analyst media or other reports or information deemed reliable by the Valuation Designee regarding the issuer or the markets or industry in which it operates. Using fair value to price securities may result in a value that is different from a security’s most recent closing price and from the price used by other unaffiliated mutual funds to calculate their net asset values.
Foreign Currency Translation: The books and records of the Fund are maintained in U.S. dollars. Foreign currency amounts are translated into U.S. dollars on the following basis:
(i) market value of investment securities, other assets and liabilities — at the exchange rate as of the valuation date;
(ii) purchases and sales of investment securities, income and expenses — at the rates of exchange prevailing on the respective dates of such transactions.
Although the net assets of the Fund are presented at the foreign exchange rates and market values at the close of the period, the Fund does not generally isolate that portion of the
PGIM Emerging Markets Debt Local Currency Fund 53
Notes to Financial Statements (continued)
results of operations arising as a result of changes in the foreign exchange rates from the fluctuations arising from changes in the market prices of long-term portfolio securities held at the end of the period. Similarly, the Fund does not isolate the effect of changes in foreign exchange rates from the fluctuations arising from changes in the market prices of long-term portfolio securities sold during the period. Accordingly, holding period unrealized and realized foreign currency gains (losses) are included in the reported net change in unrealized appreciation (depreciation) on investments and net realized gains (losses) on investment transactions on the Statements of Operations. Notwithstanding the above, the Fund does isolate the effect of fluctuations in foreign currency exchange rates when determining the gain (loss) upon the sale or maturity of foreign currency denominated debt obligations; such amounts are included in net realized gains (losses) on foreign currency transactions.
Additionally, net realized gains (losses) on foreign currency transactions represent net foreign exchange gains (losses) from the disposition of holdings of foreign currencies, currency gains (losses) realized between the trade and settlement dates on investment transactions, and the difference between the amounts of interest, dividends and foreign withholding taxes recorded on the Fund’s books and the U.S. dollar equivalent amounts actually received or paid. Net unrealized currency gains (losses) arise from valuing foreign currency denominated assets and liabilities (other than investments) at period end exchange rates.
Forward and Cross Currency Contracts: A forward currency contract is a commitment to purchase or sell a foreign currency at a future date at a negotiated forward rate. The Fund enters into forward currency contracts, as defined in the prospectus, in order to hedge its exposure to changes in foreign currency exchange rates on its foreign portfolio holdings or on specific receivables and payables denominated in a foreign currency and to gain exposure to certain currencies. The contracts are valued daily at current forward exchange rates and any unrealized gain (loss) is included in net unrealized appreciation or depreciation on forward and cross currency contracts. Gain (loss) is realized on the settlement date of the contract equal to the difference between the settlement value of the original and negotiated forward contracts. This gain (loss), if any, is included in net realized gain (loss) on forward and cross currency contract transactions. Risks may arise upon entering into these contracts from the potential inability of the counterparties to meet the terms of their contracts. Forward currency contracts involve risks from currency exchange rate and credit risk in excess of the amounts reflected on the Statement of Assets and Liabilities. The Fund’s maximum risk of loss from counterparty credit risk is the net value of the cash flows to be received from the counterparty at the end of the contract’s life. A cross currency contract is a forward contract where a specified amount of one foreign currency will be exchanged for a specified amount of another foreign currency.
54
Options: The Fund purchased and/or wrote options in order to hedge against adverse market movements or fluctuations in value caused by changes in prevailing interest rates, value of equities or foreign currency exchange rates with respect to securities or financial instruments which the Fund currently owns or intends to purchase. The Fund may also use options to gain additional market exposure. The Fund’s principal reason for writing options is to realize, through receipt of premiums, a greater current return than would be realized on the underlying security alone. When the Fund purchases an option, it pays a premium and an amount equal to that premium is recorded as an asset. When the Fund writes an option, it receives a premium and an amount equal to that premium is recorded as a liability. The asset or liability is adjusted daily to reflect the current market value of the option. If an option expires unexercised, the Fund realizes a gain (loss) to the extent of the premium received or paid. If an option is exercised, the premium received or paid is recorded as an adjustment to the proceeds from the sale or the cost of the purchase in determining whether the Fund has realized a gain (loss). The difference between the premium and the amount received or paid at the closing of a purchase or sale transaction is also treated as a realized gain (loss). Gain (loss) on purchased options is included in net realized gain (loss) on investment transactions. Gain (loss) on written options is presented separately as net realized gain (loss) on options written transactions.
The Fund, as writer of an option, may have no control over whether the underlying securities or financial instruments may be sold (called) or purchased (put). As a result, the Fund bears the market risk of an unfavorable change in the price of the security or financial instrument underlying the written option. The Fund, as purchaser of an OTC option, bears the risk of the potential inability of the counterparties to meet the terms of their contracts. With exchange-traded options contracts, there is minimal counterparty credit risk to the Fund since the exchanges’ clearinghouse acts as counterparty to all exchange-traded options and guarantees the options contracts against default.
When the Fund writes an option on a swap, an amount equal to any premium received by the Fund is recorded as a liability and is subsequently adjusted to the current market value of the written option on the swap. If a call option on a swap is exercised, the Fund becomes obligated to pay a fixed interest rate (noted as the strike price) and receive a variable interest rate on a notional amount. If a put option on a swap is exercised, the Fund becomes obligated to pay a variable interest rate and receive a fixed interest rate (noted as the strike price) on a notional amount. Premiums received from writing options on swaps that expire or are exercised are treated as realized gains upon the expiration or exercise of such options on swaps. The risk associated with writing put and call options on swaps is that the Fund will be obligated to be party to a swap agreement if an option on a swap is exercised.
Financial Futures Contracts: A financial futures contract is an agreement to purchase (long) or sell (short) an agreed amount of securities at a set price for delivery on a future date. Upon entering into a financial futures contract, the Fund is required to pledge to the broker an amount of cash and/or other assets equal to a certain percentage of the contract amount. This amount is known as the “initial margin.” Subsequent payments, known as “variation margin,” are made or received by the Fund each day, depending on the daily fluctuations in
PGIM Emerging Markets Debt Local Currency Fund 55
Notes to Financial Statements (continued)
the value of the underlying security. Such variation margin is recorded for financial statement purposes on a daily basis as unrealized gain (loss). When the contract expires or is closed, the gain (loss) is realized and is presented in the Statement of Operations as net realized gain (loss) on futures transactions.
The Fund invested in financial futures contracts in order to hedge its existing portfolio securities, or securities the Fund intends to purchase, against fluctuations in value caused by changes in prevailing interest rates. Should interest rates move unexpectedly, the Fund may not achieve the anticipated benefits of the financial futures contracts and may realize a loss. The use of futures transactions involves the risk of imperfect correlation in movements in the price of futures contracts, interest rates and the underlying hedged assets. Since futures contracts are exchange-traded, there is minimal counterparty credit risk to the Fund since the exchanges’ clearinghouse acts as counterparty to all exchange-traded futures and guarantees the futures contracts against default.
Swap Agreements: The Fund entered into certain types of swap agreements detailed in the disclosures below. A swap agreement is an agreement to exchange the return generated by one instrument for the return generated by another instrument. Swap agreements are negotiated in the OTC market and may be executed either directly with a counterparty (“OTC-traded”) or through a central clearing facility, such as a registered exchange. Swap agreements are valued daily at current market value and any change in value is included in the net unrealized appreciation or depreciation on swap agreements. Centrally cleared swaps pay or receive an amount known as “variation margin”, based on daily changes in the valuation of the swap contract. For OTC-traded, upfront premiums paid and received are shown as swap premiums paid and swap premiums received in the Statement of Assets and Liabilities. Risk of loss may exceed amounts recognized on the Statement of Assets and Liabilities. Swap agreements outstanding at period end, if any, are listed on the Schedule of Investments.
Interest Rate Swaps: Interest rate swaps represent an agreement between counterparties to exchange cash flows based on the difference between two interest rates, applied to a notional principal amount for a specified period. The Fund is subject to interest rate risk exposure in the normal course of pursuing its investment objective. The Fund used interest rate swaps to maintain its ability to generate steady cash flow by receiving a stream of fixed rate payments or to increase exposure to prevailing market rates by receiving floating rate payments. The Fund’s maximum risk of loss from counterparty credit risk is the discounted net present value of the cash flows to be received from the counterparty over the contract’s remaining life.
Credit Default Swaps (“CDS”): CDS involve one party (the protection buyer) making a stream of payments to another party (the protection seller) in exchange for the right to receive a
56
specified payment in the event of a default or as a result of a default (collectively a “credit event”) for the referenced entity (typically corporate issues or sovereign issues of an emerging country) on its obligation; or in the event of a write-down, principal shortfall, interest shortfall or default of all or part of the referenced entities comprising a credit index.
The Fund is subject to credit risk in the normal course of pursuing its investment objectives, and as such, has entered into CDS contracts to provide a measure of protection against defaults or to take an active long or short position with respect to the likelihood of a particular issuer’s default or the reference entity’s credit soundness. CDS contracts generally trade based on a spread which represents the cost a protection buyer has to pay the protection seller. The protection buyer is said to be short the credit as the value of the contract rises the more the credit deteriorates. The value of the CDS contract increases for the protection buyer if the spread increases. The Fund’s maximum risk of loss from counterparty credit risk for purchased CDS is the inability of the counterparty to honor the contract up to the notional value due to a credit event.
As a seller of protection on credit default swap agreements, the Fund generally receives an agreed upon payment from the buyer of protection throughout the term of the swap, provided no credit event occurs. As the seller, the Fund effectively increases its investment risk because, in addition to its total net assets, the Fund may be subject to investment exposure on the notional amount of the swap.
The maximum amount of the payment that the Fund, as a seller of protection, could be required to make under a credit default swap agreement would be equal to the notional amount of the underlying security or index contract as a result of a credit event. This potential amount will be partially offset by any recovery values of the respective referenced obligations, or net amounts received from the settlement of buy protection credit default swap agreements which the Fund entered into for the same referenced entity or index. As a buyer of protection, the Fund generally receives an amount up to the notional value of the swap if a credit event occurs.
Implied credit spreads, represented in absolute terms, utilized in determining the market value of credit default swap agreements where the Fund is the seller of protection as of period end are disclosed in the footnotes to the Schedule of Investments, if applicable. These spreads serve as indicators of the current status of the payment/performance risk and represent the likelihood of default risk for the credit derivative. The implied credit spread of a particular referenced entity reflects the cost of buying/selling protection and may include upfront payments required to enter into the agreement. Wider credit spreads and increased market value in absolute terms, when compared to the notional amount of the swap, represent a deterioration of the referenced entity’s credit soundness and a greater likelihood of risk of default or other credit event occurring as defined under the terms of the agreement.
Master Netting Arrangements: The RIC, on behalf of the Fund, is subject to various Master Agreements, or netting arrangements, with select counterparties. These are agreements
PGIM Emerging Markets Debt Local Currency Fund 57
Notes to Financial Statements (continued)
which a subadviser may have negotiated and entered into on behalf of all or a portion of the Fund. A master netting arrangement between the Fund and the counterparty permits the Fund to offset amounts payable by the Fund to the same counterparty against amounts to be received; and by the receipt of collateral from the counterparty by the Fund to cover the Fund’s exposure to the counterparty. However, there is no assurance that such mitigating factors are easily enforceable. In addition to master netting arrangements, the right to set-off exists when all the conditions are met such that each of the parties owes the other determinable amounts, the reporting party has the right to set-off the amount owed with the amount owed by the other party, the reporting party intends to set-off and the right of set-off is enforceable by law.
The RIC, on behalf of the Fund, is a party to International Swaps and Derivatives Association, Inc. (“ISDA”) Master Agreements with certain counterparties that govern OTC derivative and foreign exchange contracts entered into from time to time. The Master Agreements may contain provisions regarding, among other things, the parties’ general obligations, representations, agreements, collateral requirements, events of default and early termination. With respect to certain counterparties, in accordance with the terms of the Master Agreements, collateral posted to the Fund is held in a segregated account by the Fund’s custodian and with respect to those amounts which can be sold or re-pledged, is presented in the Schedule of Investments. Collateral pledged by the Fund is segregated by the Fund’s custodian and identified in the Schedule of Investments. Collateral can be in the form of cash or debt securities issued by the U.S. Government or related agencies or other securities as agreed to by the Fund and the applicable counterparty. Collateral requirements are determined based on the Fund’s net position with each counterparty. Termination events applicable to the Fund may occur upon a decline in the Fund’s net assets below a specified threshold over a certain period of time. Termination events applicable to counterparties may occur upon a decline in the counterparty’s long-term and short-term credit ratings below a specified level. In each case, upon occurrence, the other party may elect to terminate early and cause settlement of all derivative and foreign exchange contracts outstanding, including the payment of any losses and costs resulting from such early termination, as reasonably determined by the terminating party. Any decision by one or more of the Fund’s counterparties to elect early termination could impact the Fund’s future derivative activity.
In addition to each instrument’s primary underlying risk exposure (e.g. interest rate, credit, equity or foreign exchange, etc.), swap agreements involve, to varying degrees, elements of credit, market and documentation risk. Such risks involve the possibility that no liquid market for these agreements will exist, the counterparty to the agreement may default on its obligation to perform or disagree on the contractual terms of the agreement, and changes in net interest rates will be unfavorable. In connection with these agreements, securities in the portfolio may be identified or received as collateral from the counterparty in accordance with the terms of the respective swap agreements to provide or receive assets of value and to
58
serve as recourse in the event of default or bankruptcy/insolvency of either party. Such OTC derivative agreements include conditions which, when materialized, give the counterparty the right to cause an early termination of the transactions under those agreements. Any election by the counterparty for early termination of the contract(s) may impact the amounts reported on financial statements.
Short sales and OTC contracts, including forward foreign currency exchange contracts, swaps, forward rate agreements and written options involve elements of both market and credit risk in excess of the amounts reflected on the Statement of Assets and Liabilities, if applicable. Such risks may be mitigated by engaging in master netting arrangements.
Securities Lending: The Fund lends its portfolio securities to banks and broker-dealers. The loans are secured by collateral at least equal to the market value of the securities loaned. Collateral pledged by each borrower is invested in an affiliated money market fund and is marked to market daily, based on the previous day’s market value, such that the value of the collateral exceeds the value of the loaned securities. In the event of significant appreciation in value of securities on loan on the last business day of the reporting period, the financial statements may reflect a collateral value that is less than the market value of the loaned securities. Such shortfall is remedied as described above. Loans are subject to termination at the option of the borrower or the Fund. Upon termination of the loan, the borrower will return to the Fund securities identical to the loaned securities. The remaining open loans of the securities lending transactions are considered overnight and continuous. Should the borrower of the securities fail financially, the Fund has the right to repurchase the securities in the open market using the collateral.
The Fund recognizes income, net of any rebate and securities lending agent fees, for lending its securities in the form of fees or interest on the investment of any cash received as collateral. The borrower receives all interest and dividends from the securities loaned and such payments are passed back to the lender in amounts equivalent thereto, which are reflected in interest income or unaffiliated dividend income based on the nature of the payment on the Statement of Operations. The Fund also continues to recognize any unrealized gain (loss) in the market price of the securities loaned and on the change in the value of the collateral invested that may occur during the term of the loan. In addition, realized gain (loss) is recognized on changes in the value of the collateral invested upon liquidation of the collateral. Net earnings from securities lending are disclosed in the Statement of Operations.
Securities Transactions and Net Investment Income: Securities transactions are recorded on the trade date. Realized gains (losses) from investment and currency transactions are calculated on the specific identification method. Dividend income is recorded on the ex-date, or for certain foreign securities, when the Fund becomes aware of such dividends. Interest income, including amortization of premium and accretion of discount on debt securities, as required, is recorded on the accrual basis. Expenses are recorded on an accrual basis, which may require the use of certain estimates by management that may differ from actual. Net investment income or loss (other than class specific expenses and
PGIM Emerging Markets Debt Local Currency Fund 59
Notes to Financial Statements (continued)
waivers, which are allocated as noted below) and unrealized and realized gains (losses) are allocated daily to each class of shares based upon the relative proportion of adjusted net assets of each class at the beginning of the day. Class specific expenses and waivers, where applicable, are charged to the respective share classes. Such class specific expenses and waivers include distribution fees and distribution fee waivers, shareholder servicing fees, transfer agent’s fees and expenses, registration fees and fee waivers and/or expense reimbursements, as applicable.
Taxes: It is the Fund’s policy to continue to meet the requirements of the Internal Revenue Code applicable to regulated investment companies and to distribute all of its taxable net investment income and capital gains, if any, to its shareholders. Therefore, no federal income tax provision is required. Withholding taxes on foreign dividends, interest and capital gains, if any, are recorded, net of reclaimable amounts, at the time the related income is earned.
Dividends and Distributions: Dividends and distributions to shareholders, which are determined in accordance with federal income tax regulations and which may differ from GAAP, are recorded on the ex-date. Permanent book/tax differences relating to income and gain (loss) are reclassified between total distributable earnings (loss) and paid-in capital in excess of par, as appropriate. The chart below sets forth the expected frequency of dividend and capital gains distributions to shareholders. Various factors may impact the frequency of dividend distributions to shareholders, including but not limited to adverse market conditions or portfolio holding-specific events.
| | |
| Expected Distribution Schedule to Shareholders* | | Frequency |
| Net Investment Income | | Monthly |
| Short-Term Capital Gains | | Annually |
| Long-Term Capital Gains | | Annually |
| * | Under certain circumstances, the Fund may make more than one distribution of short-term and/or long-term capital gains during a fiscal year. |
Estimates: The preparation of financial statements requires management to make estimates and assumptions that affect the reported amounts and disclosures in the financial statements. Actual results could differ from those estimates.
The RIC, on behalf of the Fund, has a management agreement with the Manager pursuant to which it has responsibility for all investment advisory services and supervises the subadvisers’ performance of such services, and pursuant to which it renders administrative services.
60
The Manager has entered into a subadvisory agreement with PGIM, Inc., which provides subadvisory services to the Fund through its PGIM Fixed Income unit, and PGIM Limited (collectively the “subadviser”). The Manager pays for the services of subadvisers.
Fees payable under the management agreement are computed daily and paid monthly. For the reporting period ended October 31, 2022, the contractual and effective management fee rates were as follows:
| | |
| Contractual Management Rate | | Effective Management Fee, before any waivers and/or expense reimbursements |
| 0.650% on average daily net assets up to $1 billion; | | 0.65% |
| 0.630% on average daily net assets from $1 billion to $3 billion; | | |
| 0.610% on average daily net assets from $3 billion to $5 billion; | | |
| 0.600% on average daily net assets from $5 billion to $10 billion; | | |
| 0.590% on average daily net assets over $10 billion. | | |
The Manager has contractually agreed, through February 29, 2024, to limit total annual operating expenses after fee waivers and/or expense reimbursements. This contractual waiver excludes interest, brokerage, taxes (such as income and foreign withholding taxes, stamp duty and deferred tax expenses), acquired fund fees and expenses, extraordinary expenses, and certain other Fund expenses such as dividend and interest expense and broker charges on short sales.
Where applicable, the Manager agrees to waive management fees or shared operating expenses on any share class to the same extent that it waives such expenses on any other share class. In addition, total annual operating expenses for Class R6 shares will not exceed total annual operating expenses for Class Z shares. Fees and/or expenses waived and/or reimbursed by the Manager for the purpose of preventing the expenses from exceeding a certain expense ratio limit may be recouped by the Manager within the same fiscal year during which such waiver and/or reimbursement is made if such recoupment can be realized without exceeding the expense limit in effect at the time of the recoupment for that fiscal year. The expense limitations attributable to each class are as follows:
| | |
| Class | | Expense
Limitations |
| A | | 1.13% |
| C | | 1.88 |
| Z | | 0.72 |
| R6 | | 0.65 |
The RIC, on behalf of the Fund, has a distribution agreement with Prudential Investment Management Services LLC (“PIMS”), which acts as the distributor of the Class A, Class C, Class Z and Class R6 shares of the Fund. The Fund compensates PIMS for distributing and servicing the Fund’s Class A and Class C shares, pursuant to the plans of distribution (the “Distribution Plans”),regardless of expenses actually incurred by PIMS.
PGIM Emerging Markets Debt Local Currency Fund 61
Notes to Financial Statements (continued)
Pursuant to the Distribution Plans, the Fund compensates PIMS for distribution related activities at an annual rate based on average daily net assets per class. The distribution fees are accrued daily and payable monthly.
The Fund’s annual gross and net distribution rate, where applicable, are as follows:
| | | | |
| Class | | Gross Distribution Fee | | Net Distribution Fee |
| A | | 0.25% | | 0.25% |
| C | | 1.00 | | 1.00 |
| Z | | N/A | | N/A |
| R6 | | N/A | | N/A |
For the year ended October 31, 2022, PIMS received front-end sales charges (“FESL”) resulting from sales of certain class shares and contingent deferred sales charges (“CDSC”) imposed upon redemptions by certain shareholders. From these fees, PIMS paid such sales charges to broker-dealers, who in turn paid commissions to salespersons and incurred other distribution costs. The sales charges are as follows where applicable:
| | | | | | | | |
| Class | | | FESL | | | | CDSC | |
| A | | $ | 4,717 | | | $ | — | |
| C | | | — | | | | — | |
PGIM Investments, PGIM, Inc., PGIM Limited and PIMS are indirect, wholly-owned subsidiaries of Prudential Financial, Inc. (“Prudential”).
| 4. | Other Transactions with Affiliates |
Prudential Mutual Fund Services LLC (“PMFS”), an affiliate of PGIM Investments and an indirect, wholly-owned subsidiary of Prudential, serves as the Fund’s transfer agent and shareholder servicing agent. Transfer agent’s fees and expenses in the Statement of Operations include certain out-of-pocket expenses paid to non-affiliates, where applicable.
The Fund may invest its overnight sweep cash in the PGIM Core Ultra Short Bond Fund (the “Core Fund”), and its securities lending cash collateral in the PGIM Institutional Money Market Fund (the “Money Market Fund”), each a fund of Prudential Investment Portfolios 2, registered under the 1940 Act and managed by PGIM Investments. PGIM Investments and/or its affiliates are paid fees or reimbursed for providing their services to the Core Fund. In addition to the realized and unrealized gains on investments in the Core Fund and Money Market Fund, earnings from such investments are disclosed on the Statement of Operations as “Affiliated dividend income” and “Income from securities lending, net”, respectively. Effective January 2022, the Fund changed its overnight cash sweep vehicle from the Core Fund to an unaffiliated money market fund.
62
The Fund may enter into certain securities purchase or sale transactions under Board approved Rule 17a-7 procedures. Rule 17a-7 is an exemptive rule under the 1940 Act, that subject to certain conditions, permits purchase and sale transactions among affiliated investment companies, or between an investment company and a person that is affiliated solely by reason of having a common (or affiliated) investment adviser, common directors/trustees, and/or common officers. For the year ended October 31, 2022, no 17a-7 transactions were entered into by the Fund.
The aggregate cost of purchases and proceeds from sales of portfolio securities (excluding short-term investments and U.S. Government securities) for the reporting period ended October 31, 2022, were as follows:
| | |
| Cost of Purchases | | Proceeds from Sales |
| $10,812,160 | | $30,216,612 |
A summary of the cost of purchases and proceeds from sales of shares of affiliated mutual funds for the year ended October 31, 2022, is presented as follows:
| | | | | | | | | | | | | | | | | | | | | | | | | | | | | | |
Value,
Beginning
of Year | | | Cost of
Purchases | | | Proceeds
from Sales | | | Change in
Unrealized
Gain
(Loss) | | | Realized
Gain
(Loss) | | | Value,
End of Year | | | Shares,
End
of Year | | | Income | |
|
| | Short-Term Investments - Affiliated Mutual Funds: | |
| PGIM Core Ultra Short Bond Fund(1)(wa) | |
| | $586,842 | | | $ | 9,154,727 | | | $ | 9,741,569 | | | $ | — | | | $ | — | | | | $— | | | | — | | | $ | 268 | |
| PGIM Institutional Money Market Fund(1)(b)(wa) | |
| | 219,262 | | | | 1,454,555 | | | | 1,673,724 | | | | 21 | | | | (114 | ) | | | — | | | | — | | | | 148 | (2) |
| | $806,104 | | | $ | 10,609,282 | | | $ | 11,415,293 | | | $ | 21 | | | $ | (114 | ) | | | $— | | | | | | | $ | 416 | |
| (1) | The Fund did not have any capital gain distributions during the reporting period. |
| (2) | The amount, or a portion thereof, represents the affiliated securities lending income shown on the Statement of Operations. |
| (b) | Represents security, or portion thereof, purchased with cash collateral received for securities on loan and includes dividend reinvestment. |
| (wa) | PGIM Investments LLC, the manager of the Fund, also serves as manager of the PGIM Core Ultra Short Bond Fund and PGIM Institutional Money Market Fund, if applicable. |
| 6. | Distributions and Tax Information |
Distributions to shareholders, which are determined in accordance with federal income tax regulations and which may differ from GAAP, are recorded on the ex-date.
For the year ended October 31, 2022, the tax character of dividends paid by the Fund were $554,682 of ordinary income and $1,484,738 of tax return of capital. For the year ended October 31, 2021, the tax character of dividends paid by the Fund was $3,093,508 of ordinary income.
PGIM Emerging Markets Debt Local Currency Fund 63
Notes to Financial Statements (continued)
As of October 31, 2022, there were no accumulated undistributed earnings on a tax basis.
The United States federal income tax basis of the Fund’s investments and the net unrealized depreciation as of October 31, 2022 were as follows:
| | | | | | |
| Tax Basis | | Gross
Unrealized
Appreciation | | Gross
Unrealized
Depreciation | | Net
Unrealized
Depreciation |
| $33,189,482 | | $2,097,588 | | $(9,867,724) | | $(7,770,136) |
The difference between GAAP and tax basis is primarily attributable to the deferred losses on wash sales, bond premium amortization, mark-to-market of forwards contracts, straddle loss deferrals and other GAAP to tax differences.
For federal income tax purposes, the Fund had a capital loss carryforward as of October 31, 2022 of approximately $11,304,000 which can be carried forward for an unlimited period. No capital gains distributions are expected to be paid to shareholders until net gains have been realized in excess of such losses.
The Manager has analyzed the Fund’s tax positions taken on federal, state and local income tax returns for all open tax years and has concluded that no provision for income tax is required in the Fund’s financial statements for the current reporting period. Since tax authorities can examine previously filed tax returns, the Fund’s U.S. federal and state tax returns for each of the four fiscal years up to the most recent fiscal year ended October 31, 2022 are subject to such review.
The Fund offers Class A, Class C, Class Z and Class R6 shares. Class A shares are sold with a maximum front-end sales charge of 3.25%. Investors who purchase $500,000 or more of Class A shares and sell those shares within 12 months of purchase are subject to a CDSC of 1% on sales although these purchases are not subject to a front-end sales charge. The Class A CDSC is waived for certain retirement and/or benefit plans. A special exchange privilege is also available for shareholders who qualified to purchase Class A shares at net asset value. Class C shares are sold with a CDSC of 1% on sales made within 12 months of purchase. Class C shares will automatically convert to Class A shares on a monthly basis approximately eight years (ten years prior to January 22, 2021) after purchase. Class Z and Class R6 shares are not subject to any sales or redemption charges and are available exclusively for sale to a limited group of investors.
64
Under certain circumstances, an exchange may be made from specified share classes of the Fund to one or more other share classes of the Fund as presented in the table of transactions in shares of common stock, below.
The RIC is authorized to issue 10,225,000,000 shares of common stock, $0.00001 par value per share, 550,000,000 of which are designated as shares of the Fund. The authorized shares of the Fund are currently classified and designated as follows:
| | | | |
| Class | | | Number of Shares | |
| A | | | 10,000,000 | |
| C | | | 50,000,000 | |
| Z | | | 250,000,000 | |
| T | | | 190,000,000 | |
| R6 | | | 50,000,000 | |
The Fund currently does not have any Class T shares outstanding.
As of October 31, 2022, Prudential, through its affiliated entities, including affiliated funds (if applicable), owned shares of the Fund as follows:
| | | | | | | | |
| Class | | | Number of Shares | | | | Percentage of Outstanding Shares | |
| Z | | | 3,811,817 | | | | 70.7% | |
| R6 | | | 198 | | | | 0.1 | |
At the reporting period end, the number of shareholders holding greater than 5% of the Fund are as follows:
| | | | | | | | |
| | | | Number of Shareholders | | | | Percentage of Outstanding Shares | |
| Affiliated | | | 1 | | | | 61.2% | |
| Unaffiliated | | | 2 | | | | 29.8 | |
Transactions in shares of common stock were as follows:
| | | | | | | | |
| | | |
| Share Class | | | Shares | | | | Amount | |
| | |
Class A | | | | | | | | |
Year ended October 31, 2022: | | | | | | | | |
| Shares sold | | | 66,195 | | | $ | 341,565 | |
| Shares issued in reinvestment of dividends and distributions | | | 24,360 | | | | 117,212 | |
| Shares purchased | | | (236,571 | ) | | | (1,172,120 | ) |
| Net increase (decrease) in shares outstanding before conversion | | | (146,016 | ) | | | (713,343 | ) |
| Shares issued upon conversion from other share class(es) | | | 9,979 | | | | 46,343 | |
| Shares purchased upon conversion into other share class(es) | | | (651 | ) | | | (3,466) | |
| Net increase (decrease) in shares outstanding | | | (136,688 | ) | | $ | (670,466 | ) |
PGIM Emerging Markets Debt Local Currency Fund 65
Notes to Financial Statements (continued)
| | | | | | | | |
| | | |
| Share Class | | | Shares | | | | Amount | |
| | |
Year ended October 31, 2021: | | | | | | | | |
| Shares sold | | | 78,649 | | | $ | 458,123 | |
| Shares issued in reinvestment of dividends and distributions | | | 29,019 | | | | 167,971 | |
| Shares purchased | | | (181,591 | ) | | | (1,055,699) | |
| Net increase (decrease) in shares outstanding before conversion | | | (73,923 | ) | | | (429,605 | ) |
| Shares issued upon conversion from other share class(es) | | | 25,573 | | | | 154,504 | |
| Shares purchased upon conversion into other share class(es) | | | (3,161 | ) | | | (18,144) | |
| Net increase (decrease) in shares outstanding | | | (51,511 | ) | | $ | (293,245 | ) |
| | |
Class C | | | | | | | | |
Year ended October 31, 2022: | | | | | | | | |
| Shares sold | | | 9,916 | | | $ | 46,594 | |
| Shares issued in reinvestment of dividends and distributions | | | 1,029 | | | | 4,995 | |
| Shares purchased | | | (6,394 | ) | | | (32,776) | |
| Net increase (decrease) in shares outstanding before conversion | | | 4,551 | | | | 18,813 | |
| Shares purchased upon conversion into other share class(es) | | | (9,912 | ) | | | (46,343) | |
| Net increase (decrease) in shares outstanding | | | (5,361 | ) | | $ | (27,530 | ) |
| | |
Year ended October 31, 2021: | | | | | | | | |
| Shares sold | | | 3,485 | | | $ | 20,671 | |
| Shares issued in reinvestment of dividends and distributions | | | 2,022 | | | | 11,886 | |
| Shares purchased | | | (28,402 | ) | | | (163,996) | |
| Net increase (decrease) in shares outstanding before conversion | | | (22,895 | ) | | | (131,439 | ) |
| Shares purchased upon conversion into other share class(es) | | | (25,403 | ) | | | (154,504) | |
| Net increase (decrease) in shares outstanding | | | (48,298 | ) | | $ | (285,943 | ) |
| | |
Class Z | | | | | | | | |
Year ended October 31, 2022: | | | | | | | | |
| Shares sold | | | 2,502,871 | | | $ | 13,016,107 | |
| Shares issued in reinvestment of dividends and distributions | | | 372,746 | | | | 1,822,678 | |
| Shares purchased | | | (6,406,152 | ) | | | (30,692,749) | |
| Net increase (decrease) in shares outstanding before conversion | | | (3,530,535 | ) | | | (15,853,964 | ) |
| Shares issued upon conversion from other share class(es) | | | 645 | | | | 3,466 | |
| Net increase (decrease) in shares outstanding | | | (3,529,890 | ) | | $ | (15,850,498 | ) |
66
| | | | | | | | |
| | | |
| Share Class | | | Shares | | | | Amount | |
| | |
Year ended October 31, 2021: | | | | | | | | |
| Shares sold | | | 2,987,759 | | | $ | 17,715,817 | |
| Shares issued in reinvestment of dividends and distributions | | | 483,358 | | | | 2,827,410 | |
| Shares purchased | | | (4,096,951 | ) | | | (23,917,712) | |
| Net increase (decrease) in shares outstanding before conversion | | | (625,834 | ) | | | (3,374,485 | ) |
| Shares issued upon conversion from other share class(es) | | | 3,128 | | | | 18,144 | |
| Shares purchased upon conversion into other share class(es) | | | (661,948 | ) | | | (3,892,254) | |
| Net increase (decrease) in shares outstanding | | | (1,284,654 | ) | | $ | (7,248,595 | ) |
| | |
Class R6 | | | | | | | | |
Year ended October 31, 2022: | | | | | | | | |
| Shares sold | | | 72,252 | | | $ | 354,001 | |
| Shares issued in reinvestment of dividends and distributions | | | 19,125 | | | | 93,934 | |
| Shares purchased | | | (366,479 | ) | | | (1,854,730) | |
| Net increase (decrease) in shares outstanding | | | (275,102 | ) | | $ | (1,406,795 | ) |
| | |
Year ended October 31, 2021: | | | | | | | | |
| Shares sold | | | 68,180 | | | $ | 395,330 | |
| Shares issued in reinvestment of dividends and distributions | | | 13,589 | | | | 77,566 | |
| Shares purchased | | | (164,802 | ) | | | (945,773) | |
| Net increase (decrease) in shares outstanding before conversion | | | (83,033 | ) | | | (472,877 | ) |
| Shares issued upon conversion from other share class(es) | | | 663,076 | | | | 3,892,254 | |
| Net increase (decrease) in shares outstanding | | | 580,043 | | | $ | 3,419,377 | |
The RIC, on behalf of the Fund, along with other affiliated registered investment companies (the “Participating Funds”), is a party to a Syndicated Credit Agreement (“SCA”) with a group of banks. The purpose of the SCA is to provide an alternative source of temporary funding for capital share redemptions. The table below provides details of the current SCA in effect at the reporting period-end as well as the prior SCA.
| | | | |
| | | Current SCA | | Prior SCA |
Term of Commitment | | 9/30/2022 - 9/28/2023 | | 10/1/2021 – 9/29/2022 |
Total Commitment | | $ 1,200,000,000 | | $ 1,200,000,000 |
Annualized Commitment Fee on the Unused Portion of the SCA | | 0.15% | | 0.15% |
Annualized Interest Rate on Borrowings | | 1.00% plus the higher of (1)
the effective federal funds
rate, (2) the daily SOFR
rate plus 0.10% or (3) zero
percent | | 1.20% plus the higher of (1)
the effective federal funds
rate, (2) the one-month
LIBOR rate or (3) zero
percent |
Certain affiliated registered investment companies that are parties to the SCA include portfolios that are subject to a predetermined mathematical formula used to manage certain benefit guarantees offered under variable annuity contracts. The formula may result in large scale asset flows into and out of these portfolios. Consequently, these portfolios may be more
PGIM Emerging Markets Debt Local Currency Fund 67
Notes to Financial Statements (continued)
likely to utilize the SCA for purposes of funding redemptions. It may be possible for those portfolios to fully exhaust the committed amount of the SCA, thereby requiring the Manager to allocate available funding per a Board-approved methodology designed to treat the Participating Funds in the SCA equitably.
The Fund utilized the SCA during the year ended October 31, 2022. The average daily balance for the 16 days that the Fund had loans outstanding during the period was approximately $2,329,750, borrowed at a weighted average interest rate of 2.74%. The maximum loan outstanding amount during the period was $5,500,000. At October 31, 2022, the Fund did not have an outstanding loan amount.
| 9. | Risks of Investing in the Fund |
The Fund’s risks include, but are not limited to, some or all of the risks discussed below. For further information on the Fund’s risks, please refer to the Fund’s Prospectus and Statement of Additional Information.
Credit Risk: Credit risk relates to the ability of the issuer of a fixed income instrument or the counterparty to a financial transaction with the Fund to meet interest and principal payments as they come due or to fulfill its obligations to the Fund. The value of the fixed income instruments held by the Fund will be adversely affected by any erosion in the ability of the relevant issuers to make interest and principal payments as they become due. The ratings given to a debt security by certain ratings agencies provide a generally useful guide as to such credit risk. The lower the rating of a debt security held by the Fund, the greater the degree of credit risk that is perceived to exist by the rating agency with respect to that security. Increasing the amount of Fund assets invested in lower-rated securities generally will increase the Fund’s income, but also will increase the credit risk to which the Fund is subject. The Fund generally enters into financial transactions with major dealers that are deemed acceptable to the subadviser from a credit perspective.
Currency Risk: The Fund’s assets may be invested in securities that are denominated in non-US currencies or directly in currencies. Such investments are subject to the risk that the value of a particular currency will change in relation to the US dollar or other currencies. The weakening of a country’s currency relative to the US dollar will negatively affect the dollar value of the Fund’s assets. Among the factors that may affect currency values are trade balances, levels of short term interest rates, differences in relative values of similar assets in different currencies, long term opportunities for investment and capital appreciation, central bank policy, and political developments. The Fund may attempt to hedge such risks by selling or buying currencies in the forward market; selling or buying currency futures contracts, options or other securities thereon; borrowing funds denominated in particular currencies; or any combination thereof, depending on the
68
availability of liquidity in the hedging instruments and their relative costs. There can be no assurance that such strategies will be implemented or, if implemented, will be effective. The Fund would incur additional costs from hedging.
Debt Obligations Risk: Debt obligations are subject to credit risk, market risk and interest rate risk. The Fund’s holdings, share price, yield and total return may also fluctuate in response to bond market movements. The value of bonds may decline for issuer-related reasons, including management performance, financial leverage and reduced demand for the issuer’s goods and services. Certain types of fixed income obligations also may be subject to “call and redemption risk,” which is the risk that the issuer may call a bond held by the Fund for redemption before it matures and the Fund may not be able to reinvest at the same rate of interest and therefore would earn less income.
Derivatives Risk: Derivatives involve special risks and costs and may result in losses to the Fund. The successful use of derivatives requires sophisticated management, and, to the extent that derivatives are used, the Fund will depend on the subadviser’s ability to analyze and manage derivatives transactions. The prices of derivatives may move in unexpected ways, especially in abnormal market conditions. Some derivatives are “leveraged” or may create economic leverage for the Fund. and therefore may magnify or otherwise increase investment losses to the Fund. The Fund’s use of derivatives may also increase the amount of taxes payable by shareholders.
Other risks arise from the potential inability to terminate or sell derivatives positions. A liquid secondary market may not always exist for the Fund’s derivatives positions. In fact, many over-the-counter derivative instruments will not have liquidity beyond the counterparty to the instrument. Over-the-counter derivative instruments also involve the risk that the other party will not meet its obligations to the Fund. The use of derivatives also exposes the Fund to operational issues, such as documentation and settlement issues, systems failures, inadequate control and human error.
Derivatives may also involve legal risks, such as insufficient documentation, the lack of capacity or authority of a counterparty to execute or settle a transaction, and the legality and enforceability of derivatives contracts. The U.S. Government and foreign governments have adopted (and may adopt further) regulations governing derivatives markets, including mandatory clearing of certain derivatives, margin and reporting requirements and risk exposure limitations. Regulation of derivatives may make derivatives more costly, limit their availability or utility to the Fund, or otherwise adversely affect their performance or disrupt markets.
Economic and Market Events Risk: Events in the U.S. and global financial markets, including actions taken by the U.S. Federal Reserve or foreign central banks to stimulate or stabilize economic growth or the functioning of the securities markets, or otherwise reduce inflation may at times result in unusually high market volatility, which could negatively impact performance. Governmental efforts to curb inflation often have negative effects on
PGIM Emerging Markets Debt Local Currency Fund 69
Notes to Financial Statements (continued)
the level of economic activity. Relatively reduced liquidity in credit and fixed income markets could adversely affect issuers worldwide.
Emerging Markets Risk: The risks of foreign investments are greater for investments in or exposed to emerging markets. Emerging market countries typically have economic and political systems that are less fully developed, and can be expected to be less stable, than those of more developed countries. For example, the economies of such countries can be subject to rapid and unpredictable rates of inflation or deflation. Low trading volumes may result in a lack of liquidity and price volatility. Emerging market countries may have policies that restrict investment by non-U.S. investors, or that prevent non-U.S. investors from withdrawing their money at will.
The Fund may invest in some emerging markets that subject it to risks such as those associated with illiquidity, custody of assets, different settlement and clearance procedures and asserting legal title under a developing legal and regulatory regime to a greater degree than in developed markets or even in other emerging markets.
Foreign Securities Risk: Investments in securities of non-U.S. issuers (including those denominated in U.S. dollars) may involve more risk than investing in securities of U.S. issuers. Foreign political, economic and legal systems, especially those in developing and emerging market countries, may be less stable and more volatile than in the United States. Foreign legal systems generally have fewer regulatory requirements than the U.S. legal system, particularly those of emerging markets. In general, less information is publicly available with respect to non-U.S. companies than U.S. companies. Non-U.S. companies generally are not subject to the same accounting, auditing, and financial reporting standards as are U.S. companies. Additionally, the changing value of foreign currencies and changes in exchange rates could also affect the value of the assets the Fund holds and the Fund’s performance. Certain foreign countries may impose restrictions on the ability of issuers of foreign securities to make payment of principal and interest or dividends to investors located outside the country, due to blockage of foreign currency exchanges or otherwise. Investments in emerging markets are subject to greater volatility and price declines.
In addition, the Fund’s investments in non-U.S. securities may be subject to the risks of nationalization or expropriation of assets, imposition of currency exchange controls or restrictions on the repatriation of non-U.S. currency, confiscatory taxation and adverse diplomatic developments. Special U.S. tax considerations may apply.
Geographic Concentration Risk: The Fund’s performance may be closely tied to the market, economic, political, regulatory or other conditions in the countries or regions in which the Fund invests. This can result in more pronounced risks based upon conditions that impact one or more countries or regions more or less than other countries or regions.
70
Increase in Expenses Risk: Your actual cost of investing in the Fund may be higher than the expenses shown in the expense table in the Fund’s prospectus for a variety of reasons. For example, expense ratios may be higher than those shown if average net assets decrease. Net assets are more likely to decrease and Fund expense ratios are more likely to increase when markets are volatile. Active and frequent trading of Fund securities can increase expenses.
Interest Rate Risk: The value of your investment may go down when interest rates rise. A rise in rates tends to have a greater impact on the prices of longer term or duration debt securities. Similarly, a rise in interest rates may also have a greater negative impact on the value of equity securities whose issuers expect earnings further out in the future. For example, a fixed income security with a duration of three years is expected to decrease in value by approximately 3% if interest rates increase by 1%. This is referred to as “duration risk.” When interest rates fall, the issuers of debt obligations may prepay principal more quickly than expected, and the Fund may be required to reinvest the proceeds at a lower interest rate. This is referred to as “prepayment risk.” When interest rates rise, debt obligations may be repaid more slowly than expected, and the value of the Fund’s holdings may fall sharply. This is referred to as “extension risk.” The Fund may lose money if short-term or long-term interest rates rise sharply or in a manner not anticipated by the subadviser.
Junk Bonds Risk: High-yield, high-risk bonds have predominantly speculative characteristics, including particularly high credit risk. Junk bonds tend to have lower market liquidity than higher-rated securities. The liquidity of particular issuers or industries within a particular investment category may shrink or disappear suddenly and without warning. The non-investment grade bond market can experience sudden and sharp price swings and become illiquid due to a variety of factors, including changes in economic forecasts, stock market activity, large sustained sales by major investors, a high profile default or a change in the market’s psychology.
Large Shareholder and Large Scale Redemption Risk: Certain individuals, accounts, funds (including funds affiliated with the Manager) or institutions, including the Manager and its affiliates, may from time to time own or control a substantial amount of the Fund’s shares. There is no requirement that these entities maintain their investment in the Fund. There is a risk that such large shareholders or that the Fund’s shareholders generally may redeem all or a substantial portion of their investments in the Fund in a short period of time, which could have a significant negative impact on the Fund’s NAV, liquidity, and brokerage costs. Large redemptions could also result in tax consequences to shareholders and impact the Fund’s ability to implement its investment strategy. The Fund’s ability to pursue its investment objective after one or more large scale redemptions may be impaired and, as a result, the Fund may invest a larger portion of its assets in cash or cash equivalents.
Liquidity Risk: Liquidity risk is the risk that the Fund could not meet requests to redeem shares issued by the Fund without significant dilution of remaining investors’ interests in the Fund. The Fund may invest in instruments that trade in lower volumes and are more illiquid
PGIM Emerging Markets Debt Local Currency Fund 71
Notes to Financial Statements (continued)
than other investments. If the Fund is forced to sell these investments to pay redemption proceeds or for other reasons, the Fund may lose money. In addition, when there is no willing buyer and investments cannot be readily sold at the desired time or price, the Fund may have to accept a lower price or may not be able to sell the instrument at all. An inability to sell a portfolio position can adversely affect the Fund’s value or prevent the Fund from being able to take advantage of other investment opportunities.
Management Risk: Actively managed funds are subject to management risk. The subadviser will apply investment techniques and risk analyses in making investment decisions for the Fund, but the subadviser’s judgments about the attractiveness, value or market trends affecting a particular security, industry or sector or about market movements may be incorrect. Additionally, the investments selected for the Fund may underperform the markets in general, the Fund’s benchmark and other funds with similar investment objectives.
Market Disruption and Geopolitical Risks: Market disruption can be caused by economic, financial or political events and factors, including but not limited to, international wars or conflicts (including Russia’s military invasion of Ukraine), geopolitical developments (including trading and tariff arrangements, sanctions and cybersecurity attacks), instability in regions such as Asia, Eastern Europe and the Middle East, terrorism, natural disasters and public health epidemics (including the outbreak of COVID-19 globally).
The extent and duration of such events and resulting market disruptions cannot be predicted, but could be substantial and could magnify the impact of other risks to the Fund. These and other similar events could adversely affect the U.S. and foreign financial markets and lead to increased market volatility, reduced liquidity in the securities markets, significant negative impacts on issuers and the markets for certain securities and commodities and/or government intervention. They may also cause short- or long-term economic uncertainties in the United States and worldwide. As a result, whether or not the Fund invests in securities of issuers located in or with significant exposure to the countries directly affected, the value and liquidity of the Fund’s investments may be negatively impacted. Further, due to closures of certain markets and restrictions on trading certain securities, the value of certain securities held by the Fund could be significantly impacted, which could lead to such securities being valued at zero.
COVID-19 and the related governmental and public responses have had and may continue to have an impact on the Fund’s investments and net asset value and have led and may continue to lead to increased market volatility and the potential for illiquidity in certain classes of securities and sectors of the market. They have also had and may continue to result in periods of business disruption, business closures, inability to obtain raw materials, supplies and component parts, and reduced or disrupted operations for the issuers in which
72
the Fund invests. The occurrence, reoccurrence and pendency of public health epidemics could adversely affect the economies and financial markets either in specific countries or worldwide.
Market Risk: Securities markets may be volatile and the market prices of the Fund’s securities may decline. Securities fluctuate in price based on changes in an issuer’s financial condition and overall market and economic conditions. If the market prices of the securities owned by the Fund fall, the value of your investment in the Fund will decline.
Non-Diversified Investment Company Risk: The Fund is non-diversified for purposes of the 1940 Act. This means that the Fund may invest a greater percentage of its assets in the securities of a single company or other issuer than a diversified fund. Investing in a non-diversified fund involves greater risk than investing in a diversified fund because a loss resulting from the decline in value of any one security may represent a greater portion of the total assets of a non-diversified fund.
| 10. | Recent Accounting Pronouncement and Regulatory Developments |
In March 2020, the FASB issued Accounting Standard Update (“ASU”) No. 2020-04, which provides optional guidance for applying GAAP to contract modifications, hedging relationships and other transactions affected by the reference rate reform if certain criteria are met. ASU 2020-04 is elective and is effective on March 12, 2020 through December 31, 2022. Management does not expect ASU 2020-04 to have a material impact on the financial statements.
PGIM Emerging Markets Debt Local Currency Fund 73
Report of Independent Registered Public Accounting Firm
To the Board of Directors of Prudential World Fund, Inc. and Shareholders of PGIM Emerging Markets Debt Local Currency Fund
Opinion on the Financial Statements
We have audited the accompanying statement of assets and liabilities, including the schedule of investments, of PGIM Emerging Markets Debt Local Currency Fund (one of the funds constituting Prudential World Fund, Inc., referred to hereafter as the “Fund”) as of October 31, 2022, the related statement of operations for the year ended October 31, 2022, the statements of changes in net assets for each of the two years in the period ended October 31, 2022, including the related notes, and the financial highlights for each of the three years in the period ended October 31, 2022 (collectively referred to as the “financial statements”). In our opinion, the financial statements present fairly, in all material respects, the financial position of the Fund as of October 31, 2022, the results of its operations for the year then ended, the changes in its net assets for each of the two years in the period ended October 31 2022 and the financial highlights for each of the three years in the period ended October 31, 2022 in conformity with accounting principles generally accepted in the United States of America.
The financial statements of the Fund as of and for the year ended October 31, 2019 and the financial highlights for each of the periods ended on or prior to October 31, 2019 (not presented herein, other than the financial highlights) were audited by other auditors whose report dated December 19, 2019 expressed an unqualified opinion on those financial statements and financial highlights.
Basis for Opinion
These financial statements are the responsibility of the Fund’s management. Our responsibility is to express an opinion on the Fund’s financial statements based on our audits. We are a public accounting firm registered with the Public Company Accounting Oversight Board (United States) (PCAOB) and are required to be independent with respect to the Fund in accordance with the U.S. federal securities laws and the applicable rules and regulations of the Securities and Exchange Commission and the PCAOB.
We conducted our audits of these financial statements in accordance with the standards of the PCAOB. Those standards require that we plan and perform the audit to obtain reasonable assurance about whether the financial statements are free of material misstatement, whether due to error or fraud.
Our audits included performing procedures to assess the risks of material misstatement of the financial statements, whether due to error or fraud, and performing procedures that respond to those risks. Such procedures included examining, on a test basis, evidence regarding the amounts and disclosures in the financial statements. Our audits also included evaluating the accounting principles used and significant estimates made by management, as well as evaluating the overall presentation of the financial statements. Our procedures included confirmation of securities owned as of October 31, 2022 by correspondence with the custodian, transfer agent and brokers; when replies were not received from brokers, we performed other auditing procedures. We believe that our audits provide a reasonable basis for our opinion.
/s/PricewaterhouseCoopers LLP
New York, New York
December 16, 2022
We have served as the auditor of one or more investment companies in the PGIM Retail Funds complex since 2020.
74
Tax Information (unaudited)
For the year ended October 31, 2022, the Fund reports the maximum amount allowable but not less than 22.68% as interest-related dividends in accordance with Sections 871(k)(1) and 881(e)(1) of the Internal Revenue Code.
In January 2023, you will be advised on IRS Form 1099-DIV or substitute 1099-DIV as to the federal tax status of the dividends and distributions received by you in calendar year 2022. call your financial adviser.
PGIM Emerging Markets Debt Local Currency Fund 75
INFORMATION ABOUT BOARD MEMBERS AND OFFICERS (unaudited)
Information about Board Members and Officers of the Fund is set forth below. Board Members who are not deemed to be “interested persons” of the Fund, as defined in the 1940 Act, are referred to as “Independent Board Members.” Board Members who are deemed to be “interested persons” of the Fund are referred to as “Interested Board Members.” The Board Members are responsible for the overall supervision of the operations of the Fund and perform the various duties imposed on the directors of investment companies by the 1940 Act. The Board in turn elects the Officers, who are responsible for administering the day-to-day operations of the Fund.
| | | | | | |
Independent Board Members |
| | | | |
Name Year of Birth Position(s) Portfolios Overseen | | Principal Occupation(s) During Past Five Years | | Other Directorships Held During Past Five Years | | Length of Board Service |
| | | | |
Ellen S. Alberding 1958 Board Member Portfolios Overseen: 97 | | President and Board Member, The Joyce Foundation (charitable foundation) (since 2002); formerly Vice Chair, City Colleges of Chicago (community college system) (2011-2015); Trustee, National Park Foundation (charitable foundation for national park system) (2009-2018); Trustee, Economic Club of Chicago (2009-2016); Trustee, Loyola University (since 2018). | | None. | | Since September 2013 |
| | | | |
Kevin J. Bannon 1952 Board Member Portfolios Overseen: 97 | | Retired; formerly Managing Director (April 2008-May 2015) and Chief Investment Officer (October 2008-November 2013) of Highmount Capital LLC (registered investment adviser); formerly Executive Vice President and Chief Investment Officer (April 1993-August 2007) of Bank of New York Company; President (May 2003-May 2007) of BNY Hamilton Family of Mutual Funds. | | Director of Urstadt Biddle Properties (equity real estate investment trust) (since September 2008). | | Since July 2008 |
PGIM Emerging Markets Debt Local Currency Fund
| | | | | | |
Independent Board Members |
| | | | |
Name Year of Birth Position(s) Portfolios Overseen | | Principal Occupation(s) During Past Five Years | | Other Directorships Held During Past Five Years | | Length of Board Service |
| | | | |
Linda W. Bynoe 1952 Board Member Portfolios Overseen: 94 | | President and Chief Executive Officer (since March 1995) and formerly Chief Operating Officer (December 1989-February 1995) of Telemat Limited LLC (formerly Telemat Ltd) (management consulting); formerly Vice President (January 1985-June 1989) at Morgan Stanley & Co. (broker-dealer). | | Trustee of Equity Residential (residential real estate) (since December 2009); Director of Northern Trust Corporation (financial services) (since April 2006); formerly Director of Anixter International, Inc. (communication products distributor) (January 2006-June 2020). | | Since March 2005 |
| | | | |
Barry H. Evans 1960 Board Member Portfolios Overseen: 96 | | Retired; formerly President (2005-2016), Global Chief Operating Officer (2014-2016), Chief Investment Officer - Global Head of Fixed Income (1998-2014), and various portfolio manager roles (1986-2006), Manulife Asset Management (asset management). | | Formerly Director, Manulife Trust Company (2011-2018); formerly Director, Manulife Asset Management Limited (2015-2017); formerly Chairman of the Board of Directors of Manulife Asset Management U.S. (2005-2016); formerly Chairman of the Board, Declaration Investment Management and Research (2008-2016). | | Since September 2017 |
| | | | |
Keith F. Hartstein 1956 Board Member & Independent Chair Portfolios Overseen: 97 | | Retired; Member (November 2014-September 2022) of the Governing Council of the Independent Directors Council (IDC) (organization of independent mutual fund directors); formerly Executive Committee of the IDC Board of Governors (October 2019-December 2021); formerly President and Chief Executive Officer (2005-2012), Senior Vice President (2004-2005), Senior Vice President of Sales and Marketing (1997-2004), and various executive management positions (1990-1997), John Hancock Funds, LLC (asset management); Chairman, Investment Company Institute’s Sales Force Marketing Committee (2003-2008). | | None. | | Since September 2013 |
Visit our website at pgim.com/investments
| | | | | | |
Independent Board Members |
| | | | |
Name Year of Birth Position(s) Portfolios Overseen | | Principal Occupation(s) During Past Five Years | | Other Directorships Held During Past Five Years | | Length of Board Service |
| | | | |
Laurie Simon Hodrick 1962 Board Member Portfolios Overseen: 93 | | A. Barton Hepburn Professor Emerita of Economics in the Faculty of Business, Columbia Business School (since 2018); Visiting Fellow at the Hoover Institution, Stanford University (since 2015); Sole Member, ReidCourt LLC (since 2008) (a consulting firm); formerly Visiting Professor of Law, Stanford Law School (2015-2021); formerly A. Barton Hepburn Professor of Economics in the Faculty of Business, Columbia Business School (1996-2017); formerly Managing Director, Global Head of Alternative Investment Strategies, Deutsche Bank (2006-2008). | | Independent Director, Andela (since January 2022) (global talent network); Independent Director, Roku (since December 2020) (communication services); formerly Independent Director, Synnex Corporation (2019-2021) (information technology); formerly Independent Director, Kabbage, Inc. (2018-2020) (financial services); formerly Independent Director, Corporate Capital Trust (2017-2018) (a business development company). | | Since September 2017 |
| | | | |
Brian K. Reid 1961 Board Member Portfolios Overseen: 96 | | Retired; formerly Chief Economist for the Investment Company Institute (ICI) (2005-2017); formerly Senior Economist and Director of Industry and Financial Analysis at the ICI (1998-2004); formerly Senior Economist, Industry and Financial Analysis at the ICI (1996-1998); formerly Staff Economist at the Federal Reserve Board (1989-1996); Director, ICI Mutual Insurance Company (2012-2017). | | None. | | Since March 2018 |
PGIM Emerging Markets Debt Local Currency Fund
| | | | | | |
Independent Board Members |
| | | | |
Name Year of Birth Position(s) Portfolios Overseen | | Principal Occupation(s) During Past Five Years | | Other Directorships Held During Past Five Years | | Length of Board Service |
| | | | |
Grace C. Torres 1959 Board Member Portfolios Overseen: 96 | | Retired; formerly Treasurer and Principal Financial and Accounting Officer of the PGIM Funds, Target Funds, Advanced Series Trust, Prudential Variable Contract Accounts and The Prudential Series Fund (1998-June 2014); Assistant Treasurer (March 1999-June 2014) and Senior Vice President (September 1999-June 2014) of PGIM Investments LLC; Assistant Treasurer (May 2003-June 2014) and Vice President (June 2005-June 2014) of AST Investment Services, Inc.; Senior Vice President and Assistant Treasurer (May 2003-June 2014) of Prudential Annuities Advisory Services, Inc. | | Director (since January 2018) of OceanFirst Financial Corp. and OceanFirst Bank; formerly Director (July 2015-January 2018) of Sun Bancorp, Inc. N.A. and Sun National Bank. | | Since November 2014 |
Visit our website at pgim.com/investments
| | | | | | |
Interested Board Members |
| | | | |
Name Year of Birth Position(s) Portfolios Overseen | | Principal Occupation(s) During Past Five Years | | Other Directorships Held During Past Five Years | | Length of Board Service |
| | | | |
Stuart S. Parker 1962 Board Member & President Portfolios Overseen: 96 | | President, Chief Executive Officer, Chief Operating Officer and Officer in Charge of PGIM Investments LLC (formerly known as Prudential Investments LLC) (since January 2012); President and Principal Executive Officer (“PEO”) (since September 2022) of the PGIM Private Credit Fund; President and PEO (since March 2022) of the PGIM Private Real Estate Fund, Inc.; formerly Executive Vice President of Jennison Associates LLC and Head of Retail Distribution of PGIM Investments LLC (June 2005-December 2011); Investment Company Institute - Board of Governors (since May 2012). | | None. | | Since January 2012 |
| | | | |
Scott E. Benjamin 1973 Board Member & Vice President Portfolios Overseen: 97 | | Executive Vice President (since May 2009) of PGIM Investments LLC; Vice President (since June 2012) of Prudential Investment Management Services LLC; Executive Vice President (since September 2009) of AST Investment Services, Inc.; Senior Vice President of Product Development and Marketing, PGIM Investments (since February 2006); Vice President (since September 2022) of the PGIM Private Credit Fund; Vice President (since March 2022) of the PGIM Private Real Estate Fund, Inc.; formerly Vice President of Product Development and Product Management, PGIM Investments LLC (2003-2006). | | None. | | Since March 2010 |
PGIM Emerging Markets Debt Local Currency Fund
| | | | |
Fund Officers(a) | | | | |
| | | |
Name Year of Birth Fund Position | | Principal Occupation(s) During Past Five Years | | Length of Service as Fund Officer |
| | | |
Claudia DiGiacomo 1974 Chief Legal Officer | | Chief Legal Officer (since September 2022) of the PGIM Private Credit Fund; Chief Legal Officer (since July 2022) of the PGIM Private Real Estate Fund, Inc.; Chief Legal Officer, Executive Vice President and Secretary of PGIM Investments LLC (since August 2020); Chief Legal Officer of Prudential Mutual Fund Services LLC (since August 2020); Chief Legal Officer of PIFM Holdco, LLC (since August 2020); Vice President and Corporate Counsel (since January 2005) of Prudential; and Corporate Counsel of AST Investment Services, Inc. (since August 2020); formerly Vice President and Assistant Secretary of PGIM Investments LLC (2005-2020); formerly Associate at Sidley Austin Brown & Wood LLP (1999-2004). | | Since December 2005 |
| | | |
Isabelle Sajous 1976 Chief Compliance Officer | | Chief Compliance Officer (since April 2022) of PGIM Investments LLC, the PGIM Funds, Target Funds, PGIM ETF Trust, PGIM Global High Yield Fund, Inc., PGIM High Yield Bond Fund, Inc., PGIM Short Duration High Yield Opportunities Fund, Advanced Series Trust, The Prudential Series Fund and Prudential’s Gibraltar Fund, Inc.; Chief Compliance Officer (since September 2022) of the PGIM Private Credit Fund; Chief Compliance Officer (since March 2022) of the PGIM Private Real Estate Fund, Inc.; Vice President, Compliance of PGIM Investments LLC (since December 2020); formerly Director, Compliance (July 2018-December 2020) of Credit Suisse Asset Management LLC; and Vice President, Associate General Counsel & Deputy Chief Compliance Officer of Cramer Rosenthal McGlynn, LLC (August 2014-July 2018). | | Since April 2022 |
| | | |
Andrew R. French 1962 Secretary | | Vice President (since December 2018) of PGIM Investments LLC; Secretary (since September 2022) of the PGIM Private Credit Fund; Secretary (since March 2022) of the PGIM Private Real Estate Fund, Inc.; formerly Vice President and Corporate Counsel (2010-2018) of Prudential; formerly Director and Corporate Counsel (2006-2010) of Prudential; Vice President and Assistant Secretary (since January 2007) of PGIM Investments LLC; Vice President and Assistant Secretary (since January 2007) of Prudential Mutual Fund Services LLC. | | Since October 2006 |
| | | |
Melissa Gonzalez 1980 Assistant Secretary | | Vice President and Corporate Counsel (since September 2018) of Prudential; Vice President and Assistant Secretary (since August 2020) of PGIM Investments LLC; Assistant Secretary (since September 2022) of the PGIM Private Credit Fund; Assistant Secretary (since March 2022) of the PGIM Private Real Estate Fund, Inc.; formerly Director and Corporate Counsel (March 2014-September 2018) of Prudential. | | Since March 2020 |
Visit our website at pgim.com/investments
| | | | |
Fund Officers(a) | | | | |
| | | |
Name Year of Birth Fund Position | | Principal Occupation(s) During Past Five Years | | Length of Service as Fund Officer |
| | | |
Patrick E. McGuinness 1986 Assistant Secretary | | Vice President and Assistant Secretary (since August 2020) of PGIM Investments LLC; Director and Corporate Counsel (since February 2017) of Prudential; Assistant Secretary (since September 2022) of the PGIM Private Credit Fund; Assistant Secretary (since March 2022) of the PGIM Private Real Estate Fund, Inc. | | Since June 2020 |
| | | |
Debra Rubano 1975 Assistant Secretary | | Vice President and Corporate Counsel (since November 2020) of Prudential; Assistant Secretary (since September 2022) of the PGIM Private Credit Fund; Assistant Secretary (since March 2022) of the PGIM Private Real Estate Fund, Inc; formerly Director and Senior Counsel of Allianz Global Investors U.S. Holdings LLC (2010-2020) and Assistant Secretary of numerous funds in the Allianz fund complex (2015-2020). | | Since December 2020 |
| | | |
Kelly A. Coyne 1968 Assistant Secretary | | Director, Investment Operations of Prudential Mutual Fund Services LLC (since 2010); Assistant Secretary (since September 2022) of the PGIM Private Credit Fund; Assistant Secretary (since March 2022) of the PGIM Private Real Estate Fund, Inc. | | Since March 2015 |
| | | |
Christian J. Kelly 1975 Treasurer and Principal Financial and Accounting Officer | | Vice President, Head of Fund Administration of PGIM Investments LLC (since November 2018); Principal Financial Officer (since September 2022) of the PGIM Private Credit Fund; Principal Financial Officer (since March 2022) of the PGIM Private Real Estate Fund, Inc.; formerly, Treasurer and Principal Accounting Officer (March 2022- July 2022) of the PGIM Private Real Estate Fund, Inc.; formerly Director of Fund Administration of Lord Abbett & Co. LLC (2009-2018), Treasurer and Principal Accounting Officer of the Lord Abbett Family of Funds (2017-2018); Director of Accounting, Avenue Capital Group (2008-2009); Senior Manager, Investment Management Practice of Deloitte & Touche LLP (1998-2007). | | Since January 2019 |
| | | |
Lana Lomuti 1967 Assistant Treasurer | | Vice President (since 2007) and Director (2005-2007), within PGIM Investments Fund Administration; formerly Assistant Treasurer (December 2007-February 2014) of The Greater China Fund, Inc. | | Since April 2014 |
| | | |
Russ Shupak 1973 Assistant Treasurer | | Vice President (since 2017) and Director (2013-2017), within PGIM Investments Fund Administration; Treasurer and Principal Accounting Officer (since July 2022) of the PGIM Private Real Estate Fund, Inc.; Assistant Treasurer (since September 2022) of the PGIM Private Credit Fund; formerly Assistant Treasurer (March 2022 – July 2022) of the PGIM Private Real Estate Fund, Inc. | | Since October 2019 |
| | | |
Deborah Conway 1969 Assistant Treasurer | | Vice President (since 2017) and Director (2007-2017), within PGIM Investments Fund Administration. | | Since October 2019 |
PGIM Emerging Markets Debt Local Currency Fund
| | | | |
Fund Officers(a) | | | | |
| | | |
Name Year of Birth Fund Position | | Principal Occupation(s) During Past Five Years | | Length of Service as Fund Officer |
| | | |
Elyse M. McLaughlin 1974 Assistant Treasurer | | Vice President (since 2017) and Director (2011-2017), within PGIM Investments Fund Administration; Treasurer and Principal Accounting Officer (since September 2022) of the PGIM Private Credit Fund; Assistant Treasurer (since March 2022) of the PGIM Private Real Estate Fund, Inc. | | Since October 2019 |
| | | |
Kelly Florio 1978 Anti-Money Laundering Compliance Officer | | Vice President, Corporate Compliance, Global Compliance Programs and Compliance Risk Management (since December 2021) of Prudential; formerly, Head of Fraud Risk Management (October 2019 to December 2021) at New York Life Insurance Company; formerly, Head of Key Risk Area Operations (November 2018 to October 2019), Director of the US Anti-Money Laundering Compliance Unit (2009-2018) and Bank Loss Prevention Associate (2006 -2009) at MetLife. | | Since June 2022 |
| (a) | Excludes Mr. Parker and Mr. Benjamin, interested Board Members who also serve as President and Vice President, respectively. |
Explanatory Notes to Tables:
| ∎ | Board Members are deemed to be “Interested,” as defined in the 1940 Act, by reason of their affiliation with PGIM Investments LLC and/or an affiliate of PGIM Investments LLC. |
| ∎ | Unless otherwise noted, the address of all Board Members and Officers is c/o PGIM Investments LLC, 655 Broad Street, Newark, New Jersey 07102-4410. |
| ∎ | There is no set term of office for Board Members or Officers. The Board Members have adopted a retirement policy, which calls for the retirement of Board Members on December 31 of the year in which they reach the age of 75. |
| ∎ | “Other Directorships Held” includes all directorships of companies required to register or file reports with the SEC under the 1934 Act (that is, “public companies”) or other investment companies registered under the 1940 Act. |
| ∎ | “Portfolios Overseen” includes all investment companies managed by PGIM Investments LLC. The investment companies for which PGIM Investments LLC serves as manager include the PGIM Mutual Funds, Target Funds, The Prudential Variable Contract Accounts, PGIM ETF Trust, PGIM Private Real Estate Fund, Inc., PGIM Private Credit Fund, PGIM High Yield Bond Fund, Inc., PGIM Global High Yield Fund, Inc., PGIM Short Duration High Yield Opportunities Fund, The Prudential Series Fund, Prudential’s Gibraltar Fund, Inc. and the Advanced Series Trust. |
| ∎ | As used in the Fund Officers table “Prudential” means The Prudential Insurance Company of America. |
Visit our website at pgim.com/investments
Approval of Advisory Agreements (unaudited)
The Fund’s Board of Directors
The Board of Directors (the “Board”) of PGIM Emerging Markets Debt Local Currency Fund (the “Fund”)1 consists of ten individuals, eight of whom are not “interested persons” of the Fund, as defined in the Investment Company Act of 1940, as amended (the “1940 Act”) (the “Independent Directors”). The Board is responsible for the oversight of the Fund and its operations, and performs the various duties imposed on the directors of investment companies by the 1940 Act. The Independent Directors have retained independent legal counsel to assist them in connection with their duties. The Chair of the Board is an Independent Director. The Board has established five standing committees: the Audit Committee, the Nominating and Governance Committee, the Compliance Committee and two Investment Committees. Each committee is chaired by, and composed of, Independent Directors.
Annual Approval of the Fund’s Advisory Agreements
As required under the 1940 Act, the Board determines annually whether to renew the Fund’s management agreement with PGIM Investments LLC (“PGIM Investments”), the Fund’s subadvisory agreement with PGIM, Inc. (“PGIM”) on behalf of its PGIM Fixed Income unit (“PGIM Fixed Income”), and the Fund’s sub-subadvisory agreement with PGIM Limited (“PGIML”). In considering the renewal of the agreements, the Board, including all of the Independent Directors, met on May 26 and June 7-9, 2022 (the “Board Meeting”) and approved the renewal of the agreements through July 31, 2023, after concluding that the renewal of the agreements was in the best interests of the Fund and its shareholders.
In advance of the meetings, the Board requested and received materials relating to the agreements, and had the opportunity to ask questions and request further information in connection with its consideration. Among other things, the Board considered comparative fee information from PGIM Investments, PGIM, and, where appropriate, affiliates of PGIM. Also, the Board considered comparisons with other mutual funds in relevant Peer Universes and Peer Groups, as is further discussed below.
In approving the agreements, the Board, including the Independent Directors advised by independent legal counsel, considered the factors it deemed relevant, including the nature, quality and extent of services provided by PGIM Investments, the subadviser, and, as relevant, its affiliates, the performance of the Fund, the profitability of PGIM Investments and its affiliates, expenses and fees, and the potential for economies of scale that may be shared with the Fund and its shareholders as the Fund’s assets grow. In their deliberations, the Directors did not identify any single factor which alone was responsible for the Board’s decision to approve the agreements with respect to the Fund. In connection with its deliberations, the Board considered information provided by PGIM Investments throughout the year at regular Board meetings, presentations from portfolio managers and other information, as well as information furnished at or in advance of the Board Meeting.
1PGIM Emerging Markets Debt Local Currency Fund is a series of Prudential World Fund, Inc.
PGIM Emerging Markets Debt Local Currency Fund
Approval of Advisory Agreements (continued)
The Directors determined that the overall arrangements between the Fund and PGIM Investments, which serves as the Fund’s investment manager pursuant to a management agreement, between PGIM Investments and PGIM, which, through its PGIM Fixed Income unit, serves as the Fund’s subadviser pursuant to the terms of a subadvisory agreement with PGIM Investments, and between PGIM and PGIML, which serves as the Fund’s sub-subadviser pursuant to the terms of a sub-subadvisory agreement with PGIM, are in the best interests of the Fund and its shareholders in light of the services performed, fees charged and such other matters as the Directors considered relevant in the exercise of their business judgment.
The material factors and conclusions that formed the basis for the Directors’ reaching their determinations to approve the continuance of the agreements are separately discussed below.
Nature, Quality and Extent of Services
The Board received and considered information regarding the nature, quality and extent of services provided to the Fund by PGIM Investments, PGIM Fixed Income, and PGIML. The Board noted that PGIM Fixed Income and PGIML are affiliated with PGIM Investments. The Board considered the services provided by PGIM Investments, including but not limited to the oversight of the subadviser and sub-subadviser for the Fund, as well as the provision of fund recordkeeping, compliance and other services to the Fund, and PGIM Investments’ role as administrator for the Fund’s liquidity risk management program. With respect to PGIM Investments’ oversight of the subadviser and sub-subadviser, the Board noted that PGIM Investments’ Strategic Investment Research Group (“SIRG”), which is a business unit of PGIM Investments, is responsible for monitoring and reporting to PGIM Investments’ senior management on the performance and operations of the subadviser and sub-subadviser. The Board also considered that PGIM Investments pays the salaries of all of the officers and interested Directors of the Fund who are part of Fund management. The Board also considered the investment subadvisory services provided by PGIM Fixed Income and PGIML, including investment research and security selection, as well as adherence to the Fund’s investment restrictions and compliance with applicable Fund policies and procedures. The Board considered PGIM Investments’ evaluation of the subadviser and sub-subadviser, as well as PGIM Investments’ recommendation, based on its review of the subadviser and sub-subadviser, to renew the subadvisory and sub-subadvisory agreements.
The Board considered the qualifications, backgrounds and responsibilities of PGIM Investments’ senior management responsible for the oversight of the Fund, PGIM, and PGIML, and also considered the qualifications, backgrounds and responsibilities of PGIM Fixed Income’s portfolio managers who are responsible for the day-to-day management of the Fund’s portfolio. The Board was provided with information pertaining to PGIM Investments, PGIM Fixed Income’s, and PGIML’s organizational structure, senior management, investment operations, and other relevant information
Visit our website at pgim.com/investments
pertaining to PGIM Investments, PGIM Fixed Income, and PGIML. The Board also noted that it received favorable compliance reports from the Fund’s Chief Compliance Officer (“CCO”) as to PGIM Investments, PGIM Fixed Income, and PGIML.
The Board concluded that it was satisfied with the nature, extent and quality of the investment management services provided by PGIM Investments, the subadvisory services provided to the Fund by PGIM Fixed Income, and the sub-subadvisory services provided by PGIML, and that there was a reasonable basis on which to conclude that the Fund benefits from the services provided by PGIM Investments, PGIM Fixed Income, and PGIML under the management, subadvisory and sub-subadvisory agreements.
Costs of Services and Profits Realized by PGIM Investments
The Board was provided with information on the profitability of PGIM Investments and its affiliates in serving as the Fund’s investment manager. The Board discussed with PGIM Investments the methodology utilized in assembling the information regarding profitability and considered its reasonableness. The Board recognized that it is difficult to make comparisons of profitability from fund management contracts because comparative information is not generally publicly available and is affected by numerous factors, including the structure of the particular adviser, the types of funds it manages, its business mix, numerous assumptions regarding allocations and the adviser’s capital structure and cost of capital. However, the Board considered that the cost of services provided by PGIM Investments for the year ended December 31, 2021 exceeded the management fees received by PGIM Investments, resulting in an operating loss to PGIM Investments. Taking these factors into account, the Board concluded that the profitability of PGIM Investments and its affiliates in relation to the services rendered was not unreasonable.
Economies of Scale
The Board received and discussed information concerning economies of scale that PGIM Investments may realize as the Fund’s assets grow beyond current levels. The Board noted that the management fee schedule for the Fund includes breakpoints, which have the effect of decreasing the fee rate as assets increase. During the course of time, the Board has considered information regarding the launch date of the Fund, the management fees of the Fund compared to those of similarly managed funds and PGIM Investments investment in the Fund over time. The Board noted that economies of scale may be shared with the Fund in several ways, including low management fees from inception, additional technological and personnel investments to enhance shareholder services, and maintaining existing expense structures in the face of a rising cost environment. The Board considered PGIM Investments’ assertion that it continually evaluates the management fee schedule of the Fund and the potential to share economies of scale through breakpoints or fee waivers as asset levels increase.
PGIM Emerging Markets Debt Local Currency Fund
Approval of Advisory Agreements (continued)
The Board recognized the inherent limitations of any analysis of economies of scale, stemming largely from the Board’s understanding that most of PGIM Investments’ costs are not specific to individual funds, but rather are incurred across a variety of products and services.
Other Benefits to PGIM Investments, PGIM Fixed Income, and PGIML
The Board considered potential ancillary benefits that might be received by PGIM Investments, PGIM Fixed Income, PGIML and their affiliates as a result of their relationship with the Fund. The Board concluded that potential benefits to be derived by PGIM Investments included transfer agency fees received by the Fund’s transfer agent (which is affiliated with PGIM Investments), as well as benefits to its reputation or other intangible benefits resulting from PGIM Investments’ association with the Fund. The Board concluded that the potential benefits to be derived by PGIM Fixed Income and PGIML included the ability to use soft dollar credits, as well as the potential benefits consistent with those generally resulting from an increase in assets under management, specifically, potential access to additional research resources and benefits to their reputations. The Board concluded that the benefits derived by PGIM Investments, PGIM Fixed Income, and PGIML were consistent with the types of benefits generally derived by investment managers and subadvisers to mutual funds.
Performance of the Fund / Fees and Expenses
The Board considered certain additional factors and made related conclusions relating to the historical performance of the Fund for the one-, three- and five-year periods ended December 31, 2021.
The Board also considered the Fund’s actual management fee, as well as the Fund’s net total expense ratio, for the fiscal year ended October 31, 2021. The Board considered the management fee for the Fund as compared to the management fee charged by PGIM Investments to other funds and the fee charged by other advisers to comparable mutual funds in a Peer Group. The actual management fee represents the fee rate actually paid by Fund shareholders and includes any fee waivers or reimbursements. The net total expense ratio for the Fund represents the actual expense ratio incurred by Fund shareholders.
The mutual funds included in the Peer Universe, which was used to consider performance, and the Peer Group, which was used to consider fees and expenses, were objectively determined by Broadridge, an independent provider of mutual fund data. In certain circumstances, PGIM Investments also provided supplemental Peer Universe or Peer Group information, for reasons addressed with the Board. The comparisons placed the Fund in various quartiles over various periods, with the first quartile being the best 25% of the mutual funds (for performance, the best performing mutual funds and, for expenses, the lowest cost mutual funds).
The section below summarizes key factors considered by the Board and the Board’s conclusions regarding the Fund’s performance, fees and overall expenses. The table
Visit our website at pgim.com/investments
sets forth net performance comparisons (which reflect the impact on performance of fund expenses, or any subsidies, expense caps or waivers that may be applicable) with the Peer Universe, actual management fees with the Peer Group (which reflect the impact of any subsidies or fee waivers), and net total expenses with the Peer Group, each of which were key factors considered by the Board.
| | | | | | | | |
| | | | | |
| Net Performance | | 1 Year | | 3 Years | | 5 Years | | 10 Years |
| | 3rd Quartile | | 2nd Quartile | | 2nd Quartile | | 2nd Quartile |
| |
| Actual Management Fees: 1st Quartile |
| |
Net Total Expenses: 1st Quartile |
| ● | The Board noted that the Fund outperformed its benchmark index over the three-, five- and ten-year periods, though it underperformed its benchmark index over the one-year period. |
| ● | The Board considered PGIM Investments’ assertion that despite recent underperformance, they are encouraged by the Fund’s strong longer-term outperformance over the three-, five- and ten-year periods ended December 31, 2021 versus peers. |
| ● | The Board also considered that the Fund outperformed its benchmark for the year-to-date, one-, three-, five- and ten-year periods ended March 31, 2022 and outperformed its peer group for the three-, five- and ten-year periods ended March 31, 2022. |
| ● | The Board and PGIM Investments agreed to retain the existing contractual expense cap that (exclusive of other fees and expenses) caps the Fund’s annual operating expenses at 1.13% for Class A shares, 1.88% for Class C shares, 0.65% for Class R6 shares, and 0.72% for Class Z shares through February 28, 2023. |
| ● | In addition, PGIM Investments will waive management fees or shared operating expenses on any share class to the same extent that it waives such expenses on any other share class, and has agreed that total annual fund operating expenses for Class R6 shares will not exceed total annual fund operating expenses for Class Z shares. |
| ● | The Board concluded that, in light of the above, it would be in the best interests of the Fund and its shareholders to renew the agreements. |
| ● | The Board concluded that the management fees (including subadvisory fees) and total expenses were reasonable in light of the services provided. |
* * *
After full consideration of these factors, the Board concluded that the approval of the agreements was in the best interests of the Fund and its shareholders.
PGIM Emerging Markets Debt Local Currency Fund
| | | | |
| | | |
∎ MAIL | | ∎ TELEPHONE | | ∎ WEBSITE |
655 Broad Street | | (800) 225-1852 | | pgim.com/investments |
Newark, NJ 07102 | | | | |
PROXY VOTING
The Board of Directors of the Fund has delegated to the Fund’s subadviser the responsibility for voting any proxies and maintaining proxy recordkeeping with respect to the Fund. A description of these proxy voting policies and procedures is available without charge, upon request, by calling (800) 225-1852 or by visiting the Securities and Exchange Commission’s website at sec.gov. Information regarding how the Fund voted proxies relating to portfolio securities during the most recent 12-month period ended June 30 is available on the Fund’s website and on the Securities and Exchange Commission’s website.
DIRECTORS
Ellen S. Alberding ● Kevin J. Bannon ● Scott E. Benjamin ● Linda W. Bynoe ● Barry H. Evans ● Keith F. Hartstein ● Laurie Simon Hodrick ● Stuart S. Parker ● Brian K. Reid ● Grace C. Torres
OFFICERS
Stuart S. Parker, President ● Scott E. Benjamin, Vice President ● Christian J. Kelly, Treasurer and Principal Financial and Accounting Officer ● Claudia DiGiacomo, Chief Legal Officer ● Isabelle Sajous, Chief Compliance Officer ● Kelly Florio, Anti-Money Laundering Compliance Officer ● Andrew R. French, Secretary ● Melissa Gonzalez, Assistant Secretary ● Kelly A. Coyne, Assistant Secretary ● Patrick E. McGuinness, Assistant Secretary ● Debra Rubano, Assistant Secretary ● Lana Lomuti, Assistant Treasurer ● Russ Shupak, Assistant Treasurer ● Elyse M. McLaughlin, Assistant Treasurer ● Deborah Conway, Assistant Treasurer
| | | | |
| | |
| MANAGER | | PGIM Investments LLC | | 655 Broad Street Newark, NJ 07102 |
| | |
| SUBADVISER | | PGIM Fixed Income | | 655 Broad Street Newark, NJ 07102 |
| | |
| SUB-SUBADVISER | | PGIM Limited | | Grand Buildings, 1-3 Strand Trafalgar Square London, WC2N 5HR United Kingdom |
| | |
| DISTRIBUTOR | | Prudential Investment Management Services LLC | | 655 Broad Street Newark, NJ 07102 |
| | |
| CUSTODIAN | | The Bank of New York Mellon | | 240 Greenwich Street New York, NY 10286 |
| | |
| TRANSFER AGENT | | Prudential Mutual Fund Services LLC | | PO Box 9658 Providence, RI 02940 |
| | |
| INDEPENDENT REGISTERED PUBLIC ACCOUNTING FIRM | | PricewaterhouseCoopers LLP | | 300 Madison Avenue New York, NY 10017 |
| | |
| FUND COUNSEL | | Willkie Farr &Gallagher LLP | | 787 Seventh Avenue New York, NY 10019 |
|
An investor should consider the investment objectives, risks, charges, and expenses of the Fund carefully before investing. The prospectus
and summary prospectus contain this and other information about the Fund. An investor may obtain the prospectus and summary
prospectus by visiting our website at pgim.com/investments or by calling (800) 225-1852. The prospectus and summary prospectus should be
read carefully before investing. |
|
| E-DELIVERY |
| To receive your mutual fund documents online, go to pgim.com/investments/resource/edelivery and enroll. Instead of receiving printed documents by mail, you will receive notification via email when new materials are available. You can cancel your enrollment or change your email address at any time by visiting the website address above. |
|
| SHAREHOLDER COMMUNICATIONS WITH DIRECTORS |
| Shareholders can communicate directly with the Board of Directors by writing to the Chair of the Board, PGIM Emerging Markets Debt Local Currency Fund, PGIM Investments, Attn: Board of Directors, 655 Broad Street, Newark, NJ 07102. Shareholders can communicate directly with an individual Director by writing to that Director at the same address. Communications are not screened before being delivered to the addressee. |
|
| AVAILABILITY OF PORTFOLIO HOLDINGS |
| The Fund files its complete schedule of portfolio holdings with the Securities and Exchange Commission for the first and third quarters of each fiscal year as an exhibit to its reports on Form N-PORT. The Fund’s Form N-PORT filings are available on the Commission’s website at sec.gov. |
|
| The Fund’s Statement of Additional Information contains additional information about the Fund’s Directors and is available without charge, upon request, by calling (800) 225-1852. |
| | | | |
| Mutual Funds: | | | | |
| ARE NOT INSURED BY THE FDIC OR ANY FEDERAL GOVERNMENT AGENCY | | MAY LOSE VALUE | | ARE NOT A DEPOSIT OF OR GUARANTEED BY ANY BANK OR ANY BANK AFFILIATE |
| | | | | | | | |
|
PGIM EMERGING MARKETS DEBT LOCAL CURRENCY FUND |
| | | | |
SHARE CLASS | | A | | C | | Z | | R6 |
| | | | |
NASDAQ | | EMDAX | | EMDCX | | EMDZX | | EMDQX |
| | | | |
CUSIP | | 743969750 | | 743969743 | | 743969727 | | 743969735 |
MF212E

PGIM JENNISON GLOBAL INFRASTRUCTURE FUND
ANNUAL REPORT
OCTOBER 31, 2022

To enroll in e-delivery, go to pgim.com/investments/resource/edelivery
Table of Contents
This report is not authorized for distribution to prospective investors unless preceded or accompanied by a current prospectus.
The views expressed in this report and information about the Fund’s portfolio holdings are for the period covered by this report and are subject to change thereafter.
Mutual funds are distributed by Prudential Investment Management Services LLC, member SIPC. Jennison Associates LLC is a registered investment adviser. Both are Prudential Financial companies. © 2022 Prudential Financial, Inc. and its related entities. Jennison Associates, Jennison, PGIM, and the PGIM logo are service marks of Prudential Financial, Inc. and its related entities, registered in many jurisdictions worldwide.
2 Visit our website at pgim.com/investments
Letter from the President
| | |
 | | Dear Shareholder: |
| | We hope you find the annual report for the PGIM Jennison Global Infrastructure Fund informative and useful. The report covers performance for the 12-month period that ended October 31, 2022. The attention of the global economy and financial markets pivoted during the period from the COVID-19 pandemic to the challenge of rapidly rising inflation. While job growth remained strong, prices for a wide range of goods and services rose in response to economic re-openings, supply-chain disruptions, governmental stimulus, and Russia’s invasion of Ukraine. With inflation surging to a 40-year high, the Federal Reserve and other central banks aggressively hiked interest rates, prompting recession concerns. |
After rising to record levels at the end of 2021, stocks have fallen sharply in 2022 as investors worried about higher prices, slowing economic growth, geopolitical uncertainty, and new COVID-19 outbreaks. Equities rallied for a time during the summer but began falling again in late August on fears that the Fed would keep raising rates to tame inflation. For the entire 12-month period, equities suffered a broad-based global decline, although large-cap US stocks outperformed their small-cap counterparts. International developed and emerging markets trailed the US market during this time.
Rising rates and economic uncertainty drove fixed income prices broadly lower as well. US and global investment-grade bonds, along with US high yield corporate bonds and emerging market debt, all posted negative returns during the period.
Regarding your investments with PGIM, we believe it is important to maintain a diversified portfolio of funds consistent with your tolerance for risk, time horizon, and financial goals. Your financial advisor can help you create a diversified investment plan that may include funds covering all the basic asset classes and that reflects your personal investor profile and risk tolerance. However, diversification and asset allocation strategies do not assure a profit or protect against loss in declining markets.
At PGIM Investments, we provide access to active investment strategies across the global markets in the pursuit of consistent outperformance for investors. PGIM is the world’s 11th-largest investment manager with more than $1.5 trillion in assets under management. Our scale and investment expertise allow us to deliver a diversified suite of actively managed solutions across a broad spectrum of asset classes and investment styles.
Thank you for choosing our family of funds.
Sincerely,

Stuart S. Parker, President
PGIM Jennison Global Infrastructure Fund
December 15, 2022
PGIM Jennison Global Infrastructure Fund 3
Your Fund’s Performance (unaudited)
Performance data quoted represent past performance. Past performance does not guarantee future results. The investment return and principal value of an investment will fluctuate so that an investor’s shares, when redeemed, may be worth more or less than their original cost. Current performance may be lower or higher than the past performance data quoted. An investor may obtain performance data as of the most recent month-end by visiting our website at pgim.com/investments or by calling (800) 225-1852.
| | | | | | | | | | | | |
| |
| | | Average Annual Total Returns as of 10/31/22 |
| | | |
| | | One Year (%) | | Five Years (%) | | Since Inception (%) | |
| | | |
Class A | | | | | | | | | | | | |
| | | |
(with sales charges) | | | -14.22 | | | | 3.38 | | | | 5.43 (09/25/2013) | |
| | | |
(without sales charges) | | | -9.23 | | | | 4.55 | | | | 6.09 (09/25/2013) | |
| | | |
Class C | | | | | | | | | | | | |
| | | |
(with sales charges) | | | -10.75 | | | | 3.75 | | | | 5.29 (09/25/2013) | |
| | | |
(without sales charges) | | | -9.91 | | | | 3.75 | | | | 5.29 (09/25/2013) | |
| | | |
Class Z | | | | | | | | | | | | |
| | | |
(without sales charges) | | | -8.93 | | | | 4.87 | | | | 6.39 (09/25/2013) | |
| | | |
Class R6 | | | | | | | | | | | | |
| | | |
(without sales charges) | | | -8.93 | | | | 4.86 | | | | 6.83 (12/28/2016) | |
| | | |
S&P Global Infrastructure Index | | | | | | | | | | | | |
| | | |
| | | -5.43 | | | | 2.02 | | | | — | |
| | | |
S&P 500 Index | | | | | | | | | | | | |
| | | |
| | | | -14.60 | | | | 10.44 | | | | — | |
| | | | |
| |
| Average Annual Total Returns as of 10/31/22 Since Inception (%) | | |
| | | Class A, Class C, Class Z (09/25/2013) | | Class R6 (12/28/2016) |
| | |
S&P Global Infrastructure Index | | 4.54 | | 4.70 |
| | |
S&P 500 Index | | 11.73 | | 11.84 |
Since Inception returns are provided since the Fund has less than 10 fiscal years of returns. Since Inception returns for the Indexes are measured from the closest month-end to the class’s inception date.
4 Visit our website at pgim.com/investments
Growth of a $10,000 Investment (unaudited)
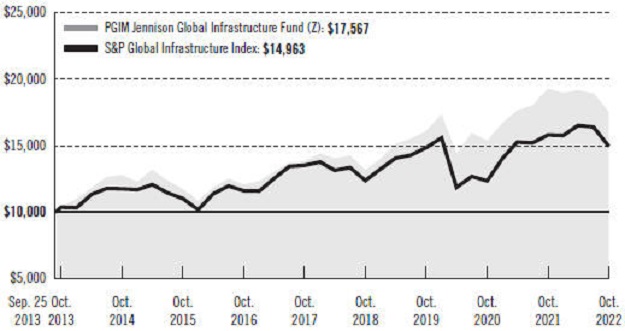
The graph compares a $10,000 investment in the Fund’s Class Z shares with a similar investment in the S&P Global Infrastructure Index by portraying the initial account values at the commencement of operations of Class Z shares (September 25, 2013) and the account values at the end of the current fiscal year (October 31, 2022), as measured on a quarterly basis. For purposes of the graph, and unless otherwise indicated, it has been assumed that (a) all recurring fees (including management fees) were deducted and (b) all dividends and distributions were reinvested. The line graph provides information for Class Z shares only. As indicated in the tables provided earlier, performance for other share classes will vary due to the differing fees and expenses applicable to each share class (as indicated in the following paragraphs). Without waiver of fees and/or expense reimbursements, if any, the returns would have been lower.
Past performance does not predict future performance. Total returns and the ending account values in the graphs include changes in share price and reinvestment of dividends and capital gains distributions in a hypothetical investment for the periods shown. The Fund’s total returns do not reflect the deduction of income taxes on an individual’s investment. Taxes may reduce your actual investment returns on income or gains paid by the Fund or any gains you may realize if you sell your shares.
PGIM Jennison Global Infrastructure Fund 5
Your Fund’s Performance (continued)
The returns in the tables do not reflect the deduction of taxes that a shareholder would pay on Fund distributions or following the redemption of Fund shares. The average annual total returns take into account applicable sales charges, which are described for each share class in the table below.
| | | | | | | | |
| | | | | |
| | | Class A | | Class C | | Class Z | | Class R6 |
| | | | | |
Maximum initial sales charge | | 5.50% of the public offering price | | None | | None | | None |
| | | | | |
Contingent deferred sales charge (CDSC) (as a percentage of the lower of the original purchase price or the net asset value at redemption) | | 1.00% on sales of $1 million or more made within 12 months of purchase | | 1.00% on sales made within 12 months of purchase | | None | | None |
| | | | | |
Annual distribution and service (12b-1) fees (shown as a percentage of average daily net assets) | | 0.30% (0.25% currently) | | 1.00% | | None | | None |
Benchmark Definitions
S&P Global Infrastructure Index—The S&P Global Infrastructure Index is an unmanaged index that consists of 75 companies from around the world that represent the listed infrastructure universe. To create diversified exposure across the global listed infrastructure market, the Index has balanced weights across three distinct infrastructure clusters: Utilities, Transportation, and Energy.
S&P 500 Index*—The S&P 500 Index is an unmanaged index of over 500 stocks of large US public companies. It gives a broad look at how stock prices in the United States have performed.
*The S&P 500 Index is a product of S&P Dow Jones Indices LLC and/or its affiliates and has been licensed for use by PGIM, Inc. and/or its affiliates. Copyright © 2022 S&P Dow Jones Indices LLC, a division of S&P Global, Inc., and/or its affiliates. All rights reserved. Redistribution or reproduction in whole or in part are prohibited without written permission of S&P Dow Jones Indices LLC. For more information on any of S&P Dow Jones Indices LLC’s indices please visit www.spdji.com. S&P® is a registered trademark of S&P Global and Dow Jones® is a registered trademark of Dow Jones Trademark Holdings LLC.
Investors cannot invest directly in an index. The returns for the Indexes would be lower if they included the effects of sales charges, operating expenses of a mutual fund, or taxes that may be paid by an investor.
6 Visit our website at pgim.com/investments
Presentation of Fund Holdings as of 10/31/22
| | | | | | |
| | | |
| Ten Largest Holdings | | Line of Business | | Country | | % of Net Assets |
| | | |
Cheniere Energy, Inc. | | Oil, Gas & Consumable Fuels | | United States | | 6.4% |
| | | |
NextEra Energy, Inc. | | Electric Utilities | | United States | | 6.1% |
| | | |
Constellation Energy Corp. | | Electric Utilities | | United States | | 4.5% |
| | | |
CenterPoint Energy, Inc. | | Multi-Utilities | | United States | | 4.0% |
| | | |
Transurban Group, UTS | | Transportation Infrastructure | | Australia | | 3.8% |
| | | |
Sempra Energy | | Multi-Utilities | | United States | | 3.6% |
| | | |
Williams Cos., Inc. (The) | | Oil, Gas &Consumable Fuels | | United States | | 3.5% |
| | | |
American Tower Corp., REIT | | Equity Real Estate Investment Trusts (REITs) | | United States | | 3.4% |
| | | |
Ferrovial SA | | Construction & Engineering | | Spain | | 3.4% |
| | | |
National Grid plc | | Multi-Utilities | | United Kingdom | | 3.2% |
Holdings reflect only long-term investments and are subject to change.
PGIM Jennison Global Infrastructure Fund 7
Strategy and Performance Overview* (unaudited)
How did the Fund perform?
The PGIM Jennison Global Infrastructure Fund’s Class Z shares returned –8.93% in the 12-month reporting period that ended October 31, 2022, underperforming the –5.43% return of the S&P Global Infrastructure Index (the Index).
What were the market conditions?
| ● | | During the reporting period, the investment backdrop changed from one of stimulus and spending to one of inflation and tightening financial conditions, with the need to control inflation moving aggressively to the fore. |
| ● | | Many global equity markets closed out 2021 at all-time highs. However, rapidly rising inflation spurred the US Federal Reserve (the Fed) to pivot to a tightening stance late in the year, leading to a spike in US Treasury yields and a general repricing of risk. |
| ● | | The investment environment at the start of 2022 was clouded by continued uncertainties related to the COVID-19 pandemic, inflation, and the prospect of slowing growth on the back of the Fed’s plans for policy tightening. The brutal military conflict in Ukraine added a dangerous new dimension of uncertainty in late February. Commodity prices rose sharply, led by crude oil, as the sanctions imposed on Russia by the US and European Union made it difficult for the world’s largest oil exporter to complete transactions. |
| ● | | As the year progressed, stock prices continued to suffer from the impacts of the war in Ukraine, unexpectedly high inflation, aggressive monetary tightening, and declining growth prospects around the globe. |
| ● | | Global infrastructure stocks, as represented by the Index, declined for the period but significantly outperformed the broader equity market. Among infrastructure sectors, midstream energy led performance, while utility stocks saw modest declines overall. Transportation infrastructure stocks also lost ground. Telecommunications infrastructure (which is not represented in the Index) was the laggard, declining sharply over the period. |
What worked?
| ● | | The Fund benefited from strong stock selection in the midstream energy sector. |
| ● | | The Fund’s holdings in midstream energy companies Cheniere Energy Inc., DT Midstream Inc., Targa Resources Corp., and The Williams Companies Inc. saw strong performance for the period. |
| ● | | The Fund also benefited from gains in certain utility companies, including Constellation Energy Corp., CenterPoint Energy Inc., and Power Grid Corporation of India Ltd. |
What didn’t work?
| ● | | Despite significantly outperforming broad market indices, the Fund underperformed the Index during the period, primarily due to off-Index holdings in the telecommunications sector. |
8 Visit our website at pgim.com/investments
| ● | | Telecommunications infrastructure stocks Cellnex Telecom SA, American Tower Corp., and SBA Communications Corp. hurt performance for the period. |
| ● | | Utility stocks China Longyuan Power Group Corporation Ltd. and National Grid plc also contributed to portfolio declines. |
| ● | | Other notable detractors included GFL Environmental Inc., AENA S.M.E. SA, Ferrovial SA, and Transurban Group. |
Current outlook
| ● | | Global macroeconomic considerations have heavily influenced the recent performance of listed infrastructure stocks, as a broad market rally reversed course on expectations for further interest rate hikes from the Fed and other global central banks. Despite expectations for continued market volatility, Jennison maintains a positive outlook regarding the long-term fundamental outlook for the Fund’s holdings across all four infrastructure sectors (midstream energy, utilities, transportation infrastructure, and telecommunication infrastructure), with an emphasis on utilities and midstream energy infrastructure in the near-to-intermediate term. Additionally, Jennison believes that ESG factors appear likely to be more influential in determining investment outcomes over time. |
| ● | | Utilities represent the Fund’s largest sector exposure, reflecting projections for the sector to generate mid-to-high single-digit earnings growth with commensurate dividend growth, supported by highly visible, regulated capital expenditure trajectories and improving regulatory regimes. In particular, utilities appear well positioned to capitalize on the transition to cleaner energy. In Jennison’s view, energy transition investment is supported by two broad and enduring themes: (1) pronounced reductions in the cost of renewable energy, driven by continued technological advancement, and (2) increasing public policy support driven by concerns over greenhouse gas emissions, energy security, and, most recently, job creation. The many decarbonization-related financial incentives included in the US Inflation Reduction Act will likely accelerate the energy transition in the US. In Europe, uncertainty driven by the need to transition away from Russian energy supply has led to weakness in the stock prices of utility companies. While remaining optimistic for the longer term, Jennison has reduced the Fund’s exposure to European utilities in lieu of more clarity regarding policy decisions, and until the risk/reward proposition appears more favorable. |
| ● | | While the midstream energy sector has been a strong performer since the COVID-19 vaccine announcement in late 2020, the group continues to experience outsized outperformance. Russia’s invasion of Ukraine has exacerbated supply/demand imbalances, and heightened security-related energy supply concerns, thereby driving energy stocks higher. In Jennison’s view, companies with strong balance sheets, integrated asset systems with multiple touchpoints across the energy value chain, and strong ESG metrics are likely to continue to fare well going forward. Additionally, Jennison believes the midstream energy sector is poised for a noteworthy upward |
PGIM Jennison Global Infrastructure Fund 9
Strategy and Performance Overview* (continued)
| | inflection in free cash flow and return of capital to shareholders through dividend increases and/or share repurchases, with the Fund’s energy infrastructure holdings positioned to benefit. |
| ● | | Transportation infrastructure (excluding China) has seen improving economic fundaments as fading COVID-19 impacts have generally resulted in accelerating mobility trends for both airports and toll roads. However, macroeconomic uncertainties have increased, driven by inflation, interest rates, and high energy prices, prompting Jennison to adopt incrementally more defensive positioning. Specific portfolio biases as of the end of the period include: |
| | ● | | Continuing to invest in higher-quality toll roads that provide good inflation protection and can perform well across a range of economic outcomes. |
| | ● | | Trimming exposure to European airports in favor of other geographies. |
| | ● | | Reducing overall North American rail exposure given macroeconomic concerns and pivoting to Canadian rails where end markets offer a fundamentally better outlook into 2023. |
| | ● | | Remaining constructive on US waste stocks that continue to exhibit defensive characteristics and strong pricing power. |
| ● | | Lastly, regarding communications infrastructure, Jennison continues to favor wireless towers, given their recession-resistant business models (including inflation-adjusted revenues), which appear well positioned to benefit from expanded, carrier-funded, 5G network deployment. |
*This strategy and performance overview, which discusses what strategies or holdings (including derivatives, if applicable) affected the Fund’s performance, is compiled based on how the Fund performed relative to the Fund’s benchmark index and is viewed for performance attribution purposes at the aggregate Fund level, which in most instances will not directly correlate to the amounts disclosed in the Statement of Operations which conform to US generally accepted accounting principles.
10 Visit our website at pgim.com/investments
Fees and Expenses (unaudited)
As a shareholder of the Fund, you incur two types of costs: (1) transaction costs, including sales charges (loads) on purchase payments and redemptions, as applicable, and (2) ongoing costs, including management fees, distribution and/or service (12b-1) fees, and other Fund expenses, as applicable. This example is intended to help you understand your ongoing costs (in dollars) of investing in the Fund and to compare these costs with the ongoing costs of investing in other mutual funds.
The example is based on an investment of $1,000 held through the six-month period ended October 31, 2022. The example is for illustrative purposes only; you should consult the Prospectus for information on initial and subsequent minimum investment requirements.
Actual Expenses
The first line for each share class in the table on the following page provides information about actual account values and actual expenses. You may use the information on this line, together with the amount you invested, to estimate the expenses that you paid over the period. Simply divide your account value by $1,000 (for example, an $8,600 account value ÷ $1,000 = 8.6), then multiply the result by the number on the first line under the heading “Expenses Paid During the Six-Month Period” to estimate the expenses you paid on your account during this period.
Hypothetical Example for Comparison Purposes
The second line for each share class in the table on the following page provides information about hypothetical account values and hypothetical expenses based on the Fund’s actual expense ratio and an assumed rate of return of 5% per year before expenses, which is not the Fund’s actual return. The hypothetical account values and expenses may not be used to estimate the actual ending account balance or expenses you paid for the period. You may use this information to compare the ongoing costs of investing in the Fund and other funds. To do so, compare this 5% hypothetical example with the 5% hypothetical examples that appear in the shareholder reports of the other funds.
The Fund’s transfer agent may charge additional fees to holders of certain accounts that are not included in the expenses shown in the table on the following page. These fees apply to individual retirement accounts (IRAs) and Section 403(b) accounts. As of the close of the six-month period covered by the table, IRA fees included an annual maintenance fee of $15 per account (subject to a maximum annual maintenance fee of $25 for all accounts held by the same shareholder). Section 403(b) accounts are charged an annual $25 fiduciary maintenance fee. Some of the fees may vary in amount, or may be waived, based on your total account balance or the number of PGIM funds, including the Fund, that you own. You should consider the additional fees that were charged to your Fund account over the six-month period when you estimate the total ongoing expenses paid over the period and the impact of these fees on your ending account value, as these additional expenses are not reflected in the information
PGIM Jennison Global Infrastructure Fund 11
Fees and Expenses (continued)
provided in the expense table. Additional fees have the effect of reducing investment returns.
Please note that the expenses shown in the table are meant to highlight your ongoing costs only and do not reflect any transactional costs such as sales charges (loads). Therefore, the second line for each share class in the table is useful in comparing ongoing costs only and will not help you determine the relative total costs of owning different funds. In addition, if these transactional costs were included, your costs would have been higher.
| | | | | | | | | | |
| | | | | |
PGIM Jennison Global Infrastructure Fund | | Beginning Account Value May 1, 2022 | | Ending Account Value October 31, 2022 | | Annualized Expense Ratio Based on the Six-Month Period | | Expenses Paid During the Six-Month Period* |
| | | | | |
Class A | | Actual | | $1,000.00 | | $ 914.00 | | 1.50% | | $ 7.24 |
| | | | | |
| | Hypothetical | | $1,000.00 | | $1,017.64 | | 1.50% | | $ 7.63 |
| | | | | |
Class C | | Actual | | $1,000.00 | | $ 910.10 | | 2.25% | | $10.83 |
| | | | | |
| | Hypothetical | | $1,000.00 | | $1,013.86 | | 2.25% | | $11.42 |
| | | | | |
Class Z | | Actual | | $1,000.00 | | $ 915.70 | | 1.17% | | $ 5.65 |
| | | | | |
| | Hypothetical | | $1,000.00 | | $1,019.31 | | 1.17% | | $ 5.96 |
| | | | | |
Class R6 | | Actual | | $1,000.00 | | $ 915.10 | | 1.17% | | $ 5.65 |
| | | | | |
| | | Hypothetical | | $1,000.00 | | $1,019.31 | | 1.17% | | $ 5.96 |
*Fund expenses (net of fee waivers or subsidies, if any) for each share class are equal to the annualized expense ratio for each share class (provided in the table), multiplied by the average account value over the period, multiplied by the 184 days in the six-month period ended October 31, 2022, and divided by the 365 days in the Fund’s fiscal year ended October 31, 2022 (to reflect the six-month period).Expenses presented in the table include the expenses of any underlying portfolios in which the Fund may invest.
12 Visit our website at pgim.com/investments
Schedule of Investments
as of October 31, 2022
| | | | | | | | |
| | |
Description | | | Shares | | | | Value | |
| | |
LONG-TERM INVESTMENTS 97.9% | | | | | | | | |
| | |
COMMON STOCKS 96.9% | | | | | | | | |
| | |
Australia 5.1% | | | | | | | | |
| | |
APA Group | | | 129,250 | | | $ | 870,161 | |
Transurban Group, UTS | | | 288,590 | | | | 2,448,094 | |
| | | | | | | | |
| | |
| | | | | | | 3,318,255 | |
| | |
Canada 7.0% | | | | | | | | |
| | |
Canadian National Railway Co. | | | 13,550 | | | | 1,604,862 | |
Canadian Pacific Railway Ltd. | | | 13,544 | | | | 1,009,673 | |
Enbridge, Inc. | | | 24,612 | | | | 958,935 | |
TC Energy Corp. | | | 21,268 | | | | 934,178 | |
| | | | | | | | |
| | |
| | | | | | | 4,507,648 | |
| | |
China 1.3% | | | | | | | | |
| | |
Beijing Capital International Airport Co. Ltd. (Class H Stock)* | | | 225,990 | | | | 122,381 | |
China Longyuan Power Group Corp. Ltd. (Class H Stock) | | | 635,576 | | | | 726,254 | |
| | | | | | | | |
| | |
| | | | | | | 848,635 | |
| | |
France 4.4% | | | | | | | | |
| | |
Eiffage SA | | | 16,103 | | | | 1,456,062 | |
Vinci SA | | | 14,841 | | | | 1,365,922 | |
| | | | | | | | |
| | |
| | | | | | | 2,821,984 | |
| | |
Germany 1.0% | | | | | | | | |
| | |
RWE AG | | | 16,478 | | | | 634,324 | |
| | |
India 1.3% | | | | | | | | |
| | |
Power Grid Corp. of India Ltd. | | | 305,342 | | | | 842,461 | |
| | |
Italy 3.1% | | | | | | | | |
| | |
Enav SpA, 144A | | | 251,607 | | | | 972,974 | |
Terna - Rete Elettrica Nazionale | | | 153,847 | | | | 1,020,262 | |
| | | | | | | | |
| | |
| | | | | | | 1,993,236 | |
| | |
Japan 2.7% | | | | | | | | |
| | |
West Japan Railway Co. | | | 43,520 | | | | 1,725,419 | |
| | |
Mexico 2.6% | | | | | | | | |
| | |
Grupo Aeroportuario del Pacifico SAB de CV (Class B Stock) | | | 107,364 | | | | 1,665,272 | |
See Notes to Financial Statements.
PGIM Jennison Global Infrastructure Fund 13
Schedule of Investments (continued)
as of October 31, 2022
| | | | | | | | |
| | |
Description | | | Shares | | | | Value | |
| | |
COMMON STOCKS (Continued) | | | | | | | | |
| | |
New Zealand 1.4% | | | | | | | | |
| | |
Auckland International Airport Ltd.* | | | 207,345 | | | $ | 926,920 | |
| | |
Spain 5.2% | | | | | | | | |
| | |
Ferrovial SA | | | 90,359 | | | | 2,208,227 | |
Sacyr SA | | | 462,400 | | | | 1,134,326 | |
| | | | | | | | |
| | |
| | | | | | | 3,342,553 | |
| | |
United Kingdom 4.2% | | | | | | | | |
| | |
National Grid PLC | | | 189,480 | | | | 2,064,408 | |
Pennon Group PLC | | | 71,040 | | | | 682,674 | |
| | | | | | | | |
| | |
| | | | | | | 2,747,082 | |
| | |
United States 57.6% | | | | | | | | |
| | |
AES Corp. (The) | | | 29,889 | | | | 781,896 | |
American Tower Corp., REIT | | | 10,705 | | | | 2,217,969 | |
CenterPoint Energy, Inc. | | | 89,899 | | | | 2,572,010 | |
Cheniere Energy, Inc. | | | 23,314 | | | | 4,112,823 | |
CMS Energy Corp. | | | 28,801 | | | | 1,643,097 | |
Constellation Energy Corp. | | | 30,733 | | | | 2,905,498 | |
Dominion Energy, Inc. | | | 26,316 | | | | 1,841,331 | |
DT Midstream, Inc. | | | 21,009 | | | | 1,254,237 | |
Equitrans Midstream Corp. | | | 84,982 | | | | 715,548 | |
Exelon Corp. | | | 50,119 | | | | 1,934,092 | |
NextEra Energy Partners LP | | | 12,405 | | | | 918,838 | |
NextEra Energy, Inc. | | | 50,995 | | | | 3,952,113 | |
NiSource, Inc. | | | 23,707 | | | | 609,033 | |
SBA Communications Corp., REIT | | | 5,324 | | | | 1,436,948 | |
Sempra Energy | | | 15,365 | | | | 2,319,193 | |
Targa Resources Corp. | | | 30,167 | | | | 2,062,518 | |
Union Pacific Corp. | | | 3,509 | | | | 691,764 | |
Waste Connections, Inc. | | | 10,513 | | | | 1,386,770 | |
Williams Cos., Inc. (The) | | | 68,676 | | | | 2,247,766 | |
Xcel Energy, Inc. | | | 24,093 | | | | 1,568,695 | |
| | | | | | | | |
| | |
| | | | | | | 37,172,139 | |
| | | | | | | | |
| | |
TOTAL COMMON STOCKS
(cost $58,546,654) | | | | | | | 62,545,928 | |
| | | | | | | | |
See Notes to Financial Statements.
14
| | | | | | | | |
| | |
Description | | | Shares | | | | Value | |
| | |
PREFERRED STOCK 1.0% | | | | | | | | |
| | |
United States | | | | | | | | |
| | |
NextEra Energy, Inc., CVT, 6.219%, Maturing 09/01/23
(cost $657,062) | | | 13,402 | | | $ | 646,646 | |
| | | | | | | | |
| | |
TOTAL LONG-TERM INVESTMENTS
(cost $59,203,716) | | | | | | | 63,192,574 | |
| | | | | | | | |
| | |
SHORT-TERM INVESTMENT 2.2% | | | | | | | | |
| | |
UNAFFILIATED FUND | | | | | | | | |
Dreyfus Government Cash Management (Institutional Shares)
(cost $1,414,697) | | | 1,414,697 | | | | 1,414,697 | |
| | | | | | | | |
| | |
TOTAL INVESTMENTS 100.1%
(cost $60,618,413) | | | | | | | 64,607,271 | |
Liabilities in excess of other assets (0.1)% | | | | | | | (96,476 | ) |
| | | | | | | | |
| | |
NET ASSETS 100.0% | | | | | | $ | 64,510,795 | |
| | | | | | | | |
Below is a list of the abbreviation(s) used in the annual report:
144A—Security was purchased pursuant to Rule 144A under the Securities Act of 1933 and, pursuant to the requirements of Rule 144A, may not be resold except to qualified institutional buyers.
CVT—Convertible Security
LIBOR—London Interbank Offered Rate
LP—Limited Partnership
REITs—Real Estate Investment Trust
SOFR—Secured Overnight Financing Rate
UTS—Unit Trust Security
| * | Non-income producing security. |
Fair Value Measurements:
Various inputs are used in determining the value of the Fund’s investments. These inputs are summarized in the three broad levels listed below.
Level 1—unadjusted quoted prices generally in active markets for identical securities.
Level 2—quoted prices for similar securities, interest rates and yield curves, prepayment speeds, foreign currency exchange rates and other observable inputs.
Level 3—unobservable inputs for securities valued in accordance with Board approved fair valuation procedures.
See Notes to Financial Statements.
PGIM Jennison Global Infrastructure Fund 15
Schedule of Investments (continued)
as of October 31, 2022
The following is a summary of the inputs used as of October 31, 2022 in valuing such portfolio securities:
| | | | | | | | | | | | | | | | | | | | |
| | | Level 1 | | | Level 2 | | | Level 3 |
Investments in Securities | | | | | | | | | | | | | | | | | | | | |
Assets | | | | | | | | | | | | | | | | | | | | |
Long-Term Investments | | | | | | | | | | | | | | | | | | | | |
Common Stocks | | | | | | | | | | | | | | | | | | | | |
Australia | | $ | — | | | $ | 3,318,255 | | | | | | | | $— | | | | | |
Canada | | | 4,507,648 | | | | — | | | | | | | | — | | | | | |
China | | | — | | | | 848,635 | | | | | | | | — | | | | | |
France | | | — | | | | 2,821,984 | | | | | | | | — | | | | | |
Germany | | | — | | | | 634,324 | | | | | | | | — | | | | | |
India | | | — | | | | 842,461 | | | | | | | | — | | | | | |
Italy | | | — | | | | 1,993,236 | | | | | | | | — | | | | | |
Japan | | | — | | | | 1,725,419 | | | | | | | | — | | | | | |
Mexico | | | 1,665,272 | | | | — | | | | | | | | — | | | | | |
New Zealand | | | — | | | | 926,920 | | | | | | | | — | | | | | |
Spain | | | — | | | | 3,342,553 | | | | | | | | — | | | | | |
United Kingdom | | | — | | | | 2,747,082 | | | | | | | | — | | | | | |
United States | | | 37,172,139 | | | | — | | | | | | | | — | | | | | |
Preferred Stock | | | | | | | | | | | | | | | | | | | | |
United States | | | 646,646 | | | | — | | | | | | | | — | | | | | |
Short-Term Investment | | | | | | | | | | | | | | | | | | | | |
Unaffiliated Fund | | | 1,414,697 | | | | — | | | | | | | | — | | | | | |
| | | | | | | | | | | | | | | | | | | | |
Total | | $ | 45,406,402 | | | $ | 19,200,869 | | | | | | | | $— | | | | | |
| | | | | | | | | | | | |
Industry Classification:
The industry classification of investments and liabilities in excess of other assets shown as a percentage of net assets as of October 31, 2022 were as follows:
| | | | |
Electric Utilities | | | 19.9 | % |
Oil, Gas & Consumable Fuels | | | 19.0 | |
Multi-Utilities | | | 17.2 | |
Construction & Engineering | | | 9.6 | |
Transportation Infrastructure | | | 9.5 | |
Road & Rail | | | 7.9 | |
Equity Real Estate Investment Trusts (REITs) | | | 5.6 | |
Independent Power & Renewable Electricity Producers | | | 4.7 | |
| | | | |
Unaffiliated Fund | | | 2.2 | % |
Commercial Services & Supplies | | | 2.2 | |
Gas Utilities | | | 1.3 | |
Water Utilities | | | 1.0 | |
| | | | |
| |
| | | 100.1 | |
Liabilities in excess of other assets | | | (0.1 | ) |
| | | | |
| |
| | | 100.0 | % |
| | | | |
See Notes to Financial Statements.
16
Statement of Assets and Liabilities
as of October 31, 2022
| | | | |
| |
Assets | | | | |
| |
Unaffiliated investments (cost $60,618,413) | | $ | 64,607,271 | |
Foreign currency, at value (cost $10,394) | | | 10,385 | |
Tax reclaim receivable | | | 49,542 | |
Dividends receivable | | | 38,131 | |
Receivable for Fund shares sold | | | 31,445 | |
Prepaid expenses and other assets | | | 2,863 | |
| | | | |
Total Assets | | | 64,739,637 | |
| | | | |
| |
Liabilities | | | | |
| |
Payable for Fund shares purchased | | | 117,483 | |
Management fee payable | | | 32,147 | |
Audit fee payable | | | 28,001 | |
Accrued expenses and other liabilities | | | 24,055 | |
Custodian and accounting fees payable | | | 19,169 | |
Distribution fee payable | | | 4,885 | |
Affiliated transfer agent fee payable | | | 2,208 | |
Directors’ fees payable | | | 894 | |
| | | | |
Total Liabilities | | | 228,842 | |
| | | | |
| |
Net Assets | | $ | 64,510,795 | |
| | | | |
| | | | |
| | |
Net assets were comprised of: | | | | |
Common stock, at par | | $ | 45 | |
Paid-in capital in excess of par | | | 60,018,420 | |
Total distributable earnings (loss) | | | 4,492,330 | |
| | | | |
Net assets, October 31, 2022 | | $ | 64,510,795 | |
| | | | |
See Notes to Financial Statements.
PGIM Jennison Global Infrastructure Fund 17
Statement of Assets and Liabilities
as of October 31, 2022
| | | | | | |
Class A | | | | | | |
| | |
Net asset value and redemption price per share, ($8,806,116 ÷ 611,150 shares of common stock issued and outstanding) | | $ | 14.41 | | | |
Maximum sales charge (5.50% of offering price) | | | 0.84 | | | |
| | | | | | |
Maximum offering price to public | | $ | 15.25 | | | |
| | | | | | |
| | |
Class C | | | | | | |
| | |
Net asset value, offering price and redemption price per share, ($3,736,708 ÷ 263,816 shares of common stock issued and outstanding) | | $ | 14.16 | | | |
| | | | | | |
| | |
Class Z | | | | | | |
| | |
Net asset value, offering price and redemption price per share, ($26,049,026 ÷ 1,806,840 shares of common stock issued and outstanding) | | $ | 14.42 | | | |
| | | | | | |
| | |
Class R6 | | | | | | |
| | |
Net asset value, offering price and redemption price per share, ($25,918,945 ÷ 1,798,527 shares of common stock issued and outstanding) | | $ | 14.41 | | | |
| | | | | | |
See Notes to Financial Statements.
18
Statement of Operations
Year Ended October 31, 2022
| | | | |
Net Investment Income (Loss) | | | | |
| |
Income | | | | |
Unaffiliated dividend income (net of $94,253 foreign withholding tax) | | $ | 1,558,534 | |
Affiliated dividend income | | | 408 | |
Income from securities lending, net (including affiliated income of $15) | | | 155 | |
| | | | |
Total income | | | 1,559,097 | |
| | | | |
| |
Expenses | | | | |
Management fee | | | 629,118 | |
Distribution fee(a) | | | 68,313 | |
Transfer agent’s fees and expenses (including affiliated expense of $12,303)(a) | | | 60,850 | |
Custodian and accounting fees | | | 60,670 | |
Registration fees(a) | | | 43,888 | |
Audit fee | | | 28,000 | |
Legal fees and expenses | | | 21,548 | |
Shareholders’ reports | | | 17,173 | |
Directors’ fees | | | 10,321 | |
SEC registration fees | | | 979 | |
Miscellaneous | | | 32,815 | |
| | | | |
Total expenses | | | 973,675 | |
Less: Fee waiver and/or expense reimbursement(a) | | | (158,839 | ) |
Distribution fee waiver(a) | | | (4,139 | ) |
| | | | |
Net expenses | | | 810,697 | |
| | | | |
Net investment income (loss) | | | 748,400 | |
| | | | |
| |
Realized And Unrealized Gain (Loss)On Investment And Foreign Currency Transactions | | | | |
| |
Net realized gain (loss) on: | | | | |
Investment transactions (including affiliated of $83) | | | 761,162 | |
Foreign currency transactions | | | (25,977 | ) |
| | | | |
| | | 735,185 | |
| | | | |
Net change in unrealized appreciation (depreciation) on: | | | | |
Investments | | | (8,367,688 | ) |
Foreign currencies | | | (6,097 | ) |
| | | | |
| | | (8,373,785 | ) |
| | | | |
Net gain (loss) on investment and foreign currency transactions | | | (7,638,600 | ) |
| | | | |
Net Increase (Decrease) In Net Assets Resulting From Operations | | $ | (6,890,200 | ) |
| | | | |
| (a) | Class specific expenses and waivers were as follows: |
| | | | | | | | | | | | | | | | |
| | | Class A | | Class C | | Class Z | | Class R6 |
Distribution fee | | | 24,836 | | | | 43,477 | | | | — | | | | — | |
Transfer agent’s fees and expenses | | | 15,517 | | | | 6,052 | | | | 39,117 | | | | 164 | |
Registration fees | | | 11,215 | | | | 8,015 | | | | 13,202 | | | | 11,456 | |
Fee waiver and/or expense reimbursement | | | (28,746 | ) | | | (15,011 | ) | | | (80,173 | ) | | | (34,909 | ) |
Distribution fee waiver | | | (4,139 | ) | | | — | | | | — | | | | — | |
See Notes to Financial Statements.
PGIM Jennison Global Infrastructure Fund 19
Statements of Changes in Net Assets
| | | | | | | | |
| |
| |
| Year Ended
October 31, |
|
| | | | |
| | |
| | | 2022 | | | 2021 | |
| | |
Increase (Decrease) in Net Assets | | | | | | | | |
| | |
Operations | | | | | | | | |
Net investment income (loss) | | $ | 748,400 | | | $ | 341,007 | |
Net realized gain (loss) on investment and foreign currency transactions | | | 735,185 | | | | 3,940,874 | |
Net change in unrealized appreciation (depreciation) on investments and foreign currencies | | | (8,373,785 | ) | | | 5,696,932 | |
| | | | | | | | |
Net increase (decrease) in net assets resulting from operations | | | (6,890,200 | ) | | | 9,978,813 | |
| | | | | | | | |
| | |
Dividends and Distributions | | | | | | | | |
Distributions from distributable earnings | | | | | | | | |
Class A | | | (601,050 | ) | | | (43,709 | ) |
Class C | | | (299,687 | ) | | | (3,222 | ) |
Class Z | | | (2,030,688 | ) | | | (226,472 | ) |
Class R6 | | | (1,207,913 | ) | | | (113,926 | ) |
| | | | | | | | |
| | | (4,139,338 | ) | | | (387,329 | ) |
| | | | | | | | |
| | |
Fund share transactions (Net of share conversions) | | | | | | | | |
Net proceeds from shares sold | | | 31,402,800 | | | | 20,222,493 | |
Net asset value of shares issued in reinvestment of dividends and distributions | | | 4,134,256 | | | | 386,793 | |
Cost of shares purchased | | | (15,178,225 | ) | | | (10,006,347 | ) |
| | | | | | | | |
Net increase (decrease) in net assets from Fund share transactions | | | 20,358,831 | | | | 10,602,939 | |
| | | | | | | | |
Total increase (decrease) | | | 9,329,293 | | | | 20,194,423 | |
| | |
Net Assets: | | | | | | | | |
| | |
Beginning of year | | | 55,181,502 | | | | 34,987,079 | |
| | | | | | | | |
End of year | | $ | 64,510,795 | | | $ | 55,181,502 | |
| | | | | | | | |
See Notes to Financial Statements.
20
Financial Highlights
| | | | | | | | | | | | | | | | | | | | |
| | | | | | |
Class A Shares | | | | | | | | | | | | | | | | | | | | |
| | | Year Ended October 31, | |
| | | | | | |
| | | 2022 | | | 2021 | | | 2020 | | | 2019 | | | 2018 | |
| | | | | | |
Per Share Operating Performance(a): | | | | | | | | | | | | | | | | | | | | |
| | | | | | |
Net Asset Value, Beginning of Year | | | $17.15 | | | | $13.80 | | | | $14.66 | | | | $12.21 | | | | $13.05 | |
| | | | | | |
Income (loss) from investment operations: | | | | | | | | | | | | | | | | | | | | |
| | | | | | |
Net investment income (loss) | | | 0.14 | | | | 0.09 | | | | 0.14 | | | | 0.18 | | | | 0.16 | |
| | | | | | |
| Net realized and unrealized gain (loss) on investment and foreign currency transactions | | | (1.64 | ) | | | 3.36 | | | | (0.86 | ) | | | 2.49 | | | | (0.81 | ) |
| | | | | | |
Total from investment operations | | | (1.50 | ) | | | 3.45 | | | | (0.72 | ) | | | 2.67 | | | | (0.65 | ) |
| | | | | | |
Less Dividends and Distributions: | | | | | | | | | | | | | | | | | | | | |
| | | | | | |
Dividends from net investment income | | | (0.14 | ) | | | (0.10 | ) | | | (0.12 | ) | | | (0.21 | ) | | | (0.19 | ) |
| | | | | | |
Tax return of capital distributions | | | - | | | | - | | | | (0.02 | ) | | | (0.01 | ) | | | - | |
| | | | | | |
Distributions from net realized gains | | | (1.10 | ) | | | - | | | | - | | | | - | | | | - | |
| | | | | | |
Total dividends and distributions | | | (1.24 | ) | | | (0.10 | ) | | | (0.14 | ) | | | (0.22 | ) | | | (0.19 | ) |
| | | | | | |
Net asset value, end of year | | | $14.41 | | | | $17.15 | | | | $13.80 | | | | $14.66 | | | | $12.21 | |
| | | | | | |
Total Return(b): | | | (9.23 | )% | | | 25.04 | % | | | (4.93 | )% | | | 22.01 | % | | | (5.10 | )% |
| | | | | | |
| | | | | | | | | | | | | | | | | | | | | |
| | | | | | |
Ratios/Supplemental Data: | | | | | | | | | | | | | | | | | | | | |
| | | | | | |
Net assets, end of year (000) | | | $8,806 | | | | $8,153 | | | | $5,961 | | | | $7,637 | | | | $8,073 | |
| | | | | | |
Average net assets (000) | | | $8,278 | | | | $7,154 | | | | $6,859 | | | | $7,718 | | | | $10,218 | |
| | | | | | |
Ratios to average net assets(c): | | | | | | | | | | | | | | | | | | | | |
| | | | | | |
| Expenses after waivers and/or expense reimbursement | | | 1.50 | % | | | 1.50 | % | | | 1.50 | % | | | 1.50 | % | | | 1.50 | % |
| | | | | | |
| Expenses before waivers and/or expense reimbursement | | | 1.90 | % | | | 1.99 | % | | | 2.20 | % | | | 2.10 | % | | | 2.00 | % |
| | | | | | |
Net investment income (loss) | | | 0.92 | % | | | 0.55 | % | | | 0.95 | % | | | 1.34 | % | | | 1.21 | % |
| | | | | | |
Portfolio turnover rate(d) | | | 89 | % | | | 72 | % | | | 62 | % | | | 62 | % | | | 75 | % |
| (a) | Calculated based on average shares outstanding during the year. |
| (b) | Total return does not consider the effects of sales loads. Total return is calculated assuming a purchase of a share on the first day and a sale on the last day of each year reported and includes reinvestment of dividends and distributions, if any. Total returns may reflect adjustments to conform to GAAP. |
| (c) | Does not include expenses of the underlying funds in which the Fund invests. |
| (d) | The Fund’s portfolio turnover rate is calculated in accordance with regulatory requirements, without regard to transactions involving short-term investments, certain derivatives and in-kind transactions (if any). If such transactions were included, the Fund’s portfolio turnover rate may be higher. |
See Notes to Financial Statements.
PGIM Jennison Global Infrastructure Fund 21
Financial Highlights (continued)
| | | | | | | | | | | | | | | | | | | | |
| | | | | | |
Class C Shares | | | | | | | | | | | | | | | | | | | | |
| | | Year Ended October 31, | |
| | | | | | |
| | | 2022 | | | 2021 | | | 2020 | | | 2019 | | | 2018 | |
| | | | | | |
Per Share Operating Performance(a): | | | | | | | | | | | | | | | | | | | | |
| | | | | | |
Net Asset Value, Beginning of Year | | | $16.90 | | | | $13.63 | | | | $14.51 | | | | $12.12 | | | | $12.97 | |
| | | | | | |
Income (loss) from investment operations: | | | | | | | | | | | | | | | | | | | | |
| | | | | | |
Net investment income (loss) | | | 0.04 | | | | (0.03 | )(b) | | | 0.03 | | | | 0.08 | | | | 0.06 | |
| | | | | | |
| Net realized and unrealized gain (loss) on investment and foreign currency transactions | | | (1.63 | ) | | | 3.31 | | | | (0.84 | ) | | | 2.45 | | | | (0.81 | ) |
| | | | | | |
Total from investment operations | | | (1.59 | ) | | | 3.28 | | | | (0.81 | ) | | | 2.53 | | | | (0.75 | ) |
| | | | | | |
Less Dividends and Distributions: | | | | | | | | | | | | | | | | | | | | |
| | | | | | |
Dividends from net investment income | | | (0.05 | ) | | | (0.01 | ) | | | (0.05 | ) | | | (0.13 | ) | | | (0.10 | ) |
| | | | | | |
Tax return of capital distributions | | | - | | | | - | | | | (0.02 | ) | | | (0.01 | ) | | | - | |
| | | | | | |
Distributions from net realized gains | | | (1.10 | ) | | | - | | | | - | | | | - | | | | - | |
| | | | | | |
Total dividends and distributions | | | (1.15 | ) | | | (0.01 | ) | | | (0.07 | ) | | | (0.14 | ) | | | (0.10 | ) |
| | | | | | |
Net asset value, end of year | | | $14.16 | | | | $16.90 | | | | $13.63 | | | | $14.51 | | | | $12.12 | |
| | | | | | |
Total Return(c): | | | (9.91 | )% | | | 24.10 | % | | | (5.63 | )% | | | 21.01 | % | | | (5.82 | )% |
| | | | | | |
| | | | | | | | | | | | | | | | | | | | | |
| | | | | | |
Ratios/Supplemental Data: | | | | | | | | | | | | | | | | | | | | |
| | | | | | |
Net assets, end of year (000) | | | $3,737 | | | | $4,336 | | | | $3,242 | | | | $4,135 | | | | $4,162 | |
| | | | | | |
Average net assets (000) | | | $4,348 | | | | $3,720 | | | | $3,771 | | | | $4,131 | | | | $5,464 | |
| | | | | | |
Ratios to average net assets(d): | | | | | | | | | | | | | | | | | | | | |
| | | | | | |
| Expenses after waivers and/or expense reimbursement | | | 2.25 | % | | | 2.25 | % | | | 2.25 | % | | | 2.25 | % | | | 2.25 | % |
| | | | | | |
| Expenses before waivers and/or expense reimbursement | | | 2.60 | % | | | 2.79 | % | | | 3.05 | % | | | 2.90 | % | | | 2.81 | % |
| | | | | | |
Net investment income (loss) | | | 0.27 | % | | | (0.21 | )% | | | 0.21 | % | | | 0.59 | % | | | 0.48 | % |
| | | | | | |
Portfolio turnover rate(e) | | | 89 | % | | | 72 | % | | | 62 | % | | | 62 | % | | | 75 | % |
| (a) | Calculated based on average shares outstanding during the year. |
| (b) | The per share amount of net investment income (loss) does not directly correlate to the amounts reported in the Statement of Operations due to class specific expenses. |
| (c) | Total return does not consider the effects of sales loads. Total return is calculated assuming a purchase of a share on the first day and a sale on the last day of each year reported and includes reinvestment of dividends and distributions, if any. Total returns may reflect adjustments to conform to GAAP. |
| (d) | Does not include expenses of the underlying funds in which the Fund invests. |
| (e) | The Fund’s portfolio turnover rate is calculated in accordance with regulatory requirements, without regard to transactions involving short-term investments, certain derivatives and in-kind transactions (if any). If such transactions were included, the Fund’s portfolio turnover rate may be higher. |
See Notes to Financial Statements.
22
| | | | | | | | | | | | | | | | | | | | |
| | | | | | |
Class Z Shares | | | | | | | | | | | | | | | | | | | | |
| | | Year Ended October 31, | |
| | | | | | |
| | | 2022 | | | 2021 | | | 2020 | | | 2019 | | | 2018 | |
| | | | | | |
Per Share Operating Performance(a): | | | | | | | | | | | | | | | | | | | | |
| | | | | | |
Net Asset Value, Beginning of Year | | | $17.16 | | | | $13.80 | | | | $14.66 | | | | $12.21 | | | | $13.06 | |
| | | | | | |
Income (loss) from investment operations: | | | | | | | | | | | | | | | | | | | | |
| | | | | | |
Net investment income (loss) | | | 0.20 | | | | 0.14 | | | | 0.18 | | | | 0.23 | | | | 0.19 | |
| | | | | | |
| Net realized and unrealized gain (loss) on investment and foreign currency transactions | | | (1.65 | ) | | | 3.37 | | | | (0.85 | ) | | | 2.48 | | | | (0.82 | ) |
| | | | | | |
Total from investment operations | | | (1.45 | ) | | | 3.51 | | | | (0.67 | ) | | | 2.71 | | | | (0.63 | ) |
| | | | | | |
Less Dividends and Distributions: | | | | | | | | | | | | | | | | | | | | |
| | | | | | |
Dividends from net investment income | | | (0.19 | ) | | | (0.15 | ) | | | (0.17 | ) | | | (0.25 | ) | | | (0.22 | ) |
| | | | | | |
Tax return of capital distributions | | | - | | | | - | | | | (0.02 | ) | | | (0.01 | ) | | | - | |
| | | | | | |
Distributions from net realized gains | | | (1.10 | ) | | | - | | | | - | | | | - | | | | - | |
| | | | | | |
Total dividends and distributions | | | (1.29 | ) | | | (0.15 | ) | | | (0.19 | ) | | | (0.26 | ) | | | (0.22 | ) |
| | | | | | |
Net asset value, end of year | | | $14.42 | | | | $17.16 | | | | $13.80 | | | | $14.66 | | | | $12.21 | |
| | | | | | |
Total Return(b): | | | (8.93 | )% | | | 25.42 | % | | | (4.56 | )% | | | 22.30 | % | | | (4.94 | )% |
| | | | | | |
| | | | | | | | | | | | | | | | | | | | | |
| | | | | | |
Ratios/Supplemental Data: | | | | | | | | | | | | | | | | | | | | |
| | | | | | |
Net assets, end of year (000) | | | $26,049 | | | | $25,429 | | | | $20,148 | | | | $21,868 | | | | $23,074 | |
| | | | | | |
Average net assets (000) | | | $27,109 | | | | $24,462 | | | | $21,048 | | | | $21,608 | | | | $27,549 | |
| | | | | | |
Ratios to average net assets(c): | | | | | | | | | | | | | | | | | | | | |
| | | | | | |
| Expenses after waivers and/or expense reimbursement | | | 1.17 | % | | | 1.17 | % | | | 1.17 | % | | | 1.17 | % | | | 1.25 | % |
| | | | | | |
| Expenses before waivers and/or expense reimbursement | | | 1.47 | % | | | 1.55 | % | | | 1.66 | % | | | 1.57 | % | | | 1.52 | % |
| | | | | | |
Net investment income (loss) | | | 1.29 | % | | | 0.92 | % | | | 1.25 | % | | | 1.66 | % | | | 1.45 | % |
| | | | | | |
Portfolio turnover rate(d) | | | 89 | % | | | 72 | % | | | 62 | % | | | 62 | % | | | 75 | % |
| (a) | Calculated based on average shares outstanding during the year. |
| (b) | Total return is calculated assuming a purchase of a share on the first day and a sale on the last day of each year reported and includes reinvestment of dividends and distributions, if any. Total returns may reflect adjustments to conform to GAAP. |
| (c) | Does not include expenses of the underlying funds in which the Fund invests. |
| (d) | The Fund’s portfolio turnover rate is calculated in accordance with regulatory requirements, without regard to transactions involving short-term investments, certain derivatives and in-kind transactions (if any). If such transactions were included, the Fund’s portfolio turnover rate may be higher. |
See Notes to Financial Statements.
PGIM Jennison Global Infrastructure Fund 23
Financial Highlights (continued)
| | | | | | | | | | | | | | | | | | | | |
| | | | | | |
Class R6 Shares | | | | | | | | | | | | | | | | | | | | |
| | | Year Ended October 31, | |
| | | | | | |
| | | 2022 | | | 2021 | | | 2020 | | | 2019 | | | 2018 | |
| | | | | | |
Per Share Operating Performance(a): | | | | | | | | | | | | | | | | | | | | |
| | | | | | |
Net Asset Value, Beginning of Year | | | $17.15 | | | | $13.80 | | | | $14.66 | | | | $12.21 | | | | $13.06 | |
| | | | | | |
Income (loss) from investment operations: | | | | | | | | | | | | | | | | | | | | |
| | | | | | |
Net investment income (loss) | | | 0.21 | | | | 0.12 | | | | 0.18 | | | | 0.23 | | | | 0.18 | |
| | | | | | |
| Net realized and unrealized gain (loss) on investment and foreign currency transactions | | | (1.66 | ) | | | 3.38 | | | | (0.85 | ) | | | 2.48 | | | | (0.81 | ) |
| | | | | | |
Total from investment operations | | | (1.45 | ) | | | 3.50 | | | | (0.67 | ) | | | 2.71 | | | | (0.63 | ) |
| | | | | | |
Less Dividends and Distributions: | | | | | | | | | | | | | | | | | | | | |
| | | | | | |
Dividends from net investment income | | | (0.19 | ) | | | (0.15 | ) | | | (0.17 | ) | | | (0.25 | ) | | | (0.22 | ) |
| | | | | | |
Tax return of capital distributions | | | - | | | | - | | | | (0.02 | ) | | | (0.01 | ) | | | - | |
| | | | | | |
Distributions from net realized gains | | | (1.10 | ) | | | - | | | | - | | | | - | | | | - | |
| | | | | | |
Total dividends and distributions | | | (1.29 | ) | | | (0.15 | ) | | | (0.19 | ) | | | (0.26 | ) | | | (0.22 | ) |
| | | | | | |
Net asset value, end of year | | | $14.41 | | | | $17.15 | | | | $13.80 | | | | $14.66 | | | | $12.21 | |
| | | | | | |
Total Return(b): | | | (8.93 | )% | | | 25.44 | % | | | (4.62 | )% | | | 22.40 | % | | | (4.94 | )% |
| | | | | | |
| | | | | | | | | | | | | | | | | | | | | |
| | | | | | |
Ratios/Supplemental Data: | | | | | | | | | | | | | | | | | | | | |
| | | | | | |
Net assets, end of year (000) | | | $25,919 | | | | $17,263 | | | | $5,636 | | | | $11,954 | | | | $13,912 | |
| | | | | | |
Average net assets (000) | | | $23,177 | | | | $11,389 | | | | $8,565 | | | | $13,787 | | | | $17,657 | |
| | | | | | |
Ratios to average net assets(c): | | | | | | | | | | | | | | | | | | | | |
| | | | | | |
| Expenses after waivers and/or expense reimbursement | | | 1.17 | % | | | 1.17 | % | | | 1.17 | % | | | 1.17 | % | | | 1.25 | % |
| | | | | | |
| Expenses before waivers and/or expense reimbursement | | | 1.32 | % | | | 1.40 | % | | | 1.66 | % | | | 1.48 | % | | | 1.44 | % |
| | | | | | |
Net investment income (loss) | | | 1.34 | % | | | 0.74 | % | | | 1.28 | % | | | 1.70 | % | | | 1.39 | % |
| | | | | | |
Portfolio turnover rate(d) | | | 89 | % | | | 72 | % | | | 62 | % | | | 62 | % | | | 75 | % |
| (a) | Calculated based on average shares outstanding during the year. |
| (b) | Total return is calculated assuming a purchase of a share on the first day and a sale on the last day of each year reported and includes reinvestment of dividends and distributions, if any. Total returns may reflect adjustments to conform to GAAP. |
| (c) | Does not include expenses of the underlying funds in which the Fund invests. |
| (d) | The Fund’s portfolio turnover rate is calculated in accordance with regulatory requirements, without regard to transactions involving short-term investments, certain derivatives and in-kind transactions (if any). If such transactions were included, the Fund’s portfolio turnover rate may be higher. |
See Notes to Financial Statements.
24
Notes to Financial Statements
Prudential World Fund, Inc. (the “Registered Investment Company” or “RIC”) is registered under the Investment Company Act of 1940, as amended (“1940 Act”), as an open-end management investment company. The RIC is organized as a Maryland Corporation. These financial statements relate only to the PGIM Jennison Global Infrastructure Fund (the “Fund”), a series of the RIC. The Fund is classified as a diversified fund for purposes of the 1940 Act.
The investment objective of the Fund is to seek total return.
The Fund follows the investment company accounting and reporting guidance of the Financial Accounting Standards Board (“FASB”) Accounting Standard Codification (“ASC”) Topic 946 Financial Services — Investment Companies. The following is a summary of significant accounting policies followed by the Fund in the preparation of its financial statements. The policies conform to U.S. generally accepted accounting principles (“GAAP”). The Fund consistently follows such policies in the preparation of its financial statements.
Securities Valuation: The Fund holds securities and other assets and liabilities that are fair valued as of the close of each day (generally, 4:00 PM Eastern time) the New York Stock Exchange (“NYSE”) is open for trading. As described in further detail below, the Fund’s investments are valued daily based on a number of factors, including the type of investment and whether market quotations are readily available. The RIC’s Board of Directors (the “Board”) has approved the Fund’s valuation policies and procedures for security valuation and designated to PGIM Investments LLC (“PGIM Investments” or the “Manager”) as the Valuation Designee pursuant to SEC Rule 2a-5(b) to perform the fair value determination relating to all Fund investments. Pursuant to the Board’s oversight, the Valuation Designee has established a Valuation Committee to perform the duties and responsibilities as valuation designee under SEC Rule 2a-5. The valuation procedures permit the Fund to utilize independent pricing vendor services, quotations from market makers, and alternative valuation methods when market quotations are either not readily available or not deemed representative of fair value. Fair value is the price that would be received to sell an asset or paid to transfer a liability in an orderly transaction between market participants on the measurement date. A record of the Valuation Committee’s actions is provided to the Board at the first quarterly meeting following the quarter in which such actions take place.
For the fiscal reporting year-end, securities and other assets and liabilities were fair valued at the close of the last U.S. business day. Trading in certain foreign securities may occur when the NYSE is closed (including weekends and holidays). Because such foreign securities
PGIM Jennison Global Infrastructure Fund 25
Notes to Financial Statements (continued)
trade in markets that are open on weekends and U.S. holidays, the values of some of the Fund’s foreign investments may change on days when investors cannot purchase or redeem Fund shares.
Various inputs determine how the Fund’s investments are valued, all of which are categorized according to the three broad levels (Level 1, 2, or 3) detailed in the Schedule of Investments and referred to herein as the “fair value hierarchy” in accordance with FASB ASC Topic 820 - Fair Value Measurement.
Common or preferred stocks, exchange-traded funds and derivative instruments, if applicable, that are traded on a national securities exchange are valued at the last sale price as of the close of trading on the applicable exchange where the security principally trades. Securities traded via NASDAQ are valued at the NASDAQ official closing price. To the extent these securities are valued at the last sale price or NASDAQ official closing price, they are classified as Level 1 in the fair value hierarchy. In the event that no sale or official closing price on valuation date exists, these securities are generally valued at the mean between the last reported bid and ask prices, or at the last bid price in the absence of an ask price. These securities are classified as Level 2 in the fair value hierarchy.
Foreign equities traded on foreign securities exchanges are generally valued using pricing vendor services that provide model prices derived using adjustment factors based on information such as local closing price, relevant general and sector indices, currency fluctuations, depositary receipts, and futures, as applicable. Securities valued using such model prices are classified as Level 2 in the fair value hierarchy. The models generate an evaluated adjustment factor for each security, which is applied to the local closing price to adjust it for post closing market movements up to the time the Fund is valued. Utilizing that evaluated adjustment factor, the vendor provides an evaluated price for each security. If the vendor does not provide an evaluated price, securities are valued in accordance with exchange-traded common and preferred stock valuation policies discussed above.
Investments in open-end funds (other than exchange-traded funds) are valued at their net asset values as of the close of the NYSE on the date of valuation. These securities are classified as Level 1 in the fair value hierarchy since they may be purchased or sold at their net asset values on the date of valuation.
Securities and other assets that cannot be priced according to the methods described above are valued based on policies and procedures approved by the Board. In the event that unobservable inputs are used when determining such valuations, the securities will be classified as Level 3 in the fair value hierarchy. Altering one or more unobservable inputs may result in a significant change to a Level 3 security’s fair value measurement.
26
When determining the fair value of securities, some of the factors influencing the valuation include: the nature of any restrictions on disposition of the securities; assessment of the general liquidity of the securities; the issuer’s financial condition and the markets in which it does business; the cost of the investment; the size of the holding and the capitalization of the issuer; the prices of any recent transactions or bids/offers for such securities or any comparable securities; any available analyst media or other reports or information deemed reliable by the Valuation Designee regarding the issuer or the markets or industry in which it operates. Using fair value to price securities may result in a value that is different from a security’s most recent closing price and from the price used by other unaffiliated mutual funds to calculate their net asset values.
Foreign Currency Translation: The books and records of the Fund are maintained in U.S. dollars. Foreign currency amounts are translated into U.S. dollars on the following basis:
(i) market value of investment securities, other assets and liabilities — at the exchange rate as of the valuation date;
(ii) purchases and sales of investment securities, income and expenses — at the rates of exchange prevailing on the respective dates of such transactions.
Although the net assets of the Fund are presented at the foreign exchange rates and market values at the close of the period, the Fund does not generally isolate that portion of the results of operations arising as a result of changes in the foreign exchange rates from the fluctuations arising from changes in the market prices of long-term portfolio securities held at the end of the period. Similarly, the Fund does not isolate the effect of changes in foreign exchange rates from the fluctuations arising from changes in the market prices of long-term portfolio securities sold during the period. Accordingly, holding period unrealized and realized foreign currency gains (losses) are included in the reported net change in unrealized appreciation (depreciation) on investments and net realized gains (losses) on investment transactions on the Statements of Operations.
Net realized gains (losses) on foreign currency transactions represent net foreign exchange gains (losses)from the disposition of holdings of foreign currencies, currency gains (losses) realized between the trade and settlement dates on investment transactions, and the difference between the amounts of interest, dividends and foreign withholding taxes recorded on the Fund’s books and the U.S. dollar equivalent amounts actually received or paid. Net unrealized currency gains (losses) arise from valuing foreign currency denominated assets and liabilities (other than investments) at period end exchange rates.
Master Netting Arrangements: The RIC, on behalf of the Fund, is subject to various Master Agreements, or netting arrangements, with select counterparties. These are agreements which a subadviser may have negotiated and entered into on behalf of all or a portion of the Fund. A master netting arrangement between the Fund and the counterparty permits the Fund to offset amounts payable by the Fund to the same counterparty against amounts to be received; and by the receipt of collateral from the counterparty by the Fund to cover the
PGIM Jennison Global Infrastructure Fund 27
Notes to Financial Statements (continued)
Fund’s exposure to the counterparty. However, there is no assurance that such mitigating factors are easily enforceable. In addition to master netting arrangements, the right to set-off exists when all the conditions are met such that each of the parties owes the other determinable amounts, the reporting party has the right to set-off the amount owed with the amount owed by the other party, the reporting party intends to set-off and the right of set-off is enforceable by law.
Securities Lending: The Fund lends its portfolio securities to banks and broker-dealers. The loans are secured by collateral at least equal to the market value of the securities loaned. Collateral pledged by each borrower is invested in an affiliated money market fund and is marked to market daily, based on the previous day’s market value, such that the value of the collateral exceeds the value of the loaned securities. In the event of significant appreciation in value of securities on loan on the last business day of the reporting period, the financial statements may reflect a collateral value that is less than the market value of the loaned securities. Such shortfall is remedied as described above. Loans are subject to termination at the option of the borrower or the Fund. Upon termination of the loan, the borrower will return to the Fund securities identical to the loaned securities. The remaining open loans of the securities lending transactions are considered overnight and continuous. Should the borrower of the securities fail financially, the Fund has the right to repurchase the securities in the open market using the collateral.
The Fund recognizes income, net of any rebate and securities lending agent fees, for lending its securities in the form of fees or interest on the investment of any cash received as collateral. The borrower receives all interest and dividends from the securities loaned and such payments are passed back to the lender in amounts equivalent thereto, which are reflected in interest income or unaffiliated dividend income based on the nature of the payment on the Statement of Operations. The Fund also continues to recognize any unrealized gain (loss) in the market price of the securities loaned and on the change in the value of the collateral invested that may occur during the term of the loan. In addition, realized gain (loss) is recognized on changes in the value of the collateral invested upon liquidation of the collateral. Net earnings from securities lending are disclosed in the Statement of Operations.
Equity and Mortgage Real Estate Investment Trusts (collectively REITs): The Fund invested in REITs, which report information on the source of their distributions annually. Based on current and historical information, a portion of distributions received from REITs during the period is estimated to be dividend income, capital gain or return of capital and recorded accordingly. When material, these estimates are adjusted periodically when the actual source of distributions is disclosed by the REITs.
28
Securities Transactions and Net Investment Income: Securities transactions are recorded on the trade date. Realized gains (losses) from investment and currency transactions are calculated on the specific identification method. Dividend income is recorded on the ex-date, or for certain foreign securities, when the Fund becomes aware of such dividends. Expenses are recorded on an accrual basis, which may require the use of certain estimates by management that may differ from actual. Net investment income or loss (other than class specific expenses and waivers, which are allocated as noted below) and unrealized and realized gains (losses) are allocated daily to each class of shares based upon the relative proportion of adjusted net assets of each class at the beginning of the day. Class specific expenses and waivers, where applicable, are charged to the respective share classes. Such class specific expenses and waivers include distribution fees and distribution fee waivers, shareholder servicing fees, transfer agent’s fees and expenses, registration fees and fee waivers and/or expense reimbursements, as applicable.
Taxes: It is the Fund’s policy to continue to meet the requirements of the Internal Revenue Code applicable to regulated investment companies and to distribute all of its taxable net investment income and capital gains, if any, to its shareholders. Therefore, no federal income tax provision is required. Withholding taxes on foreign dividends, interest and capital gains, if any, are recorded, net of reclaimable amounts, at the time the related income is earned.
Dividends and Distributions: Dividends and distributions to shareholders, which are determined in accordance with federal income tax regulations and which may differ from GAAP, are recorded on the ex-date. Permanent book/tax differences relating to income and gain (loss) are reclassified between total distributable earnings (loss) and paid-in capital in excess of par, as appropriate. The chart below sets forth the expected frequency of dividend and capital gains distributions to shareholders. Various factors may impact the frequency of dividend distributions to shareholders, including but not limited to adverse market conditions or portfolio holding-specific events.
| | |
| | |
| Expected Distribution Schedule to Shareholders* | | Frequency |
| |
Net Investment Income | | Quarterly |
| |
Short-Term Capital Gains | | Annually |
| |
Long-Term Capital Gains | | Annually |
| * | Under certain circumstances, the Fund may make more than one distribution of short-term and/or long-term capital gains during a fiscal year. |
Estimates: The preparation of financial statements requires management to make estimates and assumptions that affect the reported amounts and disclosures in the financial statements. Actual results could differ from those estimates.
PGIM Jennison Global Infrastructure Fund 29
Notes to Financial Statements (continued)
The RIC, on behalf of the Fund, has a management agreement with the Manager pursuant to which it has responsibility for all investment advisory services and supervises the subadviser’s performance of such services, and pursuant to which it renders administrative services.
The Manager has entered into a subadvisory agreement with Jennison Associates LLC (“Jennison” or the “subadviser”). The Manager pays for the services of Jennison.
Fees payable under the management agreement are computed daily and paid monthly. For the reporting period ended October 31, 2022, the contractual and effective management fee rates were as follows:
| | |
| | |
Contractual Management Rate | | Effective Management Fee, before any waivers and/or expense reimbursements |
| |
1.00% of average daily net assets up to $1 billion; | | 1.00% |
| |
0.98% of average daily net assets from $1 billion to $3 billion; | | |
| |
0.96% of average daily net assets from $3 billion to $5 billion; | | |
| |
0.95% of average daily net assets from $5 billion to $10 billion; | | |
| |
0.94% of average daily net assets over $10 billion | | |
The Manager has contractually agreed, through February 29, 2024, to limit total annual operating expenses after fee waivers and/or expense reimbursements. This contractual waiver excludes interest, brokerage, taxes (such as income and foreign withholding taxes, stamp duty and deferred tax expenses), acquired fund fees and expenses, extraordinary expenses, and certain other Fund expenses such as dividend and interest expense and broker charges on short sales.
Where applicable, the Manager agrees to waive management fees or shared operating expenses on any share class to the same extent that it waives similar expenses on any other share class. In addition, total annual operating expenses for Class R6 shares will not exceed total annual operating expenses for Class Z shares. Fees and/or expenses waived and/or reimbursed by the Manager for the purpose of preventing the expenses from exceeding a certain expense ratio limit may be recouped by the Manager within the same fiscal year during which such waiver and/or reimbursement is made if such recoupment can be
30
realized without exceeding the expense limit in effect at the time of the recoupment for the fiscal year. The expense limitations attributable to each class are as follows:
| | | | |
| | |
| Class | | Expense
Limitations |
| |
A | | | 1.50 | % |
| |
C | | | 2.25 | |
| |
Z | | | 1.17 | |
| |
R6 | | | 1.17 | |
The RIC, on behalf of the Fund, has a distribution agreement with Prudential Investment Management Services LLC (“PIMS”), which acts as the distributor of the Class A, Class C, Class Z and Class R6 shares of the Fund. The Fund compensates PIMS for distributing and servicing the Fund’s Class A and Class C shares, pursuant to the plans of distribution (the “Distribution Plans”), regardless of expenses actually incurred by PIMS.
Pursuant to the Distribution Plans, the Fund compensates PIMS for distribution related activities at an annual rate based on average daily net assets per class. PIMS has contractually agreed through February 29, 2024 to limit such fees on certain classes based on the daily net assets. The distribution fees are accrued daily and payable monthly.
The Fund’s annual gross and net distribution rate, where applicable, are as follows:
| | | | |
| | | |
Class | | Gross Distribution Fee | | Net Distribution Fee |
| | |
A | | 0.30% | | 0.25% |
| | |
C | | 1.00 | | 1.00 |
| | |
Z | | N/A | | N/A |
| | |
R6 | | N/A | | N/A |
For the year ended October 31, 2022, PIMS received front-end sales charges (“FESL”) resulting from sales of certain class shares and contingent deferred sales charges (“CDSC”) imposed upon redemptions by certain shareholders. From these fees, PIMS paid such sales charges to broker-dealers, who in turn paid commissions to salespersons and incurred other distribution costs. The sales charges are as follows where applicable:
| | | | | | | | |
| | | |
| Class | | FESL | | CDSC |
| | |
A | | $ | 12,457 | | | | $ — | |
| | |
C | | | — | | | | 404 | |
PGIM Investments, PIMS and Jennison are indirect, wholly-owned subsidiaries of Prudential Financial, Inc. (“Prudential”).
| 4. | Other Transactions with Affiliates |
Prudential Mutual Fund Services LLC (“PMFS”), an affiliate of PGIM Investments and an indirect, wholly-owned subsidiary of Prudential, serves as the Fund’s transfer agent and shareholder servicing agent. Transfer agent’s fees and expenses in the Statement of Operations include certain out-of-pocket expenses paid to non-affiliates, where applicable.
PGIM Jennison Global Infrastructure Fund 31
Notes to Financial Statements (continued)
The Fund may invest its overnight sweep cash in the PGIM Core Ultra Short Bond Fund (the “Core Fund”), and its securities lending cash collateral in the PGIM Institutional Money Market Fund (the “Money Market Fund”), each a fund of Prudential Investment Portfolios 2, registered under the 1940 Act and managed by PGIM Investments. PGIM Investments and/or its affiliates are paid fees or reimbursed for providing their services to the Core Fund. In addition to the realized and unrealized gains on investments in the Core Fund and Money Market Fund, earnings from such investments are disclosed on the Statement of Operations as “Affiliated dividend income” and “Income from securities lending, net”, respectively. Effective January 2022, the Fund changed its overnight cash sweep vehicle from the Core Fund to an unaffiliated money market fund.
The Fund may enter into certain securities purchase or sale transactions under Board approved Rule 17a-7 procedures. Rule 17a-7 is an exemptive rule under the 1940 Act, that subject to certain conditions, permits purchase and sale transactions among affiliated investment companies, or between an investment company and a person that is affiliated solely by reason of having a common (or affiliated) investment adviser, common directors/trustees, and/or common officers. For the year ended October 31, 2022, no 17a-7 transactions were entered into by the Fund.
The aggregate cost of purchases and proceeds from sales of portfolio securities (excluding short-term investments and U.S. Government securities) for the reporting period ended October 31, 2022, were as follows:
| | |
| | |
Cost of Purchases | | Proceeds from Sales |
| |
$70,383,687 | | $53,857,511 |
A summary of the cost of purchases and proceeds from sales of shares of affiliated mutual funds for the year ended October 31, 2022, is presented as follows:
| | | | | | | | | | | | | | |
| | | | | | | | |
Value,
Beginning
of Year | | Cost of Purchases | | Proceeds from Sales | | Change in Unrealized
Gain
(Loss) | | Realized Gain
(Loss) | | Value, End of Year | | Shares,
End of Year | | Income |
| | |
Short-Term Investments - Affiliated Mutual Funds: | | | | |
| | | |
PGIM Core Ultra Short Bond Fund(1)(wa) | | | | | | |
| | | | | | | |
$956,348 | | $5,817,008 | | $6,773,356 | | $— | | $— | | $— | | — | | $408 |
32
| | | | | | | | | | | | | | | | |
| | | | | | | | |
Value,
Beginning
of Year | | Cost of
Purchases | | Proceeds
from Sales | | Change in
Unrealized
Gain
(Loss) | | Realized
Gain
(Loss) | | Value,
End of Year | | Shares,
End of Year | | Income |
| | |
PGIM Institutional Money Market Fund(1)(b)(wa) | | | | | | |
$ — | | $1,747,820 | | $1,747,903 | | $— | | $83 | | $— | | — | | $ | 15 | (2) |
$956,348 | | $7,564,828 | | $8,521,259 | | $— | | $83 | | $— | | | | $ | 423 | |
| (1) | The Fund did not have any capital gain distributions during the reporting period. |
| (2) | The amount, or a portion thereof, represents the affiliated securities lending income shown on the Statement of Operations. |
| (b) | Represents security, or portion thereof, purchased with cash collateral received for securities on loan and includes dividend reinvestment. |
| (wa) | PGIM Investments LLC, the manager of the Fund, also serves as manager of the PGIM Core Ultra Short Bond Fund and PGIM Institutional Money Market Fund, if applicable. |
| 6. | Distributions and Tax Information |
Distributions to shareholders, which are determined in accordance with federal income tax regulations and which may differ from GAAP, are recorded on the ex-date.
For the year ended October 31, 2022, the tax character of dividends paid by the Fund were $722,423 of ordinary income and $3,416,915 of long-term capital gains. For the year ended October 31, 2021, the tax character of dividends paid by the Fund were $338,070 of ordinary income and $49,259 of long-term capital gains.
As of October 31, 2022, the accumulated undistributed earnings on a tax basis was $1,072,819 of long-term capital gains.
The United States federal income tax basis of the Fund’s investments and the net unrealized appreciation as of October 31, 2022 were as follows:
| | | | | | |
| | | | |
| Tax Basis | | Gross Unrealized Appreciation | | Gross Unrealized Depreciation | | Net
Unrealized Appreciation |
| | | |
| $61,187,760 | | $8,361,324 | | $(4,941,813) | | $3,419,511 |
The difference between GAAP and tax basis was primarily due to deferred losses on wash sales.
The Manager has analyzed the Fund’s tax positions taken on federal, state and local income tax returns for all open tax years and has concluded that no provision for income tax is required in the Fund’s financial statements for the current reporting period. Since tax authorities can examine previously filed tax returns, the Fund’s U.S. federal and state tax returns for each of the four fiscal years up to the most recent fiscal year ended October 31, 2022 are subject to such review.
PGIM Jennison Global Infrastructure Fund 33
Notes to Financial Statements (continued)
The Fund offers Class A, Class C, Class Z and Class R6 shares. Class A shares are sold with a maximum front-end sales charge of 5.50%. Investors who purchase $1 million or more of Class A shares and sell these shares within 12 months of purchase are subject to a CDSC of 1%, although they are not subject to an initial sales charge. The Class A CDSC is waived for certain retirement and/or benefit plans. A special exchange privilege is also available for shareholders who qualified to purchase Class A shares at net asset value. Class C shares are sold with a CDSC of 1% on sales made within 12 months of purchase. Class C shares will automatically convert to Class A shares on a monthly basis approximately eight years (ten years prior to January 22, 2021) after purchase. Class Z and Class R6 shares are not subject to any sales or redemption charges and are available exclusively for sale to a limited group of investors.
Under certain circumstances, an exchange may be made from specified share classes of the Fund to one or more other share classes of the Fund as presented in the table of transactions in shares of common stock, below.
The RIC is authorized to issue 10,225,000,000 shares of common stock, $0.00001 par value per share, 510,000,000 of which are designated as shares of the Fund. The authorized shares of the Fund are currently classified and designated as follows:
| | |
| | |
Class | | Number of Shares |
| |
A | | 20,000,000 |
| |
C | | 100,000,000 |
| |
Z | | 150,000,000 |
| |
T | | 115,000,000 |
| |
R6 | | 125,000,000 |
The Fund currently does not have any Class T shares outstanding.
As of October 31, 2022, Prudential, through its affiliated entities, including affiliated funds (if applicable), owned shares of the Fund as follows:
| | | | |
| | | |
Class | | Number of Shares | | Percentage of Outstanding Shares |
| | |
Z | | 609,122 | | 33.7% |
| | |
R6 | | 1,386,393 | | 77.1 |
At the reporting period end, the number of shareholders holding greater than 5% of the Fund are as follows:
| | | | |
| | | |
| | | Number of Shareholders | | Percentage of Outstanding Shares |
| | |
Affiliated | | 2 | | 44.6% |
| | |
Unaffiliated | | 4 | | 44.9 |
34
Transactions in shares of common stock were as follows:
| | | | | | | | |
| | | |
Share Class | | | Shares | | | | Amount | |
| | |
Class A | | | | | | | | |
| | |
Year ended October 31, 2022: | | | | | | | | |
| | |
Shares sold | | | 117,154 | | | $ | 1,830,512 | |
| | |
Shares issued in reinvestment of dividends and distributions | | | 38,277 | | | | 596,146 | |
| | |
Shares purchased | | | (62,851 | ) | | | (942,436 | ) |
| | |
Net increase (decrease) in shares outstanding before conversion | | | 92,580 | | | | 1,484,222 | |
| | |
Shares issued upon conversion from other share class(es) | | | 46,493 | | | | 722,259 | |
| | |
Shares purchased upon conversion into other share class(es) | | | (3,405 | ) | | | (56,034 | ) |
| | |
Net increase (decrease) in shares outstanding | | | 135,668 | | | $ | 2,150,447 | |
| | |
Year ended October 31, 2021: | | | | | | | | |
| | |
Shares sold | | | 89,522 | | | $ | 1,405,312 | |
| | |
Shares issued in reinvestment of dividends and distributions | | | 2,766 | | | | 43,504 | |
| | |
Shares purchased | | | (57,473 | ) | | | (897,912 | ) |
| | |
Net increase (decrease) in shares outstanding before conversion | | | 34,815 | | | | 550,904 | |
| | |
Shares issued upon conversion from other share class(es) | | | 10,887 | | | | 171,733 | |
| | |
Shares purchased upon conversion into other share class(es) | | | (2,205 | ) | | | (36,384 | ) |
| | |
Net increase (decrease) in shares outstanding | | | 43,497 | | | $ | 686,253 | |
| | |
Class C | | | | | | | | |
| | |
Year ended October 31, 2022: | | | | | | | | |
| | |
Shares sold | | | 64,812 | | | $ | 1,012,615 | |
| | |
Shares issued in reinvestment of dividends and distributions | | | 19,470 | | | | 299,687 | |
| | |
Shares purchased | | | (27,936 | ) | | | (415,935 | ) |
| | |
Net increase (decrease) in shares outstanding before conversion | | | 56,346 | | | | 896,367 | |
| | |
Shares purchased upon conversion into other share class(es) | | | (49,043 | ) | | | (750,462 | ) |
| | |
Net increase (decrease) in shares outstanding | | | 7,303 | | | $ | 145,905 | |
| | |
Year ended October 31, 2021: | | | | | | | | |
| | |
Shares sold | | | 66,892 | | | $ | 1,050,863 | |
| | |
Shares issued in reinvestment of dividends and distributions | | | 202 | | | | 3,137 | |
| | |
Shares purchased | | | (30,598 | ) | | | (473,603 | ) |
| | |
Net increase (decrease) in shares outstanding before conversion | | | 36,496 | | | | 580,397 | |
| | |
Shares purchased upon conversion into other share class(es) | | | (17,810 | ) | | | (276,678 | ) |
| | |
Net increase (decrease) in shares outstanding | | | 18,686 | | | $ | 303,719 | |
| | |
Class Z | | | | | | | | |
| | |
Year ended October 31, 2022: | | | | | | | | |
| | |
Shares sold | | | 582,073 | | | $ | 9,297,231 | |
| | |
Shares issued in reinvestment of dividends and distributions | | | 130,725 | | | | 2,030,510 | |
| | |
Shares purchased | | | (393,341 | ) | | | (6,166,300 | ) |
| | |
Net increase (decrease) in shares outstanding before conversion | | | 319,457 | | | | 5,161,441 | |
| | |
Shares issued upon conversion from other share class(es) | | | 5,155 | | | | 84,237 | |
| | |
Net increase (decrease) in shares outstanding | | | 324,612 | | | $ | 5,245,678 | |
PGIM Jennison Global Infrastructure Fund 35
Notes to Financial Statements (continued)
| | | | | | | | |
| | | |
Share Class | | | Shares | | | | Amount | |
| | |
Year ended October 31, 2021: | | | | | | | | |
| | |
Shares sold | | | 582,606 | | | $ | 8,944,074 | |
| | |
Shares issued in reinvestment of dividends and distributions | | | 14,369 | | | | 226,226 | |
| | |
Shares purchased | | | (436,186 | ) | | | (6,746,807 | ) |
| | |
Net increase (decrease) in shares outstanding before conversion | | | 160,789 | | | | 2,423,493 | |
| | |
Shares issued upon conversion from other share class(es) | | | 8,893 | | | | 141,329 | |
| | |
Shares purchased upon conversion into other share class(es) | | | (146,971 | ) | | | (2,357,668 | ) |
| | |
Net increase (decrease) in shares outstanding | | | 22,711 | | | $ | 207,154 | |
| | |
Class R6 | | | | | | | | |
| | |
Year ended October 31, 2022: | | | | | | | | |
| | |
Shares sold | | | 1,194,029 | | | $ | 19,262,442 | |
| | |
Shares issued in reinvestment of dividends and distributions | | | 78,291 | | | | 1,207,913 | |
| | |
Shares purchased | | | (480,363 | ) | | | (7,653,554 | ) |
| | |
Net increase (decrease) in shares outstanding | | | 791,957 | | | $ | 12,816,801 | |
| | |
Year ended October 31, 2021: | | | | | | | | |
| | |
Shares sold | | | 562,092 | | | $ | 8,822,244 | |
| | |
Shares issued in reinvestment of dividends and distributions | | | 7,162 | | | | 113,926 | |
| | |
Shares purchased | | | (118,014 | ) | | | (1,888,025 | ) |
| | |
Net increase (decrease) in shares outstanding before conversion | | | 451,240 | | | | 7,048,145 | |
| | |
Shares issued upon conversion from other share class(es) | | | 146,971 | | | | 2,357,668 | |
| | |
Net increase (decrease) in shares outstanding | | | 598,211 | | | $ | 9,405,813 | |
The RIC, on behalf of the Fund, along with other affiliated registered investment companies (the “Participating Funds”), is a party to a Syndicated Credit Agreement (“SCA”) with a group of banks. The purpose of the SCA is to provide an alternative source of temporary funding for capital share redemptions. The table below provides details of the current SCA in effect at the reporting period-end as well as the prior SCA.
| | | | |
| | | |
| | | Current SCA | | Prior SCA |
| | |
Term of Commitment | | 9/30/2022 - 9/28/2023 | | 10/1/2021 – 9/29/2022 |
| | |
Total Commitment | | $ 1,200,000,000 | | $ 1,200,000,000 |
| | |
Annualized Commitment Fee on the Unused Portion of the SCA | | 0.15% | | 0.15% |
| | |
Annualized Interest Rate on Borrowings | | 1.00% plus the higher of (1) the effective federal funds rate, (2) the daily SOFR rate plus 0.10% or (3) zero percent | | 1.20% plus the higher of (1) the effective federal funds rate, (2) the one-month LIBOR rate or (3) zero percent |
36
Certain affiliated registered investment companies that are parties to the SCA include portfolios that are subject to a predetermined mathematical formula used to manage certain benefit guarantees offered under variable annuity contracts. The formula may result in large scale asset flows into and out of these portfolios. Consequently, these portfolios may be more likely to utilize the SCA for purposes of funding redemptions. It may be possible for those portfolios to fully exhaust the committed amount of the SCA, thereby requiring the Manager to allocate available funding per a Board-approved methodology designed to treat the Participating Funds in the SCA equitably.
The Fund utilized the SCA during the year ended October 31, 2022. The average daily balance for the 5 days that the Fund had loans outstanding during the period was approximately $1,977,000, borrowed at a weighted average interest rate of 1.29%. The maximum loan outstanding amount during the period was $1,977,000. At October 31, 2022, the Fund did not have an outstanding loan amount.
| 9. | Risks of Investing in the Fund |
The Fund’s risks include, but are not limited to, some or all of the risks discussed below. For further information on the Fund’s risks, please refer to the Fund’s Prospectus and Statement of Additional Information.
Blend Style Risk: The Fund’s blend investment style may subject the Fund to risks of both value and growth investing. The portion of the Fund’s portfolio that makes investments pursuant to a growth strategy may be subject to above-average fluctuations as a result of seeking higher than average capital growth. The portion of the Fund’s portfolio that makes investments pursuant to a value strategy may be subject to the risk that the market may not recognize a security’s intrinsic value for long periods of time or at all, or that a stock judged to be undervalued may actually be appropriately priced or overvalued. Issuers of value stocks may have experienced adverse business developments or may be subject to special risks that have caused the stock to be out of favor. If the Fund’s assessment of market conditions or a company’s value is inaccurate, the Fund could suffer losses or produce poor performance relative to other funds. Historically, growth stocks have performed best during later stages of economic expansion and value stocks have performed best during periods of economic recovery. Therefore, both styles may over time go in and out of favor with the markets. At times when a style is out of favor, that portion of the portfolio may lag the other portion of the portfolio, which may cause the Fund to underperform the market in general, its benchmark and other mutual funds. Growth and value stocks have historically produced similar long-term results, though each category has periods when it outperforms the other.
Distribution Risk: The Fund’s distributions may consist of net investment income, if any, and net realized gains, if any, from the sale of investments and/or return of capital. The Fund will provide to shareholders early in each calendar year the final tax character of the Fund’s distributions for the previous year. Also, at such time that the Fund distribution is expected to be from sources other than current or accumulated net income, a notice to shareholders may be required.
PGIM Jennison Global Infrastructure Fund 37
Notes to Financial Statements (continued)
Economic and Market Events Risk: Events in the U.S. and global financial markets, including actions taken by the U.S. Federal Reserve or foreign central banks to stimulate or stabilize economic growth or the functioning of the securities markets, or otherwise reduce inflation may at times result in unusually high market volatility, which could negatively impact performance. Governmental efforts to curb inflation often have negative effects on the level of economic activity. Relatively reduced liquidity in credit and fixed income markets could adversely affect issuers worldwide.
Emerging Markets Risk: The risks of foreign investments are greater for investments in or exposed to emerging markets. Emerging market countries typically have economic and political systems that are less fully developed, and can be expected to be less stable, than those of more developed countries. For example, the economies of such countries can be subject to rapid and unpredictable rates of inflation or deflation. Low trading volumes may result in a lack of liquidity and price volatility. Emerging market countries may have policies that restrict investment by non-U.S. investors, or that prevent non-U.S. investors from withdrawing their money at will.
The Fund may invest in some emerging markets that subject it to risks such as those associated with illiquidity, custody of assets, different settlement and clearance procedures and asserting legal title under a developing legal and regulatory regime to a greater degree than in developed markets or even in other emerging markets.
Equity and Equity-Related Securities Risk: Equity and equity-related securities may be subject to changes in value, and their values may be more volatile than those of other asset classes. In addition to an individual security losing value, the value of the equity markets or a sector in which the Fund invests could go down. Different parts of a market can react differently to adverse issuer, market, regulatory, political and economic developments.
Foreign Securities Risk: Investments in securities of non-U.S. issuers (including those denominated in U.S. dollars) may involve more risk than investing in securities of U.S. issuers. Foreign political, economic and legal systems, especially those in developing and emerging market countries, may be less stable and more volatile than in the United States. Foreign legal systems generally have fewer regulatory requirements than the U.S. legal system, particularly those of emerging markets. In general, less information is publicly available with respect to non-U.S. companies than U.S. companies. Non-U.S. companies generally are not subject to the same accounting, auditing, and financial reporting standards as are U.S. companies. Additionally, the changing value of foreign currencies and changes in exchange rates could also affect the value of the assets the Fund holds and the Fund’s performance. Certain foreign countries may impose restrictions on the ability of issuers of foreign securities to make payment of principal and interest or dividends to investors located
38
outside the country, due to blockage of foreign currency exchanges or otherwise. Investments in emerging markets are subject to greater volatility and price declines.
In addition, the Fund’s investments in non-U.S. securities may be subject to the risks of nationalization or expropriation of assets, imposition of currency exchange controls or restrictions on the repatriation of non-U.S. currency, confiscatory taxation and adverse diplomatic developments. Special U.S. tax considerations may apply.
Increase in Expenses Risk: Your actual cost of investing in the Fund may be higher than the expenses shown in the expense table in the Fund’s prospectus for a variety of reasons. For example, expense ratios may be higher than those shown if average net assets decrease. Net assets are more likely to decrease and Fund expense ratios are more likely to increase when markets are volatile. Active and frequent trading of Fund securities can increase expenses.
Infrastructure Companies Risk: Securities of infrastructure companies are more susceptible to adverse economic, social, political and regulatory occurrences than securities of companies in other industries. Infrastructure companies may be subject to a variety of factors that may adversely affect their business or operations, including high interest costs in connection with capital construction programs, high leverage, costs associated with environmental and other regulations, the level of government spending on infrastructure projects, the effects of economic slowdown, surplus capacity, technological changes, casualty losses, insufficient supply of necessary resources, increased competition from other providers of similar services, uncertainties concerning the availability of fuel at reasonable prices, the effects of energy conservation policies and other factors. Certain infrastructure companies may operate in limited areas or have few sources of revenue.
Infrastructure companies may also be affected by or subject to:
| ∎ | | regulation by various government authorities, including regulation of rates charged to customers; |
| ∎ | | service interruption due to environmental, operational or other mishaps as well as political and social unrest; |
| ∎ | | the imposition of special tariffs and changes in tax laws and accounting standards; and |
| ∎ | | general changes in market sentiment towards the assets of infrastructure companies. |
Large Shareholder and Large Scale Redemption Risk: Certain individuals, accounts, funds (including funds affiliated with the Manager) or institutions, including the Manager and its affiliates, may from time to time own or control a substantial amount of the Fund’s shares. There is no requirement that these entities maintain their investment in the Fund. There is a risk that such large shareholders or that the Fund’s shareholders generally may redeem all or a substantial portion of their investments in the Fund in a short period of time, which
PGIM Jennison Global Infrastructure Fund 39
Notes to Financial Statements (continued)
could have a significant negative impact on the Fund’s NAV, liquidity, and brokerage costs. Large redemptions could also result in tax consequences to shareholders and impact the Fund’s ability to implement its investment strategy. The Fund’s ability to pursue its investment objective after one or more large scale redemptions may be impaired and, as a result, the Fund may invest a larger portion of its assets in cash or cash equivalents.
Liquidity Risk: Liquidity risk is the risk that the Fund could not meet requests to redeem shares issued by the Fund without significant dilution of remaining investors’ interests in the Fund. The Fund may invest in instruments that trade in lower volumes and are more illiquid than other investments. If the Fund is forced to sell these investments to pay redemption proceeds or for other reasons, the Fund may lose money. In addition, when there is no willing buyer and investments cannot be readily sold at the desired time or price, the Fund may have to accept a lower price or may not be able to sell the instrument at all. An inability to sell a portfolio position can adversely affect the Fund’s value or prevent the Fund from being able to take advantage of other investment opportunities.
Management Risk: Actively managed funds are subject to management risk. The subadviser will apply investment techniques and risk analyses in making investment decisions for the Fund, but the subadviser’s judgments about the attractiveness, value or market trends affecting a particular security, industry or sector or about market movements may be incorrect. Additionally, the investments selected for the Fund may underperform the markets in general, the Fund’s benchmark and other funds with similar investment objectives.
Market Capitalization Risk: The Fund may invest in companies of any market capitalization. Generally, the stock prices of small- and mid-cap companies are less stable than the prices of large-cap stocks and may present greater risks. Large capitalization companies as a group could fall out of favor with the market, causing the Fund to underperform compared to investments that focus on smaller capitalized companies.
Market Disruption and Geopolitical Risks: Market disruption can be caused by economic, financial or political events and factors, including but not limited to, international wars or conflicts (including Russia’s military invasion of Ukraine), geopolitical developments (including trading and tariff arrangements, sanctions and cybersecurity attacks), instability in regions such as Asia, Eastern Europe and the Middle East, terrorism, natural disasters and public health epidemics (including the outbreak of COVID-19 globally).
The extent and duration of such events and resulting market disruptions cannot be predicted, but could be substantial and could magnify the impact of other risks to the Fund. These and other similar events could adversely affect the U.S. and foreign financial markets and lead to increased market volatility, reduced liquidity in the securities markets, significant
40
negative impacts on issuers and the markets for certain securities and commodities and/or government intervention. They may also cause short- or long-term economic uncertainties in the United States and worldwide. As a result, whether or not the Fund invests in securities of issuers located in or with significant exposure to the countries directly affected, the value and liquidity of the Fund’s investments may be negatively impacted. Further, due to closures of certain markets and restrictions on trading certain securities, the value of certain securities held by the Fund could be significantly impacted, which could lead to such securities being valued at zero.
COVID-19 and the related governmental and public responses have had and may continue to have an impact on the Fund’s investments and net asset value and have led and may continue to lead to increased market volatility and the potential for illiquidity in certain classes of securities and sectors of the market. They have also had and may continue to result in periods of business disruption, business closures, inability to obtain raw materials, supplies and component parts, and reduced or disrupted operations for the issuers in which the Fund invests. The occurrence, reoccurrence and pendency of public health epidemics could adversely affect the economies and financial markets either in specific countries or worldwide.
Market Risk: Securities markets may be volatile and the market prices of the Fund’s securities may decline. Securities fluctuate in price based on changes in an issuer’s financial condition and overall market and economic conditions. If the market prices of the securities owned by the Fund fall, the value of your investment in the Fund will decline.
Master Limited Partnerships Risk: The risks of investing in an MLP are generally those involved in investing in a partnership as opposed to a corporation. For example, state law governing partnerships is often less restrictive than state law governing corporations. Accordingly, there may be fewer protections afforded investors in an MLP than investors in a corporation. Investments held by MLPs may be relatively illiquid, limiting the MLPs’ ability to vary their portfolios promptly in response to changes in economic or other conditions. MLPs may have limited financial resources, their securities may trade infrequently and in limited volume, and they may be subject to more abrupt or erratic price movements than securities of larger or more broadly-based companies. The Fund’s investment in MLPs also subjects the Fund to the risks associated with the specific industry or industries in which the MLPs invest, risks related to limited control and limited rights to vote on matters affecting the MLP, risks related to potential conflicts of interest between the MLP and the MLP’s general partner, cash flow risks, dilution risks and risks related to the general partner’s right to require unit-holders to sell their common units at an undesirable time or price. MLPs are generally considered interest-rate sensitive investments. During periods of interest rate volatility, these investments may not provide attractive returns. Since MLPs generally conduct business in multiple states, the Fund may be subject to income or franchise tax in each of the states in which the partnership does business. The additional cost of preparing and filing the tax returns and paying the related taxes may adversely impact the Fund’s return on its investment in MLPs.
PGIM Jennison Global Infrastructure Fund 41
Notes to Financial Statements (continued)
Real Estate Investment Trust (“REIT”) Risk: Investing in REITs involves certain unique risks in addition to those risks associated with investing in the real estate industry in general. REITs may be affected by changes in the value of the underlying property owned by the REITs, while mortgage REITs may be affected by the quality of any credit extended. REITs are dependent upon management skills, may not be diversified geographically or by property/mortgage asset type, and are subject to heavy cash flow dependency, default by borrowers and self-liquidation. REITs may be more volatile and/or more illiquid than other types of equity securities. REITs (especially mortgage REITs) are subject to interest rate risks. REITs may incur significant amounts of leverage. The Fund will indirectly bear a portion of the expenses, including management fees, paid by each REIT in which it invests, in addition to the expenses of the Fund.
REITs must also meet certain requirements under the Internal Revenue Code of 1986, as amended (the Code) to avoid entity level tax and be eligible to pass-through certain tax attributes of their income to shareholders. REITs are consequently subject to the risk of failing to meet these requirements for favorable tax treatment and of failing to maintain their exemptions from registration under the Investment Company Act of 1940. REITs are subject to the risks of changes in the Code affecting their tax status.
42
Report of Independent Registered Public Accounting Firm
To the Board of Directors of Prudential World Fund, Inc. and Shareholders of PGIM Jennison Global Infrastructure Fund
Opinion on the Financial Statements
We have audited the accompanying statement of assets and liabilities, including the schedule of investments, of PGIM Jennison Global Infrastructure Fund (one of the funds constituting Prudential World Fund, Inc., referred to hereafter as the “Fund”) as of October 31, 2022, the related statement of operations for the year ended October 31, 2022, the statements of changes in net assets for each of the two years in the period ended October 31, 2022, including the related notes, and the financial highlights for each of the three years in the period ended October 31, 2022 (collectively referred to as the “financial statements”). In our opinion, the financial statements present fairly, in all material respects, the financial position of the Fund as of October 31, 2022, the results of its operations for the year then ended, the changes in its net assets for each of the two years in the period ended October 31 2022 and the financial highlights for each of the three years in the period ended October 31, 2022 in conformity with accounting principles generally accepted in the United States of America.
The financial statements of the Fund as of and for the year ended October 31, 2019 and the financial highlights for each of the periods ended on or prior to October 31, 2019 (not presented herein, other than the financial highlights) were audited by other auditors whose report dated December 19, 2019 expressed an unqualified opinion on those financial statements and financial highlights.
Basis for Opinion
These financial statements are the responsibility of the Fund’s management. Our responsibility is to express an opinion on the Fund’s financial statements based on our audits. We are a public accounting firm registered with the Public Company Accounting Oversight Board (United States) (PCAOB) and are required to be independent with respect to the Fund in accordance with the U.S. federal securities laws and the applicable rules and regulations of the Securities and Exchange Commission and the PCAOB.
We conducted our audits of these financial statements in accordance with the standards of the PCAOB. Those standards require that we plan and perform the audit to obtain reasonable assurance about whether the financial statements are free of material misstatement, whether due to error or fraud.
Our audits included performing procedures to assess the risks of material misstatement of the financial statements, whether due to error or fraud, and performing procedures that respond to those risks. Such procedures included examining, on a test basis, evidence regarding the amounts and disclosures in the financial statements. Our audits also included evaluating the accounting principles used and significant estimates made by management, as well as evaluating the overall presentation of the financial statements. Our procedures included confirmation of securities owned as of October 31, 2022 by correspondence with the custodian, transfer agent and brokers; when replies were not received from brokers, we performed other auditing procedures. We believe that our audits provide a reasonable basis for our opinion.
/s/PricewaterhouseCoopers LLP
New York, New York
December 16, 2022
We have served as the auditor of one or more investment companies in the PGIM Retail Funds complex since 2020.
PGIM Jennison Global Infrastructure Fund 43
Tax Information (unaudited)
We are advising you that during the fiscal year ended October 31, 2022, the Fund reports the maximum amount allowed per share, but not less than $1.09 for Class A, C, R6 and Z share as a capital gain distribution in accordance with Section 852(b)(3)(C) of the Internal Revenue Code.
For the year ended October 31, 2022, the Series reports under Section 854 of the Internal Revenue Code, the following percentages of the ordinary income dividends paid as 1) qualified dividend income (QDI); and 2) eligible for corporate dividends received deduction (DRD):
| | | | |
| | | |
| Fund | | QDI | | DRD |
| | |
PGIM Jennison Global Infrastructure Fund | | 100.00% | | 74.81% |
In January 2023, you will be advised on IRS Form 1099-DIV or substitute 1099-DIV, as to the federal tax status of dividends and distributions received by you in calendar year 2022.
44
INFORMATION ABOUT BOARD MEMBERS AND OFFICERS (unaudited)
Information about Board Members and Officers of the Fund is set forth below. Board Members who are not deemed to be “interested persons” of the Fund, as defined in the 1940 Act, are referred to as “Independent Board Members.” Board Members who are deemed to be “interested persons” of the Fund are referred to as “Interested Board Members.” The Board Members are responsible for the overall supervision of the operations of the Fund and perform the various duties imposed on the directors of investment companies by the 1940 Act. The Board in turn elects the Officers, who are responsible for administering the day-to-day operations of the Fund.
| | | | | | |
| | | |
Independent Board Members | | | | |
| | | | |
Name Year of Birth Position(s) Portfolios Overseen | | Principal Occupation(s) During Past Five Years | | Other Directorships Held During Past Five Years | | Length of Board Service |
| | | | |
Ellen S. Alberding 1958 Board Member Portfolios Overseen: 97 | | President and Board Member, The Joyce Foundation (charitable foundation) (since 2002); formerly Vice Chair, City Colleges of Chicago (community college system) (2011-2015); Trustee, National Park Foundation (charitable foundation for national park system) (2009-2018); Trustee, Economic Club of Chicago (2009-2016); Trustee, Loyola University (since 2018). | | None. | | Since September 2013 |
| | | | |
Kevin J. Bannon 1952 Board Member Portfolios Overseen: 97 | | Retired; formerly Managing Director (April 2008-May 2015) and Chief Investment Officer (October 2008-November 2013) of Highmount Capital LLC (registered investment adviser); formerly Executive Vice President and Chief Investment Officer (April 1993-August 2007) of Bank of New York Company; President (May 2003-May 2007) of BNY Hamilton Family of Mutual Funds. | | Director of Urstadt Biddle Properties (equity real estate investment trust) (since September 2008). | | Since July 2008 |
PGIM Jennison Global Infrastructure Fund
| | | | | | |
| | | |
Independent Board Members | | | | |
| | | | |
Name Year of Birth Position(s) Portfolios Overseen | | Principal Occupation(s) During Past Five Years | | Other Directorships Held During Past Five Years | | Length of Board Service |
| | | | |
Linda W. Bynoe 1952 Board Member Portfolios Overseen: 94 | | President and Chief Executive Officer (since March 1995) and formerly Chief Operating Officer (December 1989-February 1995) of Telemat Limited LLC (formerly Telemat Ltd) (management consulting); formerly Vice President (January 1985-June 1989) at Morgan Stanley & Co. (broker-dealer). | | Trustee of Equity Residential (residential real estate) (since December 2009); Director of Northern Trust Corporation (financial services) (since April 2006); formerly Director of Anixter International, Inc. (communication products distributor) (January 2006-June 2020). | | Since March 2005 |
| | | | |
Barry H. Evans 1960 Board Member Portfolios Overseen: 96 | | Retired; formerly President (2005-2016), Global Chief Operating Officer (2014-2016), Chief Investment Officer - Global Head of Fixed Income (1998-2014), and various portfolio manager roles (1986-2006), Manulife Asset Management (asset management). | | Formerly Director, Manulife Trust Company (2011-2018); formerly Director, Manulife Asset Management Limited (2015-2017); formerly Chairman of the Board of Directors of Manulife Asset Management U.S. (2005-2016); formerly Chairman of the Board, Declaration Investment Management and Research (2008-2016). | | Since September 2017 |
| | | | |
Keith F. Hartstein 1956 Board Member & Independent Chair Portfolios Overseen: 97 | | Retired; Member (November 2014-September 2022) of the Governing Council of the Independent Directors Council (IDC) (organization of independent mutual fund directors); formerly Executive Committee of the IDC Board of Governors (October 2019-December 2021); formerly President and Chief Executive Officer (2005-2012), Senior Vice President (2004-2005), Senior Vice President of Sales and Marketing (1997-2004), and various executive management positions (1990-1997), John Hancock Funds, LLC (asset management); Chairman, Investment Company Institute’s Sales Force Marketing Committee (2003-2008). | | None. | | Since September 2013 |
Visit our website at pgim.com/investments
| | | | | | |
| | | |
Independent Board Members | | | | |
| | | | |
Name Year of Birth Position(s) Portfolios Overseen | | Principal Occupation(s) During Past Five Years | | Other Directorships Held During Past Five Years | | Length of Board Service |
| | | | |
Laurie Simon Hodrick 1962 Board Member Portfolios Overseen: 93 | | A. Barton Hepburn Professor Emerita of Economics in the Faculty of Business, Columbia Business School (since 2018); Visiting Fellow at the Hoover Institution, Stanford University (since 2015); Sole Member, ReidCourt LLC (since 2008) (a consulting firm); formerly Visiting Professor of Law, Stanford Law School (2015-2021); formerly A. Barton Hepburn Professor of Economics in the Faculty of Business, Columbia Business School (1996-2017); formerly Managing Director, Global Head of Alternative Investment Strategies, Deutsche Bank (2006-2008). | | Independent Director, Andela (since January 2022) (global talent network); Independent Director, Roku (since December 2020) (communication services); formerly Independent Director, Synnex Corporation (2019-2021) (information technology); formerly Independent Director, Kabbage, Inc. (2018-2020) (financial services); formerly Independent Director, Corporate Capital Trust (2017-2018) (a business development company). | | Since September 2017 |
| | | | |
Brian K. Reid 1961 Board Member Portfolios Overseen: 96 | | Retired; formerly Chief Economist for the Investment Company Institute (ICI) (2005-2017); formerly Senior Economist and Director of Industry and Financial Analysis at the ICI (1998-2004); formerly Senior Economist, Industry and Financial Analysis at the ICI (1996-1998); formerly Staff Economist at the Federal Reserve Board (1989-1996); Director, ICI Mutual Insurance Company (2012-2017). | | None. | | Since March 2018 |
PGIM Jennison Global Infrastructure Fund
| | | | | | |
| | | |
Independent Board Members | | | | |
| | | | |
Name Year of Birth Position(s) Portfolios Overseen | | Principal Occupation(s) During Past Five Years | | Other Directorships Held During Past Five Years | | Length of Board Service |
| | | | |
Grace C. Torres 1959 Board Member Portfolios Overseen: 96 | | Retired; formerly Treasurer and Principal Financial and Accounting Officer of the PGIM Funds, Target Funds, Advanced Series Trust, Prudential Variable Contract Accounts and The Prudential Series Fund (1998-June 2014); Assistant Treasurer (March 1999-June 2014) and Senior Vice President (September 1999-June 2014) of PGIM Investments LLC; Assistant Treasurer (May 2003-June 2014) and Vice President (June 2005-June 2014) of AST Investment Services, Inc.; Senior Vice President and Assistant Treasurer (May 2003-June 2014) of Prudential Annuities Advisory Services, Inc. | | Director (since January 2018) of OceanFirst Financial Corp. and OceanFirst Bank; formerly Director (July 2015-January 2018) of Sun Bancorp, Inc. N.A. and Sun National Bank. | | Since November 2014 |
Visit our website at pgim.com/investments
| | | | | | |
| | |
Interested Board Members | | |
| | | | |
Name Year of Birth Position(s) Portfolios Overseen | | Principal Occupation(s) During Past Five Years | | Other Directorships Held During Past Five Years | | Length of Board Service |
| | | | |
Stuart S. Parker 1962 Board Member & President Portfolios Overseen: 96 | | President, Chief Executive Officer, Chief Operating Officer and Officer in Charge of PGIM Investments LLC (formerly known as Prudential Investments LLC) (since January 2012); President and Principal Executive Officer (“PEO”) (since September 2022) of the PGIM Private Credit Fund; President and PEO (since March 2022) of the PGIM Private Real Estate Fund, Inc.; formerly Executive Vice President of Jennison Associates LLC and Head of Retail Distribution of PGIM Investments LLC (June 2005-December 2011); Investment Company Institute - Board of Governors (since May 2012). | | None. | | Since January 2012 |
| | | | |
Scott E. Benjamin 1973 Board Member & Vice President Portfolios Overseen: 97 | | Executive Vice President (since May 2009) of PGIM Investments LLC; Vice President (since June 2012) of Prudential Investment Management Services LLC; Executive Vice President (since September 2009) of AST Investment Services, Inc.; Senior Vice President of Product Development and Marketing, PGIM Investments (since February 2006); Vice President (since September 2022) of the PGIM Private Credit Fund; Vice President (since March 2022) of the PGIM Private Real Estate Fund, Inc.; formerly Vice President of Product Development and Product Management, PGIM Investments LLC (2003-2006). | | None. | | Since March 2010 |
PGIM Jennison Global Infrastructure Fund
| | | | |
| | | |
Fund Officers(a) | | | | |
| | | |
Name Year of Birth Fund Position | | Principal Occupation(s) During Past Five Years | | Length of Service as Fund Officer |
| | | |
Claudia DiGiacomo 1974 Chief Legal Officer | | Chief Legal Officer (since September 2022) of the PGIM Private Credit Fund; Chief Legal Officer (since July 2022) of the PGIM Private Real Estate Fund, Inc.; Chief Legal Officer, Executive Vice President and Secretary of PGIM Investments LLC (since August 2020); Chief Legal Officer of Prudential Mutual Fund Services LLC (since August 2020); Chief Legal Officer of PIFM Holdco, LLC (since August 2020); Vice President and Corporate Counsel (since January 2005) of Prudential; and Corporate Counsel of AST Investment Services, Inc. (since August 2020); formerly Vice President and Assistant Secretary of PGIM Investments LLC (2005-2020); formerly Associate at Sidley Austin Brown & Wood LLP (1999-2004). | | Since December 2005 |
| | | |
Isabelle Sajous 1976 Chief Compliance Officer | | Chief Compliance Officer (since April 2022) of PGIM Investments LLC, the PGIM Funds, Target Funds, PGIM ETF Trust, PGIM Global High Yield Fund, Inc., PGIM High Yield Bond Fund, Inc., PGIM Short Duration High Yield Opportunities Fund, Advanced Series Trust, The Prudential Series Fund and Prudential’s Gibraltar Fund, Inc.; Chief Compliance Officer (since September 2022) of the PGIM Private Credit Fund; Chief Compliance Officer (since March 2022) of the PGIM Private Real Estate Fund, Inc.; Vice President, Compliance of PGIM Investments LLC (since December 2020); formerly Director, Compliance (July 2018-December 2020) of Credit Suisse Asset Management LLC; and Vice President, Associate General Counsel & Deputy Chief Compliance Officer of Cramer Rosenthal McGlynn, LLC (August 2014-July 2018). | | Since April 2022 |
| | | |
Andrew R. French 1962 Secretary | | Vice President (since December 2018) of PGIM Investments LLC; Secretary (since September 2022) of the PGIM Private Credit Fund; Secretary (since March 2022) of the PGIM Private Real Estate Fund, Inc.; formerly Vice President and Corporate Counsel (2010-2018) of Prudential; formerly Director and Corporate Counsel (2006-2010) of Prudential; Vice President and Assistant Secretary (since January 2007) of PGIM Investments LLC; Vice President and Assistant Secretary (since January 2007) of Prudential Mutual Fund Services LLC. | | Since October 2006 |
| | | |
Melissa Gonzalez 1980 Assistant Secretary | | Vice President and Corporate Counsel (since September 2018) of Prudential; Vice President and Assistant Secretary (since August 2020) of PGIM Investments LLC; Assistant Secretary (since September 2022) of the PGIM Private Credit Fund; Assistant Secretary (since March 2022) of the PGIM Private Real Estate Fund, Inc.; formerly Director and Corporate Counsel (March 2014-September 2018) of Prudential. | | Since March 2020 |
Visit our website at pgim.com/investments
| | | | |
| | | |
Fund Officers(a) | | | | |
| | | |
Name Year of Birth Fund Position | | Principal Occupation(s) During Past Five Years | | Length of Service as Fund Officer |
| | | |
Patrick E. McGuinness 1986 Assistant Secretary | | Vice President and Assistant Secretary (since August 2020) of PGIM Investments LLC; Director and Corporate Counsel (since February 2017) of Prudential; Assistant Secretary (since September 2022) of the PGIM Private Credit Fund; Assistant Secretary (since March 2022) of the PGIM Private Real Estate Fund, Inc. | | Since June 2020 |
| | | |
Debra Rubano 1975 Assistant Secretary | | Vice President and Corporate Counsel (since November 2020) of Prudential; Assistant Secretary (since September 2022) of the PGIM Private Credit Fund; Assistant Secretary (since March 2022) of the PGIM Private Real Estate Fund, Inc; formerly Director and Senior Counsel of Allianz Global Investors U.S. Holdings LLC (2010-2020) and Assistant Secretary of numerous funds in the Allianz fund complex (2015-2020). | | Since December 2020 |
| | | |
Kelly A. Coyne 1968 Assistant Secretary | | Director, Investment Operations of Prudential Mutual Fund Services LLC (since 2010); Assistant Secretary (since September 2022) of the PGIM Private Credit Fund; Assistant Secretary (since March 2022) of the PGIM Private Real Estate Fund, Inc. | | Since March 2015 |
| | | |
Christian J. Kelly 1975 Treasurer and Principal Financial and Accounting Officer | | Vice President, Head of Fund Administration of PGIM Investments LLC (since November 2018); Principal Financial Officer (since September 2022) of the PGIM Private Credit Fund; Principal Financial Officer (since March 2022) of the PGIM Private Real Estate Fund, Inc.; formerly, Treasurer and Principal Accounting Officer (March 2022- July 2022) of the PGIM Private Real Estate Fund, Inc.; formerly Director of Fund Administration of Lord Abbett & Co. LLC (2009-2018), Treasurer and Principal Accounting Officer of the Lord Abbett Family of Funds (2017-2018); Director of Accounting, Avenue Capital Group (2008-2009); Senior Manager, Investment Management Practice of Deloitte & Touche LLP (1998-2007). | | Since January 2019 |
| | | |
Lana Lomuti 1967 Assistant Treasurer | | Vice President (since 2007) and Director (2005-2007), within PGIM Investments Fund Administration; formerly Assistant Treasurer (December 2007-February 2014) of The Greater China Fund, Inc. | | Since April 2014 |
| | | |
Russ Shupak 1973 Assistant Treasurer | | Vice President (since 2017) and Director (2013-2017), within PGIM Investments Fund Administration; Treasurer and Principal Accounting Officer (since July 2022) of the PGIM Private Real Estate Fund, Inc.; Assistant Treasurer (since September 2022) of the PGIM Private Credit Fund; formerly Assistant Treasurer (March 2022 – July 2022) of the PGIM Private Real Estate Fund, Inc. | | Since October 2019 |
| | | |
Deborah Conway 1969 Assistant Treasurer | | Vice President (since 2017) and Director (2007-2017), within PGIM Investments Fund Administration. | | Since October 2019 |
PGIM Jennison Global Infrastructure Fund
| | | | |
| | | |
Fund Officers(a) | | | | |
| | | |
Name Year of Birth Fund Position | | Principal Occupation(s) During Past Five Years | | Length of Service as Fund Officer |
| | | |
Elyse M. McLaughlin 1974 Assistant Treasurer | | Vice President (since 2017) and Director (2011-2017), within PGIM Investments Fund Administration; Treasurer and Principal Accounting Officer (since September 2022) of the PGIM Private Credit Fund; Assistant Treasurer (since March 2022) of the PGIM Private Real Estate Fund, Inc. | | Since October 2019 |
| | | |
Kelly Florio 1978 Anti-Money Laundering Compliance Officer | | Vice President, Corporate Compliance, Global Compliance Programs and Compliance Risk Management (since December 2021) of Prudential; formerly, Head of Fraud Risk Management (October 2019 to December 2021) at New York Life Insurance Company; formerly, Head of Key Risk Area Operations (November 2018 to October 2019), Director of the US Anti-Money Laundering Compliance Unit (2009-2018) and Bank Loss Prevention Associate (2006 -2009) at MetLife. | | Since June 2022 |
(a) Excludes Mr. Parker and Mr. Benjamin, interested Board Members who also serve as President and Vice President, respectively.
Explanatory Notes to Tables:
| ∎ | | Board Members are deemed to be “Interested,” as defined in the 1940 Act, by reason of their affiliation with PGIM Investments LLC and/or an affiliate of PGIM Investments LLC. |
| ∎ | | Unless otherwise noted, the address of all Board Members and Officers is c/o PGIM Investments LLC, 655 Broad Street, Newark, New Jersey 07102-4410. |
| ∎ | | There is no set term of office for Board Members or Officers. The Board Members have adopted a retirement policy, which calls for the retirement of Board Members on December 31 of the year in which they reach the age of 75. |
| ∎ | | “Other Directorships Held” includes all directorships of companies required to register or file reports with the SEC under the 1934 Act (that is, “public companies”) or other investment companies registered under the 1940 Act. |
| ∎ | | “Portfolios Overseen” includes all investment companies managed by PGIM Investments LLC. The investment companies for which PGIM Investments LLC serves as manager include the PGIM Mutual Funds, Target Funds, The Prudential Variable Contract Accounts, PGIM ETF Trust, PGIM Private Real Estate Fund, Inc., PGIM Private Credit Fund, PGIM High Yield Bond Fund, Inc., PGIM Global High Yield Fund, Inc., PGIM Short Duration High Yield Opportunities Fund, The Prudential Series Fund, Prudential’s Gibraltar Fund, Inc. and the Advanced Series Trust. |
| ∎ | | As used in the Fund Officers table “Prudential” means The Prudential Insurance Company of America. |
Visit our website at pgim.com/investments
Approval of Advisory Agreements (unaudited)
The Fund’s Board of Directors
The Board of Directors (the “Board”) of PGIM Jennison Global Infrastructure Fund (the “Fund”)1 consists of ten individuals, eight of whom are not “interested persons” of the Fund, as defined in the Investment Company Act of 1940, as amended (the “1940 Act”) (the “Independent Directors”). The Board is responsible for the oversight of the Fund and its operations, and performs the various duties imposed on the directors of investment companies by the 1940 Act. The Independent Directors have retained independent legal counsel to assist them in connection with their duties. The Chair of the Board is an Independent Director. The Board has established five standing committees: the Audit Committee, the Nominating and Governance Committee, the Compliance Committee and two Investment Committees. Each committee is chaired by, and composed of, Independent Directors.
Annual Approval of the Fund’s Advisory Agreements
As required under the 1940 Act, the Board determines annually whether to renew the Fund’s management agreement with PGIM Investments LLC (“PGIM Investments”) and the Fund’s subadvisory agreement with Jennison Associates LLC (“Jennison”). In considering the renewal of the agreements, the Board, including all of the Independent Directors, met on May 26 and June 7-9, 2022 (the “Board Meeting”) and approved the renewal of the agreements through July 31, 2023, after concluding that the renewal of the agreements was in the best interests of the Fund and its shareholders.
In advance of the meetings, the Board requested and received materials relating to the agreements, and had the opportunity to ask questions and request further information in connection with its consideration. Among other things, the Board considered comparative fee information from PGIM Investments and Jennison. Also, the Board considered comparisons with other mutual funds in relevant Peer Universes and Peer Groups, as is further discussed below.
In approving the agreements, the Board, including the Independent Directors advised by independent legal counsel, considered the factors it deemed relevant, including the nature, quality and extent of services provided by PGIM Investments and the subadviser, the performance of the Fund, the profitability of PGIM Investments and its affiliates, expenses and fees, and the potential for economies of scale that may be shared with the Fund and its shareholders as the Fund’s assets grow. In their deliberations, the Directors did not identify any single factor which alone was responsible for the Board’s decision to approve the agreements with respect to the Fund. In connection with its deliberations, the Board considered information provided by PGIM Investments throughout the year at regular Board meetings, presentations from portfolio managers and other information, as well as information furnished at or in advance of the Board Meeting.
The Directors determined that the overall arrangements between the Fund and PGIM Investments, which serves as the Fund’s investment manager pursuant to a
1 PGIM Jennison Global Infrastructure Fund is a series of Prudential World Fund, Inc.
PGIM Jennison Global Infrastructure Fund
Approval of Advisory Agreements (continued)
management agreement, and between PGIM Investments and Jennison, which serves as the Fund’s subadviser pursuant to the terms of a subadvisory agreement with PGIM Investments, are in the best interests of the Fund and its shareholders in light of the services performed, fees charged and such other matters as the Directors considered relevant in the exercise of their business judgment.
The material factors and conclusions that formed the basis for the Directors’ reaching their determinations to approve the continuance of the agreements are separately discussed below.
Nature, Quality and Extent of Services
The Board received and considered information regarding the nature, quality and extent of services provided to the Fund by PGIM Investments and Jennison. The Board noted that Jennison is affiliated with PGIM Investments. The Board considered the services provided by PGIM Investments, including but not limited to the oversight of the subadviser for the Fund, as well as the provision of fund recordkeeping, compliance and other services to the Fund, and PGIM Investments’ role as administrator for the Fund’s liquidity risk management program. With respect to PGIM Investments’ oversight of the subadviser, the Board noted that PGIM Investments’ Strategic Investment Research Group (“SIRG”), which is a business unit of PGIM Investments, is responsible for monitoring and reporting to PGIM Investments’ senior management on the performance and operations of the subadviser. The Board also considered that PGIM Investments pays the salaries of all of the officers and interested Directors of the Fund who are part of Fund management. The Board also considered the investment subadvisory services provided by Jennison, including investment research and security selection, as well as adherence to the Fund’s investment restrictions and compliance with applicable Fund policies and procedures. The Board considered PGIM Investments’ evaluation of the subadviser, as well as PGIM Investments’ recommendation, based on its review of the subadviser, to renew the subadvisory agreement.
The Board considered the qualifications, backgrounds and responsibilities of PGIM Investments’ senior management responsible for the oversight of the Fund and Jennison, and also considered the qualifications, backgrounds and responsibilities of Jennison’s portfolio managers who are responsible for the day-to-day management of the Fund’s portfolio. The Board was provided with information pertaining to PGIM Investments’ and Jennison’s organizational structure, senior management, investment operations, and other relevant information pertaining to both PGIM Investments and Jennison. The Board also noted that it received favorable compliance reports from the Fund’s Chief Compliance Officer (“CCO”) as to both PGIM Investments and Jennison.
The Board concluded that it was satisfied with the nature, extent and quality of the investment management services provided by PGIM Investments and the subadvisory services provided to the Fund by Jennison, and that there was a reasonable basis on which to conclude that the Fund benefits from the services provided by PGIM Investments and Jennison under the management and subadvisory agreements.
Visit our website at pgim.com/investments
Costs of Services and Profits Realized by PGIM Investments
The Board was provided with information on the profitability of PGIM Investments and its affiliates in serving as the Fund’s investment manager. The Board discussed with PGIM Investments the methodology utilized in assembling the information regarding profitability and considered its reasonableness. The Board recognized that it is difficult to make comparisons of profitability from fund management contracts because comparative information is not generally publicly available and is affected by numerous factors, including the structure of the particular adviser, the types of funds it manages, its business mix, numerous assumptions regarding allocations and the adviser’s capital structure and cost of capital. However, the Board considered that the cost of services provided by PGIM Investments to the Fund during the year ended December 31, 2021 exceeded the management fees paid by the Fund, resulting in an operating loss to PGIM Investments. Taking these factors into account, the Board concluded that the profitability of PGIM Investments and its affiliates in relation to the services rendered was not unreasonable.
Economies of Scale
The Board received and discussed information concerning economies of scale that PGIM Investments may realize as the Fund’s assets grow beyond current levels. The Board noted that the management fee schedule for the Fund includes breakpoints, which have the effect of decreasing the fee rate as assets increase. During the course of time, the Board has considered information regarding the launch date of the Fund, the management fees of the Fund compared to those of similarly managed funds and PGIM Investments’ investment in the Fund over time. The Board noted that economies of scale may be shared with the Fund in several ways, including low management fees from inception, additional technological and personnel investments to enhance shareholder services, and maintaining existing expense structures in the face of a rising cost environment. The Board considered PGIM Investments’ assertion that it continually evaluates the management fee schedule of the Fund and the potential to share economies of scale through breakpoints or fee waivers as asset levels increase.
The Board recognized the inherent limitations of any analysis of economies of scale, stemming largely from the Board’s understanding that most of PGIM Investments’ costs are not specific to individual funds, but rather are incurred across a variety of products and services.
Other Benefits to PGIM Investments and Jennison
The Board considered potential ancillary benefits that might be received by PGIM Investments and Jennison and their affiliates as a result of their relationship with the Fund. The Board concluded that potential benefits to be derived by PGIM Investments included transfer agency fees received by the Fund’s transfer agent (which is affiliated with PGIM Investments), benefits to its reputation as well as other intangible benefits resulting from PGIM Investments’ association with the Fund. The Board concluded that the potential benefits to be derived by Jennison included its ability to use soft dollar
PGIM Jennison Global Infrastructure Fund
Approval of Advisory Agreements (continued)
credits, as well as the potential benefits consistent with those generally resulting from an increase in assets under management, specifically, potential access to additional research resources and benefits to its reputation. The Board concluded that the benefits derived by PGIM Investments and Jennison were consistent with the types of benefits generally derived by investment managers and subadvisers to mutual funds.
Performance of the Fund / Fees and Expenses
The Board considered certain additional factors and made related conclusions relating to the historical performance of the Fund for the one-, three- and five-year periods ended December 31, 2021.
The Board also considered the Fund’s actual management fee, as well as the Fund’s net total expense ratio, for the fiscal year ended October 31, 2021. The Board considered the management fee for the Fund as compared to the management fee charged by PGIM Investments to other funds and the fee charged by other advisers to comparable mutual funds in a Peer Group. The actual management fee represents the fee rate actually paid by Fund shareholders and includes any fee waivers or reimbursements. The net total expense ratio for the Fund represents the actual expense ratio incurred by Fund shareholders.
The mutual funds included in the Peer Universe, which was used to consider performance, and the Peer Group, which was used to consider fees and expenses, were objectively determined by Broadridge, an independent provider of mutual fund data. In certain circumstances, PGIM Investments also provided supplemental Peer Universe or Peer Group information for reasons addressed with the Board. The comparisons placed the Fund in various quartiles over various periods, with the first quartile being the best 25% of the mutual funds (for performance, the best performing mutual funds and, for expenses, the lowest cost mutual funds).
The section below summarizes key factors considered by the Board and the Board’s conclusions regarding the Fund’s performance, fees and overall expenses. The table sets forth net performance comparisons (which reflect the impact on performance of fund expenses, or any subsidies, expense caps or waivers that may be applicable) with the Peer Universe, actual management fees with the Peer Group (which reflect the impact of any subsidies or fee waivers), and net total expenses with the Peer Group, each of which were key factors considered by the Board.
| | | | | | | | |
| | | | | |
Net Performance | | 1 Year | | 3 Years | | 5 Years | | 10 Years |
| | 2nd Quartile | | 1st Quartile | | 1st Quartile | | N/A |
| | | |
| Actual Management Fees: 1st Quartile | | | | |
| |
| Net Total Expenses: 4th Quartile |
| ● | | The Board noted that the Fund outperformed its benchmark index over all periods. |
Visit our website at pgim.com/investments
| ● | | The Board and PGIM Investments agreed to retain the Fund’s existing contractual expense cap that (exclusive of certain fees and expenses) caps total annual operating expenses at 1.50% for Class A shares, 2.25% for Class C shares, 1.17% for Class R6 shares, and 1.17%for Class Z shares through February 28, 2023. |
| ● | | In addition, PGIM Investments will waive management fees or shared operating expenses on any share class to the same extent that it waives such expenses on any other share class, and has agreed that total annual fund operating expenses for Class R6 shares will not exceed total annual fund operating expenses for Class Z shares. |
| ● | | The Board concluded that, in light of the above, it would be in the best interests of the Fund and its shareholders to renew the agreements. |
| ● | | The Board concluded that the management fees (including subadvisory fees) and total expenses were reasonable in light of the services provided. |
* * *
After full consideration of these factors, the Board concluded that approval of the agreements was in the best interests of the Fund and its shareholders.
PGIM Jennison Global Infrastructure Fund
| | | | |
| | | |
∎ MAIL | | ∎ TELEPHONE | | ∎ WEBSITE |
655 Broad Street Newark, NJ 07102 | | (800) 225-1852 | | pgim.com/investments |
PROXY VOTING
The Board of Directors of the Fund has delegated to the Fund’s subadviser the responsibility for voting any proxies and maintaining proxy recordkeeping with respect to the Fund. A description of these proxy voting policies and procedures is available without charge, upon request, by calling (800) 225-1852 or by visiting the Securities and Exchange Commission’s website at sec.gov. Information regarding how the Fund voted proxies relating to portfolio securities during the most recent 12-month period ended June 30 is available on the Fund’s website and on the Securities and Exchange Commission’s website.
DIRECTORS
Ellen S. Alberding ● Kevin J. Bannon ● Scott E. Benjamin ● Linda W. Bynoe ● Barry H. Evans ● Keith F. Hartstein ● Laurie Simon Hodrick ● Stuart S. Parker ● Brian K. Reid ● Grace C. Torres
OFFICERS
Stuart S. Parker, President ● Scott E. Benjamin, Vice President ● Christian J. Kelly, Treasurer and Principal Financial and Accounting Officer ● Claudia DiGiacomo, Chief Legal Officer ● Isabelle Sajous, Chief Compliance Officer ● Kelly Florio, Anti-Money Laundering Compliance Officer ● Andrew R. French, Secretary ● Melissa Gonzalez, Assistant Secretary ● Kelly A. Coyne, Assistant Secretary ● Patrick E. McGuinness, Assistant Secretary ● Debra Rubano, Assistant Secretary ● Lana Lomuti, Assistant Treasurer ● Russ Shupak, Assistant Treasurer ● Elyse M. McLaughlin, Assistant Treasurer ● Deborah Conway, Assistant Treasurer
| | | | |
| | |
| MANAGER | | PGIM Investments LLC | | 655 Broad Street Newark, NJ 07102 |
| | |
| SUBADVISER | | Jennison Associates LLC | | 466 Lexington Avenue New York, NY 10017 |
| | |
| DISTRIBUTOR | | Prudential Investment Management Services LLC | | 655 Broad Street Newark, NJ 07102 |
| | |
| CUSTODIAN | | The Bank of New York Mellon | | 240 Greenwich Street New York, NY 10286 |
| | |
| TRANSFER AGENT | | Prudential Mutual Fund Services LLC | | PO Box 9658 Providence, RI 02940 |
| | |
| INDEPENDENT REGISTERED PUBLIC ACCOUNTING FIRM | | PricewaterhouseCoopers LLP | | 300 Madison Avenue New York, NY 10017 |
| | |
| FUND COUNSEL | | Willkie Farr &Gallagher LLP | | 787 Seventh Avenue New York, NY 10019 |
An investor should consider the investment objectives, risks, charges, and expenses of the Fund carefully before investing. The prospectus and summary prospectus contain this and other information about the Fund. An investor may obtain the prospectus and summary prospectus by visiting our website at pgim.com/investments or by calling (800) 225-1852. The prospectus and summary prospectus should be read carefully before investing.
E-DELIVERY
To receive your mutual fund documents online, go to pgim.com/investments/resource/edelivery and enroll. Instead of receiving printed documents by mail, you will receive notification via email when new materials are available. You can cancel your enrollment or change your email address at any time by visiting the website address above.
SHAREHOLDER COMMUNICATIONS WITH DIRECTORS
Shareholders can communicate directly with the Board of Directors by writing to the Chair of the Board, PGIM Jennison Global Infrastructure Fund, PGIM Investments, Attn: Board of Directors, 655 Broad Street, Newark, NJ 07102. Shareholders can communicate directly with an individual Director by writing to that Director at the same address. Communications are not screened before being delivered to the addressee.
AVAILABILITY OF PORTFOLIO HOLDINGS
The Fund files its complete schedule of portfolio holdings with the Securities and Exchange Commission for the first and third quarters of each fiscal year as an exhibit to its reports on Form N-PORT. The Fund’s Form N-PORT filings are available on the Commission’s website at sec.gov.
The Fund’s Statement of Additional Information contains additional information about the Fund’s Directors and is available without charge, upon request, by calling (800) 225-1852.
Mutual Funds:
| | | | |
| | | |
ARE NOT INSURED BY THE FDIC OR ANY FEDERAL GOVERNMENT AGENCY | | MAY LOSE VALUE | | ARE NOT A DEPOSIT OF OR GUARANTEED BY ANY BANK OR ANY BANK AFFILIATE |

PGIM JENNISON GLOBAL INFRASTRUCTURE FUND
| | | | | | | | |
| | | | |
SHARE CLASS | | A | | C | | Z | | R6 |
| | | | |
NASDAQ | | PGJAX | | PGJCX | | PGJZX | | PGJQX |
| | | | |
CUSIP | | 743969792 | | 743969784 | | 743969776 | | 743969560 |
MF217E

PGIM JENNISON GLOBAL OPPORTUNITIES FUND
ANNUAL REPORT
OCTOBER 31, 2022

To enroll in e-delivery, go to pgim.com/investments/resource/edelivery
Table of Contents
This report is not authorized for distribution to prospective investors unless preceded or accompanied by a current prospectus.
The views expressed in this report and information about the Fund’s portfolio holdings are for the period covered by this report and are subject to change thereafter.
Mutual funds are distributed by Prudential Investment Management Services LLC, member SIPC. Jennison Associates LLC is a registered investment adviser. Both are Prudential Financial companies. © 2022 Prudential Financial, Inc. and its related entities. Jennison Associates, Jennison, PGIM, and the PGIM logo are service marks of Prudential Financial, Inc. and its related entities, registered in many jurisdictions worldwide.
2 Visit our website at pgim.com/investments
Letter from the President
| | |

| | Dear Shareholder: We hope you find the annual report for the PGIM Jennison Global Opportunities Fund informative and useful. The report covers performance for the 12-month period that ended October 31, 2022. The attention of the global economy and financial markets pivoted during the period from the COVID-19 pandemic to the challenge of rapidly rising inflation. While job growth remained strong, prices for a wide range of goods and services rose in response to economic re-openings, supply-chain disruptions, governmental stimulus, and Russia’s invasion of |
Ukraine. With inflation surging to a 40-year high, the Federal Reserve and other central banks aggressively hiked interest rates, prompting recession concerns.
After rising to record levels at the end of 2021, stocks have fallen sharply in 2022 as investors worried about higher prices, slowing economic growth, geopolitical uncertainty, and new COVID-19 outbreaks. Equities rallied for a time during the summer but began falling again in late August on fears that the Fed would keep raising rates to tame inflation. For the entire 12-month period, equities suffered a broad-based global decline, although large-cap US stocks outperformed their small-cap counterparts. International developed and emerging markets trailed the US market during this time.
Rising rates and economic uncertainty drove fixed income prices broadly lower as well. US and global investment-grade bonds, along with US high yield corporate bonds and emerging market debt, all posted negative returns during the period.
Regarding your investments with PGIM, we believe it is important to maintain a diversified portfolio of funds consistent with your tolerance for risk, time horizon, and financial goals. Your financial advisor can help you create a diversified investment plan that may include funds covering all the basic asset classes and that reflects your personal investor profile and risk tolerance. However, diversification and asset allocation strategies do not assure a profit or protect against loss in declining markets.
At PGIM Investments, we provide access to active investment strategies across the global markets in the pursuit of consistent outperformance for investors. PGIM is the world’s 11th-largest investment manager with more than $1.5 trillion in assets under management. Our scale and investment expertise allow us to deliver a diversified suite of actively managed solutions across a broad spectrum of asset classes and investment styles.
Thank you for choosing our family of funds.
Sincerely,

Stuart S. Parker, President
PGIM Jennison Global Opportunities Fund
December 15, 2022
PGIM Jennison Global Opportunities Fund 3
Your Fund’s Performance (unaudited)
Performance data quoted represent past performance. Past performance does not guarantee future results. The investment return and principal value of an investment will fluctuate so that an investor’s shares, when redeemed, may be worth more or less than their original cost. Current performance may be lower or higher than the past performance data quoted. An investor may obtain performance data as of the most recent month-end by visiting our website at pgim.com/investments or by calling (800) 225-1852.
| | | | | | | | |
| |
| | | Average Annual Total Returns as of 10/31/22 |
| | | | |
| | | One Year (%) | | Five Years (%) | | Ten Years (%) | | Since Inception (%) |
| | | | |
Class A | | | | | | | | |
| | | | |
(with sales charges) | | -44.90 | | 7.12 | | 11.48 | | — |
| | | | |
(without sales charges) | | -41.69 | | 8.34 | | 12.11 | | — |
| | | | |
Class C | | | | | | | | |
| | | | |
(with sales charges) | | -42.71 | | 7.44 | | 11.22 | | — |
| | | | |
(without sales charges) | | -42.19 | | 7.44 | | 11.22 | | — |
| | | | |
Class Z | | | | | | | | |
| | | | |
(without sales charges) | | -41.59 | | 8.53 | | 12.35 | | — |
| | | | |
Class R2 | | | | | | | | |
| | | | |
(without sales charges) | | -41.85 | | N/A | | N/A | | 11.46 (12/27/2018) |
| | | | |
Class R4 | | | | | | | | |
| | | | |
(without sales charges) | | -41.68 | | N/A | | N/A | | 11.76 (12/27/2018) |
| | | | |
Class R6 | | | | | | | | |
| | | | |
(without sales charges) | | -41.54 | | 8.63 | | N/A | | 10.87 (12/22/2014) |
| | | | |
MSCI All Country World ND Index | | | | | | | | |
| | | | |
| | | -19.96 | | 5.24 | | 7.98 | | — |
| | | | |
|
| Average Annual Total Returns as of 10/31/22 Since Inception (%) |
| | |
| | | Class R2, Class R4 | | Class R6 |
| | |
| | | (12/27/2018) | | (12/22/2014) |
| | |
MSCI All Country World ND Index | | 8.68 | | 6.41 |
Since Inception returns are provided for any share class with less than 10 fiscal years of returns. Since Inception returns for the Index are measured from the closest month-end to the class’s inception date.
4 Visit our website at pgim.com/investments
Growth of a $10,000 Investment (unaudited)
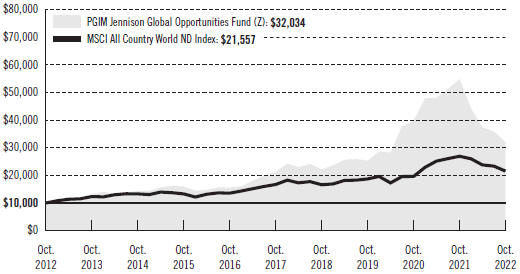
The graph compares a $10,000 investment in the Fund’s Class Z shares with a similar investment in the MSCI ACWI ND Index by portraying the initial account values at the beginning of the 10-year period for Class Z shares (October 31, 2012) and the account values at the end of the current fiscal year (October 31, 2022), as measured on a quarterly basis. For purposes of the graph, and unless otherwise indicated, it has been assumed that (a) all recurring fees (including management fees) were deducted and (b) all dividends and distributions were reinvested. The line graph provides information for Class Z shares only. As indicated in the tables provided earlier, performance for other share classes will vary due to the differing fees and expenses applicable to each share class (as indicated in the following paragraphs). Without waiver of fees and/or expense reimbursements, if any, the returns would have been lower.
Past performance does not predict future performance. Total returns and the ending account values in the graphs include changes in share price and reinvestment of dividends and capital gains distributions in a hypothetical investment for the periods shown. The Fund’s total returns do not reflect the deduction of income taxes on an individual’s investment. Taxes may reduce your actual investment returns on income or gains paid by the Fund or any gains you may realize if you sell your shares.
PGIM Jennison Global Opportunities Fund 5
Your Fund’s Performance (continued)
The returns in the tables do not reflect the deduction of taxes that a shareholder would pay on Fund distributions or following the redemption of Fund shares. The average annual total returns take into account applicable sales charges, which are described for each share class in the table below.
| | | | | | | | | | | | |
| | | | | | |
| | | Class A | | Class C | | Class Z | | Class R2 | | Class R4 | | Class R6 |
| Maximum initial sales charge | | 5.50% of the public offering price | | None | | None | | None | | None | | None |
| | | | | | | |
| Contingent deferred sales charge (CDSC) (as a percentage of the lower of the original purchase price or the net asset value at redemption) | | 1.00% on sales of $1 million or more made within 12 months of purchase | | 1.00% on sales made within 12 months of purchase | | None | | None | | None | | None |
| | | | | | | |
| Annual distribution or distribution and service (12b-1) fees (shown as a percentage of average daily net assets) | | 0.30% (0.25% currently) | | 1.00% | | None | | 0.25% | | None | | None |
| | | | | | | |
| Shareholder services fees | | None | | None | | None | | 0.10%* | | 0.10%* | | None |
*Shareholder service fee reflects maximum allowable fees under a shareholder services plan.
Benchmark Definition
MSCI All Country World ND Index—The Morgan Stanley Capital International All Country World Net Dividends Index (MSCI ACWI ND Index) is an unmanaged, free float-adjusted, market capitalization-weighted index that is designed to measure the equity market performance of developed and emerging markets. The MSCI ACWI ND Index consists of 47 country indexes comprising 23 developed and 24 emerging market country indexes. The ND version of the MSCI ACWI Index reflects the impact of the maximum withholding taxes on reinvested dividends. The MSCI ACWI ND Index is unmanaged and the total return includes the reinvestment of all dividends.
Investors cannot invest directly in an index. The returns for the Index would be lower if they included the effects of sales charges, operating expenses of a mutual fund, or taxes that may be paid by an investor.
6 Visit our website at pgim.com/investments
Presentation of Fund Holdings as of 10/31/22
| | | | | | |
| | | |
| Ten Largest Holdings | | Line of Business | | Country | | % of Net Assets |
| | | |
Apple, Inc. | | Technology Hardware, Storage & Peripherals | | United States | | 6.9% |
| | | |
Tesla, Inc. | | Automobiles | | United States | | 5.6% |
| | | |
LVMH Moet Hennessy Louis Vuitton SE | | Textiles, Apparel & Luxury Goods | | France | | 5.1% |
| | | |
Hermes International | | Textiles, Apparel & Luxury Goods | | France | | 5.0% |
| | | |
Eli Lilly &Co. | | Pharmaceuticals | | United States | | 4.3% |
| | | |
Novo Nordisk A/S (Class B Stock) | | Pharmaceuticals | | Denmark | | 4.0% |
| | | |
Ferrari NV | | Automobiles | | Italy | | 3.9% |
| | | |
MercadoLibre, Inc. | | Internet & Direct Marketing Retail | | Brazil | | 3.6% |
| | | |
Pernod Ricard SA | | Beverages | | France | | 3.1% |
| | | |
UnitedHealth Group, Inc. | | Health Care Providers &Services | | United States | | 3.1% |
Holdings reflect only long-term investments and are subject to change.
PGIM Jennison Global Opportunities Fund 7
Strategy and Performance Overview*
(unaudited)
How did the Fund perform?
The PGIM Jennison Global Opportunities Fund’s Class Z shares returned –41.59% in the 12-month reporting period that ended October 31, 2022, underperforming the –19.96% return of the MSCI All Country World Net Dividends Index (the Index).
What was the market environment?
| ● | | During the reporting period, the investment backdrop changed from one of stimulus and spending to one of inflation and tightening financial conditions, with the need to control inflation moving aggressively to the fore. |
| ● | | The investment environment at the start of 2022 was clouded by continued uncertainties related to the COVID-19 pandemic, inflation, and the prospect of slowing growth on the back of the Fed’s plans for policy tightening. The brutal military conflict in Ukraine added a dangerous new dimension of uncertainty in late February. Commodity prices rose sharply, led by crude oil, as the sanctions imposed on Russia by the US and European Union made it difficult for the world’s largest oil exporter to complete transactions. |
| ● | | As the year progressed, stock prices continued to suffer from the impacts of the war in Ukraine, unexpectedly high inflation, aggressive monetary tightening, and declining growth prospects around the globe. |
| ● | | Within the Index, only the energy sector generated positive returns, up nearly 29% for the period. Despite producing negative performance, utilities, healthcare and consumer staples outperformed all other sectors in the Index. The largest declines came from the communication services, consumer discretionary, and information technology sectors. |
What worked?
| ● | | Despite a challenging investment environment, especially for growth stocks, a number of holdings generated solid gains, mostly in the healthcare sector. |
| ● | | The successful launch by Eli Lilly and Company of a diabetes drug that has also demonstrated a high degree of efficacy in the treatment of obesity in clinical trials led to higher growth expectations for the company and pushed the stock to all-time highs. |
| ● | | Shares of Argenx SE continued to rise on the strength of approval by the US Food and Drug Administration (the FDA) of Vygart, the company’s treatment for myasthenia gravis, an autoimmune disease, and Argenx’s first drug to receive FDA approval. In Jennison’s view, Argenx has a solid management team, a smart business and commercialization strategy, and a compelling research and development engine to continue to build out its pipeline. |
| ● | | Demand for DexCom Inc.’s continuous glucose monitoring (CGM) systems continued to increase, driving strong revenue growth for the company and supporting its share price. |
8 Visit our website at pgim.com/investments
| ● | | Vertex Pharmaceuticals Inc. enjoyed steady results from its core cystic fibrosis product, as well as pain management and treatments for other rare diseases, driving the company’s share price sharply higher. |
| ● | | In financials, Nu Holdings Ltd. (Nubank), a Brazilian financial technology company, reported solid quarterly results with continued profitable growth, higher asset yields, and better payment volumes. Nubank is one of the largest digital banks in the world focused on user experience, but is small enough to react and develop products to take advantage of industry changes. Operating leverage was also impressive, demonstrating the potential efficiency of a digital bank. |
What didn’t work?
| ● | | In information technology, shares of payments platform company Adyen N.V. were down, despite impressive transaction volumes due to higher expenses as the company stepped up investments to sustain its long-term growth and attract additional merchants onto its platform. Shares in semiconductor equipment maker ASML Holding N.V. lost ground as the company faced supply-chain constraints; however, new orders reached historical highs, demonstrating strong demand for ASML’s products. |
| ● | | In consumer discretionary, shares in electric vehicle maker Tesla Inc. proved volatile, finishing the reporting period lower on the back of disappointments related to deliveries, the temporary shutdown of the company’s Shanghai facility, and investor concern about CEO Elon Musk. Online guest-stay platform AirBnb Inc. underperformed on concerns about a consumer slowdown amid a stalling global economy, and continued pressure on high-valuation growth stocks, as interest rates and inflation remained elevated. |
| ● | | In communication services, shares of Sea Ltd. declined due to a slowdown in the company’s gaming business and decelerating e-commerce growth. The Fund’s position was eliminated during the reporting period. |
Current outlook
| ● | | As of the end of the reporting period, the Fed’s inflation fight has been joined by central banks around the world. Tighter domestic liquidity in many economies and the pain caused by the US dollar’s surge further cloud the global outlook. |
| ● | | Growth appears poised to decelerate across Europe heading into a winter that will likely feature industrial shutdowns, fuel rationing, and lowered thermostats to offset the loss of Russian gas. Russia’s move to formally annex Eastern Ukrainian territory leaves seemingly little room for a resolution of the conflict in the near term and continues to depress sentiment. China is still coming to terms with the impacts of its “zero-COVID” policy, and more lockdowns cannot be ruled out as a result. |
| ● | | Share price declines in the period reflected a combination of increased risk aversion and lower price/earnings ratios in the face of higher interest rates. The presumption of slowing growth and possible recession are now challenging revenue estimates and |
PGIM Jennison Global Opportunities Fund 9
Strategy and Performance Overview* (continued)
| | profit margin assumptions. Jennison’s continued focus on the fundamental growth prospects for the Fund’s holdings requires an understanding of the difficulties and uncertainty created by the macroeconomic environment. |
| ● | | Most economic slowdowns and recessions in the modern era occurred under circumstances different from those confronting investors today. But the aftermaths of previous economic downturns have generally seen large-cap growth companies generating fundamental outperformance driven by innovation, leadership in large and growing addressable markets, and financial stability. Jennison sees much to be optimistic about from this perspective and in the context of the Fund’s multiyear investment horizon. |
*This strategy and performance overview, which discusses what strategies or holdings (including derivatives, if applicable) affected the Fund’s performance, is compiled based on how the Fund performed relative to the Fund’s benchmark index and is viewed for performance attribution purposes at the aggregate Fund level, which in most instances will not directly correlate to the amounts disclosed in the Statement of Operations which conform to US generally accepted accounting principles.
10 Visit our website at pgim.com/investments
Fees and Expenses (unaudited)
As a shareholder of the Fund, you incur two types of costs: (1) transaction costs, including sales charges (loads) on purchase payments and redemptions, as applicable, and (2) ongoing costs, including management fees, distribution and/or service (12b-1) fees, and other Fund expenses, as applicable. This example is intended to help you understand your ongoing costs (in dollars) of investing in the Fund and to compare these costs with the ongoing costs of investing in other mutual funds.
The example is based on an investment of $1,000 held through the six-month period ended October 31, 2022. The example is for illustrative purposes only; you should consult the Prospectus for information on initial and subsequent minimum investment requirements.
Actual Expenses
The first line for each share class in the table on the following page provides information about actual account values and actual expenses. You may use the information on this line, together with the amount you invested, to estimate the expenses that you paid over the period. Simply divide your account value by $1,000 (for example, an $8,600 account value ÷ $1,000 = 8.6), then multiply the result by the number on the first line under the heading “Expenses Paid During the Six-Month Period” to estimate the expenses you paid on your account during this period.
Hypothetical Example for Comparison Purposes
The second line for each share class in the table on the following page provides information about hypothetical account values and hypothetical expenses based on the Fund’s actual expense ratio and an assumed rate of return of 5% per year before expenses, which is not the Fund’s actual return. The hypothetical account values and expenses may not be used to estimate the actual ending account balance or expenses you paid for the period. You may use this information to compare the ongoing costs of investing in the Fund and other funds. To do so, compare this 5% hypothetical example with the 5% hypothetical examples that appear in the shareholder reports of the other funds.
The Fund’s transfer agent may charge additional fees to holders of certain accounts that are not included in the expenses shown in the table on the following page. These fees apply to individual retirement accounts (IRAs) and Section 403(b) accounts. As of the close of the six-month period covered by the table, IRA fees included an annual maintenance fee of $15 per account (subject to a maximum annual maintenance fee of $25 for all accounts held by the same shareholder). Section 403(b) accounts are charged an annual $25 fiduciary maintenance fee. Some of the fees may vary in amount, or may be waived, based on your total account balance or the number of PGIM funds, including the Fund, that you own. You should consider the additional fees that were charged to your Fund account over the six-month period when you estimate the total ongoing expenses paid over the period and the impact of these fees on your ending account value, as these additional expenses are not reflected in the information
PGIM Jennison Global Opportunities Fund 11
Fees and Expenses (continued)
provided in the expense table. Additional fees have the effect of reducing investment returns.
Please note that the expenses shown in the table are meant to highlight your ongoing costs only and do not reflect any transactional costs such as sales charges (loads). Therefore, the second line for each share class in the table is useful in comparing ongoing costs only and will not help you determine the relative total costs of owning different funds. In addition, if these transactional costs were included, your costs would have been higher.
| | | | | | | | | | |
| | | | | |
PGIM Jennison Global Opportunities Fund | | Beginning Account Value May 1, 2022 | | Ending Account Value October 31, 2022 | | Annualized Expense Ratio Based on the Six-Month Period | | Expenses Paid During the Six-Month Period* |
| | | | | |
Class A | | Actual | | $1,000.00 | | $ 855.30 | | 1.08% | | $5.05 |
| | | | | |
| | Hypothetical | | $1,000.00 | | $1,019.76 | | 1.08% | | $5.50 |
| | | | | |
Class C | | Actual | | $1,000.00 | | $ 851.80 | | 1.94% | | $9.06 |
| | | | | |
| | Hypothetical | | $1,000.00 | | $1,015.43 | | 1.94% | | $9.86 |
| | | | | |
Class Z | | Actual | | $1,000.00 | | $ 856.20 | | 0.92% | | $4.30 |
| | | | | |
| | Hypothetical | | $1,000.00 | | $1,020.57 | | 0.92% | | $4.69 |
| | | | | |
Class R2 | | Actual | | $1,000.00 | | $ 854.20 | | 1.34% | | $6.26 |
| | | | | |
| | Hypothetical | | $1,000.00 | | $1,018.45 | | 1.34% | | $6.82 |
| | | | | |
Class R4 | | Actual | | $1,000.00 | | $ 855.60 | | 1.09% | | $5.10 |
| | | | | |
| | Hypothetical | | $1,000.00 | | $1,019.71 | | 1.09% | | $5.55 |
| | | | | |
Class R6 | | Actual | | $1,000.00 | | $ 856.50 | | 0.84% | | $3.93 |
| | | | | |
| | | Hypothetical | | $1,000.00 | | $1,020.97 | | 0.84% | | $4.28 |
*Fund expenses (net of fee waivers or subsidies, if any) for each share class are equal to the annualized expense ratio for each share class (provided in the table), multiplied by the average account value over the period, multiplied by the 184 days in the six-month period ended October 31, 2022, and divided by the 365 days in the Fund’s fiscal year ended October 31, 2022 (to reflect the six-month period). Expenses presented in the table include the expenses of any underlying portfolios in which the Fund may invest.
12 Visit our website at pgim.com/investments
Schedule of Investments
as of October 31, 2022
| | | | | | | | |
| | |
Description | | Shares | | | Value | |
| | |
LONG-TERM INVESTMENTS 94.8% | | | | | | | | |
| | |
COMMON STOCKS 94.2% | | | | | | | | |
| | |
Brazil 5.5% | | | | | | | | |
| | |
MercadoLibre, Inc.*(a) | | | 179,758 | | | $ | 162,073,408 | |
NU Holdings Ltd. (Class A Stock)*(a) | | | 17,851,870 | | | | 89,259,350 | |
| | | | | | | | |
| | |
| | | | | | | 251,332,758 | |
| | |
Denmark 4.0% | | | | | | | | |
| | |
Novo Nordisk A/S (Class B Stock) | | | 1,665,325 | | | | 181,072,887 | |
| | |
France 17.7% | | | | | | | | |
| | |
Hermes International | | | 173,769 | | | | 224,924,153 | |
L’Oreal SA | | | 386,968 | | | | 121,509,651 | |
LVMH Moet Hennessy Louis Vuitton SE | | | 368,594 | | | | 232,580,931 | |
Pernod Ricard SA | | | 790,328 | | | | 138,711,490 | |
Remy Cointreau SA | | | 550,325 | | | | 84,165,573 | |
| | | | | | | | |
| | |
| | | | | | | 801,891,798 | |
| | |
Italy 3.9% | | | | | | | | |
| | |
Ferrari NV | | | 904,035 | | | | 178,220,109 | |
| | |
Netherlands 6.7% | | | | | | | | |
| | |
Adyen NV, 144A* | | | 66,764 | | | | 95,312,252 | |
Argenx SE, ADR* | | | 277,373 | | | | 107,601,308 | |
ASML Holding NV | | | 211,133 | | | | 99,039,779 | |
| | | | | | | | |
| | |
| | | | | | | 301,953,339 | |
| | |
Switzerland 1.8% | | | | | | | | |
| | |
Alcon, Inc. | | | 615,584 | | | | 37,480,074 | |
Cie Financiere Richemont SA (Class A Stock) | | | 455,247 | | | | 44,492,908 | |
| | | | | | | | |
| | |
| | | | | | | 81,972,982 | |
| | |
United Kingdom 0.7% | | | | | | | | |
| | |
Ashtead Group PLC | | | 116,340 | | | | 6,060,509 | |
AstraZeneca PLC | | | 203,243 | | | | 23,846,946 | |
| | | | | | | | |
| | |
| | | | | | | 29,907,455 | |
| | |
United States 53.0% | | | | | | | | |
| | |
Airbnb, Inc. (Class A Stock)*(a) | | | 986,198 | | | | 105,434,428 | |
Alphabet, Inc. (Class A Stock)* | | | 425,418 | | | | 40,206,255 | |
Amazon.com, Inc.* | | | 478,635 | | | | 49,031,369 | |
See Notes to Financial Statements.
PGIM Jennison Global Opportunities Fund 13
Schedule of Investments (continued)
as of October 31, 2022
| | | | | | | | |
| | |
Description | | Shares | | | Value | |
| | |
COMMON STOCKS (Continued) | | | | | | | | |
| | |
United States (cont’d.) | | | | | | | | |
| | |
Apple, Inc. | | | 2,049,110 | | | $ | 314,210,527 | |
Atlassian Corp. (Class A Stock)* | | | 509,123 | | | | 103,214,506 | |
Costco Wholesale Corp. | | | 132,260 | | | | 66,328,390 | |
Crowdstrike Holdings, Inc. (Class A Stock)* | | | 692,457 | | | | 111,624,068 | |
Dexcom, Inc.*(a) | | | 955,206 | | | | 115,369,781 | |
Eli Lilly &Co. | | | 533,570 | | | | 193,200,361 | |
Enphase Energy, Inc.* | | | 304,334 | | | | 93,430,538 | |
Lululemon Athletica, Inc.* | | | 379,317 | | | | 124,810,466 | |
Mastercard, Inc. (Class A Stock) | | | 417,018 | | | | 136,856,967 | |
Microsoft Corp. | | | 575,993 | | | | 133,705,255 | |
Netflix, Inc.* | | | 223,091 | | | | 65,115,801 | |
NVIDIA Corp. | | | 298,474 | | | | 40,285,036 | |
Palo Alto Networks, Inc.*(a) | | | 697,176 | | | | 119,628,430 | |
Tesla, Inc.* | | | 1,117,864 | | | | 254,358,775 | |
Thermo Fisher Scientific, Inc. | | | 173,034 | | | | 88,934,285 | |
UnitedHealth Group, Inc. | | | 249,783 | | | | 138,667,033 | |
Vertex Pharmaceuticals, Inc.* | | | 330,367 | | | | 103,074,504 | |
| | | | | | | | |
| | |
| | | | | | | 2,397,486,775 | |
| | |
Uruguay 0.9% | | | | | | | | |
| | |
Dlocal Ltd.*(a) | | | 1,907,596 | | | | 42,539,391 | |
| | | | | | | | |
| | |
TOTAL COMMON STOCKS | | | | | | | | |
(cost $3,572,731,447) | | | | | | | 4,266,377,494 | |
| | | | | | | | |
| | |
PREFERRED STOCK 0.6% | | | | | | | | |
| | |
Germany | | | | | | | | |
Dr. Ing. h.c. F. Porsche AG (PRFC)* | | | | | | | | |
(cost $22,288,034) | | | 276,617 | | | | 28,293,459 | |
| | | | | | | | |
| | |
TOTAL LONG-TERM INVESTMENTS | | | | | | | | |
(cost $3,595,019,481) | | | | | | | 4,294,670,953 | |
| | | | | | | | |
| | |
SHORT-TERM INVESTMENTS 7.4% | | | | | | | | |
| | |
AFFILIATED MUTUAL FUND 4.8% | | | | | | | | |
PGIM Institutional Money Market Fund | | | | | | | | |
(cost $215,397,352; includes $214,869,179 of cash collateral for securities on loan)(b)(wa) | | | 215,589,400 | | | | 215,395,369 | |
| | | | | | | | |
See Notes to Financial Statements.
14
| | | | | | | | |
| | |
Description | | Shares | | | Value | |
| | |
UNAFFILIATED FUND 2.6% | | | | | | | | |
Dreyfus Government Cash Management (Institutional Shares) | | | | | | | | |
(cost $118,537,618) | | | 118,537,618 | | | $ | 118,537,618 | |
| | | | | | | | |
| | |
TOTAL SHORT-TERM INVESTMENTS | | | | | | | | |
(cost $333,934,970) | | | | | | | 333,932,987 | |
| | | | | | | | |
| | |
TOTAL INVESTMENTS 102.2% | | | | | | | | |
(cost $3,928,954,451) | | | | | | | 4,628,603,940 | |
| Liabilities in excess of other assets (2.2)% | | | | | | | (100,854,070 | ) |
| | | | | | | | |
| | |
NET ASSETS 100.0% | | | | | | $ | 4,527,749,870 | |
| | | | | | | | |
Below is a list of the abbreviation(s) used in the annual report:
144A—Security was purchased pursuant to Rule 144A under the Securities Act of 1933 and, pursuant to the requirements of Rule 144A, may not be resold except to qualified institutional buyers.
ADR—American Depositary Receipt
LIBOR—London Interbank Offered Rate
PRFC—Preference Shares
SOFR—Secured Overnight Financing Rate
| * | Non-income producing security. |
| (a) | All or a portion of security is on loan. The aggregate market value of such securities, including those sold and pending settlement, is $215,698,167; cash collateral of $214,869,179 (included in liabilities) was received with which the Fund purchased highly liquid short-term investments. In the event of significant appreciation in value of securities on loan on the last business day of the reporting period, the Fund may reflect a collateral value that is less than the market value of the loaned securities and such shortfall is remedied the following business day. |
| (b) | Represents security, or portion thereof, purchased with cash collateral received for securities on loan and includes dividend reinvestment. |
| (wa) | PGIM Investments LLC, the manager of the Fund, also serves as manager of the PGIM Core Ultra Short Bond Fund and PGIM Institutional Money Market Fund, if applicable. |
Fair Value Measurements:
Various inputs are used in determining the value of the Fund’s investments. These inputs are summarized in the three broad levels listed below.
Level 1—unadjusted quoted prices generally in active markets for identical securities.
Level 2—quoted prices for similar securities, interest rates and yield curves, prepayment speeds, foreign currency exchange rates and other observable inputs.
Level 3—unobservable inputs for securities valued in accordance with Board approved fair valuation procedures.
See Notes to Financial Statements.
PGIM Jennison Global Opportunities Fund 15
Schedule of Investments (continued)
as of October 31, 2022
The following is a summary of the inputs used as of October 31, 2022 in valuing such portfolio securities:
| | | | | | | | | | | | | | | |
| | | Level 1 | | Level 2 | | Level 3 |
Investments in Securities | | | | | | | | | | | | | | | |
Assets | | | | | | | | | | | | | | | |
Long-Term Investments | | | | | | | | | | | | | | | |
Common Stocks | | | | | | | | | | | | | | | |
Brazil | | | $ | 251,332,758 | | | | $ | — | | | | $ | — | |
Denmark | | | | — | | | | | 181,072,887 | | | | | — | |
France | | | | — | | | | | 801,891,798 | | | | | — | |
Italy | | | | — | | | | | 178,220,109 | | | | | — | |
Netherlands | | | | 107,601,308 | | | | | 194,352,031 | | | | | — | |
Switzerland | | | | — | | | | | 81,972,982 | | | | | — | |
United Kingdom | | | | — | | | | | 29,907,455 | | | | | — | |
United States | | | | 2,397,486,775 | | | | | — | | | | | — | |
Uruguay | | | | 42,539,391 | | | | | — | | | | | — | |
Preferred Stock | | | | | | | | | | | | | | | |
Germany | | | | 28,293,459 | | | | | — | | | | | — | |
Short-Term Investments | | | | | | | | | | | | | | | |
Affiliated Mutual Fund | | | | 215,395,369 | | | | | — | | | | | — | |
Unaffiliated Fund | | | | 118,537,618 | | | | | — | | | | | — | |
| | | | | | | | | | | | | | | |
| | | |
Total | | | $ | 3,161,186,678 | | | | $ | 1,467,417,262 | | | | $ | — | |
| | | | | | | | | | | | | | | |
Industry Classification:
The industry classification of investments and liabilities in excess of other assets shown as a percentage of net assets as of October 31, 2022 were as follows:
| | | | | |
Textiles, Apparel & Luxury Goods | | | | 13.9 | % |
Software | | | | 10.3 | |
Automobiles | | | | 10.1 | |
Pharmaceuticals | | | | 8.8 | |
Technology Hardware, Storage & Peripherals | | | | 6.9 | |
IT Services | | | | 6.0 | |
Semiconductors & Semiconductor Equipment | | | | 5.2 | |
Beverages | | | | 4.9 | |
Affiliated Mutual Fund (4.7% represents investments purchased with collateral from securities on loan) | | | | 4.8 | |
Internet & Direct Marketing Retail | | | | 4.7 | |
Biotechnology | | | | 4.7 | |
Health Care Equipment & Supplies | | | | 3.3 | |
Health Care Providers & Services | | | | 3.1 | |
| | | | | |
Personal Products | | | | 2.7 | % |
Unaffiliated Fund | | | | 2.6 | |
Hotels, Restaurants & Leisure | | | | 2.3 | |
Life Sciences Tools & Services | | | | 2.0 | |
Banks | | | | 1.9 | |
Food & Staples Retailing | | | | 1.5 | |
Entertainment | | | | 1.4 | |
Interactive Media & Services | | | | 0.9 | |
Trading Companies & Distributors | | | | 0.2 | |
| | | | | |
| |
| | | | 102.2 | |
Liabilities in excess of other assets | | | | (2.2 | ) |
| | | | | |
| |
| | | | 100.0 | % |
| | | | | |
Financial Instruments/Transactions—Summary of Offsetting and Netting Arrangements:
The Fund entered into financial instruments/transactions during the reporting period that are either offset in accordance with current requirements or are subject to enforceable master netting arrangements or similar agreements that permit
See Notes to Financial Statements.
16
offsetting. The information about offsetting and related netting arrangements for financial instruments/transactions where the legal right to set-off exists is presented in the summary below.
Offsetting of financial instrument/transaction assets and liabilities:
| | | | | | | | | | |
| Description | | Gross Market
Value of
Recognized
Assets/(Liabilities) | | | | Collateral
Pledged/(Received)(1) | | | | Net Amount |
Securities on Loan | | $215,698,167 | | | | $(214,869,179) | | | | $828,988 |
| (1) | Collateral amount disclosed by the Fund is limited to the market value of financial instruments/transactions. |
See Notes to Financial Statements.
PGIM Jennison Global Opportunities Fund 17
Statement of Assets and Liabilities
as of October 31, 2022
| | | | |
Assets | | | | |
| |
Investments at value, including securities on loan of $215,698,167: | | | | |
Unaffiliated investments (cost $3,713,557,099) | | $ | 4,413,208,571 | |
Affiliated investments (cost $215,397,352) | | | 215,395,369 | |
Foreign currency, at value (cost $43,755) | | | 43,755 | |
Receivable for investments sold | | | 164,157,041 | |
Receivable for Fund shares sold | | | 15,645,040 | |
Tax reclaim receivable | | | 5,477,807 | |
Dividends receivable | | | 693,381 | |
Prepaid expenses and other assets | | | 93,969 | |
| | | | |
| |
Total Assets | | | 4,814,714,933 | |
| |
| | | | |
| |
Liabilities | | | | |
| |
Payable to broker for collateral for securities on loan | | | 214,869,179 | |
Payable for investments purchased | | | 47,306,439 | |
Payable for Fund shares purchased | | | 20,100,740 | |
Management fee payable | | | 3,032,588 | |
Accrued expenses and other liabilities | | | 1,334,178 | |
Distribution fee payable | | | 289,245 | |
Affiliated transfer agent fee payable | | | 27,537 | |
Directors’ fees payable | | | 5,157 | |
| | | | |
| |
Total Liabilities | | | 286,965,063 | |
| | | | |
| |
Net Assets | | $ | 4,527,749,870 | |
| | | | |
| |
| | | | | |
| |
Net assets were comprised of: | | | | |
Common stock, at par | | $ | 1,610 | |
Paid-in capital in excess of par | | | 4,657,782,679 | |
Total distributable earnings (loss) | | | (130,034,419 | ) |
| | | | |
| |
Net assets, October 31, 2022 | | $ | 4,527,749,870 | |
| |
| | | | |
See Notes to Financial Statements.
18
| | | | | | |
| | |
Class A | | | | | | |
| | |
Net asset value and redemption price per share, | | | | | | |
($428,096,744 ÷ 15,508,872 shares of common stock issued and outstanding) | | $ | 27.60 | | | |
Maximum sales charge (5.50% of offering price) | | | 1.61 | | | |
| | | | | | |
| | |
Maximum offering price to public | | $ | 29.21 | | | |
| | |
| | | | | | |
| | |
Class C | | | | | | |
| | |
Net asset value, offering price and redemption price per share, | | | | | | |
($238,328,867 ÷ 9,486,817 shares of common stock issued and outstanding) | | $ | 25.12 | | | |
| | |
| | | | | | |
| | |
Class Z | | | | | | |
| | |
Net asset value, offering price and redemption price per share, | | | | | | |
($2,073,103,209 ÷ 73,277,795 shares of common stock issued and outstanding) | | $ | 28.29 | | | |
| | |
| | | | | | |
| | |
Class R2 | | | | | | |
| | |
Net asset value, offering price and redemption price per share, | | | | | | |
($11,837,585 ÷ 423,637 shares of common stock issued and outstanding) | | $ | 27.94 | | | |
| | |
| | | | | | |
| | |
Class R4 | | | | | | |
| | |
Net asset value, offering price and redemption price per share, | | | | | | |
($309,829 ÷ 10,965 shares of common stock issued and outstanding) | | $ | 28.26 | | | |
| | |
| | | | | | |
| | |
Class R6 | | | | | | |
| | |
Net asset value, offering price and redemption price per share, | | | | | | |
($1,776,073,636 ÷ 62,275,227 shares of common stock issued and outstanding) | | $ | 28.52 | | | |
| | |
| | | | | | |
See Notes to Financial Statements.
PGIM Jennison Global Opportunities Fund 19
Statement of Operations
Year Ended October 31, 2022
| | | | |
Net Investment Income (Loss) | | | | |
| |
Income | | | | |
Unaffiliated dividend income (net of $4,786,509 foreign withholding tax) | | $ | 34,796,337 | |
Income from securities lending, net (including affiliated income of $238,640) | | | 274,909 | |
Affiliated dividend income | | | 21,958 | |
| |
| | | | |
| |
Total income | | | 35,093,204 | |
| |
| | | | |
| |
Expenses | | | | |
Management fee | | | 51,862,447 | |
Distribution fee(a) | | | 5,073,608 | |
Shareholder servicing fees (including affiliated expense of $7,526)(a) | | | 15,517 | |
Transfer agent’s fees and expenses (including affiliated expense of $203,255)(a) | | | 4,069,574 | |
Custodian and accounting fees | | | 521,002 | |
Shareholders’ reports | | | 477,418 | |
Registration fees(a) | | | 233,984 | |
Directors’ fees | | | 93,954 | |
Legal fees and expenses | | | 59,430 | |
Audit fee | | | 27,600 | |
SEC registration fees | | | 27,177 | |
Miscellaneous | | | 179,332 | |
| |
| | | | |
| |
Total expenses | | | 62,641,043 | |
| |
Less: Fee waiver and/or expense reimbursement(a) | | | (530,576 | ) |
Distribution fee waiver(a) | | | (284,189 | ) |
| |
| | | | |
| |
Net expenses | | | 61,826,278 | |
| |
| | | | |
| |
Net investment income (loss) | | | (26,733,074 | ) |
| | | | |
| |
Realized And Unrealized Gain (Loss) On Investment And Foreign Currency Transactions | | | | |
| |
Net realized gain (loss) on: | | | | |
Investment transactions (including affiliated of $52,322) | | | (808,119,619 | ) |
Foreign currency transactions | | | (407,883 | ) |
| | | | |
| |
| | | (808,527,502 | ) |
| | | | |
| |
Net change in unrealized appreciation (depreciation) on: | | | | |
Investments (including affiliated of $(1,983)) | | | (2,954,959,625 | ) |
Foreign currencies | | | (507,940 | ) |
| | | | |
| |
| | | (2,955,467,565 | ) |
| | | | |
| |
Net gain (loss) on investment and foreign currency transactions | | | (3,763,995,067 | ) |
| | | | |
| |
Net Increase (Decrease) In Net Assets Resulting From Operations | | $ | (3,790,728,141 | ) |
| | | | |
(a) Class specific expenses and waivers were as follows:
| | | | | | | | | | | | | | | | | | | | | | | | | | | | | | |
| | | Class A | | Class C | | Class Z | | Class R2 | | Class R4 | | Class R6 |
Distribution fee | | | | 1,705,137 | | | | | 3,330,184 | | | | | — | | | | | 38,287 | | | | | — | | | | | — | |
Shareholder servicing fees | | | | — | | | | | — | | | | | — | | | | | 15,159 | | | | | 358 | | | | | — | |
Transfer agent’s fees and expenses | | | | 505,556 | | | | | 313,604 | | | | | 3,153,445 | | | | | 24,404 | | | | | 855 | | | | | 71,710 | |
Registration fees | | | | 39,539 | | | | | 31,522 | | | | | 65,971 | | | | | 7,025 | | | | | 7,025 | | | | | 82,902 | |
Fee waiver and/or expense reimbursement | | | | (517,160) | | | | | — | | | | | — | | | | | (6,019) | | | | | (7,397 | ) | | | | — | |
Distribution fee waiver | | | | (284,189) | | | | | — | | | | | — | | | | | — | | | | | — | | | | | — | |
See Notes to Financial Statements.
20
Statements of Changes in Net Assets
| | | | | | | | |
| |
| | | Year Ended
October 31, | |
| | | 2022 | | | 2021 | |
| | |
Increase (Decrease) in Net Assets | | | | | | | | |
| | |
Operations | | | | | | | | |
Net investment income (loss) | | | $ (26,733,074 | ) | | $ | (54,854,542 | ) |
Net realized gain (loss) on investment and foreign currency transactions | | | (808,527,502 | ) | | | 900,560,726 | |
Net change in unrealized appreciation (depreciation) on investments and foreign currencies | | | (2,955,467,565 | ) | | | 1,589,333,222 | |
| | | | | | | | |
| | |
Net increase (decrease) in net assets resulting from operations | | | (3,790,728,141 | ) | | | 2,435,039,406 | |
| | | | | | | | |
| | |
Dividends and Distributions | | | | | | | | |
Distributions from distributable earnings | | | | | | | | |
Class A | | | (71,122,560 | ) | | | (9,958,088 | ) |
Class C | | | (47,133,586 | ) | | | (7,632,427 | ) |
Class Z | | | (420,099,934 | ) | | | (66,508,567 | ) |
Class R2 | | | (1,885,487 | ) | | | (7,434 | ) |
Class R4 | | | (31,140 | ) | | | (9,579 | ) |
Class R6 | | | (290,482,018 | ) | | | (36,320,678 | ) |
| | | | | | | | |
| | |
| | | (830,754,725 | ) | | | (120,436,773 | ) |
| | | | | | | | |
| | |
Tax return of capital distributions | | | | | | | | |
Class A | | | (35,800 | ) | | | — | |
Class C | | | (23,725 | ) | | | — | |
Class Z | | | (211,460 | ) | | | — | |
Class R2 | | | (949 | ) | | | — | |
Class R4 | | | (16 | ) | | | — | |
Class R6 | | | (146,216 | ) | | | — | |
| | | | | | | | |
| | |
| | | (418,166 | ) | | | — | |
| | | | | | | | |
| | |
Fund share transactions (Net of share conversions) | | | | | | | | |
Net proceeds from shares sold | | | 1,698,275,216 | | | | 3,048,592,811 | |
Net asset value of shares issued in reinvestment of dividends and distributions | | | 818,705,147 | | | | 117,629,727 | |
Cost of shares purchased | | | (2,777,192,591 | ) | | | (2,124,201,273 | ) |
| | | | | | | | |
| | |
Net increase (decrease) in net assets from Fund share transactions | | | (260,212,228 | ) | | | 1,042,021,265 | |
| | | | | | | | |
| | |
Total increase (decrease) | | | (4,882,113,260 | ) | | | 3,356,623,898 | |
| | |
Net Assets: | | | | | | | | |
| | |
Beginning of year | | | 9,409,863,130 | | | | 6,053,239,232 | |
| | | | | | | | |
| | |
End of year | | | $ 4,527,749,870 | | | $ | 9,409,863,130 | |
| | | | | | | | |
See Notes to Financial Statements.
PGIM Jennison Global Opportunities Fund 21
Financial Highlights
| | | | | | | | | | | | | | | | | | | | |
| | | | | | |
| Class A Shares | | | | | | | | | | | | | | | |
| | | Year Ended October 31, | |
| | | 2022 | | | 2021 | | | 2020 | | | 2019 | | | 2018 | |
| | | | | | |
Per Share Operating Performance(a): | | | | | | | | | | | | | | | | | | | | |
| | | | | | |
Net Asset Value, Beginning of Year | | | $52.15 | | | | $38.50 | | | | $24.58 | | | | $21.47 | | | | $20.72 | |
| | | | | | |
Income (loss) from investment operations: | | | | | | | | | | | | | | | | | | | | |
| | | | | | |
Net investment income (loss) | | | (0.19 | ) | | | (0.37 | ) | | | (0.22 | ) | | | (0.11 | ) | | | (0.13 | ) |
| | | | | | |
| Net realized and unrealized gain (loss) on investment and foreign currency transactions | | | (19.72 | ) | | | 14.76 | | | | 14.14 | | | | 3.22 | | | | 0.88 | |
| | | | | | |
Total from investment operations | | | (19.91 | ) | | | 14.39 | | | | 13.92 | | | | 3.11 | | | | 0.75 | |
| | | | | | |
Less Dividends and Distributions: | | | | | | | | | | | | | | | | | | | | |
| | | | | | |
Tax return of capital distributions | | | (- | )(b) | | | - | | | | - | | | | - | | | | - | |
| | | | | | |
Distributions from net realized gains | | | (4.64 | ) | | | (0.74 | ) | | | - | | | | - | | | | - | |
| | | | | | |
Total dividends and distributions | | | (4.64 | ) | | | (0.74 | ) | | | - | | | | - | | | | - | |
| | | | | | |
Net asset value, end of year | | | $27.60 | | | | $52.15 | | | | $38.50 | | | | $24.58 | | | | $21.47 | |
| | | | | | |
Total Return(c): | | | (41.69 | )% | | | 37.75 | % | | | 56.63 | % | | | 14.49 | % | | | 3.62 | % |
| | | | | | |
| | | | | | | | | | | | | | | | | | | | |
| | | | | | |
| Ratios/Supplemental Data: | | | | | | | | | | | | | | | |
| | | | | | |
Net assets, end of year (000) | | | $428,097 | | | | $797,091 | | | | $494,173 | | | | $236,118 | | | | $164,764 | |
| | | | | | |
Average net assets (000) | | | $568,379 | | | | $684,569 | | | | $344,283 | | | | $205,653 | | | | $142,313 | |
| | | | | | |
Ratios to average net assets(d): | | | | | | | | | | | | | | | | | | | | |
| | | | | | |
Expenses after waivers and/or expense reimbursement | | | 1.08 | % | | | 1.08 | % | | | 1.08 | % | | | 1.08 | % | | | 1.14 | % |
| | | | | | |
Expenses before waivers and/or expense reimbursement | | | 1.22 | % | | | 1.21 | % | | | 1.24 | % | | | 1.28 | % | | | 1.30 | % |
| | | | | | |
Net investment income (loss) | | | (0.53 | )% | | | (0.80 | )% | | | (0.69 | )% | | | (0.45 | )% | | | (0.55 | )% |
| | | | | | |
Portfolio turnover rate(e) | | | 84 | % | | | 62 | % | | | 57 | % | | | 52 | % | | | 62 | % |
| (a) | Calculated based on average shares outstanding during the year. |
| (b) | Amount rounds to zero. |
| (c) | Total return does not consider the effects of sales loads. Total return is calculated assuming a purchase of a share on the first day and a sale on the last day of each year reported and includes reinvestment of dividends and distributions, if any. Total returns may reflect adjustments to conform to GAAP. |
| (d) | Does not include expenses of the underlying funds in which the Fund invests. |
| (e) | The Fund’s portfolio turnover rate is calculated in accordance with regulatory requirements, without regard to transactions involving short-term investments, certain derivatives and in-kind transactions (if any). If such transactions were included, the Fund’s portfolio turnover rate may be higher. |
See Notes to Financial Statements.
22
| | | | | | | | | | | | | | | | | | | | |
| | | | | | |
| Class C Shares | | | | | | | | | | | | | | | |
| | | Year Ended October 31, | |
| | | 2022 | | | 2021 | | | 2020 | | | 2019 | | | 2018 | |
| | | | | | |
Per Share Operating Performance(a): | | | | | | | | | | | | | | | | | | | | |
| | | | | | |
Net Asset Value, Beginning of Year | | | $48.27 | | | | $35.98 | | | | $23.16 | | | | $20.41 | | | | $19.85 | |
| | | | | | |
Income (loss) from investment operations: | | | | | | | | | | | | | | | | | | | | |
| | | | | | |
Net investment income (loss) | | | (0.45 | ) | | | (0.70 | ) | | | (0.45 | ) | | | (0.29 | ) | | | (0.30 | ) |
| | | | | | |
| Net realized and unrealized gain (loss) on investment and foreign currency transactions | | | (18.06 | ) | | | 13.73 | | | | 13.27 | | | | 3.04 | | | | 0.86 | |
| | | | | | |
Total from investment operations | | | (18.51 | ) | | | 13.03 | | | | 12.82 | | | | 2.75 | | | | 0.56 | |
| | | | | | |
Less Dividends and Distributions: | | | | | | | | | | | | | | | | | | | | |
| | | | | | |
Tax return of capital distributions | | | (- | )(b) | | | - | | | | - | | | | - | | | | - | |
| | | | | | |
Distributions from net realized gains | | | (4.64 | ) | | | (0.74 | ) | | | - | | | | - | | | | - | |
| | | | | | |
Total dividends and distributions | | | (4.64 | ) | | | (0.74 | ) | | | - | | | | - | | | | - | |
| | | | | | |
Net asset value, end of year | | | $25.12 | | | | $48.27 | | | | $35.98 | | | | $23.16 | | | | $20.41 | |
| | | | | | |
Total Return(c): | | | (42.19 | )% | | | 36.63 | % | | | 55.31 | % | | | 13.47 | % | | | 2.82 | % |
| | | | | | |
| | | | | | | | | | | | | | | | | | | | |
| | | | | | |
| Ratios/Supplemental Data: | | | | | | | | | | | | | | | |
| | | | | | |
Net assets, end of year (000) | | | $238,329 | | | | $496,435 | | | | $364,557 | | | | $211,290 | | | | $168,587 | |
| | | | | | |
Average net assets (000) | | | $333,018 | | | | $449,870 | | | | $279,272 | | | | $198,518 | | | | $136,788 | |
| | | | | | |
Ratios to average net assets(d): | | | | | | | | | | | | | | | | | | | | |
| | | | | | |
Expenses after waivers and/or expense reimbursement | | | 1.93 | % | | | 1.91 | % | | | 1.93 | % | | | 1.94 | % | | | 1.94 | % |
| | | | | | |
Expenses before waivers and/or expense reimbursement | | | 1.93 | % | | | 1.91 | % | | | 1.93 | % | | | 1.97 | % | | | 1.99 | % |
| | | | | | |
Net investment income (loss) | | | (1.38 | )% | | | (1.62 | )% | | | (1.53 | )% | | | (1.31 | )% | | | (1.35 | )% |
| | | | | | |
Portfolio turnover rate(e) | | | 84 | % | | | 62 | % | | | 57 | % | | | 52 | % | | | 62 | % |
| (a) | Calculated based on average shares outstanding during the year. |
| (b) | Amount rounds to zero. |
| (c) | Total return does not consider the effects of sales loads. Total return is calculated assuming a purchase of a share on the first day and a sale on the last day of each year reported and includes reinvestment of dividends and distributions, if any. Total returns may reflect adjustments to conform to GAAP. |
| (d) | Does not include expenses of the underlying funds in which the Fund invests. |
| (e) | The Fund’s portfolio turnover rate is calculated in accordance with regulatory requirements, without regard to transactions involving short-term investments, certain derivatives and in-kind transactions (if any). If such transactions were included, the Fund’s portfolio turnover rate may be higher. |
See Notes to Financial Statements.
PGIM Jennison Global Opportunities Fund 23
Financial Highlights (continued)
| | | | | | | | | | | | | | | | | | | | |
| | | | | | |
| Class Z Shares | | | | | | | | | | | | | | | |
| | | Year Ended October 31, | |
| | | 2022 | | | 2021 | | | 2020 | | | 2019 | | | 2018 | |
| | | | | | |
Per Share Operating Performance(a): | | | | | | | | | | | | | | | | | | | | |
| | | | | | |
Net Asset Value, Beginning of Year | | | $53.25 | | | | $39.24 | | | | $25.01 | | | | $21.82 | | | | $21.00 | |
| | | | | | |
Income (loss) from investment operations: | | | | | | | | | | | | | | | | | | | | |
| | | | | | |
Net investment income (loss) | | | (0.14 | ) | | | (0.30 | ) | | | (0.17 | ) | | | (0.07 | ) | | | (0.08 | ) |
| | | | | | |
| Net realized and unrealized gain (loss) on investment and foreign currency transactions | | | (20.18 | ) | | | 15.05 | | | | 14.40 | | | | 3.26 | | | | 0.90 | |
| | | | | | |
Total from investment operations | | | (20.32 | ) | | | 14.75 | | | | 14.23 | | | | 3.19 | | | | 0.82 | |
| | | | | | |
Less Dividends and Distributions: | | | | | | | | | | | | | | | | | | | | |
| | | | | | |
Tax return of capital distributions | | | (- | )(b) | | | - | | | | - | | | | - | | | | - | |
| | | | | | |
Distributions from net realized gains | | | (4.64 | ) | | | (0.74 | ) | | | - | | | | - | | | | - | |
| | | | | | |
Total dividends and distributions | | | (4.64 | ) | | | (0.74 | ) | | | - | | | | - | | | | - | |
| | | | | | |
Net asset value, end of year | | | $28.29 | | | | $53.25 | | | | $39.24 | | | | $25.01 | | | | $21.82 | |
| | | | | | |
Total Return(c): | | | (41.59 | )% | | | 37.96 | % | | | 56.90 | % | | | 14.62 | % | | | 3.90 | % |
| | | | | | |
| | | | | | | | | | | | | | | | | | | | |
| | | | | | |
| Ratios/Supplemental Data: | | | | | | | | | | | | | | | |
| | | | | | |
Net assets, end of year (000) | | | $2,073,103 | | | | $4,792,805 | | | | $3,390,006 | | | | $1,466,571 | | | | $927,492 | |
| | | | | | |
Average net assets (000) | | | $3,132,931 | | | | $4,303,934 | | | | $2,338,060 | | | | $1,228,375 | | | | $693,749 | |
| | | | | | |
Ratios to average net assets(d): | | | | | | | | | | | | | | | | | | | | |
| | | | | | |
Expenses after waivers and/or expense reimbursement | | | 0.93 | % | | | 0.92 | % | | | 0.93 | % | | | 0.94 | % | | | 0.93 | % |
| | | | | | |
Expenses before waivers and/or expense reimbursement | | | 0.93 | % | | | 0.92 | % | | | 0.93 | % | | | 0.96 | % | | | 0.97 | % |
| | | | | | |
Net investment income (loss) | | | (0.39 | )% | | | (0.64 | )% | | | (0.54 | )% | | | (0.31 | )% | | | (0.35 | )% |
| | | | | | |
Portfolio turnover rate(e) | | | 84 | % | | | 62 | % | | | 57 | % | | | 52 | % | | | 62 | % |
| (a) | Calculated based on average shares outstanding during the year. |
| (b) | Amount rounds to zero. |
| (c) | Total return is calculated assuming a purchase of a share on the first day and a sale on the last day of each year reported and includes reinvestment of dividends and distributions, if any. Total returns may reflect adjustments to conform to GAAP. |
| (d) | Does not include expenses of the underlying funds in which the Fund invests. |
| (e) | The Fund’s portfolio turnover rate is calculated in accordance with regulatory requirements, without regard to transactions involving short-term investments, certain derivatives and in-kind transactions (if any). If such transactions were included, the Fund’s portfolio turnover rate may be higher. |
See Notes to Financial Statements.
24
| | | | | | | | | | | | | | | | | | | | | | | | | | | | | | |
| | | | | | | |
| Class R2 Shares | | | | | | | | | | | | |
| | | Year Ended October 31, | | | | December 27, 2018(a)
through October 31, | | |
| | | 2022 | | 2021 | | 2020 | | | | 2019 | | |
| | | | | | | |
Per Share Operating Performance(b): | | | | | | | | | | | | | | | | | | | | | | | | | | | | | | |
| | | | | | | |
Net Asset Value, Beginning of Period | | | | $52.86 | | | | | $39.10 | | | | | $25.02 | | | | | | | | | | $20.59 | | | | | | |
| | | | | | | |
Income (loss) from investment operations: | | | | | | | | | | | | | | | | | | | | | | | | | | | | | | |
| | | | | | | |
Net investment income (loss) | | | | (0.28 | ) | | | | (0.48 | ) | | | | (0.31 | ) | | | | | | | | | (0.12 | ) | | | | | |
| | | | | | | |
| Net realized and unrealized gain (loss) on investment and foreign currency transactions | | | | (20.00 | ) | | | | 14.98 | | | | | 14.39 | | | | | | | | | | 4.55 | | | | | | |
| | | | | | | |
Total from investment operations | | | | (20.28 | ) | | | | 14.50 | | | | | 14.08 | | | | | | | | | | 4.43 | | | | | | |
| | | | | | | |
Less Dividends and Distributions: | | | | | | | | | | | | | | | | | | | | | | | | | | | | | | |
| | | | | | | |
Tax return of capital distributions | | | | (- | )(c) | | | | - | | | | | - | | | | | | | | | | - | | | | | | |
| | | | | | | |
Distributions from net realized gains | | | | (4.64 | ) | | | | (0.74 | ) | | | | - | | | | | | | | | | - | | | | | | |
| | | | | | | |
Total dividends and distributions | | | | (4.64 | ) | | | | (0.74 | ) | | | | - | | | | | | | | | | - | | | | | | |
| | | | | | | |
Net asset value, end of period | | | | $27.94 | | | | | $52.86 | | | | | $39.10 | | | | | | | | | | $25.02 | | | | | | |
| | | | | | | |
Total Return(d): | | | | (41.85 | )% | | | | 37.45 | % | | | | 56.27 | % | | | | | | | | | 21.52 | % | | | | | |
| | | | | | | |
| | | | | | | | | | | | | | | | | | | | | | | | | | | | | | |
| | | | | | | |
| Ratios/Supplemental Data: | | | | | | | | | | | | |
| | | | | | | |
Net assets, end of period (000) | | | | $11,838 | | | | | $21,615 | | | | | $377 | | | | | | | | | | $12 | | | | | | |
| | | | | | | |
Average net assets (000) | | | | $15,315 | | | | | $12,667 | | | | | $221 | | | | | | | | | | $13 | | | | | | |
| | | | | | | |
Ratios to average net assets(e): | | | | | | | | | | | | | | | | | | | | | | | | | | | | | | |
| | | | | | | |
Expenses after waivers and/or expense reimbursement | | | | 1.34 | % | | | | 1.34 | % | | | | 1.33 | % | | | | | | | | | 1.34 | %(f) | | | | | |
| | | | | | | |
Expenses before waivers and/or expense reimbursement | | | | 1.38 | % | | | | 1.39 | % | | | | 7.68 | % | | | | | | | | | 216.05 | %(f) | | | | | |
| | | | | | | |
Net investment income (loss) | | | | (0.79 | )% | | | | (1.00 | )% | | | | (0.92 | )% | | | | | | | | | (0.58 | )%(f) | | | | | |
| | | | | | | |
Portfolio turnover rate(g) | | | | 84 | % | | | | 62 | % | | | | 57 | % | | | | | | | | | 52 | % | | | | | |
| (a) | Commencement of offering. |
| (b) | Calculated based on average shares outstanding during the period. |
| (c) | Amount rounds to zero. |
| (d) | Total return is calculated assuming a purchase of a share on the first day and a sale on the last day of each period reported and includes reinvestment of dividends and distributions, if any. Total returns may reflect adjustments to conform to GAAP. Total returns for periods less than one full year are not annualized. |
| (e) | Does not include expenses of the underlying funds in which the Fund invests. |
| (g) | The Fund’s portfolio turnover rate is calculated in accordance with regulatory requirements, without regard to transactions involving short-term investments, certain derivatives and in-kind transactions (if any). If such transactions were included, the Fund’s portfolio turnover rate may be higher. |
See Notes to Financial Statements.
PGIM Jennison Global Opportunities Fund 25
Financial Highlights (continued)
| | | | | | | | | | | | | | | | | | | | | | | | | | | | | | |
| | | | | | | |
| Class R4 Shares | | | | | | | | | | | | |
| | | Year Ended October 31, | | | | December 27, 2018(a)
through October 31, | | |
| | | 2022 | | 2021 | | 2020 | | | | 2019 | | |
| | | | | | | |
Per Share Operating Performance(b): | | | | | | | | | | | | | | | | | | | | | | | | | | | | | | |
| | | | | | | |
Net Asset Value, Beginning of Period | | | | $53.27 | | | | | $39.31 | | | | | $25.08 | | | | | | | | | | $20.59 | | | | | | |
| | | | | | | |
Income (loss) from investment operations: | | | | | | | | | | | | | | | | | | | | | | | | | | | | | | |
| | | | | | | |
Net investment income (loss) | | | | (0.18 | ) | | | | (0.37 | ) | | | | (0.19 | ) | | | | | | | | | (0.10 | ) | | | | | |
| | | | | | | |
| Net realized and unrealized gain (loss) on investment and foreign currency transactions | | | | (20.19 | ) | | | | 15.07 | | | | | 14.42 | | | | | | | | | | 4.59 | | | | | | |
| | | | | | | |
Total from investment operations | | | | (20.37 | ) | | | | 14.70 | | | | | 14.23 | | | | | | | | | | 4.49 | | | | | | |
| | | | | | | |
Less Dividends and Distributions: | | | | | | | | | | | | | | | | | | | | | | | | | | | | | | |
| | | | | | | |
Tax return of capital distributions | | | | (- | )(c) | | | | - | | | | | - | | | | | | | | | | - | | | | | | |
| | | | | | | |
Distributions from net realized gains | | | | (4.64 | ) | | | | (0.74 | ) | | | | - | | | | | | | | | | - | | | | | | |
| | | | | | | |
Total dividends and distributions | | | | (4.64 | ) | | | | (0.74 | ) | | | | - | | | | | | | | | | - | | | | | | |
| | | | | | | |
Net asset value, end of period | | | | $28.26 | | | | | $53.27 | | | | | $39.31 | | | | | | | | | | $25.08 | | | | | | |
| | | | | | | |
Total Return(d): | | | | (41.68 | )% | | | | 37.76 | % | | | | 56.74 | % | | | | | | | | | 21.81 | % | | | | | |
| | | | | | | |
| | | | | | | | | | | | | | | | | | | | | | | | | | | | | | |
| | | | | | | |
| Ratios/Supplemental Data: | | | | | | | | | | | | |
| | | | | | | |
Net assets, end of period (000) | | | | $310 | | | | | $332 | | | | | $505 | | | | | | | | | | $362 | | | | | | |
| | | | | | | |
Average net assets (000) | | | | $318 | | | | | $696 | | | | | $433 | | | | | | | | | | $122 | | | | | | |
| | | | | | | |
Ratios to average net assets(e): | | | | | | | | | | | | | | | | | | | | | | | | | | | | | | |
| | | | | | | |
Expenses after waivers and/or expense reimbursement | | | | 1.09 | % | | | | 1.06 | % | | | | 1.02 | % | | | | | | | | | 0.97 | %(f) | | | | | |
| | | | | | | |
Expenses before waivers and/or expense reimbursement | | | | 3.42 | % | | | | 2.18 | % | | | | 4.28 | % | | | | | | | | | 23.67 | %(f) | | | | | |
| | | | | | | |
Net investment income (loss) | | | | (0.51 | )% | | | | (0.78 | )% | | | | (0.60 | )% | | | | | | | | | (0.46 | )%(f) | | | | | |
| | | | | | | |
Portfolio turnover rate(g) | | | | 84 | % | | | | 62 | % | | | | 57 | % | | | | | | | | | 52 | % | | | | | |
| (a) | Commencement of offering. |
| (b) | Calculated based on average shares outstanding during the period. |
| (c) | Amount rounds to zero. |
| (d) | Total return is calculated assuming a purchase of a share on the first day and a sale on the last day of each period reported and includes reinvestment of dividends and distributions, if any. Total returns may reflect adjustments to conform to GAAP. Total returns for periods less than one full year are not annualized. |
| (e) | Does not include expenses of the underlying funds in which the Fund invests. |
| (g) | The Fund’s portfolio turnover rate is calculated in accordance with regulatory requirements, without regard to transactions involving short-term investments, certain derivatives and in-kind transactions (if any). If such transactions were included, the Fund’s portfolio turnover rate may be higher. |
See Notes to Financial Statements.
26
| | | | | | | | | | | | | | | | | | | | |
| | | | | | |
| Class R6 Shares | | | | | | | | | | | | | | | |
| | | Year Ended October 31, | |
| | | 2022 | | | 2021 | | | 2020 | | | 2019 | | | 2018 | |
| | | | | | |
Per Share Operating Performance(a): | | | | | | | | | | | | | | | | | | | | |
| | | | | | |
Net Asset Value, Beginning of Year | | | $53.60 | | | | $39.46 | | | | $25.13 | | | | $21.90 | | | | $21.06 | |
| | | | | | |
Income (loss) from investment operations: | | | | | | | | | | | | | | | | | | | | |
| | | | | | |
Net investment income (loss) | | | (0.10 | ) | | | (0.26 | ) | | | (0.15 | ) | | | (0.06 | ) | | | (0.06 | ) |
| | | | | | |
| Net realized and unrealized gain (loss) on investment and foreign currency transactions | | | (20.34 | ) | | | 15.14 | | | | 14.48 | | | | 3.29 | | | | 0.90 | |
| | | | | | |
Total from investment operations | | | (20.44 | ) | | | 14.88 | | | | 14.33 | | | | 3.23 | | | | 0.84 | |
| | | | | | |
Less Dividends and Distributions: | | | | | | | | | | | | | | | | | | | | |
| | | | | | |
Tax return of capital distributions | | | (- | )(b) | | | - | | | | - | | | | - | | | | - | |
| | | | | | |
Distributions from net realized gains | | | (4.64 | ) | | | (0.74 | ) | | | - | | | | - | | | | - | |
| | | | | | |
Total dividends and distributions | | | (4.64 | ) | | | (0.74 | ) | | | - | | | | - | | | | - | |
| | | | | | |
Net asset value, end of year | | | $28.52 | | | | $53.60 | | | | $39.46 | | | | $25.13 | | | | $21.90 | |
| | | | | | |
Total Return(c): | | | (41.54 | )% | | | 38.08 | % | | | 57.02 | % | | | 14.75 | % | | | 3.99 | % |
| | | | | | |
| | | | | | | | | | | | | | | | | | | | |
| | | | | | |
| Ratios/Supplemental Data: | | | | | | | | | | | | | | | |
| | | | | | |
Net assets, end of year (000) | | | $1,776,074 | | | | $3,301,585 | | | | $1,803,620 | | | | $641,419 | | | | $253,010 | |
| | | | | | |
Average net assets (000) | | | $2,401,595 | | | | $2,690,566 | | | | $1,074,262 | | | | $448,178 | | | | $133,984 | |
| | | | | | |
Ratios to average net assets(d): | | | | | | | | | | | | | | | | | | | | |
| | | | | | |
Expenses after waivers and/or expense reimbursement | | | 0.83 | % | | | 0.83 | % | | | 0.84 | % | | | 0.84 | % | | | 0.84 | % |
| | | | | | |
Expenses before waivers and/or expense reimbursement | | | 0.83 | % | | | 0.83 | % | | | 0.84 | % | | | 0.87 | % | | | 0.90 | % |
| | | | | | |
Net investment income (loss) | | | (0.28 | )% | | | (0.54 | )% | | | (0.46 | )% | | | (0.23 | )% | | | (0.26 | )% |
| | | | | | |
Portfolio turnover rate(e) | | | 84 | % | | | 62 | % | | | 57 | % | | | 52 | % | | | 62 | % |
| (a) | Calculated based on average shares outstanding during the year. |
| (b) | Amount rounds to zero. |
| (c) | Total return is calculated assuming a purchase of a share on the first day and a sale on the last day of each year reported and includes reinvestment of dividends and distributions, if any. Total returns may reflect adjustments to conform to GAAP. |
| (d) | Does not include expenses of the underlying funds in which the Fund invests. |
| (e) | The Fund’s portfolio turnover rate is calculated in accordance with regulatory requirements, without regard to transactions involving short-term investments, certain derivatives and in-kind transactions (if any). If such transactions were included, the Fund’s portfolio turnover rate may be higher. |
See Notes to Financial Statements.
PGIM Jennison Global Opportunities Fund 27
Notes to Financial Statements
Prudential World Fund, Inc. (the “Registered Investment Company” or “RIC”) is registered under the Investment Company Act of 1940, as amended (“1940 Act”), as an open-end management investment company. The RIC is organized as a Maryland Corporation. These financial statements relate only to the PGIM Jennison Global Opportunities Fund (the “Fund”), a series of the RIC. The Fund is classified as a diversified fund for purposes of the 1940 Act.
The investment objective of the Fund is to seek long-term growth of capital.
The Fund follows the investment company accounting and reporting guidance of the Financial Accounting Standards Board (“FASB”) Accounting Standard Codification (“ASC”) Topic 946 Financial Services — Investment Companies. The following is a summary of significant accounting policies followed by the Fund in the preparation of its financial statements. The policies conform to U.S. generally accepted accounting principles (“GAAP”). The Fund consistently follows such policies in the preparation of its financial statements.
Securities Valuation: The Fund holds securities and other assets and liabilities that are fair valued as of the close of each day (generally, 4:00 PM Eastern time) the New York Stock Exchange (“NYSE”) is open for trading. As described in further detail below, the Fund’s investments are valued daily based on a number of factors, including the type of investment and whether market quotations are readily available. The RIC’s Board of Directors (the “Board”) has approved the Fund’s valuation policies and procedures for security valuation and designated to PGIM Investments LLC (“PGIM Investments” or the “Manager”) as the Valuation Designee pursuant to SEC Rule 2a-5(b) to perform the fair value determination relating to all Fund investments. Pursuant to the Board’s oversight, the Valuation Designee has established a Valuation Committee to perform the duties and responsibilities as valuation designee under SEC Rule 2a-5. The valuation procedures permit the Fund to utilize independent pricing vendor services, quotations from market makers, and alternative valuation methods when market quotations are either not readily available or not deemed representative of fair value. Fair value is the price that would be received to sell an asset or paid to transfer a liability in an orderly transaction between market participants on the measurement date. A record of the Valuation Committee’s actions is provided to the Board at the first quarterly meeting following the quarter in which such actions take place.
For the fiscal reporting year-end, securities and other assets and liabilities were fair valued at the close of the last U.S. business day. Trading in certain foreign securities may occur when the NYSE is closed (including weekends and holidays). Because such foreign securities
28
trade in markets that are open on weekends and U.S. holidays, the values of some of the Fund’s foreign investments may change on days when investors cannot purchase or redeem Fund shares.
Various inputs determine how the Fund’s investments are valued, all of which are categorized according to the three broad levels (Level 1, 2, or 3) detailed in the Schedule of Investments and referred to herein as the “fair value hierarchy” in accordance with FASB ASC Topic 820 - Fair Value Measurement.
Common or preferred stocks, exchange-traded funds and derivative instruments, if applicable, that are traded on a national securities exchange are valued at the last sale price as of the close of trading on the applicable exchange where the security principally trades. Securities traded via NASDAQ are valued at the NASDAQ official closing price. To the extent these securities are valued at the last sale price or NASDAQ official closing price, they are classified as Level 1 in the fair value hierarchy. In the event that no sale or official closing price on valuation date exists, these securities are generally valued at the mean between the last reported bid and ask prices, or at the last bid price in the absence of an ask price. These securities are classified as Level 2 in the fair value hierarchy.
Foreign equities traded on foreign securities exchanges are generally valued using pricing vendor services that provide model prices derived using adjustment factors based on information such as local closing price, relevant general and sector indices, currency fluctuations, depositary receipts, and futures, as applicable. Securities valued using such model prices are classified as Level 2 in the fair value hierarchy. The models generate an evaluated adjustment factor for each security, which is applied to the local closing price to adjust it for post closing market movements up to the time the Fund is valued. Utilizing that evaluated adjustment factor, the vendor provides an evaluated price for each security. If the vendor does not provide an evaluated price, securities are valued in accordance with exchange-traded common and preferred stock valuation policies discussed above.
Investments in open-end funds (other than exchange-traded funds) are valued at their net asset values as of the close of the NYSE on the date of valuation. These securities are classified as Level 1 in the fair value hierarchy since they may be purchased or sold at their net asset values on the date of valuation.
Securities and other assets that cannot be priced according to the methods described above are valued based on policies and procedures approved by the Board. In the event that unobservable inputs are used when determining such valuations, the securities will be classified as Level 3 in the fair value hierarchy. Altering one or more unobservable inputs may result in a significant change to a Level 3 security’s fair value measurement.
When determining the fair value of securities, some of the factors influencing the valuation include: the nature of any restrictions on disposition of the securities; assessment of the general liquidity of the securities; the issuer’s financial condition and the markets in which it does business; the cost of the investment; the size of the holding and the capitalization of
PGIM Jennison Global Opportunities Fund 29
Notes to Financial Statements (continued)
the issuer; the prices of any recent transactions or bids/offers for such securities or any comparable securities; any available analyst media or other reports or information deemed reliable by the Valuation Designee regarding the issuer or the markets or industry in which it operates. Using fair value to price securities may result in a value that is different from a security’s most recent closing price and from the price used by other unaffiliated mutual funds to calculate their net asset values.
Foreign Currency Translation: The books and records of the Fund are maintained in U.S. dollars. Foreign currency amounts are translated into U.S. dollars on the following basis:
(i) market value of investment securities, other assets and liabilities — at the exchange rate as of the valuation date;
(ii) purchases and sales of investment securities, income and expenses — at the rates of exchange prevailing on the respective dates of such transactions.
Although the net assets of the Fund are presented at the foreign exchange rates and market values at the close of the period, the Fund does not generally isolate that portion of the results of operations arising as a result of changes in the foreign exchange rates from the fluctuations arising from changes in the market prices of long-term portfolio securities held at the end of the period. Similarly, the Fund does not isolate the effect of changes in foreign exchange rates from the fluctuations arising from changes in the market prices of long-term portfolio securities sold during the period. Accordingly, holding period unrealized and realized foreign currency gains (losses) are included in the reported net change in unrealized appreciation (depreciation) on investments and net realized gains (losses) on investment transactions on the Statements of Operations.
Net realized gains (losses) on foreign currency transactions represent net foreign exchange gains (losses) from the disposition of holdings of foreign currencies, currency gains (losses) realized between the trade and settlement dates on investment transactions, and the difference between the amounts of interest, dividends and foreign withholding taxes recorded on the Fund’s books and the U.S. dollar equivalent amounts actually received or paid. Net unrealized currency gains (losses) arise from valuing foreign currency denominated assets and liabilities (other than investments) at period end exchange rates.
Master Netting Arrangements: The RIC, on behalf of the Fund, is subject to various Master Agreements, or netting arrangements, with select counterparties. These are agreements which a subadviser may have negotiated and entered into on behalf of all or a portion of the Fund. A master netting arrangement between the Fund and the counterparty permits the Fund to offset amounts payable by the Fund to the same counterparty against amounts to be received; and by the receipt of collateral from the counterparty by the Fund to cover the
30
Fund’s exposure to the counterparty. However, there is no assurance that such mitigating factors are easily enforceable. In addition to master netting arrangements, the right to set-off exists when all the conditions are met such that each of the parties owes the other determinable amounts, the reporting party has the right to set-off the amount owed with the amount owed by the other party, the reporting party intends to set-off and the right of set-off is enforceable by law.
Securities Lending: The Fund lends its portfolio securities to banks and broker-dealers. The loans are secured by collateral at least equal to the market value of the securities loaned. Collateral pledged by each borrower is invested in an affiliated money market fund and is marked to market daily, based on the previous day’s market value, such that the value of the collateral exceeds the value of the loaned securities. In the event of significant appreciation in value of securities on loan on the last business day of the reporting period, the financial statements may reflect a collateral value that is less than the market value of the loaned securities. Such shortfall is remedied as described above. Loans are subject to termination at the option of the borrower or the Fund. Upon termination of the loan, the borrower will return to the Fund securities identical to the loaned securities. The remaining open loans of the securities lending transactions are considered overnight and continuous. Should the borrower of the securities fail financially, the Fund has the right to repurchase the securities in the open market using the collateral.
The Fund recognizes income, net of any rebate and securities lending agent fees, for lending its securities in the form of fees or interest on the investment of any cash received as collateral. The borrower receives all interest and dividends from the securities loaned and such payments are passed back to the lender in amounts equivalent thereto, which are reflected in interest income or unaffiliated dividend income based on the nature of the payment on the Statement of Operations. The Fund also continues to recognize any unrealized gain (loss) in the market price of the securities loaned and on the change in the value of the collateral invested that may occur during the term of the loan. In addition, realized gain (loss) is recognized on changes in the value of the collateral invested upon liquidation of the collateral. Net earnings from securities lending are disclosed in the Statement of Operations.
Securities Transactions and Net Investment Income: Securities transactions are recorded on the trade date. Realized gains (losses) from investment and currency transactions are calculated on the specific identification method. Dividend income is recorded on the ex-date, or for certain foreign securities, when the Fund becomes aware of such dividends. Expenses are recorded on an accrual basis, which may require the use of certain estimates by management that may differ from actual. Net investment income or loss (other than class specific expenses and waivers, which are allocated as noted below) and unrealized and realized gains (losses) are allocated daily to each class of shares based upon the relative proportion of adjusted net assets of each class at the beginning of the day. Class specific expenses and waivers, where applicable, are charged to the respective share classes. Such class specific expenses and waivers include distribution fees and distribution fee waivers,
PGIM Jennison Global Opportunities Fund 31
Notes to Financial Statements (continued)
shareholder servicing fees, transfer agent’s fees and expenses, registration fees and fee waivers and/or expense reimbursements, as applicable.
Taxes: It is the Fund’s policy to continue to meet the requirements of the Internal Revenue Code applicable to regulated investment companies and to distribute all of its taxable net investment income and capital gains, if any, to its shareholders. Therefore, no federal income tax provision is required. Withholding taxes on foreign dividends, interest and capital gains, if any, are recorded, net of reclaimable amounts, at the time the related income is earned.
Dividends and Distributions: Dividends and distributions to shareholders, which are determined in accordance with federal income tax regulations and which may differ from GAAP, are recorded on the ex-date. Permanent book/tax differences relating to income and gain (loss) are reclassified between total distributable earnings (loss) and paid-in capital in excess of par, as appropriate. The chart below sets forth the expected frequency of dividend and capital gains distributions to shareholders. Various factors may impact the frequency of dividend distributions to shareholders, including but not limited to adverse market conditions or portfolio holding-specific events.
| | |
| | |
| Expected Distribution Schedule to Shareholders* | | Frequency |
| |
Net Investment Income | | Annually |
| |
Short-Term Capital Gains | | Annually |
| |
Long-Term Capital Gains | | Annually |
| * | Under certain circumstances, the Fund may make more than one distribution of short-term and/or long-term capital gains during a fiscal year. |
Estimates: The preparation of financial statements requires management to make estimates and assumptions that affect the reported amounts and disclosures in the financial statements. Actual results could differ from those estimates.
The RIC, on behalf of the Fund, has a management agreement with the Manager pursuant to which it has responsibility for all investment advisory services and supervises the subadviser’s performance of such services, and pursuant to which it renders administrative services.
The Manager has entered into a subadvisory agreement with Jennison Associates LLC (“Jennison” or the “subadviser”). The Manager pays for the services of Jennison.
32
Fees payable under the management agreement are computed daily and paid monthly. For the reporting period ended October 31, 2022, the contractual and effective management fee rates were as follows:
| | | | |
| | |
| Contractual Management Rate* | | Effective Management Fee, before any waivers
and/or expense reimbursements | |
| |
0.825% of the average daily net assets up to $1 billion; | | | 0.804% | |
| |
0.80% of the average daily net assets from $1 billion to | | | | |
| |
$5 billion; 0.78% of the average daily net assets over $5 billion. | | | | |
*Prior to July 1, 2022, the contractual management rate was 0.825% of the Fund’s average daily net assets up to $1 billion and 0.80% of such assets in excess of $1 billion.
The Manager has contractually agreed, through February 29, 2024, to limit certain operating expenses and/or to limit total annual operating expenses after fee waivers and/or expense reimbursements. The contractual waivers exclude interest, brokerage, taxes (such as income and foreign withholding taxes, stamp duty and deferred tax expenses), acquired fund fees and expenses, extraordinary expenses, and certain other Fund expenses such as dividend and interest expense and broker charges on short sales.
Where applicable, the Manager agrees to waive management fees or shared operating expenses on any share class to the same extent that it waives such expenses on any other share class. In addition, total annual operating expenses for Class R6 shares will not exceed total annual operating expenses for Class Z shares. Fees and/or expenses waived and/or reimbursed by the Manager for the purpose of preventing the expenses from exceeding a certain expense ratio limit may be recouped by the Manager within the same fiscal year during which such waiver and/or reimbursement is made if such recoupment can be realized without exceeding the expense limit in effect at the time of the recoupment for that fiscal year. The expense limitations attributable to each class are as follows:
| | | | | | | | | | |
| | | |
| Class | | Fund Expense
Limitation* | | Class Expense
Limitation |
| | |
A | | | | 0.84 | % | | | | 1.08 | % |
| | |
C | | | | 0.84 | | | | | — | |
| | |
Z | | | | 0.84 | | | | | — | |
| | |
R2 | | | | 0.84 | | | | | 1.34 | *** |
| | |
R4 | | | | 0.84 | | | | | 1.09 | *** |
| | |
R6 | | | | 0.84 | | | | | — | |
*Expense limitation excludes distribution and service (12b-1) fees, shareholder service fee, and transfer agency expenses (including sub-transfer agency and networking fees).
***Expense limitation applicable only to blue sky fees, shareholder service fee, and transfer agency expenses (including sub-transfer agency and networking fees).
The RIC, on behalf of the Fund, has a distribution agreement with Prudential Investment Management Services LLC (“PIMS”), which acts as the distributor of the Class A, Class C, Class Z, Class R2, Class R4 and Class R6 shares of the Fund. The Fund compensates PIMS
PGIM Jennison Global Opportunities Fund 33
Notes to Financial Statements (continued)
for distributing and servicing the Fund’s Class A, Class C and Class R2 shares, pursuant to the plans of distribution (the “Distribution Plans”), regardless of expenses actually incurred by PIMS.
Pursuant to the Distribution Plans, the Fund compensates PIMS for distribution related activities at an annual rate based on average daily net assets per class. PIMS has contractually agreed through February 29, 2024 to limit such fees on certain classes based on the average daily net assets. The distribution fees are accrued daily and payable monthly.
The Fund has adopted a Shareholder Services Plan with respect to Class R2 and Class R4 shares. Under the terms of the Shareholder Services Plan, Class R2 and Class R4 shares are authorized to compensate Prudential Mutual Fund Services LLC (“PMFS”), its affiliates or third-party service providers for services rendered to the shareholders of such Class R2 or Class R4 shares. The shareholder service fee is accrued daily and paid monthly, as applicable.
The Fund’s annual gross and net distribution rate and maximum shareholder service fee, where applicable, are as follows:
| | | | | | | | | | | | | | | |
| | | | |
| Class | | Gross Distribution Fee | | Net Distribution Fee | | Shareholder Service Fee |
| | | |
A | | | | 0.30 | % | | | | 0.25 | % | | | | N/A | % |
| | | |
C | | | | 1.00 | | | | | 1.00 | | | | | N/A | |
| | | |
Z | | | | N/A | | | | | N/A | | | | | N/A | |
| | | |
R2 | | | | 0.25 | | | | | 0.25 | | | | | 0.10 | |
| | | |
R4 | | | | N/A | | | | | N/A | | | | | 0.10 | |
| | | |
R6 | | | | N/A | | | | | N/A | | | | | N/A | |
For the year ended October 31, 2022, PIMS received front-end sales charges (“FESL”) resulting from sales of certain class shares and contingent deferred sales charges (“CDSC”) imposed upon redemptions by certain shareholders. From these fees, PIMS paid such sales charges to broker-dealers, who in turn paid commissions to salespersons and incurred other distribution costs. The sales charges are as follows where applicable:
| | | | | | | | | | |
| | | |
| Class | | FESL | | CDSC |
| | |
A | | | $ | 1,155,877 | | | | $ | 12,685 | |
| | |
C | | | | — | | | | | 43,498 | |
PGIM Investments, PIMS, PMFS and Jennison are indirect, wholly-owned subsidiaries of Prudential Financial, Inc. (“Prudential”).
34
| 4. | Other Transactions with Affiliates |
PMFS serves as the Fund’s transfer agent and shareholder servicing agent. Transfer agent’s and shareholder servicing agent’s fees and expenses in the Statement of Operations include certain out-of-pocket expenses paid to non-affiliates, where applicable.
The Fund may invest its overnight sweep cash in the PGIM Core Ultra Short Bond Fund (the “Core Fund”), and its securities lending cash collateral in the PGIM Institutional Money Market Fund (the “Money Market Fund”), each a fund of Prudential Investment Portfolios 2, registered under the 1940 Act and managed by PGIM Investments. PGIM Investments and/or its affiliates are paid fees or reimbursed for providing their services to the Core Fund and the Money Market Fund. In addition to the realized and unrealized gains on investments in the Core Fund and Money Market Fund, earnings from such investments are disclosed on the Statement of Operations as “Affiliated dividend income” and “Income from securities lending, net”, respectively. Effective January 2022, the Fund changed its overnight cash sweep vehicle from the Core Fund to an unaffiliated money market fund.
The Fund may enter into certain securities purchase or sale transactions under Board approved Rule 17a-7 procedures. Rule 17a-7 is an exemptive rule under the 1940 Act, that subject to certain conditions, permits purchase and sale transactions among affiliated investment companies, or between an investment company and a person that is affiliated solely by reason of having a common (or affiliated) investment adviser, common directors/trustees, and/or common officers. For the year ended October 31, 2022, no 17a-7 transactions were entered into by the Fund.
The aggregate cost of purchases and proceeds from sales of portfolio securities (excluding short-term investments and U.S. Government securities) for the reporting period ended October 31, 2022, were as follows:
| | |
| | |
| Cost of Purchases | | Proceeds from Sales |
| |
$5,378,921,540 | | $6,639,266,627 |
A summary of the cost of purchases and proceeds from sales of shares of affiliated mutual funds for the year ended October 31, 2022, is presented as follows:
| | | | | | | | | | | | | | | | |
| | | | | | | | | |
Value, Beginning of Year | | | | Cost of Purchases | | Proceeds from Sales | | Change in Unrealized Gain (Loss) | | Realized Gain (Loss) | | Value, End of Year | | Shares, End of Year | | Income |
| | | | | |
Short-Term Investments - Affiliated Mutual Funds: | | | | | | | | | | |
| | | | | | | |
PGIM Core Ultra Short Bond Fund(1)(wa) | | | | | | | | | | | | | | |
| | | | | | | | |
$46,760,862 | | | | $ 604,906,557 | | $ 651,667,419 | | $ — | | $ — | | $ — | | — | | $ 21,958 |
PGIM Jennison Global Opportunities Fund 35
Notes to Financial Statements (continued)
| | | | | | | | | | | | | | |
| | | | | | | | |
Value, Beginning of Year | | Cost of Purchases | | Proceeds from Sales | | Change in Unrealized Gain (Loss) | | Realized Gain (Loss) | | Value, End of Year | | Shares, End of Year | | Income |
| | | | | |
PGIM Institutional Money Market Fund(1)(b)(wa) | | | | | | | | | | |
| | | | | | | |
$16,154,794 | | $3,218,224,612 | | $3,019,034,376 | | $(1,983) | | $52,322 | | $215,395,369 | | 215,589,400 | | $238,640(2) |
| | | | | | | |
$62,915,656 | | $3,823,131,169 | | $3,670,701,795 | | $(1,983) | | $52,322 | | $215,395,369 | | | | $260,598 |
| (1) | The Fund did not have any capital gain distributions during the reporting period. |
| (2) | The amount, or a portion thereof, represents the affiliated securities lending income shown on the Statement of Operations. |
| (b) | Represents security, or portion thereof, purchased with cash collateral received for securities on loan and includes dividend reinvestment. |
| (wa) | PGIM Investments LLC, the manager of the Fund, also serves as manager of the PGIM Core Ultra Short Bond Fund and PGIM Institutional Money Market Fund, if applicable. |
| 6. | Distributions and Tax Information |
Distributions to shareholders, which are determined in accordance with federal income tax regulations and which may differ from GAAP, are recorded on the ex-date. In order to present total distributable earnings (loss) and paid-in capital in excess of par on the Statement of Assets and Liabilities that more closely represent their tax character, certain adjustments have been made to total distributable earnings (loss) and paid-in capital in excess of par. For the year ended October 31, 2022, the adjustments were to increase total distributable earnings (loss) and decrease paid-in capital in excess of par by $27,141,600 due to a net operating loss. Net investment income (loss), net realized gain (loss) on investments and net assets were not affected by this change.
For the year ended October 31, 2022, the tax character of dividends paid by the Fund were $57,821,230 of ordinary income, $772,933,495 of long-term capital gains and $418,166 of tax return of capital. For the year ended October 31, 2021, the tax character of dividends paid by the Fund were $883,669 of ordinary income and $119,553,104 of long-term capital gains.
As of October 31, 2022, there were no accumulated undistributed earnings on a tax basis.
The United States federal income tax basis of the Fund’s investments and the net unrealized appreciation as of October 31, 2022 were as follows:
| | | | | | |
| | | | |
| Tax Basis | | Gross Unrealized Appreciation | | Gross Unrealized Depreciation | | Net Unrealized Appreciation |
| | | |
$3,986,415,521 | | $1,069,700,303 | | $(427,511,884) | | $642,188,419 |
36
The difference between GAAP and tax basis was primarily due to deferred losses on wash sales.
For federal income tax purposes, the Fund had a capital loss carryforward as of October 31, 2022 of approximately $772,220,000 which can be carried forward for an unlimited period. No capital gains distributions are expected to be paid to shareholders until net gains have been realized in excess of such losses.
The Manager has analyzed the Fund’s tax positions taken on federal, state and local income tax returns for all open tax years and has concluded that no provision for income tax is required in the Fund’s financial statements for the current reporting period. Since tax authorities can examine previously filed tax returns, the Fund’s U.S. federal and state tax returns for each of the four fiscal years up to the most recent fiscal year ended October 31, 2022 are subject to such review.
The Fund offers Class A, Class C, Class Z, Class R2, Class R4 and Class R6 shares. Class A shares are sold with a maximum front-end sales charge of 5.50%. Investors who purchase $1 million or more of Class A shares and sell these shares within 12 months of purchase are subject to a CDSC of 1%, although they are not subject to an initial sales charge. The Class A CDSC is waived for certain retirement and/or benefit plans. A special exchange privilege is also available for shareholders who qualified to purchase Class A shares at net asset value. Class C shares are sold with a CDSC of 1% on sales made within 12 months of purchase. Class C shares will automatically convert to Class A shares on a monthly basis approximately eight years (ten years prior to January 22, 2021) after purchase. Class Z, Class R2, Class R4 and Class R6 shares are not subject to any sales or redemption charges and are available exclusively for sale to a limited group of investors.
Under certain circumstances, an exchange may be made from specified share classes of the Fund to one or more other share classes of the Fund as presented in the table of transactions in shares of common stock, below.
The RIC is authorized to issue 10,225,000,000 shares of common stock, $0.00001 par value per share, 3,450,000,000 of which are designated as shares of the Fund. The authorized shares of the Fund are currently classified and designated as follows:
| | | | | |
| | |
| Class | | Number of Shares |
| |
A | | | | 150,000,000 | |
| |
C | | | | 100,000,000 | |
| |
Z | | | | 2,000,000,000 | |
| |
R2 | | | | 100,000,000 | |
| |
R4 | | | | 100,000,000 | |
| |
R6 | | | | 1,000,000,000 | |
PGIM Jennison Global Opportunities Fund 37
Notes to Financial Statements (continued)
As of October 31, 2022, Prudential, through its affiliated entities, including affiliated funds (if applicable), owned shares of the Fund as follows:
| | | | | | | | | | |
| | | |
| Class | | Number of Shares | | Percentage of Outstanding Shares |
| | |
R2 | | | | 543 | | | | | 0.1 | % |
| | |
R4 | | | | 543 | | | | | 5.0 | |
At the reporting period end, the number of shareholders holding greater than 5% of the Fund are as follows:
| | | | | | | | | | |
| | | |
| | | Number of Shareholders | | Percentage of Outstanding Shares |
| | |
Affiliated | | | | — | | | | | — | % |
| | |
Unaffiliated | | | | 4 | | | | | 69.0 | |
Transactions in shares of common stock were as follows:
| | | | | | | | |
| | | |
| Share Class | | Shares | | | Amount | |
| | |
Class A | | | | | | | | |
| | |
Year ended October 31, 2022: | | | | | | | | |
| | |
Shares sold | | | 2,437,561 | | | $ | 87,742,751 | |
| | |
Shares issued in reinvestment of dividends and distributions | | | 1,531,839 | | | | 69,897,795 | |
| | |
Shares purchased | | | (4,025,343 | ) | | | (137,018,440 | ) |
| | |
Net increase (decrease) in shares outstanding before conversion | | | (55,943 | ) | | | 20,622,106 | |
| | |
Shares issued upon conversion from other share class(es) | | | 794,706 | | | | 29,615,720 | |
| | |
Shares purchased upon conversion into other share class(es) | | | (515,018 | ) | | | (18,642,964 | ) |
| | |
Net increase (decrease) in shares outstanding | | | 223,745 | | | $ | 31,594,862 | |
| | |
Year ended October 31, 2021: | | | | | | | | |
| | |
Shares sold | | | 4,665,660 | | | $ | 213,839,272 | |
| | |
Shares issued in reinvestment of dividends and distributions | | | 222,928 | | | | 9,777,601 | |
| | |
Shares purchased | | | (2,530,691 | ) | | | (115,823,612 | ) |
| | |
Net increase (decrease) in shares outstanding before conversion | | | 2,357,897 | | | | 107,793,261 | |
| | |
Shares issued upon conversion from other share class(es) | | | 828,473 | | | | 39,228,444 | |
| | |
Shares purchased upon conversion into other share class(es) | | | (735,700 | ) | | | (34,462,946 | ) |
| | |
Net increase (decrease) in shares outstanding | | | 2,450,670 | | | $ | 112,558,759 | |
38
| | | | | | | | |
| | | |
| Share Class | | Shares | | | Amount | |
| | |
Class C | | | | | | | | |
| | |
Year ended October 31, 2022: | | | | | | | | |
| | |
Shares sold | | | 1,076,874 | | | $ | 36,143,113 | |
| | |
Shares issued in reinvestment of dividends and distributions | | | 1,111,201 | | | | 46,503,742 | |
| | |
Shares purchased | | | (2,117,875 | ) | | | (65,859,606 | ) |
| | |
Net increase (decrease) in shares outstanding before conversion | | | 70,200 | | | | 16,787,249 | |
| | |
Shares purchased upon conversion into other share class(es) | | | (868,686 | ) | | | (29,829,616 | ) |
| | |
Net increase (decrease) in shares outstanding | | | (798,486 | ) | | $ | (13,042,367 | ) |
| | |
Year ended October 31, 2021: | | | | | | | | |
| | |
Shares sold | | | 2,081,043 | | | $ | 89,155,627 | |
| | |
Shares issued in reinvestment of dividends and distributions | | | 184,797 | | | | 7,556,334 | |
| | |
Shares purchased | | | (1,174,050 | ) | | | (50,022,440 | ) |
| | |
Net increase (decrease) in shares outstanding before conversion | | | 1,091,790 | | | | 46,689,521 | |
| | |
Shares purchased upon conversion into other share class(es) | | | (939,783 | ) | | | (41,669,710 | ) |
| | |
Net increase (decrease) in shares outstanding | | | 152,007 | | | $ | 5,019,811 | |
| | |
Class Z | | | | | | | | |
| | |
Year ended October 31, 2022: | | | | | | | | |
| | |
Shares sold | | | 24,079,983 | | | $ | 892,122,293 | |
| | |
Shares issued in reinvestment of dividends and distributions | | | 8,798,903 | | | | 410,908,760 | |
| | |
Shares purchased | | | (50,050,741 | ) | | | (1,746,002,720 | ) |
| | |
Net increase (decrease) in shares outstanding before conversion | | | (17,171,855 | ) | | | (442,971,667 | ) |
| | |
Shares issued upon conversion from other share class(es) | | | 816,866 | | | | 30,109,990 | |
| | |
Shares purchased upon conversion into other share class(es) | | | (370,962 | ) | | | (13,277,879 | ) |
| | |
Net increase (decrease) in shares outstanding | | | (16,725,951 | ) | | $ | (426,139,556 | ) |
| | |
Year ended October 31, 2021: | | | | | | | | |
| | |
Shares sold | | | 30,640,507 | | | $ | 1,428,980,779 | |
| | |
Shares issued in reinvestment of dividends and distributions | | | 1,448,278 | | | | 64,781,489 | |
| | |
Shares purchased | | | (28,647,396 | ) | | | (1,335,254,028 | ) |
| | |
Net increase (decrease) in shares outstanding before conversion | | | 3,441,389 | | | | 158,508,240 | |
| | |
Shares issued upon conversion from other share class(es) | | | 1,137,547 | | | | 54,251,524 | |
| | |
Shares purchased upon conversion into other share class(es) | | | (961,974 | ) | | | (47,587,111 | ) |
| | |
Net increase (decrease) in shares outstanding | | | 3,616,962 | | | $ | 165,172,653 | |
| | |
Class R2 | | | | | | | | |
| | |
Year ended October 31, 2022: | | | | | | | | |
| | |
Shares sold | | | 36,394 | | | $ | 1,279,903 | |
| | |
Shares issued in reinvestment of dividends and distributions | | | 40,744 | | | | 1,886,436 | |
| | |
Shares purchased | | | (62,443 | ) | | | (2,192,717 | ) |
| | |
Net increase (decrease) in shares outstanding | | | 14,695 | | | $ | 973,622 | |
PGIM Jennison Global Opportunities Fund 39
Notes to Financial Statements (continued)
| | | | | | | | |
| | | |
| Share Class | | Shares | | | Amount | |
| | |
Year ended October 31, 2021: | | | | | | | | |
| | |
Shares sold | | | 439,431 | | | $ | 19,563,751 | |
| | |
Shares issued in reinvestment of dividends and distributions | | | 167 | | | | 7,434 | |
| | |
Shares purchased | | | (40,294 | ) | | | (1,961,619 | ) |
| | |
Net increase (decrease) in shares outstanding | | | 399,304 | | | $ | 17,609,566 | |
| | |
Class R4 | | | | | | | | |
| | |
Year ended October 31, 2022: | | | | | | | | |
| | |
Shares sold | | | 4,403 | | | $ | 162,182 | |
| | |
Shares issued in reinvestment of dividends and distributions | | | 667 | | | | 31,156 | |
| | |
Shares purchased | | | (342 | ) | | | (14,868 | ) |
| | |
Net increase (decrease) in shares outstanding | | | 4,728 | | | $ | 178,470 | |
| | |
Year ended October 31, 2021: | | | | | | | | |
| | |
Shares sold | | | 5,135 | | | $ | 253,565 | |
| | |
Shares issued in reinvestment of dividends and distributions | | | 214 | | | | 9,579 | |
| | |
Shares purchased | | | (11,968 | ) | | | (626,649 | ) |
| | |
Net increase (decrease) in shares outstanding | | | (6,619 | ) | | $ | (363,505 | ) |
| | |
Class R6 | | | | | | | | |
| | |
Year ended October 31, 2022: | | | | | | | | |
| | |
Shares sold | | | 18,555,279 | | | $ | 680,824,974 | |
| | |
Shares issued in reinvestment of dividends and distributions | | | 6,153,853 | | | | 289,477,258 | |
| | |
Shares purchased | | | (24,091,674 | ) | | | (826,104,240 | ) |
| | |
Net increase (decrease) in shares outstanding before conversion | | | 617,458 | | | | 144,197,992 | |
| | |
Shares issued upon conversion from other share class(es) | | | 115,451 | | | | 4,122,577 | |
| | |
Shares purchased upon conversion into other share class(es) | | | (57,593 | ) | | | (2,097,828 | ) |
| | |
Net increase (decrease) in shares outstanding | | | 675,316 | | | $ | 146,222,741 | |
| | |
Year ended October 31, 2021: | | | | | | | | |
| | |
Shares sold | | | 27,540,278 | | | $ | 1,296,799,817 | |
| | |
Shares issued in reinvestment of dividends and distributions | | | 789,179 | | | | 35,497,290 | |
| | |
Shares purchased | | | (13,025,359 | ) | | | (620,512,925 | ) |
| | |
Net increase (decrease) in shares outstanding before conversion | | | 15,304,098 | | | | 711,784,182 | |
| | |
Shares issued upon conversion from other share class(es) | | | 618,209 | | | | 31,764,888 | |
| | |
Shares purchased upon conversion into other share class(es) | | | (32,207 | ) | | | (1,525,089 | ) |
| | |
Net increase (decrease) in shares outstanding | | | 15,890,100 | | | $ | 742,023,981 | |
The RIC, on behalf of the Fund, along with other affiliated registered investment companies (the “Participating Funds”), is a party to a Syndicated Credit Agreement (“SCA”) with a
40
group of banks. The purpose of the SCA is to provide an alternative source of temporary funding for capital share redemptions. The table below provides details of the current SCA in effect at the reporting period-end as well as the prior SCA.
| | | | | | |
| | | | |
| | | Current SCA | | | | Prior SCA |
| | | |
Term of Commitment | | 9/30/2022 - 9/28/2023 | | | | 10/1/2021 - 9/29/2022 |
| | | |
Total Commitment | | $ 1,200,000,000 | | | | $ 1,200,000,000 |
| | | |
Annualized Commitment Fee on the Unused Portion of the SCA | | 0.15% | | | | 0.15% |
| | | |
Annualized Interest Rate on Borrowings | | 1.00% plus the higher of (1)
the effective federal funds
rate, (2) the daily SOFR
rate plus 0.10% or (3) zero
percent | | | | 1.20% plus the higher of (1)
the effective federal funds
rate, (2) the one-month
LIBOR rate or (3) zero
percent |
Certain affiliated registered investment companies that are parties to the SCA include portfolios that are subject to a predetermined mathematical formula used to manage certain benefit guarantees offered under variable annuity contracts. The formula may result in large scale asset flows into and out of these portfolios. Consequently, these portfolios may be more likely to utilize the SCA for purposes of funding redemptions. It may be possible for those portfolios to fully exhaust the committed amount of the SCA, thereby requiring the Manager to allocate available funding per a Board-approved methodology designed to treat the Participating Funds in the SCA equitably.
The Fund utilized the SCA during the year ended October 31, 2022. The average daily balance for the 11 days that the Fund had loans outstanding during the period was approximately $35,185,727, borrowed at a weighted average interest rate of 2.36%. The maximum loan outstanding amount during the period was $59,583,000. At October 31, 2022, the Fund did not have an outstanding loan amount.
| 9. | Risks of Investing in the Fund |
The Fund’s risks include, but are not limited to, some or all of the risks discussed below. For further information on the Fund’s risks, please refer to the Fund’s Prospectus and Statement of Additional Information.
Country Risk: Changes in the business environment may adversely affect operating profits or the value of assets in a specific country. For example, financial factors such as currency controls, devaluation or regulatory changes or stability factors such as mass riots, civil war and other potential events may contribute to companies’ operational risks.
Currency Risk: The Fund’s net asset value could decline as a result of changes in exchange rates, which could adversely affect the Fund’s investments in currencies, or in securities that trade in, and receive revenues related to, currencies, or in derivatives that provide exposure to currencies. Certain foreign countries may impose restrictions on the ability of issuers of foreign securities to make payment of principal and interest or dividends to investors located outside the country, due to blockage of foreign currency exchanges or otherwise.
PGIM Jennison Global Opportunities Fund 41
Notes to Financial Statements (continued)
Economic and Market Events Risk: Events in the U.S. and global financial markets, including actions taken by the U.S. Federal Reserve or foreign central banks to stimulate or stabilize economic growth or the functioning of the securities markets, or otherwise reduce inflation may at times result in unusually high market volatility, which could negatively impact performance. Governmental efforts to curb inflation often have negative effects on the level of economic activity. Relatively reduced liquidity in credit and fixed income markets could adversely affect issuers worldwide.
Emerging Markets Risk: The risks of foreign investments are greater for investments in or exposed to emerging markets. Emerging market countries typically have economic and political systems that are less fully developed, and can be expected to be less stable, than those of more developed countries. For example, the economies of such countries can be subject to rapid and unpredictable rates of inflation or deflation. Low trading volumes may result in a lack of liquidity and price volatility. Emerging market countries may have policies that restrict investment by non-U.S. investors, or that prevent non-U.S. investors from withdrawing their money at will.
The Fund may invest in some emerging markets that subject it to risks such as those associated with illiquidity, custody of assets, different settlement and clearance procedures and asserting legal title under a developing legal and regulatory regime to a greater degree than in developed markets or even in other emerging markets.
Equity and Equity-Related Securities Risk: Equity and equity-related securities may be subject to changes in value, and their values may be more volatile than those of other asset classes. In addition to an individual security losing value, the value of the equity markets or a sector in which the Fund invests could go down. Different parts of a market can react differently to adverse issuer, market, regulatory, political and economic developments.
Foreign Securities Risk: Investments in securities of non-U.S. issuers (including those denominated in U.S. dollars) may involve more risk than investing in securities of U.S. issuers. Foreign political, economic and legal systems, especially those in developing and emerging market countries, may be less stable and more volatile than in the United States. Foreign legal systems generally have fewer regulatory requirements than the U.S. legal system, particularly those of emerging markets. In general, less information is publicly available with respect to non-U.S. companies than U.S. companies. Non-U.S. companies generally are not subject to the same accounting, auditing, and financial reporting standards as are U.S. companies. Additionally, the changing value of foreign currencies and changes in exchange rates could also affect the value of the assets the Fund holds and the Fund’s performance. Certain foreign countries may impose restrictions on the ability of issuers of foreign securities to make payment of principal and interest or dividends to investors located
42
outside the country, due to blockage of foreign currency exchanges or otherwise. Investments in emerging markets are subject to greater volatility and price declines.
In addition, the Fund’s investments in non-U.S. securities may be subject to the risks of nationalization or expropriation of assets, imposition of currency exchange controls or restrictions on the repatriation of non-U.S. currency, confiscatory taxation and adverse diplomatic developments. Special U.S. tax considerations may apply.
Geographic Concentration Risk: The Fund’s performance may be closely tied to the market, economic, political, regulatory or other conditions in the countries or regions in which the Fund invests. This can result in more pronounced risks based upon conditions that impact one or more countries or regions more or less than other countries or regions.
Growth Style Risk: The Fund’s growth style may subject the Fund to above-average fluctuations as a result of seeking higher than average capital growth. Historically, growth stocks have performed best during later stages of economic expansion and value stocks have performed best during periods of economic recovery. Since the Fund follows a growth investment style, there is the risk that the growth investment style may be out of favor for long periods of time. At times when the style is out of favor, the Fund may underperform the market in general, its benchmark and other mutual funds.
Increase in Expenses Risk: Your actual cost of investing in the Fund may be higher than the expenses shown in the expense table in the Fund’s prospectus for a variety of reasons. For example, expense ratios may be higher than those shown if average net assets decrease. Net assets are more likely to decrease and Fund expense ratios are more likely to increase when markets are volatile. Active and frequent trading of Fund securities can increase expenses.
Large Shareholder and Large Scale Redemption Risk: Certain individuals, accounts, funds (including funds affiliated with the Manager) or institutions, including the Manager and its affiliates, may from time to time own or control a substantial amount of the Fund’s shares. There is no requirement that these entities maintain their investment in the Fund. There is a risk that such large shareholders or that the Fund’s shareholders generally may redeem all or a substantial portion of their investments in the Fund in a short period of time, which could have a significant negative impact on the Fund’s NAV, liquidity, and brokerage costs. Large redemptions could also result in tax consequences to shareholders and impact the Fund’s ability to implement its investment strategy. The Fund’s ability to pursue its investment objective after one or more large scale redemptions may be impaired and, as a result, the Fund may invest a larger portion of its assets in cash or cash equivalents.
Liquidity Risk: Liquidity risk is the risk that the Fund could not meet requests to redeem shares issued by the Fund without significant dilution of remaining investors’ interests in the Fund. The Fund may invest in instruments that trade in lower volumes and are more illiquid than other investments. If the Fund is forced to sell these investments to pay redemption proceeds or for other reasons, the Fund may lose money. In addition, when there is no
PGIM Jennison Global Opportunities Fund 43
Notes to Financial Statements (continued)
willing buyer and investments cannot be readily sold at the desired time or price, the Fund may have to accept a lower price or may not be able to sell the instrument at all. An inability to sell a portfolio position can adversely affect the Fund’s value or prevent the Fund from being able to take advantage of other investment opportunities.
Management Risk: Actively managed funds are subject to management risk. The subadviser will apply investment techniques and risk analyses in making investment decisions for the Fund, but the subadviser’s judgments about the attractiveness, value or market trends affecting a particular security, industry or sector or about market movements may be incorrect. Additionally, the investments selected for the Fund may underperform the markets in general, the Fund’s benchmark and other funds with similar investment objectives.
Market Capitalization Risk: The Fund may invest in companies of any market capitalization. Generally, the stock prices of small- and mid-cap companies are less stable than the prices of large-cap stocks and may present greater risks. Large capitalization companies as a group could fall out of favor with the market, causing the Fund to underperform compared to investments that focus on smaller capitalized companies.
Market Disruption and Geopolitical Risks: Market disruption can be caused by economic, financial or political events and factors, including but not limited to, international wars or conflicts (including Russia’s military invasion of Ukraine), geopolitical developments (including trading and tariff arrangements, sanctions and cybersecurity attacks), instability in regions such as Asia, Eastern Europe and the Middle East, terrorism, natural disasters and public health epidemics (including the outbreak of COVID-19 globally).
The extent and duration of such events and resulting market disruptions cannot be predicted, but could be substantial and could magnify the impact of other risks to the Fund. These and other similar events could adversely affect the U.S. and foreign financial markets and lead to increased market volatility, reduced liquidity in the securities markets, significant negative impacts on issuers and the markets for certain securities and commodities and/or government intervention. They may also cause short- or long-term economic uncertainties in the United States and worldwide. As a result, whether or not the Fund invests in securities of issuers located in or with significant exposure to the countries directly affected, the value and liquidity of the Fund’s investments may be negatively impacted. Further, due to closures of certain markets and restrictions on trading certain securities, the value of certain securities held by the Fund could be significantly impacted, which could lead to such securities being valued at zero.
COVID-19 and the related governmental and public responses have had and may continue to have an impact on the Fund’s investments and net asset value and have led and may
44
continue to lead to increased market volatility and the potential for illiquidity in certain classes of securities and sectors of the market. They have also had and may continue to result in periods of business disruption, business closures, inability to obtain raw materials, supplies and component parts, and reduced or disrupted operations for the issuers in which the Fund invests. The occurrence, reoccurrence and pendency of public health epidemics could adversely affect the economies and financial markets either in specific countries or worldwide.
Market Risk: Securities markets may be volatile and the market prices of the Fund’s securities may decline. Securities fluctuate in price based on changes in an issuer’s financial condition and overall market and economic conditions. If the market prices of the securities owned by the Fund fall, the value of your investment in the Fund will decline.
PGIM Jennison Global Opportunities Fund 45
Report of Independent Registered Public Accounting Firm
To the Board of Directors of Prudential World Fund, Inc. and Shareholders of PGIM Jennison Global Opportunities Fund
Opinion on the Financial Statements
We have audited the accompanying statement of assets and liabilities, including the schedule of investments, of PGIM Jennison Global Opportunities Fund (one of the funds constituting Prudential World Fund, Inc., referred to hereafter as the “Fund”) as of October 31, 2022, the related statement of operations for the year ended October 31, 2022, the statements of changes in net assets for each of the two years in the period ended October 31, 2022, including the related notes, and the financial highlights for each of the three years in the period ended October 31, 2022 (collectively referred to as the “financial statements”). In our opinion, the financial statements present fairly, in all material respects, the financial position of the Fund as of October 31, 2022, the results of its operations for the year then ended, the changes in its net assets for each of the two years in the period ended October 31 2022 and the financial highlights for each of the three years in the period ended October 31, 2022 in conformity with accounting principles generally accepted in the United States of America.
The financial statements of the Fund as of and for the year ended October 31, 2019 and the financial highlights for each of the periods ended on or prior to October 31, 2019 (not presented herein, other than the financial highlights) were audited by other auditors whose report dated December 16, 2019 expressed an unqualified opinion on those financial statements and financial highlights.
Basis for Opinion
These financial statements are the responsibility of the Fund’s management. Our responsibility is to express an opinion on the Fund’s financial statements based on our audits. We are a public accounting firm registered with the Public Company Accounting Oversight Board (United States) (PCAOB) and are required to be independent with respect to the Fund in accordance with the U.S. federal securities laws and the applicable rules and regulations of the Securities and Exchange Commission and the PCAOB.
We conducted our audits of these financial statements in accordance with the standards of the PCAOB. Those standards require that we plan and perform the audit to obtain reasonable assurance about whether the financial statements are free of material misstatement, whether due to error or fraud.
Our audits included performing procedures to assess the risks of material misstatement of the financial statements, whether due to error or fraud, and performing procedures that respond to those risks. Such procedures included examining, on a test basis, evidence regarding the amounts and disclosures in the financial statements. Our audits also included evaluating the accounting principles used and significant estimates made by management, as well as evaluating the overall presentation of the financial statements. Our procedures included confirmation of securities owned as of October 31, 2022 by correspondence with the custodian, transfer agent and brokers; when replies were not received from brokers, we performed other auditing procedures. We believe that our audits provide a reasonable basis for our opinion.
/s/PricewaterhouseCoopers LLP
New York, New York
December 16, 2022
We have served as the auditor of one or more investment companies in the PGIM Retail Funds complex since 2020.
46
Tax Information (unaudited)
We are advising you that during the fiscal year ended October 31, 2022, the Fund reports the maximum amount allowed per share, but not less than $4.32 for Class A, C, Z, R2, R4 and R6 shares as a capital gain distribution in accordance with Section 852(b)(3)(C) of the Internal Revenue Code.
For the year ended October 31, 2022, the Fund reports, in accordance with Section 854 of the Internal Revenue Code, the following percentages of the ordinary income dividends paid as 1) qualified dividend income (QDI); and 2) eligible for corporate dividends received deduction (DRD):
| | | | | | | | | | | | |
| | | | |
| Fund | | QDI | | | | | | DRD | |
| | | |
PGIM Jennison Global Opportunities Fund | | | 39.72 | % | | | | | | | 8.48 | % |
In January 2023, you will be advised on IRS Form 1099-DIV or substitute 1099-DIV, as to the federal tax status of distributions received by you in calendar year 2022.
PGIM Jennison Global Opportunities Fund 47
INFORMATION ABOUT BOARD MEMBERS AND OFFICERS (unaudited)
Information about Board Members and Officers of the Fund is set forth below. Board Members who are not deemed to be “interested persons” of the Fund, as defined in the 1940 Act, are referred to as “Independent Board Members.” Board Members who are deemed to be “interested persons” of the Fund are referred to as “Interested Board Members.” The Board Members are responsible for the overall supervision of the operations of the Fund and perform the various duties imposed on the directors of investment companies by the 1940 Act. The Board in turn elects the Officers, who are responsible for administering the day-to-day operations of the Fund.
| | | | | | |
| | |
| Independent Board Members | | | | |
| | | | |
Name Year of Birth Position(s) Portfolios Overseen | | Principal Occupation(s) During Past Five Years | | Other Directorships Held During Past Five Years | | Length of Board Service |
| | | | |
Ellen S. Alberding 1958 Board Member Portfolios Overseen: 97 | | President and Board Member, The Joyce Foundation (charitable foundation) (since 2002); formerly Vice Chair, City Colleges of Chicago (community college system) (2011-2015); Trustee, National Park Foundation (charitable foundation for national park system) (2009-2018); Trustee, Economic Club of Chicago (2009-2016); Trustee, Loyola University (since 2018). | | None. | | Since September 2013 |
| | | | |
Kevin J. Bannon 1952 Board Member Portfolios Overseen: 97 | | Retired; formerly Managing Director (April 2008-May 2015) and Chief Investment Officer (October 2008-November 2013) of Highmount Capital LLC (registered investment adviser); formerly Executive Vice President and Chief Investment Officer (April 1993-August 2007) of Bank of New York Company; President (May 2003-May 2007) of BNY Hamilton Family of Mutual Funds. | | Director of Urstadt Biddle Properties (equity real estate investment trust) (since September 2008). | | Since July 2008 |
PGIM Jennison Global Opportunities Fund
| | | | | | |
| | |
| Independent Board Members | | | | |
| | | | |
Name Year of Birth Position(s) Portfolios Overseen | | Principal Occupation(s) During Past Five Years | | Other Directorships Held During Past Five Years | | Length of Board Service |
| | | | |
Linda W. Bynoe 1952 Board Member Portfolios Overseen: 94 | | President and Chief Executive Officer (since March 1995) and formerly Chief Operating Officer (December 1989-February 1995) of Telemat Limited LLC (formerly Telemat Ltd) (management consulting); formerly Vice President (January 1985-June 1989) at Morgan Stanley & Co. (broker-dealer). | | Trustee of Equity Residential (residential real estate) (since December 2009); Director of Northern Trust Corporation (financial services) (since April 2006); formerly Director of Anixter International, Inc. (communication products distributor) (January 2006-June 2020). | | Since March 2005 |
| | | | |
Barry H. Evans 1960 Board Member Portfolios Overseen: 96 | | Retired; formerly President (2005-2016), Global Chief Operating Officer (2014-2016), Chief Investment Officer - Global Head of Fixed Income (1998-2014), and various portfolio manager roles (1986-2006), Manulife Asset Management (asset management). | | Formerly Director, Manulife Trust Company (2011-2018); formerly Director, Manulife Asset Management Limited (2015-2017); formerly Chairman of the Board of Directors of Manulife Asset Management U.S. (2005-2016); formerly Chairman of the Board, Declaration Investment Management and Research (2008-2016). | | Since September 2017 |
| | | | |
Keith F. Hartstein 1956 Board Member & Independent Chair Portfolios Overseen: 97 | | Retired; Member (November 2014-September 2022) of the Governing Council of the Independent Directors Council (IDC) (organization of independent mutual fund directors); formerly Executive Committee of the IDC Board of Governors (October 2019-December 2021); formerly President and Chief Executive Officer (2005-2012), Senior Vice President (2004-2005), Senior Vice President of Sales and Marketing (1997-2004), and various executive management positions (1990-1997), John Hancock Funds, LLC (asset management); Chairman, Investment Company Institute’s Sales Force Marketing Committee (2003-2008). | | None. | | Since September 2013 |
Visit our website at pgim.com/investments
| | | | | | |
| | |
| Independent Board Members | | | | |
| | | | |
Name Year of Birth Position(s) Portfolios Overseen | | Principal Occupation(s) During Past Five Years | | Other Directorships Held During Past Five Years | | Length of Board Service |
| | | | |
Laurie Simon Hodrick 1962 Board Member Portfolios Overseen: 93 | | A. Barton Hepburn Professor Emerita of Economics in the Faculty of Business, Columbia Business School (since 2018); Visiting Fellow at the Hoover Institution, Stanford University (since 2015); Sole Member, ReidCourt LLC (since 2008) (a consulting firm); formerly Visiting Professor of Law, Stanford Law School (2015-2021); formerly A. Barton Hepburn Professor of Economics in the Faculty of Business, Columbia Business School (1996-2017); formerly Managing Director, Global Head of Alternative Investment Strategies, Deutsche Bank (2006-2008). | | Independent Director, Andela (since January 2022) (global talent network); Independent Director, Roku (since December 2020) (communication services); formerly Independent Director, Synnex Corporation (2019-2021) (information technology); formerly Independent Director, Kabbage, Inc. (2018-2020) (financial services); formerly Independent Director, Corporate Capital Trust (2017-2018) (a business development company). | | Since September 2017 |
| | | | |
Brian K. Reid 1961 Board Member Portfolios Overseen: 96 | | Retired; formerly Chief Economist for the Investment Company Institute (ICI) (2005-2017); formerly Senior Economist and Director of Industry and Financial Analysis at the ICI (1998-2004); formerly Senior Economist, Industry and Financial Analysis at the ICI (1996-1998); formerly Staff Economist at the Federal Reserve Board (1989-1996); Director, ICI Mutual Insurance Company (2012-2017). | | None. | | Since March 2018 |
PGIM Jennison Global Opportunities Fund
| | | | | | |
| | |
| Independent Board Members | | | | |
| | | | |
Name Year of Birth Position(s) Portfolios Overseen | | Principal Occupation(s) During Past Five Years | | Other Directorships Held During Past Five Years | | Length of Board Service |
| | | | |
Grace C. Torres 1959 Board Member Portfolios Overseen: 96 | | Retired; formerly Treasurer and Principal Financial and Accounting Officer of the PGIM Funds, Target Funds, Advanced Series Trust, Prudential Variable Contract Accounts and The Prudential Series Fund (1998-June 2014); Assistant Treasurer (March 1999-June 2014) and Senior Vice President (September 1999-June 2014) of PGIM Investments LLC; Assistant Treasurer (May 2003-June 2014) and Vice President (June 2005-June 2014) of AST Investment Services, Inc.; Senior Vice President and Assistant Treasurer (May 2003-June 2014) of Prudential Annuities Advisory Services, Inc. | | Director (since January 2018) of OceanFirst Financial Corp. and OceanFirst Bank; formerly Director (July 2015-January 2018) of Sun Bancorp, Inc. N.A. and Sun National Bank. | | Since November 2014 |
Visit our website at pgim.com/investments
| | | | | | |
| | |
| Interested Board Members | | | | |
| | | | |
Name Year of Birth Position(s) Portfolios Overseen | | Principal Occupation(s) During Past Five Years | | Other Directorships Held During Past Five Years | | Length of Board Service |
| | | | |
Stuart S. Parker 1962 Board Member & President Portfolios Overseen: 96 | | President, Chief Executive Officer, Chief Operating Officer and Officer in Charge of PGIM Investments LLC (formerly known as Prudential Investments LLC) (since January 2012); President and Principal Executive Officer (“PEO”) (since September 2022) of the PGIM Private Credit Fund; President and PEO (since March 2022) of the PGIM Private Real Estate Fund, Inc.; formerly Executive Vice President of Jennison Associates LLC and Head of Retail Distribution of PGIM Investments LLC (June 2005-December 2011); Investment Company Institute - Board of Governors (since May 2012). | | None. | | Since January 2012 |
| | | | |
Scott E. Benjamin 1973 Board Member & Vice President Portfolios Overseen: 97 | | Executive Vice President (since May 2009) of PGIM Investments LLC; Vice President (since June 2012) of Prudential Investment Management Services LLC; Executive Vice President (since September 2009) of AST Investment Services, Inc.; Senior Vice President of Product Development and Marketing, PGIM Investments (since February 2006); Vice President (since September 2022) of the PGIM Private Credit Fund; Vice President (since March 2022) of the PGIM Private Real Estate Fund, Inc.; formerly Vice President of Product Development and Product Management, PGIM Investments LLC (2003-2006). | | None. | | Since March 2010 |
PGIM Jennison Global Opportunities Fund
| | | | |
| | |
| Fund Officers(a) | | | | |
| | | |
Name Year of Birth Fund Position | | Principal Occupation(s) During Past Five Years | | Length of Service as Fund Officer |
| | | |
Claudia DiGiacomo 1974 Chief Legal Officer | | Chief Legal Officer (since September 2022) of the PGIM Private Credit Fund; Chief Legal Officer (since July 2022) of the PGIM Private Real Estate Fund, Inc.; Chief Legal Officer, Executive Vice President and Secretary of PGIM Investments LLC (since August 2020); Chief Legal Officer of Prudential Mutual Fund Services LLC (since August 2020); Chief Legal Officer of PIFM Holdco, LLC (since August 2020); Vice President and Corporate Counsel (since January 2005) of Prudential; and Corporate Counsel of AST Investment Services, Inc. (since August 2020); formerly Vice President and Assistant Secretary of PGIM Investments LLC (2005-2020); formerly Associate at Sidley Austin Brown & Wood LLP (1999-2004). | | Since December 2005 |
| | | |
Isabelle Sajous 1976 Chief Compliance Officer | | Chief Compliance Officer (since April 2022) of PGIM Investments LLC, the PGIM Funds, Target Funds, PGIM ETF Trust, PGIM Global High Yield Fund, Inc., PGIM High Yield Bond Fund, Inc., PGIM Short Duration High Yield Opportunities Fund, Advanced Series Trust, The Prudential Series Fund and Prudential’s Gibraltar Fund, Inc.; Chief Compliance Officer (since September 2022) of the PGIM Private Credit Fund; Chief Compliance Officer (since March 2022) of the PGIM Private Real Estate Fund, Inc.; Vice President, Compliance of PGIM Investments LLC (since December 2020); formerly Director, Compliance (July 2018-December 2020) of Credit Suisse Asset Management LLC; and Vice President, Associate General Counsel & Deputy Chief Compliance Officer of Cramer Rosenthal McGlynn, LLC (August 2014-July 2018). | | Since April 2022 |
| | | |
Andrew R. French 1962 Secretary | | Vice President (since December 2018) of PGIM Investments LLC; Secretary (since September 2022) of the PGIM Private Credit Fund; Secretary (since March 2022) of the PGIM Private Real Estate Fund, Inc.; formerly Vice President and Corporate Counsel (2010-2018) of Prudential; formerly Director and Corporate Counsel (2006-2010) of Prudential; Vice President and Assistant Secretary (since January 2007) of PGIM Investments LLC; Vice President and Assistant Secretary (since January 2007) of Prudential Mutual Fund Services LLC. | | Since October 2006 |
| | | |
Melissa Gonzalez 1980 Assistant Secretary | | Vice President and Corporate Counsel (since September 2018) of Prudential; Vice President and Assistant Secretary (since August 2020) of PGIM Investments LLC; Assistant Secretary (since September 2022) of the PGIM Private Credit Fund; Assistant Secretary (since March 2022) of the PGIM Private Real Estate Fund, Inc.; formerly Director and Corporate Counsel (March 2014-September 2018) of Prudential. | | Since March 2020 |
Visit our website at pgim.com/investments
| | | | |
| | |
| Fund Officers(a) | | | | |
| | | |
Name Year of Birth Fund Position | | Principal Occupation(s) During Past Five Years | | Length of Service as Fund Officer |
| | | |
Patrick E. McGuinness 1986 Assistant Secretary | | Vice President and Assistant Secretary (since August 2020) of PGIM Investments LLC; Director and Corporate Counsel (since February 2017) of Prudential; Assistant Secretary (since September 2022) of the PGIM Private Credit Fund; Assistant Secretary (since March 2022) of the PGIM Private Real Estate Fund, Inc. | | Since June 2020 |
| | | |
Debra Rubano 1975 Assistant Secretary | | Vice President and Corporate Counsel (since November 2020) of Prudential; Assistant Secretary (since September 2022) of the PGIM Private Credit Fund; Assistant Secretary (since March 2022) of the PGIM Private Real Estate Fund, Inc; formerly Director and Senior Counsel of Allianz Global Investors U.S. Holdings LLC (2010-2020) and Assistant Secretary of numerous funds in the Allianz fund complex (2015-2020). | | Since December 2020 |
| | | |
Kelly A. Coyne 1968 Assistant Secretary | | Director, Investment Operations of Prudential Mutual Fund Services LLC (since 2010); Assistant Secretary (since September 2022) of the PGIM Private Credit Fund; Assistant Secretary (since March 2022) of the PGIM Private Real Estate Fund, Inc. | | Since March 2015 |
| | | |
Christian J. Kelly 1975 Treasurer and Principal Financial and Accounting Officer | | Vice President, Head of Fund Administration of PGIM Investments LLC (since November 2018); Principal Financial Officer (since September 2022) of the PGIM Private Credit Fund; Principal Financial Officer (since March 2022) of the PGIM Private Real Estate Fund, Inc.; formerly, Treasurer and Principal Accounting Officer (March 2022- July 2022) of the PGIM Private Real Estate Fund, Inc.; formerly Director of Fund Administration of Lord Abbett & Co. LLC (2009-2018), Treasurer and Principal Accounting Officer of the Lord Abbett Family of Funds (2017-2018); Director of Accounting, Avenue Capital Group (2008-2009); Senior Manager, Investment Management Practice of Deloitte & Touche LLP (1998-2007). | | Since January 2019 |
| | | |
Lana Lomuti 1967 Assistant Treasurer | | Vice President (since 2007) and Director (2005-2007), within PGIM Investments Fund Administration; formerly Assistant Treasurer (December 2007-February 2014) of The Greater China Fund, Inc. | | Since April 2014 |
| | | |
Russ Shupak 1973 Assistant Treasurer | | Vice President (since 2017) and Director (2013-2017), within PGIM Investments Fund Administration; Treasurer and Principal Accounting Officer (since July 2022) of the PGIM Private Real Estate Fund, Inc.; Assistant Treasurer (since September 2022) of the PGIM Private Credit Fund; formerly Assistant Treasurer (March 2022 – July 2022) of the PGIM Private Real Estate Fund, Inc. | | Since October 2019 |
| | | |
Deborah Conway 1969 Assistant Treasurer | | Vice President (since 2017) and Director (2007-2017), within PGIM Investments Fund Administration. | | Since October 2019 |
PGIM Jennison Global Opportunities Fund
| | | | |
| | |
| Fund Officers(a) | | | | |
| | | |
Name Year of Birth Fund Position | | Principal Occupation(s) During Past Five Years | | Length of Service as Fund Officer |
| | | |
Elyse M. McLaughlin 1974 Assistant Treasurer | | Vice President (since 2017) and Director (2011-2017), within PGIM Investments Fund Administration; Treasurer and Principal Accounting Officer (since September 2022) of the PGIM Private Credit Fund; Assistant Treasurer (since March 2022) of the PGIM Private Real Estate Fund, Inc. | | Since October 2019 |
| | | |
Kelly Florio 1978 Anti-Money Laundering Compliance Officer | | Vice President, Corporate Compliance, Global Compliance Programs and Compliance Risk Management (since December 2021) of Prudential; formerly, Head of Fraud Risk Management (October 2019 to December 2021) at New York Life Insurance Company; formerly, Head of Key Risk Area Operations (November 2018 to October 2019), Director of the US Anti-Money Laundering Compliance Unit (2009-2018) and Bank Loss Prevention Associate (2006 -2009) at MetLife. | | Since June 2022 |
(a) Excludes Mr. Parker and Mr. Benjamin, interested Board Members who also serve as President and Vice President, respectively.
Explanatory Notes to Tables:
| ∎ | | Board Members are deemed to be “Interested,” as defined in the 1940 Act, by reason of their affiliation with PGIM Investments LLC and/or an affiliate of PGIM Investments LLC. |
| ∎ | | Unless otherwise noted, the address of all Board Members and Officers is c/o PGIM Investments LLC, 655 Broad Street, Newark, New Jersey 07102-4410. |
| ∎ | | There is no set term of office for Board Members or Officers. The Board Members have adopted a retirement policy, which calls for the retirement of Board Members on December 31 of the year in which they reach the age of 75. |
| ∎ | | “Other Directorships Held” includes all directorships of companies required to register or file reports with the SEC under the 1934 Act (that is, “public companies”) or other investment companies registered under the 1940 Act. |
| ∎ | | “Portfolios Overseen” includes all investment companies managed by PGIM Investments LLC. The investment companies for which PGIM Investments LLC serves as manager include the PGIM Mutual Funds, Target Funds, The Prudential Variable Contract Accounts, PGIM ETF Trust, PGIM Private Real Estate Fund, Inc., PGIM Private Credit Fund, PGIM High Yield Bond Fund, Inc., PGIM Global High Yield Fund, Inc., PGIM Short Duration High Yield Opportunities Fund, The Prudential Series Fund, Prudential’s Gibraltar Fund, Inc. and the Advanced Series Trust. |
| ∎ | | As used in the Fund Officers table “Prudential” means The Prudential Insurance Company of America. |
Visit our website at pgim.com/investments
Approval of Advisory Agreements (unaudited)
The Fund’s Board of Directors
The Board of Directors (the “Board”) of PGIM Jennison Global Opportunities Fund (the “Fund”)1 consists of ten individuals, eight of whom are not “interested persons” of the Fund, as defined in the Investment Company Act of 1940, as amended (the “1940 Act”) (the “Independent Directors”). The Board is responsible for the oversight of the Fund and its operations, and performs the various duties imposed on the directors of investment companies by the 1940 Act. The Independent Directors have retained independent legal counsel to assist them in connection with their duties. The Chair of the Board is an Independent Director. The Board has established five standing committees: the Audit Committee, the Nominating and Governance Committee, the Compliance Committee and two Investment Committees. Each committee is chaired by, and composed of, Independent Directors.
Annual Approval of the Fund’s Advisory Agreements
As required under the 1940 Act, the Board determines annually whether to renew the Fund’s management agreement with PGIM Investments LLC (“PGIM Investments”) and the Fund’s subadvisory agreement with Jennison Associates LLC (“Jennison”). In considering the renewal of the agreements, the Board, including all of the Independent Directors, met on May 26 and June 7-9, 2022 (the “Board Meeting”) and approved the renewal of the agreements through July 31, 2023, after concluding that the renewal of the agreements was in the best interests of the Fund and its shareholders.
In advance of the meetings, the Board requested and received materials relating to the agreements, and had the opportunity to ask questions and request further information in connection with its consideration. Among other things, the Board considered comparative fee information from PGIM Investments and Jennison. Also, the Board considered comparisons with other mutual funds in relevant Peer Universes and Peer Groups, as is further discussed below.
In approving the agreements, the Board, including the Independent Directors advised by independent legal counsel, considered the factors it deemed relevant, including the nature, quality and extent of services provided by PGIM Investments and the subadviser, the performance of the Fund, the profitability of PGIM Investments and its affiliates, expenses and fees, and the potential for economies of scale that may be shared with the Fund and its shareholders as the Fund’s assets grow. In their deliberations, the Directors did not identify any single factor which alone was responsible for the Board’s decision to approve the agreements with respect to the Fund. In connection with its deliberations, the Board considered information provided by PGIM Investments throughout the year at regular Board meetings, presentations from portfolio managers and other information, as well as information furnished at or in advance of the Board Meeting.
The Directors determined that the overall arrangements between the Fund and PGIM Investments, which serves as the Fund’s investment manager pursuant to a
1 PGIM Jennison Global Opportunities Fund is a series of Prudential World Fund, Inc.
PGIM Jennison Global Opportunities Fund
Approval of Advisory Agreements (continued)
management agreement, and between PGIM Investments and Jennison, which serves as the Fund’s subadviser pursuant to the terms of a subadvisory agreement with PGIM Investments, are in the best interests of the Fund and its shareholders in light of the services performed, fees charged and such other matters as the Directors considered relevant in the exercise of their business judgment.
The material factors and conclusions that formed the basis for the Directors’ reaching their determinations to approve the continuance of the agreements are separately discussed below.
Nature, Quality and Extent of Services
The Board received and considered information regarding the nature, quality and extent of services provided to the Fund by PGIM Investments and Jennison. The Board noted that Jennison is affiliated with PGIM Investments. The Board considered the services provided by PGIM Investments, including but not limited to the oversight of the subadviser for the Fund, as well as the provision of fund recordkeeping, compliance and other services to the Fund, and PGIM Investments’ role as administrator for the Fund’s liquidity risk management program. With respect to PGIM Investments’ oversight of the subadviser, the Board noted that PGIM Investments’ Strategic Investment Research Group (“SIRG”), which is a business unit of PGIM Investments, is responsible for monitoring and reporting to PGIM Investments’ senior management on the performance and operations of the subadviser. The Board also considered that PGIM Investments pays the salaries of all of the officers and interested Directors of the Fund who are part of Fund management. The Board also considered the investment subadvisory services provided by Jennison, including investment research and security selection, as well as adherence to the Fund’s investment restrictions and compliance with applicable Fund policies and procedures. The Board considered PGIM Investments’ evaluation of the subadviser, as well as PGIM Investments’ recommendation, based on its review of the subadviser, to renew the subadvisory agreement.
The Board considered the qualifications, backgrounds and responsibilities of PGIM Investments’ senior management responsible for the oversight of the Fund and Jennison, and also considered the qualifications, backgrounds and responsibilities of Jennison’s portfolio managers who are responsible for the day-to-day management of the Fund’s portfolio. The Board was provided with information pertaining to PGIM Investments’ and Jennison’s organizational structure, senior management, investment operations, and other relevant information pertaining to both PGIM Investments and Jennison. The Board also noted that it received favorable compliance reports from the Fund’s Chief Compliance Officer (“CCO”) as to both PGIM Investments and Jennison.
The Board concluded that it was satisfied with the nature, extent and quality of the investment management services provided by PGIM Investments and the subadvisory services provided to the Fund by Jennison, and that there was a reasonable basis on which to conclude that the Fund benefits from the services provided by PGIM Investments and Jennison under the management and subadvisory agreements.
Visit our website at pgim.com/investments
Costs of Services and Profits Realized by PGIM Investments
The Board was provided with information on the profitability of PGIM Investments and its affiliates in serving as the Fund’s investment manager. The Board discussed with PGIM Investments the methodology utilized in assembling the information regarding profitability and considered its reasonableness. The Board recognized that it is difficult to make comparisons of profitability from fund management contracts because comparative information is not generally publicly available and is affected by numerous factors, including the structure of the particular adviser, the types of funds it manages, its business mix, numerous assumptions regarding allocations and the adviser’s capital structure and cost of capital. Taking these factors into account, the Board concluded that the profitability of PGIM Investments and its affiliates in relation to the services rendered was not unreasonable.
Economies of Scale
The Board received and discussed information concerning economies of scale that PGIM Investments may realize as the Fund’s assets grow beyond current levels. The Board noted that the management fee schedule for the Fund includes breakpoints, which have the effect of decreasing the fee rate as assets increase. During the course of time, the Board has considered information regarding the launch date of the Fund, the management fees of the Fund compared to those of similarly managed funds and PGIM Investments’ investment in the Fund over time. The Board noted that economies of scale may be shared with the Fund in several ways, including low management fees from inception, additional technological and personnel investments to enhance shareholder services, and maintaining existing expense structures in the face of a rising cost environment. The Board considered PGIM Investments’ assertion that it continually evaluates the management fee schedule of the Fund and the potential to share economies of scale through breakpoints or fee waivers as asset levels increase.
The Board recognized the inherent limitations of any analysis of economies of scale, stemming largely from the Board’s understanding that most of PGIM Investments’ costs are not specific to individual funds, but rather are incurred across a variety of products and services.
Other Benefits to PGIM Investments and Jennison
The Board considered potential ancillary benefits that might be received by PGIM Investments, Jennison and their affiliates as a result of their relationship with the Fund. The Board concluded that potential benefits to be derived by PGIM Investments included transfer agency fees received by the Fund’s transfer agent (which is affiliated with PGIM Investments), as well as benefits to its reputation or other intangible benefits resulting from PGIM Investments’ association with the Fund. The Board concluded that the potential benefits to be derived by Jennison included the ability to use soft dollar credits, as well as the potential benefits consistent with those generally resulting from an increase in assets under management, specifically, potential access to additional research resources and benefits to its reputation. The Board concluded that the benefits
PGIM Jennison Global Opportunities Fund
Approval of Advisory Agreements (continued)
derived by PGIM Investments and Jennison were consistent with the types of benefits generally derived by investment managers and subadvisers to mutual funds.
Performance of the Fund / Fees and Expenses
The Board considered certain additional factors and made related conclusions relating to the historical performance of the Fund for the one-, three- and five-year periods ended December 31, 2021.
The Board also considered the Fund’s actual management fee, as well as the Fund’s net total expense ratio, for the fiscal year ended October 31, 2021. The Board considered the management fee for the Fund as compared to the management fee charged by PGIM Investments to other funds and the fee charged by other advisers to comparable mutual funds in a Peer Group. The actual management fee represents the fee rate actually paid by Fund shareholders and includes any fee waivers or reimbursements. The net total expense ratio for the Fund represents the actual expense ratio incurred by Fund shareholders.
The mutual funds included in the Peer Universe, which was used to consider performance, and the Peer Group, which was used to consider fees and expenses, were objectively determined by Broadridge, an independent provider of mutual fund data. In certain circumstances, PGIM Investments also provided supplemental Peer Universe or Peer Group information for reasons addressed with the Board. The comparisons placed the Fund in various quartiles over various periods, with the first quartile being the best 25% of the mutual funds (for performance, the best performing mutual funds and, for expenses, the lowest cost mutual funds).
The section below summarizes key factors considered by the Board and the Board’s conclusions regarding the Fund’s performance, fees and overall expenses. The table sets forth net performance comparisons (which reflect the impact on performance of fund expenses, or any subsidies, expense caps or waivers that may be applicable) with the Peer Universe, actual management fees with the Peer Group (which reflect the impact of any subsidies or fee waivers), and net total expenses with the Peer Group, each of which were key factors considered by the Board.
| | | | | | | | |
| Net Performance | | 1 Year | | 3 Years | | 5 Years | | 10 Years |
| | 4th Quartile | | 1st Quartile | | 1st Quartile | | N/A |
| Actual Management Fees: 3rd Quartile |
| Net Total Expenses: 3rd Quartile |
| ● | | The Board noted that Fund outperformed its benchmark index over the three- and five-year periods and underperformed over the one-year period. |
| ● | | The Board considered PGIM Investments’ assertions that the Fund’s exposure to secular growth stocks was out of favor, and as markets return to favoring such stocks, |
Visit our website at pgim.com/investments
| | PGIM Investments expects relative returns to improve and that PGIM Investments is encouraged by the Fund’s strong longer-term performance over the 3- and 5-year periods. |
| ● | | The Board noted that, effective July 1, 2022, PGIM Investments contractually amended its management fee schedule to add an additional breakpoint at asset levels above $5 billion. The current contractual fee rate schedule is as follows: 0.825% up to $1 billion; 0.800% from $1 billion up to $5 billion; and 0.780% over $5 billion. |
| ● | | The Board and PGIM Investments agreed to retain the Fund’s existing contractual expense cap that (exclusive of certain fees and expenses) limits total annual operating expenses at 0.84%for each class of the Fund’s shares, and limits transfer agency, shareholder servicing, sub-transfer agency and blue sky fees to the extent that such fees cause net annual Fund operating expenses to exceed 1.34% for Class R2 shares or 1.09% for Class R4 shares through February 28, 2023. |
| ● | | The Board and PGIM Investments has also agreed to retain the Fund’s existing contractual expense cap with respect to Class A shares, which (exclusive of certain fees and expenses) limits total annual fund operating expenses to 1.08% for Class A shares through February 28, 2023. |
| ● | | In addition, PGIM Investments will waive management fees or shared operating expenses on any share class to the same extent that it waives such expenses on any other share class, and has agreed that total annual fund operating expenses for Class R6 shares will not exceed total annual fund operating expenses for Class Z shares. |
| ● | | The Board concluded that, in light of the above, it would be in the best interests of the Fund and its shareholders to renew the agreements. |
| ● | | The Board concluded that the management fees (including subadvisory fees) and total expenses were reasonable in light of the services provided. |
* * *
After full consideration of these factors, the Board concluded that the approval of the agreements was in the best interests of the Fund and its shareholders.
PGIM Jennison Global Opportunities Fund
| | | | |
| | | |
∎ MAIL | | ∎ TELEPHONE | | ∎ WEBSITE |
| 655 Broad Street | | (800) 225-1852 | | pgim.com/investments |
| Newark, NJ 07102 | | | | |
|
| PROXY VOTING |
| |
| The Board of Directors of the Fund has delegated to the Fund’s subadviser the responsibility for voting any proxies and maintaining proxy recordkeeping with respect to the Fund. A description of these proxy voting policies and procedures is available without charge, upon request, by calling (800) 225-1852 or by visiting the Securities and Exchange Commission’s website at sec.gov. Information regarding how the Fund voted proxies relating to portfolio securities during the most recent 12-month period ended June 30 is available on the Fund’s website and on the Securities and Exchange Commission’s website. |
| |
| |
| DIRECTORS |
| |
Ellen S. Alberding ● Kevin J. Bannon ● Scott E. Benjamin ● Linda W. Bynoe ● Barry H. Evans ● Keith F. Hartstein ● Laurie Simon Hodrick ● Stuart S. Parker ● Brian K. Reid ● Grace C. Torres |
| |
| |
| OFFICERS |
| |
| Stuart S. Parker, President ● Scott E. Benjamin, Vice President ● Christian J. Kelly, Treasurer and Principal Financial and Accounting Officer ● Claudia DiGiacomo, Chief Legal Officer ● Isabelle Sajous, Chief Compliance Officer ● Kelly Florio, Anti-Money Laundering Compliance Officer ● Andrew R. French, Secretary ● Melissa Gonzalez, Assistant Secretary ● Kelly A. Coyne, Assistant Secretary ● Patrick E. McGuinness, Assistant Secretary ● Debra Rubano, Assistant Secretary ● Lana Lomuti, Assistant Treasurer ● Russ Shupak, Assistant Treasurer ● Elyse M. McLaughlin, Assistant Treasurer ● Deborah Conway, Assistant Treasurer |
| | | | |
| MANAGER | | PGIM Investments LLC | | 655 Broad Street Newark, NJ 07102 |
| | |
| SUBADVISER | | Jennison Associates LLC | | 466 Lexington Avenue New York, NY 10017 |
| | |
| DISTRIBUTOR | | Prudential Investment Management Services LLC | | 655 Broad Street Newark, NJ 07102 |
| | |
| CUSTODIAN | | The Bank of New York Mellon | | 240 Greenwich Street New York, NY 10286 |
| | |
| TRANSFER AGENT | | Prudential Mutual Fund Services LLC | | PO Box 9658 Providence, RI 02940 |
| | |
INDEPENDENT REGISTERED PUBLIC ACCOUNTING FIRM | | PricewaterhouseCoopers LLP | | 300 Madison Avenue New York, NY 10017 |
| | |
| FUND COUNSEL | | Willkie Farr &Gallagher LLP | | 787 Seventh Avenue New York, NY 10019 |
|
| |
| An investor should consider the investment objectives, risks, charges, and expenses of the Fund carefully before investing. The prospectus and summary prospectus contain this and other information about the Fund. An investor may obtain the prospectus and summary prospectus by visiting our website at pgim.com/investments or by calling (800) 225-1852. The prospectus and summary prospectus should be read carefully before investing. |
| |
| |
| E-DELIVERY |
| To receive your mutual fund documents online, go to pgim.com/investments/resource/edelivery and enroll. Instead of receiving printed documents by mail, you will receive notification via email when new materials are available. You can cancel your enrollment or change your email address at any time by visiting the website address above. |
| |
| |
| SHAREHOLDER COMMUNICATIONS WITH DIRECTORS |
| Shareholders can communicate directly with the Board of Directors by writing to the Chair of the Board, PGIM Jennison Global Opportunities Fund, PGIM Investments, Attn: Board of Directors, 655 Broad Street, Newark, NJ 07102. Shareholders can communicate directly with an individual Director by writing to that Director at the same address. Communications are not screened before being delivered to the addressee. |
| |
| |
| AVAILABILITY OF PORTFOLIO HOLDINGS |
| |
| The Fund files its complete schedule of portfolio holdings with the Securities and Exchange Commission for the first and third quarters of each fiscal year as an exhibit to its reports on Form N-PORT. The Fund’s Form N-PORT filings are available on the Commission’s website at sec.gov. |
| |
| |
| The Fund’s Statement of Additional Information contains additional information about the Fund’s Directors and is available without charge, upon request, by calling (800) 225-1852. |
| | | | |
| Mutual Funds: | | | | |
| | | |
ARE NOT INSURED BY THE FDIC OR ANY FEDERAL GOVERNMENT AGENCY | | MAY LOSE VALUE | | ARE NOT A DEPOSIT OF OR GUARANTEED BY ANY BANK OR ANY BANK AFFILIATE |

PGIM JENNISON GLOBAL OPPORTUNITIES FUND
| | | | | | | | | | | | |
| SHARE CLASS | | A | | C | | Z | | R2 | | R4 | | R6 |
NASDAQ | | PRJAX | | PRJCX | | PRJZX | | PRJBX | | PRJDX | | PRJQX |
CUSIP | | 743969719 | | 743969693 | | 743969685 | | 743969438 | | 743969420 | | 743969594 |
MF214E

PGIM JENNISON EMERGING MARKETS EQUITY OPPORTUNITIES FUND
ANNUAL REPORT
OCTOBER 31, 2022

To enroll in e-delivery, go to pgim.com/investments/resource/edelivery
Table of Contents
This report is not authorized for distribution to prospective investors unless preceded or accompanied by a current prospectus.
The views expressed in this report and information about the Fund’s portfolio holdings are for the period covered by this report and are subject to change thereafter.
Mutual funds are distributed by Prudential Investment Management Services LLC, member SIPC. Jennison Associates LLC is a registered investment adviser. Both are Prudential Financial companies. © 2022 Prudential Financial, Inc. and its related entities. Jennison Associates, Jennison, PGIM, and the PGIM logo are service marks of Prudential Financial, Inc. and its related entities, registered in many jurisdictions worldwide.
| | |
| 2 | | Visit our website at pgim.com/investments |
Letter from the President
| | |
 | | Dear Shareholder: |
| | We hope you find the annual report for the PGIM Jennison Emerging Markets Equity Opportunities Fund informative and useful. The report covers performance for the 12-month period that ended October 31, 2022. The attention of the global economy and financial markets pivoted during the period from the COVID-19 pandemic to the challenge of rapidly rising inflation. While job growth remained strong, prices for a wide range of goods and services rose in response to economic re-openings, supply-chain disruptions, governmental stimulus, and Russia’s invasion of Ukraine. |
With inflation surging to a 40-year high, the Federal Reserve and other central banks aggressively hiked interest rates, prompting recession concerns.
After rising to record levels at the end of 2021, stocks have fallen sharply in 2022 as investors worried about higher prices, slowing economic growth, geopolitical uncertainty, and new COVID-19 outbreaks. Equities rallied for a time during the summer but began falling again in late August on fears that the Fed would keep raising rates to tame inflation. For the entire 12-month period, equities suffered a broad-based global decline, although large-cap US stocks outperformed their small-cap counterparts. International developed and emerging markets trailed the US market during this time.
Rising rates and economic uncertainty drove fixed income prices broadly lower as well. US and global investment-grade bonds, along with US high yield corporate bonds and emerging market debt, all posted negative returns during the period.
Regarding your investments with PGIM, we believe it is important to maintain a diversified portfolio of funds consistent with your tolerance for risk, time horizon, and financial goals. Your financial advisor can help you create a diversified investment plan that may include funds covering all the basic asset classes and that reflects your personal investor profile and risk tolerance. However, diversification and asset allocation strategies do not assure a profit or protect against loss in declining markets.
At PGIM Investments, we provide access to active investment strategies across the global markets in the pursuit of consistent outperformance for investors. PGIM is the world’s 11th-largest investment manager with more than $1.5 trillion in assets under management. Our scale and investment expertise allow us to deliver a diversified suite of actively managed solutions across a broad spectrum of asset classes and investment styles.
Thank you for choosing our family of funds.
Sincerely,

Stuart S. Parker, President
PGIM Jennison Emerging Markets Equity Opportunities Fund
December 15, 2022
PGIM Jennison Emerging Markets Equity Opportunities Fund 3
Your Fund’s Performance (unaudited)
Performance data quoted represent past performance. Past performance does not guarantee future results. The investment return and principal value of an investment will fluctuate so that an investor’s shares, when redeemed, may be worth more or less than their original cost. Current performance may be lower or higher than the past performance data quoted. An investor may obtain performance data as of the most recent month-end by visiting our website at pgim.com/investments or by calling (800) 225-1852.
| | | | | | |
| |
| | | Average Annual Total Returns as of 10/31/22 |
| | | One Year (%) | | Five Years (%) | | Since Inception (%) |
| | | |
Class A | | | | | | |
(with sales charges) | | -50.51 | | 0.93 | | 1.96 (09/16/2014) |
(without sales charges) | | -47.63 | | 2.08 | | 2.67 (09/16/2014) |
| | | |
Class C | | | | | | |
(with sales charges) | | -48.54 | | 1.30 | | 1.91 (09/16/2014) |
(without sales charges) | | -48.02 | | 1.30 | | 1.91 (09/16/2014) |
Class Z | | | | | | |
(without sales charges) | | -47.49 | | 2.32 | | 2.93 (09/16/2014) |
| | | |
Class R6 | | | | | | |
(without sales charges) | | -47.43 | | 2.35 | | 2.95 (09/16/2014) |
MSCI Emerging Markets Index | | | | | | |
| | | -31.03 | | -3.09 | | 0.26 |
Since Inception returns are provided since the Fund has less than 10 fiscal years of returns. Since Inception returns for the Index are measured from the closest month-end to the Fund’s inception date.
| | |
| 4 | | Visit our website at pgim.com/investments |
Growth of a $10,000 Investment (unaudited)
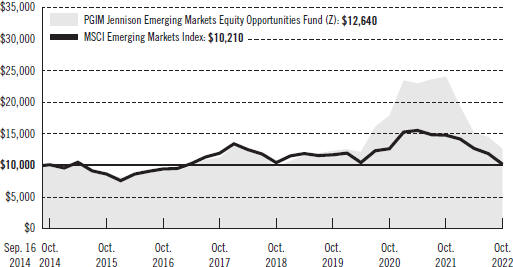
The graph compares a $10,000 investment in the Fund’s Class Z shares with a similar investment in the MSCI Emerging Markets Index, by portraying the initial account values at the commencement of operations for Class Z shares (September 16, 2014) and the account values at the end of the current fiscal year (October 31, 2022), as measured on a quarterly basis. For purposes of the graph, and unless otherwise indicated, it has been assumed that (a) all recurring fees (including management fees) were deducted and (b) all dividends and distributions were reinvested. The line graph provides information for Class Z shares only. As indicated in the tables provided earlier, performance for other share classes will vary due to the differing fees and expenses applicable to each share class (as indicated in the following paragraphs). Without waiver of fees and/or expense reimbursements, if any, the returns would have been lower.
Past performance does not predict future performance. Total returns and the ending account values in the graphs include changes in share price and reinvestment of dividends and capital gains distributions in a hypothetical investment for the periods shown. The Fund’s total returns do not reflect the deduction of income taxes on an individual’s investment. Taxes may reduce your actual investment returns on income or gains paid by the Fund or any gains you may realize if you sell your shares.
PGIM Jennison Emerging Markets Equity Opportunities Fund 5
Your Fund’s Performance (continued)
The returns in the tables do not reflect the deduction of taxes that a shareholder would pay on Fund distributions or following the redemption of Fund shares. The average annual total returns take into account applicable sales charges, which are described for each share class in the table below.
| | | | | | | | |
| | | | |
| | | Class A | | Class C | | Class Z | | Class R6 |
| | | | | |
Maximum initial sales charge | | 5.50% of the public offering price | | None | | None | | None |
Contingent deferred sales charge (CDSC) (as a percentage of the lower of the original purchase price or the net asset value at redemption) | | 1.00% on sales of $1 million or more made within 12 months of purchase | | 1.00% on sales made within 12 months of purchase | | None | | None |
Annual distribution and service (12b-1) fees (shown as a percentage of average daily net assets) | | 0.30% (0.25% currently) | | 1.00% | | None | | None |
Benchmark Definition
MSCI Emerging Markets Index—The MSCI Emerging Markets Index is an unmanaged, free float-adjusted, market capitalization-weighted index that is designed to measure equity market performance of emerging markets. It consists of the following 24 emerging market country indexes: Brazil, Chile, China, Colombia, the Czech Republic, Egypt, Greece, Hungary, India, Indonesia, Korea, Kuwait, Malaysia, Mexico, Peru, Philippines, Poland, Qatar, Saudi Arabia, South Africa, Taiwan, Thailand, Turkey, and the United Arab Emirates.
Investors cannot invest directly in an index. The returns for the Index would be lower if they included the effects of sales charges, operating expenses of a mutual fund, or taxes that may be paid by an investor.
| | |
| 6 | | Visit our website at pgim.com/investments |
Presentation of Fund Holdings as of 10/31/22
| | | | | | |
| | | |
| Ten Largest Holdings | | Line of Business | | Country | | % of Net Assets |
| | | |
Coupang, Inc. | | Internet & Direct Marketing Retail | | South Korea | | 6.0% |
| | | |
B3 SA - Brasil Bolsa Balcao | | Capital Markets | | Brazil | | 5.5% |
| | | |
Mahindra & Mahindra Ltd. | | Automobiles | | India | | 5.4% |
| | | |
Bank Central Asia Tbk PT | | Banks | | Indonesia | | 5.0% |
| | | |
MakeMyTrip Ltd. | | Hotels, Restaurants & Leisure | | India | | 4.4% |
| | | |
Hypera SA | | Pharmaceuticals | | Brazil | | 4.3% |
| | | |
Bank Mandiri Persero Tbk PT | | Banks | | Indonesia | | 4.2% |
| | | |
ICICI Bank Ltd. | | Banks | | India | | 3.8% |
| | | |
HDFC Bank Ltd., ADR | | Banks | | India | | 2.8% |
| | | |
Airports of Thailand plc | | Transportation Infrastructure | | Thailand | | 2.7% |
Holdings reflect only long-term investments and are subject to change.
PGIM Jennison Emerging Markets Equity Opportunities Fund 7
Strategy and Performance Overview*
(unaudited)
How did the Fund perform?
The PGIM Jennison Emerging Markets Equity Opportunities Fund’s Class Z shares returned -47.49% in the 12-month reporting period that ended October 31, 2022, underperforming the -31.03% return of the MSCI Emerging Markets Index (the Index).
What were the market conditions?
| ● | | The investment environment at the start of 2022 was clouded by continued uncertainties related to the COVID-19 pandemic, inflation, and the prospect of slowing growth on the back of central banks’ plans for policy tightening. The brutal military conflict in Ukraine added a dangerous new dimension of uncertainty in late February. Commodity prices rose sharply, led by crude oil, as the sanctions imposed on Russia by the US and European Union made it difficult for the world’s largest oil exporter to complete transactions. |
| ● | | As the year progressed, stock prices continued to suffer from the impacts of the war in Ukraine, unexpectedly high inflation, aggressive monetary tightening, and declining growth prospects around the globe. |
| ● | | Emerging markets were hit especially hard, trailing most developed markets, as higher interest rates and a strong US dollar weighed on the group. |
| ● | | Within the MSCI Emerging Markets Index, all sectors produced negative returns. The consumer discretionary, communication services, and real estate sectors each lost more than 40%. With respect to the Index’s largest country weights, China was one of the worst performers, as COVID-19 lockdowns persisted, and economic data proved weaker than expected. Taiwan and Korea also declined sharply, while Brazil posted a strong gain. |
What worked?
| ● | | Consumer discretionary holdings added value in aggregate. Pinduoduo Inc., a Chinese e-commerce platform, grew significantly amid China’s shift to community buying within the e-commerce industry. Shares in Mahindra & Mahindra Ltd., one of the largest tractor and SUV manufacturers in India, reacted favorably to the unveiling of the company’s electric vehicle (EV) platform, which included two EV brands and five models. |
| ● | | In healthcare, shares in Hypera S.A., the largest pharmaceutical company in Brazil, benefited from strong top-line expansion and organic growth. The company also increased its research and development investments, which were seen as likely to sustain future growth. |
| ● | | Among financials, the Fund’s positions in B3 S.A. and PT Bank Mandiri (Persero) Tbk were standouts. Shares in B3 (Brasil Bolsa Balcăo), a Brazil-based, financial-market infrastructure provider, benefited from higher equity and derivatives trading volumes. Markets also reacted positively to Brazil’s October 2022 presidential election. Bank Mandiri, the largest bank in Indonesia in terms of assets, loans, and deposits, demonstrated consistent growth in market share while gaining importance as a transactional bank, as well as making progress in digital banking. |
| | |
| 8 | | Visit our website at pgim.com/investments |
What didn’t work?
| ● | | The communication services sector was the largest detractor from performance during the reporting period. Shares in Sea Ltd., a multichannel gaming and e-commerce company based in Singapore, declined on concerns regarding slowing gaming revenues and potential regulatory risks related to the company’s entry into Brazil. Jennison believes its large user base and diversified customer base should help propel top-line growth going forward. |
| ● | | Notable detractors in other sectors included: |
| | ● | | Silergy Corp., a Taiwan-based, analogue semiconductor company with operational headquarters in China. Shares were down with other higher-valuation names as well as on inventory concerns. The position was eliminated. |
| | ● | | JD.com Inc., China’s largest direct sales company (measured by transaction volume) and one of its largest e-commerce businesses—the go-to platform for big-ticket items and a favored platform for almost all sales categories. Shares slumped on macro uncertainties, although the company continues to improve margins and grow its bottom line. |
| | ● | | KE Holdings Inc., a platform for online and offline housing transactions that is standardizing the real estate market in China and gaining significant market share. Shares lost ground on concerns over possible real estate brokerage commission rates in China, as well as more general concerns regarding China’s embattled property market. |
Current outlook
| ● | | Jennison remains focused on stock-specific opportunities and risk. While continued volatility is expected alongside incremental news flow, once volatility moderates, investors are likely to refocus on fundamentals. |
| ● | | Jennison remains optimistic that the Fund is well positioned for the prevailing, complex investment landscape. While Fund holdings are not insulated from the macro-economic backdrop, Jennison believes their market-leading positions and often-disruptive business models should allow them to deliver growth that is higher and lasts longer than the market currently expects—leading to share price outperformance over the Fund’s longer-term investment horizon. |
*This strategy and performance overview, which discusses what strategies or holdings (including derivatives, if applicable) affected the Fund’s performance, is compiled based on how the Fund performed relative to the Fund’s benchmark index and is viewed for performance attribution purposes at the aggregate Fund level, which in most instances will not directly correlate to the amounts disclosed in the Statement of Operations which conform to US generally accepted accounting principles.
PGIM Jennison Emerging Markets Equity Opportunities Fund 9
Fees and Expenses (unaudited)
As a shareholder of the Fund, you incur two types of costs: (1) transaction costs, including sales charges (loads) on purchase payments and redemptions, as applicable, and (2) ongoing costs, including management fees, distribution and/or service (12b-1) fees, and other Fund expenses, as applicable. This example is intended to help you understand your ongoing costs (in dollars) of investing in the Fund and to compare these costs with the ongoing costs of investing in other mutual funds.
The example is based on an investment of $1,000 held through the six-month period ended October 31, 2022. The example is for illustrative purposes only; you should consult the Prospectus for information on initial and subsequent minimum investment requirements.
Actual Expenses
The first line for each share class in the table on the following page provides information about actual account values and actual expenses. You may use the information on this line, together with the amount you invested, to estimate the expenses that you paid over the period. Simply divide your account value by $1,000 (for example, an $8,600 account value ÷ $1,000 = 8.6), then multiply the result by the number on the first line under the heading “Expenses Paid During the Six-Month Period” to estimate the expenses you paid on your account during this period.
Hypothetical Example for Comparison Purposes
The second line for each share class in the table on the following page provides information about hypothetical account values and hypothetical expenses based on the Fund’s actual expense ratio and an assumed rate of return of 5% per year before expenses, which is not the Fund’s actual return. The hypothetical account values and expenses may not be used to estimate the actual ending account balance or expenses you paid for the period. You may use this information to compare the ongoing costs of investing in the Fund and other funds. To do so, compare this 5% hypothetical example with the 5% hypothetical examples that appear in the shareholder reports of the other funds.
The Fund’s transfer agent may charge additional fees to holders of certain accounts that are not included in the expenses shown in the table on the following page. These fees apply to individual retirement accounts (IRAs) and Section 403(b) accounts. As of the close of the six-month period covered by the table, IRA fees included an annual maintenance fee of $15 per account (subject to a maximum annual maintenance fee of $25 for all accounts held by the same shareholder). Section 403(b) accounts are charged an annual $25 fiduciary maintenance fee. Some of the fees may vary in amount, or may be waived, based on your total account balance or the number of PGIM funds, including the Fund, that you own. You should consider the additional fees that were charged to your Fund account over the six-month period when you estimate the total ongoing expenses paid over the period and the impact of these fees on your ending account value, as these additional expenses are not reflected in the information
| | |
| 10 | | Visit our website at pgim.com/investments |
provided in the expense table. Additional fees have the effect of reducing investment returns.
Please note that the expenses shown in the table are meant to highlight your ongoing costs only and do not reflect any transactional costs such as sales charges (loads). Therefore, the second line for each share class in the table is useful in comparing ongoing costs only and will not help you determine the relative total costs of owning different funds. In addition, if these transactional costs were included, your costs would have been higher.
| | | | | | | | | | |
| | | | |
PGIM Jennison Emerging Markets
Equity Opportunities Fund | | Beginning Account Value May 1, 2022 | | Ending Account Value October 31, 2022 | | Annualized Expense Ratio Based on the
Six-Month Period | | Expenses Paid
During the Six-Month Period* |
| | | | | |
Class A | | Actual | | $1,000.00 | | $ 831.00 | | 1.31% | | $6.05 |
| | | | | |
| | Hypothetical | | $1,000.00 | | $1,018.60 | | 1.31% | | $6.67 |
| | | | | |
Class C | | Actual | | $1,000.00 | | $ 828.10 | | 2.06% | | $9.49 |
| | | | | |
| | Hypothetical | | $1,000.00 | | $1,014.82 | | 2.06% | | $10.46 |
| | | | | |
Class Z | | Actual | | $1,000.00 | | $ 832.10 | | 1.06% | | $4.89 |
| | | | | |
| | Hypothetical | | $1,000.00 | | $1,019.86 | | 1.06% | | $5.40 |
| | | | | |
Class R6 | | Actual | | $1,000.00 | | $ 832.90 | | 0.99% | | $4.57 |
| | | | | |
| | | Hypothetical | | $1,000.00 | | $1,020.21 | | 0.99% | | $5.04 |
*Fund expenses (net of fee waivers or subsidies, if any) for each share class are equal to the annualized expense ratio for each share class (provided in the table), multiplied by the average account value over the period, multiplied by the 184 days in the six-month period ended October 31, 2022, and divided by the 365 days in the Fund’s fiscal year ended October 31, 2022 (to reflect the six-month period). Expenses presented in the table include the expenses of any underlying portfolios in which the Fund may invest.
PGIM Jennison Emerging Markets Equity Opportunities Fund 11
Schedule of Investments
as of October 31, 2022
| | | | | | | | |
| | |
| Description | | Shares | | | Value | |
| | |
LONG-TERM INVESTMENTS 90.6% | | | | | | | | |
| | |
COMMON STOCKS | | | | | | | | |
| | |
Brazil 18.9% | | | | | | | | |
| | |
Arezzo Industria e Comercio SA | | | 558,748 | | | $ | 11,280,966 | |
B3 SA - Brasil Bolsa Balcao | | | 13,048,644 | | | | 37,891,716 | |
Hypera SA | | | 2,955,616 | | | | 29,192,823 | |
Localiza Rent a Car SA | | | 777,957 | | | | 10,608,710 | |
MercadoLibre, Inc.* | | | 16,412 | | | | 14,797,388 | |
NU Holdings Ltd. (Class A Stock)* | | | 2,987,600 | | | | 14,938,000 | |
Raia Drogasil SA | | | 2,172,439 | | | | 11,136,615 | |
| | | | | | | | |
| | |
| | | | | | | 129,846,218 | |
| | |
China 14.0% | | | | | | | | |
Aier Eye Hospital Group Co. Ltd. (Class A Stock) | | | 2,789,830 | | | | 9,417,860 | |
East Money Information Co. Ltd. (Class A Stock) | | | 4,817,597 | | | | 10,273,332 | |
Full Truck Alliance Co. Ltd., ADR*(a) | | | 2,109,886 | | | | 10,043,057 | |
JD.com, Inc., ADR(a) | | | 283,977 | | | | 10,589,502 | |
Kanzhun Ltd., ADR* | | | 927,975 | | | | 10,142,767 | |
KE Holdings, Inc., ADR* | | | 1,022,859 | | | | 10,412,705 | |
LONGi Green Energy Technology Co. Ltd. (Class A Stock) | | | 1,404,053 | | | | 9,224,010 | |
Pinduoduo, Inc., ADR* | | | 269,705 | | | | 14,787,925 | |
Suzhou Maxwell Technologies Co. Ltd. (Class A Stock) | | | 168,381 | | | | 11,021,196 | |
| | | | | | | | |
| | |
| | | | | | | 95,912,354 | |
| | |
India 28.7% | | | | | | | | |
| | |
Apollo Hospitals Enterprise Ltd. | | | 130,586 | | | | 7,130,504 | |
Ashok Leyland Ltd. | | | 6,565,795 | | | | 12,170,374 | |
Asian Paints Ltd. | | | 227,636 | | | | 8,568,918 | |
Bajaj Finance Ltd. | | | 208,459 | | | | 18,019,203 | |
HDFC Bank Ltd., ADR | | | 307,384 | | | | 19,153,097 | |
ICICI Bank Ltd. | | | 2,350,691 | | | | 25,846,672 | |
Mahindra & Mahindra Ltd. | | | 2,271,896 | | | | 37,079,699 | |
MakeMyTrip Ltd.*(a) | | | 1,090,041 | | | | 30,335,841 | |
Max Healthcare Institute Ltd.* | | | 1,613,684 | | | | 8,895,578 | |
Reliance Industries Ltd. | | | 334,269 | | | | 10,314,465 | |
Titan Co. Ltd. | | | 490,119 | | | | 16,354,326 | |
Varun Beverages Ltd. | | | 245,896 | | | | 3,120,141 | |
| | | | | | | | |
| | |
| | | | | | | 196,988,818 | |
| | |
Indonesia 9.2% | | | | | | | | |
| | |
Bank Central Asia Tbk PT | | | 61,198,752 | | | | 34,594,279 | |
Bank Mandiri Persero Tbk PT | | | 42,540,504 | | | | 28,738,389 | |
| | | | | | | | |
| | |
| | | | | | | 63,332,668 | |
See Notes to Financial Statements.
PGIM Jennison Emerging Markets Equity Opportunities Fund 13
Schedule of Investments (continued)
as of October 31, 2022
| | | | | | | | |
| | |
| Description | | Shares | | | Value | |
| | |
COMMON STOCKS (Continued) | | | | | | | | |
| | |
Singapore 2.0% | | | | | | | | |
| | |
Grab Holdings Ltd. (Class A Stock)*(a) | | | 3,235,227 | | | $ | 8,411,590 | |
Sea Ltd., ADR*(a) | | | 111,962 | | | | 5,562,272 | |
| | | | | | | | |
| | |
| | | | | | | 13,973,862 | |
| | |
South Korea 11.9% | | | | | | | | |
| | |
Coupang, Inc.* | | | 2,369,844 | | | | 40,927,206 | |
LG Energy Solution Ltd.* | | | 27,940 | | | | 10,338,340 | |
Samsung SDI Co. Ltd. | | | 26,583 | | | | 13,714,578 | |
SK Hynix, Inc. | | | 284,371 | | | | 16,462,680 | |
| | | | | | | | |
| | |
| | | | | | | 81,442,804 | |
| | |
Taiwan 0.7% | | | | | | | | |
| | |
ASPEED Technology, Inc. | | | 86,315 | | | | 4,474,638 | |
| | |
Thailand 5.2% | | | | | | | | |
| | |
Airports of Thailand PCL* | | | 9,569,145 | | | | 18,614,725 | |
Bumrungrad Hospital PCL | | | 2,916,653 | | | | 17,386,236 | |
| | | | | | | | |
| | |
| | | | | | | 36,000,961 | |
| | | | | | | | |
| | |
TOTAL LONG-TERM INVESTMENTS
(cost $652,741,660) | | | | | | | 621,972,323 | |
| | | | | | | | |
| | |
SHORT-TERM INVESTMENTS 13.5% | | | | | | | | |
| | |
AFFILIATED MUTUAL FUND 3.9% | | | | | | | | |
PGIM Institutional Money Market Fund
(cost $27,117,200; includes $26,979,667 of cash collateral for securities on loan)(b)(wa) | | | 27,146,713 | | | | 27,122,281 | |
| | | | | | | | |
| | |
UNAFFILIATED FUND 9.6% | | | | | | | | |
Dreyfus Government Cash Management (Institutional Shares)
(cost $65,650,552) | | | 65,650,552 | | | | 65,650,552 | |
| | | | | | | | |
| | |
TOTAL SHORT-TERM INVESTMENTS
(cost $92,767,752) | | | | | | | 92,772,833 | |
| | | | | | | | |
| | |
TOTAL INVESTMENTS 104.1% | | | | | | | | |
(cost $745,509,412) | | | | | | | 714,745,156 | |
Liabilities in excess of other assets (4.1)% | | | | | | | (28,389,677 | ) |
| | | | | | | | |
| | |
NET ASSETS 100.0% | | | | | | $ | 686,355,479 | |
| | | | | | | | |
See Notes to Financial Statements.
Below is a list of the abbreviation(s) used in the annual report:
ADR—American Depositary Receipt
LIBOR—London Interbank Offered Rate
SOFR—Secured Overnight Financing Rate
| * | Non-income producing security. |
| (a) | All or a portion of security is on loan. The aggregate market value of such securities, including those sold and pending settlement, is $26,389,424; cash collateral of $26,979,667 (included in liabilities) was received with which the Fund purchased highly liquid short-term investments. In the event of significant appreciation in value of securities on loan on the last business day of the reporting period, the Fund may reflect a collateral value that is less than the market value of the loaned securities and such shortfall is remedied the following business day. |
| (b) | Represents security, or portion thereof, purchased with cash collateral received for securities on loan and includes dividend reinvestment. |
| (wa) | PGIM Investments LLC, the manager of the Fund, also serves as manager of the PGIM Core Ultra Short Bond Fund and PGIM Institutional Money Market Fund, if applicable. |
Fair Value Measurements:
Various inputs are used in determining the value of the Fund’s investments. These inputs are summarized in the three broad levels listed below.
Level 1—unadjusted quoted prices generally in active markets for identical securities.
Level 2—quoted prices for similar securities, interest rates and yield curves, prepayment speeds, foreign currency exchange rates and other observable inputs.
Level 3—unobservable inputs for securities valued in accordance with Board approved fair valuation procedures.
The following is a summary of the inputs used as of October 31, 2022 in valuing such portfolio securities:
| | | | | | | | | | | | |
| | | Level 1 | | | Level 2 | | | Level 3 | |
Investments in Securities | | | | | | | | | | | | |
Assets | | | | | | | | | | | | |
Long-Term Investments | | | | | | | | | | | | |
Common Stocks | | | | | | | | | | | | |
Brazil | | $ | 129,846,218 | | | $ | — | | | | $— | |
China | | | 55,975,956 | | | | 39,936,398 | | | | — | |
India | | | 49,488,938 | | | | 147,499,880 | | | | — | |
Indonesia | | | — | | | | 63,332,668 | | | | — | |
Singapore | | | 13,973,862 | | | | — | | | | — | |
South Korea | | | 40,927,206 | | | | 40,515,598 | | | | — | |
Taiwan | | | — | | | | 4,474,638 | | | | — | |
Thailand. | | | — | | | | 36,000,961 | | | | — | |
Short-Term Investments | | | | | | | | | | | | |
Affiliated Mutual Fund | | | 27,122,281 | | | | — | | | | — | |
Unaffiliated Fund | | | 65,650,552 | | | | — | | | | — | |
| | | | | | | | | | | | |
Total | | $ | 382,985,013 | | | $ | 331,760,143 | | | | $— | |
| | | | | | | | | | | | |
See Notes to Financial Statements.
PGIM Jennison Emerging Markets Equity Opportunities Fund 15
Schedule of Investments (continued)
as of October 31, 2022
Industry Classification:
The industry classification of investments and liabilities in excess of other assets shown as a percentage of net assets as of October 31, 2022 were as follows:
| | | | |
Banks | | | 18.0 | % |
Internet & Direct Marketing Retail | | | 11.9 | |
Unaffiliated Fund | | | 9.6 | |
Capital Markets | | | 7.0 | |
Health Care Providers & Services | | | 6.2 | |
Automobiles | | | 5.4 | |
Hotels, Restaurants & Leisure | | | 4.4 | |
Semiconductors & Semiconductor Equipment | | | 4.4 | |
Pharmaceuticals | | | 4.3 | |
Road & Rail | | | 4.2 | |
Textiles, Apparel & Luxury Goods | | | 4.0 | |
Affiliated Mutual Fund (3.9% represents | | | | |
investments purchased with collateral from securities on loan) | | | 3.9 | |
Electrical Equipment | | | 3.1 | |
Transportation Infrastructure | | | 2.7 | |
| | | | |
Consumer Finance | | | 2.6 | % |
Electronic Equipment, Instruments & Components | | | 2.0 | |
Machinery | | | 1.8 | |
Food & Staples Retailing | | | 1.6 | |
Real Estate Management & Development | | | 1.5 | |
Oil, Gas & Consumable Fuels | | | 1.5 | |
Interactive Media & Services | | | 1.5 | |
Chemicals | | | 1.2 | |
Entertainment | | | 0.8 | |
Beverages | | | 0.5 | |
| | | | |
| | | 104.1 | |
Liabilities in excess of other assets | | | (4.1 | ) |
| | | | |
| | | 100.0 | % |
| | | | |
Financial Instruments/Transactions—Summary of Offsetting and Netting Arrangements:
The Fund entered into financial instruments/transactions during the reporting period that are either offset in accordance with current requirements or are subject to enforceable master netting arrangements or similar agreements that permit offsetting. The information about offsetting and related netting arrangements for financial instruments/transactions where the legal right to set-off exists is presented in the summary below.
Offsetting of financial instrument/transaction assets and liabilities:
| | | | | | | | | | |
| Description | | Gross Market
Value of
Recognized
Assets/(Liabilities) | | | Collateral
Pledged/(Received)(1) | | | Net Amount |
| | | |
Securities on Loan | | $ | 26,389,424 | | | $ | (26,389,424 | ) | | $— |
| (1) | Collateral amount disclosed by the Fund is limited to the market value of financial instruments/transactions. |
See Notes to Financial Statements.
Statement of Assets and Liabilities
as of October 31, 2022
| | | | |
| |
Assets | | | | |
| |
Investments at value, including securities on loan of $26,389,424: | | | | |
Unaffiliated investments (cost $718,392,212) | | $ | 687,622,875 | |
Affiliated investments (cost $27,117,200) | | | 27,122,281 | |
Foreign currency, at value (cost $9,740,534) | | | 9,729,175 | |
Receivable for Fund shares sold | | | 3,573,424 | |
Dividends receivable | | | 435,026 | |
Foreign capital gains tax benefit accrued | | | 26,010 | |
Tax reclaim receivable | | | 7,284 | |
Prepaid expenses and other assets | | | 14,568 | |
| | | | |
Total Assets | | | 728,530,643 | |
| | | | |
| |
Liabilities | | | | |
| |
Payable to broker for collateral for securities on loan | | | 26,979,667 | |
Payable for investments purchased | | | 11,020,845 | |
Payable for Fund shares purchased | | | 3,160,474 | |
Management fee payable | | | 539,366 | |
Accrued expenses and other liabilities | | | 457,665 | |
Distribution fee payable | | | 9,453 | |
Affiliated transfer agent fee payable | | | 6,167 | |
Directors’ fees payable | | | 1,527 | |
| | | | |
Total Liabilities | | | 42,175,164 | |
| | | | |
| |
Net Assets | | $ | 686,355,479 | |
| | | | |
| |
| | | | | |
| |
Net assets were comprised of: | | | | |
Common stock, at par | | $ | 543 | |
Paid-in capital in excess of par | | | 1,227,622,254 | |
Total distributable earnings (loss) | | | (541,267,318 | ) |
| | | | |
Net assets, October 31, 2022 | | $ | 686,355,479 | |
| | | | |
See Notes to Financial Statements.
PGIM Jennison Emerging Markets Equity Opportunities Fund 17
Statement of Assets and Liabilities
as of October 31, 2022
| | | | | | | | |
| | |
Class A | | | | | | | | |
| | |
Net asset value and redemption price per share, | | | | | | | | |
($28,081,841 ÷ 2,265,908 shares of common stock issued and outstanding) | | $ | 12.39 | | | | | |
Maximum sales charge (5.50% of offering price) | | | 0.72 | | | | | |
| | | | | | | | |
Maximum offering price to public | | $ | 13.11 | | | | | |
| | | | | | | | |
| | |
Class C | | | | | | | | |
| | |
Net asset value, offering price and redemption price per share, | | | | | | | | |
($3,724,000 ÷ 319,294 shares of common stock issued and outstanding) | | $ | 11.66 | | | | | |
| | | | | | | | |
| | |
Class Z | | | | | | | | |
| | |
Net asset value, offering price and redemption price per share, | | | | | | | | |
($393,985,077 ÷ 31,164,350 shares of common stock issued and outstanding) | | $ | 12.64 | | | | | |
| | | | | | | | |
| | |
Class R6 | | | | | | | | |
| | |
Net asset value, offering price and redemption price per share, | | | | | | | | |
($260,564,561 ÷ 20,588,151 shares of common stock issued and outstanding) | | $ | 12.66 | | | | | |
| | | | | | | | |
See Notes to Financial Statements.
Statement of Operations
Year Ended October 31, 2022
| | | | |
Net Investment Income (Loss) | | | | |
| |
Income | | | | |
Unaffiliated dividend income (net of $584,136 foreign withholding tax) | | $ | 4,512,160 | |
Income from securities lending, net (including affiliated income of $141,288) | | | 536,286 | |
Affiliated dividend income | | | 17,259 | |
| | | | |
Total income | | | 5,065,705 | |
| | | | |
| |
Expenses | | | | |
Management fee | | | 8,477,342 | |
Distribution fee(a) | | | 157,429 | |
Transfer agent’s fees and expenses (including affiliated expense of $32,273)(a) | | | 911,821 | |
Custodian and accounting fees | | | 317,443 | |
Shareholders’ reports | | | 197,678 | |
Registration fees(a) | | | 195,190 | |
SEC registration fees | | | 42,934 | |
Audit fee | | | 29,500 | |
Legal fees and expenses | | | 26,023 | |
Directors’ fees | | | 21,118 | |
Miscellaneous | | | 75,714 | |
| | | | |
Total expenses | | | 10,452,192 | |
Less: Fee waiver and/or expense reimbursement(a) | | | (1,136,617 | ) |
Distribution fee waiver(a) | | | (18,008 | ) |
| | | | |
Net expenses | | | 9,297,567 | |
| | | | |
Net investment income (loss) | | | (4,231,862 | ) |
| | | | |
| |
Realized And Unrealized Gain (Loss) On Investment And Foreign Currency Transactions | | | | |
| |
Net realized gain (loss) on: | | | | |
Investment transactions (including affiliated of $(11,052)) (net of foreign capital gains taxes $(24,874)) | | | (474,834,693 | ) |
Foreign currency transactions | | | (793,740 | ) |
| | | | |
| | | (475,628,433 | ) |
| | | | |
Net change in unrealized appreciation (depreciation) on: | | | | |
Investments (including affiliated of $5,081) (net of change in foreign capital gains taxes $2,364,195) | | | (120,350,802 | ) |
Foreign currencies | | | 10,959 | |
| | | | |
| | | (120,339,843 | ) |
| | | | |
Net gain (loss) on investment and foreign currency transactions | | | (595,968,276 | ) |
| | | | |
Net Increase (Decrease) In Net Assets Resulting From Operations | | $ | (600,200,138 | ) |
| | | | |
| (a) | Class specific expenses and waivers were as follows: |
| | | | | | | | | | | | | | | | |
| | | Class A | | | Class C | | | Class Z | | | Class R6 | |
| | | | |
Distribution fee | | | 108,050 | | | | 49,379 | | | | — | | | | — | |
Transfer agent’s fees and expenses | | | 54,315 | | | | 11,849 | | | | 837,006 | | | | 8,651 | |
Registration fees | | | 22,774 | | | | 20,840 | | | | 94,136 | | | | 57,440 | |
Fee waiver and/or expense reimbursement | | | (69,510 | ) | | | (31,702 | ) | | | (816,353 | ) | | | (219,052 | ) |
Distribution fee waiver | | | (18,008 | ) | | | — | | | | — | | | | — | |
See Notes to Financial Statements.
PGIM Jennison Emerging Markets Equity Opportunities Fund 19
Statements of Changes in Net Assets
| | | | | | | | |
| |
| | | Year Ended October 31, | |
| | | | |
| | |
| | | 2022 | | | 2021 | |
| | |
Increase (Decrease) in Net Assets | | | | | | | | |
| | |
Operations | | | | | | | | |
Net investment income (loss) | | $ | (4,231,862 | ) | | $ | (3,176,039 | ) |
Net realized gain (loss) on investment and foreign currency transactions | | | (475,628,433 | ) | | | (32,023,510 | ) |
Net change in unrealized appreciation (depreciation) on investments and foreign currencies | | | (120,339,843 | ) | | | 71,372,687 | |
| | | | | | | | |
Net increase (decrease) in net assets resulting from operations | | | (600,200,138 | ) | | | 36,173,138 | |
| | | | | | | | |
| | |
Fund share transactions (Net of share conversions) | | | | | | | | |
Net proceeds from shares sold | | | 920,955,434 | | | | 1,123,848,738 | |
Cost of shares purchased | | | (644,755,797 | ) | | | (210,706,003 | ) |
| | | | | | | | |
Net increase (decrease) in net assets from Fund share transactions | | | 276,199,637 | | | | 913,142,735 | |
| | | | | | | | |
Total increase (decrease) | | | (324,000,501 | ) | | | 949,315,873 | |
| | |
Net Assets: | | | | | | | | |
| | |
Beginning of year | | | 1,010,355,980 | | | | 61,040,107 | |
| | | | | | | | |
End of year | | $ | 686,355,479 | | | $ | 1,010,355,980 | |
| | | | | | | | |
See Notes to Financial Statements.
Financial Highlights
| | | | | | | | | | | | | | | | | | | | |
| |
Class A Shares | |
| | | Year Ended October 31, | |
| | | | | | |
| | | 2022 | | | 2021 | | | 2020 | | | 2019 | | | 2018 | |
| | | | | | |
Per Share Operating Performance(a): | | | | | | | | | | | | | | | | | | | | |
| | | | | | |
Net Asset Value, Beginning of Year | | | $23.66 | | | | $17.66 | | | | $12.16 | | | | $9.58 | | | | $11.19 | |
| | | | | | |
Income (loss) from investment operations: | | | | | | | | | | | | | | | | | | | | |
| | | | | | |
Net investment income (loss) | | | (0.12 | ) | | | (0.23 | ) | | | (0.14 | ) | | | (0.04 | ) | | | (0.04 | ) |
| | | | | | |
Net realized and unrealized gain (loss) on investment and foreign currency transactions | | | (11.15 | ) | | | 6.23 | | | | 5.64 | | | | 2.62 | | | | (1.57 | ) |
| | | | | | |
Total from investment operations | | | (11.27 | ) | | | 6.00 | | | | 5.50 | | | | 2.58 | | | | (1.61 | ) |
| | | | | | |
Net asset value, end of year | | | $12.39 | | | | $23.66 | | | | $17.66 | | | | $12.16 | | | | $9.58 | |
Total Return(b) : | | | (47.63 | )% | | | 33.98 | % | | | 45.23 | % | | | 26.93 | % | | | (14.39 | )% |
| | | | | | | | | | | | | | | | | |
| | | | | | |
Ratios/Supplemental Data: | | | | | | | | | | | | | | | | | | | | |
| | | | | | |
Net assets, end of year (000) | | | $28,082 | | | | $47,683 | | | | $6,144 | | | | $3,806 | | | | $2,316 | |
| | | | | | |
Average net assets (000) | | | $36,017 | | | | $26,309 | | | | $4,507 | | | | $3,074 | | | | $2,956 | |
| | | | | | |
Ratios to average net assets(c) : | | | | | | | | | | | | | | | | | | | | |
| | | | | | |
Expenses after waivers and/or expense reimbursement | | | 1.30 | % | | | 1.33 | % | | | 1.45 | % | | | 1.45 | % | | | 1.45 | % |
| | | | | | |
Expenses before waivers and/or expense reimbursement | | | 1.54 | % | | | 1.64 | % | | | 2.61 | % | | | 3.35 | % | | | 3.27 | % |
| | | | | | |
Net investment income (loss) | | | (0.74 | )% | | | (0.98 | )% | | | (0.99 | )% | | | (0.37 | )% | | | (0.35 | )% |
Portfolio turnover rate(d) | | | 134 | % | | | 78 | % | | | 58 | % | | | 33 | % | | | 23 | % |
| (a) | Calculated based on average shares outstanding during the year. |
| (b) | Total return does not consider the effects of sales loads. Total return is calculated assuming a purchase of a share on the first day and a sale on the last day of each year reported and includes reinvestment of dividends and distributions, if any. Total returns may reflect adjustments to conform to GAAP. |
| (c) | Does not include expenses of the underlying funds in which the Fund invests. |
| (d) | The Fund’s portfolio turnover rate is calculated in accordance with regulatory requirements, without regard to transactions involving short-term investments, certain derivatives and in-kind transactions (if any). If such transactions were included, the Fund’s portfolio turnover rate may be higher. |
See Notes to Financial Statements.
PGIM Jennison Emerging Markets Equity Opportunities Fund 21
Financial Highlights (continued)
| | | | | | | | | | | | | | | | | | | | |
| |
Class C Shares | |
| | | Year Ended October 31, | |
| | | | | | |
| | | 2022 | | | 2021 | | | 2020 | | | 2019 | | | 2018 | |
| | | | | | |
Per Share Operating Performance(a): | | | | | | | | | | | | | | | | | | | | |
| | | | | | |
Net Asset Value, Beginning of Year | | | $22.43 | | | | $16.88 | | | | $11.71 | | | | $9.29 | | | | $10.93 | |
| | | | | | |
Income (loss) from investment operations: | | | | | | | | | | | | | | | | | | | | |
| | | | | | |
Net investment income (loss) | | | (0.23 | ) | | | (0.39 | ) | | | (0.23 | ) | | | (0.11 | ) | | | (0.13 | ) |
| | | | | | |
Net realized and unrealized gain (loss) on investment and foreign currency transactions | | | (10.54 | ) | | | 5.94 | | | | 5.40 | | | | 2.53 | | | | (1.51 | ) |
| | | | | | |
Total from investment operations | | | (10.77 | ) | | | 5.55 | | | | 5.17 | | | | 2.42 | | | | (1.64 | ) |
| | | | | | |
Net asset value, end of year | | | $11.66 | | | | $22.43 | | | | $16.88 | | | | $11.71 | | | | $9.29 | |
Total Return(b): | | | (48.02 | )% | | | 32.96 | % | | | 44.06 | % | | | 26.05 | % | | | (15.00 | )% |
| | | | | | | | | | | | | | | | | |
| | | | | | |
Ratios/Supplemental Data: | | | | | | | | | | | | | | | | | | | | |
| | | | | | |
Net assets, end of year (000) | | | $3,724 | | | | $5,881 | | | | $1,563 | | | | $1,107 | | | | $1,363 | |
| | | | | | |
Average net assets (000) | | | $4,938 | | | | $4,077 | | | | $1,244 | | | | $1,438 | | | | $1,775 | |
| | | | | | |
Ratios to average net assets(c): | | | | | | | | | | | | | | | | | | | | |
| | | | | | |
Expenses after waivers and/or expense reimbursement | | | 2.05 | % | | | 2.09 | % | | | 2.20 | % | | | 2.20 | % | | | 2.20 | % |
| | | | | | |
Expenses before waivers and/or expense reimbursement | | | 2.69 | % | | | 2.65 | % | | | 4.15 | % | | | 4.23 | % | | | 4.20 | % |
| | | | | | |
Net investment income (loss) | | | (1.48 | )% | | | (1.76 | )% | | | (1.73 | )% | | | (1.05 | )% | | | (1.14 | )% |
Portfolio turnover rate(d) | | | 134 | % | | | 78 | % | | | 58 | % | | | 33 | % | | | 23 | % |
| (a) | Calculated based on average shares outstanding during the year. |
| (b) | Total return does not consider the effects of sales loads. Total return is calculated assuming a purchase of a share on the first day and a sale on the last day of each year reported and includes reinvestment of dividends and distributions, if any. Total returns may reflect adjustments to conform to GAAP. |
| (c) | Does not include expenses of the underlying funds in which the Fund invests. |
| (d) | The Fund’s portfolio turnover rate is calculated in accordance with regulatory requirements, without regard to transactions involving short-term investments, certain derivatives and in-kind transactions (if any). If such transactions were included, the Fund’s portfolio turnover rate may be higher. |
See Notes to Financial Statements.
| | | | | | | | | | | | | | | | | | | | |
| |
Class Z Shares | |
| | | Year Ended October 31, | |
| | | | | | |
| | | 2022 | | | 2021 | | | 2020 | | | 2019 | | | 2018 | |
| | | | | | |
Per Share Operating Performance(a): | | | | | | | | | | | | | | | | | | | | |
| | | | | | |
Net Asset Value, Beginning of Year | | | $24.07 | | | | $17.93 | | | | $12.31 | | | | $9.67 | | | | $11.27 | |
| | | | | | |
Income (loss) from investment operations: | | | | | | | | | | | | | | | | | | | | |
| | | | | | |
Net investment income (loss) | | | (0.08 | ) | | | (0.17 | ) | | | (0.13 | ) | | | (0.01 | ) | | | (0.01 | ) |
| | | | | | |
Net realized and unrealized gain (loss) on investment and foreign currency transactions | | | (11.35 | ) | | | 6.31 | | | | 5.75 | | | | 2.65 | | | | (1.59 | ) |
| | | | | | |
Total from investment operations | | | (11.43 | ) | | | 6.14 | | | | 5.62 | | | | 2.64 | | | | (1.60 | ) |
| | | | | | |
Net asset value, end of year | | | $12.64 | | | | $24.07 | | | | $17.93 | | | | $12.31 | | | | $9.67 | |
Total Return(b): | | | (47.49 | )% | | | 34.24 | % | | | 45.65 | % | | | 27.30 | % | | | (14.20 | )% |
| | | | | | | | | | | | | | | | | |
| | | | | | |
Ratios/Supplemental Data: | | | | | | | | | | | | | | | | | | | | |
| | | | | | |
Net assets, end of year (000) | | | $393,985 | | | | $642,316 | | | | $34,993 | | | | $2,357 | | | | $1,215 | |
| | | | | | |
Average net assets (000) | | | $549,186 | | | | $293,229 | | | | $11,195 | | | | $1,866 | | | | $1,443 | |
| | | | | | |
Ratios to average net assets(c): | | | | | | | | | | | | | | | | | | | | |
| | | | | | |
Expenses after waivers and/or expense reimbursement | | | 1.05 | % | | | 1.08 | % | | | 1.20 | % | | | 1.20 | % | | | 1.20 | % |
| | | | | | |
Expenses before waivers and/or expense reimbursement | | | 1.20 | % | | | 1.28 | % | | | 1.93 | % | | | 3.17 | % | | | 3.56 | % |
| | | | | | |
Net investment income (loss) | | | (0.49 | )% | | | (0.72 | )% | | | (0.83 | )% | | | (0.08 | )% | | | (0.13 | )% |
Portfolio turnover rate(d) | | | 134 | % | | | 78 | % | | | 58 | % | | | 33 | % | | | 23 | % |
| (a) | Calculated based on average shares outstanding during the year. |
| (b) | Total return is calculated assuming a purchase of a share on the first day and a sale on the last day of each year reported and includes reinvestment of dividends and distributions, if any. Total returns may reflect adjustments to conform to GAAP. |
| (c) | Does not include expenses of the underlying funds in which the Fund invests. |
| (d) | The Fund’s portfolio turnover rate is calculated in accordance with regulatory requirements, without regard to transactions involving short-term investments, certain derivatives and in-kind transactions (if any). If such transactions were included, the Fund’s portfolio turnover rate may be higher. |
See Notes to Financial Statements.
PGIM Jennison Emerging Markets Equity Opportunities Fund 23
Financial Highlights (continued)
| | | | | | | | | | | | | | | | | | | | |
| |
Class R6 Shares | |
| | | Year Ended October 31, | |
| | | | | | |
| | | 2022 | | | 2021 | | | 2020 | | | 2019 | | | 2018 | |
| | | | | | |
Per Share Operating Performance(a): | | | | | | | | | | | | | | | | | | | | |
| | | | | | |
Net Asset Value, Beginning of Year | | | $24.08 | | | | $17.93 | | | | $12.31 | | | | $9.67 | | | | $11.27 | |
| | | | | | |
Income (loss) from investment operations: | | | | | | | | | | | | | | | | | | | | |
| | | | | | |
Net investment income (loss) | | | (0.07 | ) | | | (0.15 | ) | | | (0.10 | ) | | | (0.01 | ) | | | (0.02 | ) |
| | | | | | |
Net realized and unrealized gain (loss) on investment and foreign currency transactions | | | (11.35 | ) | | | 6.30 | | | | 5.72 | | | | 2.65 | | | | (1.58 | ) |
| | | | | | |
Total from investment operations | | | (11.42 | ) | | | 6.15 | | | | 5.62 | | | | 2.64 | | | | (1.60 | ) |
| | | | | | |
Net asset value, end of year | | | $12.66 | | | | $24.08 | | | | $17.93 | | | | $12.31 | | | | $9.67 | |
Total Return(b): | | | (47.43 | )% | | | 34.30 | % | | | 45.65 | % | | | 27.30 | % | | | (14.20 | )% |
| | | | | | | | | | | | | | | | | |
| | | | | | |
Ratios/Supplemental Data: | | | | | | | | | | | | | | | | | | | | |
| | | | | | |
Net assets, end of year (000) | | | $260,565 | | | | $314,476 | | | | $18,340 | | | | $12,319 | | | | $9,675 | |
| | | | | | |
Average net assets (000) | | | $302,211 | | | | $121,398 | | | | $14,144 | | | | $11,249 | | | | $11,852 | |
| | | | | | |
Ratios to average net assets(c): | | | | | | | | | | | | | | | | | | | | |
| | | | | | |
Expenses after waivers and/or expense reimbursement | | | 0.98 | % | | | 1.01 | % | | | 1.20 | % | | | 1.20 | % | | | 1.20 | % |
| | | | | | |
Expenses before waivers and/or expense reimbursement | | | 1.05 | % | | | 1.16 | % | | | 1.80 | % | | | 2.41 | % | | | 2.32 | % |
| | | | | | |
Net investment income (loss) | | | (0.40 | )% | | | (0.62 | )% | | | (0.74 | )% | | | (0.11 | )% | | | (0.17 | )% |
Portfolio turnover rate(d) | | | 134 | % | | | 78 | % | | | 58 | % | | | 33 | % | | | 23 | % |
| (a) | Calculated based on average shares outstanding during the year. |
| (b) | Total return is calculated assuming a purchase of a share on the first day and a sale on the last day of each year reported and includes reinvestment of dividends and distributions, if any. Total returns may reflect adjustments to conform to GAAP. |
| (c) | Does not include expenses of the underlying funds in which the Fund invests. |
| (d) | The Fund’s portfolio turnover rate is calculated in accordance with regulatory requirements, without regard to transactions involving short-term investments, certain derivatives and in-kind transactions (if any). If such transactions were included, the Fund’s portfolio turnover rate may be higher. |
See Notes to Financial Statements.
Notes to Financial Statements
Prudential World Fund, Inc. (the “Registered Investment Company” or “RIC”) is registered under the Investment Company Act of 1940, as amended (“1940 Act”), as an open-end management investment company. The RIC is organized as a Maryland Corporation. These financial statements relate only to the PGIM Jennison Emerging Markets Equity Opportunities Fund (the “Fund”), a series of the RIC. The Fund is classified as a diversified fund for purposes of the 1940 Act.
The investment objective of the Fund is to seek long-term growth of capital.
The Fund follows the investment company accounting and reporting guidance of the Financial Accounting Standards Board (“FASB”) Accounting Standard Codification (“ASC”) Topic 946 Financial Services — Investment Companies. The following is a summary of significant accounting policies followed by the Fund in the preparation of its financial statements. The policies conform to U.S. generally accepted accounting principles (“GAAP”). The Fund consistently follows such policies in the preparation of its financial statements.
Securities Valuation: The Fund holds securities and other assets and liabilities that are fair valued as of the close of each day (generally, 4:00 PM Eastern time) the New York Stock Exchange (“NYSE”) is open for trading. As described in further detail below, the Fund’s investments are valued daily based on a number of factors, including the type of investment and whether market quotations are readily available. The RIC’s Board of Directors (the “Board”) has approved the Fund’s valuation policies and procedures for security valuation and designated to PGIM Investments LLC (“PGIM Investments” or the “Manager”) as the Valuation Designee pursuant to SEC Rule 2a-5(b) to perform the fair value determination relating to all Fund investments. Pursuant to the Board’s oversight, the Valuation Designee has established a Valuation Committee to perform the duties and responsibilities as valuation designee under SEC Rule 2a-5. The valuation procedures permit the Fund to utilize independent pricing vendor services, quotations from market makers, and alternative valuation methods when market quotations are either not readily available or not deemed representative of fair value. Fair value is the price that would be received to sell an asset or paid to transfer a liability in an orderly transaction between market participants on the measurement date. A record of the Valuation Committee’s actions is provided to the Board at the first quarterly meeting following the quarter in which such actions take place.
For the fiscal reporting year-end, securities and other assets and liabilities were fair valued at the close of the last U.S. business day. Trading in certain foreign securities may occur when the NYSE is closed (including weekends and holidays). Because such foreign securities
PGIM Jennison Emerging Markets Equity Opportunities Fund 25
Notes to Financial Statements (continued)
trade in markets that are open on weekends and U.S. holidays, the values of some of the Fund’s foreign investments may change on days when investors cannot purchase or redeem Fund shares.
Various inputs determine how the Fund’s investments are valued, all of which are categorized according to the three broad levels (Level 1, 2, or 3) detailed in the Schedule of Investments and referred to herein as the “fair value hierarchy” in accordance with FASB ASC Topic 820 - Fair Value Measurement.
Common or preferred stocks, exchange-traded funds and derivative instruments, if applicable, that are traded on a national securities exchange are valued at the last sale price as of the close of trading on the applicable exchange where the security principally trades. Securities traded via NASDAQ are valued at the NASDAQ official closing price. To the extent these securities are valued at the last sale price or NASDAQ official closing price, they are classified as Level 1 in the fair value hierarchy. In the event that no sale or official closing price on valuation date exists, these securities are generally valued at the mean between the last reported bid and ask prices, or at the last bid price in the absence of an ask price. These securities are classified as Level 2 in the fair value hierarchy.
Foreign equities traded on foreign securities exchanges are generally valued using pricing vendor services that provide model prices derived using adjustment factors based on information such as local closing price, relevant general and sector indices, currency fluctuations, depositary receipts, and futures, as applicable. Securities valued using such model prices are classified as Level 2 in the fair value hierarchy. The models generate an evaluated adjustment factor for each security, which is applied to the local closing price to adjust it for post closing market movements up to the time the Fund is valued. Utilizing that evaluated adjustment factor, the vendor provides an evaluated price for each security. If the vendor does not provide an evaluated price, securities are valued in accordance with exchange-traded common and preferred stock valuation policies discussed above.
Investments in open-end funds (other than exchange-traded funds) are valued at their net asset values as of the close of the NYSE on the date of valuation. These securities are classified as Level 1 in the fair value hierarchy since they may be purchased or sold at their net asset values on the date of valuation.
Securities and other assets that cannot be priced according to the methods described above are valued based on policies and procedures approved by the Board. In the event that unobservable inputs are used when determining such valuations, the securities will be classified as Level 3 in the fair value hierarchy. Altering one or more unobservable inputs may result in a significant change to a Level 3 security’s fair value measurement.
When determining the fair value of securities, some of the factors influencing the valuation include: the nature of any restrictions on disposition of the securities; assessment of the general liquidity of the securities; the issuer’s financial condition and the markets in which it does business; the cost of the investment; the size of the holding and the capitalization of the issuer; the prices of any recent transactions or bids/offers for such securities or any comparable securities; any available analyst media or other reports or information deemed reliable by the Valuation Designee regarding the issuer or the markets or industry in which it operates. Using fair value to price securities may result in a value that is different from a security’s most recent closing price and from the price used by other unaffiliated mutual funds to calculate their net asset values.
Foreign Currency Translation: The books and records of the Fund are maintained in U.S. dollars. Foreign currency amounts are translated into U.S. dollars on the following basis:
(i) market value of investment securities, other assets and liabilities — at the exchange rate as of the valuation date;
(ii) purchases and sales of investment securities, income and expenses — at the rates of exchange prevailing on the respective dates of such transactions.
Although the net assets of the Fund are presented at the foreign exchange rates and market values at the close of the period, the Fund does not generally isolate that portion of the results of operations arising as a result of changes in the foreign exchange rates from the fluctuations arising from changes in the market prices of long-term portfolio securities held at the end of the period. Similarly, the Fund does not isolate the effect of changes in foreign exchange rates from the fluctuations arising from changes in the market prices of long-term portfolio securities sold during the period. Accordingly, holding period unrealized and realized foreign currency gains (losses) are included in the reported net change in unrealized appreciation (depreciation) on investments and net realized gains (losses) on investment transactions on the Statements of Operations.
Net realized gains (losses) on foreign currency transactions represent net foreign exchange gains (losses) from the disposition of holdings of foreign currencies, currency gains (losses) realized between the trade and settlement dates on investment transactions, and the difference between the amounts of interest, dividends and foreign withholding taxes recorded on the Fund’s books and the U.S. dollar equivalent amounts actually received or paid. Net unrealized currency gains (losses) arise from valuing foreign currency denominated assets and liabilities (other than investments) at period end exchange rates.
Master Netting Arrangements: The RIC, on behalf of the Fund, is subject to various Master Agreements, or netting arrangements, with select counterparties. These are agreements which a subadviser may have negotiated and entered into on behalf of all or a portion of the Fund. A master netting arrangement between the Fund and the counterparty permits the Fund to offset amounts payable by the Fund to the same counterparty against amounts to be received; and by the receipt of collateral from the counterparty by the Fund to cover the
PGIM Jennison Emerging Markets Equity Opportunities Fund 27
Notes to Financial Statements (continued)
Fund’s exposure to the counterparty. However, there is no assurance that such mitigating factors are easily enforceable. In addition to master netting arrangements, the right to set-off exists when all the conditions are met such that each of the parties owes the other determinable amounts, the reporting party has the right to set-off the amount owed with the amount owed by the other party, the reporting party intends to set-off and the right of set-off is enforceable by law.
Securities Lending: The Fund lends its portfolio securities to banks and broker-dealers. The loans are secured by collateral at least equal to the market value of the securities loaned. Collateral pledged by each borrower is invested in an affiliated money market fund and is marked to market daily, based on the previous day’s market value, such that the value of the collateral exceeds the value of the loaned securities. In the event of significant appreciation in value of securities on loan on the last business day of the reporting period, the financial statements may reflect a collateral value that is less than the market value of the loaned securities. Such shortfall is remedied as described above. Loans are subject to termination at the option of the borrower or the Fund. Upon termination of the loan, the borrower will return to the Fund securities identical to the loaned securities. The remaining open loans of the securities lending transactions are considered overnight and continuous. Should the borrower of the securities fail financially, the Fund has the right to repurchase the securities in the open market using the collateral.
The Fund recognizes income, net of any rebate and securities lending agent fees, for lending its securities in the form of fees or interest on the investment of any cash received as collateral. The borrower receives all interest and dividends from the securities loaned and such payments are passed back to the lender in amounts equivalent thereto, which are reflected in interest income or unaffiliated dividend income based on the nature of the payment on the Statement of Operations. The Fund also continues to recognize any unrealized gain (loss) in the market price of the securities loaned and on the change in the value of the collateral invested that may occur during the term of the loan. In addition, realized gain (loss) is recognized on changes in the value of the collateral invested upon liquidation of the collateral. Net earnings from securities lending are disclosed in the Statement of Operations.
Securities Transactions and Net Investment Income: Securities transactions are recorded on the trade date. Realized gains (losses) from investment and currency transactions are calculated on the specific identification method. Dividend income is recorded on the ex-date, or for certain foreign securities, when the Fund becomes aware of such dividends. Expenses are recorded on an accrual basis, which may require the use of certain estimates by management that may differ from actual. Net investment income or loss (other than class specific expenses and waivers, which are allocated as noted below) and unrealized and realized gains (losses) are allocated daily to each class of shares based upon the relative
proportion of adjusted net assets of each class at the beginning of the day. Class specific expenses and waivers, where applicable, are charged to the respective share classes. Such class specific expenses and waivers include distribution fees and distribution fee waivers, shareholder servicing fees, transfer agent’s fees and expenses, registration fees and fee waivers and/or expense reimbursements, as applicable.
Taxes: It is the Fund’s policy to continue to meet the requirements of the Internal Revenue Code applicable to regulated investment companies and to distribute all of its taxable net investment income and capital gains, if any, to its shareholders. Therefore, no federal income tax provision is required. Withholding taxes on foreign dividends, interest and capital gains, if any, are recorded, net of reclaimable amounts, at the time the related income is earned.
The Fund is subject to foreign income taxes imposed by certain countries in which it invests. Additionally, capital gains realized upon disposition of securities issued in or by certain foreign countries are subject to capital gains tax imposed by those countries. All taxes are computed in accordance with the applicable foreign tax law, and, to the extent permitted, capital losses are used to offset capital gains. Taxes attributable to income are accrued by the Fund as a reduction of income. Current and deferred tax expense attributable to capital gains is reflected as a component of realized or change in unrealized gain/loss on securities in the accompanying financial statements. To the extent that the Fund has country specific capital loss carryforwards, such carryforwards are applied against net unrealized gains when determining the deferred tax liability. Any deferred tax liability incurred by the Fund is included in either Other liabilities or Deferred tax liability on the accompanying Statement of Assets and Liabilities.
Dividends and Distributions: Dividends and distributions to shareholders, which are determined in accordance with federal income tax regulations and which may differ from GAAP, are recorded on the ex-date. Permanent book/tax differences relating to income and gain (loss) are reclassified between total distributable earnings (loss) and paid-in capital in excess of par, as appropriate. The chart below sets forth the expected frequency of dividend and capital gains distributions to shareholders. Various factors may impact the frequency of dividend distributions to shareholders, including but not limited to adverse market conditions or portfolio holding-specific events.
| | |
Expected Distribution Schedule to Shareholders* | | Frequency |
Net Investment Income | | Annually |
Short-Term Capital Gains | | Annually |
Long-Term Capital Gains | | Annually |
| * | Under certain circumstances, the Fund may make more than one distribution of short-term and/or long-term capital gains during a fiscal year. |
Estimates: The preparation of financial statements requires management to make estimates and assumptions that affect the reported amounts and disclosures in the financial statements. Actual results could differ from those estimates.
PGIM Jennison Emerging Markets Equity Opportunities Fund 29
Notes to Financial Statements (continued)
The RIC, on behalf of the Fund, has a management agreement with the Manager pursuant to which it has responsibility for all investment advisory services and supervises the subadviser’s performance of such services, and pursuant to which it renders administrative services.
The Manager has entered into a subadvisory agreement with Jennison Associates LLC (“Jennison” or the “subadviser”). The Manager pays for the services of Jennison.
Fees payable under the management agreement are computed daily and paid monthly. For the reporting period ended October 31, 2022, the contractual and effective management fee rates were as follows:
| | |
Contractual Management Rate | | Effective Management Fee, before any waivers
and/or expense reimbursements |
0.95% of the Fund’s average daily net assets up to and including $5 billion; | | 0.95% |
0.925% of the Fund’s average daily net assets exceeding $5 billion. | | |
The Manager has contractually agreed, through February 29, 2024, to limit total annual operating expenses after fee waivers and/or expense reimbursements. This contractual waiver excludes interest, brokerage, taxes (such as income and foreign withholding taxes, stamp duty and deferred tax expenses), acquired fund fees and expenses, extraordinary expenses, and certain other Fund expenses such as dividend and interest expense and broker charges on short sales.
Where applicable, the Manager agrees to waive management fees or shared operating expenses on any share class to the same extent that it waives such expenses on any other share class. In addition, total annual operating expenses for Class R6 shares will not exceed total annual operating expenses for Class Z shares. Fees and/or expenses waived and/or reimbursed by the Manager for the purpose of preventing the expenses from exceeding a certain expense ratio limit may be recouped by the Manager within the same fiscal year during which such waiver and/or reimbursement is made if such recoupment can be realized without exceeding the expense limit in effect at the time of the recoupment for that fiscal year. The expense limitations attributable to each class are as follows:
| | | | | |
Class | | Expense
Limitations |
A | | 1.30% |
C | | 2.05 |
Z | | 1.05 |
R6 | | 0.98 |
The RIC, on behalf of the Fund, has a distribution agreement with Prudential Investment Management Services LLC (“PIMS”), which acts as the distributor of the Class A, Class C, Class Z and Class R6 shares of the Fund. The Fund compensates PIMS for distributing and servicing the Fund’s Class A and Class C shares, pursuant to the plans of distribution (the “Distribution Plans”), regardless of expenses actually incurred by PIMS.
Pursuant to the Distribution Plans, the Fund compensates PIMS for distribution related activities at an annual rate based on average daily net assets per class. PIMS has contractually agreed through February 29, 2024 to limit such fees on certain classes based on the average daily net assets. The distribution fees are accrued daily and payable monthly.
The Fund’s annual gross and net distribution rate, where applicable, are as follows:
| | | | |
Class | | Gross Distribution Fee | | Net Distribution Fee |
A | | 0.30% | | 0.25% |
C | | 1.00 | | 1.00 |
Z | | N/A | | N/A |
R6 | | N/A | | N/A |
For the year ended October 31, 2022, PIMS received front-end sales charges (“FESL”) resulting from sales of certain class shares and contingent deferred sales charges (“CDSC”) imposed upon redemptions by certain shareholders. From these fees, PIMS paid such sales charges to broker-dealers, who in turn paid commissions to salespersons and incurred other distribution costs. The sales charges are as follows where applicable:
| | | | |
Class | | FESL | | CDSC |
A | | $182,899 | | $ 658 |
C | | — | | 2,999 |
PGIM Investments, PIMS and Jennison are indirect, wholly-owned subsidiaries of Prudential Financial, Inc. (“Prudential”).
| 4. | Other Transactions with Affiliates |
Prudential Mutual Fund Services LLC (“PMFS”), an affiliate of PGIM Investments and an indirect, wholly-owned subsidiary of Prudential, serves as the Fund’s transfer agent and shareholder servicing agent. Transfer agent’s fees and expenses in the Statement of Operations include certain out-of-pocket expenses paid to non-affiliates, where applicable.
The Fund may invest its overnight sweep cash in the PGIM Core Ultra Short Bond Fund (the “Core Fund”), and its securities lending cash collateral in the PGIM Institutional Money Market Fund (the “Money Market Fund”), each a fund of Prudential Investment Portfolios 2, registered under the 1940 Act and managed by PGIM Investments. PGIM Investments and/or its affiliates are paid fees or reimbursed for providing their services. In addition to the realized and unrealized gains on investments in the Core Fund and Money Market Fund, earnings from such investments are disclosed on the Statement of Operations as “Affiliated dividend income” and “Income from securities lending, net”, respectively. Effective January
PGIM Jennison Emerging Markets Equity Opportunities Fund 31
Notes to Financial Statements (continued)
2022, the Fund changed its overnight cash sweep vehicle from the Core Fund to an unaffiliated money market fund.
The Fund may enter into certain securities purchase or sale transactions under Board approved Rule 17a-7 procedures. Rule 17a-7 is an exemptive rule under the 1940 Act, that subject to certain conditions, permits purchase and sale transactions among affiliated investment companies, or between an investment company and a person that is affiliated solely by reason of having a common (or affiliated) investment adviser, common directors/trustees, and/or common officers. For the year ended October 31, 2022, no 17a-7 transactions were entered into by the Fund.
5. Portfolio Securities
The aggregate cost of purchases and proceeds from sales of portfolio securities (excluding short-term investments and U.S. Government securities) for the reporting period ended October 31, 2022, were as follows:
| | |
| Cost of Purchases | | Proceeds from Sales |
$1,402,929,278 | | $1,130,693,336 |
A summary of the cost of purchases and proceeds from sales of shares of affiliated mutual funds for the year ended October 31, 2022, is presented as follows:
| | | | | | | | | | | | | | | | | | | | | | | | | | |
Value,
Beginning
of Year | | Cost of
Purchases | | | Proceeds
from Sales | | | Change in
Unrealized
Gain
(Loss) | | | Realized
Gain
(Loss) | | | Value, End
of Year | | | Shares,
End of
Year | | | Income |
| | | | | |
Short-Term Investments - Affiliated Mutual Funds: | | | | | | | | | | | | | | | | | | | |
| | | | | |
PGIM Core Ultra Short Bond Fund(1)(wa) | | | | | | | | | | | | | | | | | | | |
| $68,436,389 | | $ | 155,625,453 | | | $ | 224,061,842 | | | $ | — | | | $ | — | | | $ | — | | | | — | | | $ 17,259 |
| | | | | |
PGIM Institutional Money Market Fund(1)(b)(wa) | | | | | | | | | | | | | | | | | | | |
| 6,077,913 | | | 967,698,903 | | | | 946,648,564 | | | | 5,081 | | | | (11,052 | ) | | | 27,122,281 | | | | 27,146,713 | | | 141,288(2) |
| $74,514,302 | | $ | 1,123,324,356 | | | $ | 1,170,710,406 | | | $ | 5,081 | | | $ | (11,052 | ) | | $ | 27,122,281 | | | | | | | $158,547 |
| (1) | The Fund did not have any capital gain distributions during the reporting period. |
| (2) | The amount, or a portion thereof, represents the affiliated securities lending income shown on the Statement of Operations. |
| (b) | Represents security, or portion thereof, purchased with cash collateral received for securities on loan and includes dividend reinvestment. |
| (wa) | PGIM Investments LLC, the manager of the Fund, also serves as manager of the PGIM Core Ultra Short Bond Fund and PGIM Institutional Money Market Fund, if applicable. |
6. Distributions and Tax Information
Distributions to shareholders, which are determined in accordance with federal income tax regulations and which may differ from GAAP, are recorded on the ex-date. In order to present total distributable earnings (loss) and paid-in capital in excess of par on the Statement of Assets and Liabilities that more closely represent their tax character, certain adjustments have been made to total distributable earnings (loss) and paid-in capital in excess of par. For the tax year ended October 31, 2022, the adjustments were to increase total distributable earnings (loss) and decrease paid-in capital in excess of par by $5,250,953 due to a net operating loss. Net investment income, net realized gain (loss) on investments and foreign currency transactions and net assets were not affected by this change.
For the fiscal years ended October 31, 2022, and October 31, 2021, there were no distributions paid by the Fund.
As of October 31, 2022, there were no accumulated undistributed earnings on a tax basis.
The United States federal income tax basis of the Fund’s investments and the net unrealized depreciation as of October 31, 2022 were as follows:
| | | | | | | | | | | | |
| Tax Basis | | Gross
Unrealized
Appreciation | | | Gross
Unrealized
Depreciation | | | Net
Unrealized
Depreciation | |
| $788,234,926 | | | $56,650,667 | | | | $(130,140,437) | | | | $(73,489,770) | |
The differences between GAAP and tax basis were primarily attributable to deferred losses on wash sales and investments in passive foreign investment companies.
For federal income tax purposes, the Fund had a capital loss carryforward as of October 31, 2022 of approximately $465,028,000 which can be carried forward for an unlimited period. No capital gains distributions are expected to be paid to shareholders until net gains have been realized in excess of such losses.
The Fund elected to treat late year ordinary income losses of approximately $2,750,000 as having been incurred in the following fiscal year (October 31, 2023).
The Manager has analyzed the Fund’s tax positions taken on federal, state and local income tax returns for all open tax years and has concluded that no provision for income tax is required in the Fund’s financial statements for the current reporting period. Since tax authorities can examine previously filed tax returns, the Fund’s U.S. federal and state tax returns for each of the four fiscal years up to the most recent fiscal year ended October 31, 2022 are subject to such review.
PGIM Jennison Emerging Markets Equity Opportunities Fund 33
Notes to Financial Statements (continued)
7. Capital and Ownership
The Fund offers Class A, Class C, Class Z and Class R6 shares. Class A shares are sold with a maximum front-end sales charge of 5.50%. Investors who purchase $1 million or more of Class A shares and sell these shares within 12 months of purchase are subject to a CDSC of 1%, although they are not subject to an initial sales charge. The Class A CDSC is waived for certain retirement and/or benefit plans. A special exchange privilege is also available for shareholders who qualified to purchase Class A shares at net asset value. Class C shares are sold with a CDSC of 1% on sales made within 12 months of purchase. Class C shares will automatically convert to Class A shares on a monthly basis approximately eight years (ten years prior to January 22, 2021) after purchase. Class Z and Class R6 shares are not subject to any sales or redemption charges and are available exclusively for sale to a limited group of investors.
Under certain circumstances, an exchange may be made from specified share classes of the Fund to one or more other share classes of the Fund as presented in the table of transactions in shares of common stock, below.
The RIC is authorized to issue 10,225,000,000 shares of common stock, $0.00001 par value per share, 865,000,000 of which are designated as shares of the Fund. The authorized shares of the Fund are currently classified and designated as follows:
| | | | |
| Class | | Number of Shares | |
A | | | 25,000,000 | |
C | | | 65,000,000 | |
Z | | | 300,000,000 | |
T | | | 225,000,000 | |
R6 | | | 250,000,000 | |
The Fund currently does not have any Class T shares outstanding.
As of October 31, 2022, Prudential, through its affiliated entities, including affiliated funds (if applicable), did not own any shares of the Fund.
At the reporting period end, the number of shareholders holding greater than 5% of the Fund are as follows:
| | | | |
| | | Number of Shareholders | | Percentage of Outstanding Shares |
Affiliated | | — | | —% |
Unaffiliated | | 7 | | 87.1 |
Transactions in shares of common stock were as follows:
| | | | | | | | |
| | | |
Share Class | | | Shares | | | | Amount | |
| | |
Class A | | | | | | | | |
Year ended October 31, 2022: | | | | | | | | |
Shares sold | | | 1,055,027 | | | $ | 18,358,156 | |
Shares purchased | | | (743,321 | ) | | | (12,558,145 | ) |
Net increase (decrease) in shares outstanding before conversion | | | 311,706 | | | | 5,800,011 | |
Shares issued upon conversion from other share class(es) | | | 25,109 | | | | 378,868 | |
Shares purchased upon conversion into other share class(es) | | | (86,308 | ) | | | (1,418,730 | ) |
Net increase (decrease) in shares outstanding | | | 250,507 | | | $ | 4,760,149 | |
| | |
Year ended October 31, 2021: | | | | | | | | |
Shares sold | | | 2,255,202 | | | $ | 51,550,059 | |
Shares purchased | | | (580,724 | ) | | | (12,973,518 | ) |
Net increase (decrease) in shares outstanding before conversion | | | 1,674,478 | | | | 38,576,541 | |
Shares issued upon conversion from other share class(es) | | | 4,431 | | | | 112,936 | |
Shares purchased upon conversion into other share class(es) | | | (11,348 | ) | | | (248,795 | ) |
Net increase (decrease) in shares outstanding | | | 1,667,561 | | | $ | 38,440,682 | |
| | |
Class C | | | | | | | | |
Year ended October 31, 2022: | | | | | | | | |
Shares sold | | | 161,915 | | | $ | 2,666,741 | |
Shares purchased | | | (96,511 | ) | | | (1,384,438 | ) |
Net increase (decrease) in shares outstanding before conversion | | | 65,404 | | | | 1,282,303 | |
Shares purchased upon conversion into other share class(es) | | | (8,240 | ) | | | (111,420 | ) |
Net increase (decrease) in shares outstanding | | | 57,164 | | | $ | 1,170,883 | |
| | |
Year ended October 31, 2021: | | | | | | | | |
Shares sold | | | 217,144 | | | $ | 4,807,891 | |
Shares purchased | | | (39,846 | ) | | | (888,017 | ) |
Net increase (decrease) in shares outstanding before conversion | | | 177,298 | | | | 3,919,874 | |
Shares purchased upon conversion into other share class(es) | | | (7,817 | ) | | | (182,875 | ) |
Net increase (decrease) in shares outstanding | | | 169,481 | | | $ | 3,736,999 | |
| | |
Class Z | | | | | | | | |
Year ended October 31, 2022: | | | | | | | | |
Shares sold | | | 34,906,372 | | | $ | 632,098,939 | |
Shares purchased | | | (30,471,330 | ) | | | (506,872,022 | ) |
Net increase (decrease) in shares outstanding before conversion | | | 4,435,042 | | | | 125,226,917 | |
Shares issued upon conversion from other share class(es) | | | 76,249 | | | | 1,312,777 | |
Shares purchased upon conversion into other share class(es) | | | (26,729 | ) | | | (438,625 | ) |
Net increase (decrease) in shares outstanding | | | 4,484,562 | | | $ | 126,101,069 | |
PGIM Jennison Emerging Markets Equity Opportunities Fund 35
Notes to Financial Statements (continued)
| | | | | | | | |
| | | |
Share Class | | | Shares | | | | Amount | |
| | |
Year ended October 31, 2021: | | | | | | | | |
Shares sold | | | 31,445,686 | | | $ | 744,637,683 | |
Shares purchased | | | (6,723,022 | ) | | | (157,898,994 | ) |
Net increase (decrease) in shares outstanding before conversion | | | 24,722,664 | | | | 586,738,689 | |
Shares issued upon conversion from other share class(es) | | | 13,165 | | | | 295,170 | |
Shares purchased upon conversion into other share class(es) | | | (7,805 | ) | | | (191,186 | ) |
Net increase (decrease) in shares outstanding | | | 24,728,024 | | | $ | 586,842,673 | |
| | |
Class R6 | | | | | | | | |
Year ended October 31, 2022: | | | | | | | | |
Shares sold | | | 15,203,394 | | | $ | 267,831,598 | |
Shares purchased | | | (7,690,840 | ) | | | (123,941,192) | |
Net increase (decrease) in shares outstanding before conversion | | | 7,512,554 | | | | 143,890,406 | |
Shares issued upon conversion from other share class(es) | | | 31,732 | | | | 482,578 | |
Shares purchased upon conversion into other share class(es) | | | (13,580 | ) | | | (205,448 | ) |
Net increase (decrease) in shares outstanding | | | 7,530,706 | | | $ | 144,167,536 | |
| | |
Year ended October 31, 2021: | | | | | | | | |
Shares sold | | | 13,708,513 | | | $ | 322,853,105 | |
Shares purchased | | | (1,682,763 | ) | | | (38,945,474 | ) |
Net increase (decrease) in shares outstanding before conversion | | | 12,025,750 | | | | 283,907,631 | |
Shares issued upon conversion from other share class(es) | | | 8,764 | | | | 214,750 | |
Net increase (decrease) in shares outstanding | | | 12,034,514 | | | $ | 284,122,381 | |
The RIC, on behalf of the Fund, along with other affiliated registered investment companies (the “Participating Funds”), is a party to a Syndicated Credit Agreement (“SCA”) with a group of banks. The purpose of the SCA is to provide an alternative source of temporary funding for capital share redemptions. The table below provides details of the SCA.
| | | | |
| | | Current SCA | | Prior SCA |
Term of Commitment | | 9/30/2022 - 9/28/2023 | | 10/1/2021 – 9/29/2022 |
Total Commitment | | $ 1,200,000,000 | | $ 1,200,000,000 |
Annualized Commitment Fee on the Unused Portion of the SCA | | 0.15% | | 0.15% |
Annualized Interest Rate on Borrowings | | 1.00% plus the higher of (1)
the effective federal funds
rate, (2) the daily SOFR
rate plus 0.10% or (3) zero
percent | | 1.20% plus the higher of (1)
the effective federal funds
rate, (2) the one-month
LIBOR rate or (3) zero
percent |
Certain affiliated registered investment companies that are parties to the SCA include portfolios that are subject to a predetermined mathematical formula used to manage certain benefit guarantees offered under variable annuity contracts. The formula may result in large scale asset flows into and out of these portfolios. Consequently, these portfolios may be more likely to utilize the SCA for purposes of funding redemptions. It may be possible for those portfolios to fully exhaust the committed amount of the SCA, thereby requiring the Manager to allocate available funding per a Board-approved methodology designed to treat the Participating Funds in the SCA equitably.
The Fund did not utilize the SCA during the year ended October 31, 2022.
| 9. | Risks of Investing in the Fund |
The Fund’s risks include, but are not limited to, some or all of the risks discussed below. For further information on the Fund’s risks, please refer to the Fund’s Prospectus and Statement of Additional Information.
Country Risk: Changes in the business environment may adversely affect operating profits or the value of assets in a specific country. For example, financial factors such as currency controls, devaluation or regulatory changes or stability factors such as mass riots, civil war and other potential events may contribute to companies’ operational risks.
Currency Risk: The Fund’s net asset value could decline as a result of changes in exchange rates, which could adversely affect the Fund’s investments in currencies, or in securities that trade in, and receive revenues related to, currencies, or in derivatives that provide exposure to currencies. Certain foreign countries may impose restrictions on the ability of issuers of foreign securities to make payment of principal and interest or dividends to investors located outside the country, due to blockage of foreign currency exchanges or otherwise.
Economic and Market Events Risk: Events in the U.S. and global financial markets, including actions taken by the U.S. Federal Reserve or foreign central banks to stimulate or stabilize economic growth or the functioning of the securities markets, or otherwise reduce inflation may at times result in unusually high market volatility, which could negatively impact performance. Governmental efforts to curb inflation often have negative effects on the level of economic activity. Relatively reduced liquidity in credit and fixed income markets could adversely affect issuers worldwide.
Emerging Markets Risk: The risks of foreign investments are greater for investments in or exposed to emerging markets. Emerging market countries typically have economic and political systems that are less fully developed, and can be expected to be less stable, than those of more developed countries. For example, the economies of such countries can be subject to rapid and unpredictable rates of inflation or deflation. Low trading volumes may result in a lack of liquidity and price volatility. Emerging market countries may have policies that restrict investment by non-U.S. investors, or that prevent non-U.S. investors from withdrawing their money at will.
PGIM Jennison Emerging Markets Equity Opportunities Fund 37
Notes to Financial Statements (continued)
The Fund may invest in some emerging markets that subject it to risks such as those associated with illiquidity, custody of assets, different settlement and clearance procedures and asserting legal title under a developing legal and regulatory regime to a greater degree than in developed markets or even in other emerging markets.
Equity and Equity-Related Securities Risk: Equity and equity-related securities may be subject to changes in value, and their values may be more volatile than those of other asset classes. In addition to an individual security losing value, the value of the equity markets or a sector in which the Fund invests could go down. Different parts of a market can react differently to adverse issuer, market, regulatory, political and economic developments.
Foreign Securities Risk: Investments in securities of non-U.S. issuers (including those denominated in U.S. dollars) may involve more risk than investing in securities of U.S. issuers. Foreign political, economic and legal systems, especially those in developing and emerging market countries, may be less stable and more volatile than in the United States. Foreign legal systems generally have fewer regulatory requirements than the U.S. legal system, particularly those of emerging markets. In general, less information is publicly available with respect to non-U.S. companies than U.S. companies. Non-U.S. companies generally are not subject to the same accounting, auditing, and financial reporting standards as are U.S. companies. Additionally, the changing value of foreign currencies and changes in exchange rates could also affect the value of the assets the Fund holds and the Fund’s performance. Certain foreign countries may impose restrictions on the ability of issuers of foreign securities to make payment of principal and interest or dividends to investors located outside the country, due to blockage of foreign currency exchanges or otherwise. Investments in emerging markets are subject to greater volatility and price declines.
In addition, the Fund’s investments in non-U.S. securities may be subject to the risks of nationalization or expropriation of assets, imposition of currency exchange controls or restrictions on the repatriation of non-U.S. currency, confiscatory taxation and adverse diplomatic developments. Special U.S. tax considerations may apply.
Geographic Concentration Risk: The Fund’s performance may be closely tied to the market, economic, political, regulatory or other conditions in the countries or regions in which the Fund invests. This can result in more pronounced risks based upon conditions that impact one or more countries or regions more or less than other countries or regions.
Increase in Expenses Risk: Your actual cost of investing in the Fund may be higher than the expenses shown in the expense table in the Fund’s prospectus for a variety of reasons. For example, expense ratios may be higher than those shown if average net assets decrease.
Net assets are more likely to decrease and Fund expense ratios are more likely to increase when markets are volatile. Active and frequent trading of Fund securities can increase expenses.
Investments in China Risk: Investments in China subject the Fund to risks specific to China and may make it more volatile than other funds. Over the last few decades, the Chinese government has undertaken reform of economic and market practices and has expanded the sphere of private ownership of property in China. However, Chinese markets generally continue to experience inefficiency, volatility and pricing anomalies resulting from governmental influence, a lack of publicly available information and/or political and social instability. Internal social unrest or confrontations with
other neighboring countries, including military conflicts in response to such events, may also disrupt economic development in China and result in a greater risk of currency fluctuations, currency non-convertibility, interest rate fluctuations and higher rates of inflation.
China has experienced security concerns, such as terrorism and strained international relations. Incidents involving China’s or the region’s security may cause uncertainty in Chinese markets and may adversely affect the Chinese economy and the Fund’s investments. Export growth continues to be a major driver of China’s rapid economic growth. Reduction in spending on Chinese products and services, institution of additional tariffs or other trade barriers, including as a result of heightened trade tensions between China and the U.S., or a downturn in any of the economies of China’s key trading partners may have an adverse impact on the Chinese economy or the Fund. For example, a series of executive orders issued between November 2020 and June 2021 prohibit the Fund from investing in certain companies identified by the U.S. government as “Chinese Military Industrial Complex Companies.” The restrictions in these executive orders may force the subadviser to sell certain positions and may restrict the Fund from future investments the subadviser deems otherwise attractive.
Chinese companies, including Chinese companies that are listed on U.S. exchanges, are not subject to the same degree of regulatory requirements, accounting standards or auditor oversight as companies in more developed countries, and as a result, information about the Chinese securities in which the Fund invests may be less reliable or complete. There may be significant obstacles to obtaining information necessary for investigations into or litigation against Chinese companies and shareholders may have limited legal remedies.
Large Shareholder and Large Scale Redemption Risk: Certain individuals, accounts, funds (including funds affiliated with the Manager) or institutions, including the Manager and its affiliates, may from time to time own or control a substantial amount of the Fund’s shares. There is no requirement that these entities maintain their investment in the Fund. There is a risk that such large shareholders or that the Fund’s shareholders generally may redeem all or a substantial portion of their investments in the Fund in a short period of time, which could have a significant negative impact on the Fund’s NAV, liquidity, and brokerage costs. Large redemptions could also result in tax consequences to shareholders and impact the
PGIM Jennison Emerging Markets Equity Opportunities Fund 39
Notes to Financial Statements (continued)
Fund’s ability to implement its investment strategy. The Fund’s ability to pursue its investment objective after one or more large scale redemptions may be impaired and, as a result, the Fund may invest a larger portion of its assets in cash or cash equivalents.
Liquidity Risk: Liquidity risk is the risk that the Fund could not meet requests to redeem shares issued by the Fund without significant dilution of remaining investors’ interests in the Fund. The Fund may invest in instruments that trade in lower volumes and are more illiquid than other investments. If the Fund is forced to sell these investments to pay redemption proceeds or for other reasons, the Fund may lose money. In addition, when there is no willing buyer and investments cannot be readily sold at the desired time or price, the Fund may have to accept a lower price or may not be able to sell the instrument at all. An inability to sell a portfolio position can adversely affect the Fund’s value or prevent the Fund from being able to take advantage of other investment opportunities.
Management Risk: Actively managed funds are subject to management risk. The subadviser will apply investment techniques and risk analyses in making investment decisions for the Fund, but the subadviser’s judgments about the attractiveness, value or market trends affecting a particular security, industry or sector or about market movements may be incorrect. Additionally, the investments selected for the Fund may underperform the markets in general, the Fund’s benchmark and other funds with similar investment objectives.
Market Capitalization Risk: The Fund may invest in companies of any market capitalization. Generally, the stock prices of small- and mid-cap companies are less stable than the prices of large-cap stocks and may present greater risks. Large capitalization companies as a group could fall out of favor with the market, causing the Fund to underperform compared to investments that focus on smaller capitalized companies.
Market Disruption and Geopolitical Risks: Market disruption can be caused by economic, financial or political events and factors, including but not limited to, international wars or conflicts (including Russia’s military invasion of Ukraine), geopolitical developments (including trading and tariff arrangements, sanctions and cybersecurity attacks), instability in regions such as Asia, Eastern Europe and the Middle East, terrorism, natural disasters and public health epidemics (including the outbreak of COVID-19 globally).
The extent and duration of such events and resulting market disruptions cannot be predicted, but could be substantial and could magnify the impact of other risks to the Fund. These and other similar events could adversely affect the U.S. and foreign financial markets and lead to increased market volatility, reduced liquidity in the securities markets, significant negative impacts on issuers and the markets for certain securities and commodities and/or government intervention. They may also cause short- or long-term economic uncertainties in
the United States and worldwide. As a result, whether or not the Fund invests in securities of issuers located in or with significant exposure to the countries directly affected, the value and liquidity of the Fund’s investments may be negatively impacted. Further, due to closures of certain markets and restrictions on trading certain securities, the value of certain securities held by the Fund could be significantly impacted, which could lead to such securities being valued at zero.
COVID-19 and the related governmental and public responses have had and may continue to have an impact on the Fund’s investments and net asset value and have led and may continue to lead to increased market volatility and the potential for illiquidity in certain classes of securities and sectors of the market. They have also had and may continue to result in periods of business disruption, business closures, inability to obtain raw materials, supplies and component parts, and reduced or disrupted operations for the issuers in which the Fund invests. The occurrence, reoccurrence and pendency of public health epidemics could adversely affect the economies and financial markets either in specific countries or worldwide.
Market Risk: Securities markets may be volatile and the market prices of the Fund’s securities may decline. Securities fluctuate in price based on changes in an issuer’s financial condition and overall market and economic conditions. If the market prices of the securities owned by the Fund fall, the value of your investment in the Fund will decline.
PGIM Jennison Emerging Markets Equity Opportunities Fund 41
Report of Independent Registered Public Accounting Firm
To the Board of Directors of Prudential World Fund, Inc. and Shareholders of PGIM Jennison Emerging Markets Equity Opportunities Fund
Opinion on the Financial Statements
We have audited the accompanying statement of assets and liabilities, including the schedule of investments, of PGIM Jennison Emerging Markets Equity Opportunities Fund (one of the funds constituting Prudential World Fund, Inc., referred to hereafter as the “Fund”) as of October 31, 2022, the related statement of operations for the year ended October 31, 2022, the statements of changes in net assets for each of the two years in the period ended October 31, 2022, including the related notes, and the financial highlights for each of the three years in the period ended October 31, 2022 (collectively referred to as the “financial statements”). In our opinion, the financial statements present fairly, in all material respects, the financial position of the Fund as of October 31, 2022, the results of its operations for the year then ended, the changes in its net assets for each of the two years in the period ended October 31 2022 and the financial highlights for each of the three years in the period ended October 31, 2022 in conformity with accounting principles generally accepted in the United States of America.
The financial statements of the Fund as of and for the year ended October 31, 2019 and the financial highlights for each of the periods ended on or prior to October 31, 2019 (not presented herein, other than the financial highlights) were audited by other auditors whose report dated December 19, 2019 expressed an unqualified opinion on those financial statements and financial highlights.
Basis for Opinion
These financial statements are the responsibility of the Fund’s management. Our responsibility is to express an opinion on the Fund’s financial statements based on our audits. We are a public accounting firm registered with the Public Company Accounting Oversight Board (United States) (PCAOB) and are required to be independent with respect to the Fund in accordance with the U.S. federal securities laws and the applicable rules and regulations of the Securities and Exchange Commission and the PCAOB.
We conducted our audits of these financial statements in accordance with the standards of the PCAOB. Those standards require that we plan and perform the audit to obtain reasonable assurance about whether the financial statements are free of material misstatement, whether due to error or fraud.
Our audits included performing procedures to assess the risks of material misstatement of the financial statements, whether due to error or fraud, and performing procedures that respond to those risks. Such procedures included examining, on a test basis, evidence regarding the amounts and disclosures in the financial statements. Our audits also included evaluating the accounting principles used and significant estimates made by management, as well as evaluating the overall presentation of the financial statements. Our procedures included confirmation of securities owned as of October 31, 2022 by correspondence with the custodian, transfer agent and brokers. We believe that our audits provide a reasonable basis for our opinion.
/s/PricewaterhouseCoopers LLP
New York, New York
December 19, 2022
We have served as the auditor of one or more investment companies in the PGIM Retail Funds complex since 2020.
INFORMATION ABOUT BOARD MEMBERS AND OFFICERS (unaudited)
Information about Board Members and Officers of the Fund is set forth below. Board Members who are not deemed to be “interested persons” of the Fund, as defined in the 1940 Act, are referred to as “Independent Board Members.” Board Members who are deemed to be “interested persons” of the Fund are referred to as “Interested Board Members.” The Board Members are responsible for the overall supervision of the operations of the Fund and perform the various duties imposed on the directors of investment companies by the 1940 Act. The Board in turn elects the Officers, who are responsible for administering the day-to-day operations of the Fund.
| | | | | | |
Independent Board Members |
| | | | |
Name Year of Birth Position(s) Portfolios Overseen | | Principal Occupation(s) During Past Five Years | | Other Directorships Held During Past Five Years | | Length of
Board Service |
| | | | |
Ellen S. Alberding 1958 Board Member Portfolios Overseen: 97 | | President and Board Member, The Joyce Foundation (charitable foundation) (since 2002); formerly Vice Chair, City Colleges of Chicago (community college system) (2011-2015); Trustee, National Park Foundation (charitable foundation for national park system) (2009-2018); Trustee, Economic Club of Chicago (2009-2016); Trustee, Loyola University (since 2018). | | None. | | Since September 2013 |
| | | | |
Kevin J. Bannon 1952 Board Member Portfolios Overseen: 97 | | Retired; formerly Managing Director (April 2008-May 2015) and Chief Investment Officer (October 2008-November 2013) of Highmount Capital LLC (registered investment adviser); formerly Executive Vice President and Chief Investment Officer (April 1993-August 2007) of Bank of New York Company; President (May 2003-May 2007) of BNY Hamilton Family of Mutual Funds. | | Director of Urstadt Biddle Properties (equity real estate investment trust) (since September 2008). | | Since July 2008 |
PGIM Jennison Emerging Markets Equity Opportunities Fund
| | | | | | |
Independent Board Members |
| | | | |
Name Year of Birth Position(s) Portfolios Overseen | | Principal Occupation(s) During Past Five Years | | Other Directorships Held During Past Five Years | | Length of
Board Service |
| | | | |
Linda W. Bynoe 1952 Board Member Portfolios Overseen: 94 | | President and Chief Executive Officer (since March 1995) and formerly Chief Operating Officer (December 1989-February 1995) of Telemat Limited LLC (formerly Telemat Ltd) (management consulting); formerly Vice President (January 1985-June 1989) at Morgan Stanley & Co. (broker-dealer). | | Trustee of Equity Residential (residential real estate) (since December 2009); Director of Northern Trust Corporation (financial services) (since April 2006); formerly Director of Anixter International, Inc. (communication products distributor) (January 2006-June 2020). | | Since March 2005 |
| | | | |
Barry H. Evans 1960 Board Member Portfolios Overseen: 96 | | Retired; formerly President (2005-2016), Global Chief Operating Officer (2014-2016), Chief Investment Officer - Global Head of Fixed Income (1998-2014), and various portfolio manager roles (1986-2006), Manulife Asset Management (asset management). | | Formerly Director, Manulife Trust Company (2011-2018); formerly Director, Manulife Asset Management Limited (2015-2017); formerly Chairman of the Board of Directors of Manulife Asset Management U.S. (2005-2016); formerly Chairman of the Board, Declaration Investment Management and Research (2008-2016). | | Since September 2017 |
| | | | |
Keith F. Hartstein 1956 Board Member & Independent Chair Portfolios Overseen: 97 | | Retired; Member (November 2014-September 2022) of the Governing Council of the Independent Directors Council (IDC) (organization of independent mutual fund directors); formerly Executive Committee of the IDC Board of Governors (October 2019-December 2021); formerly President and Chief Executive Officer (2005-2012), Senior Vice President (2004-2005), Senior Vice President of Sales and Marketing (1997-2004), and various executive management positions (1990-1997), John Hancock Funds, LLC (asset management); Chairman, Investment Company Institute’s Sales Force Marketing Committee (2003-2008). | | None. | | Since September 2013 |
Visit our website at pgim.com/investments
| | | | | | |
Independent Board Members |
| | | | |
Name Year of Birth Position(s) Portfolios Overseen | | Principal Occupation(s) During Past Five Years | | Other Directorships Held During Past Five Years | | Length of Board Service |
| | | | |
Laurie Simon Hodrick 1962 Board Member Portfolios Overseen: 93 | | A. Barton Hepburn Professor Emerita of Economics in the Faculty of Business, Columbia Business School (since 2018); Visiting Fellow at the Hoover Institution, Stanford University (since 2015); Sole Member, ReidCourt LLC (since 2008) (a consulting firm); formerly Visiting Professor of Law, Stanford Law School (2015-2021); formerly A. Barton Hepburn Professor of Economics in the Faculty of Business, Columbia Business School (1996-2017); formerly Managing Director, Global Head of Alternative Investment Strategies, Deutsche Bank (2006-2008). | | Independent Director, Andela (since January 2022) (global talent network); Independent Director, Roku (since December 2020) (communication services); formerly Independent Director, Synnex Corporation (2019-2021) (information technology); formerly Independent Director, Kabbage, Inc. (2018-2020) (financial services); formerly Independent Director, Corporate Capital Trust (2017-2018) (a business development company). | | Since September 2017 |
| | | | |
Brian K. Reid 1961 Board Member Portfolios Overseen: 96 | | Retired; formerly Chief Economist for the Investment Company Institute (ICI) (2005-2017); formerly Senior Economist and Director of Industry and Financial Analysis at the ICI (1998-2004); formerly Senior Economist, Industry and Financial Analysis at the ICI (1996-1998); formerly Staff Economist at the Federal Reserve Board (1989-1996); Director, ICI Mutual Insurance Company (2012-2017). | | None. | | Since March 2018 |
PGIM Jennison Emerging Markets Equity Opportunities Fund
| | | | | | |
Independent Board Members |
| | | | |
Name Year of Birth Position(s) Portfolios Overseen | | Principal Occupation(s) During Past Five Years | | Other Directorships Held During Past Five Years | | Length of Board Service |
| | | | |
Grace C. Torres 1959 Board Member Portfolios Overseen: 96 | | Retired; formerly Treasurer and Principal Financial and Accounting Officer of the PGIM Funds, Target Funds, Advanced Series Trust, Prudential Variable Contract Accounts and The Prudential Series Fund (1998-June 2014); Assistant Treasurer (March 1999-June 2014) and Senior Vice President (September 1999-June 2014) of PGIM Investments LLC; Assistant Treasurer (May 2003-June 2014) and Vice President (June 2005-June 2014) of AST Investment Services, Inc.; Senior Vice President and Assistant Treasurer (May 2003-June 2014) of Prudential Annuities Advisory Services, Inc. | | Director (since January 2018) of OceanFirst Financial Corp. and OceanFirst Bank; formerly Director (July 2015-January 2018) of Sun Bancorp, Inc. N.A. and Sun National Bank. | | Since November 2014 |
Visit our website at pgim.com/investments
| | | | | | |
Interested Board Members |
| | | | |
Name Year of Birth Position(s) Portfolios Overseen | | Principal Occupation(s) During Past Five Years | | Other Directorships Held During Past Five Years | | Length of
Board Service |
| | | | |
Stuart S. Parker 1962 Board Member & President Portfolios Overseen: 96 | | President, Chief Executive Officer, Chief Operating Officer and Officer in Charge of PGIM Investments LLC (formerly known as Prudential Investments LLC) (since January 2012); President and Principal Executive Officer (“PEO”) (since September 2022) of the PGIM Private Credit Fund; President and PEO (since March 2022) of the PGIM Private Real Estate Fund, Inc.; formerly Executive Vice President of Jennison Associates LLC and Head of Retail Distribution of PGIM Investments LLC (June 2005-December 2011); Investment Company Institute - Board of Governors (since May 2012). | | None. | | Since January 2012 |
| | | | |
Scott E. Benjamin 1973 Board Member & Vice President Portfolios Overseen: 97 | �� | Executive Vice President (since May 2009) of PGIM Investments LLC; Vice President (since June 2012) of Prudential Investment Management Services LLC; Executive Vice President (since September 2009) of AST Investment Services, Inc.; Senior Vice President of Product Development and Marketing, PGIM Investments (since February 2006); Vice President (since September 2022) of the PGIM Private Credit Fund; Vice President (since March 2022) of the PGIM Private Real Estate Fund, Inc.; formerly Vice President of Product Development and Product Management, PGIM Investments LLC (2003-2006). | | None. | | Since March 2010 |
PGIM Jennison Emerging Markets Equity Opportunities Fund
| | | | |
Fund Officers(a) | | | | |
| | | |
Name Year of Birth Fund Position | | Principal Occupation(s) During Past Five Years | | Length of Service as Fund Officer |
| | | |
Claudia DiGiacomo 1974 Chief Legal Officer | | Chief Legal Officer (since September 2022) of the PGIM Private Credit Fund; Chief Legal Officer (since July 2022) of the PGIM Private Real Estate Fund, Inc.; Chief Legal Officer, Executive Vice President and Secretary of PGIM Investments LLC (since August 2020); Chief Legal Officer of Prudential Mutual Fund Services LLC (since August 2020); Chief Legal Officer of PIFM Holdco, LLC (since August 2020); Vice President and Corporate Counsel (since January 2005) of Prudential; and Corporate Counsel of AST Investment Services, Inc. (since August 2020); formerly Vice President and Assistant Secretary of PGIM Investments LLC (2005-2020); formerly Associate at Sidley Austin Brown & Wood LLP (1999-2004). | | Since December 2005 |
| | | |
Isabelle Sajous 1976 Chief Compliance Officer | | Chief Compliance Officer (since April 2022) of PGIM Investments LLC, the PGIM Funds, Target Funds, PGIM ETF Trust, PGIM Global High Yield Fund, Inc., PGIM High Yield Bond Fund, Inc., PGIM Short Duration High Yield Opportunities Fund, Advanced Series Trust, The Prudential Series Fund and Prudential’s Gibraltar Fund, Inc.; Chief Compliance Officer (since September 2022) of the PGIM Private Credit Fund; Chief Compliance Officer (since March 2022) of the PGIM Private Real Estate Fund, Inc.; Vice President, Compliance of PGIM Investments LLC (since December 2020); formerly Director, Compliance (July 2018-December 2020) of Credit Suisse Asset Management LLC; and Vice President, Associate General Counsel & Deputy Chief Compliance Officer of Cramer Rosenthal McGlynn, LLC (August 2014-July 2018). | | Since April 2022 |
| | | |
Andrew R. French 1962 Secretary | | Vice President (since December 2018) of PGIM Investments LLC; Secretary (since September 2022) of the PGIM Private Credit Fund; Secretary (since March 2022) of the PGIM Private Real Estate Fund, Inc.; formerly Vice President and Corporate Counsel (2010-2018) of Prudential; formerly Director and Corporate Counsel (2006-2010) of Prudential; Vice President and Assistant Secretary (since January 2007) of PGIM Investments LLC; Vice President and Assistant Secretary (since January 2007) of Prudential Mutual Fund Services LLC. | | Since October 2006 |
| | | |
Melissa Gonzalez 1980 Assistant Secretary | | Vice President and Corporate Counsel (since September 2018) of Prudential; Vice President and Assistant Secretary (since August 2020) of PGIM Investments LLC; Assistant Secretary (since September 2022) of the PGIM Private Credit Fund; Assistant Secretary (since March 2022) of the PGIM Private Real Estate Fund, Inc.; formerly Director and Corporate Counsel (March 2014-September 2018) of Prudential. | | Since March 2020 |
Visit our website at pgim.com/investments
| | | | |
Fund Officers(a) | | | | |
| | | |
Name Year of Birth Fund Position | | Principal Occupation(s) During Past Five Years | | Length of Service as Fund Officer |
| | | |
Patrick E. McGuinness 1986 Assistant Secretary | | Vice President and Assistant Secretary (since August 2020) of PGIM Investments LLC; Director and Corporate Counsel (since February 2017) of Prudential; Assistant Secretary (since September 2022) of the PGIM Private Credit Fund; Assistant Secretary (since March 2022) of the PGIM Private Real Estate Fund, Inc. | | Since June 2020 |
| | | |
Debra Rubano 1975 Assistant Secretary | | Vice President and Corporate Counsel (since November 2020) of Prudential; Assistant Secretary (since September 2022) of the PGIM Private Credit Fund; Assistant Secretary (since March 2022) of the PGIM Private Real Estate Fund, Inc; formerly Director and Senior Counsel of Allianz Global Investors U.S. Holdings LLC (2010-2020) and Assistant Secretary of numerous funds in the Allianz fund complex (2015-2020). | | Since December 2020 |
| | | |
Kelly A. Coyne 1968 Assistant Secretary | | Director, Investment Operations of Prudential Mutual Fund Services LLC (since 2010); Assistant Secretary (since September 2022) of the PGIM Private Credit Fund; Assistant Secretary (since March 2022) of the PGIM Private Real Estate Fund, Inc. | | Since March 2015 |
| | | |
Christian J. Kelly 1975 Treasurer and Principal Financial and Accounting Officer | | Vice President, Head of Fund Administration of PGIM Investments LLC (since November 2018); Principal Financial Officer (since September 2022) of the PGIM Private Credit Fund; Principal Financial Officer (since March 2022) of the PGIM Private Real Estate Fund, Inc.; formerly, Treasurer and Principal Accounting Officer (March 2022- July 2022) of the PGIM Private Real Estate Fund, Inc.; formerly Director of Fund Administration of Lord Abbett & Co. LLC (2009-2018), Treasurer and Principal Accounting Officer of the Lord Abbett Family of Funds (2017-2018); Director of Accounting, Avenue Capital Group (2008-2009); Senior Manager, Investment Management Practice of Deloitte & Touche LLP (1998-2007). | | Since January 2019 |
| | | |
Lana Lomuti 1967 Assistant Treasurer | | Vice President (since 2007) and Director (2005-2007), within PGIM Investments Fund Administration; formerly Assistant Treasurer (December 2007-February 2014) of The Greater China Fund, Inc. | | Since April 2014 |
| | | |
Russ Shupak 1973 Assistant Treasurer | | Vice President (since 2017) and Director (2013-2017), within PGIM Investments Fund Administration; Treasurer and Principal Accounting Officer (since July 2022) of the PGIM Private Real Estate Fund, Inc.; Assistant Treasurer (since September 2022) of the PGIM Private Credit Fund; formerly Assistant Treasurer (March 2022 – July 2022) of the PGIM Private Real Estate Fund, Inc. | | Since October 2019 |
| | | |
Deborah Conway 1969 Assistant Treasurer | | Vice President (since 2017) and Director (2007-2017), within PGIM Investments Fund Administration. | | Since October 2019 |
PGIM Jennison Emerging Markets Equity Opportunities Fund
| | | | |
Fund Officers(a) | | | | |
| | | |
Name Year of Birth Fund Position | | Principal Occupation(s) During Past Five Years | | Length of Service as Fund Officer |
| | | |
Elyse M. McLaughlin 1974 Assistant Treasurer | | Vice President (since 2017) and Director (2011-2017), within PGIM Investments Fund Administration; Treasurer and Principal Accounting Officer (since September 2022) of the PGIM Private Credit Fund; Assistant Treasurer (since March 2022) of the PGIM Private Real Estate Fund, Inc. | | Since October 2019 |
| | | |
Kelly Florio 1978 Anti-Money Laundering Compliance Officer | | Vice President, Corporate Compliance, Global Compliance Programs and Compliance Risk Management (since December 2021) of Prudential; formerly, Head of Fraud Risk Management (October 2019 to December 2021) at New York Life Insurance Company; formerly, Head of Key Risk Area Operations (November 2018 to October 2019), Director of the US Anti-Money Laundering Compliance Unit (2009-2018) and Bank Loss Prevention Associate (2006 -2009) at MetLife. | | Since June 2022 |
| (a) | Excludes Mr. Parker and Mr. Benjamin, interested Board Members who also serve as President and Vice President, respectively. |
Explanatory Notes to Tables:
| ∎ | Board Members are deemed to be “Interested,” as defined in the 1940 Act, by reason of their affiliation with PGIM Investments LLC and/or an affiliate of PGIM Investments LLC. |
| ∎ | Unless otherwise noted, the address of all Board Members and Officers is c/o PGIM Investments LLC, 655 Broad Street, Newark, New Jersey 07102-4410. |
| ∎ | There is no set term of office for Board Members or Officers. The Board Members have adopted a retirement policy, which calls for the retirement of Board Members on December 31 of the year in which they reach the age of 75. |
| ∎ | “Other Directorships Held” includes all directorships of companies required to register or file reports with the SEC under the 1934 Act (that is, “public companies”) or other investment companies registered under the 1940 Act. |
| ∎ | “Portfolios Overseen” includes all investment companies managed by PGIM Investments LLC. The investment companies for which PGIM Investments LLC serves as manager include the PGIM Mutual Funds, Target Funds, The Prudential Variable Contract Accounts, PGIM ETF Trust, PGIM Private Real Estate Fund, Inc., PGIM Private Credit Fund, PGIM High Yield Bond Fund, Inc., PGIM Global High Yield Fund, Inc., PGIM Short Duration High Yield Opportunities Fund, The Prudential Series Fund, Prudential’s Gibraltar Fund, Inc. and the Advanced Series Trust. |
| ∎ | As used in the Fund Officers table “Prudential” means The Prudential Insurance Company of America. |
Visit our website at pgim.com/investments
Approval of Advisory Agreements (unaudited)
The Fund’s Board of Trustees
The Board of Directors (the “Board”) of PGIM Jennison Emerging Markets Equity Opportunities Fund (the “Fund”)1 consists of ten individuals, eight of whom are not “interested persons” of the Fund, as defined in the Investment Company Act of 1940, as amended (the “1940 Act”) (the “Independent Directors”). The Board is responsible for the oversight of the Fund and its operations, and performs the various duties imposed on the directors of investment companies by the 1940 Act. The Independent Directors have retained independent legal counsel to assist them in connection with their duties. The Chair of the Board is an Independent Director. The Board has established five standing committees: the Audit Committee, the Nominating and Governance Committee, the Compliance Committee and two Investment Committees. Each committee is chaired by, and composed of, Independent Directors.
Annual Approval of the Fund’s Advisory Agreements
As required under the 1940 Act, the Board determines annually whether to renew the Fund’s management agreement with PGIM Investments LLC (“PGIM Investments”) and the Fund’s subadvisory agreement with Jennison Associates LLC (“Jennison”). In considering the renewal of the agreements, the Board, including all of the Independent Directors, met on May 26 and June 7-9, 2022 (the “Board Meeting”) and approved the renewal of the agreements through July 31, 2023, after concluding that the renewal of the agreements was in the best interests of the Fund and its shareholders.
In advance of the meetings, the Board requested and received materials relating to the agreements, and had the opportunity to ask questions and request further information in connection with its consideration. Among other things, the Board considered comparative fee information from PGIM Investments and Jennison. Also, the Board considered comparisons with other mutual funds in relevant Peer Universes and Peer Groups, as is further discussed below.
In approving the agreements, the Board, including the Independent Directors advised by independent legal counsel, considered the factors it deemed relevant, including the nature, quality and extent of services provided by PGIM Investments and the subadviser, the performance of the Fund, the profitability of PGIM Investments and its affiliates, expenses and fees, and the potential for economies of scale that may be shared with the Fund and its shareholders as the Fund’s assets grow. In their deliberations, the Directors did not identify any single factor which alone was responsible for the Board’s decision to approve the agreements with respect to the Fund. In connection with its deliberations, the Board considered information provided by PGIM Investments throughout the year at regular Board meetings, presentations from portfolio managers and other information, as well as information furnished at or in advance of the Board Meeting.
The Directors determined that the overall arrangements between the Fund and PGIM Investments, which serves as the Fund’s investment manager pursuant to a
1PGIM Jennison Emerging Markets Equity Opportunities Fund is a series of Prudential World Fund, Inc.
PGIM Jennison Emerging Markets Equity Opportunities Fund
Approval of Advisory Agreements (continued)
management agreement, and between PGIM Investments and Jennison, which serves as the Fund’s subadviser pursuant to the terms of a subadvisory agreement with PGIM Investments, are in the best interests of the Fund and its shareholders in light of the services performed, fees charged and such other matters as the Directors considered relevant in the exercise of their business judgment.
The material factors and conclusions that formed the basis for the Directors’ determinations to approve the renewal of the agreements are discussed separately below.
Nature, Quality and Extent of Services
The Board received and considered information regarding the nature, quality and extent of services provided to the Fund by PGIM Investments and Jennison. The Board noted that Jennison is affiliated with PGIM Investments. The Board considered the services provided by PGIM Investments, including but not limited to the oversight of the subadviser for the Fund, as well as the provision of fund recordkeeping, compliance and other services to the Fund, and PGIM Investments’ role as administrator for the Fund’s liquidity risk management program. With respect to PGIM Investments’ oversight of the subadviser, the Board noted that PGIM Investments’ Strategic Investment Research Group (“SIRG”), a business unit of PGIM Investments, is responsible for monitoring and reporting to PGIM Investments’ senior management on the performance and operations of the subadviser. The Board also considered that PGIM Investments pays the salaries of all of the officers and interested Directors of the Fund who are part of Fund management. The Board also considered the investment subadvisory services provided by Jennison, including investment research and security selection, as well as compliance with the Fund’s investment restrictions, policies and procedures. The Board considered PGIM Investments’ evaluation of Jennison as well as PGIM Investments’ recommendation, based on its review of Jennison, to renew the subadvisory agreement.
The Board considered the qualifications, backgrounds and responsibilities of PGIM Investments’ senior management responsible for the oversight of the Fund and Jennison, and also considered the qualifications, backgrounds and responsibilities of Jennison’s portfolio managers who are responsible for the day-to-day management of the Fund’s portfolio. The Board was provided with information pertaining to PGIM Investments’ and Jennison’s organizational structure, senior management, investment operations, and other relevant information pertaining to both PGIM Investments and Jennison. The Board also noted that it received favorable compliance reports from the Fund’s Chief Compliance Officer (“CCO”) as to both PGIM Investments and Jennison.
The Board concluded that it was satisfied with the nature, extent and quality of the investment management services provided by PGIM Investments and the subadvisory services provided to the Fund by Jennison, and that there was a reasonable basis on which to conclude that the Fund benefits from the services provided by PGIM Investments and Jennison under the management and subadvisory agreements.
Visit our website at pgim.com/investments
The Board was provided with information on the profitability of PGIM Investments and its affiliates in serving as the Fund’s investment manager. The Board discussed with PGIM Investments the methodology utilized in assembling the information regarding profitability and considered its reasonableness. The Board recognized that it is difficult to make comparisons of profitability from fund management contracts because comparative information is not generally publicly available and is affected by numerous factors, including the structure of the particular adviser, the types of funds it manages, its business mix, numerous assumptions regarding allocations and the adviser’s capital structure and cost of capital. However, the Board considered that the cost of services provided by PGIM Investments for the year ended December 31, 2021 exceeded the management fees received by PGIM Investments, resulting in an operating loss to PGIM Investments. Taking these factors into account, the Board concluded that the profitability of PGIM Investments and its affiliates in relation to the services rendered was not unreasonable.
Economies of Scale
The Board received and discussed information concerning economies of scale that PGIM Investments may realize as the Fund’s assets grow beyond current levels. The Board noted that the management fee schedule for the Fund includes breakpoints, which have the effect of decreasing the fee rate as assets increase. During the course of time, the Board has considered information regarding the launch date of the Fund, the management fees of the Fund compared to those of similarly managed funds and PGIM Investments’ investment in the Fund over time. The Board noted that economies of scale can be shared with the Fund in other ways, including low management fees from inception, additional technological and personnel investments to enhance shareholder services, and maintaining existing expense structures in the face of a rising cost environment. The Board also considered PGIM Investments’ assertion that it continually evaluates the management fee schedule of the Fund and the potential to share economies of scale through breakpoints or fee waivers as asset levels increase.
The Board recognized the inherent limitations of any analysis of economies of scale, stemming largely from the Board’s understanding that most of PGIM Investments’ costs are not specific to individual funds, but rather are incurred across a variety of products and services.
Other Benefits to PGIM Investments and Jennison
The Board considered potential ancillary benefits that might be received by PGIM Investments and Jennison and their affiliates as a result of their relationship with the Fund. The Board concluded that potential benefits to be derived by PGIM Investments included transfer agency fees received by the Fund’s transfer agent (which is affiliated with PGIM Investments), as well as benefits to its reputation or other intangible benefits resulting from PGIM Investments’ association with the Fund. The Board concluded that the potential benefits to be derived by Jennison included its ability to use soft dollar credits, as well as the potential benefits consistent with those generally resulting from an
PGIM Jennison Emerging Markets Equity Opportunities Fund
Approval of Advisory Agreements (continued)
increase in assets under management, specifically, potential access to additional research resources and benefits to its reputation. The Board concluded that the benefits derived by PGIM Investments and Jennison were consistent with the types of benefits generally derived by investment managers and subadvisers to mutual funds.
Performance of the Fund / Fees and Expenses
The Board considered certain additional factors and made related conclusions relating to the historical performance of the Fund for the one-, three- and five-year periods ended December 31, 2021. The Board considered that the Fund commenced operations on September 16, 2014 and that longer-term performance was not yet available.
The Board also considered the Fund’s actual management fee, as well as the Fund’s net total expense ratio, for the fiscal year ended October 31, 2021. The Board considered the management fee for the Fund as compared to the management fee charged by PGIM Investments to other funds and the fee charged by other advisers to comparable mutual funds in a Peer Group. The actual management fee represents the fee rate actually paid by Fund shareholders and includes any fee waivers or reimbursements. The net total expense ratio for the Fund represents the actual expense ratio incurred by Fund shareholders.
The mutual funds included in the Peer Universe, which was used to consider performance, and the Peer Group, which was used to consider fees and expenses, were objectively determined by Broadridge, an independent provider of mutual fund data. In certain circumstances, PGIM Investments also provided supplemental Peer Universe or Peer Group information, for reasons addressed with the Board. The comparisons placed the Fund in various quartiles over various periods, with the first quartile being the best 25% of the mutual funds (for performance, the best performing mutual funds and, for expenses, the lowest cost mutual funds).
The section below summarizes key factors considered by the Board and the Board’s conclusions regarding the Fund’s performance, fees and overall expenses. The table sets forth net performance comparisons (which reflect the impact on performance of fund expenses, or any subsidies, expense caps or waivers that may be applicable) with the Peer Universe, actual management fees with the Peer Group (which reflect the impact of any subsidies or fee waivers), and net total expenses with the Peer Group, each of which were key factors considered by the Board.
| | | | | | | | |
| | | | | |
| Net Performance | | 1 Year | | 3 Years | | 5 Years | | 10 Years |
| | 2nd Quartile | | 1st Quartile | | 1st Quartile | | N/A |
| |
| Actual Management Fees: 2nd Quartile |
| |
Net Total Expenses: 2nd Quartile |
| ● | The Board noted that the Fund outperformed its benchmark index over all periods. |
Visit our website at pgim.com/investments
| ● | The Board and PGIM Investments agreed to retain the existing contractual expense cap, which (exclusive of certain fees and expenses) caps the Fund’s annual operating expenses at 1.30% for Class A shares, 2.05% for Class C shares, 0.98% for Class R6 shares, and 1.05% for Class Z shares through February 28, 2023. |
| ● | In addition, PGIM Investments will waive management fees or shared operating expenses on any share class to the same extent that it waives such expenses on any other share class, and has agreed that total annual fund operating expenses for Class R6 shares will not exceed total annual fund operating expenses for Class Z shares. |
| ● | The Board concluded that, in light of the above, it would be in the best interests of the Fund and its shareholders to renew the agreements. |
| ● | The Board concluded that the management fees (including subadvisory fees) and total expenses were reasonable in light of the services provided. |
* * *
After full consideration of these factors, the Board concluded that approval of the agreements was in the best interests of the Fund and its shareholders.
PGIM Jennison Emerging Markets Equity Opportunities Fund
| | | | |
| | | |
∎ MAIL | | ∎ TELEPHONE | | ∎ WEBSITE |
655 Broad Street | | (800) 225-1852 | | pgim.com/investments |
Newark, NJ 07102 | | | | |
PROXY VOTING
The Board of Directors of the Fund has delegated to the Fund’s subadviser the responsibility for voting any proxies and maintaining proxy recordkeeping with respect to the Fund. A description of these proxy voting policies and procedures is available without charge, upon request, by calling (800) 225-1852 or by visiting the Securities and Exchange Commission’s website at sec.gov. Information regarding how the Fund voted proxies relating to portfolio securities during the most recent 12-month period ended June 30 is available on the Fund’s website and on the Securities and Exchange Commission’s website.
DIRECTORS
Ellen S. Alberding ● Kevin J. Bannon ● Scott E. Benjamin ● Linda W. Bynoe ● Barry H. Evans ● Keith F. Hartstein ● Laurie Simon Hodrick ● Stuart S. Parker ● Brian K. Reid ● Grace C. Torres
OFFICERS
Stuart S. Parker, President ● Scott E. Benjamin, Vice President ● Christian J. Kelly, Treasurer and Principal Financial and Accounting Officer ● Claudia DiGiacomo, Chief Legal Officer ● Isabelle Sajous, Chief Compliance Officer ● Kelly Florio, Anti-Money Laundering Compliance Officer ● Andrew R. French, Secretary ● Melissa Gonzalez, Assistant Secretary ● Kelly A. Coyne, Assistant Secretary ● Patrick E. McGuinness, Assistant Secretary ● Debra Rubano, Assistant Secretary ● Lana Lomuti, Assistant Treasurer ● Russ Shupak, Assistant Treasurer ● Elyse M. McLaughlin, Assistant Treasurer ● Deborah Conway, Assistant Treasurer
| | | | |
| MANAGER | | PGIM Investments LLC | | 655 Broad Street Newark, NJ 07102 |
| | |
| SUBADVISER | | Jennison Associates LLC | | 466 Lexington Avenue New York, NY 10017 |
| | |
| DISTRIBUTOR | | Prudential Investment Management Services LLC | | 655 Broad Street Newark, NJ 07102 |
| | |
| CUSTODIAN | | The Bank of New York Mellon | | 240 Greenwich Street New York, NY 10286 |
| | |
| TRANSFER AGENT | | Prudential Mutual Fund Services LLC | | PO Box 9658 Providence, RI 02940 |
| | |
| INDEPENDENT REGISTERED PUBLIC ACCOUNTING FIRM | | PricewaterhouseCoopers LLP | | 300 Madison Avenue New York, NY 10017 |
| | |
| FUND COUNSEL | | Willkie Farr & Gallagher LLP | | 787 Seventh Avenue New York, NY 10019 |
|
An investor should consider the investment objectives, risks, charges, and expenses of the Fund carefully before investing. The prospectus
and summary prospectus contain this and other information about the Fund. An investor may obtain the prospectus and summary
prospectus by visiting our website at pgim.com/investments or by calling (800) 225-1852. The prospectus and summary prospectus should be
read carefully before investing. |
|
| E-DELIVERY |
To receive your mutual fund documents online, go to pgim.com/investments/resource/edelivery and enroll. Instead of receiving printed documents by mail, you will receive notification via email when new materials are available. You can cancel your enrollment or change your email address at any time by visiting the website address above. |
|
| SHAREHOLDER COMMUNICATIONS WITH DIRECTORS |
Shareholders can communicate directly with the Board of Directors by writing to the Chair of the Board, PGIM Jennison Emerging Markets Equity Opportunities Fund, PGIM Investments, Attn: Board of Directors, 655 Broad Street, Newark, NJ 07102. Shareholders can communicate directly with an individual Director by writing to that Director at the same address. Communications are not screened before being delivered to the addressee. |
|
| AVAILABILITY OF PORTFOLIO HOLDINGS |
The Fund files its complete schedule of portfolio holdings with the Securities and Exchange Commission for the first and third quarters of each fiscal year as an exhibit to its reports on Form N-PORT. The Fund’s Form N-PORT filings are available on the Commission’s website at sec.gov. |
|
| The Fund’s Statement of Additional Information contains additional information about the Fund’s Directors and is available without charge, upon request, by calling (800) 225-1852. |
| | | | |
| Mutual Funds: | | | | |
| ARE NOT INSURED BY THE FDIC OR ANY FEDERAL GOVERNMENT AGENCY | | MAY LOSE VALUE | | ARE NOT A DEPOSIT OF OR GUARANTEED BY ANY BANK OR ANY BANK AFFILIATE |
PGIM JENNISON EMERGING MARKETS EQUITY OPPORTUNITIES FUND
| | | | | | | | |
| SHARE CLASS | | A | | C | | Z | | R6 |
| NASDAQ | | PDEAX | | PDECX | | PDEZX | | PDEQX |
| CUSIP | | 743969644 | | 743969636 | | 743969610 | | 743969628 |
MF225E

PGIM JENNISON INTERNATIONAL
OPPORTUNITIES FUND
ANNUAL REPORT
OCTOBER 31, 2022

To enroll in e-delivery, go to pgim.com/investments/resource/edelivery
Table of Contents
This report is not authorized for distribution to prospective investors unless preceded or accompanied by a current prospectus.
The views expressed in this report and information about the Fund’s portfolio holdings are for the period covered by this report and are subject to change thereafter.
Mutual funds are distributed by Prudential Investment Management Services LLC, member SIPC. Jennison Associates LLC is a registered investment adviser. Both are Prudential Financial companies. © 2022 Prudential Financial, Inc. and its related entities. Jennison Associates, Jennison, PGIM, and the PGIM logo are service marks of Prudential Financial, Inc. and its related entities, registered in many jurisdictions worldwide.
| | |
| 2 | | Visit our website at pgim.com/investments |
Letter from the President
| | |
 | |
Dear Shareholder:
We hope you find the annual report for the PGIM Jennison International Opportunities Fund informative and useful. The report covers performance for the 12-month period that ended October 31, 2022. The attention of the global economy and financial markets pivoted during the period from the COVID-19 pandemic to the challenge of rapidly rising inflation. While job growth remained strong, prices for a wide range of goods and services rose in response to economic re-openings, supply-chain disruptions, governmental stimulus, and Russia’s invasion of Ukraine. With inflation surging to a 40-year high, the Federal Reserve and other central banks aggressively hiked interest rates, prompting recession concerns. |
After rising to record levels at the end of 2021, stocks have fallen sharply in 2022 as investors worried about higher prices, slowing economic growth, geopolitical uncertainty, and new COVID-19 outbreaks. Equities rallied for a time during the summer but began falling again in late August on fears that the Fed would keep raising rates to tame inflation. For the entire 12-month period, equities suffered a broad-based global decline, although large-cap US stocks outperformed their small-cap counterparts. International developed and emerging markets trailed the US market during this time.
Rising rates and economic uncertainty drove fixed income prices broadly lower as well. US and global investment-grade bonds, along with US high yield corporate bonds and emerging market debt, all posted negative returns during the period.
Regarding your investments with PGIM, we believe it is important to maintain a diversified portfolio of funds consistent with your tolerance for risk, time horizon, and financial goals. Your financial advisor can help you create a diversified investment plan that may include funds covering all the basic asset classes and that reflects your personal investor profile and risk tolerance. However, diversification and asset allocation strategies do not assure a profit or protect against loss in declining markets.
At PGIM Investments, we provide access to active investment strategies across the global markets in the pursuit of consistent outperformance for investors. PGIM is the world’s 11th-largest investment manager with more than $1.5 trillion in assets under management. Our scale and investment expertise allow us to deliver a diversified suite of actively managed solutions across a broad spectrum of asset classes and investment styles.
Thank you for choosing our family of funds.
Sincerely,

Stuart S. Parker, President
PGIM Jennison International Opportunities Fund
December 15, 2022
| | | | |
PGIM Jennison International Opportunities Fund | | | 3 | |
Your Fund’s Performance (unaudited)
Performance data quoted represent past performance. Past performance does not guarantee future results. The investment return and principal value of an investment will fluctuate so that an investor’s shares, when redeemed, may be worth more or less than their original cost. Current performance may be lower or higher than the past performance data quoted. An investor may obtain performance data as of the most recent month-end by visiting our website at pgim.com/investments or by calling (800) 225-1852.
| | | | | | | | | | | | | | | | | | | | |
| |
| | | Average Annual Total Returns as of 10/31/22 |
| | | One Year (%) | | Five Years (%) | | Ten Years (%) | | Since Inception (%) |
| | | | |
Class A | | | | | | | | |
| | | | |
(with sales charges) | | -45.89 | | 4.03 | | 6.73 | | — |
| | | | |
(without sales charges) | | -42.74 | | 5.22 | | 7.33 | | — |
| | | | |
Class C | | | | | | | | |
| | | | |
(with sales charges) | | -43.78 | | 4.36 | | 6.50 | | — |
| | | | |
(without sales charges) | | -43.22 | | 4.36 | | 6.50 | | — |
| | | | |
Class R | | | | | | | | |
| | | | |
(without sales charges) | | -42.97 | | N/A | | N/A | | 4.37 (11/20/2017) |
| | | | |
Class Z | | | | | | | | |
| | | | |
(without sales charges) | | -42.63 | | 5.43 | | 7.58 | | — |
| | | | |
Class R2 | | | | | | | | |
| | | | |
(without sales charges) | | -42.90 | | N/A | | N/A | | 10.42 (12/27/2018) |
| | | | |
Class R4 | | | | | | | | |
| | | | |
(without sales charges) | | -42.76 | | N/A | | N/A | | 10.71 (12/27/2018) |
| | | | |
Class R6 | | | | | | | | |
| | | | |
(without sales charges) | | -42.61 | | 5.50 | | N/A | | 8.14 (12/23/2015) |
| | | | |
MSCI All Country World ex-US Index | | | | | | | | |
| | | | |
| | | -24.73 | | -0.60 | | 3.27 | | — |
| | | | | | |
|
| Average Annual Total Returns as of 10/31/22 Since Inception (%) |
| | | Class R | | Class R2, Class R4 | | Class R6 |
| | | (11/20/2017) | | (12/27/2018) | | (12/23/2015) |
| | | |
MSCI All Country World ex-US Index | | -0.77 | | 2.45 | | 3.34 |
Since Inception returns are provided since the Fund has less than 10 fiscal years of returns. Since Inception returns for the Index are measured from the closest month-end to the class’s inception date.
| | |
| 4 | | Visit our website at pgim.com/investments |
Growth of a $10,000 Investment (unaudited)
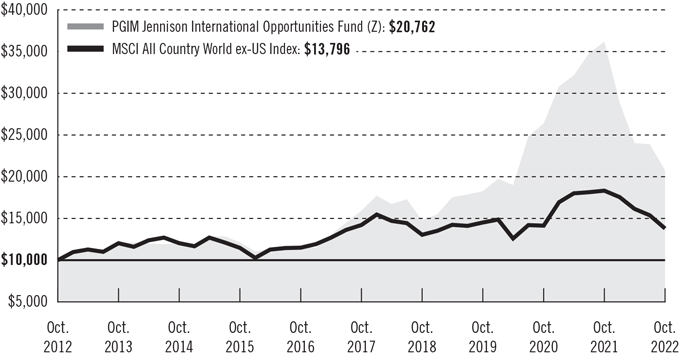
The graph compares a $10,000 investment in the Fund’s Class Z shares with a similar investment in the MSCI ACWI ex-US Index by portraying the initial account values at the beginning of the 10-year period for Class Z (October 31, 2012) and the account values at the end of the current fiscal year (October 31, 2022), as measured on a quarterly basis. For purposes of the graph, and unless otherwise indicated, it has been assumed that (a) all recurring fees (including management fees) were deducted and (b) all dividends and distributions were reinvested. The line graph provides information for Class Z shares only. As indicated in the tables provided earlier, performance for other share classes will vary due to the differing fees and expenses applicable to each share class (as indicated in the following paragraphs). Without waiver of fees and/or expense reimbursements, if any, the returns would have been lower.
Past performance does not predict future performance. Total returns and the ending account values in the graphs include changes in share price and reinvestment of dividends and capital gains distributions in a hypothetical investment for the periods shown. The Fund’s total returns do not reflect the deduction of income taxes on an individual’s investment. Taxes may reduce your actual investment returns on income or gains paid by the Fund or any gains you may realize if you sell your shares.
| | | | |
PGIM Jennison International Opportunities Fund | | | 5 | |
Your Fund’s Performance (continued)
The returns in the tables do not reflect the deduction of taxes that a shareholder would pay on Fund distributions or following the redemption of Fund shares. The average annual total returns take into account applicable sales charges, which are described for each share class in the table below.
| | | | | | | | | | | | | | |
| | | | | | | | |
| | | Class A | | Class C | | Class R | | Class Z | | Class R2 | | Class R4 | | Class R6 |
| | | | | | | | |
| Maximum initial sales charge | | 5.50% of the public offering price | | None | | None | | None | | None | | None | | None |
| | | | | | | | |
| Contingent deferred sales charge (CDSC) (as a percentage of the lower of the original purchase price or the net asset value at redemption) | | 1.00% on sales of $1 million or more made within 12 months of purchase | | 1.00% on sales made within 12 months of purchase | | None | | None | | None | | None | | None |
| | | | | | | | |
| Annual distribution or distribution and service (12b-1) fees (shown as a percentage of average daily net assets) | | 0.30% (0.25% currently) | | 1.00% | | 0.75% (0.50% currently) | | None | | 0.25% | | None | | None |
| | | | | | | | |
| Shareholder services fees | | None | | None | | None | | None | | 0.10%* | | 0.10%* | | None |
*Shareholder service fee reflects maximum allowable fees under a shareholder services plan.
Benchmark Definition
MSCI All Country World ex-US Index—The Morgan Stanley Capital International All Country World ex-US Index (MSCI ACWI ex-US Index) is an unmanaged, free float-adjusted, market capitalization-weighted index that is designed to provide a broad measure of stock performance throughout the world, with the exception of US-based companies. The Index includes both developed and emerging markets.
Investors cannot invest directly in an index. The returns for the Index would be lower if they included the effects of sales charges, operating expenses of a mutual fund, or taxes that may be paid by an investor.
| | |
| 6 | | Visit our website at pgim.com/investments |
Presentation of Fund Holdings as of 10/31/22
| | | | | | |
| | | |
| Ten Largest Holdings | | Line of Business | | Country | | % of Net Assets |
| | | |
LVMH Moet Hennessy Louis Vuitton SE | | Textiles, Apparel & Luxury Goods | | France | | 5.3% |
| | | |
| Novo Nordisk A/S (Class B Stock) | | Pharmaceuticals | | Denmark | | 5.1% |
| | | |
| Ferrari NV | | Automobiles | | Italy | | 4.5% |
| | | |
| Hermes International | | Textiles, Apparel & Luxury Goods | | France | | 4.4% |
| | | |
| Sartorius AG (PRFC) | | Life Sciences Tools & Services | | Germany | | 3.8% |
| | | |
| Pernod Ricard SA | | Beverages | | France | | 3.8% |
| | | |
| Dassault Systemes SE | | Software | | France | | 3.8% |
| | | |
| L’Oreal SA | | Personal Products | | France | | 3.6% |
| | | |
| MercadoLibre, Inc. | | Internet & Direct Marketing Retail | | Brazil | | 3.6% |
| | | |
| Compass Group plc | | Hotels, Restaurants & Leisure | | United Kingdom | | 3.5% |
Holdings reflect only long-term investments and are subject to change.
| | | | |
PGIM Jennison International Opportunities Fund | | | 7 | |
Strategy and Performance Overview*
(unaudited)
How did the Fund perform?
The PGIM Jennison International Opportunities Fund’s Class Z shares returned –42.63% in the 12-month reporting period that ended October 31, 2022, underperforming the –24.73% return of the MSCI All Country ex-US Index (the Index).
What were the market conditions?
| ● | During the reporting period, the investment backdrop changed from one of stimulus and spending to one of inflation and tightening financial conditions, with the need to control inflation moving aggressively to the fore. |
| ● | The investment environment at the start of 2022 was clouded by continued uncertainties related to the COVID-19 pandemic, inflation, and the prospect of slowing growth on the back of central banks’ plans for policy tightening. The brutal military conflict in Ukraine added a dangerous new dimension of uncertainty in late February. Commodity prices rose sharply, led by crude oil, as the sanctions imposed on Russia by the US and European Union made it difficult for the world’s largest oil exporter to complete transactions. |
| ● | As the year progressed, stock prices continued to suffer from the impacts of the war in Ukraine, unexpectedly high inflation, aggressive monetary tightening, and declining growth prospects around the globe. |
| ● | Within the Index, only the energy sector generated positive returns, up nearly 29% for the period. Despite producing negative performance, utilities, healthcare, and consumer staples outperformed all other sectors in the Index. The largest declines came from the communication services, consumer discretionary, and information technology sectors. |
What worked?
| ● | Despite a challenging investment environment, especially for growth stocks, a number of holdings generated solid gains. |
| ● | Shares of Argenx SE continued to rise on the strength of approval by the US Food and Drug Administration (the FDA) of Vyvgart, the company’s treatment for myasthenia gravis, an autoimmune disease, and its first drug to receive FDA approval. In Jennison’s view, Argenx has a solid management team, a smart business and commercialization strategy, and a compelling research and development engine to continue to build out its pipeline. |
| ● | Shares in HDFC Bank Ltd., India’s second-largest private-sector bank in terms of assets, benefited from solid quarterly results, with a pickup in loan and deposit growth, and stable net interest margins. HDFC offers a wide range of corporate and retail banking services, and appears well positioned for strong growth in its consumer franchise. |
| ● | The Fund participated in the Dr. Ing. h.c. F. Porsche AG initial public offering and continues to hold the position. The investment represents an opportunity to |
| | |
| 8 | | Visit our website at pgim.com/investments |
| | participate in the long-term growth of a well-managed, high-end automobile maker with high margins, pricing power, and extreme customer loyalty, that is transforming itself into an electric vehicle company. |
| ● | Shares in pharmaceutical company Novo Nordisk A/S benefited from the company’s strong top-line earnings growth in both diabetes treatment and obesity care. Jennison continues to view the company as a highly durable growth story, anchored by its best-in-class/first-in-class portfolio in diabetes and obesity, with potential to further penetrate other cardiometabolic diseases—all very large, total addressable markets. |
| ● | Brunello Cucinelli S.p.A. posted strong results as its position as a top-tier, luxury brand continued to insulate the company from weakening European consumption trends. |
What didn’t work?
| ● | In information technology, shares of payments platform company Adyen N.V. declined, despite impressive transaction volumes, due to higher expenses as the company stepped up investments to sustain its long-term growth and attract additional merchants onto its platform. Shares in semiconductor equipment maker ASML Holding N.V. lost ground as the company faced supply-chain constraints; however, new orders reached historical highs, demonstrating strong demand for ASML’s products. Shares of Atlassian Corp. slid lower despite the company’s strong quarterly results, with encouraging revenue and margin guidance. Atlassian’s cloud migration and data center businesses continue to drive the company’s growth. |
| ● | In communication services, shares of Sea Ltd. were hurt by a slowdown in the company’s gaming business and decelerating e-commerce growth. The Fund’s position was eliminated prior to the end of the reporting period. |
| ● | In industrials, shares of equipment maker Techtronic Industries Company Ltd. declined due to the company’s slowing growth, as well as mounting evidence of rising inventory levels. Jennison eliminated this position as well prior to the end of the reporting period. |
Current outlook
| ● | As of the end of the reporting period, the Fed’s inflation flight has been joined by central banks around the world. Tighter domestic liquidity in many economies and the pain caused by the US dollar’s surge further cloud the global outlook. |
| ● | Growth appears poised to decelerate across Europe heading into a winter that will likely feature industrial shutdowns, fuel rationing, and lowered thermostats to offset the loss of Russian gas. Russia’s move to formally annex Eastern Ukrainian territory leaves seemingly little room for a resolution of the conflict in the near term and continues to depress sentiment. China is still coming to terms with the impacts of its “zero-COVID” policy, and more lockdowns cannot be ruled out as a result. |
| ● | Share price declines in the period reflected a combination of increased risk aversion and lower price/earnings ratios in the face of higher interest rates. The presumption of slowing growth and possible recession are now challenging revenue estimates and |
| | | | |
PGIM Jennison International Opportunities Fund | | | 9 | |
Strategy and Performance Overview* (continued)
| |
profit margin assumptions. Jennison’s continued focus on the fundamental growth prospects for the Fund’s holdings requires an understanding of the difficulties and uncertainty created by the macroeconomic environment. |
| ● | Most economic slowdowns and recessions in the modern era occurred under circumstances different from those confronting investors today. But the aftermaths of previous economic downturns have generally seen large-cap growth companies generating fundamental outperformance driven by innovation, leadership in large and growing addressable markets, and financial stability. Jennison sees much to be optimistic about from this perspective and in the context of the Fund’s multi-year investment horizon. |
*This strategy and performance overview, which discusses what strategies or holdings (including derivatives, if applicable) affected the Fund’s performance, is compiled based on how the Fund performed relative to the Fund’s benchmark index and is viewed for performance attribution purposes at the aggregate Fund level, which in most instances will not directly correlate to the amounts disclosed in the Statement of Operations which conform to US generally accepted accounting principles.
| | |
| 10 | | Visit our website at pgim.com/investments |
Fees and Expenses (unaudited)
As a shareholder of the Fund, you incur two types of costs: (1) transaction costs, including sales charges (loads) on purchase payments and redemptions, as applicable, and (2) ongoing costs, including management fees, distribution and/or service (12b-1) fees, and other Fund expenses, as applicable. This example is intended to help you understand your ongoing costs (in dollars) of investing in the Fund and to compare these costs with the ongoing costs of investing in other mutual funds.
The example is based on an investment of $1,000 held through the six-month period ended October 31, 2022. The example is for illustrative purposes only; you should consult the Prospectus for information on initial and subsequent minimum investment requirements.
Actual Expenses
The first line for each share class in the table on the following page provides information about actual account values and actual expenses. You may use the information on this line, together with the amount you invested, to estimate the expenses that you paid over the period. Simply divide your account value by $1,000 (for example, an $8,600 account value ÷ $1,000 = 8.6), then multiply the result by the number on the first line under the heading “Expenses Paid During the Six-Month Period” to estimate the expenses you paid on your account during this period.
Hypothetical Example for Comparison Purposes
The second line for each share class in the table on the following page provides information about hypothetical account values and hypothetical expenses based on the Fund’s actual expense ratio and an assumed rate of return of 5% per year before expenses, which is not the Fund’s actual return. The hypothetical account values and expenses may not be used to estimate the actual ending account balance or expenses you paid for the period. You may use this information to compare the ongoing costs of investing in the Fund and other funds. To do so, compare this 5% hypothetical example with the 5% hypothetical examples that appear in the shareholder reports of the other funds.
The Fund’s transfer agent may charge additional fees to holders of certain accounts that are not included in the expenses shown in the table on the following page. These fees apply to individual retirement accounts (IRAs) and Section 403(b) accounts. As of the close of the six-month period covered by the table, IRA fees included an annual maintenance fee of $15 per account (subject to a maximum annual maintenance fee of $25 for all accounts held by the same shareholder). Section 403(b) accounts are charged an annual $25 fiduciary maintenance fee. Some of the fees may vary in amount, or may be waived, based on your total account balance or the number of PGIM funds, including the Fund, that you own. You should consider the additional fees that were charged to your Fund account over the six-month period when you estimate the total ongoing expenses paid over the period and the impact of these fees on your ending account value, as these additional expenses are not reflected in the information
| | | | |
PGIM Jennison International Opportunities Fund | | | 11 | |
Fees and Expenses (continued)
provided in the expense table. Additional fees have the effect of reducing investment returns.
Please note that the expenses shown in the table are meant to highlight your ongoing costs only and do not reflect any transactional costs such as sales charges (loads). Therefore, the second line for each share class in the table is useful in comparing ongoing costs only and will not help you determine the relative total costs of owning different funds. In addition, if these transactional costs were included, your costs would have been higher.
| | | | | | | | | | |
| | | | |
PGIM Jennison International Opportunities Fund | | Beginning
Account Value
May 1, 2022 | | Ending
Account Value
October 31, 2022 | | Annualized
Expense
Ratio Based on
the
Six-Month Period | | Expenses Paid
During the
Six-Month Period* |
| | | | | |
| Class A | | Actual | | $1,000.00 | | $ 862.90 | | 1.10% | | $5.17 |
| | | | | |
| | Hypothetical | | $1,000.00 | | $1,019.66 | | 1.10% | | $5.60 |
| | | | | |
| Class C | | Actual | | $1,000.00 | | $ 859.60 | | 1.91% | | $8.95 |
| | | | | |
| | Hypothetical | | $1,000.00 | | $1,015.58 | | 1.91% | | $9.70 |
| | | | | |
| Class R | | Actual | | $1,000.00 | | $ 861.70 | | 1.46% | | $6.85 |
| | | | | |
| | Hypothetical | | $1,000.00 | | $1,017.85 | | 1.46% | | $7.43 |
| | | | | |
| Class Z | | Actual | | $1,000.00 | | $ 863.80 | | 0.91% | | $4.27 |
| | | | | |
| | Hypothetical | | $1,000.00 | | $1,020.62 | | 0.91% | | $4.63 |
| | | | | |
| Class R2 | | Actual | | $1,000.00 | | $ 861.90 | | 1.35% | | $6.34 |
| | | | | |
| | Hypothetical | | $1,000.00 | | $1,018.40 | | 1.35% | | $6.87 |
| | | | | |
| Class R4 | | Actual | | $1,000.00 | | $ 863.10 | | 1.10% | | $5.17 |
| | | | | |
| | Hypothetical | | $1,000.00 | | $1,019.66 | | 1.10% | | $5.60 |
| | | | | |
| Class R6 | | Actual | | $1,000.00 | | $ 864.10 | | 0.85% | | $3.99 |
| | | | | |
| | | Hypothetical | | $1,000.00 | | $1,020.92 | | 0.85% | | $4.33 |
*Fund expenses (net of fee waivers or subsidies, if any) for each share class are equal to the annualized expense ratio for each share class (provided in the table), multiplied by the average account value over the period, multiplied by the 184 days in the six-month period ended October 31, 2022, and divided by the 365 days in the Fund’s fiscal year ended October 31, 2022 (to reflect the six-month period). Expenses presented in the table include the expenses of any underlying portfolios in which the Fund may invest.
| | |
| 12 | | Visit our website at pgim.com/investments |
Schedule of Investments
as of October 31, 2022
| | | | | | | | |
| | |
| Description | | Shares | | | Value | |
| | |
| LONG-TERM INVESTMENTS 93.4% | | | | | | |
| | |
| COMMON STOCKS 89.0% | | | | | | |
| | |
| Brazil 5.7% | | | | | | |
MercadoLibre, Inc.* | | | 146,809 | | | $ | 132,365,931 | |
NU Holdings Ltd. (Class A Stock)*(a) | | | 15,257,438 | | | | 76,287,190 | |
| | | | | | | | |
| | |
| | | | | | | 208,653,121 | |
| | |
| Denmark 5.1% | | | | | | |
Novo Nordisk A/S (Class B Stock) | | | 1,712,788 | | | | 186,233,598 | |
| | |
| France 23.0% | | | | | | |
Dassault Systemes SE | | | 4,145,495 | | | | 138,951,925 | |
Hermes International | | | 124,928 | | | | 161,705,048 | |
L’Oreal SA | | | 423,825 | | | | 133,082,911 | |
LVMH Moet Hennessy Louis Vuitton SE | | | 309,393 | | | | 195,225,402 | |
Pernod Ricard SA | | | 792,049 | | | | 139,013,545 | |
Remy Cointreau SA | | | 467,412 | | | | 71,485,030 | |
| | | | | | | | |
| | |
| | | | | | | 839,463,861 | |
| | |
| Germany 2.3% | | | | | | |
Symrise AG | | | 828,071 | | | | 84,523,326 | |
| | |
| India 5.3% | | | | | | |
HDFC Bank Ltd., ADR(a) | | | 1,917,899 | | | | 119,504,286 | |
ICICI Bank Ltd., ADR(a) | | | 3,372,370 | | | | 74,327,035 | |
| | | | | | | | |
| | |
| | | | | | | 193,831,321 | |
| | |
| Indonesia 2.0% | | | | | | |
Bank Central Asia Tbk PT | | | 127,337,407 | | | | 71,980,975 | |
| | |
| Italy 6.8% | | | | | | |
Brunello Cucinelli SpA | | | 1,459,288 | | | | 84,588,966 | |
Ferrari NV | | | 836,017 | | | | 164,811,142 | |
| | | | | | | | |
| | |
| | | | | | | 249,400,108 | |
| | |
| Japan 3.5% | | | | | | |
GMO Payment Gateway, Inc. | | | 200,025 | | | | 14,382,965 | |
Keyence Corp. | | | 262,324 | | | | 98,913,279 | |
Menicon Co. Ltd. | | | 963,399 | | | | 16,449,034 | |
| | | | | | | | |
| | |
| | | | | | | 129,745,278 | |
See Notes to Financial Statements.
| | | | |
PGIM Jennison International Opportunities Fund | | | 13 | |
Schedule of Investments (continued)
as of October 31, 2022
| | | | | | | | |
| | |
| Description | | Shares | | | Value | |
| | |
| COMMON STOCKS (Continued) | | | | | | |
| | |
| Netherlands 8.4% | | | | | | |
Adyen NV, 144A* | | | 62,430 | | | $ | 89,125,036 | |
Argenx SE, ADR* | | | 307,958 | | | | 119,466,147 | |
ASML Holding NV | | | 207,264 | | | | 97,224,881 | |
| | | | | | | | |
| | |
| | | | | | | 305,816,064 | |
| | |
| South Korea 2.4% | | | | | | |
Coupang, Inc.* | | | 3,778,902 | | | | 65,261,638 | |
Samsung SDI Co. Ltd. | | | 45,217 | | | | 23,328,145 | |
| | | | | | | | |
| | |
| | | | | | | 88,589,783 | |
| | |
| Switzerland 5.0% | | | | | | |
Alcon, Inc. | | | 912,961 | | | | 55,585,989 | |
Cie Financiere Richemont SA (Class A Stock) | | | 818,072 | | | | 79,953,086 | |
Lonza Group AG | | | 92,598 | | | | 47,667,988 | |
| | | | | | | | |
| | |
| | | | | | | 183,207,063 | |
| | |
| United Kingdom 9.8% | | | | | | |
Ashtead Group PLC | | | 2,177,793 | | | | 113,447,943 | |
AstraZeneca PLC | | | 981,136 | | | | 115,118,837 | |
Compass Group PLC | | | 6,144,559 | | | | 129,415,633 | |
| | | | | | | | |
| | |
| | | | | | | 357,982,413 | |
| | |
| United States 8.7% | | | | | | |
Atlassian Corp. (Class A Stock)* | | | 459,438 | | | | 93,141,866 | |
CyberArk Software Ltd.*(a) | | | 476,193 | | | | 74,719,444 | |
ICON PLC*(a) | | | 189,553 | | | | 37,501,165 | |
Lululemon Athletica, Inc.* | | | 339,786 | | | | 111,803,185 | |
| | | | | | | | |
| | |
| | | | | | | 317,165,660 | |
| | |
| Uruguay 1.0% | | | | | | |
Dlocal Ltd.* | | | 1,725,532 | | | | 38,479,364 | |
| | | | | | | | |
| | |
TOTAL COMMON STOCKS
(cost $3,381,664,260) | | | | | | | 3,255,071,935 | |
| | | | | | | | |
| | |
| PREFERRED STOCKS 4.4% | | | | | | |
| | |
| Germany | | | | | | |
Dr. Ing. h.c. F. Porsche AG (PRFC)* | | | 221,263 | | | | 22,631,637 | |
See Notes to Financial Statements.
| | | | | | | | |
| | |
| Description | | Shares | | | Value | |
| | |
| PREFERRED STOCKS (Continued) | | | | | | |
| | |
| Germany (cont’d.) | | | | | | |
Sartorius AG (PRFC) | | | 395,076 | | | $ | 139,300,053 | |
| | | | | | | | |
| | |
TOTAL PREFERRED STOCKS
(cost $148,076,108) | | | | | | | 161,931,690 | |
| | | | | | | | |
| | |
TOTAL LONG-TERM INVESTMENTS
(cost $3,529,740,368) | | | | | | | 3,417,003,625 | |
| | | | | | | | |
| | |
| SHORT-TERM INVESTMENTS 11.5% | | | | | | |
| | |
| AFFILIATED MUTUAL FUND 4.1% | | | | | | |
PGIM Institutional Money Market Fund
(cost $150,008,989; includes $149,660,772 of cash collateral for securities on loan)(b)(wa) | | | 150,155,477 | | | | 150,020,337 | |
| | | | | | | | |
| | |
| UNAFFILIATED FUND 7.4% | | | | | | |
Dreyfus Government Cash Management (Institutional Shares)
(cost $269,352,144) | | | 269,352,144 | | | | 269,352,144 | |
| | | | | | | | |
| | |
TOTAL SHORT-TERM INVESTMENTS
(cost $419,361,133) | | | | | | | 419,372,481 | |
| | | | | | | | |
| | |
TOTAL INVESTMENTS 104.9%
(cost $3,949,101,501) | | | | | | | 3,836,376,106 | |
Liabilities in excess of other assets (4.9)% | | | | | | | (180,116,516 | ) |
| | | | | | | | |
| | |
NET ASSETS 100.0% | | | | | | $ | 3,656,259,590 | |
| | | | | | | | |
Below is a list of the abbreviation(s) used in the annual report:
144A—Security was purchased pursuant to Rule 144A under the Securities Act of 1933 and, pursuant to the requirements of Rule 144A, may not be resold except to qualified institutional buyers.
ADR—American Depositary Receipt
LIBOR—London Interbank Offered Rate
PRFC—Preference Shares
SOFR—Secured Overnight Financing Rate
| * | Non-income producing security. |
| (a) | All or a portion of security is on loan. The aggregate market value of such securities, including those sold and pending settlement, is $149,579,912; cash collateral of $149,660,772 (included in liabilities) was received with which the Fund purchased highly liquid short-term investments. In the event of significant appreciation in value of securities on loan on the last business day of the reporting period, the Fund may reflect a collateral value that is less than the market value of the loaned securities and such shortfall is remedied the following business day. |
| (b) | Represents security, or portion thereof, purchased with cash collateral received for securities on loan and includes dividend reinvestment. |
| (wa) | PGIM Investments LLC, the manager of the Fund, also serves as manager of the PGIM Core Ultra Short Bond Fund and PGIM Institutional Money Market Fund, if applicable. |
See Notes to Financial Statements.
| | | | |
PGIM Jennison International Opportunities Fund | | | 15 | |
Schedule of Investments (continued)
as of October 31, 2022
Fair Value Measurements:
Various inputs are used in determining the value of the Fund’s investments. These inputs are summarized in the three broad levels listed below.
Level 1—unadjusted quoted prices generally in active markets for identical securities.
Level 2—quoted prices for similar securities, interest rates and yield curves, prepayment speeds, foreign currency exchange rates and other observable inputs.
Level 3—unobservable inputs for securities valued in accordance with Board approved fair valuation procedures.
The following is a summary of the inputs used as of October 31, 2022 in valuing such portfolio securities:
| | | | | | | | | | | | |
| | | Level 1 | | | Level 2 | | | Level 3 | |
| Investments in Securities | | | | | | | | | |
| Assets | | | | | | | | | |
| Long-Term Investments | | | | | | | | | |
| Common Stocks | | | | | | | | | |
Brazil | | $ | 208,653,121 | | | $ | — | | | $ | — | |
Denmark | | | — | | | | 186,233,598 | | | | — | |
France | | | — | | | | 839,463,861 | | | | — | |
Germany | | | — | | | | 84,523,326 | | | | — | |
India | | | 193,831,321 | | | | — | | | | — | |
Indonesia | | | — | | | | 71,980,975 | | | | — | |
Italy | | | — | | | | 249,400,108 | | | | — | |
Japan | | | — | | | | 129,745,278 | | | | — | |
Netherlands | | | 119,466,147 | | | | 186,349,917 | | | | — | |
South Korea | | | 65,261,638 | | | | 23,328,145 | | | | — | |
Switzerland | | | — | | | | 183,207,063 | | | | — | |
United Kingdom | | | — | | | | 357,982,413 | | | | — | |
United States | | | 317,165,660 | | | | — | | | | — | |
Uruguay | | | 38,479,364 | | | | — | | | | — | |
| Preferred Stocks | | | | | | | | | |
Germany | | | 22,631,637 | | | | 139,300,053 | | | | — | |
| Short-Term Investments | | | | | | | | | |
Affiliated Mutual Fund | | | 150,020,337 | | | | — | | | | — | |
Unaffiliated Fund | | | 269,352,144 | | | | — | | | | — | |
| | | | | | | | | | | | |
Total | | $ | 1,384,861,369 | | | $ | 2,451,514,737 | | | $ | — | |
| | | | | | | | | | | | |
See Notes to Financial Statements.
Industry Classification:
The industry classification of investments and liabilities in excess of other assets shown as a percentage of net assets as of October 31, 2022 were as follows:
| | | | |
Textiles, Apparel & Luxury Goods | | | 17.3 | % |
Banks | | | 9.4 | |
Software | | | 8.4 | |
Pharmaceuticals | | | 8.3 | |
Unaffiliated Fund | | | 7.4 | |
Life Sciences Tools & Services | | | 6.1 | |
Beverages | | | 5.8 | |
Internet & Direct Marketing Retail | | | 5.4 | |
Automobiles | | | 5.1 | |
Affiliated Mutual Fund (4.1% represents investments purchased with collateral from securities on loan) | | | 4.1 | |
IT Services | | | 3.8 | |
Personal Products | | | 3.7 | |
| | | | |
Hotels, Restaurants & Leisure | | | 3.5 | % |
Electronic Equipment, Instruments & Components | | | 3.3 | |
Biotechnology | | | 3.3 | |
Trading Companies & Distributors | | | 3.1 | |
Semiconductors & Semiconductor Equipment | | | 2.7 | |
Chemicals | | | 2.3 | |
Health Care Equipment & Supplies | | | 1.9 | |
| | | | |
| | | 104.9 | |
Liabilities in excess of other assets | | | (4.9 | ) |
| | | | |
| | | 100.0 | % |
| | | | |
Financial Instruments/Transactions—Summary of Offsetting and Netting Arrangements:
The Fund entered into financial instruments/transactions during the reporting period that are either offset in accordance with current requirements or are subject to enforceable master netting arrangements or similar agreements that permit offsetting. The information about offsetting and related netting arrangements for financial instruments/transactions where the legal right to set-off exists is presented in the summary below.
Offsetting of financial instrument/transaction assets and liabilities:
| | | | | | |
| Description | | Gross Market
Value of
Recognized
Assets/(Liabilities) | | Collateral
Pledged/(Received)(1) | | Net
Amount |
| | | |
| Securities on Loan | | $149,579,912 | | $(149,579,912) | | $— |
| (1) | Collateral amount disclosed by the Fund is limited to the market value of financial instruments/transactions. |
See Notes to Financial Statements.
| | | | |
PGIM Jennison International Opportunities Fund | | | 17 | |
Statement of Assets & Liabilities
as of October 31, 2022
| | | | |
Assets | | | | |
Investments at value, including securities on loan of $149,579,912: | | | | |
Unaffiliated investments (cost $3,799,092,512) | | $ | 3,686,355,769 | |
Affiliated investments (cost $150,008,989) | | | 150,020,337 | |
Foreign currency, at value (cost $43,228) | | | 43,110 | |
Receivable for Fund shares sold | | | 13,390,338 | |
Receivable for investments sold | | | 8,697,102 | |
Tax reclaim receivable | | | 3,941,780 | |
Dividends receivable | | | 935,607 | |
Prepaid expenses | | | 26,928 | |
| | | | |
Total Assets | | | 3,863,410,971 | |
| | | | |
| |
| Liabilities | | | |
Payable to broker for collateral for securities on loan | | | 149,660,772 | |
Payable for investments purchased | | | 40,341,159 | |
Payable for Fund shares purchased | | | 13,400,820 | |
Management fee payable | | | 2,370,753 | |
Accrued expenses and other liabilities | | | 1,221,665 | |
Distribution fee payable | | | 140,288 | |
Affiliated transfer agent fee payable | | | 11,474 | |
Directors’ fees payable | | | 4,450 | |
| | | | |
Total Liabilities | | | 207,151,381 | |
| | | | |
| |
Net Assets | | $ | 3,656,259,590 | |
| | | | |
| |
| | | | | |
Net assets were comprised of: | | | | |
Common stock, at par | | $ | 1,633 | |
Paid-in capital in excess of par | | | 4,809,061,459 | |
Total distributable earnings (loss) | | | (1,152,803,502 | ) |
| | | | |
Net assets, October 31, 2022 | | $ | 3,656,259,590 | |
| | | | |
See Notes to Financial Statements.
| | | | |
Class A | | | | |
Net asset value and redemption price per share,
($105,135,112 ÷ 4,772,699 shares of common stock issued and outstanding) | | $ | 22.03 | |
Maximum sales charge (5.50% of offering price) | | | 1.28 | |
| | | | |
Maximum offering price to public | | $ | 23.31 | |
| | | | |
| |
| Class C | | | |
Net asset value, offering price and redemption price per share,
($22,980,722 ÷ 1,131,033 shares of common stock issued and outstanding) | | $ | 20.32 | |
| | | | |
| |
| Class R | | | |
Net asset value, offering price and redemption price per share,
($230,246,249 ÷ 10,588,053 shares of common stock issued and outstanding) | | $ | 21.75 | |
| | | | |
| |
| Class Z | | | |
Net asset value, offering price and redemption price per share,
($1,948,250,355 ÷ 86,794,261 shares of common stock issued and outstanding) | | $ | 22.45 | |
| | | | |
| |
| Class R2 | | | |
Net asset value, offering price and redemption price per share,
($10,579,143 ÷ 478,916 shares of common stock issued and outstanding) | | $ | 22.09 | |
| | | | |
| |
| Class R4 | | | |
Net asset value, offering price and redemption price per share,
($8,646,364 ÷ 387,538 shares of common stock issued and outstanding) | | $ | 22.31 | |
| | | | |
| |
| Class R6 | | | |
Net asset value, offering price and redemption price per share,
($1,330,421,645 ÷ 59,130,499 shares of common stock issued and outstanding) | | $ | 22.50 | |
| | | | |
See Notes to Financial Statements.
| | | | |
PGIM Jennison International Opportunities Fund | | | 19 | |
Statement of Operations
Year Ended October 31, 2022
| | | | |
Net Investment Income (Loss) | | | | |
Income | | | | |
Unaffiliated dividend income (net of $5,421,714 foreign withholding tax) | | $ | 35,611,724 | |
Income from securities lending, net (including affiliated income of $236,497) | | | 1,644,314 | |
Affiliated dividend income | | | 29,833 | |
| | | | |
Total income | | | 37,285,871 | |
| | | | |
| |
Expenses | | | | |
Management fee | | | 39,488,955 | |
Distribution fee(a) | | | 2,811,906 | |
Shareholder servicing fees (including affiliated expense of $6,038)(a) | | | 22,717 | |
Transfer agent’s fees and expenses (including affiliated expense of $235,351)(a) | | | 3,933,683 | |
Custodian and accounting fees | | | 501,428 | |
Registration fees(a) | | | 452,023 | |
Shareholders’ reports | | | 409,980 | |
Directors’ fees | | | 72,537 | |
Legal fees and expenses | | | 47,659 | |
SEC registration fees | | | 42,674 | |
Audit fee | | | 27,000 | |
Miscellaneous | | | 104,228 | |
| | | | |
Total expenses | | | 47,914,790 | |
Less: Fee waiver and/or expense reimbursement(a) | | | (1,857,365 | ) |
Distribution fee waiver(a) | | | (749,759 | ) |
| | | | |
Net expenses | | | 45,307,666 | |
| | | | |
Net investment income (loss) | | | (8,021,795 | ) |
| | | | |
| |
| Realized And Unrealized Gain (Loss) On Investment And Foreign Currency Transactions | | | |
Net realized gain (loss) on: | | | | |
Investment transactions (including affiliated of $(61,481)) | | | (1,018,942,756 | ) |
Foreign currency transactions | | | (1,129,000 | ) |
| | | | |
| | | (1,020,071,756 | ) |
| | | | |
Net change in unrealized appreciation (depreciation) on: | | | | |
Investments (including affiliated of $11,114) | | | (1,947,747,831 | ) |
Foreign currencies | | | (377,082 | ) |
| | | | |
| | | (1,948,124,913 | ) |
| | | | |
Net gain (loss) on investment and foreign currency transactions | | | (2,968,196,669 | ) |
| | | | |
Net Increase (Decrease) In Net Assets Resulting From Operations | | $ | (2,976,218,464 | ) |
| | | | |
See Notes to Financial Statements.
| (a) | Class specific expenses and waivers were as follows: |
| | | | | | | | | | | | | | | | | | | | | | | | | | | | |
| | | Class A | | | Class C | | | Class R | | | Class Z | | | Class R2 | | | Class R4 | | | Class R6 | |
Distribution fee | | | 451,896 | | | | 307,799 | | | | 2,023,329 | | | | — | | | | 28,882 | | | | — | | | | — | |
Shareholder servicing fees | | | — | | | | — | | | | — | | | | — | | | | 11,553 | | | | 11,164 | | | | — | |
Transfer agent’s fees and expenses | | | 173,894 | | | | 33,246 | | | | 361,441 | | | | 3,283,177 | | | | 19,722 | | | | 18,013 | | | | 44,190 | |
Registration fees | | | 36,177 | | | | 21,587 | | | | 6,373 | | | | 261,798 | | | | 7,183 | | | | 7,234 | | | | 111,671 | |
Fee waiver and/or expense reimbursement | | | (194,414 | ) | | | (33,174 | ) | | | — | | | | (1,614,036 | ) | | | (8,415 | ) | | | (7,326 | ) | | | — | |
Distribution fee waiver | | | (75,316 | ) | | | — | | | | (674,443 | ) | | | — | | | | — | | | | — | | | | — | |
See Notes to Financial Statements.
| | | | |
PGIM Jennison International Opportunities Fund | | | 21 | |
Statements of Changes in Net Assets
| | | | | | | | |
| |
| | | Year Ended
October 31, | |
| | |
| | | 2022 | | | 2021 | |
| | |
Increase (Decrease) in Net Assets | | | | | | | | |
Operations | | | | | | | | |
Net investment income (loss) | | $ | (8,021,795 | ) | | $ | (24,566,284 | ) |
Net realized gain (loss) on investment and foreign currency transactions | | | (1,020,071,756 | ) | | | 18,155,566 | |
Net change in unrealized appreciation (depreciation) on investments and foreign currencies | | | (1,948,124,913 | ) | | | 1,213,359,467 | |
| | | | | | | | |
Net increase (decrease) in net assets resulting from operations | | | (2,976,218,464 | ) | | | 1,206,948,749 | |
| | | | | | | | |
| | |
Dividends and Distributions | | | | | | | | |
Distributions from distributable earnings | | | | | | | | |
Class A | | | (181,181 | ) | | | — | |
Class C | | | (38,113 | ) | | | — | |
Class R | | | (296,402 | ) | | | — | |
Class Z | | | (3,142,102 | ) | | | — | |
Class R2 | | | (11,816 | ) | | | — | |
Class R4 | | | (12,841 | ) | | | — | |
Class R6 | | | (1,853,539 | ) | | | — | |
| | | | | | | | |
| | | (5,535,994 | ) | | | — | |
| | | | | | | | |
Tax return of capital distributions | | | | | | | | |
Class A | | | (2,270 | ) | | | — | |
Class C | | | (478 | ) | | | — | |
Class R | | | (3,713 | ) | | | — | |
Class Z | | | (39,364 | ) | | | — | |
Class R2 | | | (148 | ) | | | — | |
Class R4 | | | (161 | ) | | | — | |
Class R6 | | | (23,221 | ) | | | — | |
| | | | | | | | |
| | | (69,355 | ) | | | — | |
| | | | | | | | |
| | |
Fund share transactions (Net of share conversions) | | | | | | | | |
Net proceeds from shares sold | | | 3,237,458,222 | | | | 3,741,129,832 | |
Net asset value of shares issued in reinvestment of dividends and distributions | | | 5,596,238 | | | | — | |
Cost of shares purchased | | | (2,859,687,305 | ) | | | (1,121,686,711 | ) |
| | | | | | | | |
Net increase (decrease) in net assets from Fund share transactions | | | 383,367,155 | | | | 2,619,443,121 | |
| | | | | | | | |
Total increase (decrease) | | | (2,598,456,658 | ) | | | 3,826,391,870 | |
| | |
| Net Assets: | | | | | | |
Beginning of year | | | 6,254,716,248 | | | | 2,428,324,378 | |
| | | | | | | | |
End of year | | $ | 3,656,259,590 | | | $ | 6,254,716,248 | |
| | | | | | | | |
See Notes to Financial Statements.
Financial Highlights
| | | | | | | | | | | | | | | | | | | | |
| Class A Shares | |
| | | Year Ended October 31, | |
| | | 2022 | | | 2021 | | | 2020 | | | 2019 | | | 2018 | |
| | | | | | |
| Per Share Operating Performance(a): | | | | | | | | | | | | | | | | | | | | |
| Net Asset Value, Beginning of Year | | | $38.51 | | | | $28.14 | | | | $19.51 | | | | $15.82 | | | | $17.10 | |
| Income (loss) from investment operations: | | | | | | | | | | | | | | | | | | | | |
| Net investment income (loss) | | | (0.09 | ) | | | (0.25 | ) | | | (0.12 | ) | | | 0.01 | | | | (0.06 | ) |
| Net realized and unrealized gain (loss) on investment and foreign currency transactions | | | (16.36 | ) | | | 10.62 | | | | 8.75 | | | | 3.68 | | | | (1.22 | ) |
| Total from investment operations | | | (16.45 | ) | | | 10.37 | | | | 8.63 | | | | 3.69 | | | | (1.28 | ) |
| Less Dividends and Distributions: | | | | | | | | | | | | | | | | | | | | |
| Tax return of capital distributions | | | (- | )(b) | | | - | | | | - | | | | - | | | | - | |
| Distributions from net realized gains | | | (0.03 | ) | | | - | | | | - | | | | - | | | | - | |
| Total dividends and distributions | | | (0.03 | ) | | | - | | | | - | | | | - | | | | - | |
| Net asset value, end of year | | | $22.03 | | | | $38.51 | | | | $28.14 | | | | $19.51 | | | | $15.82 | |
| Total Return(c): | | | (42.74 | )% | | | 36.90 | % | | | 44.11 | % | | | 23.39 | % | | | (7.49 | )% |
| | | | | | | | | | | | | | | | | | | | |
| Ratios/Supplemental Data: | |
| Net assets, end of year (000) | | | $105,135 | | | | $208,515 | | | | $76,093 | | | | $26,778 | | | | $14,496 | |
| Average net assets (000) | | | $150,632 | | | | $142,641 | | | | $46,059 | | | | $20,599 | | | | $10,393 | |
| Ratios to average net assets(d): | | | | | | | | | | | | | | | | | | | | |
| Expenses after waivers and/or expense reimbursement | | | 1.09 | % | | | 1.09 | % | | | 1.09 | % | | | 1.09 | % | | | 1.13 | % |
| Expenses before waivers and/or expense reimbursement | | | 1.27 | % | | | 1.27 | % | | | 1.34 | % | | | 1.46 | % | | | 1.55 | % |
| Net investment income (loss) | | | (0.34 | )% | | | (0.71 | )% | | | (0.52 | )% | | | 0.04 | % | | | (0.32 | )% |
| Portfolio turnover rate(e) | | | 76 | % | | | 41 | % | | | 43 | % | | | 53 | % | | | 59 | % |
| (a) | Calculated based on average shares outstanding during the year. |
| (b) | Amount rounds to zero. |
| (c) | Total return does not consider the effects of sales loads. Total return is calculated assuming a purchase of a share on the first day and a sale on the last day of each year reported and includes reinvestment of dividends and distributions, if any. Total returns may reflect adjustments to conform to GAAP. |
| (d) | Does not include expenses of the underlying funds in which the Fund invests. |
| (e) | The Fund’s portfolio turnover rate is calculated in accordance with regulatory requirements, without regard to transactions involving short-term investments, certain derivatives and in-kind transactions (if any). If such transactions were included, the Fund’s portfolio turnover rate may be higher. |
See Notes to Financial Statements.
| | | | |
PGIM Jennison International Opportunities Fund | | | 23 | |
Financial Highlights (continued)
| | | | | | | | | | | | | | | | | | | | |
| Class C Shares | |
| | | Year Ended October 31, | |
| | | 2022 | | | 2021 | | | 2020 | | | 2019 | | | 2018 | |
| | | | | | |
| Per Share Operating Performance(a): | | | | | | | | | | | | | | | | | | | | |
| Net Asset Value, Beginning of Year | | | $35.82 | | | | $26.38 | | | | $18.44 | | | | $15.08 | | | | $16.43 | |
| Income (loss) from investment operations: | | | | | | | | | | | | | | | | | | | | |
| Net investment income (loss) | | | (0.30 | ) | | | (0.50 | ) | | | (0.29 | ) | | | (0.13 | ) | | | (0.18 | ) |
| Net realized and unrealized gain (loss) on investment and foreign currency transactions | | | (15.17 | ) | | | 9.94 | | | | 8.23 | | | | 3.49 | | | | (1.17 | ) |
| Total from investment operations | | | (15.47 | ) | | | 9.44 | | | | 7.94 | | | | 3.36 | | | | (1.35 | ) |
| Less Dividends and Distributions: | | | | | | | | | | | | | | | | | | | | |
| Tax return of capital distributions | | | (- | )(b) | | | - | | | | - | | | | - | | | | - | |
| Distributions from net realized gains | | | (0.03 | ) | | | - | | | | - | | | | - | | | | - | |
| Total dividends and distributions | | | (0.03 | ) | | | - | | | | - | | | | - | | | | - | |
| Net asset value, end of year | | | $20.32 | | | | $35.82 | | | | $26.38 | | | | $18.44 | | | | $15.08 | |
| Total Return(c): | | | (43.22 | )% | | | 35.84 | % | | | 43.00 | % | | | 22.28 | % | | | (8.22 | )% |
| | | | | | | | | | | | | | | | | | | | |
| Ratios/Supplemental Data: | |
| Net assets, end of year (000) | | | $22,981 | | | | $40,128 | | | | $16,411 | | | | $5,302 | | | | $3,800 | |
| Average net assets (000) | | | $30,780 | | | | $28,884 | | | | $9,894 | | | | $4,683 | | | | $3,449 | |
| Ratios to average net assets(d): | | | | | | | | | | | | | | | | | | | | |
| Expenses after waivers and/or expense reimbursement | | | 1.90 | % | | | 1.90 | % | | | 1.90 | % | | | 1.91 | % | | | 1.92 | % |
| Expenses before waivers and/or expense reimbursement | | | 2.01 | % | | | 1.97 | % | | | 2.15 | % | | | 2.33 | % | | | 2.54 | % |
| Net investment income (loss) | | | (1.14 | )% | | | (1.52 | )% | | | (1.32 | )% | | | (0.80 | )% | | | (1.05 | )% |
| Portfolio turnover rate(e) | | | 76 | % | | | 41 | % | | | 43 | % | | | 53 | % | | | 59 | % |
| (a) | Calculated based on average shares outstanding during the year. |
| (b) | Amount rounds to zero. |
| (c) | Total return does not consider the effects of sales loads. Total return is calculated assuming a purchase of a share on the first day and a sale on the last day of each year reported and includes reinvestment of dividends and distributions, if any. Total returns may reflect adjustments to conform to GAAP. |
| (d) | Does not include expenses of the underlying funds in which the Fund invests. |
| (e) | The Fund’s portfolio turnover rate is calculated in accordance with regulatory requirements, without regard to transactions involving short-term investments, certain derivatives and in-kind transactions (if any). If such transactions were included, the Fund’s portfolio turnover rate may be higher. |
See Notes to Financial Statements.
| | | | | | | | | | | | | | | | | | | | | | | | | | | | |
| Class R Shares | |
| | | Year Ended October 31, | | | | | | November 20, 2017(a) through October 31, 2018 | |
| | | 2022 | | | 2021 | | | 2020 | | | 2019 | | | | |
| Per Share Operating Performance(b): | | | | | | | | | | | | | | | | | | | | | | | | | | | | |
| Net Asset Value, Beginning of Period | | | $38.17 | | | | $27.98 | | | | $19.48 | | | | $15.86 | | | | | | | | $17.62 | | | | | |
| Income (loss) from investment operations: | | | | | | | | | | | | | | | | | | | | | | | | | | | | |
| Net investment income (loss) | | | (0.19 | ) | | | (0.37 | ) | | | (0.20 | ) | | | (0.06 | ) | | | | | | | (0.09 | ) | | | | |
| Net realized and unrealized gain (loss) on investment and foreign currency transactions | | | (16.20 | ) | | | 10.56 | | | | 8.70 | | | | 3.68 | | | | | | | | (1.67 | ) | | | | |
| Total from investment operations | | | (16.39 | ) | | | 10.19 | | | | 8.50 | | | | 3.62 | | | | | | | | (1.76 | ) | | | | |
| Less Dividends and Distributions: | | | | | | | | | | | | | | | | | | | | | | | | | | | | |
| Tax return of capital distributions | | | (- | )(c) | | | - | | | | - | | | | - | | | | | | | | - | | | | | |
| Distributions from net realized gains | | | (0.03 | ) | | | - | | | | - | | | | - | | | | | | | | - | | | | | |
| Total dividends and distributions | | | (0.03 | ) | | | - | | | | - | | | | - | | | | | | | | - | | | | | |
| Net asset value, end of period | | | $21.75 | | | | $38.17 | | | | $27.98 | | | | $19.48 | | | | | | | | $15.86 | | | | | |
| Total Return(d): | | | (42.97 | )% | | | 36.42 | % | | | 43.56 | % | | | 22.89 | % | | | | | | | (9.99 | )% | | | | |
| | | | | | | | | | | | | | | | | | | | | | | | | | | | |
| Ratios/Supplemental Data: | |
| Net assets, end of period (000) | | | $230,246 | | | | $358,284 | | | | $291,162 | | | | $280,311 | | | | | | | | $266,294 | | | | | |
| Average net assets (000) | | | $269,777 | | | | $340,986 | | | | $281,238 | | | | $278,086 | | | | | | | | $299,955 | | | | | |
| Ratios to average net assets(e): | | | | | | | | | | | | | | | | | | | | | | | | | | | | |
| Expenses after waivers and/or expense reimbursement | | | 1.47 | % | | | 1.47 | % | | | 1.47 | % | | | 1.47 | % | | | | | | | 1.46 | %(f) | | | | |
| Expenses before waivers and/or expense reimbursement | | | 1.72 | % | | | 1.72 | % | | | 1.77 | % | | | 1.81 | % | | | | | | | 1.80 | %(f) | | | | |
| Net investment income (loss) | | | (0.70 | )% | | | (1.08 | )% | | | (0.87 | )% | | | (0.36 | )% | | | | | | | (0.53 | )%(f) | | | | |
| Portfolio turnover rate(g) | | | 76 | % | | | 41 | % | | | 43 | % | | | 53 | % | | | | | | | 59 | % | | | | |
| (a) | Commencement of offering. |
| (b) | Calculated based on average shares outstanding during the period. |
| (c) | Amount rounds to zero. |
| (d) | Total return is calculated assuming a purchase of a share on the first day and a sale on the last day of each period reported and includes reinvestment of dividends and distributions, if any. Total returns may reflect adjustments to conform to GAAP. Total returns for periods less than one full year are not annualized. |
| (e) | Does not include expenses of the underlying funds in which the Fund invests. |
| (g) | The Fund’s portfolio turnover rate is calculated in accordance with regulatory requirements, without regard to transactions involving short-term investments, certain derivatives and in-kind transactions (if any). If such transactions were included, the Fund’s portfolio turnover rate may be higher. |
See Notes to Financial Statements.
| | | | |
PGIM Jennison International Opportunities Fund | | | 25 | |
Financial Highlights (continued)
| | | | | | | | | | | | | | | | | | | | |
| Class Z Shares | | | | | | | | | | | | | | | |
| | | Year Ended October 31, | |
| | | 2022 | | | 2021 | | | 2020 | | | 2019 | | | 2018 | |
| Per Share Operating Performance(a): | | | | | | | | | | | | | | | | | | | | |
| Net Asset Value, Beginning of Year | | | $39.17 | | | | $28.56 | | | | $19.77 | | | | $16.01 | | | | $17.29 | |
| Income (loss) from investment operations: | | | | | | | | | | | | | | | | | | | | |
| Net investment income (loss) | | | (0.04 | ) | | | (0.18 | ) | | | (0.10 | ) | | | 0.03 | | | | (0.01 | ) |
| Net realized and unrealized gain (loss) on investment and foreign currency transactions | | | (16.65 | ) | | | 10.79 | | | | 8.89 | | | | 3.74 | | | | (1.24 | ) |
| Total from investment operations | | | (16.69 | ) | | | 10.61 | | | | 8.79 | | | | 3.77 | | | | (1.25 | ) |
| Less Dividends and Distributions: | | | | | | | | | | | | | | | | | | | | |
| Dividends from net investment income | | | - | | | | - | | | | - | | | | (0.01 | ) | | | (0.03 | ) |
| Tax return of capital distributions | | | (- | )(b) | | | - | | | | - | | | | - | | | | - | |
| Distributions from net realized gains | | | (0.03 | ) | | | - | | | | - | | | | - | | | | - | |
| Total dividends and distributions | | | (0.03 | ) | | | - | | | | - | | | | (0.01 | ) | | | (0.03 | ) |
| Net asset value, end of year | | | $22.45 | | | | $39.17 | | | | $28.56 | | | | $19.77 | | | | $16.01 | |
| Total Return(c): | | | (42.63 | )% | | | 37.15 | % | | | 44.46 | % | | | 23.56 | % | | | (7.24 | )% |
| | | | | | | | | | | | | | | | | | | | | |
| Ratios/Supplemental Data: | |
| Net assets, end of year (000) | | | $1,948,250 | | | | $3,481,110 | | | | $1,364,899 | | | | $208,629 | | | | $104,113 | |
| Average net assets (000) | | | $2,744,398 | | | | $2,452,905 | | | | $639,223 | | | | $139,982 | | | | $75,711 | |
| Ratios to average net assets(d): | | | | | | | | | | | | | | | | | | | | |
| Expenses after waivers and/or expense reimbursement | | | 0.90 | % | | | 0.90 | % | | | 0.90 | % | | | 0.90 | % | | | 0.89 | % |
| Expenses before waivers and/or expense reimbursement | | | 0.96 | % | | | 0.94 | % | | | 0.99 | % | | | 1.04 | % | | | 1.04 | % |
| Net investment income (loss) | | | (0.14 | )% | | | (0.51 | )% | | | (0.38 | )% | | | 0.15 | % | | | (0.08 | )% |
| Portfolio turnover rate(e) | | | 76 | % | | | 41 | % | | | 43 | % | | | 53 | % | | | 59 | % |
| (a) | Calculated based on average shares outstanding during the year. |
| (b) | Amount rounds to zero. |
| (c) | Total return is calculated assuming a purchase of a share on the first day and a sale on the last day of each year reported and includes reinvestment of dividends and distributions, if any. Total returns may reflect adjustments to conform to GAAP. |
| (d) | Does not include expenses of the underlying funds in which the Fund invests. |
| (e) | The Fund’s portfolio turnover rate is calculated in accordance with regulatory requirements, without regard to transactions involving short-term investments, certain derivatives and in-kind transactions (if any). If such transactions were included, the Fund’s portfolio turnover rate may be higher. |
See Notes to Financial Statements.
| | | | | | | | | | | | | | | | | | | | | | | | | | | | | | |
| Class R2 Shares | | | | | | | | | | | | |
| | | Year Ended October 31, | | | | December 27, 2018(a) through October 31, | | |
| | | 2022 | | 2021 | | 2020 | | | | 2019 |
| Per Share Operating Performance(b): | | | | | | | | | | | | | | | | | | | | | | | | | |
| Net Asset Value, Beginning of Period | | | | $38.72 | | | | | $28.35 | | | | | $19.70 | | | | | | | | | | $15.10 | | | | | | |
| Income (loss) from investment operations: | | | | | | | | | | | | | | | | | | | | | | | | | | | | | | |
| Net investment income (loss) | | | | (0.15 | ) | | | | (0.33 | ) | | | | (0.29 | ) | | | | | | | | | (0.12 | ) | | | | | |
| Net realized and unrealized gain (loss) on investment and foreign currency transactions | | | | (16.45 | ) | | | | 10.70 | | | | | 8.94 | | | | | | | | | | 4.72 | | | | | | |
| Total from investment operations | | | | (16.60 | ) | | | | 10.37 | | | | | 8.65 | | | | | | | | | | 4.60 | | | | | | |
| Less Dividends and Distributions: | | | | | | | | | | | | | | | | | | | | | | | | | | | | | | |
| Tax return of capital distributions | | | | (- | )(c) | | | | - | | | | | - | | | | | | | | | | - | | | | | | |
| Distributions from net realized gains | | | | (0.03 | ) | | | | - | | | | | - | | | | | | | | | | - | | | | | | |
| Total dividends and distributions | | | | (0.03 | ) | | | | - | | | | | - | | | | | | | | | | - | | | | | | |
| Net asset value, end of period | | | | $22.09 | | | | | $38.72 | | | | | $28.35 | | | | | | | | | | $19.70 | | | | | | |
| Total Return(d): | | | | (42.90 | )% | | | | 36.58 | % | | | | 43.91 | % | | | | | | | | | 30.46 | % | | | | | |
| | | | | | | | | | | | | | | | | | | | | | | | | | | | | | | |
| Ratios/Supplemental Data: | | | | | | | | | | | | |
| Net assets, end of period (000) | | | | $10,579 | | | | | $13,101 | | | | | $4,664 | | | | | | | | | | $233 | | | | | | |
| Average net assets (000) | | | | $11,553 | | | | | $8,789 | | | | | $1,557 | | | | | | | | | | $44 | | | | | | |
| Ratios to average net assets(e): | | | | | | | | | | | | | | | | | | | | | | | | | | | | | | |
| Expenses after waivers and/or expense reimbursement | | | | 1.34 | % | | | | 1.33 | % | | | | 1.32 | % | | | | | | | | | 1.26 | %(f) | | | | | |
| Expenses before waivers and/or expense reimbursement | | | | 1.41 | % | | | | 1.41 | % | | | | 2.23 | % | | | | | | | | | 64.97 | %(f) | | | | | |
| Net investment income (loss) | | | | (0.55 | )% | | | | (0.92 | )% | | | | (1.06 | )% | | | | | | | | | (0.76 | )%(f) | | | | | |
| Portfolio turnover rate(g) | | | | 76 | % | | | | 41 | % | | | | 43 | % | | | | | | | | | 53 | % | | | | | |
| (a) | Commencement of offering. |
| (b) | Calculated based on average shares outstanding during the period. |
| (c) | Amount rounds to zero. |
| (d) | Total return is calculated assuming a purchase of a share on the first day and a sale on the last day of each period reported and includes reinvestment of dividends and distributions, if any. Total returns may reflect adjustments to conform to GAAP. Total returns for periods less than one full year are not annualized. |
| (e) | Does not include expenses of the underlying funds in which the Fund invests. |
| (g) | The Fund’s portfolio turnover rate is calculated in accordance with regulatory requirements, without regard to transactions involving short-term investments, certain derivatives and in-kind transactions (if any). If such transactions were included, the Fund’s portfolio turnover rate may be higher. |
See Notes to Financial Statements.
| | | | |
PGIM Jennison International Opportunities Fund | | | 27 | |
Financial Highlights (continued)
| | | | | | | | | | | | | | | | | | | | | | | | | | | | | | |
| Class R4 Shares | | | | | | | | | | | | |
| | | Year Ended October 31, | | | | December 27, 2018(a) through October 31, | | |
| | | 2022 | | 2021 | | 2020 | | | | 2019 |
| Per Share Operating Performance(b): | | | | | | | | | | | | | | | | | | | | |
| Net Asset Value, Beginning of Period | | | | $39.01 | | | | | $28.49 | | | | | $19.75 | | | | | | | | | | $15.10 | | | | | | |
| Income (loss) from investment operations: | | | | | | | | | | | | | | | | | | | | | | | | | | | | | | |
| Net investment income (loss) | | | | (0.09 | ) | | | | (0.25 | ) | | | | (0.11 | ) | | | | | | | | | (0.02 | ) | | | | | |
| Net realized and unrealized gain (loss) on investment and foreign currency transactions | | | | (16.58 | ) | | | | 10.77 | | | | | 8.85 | | | | | | | | | | 4.67 | | | | | | |
| Total from investment operations | | | | (16.67 | ) | | | | 10.52 | | | | | 8.74 | | | | | | | | | | 4.65 | | | | | | |
| Less Dividends and Distributions: | | | | | | | | | | | | | | | | | | | | | | | | | | | | | | |
| Tax return of capital distributions | | | | (- | )(c) | | | | - | | | | | - | | | | | | | | | | - | | | | | | |
| Distributions from net realized gains | | | | (0.03 | ) | | | | - | | | | | - | | | | | | | | | | - | | | | | | |
| Total dividends and distributions | | | | (0.03 | ) | | | | - | | | | | - | | | | | | | | | | - | | | | | | |
| Net asset value, end of period | | | | $22.31 | | | | | $39.01 | | | | | $28.49 | | | | | | | | | | $19.75 | | | | | | |
| Total Return(d): | | | | (42.76 | )% | | | | 36.97 | % | | | | 44.20 | % | | | | | | | | | 30.79 | % | | | | | |
| | | | | | | | | | | | | | | | | | | | | | | | | | | | | | | |
| Ratios/Supplemental Data: | | | | | | | | | | | | |
| Net assets, end of period (000) | | | | $8,646 | | | | | $16,892 | | | | | $1,359 | | | | | | | | | | $846 | | | | | | |
| Average net assets (000) | | | | $11,164 | | | | | $11,907 | | | | | $1,023 | | | | | | | | | | $293 | | | | | | |
| Ratios to average net assets(e): | | | | | | | | | | | | | | | | | | | | | | | | | | | | | | |
| Expenses after waivers and/or expense reimbursement | | | | 1.09 | % | | | | 1.08 | % | | | | 1.04 | % | | | | | | | | | 0.95 | %(f) | | | | | |
| Expenses before waivers and/or expense reimbursement | | | | 1.16 | % | | | | 1.14 | % | | | | 2.47 | % | | | | | | | | | 10.65 | %(f) | | | | | |
| Net investment income (loss) | | | | (0.33 | )% | | | | (0.69 | )% | | | | (0.46 | )% | | | | | | | | | (0.11 | )%(f) | | | | | |
| Portfolio turnover rate(g) | | | | 76 | % | | | | 41 | % | | | | 43 | % | | | | | | | | | 53 | % | | | | | |
| (a) | Commencement of offering. |
| (b) | Calculated based on average shares outstanding during the period. |
| (c) | Amount rounds to zero. |
| (d) | Total return is calculated assuming a purchase of a share on the first day and a sale on the last day of each period reported and includes reinvestment of dividends and distributions, if any. Total returns may reflect adjustments to conform to GAAP. Total returns for periods less than one full year are not annualized. |
| (e) | Does not include expenses of the underlying funds in which the Fund invests. |
| (g) | The Fund’s portfolio turnover rate is calculated in accordance with regulatory requirements, without regard to transactions involving short-term investments, certain derivatives and in-kind transactions (if any). If such transactions were included, the Fund’s portfolio turnover rate may be higher. |
See Notes to Financial Statements.
| | | | | | | | | | | | | | | | | | | | |
| Class R6 Shares | | | | | | | | | | | | | | | |
| | | Year Ended October 31, | |
| | | 2022 | | | 2021 | | | 2020 | | | 2019 | | | 2018 | |
| Per Share Operating Performance(a): | | | | | | | | | | | | | | | | | | | | |
| Net Asset Value, Beginning of Year | | | $39.24 | | | | $28.59 | | | | $19.78 | | | | $16.02 | | | | $17.29 | |
| Income (loss) from investment operations: | | | | | | | | | | | | | | | | | | | | |
| Net investment income (loss) | | | (0.02 | ) | | | (0.16 | ) | | | (0.08 | ) | | | 0.04 | | | | (0.01 | ) |
| Net realized and unrealized gain (loss) on investment and foreign currency transactions | | | (16.69 | ) | | | 10.81 | | | | 8.89 | | | | 3.74 | | | | (1.22 | ) |
| Total from investment operations | | | (16.71 | ) | | | 10.65 | | | | 8.81 | | | | 3.78 | | | | (1.23 | ) |
| Less Dividends and Distributions: | | | | | | | | | | | | | | | | | | | | |
| Dividends from net investment income | | | - | | | | - | | | | - | | | | (0.02 | ) | | | (0.04 | ) |
| Tax return of capital distributions | | | (- | )(b) | | | - | | | | - | | | | - | | | | - | |
| Distributions from net realized gains | | | (0.03 | ) | | | - | | | | - | | | | - | | | | - | |
| Total dividends and distributions | | | (0.03 | ) | | | - | | | | - | | | | (0.02 | ) | | | (0.04 | ) |
| Net asset value, end of year | | | $22.50 | | | | $39.24 | | | | $28.59 | | | | $19.78 | | | | $16.02 | |
| Total Return(c): | | | (42.61 | )% | | | 37.25 | % | | | 44.54 | % | | | 23.72 | % | | | (7.15 | )% |
| | | | | | | | | | | | | | | | | | | | | |
| Ratios/Supplemental Data: | |
| Net assets, end of year (000) | | | $1,330,422 | | | | $2,136,686 | | | | $673,736 | | | | $101,975 | | | | $35,141 | |
| Average net assets (000) | | | $1,686,565 | | | | $1,445,464 | | | | $295,968 | | | | $54,900 | | | | $26,736 | |
| Ratios to average net assets(d): | | | | | | | | | | | | | | | | | | | | |
| Expenses after waivers and/or expense reimbursement | | | 0.84 | % | | | 0.84 | % | | | 0.84 | % | | | 0.84 | % | | | 0.84 | % |
| Expenses before waivers and/or expense reimbursement | | | 0.84 | % | | | 0.84 | % | | | 0.91 | % | | | 0.98 | % | | | 1.00 | % |
| Net investment income (loss) | | | (0.07 | )% | | | (0.46 | )% | | | (0.32 | )% | | | 0.20 | % | | | (0.05 | )% |
| Portfolio turnover rate(e) | | | 76 | % | | | 41 | % | | | 43 | % | | | 53 | % | | | 59 | % |
| (a) | Calculated based on average shares outstanding during the year. |
| (b) | Amount rounds to zero. |
| (c) | Total return is calculated assuming a purchase of a share on the first day and a sale on the last day of each year reported and includes reinvestment of dividends and distributions, if any. Total returns may reflect adjustments to conform to GAAP. |
| (d) | Does not include expenses of the underlying funds in which the Fund invests. |
| (e) | The Fund’s portfolio turnover rate is calculated in accordance with regulatory requirements, without regard to transactions involving short-term investments, certain derivatives and in-kind transactions (if any). If such transactions were included, the Fund’s portfolio turnover rate may be higher. |
See Notes to Financial Statements.
| | | | |
PGIM Jennison International Opportunities Fund | | | 29 | |
Notes to Financial Statements
1. Organization
Prudential World Fund, Inc. (the “Registered Investment Company” or “RIC”) is registered under the Investment Company Act of 1940, as amended (“1940 Act”), as an open-end management investment company. The RIC is organized as a Maryland Corporation. These financial statements relate only to the PGIM Jennison International Opportunities Fund (the “Fund”), a series of the RIC. The Fund is classified as a diversified fund for purposes of the 1940 Act.
The investment objective of the Fund is to seek long-term growth of capital.
2. Accounting Policies
The Fund follows the investment company accounting and reporting guidance of the Financial Accounting Standards Board (“FASB”) Accounting Standard Codification (“ASC”) Topic 946 Financial Services — Investment Companies. The following is a summary of significant accounting policies followed by the Fund in the preparation of its financial statements. The policies conform to U.S. generally accepted accounting principles (“GAAP”). The Fund consistently follows such policies in the preparation of its financial statements.
Securities Valuation: The Fund holds securities and other assets and liabilities that are fair valued as of the close of each day (generally, 4:00 PM Eastern time) the New York Stock Exchange (“NYSE”) is open for trading. As described in further detail below, the Fund’s investments are valued daily based on a number of factors, including the type of investment and whether market quotations are readily available. The RIC’s Board of Directors (the “Board”) has approved the Fund’s valuation policies and procedures for security valuation and designated to PGIM Investments LLC (“PGIM Investments” or the “Manager”) as the Valuation Designee pursuant to SEC Rule 2a-5(b) to perform the fair value determination relating to all Fund investments. Pursuant to the Board’s oversight, the Valuation Designee has established a Valuation Committee to perform the duties and responsibilities as valuation designee under SEC Rule 2a-5. The valuation procedures permit the Fund to utilize independent pricing vendor services, quotations from market makers, and alternative valuation methods when market quotations are either not readily available or not deemed representative of fair value. Fair value is the price that would be received to sell an asset or paid to transfer a liability in an orderly transaction between market participants on the measurement date. A record of the Valuation Committee’s actions is provided to the Board at the first quarterly meeting following the quarter in which such actions take place.
For the fiscal reporting year-end, securities and other assets and liabilities were fair valued at the close of the last U.S. business day. Trading in certain foreign securities may occur when the NYSE is closed (including weekends and holidays). Because such foreign securities
trade in markets that are open on weekends and U.S. holidays, the values of some of the Fund’s foreign investments may change on days when investors cannot purchase or redeem Fund shares.
Various inputs determine how the Fund’s investments are valued, all of which are categorized according to the three broad levels (Level 1, 2, or 3) detailed in the Schedule of Investments and referred to herein as the “fair value hierarchy” in accordance with FASB ASC Topic 820 - Fair Value Measurement.
Common or preferred stocks, exchange-traded funds and derivative instruments, if applicable, that are traded on a national securities exchange are valued at the last sale price as of the close of trading on the applicable exchange where the security principally trades. Securities traded via NASDAQ are valued at the NASDAQ official closing price. To the extent these securities are valued at the last sale price or NASDAQ official closing price, they are classified as Level 1 in the fair value hierarchy. In the event that no sale or official closing price on valuation date exists, these securities are generally valued at the mean between the last reported bid and ask prices, or at the last bid price in the absence of an ask price. These securities are classified as Level 2 in the fair value hierarchy.
Foreign equities traded on foreign securities exchanges are generally valued using pricing vendor services that provide model prices derived using adjustment factors based on information such as local closing price, relevant general and sector indices, currency fluctuations, depositary receipts, and futures, as applicable. Securities valued using such model prices are classified as Level 2 in the fair value hierarchy. The models generate an evaluated adjustment factor for each security, which is applied to the local closing price to adjust it for post closing market movements up to the time the Fund is valued. Utilizing that evaluated adjustment factor, the vendor provides an evaluated price for each security. If the vendor does not provide an evaluated price, securities are valued in accordance with exchange-traded common and preferred stock valuation policies discussed above.
Investments in open-end funds (other than exchange-traded funds) are valued at their net asset values as of the close of the NYSE on the date of valuation. These securities are classified as Level 1 in the fair value hierarchy since they may be purchased or sold at their net asset values on the date of valuation.
Securities and other assets that cannot be priced according to the methods described above are valued based on policies and procedures approved by the Board. In the event that unobservable inputs are used when determining such valuations, the securities will be classified as Level 3 in the fair value hierarchy. Altering one or more unobservable inputs may result in a significant change to a Level 3 security’s fair value measurement.
When determining the fair value of securities, some of the factors influencing the valuation include: the nature of any restrictions on disposition of the securities; assessment of the general liquidity of the securities; the issuer’s financial condition and the markets in which it does business; the cost of the investment; the size of the holding and the capitalization of
| | | | |
PGIM Jennison International Opportunities Fund | | | 31 | |
Notes to Financial Statements (continued)
the issuer; the prices of any recent transactions or bids/offers for such securities or any comparable securities; any available analyst media or other reports or information deemed reliable by the Valuation Designee regarding the issuer or the markets or industry in which it operates. Using fair value to price securities may result in a value that is different from a security’s most recent closing price and from the price used by other unaffiliated mutual funds to calculate their net asset values.
Foreign Currency Translation: The books and records of the Fund are maintained in U.S. dollars. Foreign currency amounts are translated into U.S. dollars on the following basis:
(i) market value of investment securities, other assets and liabilities — at the exchange rate as of the valuation date;
(ii) purchases and sales of investment securities, income and expenses — at the rates of exchange prevailing on the respective dates of such transactions.
Although the net assets of the Fund are presented at the foreign exchange rates and market values at the close of the period, the Fund does not generally isolate that portion of the results of operations arising as a result of changes in the foreign exchange rates from the fluctuations arising from changes in the market prices of long-term portfolio securities held at the end of the period. Similarly, the Fund does not isolate the effect of changes in foreign exchange rates from the fluctuations arising from changes in the market prices of long-term portfolio securities sold during the period. Accordingly, holding period unrealized and realized foreign currency gains (losses) are included in the reported net change in unrealized appreciation (depreciation) on investments and net realized gains (losses) on investment transactions on the Statements of Operations.
Net realized gains (losses) on foreign currency transactions represent net foreign exchange gains (losses) from the disposition of holdings of foreign currencies, currency gains (losses) realized between the trade and settlement dates on investment transactions, and the difference between the amounts of interest, dividends and foreign withholding taxes recorded on the Fund’s books and the U.S. dollar equivalent amounts actually received or paid. Net unrealized currency gains (losses) arise from valuing foreign currency denominated assets and liabilities (other than investments) at period end exchange rates.
Master Netting Arrangements: The RIC, on behalf of the Fund, is subject to various Master Agreements, or netting arrangements, with select counterparties. These are agreements which a subadviser may have negotiated and entered into on behalf of all or a portion of the Fund. A master netting arrangement between the Fund and the counterparty permits the Fund to offset amounts payable by the Fund to the same counterparty against amounts to be received; and by the receipt of collateral from the counterparty by the Fund to cover the
Fund’s exposure to the counterparty. However, there is no assurance that such mitigating factors are easily enforceable. In addition to master netting arrangements, the right to set-off exists when all the conditions are met such that each of the parties owes the other determinable amounts, the reporting party has the right to set-off the amount owed with the amount owed by the other party, the reporting party intends to set-off and the right of set-off is enforceable by law.
Securities Lending: The Fund lends its portfolio securities to banks and broker-dealers. The loans are secured by collateral at least equal to the market value of the securities loaned. Collateral pledged by each borrower is invested in an affiliated money market fund and is marked to market daily, based on the previous day’s market value, such that the value of the collateral exceeds the value of the loaned securities. In the event of significant appreciation in value of securities on loan on the last business day of the reporting period, the financial statements may reflect a collateral value that is less than the market value of the loaned securities. Such shortfall is remedied as described above. Loans are subject to termination at the option of the borrower or the Fund. Upon termination of the loan, the borrower will return to the Fund securities identical to the loaned securities. The remaining open loans of the securities lending transactions are considered overnight and continuous. Should the borrower of the securities fail financially, the Fund has the right to repurchase the securities in the open market using the collateral.
The Fund recognizes income, net of any rebate and securities lending agent fees, for lending its securities in the form of fees or interest on the investment of any cash received as collateral. The borrower receives all interest and dividends from the securities loaned and such payments are passed back to the lender in amounts equivalent thereto, which are reflected in interest income or unaffiliated dividend income based on the nature of the payment on the Statement of Operations. The Fund also continues to recognize any unrealized gain (loss) in the market price of the securities loaned and on the change in the value of the collateral invested that may occur during the term of the loan. In addition, realized gain (loss) is recognized on changes in the value of the collateral invested upon liquidation of the collateral. Net earnings from securities lending are disclosed in the Statement of Operations.
Securities Transactions and Net Investment Income: Securities transactions are recorded on the trade date. Realized gains (losses) from investment and currency transactions are calculated on the specific identification method. Dividend income is recorded on the ex-date, or for certain foreign securities, when the Fund becomes aware of such dividends. Expenses are recorded on an accrual basis, which may require the use of certain estimates by management that may differ from actual. Net investment income or loss (other than class specific expenses and waivers, which are allocated as noted below) and unrealized and realized gains (losses) are allocated daily to each class of shares based upon the relative proportion of adjusted net assets of each class at the beginning of the day. Class specific expenses and waivers, where applicable, are charged to the respective share classes. Such class specific expenses and waivers include distribution fees and distribution fee waivers,
| | | | |
PGIM Jennison International Opportunities Fund | | | 33 | |
Notes to Financial Statements (continued)
shareholder servicing fees, transfer agent’s fees and expenses, registration fees and fee waivers and/or expense reimbursements, as applicable.
Taxes: It is the Fund’s policy to continue to meet the requirements of the Internal Revenue Code applicable to regulated investment companies and to distribute all of its taxable net investment income and capital gains, if any, to its shareholders. Therefore, no federal income tax provision is required. Withholding taxes on foreign dividends, interest and capital gains, if any, are recorded, net of reclaimable amounts, at the time the related income is earned.
Dividends and Distributions: Dividends and distributions to shareholders, which are determined in accordance with federal income tax regulations and which may differ from GAAP, are recorded on the ex-date. Permanent book/tax differences relating to income and gain (loss) are reclassified between total distributable earnings (loss) and paid-in capital in excess of par, as appropriate. The chart below sets forth the expected frequency of dividend and capital gains distributions to shareholders. Various factors may impact the frequency of dividend distributions to shareholders, including but not limited to adverse market conditions or portfolio holding-specific events.
| | |
| | |
| Expected Distribution Schedule to Shareholders* | | Frequency |
| |
Net Investment Income | | Annually |
| |
Short-Term Capital Gains | | Annually |
| |
Long-Term Capital Gains | | Annually |
| * | Under certain circumstances, the Fund may make more than one distribution of short-term and/or long-term capital gains during a fiscal year. |
Estimates: The preparation of financial statements requires management to make estimates and assumptions that affect the reported amounts and disclosures in the financial statements. Actual results could differ from those estimates.
3. Agreements
The RIC, on behalf of the Fund, has a management agreement with the Manager pursuant to which it has responsibility for all investment advisory services and supervises the subadviser’s performance of such services, and pursuant to which it renders administrative services.
The Manager has entered into a subadvisory agreement with Jennison Associates LLC (“Jennison” or the “subadviser”). The Manager pays for the services of Jennison.
Fees payable under the management agreement are computed daily and paid monthly. For the reporting period ended October 31, 2022, the contractual and effective management fee rates were as follows:
| | | | |
| | |
| Contractual Management Rate* | | Effective Management Fee, before any waivers and/or expense reimbursements | |
| |
0.825% on average daily net assets up to and including $1 billion; | | | 0.805% | |
| |
0.80% on average daily net assets from $1 billion to $5 billion; | | | | |
| |
0.78% on average daily net assets exceeding $5 billion. | | | | |
*Prior to July 1, 2022, the contractual management rate was 0.825% of the Fund���s average daily net assets up to $1 billion and 0.80% of such assets in excess of $1 billion.
The Manager has contractually agreed, through February 29, 2024, to limit certain operating expenses and/or to limit total annual operating expenses after fee waivers and/or expense reimbursements. The contractual waivers exclude interest, brokerage, taxes (such as income and foreign withholding taxes, stamp duty and deferred tax expenses), acquired fund fees and expenses, extraordinary expenses, and certain other Fund expenses such as dividend and interest expense and broker charges on short sales.
Where applicable, the Manager agrees to waive management fees or shared operating expenses on any share class to the same extent that it waives such expenses on any other share class. In addition, total annual operating expenses for Class R6 shares will not exceed total annual operating expenses for Class Z shares. Fees and/or expenses waived and/or reimbursed by the Manager for the purpose of preventing the expenses from exceeding a certain expense ratio limit may be recouped by the Manager within the same fiscal year during which such waiver and/or reimbursement is made if such recoupment can be realized without exceeding the expense limit in effect at the time of the recoupment for that fiscal year. The expense limitations attributable to each class are as follows:
| | | | | | | | | | |
| Class | | Fund Expense
Limitation* | | Class Expense Limitation |
A | | | | 0.84 | % | | | | 1.09 | % |
C | | | | 0.84 | | | | | 1.90 | ** |
R | | | | 0.84 | | | | | 1.48 | ** |
Z | | | | 0.84 | | | | | 0.90 | ** |
R2 | | | | 0.84 | | | | | 1.34 | *** |
R4 | | | | 0.84 | | | | | 1.09 | *** |
R6 | | | | 0.84 | | | | | 0.84 | ** |
*Expense limitation excludes distribution and service (12b-1) fees, shareholder service fee, and transfer agency expenses (including sub-transfer agency and networking fees).
**Expense waiver/reimbursement limited to 0.06% on an annualized basis.
***Expense limitation applicable only to blue sky fees, shareholder service fee, and transfer agency expenses (including sub-transfer agency and networking fees).
| | | | |
PGIM Jennison International Opportunities Fund | | | 35 | |
Notes to Financial Statements (continued)
The RIC, on behalf of the Fund, has a distribution agreement with Prudential Investment Management Services LLC (“PIMS”), which acts as the distributor of the Class A, Class C, Class R, Class Z, Class R2, Class R4 and Class R6 shares of the Fund. The Fund compensates PIMS for distributing and servicing the Fund’s Class A, Class C, Class R and Class R2 shares, pursuant to the plans of distribution (the “Distribution Plans”), regardless of expenses actually incurred by PIMS.
Pursuant to the Distribution Plans, the Fund compensates PIMS for distribution related activities at an annual rate based on average daily net assets per class. PIMS has contractually agreed through February 29, 2024 to limit such fees on certain classes based on the average daily net assets. The distribution fees are accrued daily and payable monthly.
The Fund has adopted a Shareholder Services Plan with respect to Class R2 and Class R4 shares. Under the terms of the Shareholder Services Plan, Class R2 and Class R4 shares are authorized to compensate Prudential Mutual Fund Services LLC (“PMFS”), its affiliates or third-party service providers for services rendered to the shareholders of such Class R2 or Class R4 shares. The shareholder service fee is accrued daily and paid monthly, as applicable.
The Fund’s annual gross and net distribution rate and maximum shareholder service fee, where applicable, are as follows:
| | | | | | | | | | | | | | | |
| Class | | Gross Distribution Fee | | Net Distribution Fee | | Shareholder Service Fee |
A | | | | 0.30 | % | | | | 0.25 | % | | | | N/A | % |
C | | | | 1.00 | | | | | 1.00 | | | | | N/A | |
R | | | | 0.75 | | | | | 0.50 | | | | | N/A | |
Z | | | | N/A | | | | | N/A | | | | | N/A | |
R2 | | | | 0.25 | | | | | 0.25 | | | | | 0.10 | |
R4 | | | | N/A | | | | | N/A | | | | | 0.10 | |
R6 | | | | N/A | | | | | N/A | | | | | N/A | |
For the year ended October 31, 2022, PIMS received front-end sales charges (“FESL”) resulting from sales of certain class shares and contingent deferred sales charges (“CDSC”) imposed upon redemptions by certain shareholders. From these fees, PIMS paid such sales charges to broker-dealers, who in turn paid commissions to salespersons and incurred other distribution costs. The sales charges are as follows where applicable:
| | | | | | | | |
| | | |
| Class | | FESL | | | CDSC | |
A | | $ | 403,166 | | | $ | 3,246 | |
C | | | — | | | | 13,008 | |
PGIM Investments, PIMS, PMFS and Jennison are indirect, wholly-owned subsidiaries of Prudential Financial, Inc. (“Prudential”).
4. Other Transactions with Affiliates
PMFS serves as the Fund’s transfer agent and shareholder servicing agent. Transfer agent’s and shareholder servicing agent’s fees and expenses in the Statement of Operations include certain out-of-pocket expenses paid to non-affiliates, where applicable.
The Fund may invest its overnight sweep cash in the PGIM Core Ultra Short Bond Fund (the “Core Fund”), and its securities lending cash collateral in the PGIM Institutional Money Market Fund (the “Money Market Fund”), each a fund of Prudential Investment Portfolios 2, registered under the 1940 Act and managed by PGIM Investments. PGIM Investments and/or its affiliates are paid fees or reimbursed for providing their services to the Core Fund and the Money Market Fund. In addition to the realized and unrealized gains on investments in the Core Fund and Money Market Fund, earnings from such investments are disclosed on the Statement of Operations as “Affiliated dividend income” and “Income from securities lending, net”, respectively. Effective January 2022, the Fund changed its overnight cash sweep vehicle from the Core Fund to an unaffiliated money market fund.
The Fund may enter into certain securities purchase or sale transactions under Board approved Rule 17a-7 procedures. Rule 17a-7 is an exemptive rule under the 1940 Act, that subject to certain conditions, permits purchase and sale transactions among affiliated investment companies, or between an investment company and a person that is affiliated solely by reason of having a common (or affiliated) investment adviser, common directors/trustees, and/or common officers. For the year ended October 31, 2022, no 17a-7 transactions were entered into by the Fund.
5. Portfolio Securities
The aggregate cost of purchases and proceeds from sales of portfolio securities (excluding short-term investments and U.S. Government securities) for the reporting period ended October 31, 2022, were as follows:
| | |
| | |
| Cost of Purchases | | Proceeds from Sales |
| $3,820,896,286 | | $3,594,020,605 |
A summary of the cost of purchases and proceeds from sales of shares of affiliated mutual funds for the year ended October 31, 2022, is presented as follows:
| | | | | | | | | | | | | | | | | | |
Value, Beginning of Year | | Cost of Purchases | | Proceeds from Sales | | Change in
Unrealized Gain (Loss) | | Realized Gain (Loss) | | Value, End of Year | | Shares, End of Year | | | Income | |
| | |
Short-Term Investments - Affiliated Mutual Funds: | | | | | | | | |
| | |
PGIM Core Ultra Short Bond Fund(1)(wa) | | | | | | | | |
$101,909,396 | | $ 474,801,449 | | $ 576,710,845 | | $ — | | $ — | | $ — | | | — | | | $ | 29,833 | |
| | | | |
PGIM Jennison International Opportunities Fund | | | 37 | |
Notes to Financial Statements (continued)
| | | | | | | | | | | | | | | | | | |
Value, Beginning of Year | | Cost of Purchases | | Proceeds from Sales | | Change in
Unrealized Gain (Loss) | | Realized Gain (Loss) | | Value, End of Year | | Shares, End of Year | | | Income | |
| | |
PGIM Institutional Money Market Fund(1)(b)(wa) | | | | | | | | |
$45,167,540 | | $1,726,129,152 | | $1,621,225,988 | | $11,114 | | $(61,481) | | $150,020,337 | | | 150,155,477 | | | $ | 236,497 | (2) |
$147,076,936 | | $2,200,930,601 | | $2,197,936,833 | | $11,114 | | $(61,481) | | $150,020,337 | | | | | | $ | 266,330 | |
| (1) | The Fund did not have any capital gain distributions during the reporting period. |
| (2) | The amount, or a portion thereof, represents the affiliated securities lending income shown on the Statement of Operations. |
| (b) | Represents security, or portion thereof, purchased with cash collateral received for securities on loan and includes dividend reinvestment. |
| (wa) | PGIM Investments LLC, the manager of the Fund, also serves as manager of the PGIM Core Ultra Short Bond Fund and PGIM Institutional Money Market Fund, if applicable. |
6. Distributions and Tax Information
Distributions to shareholders, which are determined in accordance with federal income tax regulations and which may differ from GAAP, are recorded on the ex-date. In order to present total distributable earnings (loss) and paid-in-capital in excess of par on the Statement of Assets and Liabilities that more closely represent their tax character, certain adjustments have been made to total distributable earnings (loss) and paid-in capital in excess of par. For the year ended October 31, 2022, the adjustments were to increase total distributable earnings (loss) and decrease paid-in capital in excess of par by $28,754,396 primarily due to a net operating loss. Net investment income, net realized gain (loss) on investments and foreign currency transactions and net assets were not affected by this change.
For the year ended October 31, 2022, the tax character of dividends paid by the Fund was $5,535,994 of long-term capital gains and $69,355 of tax return of capital. For the year ended October 31, 2021, there were no distributions paid by the Fund.
As of October 31, 2022, there were no accumulated undistributed earnings on a tax basis.
The United States federal income tax basis of the Fund’s investments and the net unrealized depreciation as of October 31, 2022 were as follows:
| | | | | | | | | | | | |
| Tax Basis | | | | Gross
Unrealized
Appreciation | | | | Gross
Unrealized
Depreciation | | | | Net Unrealized
Depreciation |
| $4,035,019,767 | | | | $390,783,188 | | | | $(589,426,849) | | | | $(198,643,661) |
The difference between GAAP basis and tax basis were primarily attributable to deferred losses on wash sales and corporate spin-off adjustments.
For federal income tax purposes, the Fund had a capital loss carryforward as of October 31, 2022 of approximately $952,335,000 which can be carried forward for an unlimited period. No capital gains distributions are expected to be paid to shareholders until net gains have been realized in excess of such losses.
The Fund elected to treat late year ordinary income losses of approximately $1,825,000 as having been incurred in the following fiscal year (October 31, 2023).
The Manager has analyzed the Fund’s tax positions taken on federal, state and local income tax returns for all open tax years and has concluded that no provision for income tax is required in the Fund’s financial statements for the current reporting period. Since tax authorities can examine previously filed tax returns, the Fund’s U.S. federal and state tax returns for each of the four fiscal years up to the most recent fiscal year ended October 31, 2022 are subject to such review.
7. Capital and Ownership
The Fund offers Class A, Class C, Class R, Class Z, Class R2, Class R4 and Class R6 shares. Class A shares are sold with a maximum front-end sales charge of 5.50%. Investors who purchase $1 million or more of Class A shares and sell these shares within 12 months of purchase are subject to a CDSC of 1%, although they are not subject to an initial sales charge. The Class A CDSC is waived for certain retirement and/or benefit plans. A special exchange privilege is also available for shareholders who qualified to purchase Class A shares at net asset value. Class C shares are sold with a CDSC of 1% on sales made within 12 months of purchase. Class C shares will automatically convert to Class A shares on a monthly basis approximately eight years (ten years prior to January 22, 2021) after purchase. Class R, Class Z, Class R2, Class R4 and Class R6 shares are not subject to any sales or redemption charges and are available exclusively for sale to a limited group of investors.
Under certain circumstances, an exchange may be made from specified share classes of the Fund to one or more other share classes of the Fund as presented in the table of transactions in shares of common stock, below.
The RIC is authorized to issue 10,225,000,000 shares of common stock, $0.00001 par value per share, 3,550,000,000 of which are designated as shares of the Fund. The authorized shares of the Fund are currently classified and designated as follows:
| | | | | |
| Class | | Number of Shares |
| |
A | | | | 150,000,000 | |
| |
C | | | | 100,000,000 | |
| |
R | | | | 100,000,000 | |
| |
Z | | | | 2,000,000,000 | |
| |
R2 | | | | 100,000,000 | |
| |
R4 | | | | 100,000,000 | |
| |
R6 | | | | 1,000,000,000 | |
| | | | |
PGIM Jennison International Opportunities Fund | | | 39 | |
Notes to Financial Statements (continued)
As of October 31, 2022, Prudential, through its affiliated entities, including affiliated funds (if applicable), owned shares of the Fund as follows:
| | | | | | | | | | |
| Class | | Number of Shares | | Percentage of Outstanding Shares |
R | | | | 10,588,053 | | | | | 100.0 | % |
R2 | | | | 663 | | | | | 0.1 | |
R4 | | | | 13,604 | | | | | 3.5 | |
At the reporting period end, the number of shareholders holding greater than 5% of the Fund are as follows:
| | | | | | | | | | |
| | | Number of Shareholders | | Percentage of Outstanding Shares |
Affiliated | | | | 1 | | | | | 6.3 | % |
Unaffiliated | | | | 5 | | | | | 70.7 | |
Transactions in shares of common stock were as follows:
| | | | | | | | |
| | | |
| Share Class | | Shares | | | Amount | |
| | |
Class A | | | | | | | | |
| | |
Year ended October 31, 2022: | | | | | | | | |
| | |
Shares sold | | | 1,863,405 | | | $ | 55,373,880 | |
| | |
Shares issued in reinvestment of dividends and distributions | | | 5,200 | | | | 182,714 | |
| | |
Shares purchased | | | (2,566,608 | ) | | | (69,034,328 | ) |
| | |
Net increase (decrease) in shares outstanding before conversion | | | (698,003 | ) | | | (13,477,734 | ) |
| | |
Shares issued upon conversion from other share class(es) | | | 297,066 | | | | 8,736,406 | |
| | |
Shares purchased upon conversion into other share class(es) | | | (240,270 | ) | | | (7,536,465 | ) |
| | |
Net increase (decrease) in shares outstanding | | | (641,207 | ) | | $ | (12,277,793 | ) |
| | |
Year ended October 31, 2021: | | | | | | | | |
| | |
Shares sold | | | 3,295,095 | | | $ | 113,856,416 | |
| | |
Shares purchased | | | (645,468 | ) | | | (22,275,031 | ) |
| | |
Net increase (decrease) in shares outstanding before conversion | | | 2,649,627 | | | | 91,581,385 | |
| | |
Shares issued upon conversion from other share class(es) | | | 231,486 | | | | 8,009,475 | |
| | |
Shares purchased upon conversion into other share class(es) | | | (171,779 | ) | | | (6,016,914 | ) |
| | |
Net increase (decrease) in shares outstanding | | | 2,709,334 | | | $ | 93,573,946 | |
| | | | | | | | |
| | | |
| Share Class | | Shares | | | Amount |
| | |
Class C | | | | | | | | |
| | |
Year ended October 31, 2022: | | | | | | | | |
| | |
Shares sold | | | 439,161 | | | $ | 12,611,578 | |
| | |
Shares issued in reinvestment of dividends and distributions | | | 1,181 | | | | 38,543 | |
| | |
Shares purchased | | | (381,085 | ) | | | (9,470,187 | ) |
| | |
Net increase (decrease) in shares outstanding before conversion | | | 59,257 | | | | 3,179,934 | |
| | |
Shares purchased upon conversion into other share class(es) | | | (48,581 | ) | | | (1,296,415 | ) |
| | |
Net increase (decrease) in shares outstanding | | | 10,676 | | | $ | 1,883,519 | |
| | |
Year ended October 31, 2021: | | | | | | | | |
| | |
Shares sold | | | 671,538 | | | $ | 21,597,459 | |
| | |
Shares purchased | | | (72,681 | ) | | | (2,330,925 | ) |
| | |
Net increase (decrease) in shares outstanding before conversion | | | 598,857 | | | | 19,266,534 | |
| | |
Shares purchased upon conversion into other share class(es) | | | (100,679 | ) | | | (3,132,283 | ) |
| | |
Net increase (decrease) in shares outstanding | | | 498,178 | | | $ | 16,134,251 | |
| | |
Class R | | | | | | | | |
| | |
Year ended October 31, 2022: | | | | | | | | |
| | |
Shares sold | | | 2,646,941 | | | $ | 70,002,360 | |
| | |
Shares issued in reinvestment of dividends and distributions | | | 8,622 | | | | 300,115 | |
| | |
Shares purchased | | | (1,455,193 | ) | | | (39,061,923 | ) |
| | |
Net increase (decrease) in shares outstanding | | | 1,200,370 | | | $ | 31,240,552 | |
| | |
Year ended October 31, 2021: | | | | | | | | |
| | |
Shares sold | | | 757,793 | | | $ | 24,410,460 | |
| | |
Shares purchased | | | (1,774,362 | ) | | | (60,549,305 | ) |
| | |
Net increase (decrease) in shares outstanding | | | (1,016,569 | ) | | $ | (36,138,845 | ) |
| | |
Class Z | | | | | | | | |
| | |
Year ended October 31, 2022: | | | | | | | | |
| | |
Shares sold | | | 76,944,814 | | | $ | 2,301,749,213 | |
| | |
Shares issued in reinvestment of dividends and distributions | | | 88,911 | | | | 3,178,566 | |
| | |
Shares purchased | | | (78,931,653 | ) | | | (2,134,832,204 | ) |
| | |
Net increase (decrease) in shares outstanding before conversion | | | (1,897,928 | ) | | | 170,095,575 | |
| | |
Shares issued upon conversion from other share class(es) | | | 233,999 | | | | 7,032,081 | |
| | |
Shares purchased upon conversion into other share class(es) | | | (411,416 | ) | | | (12,499,417 | ) |
| | |
Net increase (decrease) in shares outstanding | | | (2,075,345 | ) | | $ | 164,628,239 | |
| | |
Year ended October 31, 2021: | | | | | | | | |
| | |
Shares sold | | | 65,487,151 | | | $ | 2,317,934,026 | |
| | |
Shares purchased | | | (20,037,303 | ) | | | (704,435,367 | ) |
| | |
Net increase (decrease) in shares outstanding before conversion | | | 45,449,848 | | | | 1,613,498,659 | |
| | |
Shares issued upon conversion from other share class(es) | | | 246,910 | | | | 8,620,461 | |
| | |
Shares purchased upon conversion into other share class(es) | | | (4,617,431 | ) | | | (161,788,669 | ) |
| | |
Net increase (decrease) in shares outstanding | | | 41,079,327 | | | $ | 1,460,330,451 | |
| | | | |
PGIM Jennison International Opportunities Fund | | | 41 | |
Notes to Financial Statements (continued)
| | | | | | | | |
| | | |
| Share Class | | Shares | | | Amount |
| | |
Class R2 | | | | | | | | |
| | |
Year ended October 31, 2022: | | | | | | | | |
| | |
Shares sold | | | 205,770 | | | $ | 5,870,696 | |
| | |
Shares issued in reinvestment of dividends and distributions | | | 339 | | | | 11,964 | |
| | |
Shares purchased | | | (65,558 | ) | | | (1,795,651 | ) |
| | |
Net increase (decrease) in shares outstanding | | | 140,551 | | | $ | 4,087,009 | |
| | |
Year ended October 31, 2021: | | | | | | | | |
| | |
Shares sold | | | 249,628 | | | $ | 8,603,079 | |
| | |
Shares purchased | | | (73,779 | ) | | | (2,605,355 | ) |
| | |
Net increase (decrease) in shares outstanding before conversion | | | 175,849 | | | | 5,997,724 | |
| | |
Shares purchased upon conversion into other share class(es) | | | (2,016 | ) | | | (73,177 | ) |
| | |
Net increase (decrease) in shares outstanding | | | 173,833 | | | $ | 5,924,547 | |
| | |
Class R4 | | | | | | | | |
| | |
Year ended October 31, 2022: | | | | | | | | |
| | |
Shares sold | | | 180,706 | | | $ | 5,177,531 | |
| | |
Shares issued in reinvestment of dividends and distributions | | | 365 | | | | 13,002 | |
| | |
Shares purchased | | | (226,586 | ) | | | (6,776,093 | ) |
| | |
Net increase (decrease) in shares outstanding | | | (45,515 | ) | | $ | (1,585,560 | ) |
| | |
Year ended October 31, 2021: | | | | | | | | |
| | |
Shares sold | | | 720,254 | | | $ | 24,255,406 | |
| | |
Shares purchased | | | (334,901 | ) | | | (11,278,535 | ) |
| | |
Net increase (decrease) in shares outstanding | | | 385,353 | | | $ | 12,976,871 | |
| | |
Class R6 | | | | | | | | |
| | |
Year ended October 31, 2022: | | | | | | | | |
| | |
Shares sold | | | 26,706,420 | | | $ | 786,672,964 | |
| | |
Shares issued in reinvestment of dividends and distributions | | | 52,243 | | | | 1,871,334 | |
| | |
Shares purchased | | | (22,246,205 | ) | | | (598,716,919 | ) |
| | |
Net increase (decrease) in shares outstanding before conversion | | | 4,512,458 | | | | 189,827,379 | |
| | |
Shares issued upon conversion from other share class(es) | | | 212,509 | | | | 6,952,926 | |
| | |
Shares purchased upon conversion into other share class(es) | | | (46,935 | ) | | | (1,389,116 | ) |
| | |
Net increase (decrease) in shares outstanding | | | 4,678,032 | | | $ | 195,391,189 | |
| | | | | | | | |
| | | |
| Share Class | | Shares | | | Amount |
| | |
Year ended October 31, 2021: | | | | | | | | |
| | |
Shares sold | | | 35,440,308 | | | $ | 1,230,472,986 | |
| | |
Shares purchased | | | (8,950,166 | ) | | | (318,212,193 | ) |
| | |
Net increase (decrease) in shares outstanding before conversion | | | 26,490,142 | | | | 912,260,793 | |
| | |
Shares issued upon conversion from other share class(es) | | | 4,411,797 | | | | 154,824,965 | |
| | |
Shares purchased upon conversion into other share class(es) | | | (12,007 | ) | | | (443,858 | ) |
| | |
Net increase (decrease) in shares outstanding | | | 30,889,932 | | | $ | 1,066,641,900 | |
The RIC, on behalf of the Fund, along with other affiliated registered investment companies (the “Participating Funds”), is a party to a Syndicated Credit Agreement (“SCA”) with a group of banks. The purpose of the SCA is to provide an alternative source of temporary funding for capital share redemptions. The table below provides details of the current SCA in effect at the reporting period-end as well as the prior SCA.
| | | | |
| | | |
| | | Current SCA | | Prior SCA |
| | |
Term of Commitment | | 9/30/2022 - 9/28/2023 | | 10/1/2021 – 9/29/2022 |
| | |
Total Commitment | | $ 1,200,000,000 | | $ 1,200,000,000 |
| | |
Annualized Commitment Fee on the Unused Portion of the SCA | | 0.15% | | 0.15% |
| | |
Annualized Interest Rate on Borrowings | | 1.00% plus the higher of (1) the effective federal funds rate, (2) the daily SOFR rate plus 0.10% or (3) zero percent | | 1.20% plus the higher of (1) the effective federal funds rate, (2) the one-month LIBOR rate or (3) zero percent |
Certain affiliated registered investment companies that are parties to the SCA include portfolios that are subject to a predetermined mathematical formula used to manage certain benefit guarantees offered under variable annuity contracts. The formula may result in large scale asset flows into and out of these portfolios. Consequently, these portfolios may be more likely to utilize the SCA for purposes of funding redemptions. It may be possible for those portfolios to fully exhaust the committed amount of the SCA, thereby requiring the Manager to allocate available funding per a Board-approved methodology designed to treat the Participating Funds in the SCA equitably.
The Fund did not utilize the SCA during the year ended October 31, 2022.
| 9. | Risks of Investing in the Fund |
The Fund’s risks include, but are not limited to, some or all of the risks discussed below. For further information on the Fund’s risks, please refer to the Fund’s Prospectus and Statement of Additional Information.
Country Risk: Changes in the business environment may adversely affect operating profits or the value of assets in a specific country. For example, financial factors such as currency
| | | | |
PGIM Jennison International Opportunities Fund | | | 43 | |
Notes to Financial Statements (continued)
controls, devaluation or regulatory changes or stability factors such as mass riots, civil war and other potential events may contribute to companies’ operational risks.
Currency Risk: The Fund’s net asset value could decline as a result of changes in exchange rates, which could adversely affect the Fund’s investments in currencies, or in securities that trade in, and receive revenues related to, currencies, or in derivatives that provide exposure to currencies. Certain foreign countries may impose restrictions on the ability of issuers of foreign securities to make payment of principal and interest or dividends to investors located outside the country, due to blockage of foreign currency exchanges or otherwise.
Economic and Market Events Risk: Events in the U.S. and global financial markets, including actions taken by the U.S. Federal Reserve or foreign central banks to stimulate or stabilize economic growth or the functioning of the securities markets, or otherwise reduce inflation may at times result in unusually high market volatility, which could negatively impact performance. Governmental efforts to curb inflation often have negative effects on the level of economic activity. Relatively reduced liquidity in credit and fixed income markets could adversely affect issuers worldwide.
Emerging Markets Risk: The risks of foreign investments are greater for investments in or exposed to emerging markets. Emerging market countries typically have economic and political systems that are less fully developed, and can be expected to be less stable, than those of more developed countries. For example, the economies of such countries can be subject to rapid and unpredictable rates of inflation or deflation. Low trading volumes may result in a lack of liquidity and price volatility. Emerging market countries may have policies that restrict investment by non-U.S. investors, or that prevent non-U.S. investors from withdrawing their money at will.
The Fund may invest in some emerging markets that subject it to risks such as those associated with illiquidity, custody of assets, different settlement and clearance procedures and asserting legal title under a developing legal and regulatory regime to a greater degree than in developed markets or even in other emerging markets.
Equity and Equity-Related Securities Risk: Equity and equity-related securities may be subject to changes in value, and their values may be more volatile than those of other asset classes. In addition to an individual security losing value, the value of the equity markets or a sector in which the Fund invests could go down. Different parts of a market can react differently to adverse issuer, market, regulatory, political and economic developments.
Foreign Securities Risk: Investments in securities of non-U.S. issuers (including those denominated in U.S. dollars) may involve more risk than investing in securities of U.S. issuers. Foreign political, economic and legal systems, especially those in developing and
emerging market countries, may be less stable and more volatile than in the United States. Foreign legal systems generally have fewer regulatory requirements than the U.S. legal system, particularly those of emerging markets. In general, less information is publicly available with respect to non-U.S. companies than U.S. companies. Non-U.S. companies generally are not subject to the same accounting, auditing, and financial reporting standards as are U.S. companies. Additionally, the changing value of foreign currencies and changes in exchange rates could also affect the value of the assets the Fund holds and the Fund’s performance. Certain foreign countries may impose restrictions on the ability of issuers of foreign securities to make payment of principal and interest or dividends to investors located outside the country, due to blockage of foreign currency exchanges or otherwise. Investments in emerging markets are subject to greater volatility and price declines.
In addition, the Fund’s investments in non-U.S. securities may be subject to the risks of nationalization or expropriation of assets, imposition of currency exchange controls or restrictions on the repatriation of non-U.S. currency, confiscatory taxation and adverse diplomatic developments. Special U.S. tax considerations may apply.
Geographic Concentration Risk: The Fund’s performance may be closely tied to the market, economic, political, regulatory or other conditions in the countries or regions in which the Fund invests. This can result in more pronounced risks based upon conditions that impact one or more countries or regions more or less than other countries or regions.
Growth Style Risk: The Fund’s growth style may subject the Fund to above-average fluctuations as a result of seeking higher than average capital growth. Historically, growth stocks have performed best during later stages of economic expansion and value stocks have performed best during periods of economic recovery. Since the Fund follows a growth investment style, there is the risk that the growth investment style may be out of favor for long periods of time. At times when the style is out of favor, the Fund may underperform the market in general, its benchmark and other mutual funds.
Increase in Expenses Risk: Your actual cost of investing in the Fund may be higher than the expenses shown in the expense table in the Fund’s prospectus for a variety of reasons. For example, expense ratios may be higher than those shown if average net assets decrease. Net assets are more likely to decrease and Fund expense ratios are more likely to increase when markets are volatile. Active and frequent trading of Fund securities can increase expenses.
Investments in China Risk: Investments in China subject the Fund to risks specific to China and may make it more volatile than other funds. Over the last few decades, the Chinese government has undertaken reform of economic and market practices and has expanded the sphere of private ownership of property in China. However, Chinese markets generally continue to experience inefficiency, volatility and pricing anomalies resulting from governmental influence, a lack of publicly available information and/or political and social instability. Internal social unrest or confrontations with other neighboring countries, including military conflicts in response to such events, may also disrupt economic
| | | | |
PGIM Jennison International Opportunities Fund | | | 45 | |
Notes to Financial Statements (continued)
development in China and result in a greater risk of currency fluctuations, currency non-convertibility, interest rate fluctuations and higher rates of inflation.
China has experienced security concerns, such as terrorism and strained international relations. Incidents involving China’s or the region’s security may cause uncertainty in Chinese markets and may adversely affect the Chinese economy and the Fund’s investments. Export growth continues to be a major driver of China’s rapid economic growth. Reduction in spending on Chinese products and services, institution of additional tariffs or other trade barriers, including as a result of heightened trade tensions between China and the U.S., or a downturn in any of the economies of China’s key trading partners may have an adverse impact on the Chinese economy or the Fund. For example, a series of executive orders issued between November 2020 and June 2021 prohibit the Fund from investing in certain companies identified by the U.S. government as “Chinese Military Industrial Complex Companies.” The restrictions in these executive orders may force the subadviser to sell certain positions and may restrict the Fund from future investments the subadviser deems otherwise attractive.
Chinese companies, including Chinese companies that are listed on U.S. exchanges, are not subject to the same degree of regulatory requirements, accounting standards or auditor oversight as companies in more developed countries, and as a result, information about the Chinese securities in which the Fund invests may be less reliable or complete. There may be significant obstacles to obtaining information necessary for investigations into or litigation against Chinese companies and shareholders may have limited legal remedies.
Large Shareholder and Large Scale Redemption Risk: Certain individuals, accounts, funds (including funds affiliated with the Manager) or institutions, including the Manager and its affiliates, may from time to time own or control a substantial amount of the Fund’s shares. There is no requirement that these entities maintain their investment in the Fund. There is a risk that such large shareholders or that the Fund’s shareholders generally may redeem all or a substantial portion of their investments in the Fund in a short period of time, which could have a significant negative impact on the Fund’s NAV, liquidity, and brokerage costs. Large redemptions could also result in tax consequences to shareholders and impact the Fund’s ability to implement its investment strategy. The Fund’s ability to pursue its investment objective after one or more large scale redemptions may be impaired and, as a result, the Fund may invest a larger portion of its assets in cash or cash equivalents.
Liquidity Risk: Liquidity risk is the risk that the Fund could not meet requests to redeem shares issued by the Fund without significant dilution of remaining investors’ interests in the Fund. The Fund may invest in instruments that trade in lower volumes and are more illiquid than other investments. If the Fund is forced to sell these investments to pay redemption proceeds or for other reasons, the Fund may lose money. In addition, when there is no
willing buyer and investments cannot be readily sold at the desired time or price, the Fund may have to accept a lower price or may not be able to sell the instrument at all. An inability to sell a portfolio position can adversely affect the Fund’s value or prevent the Fund from being able to take advantage of other investment opportunities.
Management Risk: Actively managed funds are subject to management risk. The subadviser will apply investment techniques and risk analyses in making investment decisions for the Fund, but the subadviser judgments about the attractiveness, value or market trends affecting a particular security, industry or sector or about market movements may be incorrect. Additionally, the investments selected for the Fund may underperform the markets in general, the Fund’s benchmark and other funds with similar investment objectives.
Market Capitalization Risk: The Fund may invest in companies of any market capitalization. Generally, the stock prices of small- and mid-cap companies are less stable than the prices of large-cap stocks and may present greater risks. Large capitalization companies as a group could fall out of favor with the market, causing the Fund to underperform compared to investments that focus on smaller capitalized companies.
Market Disruption and Geopolitical Risks: Market disruption can be caused by economic, financial or political events and factors, including but not limited to, international wars or conflicts (including Russia’s military invasion of Ukraine), geopolitical developments (including trading and tariff arrangements, sanctions and cybersecurity attacks), instability in regions such as Asia, Eastern Europe and the Middle East, terrorism, natural disasters and public health epidemics (including the outbreak of COVID-19 globally).
The extent and duration of such events and resulting market disruptions cannot be predicted, but could be substantial and could magnify the impact of other risks to the Fund. These and other similar events could adversely affect the U.S. and foreign financial markets and lead to increased market volatility, reduced liquidity in the securities markets, significant negative impacts on issuers and the markets for certain securities and commodities and/or government intervention. They may also cause short- or long-term economic uncertainties in the United States and worldwide. As a result, whether or not the Fund invests in securities of issuers located in or with significant exposure to the countries directly affected, the value and liquidity of the Fund’s investments may be negatively impacted. Further, due to closures of certain markets and restrictions on trading certain securities, the value of certain securities held by the Fund could be significantly impacted, which could lead to such securities being valued at zero.
COVID-19 and the related governmental and public responses have had and may continue to have an impact on the Fund’s investments and net asset value and have led and may continue to lead to increased market volatility and the potential for illiquidity in certain classes of securities and sectors of the market. They have also had and may continue to result in periods of business disruption, business closures, inability to obtain raw materials, supplies and component parts, and reduced or disrupted operations for the issuers in which
| | | | |
PGIM Jennison International Opportunities Fund | | | 47 | |
Notes to Financial Statements (continued)
the Fund invests. The occurrence, reoccurrence and pendency of public health epidemics could adversely affect the economies and financial markets either in specific countries or worldwide.
Market Risk: Securities markets may be volatile and the market prices of the Fund’s securities may decline. Securities fluctuate in price based on changes in an issuer’s financial condition and overall market and economic conditions. If the market prices of the securities owned by the Fund fall, the value of your investment in the Fund will decline.
Report of Independent Registered Public Accounting Firm
To the Board of Directors of Prudential World Fund, Inc. and Shareholders of PGIM Jennison International Opportunities Fund
Opinion on the Financial Statements
We have audited the accompanying statement of assets and liabilities, including the schedule of investments, of PGIM Jennison International Opportunities Fund (one of the funds constituting Prudential World Fund, Inc., referred to hereafter as the “Fund”) as of October 31, 2022, the related statement of operations for the year ended October 31, 2022, the statements of changes in net assets for each of the two years in the period ended October 31, 2022, including the related notes, and the financial highlights for each of the three years in the period ended October 31, 2022 (collectively referred to as the “financial statements”). In our opinion, the financial statements present fairly, in all material respects, the financial position of the Fund as of October 31, 2022, the results of its operations for the year then ended, the changes in its net assets for each of the two years in the period ended October 31 2022 and the financial highlights for each of the three years in the period ended October 31, 2022 in conformity with accounting principles generally accepted in the United States of America.
The financial statements of the Fund as of and for the year ended October 31, 2019 and the financial highlights for each of the periods ended on or prior to October 31, 2019 (not presented herein, other than the financial highlights) were audited by other auditors whose report dated December 16, 2019 expressed an unqualified opinion on those financial statements and financial highlights.
Basis for Opinion
These financial statements are the responsibility of the Fund’s management. Our responsibility is to express an opinion on the Fund’s financial statements based on our audits. We are a public accounting firm registered with the Public Company Accounting Oversight Board (United States) (PCAOB) and are required to be independent with respect to the Fund in accordance with the U.S. federal securities laws and the applicable rules and regulations of the Securities and Exchange Commission and the PCAOB.
We conducted our audits of these financial statements in accordance with the standards of the PCAOB. Those standards require that we plan and perform the audit to obtain reasonable assurance about whether the financial statements are free of material misstatement, whether due to error or fraud.
Our audits included performing procedures to assess the risks of material misstatement of the financial statements, whether due to error or fraud, and performing procedures that respond to those risks. Such procedures included examining, on a test basis, evidence regarding the amounts and disclosures in the financial statements. Our audits also included evaluating the accounting principles used and significant estimates made by management, as well as evaluating the overall presentation of the financial statements. Our procedures included confirmation of securities owned as of October 31, 2022 by correspondence with the custodian, transfer agent and brokers; when replies were not received from brokers, we performed other auditing procedures. We believe that our audits provide a reasonable basis for our opinion.
/s/PricewaterhouseCoopers LLP
New York, New York
December 16, 2022
We have served as the auditor of one or more investment companies in the PGIM Retail Funds complex since 2020.
| | | | |
PGIM Jennison International Opportunities Fund | | | 49 | |
Tax Information (unaudited)
We are advising you that during the fiscal year ended October 31, 2022, the Fund reports the maximum amount allowed per share, but not less than $0.03 for Class A, C, R, Z, R2, R4, and R6 shares as a capital gain distribution in accordance with Section 852(b)(3)(C) of the Internal Revenue Code.
In January 2023, you will be advised on IRS Form 1099-DIV or substitute 1099-DIV as to the federal tax status of the dividends received by you in calendar year 2022.
INFORMATION ABOUT BOARD MEMBERS AND OFFICERS (unaudited)
Information about Board Members and Officers of the Fund is set forth below. Board Members who are not deemed to be “interested persons” of the Fund, as defined in the 1940 Act, are referred to as “Independent Board Members.” Board Members who are deemed to be “interested persons” of the Fund are referred to as “Interested Board Members.” The Board Members are responsible for the overall supervision of the operations of the Fund and perform the various duties imposed on the directors of investment companies by the 1940 Act. The Board in turn elects the Officers, who are responsible for administering the day-to-day operations of the Fund.
| | | | | | |
| | | |
| Independent Board Members | | | | |
| | | | |
Name Year of Birth Position(s) Portfolios Overseen | | Principal Occupation(s) During Past Five Years | | Other Directorships Held During Past Five Years | | Length of Board Service |
| | | | |
Ellen S. Alberding 1958 Board Member Portfolios Overseen: 97 | | President and Board Member, The Joyce Foundation (charitable foundation) (since 2002); formerly Vice Chair, City Colleges of Chicago (community college system) (2011-2015); Trustee, National Park Foundation (charitable foundation for national park system) (2009-2018); Trustee, Economic Club of Chicago (2009-2016); Trustee, Loyola University (since 2018). | | None. | | Since September 2013 |
| | | | |
Kevin J. Bannon 1952 Board Member Portfolios Overseen: 97 | | Retired; formerly Managing Director (April 2008-May 2015) and Chief Investment Officer (October 2008-November 2013) of Highmount Capital LLC (registered investment adviser); formerly Executive Vice President and Chief Investment Officer (April 1993-August 2007) of Bank of New York Company; President (May 2003-May 2007) of BNY Hamilton Family of Mutual Funds. | | Director of Urstadt Biddle Properties (equity real estate investment trust) (since September 2008). | | Since July 2008 |
PGIM Jennison International Opportunities Fund
| | | | | | |
| | | |
| Independent Board Members | | | | |
| | | | |
Name Year of Birth Position(s) Portfolios Overseen | | Principal Occupation(s) During Past Five Years | | Other Directorships Held During Past Five Years | | Length of Board Service |
| | | | |
Linda W. Bynoe 1952 Board Member Portfolios Overseen: 94 | | President and Chief Executive Officer (since March 1995) and formerly Chief Operating Officer (December 1989-February 1995) of Telemat Limited LLC (formerly Telemat Ltd) (management consulting); formerly Vice President (January 1985-June 1989) at Morgan Stanley & Co. (broker-dealer). | | Trustee of Equity Residential (residential real estate) (since December 2009); Director of Northern Trust Corporation (financial services) (since April 2006); formerly Director of Anixter International, Inc. (communication products distributor) (January 2006-June 2020). | | Since March 2005 |
| | | | |
Barry H. Evans 1960 Board Member Portfolios Overseen: 96 | | Retired; formerly President (2005-2016), Global Chief Operating Officer (2014-2016), Chief Investment Officer - Global Head of Fixed Income (1998-2014), and various portfolio manager roles (1986-2006), Manulife Asset Management (asset management). | | Formerly Director, Manulife Trust Company (2011-2018); formerly Director, Manulife Asset Management Limited (2015-2017); formerly Chairman of the Board of Directors of Manulife Asset Management U.S. (2005-2016); formerly Chairman of the Board, Declaration Investment Management and Research (2008-2016). | | Since September 2017 |
| | | | |
Keith F. Hartstein 1956 Board Member & Independent Chair Portfolios Overseen: 97 | | Retired; Member (November 2014-September 2022) of the Governing Council of the Independent Directors Council (IDC) (organization of independent mutual fund directors); formerly Executive Committee of the IDC Board of Governors (October 2019-December 2021); formerly President and Chief Executive Officer (2005-2012), Senior Vice President (2004-2005), Senior Vice President of Sales and Marketing (1997-2004), and various executive management positions (1990-1997), John Hancock Funds, LLC (asset management); Chairman, Investment Company Institute’s Sales Force Marketing Committee (2003-2008). | | None. | | Since September 2013 |
Visit our website at pgim.com/investments
| | | | | | |
| | | |
| Independent Board Members | | | | |
| | | | |
Name Year of Birth Position(s) Portfolios Overseen | | Principal Occupation(s) During Past Five Years | | Other Directorships Held During Past Five Years | | Length of Board Service |
| | | | |
Laurie Simon Hodrick 1962 Board Member Portfolios Overseen: 93 | | A. Barton Hepburn Professor Emerita of Economics in the Faculty of Business, Columbia Business School (since 2018); Visiting Fellow at the Hoover Institution, Stanford University (since 2015); Sole Member, ReidCourt LLC (since 2008) (a consulting firm); formerly Visiting Professor of Law, Stanford Law School (2015-2021); formerly A. Barton Hepburn Professor of Economics in the Faculty of Business, Columbia Business School (1996-2017); formerly Managing Director, Global Head of Alternative Investment Strategies, Deutsche Bank (2006-2008). | | Independent Director, Andela (since January 2022) (global talent network); Independent Director, Roku (since December 2020) (communication services); formerly Independent Director, Synnex Corporation (2019-2021) (information technology); formerly Independent Director, Kabbage, Inc. (2018-2020) (financial services); formerly Independent Director, Corporate Capital Trust (2017-2018) (a business development company). | | Since September 2017 |
| | | | |
Brian K. Reid 1961 Board Member Portfolios Overseen: 96 | | Retired; formerly Chief Economist for the Investment Company Institute (ICI) (2005-2017); formerly Senior Economist and Director of Industry and Financial Analysis at the ICI (1998-2004); formerly Senior Economist, Industry and Financial Analysis at the ICI (1996-1998); formerly Staff Economist at the Federal Reserve Board (1989-1996); Director, ICI Mutual Insurance Company (2012-2017). | | None. | | Since March 2018 |
PGIM Jennison International Opportunities Fund
| | | | | | |
| | | |
| Independent Board Members | | | | |
| | | | |
Name Year of Birth Position(s) Portfolios Overseen | | Principal Occupation(s) During Past Five Years | | Other Directorships Held During Past Five Years | | Length of Board Service |
| | | | |
Grace C. Torres 1959 Board Member Portfolios Overseen: 96 | | Retired; formerly Treasurer and Principal Financial and Accounting Officer of the PGIM Funds, Target Funds, Advanced Series Trust, Prudential Variable Contract Accounts and The Prudential Series Fund (1998-June 2014); Assistant Treasurer (March 1999-June 2014) and Senior Vice President (September 1999-June 2014) of PGIM Investments LLC; Assistant Treasurer (May 2003-June 2014) and Vice President (June 2005-June 2014) of AST Investment Services, Inc.; Senior Vice President and Assistant Treasurer (May 2003-June 2014) of Prudential Annuities Advisory Services, Inc. | | Director (since January 2018) of OceanFirst Financial Corp. and OceanFirst Bank; formerly Director (July 2015-January 2018) of Sun Bancorp, Inc. N.A. and Sun National Bank. | | Since November 2014 |
Visit our website at pgim.com/investments
| | | | | | |
| | | |
| Interested Board Members | | | | |
| | | | |
Name Year of Birth Position(s) Portfolios Overseen | | Principal Occupation(s) During Past Five Years | | Other Directorships Held During Past Five Years | | Length of Board Service |
| | | | |
Stuart S. Parker 1962 Board Member & President Portfolios Overseen: 96 | | President, Chief Executive Officer, Chief Operating Officer and Officer in Charge of PGIM Investments LLC (formerly known as Prudential Investments LLC) (since January 2012); President and Principal Executive Officer (“PEO”) (since September 2022) of the PGIM Private Credit Fund; President and PEO (since March 2022) of the PGIM Private Real Estate Fund, Inc.; formerly Executive Vice President of Jennison Associates LLC and Head of Retail Distribution of PGIM Investments LLC (June 2005-December 2011); Investment Company Institute - Board of Governors (since May 2012). | | None. | | Since January 2012 |
| | | | |
Scott E. Benjamin 1973 Board Member & Vice President Portfolios Overseen: 97 | | Executive Vice President (since May 2009) of PGIM Investments LLC; Vice President (since June 2012) of Prudential Investment Management Services LLC; Executive Vice President (since September 2009) of AST Investment Services, Inc.; Senior Vice President of Product Development and Marketing, PGIM Investments (since February 2006); Vice President (since September 2022) of the PGIM Private Credit Fund; Vice President (since March 2022) of the PGIM Private Real Estate Fund, Inc.; formerly Vice President of Product Development and Product Management, PGIM Investments LLC (2003-2006). | | None. | | Since March 2010 |
PGIM Jennison International Opportunities Fund
| | | | |
| |
| Fund Officers(a) |
| | | |
Name Year of Birth
Fund Position | | Principal Occupation(s) During Past Five Years | | Length of
Service as Fund
Officer |
| | | |
Claudia DiGiacomo 1974 Chief Legal Officer | | Chief Legal Officer (since September 2022) of the PGIM Private Credit Fund; Chief Legal Officer (since July 2022) of the PGIM Private Real Estate Fund, Inc.; Chief Legal Officer, Executive Vice President and Secretary of PGIM Investments LLC (since August 2020); Chief Legal Officer of Prudential Mutual Fund Services LLC (since August 2020); Chief Legal Officer of PIFM Holdco, LLC (since August 2020); Vice President and Corporate Counsel (since January 2005) of Prudential; and Corporate Counsel of AST Investment Services, Inc. (since August 2020); formerly Vice President and Assistant Secretary of PGIM Investments LLC (2005-2020); formerly Associate at Sidley Austin Brown & Wood LLP (1999-2004). | | Since December 2005 |
| | | |
Isabelle Sajous 1976 Chief Compliance Officer | | Chief Compliance Officer (since April 2022) of PGIM Investments LLC, the PGIM Funds, Target Funds, PGIM ETF Trust, PGIM Global High Yield Fund, Inc., PGIM High Yield Bond Fund, Inc., PGIM Short Duration High Yield Opportunities Fund, Advanced Series Trust, The Prudential Series Fund and Prudential’s Gibraltar Fund, Inc.; Chief Compliance Officer (since September 2022) of the PGIM Private Credit Fund; Chief Compliance Officer (since March 2022) of the PGIM Private Real Estate Fund, Inc.; Vice President, Compliance of PGIM Investments LLC (since December 2020); formerly Director, Compliance (July 2018-December 2020) of Credit Suisse Asset Management LLC; and Vice President, Associate General Counsel & Deputy Chief Compliance Officer of Cramer Rosenthal McGlynn, LLC (August 2014-July 2018). | | Since April 2022 |
| | | |
Andrew R. French 1962 Secretary | | Vice President (since December 2018) of PGIM Investments LLC; Secretary (since September 2022) of the PGIM Private Credit Fund; Secretary (since March 2022) of the PGIM Private Real Estate Fund, Inc.; formerly Vice President and Corporate Counsel (2010-2018) of Prudential; formerly Director and Corporate Counsel (2006-2010) of Prudential; Vice President and Assistant Secretary (since January 2007) of PGIM Investments LLC; Vice President and Assistant Secretary (since January 2007) of Prudential Mutual Fund Services LLC. | | Since October 2006 |
| | | |
Melissa Gonzalez 1980 Assistant Secretary | | Vice President and Corporate Counsel (since September 2018) of Prudential; Vice President and Assistant Secretary (since August 2020) of PGIM Investments LLC; Assistant Secretary (since September 2022) of the PGIM Private Credit Fund; Assistant Secretary (since March 2022) of the PGIM Private Real Estate Fund, Inc.; formerly Director and Corporate Counsel (March 2014-September 2018) of Prudential. | | Since March 2020 |
Visit our website at pgim.com/investments
| | | | |
| |
| Fund Officers(a) |
| | | |
Name Year of Birth
Fund Position | | Principal Occupation(s) During Past Five Years | | Length of Service as Fund Officer |
| | | |
Patrick E. McGuinness 1986 Assistant Secretary | | Vice President and Assistant Secretary (since August 2020) of PGIM Investments LLC; Director and Corporate Counsel (since February 2017) of Prudential; Assistant Secretary (since September 2022) of the PGIM Private Credit Fund; Assistant Secretary (since March 2022) of the PGIM Private Real Estate Fund, Inc. | | Since June 2020 |
| | | |
Debra Rubano 1975 Assistant Secretary | | Vice President and Corporate Counsel (since November 2020) of Prudential; Assistant Secretary (since September 2022) of the PGIM Private Credit Fund; Assistant Secretary (since March 2022) of the PGIM Private Real Estate Fund, Inc; formerly Director and Senior Counsel of Allianz Global Investors U.S. Holdings LLC (2010-2020) and Assistant Secretary of numerous funds in the Allianz fund complex (2015-2020). | | Since December 2020 |
| | | |
Kelly A. Coyne 1968 Assistant Secretary | | Director, Investment Operations of Prudential Mutual Fund Services LLC (since 2010); Assistant Secretary (since September 2022) of the PGIM Private Credit Fund; Assistant Secretary (since March 2022) of the PGIM Private Real Estate Fund, Inc. | | Since March 2015 |
| | | |
Christian J. Kelly 1975 Treasurer and Principal Financial and Accounting Officer | | Vice President, Head of Fund Administration of PGIM Investments LLC (since November 2018); Principal Financial Officer (since September 2022) of the PGIM Private Credit Fund; Principal Financial Officer (since March 2022) of the PGIM Private Real Estate Fund, Inc.; formerly, Treasurer and Principal Accounting Officer (March 2022- July 2022) of the PGIM Private Real Estate Fund, Inc.; formerly Director of Fund Administration of Lord Abbett & Co. LLC (2009-2018), Treasurer and Principal Accounting Officer of the Lord Abbett Family of Funds (2017-2018); Director of Accounting, Avenue Capital Group (2008-2009); Senior Manager, Investment Management Practice of Deloitte & Touche LLP (1998-2007). | | Since January 2019 |
| | | |
Lana Lomuti 1967 Assistant Treasurer | | Vice President (since 2007) and Director (2005-2007), within PGIM Investments Fund Administration; formerly Assistant Treasurer (December 2007-February 2014) of The Greater China Fund, Inc. | | Since April 2014 |
| | | |
Russ Shupak 1973 Assistant Treasurer | | Vice President (since 2017) and Director (2013-2017), within PGIM Investments Fund Administration; Treasurer and Principal Accounting Officer (since July 2022) of the PGIM Private Real Estate Fund, Inc.; Assistant Treasurer (since September 2022) of the PGIM Private Credit Fund; formerly Assistant Treasurer (March 2022 – July 2022) of the PGIM Private Real Estate Fund, Inc. | | Since October 2019 |
| | | |
Deborah Conway 1969 Assistant Treasurer | | Vice President (since 2017) and Director (2007-2017), within PGIM Investments Fund Administration. | | Since October 2019 |
PGIM Jennison International Opportunities Fund
| | | | |
| |
| Fund Officers(a) |
| | | |
Name Year of Birth
Fund Position | | Principal Occupation(s) During Past Five Years | | Length of Service as Fund Officer |
| | | |
Elyse M. McLaughlin 1974 Assistant Treasurer | | Vice President (since 2017) and Director (2011-2017), within PGIM Investments Fund Administration; Treasurer and Principal Accounting Officer (since September 2022) of the PGIM Private Credit Fund; Assistant Treasurer (since March 2022) of the PGIM Private Real Estate Fund, Inc. | | Since October 2019 |
| | | |
Kelly Florio 1978 Anti-Money Laundering Compliance Officer | | Vice President, Corporate Compliance, Global Compliance Programs and Compliance Risk Management (since December 2021) of Prudential; formerly, Head of Fraud Risk Management (October 2019 to December 2021) at New York Life Insurance Company; formerly, Head of Key Risk Area Operations (November 2018 to October 2019), Director of the US Anti-Money Laundering Compliance Unit (2009-2018) and Bank Loss Prevention Associate (2006 -2009) at MetLife. | | Since June 2022 |
(a) Excludes Mr. Parker and Mr. Benjamin, interested Board Members who also serve as President and Vice President, respectively.
Explanatory Notes to Tables:
| ∎ | | Board Members are deemed to be “Interested,” as defined in the 1940 Act, by reason of their affiliation with PGIM Investments LLC and/or an affiliate of PGIM Investments LLC. |
| ∎ | | Unless otherwise noted, the address of all Board Members and Officers is c/o PGIM Investments LLC, 655 Broad Street, Newark, New Jersey 07102-4410. |
| ∎ | | There is no set term of office for Board Members or Officers. The Board Members have adopted a retirement policy, which calls for the retirement of Board Members on December 31 of the year in which they reach the age of 75. |
| ∎ | | “Other Directorships Held” includes all directorships of companies required to register or file reports with the SEC under the 1934 Act (that is, “public companies”) or other investment companies registered under the 1940 Act. |
| ∎ | | “Portfolios Overseen” includes all investment companies managed by PGIM Investments LLC. The investment companies for which PGIM Investments LLC serves as manager include the PGIM Mutual Funds, Target Funds, The Prudential Variable Contract Accounts, PGIM ETF Trust, PGIM Private Real Estate Fund, Inc., PGIM Private Credit Fund, PGIM High Yield Bond Fund, Inc., PGIM Global High Yield Fund, Inc., PGIM Short Duration High Yield Opportunities Fund, The Prudential Series Fund, Prudential’s Gibraltar Fund, Inc. and the Advanced Series Trust. |
| ∎ | | As used in the Fund Officers table “Prudential” means The Prudential Insurance Company of America. |
Visit our website at pgim.com/investments
Approval of Advisory Agreements (unaudited)
The Fund’s Board of Directors
The Board of Directors (the “Board”) of PGIM Jennison International Opportunities Fund (the “Fund”)1 consists of ten individuals, eight of whom are not “interested persons” of the Fund, as defined in the Investment Company Act of 1940, as amended (the “1940 Act”) (the “Independent Directors”). The Board is responsible for the oversight of the Fund and its operations, and performs the various duties imposed on the directors of investment companies by the 1940 Act. The Independent Directors have retained independent legal counsel to assist them in connection with their duties. The Chair of the Board is an Independent Director. The Board has established five standing committees: the Audit Committee, the Nominating and Governance Committee, the Compliance Committee and two Investment Committees. Each committee is chaired by, and composed of, Independent Directors.
Annual Approval of the Fund’s Advisory Agreements
As required under the 1940 Act, the Board determines annually whether to renew the Fund’s management agreement with PGIM Investments LLC (“PGIM Investments”) and the Fund’s subadvisory agreement with Jennison Associates LLC (“Jennison”). In considering the renewal of the agreements, the Board, including all of the Independent Directors, met on May 26 and June 7-9, 2022 (the “Board Meeting”) and approved the renewal of the agreements through July 31, 2023, after concluding that the renewal of the agreements was in the best interests of the Fund and its shareholders.
In advance of the meetings, the Board requested and received materials relating to the agreements, and had the opportunity to ask questions and request further information in connection with its consideration. Among other things, the Board considered comparative fee information from PGIM Investments and Jennison. Also, the Board considered comparisons with other mutual funds in relevant Peer Universes and Peer Groups, as is further discussed below.
In approving the agreements, the Board, including the Independent Directors advised by independent legal counsel, considered the factors it deemed relevant, including the nature, quality and extent of services provided by PGIM Investments and the subadviser, the performance of the Fund, the profitability of PGIM Investments and its affiliates, expenses and fees, and the potential for economies of scale that may be shared with the Fund and its shareholders as the Fund’s assets grow. In their deliberations, the Directors did not identify any single factor which alone was responsible for the Board’s decision to approve the agreements with respect to the Fund. In connection with its deliberations, the Board considered information provided by PGIM Investments throughout the year at regular Board meetings, presentations from portfolio managers and other information, as well as information furnished at or in advance of the Board Meeting.
The Directors determined that the overall arrangements between the Fund and PGIM Investments, which serves as the Fund’s investment manager pursuant to a
1 PGIM Jennison International Opportunities Fund is a series of Prudential World Fund, Inc.
PGIM Jennison International Opportunities Fund
Approval of Advisory Agreements (continued)
management agreement, and between PGIM Investments and Jennison, which serves as the Fund’s subadviser pursuant to the terms of a subadvisory agreement with PGIM Investments, are in the best interests of the Fund and its shareholders in light of the services performed, fees charged and such other matters as the Directors considered relevant in the exercise of their business judgment.
The material factors and conclusions that formed the basis for the Directors’ reaching their determinations to approve the continuance of the agreements are separately discussed below.
Nature, Quality and Extent of Services
The Board received and considered information regarding the nature, quality and extent of services provided to the Fund by PGIM Investments and Jennison. The Board noted that Jennison is affiliated with PGIM Investments. The Board considered the services provided by PGIM Investments, including but not limited to the oversight of the subadviser for the Fund, as well as the provision of fund recordkeeping, compliance and other services to the Fund, and PGIM Investments’ role as administrator for the Fund’s liquidity risk management program. With respect to PGIM Investments’ oversight of the subadviser, the Board noted that PGIM Investments’ Strategic Investment Research Group (“SIRG”), which is a business unit of PGIM Investments, is responsible for monitoring and reporting to PGIM Investments’ senior management on the performance and operations of the subadviser. The Board also considered that PGIM Investments pays the salaries of all of the officers and interested Directors of the Fund who are part of Fund management. The Board also considered the investment subadvisory services provided by Jennison, including investment research and security selection, as well as adherence to the Fund’s investment restrictions and compliance with applicable Fund policies and procedures. The Board considered PGIM Investments’ evaluation of the subadviser, as well as PGIM Investments’ recommendation, based on its review of the subadviser, to renew the subadvisory agreement.
The Board considered the qualifications, backgrounds and responsibilities of PGIM Investments’ senior management responsible for the oversight of the Fund and Jennison, and also considered the qualifications, backgrounds and responsibilities of Jennison’s portfolio managers who are responsible for the day-to-day management of the Fund’s portfolio. The Board was provided with information pertaining to PGIM Investments’ and Jennison’s organizational structure, senior management, investment operations, and other relevant information pertaining to both PGIM Investments and Jennison. The Board also noted that it received favorable compliance reports from the Fund’s Chief Compliance Officer (“CCO”) as to both PGIM Investments and Jennison.
The Board concluded that it was satisfied with the nature, extent and quality of the investment management services provided by PGIM Investments and the subadvisory services provided to the Fund by Jennison, and that there was a reasonable basis on which to conclude that the Fund benefits from the services provided by PGIM Investments and Jennison under the management and subadvisory agreements.
Visit our website at pgim.com/investments
Costs of Services and Profits Realized by PGIM Investments
The Board was provided with information on the profitability of PGIM Investments and its affiliates in serving as the Fund’s investment manager. The Board discussed with PGIM Investments the methodology utilized in assembling the information regarding profitability and considered its reasonableness. The Board recognized that it is difficult to make comparisons of profitability from fund management contracts because comparative information is not generally publicly available and is affected by numerous factors, including the structure of the particular adviser, the types of funds it manages, its business mix, numerous assumptions regarding allocations and the adviser’s capital structure and cost of capital. Taking these factors into account, the Board concluded that the profitability of PGIM Investments and its affiliates in relation to the services rendered was not unreasonable.
Economies of Scale
The Board received and discussed information concerning economies of scale that PGIM Investments may realize as the Fund’s assets grow beyond current levels. The Board noted that the management fee schedule for the Fund includes breakpoints, which have the effect of reducing the fee rate as assets increase. During the course of time, the Board has considered information regarding the launch date of the Fund, the management fees of the Fund compared to those of similarly managed funds, and PGIM Investments’ investment in the Fund over time. The Board noted that economies of scale may be shared with the Fund in several ways, including low management fees from inception, additional technological and personnel investments to enhance shareholder services, and maintaining existing expense structures in the face of a rising cost environment. The Board considered PGIM Investments’ assertion that it continually evaluates the management fee schedule of the Fund and the potential to share economies of scale through breakpoints or fee waivers as asset levels increase.
The Board recognized the inherent limitations of any analysis of economies of scale, stemming largely from the Board’s understanding that most of PGIM Investments’ costs are not specific to individual funds, but rather are incurred across a variety of products and services.
Other Benefits to PGIM Investments and Jennison
The Board considered potential ancillary benefits that might be received by PGIM Investments, Jennison and their affiliates as a result of their relationship with the Fund. The Board concluded that potential benefits to be derived by PGIM Investments included transfer agency fees received by the Fund’s transfer agent (which is affiliated with PGIM Investments), as well as benefits to its reputation or other intangible benefits resulting from PGIM Investments’ association with the Fund. The Board concluded that the potential benefits to be derived by Jennison included the ability to use soft dollar credits, as well as the potential benefits consistent with those generally resulting from an increase in assets under management, specifically, potential access to additional research resources and benefits to its reputation. The Board concluded that the benefits
PGIM Jennison International Opportunities Fund
Approval of Advisory Agreements (continued)
derived by PGIM Investments and Jennison were consistent with the types of benefits generally derived by investment managers and subadvisers to mutual funds.
Performance of the Fund / Fees and Expenses
The Board considered certain additional factors and made related conclusions relating to the historical performance of the Fund for the one-, three- and five-year periods ended December 31, 2021.
The Board also considered the Fund’s actual management fee, as well as the Fund’s net total expense ratio, for the fiscal year ended October 31, 2021. The Board considered the management fee for the Fund as compared to the management fee charged by PGIM Investments to other funds and the fee charged by other advisers to comparable mutual funds in a Peer Group. The actual management fee represents the fee rate actually paid by Fund shareholders and includes any fee waivers or reimbursements. The net total expense ratio for the Fund represents the actual expense ratio incurred by Fund shareholders.
The mutual funds included in the Peer Universe, which was used to consider performance, and the Peer Group, which was used to consider fees and expenses, were objectively determined by Broadridge, an independent provider of mutual fund data. In certain circumstances, PGIM Investments also provided supplemental Peer Universe or Peer Group information for reasons addressed with the Board. The comparisons placed the Fund in various quartiles over various periods, with the first quartile being the best 25% of the mutual funds (for performance, the best performing mutual funds and, for expenses, the lowest cost mutual funds).
The section below summarizes key factors considered by the Board and the Board’s conclusions regarding the Fund’s performance, fees and overall expenses. The table sets forth net performance comparisons (which reflect the impact on performance of fund expenses, or any subsidies, expense caps or waivers that may be applicable) with the Peer Universe, actual management fees with the Peer Group (which reflect the impact of any subsidies or fee waivers), and net total expenses with the Peer Group, each of which were key factors considered by the Board.
| | | | | | | | | | |
| Net Performance | | 1 Year | | 3 Years | | 5 Years | | 10 Years | | |
| | 1st Quartile | | 1st Quartile | | 1st Quartile | | N/A | | |
| Actual Management Fees: 2nd Quartile | | | | | | |
| Net Total Expenses: 1st Quartile | | |
| • | | The Board noted that Fund outperformed its benchmark index over all periods. |
| • | | The Board noted that, effective July 1, 2022, PGIM Investments contractually amended its management fee schedule to add an additional breakpoint at asset levels above $5 billion. The current contractual fee rate schedule is as follows: 0.825% up to $1 billion; 0.800% from $1 billion up to $5 billion; and 0.780% over $5 billion. |
Visit our website at pgim.com/investments
| • | | The Board and PGIM Investments agreed to retain the Fund’s existing contractual expense cap that (exclusive of certain fees and expenses) caps net annual operating expenses at 0.84% for each class of the Fund’s shares, and that limits transfer agency, shareholder servicing, sub-transfer agency and blue sky fees, as applicable, to the extent that such fees cause the net annual operating expenses to exceed 1.34% of average daily net assets for Class R2 shares or 1.09% of average daily net assets for Class R4 shares through February 28, 2023. |
| • | | The Board and PGIM Investments agreed to retain the Fund’s existing contractual expense cap with respect to Class A shares, pursuant to which PGIM Investments agrees to limit total annual operating expenses for Class A shares to 1.09% through February 28, 2023. |
| • | | The Board and PGIM Investments agreed to retain the Fund’s existing contractual expense waiver, pursuant to which (exclusive of certain fees and expenses) PGIM Investments waives and/or reimburses up to 0.06% of certain other expenses through February 28, 2023 to the extent that total annual operating expenses exceed 1.90% for Class C shares, 1.48% for Class R shares, 0.90% for Class Z shares, and 0.84% for Class R6 shares. |
| • | | In addition, PGIM Investments will waive management fees or shared operating expenses on any share class to the same extent that it waives such expenses on any other share class, and has agreed that total annual fund operating expenses for Class R6 shares will not exceed total annual fund operating expenses for Class Z shares. |
| • | | The Board concluded that, in light of the above, it would be in the best interests of the Fund and its shareholders to renew the agreements. |
| • | | The Board concluded that the management fees (including subadvisory fees) and total expenses were reasonable in light of the services provided. |
* * *
After full consideration of these factors, the Board concluded that the approval of the agreements was in the best interests of the Fund and its shareholders.
| | | | |
| PGIM Jennison International Opportunities Fund | | | | |
| | | | |
| | | |
| ∎ MAIL | | ∎ TELEPHONE | | ∎ WEBSITE |
655 Broad Street Newark, NJ 07102 | | (800) 225-1852 | | pgim.com/investments |
|
| PROXY VOTING |
| The Board of Directors of the Fund has delegated to the Fund’s subadviser the responsibility for voting any proxies and maintaining proxy recordkeeping with respect to the Fund. A description of these proxy voting policies and procedures is available without charge, upon request, by calling (800) 225-1852 or by visiting the Securities and Exchange Commission’s website at sec.gov. Information regarding how the Fund voted proxies relating to portfolio securities during the most recent 12-month period ended June 30 is available on the Fund’s website and on the Securities and Exchange Commission’s website. |
|
| DIRECTORS |
| Ellen S. Alberding • Kevin J. Bannon • Scott E. Benjamin • Linda W. Bynoe • Barry H. Evans • Keith F. Hartstein • Laurie Simon Hodrick • Stuart S. Parker • Brian K. Reid • Grace C. Torres |
|
| OFFICERS |
| Stuart S. Parker, President • Scott E. Benjamin, Vice President • Christian J. Kelly, Treasurer and Principal Financial and Accounting Officer • Claudia DiGiacomo, Chief Legal Officer • Isabelle Sajous, Chief Compliance Officer • Kelly Florio, Anti-Money Laundering Compliance Officer • Andrew R. French, Secretary • Melissa Gonzalez, Assistant Secretary • Kelly A. Coyne, Assistant Secretary • Patrick E. McGuinness, Assistant Secretary • Debra Rubano, Assistant Secretary • Lana Lomuti, Assistant Treasurer • Russ Shupak, Assistant Treasurer • Elyse M. McLaughlin, Assistant Treasurer • Deborah Conway, Assistant Treasurer |
| | | | |
| MANAGER | | PGIM Investments LLC | | 655 Broad Street Newark, NJ 07102 |
|
| SUBADVISER | | Jennison Associates LLC | | 466 Lexington Avenue New York, NY 10017 |
|
| DISTRIBUTOR | | Prudential Investment Management Services LLC | | 655 Broad Street Newark, NJ 07102 |
|
| CUSTODIAN | | The Bank of New York Mellon | | 240 Greenwich Street New York, NY 10286 |
|
| TRANSFER AGENT | | Prudential Mutual Fund Services LLC | | PO Box 9658 Providence, RI 02940 |
|
INDEPENDENT REGISTERED PUBLIC ACCOUNTING FIRM | | PricewaterhouseCoopers LLP | | 300 Madison Avenue New York, NY 10017 |
|
| FUND COUNSEL | | Willkie Farr & Gallagher LLP | | 787 Seventh Avenue New York, NY 10019 |
|
|
An investor should consider the investment objectives, risks, charges, and expenses of the Fund carefully before investing. The prospectus and summary prospectus contain this and other information about the Fund. An investor may obtain the prospectus and summary prospectus by visiting our website at pgim.com/investments or by calling (800) 225-1852. The prospectus and summary prospectus should be read carefully before investing. |
|
| E-DELIVERY |
To receive your mutual fund documents online, go to pgim.com/investments/resource/edelivery and enroll. Instead of receiving printed documents by mail, you will receive notification via email when new materials are available. You can cancel your enrollment or change your email address at any time by visiting the website address above. |
|
| SHAREHOLDER COMMUNICATIONS WITH DIRECTORS |
Shareholders can communicate directly with the Board of Directors by writing to the Chair of the Board, PGIM Jennison International Opportunities Fund, PGIM Investments, Attn: Board of Directors, 655 Broad Street, Newark, NJ 07102. Shareholders can communicate directly with an individual Director by writing to that Director at the same address. Communications are not screened before being delivered to the addressee. |
|
| AVAILABILITY OF PORTFOLIO HOLDINGS |
The Fund files its complete schedule of portfolio holdings with the Securities and Exchange Commission for the first and third quarters of each fiscal year as an exhibit to its reports on Form N-PORT. The Fund’s Form N-PORT filings are available on the Commission’s website at sec.gov. |
|
The Fund’s Statement of Additional Information contains additional information about the Fund’s Directors and is available without charge, upon request, by calling (800) 225-1852. |
Mutual Funds:
| | | | |
ARE NOT INSURED BY THE FDIC OR ANY
FEDERAL GOVERNMENT AGENCY | | MAY LOSE VALUE | | ARE NOT A DEPOSIT OF OR GUARANTEED
BY ANY BANK OR ANY BANK AFFILIATE |

PGIM JENNISON INTERNATIONAL OPPORTUNITIES FUND
| | | | | | | | | | | | | | |
| | | | | | | |
| SHARE CLASS | | A | | C | | R | | Z | | R2 | | R4 | | R6 |
| | | | | | | |
| NASDAQ | | PWJAX | | PWJCX | | PWJRX | | PWJZX | | PWJBX | | PWJDX | | PWJQX |
| | | | | | | |
| CUSIP | | 743969677 | | 743969669 | | 743969487 | | 743969651 | | 743969412 | | 743969396 | | 743969586 |
MF215E

PGIM EMERGING MARKETS DEBT HARD
CURRENCY FUND
ANNUAL REPORT
OCTOBER 31, 2022

To enroll in e-delivery, go to pgim.com/investments/resource/edelivery
Table of Contents
This report is not authorized for distribution to prospective investors unless preceded or accompanied by a current prospectus.
The views expressed in this report and information about the Fund’s portfolio holdings are for the period covered by this report and are subject to change thereafter.
Mutual funds are distributed by Prudential Investment Management Services LLC (PIMS), member SIPC.PGIM Fixed Income is a unit of PGIM, Inc. (PGIM), a registered investment adviser. PIMS and PGIM are Prudential Financial companies. © 2022 Prudential Financial, Inc. and its related entities. PGIM and the PGIM logo are service marks of Prudential Financial, Inc. and its related entities, registered in many jurisdictions worldwide.
2 Visit our website at pgim.com/investments
Letter from the President
| | | | |
 | | | | Dear Shareholder: |
| | | | We hope you find the annual report for the PGIM Emerging Markets Debt Hard Currency Fund informative and useful. The report covers performance for the 12-month period that ended October 31, 2022. |
| | | | The attention of the global economy and financial markets pivoted during the period from the COVID-19 pandemic to the challenge of rapidly rising inflation. While job growth remained strong, prices for a wide range of goods and services rose in response to economic re-openings, supply-chain disruptions, governmental stimulus, and Russia’s invasion of Ukraine. With inflation surging to a 40-year high, the Federal Reserve and other central banks aggressively hiked interest rates, prompting recession concerns. |
After rising to record levels at the end of 2021, stocks have fallen sharply in 2022 as investors worried about higher prices, slowing economic growth, geopolitical uncertainty, and new COVID-19 outbreaks. Equities rallied for a time during the summer but began falling again in late August on fears that the Fed would keep raising rates to tame inflation. For the entire 12-month period, equities suffered a broad-based global decline, although large-cap US stocks outperformed their small-cap counterparts. International developed and emerging markets trailed the US market during this time.
Rising rates and economic uncertainty drove fixed income prices broadly lower as well. US and global investment-grade bonds, along with US high yield corporate bonds and emerging market debt, all posted negative returns during the period.
Regarding your investments with PGIM, we believe it is important to maintain a diversified portfolio of funds consistent with your tolerance for risk, time horizon, and financial goals. Your financial advisor can help you create a diversified investment plan that may include funds covering all the basic asset classes and that reflects your personal investor profile and risk tolerance. However, diversification and asset allocation strategies do not assure a profit or protect against loss in declining markets.
At PGIM Investments, we provide access to active investment strategies across the global markets in the pursuit of consistent outperformance for investors. PGIM is the world’s 11th-largest investment manager with more than $1.5 trillion in assets under management. Our scale and investment expertise allow us to deliver a diversified suite of actively managed solutions across a broad spectrum of asset classes and investment styles.
Thank you for choosing our family of funds.
Sincerely,

Stuart S. Parker, President
PGIM Emerging Markets Debt Hard Currency Fund
December 15, 2022
PGIM Emerging Markets Debt Hard Currency Fund 3
Your Fund’s Performance (unaudited)
Performance data quoted represent past performance. Past performance does not guarantee future results. The investment return and principal value of an investment will fluctuate so that an investor’s shares, when redeemed, may be worth more or less than their original cost. Current performance may be lower or higher than the past performance data quoted. An investor may obtain performance data as of the most recent month-end by visiting our website at pgim.com/investments or by calling (800) 225-1852.
| | | | | | |
| |
| | | Average Annual Total Returns as of 10/31/22 |
| | | One Year (%) | | | Since Inception (%) |
| | |
Class A | | | | | | |
| | |
(with sales charges) | | | -27.67 | | | -4.47 (12/12/2017) |
| | |
(without sales charges) | | | -25.24 | | | -3.82 (12/12/2017) |
| | |
Class C | | | | | | |
| | |
(with sales charges) | | | -26.52 | | | -4.54 (12/12/2017) |
| | |
(without sales charges) | | | -25.82 | | | -4.54 (12/12/2017) |
| | |
Class Z | | | | | | |
| | |
(without sales charges) | | | -25.01 | | | -3.56 (12/12/2017) |
| | |
Class R6 | | | | | | |
| | |
(without sales charges) | | | -24.94 | | | -3.47 (12/12/2017) |
| | |
JP Morgan Emerging Markets Bond Index Global Diversified Index | | | | | | |
| | |
| | | | -24.19 | | | -2.71 |
Since Inception returns are provided since the Fund has less than 10 fiscal years of returns. Since Inception returns for the Index are measured from the closest month-end to the Fund’s inception date.
4 Visit our website at pgim.com/investments
Growth of a $10,000 Investment (unaudited)
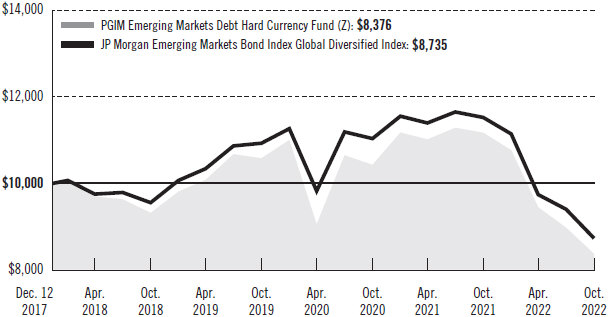
The graph compares a $10,000 investment in the Fund’s Class Z shares with a similar investment in the JP Morgan Emerging Markets Bond Index Global Diversified Index by portraying the initial account values at the commencement of operations for Class Z shares (December 12, 2017) and the account values at the end of the current fiscal year (October 31, 2022), as measured on a quarterly basis. For purposes of the graph, and unless otherwise indicated, it has been assumed that (a) all recurring fees (including management fees) were deducted and (b) all dividends and distributions were reinvested. The line graph provides information for Class Z shares only. As indicated in the tables provided earlier, performance for other share classes will vary due to the differing fees and expenses applicable to each share class (as indicated in the following paragraphs). Without waiver of fees and/or expense reimbursements, if any, the returns would have been lower.
Past performance does not predict future performance. Total returns and the ending account values in the graphs include changes in share price and reinvestment of dividends and capital gains distributions in a hypothetical investment for the periods shown. The Fund’s total returns do not reflect the deduction of income taxes on an individual’s investment. Taxes may reduce your actual investment returns on income or gains paid by the Fund or any gains you may realize if you sell your shares.
PGIM Emerging Markets Debt Hard Currency Fund 5
Your Fund’s Performance (continued)
The returns in the tables do not reflect the deduction of taxes that a shareholder would pay on Fund distributions or following the redemption of Fund shares. The average annual total returns take into account applicable sales charges, which are described for each share class in the table below.
| | | | | | | | |
| | | | | |
| | | Class A | | Class C | | Class Z | | Class R6 |
| Maximum initial sales charge | | 3.25% of the public offering price | | None | | None | | None |
| Contingent deferred sales charge (CDSC) (as a percentage of the lower of the original purchase price or the net asset value at redemption) | | 1.00% on sales of $500,000 or more made within 12 months of purchase | | 1.00% on sales made within 12 months of purchase | | None | | None |
| Annual distribution and service (12b-1) fees (shown as a percentage of average daily net assets) | | 0.25% | | 1.00% | | None | | None |
Benchmark Definition
JP Morgan Emerging Markets Bond Index Global Diversified Index—The JP Morgan Emerging Markets Bond Index Global Diversified Index is an unmanaged index that tracks total returns for USD-denominated debt instruments issued by emerging market sovereign and quasi-sovereign entities: Brady bonds, loans, and Eurobonds. It limits the weights of those index countries with larger debt stocks by only including specified portions of these countries’ eligible current face amounts of debt outstanding.
Investors cannot invest directly in an index. The returns for the Index would be lower if they included the effects of sales charges, operating expenses of a mutual fund, or taxes that may be paid by an investor.
6 Visit our website at pgim.com/investments
| | | | |
| |
| Credit Quality expressed as a percentage of total investments as of 10/31/22 (%) | | | |
| |
AAA | | | 0.2 | |
| |
AA | | | 5.7 | |
| |
A | | | 7.1 | |
| |
BBB | | | 32.1 | |
| |
BB | | | 22.9 | |
| |
B | | | 19.7 | |
| |
CCC | | | 5.0 | |
| |
CC | | | 0.7 | |
| |
C | | | 0.2 | |
| |
Not Rated | | | 2.4 | |
| |
Cash/Cash Equivalents | | | 4.0 | |
| | |
| Total | | | 100.0 | |
Credit ratings reflect the highest rating assigned by a nationally recognized statistical rating organization (NRSRO) such as Moody’s Investors Service, Inc. (Moody’s), S&P Global Ratings (S&P), or Fitch, Inc. (Fitch). Credit ratings reflect the common nomenclature used by both S&P and Fitch. Where applicable, ratings are converted to the comparable S&P/Fitch rating tier nomenclature. These rating agencies are independent and are widely used. The Not Rated category consists of securities that have not been rated by an NRSRO. Credit ratings are subject to change.
| | | | | | | | |
| | | |
| Distributions and Yields as of 10/31/22 | | | | | | |
| | | |
| | | Total Distributions Paid for One Year ($) | | SEC 30-Day Subsidized Yield* (%) | | SEC 30-Day Unsubsidized Yield** (%) |
| | | |
Class A | | 0.43 | | 7.67 | | | -3.24 | |
| | | |
Class C | | 0.38 | | 7.35 | | | –63.88 | |
| | | |
Class Z | | 0.46 | | 8.42 | | | 8.74 | |
| | | |
Class R6 | | 0.46 | | 8.52 | | | 8.33 | |
*SEC 30-Day Subsidized Yield (%)—A standardized yield calculation created by the Securities and Exchange Commission, it reflects the income earned during a 30-day period, after the deduction of the Fund’s net expenses (net of any expense waivers or reimbursements). The investor experience is represented by the SEC 30-Day Subsidized Yield.
**SEC 30-Day Unsubsidized Yield (%)—A standardized yield calculation created by the Securities and Exchange Commission, it reflects the income earned during a 30-day period, after the deduction of the Fund’s gross expenses. The investor experience is represented by the SEC 30-Day Subsidized Yield.
PGIM Emerging Markets Debt Hard Currency Fund 7
Strategy and Performance Overview* (unaudited)
How did the Fund perform?
The PGIM Emerging Markets Debt Hard Currency Fund’s Class Z shares returned –25.01% in the 12-month reporting period that ended October 31, 2022, underperforming the –24.19% return of the JP Morgan Emerging Markets Bond Index Global Diversified Index (the Index).
What were the market conditions?
| · | | Emerging market debt remained volatile throughout the reporting period, with investor appetite for risk assets challenged by persistent global inflation, commodity price shocks, and geopolitical risks. Concerns about central bank tightening, hard economic landings, and the war in Ukraine led spreads notably wider, with emerging market hard currency, corporates, local currency rates, and emerging market foreign exchange all posting negative returns over the period. |
| · | | In the first quarter of 2022, overall performance remained differentiated and country specific, with oil-sensitive issuers outperforming other issuers as oil prices soared. Most of the spread widening over the period came as the escalating war in Ukraine was met by severe sanctions from western nations and rating agency downgrades of Russia, Belarus, and Ukraine debt. Broad market performance reflected investors’ flight from risky assets as outflows picked up their pace, with underperformance led by Russia as the market anticipated its removal from most indices. Emerging market corporate spreads widened but held up relatively well (excluding Russia and Ukraine) amid continued weakness in China driven by the country’s property market slowdown, regulatory risks, and zero-COVID strategy. Local rates produced negative returns in the quarter, driven by high inflation prints, geopolitical tensions, continued hiking cycles in Latin America and Central Europe, and a more hawkish US Federal Reserve (the Fed). Meanwhile, emerging market foreign exchange declined, but dispersion remained evident as the currencies of commodity exporters generally outperformed those of commodity importers. |
| · | | The emerging market debt sector saw continued pressure in the second quarter of 2022 as tightening financial conditions and slowing growth in China and Europe provided a challenging macroeconomic backdrop. The impact of higher food and energy prices, in large part a result of the Russia/Ukraine war, negatively impacted many emerging market countries, and fears of stagflation meaningfully increased their risk premium. Meanwhile, China remained a significant underperformer amid its property market slowdown. Emerging market corporate performance remained negative in the quarter, but fundamentals remained resilient and technicals were supported by large negative net financing (i.e., amortizations and coupon payments exceeded gross issuance), low dealer inventories, and an elevated level of tender activity. Local currency yield rates suffered one of their worst quarters since the Global Financial Crisis, with the Index yield rising above 7.0%—a level not seen since 2015—due to tightening monetary policies. Local curves flattened across the board as most emerging market central banks extended their interest rate hiking cycle. |
8 Visit our website at pgim.com/investments
| | Emerging market foreign exchange underperformed as the Russian conflict continued to impact emerging market currencies, while the US dollar outperformed amid expectations of a tighter Fed policy and higher US Treasury yields. |
| · | | In the third quarter of 2022, emerging market debt performance remained negative as an uncertain global backdrop remained a challenge due to continuing rising rates, slowing growth, and geopolitical tensions. Emerging market hard currency returns were negative, making year-to-date returns the worst on record. While the emerging market corporate sector continued to outperform, the fundamental outlook for the sector turned cloudier on tightening financial conditions and slower growth, with the lower-rated segment more vulnerable to a stagflation/recession scenario. Within local rates, front-end yields in many emerging market countries were significantly higher than long-end yields due to continued pressures on central banks to raise rates, as well as the ongoing surge in the US dollar. Emerging market foreign exchange saw a continuation of declines amid ongoing Fed hawkishness, concerns over slowing global growth, and inflation in both developed and emerging economies. |
| · | | During October—the last month of the period—emerging market spreads were mixed, and fund flows remained negative. Returns across hard currency and foreign exchange were positive in October, while local currency rates and corporates lagged. The emerging market debt sovereign sector exhibited positive spread return in October, with both investment-grade and high yield outperforming. Latin America, Europe, and Africa displayed positive total returns, while Asia and the Middle East underperformed. Within local currency rates, all regions lagged except for Asia. Meanwhile, emerging market foreign exchange exhibited mixed performance in October, with Europe and Latin America exhibiting positive returns while Asia and Middle/East Africa underperformed. The US dollar rally stalled after four months of positive performance amid expectations that the Fed might pivot, or adopt a less-aggressive rate-hiking policy, following shifts in central bank rhetoric in other developed countries. |
What worked?
| · | | Overall country selection and currency selection contributed to performance during the period. |
| · | | Long spread duration positioning in Russia, Pakistan, and Brazil, along with short spread duration positioning in Ghana, Sri Lanka, Ecuador, and Panama, contributed to performance. (Duration measures the sensitivity of the price—the value of principal—of a bond to a change in interest rates.) |
| · | | Within currencies, underweight positioning relative to the Index in the Chinese yuan, Thailand baht, Taiwan dollar, and Korean won contributed to performance. |
| · | | While overall issue selection detracted from performance, sovereign positioning in Russia, Belarus, and Sri Lanka contributed. |
| · | | Corporate and quasi-sovereign positioning in Russia (VEB Finance PLC) contributed to performance. |
PGIM Emerging Markets Debt Hard Currency Fund 9
Strategy and Performance Overview* (continued)
| · | | In the Fund’s positions in local currency that are not included in the Index, short positioning in Poland contributed to performance. |
What didn’t work?
| · | | Sovereign positioning in Ukraine, Zambia, and Pakistan detracted from performance. |
| · | | Long spread duration positioning in Ukraine, Belarus, and Serbia also detracted. |
| · | | While overall currency selection contributed to performance, overweights relative to the Index to the Russian ruble and Indian rupee, along with an underweight relative to the Index to the Czech koruna, detracted. |
| · | | Corporate and quasi-sovereign positioning in China (Country Garden Holdings Company Ltd.) and Russia (Lukoil, Gazprom PJSC) detracted from performance. |
| · | | In the Fund’s positions in local currency that are not included in the Index, long duration positioning in Mexico, Korea, and Russia detracted from performance. |
Did the Fund use derivatives?
Currency positioning in the Fund was partially facilitated by the use of currency forward and option contracts. During the reporting period, the Fund’s currency positioning added to relative performance. The Fund also used futures and interest rate swaps, in part, to help manage duration and yield curve exposure, which collectively had a negative impact on performance.
Current outlook
| · | | PGIM Fixed Income expects rising interest rates, slowing growth, and geopolitical tensions to continue to challenge the emerging market debt sector, and thus has positioned the Fund cautiously. However, emerging market price action has been front loaded, and PGIM Fixed Income believes current valuations provide an attractive opportunity for investors with a longer-term time horizon. |
| · | | PGIM Fixed Income expects emerging market hard currency sovereign spreads to remain volatile and returns to vary by credit quality as financial conditions continue to tighten until inflation cools, unemployment rises, and/or economic growth slows. Signs that negative risk sentiment has peaked will likely first be seen in the US dollar, followed by more positive performance in local rates and emerging market spreads. |
| · | | In structuring emerging market portfolios that protect the downside and take advantage of mispricing and misalignments of pricing versus relative value, PGIM Fixed Income focuses on a “barbell” in credit, with emphasis on the double-B-rated sovereign segment and select emerging market corporates, long US dollar exposure with select relative value opportunities in emerging market foreign exchange, and a neutral stance on local emerging market duration given the level of rates and a curve-flattening bias. |
| · | | PGIM Fixed Income remains cautious on emerging market currencies but also sees relative-value opportunities, is mindful of two-way risks, and views Asia as the weakest region as all central banks are lagging the Fed in the degree of rate hikes. |
10 Visit our website at pgim.com/investments
*This strategy and performance overview, which discusses what strategies or holdings (including derivatives, if applicable) affected the Fund’s performance, is compiled based on how the Fund performed relative to the Fund’s benchmark index and is viewed for performance attribution purposes at the aggregate Fund level, which in most instances will not directly correlate to the amounts disclosed in the Statement of Operations which conform to US generally accepted accounting principles.
PGIM Emerging Markets Debt Hard Currency Fund 11
Fees and Expenses (unaudited)
As a shareholder of the Fund, you incur two types of costs: (1) transaction costs, including sales charges (loads) on purchase payments and redemptions, as applicable, and (2) ongoing costs, including management fees, distribution and/or service (12b-1) fees, and other Fund expenses, as applicable. This example is intended to help you understand your ongoing costs (in dollars) of investing in the Fund and to compare these costs with the ongoing costs of investing in other mutual funds.
The example is based on an investment of $1,000 held through the six-month period ended October 31, 2022. The example is for illustrative purposes only; you should consult the Prospectus for information on initial and subsequent minimum investment requirements.
Actual Expenses
The first line for each share class in the table on the following page provides information about actual account values and actual expenses. You may use the information on this line, together with the amount you invested, to estimate the expenses that you paid over the period. Simply divide your account value by $1,000 (for example, an $8,600 account value ÷ $1,000 = 8.6), then multiply the result by the number on the first line under the heading “Expenses Paid During the Six-Month Period” to estimate the expenses you paid on your account during this period.
Hypothetical Example for Comparison Purposes
The second line for each share class in the table on the following page provides information about hypothetical account values and hypothetical expenses based on the Fund’s actual expense ratio and an assumed rate of return of 5% per year before expenses, which is not the Fund’s actual return. The hypothetical account values and expenses may not be used to estimate the actual ending account balance or expenses you paid for the period. You may use this information to compare the ongoing costs of investing in the Fund and other funds. To do so, compare this 5% hypothetical example with the 5% hypothetical examples that appear in the shareholder reports of the other funds.
The Fund’s transfer agent may charge additional fees to holders of certain accounts that are not included in the expenses shown in the table on the following page. These fees apply to individual retirement accounts (IRAs) and Section 403(b) accounts. As of the close of the six-month period covered by the table, IRA fees included an annual maintenance fee of $15 per account (subject to a maximum annual maintenance fee of $25 for all accounts held by the same shareholder). Section 403(b) accounts are charged an annual $25 fiduciary maintenance fee. Some of the fees may vary in amount, or may be waived, based on your total account balance or the number of PGIM funds, including the Fund, that you own. You should consider the additional fees that were charged to your Fund account over the six-month period when you estimate the total ongoing expenses paid over the period and the impact of these fees on your ending account value, as these additional expenses are not reflected in the information
12 Visit our website at pgim.com/investments
provided in the expense table. Additional fees have the effect of reducing investment returns.
Please note that the expenses shown in the table are meant to highlight your ongoing costs only and do not reflect any transactional costs such as sales charges (loads). Therefore, the second line for each share class in the table is useful in comparing ongoing costs only and will not help you determine the relative total costs of owning different funds. In addition, if these transactional costs were included, your costs would have been higher.
| | | | | | | | | | | | |
| | | | |
PGIM Emerging Markets Debt Hard Currency Fund | | Beginning Account Value May 1, 2022 | | Ending Account Value October 31, 2022 | | Annualized Expense Ratio Based on the Six-Month Period | | Expenses Paid During the Six-Month Period* |
| | | | | |
Class A | | Actual | | $1,000.00 | | | $ 884.90 | | | 1.06% | | $5.04 |
| | | | | |
| | Hypothetical | | $1,000.00 | | | $1,019.86 | | | 1.06% | | $5.40 |
| | | | | |
Class C | | Actual | | $1,000.00 | | | $ 881.40 | | | 1.81% | | $8.58 |
| | | | | |
| | Hypothetical | | $1,000.00 | | | $1,016.08 | | | 1.81% | | $9.20 |
| | | | | |
Class Z | | Actual | | $1,000.00 | | | $ 886.20 | | | 0.76% | | $3.61 |
| | | | | |
| | Hypothetical | | $1,000.00 | | | $1,021.37 | | | 0.76% | | $3.87 |
| | | | | |
Class R6 | | Actual | | $1,000.00 | | | $ 886.60 | | | 0.66% | | $3.14 |
| | | | | |
| | | Hypothetical | | $1,000.00 | | | $1,021.88 | | | 0.66% | | $3.36 |
*Fund expenses (net of fee waivers or subsidies, if any) for each share class are equal to the annualized expense ratio for each share class (provided in the table), multiplied by the average account value over the period, multiplied by the 184 days in the six-month period ended October 31, 2022, and divided by the 365 days in the Fund’s fiscal year ended October 31, 2022 (to reflect the six-month period).Expenses presented in the table include the expenses of any underlying portfolios in which the Fund may invest.
PGIM Emerging Markets Debt Hard Currency Fund 13
Schedule of Investments
as of October 31, 2022
| | | | | | | | | | | | | | | | | | | | | | |
| | | | | | |
| Description | | Interest Rate | | | | Maturity Date | | | | | Principal Amount (000)# | | | Value | |
| | | | | | |
LONG-TERM INVESTMENTS 93.9% | | | | | | | | | | | | | | | | | | | | | | |
| | | | | | |
CORPORATE BONDS 25.6% | | | | | | | | | | | | | | | | | | | | | | |
| | | | | | |
Azerbaijan 0.6% | | | | | | | | | | | | | | | | | | | | | | |
| | | | | | |
Southern Gas Corridor CJSC, | | | | | | | | | | | | | | | | | | | | | | |
Gov’t. Gtd. Notes | | | 6.875 | % | | | | | | | 03/24/26 | | | | | | 450 | | | $ | 442,080 | |
State Oil Co. of the Azerbaijan Republic, | | | | | | | | | | | | | | | | | | | | | | |
Sr. Unsec’d. Notes | | | 6.950 | | | | | | | | 03/18/30 | | | | | | 400 | | | | 387,450 | |
| | | | | | | | | | | | | | | | | | | | | | |
| | | | | | |
| | | | | | | | | | | | | | | | | | | | | 829,530 | |
| | | | | | |
Bahrain 0.4% | | | | | | | | | | | | | | | | | | | | | | |
| | | | | | |
Oil &Gas Holding Co. BSCC (The), | | | | | | | | | | | | | | | | | | | | | | |
Sr. Unsec’d. Notes | | | 7.625 | | | | | | | | 11/07/24 | | | | | | 400 | | | | 396,325 | |
Sr. Unsec’d. Notes | | | 8.375 | | | | | | | | 11/07/28 | | | | | | 200 | | | | 195,850 | |
| | | | | | | | | | | | | | | | | | | | | | |
| | | | | | |
| | | | | | | | | | | | | | | | | | | | | 592,175 | |
| | | | | | |
Brazil 1.1% | | | | | | | | | | | | | | | | | | | | | | |
| | | | | | |
Banco do Brasil SA, | | | | | | | | | | | | | | | | | | | | | | |
Sr. Unsec’d. Notes | | | 4.875 | | | | | | | | 01/11/29 | | | | | | 200 | | | | 179,100 | |
Globo Comunicacao e Participacoes SA, | | | | | | | | | | | | | | | | | | | | | | |
Sr. Unsec’d. Notes | | | 4.875 | | | | | | | | 01/22/30 | | | | | | 200 | | | | 154,776 | |
JSM Global Sarl, | | | | | | | | | | | | | | | | | | | | | | |
Gtd. Notes, 144A | | | 4.750 | | | | | | | | 10/20/30 | | | | | | 400 | | | | 276,325 | |
Nexa Resources SA, | | | | | | | | | | | | | | | | | | | | | | |
Gtd. Notes | | | 6.500 | | | | | | | | 01/18/28 | | | | | | 210 | | | | 192,780 | |
Petrobras Global Finance BV, | | | | | | | | | | | | | | | | | | | | | | |
Gtd. Notes | | | 5.093 | | | | | | | | 01/15/30 | | | | | | 80 | | | | 71,150 | |
Gtd. Notes | | | 5.375 | | | | | | | | 10/01/29 | | | GBP | | | 100 | | | | 95,672 | |
Gtd. Notes(a) | | | 5.600 | | | | | | | | 01/03/31 | | | | | | 505 | | | | 457,126 | |
Suzano Austria GmbH, | | | | | | | | | | | | | | | | | | | | | | |
Gtd. Notes | | | 3.750 | | | | | | | | 01/15/31 | | | | | | 150 | | | | 119,344 | |
| | | | | | | | | | | | | | | | | | | | | | |
| | | | | | |
| | | | | | | | | | | | | | | | | | | | | 1,546,273 | |
| | | | | | |
Chile 1.0% | | | | | | | | | | | | | | | | | | | | | | |
| | | | | | |
Alfa Desarrollo SpA, | | | | | | | | | | | | | | | | | | | | | | |
Sr. Sec’d. Notes, 144A | | | 4.550 | | | | | | | | 09/27/51 | | | | | | 199 | | | | 127,533 | |
Corp. Nacional del Cobre de Chile, | | | | | | | | | | | | | | | | | | | | | | |
Sr. Unsec’d. Notes | | | 3.000 | | | | | | | | 09/30/29 | | | | | | 200 | | | | 165,725 | |
Sr. Unsec’d. Notes | | | 4.875 | | | | | | | | 11/04/44 | | | | | | 600 | | | | 486,862 | |
Sr. Unsec’d. Notes | | | 6.150 | | | | | | | | 10/24/36 | | | | | | 100 | | | | 95,831 | |
Sr. Unsec’d. Notes, 144A | | | 4.875 | | | | | | | | 11/04/44 | | | | | | 200 | | | | 162,288 | |
See Notes to Financial Statements.
PGIM Emerging Markets Debt Hard Currency Fund 15
Schedule of Investments (continued)
as of October 31, 2022
| | | | | | | | | | | | | | | | | | | | | | | | |
| | | | | | |
| Description | | Interest Rate | | | | | Maturity Date | | | | | | Principal Amount (000)# | | | Value | |
| | | | | | |
CORPORATE BONDS (Continued) | | | | | | | | | | | | | | | | | | | | | | | | |
| | | | | | |
Chile (cont’d.) | | | | | | | | | | | | | | | | | | | | | | | | |
| | | | | | |
Empresa Nacional del Petroleo, | | | | | | | | | | | | | | | | | | | | | | | | |
Sr. Unsec’d. Notes, 144A | | | 3.450 | % | | | | | | | 09/16/31 | | | | | | | | 200 | | | $ | 155,225 | |
Interchile SA, | | | | | | | | | | | | | | | | | | | | | | | | |
Sr. Sec’d. Notes, 144A | | | 4.500 | | | | | | | | 06/30/56 | | | | | | | | 200 | | | | 143,663 | |
VTR Finance NV, | | | | | | | | | | | | | | | | | | | | | | | | |
Sr. Unsec’d. Notes | | | 6.375 | | | | | | | | 07/15/28 | | | | | | | | 200 | | | | 100,788 | |
| | | | | | | | | | | | | | | | | | | | | | | | |
| | | | | | |
| | | | | | | | | | | | | | | | | | | | | | | 1,437,915 | |
| | | | | | |
China 1.0% | | | | | | | | | | | | | | | | | | | | | | | | |
| | | | | | |
Agile Group Holdings Ltd., | | | | | | | | | | | | | | | | | | | | | | | | |
Sr. Sec’d. Notes | | | 6.050 | | | | | | | | 10/13/25 | | | | | | | | 200 | | | | 37,288 | |
CNAC HK Finbridge Co. Ltd., | | | | | | | | | | | | | | | | | | | | | | | | |
Gtd. Notes | | | 3.000 | | | | | | | | 09/22/30 | | | | | | | | 300 | | | | 215,433 | |
Gtd. Notes | | | 3.875 | | | | | | | | 06/19/29 | | | | | | | | 500 | | | | 397,460 | |
Country Garden Holdings Co. Ltd., | | | | | | | | | | | | | | | | | | | | | | | | |
Sr. Sec’d. Notes | | | 4.200 | | | | | | | | 02/06/26 | | | | | | | | 460 | | | | 39,100 | |
ENN Clean Energy International Investment Ltd., | | | | | | | | | | | | | | | | | | | | | | | | |
Gtd. Notes, 144A | | | 3.375 | | | | | | | | 05/12/26 | | | | | | | | 200 | | | | 155,912 | |
New Metro Global Ltd., | | | | | | | | | | | | | | | | | | | | | | | | |
Gtd. Notes | | | 4.800 | | | | | | | | 12/15/24 | | | | | | | | 200 | | | | 50,100 | |
Prosus NV, | | | | | | | | | | | | | | | | | | | | | | | | |
Sr. Unsec’d. Notes, 144A | | | 4.193 | | | | | | | | 01/19/32 | | | | | | | | 350 | | | | 248,895 | |
Sinopec Group Overseas Development 2012 Ltd., | | | | | | | | | | | | | | | | | | | | | | | | |
Gtd. Notes | | | 4.875 | | | | | | | | 05/17/42 | | | | | | | | 200 | | | | 175,548 | |
Sinopec Group Overseas Development 2018 Ltd., | | | | | | | | | | | | | | | | | | | | | | | | |
Gtd. Notes, 144A | | | 3.680 | | | | | | | | 08/08/49 | | | | | | | | 200 | | | | 138,663 | |
Sunac China Holdings Ltd., | | | | | | | | | | | | | | | | | | | | | | | | |
Sr. Sec’d. Notes | | | 6.500 | | | | | | | | 01/10/25(d) | | | | | | | | 200 | | | | 11,000 | |
| | | | | | | | | | | | | | | | | | | | | | | | |
| | | | | | |
| | | | | | | | | | | | | | | | | | | | | | | 1,469,399 | |
| | | | | | |
Colombia 0.4% | | | | | | | | | | | | | | | | | | | | | | | | |
| | | | | | |
Colombia Telecomunicaciones SA ESP, | | | | | | | | | | | | | | | | | | | | | | | | |
Sr. Unsec’d. Notes, 144A | | | 4.950 | | | | | | | | 07/17/30 | | | | | | | | 200 | | | | 139,287 | |
Ecopetrol SA, | | | | | | | | | | | | | | | | | | | | | | | | |
Sr. Unsec’d. Notes | | | 6.875 | | | | | | | | 04/29/30 | | | | | | | | 208 | | | | 169,832 | |
Grupo Aval Ltd., | | | | | | | | | | | | | | | | | | | | | | | | |
Gtd. Notes, 144A | | | 4.375 | | | | | | | | 02/04/30 | | | | | | | | 200 | | | | 138,038 | |
Millicom International Cellular SA, | | | | | | | | | | | | | | | | | | | | | | | | |
Sr. Unsec’d. Notes, 144A | | | 4.500 | | | | | | | | 04/27/31 | | | | | | | | 200 | | | | 149,600 | |
| | | | | | | | | | | | | | | | | | | | | | | | |
| | | | | | |
| | | | | | | | | | | | | | | | | | | | | | | 596,757 | |
See Notes to Financial Statements.
16
| | | | | | | | | | | | | | | | | | | | | | | | |
| | | | | | |
| Description | | Interest
Rate | | | | Maturity
Date | | | | | | Principal Amount (000)# | | | Value | |
| | | | | | |
CORPORATE BONDS (Continued) | | | | | | | | | | | | | | | | | | | | | | | | |
| | | | | | |
Costa Rica 0.1% | | | | | | | | | | | | | | | | | | | | | | | | |
| | | | | | |
Instituto Costarricense de Electricidad, | | | | | | | | | | | | | | | | | | | | | | | | |
Sr. Unsec’d. Notes, 144A | | | 6.750 | % | | | | | | | 10/07/31 | | | | | | | | 200 | | | $ | 174,912 | |
| | | | | | |
Ghana 0.1% | | | | | | | | | | | | | | | | | | | | | | | | |
| | | | | | |
Tullow Oil PLC, | | | | | | | | | | | | | | | | | | | | | | | | |
Sr. Sec’d. Notes, 144A | | | 10.250 | | | | | | | | 05/15/26 | | | | | | | | 200 | | | | 170,500 | |
| | | | | | |
Guatemala 0.4% | | | | | | | | | | | | | | | | | | | | | | | | |
| | | | | | |
CT Trust, | | | | | | | | | | | | | | | | | | | | | | | | |
Sr. Sec’d. Notes, 144A | | | 5.125 | | | | | | | | 02/03/32 | | | | | | | | 200 | | | | 159,225 | |
Energuate Trust, | | | | | | | | | | | | | | | | | | | | | | | | |
Gtd. Notes | | | 5.875 | | | | | | | | 05/03/27 | | | | | | | | 400 | | | | 347,800 | |
| | | | | | | | | | | | | | | | | | | | | | | | |
| | | | | | |
| | | | | | | | | | | | | | | | | | | | | | | 507,025 | |
| | | | | | |
India 1.7% | | | | | | | | | | | | | | | | | | | | | | | | |
| | | | | | |
Adani Ports & Special Economic Zone Ltd., | | | | | | | | | | | | | | | | | | | | | | | | |
Sr. Unsec’d. Notes, 144A | | | 5.000 | | | | | | | | 08/02/41 | | | | | | | | 200 | | | | 117,038 | |
Azure Power Solar Energy Pvt. Ltd., | | | | | | | | | | | | | | | | | | | | | | | | |
Sr. Sec’d. Notes, 144A, MTN | | | 5.650 | | | | | | | | 12/24/24 | | | | | | | | 200 | | | | 162,000 | |
GMR Hyderabad International Airport Ltd., | | | | | | | | | | | | | | | | | | | | | | | | |
Sr. Sec’d. Notes | | | 4.250 | | | | | | | | 10/27/27 | | | | | | | | 200 | | | | 157,500 | |
HPCL-Mittal Energy Ltd., | | | | | | | | | | | | | | | | | | | | | | | | |
Sr. Unsec’d. Notes | | | 5.250 | | | | | | | | 04/28/27 | | | | | | | | 400 | | | | 339,500 | |
NTPC Ltd., | | | | | | | | | | | | | | | | | | | | | | | | |
Sr. Unsec’d. Notes, EMTN | | | 2.750 | | | | | | | | 02/01/27 | | | | EUR | | | | 100 | | | | 90,660 | |
Periama Holdings LLC, | | | | | | | | | | | | | | | | | | | | | | | | |
Gtd. Notes | | | 5.950 | | | | | | | | 04/19/26 | | | | | | | | 400 | | | | 323,825 | |
Power Finance Corp. Ltd., | | | | | | | | | | | | | | | | | | | | | | | | |
Sr. Unsec’d. Notes | | | 4.500 | | | | | | | | 06/18/29 | | | | | | | | 600 | | | | 515,362 | |
Sr. Unsec’d. Notes, 144A, MTN | | | 6.150 | | | | | | | | 12/06/28 | | | | | | | | 200 | | | | 192,162 | |
Reliance Industries Ltd., | | | | | | | | | | | | | | | | | | | | | | | | |
Sr. Unsec’d. Notes, 144A | | | 3.625 | | | | | | | | 01/12/52 | | | | | | | | 250 | | | | 146,688 | |
Summit Digitel Infrastructure Ltd., | | | | | | | | | | | | | | | | | | | | | | | | |
Sr. Sec’d. Notes, 144A | | | 2.875 | | | | | | | | 08/12/31 | | | | | | | | 235 | | | | 161,802 | |
TML Holdings Pte Ltd., | | | | | | | | | | | | | | | | | | | | | | | | |
Sr. Unsec’d. Notes | | | 5.500 | | | | | | | | 06/03/24 | | | | | | | | 200 | | | | 187,500 | |
| | | | | | | | | | | | | | | | | | | | | | | | |
| | | | | | |
| | | | | | | | | | | | | | | | | | | | | | | 2,394,037 | |
See Notes to Financial Statements.
PGIM Emerging Markets Debt Hard Currency Fund 17
Schedule of Investments (continued)
as of October 31, 2022
| | | | | | | | | | | | | | | | | | | | | | |
| | | | | | |
| Description | | Interest
Rate | | | | Maturity
Date | | | | | Principal Amount (000)# | | | Value | |
| | | | | | |
CORPORATE BONDS (Continued) | | | | | | | | | | | | | | | | | | | | | | |
| | | | | | |
Indonesia 2.4% | | | | | | | | | | | | | | | | | | | | | | |
| | | | | | |
Cikarang Listrindo Tbk PT, | | | | | | | | | | | | | | | | | | | | | | |
Sr. Unsec’d. Notes, 144A | | | 4.950 | % | | | | | | | 09/14/26 | | | | | | 200 | | | $ | 173,850 | |
Freeport Indonesia PT, | | | | | | | | | | | | | | | | | | | | | | |
Sr. Unsec’d. Notes, 144A, MTN | | | 5.315 | | | | | | | | 04/14/32 | | | | | | 200 | | | | 166,750 | |
Indofood CBP Sukses Makmur Tbk PT, | | | | | | | | | | | | | | | | | | | | | | |
Sr. Unsec’d. Notes | | | 3.541 | | | | | | | | 04/27/32 | | | | | | 200 | | | | 145,022 | |
Indonesia Asahan Aluminium Persero PT, | | | | | | | | | | | | | | | | | | | | | | |
Sr. Unsec’d. Notes | | | 5.450 | | | | | | | | 05/15/30 | | | | | | 700 | | | | 610,006 | |
Sr. Unsec’d. Notes, 144A | | | 4.750 | | | | | | | | 05/15/25 | | | | | | 200 | | | | 191,022 | |
Pertamina Persero PT, | | | | | | | | | | | | | | | | | | | | | | |
Sr. Unsec’d. Notes | | | 6.000 | | | | | | | | 05/03/42 | | | | | | 200 | | | | 170,788 | |
Sr. Unsec’d. Notes, EMTN | | | 3.100 | | | | | | | | 01/21/30 | | | | | | 200 | | | | 162,820 | |
Sr. Unsec’d. Notes, EMTN | | | 3.650 | | | | | | | | 07/30/29 | | | | | | 200 | | | | 170,722 | |
Sr. Unsec’d. Notes, EMTN | | | 4.700 | | | | | | | | 07/30/49 | | | | | | 200 | | | | 143,080 | |
Sr. Unsec’d. Notes, EMTN | | | 6.500 | | | | | | | | 11/07/48 | | | | | | 200 | | | | 179,600 | |
Perusahaan Listrik Negara PT, | | | | | | | | | | | | | | | | | | | | | | |
Sr. Unsec’d. Notes | | | 1.875 | | | | | | | | 11/05/31 | | | EUR | | | 100 | | | | 69,073 | |
Sr. Unsec’d. Notes | | | 2.875 | | | | | | | | 10/25/25 | | | EUR | | | 200 | | | | 186,013 | |
Sr. Unsec’d. Notes, 144A, MTN | | | 5.450 | | | | | | | | 05/21/28 | | | | | | 420 | | | | 396,060 | |
Sr. Unsec’d. Notes, 144A, MTN | | | 6.150 | | | | | | | | 05/21/48 | | | | | | 200 | | | | 156,250 | |
Sr. Unsec’d. Notes, EMTN | | | 4.125 | | | | | | | | 05/15/27 | | | | | | 250 | | | | 228,750 | |
Sr. Unsec’d. Notes, EMTN | | | 6.150 | | | | | | | | 05/21/48 | | | | | | 200 | | | | 156,250 | |
| | | | | | | | | | | | | | | | | | | | | | |
| | | | | | |
| | | | | | | | | | | | | | | | | | | | | 3,306,056 | |
| | | | | | |
Israel 0.7% | | | | | | | | | | | | | | | | | | | | | | |
| | | | | | |
Bank Leumi Le-Israel BM, | | | | | | | | | | | | | | | | | | | | | | |
Sr. Unsec’d. Notes, 144A | | | 5.125 | | | | | | | | 07/27/27 | | | | | | 203 | | | | 197,539 | |
Energean Israel Finance Ltd., | | | | | | | | | | | | | | | | | | | | | | |
Sr. Sec’d. Notes, 144A | | | 4.875 | | | | | | | | 03/30/26 | | | | | | 75 | | | | 67,500 | |
Sr. Sec’d. Notes, 144A | | | 5.375 | | | | | | | | 03/30/28 | | | | | | 265 | | | | 232,537 | |
Sr. Sec’d. Notes, 144A | | | 5.875 | | | | | | | | 03/30/31 | | | | | | 115 | | | | 97,175 | |
Leviathan Bond Ltd., | | | | | | | | | | | | | | | | | | | | | | |
Sr. Sec’d. Notes, 144A | | | 6.125 | | | | | | | | 06/30/25 | | | | | | 200 | | | | 190,250 | |
Sr. Sec’d. Notes, 144A | | | 6.750 | | | | | | | | 06/30/30 | | | | | | 200 | | | | 177,538 | |
| | | | | | | | | | | | | | | | | | | | | | |
| | | | | | |
| | | | | | | | | | | | | | | | | | | | | 962,539 | |
| | | | | | |
Jamaica 0.1% | | | | | | | | | | | | | | | | | | | | | | |
| | | | | | |
Digicel International Finance Ltd./Digicel International Holdings Ltd., | | | | | | | | | | | | | | | | | | | | | | |
Gtd. Notes, 144A | | | 8.000 | | | | | | | | 12/31/26 | | | | | | 39 | | | | 22,574 | |
See Notes to Financial Statements.
18
| | | | | | | | | | | | | | | | | | | | | | |
| | | | | | |
| Description | | Interest
Rate | | | | Maturity
Date | | | | | Principal Amount (000)# | | | Value | |
| | | | | | |
CORPORATE BONDS (Continued) | | | | | | | | | | | | | | | | | | | | | | |
| | | | | | |
Jamaica (cont’d.) | | | | | | | | | | | | | | | | | | | | | | |
| | | | | | |
Digicel International Finance Ltd./Digicel International Holdings Ltd., (cont’d.) | | | | | | | | | | | | | | | | | | | | | | |
Gtd. Notes, 144A, Cash coupon 6.000% and PIK 7.000% | | | 13.000 | % | | | | | | | 12/31/25 | | | | | | 57 | | | $ | 38,146 | |
Sr. Sec’d. Notes, 144A | | | 8.750 | | | | | | | | 05/25/24 | | | | | | 97 | | | | 82,052 | |
| | | | | | | | | | | | | | | | | | | | | | |
| | | | | | |
| | | | | | | | | | | | | | | | | | | | | 142,772 | |
| | | | | | |
Kazakhstan 1.3% | | | | | | | | | | | | | | | | | | | | | | |
| | | | | | |
Kazakhstan Temir Zholy Finance BV, | | | | | | | | | | | | | | | | | | | | | | |
Gtd. Notes | | | 6.950 | | | | | | | | 07/10/42 | | | | | | 400 | | | | 394,000 | |
KazMunayGas National Co. JSC, | | | | | | | | | | | | | | | | | | | | | | |
Sr. Unsec’d. Notes | | | 3.500 | | | | | | | | 04/14/33 | | | | | | 200 | | | | 135,787 | |
Sr. Unsec’d. Notes | | | 4.750 | | | | | | | | 04/19/27 | | | | | | 390 | | | | 337,789 | |
Sr. Unsec’d. Notes | | | 5.375 | | | | | | | | 04/24/30 | | | | | | 400 | | | | 327,200 | |
Sr. Unsec’d. Notes | | | 5.750 | | | | | | | | 04/19/47 | | | | | | 400 | | | | 272,620 | |
Sr. Unsec’d. Notes | | | 6.375 | | | | | | | | 10/24/48 | | | | | | 400 | | | | 284,540 | |
| | | | | | | | | | | | | | | | | | | | | | |
| | | | | | |
| | | | | | | | | | | | | | | | | | | | | 1,751,936 | |
| | | | | | |
Kuwait 0.3% | | | | | | | | | | | | | | | | | | | | | | |
| | | | | | |
MEGlobal Canada ULC, | | | | | | | | | | | | | | | | | | | | | | |
Gtd. Notes, 144A, MTN | | | 5.875 | | | | | | | | 05/18/30 | | | | | | 400 | | | | 384,825 | |
| | | | | | |
Malaysia 1.3% | | | | | | | | | | | | | | | | | | | | | | |
| | | | | | |
GENM Capital Labuan Ltd., | | | | | | | | | | | | | | | | | | | | | | |
Gtd. Notes | | | 3.882 | | | | | | | | 04/19/31 | | | | | | 200 | | | | 119,162 | |
Gohl Capital Ltd., | | | | | | | | | | | | | | | | | | | | | | |
Gtd. Notes | | | 4.250 | | | | | | | | 01/24/27 | | | | | | 250 | | | | 185,000 | |
Petronas Capital Ltd., | | | | | | | | | | | | | | | | | | | | | | |
Gtd. Notes, 144A, MTN | | | 4.550 | | | | | | | | 04/21/50 | | | | | | 800 | | | | 650,576 | |
Gtd. Notes, EMTN | | | 2.480 | | | | | | | | 01/28/32 | | | | | | 400 | | | | 317,738 | |
Gtd. Notes, EMTN | | | 4.550 | | | | | | | | 04/21/50 | | | | | | 400 | | | | 325,288 | |
Gtd. Notes, EMTN | | | 4.800 | | | | | | | | 04/21/60 | | | | | | 200 | | | | 164,432 | |
| | | | | | | | | | | | | | | | | | | | | | |
| | | | | | |
| | | | | | | | | | | | | | | | | | | | | 1,762,196 | |
| | | | | | |
Mexico 4.9% | | | | | | | | | | | | | | | | | | | | | | |
| | | | | | |
Cemex SAB de CV, | | | | | | | | | | | | | | | | | | | | | | |
Gtd. Notes(a) | | | 5.450 | | | | | | | | 11/19/29 | | | | | | 400 | | | | 348,220 | |
Comision Federal de Electricidad, | | | | | | | | | | | | | | | | | | | | | | |
Gtd. Notes | | | 4.688 | | | | | | | | 05/15/29 | | | | | | 310 | | | | 261,233 | |
Gtd. Notes, 144A | | | 4.688 | | | | | | | | 05/15/29 | | | | | | 200 | | | | 168,538 | |
See Notes to Financial Statements.
PGIM Emerging Markets Debt Hard Currency Fund 19
Schedule of Investments (continued)
as of October 31, 2022
| | | | | | | | | | | | | | | | | | | | | | |
| | | | | | |
| Description | | Interest
Rate | | | | Maturity
Date | | | | | Principal Amount (000)# | | | Value | |
| | | | | | |
CORPORATE BONDS (Continued) | | | | | | | | | | | | | | | | | | | | | | |
| | | | | | |
Mexico (cont’d.) | | | | | | | | | | | | | | | | | | | | | | |
| | | | | | |
FEL Energy VI Sarl, | | | | | | | | | | | | | | | | | | | | | | |
Sr. Sec’d. Notes, 144A | | | 5.750 | % | | | | | | | 12/01/40 | | | | | | 221 | | | $ | 148,203 | |
Fermaca Enterprises S de RL de CV, | | | | | | | | | | | | | | | | | | | | | | |
Sr. Sec’d. Notes | | | 6.375 | | | | | | | | 03/30/38 | | | | | | 212 | | | | 194,686 | |
Mexico City Airport Trust, | | | | | | | | | | | | | | | | | | | | | | |
Sr. Sec’d. Notes | | | 3.875 | | | | | | | | 04/30/28 | | | | | | 200 | | | | 167,000 | |
Sr. Sec’d. Notes(a) | | | 4.250 | | | | | | | | 10/31/26 | | | | | | 650 | | | | 578,825 | |
Sr. Sec’d. Notes | | | 5.500 | | | | | | | | 07/31/47 | | | | | | 800 | | | | 508,000 | |
Petroleos Mexicanos, | | | | | | | | | | | | | | | | | | | | | | |
Gtd. Notes | | | 5.350 | | | | | | | | 02/12/28 | | | | | | 1,042 | | | | 828,882 | |
Gtd. Notes | | | 6.350 | | | | | | | | 02/12/48 | | | | | | 376 | | | | 215,756 | |
Gtd. Notes | | | 6.490 | | | | | | | | 01/23/27 | | | | | | 305 | | | | 266,387 | |
Gtd. Notes | | | 6.500 | | | | | | | | 03/13/27 | | | | | | 608 | | | | 529,872 | |
Gtd. Notes | | | 6.500 | | | | | | | | 01/23/29 | | | | | | 830 | | | | 668,980 | |
Gtd. Notes | | | 6.500 | | | | | | | | 06/02/41 | | | | | | 610 | | | | 379,786 | |
Gtd. Notes | | | 6.840 | | | | | | | | 01/23/30 | | | | | | 573 | | | | 454,463 | |
Gtd. Notes | | | 6.875 | | | | | | | | 10/16/25 | | | | | | 250 | | | | 237,813 | |
Gtd. Notes | | | 7.690 | | | | | | | | 01/23/50 | | | | | | 550 | | | | 354,581 | |
Gtd. Notes, EMTN | | | 3.750 | | | | | | | | 04/16/26 | | | EUR | | | 285 | | | | 233,119 | |
Gtd. Notes, MTN | | | 6.875 | | | | | | | | 08/04/26 | | | | | | 355 | | | | 327,184 | |
| | | | | | | | | | | | | | | | | | | | | | |
| | | | | | |
| | | | | | | | | | | | | | | | | | | | | 6,871,528 | |
| | | | | | |
Mongolia 0.1% | | | | | | | | | | | | | | | | | | | | | | |
| | | | | | |
Development Bank of Mongolia LLC, | | | | | | | | | | | | | | | | | | | | | | |
Sr. Unsec’d. Notes | | | 7.250 | | | | | | | | 10/23/23 | | | | | | 200 | | | | 174,000 | |
| | | | | | |
Panama 0.2% | | | | | | | | | | | | | | | | | | | | | | |
| | | | | | |
Aeropuerto Internacional de Tocumen SA, | | | | | | | | | | | | | | | | | | | | | | |
Sr. Sec’d. Notes | | | 4.000 | | | | | | | | 08/11/41 | | | | | | 200 | | | | 140,287 | |
Sr. Sec’d. Notes, 144A | | | 5.125 | | | | | | | | 08/11/61 | | | | | | 200 | | | | 134,975 | |
| | | | | | | | | | | | | | | | | | | | | | |
| | | | | | |
| | | | | | | | | | | | | | | | | | | | | 275,262 | |
| | | | | | |
Peru 1.2% | | | | | | | | | | | | | | | | | | | | | | |
| | | | | | |
Banco Internacional del Peru SAA Interbank, | | | | | | | | | | | | | | | | | | | | | | |
Sr. Unsec’d. Notes | | | 3.250 | | | | | | | | 10/04/26 | | | | | | 350 | | | | 313,294 | |
Corp. Financiera de Desarrollo SA, | | | | | | | | | | | | | | | | | | | | | | |
Sr. Unsec’d. Notes | | | 2.400 | | | | | | | | 09/28/27 | | | | | | 200 | | | | 160,600 | |
Fondo MIVIVIENDA SA, | | | | | | | | | | | | | | | | | | | | | | |
Sr. Unsec’d. Notes, 144A | | | 4.625 | | | | | | | | 04/12/27 | | | | | | 150 | | | | 138,000 | |
InRetail Consumer, | | | | | | | | | | | | | | | | | | | | | | |
Sr. Sec’d. Notes | | | 3.250 | | | | | | | | 03/22/28 | | | | | | 300 | | | | 237,187 | |
See Notes to Financial Statements.
20
| | | | | | | | | | | | | | | | | | | | |
| | | | | | |
| Description | | Interest
Rate | | | | Maturity
Date | | | | Principal Amount (000)# | | | Value | |
| | | | | | |
CORPORATE BONDS (Continued) | | | | | | | | | | | | | | | | | | | | |
| | | | | | |
Peru (cont’d.) | | | | | | | | | | | | | | | | | | | | |
| | | | | | |
Petroleos del Peru SA, | | | | | | | | | | | | | | | | | | | | |
Sr. Unsec’d. Notes | | | 4.750 | % | | | | | | 06/19/32 | | | | | 880 | | | $ | 646,470 | |
Sr. Unsec’d. Notes | | | 5.625 | | | | | | | 06/19/47 | | | | | 200 | | | | 127,500 | |
| | | | | | | | | | | | | | | | | | | | |
| | | | | | |
| | | | | | | | | | | | | | | | | | | 1,623,051 | |
| | | | | | |
Philippines 0.1% | | | | | | | | | | | | | | | | | | | | |
| | | | | | |
Globe Telecom, Inc., | | | | | | | | | | | | | | | | | | | | |
Sr. Unsec’d. Notes | | | 3.000 | | | | | | | 07/23/35 | | | | | 200 | | | | 131,162 | |
| | | | | | |
Qatar 0.5% | | | | | | | | | | | | | | | | | | | | |
| | | | | | |
Qatar Energy, | | | | | | | | | | | | | | | | | | | | |
Sr. Unsec’d. Notes | | | 3.300 | | | | | | | 07/12/51 | | | | | 200 | | | | 135,000 | |
Sr. Unsec’d. Notes, 144A | | | 3.125 | | | | | | | 07/12/41 | | | | | 800 | | | | 563,400 | |
| | | | | | | | | | | | | | | | | | | | |
| | | | | | |
| | | | | | | | | | | | | | | | | | | 698,400 | |
| | | | | | |
Saudi Arabia 0.6% | | | | | | | | | | | | | | | | | | | | |
| | | | | | |
Arabian Centres Sukuk Ltd., | | | | | | | | | | | | | | | | | | | | |
Gtd. Notes | | | 5.375 | | | | | | | 11/26/24 | | | | | 200 | | | | 183,700 | |
EIG Pearl Holdings Sarl, | | | | | | | | | | | | | | | | | | | | |
Sr. Sec’d. Notes, 144A | | | 3.545 | | | | | | | 08/31/36 | | | | | 450 | | | | 345,375 | |
Saudi Arabian Oil Co., | | | | | | | | | | | | | | | | | | | | |
Sr. Unsec’d. Notes | | | 2.250 | | | | | | | 11/24/30 | | | | | 260 | | | | 204,880 | |
Sr. Unsec’d. Notes, EMTN | | | 4.250 | | | | | | | 04/16/39 | | | | | 200 | | | | 164,002 | |
| | | | | | | | | | | | | | | | | | | | |
| | | | | | |
| | | | | | | | | | | | | | | | | | | 897,957 | |
| | | | | | |
South Africa 2.2% | | | | | | | | | | | | | | | | | | | | |
| | | | | | |
Eskom Holdings SOC Ltd., | | | | | | | | | | | | | | | | | | | | |
Gov’t. Gtd. Notes, MTN | | | 6.350 | | | | | | | 08/10/28 | | | | | 600 | | | | 537,187 | |
Sr. Unsec’d. Notes | | | 7.125 | | | | | | | 02/11/25 | | | | | 1,000 | | | | 930,812 | |
Sr. Unsec’d. Notes, EMTN | | | 6.750 | | | | | | | 08/06/23 | | | | | 600 | | | | 585,375 | |
Sr. Unsec’d. Notes, MTN | | | 8.450 | | | | | | | 08/10/28 | | | | | 660 | | | | 579,150 | |
MTN Mauritius Investments Ltd., | | | | | | | | | | | | | | | | | | | | |
Gtd. Notes, 144A | | | 6.500 | | | | | | | 10/13/26 | | | | | 200 | | | | 189,913 | |
Sasol Financing USA LLC, | | | | | | | | | | | | | | | | | | | | |
Gtd. Notes | | | 6.500 | | | | | | | 09/27/28 | | | | | 300 | | | | 265,216 | |
| | | | | | | | | | | | | | | | | | | | |
| | | | | | |
| | | | | | | | | | | | | | | | | | | 3,087,653 | |
See Notes to Financial Statements.
PGIM Emerging Markets Debt Hard Currency Fund 21
Schedule of Investments (continued)
as of October 31, 2022
| | | | | | | | | | | | | | | | | | | | | | | | |
| | | | | | |
| Description | | Interest Rate | | | | Maturity Date | | | | | | Principal Amount (000)# | | | Value | |
| | | | | | |
CORPORATE BONDS (Continued) | | | | | | | | | | | | | | | | | | | | | | | | |
| | | | | | |
Thailand 0.1% | | | | | | | | | | | | | | | | | | | | | | | | |
| | | | | | |
Thaioil Treasury Center Co. Ltd., | | | | | | | | | | | | | | | | | | | | | | | | |
Gtd. Notes, 144A, MTN | | | 3.750 | % | | | | | | | 06/18/50 | | | | | | | | 200 | | | $ | 97,126 | |
| | | | | | |
Trinidad & Tobago 0.1% | | | | | | | | | | | | | | | | | | | | | | | | |
| | | | | | |
Heritage Petroleum Co. Ltd., | | | | | | | | | | | | | | | | | | | | | | | | |
Sr. Sec’d. Notes, 144A | | | 9.000 | | | | | | | | 08/12/29 | | | | | | | | 200 | | | | 208,000 | |
| | | | | | |
Turkey 0.2% | | | | | | | | | | | | | | | | | | | | | | | | |
| | | | | | |
Aydem Yenilenebilir Enerji A/S, | | | | | | | | | | | | | | | | | | | | | | | | |
Sr. Sec’d. Notes, 144A | | | 7.750 | | | | | | | | 02/02/27 | | | | | | | | 200 | | | | 147,287 | |
Turkiye Sinai Kalkinma Bankasi A/S, | | | | | | | | | | | | | | | | | | | | | | | | |
Sr. Unsec’d. Notes, 144A | | | 6.000 | | | | | | | | 01/23/25 | | | | | | | | 200 | | | | 184,546 | |
| | | | | | | | | | | | | | | | | | | | | | | | |
| | | | | | |
| | | | | | | | | | | | | | | | | | | | | | | 331,833 | |
| | | | | | |
Ukraine 0.1% | | | | | | | | | | | | | | | | | | | | | | | | |
| | | | | | |
NAK Naftogaz Ukraine via Kondor Finance PLC, | | | | | | | | | | | | | | | | | | | | | | | | |
Sr. Unsec’d. Notes | | | 7.125 | | | | | | | | 07/19/24(d) | | | | EUR | | | | 420 | | | | 64,413 | |
State Savings Bank of Ukraine Via SSB #1 PLC, | | | | | | | | | | | | | | | | | | | | | | | | |
Sr. Unsec’d. Notes | | | 9.625 | | | | | | | | 03/20/25 | | | | | | | | 50 | | | | 25,447 | |
| | | | | | | | | | | | | | | | | | | | | | | | |
| | | | | | |
| | | | | | | | | | | | | | | | | | | | | | | 89,860 | |
| | | | | | |
United Arab Emirates 2.3% | | | | | | | | | | | | | | | | | | | | | | | | |
| | | | | | |
Abu Dhabi Crude Oil Pipeline LLC, | | | | | | | | | | | | | | | | | | | | | | | | |
Sr. Sec’d. Notes | | | 3.650 | | | | | | | | 11/02/29 | | | | | | | | 200 | | | | 180,500 | |
Sr. Sec’d. Notes | | | 4.600 | | | | | | | | 11/02/47 | | | | | | | | 200 | | | | 170,850 | |
Abu Dhabi National Energy Co. PJSC, | | | | | | | | | | | | | | | | | | | | | | | | |
Sr. Unsec’d. Notes, 144A | | | 4.000 | | | | | | | | 10/03/49 | | | | | | | | 200 | | | | 160,725 | |
Abu Dhabi Ports Co. PJSC, | | | | | | | | | | | | | | | | | | | | | | | | |
Sr. Unsec’d. Notes, EMTN | | | 2.500 | | | | | | | | 05/06/31 | | | | | | | | 200 | | | | 156,865 | |
DAE Funding LLC, | | | | | | | | | | | | | | | | | | | | | | | | |
Gtd. Notes, EMTN | | | 3.375 | | | | | | | | 03/20/28 | | | | | | | | 240 | | | | 202,942 | |
DP World Crescent Ltd., | | | | | | | | | | | | | | | | | | | | | | | | |
Sr. Unsec’d. Notes, EMTN | | | 3.875 | | | | | | | | 07/18/29 | | | | | | | | 660 | | | | 586,235 | |
DP World Ltd., | | | | | | | | | | | | | | | | | | | | | | | | |
Sr. Unsec’d. Notes, EMTN | | | 6.850 | | | | | | | | 07/02/37 | | | | | | | | 800 | | | | 762,400 | |
Galaxy Pipeline Assets Bidco Ltd., | | | | | | | | | | | | | | | | | | | | | | | | |
Sr. Sec’d. Notes | | | 2.160 | | | | | | | | 03/31/34 | | | | | | | | 203 | | | | 165,537 | |
Sr. Sec’d. Notes, 144A | | | 2.940 | | | | | | | | 09/30/40 | | | | | | | | 580 | | | | 433,054 | |
See Notes to Financial Statements.
22
| | | | | | | | | | | | | | | | | | | | | | |
| | | | | | |
| Description | | Interest Rate | | | | Maturity Date | | | | | Principal Amount (000)# | | | Value | |
| | | | | | |
CORPORATE BONDS (Continued) | | | | | | | | | | | | | | | | | | | | | | |
| | | | | | |
United Arab Emirates (cont’d.) | | | | | | | | | | | | | | | | | | | | | | |
| | | | | | |
ICD Funding Ltd., | | | | | | | | | | | | | | | | | | | | | | |
Gtd. Notes | | | 4.625 | % | | | | | | | 05/21/24 | | | | | | 200 | | | $ | 194,010 | |
MDGH GMTN RSC Ltd., | | | | | | | | | | | | | | | | | | | | | | |
Gtd. Notes, EMTN | | | 3.700 | | | | | | | | 11/07/49 | | | | | | 240 | | | | 175,920 | |
| | | | | | | | | | | | | | | | | | | | | | |
| | | | | | |
| | | | | | | | | | | | | | | | | | | | | 3,189,038 | |
| | | | | | |
Venezuela 0.0% | | | | | | | | | | | | | | | | | | | | | | |
| | | | | | |
Petroleos de Venezuela SA, | | | | | | | | | | | | | | | | | | | | | | |
Gtd. Notes | | | 5.375 | | | | | | | | 04/12/27(d) | | | | | | 205 | | | | 4,100 | |
Gtd. Notes | | | 6.000 | | | | | | | | 05/16/24(d) | | | | | | 45 | | | | 1,013 | |
Gtd. Notes | | | 6.000 | | | | | | | | 11/15/26(d) | | | | | | 65 | | | | 1,235 | |
Sr. Sec’d. Notes | | | 8.500 | | | | | | | | 10/27/20(d) | | | | | | 205 | | | | 30,750 | |
| | | | | | | | | | | | | | | | | | | | | | |
| | | | | | |
| | | | | | | | | | | | | | | | | | | | | 37,098 | |
| | | | | | |
Vietnam 0.1% | | | | | | | | | | | | | | | | | | | | | | |
| | | | | | |
Mong Duong Finance Holdings BV, | | | | | | | | | | | | | | | | | | | | | | |
Sr. Sec’d. Notes | | | 5.125 | | | | | | | | 05/07/29 | | | | | | 250 | | | | 173,250 | |
| | | | | | | | | | | | | | | | | | | | | | |
| | | | | | |
TOTAL CORPORATE BONDS
(cost $46,349,569) | | | | | | | | | | | | | | | | | | | | | 35,914,065 | |
| | | | | | | | | | | | | | | | | | | | | | |
| | | | | | |
SOVEREIGN BONDS 68.1% | | | | | | | | | | | | | | | | | | | | | | |
| | | | | | |
Angola 2.0% | | | | | | | | | | | | | | | | | | | | | | |
| | | | | | |
Angolan Government International Bond, | | | | | | | | | | | | | | | | | | | | | | |
Sr. Unsec’d. Notes | | | 8.250 | | | | | | | | 05/09/28 | | | | | | 1,380 | | | | 1,155,750 | |
Sr. Unsec’d. Notes | | | 9.375 | | | | | | | | 05/08/48 | | | | | | 200 | | | | 152,000 | |
Sr. Unsec’d. Notes | | | 9.500 | | | | | | | | 11/12/25 | | | | | | 905 | | | | 880,112 | |
Sr. Unsec’d. Notes, 144A | | | 8.750 | | | | | | | | 04/14/32 | | | | | | 200 | | | | 160,000 | |
Sr. Unsec’d. Notes, EMTN | | | 8.000 | | | | | | | | 11/26/29 | | | | | | 600 | | | | 487,500 | |
| | | | | | | | | | | | | | | | | | | | | | |
| | | | | | |
| | | | | | | | | | | | | | | | | | | | | 2,835,362 | |
| | | | | | |
Argentina 1.1% | | | | | | | | | | | | | | | | | | | | | | |
| | | | | | |
Argentine Republic Government International Bond, | | | | | | | | | | | | | | | | | | | | | | |
Sr. Unsec’d. Notes | | | 0.500 | (cc)�� | | | | | | | 07/09/30 | | | | | | 2,010 | | | | 421,118 | |
Sr. Unsec’d. Notes | | | 1.000 | | | | | | | | 07/09/29 | | | | | | 254 | | | | 51,963 | |
Sr. Unsec’d. Notes | | | 1.500 | (cc) | | | | | | | 07/09/35 | | | | | | 1,052 | | | | 208,266 | |
Sr. Unsec’d. Notes | | | 1.500 | (cc) | | | | | | | 07/09/46 | | | | | | 335 | | | | 67,586 | |
Sr. Unsec’d. Notes | | | 3.500 | (cc) | | | | | | | 07/09/41 | | | | | | 597 | | | | 141,832 | |
Sr. Unsec’d. Notes | | | 3.875 | (cc) | | | | | | | 01/09/38 | | | | | | 1,790 | | | | 460,233 | |
See Notes to Financial Statements.
PGIM Emerging Markets Debt Hard Currency Fund 23
Schedule of Investments (continued)
as of October 31, 2022
| | | | | | | | | | | | | | | | | | | | | | |
| | | | | | |
| Description | | Interest Rate | | | | Maturity Date | | | | | Principal Amount (000)# | | | Value | |
| | | | | | |
SOVEREIGN BONDS (Continued) | | | | | | | | | | | | | | | | | | | | | | |
| | | | | | |
Argentina (cont’d.) | | | | | | | | | | | | | | | | | | | | | | |
| | | | | | |
Provincia de Buenos Aires, | | | | | | | | | | | | | | | | | | | | | | |
Sr. Unsec’d. Notes, 144A, MTN | | | 5.250 | %(cc) | | | | | | | 09/01/37 | | | | | | 478 | | | $ | 143,850 | |
| | | | | | | | | | | | | | | | | | | | | | |
| | | | | | |
| | | | | | | | | | | | | | | | | | | | | 1,494,848 | |
| | | | | | |
Bahrain 2.2% | | | | | | | | | | | | | | | | | | | | | | |
| | | | | | |
Bahrain Government International Bond, | | | | | | | | | | | | | | | | | | | | | | |
Sr. Unsec’d. Notes | | | 6.750 | | | | | | | | 09/20/29 | | | | | | 1,000 | | | | 937,062 | |
Sr. Unsec’d. Notes | | | 7.000 | | | | | | | | 10/12/28 | | | | | | 950 | | | | 908,616 | |
Sr. Unsec’d. Notes | | | 7.375 | | | | | | | | 05/14/30 | | | | | | 720 | | | | 684,135 | |
Sr. Unsec’d. Notes | | | 7.500 | | | | | | | | 09/20/47 | | | | | | 400 | | | | 318,450 | |
Sr. Unsec’d. Notes, EMTN | | | 4.250 | | | | | | | | 01/25/28 | | | | | | 200 | | | | 174,288 | |
| | | | | | | | | | | | | | | | | | | | | | |
| | | | | | |
| | | | | | | | | | | | | | | | | | | | | 3,022,551 | |
| | | | | | |
Bermuda 0.4% | | | | | | | | | | | | | | | | | | | | | | |
| | | | | | |
Bermuda Government International Bond, | | | | | | | | | | | | | | | | | | | | | | |
Sr. Unsec’d. Notes | | | 2.375 | | | | | | | | 08/20/30 | | | | | | 670 | | | | 525,448 | |
| | | | | | |
Brazil 2.7% | | | | | | | | | | | | | | | | | | | | | | |
| | | | | | |
Brazil Minas SPE via State of Minas Gerais, | | | | | | | | | | | | | | | | | | | | | | |
Gov’t. Gtd. Notes | | | 5.333 | | | | | | | | 02/15/28 | | | | | | 171 | | | | 163,979 | |
Brazilian Government International Bond, | | | | | | | | | | | | | | | | | | | | | | |
Sr. Unsec’d. Notes | | | 3.875 | | | | | | | | 06/12/30 | | | | | | 480 | | | | 403,140 | |
Sr. Unsec’d. Notes | | | 4.500 | | | | | | | | 05/30/29 | | | | | | 550 | | | | 492,181 | |
Sr. Unsec’d. Notes | | | 5.000 | | | | | | | | 01/27/45 | | | | | | 400 | | | | 287,325 | |
Sr. Unsec’d. Notes | | | 5.625 | | | | | | | | 01/07/41 | | | | | | 745 | | | | 598,002 | |
Sr. Unsec’d. Notes | | | 7.125 | | | | | | | | 01/20/37 | | | | | | 1,050 | | | | 1,045,931 | |
Sr. Unsec’d. Notes | | | 8.250 | | | | | | | | 01/20/34 | | | | | | 773 | | | | 834,260 | |
| | | | | | | | | | | | | | | | | | | | | | |
| | | | | | |
| | | | | | | | | | | | | | | | | | | | | 3,824,818 | |
| | | | | | |
Cameroon 0.3% | | | | | | | | | | | | | | | | | | | | | | |
| | | | | | |
Republic of Cameroon International Bond, | | | | | | | | | | | | | | | | | | | | | | |
Sr. Unsec’d. Notes | | | 9.500 | | | | | | | | 11/19/25 | | | | | | 400 | | | | 385,575 | |
| | | | | | |
Chile 0.8% | | | | | | | | | | | | | | | | | | | | | | |
| | | | | | |
Chile Government International Bond, | | | | | | | | | | | | | | | | | | | | | | |
Sr. Unsec’d. Notes | | | 2.550 | | | | | | | | 07/27/33 | | | | | | 370 | | | | 275,095 | |
Sr. Unsec’d. Notes | | | 2.750 | | | | | | | | 01/31/27 | | | | | | 930 | | | | 834,675 | |
| | | | | | | | | | | | | | | | | | | | | | |
| | | | | | |
| | | | | | | | | | | | | | | | | | | | | 1,109,770 | |
See Notes to Financial Statements.
24
| | | | | | | | | | | | | | | | | | | | | | | | |
| | | | | | |
| Description | | Interest
Rate | | | | | Maturity
Date | | | | | | Principal Amount (000)# | | | Value | |
| | | | | | |
SOVEREIGN BONDS (Continued) | | | | | | | | | | | | | | | | | | | | | | | | |
| | | | | | |
Colombia 2.8% | | | | | | | | | | | | | | | | | | | | | | | | |
| | | | | | |
Colombia Government International Bond, | | | | | | | | | | | | | | | | | | | | | | | | |
Sr. Unsec’d. Notes | | | 3.000 | % | | | | | | | 01/30/30 | | | | | | | | 1,268 | | | $ | 895,842 | |
Sr. Unsec’d. Notes | | | 3.875 | | | | | | | | 04/25/27 | | | | | | | | 600 | | | | 499,612 | |
Sr. Unsec’d. Notes | | | 4.500 | | | | | | | | 03/15/29 | | | | | | | | 410 | | | | 330,768 | |
Sr. Unsec’d. Notes | | | 5.625 | | | | | | | | 02/26/44 | | | | | | | | 710 | | | | 459,015 | |
Sr. Unsec’d. Notes | | | 6.125 | | | | | | | | 01/18/41 | | | | | | | | 980 | | | | 700,271 | |
Sr. Unsec’d. Notes | | | 7.375 | | | | | | | | 09/18/37 | | | | | | | | 915 | | | | 769,915 | |
Sr. Unsec’d. Notes | | | 10.375 | | | | | | | | 01/28/33 | | | | | | | | 200 | | | | 212,413 | |
| | | | | | | | | | | | | | | | | | | | | | | | |
| | | | | | |
| | | | | | | | | | | | | | | | | | | | | | | 3,867,836 | |
| | | | | | |
Congo (Republic) 0.2% | | | | | | | | | | | | | | | | | | | | | | | | |
| | | | | | |
Congolese International Bond, | | | | | | | | | | | | | | | | | | | | | | | | |
Sr. Unsec’d. Notes | | | 6.000 | | | | | | | | 06/30/29 | | | | | | | | 254 | | | | 213,465 | |
| | | | | | |
Costa Rica 0.7% | | | | | | | | | | | | | | | | | | | | | | | | |
| | | | | | |
Costa Rica Government International Bond, | | | | | | | | | | | | | | | | | | | | | | | | |
Sr. Unsec’d. Notes | | | 4.375 | | | | | | | | 04/30/25 | | | | | | | | 1,000 | | | | 960,500 | |
| | | | | | |
Croatia 0.3% | | | | | | | | | | | | | | | | | | | | | | | | |
| | | | | | |
Croatia Government International Bond, | | | | | | | | | | | | | | | | | | | | | | | | |
Sr. Unsec’d. Notes | | | 1.500 | | | | | | | | 06/17/31 | | | | EUR | | | | 575 | | | | 458,608 | |
| | | | | | |
Dominican Republic 3.7% | | | | | | | | | | | | | | | | | | | | | | | | |
| | | | | | |
Dominican Republic International Bond, | | | | | | | | | | | | | | | | | | | | | | | | |
Sr. Unsec’d. Notes | | | 4.500 | | | | | | | | 01/30/30 | | | | | | | | 1,088 | | | | 868,564 | |
Sr. Unsec’d. Notes | | | 4.875 | | | | | | | | 09/23/32 | | | | | | | | 190 | | | | 145,742 | |
Sr. Unsec’d. Notes | | | 5.500 | | | | | | | | 01/27/25 | | | | | | | | 100 | | | | 97,613 | |
Sr. Unsec’d. Notes | | | 5.500 | | | | | | | | 02/22/29 | | | | | | | | 306 | | | | 265,990 | |
Sr. Unsec’d. Notes | | | 5.875 | | | | | | | | 01/30/60 | | | | | | | | 150 | | | | 100,500 | |
Sr. Unsec’d. Notes | | | 5.950 | | | | | | | | 01/25/27 | | | | | | | | 665 | | | | 619,198 | |
Sr. Unsec’d. Notes | | | 6.000 | | | | | | | | 07/19/28 | | | | | | | | 150 | | | | 136,481 | |
Sr. Unsec’d. Notes | | | 6.850 | | | | | | | | 01/27/45 | | | | | | | | 610 | | | | 468,671 | |
Sr. Unsec’d. Notes | | | 6.875 | | | | | | | | 01/29/26 | | | | | | | | 500 | | | | 489,781 | |
Sr. Unsec’d. Notes | | | 7.450 | | | | | | | | 04/30/44 | | | | | | | | 1,300 | | | | 1,084,525 | |
Sr. Unsec’d. Notes, 144A | | | 4.875 | | | | | | | | 09/23/32 | | | | | | | | 150 | | | | 115,059 | |
Sr. Unsec’d. Notes, 144A | | | 5.300 | | | | | | | | 01/21/41 | | | | | | | | 150 | | | | 102,872 | |
Sr. Unsec’d. Notes, 144A | | | 5.500 | | | | | | | | 02/22/29 | | | | | | | | 400 | | | | 347,700 | |
Sr. Unsec’d. Notes, 144A | | | 5.875 | | | | | | | | 01/30/60 | | | | | | | | 225 | | | | 150,750 | |
Sr. Unsec’d. Notes, 144A | | | 6.000 | | | | | | | | 07/19/28 | | | | | | | | 170 | | | | 154,679 | |
| | | | | | | | | | | | | | | | | | | | | | | | |
| | | | | | |
| | | | | | | | | | | | | | | | | | | | | | | 5,148,125 | |
See Notes to Financial Statements.
PGIM Emerging Markets Debt Hard Currency Fund 25
Schedule of Investments (continued)
as of October 31, 2022
| | | | | | | | | | | | | | | | | | | | | | | | |
| | | | | | |
| Description | | Interest Rate | | | | Maturity Date | | | | | | Principal Amount (000)# | | | Value | |
| | | | | | |
SOVEREIGN BONDS (Continued) | | | | | | | | | | | | | | | | | | | | | | | | |
| | | | | | |
Ecuador 1.2% | | | | | | | | | | | | | | | | | | | | | | | | |
| | | | | | |
Ecuador Government International Bond, | | | | | | | | | | | | | | | | | | | | | | | | |
Sr. Unsec’d. Notes | | | 5.500 | %(cc) | | | | | | | 07/31/30 | | | | | | | | 327 | | | $ | 173,033 | |
Sr. Unsec’d. Notes, 144A | | | 1.500 | (cc) | | | | | | | 07/31/40 | | | | | | | | 1,111 | | | | 360,285 | |
Sr. Unsec’d. Notes, 144A | | | 2.500 | (cc) | | | | | | | 07/31/35 | | | | | | | | 1,405 | | | | 510,493 | |
Sr. Unsec’d. Notes, 144A | | | 5.500 | (cc) | | | | | | | 07/31/30 | | | | | | | | 1,119 | | | | 592,901 | |
Sr. Unsec’d. Notes, 144A | | | 7.187 | (s) | | | | | | | 07/31/30 | | | | | | | | 179 | | | | 54,922 | |
| | | | | | | | | | | | | | | | | | | | | | | | |
| | | | | | |
| | | | | | | | | | | | | | | | | | | | | | | 1,691,634 | |
| | | | | | |
Egypt 2.4% | | | | | | | | | | | | | | | | | | | | | | | | |
| | | | | | |
Egypt Government International Bond, | | | | | | | | | | | | | | | | | | | | | | | | |
Sr. Unsec’d. Notes | | | 7.903 | | | | | | | | 02/21/48 | | | | | | | | 200 | | | | 111,750 | |
Sr. Unsec’d. Notes | | | 8.875 | | | | | | | | 05/29/50 | | | | | | | | 400 | | | | 237,000 | |
Sr. Unsec’d. Notes, 144A | | | 8.700 | | | | | | | | 03/01/49 | | | | | | | | 410 | | | | 242,412 | |
Sr. Unsec’d. Notes, 144A, MTN | | | 4.750 | | | | | | | | 04/16/26 | | | | EUR | | | | 100 | | | | 74,489 | |
Sr. Unsec’d. Notes, 144A, MTN | | | 6.375 | | | | | | | | 04/11/31 | | | | EUR | | | | 420 | | | | 249,558 | |
Sr. Unsec’d. Notes, 144A, MTN | | | 8.500 | | | | | | | | 01/31/47 | | | | | | | | 255 | | | | 150,131 | |
Sr. Unsec’d. Notes, EMTN | | | 3.875 | | | | | | | | 02/16/26 | | | | | | | | 230 | | | | 173,363 | |
Sr. Unsec’d. Notes, EMTN | | | 4.750 | | | | | | | | 04/11/25 | | | | EUR | | | | 400 | | | | 330,075 | |
Sr. Unsec’d. Notes, EMTN | | | 4.750 | | | | | | | | 04/16/26 | | | | EUR | | | | 800 | | | | 595,915 | |
Sr. Unsec’d. Notes, EMTN | | | 5.625 | | | | | | | | 04/16/30 | | | | EUR | | | | 500 | | | | 296,475 | |
Sr. Unsec’d. Notes, EMTN | | | 6.375 | | | | | | | | 04/11/31 | | | | EUR | | | | 200 | | | | 118,837 | |
Sr. Unsec’d. Notes, EMTN | | | 7.600 | | | | | | | | 03/01/29 | | | | | | | | 300 | | | | 214,500 | |
Sr. Unsec’d. Notes, MTN | | | 5.800 | | | | | | | | 09/30/27 | | | | | | | | 400 | | | | 290,500 | |
Sr. Unsec’d. Notes, MTN | | | 7.500 | | | | | | | | 01/31/27 | | | | | | | | 200 | | | | 160,750 | |
Sr. Unsec’d. Notes, MTN | | | 8.500 | | | | | | | | 01/31/47 | | | | | | | | 250 | | | | 147,188 | |
| | | | | | | | | | | | | | | | | | | | | | | | |
| | | | | | |
| | | | | | | | | | | | | | | | | | | | | | | 3,392,943 | |
| | | | | | |
El Salvador 0.4% | | | | | | | | | | | | | | | | | | | | | | | | |
| | | | | | |
El Salvador Government International Bond, | | | | | | | | | | | | | | | | | | | | | | | | |
Sr. Unsec’d. Notes | | | 5.875 | | | | | | | | 01/30/25 | | | | | | | | 301 | | | | 167,582 | |
Sr. Unsec’d. Notes | | | 6.375 | | | | | | | | 01/18/27 | | | | | | | | 235 | | | | 91,180 | |
Sr. Unsec’d. Notes | | | 7.625 | | | | | | | | 02/01/41 | | | | | | | | 150 | | | | 51,075 | |
Sr. Unsec’d. Notes | | | 7.650 | | | | | | | | 06/15/35 | | | | | | | | 57 | | | | 20,299 | |
Sr. Unsec’d. Notes | | | 7.750 | | | | | | | | 01/24/23 | | | | | | | | 72 | | | | 64,701 | |
Sr. Unsec’d. Notes | | | 8.250 | | | | | | | | 04/10/32 | | | | | | | | 425 | | | | 167,822 | |
| | | | | | | | | | | | | | | | | | | | | | | | |
| | | | | | |
| | | | | | | | | | | | | | | | | | | | | | | 562,659 | |
| | | | | | |
Gabon 0.8% | | | | | | | | | | | | | | | | | | | | | | | | |
| | | | | | |
Gabon Government International Bond, | | | | | | | | | | | | | | | | | | | | | | | | |
Sr. Unsec’d. Notes | | | 6.625 | | | | | | | | 02/06/31 | | | | | | | | 200 | | | | 139,537 | |
See Notes to Financial Statements.
26
| | | | | | | | | | | | | | | | | | | | | | | | |
| | | | | | |
| Description | | Interest
Rate | | | | | Maturity
Date | | | | | | Principal Amount (000)# | | | Value | |
| | | | | | |
SOVEREIGN BONDS (Continued) | | | | | | | | | | | | | | | | | | | | | | | | |
| | | | | | |
Gabon (cont’d.) | | | | | | | | | | | | | | | | | | | | | | | | |
| | | | | | |
Gabon Government International Bond, (cont’d.) | | | | | | | | | | | | | | | | | | | | | | | | |
Sr. Unsec’d. Notes | | | 6.950 | % | | | | | | | 06/16/25 | | | | | | | | 800 | | | $ | 718,000 | |
Sr. Unsec’d. Notes | | | 7.000 | | | | | | | | 11/24/31 | | | | | | | | 200 | | | | 139,413 | |
Sr. Unsec’d. Notes, 144A | | | 6.625 | | | | | | | | 02/06/31 | | | | | | | | 215 | | | | 150,003 | |
| | | | | | | | | | | | | | | | | | | | | | | | |
| | | | | | |
| | | | | | | | | | | | | | | | | | | | | | | 1,146,953 | |
| | | | | | |
Ghana 0.6% | | | | | | | | | | | | | | | | | | | | | | | | |
| | | | | | |
Ghana Government International Bond, | | | | | | | | | | | | | | | | | | | | | | | | |
Bank Gtd. Notes | | | 10.750 | | | | | | | | 10/14/30 | | | | | | | | 400 | | | | 258,000 | |
Sr. Unsec’d. Notes | | | 6.375 | | | | | | | | 02/11/27 | | | | | | | | 250 | | | | 75,000 | |
Sr. Unsec’d. Notes | | | 7.625 | | | | | | | | 05/16/29 | | | | | | | | 400 | | | | 110,000 | |
Sr. Unsec’d. Notes | | | 7.750 | | | | | | | | 04/07/29 | | | | | | | | 400 | | | | 115,180 | |
Sr. Unsec’d. Notes(a) | | | 7.875 | | | | | | | | 03/26/27 | | | | | | | | 550 | | | | 165,000 | |
Sr. Unsec’d. Notes | | | 7.875 | | | | | | | | 02/11/35 | | | | | | | | 200 | | | | 55,475 | |
Sr. Unsec’d. Notes | | | 8.125 | | | | | | | | 01/18/26 | | | | | | | | 200 | | | | 72,725 | |
Sr. Unsec’d. Notes, 144A | | | 8.950 | | | | | | | | 03/26/51 | | | | | | | | 205 | | | | 57,310 | |
| | | | | | | | | | | | | | | | | | | | | | | | |
| | | | | | |
| | | | | | | | | | | | | | | | | | | | | | | 908,690 | |
| | | | | | |
Guatemala 0.7% | | | | | | | | | | | | | | | | | | | | | | | | |
| | | | | | |
Guatemala Government Bond, | | | | | | | | | | | | | | | | | | | | | | | | |
Sr. Unsec’d. Notes | | | 4.875 | | | | | | | | 02/13/28 | | | | | | | | 600 | | | | 550,800 | |
Sr. Unsec’d. Notes | | | 6.125 | | | | | | | | 06/01/50 | | | | | | | | 400 | | | | 343,450 | |
Sr. Unsec’d. Notes, 144A | | | 4.650 | | | | | | | | 10/07/41 | | | | | | | | 200 | | | | 146,537 | |
| | | | | | | | | | | | | | | | | | | | | | | | |
| | | | | | |
| | | | | | | | | | | | | | | | | | | | | | | 1,040,787 | |
| | | | | | |
Honduras 0.1% | | | | | | | | | | | | | | | | | | | | | | | | |
| | | | | | |
Honduras Government International Bond, | | | | | | | | | | | | | | | | | | | | | | | | |
Sr. Unsec’d. Notes | | | 6.250 | | | | | | | | 01/19/27 | | | | | | | | 240 | | | | 188,370 | |
| | | | | | |
Hungary 1.4% | | | | | | | | | | | | | | | | | | | | | | | | |
| | | | | | |
Hungary Government International Bond, | | | | | | | | | | | | | | | | | | | | | | | | |
Sr. Unsec’d. Notes | | | 1.750 | | | | | | | | 06/05/35 | | | | EUR | | | | 715 | | | | 432,041 | |
Sr. Unsec’d. Notes | | | 7.625 | | | | | | | | 03/29/41 | | | | | | | | 210 | | | | 209,186 | |
Sr. Unsec’d. Notes, 144A | | | 3.125 | | | | | | | | 09/21/51 | | | | | | | | 255 | | | | 138,943 | |
Sr. Unsec’d. Notes, 144A | | | 5.250 | | | | | | | | 06/16/29 | | | | | | | | 1,220 | | | | 1,118,817 | |
| | | | | | | | | | | | | | | | | | | | | | | | |
| | | | | | |
| | | | | | | | | | | | | | | | | | | | | | | 1,898,987 | |
See Notes to Financial Statements.
PGIM Emerging Markets Debt Hard Currency Fund 27
Schedule of Investments (continued)
as of October 31, 2022
| | | | | | | | | | | | | | | | | | | | | | |
| | | | | | |
| Description | | Interest Rate | | | | | Maturity Date | | | | | Principal Amount (000)# | | | Value | |
| | | | | | |
SOVEREIGN BONDS (Continued) | | | | | | | | | | | | | | | | | | | | | | |
| | | | | | |
India 0.3% | | | | | | | | | | | | | | | | | | | | | | |
| | | | | | |
Export-Import Bank of India, | | | | | | | | | | | | | | | | | | | | | | |
Sr. Unsec’d. Notes | | | 3.875 | % | | | | | | 02/01/28 | | | | | | | 200 | | | $ | 177,360 | |
Sr. Unsec’d. Notes, 144A, MTN | | | 3.250 | | | | | | | 01/15/30 | | | | | | | 200 | | | | 162,712 | |
Sr. Unsec’d. Notes, EMTN | | | 2.250 | | | | | | | 01/13/31 | | | | | | | 200 | | | | 146,132 | |
| | | | | | | | | | | | | | | | | | | | | | |
| | | | | | |
| | | | | | | | | | | | | | | | | | | | | 486,204 | |
| | | | | | |
Indonesia 3.3% | | | | | | | | | | | | | | | | | | | | | | |
| | | | | | |
Indonesia Government International Bond, | | | | | | | | | | | | | | | | | | | | | | |
Sr. Unsec’d. Notes | | | 1.100 | | | | | | | 03/12/33 | | | EUR | | | | 440 | | | | 284,788 | |
Sr. Unsec’d. Notes | | | 1.400 | | | | | | | 10/30/31 | | | EUR | | | | 100 | | | | 71,574 | |
Sr. Unsec’d. Notes | | | 1.450 | | | | | | | 09/18/26 | | | EUR | | | | 100 | | | | 86,490 | |
Sr. Unsec’d. Notes | | | 3.550 | | | | | | | 03/31/32 | | | | | | | 200 | | | | 171,022 | |
Sr. Unsec’d. Notes | | | 4.300 | | | | | | | 03/31/52 | | | | | | | 400 | | | | 303,044 | |
Sr. Unsec’d. Notes | | | 4.650 | | | | | | | 09/20/32 | | | | | | | 590 | | | | 544,340 | |
Sr. Unsec’d. Notes | | | 6.625 | | | | | | | 02/17/37 | | | | | | | 150 | | | | 154,294 | |
Sr. Unsec’d. Notes | | | 7.750 | | | | | | | 01/17/38 | | | | | | | 490 | | | | 540,623 | |
Sr. Unsec’d. Notes | | | 8.500 | | | | | | | 10/12/35 | | | | | | | 400 | | | | 468,700 | |
Sr. Unsec’d. Notes, 144A | | | 6.625 | | | | | | | 02/17/37 | | | | | | | 110 | | | | 113,149 | |
Sr. Unsec’d. Notes, EMTN | | | 3.750 | | | | | | | 06/14/28 | | | EUR | | | | 100 | | | | 91,895 | |
Sr. Unsec’d. Notes, EMTN | | | 4.625 | | | | | | | 04/15/43 | | | | | | | 200 | | | | 167,022 | |
Sr. Unsec’d. Notes, EMTN | | | 4.750 | | | | | | | 07/18/47 | | | | | | | 230 | | | | 190,656 | |
Sr. Unsec’d. Notes, EMTN | | | 5.125 | | | | | | | 01/15/45 | | | | | | | 200 | | | | 175,022 | |
Sr. Unsec’d. Notes, EMTN | | | 5.250 | | | | | | | 01/17/42 | | | | | | | 400 | | | | 361,075 | |
Sr. Unsec’d. Notes, EMTN | | | 6.750 | | | | | | | 01/15/44 | | | | | | | 100 | | | | 103,011 | |
Perusahaan Penerbit SBSN Indonesia III, | | | | | | | | | | | | | | | | | | | | | | |
Sr. Unsec’d. Notes | | | 4.700 | | | | | | | 06/06/32 | | | | | | | 600 | | | | 561,066 | |
Sr. Unsec’d. Notes, 144A | | | 4.700 | | | | | | | 06/06/32 | | | | | | | 205 | | | | 191,697 | |
| | | | | | | | | | | | | | | | | | | | | | |
| | | | | | |
| | | | | | | | | | | | | | | | | | | | | 4,579,468 | |
| | | | | | |
Iraq 1.1% | | | | | | | | | | | | | | | | | | | | | | |
| | | | | | |
Iraq International Bond, | | | | | | | | | | | | | | | | | | | | | | |
Sr. Unsec’d. Notes | | | 5.800 | | | | | | | 01/15/28 | | | | | | | 894 | | | | 758,179 | |
Sr. Unsec’d. Notes | | | 6.752 | | | | | | | 03/09/23 | | | | | | | 800 | | | | 784,900 | |
| | | | | | | | | | | | | | | | | | | | | | |
| | | | | | |
| | | | | | | | | | | | | | | | | | | | | 1,543,079 | |
| | | | | | |
Israel 0.5% | | | | | | | | | | | | | | | | | | | | | | |
| | | | | | |
Israel Government International Bond, | | | | | | | | | | | | | | | | | | | | | | |
Sr. Unsec’d. Notes | | | 4.500 | | | | | | | 04/03/2120 | | | | | | | 900 | | | | 678,544 | |
See Notes to Financial Statements.
28
| | | | | | | | | | | | | | | | | | | | | | |
| | | | | | |
| Description | | Interest Rate | | | | | Maturity Date | | | | | Principal Amount (000)# | | | Value | |
| | | | | | |
SOVEREIGN BONDS (Continued) | | | | | | | | | | | | | | | | | | | | | | |
| | | | | | |
Ivory Coast 1.0% | | | | | | | | | | | | | | | | | | | | | | |
| | | | | | |
Ivory Coast Government International Bond, | | | | | | | | | | | | | | | | | | | | | | |
Sr. Unsec’d. Notes | | | 5.250 | % | | | | | | 03/22/30 | | | EUR | | | | 630 | | | $ | 475,042 | |
Sr. Unsec’d. Notes | | | 5.750 | | | | | | | 12/31/32 | | | | | | | 94 | | | | 82,774 | |
Sr. Unsec’d. Notes | | | 5.875 | | | | | | | 10/17/31 | | | EUR | | | | 500 | | | | 374,084 | |
Sr. Unsec’d. Notes | | | 6.375 | | | | | | | 03/03/28 | | | | | | | 400 | | | | 362,075 | |
Sr. Unsec’d. Notes | | | 6.875 | | | | | | | 10/17/40 | | | EUR | | | | 250 | | | | 164,883 | |
| | | | | | | | | | | | | | | | | | | | | | |
| | | | | | |
| | | | | | | | | | | | | | | | | | | | | 1,458,858 | |
| | | | | | |
Jamaica 0.9% | | | | | | | | | | | | | | | | | | | | | | |
| | | | | | |
Jamaica Government International Bond, | | | | | | | | | | | | | | | | | | | | | | |
Sr. Unsec’d. Notes | | | 6.750 | | | | | | | 04/28/28 | | | | | | | 500 | | | | 522,281 | |
Sr. Unsec’d. Notes | | | 7.625 | | | | | | | 07/09/25 | | | | | | | 225 | | | | 231,300 | |
Sr. Unsec’d. Notes | | | 7.875 | | | | | | | 07/28/45 | | | | | | | 200 | | | | 211,975 | |
Sr. Unsec’d. Notes | | | 8.000 | | | | | | | 03/15/39 | | | | | | | 100 | | | | 110,081 | |
Sr. Unsec’d. Notes | | | 9.250 | | | | | | | 10/17/25 | | | | | | | 200 | | | | 211,163 | |
| | | | | | | | | | | | | | | | | | | | | | |
| | | | | | |
| | | | | | | | | | | | | | | | | | | | | 1,286,800 | |
| | | | | | |
Jordan 0.6% | | | | | | | | | | | | | | | | | | | | | | |
| | | | | | |
Jordan Government International Bond, | | | | | | | | | | | | | | | | | | | | | | |
Sr. Unsec’d. Notes | | | 5.750 | | | | | | | 01/31/27 | | | | | | | 200 | | | | 182,850 | |
Sr. Unsec’d. Notes | | | 5.850 | | | | | | | 07/07/30 | | | | | | | 200 | | | | 165,500 | |
Sr. Unsec’d. Notes | | | 6.125 | | | | | | | 01/29/26 | | | | | | | 200 | | | | 190,725 | |
Sr. Unsec’d. Notes | | | 7.375 | | | | | | | 10/10/47 | | | | | | | 200 | | | | 149,250 | |
Sr. Unsec’d. Notes, 144A | | | 7.750 | | | | | | | 01/15/28 | | | | | | | 220 | | | | 213,400 | |
| | | | | | | | | | | | | | | | | | | | | | |
| | | | | | |
| | | | | | | | | | | | | | | | | | | | | 901,725 | |
| | | | | | |
Kazakhstan 0.3% | | | | | | | | | | | | | | | | | | | | | | |
| | | | | | |
Kazakhstan Government International Bond, | | | | | | | | | | | | | | | | | | | | | | |
Sr. Unsec’d. Notes, EMTN | | | 6.500 | | | | | | | 07/21/45 | | | | | | | 400 | | | | 352,450 | |
| | | | | | |
Kenya 0.2% | | | | | | | | | | | | | | | | | | | | | | |
| | | | | | |
Republic of Kenya Government International Bond, | | | | | | | | | | | | | | | | | | | | | | |
Sr. Unsec’d. Notes | | | 7.000 | | | | | | | 05/22/27 | | | | | | | 400 | | | | 317,000 | |
| | | | | | |
Lebanon 0.1% | | | | | | | | | | | | | | | | | | | | | | |
| | | | | | |
Lebanon Government International Bond, | | | | | | | | | | | | | | | | | | | | | | |
Sr. Unsec’d. Notes | | | 6.000 | | | | | | | 01/27/23(d) | | | | | | | 191 | | | | 10,899 | |
Sr. Unsec’d. Notes | | | 6.650 | | | | | | | 04/22/24(d) | | | | | | | 172 | | | | 9,815 | |
Sr. Unsec’d. Notes | | | 6.750 | | | | | | | 11/29/27(d) | | | | | | | 170 | | | | 9,647 | |
Sr. Unsec’d. Notes | | | 6.850 | | | | | | | 03/23/27(d) | | | | | | | 30 | | | | 1,693 | |
See Notes to Financial Statements.
PGIM Emerging Markets Debt Hard Currency Fund 29
Schedule of Investments (continued)
as of October 31, 2022
| | | | | | | | | | | | | | | | | | | | | | | | |
| | | | | | |
| Description | | Interest Rate | | | | | Maturity Date | | | | | | Principal Amount (000)# | | | Value | |
| | | | | | |
SOVEREIGN BONDS (Continued) | | | | | | | | | | | | | | | | | | | | | | | | |
| | | | | | |
Lebanon (cont’d.) | | | | | | | | | | | | | | | | | | | | | | | | |
| | | | | | |
Lebanon Government International Bond, (cont’d.) | | | | | | | | | | | | | | | | | | | | | | | | |
Sr. Unsec’d. Notes | | | 7.000 | % | | | | | | | 04/22/31(d) | | | | | | | | 115 | | | $ | 6,562 | |
Sr. Unsec’d. Notes, EMTN | | | 6.100 | | | | | | | | 10/04/22(d) | | | | | | | | 75 | | | | 4,561 | |
Sr. Unsec’d. Notes, EMTN | | | 6.850 | | | | | | | | 05/25/29(d) | | | | | | | | 335 | | | | 19,011 | |
Sr. Unsec’d. Notes, GMTN | | | 6.250 | | | | | | | | 05/27/22(d) | | | | | | | | 245 | | | | 14,593 | |
Sr. Unsec’d. Notes, GMTN | | | 6.250 | | | | | | | | 11/04/24(d) | | | | | | | | 320 | | | | 18,260 | |
Sr. Unsec’d. Notes, GMTN | | | 6.375 | | | | | | | | 03/09/20(d) | | | | | | | | 220 | | | | 12,554 | |
Sr. Unsec’d. Notes, GMTN | | | 6.400 | | | | | | | | 05/26/23(d) | | | | | | | | 250 | | | | 14,850 | |
Sr. Unsec’d. Notes, GMTN | | | 6.650 | | | | | | | | 02/26/30(d) | | | | | | | | 715 | | | | 40,353 | |
Sr. Unsec’d. Notes, GMTN | | | 7.150 | | | | | | | | 11/20/31(d) | | | | | | | | 415 | | | | 23,979 | |
| | | | | | | | | | | | | | | | | | | | | | | | |
| | | | | | |
| | | | | | | | | | | | | | | | | | | | | | | 186,777 | |
| | | | | | |
Malaysia 1.4% | | | | | | | | | | | | | | | | | | | | | | | | |
| | | | | | |
1MDB Global Investments Ltd., | | | | | | | | | | | | | | | | | | | | | | | | |
Sr. Unsec’d. Notes | | | 4.400 | | | | | | | | 03/09/23 | | | | | | | | 2,000 | | | | 1,955,000 | |
| | | | | | |
Mexico 2.1% | | | | | | | | | | | | | | | | | | | | | | | | |
| | | | | | |
Mexico Government International Bond, | | | | | | | | | | | | | | | | | | | | | | | | |
Sr. Unsec’d. Notes | | | 3.250 | | | | | | | | 04/16/30 | | | | | | | | 270 | | | | 226,766 | |
Sr. Unsec’d. Notes | | | 3.500 | | | | | | | | 02/12/34 | | | | | | | | 600 | | | | 458,400 | |
Sr. Unsec’d. Notes | | | 3.750 | | | | | | | | 01/11/28 | | | | | | | | 320 | | | | 293,120 | |
Sr. Unsec’d. Notes | | | 4.875 | | | | | | | | 05/19/33 | | | | | | | | 530 | | | | 467,725 | |
Sr. Unsec’d. Notes, GMTN | | | 5.750 | | | | | | | | 10/12/2110 | | | | | | | | 358 | | | | 272,483 | |
Sr. Unsec’d. Notes, MTN | | | 4.750 | | | | | | | | 03/08/44 | | | | | | | | 140 | | | | 106,251 | |
Sr. Unsec’d. Notes, MTN | | | 6.050 | | | | | | | | 01/11/40 | | | | | | | | 988 | | | | 909,454 | |
Sr. Unsec’d. Notes, Series A, MTN | | | 6.750 | | | | | | | | 09/27/34 | | | | | | | | 203 | | | | 203,165 | |
| | | | | | | | | | | | | | | | | | | | | | | | |
| | | | | | |
| | | | | | | | | | | | | | | | | | | | | | | 2,937,364 | |
| | | | | | |
Mongolia 0.3% | | | | | | | | | | | | | | | | | | | | | | | | |
| | | | | | |
Mongolia Government International Bond, | | | | | | | | | | | | | | | | | | | | | | | | |
Sr. Unsec’d. Notes, EMTN | | | 8.750 | | | | | | | | 03/09/24 | | | | | | | | 400 | | | | 372,325 | |
| | | | | | |
Morocco 0.7% | | | | | | | | | | | | | | | | | | | | | | | | |
| | | | | | |
Morocco Government International Bond, | | | | | | | | | | | | | | | | | | | | | | | | |
Sr. Unsec’d. Notes | | | 1.500 | | | | | | | | 11/27/31 | | | | EUR | | | | 100 | | | | 65,861 | |
Sr. Unsec’d. Notes | | | 2.000 | | | | | | | | 09/30/30 | | | | EUR | | | | 500 | | | | 357,252 | |
Sr. Unsec’d. Notes | | | 2.375 | | | | | | | | 12/15/27 | | | | | | | | 400 | | | | 328,500 | |
Sr. Unsec’d. Notes | | | 4.000 | | | | | | | | 12/15/50 | | | | | | | | 200 | | | | 117,788 | |
Sr. Unsec’d. Notes, 144A | | | 3.000 | | | | | | | | 12/15/32 | | | | | | | | 200 | | | | 143,725 | |
| | | | | | | | | | | | | | | | | | | | | | | | |
| | | | | | |
| | | | | | | | | | | | | | | | | | | | | | | 1,013,126 | |
See Notes to Financial Statements.
30
| | | | | | | | | | | | | | | | | | | | | | | | |
| | | | | | |
| Description | | Interest Rate | | | | | Maturity Date | | | | | | Principal Amount (000)# | | | Value | |
| | | | | | |
SOVEREIGN BONDS (Continued) | | | | | | | | | | | | | | | | | | | | | | | | |
| | | | | | |
Mozambique 0.4% | | | | | | | | | | | | | | | | | | | | | | | | |
| | | | | | |
Mozambique International Bond, | | | | | | | | | | | | | | | | | | | | | | | | |
Unsec’d. Notes | | | 5.000 | %(cc) | | | | | | | 09/15/31 | | | | | | | | 600 | | | $ | 401,737 | |
Unsec’d. Notes, 144A | | | 5.000 | (cc) | | | | | | | 09/15/31 | | | | | | | | 200 | | | | 133,913 | |
| | | | | | | | | | | | | | | | | | | | | | | | |
| | | | | | |
| | | | | | | | | | | | | | | | | | | | | | | 535,650 | |
| | | | | | |
Namibia 0.1% | | | | | | | | | | | | | | | | | | | | | | | | |
| | | | | | |
Namibia International Bonds, | | | | | | | | | | | | | | | | | | | | | | | | |
Sr. Unsec’d. Notes | | | 5.250 | | | | | | | | 10/29/25 | | | | | | | | 200 | | | | 180,000 | |
| | | | | | |
Nigeria 1.6% | | | | | | | | | | | | | | | | | | | | | | | | |
| | | | | | |
Nigeria Government International Bond, | | | | | | | | | | | | | | | | | | | | | | | | |
Sr. Unsec’d. Notes | | | 7.143 | | | | | | | | 02/23/30 | | | | | | | | 200 | | | | 130,000 | |
Sr. Unsec’d. Notes | | | 7.625 | | | | | | | | 11/21/25 | | | | | | | | 500 | | | | 430,000 | |
Sr. Unsec’d. Notes | | | 7.696 | | | | | | | | 02/23/38 | | | | | | | | 200 | | | | 117,000 | |
Sr. Unsec’d. Notes | | | 7.875 | | | | | | | | 02/16/32 | | | | | | | | 400 | | | | 256,000 | |
Sr. Unsec’d. Notes | | | 9.248 | | | | | | | | 01/21/49 | | | | | | | | 200 | | | | 129,000 | |
Sr. Unsec’d. Notes, 144A | | | 7.696 | | | | | | | | 02/23/38 | | | | | | | | 200 | | | | 117,000 | |
Sr. Unsec’d. Notes, 144A, MTN | | | 6.125 | | | | | | | | 09/28/28 | | | | | | | | 200 | | | | 131,500 | |
Sr. Unsec’d. Notes, 144A, MTN | | | 7.375 | | | | | | | | 09/28/33 | | | | | | | | 200 | | | | 120,500 | |
Sr. Unsec’d. Notes, 144A, MTN | | | 8.375 | | | | | | | | 03/24/29 | | | | | | | | 200 | | | | 144,500 | |
Sr. Unsec’d. Notes, EMTN | | | 6.125 | | | | | | | | 09/28/28 | | | | | | | | 200 | | | | 131,500 | |
Sr. Unsec’d. Notes, EMTN | | | 6.500 | | | | | | | | 11/28/27 | | | | | | | | 700 | | | | 495,250 | |
| | | | | | | | | | | | | | | | | | | | | | | | |
| | | | | | |
| | | | | | | | | | | | | | | | | | | | | | | 2,202,250 | |
| | | | | | |
Oman 3.4% | | | | | | | | | | | | | | | | | | | | | | | | |
| | | | | | |
Oman Government International Bond, | | | | | | | | | | | | | | | | | | | | | | | | |
Sr. Unsec’d. Notes | | | 4.750 | | | | | | | | 06/15/26 | | | | | | | | 760 | | | | 718,200 | |
Sr. Unsec’d. Notes | | | 5.375 | | | | | | | | 03/08/27 | | | | | | | | 780 | | | | 742,950 | |
Sr. Unsec’d. Notes | | | 5.625 | | | | | | | | 01/17/28 | | | | | | | | 680 | | | | 646,000 | |
Sr. Unsec’d. Notes | | | 6.250 | | | | | | | | 01/25/31 | | | | | | | | 200 | | | | 190,500 | |
Sr. Unsec’d. Notes | | | 6.500 | | | | | | | | 03/08/47 | | | | | | | | 625 | | | | 514,844 | |
Sr. Unsec’d. Notes | | | 6.750 | | | | | | | | 10/28/27 | | | | | | | | 600 | | | | 600,862 | |
Sr. Unsec’d. Notes | | | 6.750 | | | | | | | | 01/17/48 | | | | | | | | 200 | | | | 167,750 | |
Sr. Unsec’d. Notes, 144A | | | 6.750 | | | | | | | | 01/17/48 | | | | | | | | 200 | | | | 167,750 | |
Sr. Unsec’d. Notes, 144A, MTN | | | 4.875 | | | | | | | | 02/01/25 | | | | | | | | 200 | | | | 194,000 | |
Sr. Unsec’d. Notes, EMTN | | | 6.000 | | | | | | | | 08/01/29 | | | | | | | | 800 | | | | 759,000 | |
| | | | | | | | | | | | | | | | | | | | | | | | |
| | | | | | |
| | | | | | | | | | | | | | | | | | | | | | | 4,701,856 | |
See Notes to Financial Statements.
PGIM Emerging Markets Debt Hard Currency Fund 31
Schedule of Investments (continued)
as of October 31, 2022
| | | | | | | | | | | | | | | | | | | | | | | | |
| | | | | | |
| Description | | Interest Rate | | | | | Maturity Date | | | | | | Principal Amount (000)# | | | Value | |
| | | | | | |
SOVEREIGN BONDS (Continued) | | | | | | | | | | | | | | | | | | | | | | | | |
| | | | | | |
Pakistan 0.9% | | | | | | | | | | | | | | | | | | | | | | | | |
| | | | | | |
Pakistan Government International Bond, | | | | | | | | | | | | | | | | | | | | | | | | |
Sr. Unsec’d. Notes | | | 6.875 | % | | | | | | | 12/05/27 | | | | | | | | 600 | | | $ | 186,066 | |
Sr. Unsec’d. Notes | | | 8.250 | | | | | | | | 04/15/24 | | | | | | | | 400 | | | | 166,044 | |
Sr. Unsec’d. Notes | | | 8.250 | | | | | | | | 09/30/25 | | | | | | | | 770 | | | | 261,885 | |
Sr. Unsec’d. Notes, 144A, MTN | | | 7.375 | | | | | | | | 04/08/31 | | | | | | | | 200 | | | | 60,522 | |
Sr. Unsec’d. Notes, EMTN | | | 7.375 | | | | | | | | 04/08/31 | | | | | | | | 200 | | | | 60,522 | |
Third Pakistan International Sukuk Co. Ltd. (The), | | | | | | | | | | | | | | | | | | | | | | | | |
Sr. Unsec’d. Notes | | | 5.625 | | | | | | | | 12/05/22 | | | | | | | | 600 | | | | 537,066 | |
| | | | | | | | | | | | | | | | | | | | | | | | |
| | | | | | |
| | | | | | | | | | | | | | | | | | | | | | | 1,272,105 | |
| | | | | | |
Panama 1.5% | | | | | | | | | | | | | | | | | | | | | | | | |
| | | | | | |
Panama Government International Bond, | | | | | | | | | | | | | | | | | | | | | | | | |
Sr. Unsec’d. Notes | | | 3.160 | | | | | | | | 01/23/30 | | | | | | | | 200 | | | | 162,600 | |
Sr. Unsec’d. Notes | | | 3.298 | | | | | | | | 01/19/33 | | | | | | | | 200 | | | | 152,600 | |
Sr. Unsec’d. Notes | | | 3.870 | | | | | | | | 07/23/60 | | | | | | | | 200 | | | | 114,800 | |
Sr. Unsec’d. Notes | | | 4.300 | | | | | | | | 04/29/53 | | | | | | | | 375 | | | | 242,766 | |
Sr. Unsec’d. Notes | | | 4.500 | | | | | | | | 04/16/50 | | | | | | | | 400 | | | | 270,700 | |
Sr. Unsec’d. Notes | | | 4.500 | | | | | | | | 04/01/56 | | | | | | | | 200 | | | | 131,287 | |
Sr. Unsec’d. Notes | | | 6.700 | | | | | | | | 01/26/36 | | | | | | | | 835 | | | | 812,194 | |
Sr. Unsec’d. Notes | | | 9.375 | | | | | | | | 04/01/29 | | | | | | | | 165 | | | | 189,750 | |
| | | | | | | | | | | | | | | | | | | | | | | | |
| | | | | | |
| | | | | | | | | | | | | | | | | | | | | | | 2,076,697 | |
| | | | | | |
Papua New Guinea 0.1% | | | | | | | | | | | | | | | | | | | | | | | | |
| | | | | | |
Papua New Guinea Government International Bond, | | | | | | | | | | | | | | | | | | | | | | | | |
Sr. Unsec’d. Notes, 144A | | | 8.375 | | | | | | | | 10/04/28 | | | | | | | | 200 | | | | 153,475 | |
| | | | | | |
Paraguay 0.5% | | | | | | | | | | | | | | | | | | | | | | | | |
| | | | | | |
Paraguay Government International Bond, | | | | | | | | | | | | | | | | | | | | | | | | |
Sr. Unsec’d. Notes | | | 4.700 | | | | | | | | 03/27/27 | | | | | | | | 200 | | | | 190,538 | |
Sr. Unsec’d. Notes | | | 4.950 | | | | | | | | 04/28/31 | | | | | | | | 200 | | | | 182,475 | |
Sr. Unsec’d. Notes | | | 6.100 | | | | | | | | 08/11/44 | | | | | | | | 400 | | | | 343,700 | |
| | | | | | | | | | | | | | | | | | | | | | | | |
| | | | | | |
| | | | | | | | | | | | | | | | | | | | | | | 716,713 | |
| | | | | | |
Peru 2.2% | | | | | | | | | | | | | | | | | | | | | | | | |
| | | | | | |
Peruvian Government International Bond, | | | | | | | | | | | | | | | | | | | | | | | | |
Sr. Unsec’d. Notes | | | 2.780 | | | | | | | | 12/01/60 | | | | | | | | 490 | | | | 257,801 | |
Sr. Unsec’d. Notes | | | 2.783 | | | | | | | | 01/23/31 | | | | | | | | 940 | | | | 740,720 | |
Sr. Unsec’d. Notes | | | 3.000 | | | | | | | | 01/15/34 | | | | | | | | 765 | | | | 569,543 | |
Sr. Unsec’d. Notes | | | 3.230 | | | | | | | | 07/28/2121 | | | | | | | | 110 | | | | 57,874 | |
Sr. Unsec’d. Notes | | | 3.600 | | | | | | | | 01/15/72 | | | | | | | | 70 | | | | 41,055 | |
See Notes to Financial Statements.
32
| | | | | | | | | | | | | | | | | | | | | | | | |
| | | | | | |
| Description | | Interest Rate | | | | | Maturity Date | | | | | | Principal Amount (000)# | | | Value | |
| | | | | | |
SOVEREIGN BONDS (Continued) | | | | | | | | | | | | | | | | | | | | | | | | |
| | | | | | |
Peru (cont’d.) | | | | | | | | | | | | | | | | | | | | | | | | |
| | | | | | |
Peruvian Government International Bond, (cont’d.) | | | | | | | | | | | | | | | | | | | | | | | | |
Sr. Unsec’d. Notes | | | 4.125 | % | | | | | | | 08/25/27 | | | | | | | | 160 | | | $ | 150,080 | |
Sr. Unsec’d. Notes | | | 5.625 | | | | | | | | 11/18/50 | | | | | | | | 232 | | | | 211,816 | |
Sr. Unsec’d. Notes | | | 6.550 | | | | | | | | 03/14/37 | | | | | | | | 225 | | | | 224,198 | |
Sr. Unsec’d. Notes | | | 8.750 | | | | | | | | 11/21/33 | | | | | | | | 670 | | | | 789,679 | |
| | | | | | | | | | | | | | | | | | | | | | | | |
| | | | | | |
| | | | | | | | | | | | | | | | | | | | | | | 3,042,766 | |
| | | | | | |
Philippines 2.0% | | | | | | | | | | | | | | | | | | | | | | | | |
| | | | | | |
Philippine Government International Bond, | | | | | | | | | | | | | | | | | | | | | | | | |
Sr. Unsec’d. Notes | | | 0.700 | | | | | | | | 02/03/29 | | | | EUR | | | | 300 | | | | 231,862 | |
Sr. Unsec’d. Notes | | | 1.750 | | | | | | | | 04/28/41 | | | | EUR | | | | 165 | | | | 94,097 | |
Sr. Unsec’d. Notes | | | 2.650 | | | | | | | | 12/10/45 | | | | | | | | 200 | | | | 120,772 | |
Sr. Unsec’d. Notes | | | 2.950 | | | | | | | | 05/05/45 | | | | | | | | 200 | | | | 128,522 | |
Sr. Unsec’d. Notes | | | 3.556 | | | | | | | | 09/29/32 | | | | | | | | 530 | | | | 453,208 | |
Sr. Unsec’d. Notes | | | 3.700 | | | | | | | | 03/01/41 | | | | | | | | 880 | | | | 655,697 | |
Sr. Unsec’d. Notes | | | 3.950 | | | | | | | | 01/20/40 | | | | | | | | 450 | | | | 344,299 | |
Sr. Unsec’d. Notes | | | 5.609 | | | | | | | | 04/13/33 | | | | | | | | 200 | | | | 199,522 | |
Sr. Unsec’d. Notes | | | 6.375 | | | | | | | | 10/23/34 | | | | | | | | 100 | | | | 102,511 | |
Sr. Unsec’d. Notes | | | 7.750 | | | | | | | | 01/14/31 | | | | | | | | 420 | | | | 472,546 | |
| | | | | | | | | | | | | | | | | | | | | | | | |
| | | | | | |
| | | | | | | | | | | | | | | | | | | | | | | 2,803,036 | |
| | | | | | |
Qatar 3.1% | | | | | | | | | | | | | | | | | | | | | | | | |
| | | | | | |
Qatar Government International Bond, | | | | | | | | | | | | | | | | | | | | | | | | |
Sr. Unsec’d. Notes | | | 4.000 | | | | | | | | 03/14/29 | | | | | | | | 1,350 | | | | 1,282,257 | |
Sr. Unsec’d. Notes | | | 4.625 | | | | | | | | 06/02/46 | | | | | | | | 600 | | | | 528,372 | |
Sr. Unsec’d. Notes | | | 4.817 | | | | | | | | 03/14/49 | | | | | | | | 200 | | | | 178,042 | |
Sr. Unsec’d. Notes | | | 5.103 | | | | | | | | 04/23/48 | | | | | | | | 1,440 | | | | 1,337,170 | |
Sr. Unsec’d. Notes | | | 6.400 | | | | | | | | 01/20/40 | | | | | | | | 100 | | | | 108,888 | |
Sr. Unsec’d. Notes, 144A | | | 4.817 | | | | | | | | 03/14/49 | | | | | | | | 810 | | | | 721,070 | |
Sr. Unsec’d. Notes, 144A | | | 5.103 | | | | | | | | 04/23/48 | | | | | | | | 200 | | | | 185,718 | |
| | | | | | | | | | | | | | | | | | | | | | | | |
| | | | | | |
| | | | | | | | | | | | | | | | | | | | | | | 4,341,517 | |
| | | | | | |
Romania 1.1% | | | | | | | | | | | | | | | | | | | | | | | | |
| | | | | | |
Romanian Government International Bond, | | | | | | | | | | | | | | | | | | | | | | | | |
Sr. Unsec’d. Notes, EMTN | | | 3.875 | | | | | | | | 10/29/35 | | | | EUR | | | | 440 | | | | 297,260 | |
Sr. Unsec’d. Notes, EMTN | | | 4.125 | | | | | | | | 03/11/39 | | | | EUR | | | | 410 | | | | 266,737 | |
Sr. Unsec’d. Notes, EMTN | | | 4.625 | | | | | | | | 04/03/49 | | | | EUR | | | | 230 | | | | 148,070 | |
Unsec’d. Notes, 144A, MTN | | | 6.000 | | | | | | | | 05/25/34 | | | | | | | | 902 | | | | 758,413 | |
| | | | | | | | | | | | | | | | | | | | | | | | |
| | | | | | |
| | | | | | | | | | | | | | | | | | | | | | | 1,470,480 | |
See Notes to Financial Statements.
PGIM Emerging Markets Debt Hard Currency Fund 33
Schedule of Investments (continued)
as of October 31, 2022
| | | | | | | | | | | | | | | | | | | | | | | | |
| | | | | | |
| Description | | Interest Rate | | | | | Maturity Date | | | | | | Principal Amount (000)# | | | Value | |
| | | | | | |
SOVEREIGN BONDS (Continued) | | | | | | | | | | | | | | | | | | | | | | | | |
| | | | | | |
Russia 0.2% | | | | | | | | | | | | | | | | | | | | | | | | |
| | | | | | |
Russian Foreign Bond - Eurobond, | | | | | | | | | | | | | | | | | | | | | | | | |
Sr. Unsec’d. Notes | | | 1.850 | % | | | | | | | 11/20/32 | | | | EUR | | | | 300 | | | $ | 112,661 | |
Sr. Unsec’d. Notes | | | 5.100 | | | | | | | | 03/28/35 | | | | | | | | 400 | | | | 168,000 | |
| | | | | | | | | | | | | | | | | | | | | | | | |
| | | | | | |
| | | | | | | | | | | | | | | | | | | | | | | 280,661 | |
| | | | | | |
Saudi Arabia 2.6% | | | | | | | | | | | | | | | | | | | | | | | | |
| | | | | | |
Saudi Government International Bond, | | | | | | | | | | | | | | | | | | | | | | | | |
Sr. Unsec’d. Notes, 144A | | | 5.250 | | | | | | | | 01/16/50 | | | | | | | | 400 | | | | 353,796 | |
Sr. Unsec’d. Notes, EMTN | | | 2.250 | | | | | | | | 02/02/33 | | | | | | | | 200 | | | | 153,580 | |
Sr. Unsec’d. Notes, EMTN | | | 4.500 | | | | | | | | 10/26/46 | | | | | | | | 2,050 | | | | 1,628,089 | |
Sr. Unsec’d. Notes, EMTN | | | 4.625 | | | | | | | | 10/04/47 | | | | | | | | 1,270 | | | | 1,019,645 | |
Sr. Unsec’d. Notes, EMTN | | | 5.000 | | | | | | | | 04/17/49 | | | | | | | | 600 | | | | 508,613 | |
| | | | | | | | | | | | | | | | | | | | | | | | |
| | | | | | |
| | | | | | | | | | | | | | | | | | | | | | | 3,663,723 | |
| | | | | | |
Senegal 0.4% | | | | | | | | | | | | | | | | | | | | | | | | |
| | | | | | |
Senegal Government International Bond, | | | | | | | | | | | | | | | | | | | | | | | | |
Sr. Unsec’d. Notes | | | 4.750 | | | | | | | | 03/13/28 | | | | EUR | | | | 500 | | | | 402,712 | |
Sr. Unsec’d. Notes | | | 5.375 | | | | | | | | 06/08/37 | | | | EUR | | | | 200 | | | | 119,578 | |
Sr. Unsec’d. Notes, 144A | | | 5.375 | | | | | | | | 06/08/37 | | | | EUR | | | | 150 | | | | 89,684 | |
| | | | | | | | | | | | | | | | | | | | | | | | |
| | | | | | |
| | | | | | | | | | | | | | | | | | | | | | | 611,974 | |
| | | | | | |
Serbia 1.1% | | | | | | | | | | | | | | | | | | | | | | | | |
| | | | | | |
Serbia International Bond, | | | | | | | | | | | | | | | | | | | | | | | | |
Sr. Unsec’d. Notes | | | 1.500 | | | | | | | | 06/26/29 | | | | EUR | | | | 800 | | | | 553,568 | |
Sr. Unsec’d. Notes, 144A | | | 1.650 | | | | | | | | 03/03/33 | | | | EUR | | | | 225 | | | | 130,676 | |
Sr. Unsec’d. Notes, 144A | | | 2.125 | | | | | | | | 12/01/30 | | | | | | | | 230 | | | | 158,312 | |
Sr. Unsec’d. Notes, 144A | | | 3.125 | | | | | | | | 05/15/27 | | | | EUR | | | | 810 | | | | 680,560 | |
| | | | | | | | | | | | | | | | | | | | | | | | |
| | | | | | |
| | | | | | | | | | | | | | | | | | | | | | | 1,523,116 | |
| | | | | | |
South Africa 1.6% | | | | | | | | | | | | | | | | | | | | | | | | |
| | | | | | |
Republic of South Africa Government International Bond, | | | | | | | | | | | | | | | | | | | | | | | | |
Sr. Unsec’d. Notes | | | 4.300 | | | | | | | | 10/12/28 | | | | | | | | 200 | | | | 170,350 | |
Sr. Unsec’d. Notes | | | 4.850 | | | | | | | | 09/27/27 | | | | | | | | 260 | | | | 235,268 | |
Sr. Unsec’d. Notes | | | 4.850 | | | | | | | | 09/30/29 | | | | | | | | 600 | | | | 508,237 | |
Sr. Unsec’d. Notes | | | 5.650 | | | | | | | | 09/27/47 | | | | | | | | 540 | | | | 358,425 | |
Sr. Unsec’d. Notes | | | 5.750 | | | | | | | | 09/30/49 | | | | | | | | 400 | | | | 265,000 | |
See Notes to Financial Statements.
34
| | | | | | | | | | | | | | | | | | | | | | | | |
| | | | | | |
| Description | | Interest Rate | | | | | Maturity Date | | | | | | Principal Amount (000)# | | | Value | |
| | | | | | |
SOVEREIGN BONDS (Continued) | | | | | | | | | | | | | | | | | | | | | | | | |
| | | | | | |
South Africa (cont’d.) | | | | | | | | | | | | | | | | | | | | | | | | |
| | | | |
Republic of South Africa Government International Bond, (cont’d.) | | | | | | | | | | | | | | | | | |
Sr. Unsec’d. Notes | | | 5.875 | % | | | | | | | 04/20/32 | | | | | | | | 600 | | | $ | 512,250 | |
Sr. Unsec’d. Notes | | | 7.300 | | | | | | | | 04/20/52 | | | | | | | | 250 | | | | 194,375 | |
| | | | | | | | | | | | | | | | | | | | | | | | |
| | | | | | |
| | | | | | | | | | | | | | | | | | | | | | | 2,243,905 | |
| | | | | | |
Sri Lanka 0.3% | | | | | | | | | | | | | | | | | | | | | | | | |
| | | | | | |
Sri Lanka Government International Bond, | | | | | | | | | | | | | | | | | | | | | | | | |
Sr. Unsec’d. Notes | | | 5.750 | | | | | | | | 04/18/23(d) | | | | | | | | 200 | | | | 44,538 | |
Sr. Unsec’d. Notes | | | 6.200 | | | | | | | | 05/11/27(d) | | | | | | | | 400 | | | | 85,044 | |
Sr. Unsec’d. Notes | | | 6.350 | | | | | | | | 06/28/24(d) | | | | | | | | 200 | | | | 44,913 | |
Sr. Unsec’d. Notes | | | 6.850 | | | | | | | | 11/03/25(d) | | | | | | | | 350 | | | | 78,050 | |
Sr. Unsec’d. Notes | | | 7.850 | | | | | | | | 03/14/29(d) | | | | | | | | 250 | | | | 54,187 | |
Sr. Unsec’d. Notes, 144A | | | 6.750 | | | | | | | | 04/18/28(d) | | | | | | | | 200 | | | | 43,975 | |
Sr. Unsec’d. Notes, 144A | | | 6.850 | | | | | | | | 03/14/24(d) | | | | | | | | 265 | | | | 59,509 | |
| | | | | | | | | | | | | | | | | | | | | | | | |
| | | | | | |
| | | | | | | | | | | | | | | | | | | | | | | 410,216 | |
| | | | | | |
Turkey 3.2% | | | | | | | | | | | | | | | | | | | | | | | | |
| | | | | | |
Turkey Government International Bond, | | | | | | | | | | | | | | | | | | | | | | | | |
Sr. Unsec’d. Notes | | | 4.250 | | | | | | | | 03/13/25 | | | | | | | | 200 | | | | 180,750 | |
Sr. Unsec’d. Notes | | | 4.250 | | | | | | | | 04/14/26 | | | | | | | | 400 | | | | 339,500 | |
Sr. Unsec’d. Notes | | | 4.750 | | | | | | | | 01/26/26 | | | | | | | | 495 | | | | 433,125 | |
Sr. Unsec’d. Notes | | | 4.875 | | | | | | | | 10/09/26 | | | | | | | | 580 | | | | 492,275 | |
Sr. Unsec’d. Notes | | | 5.250 | | | | | | | | 03/13/30 | | | | | | | | 610 | | | | 453,687 | |
Sr. Unsec’d. Notes | | | 5.750 | | | | | | | | 03/22/24 | | | | | | | | 200 | | | | 196,250 | |
Sr. Unsec’d. Notes | | | 5.950 | | | | | | | | 01/15/31 | | | | | | | | 200 | | | | 152,750 | |
Sr. Unsec’d. Notes | | | 6.000 | | | | | | | | 03/25/27 | | | | | | | | 380 | | | | 330,125 | |
Sr. Unsec’d. Notes | | | 6.000 | | | | | | | | 01/14/41 | | | | | | | | 200 | | | | 128,500 | |
Sr. Unsec’d. Notes | | | 6.125 | | | | | | | | 10/24/28 | | | | | | | | 420 | | | | 349,125 | |
Sr. Unsec’d. Notes | | | 6.350 | | | | | | | | 08/10/24 | | | | | | | | 400 | | | | 390,325 | |
Sr. Unsec’d. Notes | | | 6.375 | | | | | | | | 10/14/25 | | | | | | | | 200 | | | | 185,250 | |
Sr. Unsec’d. Notes | | | 6.500 | | | | | | | | 09/20/33 | | | | | | | | 200 | | | | 150,000 | |
Sr. Unsec’d. Notes | | | 6.875 | | | | | | | | 03/17/36 | | | | | | | | 104 | | | | 78,000 | |
Sr. Unsec’d. Notes | | | 7.375 | | | | | | | | 02/05/25 | | | | | | | | 165 | | | | 161,494 | |
Sr. Unsec’d. Notes | | | 7.625 | | | | | | | | 04/26/29 | | | | | | | | 280 | | | | 246,750 | |
Turkiye Ihracat Kredi Bankasi A/S, | | | | | | | | | | | | | | | | | | | | | | | | |
Sr. Unsec’d. Notes | | | 8.250 | | | | | | | | 01/24/24 | | | | | | | | 200 | | | | 195,500 | |
| | | | | | | | | | | | | | | | | | | | | | | | |
| | | | | | |
| | | | | | | | | | | | | | | | | | | | | | | 4,463,406 | |
See Notes to Financial Statements.
PGIM Emerging Markets Debt Hard Currency Fund 35
Schedule of Investments (continued)
as of October 31, 2022
| | | | | | | | | | | | | | | | | | | | | | | | |
| | | | | | |
| Description | | Interest Rate | | | | | Maturity Date | | | | | | Principal Amount (000)# | | | Value | |
| | | | | | |
SOVEREIGN BONDS (Continued) | | | | | | | | | | | | | | | | | | | | | | | | |
| | | | | | |
Ukraine 0.7% | | | | | | | | | | | | | | | | | | | | | | | | |
| | | | | | |
Ukraine Government International Bond, | | | | | | | | | | | | | | | | | | | | | | | | |
Sr. Unsec’d. Notes | | | 4.375 | % | | | | | | | 01/27/32(d) | | | | EUR | | | | 410 | | | $ | 60,777 | |
Sr. Unsec’d. Notes | | | 6.750 | | | | | | | | 06/20/28(d) | | | | EUR | | | | 580 | | | | 93,967 | |
Sr. Unsec’d. Notes | | | 7.375 | | | | | | | | 09/25/34(d) | | | | | | | | 200 | | | | 29,975 | |
Sr. Unsec’d. Notes | | | 7.750 | | | | | | | | 09/01/25(d) | | | | | | | | 300 | | | | 62,869 | |
Sr. Unsec’d. Notes | | | 7.750 | | | | | | | | 09/01/26(d) | | | | | | | | 1,180 | | | | 194,552 | |
Sr. Unsec’d. Notes | | | 7.750 | | | | | | | | 09/01/27(d) | | | | | | | | 640 | | | | 106,320 | |
Sr. Unsec’d. Notes | | | 7.750 | | | | | | | | 09/01/28(d) | | | | | | | | 600 | | | | 106,500 | |
Sr. Unsec’d. Notes | | | 7.750 | | | | | | | | 09/01/29(d) | | | | | | | | 520 | | | | 90,935 | |
Sr. Unsec’d. Notes | | | 8.994 | | | | | | | | 02/01/26(d) | | | | | | | | 200 | | | | 36,725 | |
Sr. Unsec’d. Notes | | | 9.750 | | | | | | | | 11/01/30(d) | | | | | | | | 965 | | | | 176,897 | |
Sr. Unsec’d. Notes, 144A | | | 4.375 | | | | | | | | 01/27/32(d) | | | | EUR | | | | 100 | | | | 14,824 | |
Ukreximbank Via Biz Finance PLC, | | | | | | | | | | | | | | | | | | | | | | | | |
Sr. Unsec’d. Notes | | | 9.750 | | | | | | | | 01/22/25 | | | | | | | | 63 | | | | 18,605 | |
| | | | | | | | | | | | | | | | | | | | | | | | |
| | | | | | |
| | | | | | | | | | | | | | | | | | | | | | | 992,946 | |
| | | | | | |
United Arab Emirates 1.4% | | | | | | | | | | | | | | | | | | | | | | | | |
| | | | | | |
Abu Dhabi Government International Bond, | | | | | | | | | | | | | | | | | | | | | | | | |
Sr. Unsec’d. Notes | | | 3.125 | | | | | | | | 09/30/49 | | | | | | | | 600 | | | | 401,175 | |
Sr. Unsec’d. Notes, 144A | | | 3.125 | | | | | | | | 09/30/49 | | | | | | | | 500 | | | | 334,312 | |
Sr. Unsec’d. Notes, 144A, MTN | | | 3.875 | | | | | | | | 04/16/50 | | | | | | | | 200 | | | | 154,225 | |
Emirate of Dubai Government International Bonds, | | | | | | | | | | | | | | | | | | | | | | | | |
Sr. Unsec’d. Notes, EMTN | | | 5.250 | | | | | | | | 01/30/43 | | | | | | | | 1,000 | | | | 832,687 | |
Finance Department Government of Sharjah, | | | | | | | | | | | | | | | | | | | | | | | | |
Sr. Unsec’d. Notes, 144A, MTN | | | 4.000 | | | | | | | | 07/28/50 | | | | | | | | 200 | | | | 114,913 | |
Sr. Unsec’d. Notes, MTN | | | 4.000 | | | | | | | | 07/28/50 | | | | | | | | 200 | | | | 114,913 | |
| | | | | | | | | | | | | | | | | | | | | | | | |
| | | | | | |
| | | | | | | | | | | | | | | | | | | | | | | 1,952,225 | |
| | | | | | |
Uruguay 1.7% | | | | | | | | | | | | | | | | | | | | | | | | |
| | | | | | |
Uruguay Government International Bond, | | | | | | | | | | | | | | | | | | | | | | | | |
Sr. Unsec’d. Notes | | | 4.125 | | | | | | | | 11/20/45 | | | | | | | | 120 | | | | 100,973 | |
Sr. Unsec’d. Notes | | | 4.975 | | | | | | | | 04/20/55 | | | | | | | | 580 | | | | 504,165 | |
Sr. Unsec’d. Notes | | | 5.100 | | | | | | | | 06/18/50 | | | | | | | | 520 | | | | 465,335 | |
Sr. Unsec’d. Notes | | | 5.750 | | | | | | | | 10/28/34 | | | | | | | | 150 | | | | 152,250 | |
Sr. Unsec’d. Notes | | | 7.625 | | | | | | | | 03/21/36 | | | | | | | | 510 | | | | 600,461 | |
Sr. Unsec’d. Notes | | | 7.875 | | | | | | | | 01/15/33 | | | | | | | | 435 | | | | 512,212 | |
| | | | | | | | | | | | | | | | | | | | | | | | |
| | | | | | |
| | | | | | | | | | | | | | | | | | | | | | | 2,335,396 | |
See Notes to Financial Statements.
36
| | | | | | | | | | | | | | | | | | | | | | | | |
| | | | | | |
| Description | | Interest Rate | | | | | Maturity Date | | | | | | Principal Amount (000)# | | | Value | |
| | | | | | |
SOVEREIGN BONDS (Continued) | | | | | | | | | | | | | | | | | | | | | | | | |
| | | | | | |
Venezuela 0.0% | | | | | | | | | | | | | | | | | | | | | | | | |
| | | | | | |
Venezuela Government International Bond, | | | | | | | | | | | | | | | | | | | | | | | | |
Sr. Unsec’d. Notes | | | 12.750 | % | | | | | | | 08/23/22(d) | | | | | | | | 180 | | | $ | 13,050 | |
| | | | | | |
Zambia 0.4% | | | | | | | | | | | | | | | | | | | | | | | | |
| | | | | | |
Zambia Government International Bond, | | | | | | | | | | | | | | | | | | | | | | | | |
Sr. Unsec’d. Notes | | | 8.500 | | | | | | | | 04/14/24(d) | | | | | | | | 600 | | | | 231,000 | |
Sr. Unsec’d. Notes | | | 8.970 | | | | | | | | 07/30/27(d) | | | | | | | | 600 | | | | 222,000 | |
Unsec’d. Notes | | | 5.375 | | | | | | | | 09/20/22(d) | | | | | | | | 400 | | | | 133,325 | |
| | | | | | | | | | | | | | | | | | | | | | | | |
| | | | | | |
| | | | | | | | | | | | | | | | | | | | | | | 586,325 | |
| | | | | | | | | | | | | | | | | | | | | | | | |
| | | | | | |
TOTAL SOVEREIGN BONDS | | | | | | | | | | | | | | | | | | | | | | | | |
(cost $131,352,936) | | | | | | | | | | | | | | | | | | | | | | | 95,320,137 | |
| | | | | | | | | | | | | | | | | | | | | | | | |
| | | | | | |
U.S. TREASURY OBLIGATION 0.2% | | | | | | | | | | | | | | | | | | | | | | | | |
U.S. Treasury Notes | | | | | | | | | | | | | | | | | | | | | | | | |
(cost $265,390) | | | 4.250 | | | | | | | | 09/30/24 | | | | | | | | 265 | | | | 263,664 | |
| | | | | | | | | | | | | | | | | | | | | | | | |
| | | | | | |
TOTAL LONG-TERM INVESTMENTS | | | | | | | | | | | | | | | | | | | | | | | | |
(cost $177,967,895) | | | | | | | | | | | | | | | | | | | | | | | 131,497,866 | |
| | | | | | | | | | | | | | | | | | | | | | | | |
| | | | | | |
| | | | | | | | | | | | | | Shares | | | | |
| | | | | | |
SHORT-TERM INVESTMENTS 4.1% | | | | | | | | | | | | | | | | | | | | | | | | |
| | | | | | |
AFFILIATED MUTUAL FUND 1.2% | | | | | | | | | | | | | | | | | | | | | | | | |
PGIM Institutional Money Market Fund
(cost $1,747,755; includes $1,743,546 of cash collateral for securities on loan)(b)(wa) | | | | | | | | 1,749,206 | | | | 1,747,632 | |
| | | | | | | | | | | | | | | | | | | | | | | | |
| |
UNAFFILIATED FUND 2.8% | | | | | |
Dreyfus Government Cash Management (Institutional Shares) | | | | | |
(cost $3,860,539) | | | | | | | | | | | | | | | | | | | 3,860,539 | | | | 3,860,539 | |
| | | | | | | | | | | | | | | | | | | | | | | | |
| | | | | | |
OPTIONS PURCHASED*~ 0.1% | | | | | | | | | | | | | | | | | | | | | | | | |
(cost $75,058) | | | | | | | | | | | | | | | | | | | | | | | 156,980 | |
| | | | | | | | | | | | | | | | | | | | | | | | |
| | | | | | |
TOTAL SHORT-TERM INVESTMENTS
| | | | | | | | | | | | | | | | | | | | | | | | |
(cost $5,683,352) | | | | 5,765,151 | |
| | | | | | | | | | | | | | | | | | | | | | | | |
See Notes to Financial Statements.
PGIM Emerging Markets Debt Hard Currency Fund 37
Schedule of Investments (continued)
as of October 31, 2022
| | | | |
| |
| Description | | Value | |
| |
TOTAL INVESTMENTS, BEFORE OPTIONS WRITTEN 98.0% | | | | |
(cost $183,651,247) | | $ | 137,263,017 | |
| | | | |
| |
OPTIONS WRITTEN*~ (0.2)% | | | | |
(premiums received $290,833) | | | (343,587 | ) |
| | | | |
| |
TOTAL INVESTMENTS, NET OF OPTIONS WRITTEN 97.8%
(cost $183,360,414) | | | 136,919,430 | |
Other assets in excess of liabilities(z) 2.2% | | | 3,055,156 | |
| | | | |
| |
NET ASSETS 100.0% | | $ | 139,974,586 | |
| | | | |
Below is a list of the abbreviation(s) used in the annual report:
AUD—Australian Dollar
BRL—Brazilian Real
CLP—Chilean Peso
CNH—Chinese Renminbi
COP—Colombian Peso
CZK—Czech Koruna
EUR—Euro
GBP—British Pound
HUF—Hungarian Forint
IDR—Indonesian Rupiah
ILS—Israeli Shekel
INR—Indian Rupee
KRW—South Korean Won
MXN—Mexican Peso
PEN—Peruvian Nuevo Sol
PHP—Philippine Peso
PLN—Polish Zloty
SGD—Singapore Dollar
THB—Thai Baht
TRY—Turkish Lira
TWD—New Taiwanese Dollar
USD—US Dollar
ZAR—South African Rand
144A—Security was purchased pursuant to Rule 144A under the Securities Act of 1933 and, pursuant to the requirements of Rule 144A, may not be resold except to qualified institutional buyers.
A—Annual payment frequency for swaps
BARC—Barclays Bank PLC
BNP—BNP Paribas S.A.
BOA—Bank of America, N.A.
BROIS—Brazil Overnight Index Swap
CDX—Credit Derivative Index
CITI—Citibank, N.A.
CLOIS—Sinacofi Chile Interbank Rate Average
COOIS—Colombia Overnight Interbank Reference Rate
DB—Deutsche Bank AG
EMTN—Euro Medium Term Note
GMTN—Global Medium Term Note
See Notes to Financial Statements.
38
GSI—Goldman Sachs International
HSBC—HSBC Bank PLC
JIBAR—Johannesburg Interbank Agreed Rate
JPM—JPMorgan Chase Bank N.A.
JPS—J.P. Morgan Securities LLC
KLIBOR—Kuala Lumpur Interbank Offered Rate
KWCDC—Korean Won Certificate of Deposit
LIBOR—London Interbank Offered Rate
M—Monthly payment frequency for swaps
MSI—Morgan Stanley & Co International PLC
MTN—Medium Term Note
OTC—Over-the-counter
PIK—Payment-in-Kind
PJSC—Public Joint-Stock Company
PRIBOR—Prague Interbank Offered Rate
Q—Quarterly payment frequency for swaps
S—Semiannual payment frequency for swaps
SCB—Standard Chartered Bank
SOFR—Secured Overnight Financing Rate
T—Swap payment upon termination
TD—The Toronto-Dominion Bank
THOR—Thai Overnight Repurchase Rate
UAG—UBS AG
WIBOR—Warsaw Interbank Offered Rate
| * | Non-income producing security. |
| # | Principal or notional amount is shown in U.S. dollars unless otherwise stated. |
| ~ | See tables subsequent to the Schedule of Investments for options detail. |
| (a) | All or a portion of security is on loan. The aggregate market value of such securities, including those sold and pending settlement, is $1,588,847; cash collateral of $1,743,546 (included in liabilities) was received with which the Fund purchased highly liquid short-term investments. In the event of significant appreciation in value of securities on loan on the last business day of the reporting period, the Fund may reflect a collateral value that is less than the market value of the loaned securities and such shortfall is remedied the following business day. |
| (b) | Represents security, or portion thereof, purchased with cash collateral received for securities on loan and includes dividend reinvestment. |
| (cc) | Variable rate instrument. The rate shown is based on the latest available information as of October 31, 2022. Certain variable rate securities are not based on a published reference rate and spread but are determined by the issuer or agent and are based on current market conditions. These securities do not indicate a reference rate and spread in their description. |
| (d) | Represents issuer in default on interest payments and/or principal repayment. Non-income producing security. Such securities may be post-maturity. |
| (s) | Represents zero coupon bond or principal only security. Rate represents yield to maturity at purchase date. |
| (wa) | PGIM Investments LLC, the manager of the Fund, also serves as manager of the PGIM Core Ultra Short Bond Fund and PGIM Institutional Money Market Fund, if applicable. |
| (z) | Includes net unrealized appreciation/(depreciation) and/or market value of the below holdings which are excluded from the Schedule of Investments: |
See Notes to Financial Statements.
PGIM Emerging Markets Debt Hard Currency Fund 39
Schedule of Investments (continued)
as of October 31, 2022
Options Purchased:
OTC Traded
| | | | | | | | | | | | | | | | | | | | | | | | | | |
Description | | Call/
Put | | | Counterparty | | | Expiration
Date | | | Strike | | | Contracts | | Notional
Amount
(000)# | | Value | |
| | | | | | | |
Currency Option USD vs CNH | | | Call | | | | CITI | | | | 11/11/22 | | | | 7.15 | | | — | | | 3,276 | | | $ | 84,665 | |
Currency Option USD vs CNH | | | Call | | | | MSI | | | | 11/11/22 | | | | 7.80 | | | — | | | 3,276 | | | | 411 | |
Currency Option USD vs INR | | | Call | | | | JPM | | | | 01/05/23 | | | | 81.50 | | | — | | | 2,061 | | | | 54,212 | |
Currency Option USD vs CNH | | | Put | | | | CITI | | | | 11/11/22 | | | | 6.50 | | | — | | | 1,638 | | | | — | |
Currency Option USD vs CNH | | | Put | | | | MSI | | | | 11/11/22 | | | | 6.90 | | | — | | | 1,638 | | | | 62 | |
Currency Option USD vs CNH | | | Put | | | | CITI | | | | 11/28/22 | | | | 6.55 | | | — | | | 1,375 | | | | 14 | |
Currency Option USD vs CNH | | | Put | | | | MSI | | | | 12/08/22 | | | | 6.00 | | | — | | | 761 | | | | 1 | |
Currency Option USD vs MXN | | | Put | | | | MSI | | | | 12/05/22 | | | | 17.00 | | | — | | | 2,080 | | | | 9 | |
| | | | | | | | | | | | | | | | | | | | | | | | | | |
| | | | | | | |
Total OTC Traded (cost $33,988) | | | | | | | | | | | | | | | | | | | | | | | | $ | 139,374 | |
| | | | | | | | | | | | | | | | | | | | | | | | | | |
OTC Swaptions
| | | | | | | | | | | | | | | | | | | | | | | | |
Description | | Call/
Put | | Counterparty | | Expiration
Date | | Strike | | | Receive | | | Pay | | | Notional Amount (000)# | | Value | |
| | | | | | | | |
CDX.EM.38.V1, 12/20/27 | | Call | | MSI | | 12/21/22 | | | 0.96% | | | | 1.00%(Q) | | | | CDX.EM.38.V1(Q) | | | 3,700 | | $ | 1,495 | |
CDX.EM.38.V1, 12/20/27 | | Put | | MSI | | 12/21/22 | | | 0.90% | | | | CDX.EM.38.V1(Q) | | | | 1.00%(Q) | | | 3,700 | | | 16,111 | |
| | | | | | | | | | | | | | | | | | | | | | | | |
| | | | | | |
Total OTC Swaptions (cost $41,070) | | | | | | | | | | | | | | | | | | $ | 17,606 | |
| | | | | | | | | | | | | | | | | | | | | | | | |
| | | | | | |
Total Options Purchased (cost $75,058) | | | | | | | | | | | | | | | | | | $ | 156,980 | |
| | | | | | | | | | | | | | | | | | | | | | | | |
Options Written:
OTC Traded
| | | | | | | | | | | | | | | | | | | | | | |
Description | | Call/
Put | | Counterparty | | Expiration
Date | | Strike | | | Contracts | | | Notional
Amount
(000)# | | Value | |
| | | | | | | |
Currency Option USD vs CNH | | Call | | MSI | | 11/11/22 | | | 7.15 | | | | — | | | | 3,276 | | | $ | (84,665 | ) |
Currency Option USD vs CNH | | Call | | MSI | | 11/11/22 | | | 7.35 | | | | — | | | | 3,276 | | | | (23,015 | ) |
Currency Option USD vs INR | | Call | | JPM | | 01/05/23 | | | 83.50 | | | | — | | | | 2,061 | | | | (23,917 | ) |
Currency Option USD vs CNH | | Put | | CITI | | 11/11/22 | | | 6.90 | | | | — | | | | 1,638 | | | | (62 | ) |
Currency Option USD vs CNH | | Put | | CITI | | 11/28/22 | | | 7.05 | | | | — | | | | 1,375 | | | | (1,697 | ) |
Currency Option USD vs MXN | | Put | | MSI | | 12/05/22 | | | 21.75 | | | | — | | | | 2,080 | | | | (191,970 | ) |
| | | | | | | | | | | | | | | | | | | | | | |
| | | | | | | |
Total OTC Traded (premiums received $263,084) | | | | | | | | | | | | | | | | | | | | $ | (325,326 | ) |
| | | | | | | | | | | | | | | | | | | | | | |
OTC Swaptions
| | | | | | | | | | | | | | | | | | | | |
Description | | Call/ Put | | Counterparty | | Expiration
Date | | Strike | | Receive | | Pay | | Notional
Amount
(000)# | | Value | |
| | | | | | | | |
CDX.EM.38.V1, 12/20/27 | | Call | | MSI | | 12/21/22 | | 0.93% | | CDX.EM.38.V1(Q) | | 1.00%(Q) | | | 3,700 | | | $ | (11,771 | ) |
See Notes to Financial Statements.
40
Options Written (continued):
OTC Swaptions
| | | | | | | | | | | | | | | | | | | | | | | | | | |
Description | | Call/
Put | | Counterparty | | Expiration
Date | | Strike | | | Receive | | | Pay | | | Notional
Amount
(000)# | | Value | |
| | | | | | | | |
CDX.EM.38.V1, 12/20/27 | | Put | | MSI | | 12/21/22 | | | 0.87% | | | | 1.00%(Q) | | | | CDX.EM.38.V1(Q) | | | | 3,700 | | | $ | (6,490 | ) |
| | | | | | | | | | | | | | | | | | | | | | | | | | |
| | | | | |
Total OTC Swaptions (premiums received $27,749) | | | | | | | | | | | | | | | | | | $ | (18,261 | ) |
| | | | | | | | | | | | | | | | | | | | | | | | | | |
| | | | | |
Total Options Written (premiums received $290,833) | | | | | | | | | | | | | | | | | | $ | (343,587 | ) |
| | | | | | | | | | | | | | | | | | | | | | | | | | |
Futures contracts outstanding at October 31, 2022:
| | | | | | | | | | | | | | | | | | | | | | | | | | |
Number of Contracts | | | | Type | | | | Expiration
Date | | | Current
Notional
Amount | | | Value / Unrealized Appreciation (Depreciation) | |
| | | | | | |
Long Positions: | | | | | | | | | | | | | | | | | | | | | | |
42 | | | | 2 Year U.S. Treasury Notes | | | | | Dec. 2022 | | | $ | 8,584,078 | | | | | | | $ | (82,738 | ) | | | | |
40 | | | | 5 Year U.S. Treasury Notes | | | | | Dec. 2022 | | | | 4,263,750 | | | | | | | | (63,941 | ) | | | | |
10 | | | | 10 Year U.S. Ultra Treasury Notes | | | | | Dec. 2022 | | | | 1,159,844 | | | | | | | | (12,201 | ) | | | | |
29 | | | | 30 Year U.S. Ultra Treasury Bonds | | | | | Dec. 2022 | | | | 3,702,031 | | | | | | | | (524,617 | ) | | | | |
| | | | | | | | | | | | | | | | | | | | | | | | | | |
| | | | | | | | |
| | | | | | | | | | | | | | | | | | | | | (683,497 | ) | | | | |
| | | | | | | | | | | | | | | | | | | | | | | | | | |
| | | | | | |
Short Positions: | | | | | | | | | | | | | | | | | | | | | | |
21 | | | | 5 Year Euro-Bobl | | | | | Dec. 2022 | | | | 2,483,541 | | | | | | | | 65,168 | | | | | |
32 | | | | 10 Year Euro-Bund | | | | | Dec. 2022 | | | | 4,378,027 | | | | | | | | 222,445 | | | | | |
12 | | | | 10 Year U.S. Treasury Notes | | | | | Dec. 2022 | | | | 1,327,125 | | | | | | | | 6,057 | | | | | |
13 | | | | 20 Year U.S. Treasury Bonds | | | | | Dec. 2022 | | | | 1,566,500 | | | | | | | | 59,513 | | | | | |
6 | | | | Euro Schatz Index | | | | | Dec. 2022 | | | | 634,071 | | | | | | | | 6,900 | | | | | |
| | | | | | | | | | | | | | | | | | | | | | | | | | |
| | | | | | | | |
| | | | | | | | | | | | | | | | | | | | | 360,083 | | | | | |
| | | | | | | | | | | | | | | | | | | | | | | | | | |
| | | | | | | | |
| | | | | | | | | | | | | | | | | | | | $ | (323,414 | ) | | | | |
| | | | | | | | | | | | | | | | | | | | | | | | | | |
Forward foreign currency exchange contracts outstanding at October 31, 2022:
| | | | | | | | | | | | | | | | | | | | | | | | | | | | | | | | | | | | | | | | | | | | | | |
Purchase Contracts | | Counterparty | | | | | Notional
Amount
(000) | | | Value at
Settlement
Date | | | Current
Value | | | Unrealized
Appreciation | | | Unrealized
Depreciation | |
| | | | | | | | |
OTC Forward Foreign Currency Exchange Contracts: | | | | | | | | | | | | | | | | | | | | | | | | | | | | | | | | | |
Australian Dollar, | | | | | | | | | | | | | | | | | | | | | | | | | | | | | | | | | | | | | | | | | | | | | | |
Expiring 01/19/23 | | | BNP | | | | | | AUD | | | | 265 | | | $ | 170,000 | | | $ | 169,956 | | | | | | | $ | — | | | | | | | | | | | $ | (44 | ) | | | | |
Expiring 01/19/23 | | | JPM | | | | | | AUD | | | | 266 | | | | 170,000 | | | | 170,801 | | | | | | | | 801 | | | | | | | | | | | | — | | | | | |
Expiring 01/19/23 | | | MSI | | | | | | AUD | | | | 549 | | | | 346,946 | | | | 352,132 | | | | | | | | 5,186 | | | | | | | | | | | | — | | | | | |
Brazilian Real, | | | | | | | | | | | | | | | | | | | | | | | | | | | | | | | | | | | | | | | | | | | | | | |
Expiring 11/03/22 | | | CITI | | | | | | BRL | | | | 912 | | | | 172,000 | | | | 176,467 | | | | | | | | 4,467 | | | | | | | | | | | | — | | | | | |
Expiring 11/03/22 | | | GSI | | | | | | BRL | | | | 1,561 | | | | 294,000 | | | | 302,065 | | | | | | | | 8,065 | | | | | | | | | | | | — | | | | | |
Expiring 11/03/22 | | | GSI | | | | | | BRL | | | | 804 | | | | 154,157 | | | | 155,442 | | | | | | | | 1,285 | | | | | | | | | | | | — | | | | | |
See Notes to Financial Statements.
PGIM Emerging Markets Debt Hard Currency Fund 41
Schedule of Investments (continued)
as of October 31, 2022
Forward foreign currency exchange contracts outstanding at October 31, 2022 (continued):
| | | | | | | | | | | | | | | | | | | | | | | | | | | | | | | | | | | | | | | | | | |
Purchase Contracts | | Counterparty | | | | | Notional
Amount
(000) | | | Value at
Settlement
Date | | | Current
Value | | | Unrealized
Appreciation | | | Unrealized
Depreciation | |
| | | |
OTC Forward Foreign Currency Exchange Contracts (cont’d.): | | | | | | | | | | | | | |
| Brazilian Real (cont’d.), | | | | | | | | | | | | | | | | | | | | | | | | | | | | | | | | | | | | | | | | | | |
Expiring 12/02/22 | | | CITI | | | | | BRL | 2,904 | | | $ | 538,910 | | | $ | 558,084 | | | | | | | $ | 19,174 | | | | | | | | | | | $ | — | | | | | |
Chilean Peso, | | | | | | | | | | | | | | | | | | | | | | | | | | | | | | | | | | | | | | | | | | |
Expiring 12/21/22 | | | BARC | | | | | CLP | 215,646 | | | | 221,178 | | | | 226,558 | | | | | | | | 5,380 | | | | | | | | | | | | — | | | | | |
Expiring 12/21/22 | | | BARC | | | | | CLP | 158,288 | | | | 160,822 | | | | 166,298 | | | | | | | | 5,476 | | | | | | | | | | | | — | | | | | |
Chinese Renminbi, | | | | | | | | | | | | | | | | | | | | | | | | | | | | | | | | | | | | | | | | | | |
Expiring 11/23/22 | | | BOA | | | | | CNH | 6,938 | | | | 1,005,000 | | | | 947,001 | | | | | | | | — | | | | | | | | | | | | (57,999 | ) | | | | |
Expiring 11/23/22 | | | BOA | | | | | CNH | 6,592 | | | | 956,000 | | | | 899,713 | | | | | | | | — | | | | | | | | | | | | (56,287 | ) | | | | |
Expiring 11/23/22 | | | BOA | | | | | CNH | 4,877 | | | | 667,000 | | | | 665,650 | | | | | | | | — | | | | | | | | | | | | (1,350 | ) | | | | |
Expiring 11/23/22 | | | CITI | | | | | CNH | 5,163 | | | | 713,000 | | | | 704,696 | | | | | | | | — | | | | | | | | | | | | (8,304 | ) | | | | |
Expiring 11/23/22 | | | GSI | | | | | CNH | 5,425 | | | | 758,000 | | | | 740,421 | | | | | | | | — | | | | | | | | | | | | (17,579 | ) | | | | |
Expiring 11/23/22 | | | GSI | | | | | CNH | 4,719 | | | | 669,000 | | | | 644,137 | | | | | | | | — | | | | | | | | | | | | (24,863 | ) | | | | |
Expiring 11/23/22 | | | HSBC | | | | | CNH | 7,620 | | | | 1,069,000 | | | | 1,039,984 | | | | | | | | — | | | | | | | | | | | | (29,016 | ) | | | | |
Expiring 11/23/22 | | | HSBC | | | | | CNH | 5,305 | | | | 769,000 | | | | 724,091 | | | | | | | | — | | | | | | | | | | | | (44,909 | ) | | | | |
Expiring 11/23/22 | | | JPM | | | | | CNH | 6,908 | | | | 992,000 | | | | 942,865 | | | | | | | | — | | | | | | | | | | | | (49,135 | ) | | | | |
Expiring 11/23/22 | | | JPM | | | | | CNH | 6,657 | | | | 956,000 | | | | 908,628 | | | | | | | | — | | | | | | | | | | | | (47,372 | ) | | | | |
Expiring 11/23/22 | | | JPM | | | | | CNH | 6,476 | | | | 930,000 | | | | 883,914 | | | | | | | | — | | | | | | | | | | | | (46,086 | ) | | | | |
Expiring 11/23/22 | | | JPM | | | | | CNH | 679 | | | | 97,600 | | | | 92,640 | | | | | | | | — | | | | | | | | | | | | (4,960 | ) | | | | |
Colombian Peso, | | | | | | | | | | | | | | | | | | | | | | | | | | | | | | | | | | | | | | | | | | |
Expiring 12/21/22 | | | BARC | | | | | COP | 901,781 | | | | 198,159 | | | | 180,964 | | | | | | | | — | | | | | | | | | | | | (17,195 | ) | | | | |
Expiring 12/21/22 | | | CITI | | | | | COP | 1,743,401 | | | | 359,000 | | | | 349,856 | | | | | | | | — | | | | | | | | | | | | (9,144 | ) | | | | |
Expiring 12/21/22 | | | MSI | | | | | COP | 1,589,699 | | | | 323,000 | | | | 319,013 | | | | | | | | — | | | | | | | | | | | | (3,987 | ) | | | | |
Expiring 12/21/22 | | | UAG | | | | | COP | 3,174,849 | | | | 651,000 | | | | 637,112 | | | | | | | | — | | | | | | | | | | | | (13,888 | ) | | | | |
Euro, | | | | | | | | | | | | | | | | | | | | | | | | | | | | | | | | | | | | | | | | | | |
Expiring 01/19/23 | | | HSBC | | | | | EUR | 172 | | | | 168,885 | | | | 171,080 | | | | | | | | 2,195 | | | | | | | | | | | | — | | | | | |
Expiring 01/19/23 | | | MSI | | | | | EUR | 447 | | | | 447,805 | | | | 444,842 | | | | | | | | — | | | | | | | | | | | | (2,963 | ) | | | | |
Expiring 01/19/23 | | | MSI | | | | | EUR | 311 | | | | 314,841 | | | | 309,728 | | | | | | | | — | | | | | | | | | | | | (5,113 | ) | | | | |
Expiring 01/19/23 | | | MSI | | | | | EUR | 76 | | | | 75,448 | | | | 75,690 | | | | | | | | 242 | | | | | | | | | | | | — | | | | | |
Expiring 01/19/23 | | | TD | | | | | EUR | 192 | | | | 190,645 | | | | 191,363 | | | | | | | | 718 | | | | | | | | | | | | — | | | | | |
Hungarian Forint, | | | | | | | | | | | | | | | | | | | | | | | | | | | | | | | | | | | | | | | | | | |
Expiring 12/21/22 | | | MSI | | | | | HUF | 408,500 | | | | 942,330 | | | | 971,488 | | | | | | | | 29,158 | | | | | | | | | | | | — | | | | | |
Expiring 01/19/23 | | | BARC | | | | | HUF | 108,995 | | | | 251,280 | | | | 256,967 | | | | | | | | 5,687 | | | | | | | | | | | | — | | | | | |
Expiring 01/19/23 | | | GSI | | | | | HUF | 125,642 | | | | 292,000 | | | | 296,214 | | | | | | | | 4,214 | | | | | | | | | | | | — | | | | | |
Expiring 01/19/23 | | | MSI | | | | | HUF | 728,831 | | | | 1,659,424 | | | | 1,718,297 | | | | | | | | 58,873 | | | | | | | | | | | | — | | | | | |
Expiring 01/19/23 | | | MSI | | | | | HUF | 583,923 | | | | 1,278,570 | | | | 1,376,661 | | | | | | | | 98,091 | | | | | | | | | | | | — | | | | | |
Indian Rupee, | | | | | | | | | | | | | | | | | | | | | | | | | | | | | | | | | | | | | | | | | | |
Expiring 12/21/22 | | | MSI | | | | | INR | 63,206 | | | | 768,000 | | | | 758,836 | | | | | | | | — | | | | | | | | | | | | (9,164 | ) | | | | |
Expiring 12/21/22 | | | TD | | | | | INR | 142,041 | | | | 1,778,962 | | | | 1,705,303 | | | | | | | | — | | | | | | | | | | | | (73,659 | ) | | | | |
Indonesian Rupiah, | | | | | | | | | | | | | | | | | | | | | | | | | | | | | | | | | | | | | | | | | | |
Expiring 12/21/22 | | | BOA | | | | | IDR | 8,983,428 | | | | 589,000 | | | | 573,913 | | | | | | | | — | | | | | | | | | | | | (15,087 | ) | | | | |
Expiring 12/21/22 | | | HSBC | | | | | IDR | 16,091,328 | | | | 1,056,000 | | | | 1,028,007 | | | | | | | | — | | | | | | | | | | | | (27,993 | ) | | | | |
Expiring 12/21/22 | | | HSBC | | | | | IDR | 10,809,333 | | | | 711,000 | | | | 690,563 | | | | | | | | — | | | | | | | | | | | | (20,437 | ) | | | | |
Expiring 12/21/22 | | | JPM | | | | | IDR | 10,755,017 | | | | 694,208 | | | | 687,093 | | | | | | | | — | | | | | | | | | | | | (7,115 | ) | | | | |
See Notes to Financial Statements.
42
Forward foreign currency exchange contracts outstanding at October 31, 2022 (continued):
| | | | | | | | | | | | | | | | | | | | | | | | | | | | | | | | | | | | | | | | | | |
Purchase Contracts | | Counterparty | | | | | Notional
Amount
(000) | | | Value at
Settlement
Date | | | Current
Value | | | Unrealized
Appreciation | | | Unrealized
Depreciation | |
| | | | | | | | |
OTC Forward Foreign Currency Exchange Contracts (cont’d.): | | | | | | | | | | | | | | | | | | | | | | | | | | | | | | | | | |
Indonesian Rupiah (cont’d.), | | | | | | | | | | | | | | | | | | | | | | | | | | | | | | | | | | | | | | | | | | |
Expiring 12/21/22 | | | SCB | | | | | IDR | 13,203,247 | | | $ | 858,000 | | | $ | 843,500 | | | | | | | $ | — | | | | | | | | | | | $ | (14,500 | ) | | | | |
Expiring 12/21/22 | | | SCB | | | | | IDR | 8,803,595 | | | | 577,000 | | | | 562,425 | | | | | | | | — | | | | | | | | | | | | (14,575 | ) | | | | |
Israeli Shekel, | | | | | | | | | | | | | | | | | | | | | | | | | | | | | | | | | | | | | | | | | | |
Expiring 12/21/22 | | | BARC | | | | | ILS | 2,906 | | | | 833,000 | | | | 825,955 | | | | | | | | — | | | | | | | | | | | | (7,045 | ) | | | | |
Expiring 12/21/22 | | | BOA | | | | | ILS | 1,155 | | | | 327,000 | | | | 328,287 | | | | | | | | 1,287 | | | | | | | | | | | | — | | | | | |
Expiring 12/21/22 | | | CITI | | | | | ILS | 1,301 | | | | 371,435 | | | | 369,771 | | | | | | | | — | | | | | | | | | | | | (1,664 | ) | | | | |
Mexican Peso, | | | | | | | | | | | | | | | | | | | | | | | | | | | | | | | | | | | | | | | | | | |
Expiring 12/21/22 | | | HSBC | | | | | MXN | 6,256 | | | | 305,291 | | | | 312,851 | | | | | | | | 7,560 | | | | | | | | | | | | — | | | | | |
New Taiwanese Dollar, | | | | | | | | | | | | | | | | | | | | | | | | | | | | | | | | | | | | | | | | | | |
Expiring 12/21/22 | | | BARC | | | | | TWD | 6,278 | | | | 201,000 | | | | 194,776 | | | | | | | | — | | | | | | | | | | | | (6,224 | ) | | | | |
Expiring 12/21/22 | | | BOA | | | | | TWD | 31,114 | | | | 985,000 | | | | 965,299 | | | | | | | | — | | | | | | | | | | | | (19,701 | ) | | | | |
Expiring 12/21/22 | | | JPM | | | | | TWD | 36,474 | | | | 1,151,000 | | | | 1,131,593 | | | | | | | | — | | | | | | | | | | | | (19,407 | ) | | | | |
Expiring 12/21/22 | | | MSI | | | | | TWD | 27,600 | | | | 882,000 | | | | 856,279 | | | | | | | | — | | | | | | | | | | | | (25,721 | ) | | | | |
Peruvian Nuevo Sol, | | | | | | | | | | | | | | | | | | | | | | | | | | | | | | | | | | | | | | | | | | |
Expiring 12/21/22 | | | BARC | | | | | PEN | 1,105 | | | | 277,400 | | | | 275,839 | | | | | | | | — | | | | | | | | | | | | (1,561 | ) | | | | |
Expiring 12/21/22 | | | BARC | | | | | PEN | 411 | | | | 102,600 | | | | 102,498 | | | | | | | | — | | | | | | | | | | | | (102 | ) | | | | |
Expiring 12/21/22 | | | BNP | | | | | PEN | 2,294 | | | | 582,922 | | | | 572,395 | | | | | | | | — | | | | | | | | | | | | (10,527 | ) | | | | |
Philippine Peso, | | | | | | | | | | | | | | | | | | | | | | | | | | | | | | | | | | | | | | | | | | |
Expiring 12/21/22 | | | CITI | | | | | PHP | 43,735 | | | | 735,000 | | | | 749,675 | | | | | | | | 14,675 | | | | | | | | | | | | — | | | | | |
Polish Zloty, | | | | | | | | | | | | | | | | | | | | | | | | | | | | | | | | | | | | | | | | | | |
Expiring 01/19/23 | | | HSBC | | | | | PLN | 890 | | | | 174,850 | | | | 183,734 | | | | | | | | 8,884 | | | | | | | | | | | | — | | | | | |
Expiring 01/19/23 | | | JPM | | | | | PLN | 3,004 | | | | 598,000 | | | | 619,793 | | | | | | | | 21,793 | | | | | | | | | | | | — | | | | | |
Expiring 01/19/23 | | | JPM | | | | | PLN | 1,985 | | | | 391,000 | | | | 409,696 | | | | | | | | 18,696 | | | | | | | | | | | | — | | | | | |
Expiring 01/19/23 | | | MSI | | | | | PLN | 2,032 | | | | 400,000 | | | | 419,269 | | | | | | | | 19,269 | | | | | | | | | | | | — | | | | | |
Singapore Dollar, | | | | | | | | | | | | | | | | | | | | | | | | | | | | | | | | | | | | | | | | | | |
Expiring 12/21/22 | | | BNP | | | | | SGD | 108 | | | | 76,821 | | | | 76,368 | | | | | | | | — | | | | | | | | | | | | (453 | ) | | | | |
Expiring 12/21/22 | | | JPM | | | | | SGD | 1,239 | | | | 863,000 | | | | 875,354 | | | | | | | | 12,354 | | | | | | | | | | | | — | | | | | |
South African Rand, | | | | | | | | | | | | | | | | | | | | | | | | | | | | | | | | | | | | | | | | | | |
Expiring 12/21/22 | | | BOA | | | | | ZAR | 6,396 | | | | 360,000 | | | | 346,798 | | | | | | | | — | | | | | | | | | | | | (13,202 | ) | | | | |
Expiring 12/21/22 | | | GSI | | | | | ZAR | 6,254 | | | | 341,000 | | | | 339,135 | | | | | | | | — | | | | | | | | | | | | (1,865 | ) | | | | |
Expiring 12/21/22 | | | JPM | | | | | ZAR | 7,771 | | | | 441,000 | | | | 421,399 | | | | | | | | — | | | | | | | | | | | | (19,601 | ) | | | | |
Expiring 12/21/22 | | | JPM | | | | | ZAR | 5,892 | | | | 318,000 | | | | 319,510 | | | | | | | | 1,510 | | | | | | | | | | | | — | | | | | |
Expiring 12/21/22 | | | JPM | | | | | ZAR | 3,516 | | | | 193,000 | | | | 190,652 | | | | | | | | — | | | | | | | | | | | | (2,348 | ) | | | | |
Expiring 12/21/22 | | | MSI | | | | | ZAR | 7,720 | | | | 424,000 | | | | 418,603 | | | | | | | | — | | | | | | | | | | | | (5,397 | ) | | | | |
Expiring 12/21/22 | | | MSI | | | | | ZAR | 7,153 | | | | 393,000 | | | | 387,888 | | | | | | | | — | | | | | | | | | | | | (5,112 | ) | | | | |
Expiring 12/21/22 | | | MSI | | | | | ZAR | 6,778 | | | | 377,000 | | | | 367,505 | | | | | | | | — | | | | | | | | | | | | (9,495 | ) | | | | |
Expiring 12/21/22 | | | MSI | | | | | ZAR | 6,266 | | | | 351,000 | | | | 339,768 | | | | | | | | — | | | | | | | | | | | | (11,232 | ) | | | | |
South Korean Won, | | | | | | | | | | | | | | | | | | | | | | | | | | | | | | | | | | | | | | | | | | |
Expiring 12/21/22 | | | BOA | | | | | KRW | 1,225,186 | | | | 882,000 | | | | 859,263 | | | | | | | | — | | | | | | | | | | | | (22,737 | ) | | | | |
Expiring 12/21/22 | | | CITI | | | | | KRW | 487,398 | | | | 341,000 | | | | 341,828 | | | | | | | | 828 | | | | | | | | | | | | — | | | | | |
Expiring 12/21/22 | | | JPM | | | | | KRW | 1,207,832 | | | | 876,000 | | | | 847,092 | | | | | | | | — | | | | | | | | | | | | (28,908 | ) | | | | |
Expiring 12/21/22 | | | JPM | | | | | KRW | 1,015,712 | | | | 718,000 | | | | 712,352 | | | | | | | | — | | | | | | | | | | | | (5,648 | ) | | | | |
See Notes to Financial Statements.
PGIM Emerging Markets Debt Hard Currency Fund 43
Schedule of Investments (continued)
as of October 31, 2022
Forward foreign currency exchange contracts outstanding at October 31, 2022 (continued):
| | | | | | | | | | | | | | | | | | | | | | | | | | | | | | | | | | | | | | | | | | |
Purchase Contracts | | Counterparty | | | | | Notional
Amount
(000) | | | Value at
Settlement
Date | | | Current
Value | | | Unrealized
Appreciation | | | Unrealized
Depreciation | |
| | | | | | | |
OTC Forward Foreign Currency Exchange Contracts (cont’d.): | | | | | | | | | | | | | | | | | | | | | | | | | | | | | |
South Korean Won (cont’d.), | | | | | | | | | | | | | | | | | | | | | | | | | | | | | | | | | | | | | | | |
Expiring 12/21/22 | | | JPM | | | | | KRW | 954,960 | | | $ | 697,000 | | | $ | 669,745 | | | | | | | $ | — | | | | | | | | | | | $ | (27,255 | ) | | | | |
Thai Baht, | | | | | | | | | | | | | | | | | | | | | | | | | | | | | | | | | | | | | | | | | | |
Expiring 12/21/22 | | | BOA | | | | | THB | 6,418 | | | | 170,000 | | | | 169,420 | | | | | | | | — | | | | | | | | | | | | (580 | ) | | | | |
Expiring 12/21/22 | | | GSI | | | | | THB | 33,916 | | | | 895,000 | | | | 895,299 | | | | | | | | 299 | | | | | | | | | | | | — | | | | | |
Expiring 12/21/22 | | | GSI | | | | | THB | 32,957 | | | | 871,000 | | | | 869,981 | | | | | | | | — | | | | | | | | | | | | (1,019 | ) | | | | |
Expiring 12/21/22 | | | HSBC | | | | | THB | 39,139 | | | | 1,071,000 | | | | 1,033,163 | | | | | | | | — | | | | | | | | | | | | (37,837 | ) | | | | |
Expiring 12/21/22 | | | JPM | | | | | THB | 22,885 | | | | 616,000 | | | | 604,113 | | | | | | | | — | | | | | | | | | | | | (11,887 | ) | | | | |
Expiring 12/21/22 | | | JPM | | | | | THB | 6,402 | | | | 170,000 | | | | 169,006 | | | | | | | | — | | | | | | | | | | | | (994 | ) | | | | |
Expiring 12/21/22 | | | MSI | | | | | THB | 31,841 | | | | 864,000 | | | | 840,535 | | | | | | | | — | | | | | | | | | | | | (23,465 | ) | | | | |
Expiring 12/21/22 | | | SCB | | | | | THB | 22,835 | | | | 611,000 | | | | 602,791 | | | | | | | | — | | | | | | | | | | | | (8,209 | ) | | | | |
| | | | | | | | | | | | | | | | | | | | | | | | | | | | | | | | | | | | | | | | | | |
| | | | | | | | | | | |
| | | | | | | | | | | | $ | 47,231,489 | | | $ | 46,635,736 | | | | | | | | 356,167 | | | | | | | | | | | | (951,920 | ) | | | | |
| | | | | | | | | | | | | | | | | | | | | | | | | | | | | | | | | | | | | | | | | | |
| | | | | | | |
Sale Contracts | | Counterparty | | | | | Notional
Amount
(000) | | | Value at
Settlement
Date | | | Current
Value | | | Unrealized
Appreciation | | | Unrealized
Depreciation | |
| | | | | | | |
OTC Forward Foreign Currency Exchange Contracts: | | | | | | | | | | | | | | | | | | | | | | | | | | | | | |
Brazilian Real, | | | | | | | | | | | | | | | | | | | | | | | | | | | | | | | | | | | | | | | | | | |
Expiring 11/03/22 | | | CITI | | | | | BRL | 2,904 | | | $ | 542,333 | | | $ | 561,711 | | | | | | | $ | — | | | | | | | | | | | $ | (19,378 | ) | | | | |
Expiring 11/03/22 | | | CITI | | | | | BRL | 374 | | | | 72,425 | | | | 72,263 | | | | | | | | 162 | | | | | | | | | | | | — | | | | | |
British Pound, | | | | | | | | | | | | | | | | | | | | | | | | | | | | | | | | | | | | | | | | | | |
Expiring 01/19/23 | | | DB | | | | | GBP | 102 | | | | 113,861 | | | | 117,650 | | | | | | | | — | | | | | | | | | | | | (3,789 | ) | | | | |
Chilean Peso, | | | | | | | | | | | | | | | | | | | | | | | | | | | | | | | | | | | | | | | | | | |
Expiring 12/21/22 | | | BNP | | | | | CLP | 348,483 | | | | 367,000 | | | | 366,117 | | | | | | | | 883 | | | | | | | | | | | | — | | | | | |
Expiring 12/21/22 | | | BNP | | | | | CLP | 183,961 | | | | 194,000 | | | | 193,269 | | | | | | | | 731 | | | | | | | | | | | | — | | | | | |
Expiring 12/21/22 | | | MSI | | | | | CLP | 304,534 | | | | 332,000 | | | | 319,944 | | | | | | | | 12,056 | | | | | | | | | | | | — | | | | | |
Expiring 12/21/22 | | | MSI | | | | | CLP | 289,257 | | | | 296,000 | | | | 303,894 | | | | | | | | — | | | | | | | | | | | | (7,894 | ) | | | | |
Expiring 12/21/22 | | | TD | | | | | CLP | 346,287 | | | | 382,000 | | | | 363,810 | | | | | | | | 18,190 | | | | | | | | | | | | — | | | | | |
Expiring 12/21/22 | | | UAG | | | | | CLP | 305,555 | | | | 309,000 | | | | 321,017 | | | | | | | | — | | | | | | | | | | | | (12,017 | ) | | | | |
Expiring 12/21/22 | | | UAG | | | | | CLP | 175,992 | | | | 194,053 | | | | 184,898 | | | | | | | | 9,155 | | | | | | | | | | | | — | | | | | |
Chinese Renminbi, | | | | | | | | | | | | | | | | | | | | | | | | | | | | | | | | | | | | | | | | | | |
Expiring 11/23/22 | | | CITI | | | | | CNH | 5,687 | | | | 832,000 | | | | 776,160 | | | | | | | | 55,840 | | | | | | | | | | | | — | | | | | |
Expiring 11/23/22 | | | GSI | | | | | CNH | 64,571 | | | | 9,511,163 | | | | 8,813,108 | | | | | | | | 698,055 | | | | | | | | | | | | — | | | | | |
Expiring 11/23/22 | | | GSI | | | | | CNH | 5,613 | | | | 774,000 | | | | 766,095 | | | | | | | | 7,905 | | | | | | | | | | | | — | | | | | |
Expiring 11/23/22 | | | GSI | | | | | CNH | 5,408 | | | | 750,000 | | | | 738,148 | | | | | | | | 11,852 | | | | | | | | | | | | — | | | | | |
Expiring 11/23/22 | | | JPM | | | | | CNH | 5,396 | | | | 752,000 | | | | 736,497 | | | | | | | | 15,503 | | | | | | | | | | | | — | | | | | |
Expiring 11/23/22 | | | JPM | | | | | CNH | 5,240 | | | | 722,000 | | | | 715,204 | | | | | | | | 6,796 | | | | | | | | | | | | — | | | | | |
Expiring 11/23/22 | | | JPM | | | | | CNH | 4,356 | | | | 605,000 | | | | 594,514 | | | | | | | | 10,486 | | | | | | | | | | | | — | | | | | |
Expiring 11/23/22 | | | JPM | | | | | CNH | 4,191 | | | | 583,000 | | | | 572,067 | | | | | | | | 10,933 | | | | | | | | | | | | — | | | | | |
Expiring 11/23/22 | | | SCB | | | | | CNH | 4,484 | | | | 634,000 | | | | 612,046 | | | | | | | | 21,954 | | | | | | | | | | | | — | | | | | |
Expiring 11/23/22 | | | UAG | | | | | CNH | 4,339 | | | | 602,000 | | | | 592,240 | | | | | | | | 9,760 | | | | | | | | | | | | — | | | | | |
See Notes to Financial Statements.
44
Forward foreign currency exchange contracts outstanding at October 31, 2022 (continued):
| | | | | | | | | | | | | | | | | | | | | | | | | | | | | | | | | | | | | | | | | | |
Sale Contracts | | Counterparty | | | | | Notional
Amount
(000) | | | Value at
Settlement
Date | | | Current
Value | | | Unrealized
Appreciation | | | Unrealized
Depreciation | |
| | | | | | | | |
OTC Forward Foreign Currency Exchange Contracts (cont’d.): | | | | | | | | | | | | | | | | | | | | | | | | | | | | | | | | | |
Colombian Peso, | | | | | | | | | | | | | | | | | | | | | | | | | | | | | | | | | | | | | | | | | | |
Expiring 12/21/22 | | | BARC | | | | | COP | 1,229,942 | | | $ | 262,998 | | | $ | 246,818 | | | | | | | $ | 16,180 | | | | | | | | | | | $ | — | | | | | |
Expiring 12/21/22 | | | BARC | | | | | COP | 548,225 | | | | 117,002 | | | | 110,015 | | | | | | | | 6,987 | | | | | | | | | | | | — | | | | | |
Czech Koruna, | | | | | | | | | | | | | | | | | | | | | | | | | | | | | | | | | | | | | | | | | | |
Expiring 01/19/23 | | | BARC | | | | | CZK | 19,145 | | | | 752,000 | | | | 769,280 | | | | | | | | — | | | | | | | | | | | | (17,280 | ) | | | | |
Expiring 01/19/23 | | | BOA | | | | | CZK | 41,231 | | | | 1,619,801 | | | | 1,656,728 | | | | | | | | — | | | | | | | | | | | | (36,927 | ) | | | | |
Expiring 01/19/23 | | | GSI | | | | | CZK | 53,122 | | | | 2,088,314 | | | | 2,134,521 | | | | | | | | — | | | | | | | | | | | | (46,207 | ) | | | | |
Expiring 01/19/23 | | | HSBC | | | | | CZK | 49,696 | | | | 1,951,590 | | | | 1,996,860 | | | | | | | | — | | | | | | | | | | | | (45,270 | ) | | | | |
Euro, | | | | | | | | | | | | | | | | | | | | | | | | | | | | | | | | | | | | | | | | | | |
Expiring 01/19/23 | | | BNP | | | | | EUR | 2,832 | | | | 2,781,536 | | | | 2,817,828 | | | | | | | | — | | | | | | | | | | | | (36,292 | ) | | | | |
Expiring 01/19/23 | | | SCB | | | | | EUR | 5,582 | | | | 5,939,690 | | | | 5,553,698 | | | | | | | | 385,992 | | | | | | | | | | | | — | | | | | |
Expiring 01/19/23 | | | SCB | | | | | EUR | 1,936 | | | | 1,884,218 | | | | 1,925,991 | | | | | | | | — | | | | | | | | | | | | (41,773 | ) | | | | |
Hungarian Forint, | | | | | | | | | | | | | | | | | | | | | | | | | | | | | | | | | | | | | | | | | | |
Expiring 12/21/22 | | | MSI | | | | | HUF | 183,356 | | | | 435,349 | | | | 436,054 | | | | | | | | — | | | | | | | | | | | | (705 | ) | | | | |
Expiring 12/21/22 | | | MSI | | | | | HUF | 128,512 | | | | 310,079 | | | | 305,626 | | | | | | | | 4,453 | | | | | | | | | | | | — | | | | | |
Indian Rupee, | | | | | | | | | | | | | | | | | | | | | | | | | | | | | | | | | | | | | | | | | | |
Expiring 12/21/22 | | | BOA | | | | | INR | 51,325 | | | | 618,000 | | | | 616,191 | | | | | | | | 1,809 | | | | | | | | | | | | — | | | | | |
Expiring 12/21/22 | | | HSBC | | | | | INR | 14,265 | | | | 172,000 | | | | 171,259 | | | | | | | | 741 | | | | | | | | | | | | — | | | | | |
Expiring 12/21/22 | | | JPM | | | | | INR | 64,905 | | | | 809,000 | | | | 779,232 | | | | | | | | 29,768 | | | | | | | | | | | | — | | | | | |
Expiring 12/21/22 | | | JPM | | | | | INR | 53,632 | | | | 643,236 | | | | 643,888 | | | | | | | | — | | | | | | | | | | | | (652 | ) | | | | |
Expiring 12/21/22 | | | MSI | | | | | INR | 35,239 | | | | 424,000 | | | | 423,066 | | | | | | | | 934 | | | | | | | | | | | | — | | | | | |
Expiring 12/21/22 | | | SCB | | | | | INR | 15,067 | | | | 181,000 | | | | 180,894 | | | | | | | | 106 | | | | | | | | | | | | — | | | | | |
Indonesian Rupiah, | | | | | | | | | | | | | | | | | | | | | | | | | | | | | | | | | | | | | | | | | | |
Expiring 12/21/22 | | | MSI | | | | | IDR | 12,453,318 | | | | 799,000 | | | | 795,590 | | | | | | | | 3,410 | | | | | | | | | | | | — | | | | | |
Expiring 12/21/22 | | | SCB | | | | | IDR | 4,383,780 | | | | 292,564 | | | | 280,061 | | | | | | | | 12,503 | | | | | | | | | | | | — | | | | | |
Israeli Shekel, | | | | | | | | | | | | | | | | | | | | | | | | | | | | | | | | | | | | | | | | | | |
Expiring 12/21/22 | | | BARC | | | | | ILS | 2,638 | | | | 768,000 | | | | 749,824 | | | | | | | | 18,176 | | | | | | | | | | | | — | | | | | |
Expiring 12/21/22 | | | BARC | | | | | ILS | 2,007 | | | | 572,000 | | | | 570,505 | | | | | | | | 1,495 | | | | | | | | | | | | — | | | | | |
Expiring 12/21/22 | | | BOA | | | | | ILS | 1,951 | | | | 547,000 | | | | 554,446 | | | | | | | | — | | | | | | | | | | | | (7,446 | ) | | | | |
Expiring 12/21/22 | | | CITI | | | | | ILS | 2,275 | | | | 646,000 | | | | 646,651 | | | | | | | | — | | | | | | | | | | | | (651 | ) | | | | |
Expiring 12/21/22 | | | CITI | | | | | ILS | 1,940 | | | | 547,000 | | | | 551,344 | | | | | | | | — | | | | | | | | | | | | (4,344 | ) | | | | |
Expiring 12/21/22 | | | CITI | | | | | ILS | 1,285 | | | | 377,305 | | | | 365,266 | | | | | | | | 12,039 | | | | | | | | | | | | — | | | | | |
Expiring 12/21/22 | | | CITI | | | | | ILS | 1,154 | | | | 337,695 | | | | 328,101 | | | | | | | | 9,594 | | | | | | | | | | | | — | | | | | |
Expiring 12/21/22 | | | CITI | | | | | ILS | 976 | | | | 286,230 | | | | 277,341 | | | | | | | | 8,889 | | | | | | | | | | | | — | | | | | |
Mexican Peso, | | | | | | | | | | | | | | | | | | | | | | | | | | | | | | | | | | | | | | | | | | |
Expiring 12/21/22 | | | BOA | | | | | MXN | 15,920 | | | | 780,000 | | | | 796,121 | | | | | | | | — | | | | | | | | | | | | (16,121 | ) | | | | |
Expiring 12/21/22 | | | JPM | | | | | MXN | 14,063 | | | | 684,000 | | | | 703,266 | | | | | | | | — | | | | | | | | | | | | (19,266 | ) | | | | |
Expiring 12/21/22 | | | JPM | | | | | MXN | 9,605 | | | | 470,000 | | | | 480,350 | | | | | | | | — | | | | | | | | | | | | (10,350 | ) | | | | |
New Taiwanese Dollar, | | | | | | | | | | | | | | | | | | | | | | | | | | | | | | | | | | | | | | | | | | |
Expiring 12/21/22 | | | JPM | | | | | TWD | 111,216 | | | | 3,628,578 | | | | 3,450,464 | | | | | | | | 178,114 | | | | | | | | | | | | — | | | | | |
Peruvian Nuevo Sol, | | | | | | | | | | | | | | | | | | | | | | | | | | | | | | | | | | | | | | | | | | |
Expiring 12/21/22 | | | BARC | | | | | PEN | 1,794 | | | | 457,524 | | | | 447,731 | | | | | | | | 9,793 | | | | | | | | | | | | — | | | | | |
Expiring 12/21/22 | | | BARC | | | | | PEN | 996 | | | | 252,434 | | | | 248,635 | | | | | | | | 3,799 | | | | | | | | | | | | — | | | | | |
See Notes to Financial Statements.
PGIM Emerging Markets Debt Hard Currency Fund 45
Schedule of Investments (continued)
as of October 31, 2022
Forward foreign currency exchange contracts outstanding at October 31, 2022 (continued):
| | | | | | | | | | | | | | | | | | | | | | | | | | | | | | | | | | | | | | |
Sale Contracts | | Counterparty | | | | | Notional
Amount
(000) | | | Value at
Settlement
Date | | | Current
Value | | | Unrealized Appreciation | | Unrealized
Depreciation | |
OTC Forward Foreign Currency Exchange Contracts (cont’d.): | | | | | |
Peruvian Nuevo Sol (cont’d.), | | | | | | | | | | | | | | | | | | | | | | | | | | | | | | | | | | | |
Expiring 12/21/22 | | | CITI | | | | | PEN | 1,107 | | | $ | 276,000 | | | $ | 276,311 | | | | | $ | — | | | | | | | | | $ | (311) | | | | | |
Philippine Peso, | | | | | | | | | | | | | | | | | | | | | | | | | | | | | | | | | | | | | | |
Expiring 12/21/22 | | | HSBC | | | | | PHP | 31,965 | | | | 556,259 | | | | 547,933 | | | | | | 8,326 | | | | | | | | | | — | | | | | |
Expiring 12/21/22 | | | MSI | | | | | PHP | 11,509 | | | | 193,000 | | | | 197,283 | | | | | | — | | | | | | | | | | (4,283) | | | | | |
Expiring 12/21/22 | | | SCB | | | | | PHP | 50,432 | | | | 869,000 | | | | 864,483 | | | | | | 4,517 | | | | | | | | | | — | | | | | |
Singapore Dollar, | | | | | | | | | | | | | | | | | | | | | | | | | | | | | | | | | | | | | | |
Expiring 12/21/22 | | | DB | | | | | SGD | 1,242 | | | | 883,000 | | | | 877,827 | | | | | | 5,173 | | | | | | | | | | — | | | | | |
Expiring 12/21/22 | | | GSI | | | | | SGD | 1,366 | | | | 954,000 | | | | 965,102 | | | | | | — | | | | | | | | | | (11,102) | | | | | |
Expiring 12/21/22 | | | SCB | | | | | SGD | 1,302 | | | | 922,000 | | | | 920,351 | | | | | | 1,649 | | | | | | | | | | — | | | | | |
South African Rand, | | | | | | | | | | | | | | | | | | | | | | | | | | | | | | | | | | | | | | |
Expiring 12/21/22 | | | MSI | | | | | ZAR | 880 | | | | 50,372 | | | | 47,708 | | | | | | 2,664 | | | | | | | | | | — | | | | | |
South Korean Won, | | | | | | | | | | | | | | | | | | | | | | | | | | | | | | | | | | | | | | |
Expiring 12/21/22 | | | GSI | | | | | KRW | 1,065,982 | | | | 746,000 | | | | 747,608 | | | | | | — | | | | | | | | | | (1,608) | | | | | |
Expiring 12/21/22 | | | JPM | | | | | KRW | 2,789,803 | | | | 2,021,582 | | | | 1,956,581 | | | | | | 65,001 | | | | | | | | | | — | | | | | |
Expiring 12/21/22 | | | JPM | | | | | KRW | 283,085 | | | | 205,000 | | | | 198,536 | | | | | | 6,464 | | | | | | | | | | — | | | | | |
Thai Baht, | | | | | | | | | | | | | | | | | | | | | | | | | | | | | | | | | | | | | | |
Expiring 12/21/22 | | | GSI | | | | | THB | 35,131 | | | | 970,000 | | | | 927,371 | | | | | | 42,629 | | | | | | | | | | — | | | | | |
Expiring 12/21/22 | | | GSI | | | | | THB | 23,945 | | | | 661,000 | | | | 632,099 | | | | | | 28,901 | | | | | | | | | | — | | | | | |
Expiring 12/21/22 | | | HSBC | | | | | THB | 31,073 | | | | 851,000 | | | | 820,239 | | | | | | 30,761 | | | | | | | | | | — | | | | | |
Expiring 12/21/22 | | | JPM | | | | | THB | 198,038 | | | | 5,435,515 | | | | 5,227,701 | | | | | | 207,814 | | | | | | | | | | — | | | | | |
Turkish Lira, | | | | | | | | | | | | | | | | | | | | | | | | | | | | | | | | | | | | | | |
Expiring 12/21/22 | | | GSI | | | | | TRY | 4,400 | | | | 223,939 | | | | 227,075 | | | | | | — | | | | | | | | | | (3,136) | | | | | |
| | | | | | | | | | | | | | | | | | | | | | | | | | | | | | | | | | | | | | |
| | | | | | | | | | | | $ | 66,820,645 | | | $ | 65,168,505 | | | | | | 1,998,942 | | | | | | | | | | (346,802) | | | | | |
| | | | | | | | | | | | | | | | | | | | | | | | | | | | | | | | | | | | | | |
| | | | | | | | | | | |
| | | | | | | | | | | | | | | | | | | | | | $ | 2,355,109 | | | | | | | | | $ | (1,298,722) | | | | | |
| | | | | | | | | | | | | | | | | | | | | | | | | | | | | | | | | | | | | | |
Cross currency exchange contracts outstanding at October 31, 2022:
| | | | | | | | | | | | | | | | | | | | | | | | | | | | | | | | | | | | | | | | | | |
Settlement | | Type | | Notional
Amount
(000) | | | In Exchange
For (000) | | | Unrealized Appreciation | | | Unrealized Depreciation | | | Counterparty | |
| | | | | | | | | | | | | | | | | | |
OTC Cross Currency Exchange Contracts: | | | | | | | | | | | | | | | | | | | | | | | | | | | | | | | | | | | | | |
01/19/23 | | Buy | | AUD | 269 | | | | EUR | | | | 173 | | | | | | | $ | 97 | | | | | | | | | | | $ | — | | | | | | | | JPM | |
01/19/23 | | Buy | | CZK | 17,267 | | | | EUR | | | | 697 | | | | | | | | 128 | | | | | | | | | | | | — | | | | | | | | GSI | |
01/19/23 | | Buy | | HUF | 127,102 | | | | EUR | | | | 300 | | | | | | | | 873 | | | | | | | | | | | | — | | | | | | | | BOA | |
01/19/23 | | Buy | | HUF | 163,350 | | | | EUR | | | | 384 | | | | | | | | 3,054 | | | | | | | | | | | | — | | | | | | | | MSI | |
01/19/23 | | Buy | | PLN | 1,630 | | | | EUR | | | | 338 | | | | | | | | — | | | | | | | | | | | | (349 | ) | | | | | | | BOA | |
01/19/23 | | Buy | | PLN | 2,944 | | | | EUR | | | | 605 | | | | | | | | 5,877 | | | | | | | | | | | | — | | | | | | | | BOA | |
| | | | | | | | | | | | | | | | | | | | | | | | | | | | | | | | | | | | | | | | | | |
| | | | | | | | | | | |
| | | | | | | | | | | | | | | | | | | | $ | 10,029 | | | | | | | | | | | $ | (349 | ) | | | | | | | | |
| | | | | | | | | | | | | | | | | | | | | | | | | | | | | | | | | | | | | | | | | | |
See Notes to Financial Statements.
46
Credit default swap agreements outstanding at October 31, 2022:
| | | | | | | | | | | | | | | | | | | | | | | | | | | | | | | | |
Reference Entity/ Obligation | | Termination
Date | | Fixed
Rate | | Notional
Amount
(000)#(3) | | Value at Trade Date | | Value at October 31, 2022 | | Unrealized
Appreciation
(Depreciation) | |
| | | | | | | | | | | | | | |
| |
Centrally Cleared Credit Default Swap Agreement on credit indices - Buy Protection(1): | | | | | |
CDX.EM.38.V1 | | 12/20/27 | | 1.000%(Q) | | 1,015 | | | | $ | 82,542 | | | | | | | $ | 82,927 | | | | | | | $ | 385 | | | | | |
| | | | | | | | | | | | | | | | | | | | | | | | | | | | | | | | |
The Fund entered into credit default swaps (“CDS”) to provide a measure of protection against defaults or to take an active long or short position with respect to the likelihood of a particular issuer’s default or the reference entity’s credit soundness. CDS contracts generally trade based on a spread which represents the cost a protection buyer has to pay the protection seller. The protection buyer is said to be short the credit as the value of the contract rises the more the credit deteriorates. The value of the CDS contract increases for the protection buyer if the spread increases.
| (1) | If the Fund is a buyer of protection, it pays the fixed rate. When a credit event occurs, as defined under the terms of that particular swap agreement, the Fund will either (i) receive from the seller of protection an amount equal to the notional amount of the swap and make delivery of the referenced obligation or underlying securities comprising the referenced index or (ii) receive a net settlement amount in the form of cash or securities equal to the notional amount of the swap less the recovery value of the referenced obligation or underlying securities comprising the referenced index. |
| (2) | If the Fund is a seller of protection, it receives the fixed rate. When a credit event occurs, as defined under the terms of that particular swap agreement, the Fund will either (i)pay to the buyer of protection an amount equal to the notional amount of the swap and take delivery of the referenced obligation or underlying securities comprising the referenced index or (ii)pay a net settlement amount in the form of cash or securities equal to the notional amount of the swap less the recovery value of the referenced obligation or underlying securities comprising the referenced index. |
| (3) | Notional amount represents the maximum potential amount the Fund could be required to pay as a seller of credit protection or receive as a buyer of credit protection if a credit event occurs as defined under the terms of that particular swap agreement. |
| (4) | Implied credit spreads, represented in absolute terms, utilized in determining the fair value of credit default swap agreements where the Fund is the seller of protection as of the reporting date serve as an indicator of the current status of the payment/ performance risk and represent the likelihood of risk of default for the credit derivative. The implied credit spread of a particular referenced entity reflects the cost of buying/selling protection and may include up-front payments required to be made to enter into the agreement. Wider credit spreads represent a deterioration of the referenced entity’s credit soundness and a greater likelihood of risk of default or other credit event occurring as defined under the terms of the agreement. |
See Notes to Financial Statements.
PGIM Emerging Markets Debt Hard Currency Fund 47
Schedule of Investments (continued)
as of October 31, 2022
Interest rate swap agreements outstanding at October 31, 2022:
| | | | | | | | | | | | | | | | | | | | | | | | | | | | | | | | | | | | | | | | | | | | | | |
Notional
Amount (000)# | | Termination
Date | | | Fixed
Rate | | Floating Rate | | Value at
Trade Date | | | Value at
October 31,
2022 | | | Unrealized
Appreciation
(Depreciation) | |
| | | | | | | | | | | | | | | | | | | | | | | | | | | | | | | | | | | | | |
| |
Centrally Cleared Interest Rate Swap Agreements: | | | | | |
BRL | | 12,472 | | | 01/02/24 | | | 12.900%(T) | | 1 Day BROIS(1)(T)/0.051% | | | | | | $ | — | | | | | | | | | | | $ | 1,075 | | | | | | | | | | | $ | 1,075 | | | | | |
BRL | | 6,044 | | | 01/02/25 | | | 11.535%(T) | | 1 Day BROIS(1)(T)/0.051% | | | | | | | — | | | | | | | | | | | | 3,546 | | | | | | | | | | | | 3,546 | | | | | |
BRL | | 6,928 | | | 01/02/25 | | | 11.673%(T) | | 1 Day BROIS(2)(T)/0.051% | | | | | | | — | | | | | | | | | | | | 930 | | | | | | | | | | | | 930 | | | | | |
BRL | | 13,002 | | | 01/02/25 | | | 11.835%(T) | | 1 Day BROIS(2)(T)/0.051% | | | | | | | 2,049 | | | | | | | | | | | | 330 | | | | | | | | | | | | (1,719 | ) | | | | |
BRL | | 2,267 | | | 01/02/26 | | | 11.350%(T) | | 1 Day BROIS(2)(T)/0.051% | | | | | | | — | | | | | | | | | | | | (1,075 | ) | | | | | | | | | | | (1,075 | ) | | | | |
BRL | | 3,380 | | | 01/02/26 | | | 11.400%(T) | | 1 Day BROIS(2)(T)/0.051% | | | | | | | — | | | | | | | | | | | | (1,228 | ) | | | | | | | | | | | (1,228 | ) | | | | |
BRL | | 3,935 | | | 01/04/27 | | | 11.360%(T) | | 1 Day BROIS(2)(T)/0.051% | | | | | | | — | | | | | | | | | | | | (3,783 | ) | | | | | | | | | | | (3,783 | ) | | | | |
BRL | | 1,713 | | | 01/04/27 | | | 11.546%(T) | | 1 Day BROIS(2)(T)/0.051% | | | | | | | — | | | | | | | | | | | | 2,251 | | | | | | | | | | | | 2,251 | | | | | |
CLP | | 606,630 | | | 12/21/32 | | | 6.742%(S) | | 1 Day CLOIS(1)(S)/11.25% | | | | | | | — | | | | | | | | | | | | (23,710 | ) | | | | | | | | | | | (23,710 | ) | | | | |
COP | | 4,786,080 | | | 12/21/27 | | | 11.508%(Q) | | 1 Day COOIS(1)(Q)/10.285% | | | | | | | — | | | | | | | | | | | | (18,836 | ) | | | | | | | | | | | (18,836 | ) | | | | |
CZK | | 10,710 | | | 12/21/32 | | | 5.430%(A) | | 6 Month PRIBOR(1)(S)/7.390% | | | | | | | — | | | | | | | | | | | | 3,201 | | | | | | | | | | | | 3,201 | | | | | |
KRW | | 700,000 | | | 12/21/27 | | | 4.197%(Q) | | 3 Month KWCDC(1)(Q)/3.960% | | | | | | | — | | | | | | | | | | | | (1,990 | ) | | | | | | | | | | | (1,990 | ) | | | | |
MXN | | 21,400 | | | 12/15/27 | | | 9.060%(M) | | 28 Day Mexican Interbank Rate(2)(M)/9.596% | | | | | | | — | | | | | | | | | | | | (8,551 | ) | | | | | | | | | | | (8,551 | ) | | | | |
MXN | | 7,435 | | | 12/15/27 | | | 9.348%(M) | | 28 Day Mexican Interbank Rate(2)(M)/9.596% | | | | | | | (37 | ) | | | | | | | | | | | 1,258 | | | | | | | | | | | | 1,295 | | | | | |
See Notes to Financial Statements.
48
Interest rate swap agreements outstanding at October 31, 2022 (continued):
| | | | | | | | | | | | | | | | | | | | | | | | | | | | | | | | | | | | | | | | | | | | | | |
Notional
Amount
(000)# | | Termination
Date | | | Fixed
Rate | | Floating Rate | | Value at Trade Date | | | Value at October 31, 2022 | | | Unrealized
Appreciation
(Depreciation) | |
| | | | | | | | | | | | | | | | | | | | | | | | | | | | | | | | | | | | | |
| | | | | | | | | |
Centrally Cleared Interest Rate Swap Agreements (cont’d.): | | | | | | | | | | | | | | | | | | | | | | | | | | | | | | | | | | | | |
PLN | | 1,204 | | | 06/15/27 | | | 4.970%(A) | | 6 Month WIBOR(2)(S)/7.720% | | | | | | $ | (17,527 | ) | | | | | | | | | | $ | (25,848 | ) | | | | | | | | | | $ | (8,321 | ) | | | | |
PLN | | 2,826 | | | 09/21/27 | | | 5.487%(A) | | 6 Month WIBOR(1)(S)/7.720% | | | | | | | — | | | | | | | | | | | | 47,190 | | | | | | | | | | | | 47,190 | | | | | |
PLN | | 8,023 | | | 09/21/27 | | | 6.547%(A) | | 6 Month WIBOR(1)(S)/7.720% | | | | | | | 1,194 | | | | | | | | | | | | 64,453 | | | | | | | | | | | | 63,259 | | | | | |
PLN | | 2,407 | | | 10/06/27 | | | 6.826%(A) | | 6 Month WIBOR(2)(S)/7.720% | | | | | | | — | | | | | | | | | | | | (14,031 | ) | | | | | | | | | | | (14,031 | ) | | | | |
PLN | | 2,547 | | | 10/25/27 | | | 7.900%(A) | | 6 Month WIBOR(2)(S)/7.720% | | | | | | | — | | | | | | | | | | | | 7,214 | | | | | | | | | | | | 7,214 | | | | | |
THB | | 34,632 | | | 12/21/27 | | | 3.050%(Q) | | 1 Day THOR(1)(Q)/0.984% | | | | | | | — | | | | | | | | | | | | (9,242 | ) | | | | | | | | | | | (9,242 | ) | | | | |
THB | | 8,000 | | | 12/21/27 | | | 3.114%(Q) | | 1 Day THOR(1)(Q)/0.984% | | | | | | | — | | | | | | | | | | | | (2,784 | ) | | | | | | | | | | | (2,784 | ) | | | | |
ZAR | | 8,755 | | | 09/21/27 | | | 7.490%(Q) | | 3 Month JIBAR(1)(Q)/6.517% | | | | | | | 21,263 | | | | | | | | | | | | 18,112 | | | | | | | | | | | | (3,151 | ) | | | | |
ZAR | | 26,104 | | | 09/21/27 | | | 7.995%(Q) | | 3 Month JIBAR(2)(Q)/6.517% | | | | | | | (4,913 | ) | | | | | | | | | | | (24,203 | ) | | | | | | | | | | | (19,290 | ) | | | | |
ZAR | | 1,188 | | | 12/21/27 | | | 8.860%(Q) | | 3 Month JIBAR(2)(Q)/6.517% | | | | | | | 713 | | | | | | | | | | | | 617 | | | | | | | | | | | | (96 | ) | | | | |
| | | | | | | | | | | | | | | | | | | | | | | | | | | | | | | | | | | | | | | | | | | | | | |
| | | | | | | | | | | | | | | | $ | 2,742 | | | | | | | | | | | $ | 14,896 | | | | | | | | | | | $ | 12,154 | | | | | |
| | | | | | | | | | | | | | | | | | | | | | | | | | | | | | | | | | | | | | | | | | | | | | |
| | | | | | | | | | | | | | | | | | | | | | | | | | | | | | | | | | | | | | | | | | | | | | | | | | | | | | | | | | | | |
Notional Amount (000)# | | Termination
Date | | | Fixed
Rate | | | Floating Rate | | Fair Value | | | Upfront
Premiums Paid(Received) | | | Unrealized
Appreciation (Depreciation) | | | Counterparty | |
| | | | | | | | | | | | | | | | | | | | | | | | | | | | | | | | | | | | | | | | | | | | | | | |
| | | | | | | | | | | | |
OTC Interest Rate Swap Agreements: | | | | | | | | | | | | | | | | | | | | | | | | | | | | | | | | | | | | | | | | | | | | | | | | |
MYR | | 1,840 | | | 10/17/27 | | | | 4.240%(Q) | | | 3 Month KLIBOR(2)(Q)/3.160% | | | | | | $ | 1,123 | | | | | | | | | | | $ | (12 | ) | | | | | | | | | | $ | 1,135 | | | | | | | | | | | | MSI | | | | | |
MYR | | 3,200 | | | 12/21/27 | | | | 4.370%(Q) | | | 3 Month KLIBOR(2)(Q)/3.160% | | | | | | | 4,161 | | | | | | | | | | | | — | | | | | | | | | | | | 4,161 | | | | | | | | | | | | BOA | | | | | |
| | | | | | | | | | | | | | | | | | | | | | | | | | | | | | | | | | | | | | | | | | | | | | | | | | | | | | | | | | | | |
| | | | | | | | | | | | | | | | | | $ | 5,284 | | | | | | | | | | | $ | (12 | ) | | | | | | | | | | $ | 5,296 | | | | | | | | | | | | | | | | | |
| | | | | | | | | | | | | | | | | | | | | | | | | | | | | | | | | | | | | | | | | | | | | | | | | | | | | | | | | | | | |
| (1) | The Fund pays the fixed rate and receives the floating rate. |
| (2) | The Fund pays the floating rate and receives the fixed rate. |
See Notes to Financial Statements.
PGIM Emerging Markets Debt Hard Currency Fund 49
Schedule of Investments (continued)
as of October 31, 2022
Balances Reported in the Statement of Assets and Liabilities for OTC Swap Agreements:
| | | | | | | | |
| | | Premiums Paid | | Premiums Received | | Unrealized
Appreciation | | Unrealized
Depreciation |
OTC Swap Agreements | | $— | | $(12) | | $5,296 | | $— |
Summary of Collateral for Centrally Cleared/Exchange-traded Derivatives:
Cash and securities segregated as collateral, including pending settlement for closed positions, to cover requirements for centrally cleared/exchange-traded derivatives are listed by broker as follows:
| | | | | | | | | | | | | | | | | | | | | | | | |
Broker | | Cash and/or Foreign Currency | | | Securities Market Value | |
JPS | | | | | | $ | 1,364,000 | | | | | | | | | | | $ | — | | | | | |
| | | | | | | | | | | | | | | | | | | | | | | | |
Fair Value Measurements:
Various inputs are used in determining the value of the Fund’s investments. These inputs are summarized in the three broad levels listed below.
Level 1—unadjusted quoted prices generally in active markets for identical securities.
Level 2—quoted prices for similar securities, interest rates and yield curves, prepayment speeds, foreign currency exchange rates and other observable inputs.
Level 3—unobservable inputs for securities valued in accordance with Board approved fair valuation procedures.
The following is a summary of the inputs used as of October 31, 2022 in valuing such portfolio securities:
| | | | | | | | | | |
| | | Level 1 | | | Level 2 | | | Level 3 |
Investments in Securities | | | | | | | | | | |
Assets | | | | | | | | | | |
Long-Term Investments | | | | | | | | | | |
Corporate Bonds | | | | | | | | | | |
Azerbaijan | | $ | — | | | $ | 829,530 | | | $— |
Bahrain | | | — | | | | 592,175 | | | — |
Brazil | | | — | | | | 1,546,273 | | | — |
Chile | | | — | | | | 1,437,915 | | | — |
China | | | — | | | | 1,469,399 | | | — |
Colombia | | | — | | | | 596,757 | | | — |
Costa Rica | | | — | | | | 174,912 | | | — |
Ghana | | | — | | | | 170,500 | | | — |
Guatemala | | | — | | | | 507,025 | | | — |
India | | | — | | | | 2,394,037 | | | — |
Indonesia | | | — | | | | 3,306,056 | | | — |
Israel | | | — | | | | 962,539 | | | — |
Jamaica | | | — | | | | 142,772 | | | — |
Kazakhstan | | | — | | | | 1,751,936 | | | — |
Kuwait | | | — | | | | 384,825 | | | — |
Malaysia | | | — | | | | 1,762,196 | | | — |
See Notes to Financial Statements.
50
| | | | | | | | | | |
| | | Level 1 | | | Level 2 | | | Level 3 |
Investments in Securities (continued) | | | | | | | | | | |
Assets (continued) | | | | | | | | | | |
Long-Term Investments (continued) | | | | | | | | | | |
Corporate Bonds (continued) | | | | | | | | | | |
Mexico | | $ | — | | | $ | 6,871,528 | | | $— |
Mongolia | | | — | | | | 174,000 | | | — |
Panama | | | — | | | | 275,262 | | | — |
Peru | | | — | | | | 1,623,051 | | | — |
Philippines | | | — | | | | 131,162 | | | — |
Qatar | | | — | | | | 698,400 | | | — |
Saudi Arabia | | | — | | | | 897,957 | | | — |
South Africa | | | — | | | | 3,087,653 | | | — |
Thailand | | | — | | | | 97,126 | | | — |
Trinidad & Tobago | | | — | | | | 208,000 | | | — |
Turkey | | | — | | | | 331,833 | | | — |
Ukraine | | | — | | | | 89,860 | | | — |
United Arab Emirates | | | — | | | | 3,189,038 | | | — |
Venezuela | | | — | | | | 37,098 | | | — |
Vietnam | | | — | | | | 173,250 | | | — |
Sovereign Bonds | | | | | | | | | | |
Angola | | | — | | | | 2,835,362 | | | — |
Argentina | | | — | | | | 1,494,848 | | | — |
Bahrain | | | — | | | | 3,022,551 | | | — |
Bermuda | | | — | | | | 525,448 | | | — |
Brazil | | | — | | | | 3,824,818 | | | — |
Cameroon | | | — | | | | 385,575 | | | — |
Chile | | | — | | | | 1,109,770 | | | — |
Colombia | | | — | | | | 3,867,836 | | | — |
Congo (Republic) | | | — | | | | 213,465 | | | — |
Costa Rica | | | — | | | | 960,500 | | | — |
Croatia | | | — | | | | 458,608 | | | — |
Dominican Republic | | | — | | | | 5,148,125 | | | — |
Ecuador | | | — | | | | 1,691,634 | | | — |
Egypt | | | — | | | | 3,392,943 | | | — |
El Salvador | | | — | | | | 562,659 | | | — |
Gabon | | | — | | | | 1,146,953 | | | — |
Ghana | | | — | | | | 908,690 | | | — |
Guatemala | | | — | | | | 1,040,787 | | | — |
Honduras | | | — | | | | 188,370 | | | — |
Hungary | | | — | | | | 1,898,987 | | | — |
India | | | — | | | | 486,204 | | | — |
Indonesia | | | — | | | | 4,579,468 | | | — |
Iraq | | | — | | | | 1,543,079 | | | — |
Israel | | | — | | | | 678,544 | | | — |
Ivory Coast | | | — | | | | 1,458,858 | | | — |
Jamaica | | | — | | | | 1,286,800 | | | — |
Jordan | | | — | | | | 901,725 | | | — |
Kazakhstan | | | — | | | | 352,450 | | | — |
Kenya | | | — | | | | 317,000 | | | — |
See Notes to Financial Statements.
PGIM Emerging Markets Debt Hard Currency Fund 51
Schedule of Investments (continued)
as of October 31, 2022
| | | | | | | | | | |
| | | Level 1 | | | Level 2 | | | Level 3 |
Investments in Securities (continued) | | | | | | | | | | |
Assets (continued) | | | | | | | | | | |
Long-Term Investments (continued) | | | | | | | | | | |
Sovereign Bonds (continued) | | | | | | | | | | |
Lebanon | | $ | — | | | $ | 186,777 | | | $— |
Malaysia | | | — | | | | 1,955,000 | | | — |
Mexico | | | — | | | | 2,937,364 | | | — |
Mongolia | | | — | | | | 372,325 | | | — |
Morocco | | | — | | | | 1,013,126 | | | — |
Mozambique | | | — | | | | 535,650 | | | — |
Namibia | | | — | | | | 180,000 | | | — |
Nigeria | | | — | | | | 2,202,250 | | | — |
Oman. | | | — | | | | 4,701,856 | | | — |
Pakistan | | | — | | | | 1,272,105 | | | — |
Panama | | | — | | | | 2,076,697 | | | — |
Papua New Guinea | | | — | | | | 153,475 | | | — |
Paraguay | | | — | | | | 716,713 | | | — |
Peru | | | — | | | | 3,042,766 | | | — |
Philippines | | | — | | | | 2,803,036 | | | — |
Qatar | | | — | | | | 4,341,517 | | | — |
Romania | | | — | | | | 1,470,480 | | | — |
Russia | | | — | | | | 280,661 | | | — |
Saudi Arabia | | | — | | | | 3,663,723 | | | — |
Senegal | | | — | | | | 611,974 | | | — |
Serbia | | | — | | | | 1,523,116 | | | — |
South Africa | | | — | | | | 2,243,905 | | | — |
Sri Lanka | | | — | | | | 410,216 | | | — |
Turkey | | | — | | | | 4,463,406 | | | — |
Ukraine | | | — | | | | 992,946 | | | — |
United Arab Emirates | | | — | | | | 1,952,225 | | | — |
Uruguay | | | — | | | | 2,335,396 | | | — |
Venezuela | | | — | | | | 13,050 | | | — |
Zambia | | | — | | | | 586,325 | | | — |
U.S. Treasury Obligation | | | — | | | | 263,664 | | | — |
Short-Term Investments | | | | | | | | | | |
Affiliated Mutual Fund | | | 1,747,632 | | | | — | | | — |
Unaffiliated Fund | | | 3,860,539 | | | | — | | | — |
Options Purchased | | | — | | | | 156,980 | | | — |
| | | | | | | | | | |
| | | |
Total | | $ | 5,608,171 | | | $ | 131,654,846 | | | $— |
| | | | | | | | | | |
| | | |
Liabilities | | | | | | | | | | |
Options Written | | $ | — | | | $ | (343,587 | ) | | $— |
| | | | | | | | | | |
| | | |
Other Financial Instruments* | | | | | | | | | | |
Assets | | | | | | | | | | |
Futures Contracts | | $ | 360,083 | | | $ | — | | | $— |
OTC Forward Foreign Currency Exchange Contracts | | | — | | | | 2,355,109 | | | — |
OTC Cross Currency Exchange Contracts | | | — | | | | 10,029 | | | — |
See Notes to Financial Statements.
52
| | | | | | | | | | |
| | | Level 1 | | | Level 2 | | | Level 3 |
Other Financial Instruments* (continued) | | | | | | | | | | |
Assets (continued) | | | | | | | | | | |
Centrally Cleared Credit Default Swap Agreement | | $ | — | | | $ | 385 | | | $— |
Centrally Cleared Interest Rate Swap Agreements | | | — | | | | 129,961 | | | — |
OTC Interest Rate Swap Agreements | | | — | | | | 5,284 | | | — |
| | | | | | | | | | |
| | | |
Total | | $ | 360,083 | | | $ | 2,500,768 | | | $— |
| | | | | | | | | | |
| | | |
Liabilities | | | | | | | | | | |
Futures Contracts | | $ | (683,497 | ) | | $ | — | | | $— |
OTC Forward Foreign Currency Exchange Contracts | | | — | | | | (1,298,722 | ) | | — |
OTC Cross Currency Exchange Contracts | | | — | | | | (349 | ) | | — |
Centrally Cleared Interest Rate Swap Agreements | | | — | | | | (117,807 | ) | | — |
| | | | | | | | | | |
| | | |
Total | | $ | (683,497) | | | $ | (1,416,878) | | | $— |
| | | | | | | | | | |
| * | Other financial instruments are derivative instruments not reflected in the Schedule of Investments, such as futures, forwards and centrally cleared swap contracts, which are recorded at the unrealized appreciation (depreciation) on the instrument, and OTC swap contracts which are recorded at fair value. |
Industry Classification:
The industry classification of investments and other assets in excess of liabilities shown as a percentage of net assets as of October 31, 2022 were as follows:
| | | | |
Sovereign Bonds | | | 68.1 | % |
Oil & Gas | | | 10.0 | |
Electric | | | 4.1 | |
Unaffiliated Fund | | | 2.8 | |
Mining | | | 1.5 | |
Pipelines | | | 1.4 | |
Engineering & Construction | | | 1.3 | |
Affiliated Mutual Fund (1.2% represents investments purchased with collateral from securities on loan) | | | 1.2 | |
Commercial Services | | | 1.2 | |
Banks | | | 1.0 | |
Chemicals | | | 0.9 | |
Telecommunications | | | 0.7 | |
Diversified Financial Services | | | 0.6 | |
Retail | | | 0.4 | |
Transportation | | | 0.3 | |
Investment Companies | | | 0.3 | |
Building Materials | | | 0.3 | |
Iron/Steel | | | 0.2 | |
| | | | |
Real Estate | | | 0.2 | % |
Energy-Alternate Sources | | | 0.2 | |
U.S. Treasury Obligation | | | 0.2 | |
Media | | | 0.2 | |
Internet | | | 0.2 | |
Trucking & Leasing | | | 0.1 | |
Auto Manufacturers | | | 0.1 | |
Lodging | | | 0.1 | |
Options Purchased | | | 0.1 | |
Gas | | | 0.1 | |
Foods | | | 0.1 | |
Forest Products & Paper | | | 0.1 | |
Entertainment | | | 0.1 | |
| | | | |
| |
| | | 98.1 | |
Options Written | | | (0.3 | ) |
Other assets in excess of liabilities | | | 2.2 | |
| | | | |
| |
| | | 100.0 | % |
| | | | |
See Notes to Financial Statements.
PGIM Emerging Markets Debt Hard Currency Fund 53
Schedule of Investments (continued)
as of October 31, 2022
Effects of Derivative Instruments on the Financial Statements and Primary Underlying Risk Exposure:
The Fund invested in derivative instruments during the reporting period. The primary types of risk associated with these derivative instruments are credit contracts risk, foreign exchange contracts risk and interest rate contracts risk. See the Notes to Financial Statements for additional detail regarding these derivative instruments and their risks. The effect of such derivative instruments on the Fund’s financial position and financial performance as reflected in the Statement of Assets and Liabilities and Statement of Operations is presented in the summary below.
Fair values of derivative instruments as of October 31, 2022 as presented in the Statement of Assets and Liabilities:
| | | | | | | | | | | | |
| | | Asset Derivatives | | | Liability Derivatives | |
| | | | | | |
Derivatives not accounted for
as hedging instruments,
carried at fair value | | Statement of
Assets and
Liabilities Location | | Fair
Value | | | Statement of
Assets and
Liabilities Location | | Fair
Value | |
| | | | |
Credit contracts | | Due from/to
broker-variation margin
swaps | | $ | 385* | | | — | | $ | — | |
Credit contracts | | Unaffiliated investments | | | 17,606 | | | Options written
outstanding, at value | | | 18,261 | |
Foreign exchange contracts | | Unaffiliated investments | | | 139,374 | | | Options written
outstanding, at value | | | 325,326 | |
Foreign exchange contracts | | Unrealized appreciation
on OTC cross currency
exchange contracts | | | 10,029 | | | Unrealized depreciation
on OTC cross currency
exchange contracts | | | 349 | |
Foreign exchange contracts | | Unrealized appreciation
on OTC forward foreign
currency exchange
contracts | | | 2,355,109 | | | Unrealized depreciation
on OTC forward foreign
currency exchange
contracts | | | 1,298,722 | |
Interest rate contracts | | Due from/to broker-
variation margin futures | | | 360,083 | * | | Due from/to broker-
variation margin futures | | | 683,497 | * |
Interest rate contracts | | Due from/to broker-
variation margin swaps | | | 129,961 | * | | Due from/to broker-
variation margin swaps | | | 117,807 | * |
Interest rate contracts | | — | | | — | | | Premiums received for
OTC swap agreements | | | 12 | |
Interest rate contracts | | Unrealized appreciation
on OTC swap agreements | | | 5,296 | | | — | | | — | |
| | | | | | | | | | | | |
| | | | |
| | | | $ | 3,017,843 | | | | | $ | 2,443,974 | |
| | | | | | | | | | | | |
| * | Includes cumulative appreciation (depreciation) as reported in the schedule of open futures and centrally cleared swap contracts. Only unsettled variation margin receivable (payable) is reported within the Statement of Assets and Liabilities. |
See Notes to Financial Statements.
54
The effects of derivative instruments on the Statement of Operations for the year ended October 31, 2022 are as follows:
| | | | | | | | | | | | | | | | | | | | | | | | | | | | |
Amount of Realized Gain (Loss) on Derivatives Recognized in Income | |
Derivatives not accounted for as hedging instruments, carried at fair value | | Options
Purchased(1) | | | Options
Written | | | Futures | | | Forward
& Cross
Currency
Exchange
Contracts | | | Swaps | |
Credit contracts | | | | | | $ | (5,680 | ) | | | | | | $ | 28,980 | | | $ | — | | | $ | — | | | $ | (434,236 | ) |
Foreign exchange contracts | | | | | | | 364,974 | | | | | | | | (267,888 | ) | | | — | | | | 1,989,688 | | | | — | |
Interest rate contracts | | | | | | | — | | | | | | | | — | | | | (1,203,556 | ) | | | — | | | | (121,422 | ) |
| | | | | | | | | | | | | | | | | | | | | | | | | | | | |
| | | | | | | |
Total | | | | | | $ | 359,294 | | | | | | | $ | (238,908 | ) | | $ | (1,203,556 | ) | | $ | 1,989,688 | | | $ | (555,658 | ) |
| | | | | | | | | | | | | | | | | | | | | | | | | | | | |
| (1) | Included in net realized gain (loss) on investment transactions in the Statement of Operations. |
| | | | | | | | | | | | | | | | | | | | | | | | | | | | | | | | | | |
| Change in Unrealized Appreciation (Depreciation) on Derivatives Recognized in Income | |
Derivatives not accounted for as hedging instruments, carried at fair value | | Options
Purchased(2) | | | Options
Written | | | Futures | | | Forward & Cross Currency Exchange Contracts | | Swaps | |
Credit contracts | | | | | | $ | (23,464 | ) | | | | | | | | $ | 9,488 | | | $ | — | | | | | $ | — | | | | | $ | (14,332 | ) |
Foreign exchange contracts | | | | | | | 94,070 | | | | | | | | | | (61,788 | ) | | | — | | | | | | 1,014,379 | | | | | | — | |
Interest rate contracts | | | | | | | — | | | | | | | | | | — | | | | (453,119 | ) | | | | | — | | | | | | 104,784 | |
| | | | | | | | | | | | | | | | | | | | | | | | | | | | | | | | | | |
| | | | | | | | | | |
Total | | | | | | $ | 70,606 | | | | | | | | | $ | (52,300 | ) | | $ | (453,119 | ) | | | | $ | 1,014,379 | | | | | $ | 90,452 | |
| | | | | | | | | | | | | | | | | | | | | | | | | | | | | | | | | | |
| (2) | Included in net change in unrealized appreciation (depreciation) on investments in the Statement of Operations. |
For the year ended October 31, 2022, the Fund’s average volume of derivative activities is as follows:
| | |
| Derivative Contract Type | | Average Volume of Derivative Activities* |
Options Purchased (1) | | $ 124,663 |
Options Written (2) | | 14,677,493 |
Futures Contracts - Long Positions (2) | | 23,144,657 |
Futures Contracts - Short Positions (2) | | 15,258,935 |
Forward Foreign Currency Exchange Contracts - Purchased (3) | | 31,586,857 |
Forward Foreign Currency Exchange Contracts - Sold (3) | | 55,681,307 |
Cross Currency Exchange Contracts (4) | | 690,451 |
Interest Rate Swap Agreements (2) | | 5,764,069 |
Credit Default Swap Agreements - Buy Protection (2) | | 2,781,000 |
| * | Average volume is based on average quarter end balances as noted for the year ended October 31, 2022. |
| (2) | Notional Amount in USD. |
| (3) | Value at Settlement Date. |
See Notes to Financial Statements.
PGIM Emerging Markets Debt Hard Currency Fund 55
Schedule of Investments (continued)
as of October 31, 2022
Financial Instruments/Transactions—Summary of Offsetting and Netting Arrangements:
The Fund invested in OTC derivatives and entered into financial instruments/transactions during the reporting period that are either offset in accordance with current requirements or are subject to enforceable master netting arrangements or similar agreements that permit offsetting. The information about offsetting and related netting arrangements for OTC derivatives and financial instruments/transactions where the legal right to set-off exists is presented in the summary below.
Offsetting of financial instrument/transaction assets and liabilities:
| | | | | | |
| | | | |
| Description | | Gross Market Value of Recognized Assets/(Liabilities) | | Collateral Pledged/(Received)(2) | | Net
Amount |
Securities on Loan | | $1,588,847 | | $(1,588,847) | | $— |
Offsetting of OTC derivative assets and liabilities:
| | | | | | | | | | | | | | | | | | | | | | | | | |
Counterparty | | Gross Amounts of
Recognized
Assets(1) | | Gross Amounts of
Recognized
Liabilities(1) | | Net Amounts of
Recognized
Assets/(Liabilities) | | Collateral
Pledged/(Received)(2) | | Net Amount |
BARC | | | $ | 72,973 | | | | $ | (49,407 | ) | | | $ | 23,566 | | | | $ | — | | | | $ | 23,566 | |
BNP | | | | 1,614 | | | | | (47,316 | ) | | | | (45,702 | ) | | | | — | | | | | (45,702 | ) |
BOA | | | | 14,007 | | | | | (247,786 | ) | | | | (233,779 | ) | | | | — | | | | | (233,779 | ) |
CITI | | | | 210,347 | | | | | (45,555 | ) | | | | 164,792 | | | | | — | | | | | 164,792 | |
DB | | | | 5,173 | | | | | (3,789 | ) | | | | 1,384 | | | | | — | | | | | 1,384 | |
GSI | | | | 803,333 | | | | | (107,379 | ) | | | | 695,954 | | | | | (550,000 | ) | | | | 145,954 | |
HSBC | | | | 58,467 | | | | | (205,462 | ) | | | | (146,995 | ) | | | | — | | | | | (146,995 | ) |
JPM | | | | 640,342 | | | | | (324,901 | ) | | | | 315,441 | | | | | (270,000 | ) | | | | 45,441 | |
MSI | | | | 256,614 | | | | | (432,454 | ) | | | | (175,840 | ) | | | | — | | | | | (175,840 | ) |
SCB | | | | 426,721 | | | | | (79,057 | ) | | | | 347,664 | | | | | (220,000 | ) | | | | 127,664 | |
TD | | | | 18,908 | | | | | (73,659 | ) | | | | (54,751 | ) | | | | — | | | | | (54,751 | ) |
UAG | | | | 18,915 | | | | | (25,905 | ) | | | | (6,990 | ) | | | | — | | | | | (6,990 | ) |
| | | | | | | | | | | | | | | | | | | | | | | | | |
| | | $ | 2,527,414 | | | | $ | (1,642,670 | ) | | | $ | 884,744 | | | | $ | (1,040,000 | ) | | | $ | (155,256 | ) |
| | | | | | | | | | | | | | | | | | | | | | | | | |
| (1) | Includes unrealized appreciation/(depreciation) on swaps and forwards, premiums paid/(received) on swap agreements and market value of purchased and written options, as represented on the Statement of Assets and Liabilities. |
| (2) | Collateral amount disclosed by the Fund is limited to the market value of financial instruments/transactions and the Fund’s OTC derivative exposure by counterparty. |
See Notes to Financial Statements.
56
Statement of Assets and Liabilities
as of October 31, 2022
| | | | |
| |
Assets | | | | |
| |
Investments at value, including securities on loan of $1,588,847: | | | | |
Unaffiliated investments (cost $181,903,492) | | $ | 135,515,385 | |
Affiliated investments (cost $1,747,755) | | | 1,747,632 | |
Foreign currency, at value (cost $113,096) | | | 111,589 | |
Unrealized appreciation on OTC forward foreign currency exchange contracts | | | 2,355,109 | |
Dividends and interest receivable | | | 2,126,344 | |
Deposit with broker for centrally cleared/exchange-traded derivatives | | | 1,364,000 | |
Receivable for Fund shares sold | | | 258,599 | |
Receivable for investments sold | | | 223,515 | |
Due from broker—variation margin swaps | | | 39,981 | |
Unrealized appreciation on OTC cross currency exchange contracts | | | 10,029 | |
Unrealized appreciation on OTC swap agreements | | | 5,296 | |
Prepaid expenses | | | 1,553 | |
| | | | |
| |
Total Assets | | | 143,759,032 | |
| | | | |
| |
| Liabilities | | | | |
| |
Payable to broker for collateral for securities on loan | | | 1,743,546 | |
Unrealized depreciation on OTC forward foreign currency exchange contracts | | | 1,298,722 | |
Options written outstanding, at value (premiums received $290,833) | | | 343,587 | |
Payable for Fund shares purchased | | | 187,180 | |
Accrued expenses and other liabilities | | | 100,300 | |
Management fee payable | | | 58,813 | |
Due to broker—variation margin futures | | | 39,566 | |
Dividends payable | | | 11,079 | |
Directors’ fees payable | | | 917 | |
Affiliated transfer agent fee payable | | | 354 | |
Unrealized depreciation on OTC cross currency exchange contracts | | | 349 | |
Distribution fee payable | | | 21 | |
Premiums received for OTC swap agreements | | | 12 | |
| | | | |
| |
Total Liabilities | | | 3,784,446 | |
| | | | |
| |
Net Assets | | $ | 139,974,586 | |
| | | | |
| |
| | | | |
| |
Net assets were comprised of: | | | | |
Common stock, at par | | $ | 219 | |
Paid-in capital in excess of par | | | 196,473,368 | |
Total distributable earnings (loss) | | | (56,499,001 | ) |
| | | | |
| |
Net assets, October 31, 2022 | | $ | 139,974,586 | |
| | | | |
See Notes to Financial Statements.
PGIM Emerging Markets Debt Hard Currency Fund 57
Statement of Assets and Liabilities
as of October 31, 2022
| | | | |
| |
Class A | | | | |
| |
Net asset value, offering price and redemption price per share, ($63,165 ÷ 9,876 shares of beneficial interest issued and outstanding) | | $ | 6.40 | |
Maximum sales charge (3.25% of offering price) | | | 0.21 | |
| | | | |
| |
Maximum offering price to public | | $ | 6.61 | |
| | | | |
| |
Class C | | | | |
| |
Net asset value, offering price and redemption price per share, ($7,964 ÷ 1,245 shares of beneficial interest issued and outstanding) | | $ | 6.40 | |
| | | | |
| |
Class Z | | | | |
| |
Net asset value, offering price and redemption price per share, ($10,670,033 ÷ 1,666,975 shares of beneficial interest issued and outstanding) | | $ | 6.40 | |
| | | | |
| |
Class R6 | | | | |
| |
Net asset value, offering price and redemption price per share, ($129,233,424 ÷ 20,197,722 shares of beneficial interest issued and outstanding) | | $ | 6.40 | |
| | | | |
See Notes to Financial Statements.
58
Statement of Operations
Year Ended October 31, 2022
| | | | |
| |
Net Investment Income (Loss) | | | | |
Income | | | | |
Interest income (net of $8,007 foreign withholding tax) | | $ | 8,112,245 | |
Unaffiliated dividend income | | | 75,212 | |
Income from securities lending, net (including affiliated income of $7,224) | | | 8,112 | |
Affiliated dividend income | | | 1,958 | |
| | | | |
| |
Total income | | | 8,197,527 | |
| | | | |
| |
Expenses | | | | |
Management fee | | | 991,529 | |
Distribution fee(a) | | | 278 | |
Custodian and accounting fees | | | 67,221 | |
Registration fees(a) | | | 40,939 | |
Audit fee | | | 38,000 | |
Shareholders’ reports | | | 32,190 | |
Transfer agent’s fees and expenses (including affiliated expense of $1,655)(a) | | | 24,228 | |
Legal fees and expenses | | | 22,007 | |
Directors’ fees | | | 11,328 | |
SEC registration fees | | | 3,133 | |
Miscellaneous | | | 21,442 | |
| | | | |
| |
Total expenses | | | 1,252,295 | |
Less: Fee waiver and/or expense reimbursement(a) | | | (245,489 | ) |
| | | | |
| |
Net expenses | | | 1,006,806 | |
| | | | |
| |
Net investment income (loss) | | | 7,190,721 | |
| | | | |
| |
Realized And Unrealized Gain (Loss) On Investment And Foreign Currency Transactions | | | | |
| |
Net realized gain (loss) on: | | | | |
Investment transactions (including affiliated of $(5)) | | | (6,819,519 | ) |
Futures transactions | | | (1,203,556 | ) |
Forward and cross currency contract transactions | | | 1,989,688 | |
Options written transactions | | | (238,908 | ) |
Swap agreement transactions | | | (555,658 | ) |
Foreign currency transactions | | | (203,439 | ) |
| | | | |
| |
| | | (7,031,392 | ) |
| | | | |
Net change in unrealized appreciation (depreciation) on: | | | | |
Investments (including affiliated of $(123)) | | | (44,989,100 | ) |
Futures | | | (453,119 | ) |
Forward and cross currency contracts | | | 1,014,379 | |
Options written | | | (52,300 | ) |
Swap agreements | | | 90,452 | |
Foreign currencies | | | (12,770 | ) |
| | | | |
| |
| | | (44,402,458 | ) |
| | | | |
| |
Net gain (loss) on investment and foreign currency transactions | | | (51,433,850 | ) |
| | | | |
| |
Net Increase (Decrease) In Net Assets Resulting From Operations | | $ | (44,243,129 | ) |
| | | | |
See Notes to Financial Statements.
PGIM Emerging Markets Debt Hard Currency Fund 59
Statement of Operations
Year Ended October 31, 2022
| (a) | Class specific expenses and waivers were as follows: |
| | | | | | | | | | | | | | | | | | | | |
| | | Class A | | Class C | | Class Z | | Class R6 |
Distribution fee | | | | 185 | | | | | 93 | | | | | — | | | | | — | |
Registration fees | | | | 7,332 | | | | | 7,332 | | | | | 18,844 | | | | | 7,431 | |
Transfer agent’s fees and expenses | | | | 549 | | | | | 53 | | | | | 22,851 | | | | | 775 | |
Fee waiver and/or expense reimbursement | | | | (7,867 | ) | | | | (7,382 | ) | | | | (45,872 | ) | | | | (184,368 | ) |
See Notes to Financial Statements.
60
Statements of Changes in Net Assets
| | | | | | | | |
| |
| | | Year Ended
October 31, | |
| | | | | | | |
| | |
| | | 2022 | | | 2021 | |
| | |
Increase (Decrease) in Net Assets | | | | | | | | |
| | |
Operations | | | | | | | | |
Net investment income (loss) | | $ | 7,190,721 | | | $ | 5,629,265 | |
Net realized gain (loss) on investment and foreign currency transactions | | | (7,031,392 | ) | | | 845,517 | |
Net change in unrealized appreciation (depreciation) on investments and foreign currencies | | | (44,402,458 | ) | | | 1,891,629 | |
| | | | | | | | |
| | |
Net increase (decrease) in net assets resulting from operations | | | (44,243,129 | ) | | | 8,366,411 | |
| | | | | | | | |
| | |
Dividends and Distributions | | | | | | | | |
Distributions from distributable earnings | | | | | | | | |
Class A | | | (4,104 | ) | | | (2,106 | ) |
Class C | | | (454 | ) | | | (397 | ) |
Class Z | | | (885,485 | ) | | | (1,206,404 | ) |
Class R6 | | | (8,274,777 | ) | | | (5,228,489 | ) |
| | | | | | | | |
| | |
| | | (9,164,820 | ) | | | (6,437,396 | ) |
| | | | | | | | |
Fund share transactions (Net of share conversions) | | | | | | | | |
Net proceeds from shares sold | | | 79,972,841 | | | | 81,696,730 | |
Net asset value of shares issued in reinvestment of dividends and distributions | | | 8,930,919 | | | | 6,292,008 | |
Cost of shares purchased | | | (49,944,561 | ) | | | (52,285,699 | ) |
| | | | | | | | |
| | |
Net increase (decrease) in net assets from Fund share transactions | | | 38,959,199 | | | | 35,703,039 | |
| | | | | | | | |
| | |
Total increase (decrease) | | | (14,448,750 | ) | | | 37,632,054 | |
| | |
Net Assets: | | | | | | | | |
| | |
Beginning of year | | | 154,423,336 | | | | 116,791,282 | |
| | | | | | | | |
| | |
End of year | | $ | 139,974,586 | | | $ | 154,423,336 | |
| | | | | | | | |
See Notes to Financial Statements.
PGIM Emerging Markets Debt Hard Currency Fund 61
Financial Highlights
| | | | | | | | | | | | | | | | | | | | | | | | | | | |
| | | | | | | |
Class A Shares | | | | | | | | | | | | | | | | | | | | | | | | | | | |
| | | Year Ended October 31, | | December 12, 2017(a) through October 31, | | |
| | | |
| | | | | | | |
| | | 2022 | | 2021 | | 2020 | | 2019 | | 2018 | | |
| | | | | | | |
Per Share Operating Performance(b): | | | | | | | | | | | | | | | | | | | | | | | | | | | |
Net Asset Value, Beginning of Period | | | | $9.06 | | | | | $8.86 | | | | | $9.51 | | | | | $8.88 | | | | | $10.00 | | | |
Income (loss)from investment operations: | | | | | | | | | | | | | | | | | | | | | | | | | | | |
| Net investment income (loss) | | | | 0.34 | | | | | 0.36 | | | | | 0.38 | | | | | 0.46 | | | | | 0.38 | | | |
| Net realized and unrealized gain (loss) on investment and foreign currency transactions | | | | (2.57 | ) | | | | 0.25 | | | | | (0.56 | ) | | | | 0.69 | | | | | (1.06 | ) | | |
Total from investment operations | | | | (2.23 | ) | | | | 0.61 | | | | | (0.18 | ) | | | | 1.15 | | | | | (0.68 | ) | | |
Less Dividends and Distributions: | | | | | | | | | | | | | | | | | | | | | | | | | | | |
Dividends from net investment income | | | | (0.43 | ) | | | | (0.41 | ) | | | | (0.47 | ) | | | | (0.52 | ) | | | | (0.43 | ) | | |
Tax return of capital distributions | | | | - | | | | | - | | | | | - | | | | | - | | | | | (0.01 | ) | | |
Total dividends and distributions | | | | (0.43 | ) | | | | (0.41 | ) | | | | (0.47 | ) | | | | (0.52 | ) | | | | (0.44 | ) | | |
Net asset value, end of period | | | | $6.40 | | | | | $9.06 | | | | | $8.86 | | | | | $9.51 | | | | | $8.88 | | | |
Total Return(c): | | | | (25.24 | )% | | | | 6.91 | % | | | | (1.82 | )% | | | | 13.23 | % | | | | (6.97 | )% | | |
| | | | | | | | | | | | | | | | | | | | | | | | | | | |
Ratios/Supplemental Data: | | | | | | | | | | | | | | | | | | | | | | | | | | | |
Net assets, end of period (000) | | | | $63 | | | | | $59 | | | | | $28 | | | | | $13 | | | | | $9 | | | |
Average net assets (000) | | | | $74 | | | | | $47 | | | | | $18 | | | | | $12 | | | | | $10 | | | |
Ratios to average net assets(d): | | | | | | | | | | | | | | | | | | | | | | | | | | | |
Expenses after waivers and/or expense reimbursement | | | | 1.05 | % | | | | 1.05 | % | | | | 1.05 | % | | | | 1.05 | % | | | | 1.05 | %(e) | | |
Expenses before waivers and/or expense reimbursement | | | | 11.65 | % | | | | 19.07 | % | | | | 66.11 | % | | | | 115.95 | % | | | | 358.14 | %(e) | | |
Net investment income (loss) | | | | 4.36 | % | | | | 3.84 | % | | | | 4.19 | % | | | | 4.95 | % | | | | 4.49 | %(e) | | |
Portfolio turnover rate(f) | | | | 20 | % | | | | 20 | % | | | | 23 | % | | | | 33 | % | | | | 17 | % | | |
| (a) | Commencement of operations. |
| (b) | Calculated based on average shares outstanding during the period. |
| (c) | Total return does not consider the effects of sales loads. Total return is calculated assuming a purchase of a share on the first day and a sale on the last day of each period reported and includes reinvestment of dividends and distributions, if any. Total returns may reflect adjustments to conform to GAAP. Total returns for periods less than one full year are not annualized. |
| (d) | Does not include expenses of the underlying funds in which the Fund invests. |
| (f) | The Fund’s portfolio turnover rate is calculated in accordance with regulatory requirements, without regard to transactions involving short-term investments, certain derivatives and in-kind transactions (if any). If such transactions were included, the Fund’s portfolio turnover rate may be higher. |
See Notes to Financial Statements.
62
| | | | | | | | | | | | | | | | | | | | | | | | | | | |
| | | | | | | |
Class C Shares | | | | | | | | | | | | | | | | | | | | | | | | | | | |
| | | Year Ended October 31, | | December 12, 2017(a) through October 31, | | |
| | | |
| | | 2022 | | 2021 | | 2020 | | 2019 | | 2018 | | |
| | | | | | | |
Per Share Operating Performance(b): | | | | | | | | | | | | | | | | | | | | | | | | | | | |
Net Asset Value, Beginning of Period | | | | $9.06 | | | | | $8.86 | | | | | $9.51 | | | | | $8.88 | | | | | $10.00 | | | |
Income (loss)from investment operations: | | | | | | | | | | | | | | | | | | | | | | | | | | | |
| Net investment income (loss) | | | | 0.27 | | | | | 0.28 | | | | | 0.32 | | | | | 0.39 | | | | | 0.31 | | | |
| Net realized and unrealized gain (loss) on investment and foreign currency transactions | | | | (2.55 | ) | | | | 0.26 | | | | | (0.57 | ) | | | | 0.69 | | | | | (1.05 | ) | | |
Total from investment operations | | | | (2.28 | ) | | | | 0.54 | | | | | (0.25 | ) | | | | 1.08 | | | | | (0.74 | ) | | |
Less Dividends and Distributions: | | | | | | | | | | | | | | | | | | | | | | | | | | | |
Dividends from net investment income | | | | (0.38 | ) | | | | (0.34 | ) | | | | (0.40 | ) | | | | (0.45 | ) | | | | (0.37 | ) | | |
Tax return of capital distributions | | | | - | | | | | - | | | | | - | | | | | - | | | | | (0.01 | ) | | |
Total dividends and distributions | | | | (0.38 | ) | | | | (0.34 | ) | | | | (0.40 | ) | | | | (0.45 | ) | | | | (0.38 | ) | | |
Net asset value, end of period | | | | $6.40 | | | | | $9.06 | | | | | $8.86 | | | | | $9.51 | | | | | $8.88 | | | |
Total Return(c): | | | | (25.82 | )% | | | | 6.11 | % | | | | (2.55 | )% | | | | 12.40 | % | | | | (7.58 | )% | | |
| | | | | | | | | | | | | | | | | | | | | | | | | | | |
Ratios/Supplemental Data: | | | | | | | | | | | | | | | | | | �� | | | | | | | | | |
Net assets, end of period (000) | | | | $8 | | | | | $11 | | | | | $10 | | | | | $10 | | | | | $9 | | | |
Average net assets (000) | | | | $9 | | | | | $11 | | | | | $10 | | | | | $10 | | | | | $10 | | | |
Ratios to average net assets(d): | | | | | | | | | | | | | | | | | | | | | | | | | | | |
Expenses after waivers and/or expense reimbursement | | | | 1.80 | % | | | | 1.80 | % | | | | 1.80 | % | | | | 1.80 | % | | | | 1.80 | %(e) | | |
Expenses before waivers and/or expense reimbursement | | | | 81.50 | % | | | | 78.90 | % | | | | 114.46 | % | | | | 139.02 | % | | | | 359.95 | %(e) | | |
Net investment income (loss) | | | | 3.53 | % | | | | 3.08 | % | | | | 3.56 | % | | | | 4.22 | % | | | | 3.73 | %(e) | | |
Portfolio turnover rate(f) | | | | 20 | % | | | | 20 | % | | | | 23 | % | | | | 33 | % | | | | 17 | % | | |
| (a) | Commencement of operations. |
| (b) | Calculated based on average shares outstanding during the period. |
| (c) | Total return does not consider the effects of sales loads. Total return is calculated assuming a purchase of a share on the first day and a sale on the last day of each period reported and includes reinvestment of dividends and distributions, if any. Total returns may reflect adjustments to conform to GAAP. Total returns for periods less than one full year are not annualized. |
| (d) | Does not include expenses of the underlying funds in which the Fund invests. |
| (f) | The Fund’s portfolio turnover rate is calculated in accordance with regulatory requirements, without regard to transactions involving short-term investments, certain derivatives and in-kind transactions (if any). If such transactions were included, the Fund’s portfolio turnover rate may be higher. |
See Notes to Financial Statements.
PGIM Emerging Markets Debt Hard Currency Fund 63
Financial Highlights (continued)
| | | | | | | | | | | | | | | | | | | | | | | | | | | |
| | | | | | | |
Class Z Shares | | | | | | | | | | | | | | | | | | | | | | | | | | | |
| | | Year Ended October 31, | | December 12, 2017(a) through October 31, | | |
| | | |
| | | 2022 | | 2021 | | 2020 | | 2019 | | 2018 | | |
| | | | | | | |
Per Share Operating Performance(b): | | | | | | | | | | | | | | | | | | | | | | | | | | | |
Net Asset Value, Beginning of Period | | | | $9.06 | | | | | $8.87 | | | | | $9.51 | | | | | $8.88 | | | | | $10.00 | | | |
Income (loss)from investment operations: | | | | | | | | | | | | | | | | | | | | | | | | | | | |
| Net investment income (loss) | | | | 0.35 | | | | | 0.38 | | | | | 0.40 | | | | | 0.48 | | | | | 0.39 | | | |
| Net realized and unrealized gain (loss) on investment and foreign currency transactions | | | | (2.55 | ) | | | | 0.25 | | | | | (0.54 | ) | | | | 0.69 | | | | | (1.05 | ) | | |
Total from investment operations | | | | (2.20 | ) | | | | 0.63 | | | | | (0.14 | ) | | | | 1.17 | | | | | (0.66 | ) | | |
Less Dividends and Distributions: | | | | | | | | | | | | | | | | | | | | | | | | | | | |
Dividends from net investment income | | | | (0.46 | ) | | | | (0.44 | ) | | | | (0.50 | ) | | | | (0.54 | ) | | | | (0.45 | ) | | |
Tax return of capital distributions | | | | - | | | | | - | | | | | - | | | | | - | | | | | (0.01 | ) | | |
Total dividends and distributions | | | | (0.46 | ) | | | | (0.44 | ) | | | | (0.50 | ) | | | | (0.54 | ) | | | | (0.46 | ) | | |
Net asset value, end of period | | | | $6.40 | | | | | $9.06 | | | | | $8.87 | | | | | $9.51 | | | | | $8.88 | | | |
Total Return(c): | | | | (25.01 | )% | | | | 7.11 | % | | | | (1.43 | )% | | | | 13.51 | % | | | | (6.79 | )% | | |
| | | | | | | | | | | | | | | | | | | | | | | | | | | |
Ratios/Supplemental Data: | | | | | | | | | | | | | | | | | | | | | | | | | | | |
Net assets, end of period (000) | | | | $10,670 | | | | | $18,069 | | | | | $18,982 | | | | | $5,782 | | | | | $2,234 | | | |
Average net assets (000) | | | | $14,687 | | | | | $25,561 | | | | | $10,951 | | | | | $3,498 | | | | | $766 | | | |
Ratios to average net assets(d): | | | | | | | | | | | | | | | | | | | | | | | | | | | |
Expenses after waivers and/or expense reimbursement | | | | 0.75 | % | | | | 0.75 | % | | | | 0.75 | % | | | | 0.80 | % | | | | 0.80 | %(e) | | |
Expenses before waivers and/or expense reimbursement | | | | 1.06 | % | | | | 1.07 | % | | | | 1.53 | % | | | | 2.41 | % | | | | 6.65 | %(e) | | |
Net investment income (loss) | | | | 4.54 | % | | | | 4.12 | % | | | | 4.45 | % | | | | 5.12 | % | | | | 4.83 | %(e) | | |
Portfolio turnover rate(f) | | | | 20 | % | | | | 20 | % | | | | 23 | % | | | | 33 | % | | | | 17 | % | | |
| (a) | Commencement of operations. |
| (b) | Calculated based on average shares outstanding during the period. |
| (c) | Total return is calculated assuming a purchase of a share on the first day and a sale on the last day of each period reported and includes reinvestment of dividends and distributions, if any. Total returns may reflect adjustments to conform to GAAP. Total returns for periods less than one full year are not annualized. |
| (d) | Does not include expenses of the underlying funds in which the Fund invests. |
| (f) | The Fund’s portfolio turnover rate is calculated in accordance with regulatory requirements, without regard to transactions involving short-term investments, certain derivatives and in-kind transactions (if any). If such transactions were included, the Fund’s portfolio turnover rate may be higher. |
See Notes to Financial Statements.
64
| | | | | | | | | | | | | | | | | | | | | | | | | | | |
| | | | | | | |
Class R6 Shares | | | | | | | | | | | | | | | | | | | | | | | | | | | |
| | | Year Ended October 31, | | December 12, 2017(a) through October 31, | | |
| | | |
| | | 2022 | | 2021 | | 2020 | | 2019 | | 2018 | | |
| | | | | | | |
Per Share Operating Performance(b): | | | | | | | | | | | | | | | | | | | | | | | | | | | |
Net Asset Value, Beginning of Period | | | | $9.06 | | | | | $8.86 | | | | | $9.51 | | | | | $8.88 | | | | | $10.00 | | | |
Income (loss)from investment operations: | | | | | | | | | | | | | | | | | | | | | | | | | | | |
| Net investment income (loss) | | | | 0.36 | | | | | 0.39 | | | | | 0.43 | | | | | 0.49 | | | | | 0.40 | | | |
| Net realized and unrealized gain (loss) on investment and foreign currency transactions | | | | (2.56 | ) | | | | 0.26 | | | | | (0.57 | ) | | | | 0.69 | | | | | (1.06 | ) | | |
Total from investment operations | | | | (2.20 | ) | | | | 0.65 | | | | | (0.14 | ) | | | | 1.18 | | | | | (0.66 | ) | | |
Less Dividends and Distributions: | | | | | | | | | | | | | | | | | | | | | | | | | | | |
Dividends from net investment income | | | | (0.46 | ) | | | | (0.45 | ) | | | | (0.51 | ) | | | | (0.55 | ) | | | | (0.45 | ) | | |
Tax return of capital distributions | | | | - | | | | | - | | | | | - | | | | | - | | | | | (0.01 | ) | | |
Total dividends and distributions | | | | (0.46 | ) | | | | (0.45 | ) | | | | (0.51 | ) | | | | (0.55 | ) | | | | (0.46 | ) | | |
Net asset value, end of period | | | | $6.40 | | | | | $9.06 | | | | | $8.86 | | | | | $9.51 | | | | | $8.88 | | | |
Total Return(c): | | | | (24.94 | )% | | | | 7.34 | % | | | | (1.44 | )% | | | | 13.58 | % | | | | (6.72 | )% | | |
| | | | | | | | | | | | | | | | | | | | | | | | | | | |
Ratios/Supplemental Data: | | | | | | | | | | | | | | | | | | | | | | | | | | | |
Net assets, end of period (000) | | | | $129,233 | | | | | $136,285 | | | | | $97,771 | | | | | $26,493 | | | | | $23,333 | | | |
Average net assets (000) | | | | $137,772 | | | | | $107,966 | | | | | $30,037 | | | | | $25,144 | | | | | $24,014 | | | |
Ratios to average net assets(d): | | | | | | | | | | | | | | | | | | | | | | | | | | | |
Expenses after waivers and/or expense reimbursement | | | | 0.65 | % | | | | 0.65 | % | | | | 0.66 | % | | | | 0.74 | % | | | | 0.74 | %(e) | | |
Expenses before waivers and/or expense reimbursement | | | | 0.78 | % | | | | 0.81 | % | | | | 1.16 | % | | | | 1.49 | % | | | | 1.76 | %(e) | | |
Net investment income (loss) | | | | 4.73 | % | | | | 4.24 | % | | | | 4.69 | % | | | | 5.27 | % | | | | 4.82 | %(e) | | |
Portfolio turnover rate(f) | | | | 20 | % | | | | 20 | % | | | | 23 | % | | | | 33 | % | | | | 17 | % | | |
| (a) | Commencement of operations. |
| (b) | Calculated based on average shares outstanding during the period. |
| (c) | Total return is calculated assuming a purchase of a share on the first day and a sale on the last day of each period reported and includes reinvestment of dividends and distributions, if any. Total returns may reflect adjustments to conform to GAAP. Total returns for periods less than one full year are not annualized. |
| (d) | Does not include expenses of the underlying funds in which the Fund invests. |
| (f) | The Fund’s portfolio turnover rate is calculated in accordance with regulatory requirements, without regard to transactions involving short-term investments, certain derivatives and in-kind transactions (if any). If such transactions were included, the Fund’s portfolio turnover rate may be higher. |
See Notes to Financial Statements.
PGIM Emerging Markets Debt Hard Currency Fund 65
Notes to Financial Statements
Prudential World Fund, Inc. (the “Registered Investment Company” or “RIC”) is registered under the Investment Company Act of 1940, as amended (“1940 Act”), as an open-end management investment company. The RIC is organized as a Maryland Corporation. These financial statements relate only to the PGIM Emerging Markets Debt Hard Currency Fund (the “Fund”), a series of the RIC. The Fund is classified as a diversified fund for purposes of the 1940 Act.
The investment objective of the Fund is total return, through a combination of current income and capital appreciation.
The Fund follows the investment company accounting and reporting guidance of the Financial Accounting Standards Board (“FASB”) Accounting Standard Codification (“ASC”) Topic 946 Financial Services — Investment Companies. The following is a summary of significant accounting policies followed by the Fund in the preparation of its financial statements. The policies conform to U.S. generally accepted accounting principles (“GAAP”). The Fund consistently follows such policies in the preparation of its financial statements.
Securities Valuation: The Fund holds securities and other assets and liabilities that are fair valued as of the close of each day (generally, 4:00 PM Eastern time) the New York Stock Exchange (“NYSE”) is open for trading. As described in further detail below, the Fund’s investments are valued daily based on a number of factors, including the type of investment and whether market quotations are readily available. The Board of Directors (the “Board”) has approved the Fund’s valuation policies and procedures for security valuation and designated to PGIM Investments LLC (“PGIM Investments” or the “Manager”) as the Valuation Designee pursuant to SEC Rule 2a-5(b) to perform the fair value determination relating to all Fund investments. Pursuant to the Board’s oversight, the Valuation Designee has established a Valuation Committee to perform the duties and responsibilities as valuation designee under SEC Rule 2a-5. The valuation procedures permit the Fund to utilize independent pricing vendor services, quotations from market makers, and alternative valuation methods when market quotations are either not readily available or not deemed representative of fair value. Fair value is the price that would be received to sell an asset or paid to transfer a liability in an orderly transaction between market participants on the measurement date. A record of the Valuation Committee’s actions is provided to the Board at the first quarterly meeting following the quarter in which such actions take place.
For the fiscal reporting year-end, securities and other assets and liabilities were fair valued at the close of the last U.S. business day. Trading in certain foreign securities may occur when
66
the NYSE is closed (including weekends and holidays). Because such foreign securities trade in markets that are open on weekends and U.S. holidays, the values of some of the Fund’s foreign investments may change on days when investors cannot purchase or redeem Fund shares.
Various inputs determine how the Fund’s investments are valued, all of which are categorized according to the three broad levels (Level 1, 2, or 3) detailed in the Schedule of Investments and referred to herein as the “fair value hierarchy” in accordance with FASB ASC Topic 820 - Fair Value Measurement.
Common or preferred stocks, exchange-traded funds and derivative instruments, if applicable, that are traded on a national securities exchange are valued at the last sale price as of the close of trading on the applicable exchange where the security principally trades. Securities traded via NASDAQ are valued at the NASDAQ official closing price. To the extent these securities are valued at the last sale price or NASDAQ official closing price, they are classified as Level 1 in the fair value hierarchy. In the event that no sale or official closing price on valuation date exists, these securities are generally valued at the mean between the last reported bid and ask prices, or at the last bid price in the absence of an ask price. These securities are classified as Level 2 in the fair value hierarchy.
Investments in open-end funds (other than exchange-traded funds) are valued at their net asset values as of the close of the NYSE on the date of valuation. These securities are classified as Level 1 in the fair value hierarchy since they may be purchased or sold at their net asset values on the date of valuation.
Fixed income securities traded in the OTC market are generally classified as Level 2 in the fair value hierarchy. Such fixed income securities are typically valued using the market approach which generally involves obtaining data from an approved independent third-party vendor source. The Fund utilizes the market approach as the primary method to value securities when market prices of identical or comparable instruments are available. The third-party vendors’ valuation techniques used to derive the evaluated bid price are based on evaluating observable inputs, including but not limited to, yield curves, yield spreads, credit ratings, deal terms, tranche level attributes, default rates, cash flows, prepayment speeds, broker/dealer quotations and reported trades. Certain Level 3 securities are also valued using the market approach when obtaining a single broker quote or when utilizing transaction prices for identical securities that have been used in excess of five business days. During the reporting period, there were no changes to report with respect to the valuation approach and/or valuation techniques discussed above.
OTC and centrally cleared derivative instruments are generally classified as Level 2 in the fair value hierarchy. Such derivative instruments are typically valued using the market approach and/or income approach which generally involves obtaining data from an approved independent third-party vendor source. The Fund utilizes the market approach when quoted prices in broker-dealer markets are available but also includes consideration of alternative valuation approaches, including the income approach. In the absence of reliable
PGIM Emerging Markets Debt Hard Currency Fund 67
Notes to Financial Statements (continued)
market quotations, the income approach is typically utilized for purposes of valuing derivatives such as interest rate swaps based on a discounted cash flow analysis whereby the value of the instrument is equal to the present value of its future cash inflows or outflows. Such analysis includes projecting future cash flows and determining the discount rate (including the present value factors that affect the discount rate) used to discount the future cash flows. In addition, the third-party vendors’ valuation techniques used to derive the evaluated derivative price is based on evaluating observable inputs, including but not limited to, underlying asset prices, indices, spreads, interest rates and exchange rates. Certain derivatives may be classified as Level 3 when valued using the market approach by obtaining a single broker quote or when utilizing unobservable inputs in the income approach. During the reporting period, there were no changes to report with respect to the valuation approach and/or valuation techniques discussed above.
Securities and other assets that cannot be priced according to the methods described above are valued based on policies and procedures approved by the Board. In the event that unobservable inputs are used when determining such valuations, the securities will be classified as Level 3 in the fair value hierarchy. Altering one or more unobservable inputs may result in a significant change to a Level 3 security’s fair value measurement.
When determining the fair value of securities, some of the factors influencing the valuation include: the nature of any restrictions on disposition of the securities; assessment of the general liquidity of the securities; the issuer’s financial condition and the markets in which it does business; the cost of the investment; the size of the holding and the capitalization of the issuer; the prices of any recent transactions or bids/offers for such securities or any comparable securities; any available analyst media or other reports or information deemed reliable by the Valuation Designee regarding the issuer or the markets or industry in which it operates. Using fair value to price securities may result in a value that is different from a security’s most recent closing price and from the price used by other unaffiliated mutual funds to calculate their net asset values.
Foreign Currency Translation: The books and records of the Fund are maintained in U.S. dollars. Foreign currency amounts are translated into U.S. dollars on the following basis:
(i) market value of investment securities, other assets and liabilities — at the exchange rate as of the valuation date;
(ii) purchases and sales of investment securities, income and expenses — at the rates of exchange prevailing on the respective dates of such transactions.
Although the net assets of the Fund are presented at the foreign exchange rates and market values at the close of the period, the Fund does not generally isolate that portion of the
68
results of operations arising as a result of changes in the foreign exchange rates from the fluctuations arising from changes in the market prices of long-term portfolio securities held at the end of the period. Similarly, the Fund does not isolate the effect of changes in foreign exchange rates from the fluctuations arising from changes in the market prices of long-term portfolio securities sold during the period. Accordingly, holding period unrealized and realized foreign currency gains (losses) are included in the reported net change in unrealized appreciation (depreciation) on investments and net realized gains (losses) on investment transactions on the Statements of Operations. Notwithstanding the above, the Fund does isolate the effect of fluctuations in foreign currency exchange rates when determining the gain (loss) upon the sale or maturity of foreign currency denominated debt obligations; such amounts are included in net
Additionally, net realized gains (losses) on foreign currency transactions represent net foreign exchange gains (losses) from the disposition of holdings of foreign currencies, currency gains (losses) realized between the trade and settlement dates on investment transactions, and the difference between the amounts of interest, dividends and foreign withholding taxes recorded on the Fund’s books and the U.S. dollar equivalent amounts actually received or paid. Net unrealized currency gains (losses) arise from valuing foreign currency denominated assets and liabilities (other than investments) at period end exchange rates.
Forward and Cross Currency Contracts: A forward currency contract is a commitment to purchase or sell a foreign currency at a future date at a negotiated forward rate. The Fund enters into forward currency contracts, as defined in the prospectus, in order to hedge its exposure to changes in foreign currency exchange rates on its foreign portfolio holdings or on specific receivables and payables denominated in a foreign currency and to gain exposure to certain currencies. The contracts are valued daily at current forward exchange rates and any unrealized gain (loss) is included in net unrealized appreciation or depreciation on forward and cross currency contracts. Gain (loss) is realized on the settlement date of the contract equal to the difference between the settlement value of the original and negotiated forward contracts. This gain (loss), if any, is included in net realized gain (loss) on forward and cross currency contract transactions. Risks may arise upon entering into these contracts from the potential inability of the counterparties to meet the terms of their contracts. Forward currency contracts involve risks from currency exchange rate and credit risk in excess of the amounts reflected on the Statement of Assets and Liabilities. The Fund’s maximum risk of loss from counterparty credit risk is the net value of the cash flows to be received from the counterparty at the end of the contract’s life. A cross currency contract is a forward contract where a specified amount of one foreign currency will be exchanged for a specified amount of another foreign currency.
Options: The Fund purchased and/or wrote options in order to hedge against adverse market movements or fluctuations in value caused by changes in prevailing interest rates, value of equities or foreign currency exchange rates with respect to securities or financial instruments which the Fund currently owns or intends to purchase. The Fund may also use options to gain additional market exposure. The Fund’s principal reason for writing options is
PGIM Emerging Markets Debt Hard Currency Fund 69
Notes to Financial Statements (continued)
to realize, through receipt of premiums, a greater current return than would be realized on the underlying security alone. When the Fund purchases an option, it pays a premium and an amount equal to that premium is recorded as an asset. When the Fund writes an option, it receives a premium and an amount equal to that premium is recorded as a liability. The asset or liability is adjusted daily to reflect the current market value of the option. If an option expires unexercised, the Fund realizes a gain (loss) to the extent of the premium received or paid. If an option is exercised, the premium received or paid is recorded as an adjustment to the proceeds from the sale or the cost of the purchase in determining whether the Fund has realized a gain (loss). The difference between the premium and the amount received or paid at the closing of a purchase or sale transaction is also treated as a realized gain (loss). Gain (loss) on purchased options is included in net realized gain (loss) on investment transactions. Gain (loss) on written options is presented separately as net realized gain (loss) on options written transactions.
The Fund, as writer of an option, may have no control over whether the underlying securities or financial instruments may be sold (called) or purchased (put). As a result, the Fund bears the market risk of an unfavorable change in the price of the security or financial instrument underlying the written option. The Fund, as purchaser of an OTC option, bears the risk of the potential inability of the counterparties to meet the terms of their contracts. With exchange-traded options contracts, there is minimal counterparty credit risk to the Fund since the exchanges’ clearinghouse acts as counterparty to all exchange-traded options and guarantees the options contracts against default.
When the Fund writes an option on a swap, an amount equal to any premium received by the Fund is recorded as a liability and is subsequently adjusted to the current market value of the written option on the swap. If a call option on a swap is exercised, the Fund becomes obligated to pay a fixed interest rate (noted as the strike price) and receive a variable interest rate on a notional amount. If a put option on a swap is exercised, the Fund becomes obligated to pay a variable interest rate and receive a fixed interest rate (noted as the strike price) on a notional amount. Premiums received from writing options on swaps that expire or are exercised are treated as realized gains upon the expiration or exercise of such options on swaps. The risk associated with writing put and call options on swaps is that the Fund will be obligated to be party to a swap agreement if an option on a swap is exercised.
Financial Futures Contracts: A financial futures contract is an agreement to purchase (long) or sell (short) an agreed amount of securities at a set price for delivery on a future date. Upon entering into a financial futures contract, the Fund is required to pledge to the broker an amount of cash and/or other assets equal to a certain percentage of the contract amount. This amount is known as the “initial margin.” Subsequent payments, known as “variation margin,” are made or received by the Fund each day, depending on the daily fluctuations in the value of the underlying security. Such variation margin is recorded for financial
70
statement purposes on a daily basis as unrealized gain (loss). When the contract expires or is closed, the gain (loss) is realized and is presented in the Statement of Operations as net realized gain (loss) on futures transactions.
The Fund invested in financial futures contracts in order to hedge its existing portfolio securities, or securities the Fund intends to purchase, against fluctuations in value caused by changes in prevailing interest rates. Should interest rates move unexpectedly, the Fund may not achieve the anticipated benefits of the financial futures contracts and may realize a loss. The use of futures transactions involves the risk of imperfect correlation in movements in the price of futures contracts, interest rates and the underlying hedged assets. Since futures contracts are exchange-traded, there is minimal counterparty credit risk to the Fund since the exchanges’ clearinghouse acts as counterparty to all exchange-traded futures and guarantees the futures contracts against default.
Swap Agreements: The Fund entered into certain types of swap agreements detailed in the disclosures below. A swap agreement is an agreement to exchange the return generated by one instrument for the return generated by another instrument. Swap agreements are negotiated in the OTC market and may be executed either directly with a counterparty (“OTC-traded”) or through a central clearing facility, such as a registered exchange. Swap agreements are valued daily at current market value and any change in value is included in the net unrealized appreciation or depreciation on swap agreements. Centrally cleared swaps pay or receive an amount known as “variation margin”, based on daily changes in the valuation of the swap contract. For OTC-traded, upfront premiums paid and received are shown as swap premiums paid and swap premiums received in the Statement of Assets and Liabilities. Risk of loss may exceed amounts recognized on the Statement of Assets and Liabilities. Swap agreements outstanding at period end, if any, are listed on the Schedule of Investments.
Interest Rate Swaps: Interest rate swaps represent an agreement between counterparties to exchange cash flows based on the difference between two interest rates, applied to a notional principal amount for a specified period. The Fund is subject to interest rate risk exposure in the normal course of pursuing its investment objective. The Fund used interest rate swaps to maintain its ability to generate steady cash flow by receiving a stream of fixed rate payments or to increase exposure to prevailing market rates by receiving floating rate payments. The Fund’s maximum risk of loss from counterparty credit risk is the discounted net present value of the cash flows to be received from the counterparty over the contract’s remaining life.
Credit Default Swaps (“CDS”): CDS involve one party (the protection buyer) making a stream of payments to another party (the protection seller) in exchange for the right to receive a specified payment in the event of a default or as a result of a default (collectively a “credit event”) for the referenced entity (typically corporate issues or sovereign issues of an emerging country) on its obligation; or in the event of a write-down, principal shortfall, interest shortfall or default of all or part of the referenced entities comprising a credit index.
PGIM Emerging Markets Debt Hard Currency Fund 71
Notes to Financial Statements (continued)
The Fund is subject to credit risk in the normal course of pursuing its investment objectives, and as such, has entered into CDS contracts to provide a measure of protection against defaults or to take an active long or short position with respect to the likelihood of a particular issuer’s default or the reference entity’s credit soundness. CDS contracts generally trade based on a spread which represents the cost a protection buyer has to pay the protection seller. The protection buyer is said to be short the credit as the value of the contract rises the more the credit deteriorates. The value of the CDS contract increases for the protection buyer if the spread increases. The Fund’s maximum risk of loss from counterparty credit risk for purchased CDS is the inability of the counterparty to honor the contract up to the notional value due to a credit event.
As a seller of protection on credit default swap agreements, the Fund generally receives an agreed upon payment from the buyer of protection throughout the term of the swap, provided no credit event occurs. As the seller, the Fund effectively increases its investment risk because, in addition to its total net assets, the Fund may be subject to investment exposure on the notional amount of the swap.
The maximum amount of the payment that the Fund, as a seller of protection, could be required to make under a credit default swap agreement would be equal to the notional amount of the underlying security or index contract as a result of a credit event. This potential amount will be partially offset by any recovery values of the respective referenced obligations, or net amounts received from the settlement of buy protection credit default swap agreements which the Fund entered into for the same referenced entity or index. As a buyer of protection, the Fund generally receives an amount up to the notional value of the swap if a credit event occurs.
Implied credit spreads, represented in absolute terms, utilized in determining the market value of credit default swap agreements where the Fund is the seller of protection as of period end are disclosed in the footnotes to the Schedule of Investments, if applicable. These spreads serve as indicators of the current status of the payment/performance risk and represent the likelihood of default risk for the credit derivative. The implied credit spread of a particular referenced entity reflects the cost of buying/selling protection and may include upfront payments required to enter into the agreement. Wider credit spreads and increased market value in absolute terms, when compared to the notional amount of the swap, represent a deterioration of the referenced entity’s credit soundness and a greater likelihood of risk of default or other credit event occurring as defined under the terms of the agreement.
Master Netting Arrangements: The RIC, on behalf of the Fund, is subject to various Master Agreements, or netting arrangements, with select counterparties. These are agreements which a subadviser may have negotiated and entered into on behalf of all or a portion of the
72
Fund. A master netting arrangement between the Fund and the counterparty permits the Fund to offset amounts payable by the Fund to the same counterparty against amounts to be received; and by the receipt of collateral from the counterparty by the Fund to cover the Fund’s exposure to the counterparty. However, there is no assurance that such mitigating factors are easily enforceable. In addition to master netting arrangements, the right to set-off exists when all the conditions are met such that each of the parties owes the other determinable amounts, the reporting party has the right to set-off the amount owed with the amount owed by the other party, the reporting party intends to set-off and the right of set-off is enforceable by law.
The RIC, on behalf of the Fund, is a party to International Swaps and Derivatives Association, Inc. (“ISDA”) Master Agreements with certain counterparties that govern OTC derivative and foreign exchange contracts entered into from time to time. The Master Agreements may contain provisions regarding, among other things, the parties’ general obligations, representations, agreements, collateral requirements, events of default and early termination. With respect to certain counterparties, in accordance with the terms of the Master Agreements, collateral posted to the Fund is held in a segregated account by the Fund’s custodian and with respect to those amounts which can be sold or re-pledged, is presented in the Schedule of Investments. Collateral pledged by the Fund is segregated by the Fund’s custodian and identified in the Schedule of Investments. Collateral can be in the form of cash or debt securities issued by the U.S. Government or related agencies or other securities as agreed to by the Fund and the applicable counterparty. Collateral requirements are determined based on the Fund’s net position with each counterparty. Termination events applicable to the Fund may occur upon a decline in the Fund’s net assets below a specified threshold over a certain period of time. Termination events applicable to counterparties may occur upon a decline in the counterparty’s long-term and short-term credit ratings below a specified level. In each case, upon occurrence, the other party may elect to terminate early and cause settlement of all derivative and foreign exchange contracts outstanding, including the payment of any losses and costs resulting from such early termination, as reasonably determined by the terminating party. Any decision by one or more of the Fund’s counterparties to elect early termination could impact the Fund’s future derivative activity.
In addition to each instrument’s primary underlying risk exposure (e.g. interest rate, credit, equity or foreign exchange, etc.), swap agreements involve, to varying degrees, elements of credit, market and documentation risk. Such risks involve the possibility that no liquid market for these agreements will exist, the counterparty to the agreement may default on its obligation to perform or disagree on the contractual terms of the agreement, and changes in net interest rates will be unfavorable. In connection with these agreements, securities in the portfolio may be identified or received as collateral from the counterparty in accordance with the terms of the respective swap agreements to provide or receive assets of value and to serve as recourse in the event of default or bankruptcy/insolvency of either party. Such OTC derivative agreements include conditions which, when materialized, give the counterparty the right to cause an early termination of the transactions under those agreements. Any election by the counterparty for early termination of the contract(s) may impact the amounts reported on financial statements.
PGIM Emerging Markets Debt Hard Currency Fund 73
Notes to Financial Statements (continued)
Short sales and OTC contracts, including forward foreign currency exchange contracts, swaps, forward rate agreements and written options involve elements of both market and credit risk in excess of the amounts reflected on the Statement of Assets and Liabilities, if applicable. Such risks may be mitigated by engaging in master netting arrangements.
Payment-In-Kind: The Fund invested in the open market or received pursuant to debt restructuring, securities that pay-in-kind (PIK) the interest due on such debt instruments. The PIK interest, computed at the contractual rate specified, is added to the existing principal balance of the debt when issued bonds have same terms as the bond or recorded as a separate bond when terms are different from the existing debt, and is recorded as interest income.
Securities Lending: The Fund lends its portfolio securities to banks and broker-dealers. The loans are secured by collateral at least equal to the market value of the securities loaned. Collateral pledged by each borrower is invested in an affiliated money market fund and is marked to market daily, based on the previous day’s market value, such that the value of the collateral exceeds the value of the loaned securities. In the event of significant appreciation in value of securities on loan on the last business day of the reporting period, the financial statements may reflect a collateral value that is less than the market value of the loaned securities. Such shortfall is remedied as described above. Loans are subject to termination at the option of the borrower or the Fund. Upon termination of the loan, the borrower will return to the Fund securities identical to the loaned securities. The remaining open loans of the securities lending transactions are considered overnight and continuous. Should the borrower of the securities fail financially, the Fund has the right to repurchase the securities in the open market using the collateral.
The Fund recognizes income, net of any rebate and securities lending agent fees, for lending its securities in the form of fees or interest on the investment of any cash received as collateral. The borrower receives all interest and dividends from the securities loaned and such payments are passed back to the lender in amounts equivalent thereto, which are reflected in interest income or unaffiliated dividend income based on the nature of the payment on the Statement of Operations. The Fund also continues to recognize any unrealized gain (loss) in the market price of the securities loaned and on the change in the value of the collateral invested that may occur during the term of the loan. In addition, realized gain (loss) is recognized on changes in the value of the collateral invested upon liquidation of the collateral. Net earnings from securities lending are disclosed in the Statement of Operations.
Securities Transactions and Net Investment Income: Securities transactions are recorded on the trade date. Realized gains (losses)from investment and currency transactions are calculated on the specific identification method. Dividend income is recorded on the
74
ex-date, or for certain foreign securities, when the Fund becomes aware of such dividends. Interest income, including amortization of premium and accretion of discount on debt securities, as required, is recorded on the accrual basis. Expenses are recorded on an accrual basis, which may require the use of certain estimates by management that may differ from actual. Net investment income or loss (other than class specific expenses and waivers, which are allocated as noted below) and unrealized and realized gains (losses) are allocated daily to each class of shares based upon the relative proportion of adjusted net assets of each class at the beginning of the day. Class specific expenses and waivers, where applicable, are charged to the respective share classes. Such class specific expenses and waivers include distribution fees and distribution fee waivers, shareholder servicing fees, transfer agent’s fees and expenses, registration fees and fee waivers and/or expense reimbursements, as applicable.
Taxes: It is the Fund’s policy to continue to meet the requirements of the Internal Revenue Code applicable to regulated investment companies and to distribute all of its taxable net investment income and capital gains, if any, to its shareholders. Therefore, no federal income tax provision is required. Withholding taxes on foreign dividends, interest and capital gains, if any, are recorded, net of reclaimable amounts, at the time the related income is earned.
Dividends and Distributions: Dividends and distributions to shareholders, which are determined in accordance with federal income tax regulations and which may differ from GAAP, are recorded on the ex-date. Permanent book/tax differences relating to income and gain (loss) are reclassified between total distributable earnings (loss) and paid-in capital in excess of par, as appropriate. The chart below sets forth the expected frequency of dividend and capital gains distributions to shareholders. Various factors may impact the frequency of dividend distributions to shareholders, including but not limited to adverse market conditions or portfolio holding-specific events.
| | |
| | |
| Expected Distribution Schedule to Shareholders* | | Frequency |
Net Investment Income | | Monthly |
Short-Term Capital Gains | | Annually |
Long-Term Capital Gains | | Annually |
| * | Under certain circumstances, the Fund may make more than one distribution of short-term and/or long-term capital gains during a fiscal year. |
Estimates: The preparation of financial statements requires management to make estimates and assumptions that affect the reported amounts and disclosures in the financial statements. Actual results could differ from those estimates.
PGIM Emerging Markets Debt Hard Currency Fund 75
Notes to Financial Statements (continued)
The RIC, on behalf of the Fund, has a management agreement with the Manager pursuant to which it has responsibility for all investment advisory services and supervises the subadviser’s performance of such services, and pursuant to which it renders administrative services.
The Manager has entered into a subadvisory agreement with PGIM, Inc., which provides subadvisory services to the Fund through its business unit PGIM Fixed Income, and PGIM Limited (collectively the “subadviser”). The Manager pays for the services of the subadviser.
Fees payable under the management agreement are computed daily and paid monthly. For the reporting period ended October 31, 2022, the contractual and effective management fee rates were as follows:
| | | | |
| | |
| Contractual Management Rate | | Effective Management Fee, before any waivers
and/or expense reimbursements | |
0.650% on average daily net assets up to $1 billion; | | | 0.65% | |
0.630% on average daily net assets from $1 billion to $3 billion; | | | | |
0.610% on average daily net assets from $3 billion to $5 billion; | | | | |
0.600% on average daily net assets from $5 billion to $10 billion; | | | | |
0.590% on average daily net assets over $10 billion. | | | | |
The Manager has contractually agreed, through February 29, 2024, to limit total annual operating expenses after fee waivers and/or expense reimbursements. This contractual waiver excludes interest, brokerage, taxes (such as income and foreign withholding taxes, stamp duty and deferred tax expenses), acquired fund fees and expenses, extraordinary expenses, and certain other Fund expenses such as dividend and interest expense and broker charges on short sales.
Where applicable, the Manager agrees to waive management fees or shared operating expenses on any share class to the same extent that it waives such expenses on any other share class. In addition, total annual operating expenses for Class R6 shares will not exceed total annual operating expenses for Class Z shares. Fees and/or expenses waived and/or reimbursed by the Manager for the purpose of preventing the expenses from exceeding a certain expense ratio limit may be recouped by the Manager within the same fiscal year during which such waiver and/or reimbursement is made if such recoupment can be
76
realized without exceeding the expense limit in effect at the time of the recoupment for that fiscal year. The expense limitations attributable to each class are as follows:
| | | | |
| Class | | Expense
Limitations |
A | | | 1.05 | % |
C | | | 1.80 | |
Z | | | 0.75 | |
R6 | | | 0.65 | |
The RIC, on behalf of the Fund, has a distribution agreement with Prudential Investment Management Services LLC (“PIMS”), which acts as the distributor of the Class A, Class C, Class Z and Class R6 shares of the Fund. The Fund compensates PIMS for distributing and servicing the Fund’s Class A and Class C shares, pursuant to the plans of distribution (the “Distribution Plans”),regardless of expenses actually incurred by PIMS.
Pursuant to the Distribution Plans, the Fund compensates PIMS for distribution related activities at an annual rate based on average daily net assets per class. The distribution fees are accrued daily and payable monthly.
The Fund’s annual gross and net distribution rate, where applicable, are as follows:
| | | | | | | | |
| | | |
| Class | | Gross Distribution Fee | | Net Distribution Fee |
| | |
A | | | 0.25 | % | | | 0.25 | % |
| | |
C | | | 1.00 | | | | 1.00 | |
| | |
Z | | | N/A | | | | N/A | |
| | |
R6 | | | N/A | | | | N/A | |
For the year ended October 31, 2022, PIMS has not received any front-end sales charges (“FESL”) resulting from sales of certain class shares. Additionally, for the year ended October 31, 2022, PIMS did not receive any contingent deferred sales charges (“CDSC”) imposed upon redemptions by certain Class A and Class C shareholders.
PGIM Investments, PGIM, Inc., PGIM Limited and PIMS are indirect, wholly-owned subsidiaries of Prudential Financial, Inc. (“Prudential”).
| 4. | Other Transactions with Affiliates |
Prudential Mutual Fund Services LLC (“PMFS”), an affiliate of PGIM Investments and an indirect, wholly-owned subsidiary of Prudential, serves as the Fund’s transfer agent and shareholder servicing agent. Transfer agent’s fees and expenses in the Statement of Operations include certain out-of-pocket expenses paid to non-affiliates, where applicable.
The Fund may invest its overnight sweep cash in the PGIM Core Ultra Short Bond Fund (the “Core Fund”), and its securities lending cash collateral in the PGIM Institutional Money Market Fund (the “Money Market Fund”), each a fund of Prudential Investment Portfolios 2, registered under the 1940 Act and managed by PGIM Investments. PGIM Investments
PGIM Emerging Markets Debt Hard Currency Fund 77
Notes to Financial Statements (continued)
and/or its affiliates are paid fees or reimbursed for providing their services to the Core Fund and the Money Market Fund. In addition to the realized and unrealized gains on investments in the Core Fund and Money Market Fund, earnings from such investments are disclosed on the Statement of Operations as “Affiliated dividend income” and “Income from securities lending, net”, respectively. Effective January 2022, the Fund changed its overnight cash sweep vehicle from the Core Fund to an unaffiliated money market fund.
The Fund may enter into certain securities purchase or sale transactions under Board approved Rule 17a-7 procedures. Rule 17a-7 is an exemptive rule under the 1940 Act, that subject to certain conditions, permits purchase and sale transactions among affiliated investment companies, or between an investment company and a person that is affiliated solely by reason of having a common (or affiliated) investment adviser, common directors/trustees, and/or common officers. For the year ended October 31, 2022,no 17a-7 transactions were entered into by the Fund.
The aggregate cost of purchases and proceeds from sales of portfolio securities (excluding short-term investments and U.S. Government securities) for the reporting period ended October 31, 2022, were as follows:
| | |
| | |
| Cost of Purchases | | Proceeds from Sales |
$66,644,490 | | $23,582,886 |
A summary of the cost of purchases and proceeds from sales of shares of an affiliated mutual fund for the year ended October 31, 2022, is presented as follows:
| | | | | | | | | | | | | | | | | | | | |
| | | | | | | | |
Value,
Beginning
of Year | | Cost of
Purchases | | | Proceeds from Sales | | | Change in
Unrealized
Gain
(Loss) | | Realized
Gain
(Loss) | | | Value,
End of Year | | Shares,
End of Year | | Income |
|
| Short-Term Investments - Affiliated Mutual Funds: |
|
| | | | | |
PGIM Core Ultra Short Bond Fund(1)(wa) | | | | | | | | | | | | | |
|
$12,463,160 | | | $ 8,881,786 | | | | $21,344,946 | | | $ — | | | $ — | | | $ — | | — | | $1,958 |
|
|
PGIM Institutional Money Market Fund(1)(b)(wa) |
|
— | | | 3,341,125 | | | | 1,593,365 | | | (123) | | | (5) | | | 1,747,632 | | 1,749,206 | | 7,224(2) |
$12,463,160 | | | $12,222,911 | | | | $22,938,311 | | | $(123) | | | $ (5) | | | $1,747,632 | | | | $9,182 |
| (1) | The Fund did not have any capital gain distributions during the reporting period. |
| (2) | The amount, or a portion thereof, represents the affiliated securities lending income shown on the Statement of Operations. |
| (b) | Represents security, or portion thereof, purchased with cash collateral received for securities on loan and includes dividend reinvestment. |
78
| (wa) | PGIM Investments LLC, the manager of the Fund, also serves as manager of the PGIM Core Ultra Short Bond Fund and PGIM Institutional Money Market Fund, if applicable. |
| 6. | Distributions and Tax Information |
Distributions to shareholders, which are determined in accordance with federal income tax regulations and which may differ from GAAP, are recorded on the ex-date.
For the year ended October 31, 2022, the tax character of dividends paid by the Fund was $9,164,820 of ordinary income. For the year ended October 31, 2021, the tax character of dividends paid by the Fund was $6,437,396 of ordinary income.
As of October 31, 2022, the accumulated undistributed earnings on a tax basis was $2,998,285 of ordinary income.
The United States federal income tax basis of the Fund’s investments and the net unrealized depreciation as of October 31, 2022 were as follows:
| | | | | | | | | | | | | | | | | | |
| | | | |
| Tax Basis | | Gross
Unrealized
Appreciation | | Gross
Unrealized
Depreciation | | Net
Unrealized
Depreciation |
| $186,363,103 | | $2,940,976 | | $(51,624,173) | | $(48,683,197) |
The difference between GAAP and tax basis were primarily due to deferred losses on wash sales, amortization of bond premium, foreign currency forwards, defaulted securities and other GAAP to tax differences.
For federal income tax purposes, the Fund had a capital loss carryforward as of October 31, 2022 of approximately $10,803,000 which can be carried forward for an unlimited period. No capital gains distributions are expected to be paid to shareholders until net gains have been realized in excess of such losses.
The Manager has analyzed the Fund’s tax positions taken on federal, state and local income tax returns for all open tax years and has concluded that no provision for income tax is required in the Fund’s financial statements for the current reporting period. Since tax authorities can examine previously filed tax returns, the Fund’s U.S. federal and state tax returns for each of the four fiscal years up to the most recent fiscal year ended October 31, 2022 are subject to such review.
The Fund offers Class A, Class C, Class Z and Class R6 shares. Class A shares are sold with a maximum front-end sales charge of 3.25%. Investors who purchase $500,000 or more of Class A shares and sell those shares within 12 months of purchase are subject to a CDSC of 1% on sales although these purchases are not subject to a front-end sales charge. The Class A CDSC is waived for certain retirement and/or benefit plans. A special exchange
PGIM Emerging Markets Debt Hard Currency Fund 79
Notes to Financial Statements (continued)
privilege is also available for shareholders who qualified to purchase Class A shares at net asset value. Class C shares are sold with a CDSC of 1% on sales made within 12 months of purchase. Class C shares will automatically convert to Class A shares on a monthly basis approximately eight years (ten years prior to January 22, 2021) after purchase. Class Z and Class R6 shares are not subject to any sales or redemption charges and are available exclusively for sale to a limited group of investors.
Under certain circumstances, an exchange may be made from specified share classes of the Fund to one or more other share classes of the Fund as presented in the table of transactions in shares of common stock, below.
The RIC is authorized to issue 10,225,000,000 shares of common stock, $0.00001 par value per share, 600,000,000 of which are designated as shares of the Fund. The authorized shares of the Fund are currently classified and designated as follows:
| | |
| | |
| Class | | Number of Shares |
A | | 100,000,000 |
C | | 100,000,000 |
Z | | 200,000,000 |
R6 | | 200,000,000 |
As of October 31, 2022, Prudential, through its affiliated entities, including affiliated funds (if applicable), owned shares of the Fund as follows:
| | | | |
| | | |
| Class | | Number of Shares | | Percentage of Outstanding Shares |
A | | 1,292 | | 13.1% |
C | | 1,245 | | 100.0 |
R6 | | 6,277,361 | | 31.1 |
At the reporting period end, the number of shareholders holding greater than 5% of the Fund are as follows:
| | | | |
| | | |
| | | Number of Shareholders | | Percentage of Outstanding Shares |
Affiliated | | 1 | | 28.7% |
Unaffiliated | | 2 | | 64.3 |
80
Transactions in shares of common stock were as follows:
| | | | | | | | |
| | | |
| Share Class | | Shares | | | Amount | |
| | |
Class A | | | | | | | | |
Year ended October 31, 2022: | | | | | | | | |
Shares sold | | | 39,571 | | | $ | 334,658 | |
Shares issued in reinvestment of dividends and distributions | | | 470 | | | | 3,551 | |
Shares purchased | | | (42,921 | ) | | | (352,555 | ) |
Net increase (decrease) in shares outstanding before conversion | | | (2,880 | ) | | | (14,346 | ) |
Shares issued upon conversion from other share class(es) | | | 6,260 | | | | 42,074 | |
Net increase (decrease) in shares outstanding | | | 3,380 | | | $ | 27,728 | |
| | |
Year ended October 31, 2021: | | | | | | | | |
Shares sold | | | 3,166 | | | $ | 28,994 | |
Shares issued in reinvestment of dividends and distributions | | | 228 | | | | 2,106 | |
Shares purchased | | | (63 | ) | | | (581 | ) |
Net increase (decrease) in shares outstanding | | | 3,331 | | | $ | 30,519 | |
| | |
Class C | | | | | | | | |
Year ended October 31, 2022: | | | | | | | | |
Shares issued in reinvestment of dividends and distributions | | | 59 | | | $ | 454 | |
Net increase (decrease) in shares outstanding | | | 59 | | | $ | 454 | |
| | |
Year ended October 31, 2021: | | | | | | | | |
Shares issued in reinvestment of dividends and distributions | | | 43 | | | $ | 395 | |
Net increase (decrease) in shares outstanding | | | 43 | | | $ | 395 | |
| | |
Class Z | | | | | | | | |
Year ended October 31, 2022: | | | | | | | | |
Shares sold | | | 1,071,706 | | | $ | 8,598,237 | |
Shares issued in reinvestment of dividends and distributions | | | 85,119 | | | | 652,230 | |
Shares purchased | | | (1,471,273 | ) | | | (11,268,608 | ) |
Net increase (decrease) in shares outstanding before conversion | | | (314,448 | ) | | | (2,018,141 | ) |
Shares issued upon conversion from other share class(es) | | | 262 | | | | 2,039 | |
Shares purchased upon conversion into other share class(es) | | | (12,660 | ) | | | (96,047 | ) |
Net increase (decrease) in shares outstanding | | | (326,846 | ) | | $ | (2,112,149 | ) |
| | |
Year ended October 31, 2021: | | | | | | | | |
Shares sold | | | 4,468,483 | | | $ | 41,307,258 | |
Shares issued in reinvestment of dividends and distributions | | | 115,282 | | | | 1,064,840 | |
Shares purchased | | | (1,031,335 | ) | | | (9,474,853 | ) |
Net increase (decrease) in shares outstanding before conversion | | | 3,552,430 | | | | 32,897,245 | |
Shares issued upon conversion from other share class(es) | | | 14,250 | | | | 132,076 | |
Shares purchased upon conversion into other share class(es) | | | (3,713,016 | ) | | | (34,383,477 | ) |
Net increase (decrease) in shares outstanding | | | (146,336 | ) | | $ | (1,354,156 | ) |
PGIM Emerging Markets Debt Hard Currency Fund 81
Notes to Financial Statements (continued)
| | | | | | | | |
| | | |
| Share Class | | Shares | | | Amount | |
| | |
Class R6 | | | | | | | | |
Year ended October 31, 2022: | | | | | | | | |
Shares sold | | | 9,368,577 | | | $ | 71,039,946 | |
Shares issued in reinvestment of dividends and distributions | | | 1,101,339 | | | | 8,274,684 | |
Shares purchased | | | (5,324,429 | ) | | | (38,323,398 | ) |
Net increase (decrease) in shares outstanding before conversion | | | 5,145,487 | | | | 40,991,232 | |
Shares issued upon conversion from other share class(es) | | | 6,406 | | | | 53,973 | |
Shares purchased upon conversion into other share class(es) | | | (262 | ) | | | (2,039 | ) |
Net increase (decrease) in shares outstanding | | | 5,151,631 | | | $ | 41,043,166 | |
| | |
Year ended October 31, 2021: | | | | | | | | |
Shares sold | | | 4,369,851 | | | $ | 40,360,478 | |
Shares issued in reinvestment of dividends and distributions | | | 566,570 | | | | 5,224,667 | |
Shares purchased | | | (4,623,318 | ) | | | (42,810,265 | ) |
Net increase (decrease) in shares outstanding before conversion | | | 313,103 | | | | 2,774,880 | |
Shares issued upon conversion from other share class(es) | | | 3,717,030 | | | | 34,383,477 | |
Shares purchased upon conversion into other share class(es) | | | (14,263 | ) | | | (132,076 | ) |
Net increase (decrease) in shares outstanding | | | 4,015,870 | | | $ | 37,026,281 | |
The RIC, on behalf of the Fund, along with other affiliated registered investment companies (the “Participating Funds”), is a party to a Syndicated Credit Agreement (“SCA”) with a group of banks. The purpose of the SCA is to provide an alternative source of temporary funding for capital share redemptions. The table below provides details of the current SCA in effect at the reporting period-end as well as the prior SCA.
| | | | | | |
| | | | |
| | | Current SCA | | | | Prior SCA |
Term of Commitment | | 9/30/2022 - 9/28/2023 | | | | 10/1/2021 – 9/29/2022 |
Total Commitment | | $ 1,200,000,000 | | | | $ 1,200,000,000 |
Annualized Commitment Fee on the Unused Portion of the SCA | | 0.15% | | | | 0.15% |
Annualized Interest Rate on Borrowings | | 1.00% plus the higher of (1) the effective federal funds rate, (2) the daily SOFR rate plus 0.10% or (3) zero percent | | | | 1.20% plus the higher of (1) the effective federal funds rate, (2) the one-month LIBOR rate or (3) zero percent |
Certain affiliated registered investment companies that are parties to the SCA include portfolios that are subject to a predetermined mathematical formula used to manage certain benefit guarantees offered under variable annuity contracts. The formula may result in large scale asset flows into and out of these portfolios. Consequently, these portfolios may be more
82
likely to utilize the SCA for purposes of funding redemptions. It may be possible for those portfolios to fully exhaust the committed amount of the SCA, thereby requiring the Manager to allocate available funding per a Board-approved methodology designed to treat the Participating Funds in the SCA equitably.
The Fund utilized the SCA during the year ended October 31, 2022. The average daily balance for the 1 day that the Fund had loans outstanding during the period was approximately $1,638,000, borrowed at a weighted average interest rate of 4.15%. The maximum loan outstanding amount during the period was $1,638,000. At October 31, 2022, the Fund did not have an outstanding loan amount.
| 9. | Risks of Investing in the Fund |
The Fund’s risks include, but are not limited to, some or all of the risks discussed below. For further information on the Fund’s risks, please refer to the Fund’s Prospectus and Statement of Additional Information.
Credit Risk: Credit risk relates to the ability of the issuer of a fixed income instrument or the counterparty to a financial transaction with the Fund to meet interest and principal payments as they come due or to fulfill its obligations to the Fund. The value of the fixed income instruments held by the Fund will be adversely affected by any erosion in the ability of the relevant issuers to make interest and principal payments as they become due. The ratings given to a debt security by certain ratings agencies provide a generally useful guide as to such credit risk. The lower the rating of a debt security held by the Fund, the greater the degree of credit risk that is perceived to exist by the rating agency with respect to that security. Increasing the amount of Fund assets invested in lower-rated securities generally will increase the Fund’s income, but also will increase the credit risk to which the Fund is subject. The Fund generally enters into financial transactions with major dealers that are deemed acceptable to the subadviser from a credit perspective.
Currency Risk: The Fund’s assets may be invested in securities that are denominated in non-US currencies or directly in currencies. Such investments are subject to the risk that the value of a particular currency will change in relation to the US dollar or other currencies. The weakening of a country’s currency relative to the US dollar will negatively affect the dollar value of the Fund’s assets. Among the factors that may affect currency values are trade balances, levels of short term interest rates, differences in relative values of similar assets in different currencies, long term opportunities for investment and capital appreciation, central bank policy, and political developments. The Fund may attempt to hedge such risks by selling or buying currencies in the forward market; selling or buying currency futures contracts, options or other securities thereon; borrowing funds denominated in particular currencies; or any combination thereof, depending on the availability of liquidity in the hedging instruments and their relative costs. There can be no assurance that such strategies will be implemented or, if implemented, will be effective. The Fund would incur additional costs from hedging.
PGIM Emerging Markets Debt Hard Currency Fund 83
Notes to Financial Statements (continued)
Debt Obligations Risk: Debt obligations are subject to credit risk, market risk and interest rate risk. The Fund’s holdings, share price, yield and total return may also fluctuate in response to bond market movements. The value of bonds may decline for issuer-related reasons, including management performance, financial leverage and reduced demand for the issuer’s goods and services. Certain types of fixed income obligations also may be subject to “call and redemption risk,” which is the risk that the issuer may call a bond held by the Fund for redemption before it matures and the Fund may not be able to reinvest at the same rate of interest and therefore would earn less income.
Derivatives Risk: Derivatives involve special risks and costs and may result in losses to the Fund. The successful use of derivatives requires sophisticated management, and, to the extent that derivatives are used, the Fund will depend on the subadviser’s ability to analyze and manage derivatives transactions. The prices of derivatives may move in unexpected ways, especially in abnormal market conditions. Some derivatives are “leveraged” or may create economic leverage for the Fund and therefore may magnify or otherwise increase investment losses to the Fund. The Fund’s use of derivatives may also increase the amount of taxes payable by shareholders.
Other risks arise from the potential inability to terminate or sell derivatives positions. A liquid secondary market may not always exist for the Fund’s derivatives positions. In fact, many over-the-counter derivative instruments will not have liquidity beyond the counterparty to the instrument. Over-the-counter derivative instruments also involve the risk that the other party will not meet its obligations to the Fund. The use of derivatives also exposes the Fund to operational issues, such as documentation and settlement issues, systems failures, inadequate control and human error.
Derivatives may also involve legal risks, such as insufficient documentation, the lack of capacity or authority of a counterparty to execute or settle a transaction, and the legality and enforceability of derivatives contracts. The U.S. Government and foreign governments have adopted (and may adopt further) regulations governing derivatives markets, including mandatory clearing of certain derivatives, margin and reporting requirements and risk exposure limitations. Regulation of derivatives may make derivatives more costly, limit their availability or utility to the Fund, or otherwise adversely affect their performance or disrupt markets.
Economic and Market Events Risk: Events in the U.S. and global financial markets, including actions taken by the U.S. Federal Reserve or foreign central banks to stimulate or stabilize economic growth or the functioning of the securities markets, or otherwise reduce inflation may at times result in unusually high market volatility, which could negatively impact performance. Governmental efforts to curb inflation often have negative effects on
84
the level of economic activity. Relatively reduced liquidity in credit and fixed income markets could adversely affect issuers worldwide.
Emerging Markets Risk: The risks of foreign investments are greater for investments in or exposed to emerging markets. Emerging market countries typically have economic and political systems that are less fully developed, and can be expected to be less stable, than those of more developed countries. For example, the economies of such countries can be subject to rapid and unpredictable rates of inflation or deflation. Low trading volumes may result in a lack of liquidity and price volatility. Emerging market countries may have policies that restrict investment by non-U.S. investors, or that prevent non-U.S. investors from withdrawing their money at will.
The Fund may invest in some emerging markets that subject it to risks such as those associated with illiquidity, custody of assets, different settlement and clearance procedures and asserting legal title under a developing legal and regulatory regime to a greater degree than in developed markets or even in other emerging markets.
Foreign Securities Risk: Investments in securities of non-U.S. issuers (including those denominated in U.S. dollars) may involve more risk than investing in securities of U.S. issuers. Foreign political, economic and legal systems, especially those in developing and emerging market countries, may be less stable and more volatile than in the United States. Foreign legal systems generally have fewer regulatory requirements than the U.S. legal system, particularly those of emerging markets. In general, less information is publicly available with respect to non-U.S. companies than U.S. companies. Non-U.S. companies generally are not subject to the same accounting, auditing, and financial reporting standards as are U.S. companies. Additionally, the changing value of foreign currencies and changes in exchange rates could also affect the value of the assets the Fund holds and the Fund’s performance. Certain foreign countries may impose restrictions on the ability of issuers of foreign securities to make payment of principal and interest or dividends to investors located outside the country, due to blockage of foreign currency exchanges or otherwise. Investments in emerging markets are subject to greater volatility and price declines.
In addition, the Fund’s investments in non-U.S. securities may be subject to the risks of nationalization or expropriation of assets, imposition of currency exchange controls or restrictions on the repatriation of non-U.S. currency, confiscatory taxation and adverse diplomatic developments. Special U.S. tax considerations may apply.
Geographic Concentration Risk: The Fund’s performance may be closely tied to the market, economic, political, regulatory or other conditions in the countries or regions in which the Fund invests. This can result in more pronounced risks based upon conditions that impact one or more countries or regions more or less than other countries or regions.
Increase in Expenses Risk: Your actual cost of investing in the Fund may be higher than the expenses shown in the expense table in the Fund’s prospectus for a variety of reasons. For example, expense ratios may be higher than those shown if average net assets decrease.
PGIM Emerging Markets Debt Hard Currency Fund 85
Notes to Financial Statements (continued)
Net assets are more likely to decrease and Fund expense ratios are more likely to increase when markets are volatile. Active and frequent trading of Fund securities can increase expenses.
Interest Rate Risk: The value of your investment may go down when interest rates rise. A rise in rates tends to have a greater impact on the prices of longer term or duration debt securities. Similarly, a rise in interest rates may also have a greater negative impact on the value of equity securities whose issuers expect earnings further out in the future. For example, a fixed income security with a duration of three years is expected to decrease in value by approximately 3% if interest rates increase by 1%. This is referred to as “duration risk.” When interest rates fall, the issuers of debt obligations may prepay principal more quickly than expected, and the Fund may be required to reinvest the proceeds at a lower interest rate. This is referred to as “prepayment risk.” When interest rates rise, debt obligations may be repaid more slowly than expected, and the value of the Fund’s holdings may fall sharply. This is referred to as “extension risk.” The Fund may lose money if short-term or long-term interest rates rise sharply or in a manner not anticipated by the subadviser.
Junk Bonds Risk: High-yield, high-risk bonds have predominantly speculative characteristics, including particularly high credit risk. Junk bonds tend to have lower market liquidity than higher-rated securities. The liquidity of particular issuers or industries within a particular investment category may shrink or disappear suddenly and without warning. The non-investment grade bond market can experience sudden and sharp price swings and become illiquid due to a variety of factors, including changes in economic forecasts, stock market activity, large sustained sales by major investors, a high profile default or a change in the market’s psychology.
Large Shareholder and Large Scale Redemption Risk: Certain individuals, accounts, funds (including funds affiliated with the Manager) or institutions, including the Manager and its affiliates, may from time to time own or control a substantial amount of the Fund’s shares. There is no requirement that these entities maintain their investment in the Fund. There is a risk that such large shareholders or that the Fund’s shareholders generally may redeem all or a substantial portion of their investments in the Fund in a short period of time, which could have a significant negative impact on the Fund’s NAV, liquidity, and brokerage costs. Large redemptions could also result in tax consequences to shareholders and impact the Fund’s ability to implement its investment strategy. The Fund’s ability to pursue its investment objective after one or more large scale redemptions may be impaired and, as a result, the Fund may invest a larger portion of its assets in cash or cash equivalents.
Liquidity Risk: Liquidity risk is the risk that the Fund could not meet requests to redeem shares issued by the Fund without significant dilution of remaining investors’ interests in the
86
Fund. The Fund may invest in instruments that trade in lower volumes and are more illiquid than other investments. If the Fund is forced to sell these investments to pay redemption proceeds or for other reasons, the Fund may lose money. In addition, when there is no willing buyer and investments cannot be readily sold at the desired time or price, the Fund may have to accept a lower price or may not be able to sell the instrument at all. An inability to sell a portfolio position can adversely affect the Fund’s value or prevent the Fund from being able to take advantage of other investment opportunities.
Management Risk: Actively managed funds are subject to management risk. The subadviser will apply investment techniques and risk analyses in making investment decisions for the Fund, but the subadviser’s judgments about the attractiveness, value or market trends affecting a particular security, industry or sector or about market movements may be incorrect. Additionally, the investments selected for the Fund may underperform the markets in general, the Fund’s benchmark and other funds with similar investment objectives.
Market Disruption and Geopolitical Risks: Market disruption can be caused by economic, financial or political events and factors, including but not limited to, international wars or conflicts (including Russia’s military invasion of Ukraine), geopolitical developments (including trading and tariff arrangements, sanctions and cybersecurity attacks), instability in regions such as Asia, Eastern Europe and the Middle East, terrorism, natural disasters and public health epidemics (including the outbreak of COVID-19 globally).
The extent and duration of such events and resulting market disruptions cannot be predicted, but could be substantial and could magnify the impact of other risks to the Fund. These and other similar events could adversely affect the U.S. and foreign financial markets and lead to increased market volatility, reduced liquidity in the securities markets, significant negative impacts on issuers and the markets for certain securities and commodities and/or government intervention. They may also cause short- or long-term economic uncertainties in the United States and worldwide. As a result, whether or not the Fund invests in securities of issuers located in or with significant exposure to the countries directly affected, the value and liquidity of the Fund’s investments may be negatively impacted. Further, due to closures of certain markets and restrictions on trading certain securities, the value of certain securities held by the Fund could be significantly impacted, which could lead to such securities being valued at zero.
COVID-19 and the related governmental and public responses have had and may continue to have an impact on the Fund’s investments and net asset value and have led and may continue to lead to increased market volatility and the potential for illiquidity in certain classes of securities and sectors of the market. They have also had and may continue to result in periods of business disruption, business closures, inability to obtain raw materials, supplies and component parts, and reduced or disrupted operations for the issuers in which the Fund invests. The occurrence, reoccurrence and pendency of public health epidemics could adversely affect the economies and financial markets either in specific countries or worldwide.
PGIM Emerging Markets Debt Hard Currency Fund 87
Notes to Financial Statements (continued)
Market Risk: Securities markets may be volatile and the market prices of the Fund’s securities may decline. Securities fluctuate in price based on changes in an issuer’s financial condition and overall market and economic conditions. If the market prices of the securities owned by the Fund fall, the value of your investment in the Fund will decline.
| 10. | Recent Accounting Pronouncement and Regulatory Developments |
In March 2020, the FASB issued Accounting Standard Update (“ASU”) No. 2020-04, which provides optional guidance for applying GAAP to contract modifications, hedging relationships and other transactions affected by the reference rate reform if certain criteria are met. ASU 2020-04 is elective and is effective on March 12, 2020 through December 31, 2022. Management does not expect ASU 2020-04 to have a material impact on the financial statements.
88
Report of Independent Registered Public Accounting Firm
To the Board of Directors of Prudential World Fund, Inc. and Shareholders of PGIM Emerging Markets Debt Hard Currency Fund
Opinion on the Financial Statements
We have audited the accompanying statement of assets and liabilities, including the schedule of investments, of PGIM Emerging Markets Debt Hard Currency Fund (one of the funds constituting Prudential World Fund, Inc., referred to hereafter as the “Fund”) as of October 31, 2022, the related statement of operations for the year ended October 31, 2022, the statements of changes in net assets for each of the two years in the period ended October 31, 2022, including the related notes, and the financial highlights for each of the three years in the period ended October 31, 2022 (collectively referred to as the “financial statements”). In our opinion, the financial statements present fairly, in all material respects, the financial position of the Fund as of October 31, 2022, the results of its operations for the year then ended, the changes in its net assets for each of the two years in the period ended October 31, 2022 and the financial highlights for each of the three years in the period ended October 31, 2022 in conformity with accounting principles generally accepted in the United States of America.
The financial statements of the Fund as of and for the year ended October 31, 2019 and the financial highlights for each of the periods ended on or prior to October 31, 2019 (not presented herein, other than the financial highlights) were audited by other auditors whose report dated December 19, 2019 expressed an unqualified opinion on those financial statements and financial highlights.
Basis for Opinion
These financial statements are the responsibility of the Fund’s management. Our responsibility is to express an opinion on the Fund’s financial statements based on our audits. We are a public accounting firm registered with the Public Company Accounting Oversight Board (United States) (PCAOB) and are required to be independent with respect to the Fund in accordance with the U.S. federal securities laws and the applicable rules and regulations of the Securities and Exchange Commission and the PCAOB.
We conducted our audits of these financial statements in accordance with the standards of the PCAOB. Those standards require that we plan and perform the audit to obtain reasonable assurance about whether the financial statements are free of material misstatement, whether due to error or fraud.
Our audits included performing procedures to assess the risks of material misstatement of the financial statements, whether due to error or fraud, and performing procedures that respond to those risks. Such procedures included examining, on a test basis, evidence regarding the amounts and disclosures in the financial statements. Our audits also included evaluating the accounting principles used and significant estimates made by management, as well as evaluating the overall presentation of the financial statements. Our procedures included confirmation of securities owned as of October 31, 2022 by correspondence with the custodian, transfer agent and brokers; when replies were not received from brokers, we performed other auditing procedures. We believe that our audits provide a reasonable basis for our opinion.
/s/ PricewaterhouseCoopers LLP
New York, New York
December 16, 2022
We have served as the auditor of one or more investment companies in the PGIM Retail Funds complex since 2020.
PGIM Emerging Markets Debt Hard Currency Fund 89
INFORMATION ABOUT BOARD MEMBERS AND OFFICERS (unaudited)
Information about Board Members and Officers of the Fund is set forth below. Board Members who are not deemed to be “interested persons” of the Fund, as defined in the 1940 Act, are referred to as “Independent Board Members.” Board Members who are deemed to be “interested persons” of the Fund are referred to as “Interested Board Members.” The Board Members are responsible for the overall supervision of the operations of the Fund and perform the various duties imposed on the directors of investment companies by the 1940 Act. The Board in turn elects the Officers, who are responsible for administering the day-to-day operations of the Fund.
| | | | | | |
| | | |
| Independent Board Members | | | | |
| | | | |
Name Year of Birth Position(s) Portfolios Overseen | | Principal Occupation(s) During Past Five Years | | Other Directorships Held During Past Five Years | | Length of Board Service |
| | | | |
Ellen S. Alberding 1958 Board Member Portfolios Overseen: 97 | | President and Board Member, The Joyce Foundation (charitable foundation) (since 2002); formerly Vice Chair, City Colleges of Chicago (community college system) (2011-2015); Trustee, National Park Foundation (charitable foundation for national park system) (2009-2018); Trustee, Economic Club of Chicago (2009-2016); Trustee, Loyola University (since 2018). | | None. | | Since September 2013 |
| | | | |
Kevin J. Bannon 1952 Board Member Portfolios Overseen: 97 | | Retired; formerly Managing Director (April 2008-May 2015) and Chief Investment Officer (October 2008-November 2013) of Highmount Capital LLC (registered investment adviser); formerly Executive Vice President and Chief Investment Officer (April 1993-August 2007) of Bank of New York Company; President (May 2003-May 2007) of BNY Hamilton Family of Mutual Funds. | | Director of Urstadt Biddle Properties (equity real estate investment trust) (since September 2008). | | Since July 2008 |
PGIM Emerging Markets Debt Hard Currency Fund
| | | | | | |
| | | |
| Independent Board Members | | | | |
| | | | |
Name Year of Birth Position(s) Portfolios Overseen | | Principal Occupation(s) During Past Five Years | | Other Directorships Held During Past Five Years | | Length of Board Service |
| | | | |
Linda W. Bynoe 1952 Board Member Portfolios Overseen: 94 | | President and Chief Executive Officer (since March 1995) and formerly Chief Operating Officer (December 1989-February 1995) of Telemat Limited LLC (formerly Telemat Ltd) (management consulting); formerly Vice President (January 1985-June 1989) at Morgan Stanley & Co. (broker-dealer). | | Trustee of Equity Residential (residential real estate) (since December 2009); Director of Northern Trust Corporation (financial services) (since April 2006); formerly Director of Anixter International, Inc. (communication products distributor) (January 2006-June 2020). | | Since March 2005 |
| | | | |
Barry H. Evans 1960 Board Member Portfolios Overseen: 96 | | Retired; formerly President (2005-2016), Global Chief Operating Officer (2014-2016), Chief Investment Officer - Global Head of Fixed Income (1998-2014), and various portfolio manager roles (1986-2006), Manulife Asset Management (asset management). | | Formerly Director, Manulife Trust Company (2011-2018); formerly Director, Manulife Asset Management Limited (2015-2017); formerly Chairman of the Board of Directors of Manulife Asset Management U.S. (2005-2016); formerly Chairman of the Board, Declaration Investment Management and Research (2008-2016). | | Since September 2017 |
| | | | |
Keith F. Hartstein 1956 Board Member & Independent Chair Portfolios Overseen: 97 | | Retired; Member (November 2014-September 2022) of the Governing Council of the Independent Directors Council (IDC) (organization of independent mutual fund directors); formerly Executive Committee of the IDC Board of Governors (October 2019-December 2021); formerly President and Chief Executive Officer (2005-2012), Senior Vice President (2004-2005), Senior Vice President of Sales and Marketing (1997-2004), and various executive management positions (1990-1997), John Hancock Funds, LLC (asset management); Chairman, Investment Company Institute’s Sales Force Marketing Committee (2003-2008). | | None. | | Since September 2013 |
Visit our website at pgim.com/investments
| | | | | | |
| | | |
| Independent Board Members | | | | |
| | | | |
Name Year of Birth Position(s) Portfolios Overseen | | Principal Occupation(s) During Past Five Years | | Other Directorships Held During Past Five Years | | Length of Board Service |
| | | | |
Laurie Simon Hodrick 1962 Board Member Portfolios Overseen: 93 | | A. Barton Hepburn Professor Emerita of Economics in the Faculty of Business, Columbia Business School (since 2018); Visiting Fellow at the Hoover Institution, Stanford University (since 2015); Sole Member, ReidCourt LLC (since 2008) (a consulting firm); formerly Visiting Professor of Law, Stanford Law School (2015-2021); formerly A. Barton Hepburn Professor of Economics in the Faculty of Business, Columbia Business School (1996-2017); formerly Managing Director, Global Head of Alternative Investment Strategies, Deutsche Bank (2006-2008). | | Independent Director, Andela (since January 2022) (global talent network); Independent Director, Roku (since December 2020) (communication services); formerly Independent Director, Synnex Corporation (2019-2021) (information technology); formerly Independent Director, Kabbage, Inc. (2018-2020) (financial services); formerly Independent Director, Corporate Capital Trust (2017-2018) (a business development company). | | Since September 2017 |
| | | | |
Brian K. Reid 1961 Board Member Portfolios Overseen: 96 | | Retired; formerly Chief Economist for the Investment Company Institute (ICI) (2005-2017); formerly Senior Economist and Director of Industry and Financial Analysis at the ICI (1998-2004); formerly Senior Economist, Industry and Financial Analysis at the ICI (1996-1998); formerly Staff Economist at the Federal Reserve Board (1989-1996); Director, ICI Mutual Insurance Company (2012-2017). | | None. | | Since March 2018 |
PGIM Emerging Markets Debt Hard Currency Fund
| | | | | | |
| | | |
| Independent Board Members | | | | |
| | | | |
Name Year of Birth Position(s) Portfolios Overseen | | Principal Occupation(s) During Past Five Years | | Other Directorships Held During Past Five Years | | Length of Board Service |
| | | | |
Grace C. Torres 1959 Board Member Portfolios Overseen: 96 | | Retired; formerly Treasurer and Principal Financial and Accounting Officer of the PGIM Funds, Target Funds, Advanced Series Trust, Prudential Variable Contract Accounts and The Prudential Series Fund (1998-June 2014); Assistant Treasurer (March 1999-June 2014) and Senior Vice President (September 1999-June 2014) of PGIM Investments LLC; Assistant Treasurer (May 2003-June 2014) and Vice President (June 2005-June 2014) of AST Investment Services, Inc.; Senior Vice President and Assistant Treasurer (May 2003-June 2014) of Prudential Annuities Advisory Services, Inc. | | Director (since January 2018) of OceanFirst Financial Corp. and OceanFirst Bank; formerly Director (July 2015-January 2018) of Sun Bancorp, Inc. N.A. and Sun National Bank. | | Since November 2014 |
Visit our website at pgim.com/investments
| | | | | | |
| | | |
| Interested Board Members | | | | |
| | | | |
Name Year of Birth Position(s) Portfolios Overseen | | Principal Occupation(s) During Past Five Years | | Other Directorships Held During Past Five Years | | Length of Board Service |
| | | | |
Stuart S. Parker 1962 Board Member & President Portfolios Overseen: 96 | | President, Chief Executive Officer, Chief Operating Officer and Officer in Charge of PGIM Investments LLC (formerly known as Prudential Investments LLC) (since January 2012); President and Principal Executive Officer (“PEO” ) (since September 2022) of the PGIM Private Credit Fund; President and PEO (since March 2022) of the PGIM Private Real Estate Fund, Inc.; formerly Executive Vice President of Jennison Associates LLC and Head of Retail Distribution of PGIM Investments LLC (June 2005-December 2011); Investment Company Institute - Board of Governors (since May 2012). | | None. | | Since January 2012 |
| | | | |
Scott E. Benjamin 1973 Board Member & Vice President Portfolios Overseen: 97 | | Executive Vice President (since May 2009) of PGIM Investments LLC; Vice President (since June 2012) of Prudential Investment Management Services LLC; Executive Vice President (since September 2009) of AST Investment Services, Inc.; Senior Vice President of Product Development and Marketing, PGIM Investments (since February 2006); Vice President (since September 2022) of the PGIM Private Credit Fund; Vice President (since March 2022) of the PGIM Private Real Estate Fund, Inc.; formerly Vice President of Product Development and Product Management, PGIM Investments LLC (2003-2006). | | None. | | Since March 2010 |
PGIM Emerging Markets Debt Hard Currency Fund
| | | | | | |
| | | |
| Fund Officers(a) | | | | |
| | | |
Name Year of Birth Fund Position | | Principal Occupation(s) During Past Five Years | | Length of Service as Fund Officer |
| | | |
Claudia DiGiacomo 1974 Chief Legal Officer | | Chief Legal Officer (since September 2022) of the PGIM Private Credit Fund; Chief Legal Officer (since July 2022) of the PGIM Private Real Estate Fund, Inc.; Chief Legal Officer, Executive Vice President and Secretary of PGIM Investments LLC (since August 2020); Chief Legal Officer of Prudential Mutual Fund Services LLC (since August 2020); Chief Legal Officer of PIFM Holdco, LLC (since August 2020); Vice President and Corporate Counsel (since January 2005) of Prudential; and Corporate Counsel of AST Investment Services, Inc. (since August 2020); formerly Vice President and Assistant Secretary of PGIM Investments LLC (2005-2020); formerly Associate at Sidley Austin Brown & Wood LLP (1999-2004). | | Since December 2005 |
| | | |
Isabelle Sajous 1976 Chief Compliance Officer | | Chief Compliance Officer (since April 2022) of PGIM Investments LLC, the PGIM Funds, Target Funds, PGIM ETF Trust, PGIM Global High Yield Fund, Inc., PGIM High Yield Bond Fund, Inc., PGIM Short Duration High Yield Opportunities Fund, Advanced Series Trust, The Prudential Series Fund and Prudential’s Gibraltar Fund, Inc.; Chief Compliance Officer (since September 2022) of the PGIM Private Credit Fund; Chief Compliance Officer (since March 2022) of the PGIM Private Real Estate Fund, Inc.; Vice President, Compliance of PGIM Investments LLC (since December 2020); formerly Director, Compliance (July 2018-December 2020) of Credit Suisse Asset Management LLC; and Vice President, Associate General Counsel & Deputy Chief Compliance Officer of Cramer Rosenthal McGlynn, LLC (August 2014-July 2018). | | Since April 2022 |
| | | |
Andrew R. French 1962 Secretary | | Vice President (since December 2018) of PGIM Investments LLC; Secretary (since September 2022) of the PGIM Private Credit Fund; Secretary (since March 2022) of the PGIM Private Real Estate Fund, Inc.; formerly Vice President and Corporate Counsel (2010-2018) of Prudential; formerly Director and Corporate Counsel (2006-2010) of Prudential; Vice President and Assistant Secretary (since January 2007) of PGIM Investments LLC; Vice President and Assistant Secretary (since January 2007) of Prudential Mutual Fund Services LLC. | | Since October 2006 |
| | | |
Melissa Gonzalez 1980 Assistant Secretary | | Vice President and Corporate Counsel (since September 2018) of Prudential; Vice President and Assistant Secretary (since August 2020) of PGIM Investments LLC; Assistant Secretary (since September 2022) of the PGIM Private Credit Fund; Assistant Secretary (since March 2022) of the PGIM Private Real Estate Fund, Inc.; formerly Director and Corporate Counsel (March 2014-September 2018) of Prudential. | | Since March 2020 |
Visit our website at pgim.com/investments
| | | | | | |
| | | |
| Fund Officers(a) | | | | |
| | | |
Name Year of Birth Fund Position | | Principal Occupation(s) During Past Five Years | | Length of Service as Fund Officer |
| | | |
Patrick E. McGuinness 1986 Assistant Secretary | | Vice President and Assistant Secretary (since August 2020) of PGIM Investments LLC; Director and Corporate Counsel (since February 2017) of Prudential; Assistant Secretary (since September 2022) of the PGIM Private Credit Fund; Assistant Secretary (since March 2022) of the PGIM Private Real Estate Fund, Inc. | | Since June 2020 |
| | | |
Debra Rubano 1975 Assistant Secretary | | Vice President and Corporate Counsel (since November 2020) of Prudential; Assistant Secretary (since September 2022) of the PGIM Private Credit Fund; Assistant Secretary (since March 2022) of the PGIM Private Real Estate Fund, Inc; formerly Director and Senior Counsel of Allianz Global Investors U.S. Holdings LLC (2010-2020) and Assistant Secretary of numerous funds in the Allianz fund complex (2015-2020). | | Since December 2020 |
| | | |
Kelly A. Coyne 1968 Assistant Secretary | | Director, Investment Operations of Prudential Mutual Fund Services LLC (since 2010); Assistant Secretary (since September 2022) of the PGIM Private Credit Fund; Assistant Secretary (since March 2022) of the PGIM Private Real Estate Fund, Inc. | | Since March 2015 |
| | | |
Christian J. Kelly 1975 Treasurer and Principal Financial and Accounting Officer | | Vice President, Head of Fund Administration of PGIM Investments LLC (since November 2018); Principal Financial Officer (since September 2022) of the PGIM Private Credit Fund; Principal Financial Officer (since March 2022) of the PGIM Private Real Estate Fund, Inc.; formerly, Treasurer and Principal Accounting Officer (March 2022- July 2022) of the PGIM Private Real Estate Fund, Inc.; formerly Director of Fund Administration of Lord Abbett & Co. LLC (2009-2018), Treasurer and Principal Accounting Officer of the Lord Abbett Family of Funds (2017-2018); Director of Accounting, Avenue Capital Group (2008-2009); Senior Manager, Investment Management Practice of Deloitte & Touche LLP (1998-2007). | | Since January 2019 |
| | | |
Lana Lomuti 1967 Assistant Treasurer | | Vice President (since 2007) and Director (2005-2007), within PGIM Investments Fund Administration; formerly Assistant Treasurer (December 2007-February 2014) of The Greater China Fund, Inc. | | Since April 2014 |
| | | |
Russ Shupak 1973 Assistant Treasurer | | Vice President (since 2017) and Director (2013-2017), within PGIM Investments Fund Administration; Treasurer and Principal Accounting Officer (since July 2022) of the PGIM Private Real Estate Fund, Inc.; Assistant Treasurer (since September 2022) of the PGIM Private Credit Fund; formerly Assistant Treasurer (March 2022 – July 2022) of the PGIM Private Real Estate Fund, Inc. | | Since October 2019 |
| | | |
Deborah Conway 1969 Assistant Treasurer | | Vice President (since 2017) and Director (2007-2017), within PGIM Investments Fund Administration. | | Since October 2019 |
PGIM Emerging Markets Debt Hard Currency Fund
| | | | | | |
| | | |
| Fund Officers(a) | | | | |
| | | |
Name Year of Birth Fund Position | | Principal Occupation(s) During Past Five Years | | Length of Service as Fund Officer |
| | | |
Elyse M. McLaughlin 1974 Assistant Treasurer | | Vice President (since 2017) and Director (2011-2017), within PGIM Investments Fund Administration; Treasurer and Principal Accounting Officer (since September 2022) of the PGIM Private Credit Fund; Assistant Treasurer (since March 2022) of the PGIM Private Real Estate Fund, Inc. | | Since October 2019 |
| | | |
Kelly Florio 1978 Anti-Money Laundering Compliance Officer | | Vice President, Corporate Compliance, Global Compliance Programs and Compliance Risk Management (since December 2021) of Prudential; formerly, Head of Fraud Risk Management (October 2019 to December 2021) at New York Life Insurance Company; formerly, Head of Key Risk Area Operations (November 2018 to October 2019), Director of the US Anti-Money Laundering Compliance Unit (2009-2018) and Bank Loss Prevention Associate (2006 -2009) at MetLife. | | Since June 2022 |
| (a) | Excludes Mr. Parker and Mr. Benjamin, interested Board Members who also serve as President and Vice President, respectively. |
Explanatory Notes to Tables:
| ∎ | | Board Members are deemed to be “Interested,” as defined in the 1940 Act, by reason of their affiliation with PGIM Investments LLC and/or an affiliate of PGIM Investments LLC. |
| ∎ | | Unless otherwise noted, the address of all Board Members and Officers is c/o PGIM Investments LLC, 655 Broad Street, Newark, New Jersey 07102-4410. |
| ∎ | | There is no set term of office for Board Members or Officers. The Board Members have adopted a retirement policy, which calls for the retirement of Board Members on December 31 of the year in which they reach the age of 75. |
| ∎ | | “Other Directorships Held” includes all directorships of companies required to register or file reports with the SEC under the 1934 Act (that is, “public companies”) or other investment companies registered under the 1940 Act. |
| ∎ | | “Portfolios Overseen” includes all investment companies managed by PGIM Investments LLC. The investment companies for which PGIM Investments LLC serves as manager include the PGIM Mutual Funds, Target Funds, The Prudential Variable Contract Accounts, PGIM ETF Trust, PGIM Private Real Estate Fund, Inc., PGIM Private Credit Fund, PGIM High Yield Bond Fund, Inc., PGIM Global High Yield Fund, Inc., PGIM Short Duration High Yield Opportunities Fund, The Prudential Series Fund, Prudential’s Gibraltar Fund, Inc. and the Advanced Series Trust. |
| ∎ | | As used in the Fund Officers table “Prudential” means The Prudential Insurance Company of America. |
Visit our website at pgim.com/investments
Approval of Advisory Agreements (unaudited)
The Fund’s Board of Directors
The Board of Directors (the “Board”) of PGIM Emerging Markets Debt Hard Currency Fund (the “Fund”)1 consists of ten individuals, eight of whom are not “interested persons” of the Fund, as defined in the Investment Company Act of 1940, as amended (the “1940 Act”) (the “Independent Directors”). The Board is responsible for the oversight of the Fund and its operations, and performs the various duties imposed on the directors of investment companies by the 1940 Act. The Independent Directors have retained independent legal counsel to assist them in connection with their duties. The Chair of the Board is an Independent Director. The Board has established five standing committees: the Audit Committee, the Nominating and Governance Committee, the Compliance Committee and two Investment Committees. Each committee is chaired by, and composed of, Independent Directors.
Annual Approval of the Fund’s Advisory Agreements
As required under the 1940 Act, the Board determines annually whether to renew the Fund’s management agreement with PGIM Investments LLC (“PGIM Investments”) and the Fund’s subadvisory agreement with PGIM, Inc. (“PGIM”) on behalf of its PGIM Fixed Income unit (“PGIM Fixed Income”) and PGIM Limited (“PGIML”). In considering the renewal of the agreements, the Board, including all of the Independent Trustees, met on May 26 and June 7-9, 2022 (the “Board Meeting”) and approved the renewal of the agreements through July 31, 2023, after concluding that the renewal of the agreements was in the best interests of the Fund and its shareholders.
In advance of the meetings, the Board requested and received materials relating to the agreements, and had the opportunity to ask questions and request further information in connection with its consideration. Among other things, the Board considered comparative fee information from PGIM Investments, PGIM Fixed Income and PGIML. Also, the Board considered comparisons with other mutual funds in relevant Peer Universes and Peer Groups, as is further discussed below.
In approving the agreements, the Board, including the Independent Directors advised by independent legal counsel, considered the factors it deemed relevant, including the nature, quality and extent of services provided by PGIM Investments and the subadvisers, the performance of the Fund, the profitability of PGIM Investments and its affiliates, expenses and fees, and the potential for economies of scale that may be shared with the Fund and its shareholders as the Fund’s assets grow. In their deliberations, the Directors did not identify any single factor which alone was responsible for the Board’s decision to approve the agreements with respect to the Fund. In connection with its deliberations, the Board considered information provided by PGIM Investments throughout the year at regular Board meetings, presentations from portfolio managers and other information, as well as information furnished at or in advance of the Board Meeting.
1 PGIM Emerging Markets Debt Hard Currency Fund is a series of Prudential World Fund, Inc.
PGIM Emerging Markets Debt Hard Currency Fund
Approval of Advisory Agreements (continued)
The Directors determined that the overall arrangements between the Fund and PGIM Investments, which serves as the Fund’s investment manager pursuant to a management agreement, and between each of PGIM Investments and PGIM, which, through its PGIM Fixed Income unit, and PGIML, which serve as the Fund’s subadvisers pursuant to the terms of a subadvisory agreement with PGIM Investments, are in the best interests of the Fund and its shareholders in light of the services performed, fees charged and such other matters as the Directors considered relevant in the exercise of their business judgment.
The material factors and conclusions that formed the basis for the Directors reaching their determinations to approve the continuance of the agreements are separately discussed below.
Nature, Quality and Extent of Services
The Board received and considered information regarding the nature, quality and extent of services provided to the Fund by PGIM Investments, PGIM Fixed Income, and PGIML. The Board noted that PGIM Fixed Income and PGIML are affiliated with PGIM Investments. The Board considered the services provided by PGIM Investments, including but not limited to the oversight of the subadvisers for the Fund, as well as the provision of fund recordkeeping, compliance and other services to the Fund, and PGIM Investments’ role as administrator for the Fund’s liquidity risk management program. With respect to PGIM Investments’ oversight of the subadvisers, the Board noted that PGIM Investments’ Strategic Investment Research Group (“SIRG”), which is a business unit of PGIM Investments, is responsible for monitoring and reporting to PGIM Investments senior management on the performance and operations of the subadvisers. The Board also considered that PGIM Investments pays the salaries of all of the officers and interested Directors of the Fund who are part of Fund management. The Board also considered the investment subadvisory services provided by PGIM Fixed Income and PGIML, including investment research and security selection, as well as adherence to the Fund’s investment restrictions and compliance with applicable Fund policies and procedures. The Board considered PGIM Investments’ evaluation of the subadvisers, as well as PGIM Investments’ recommendation, based on its review of the subadvisers, to renew the subadvisory agreement.
The Board considered the qualifications, backgrounds and responsibilities of PGIM Investments’ senior management responsible for the oversight of the Fund, PGIM Fixed Income, and PGIML, and also considered the qualifications, backgrounds and responsibilities of PGIM Fixed Income’s portfolio managers who are responsible for the day-to-day management of the Fund’s portfolio. The Board was provided with information pertaining to PGIM Investments’, PGIM Fixed Income’s, and PGIML’s organizational structure, senior management, investment operations, and other relevant information pertaining to PGIM Investments, PGIM Fixed Income, and PGIML. The Board also noted that it received favorable compliance reports from the Fund’s Chief Compliance Officer (“CCO”) as to PGIM Investments, PGIM Fixed Income, and PGIML.
Visit our website at pgim.com/investments
The Board concluded that it was satisfied with the nature, extent and quality of the investment management services provided by PGIM Investments, the subadvisory services provided to the Fund by PGIM Fixed Income and PGIML, and that there was a reasonable basis on which to conclude that the Fund benefits from the services provided by PGIM Investments, PGIM Fixed Income, and PGIML under the management and subadvisory agreements.
Costs of Services and Profits Realized by PGIM Investments
The Board was provided with information on the profitability of PGIM Investments and its affiliates in serving as the Fund’s investment manager. The Board discussed with PGIM Investments the methodology utilized in assembling the information regarding profitability and considered its reasonableness. The Board recognized that it is difficult to make comparisons of profitability from fund management contracts because comparative information is not generally publicly available and is affected by numerous factors, including the structure of the particular adviser, the types of funds it manages, its business mix, numerous assumptions regarding allocations and the adviser’s capital structure and cost of capital. Taking these factors into account, the Board concluded that the profitability of PGIM Investments and its affiliates in relation to the services rendered was not unreasonable.
Economies of Scale
The Board received and discussed information concerning economies of scale that PGIM Investments may realize as the Fund’s assets grow beyond current levels. The Board noted that the management fee schedule for the Fund includes breakpoints, which have the effect of decreasing the fee rate as assets increase. During the course of time, the Board has considered information regarding the launch date of the Fund, the management fees of the Fund compared to those of similarly managed funds and PGIM Investments’ investment in the Fund over time. The Board noted that economies of scale can be shared with the Fund in other ways, including low management fees from inception, additional technological and personnel investments to enhance shareholder services, and maintaining existing expense structures in the face of a rising cost environment. The Board also considered PGIM Investments’ assertion that it continually evaluates the management fee schedule of the Fund and the potential to share economies of scale through breakpoints or fee waivers as asset levels increase.
The Board recognized the inherent limitations of any analysis of economies of scale, stemming largely from the Board’s understanding that most of PGIM Investments’ costs are not specific to individual funds, but rather are incurred across a variety of products and services.
Other Benefits to PGIM Investments, PGIM Fixed Income, and PGIML
The Board considered potential ancillary benefits that might be received by PGIM Investments, PGIM Fixed Income, PGIML and their affiliates as a result of their relationship with the Fund. The Board concluded that potential benefits to be derived by PGIM Investments included transfer agency fees received by the Fund’s transfer agent
PGIM Emerging Markets Debt Hard Currency Fund
Approval of Advisory Agreements (continued)
(which is affiliated with PGIM Investments), as well as benefits to its reputation or other intangible benefits resulting from PGIM Investments’ association with the Fund. The Board concluded that the potential benefits to be derived by PGIM Fixed Income and PGIML included the ability to use soft dollar credits, as well as the potential benefits consistent with those generally resulting from an increase in assets under management, specifically, potential access to additional research resources and benefits to their reputations. The Board concluded that the benefits derived by PGIM Investments, PGIM Fixed Income, and PGIML were consistent with the types of benefits generally derived by investment managers and subadvisers to mutual funds.
Performance of the Fund / Fees and Expenses
The Board considered certain additional factors and made related conclusions relating to the historical performance of the Fund for the one- and three-year periods ended December 31, 2021. The Board considered that the Fund commenced operations on December 12, 2017 and that longer-term performance was not yet available.
The Board also considered the Fund’s actual management fee, as well as the Fund’s net total expense ratio, for the fiscal year ended October 31, 2021. The Board considered the management fee for the Fund as compared to the management fee charged by PGIM Investments to other funds and the fee charged by other advisers to comparable mutual funds in a Peer Group. The actual management fee represents the fee rate actually paid by Fund shareholders and includes any fee waivers or reimbursements. The net total expense ratio for the Fund represents the actual expense ratio incurred by Fund shareholders.
The mutual funds included in the Peer Universe, which was used to consider performance, and the Peer Group, which was used to consider expenses and fees, were objectively determined by Broadridge, an independent provider of mutual fund data. In certain circumstances, PGIM Investments also provided supplemental Peer Universe or Peer Group information, for reasons addressed with the Board. The comparisons placed the Fund in various quartiles over various periods, with the first quartile being the best 25% of the mutual funds (for performance, the best performing mutual funds and, for expenses, the lowest cost mutual funds).
The section below summarizes key factors considered by the Board and the Board’s conclusions regarding the Fund’s performance, fees and overall expenses. The table sets forth net performance comparisons (which reflect the impact on performance of fund expenses, or any subsidies, expense caps or waivers that may be applicable) with the Peer Universe, actual management fees with the Peer Group (which reflect the impact of any subsidies or fee waivers), and net total expenses with the Peer Group, each of which were key factors considered by the Board.
Visit our website at pgim.com/investments
| | | | | | | | |
Net Performance | | 1 Year | | 3 Years | | 5 Years | | 10 Years |
| | 1st Quartile | | 2nd Quartile | | N/A | | N/A |
| Actual Management Fees: 1st Quartile | | | | |
| Net Total Expenses: 1st Quartile |
| ● | The Board noted that the Fund outperformed its benchmark index over the one-year period and underperformed its benchmark index over the three-year period. |
| ● | The Board noted that the Fund does not yet have a five-year performance record and that, therefore, the subadviser should have more time to develop that record. |
| ● | The Board and PGIM Investments agreed to retain the existing contractual expense cap that (exclusive of certain fees and expenses) caps total annual operating expenses at 1.05%for Class A shares, 1.80% for Class C shares, 0.75%for Class Z shares and 0.65% for Class R6 shares through February 28, 2023. |
| ● | In addition, PGIM Investments will waive management fees or shared operating expenses on any share class to the same extent that it waives such expenses on any other share class, and has agreed that total annual fund operating expenses for Class R6 shares will not exceed total annual fund operating expenses for Class Z shares. |
| ● | The Board concluded that, in light of the above, it would be in the best interests of the Fund and its shareholders to continue to allow the Fund to create a longer-term performance record, and to renew the agreements. |
| ● | The Board concluded that the management fees (including subadvisory fees) and total expenses were reasonable in light of the services provided. |
* * *
After full consideration of these factors, the Board concluded that the approval of the agreements was in the best interests of the Fund and its shareholders.
PGIM Emerging Markets Debt Hard Currency Fund
| | | | |
| | | |
⬛ MAIL 655 Broad Street Newark, NJ 07102 | | ⬛ TELEPHONE (800) 225-1852 | | ⬛ WEBSITE pgim.com/investments |
PROXY VOTING
The Board of Directors of the Fund has delegated to the Fund’s subadvisers the responsibility for voting any proxies and maintaining proxy recordkeeping with respect to the Fund. A description of these proxy voting policies and procedures is available without charge, upon request, by calling (800) 225-1852 or by visiting the Securities and Exchange Commission’s website at sec.gov. Information regarding how the Fund voted proxies relating to portfolio securities during the most recent 12-month period ended June 30 is available on the Fund’s website and on the Securities and Exchange Commission’s website.
DIRECTORS
Ellen S. Alberding ● Kevin J. Bannon ● Scott E. Benjamin ● Linda W. Bynoe ● Barry H. Evans ● Keith F. Hartstein ● Laurie Simon Hodrick ●
Stuart S. Parker ● Brian K. Reid ● Grace C. Torres
OFFICERS
Stuart S. Parker, President ● Scott E. Benjamin, Vice President ● Christian J. Kelly, Treasurer and Principal Financial and Accounting Officer ●
Claudia DiGiacomo, Chief Legal Officer ● Isabelle Sajous, Chief Compliance Officer ● Kelly Florio, Anti-Money Laundering Compliance Officer ●
Andrew R. French, Secretary ● Melissa Gonzalez, Assistant Secretary ● Kelly A. Coyne, Assistant Secretary ● Patrick E. McGuinness, Assistant Secretary ● Debra Rubano, Assistant Secretary ● Lana Lomuti, Assistant Treasurer ● Russ Shupak, Assistant Treasurer ● Elyse M. McLaughlin, Assistant Treasurer ● Deborah Conway, Assistant Treasurer
| | | | |
| | |
MANAGER | | PGIM Investments LLC | | 655 Broad Street |
| | | | | Newark, NJ 07102 |
| | |
SUBADVISERS | | PGIM Fixed Income | | 655 Broad Street Newark, NJ 07102 |
| | |
| | | PGIM Limited | | Grand Buildings, 1-3 Strand Trafalgar Square London, WC2N 5HR United Kingdom |
| | |
DISTRIBUTOR | | Prudential Investment Management Services LLC | | 655 Broad Street Newark, NJ 07102 |
| | |
CUSTODIAN | | The Bank of New York Mellon | | 240 Greenwich Street New York, NY 10286 |
| | |
TRANSFER AGENT | | Prudential Mutual Fund Services LLC | | PO Box 9658 Providence, RI 02940 |
| | |
| INDEPENDENT REGISTERED PUBLIC ACCOUNTING FIRM | | PricewaterhouseCoopers LLP | | 300 Madison Avenue New York, NY 10017 |
| | |
FUND COUNSEL | | Willkie Farr & Gallagher LLP | | 787 Seventh Avenue New York, NY 10019 |
An investor should consider the investment objectives, risks, charges, and expenses of the Fund carefully before investing. The prospectus and summary prospectus contain this and other information about the Fund. An investor may obtain the prospectus and summary prospectus by visiting our website at pgim.com/investments or by calling (800) 225-1852. The prospectus and summary prospectus should be read carefully before investing.
E-DELIVERY
To receive your mutual fund documents online, go to pgim.com/investments/resource/edelivery and enroll. Instead of receiving printed documents by mail, you will receive notification via email when new materials are available. You can cancel your enrollment or change your email address at any time by visiting the website address above.
SHAREHOLDER COMMUNICATIONS WITH DIRECTORS
Shareholders can communicate directly with the Board of Directors by writing to the Chair of the Board, PGIM Emerging Markets Debt Hard Currency Fund, PGIM Investments, Attn: Board of Directors, 655 Broad Street, Newark, NJ 07102. Shareholders can communicate directly with an individual Director by writing to that Director at the same address. Communications are not screened before being delivered to the addressee.
AVAILABILITY OF PORTFOLIO HOLDINGS
The Fund files its complete schedule of portfolio holdings with the Securities and Exchange Commission for the first and third quarters of each fiscal year as an exhibit to its reports on Form N-PORT. The Fund’s Form N-PORT filings are available on the Commission’s website at sec.gov.
The Fund’s Statement of Additional Information contains additional information about the Fund’s Directors and is available without charge, upon request, by calling (800) 225-1852.
Mutual Funds:
| | | | |
| | | |
ARE NOT INSURED BY THE FDIC OR ANY FEDERAL GOVERNMENT AGENCY | | MAY LOSE VALUE | | ARE NOT A DEPOSIT OF OR GUARANTEED BY ANY BANK OR ANY BANK AFFILIATE |

PGIM EMERGING MARKETS DEBT HARD CURRENCY FUND
| | | | | | | | |
| | | | |
| SHARE CLASS | | A | | C | | Z | | R6 |
| | | | |
NASDAQ | | PDHAX | | PDHCX | | PDHVX | | PDHQX |
| | | | |
CUSIP | | 743969479 | | 743969461 | | 743969446 | | 743969453 |
MF239E
Item 2 – Code of Ethics — See Exhibit (a)
As of the end of the period covered by this report, the registrant has adopted a code of ethics (the “Section 406 Standards for Investment Companies – Ethical Standards for Principal Executive and Financial Officers”) that applies to the registrant’s Principal Executive Officer and Principal Financial Officer; the registrant’s Principal Financial Officer also serves as the Principal Accounting Officer.
The registrant hereby undertakes to provide any person, without charge, upon request, a copy of the code of ethics. To request a copy of the code of ethics, contact the registrant 800-225-1852, and ask for a copy of the Section 406 Standards for Investment Companies - Ethical Standards for Principal Executive and Financial Officers.
Item 3 – Audit Committee Financial Expert –
The registrant’s Board has determined that Ms. Grace C. Torres, member of the Board’s Audit Committee is an “audit committee financial expert,” and that she is “independent,” for purposes of this item.
Item 4 – Principal Accountant Fees and Services –
(a) Audit Fees
For the fiscal years ended October 31, 2022 and October 31, 2021, PricewaterhouseCoopers LLP (“PwC”), the Registrant’s principal accountant, billed the Registrant $244,900 and $244,900, respectively, for professional services rendered for the audit of the Registrant’s annual financial statements or services that are normally provided in connection with statutory and regulatory filings.
(b) Audit-Related Fees
For the fiscal years ended October 31, 2022 and October 31, 2021: none.
(c) Tax Fees
For the fiscal years ended October 31, 2022 and October 31, 2021: none.
(d) All Other Fees
For the fiscal years ended October 31, 2022 and October 31, 2021: none.
(e) (1) Audit Committee Pre-Approval Policies and Procedures
THE PGIM MUTUAL FUNDS
AUDIT COMMITTEE POLICY
on
Pre-Approval of Services Provided by the Independent
Accountants
The Audit Committee of each PGIM Mutual Fund is charged with the responsibility to monitor the independence of the Fund’s independent accountants. As part of this responsibility, the Audit Committee must pre-approve the independent accounting firm’s engagement to render audit and/or permissible non-audit services, as required by law. In evaluating a proposed engagement of the independent accountants, the Audit Committee will assess the effect that the engagement might reasonably be expected to have on the accountant’s independence. The Committee’s evaluation will be based on:
| | • | | a review of the nature of the professional services expected to be provided, |
| | • | | a review of the safeguards put into place by the accounting firm to safeguard independence, and |
| | • | | periodic meetings with the accounting firm. |
Policy for Audit and Non-Audit Services Provided to the Funds
On an annual basis, the scope of audits for each Fund, audit fees and expenses, and audit-related and non-audit services (and fees proposed in respect thereof) proposed to be performed by the Fund’s independent accountants will be presented by the Treasurer and the independent accountants to the Audit Committee for review and, as appropriate, approval prior to the initiation of such services.
Such presentation shall be accompanied by confirmation by both the Treasurer and the independent accountants that the proposed
non-audit services will not adversely affect the independence of the independent accountants. Such proposed non-audit services shall be described in sufficient detail to enable the Audit Committee to assess the appropriateness of such services and fees, and the compatibility of the provision of such services with the auditor’s independence. The Committee shall receive periodic reports on the progress of the audit and other services which are approved by the Committee or by the Committee Chair pursuant to authority delegated in this Policy.
The categories of services enumerated under “Audit Services”, “Audit-related Services”, and “Tax Services” are intended to provide guidance to the Treasurer and the independent accountants as to those categories of services which the Committee believes are generally consistent with the independence of the independent accountants and which the Committee (or the Committee Chair) would expect upon the presentation of specific proposals to pre-approve. The enumerated categories are not intended as an exclusive list of audit, audit-related or tax services, which the Committee (or the Committee Chair) would consider for pre-approval.
Audit Services
The following categories of audit services are considered to be consistent with the role of the Fund’s independent accountants:
| | • | | Annual Fund financial statement audits |
| | • | | Seed audits (related to new product filings, as required) |
| | • | | SEC and regulatory filings and consents |
Audit-related Services
The following categories of audit-related services are considered to be consistent with the role of the Fund’s independent accountants:
| | • | | Accounting consultations |
| | • | | Fund merger support services |
| | • | | Agreed Upon Procedure Reports |
| | • | | Other Internal Control Reports |
Individual audit-related services that fall within one of these categories (except for fund merger support services) and are not presented to the Audit Committee as part of the annual pre-approval process are subject to an authorized pre-approval by the Audit Committee so long as the estimated fee for those services does not exceed $30,000. Any services provided under such pre-approval will be reported to the Audit Committee at its next regular meeting. Should the amount of such services exceed $30,000 any additional fees will be subject to pre-approval by the Committee Chair (or any other Committee member on whom this responsibility has been delegated). Fees related to fund merger support services are subject to a separate authorized
pre-approval by the Audit Committee with fees determined on a per occurrence and merger complexity basis.
Tax Services
The following categories of tax services are considered to be consistent with the role of the Fund’s independent accountants:
| | • | | Tax compliance services related to the filing or amendment of the following: |
| | • | | Federal, state and local income tax compliance; and, |
| | • | | Sales and use tax compliance |
| | • | | Timely RIC qualification reviews |
| | • | | Tax distribution analysis and planning |
| | • | | Tax authority examination services |
| | • | | Tax appeals support services |
| | • | | Accounting methods studies |
| | • | | Fund merger support services |
| | • | | Tax consulting services and related projects |
Individual tax services that fall within one of these categories and are not presented to the Audit Committee as part of the annual pre-approval process are subject to an authorized pre-approval by the Audit Committee so long as the estimated fee for those services does not exceed $30,000. Any services provided under such pre-approval will be reported to the Audit Committee at its next regular meeting. Should the amount of such services exceed $30,000 any additional fees will be subject to pre-approval by the Committee Chair (or any other Committee member on whom this responsibility has been delegated).
Other Non-Audit Services
Certain non-audit services that the independent accountants are legally permitted to render will be subject to pre-approval by the Committee or by one or more Committee members to whom the Committee has delegated this authority and who will report to the full Committee any pre-approval decisions made pursuant to this Policy. Non-audit services presented for pre-approval pursuant to this paragraph will be accompanied by a confirmation from both the Treasurer and the independent accountants that the proposed services will not adversely affect the independence of the independent accountants.
Proscribed Services
The Fund’s independent accountants will not render services in the following categories of non-audit services:
| | • | | Bookkeeping or other services related to the accounting records or financial statements of the Fund |
| | • | | Financial information systems design and implementation |
| | • | | Appraisal or valuation services, fairness opinions, or contribution-in-kind reports |
| | • | | Internal audit outsourcing services |
| | • | | Management functions or human resources |
| | • | | Broker or dealer, investment adviser, or investment banking services |
| | • | | Legal services and expert services unrelated to the audit |
| | • | | Any other service that the Public Company Accounting Oversight Board determines, by regulation, is impermissible. |
Pre-approval of Non-Audit Services Provided to Other Entities Within the PGIM Fund Complex
Certain non-audit services provided to PGIM Investments LLC or any of its affiliates that also provide ongoing services to the PGIM Mutual Funds will be subject to pre-approval by the Audit Committee. The only non-audit services provided to these entities that will require pre-approval are those related directly to the operations and financial reporting of the Funds.
Individual projects that are not presented to the Audit Committee as part of the annual pre-approval process will be subject to pre-approval by the Committee Chair (or any other Committee member on whom this responsibility has been delegated) so long as the estimated fee for those services does not exceed $30,000. Services presented for pre-approval pursuant to this paragraph will be accompanied by a confirmation from both the Treasurer and the independent accountants that the proposed services will not adversely affect the independence of the independent accountants.
Although the Audit Committee will not pre-approve all services provided to PGIM Investments LLC and its affiliates, the Committee will receive an annual report from the Fund’s independent accounting firm showing the aggregate fees for all services provided to PGIM Investments and its affiliates.
(e) (2) Percentage of services described in each of paragraphs (b) through (d) of this Item that were approved by the audit committee pursuant to paragraph (c)(7)(i)(C) of Rule 2-01 of Regulation S-X –
| | | | | | |
| | Fiscal Year Ended October 31, 2022 | | | | Fiscal Year Ended October 31, 2021 |
| 4(b) | | Not applicable. | | | | Not applicable. |
| 4(c) | | Not applicable. | | | | Not applicable. |
| 4(d) | | Not applicable. | | | | Not applicable. |
(f) Percentage of hours expended attributable to work performed by other than full time employees of principal accountant if greater than 50%.
The percentage of hours expended on the principal accountant’s engagement to audit the registrant’s financial statements for the most recent fiscal year that were attributed to work performed by persons other than the principal accountant’s full-time, permanent employees was 0%.
(g) Non-Audit Fees
The aggregate non-audit fees billed by the Registrant’s principal accountant for services rendered to the registrant’s investment adviser and any entity controlling, controlled by, or under common control with the investment adviser that provides ongoing services to the registrant for the fiscal years ended October 31, 2022 and October 31, 2021 was $0 and $0, respectively.
(h) Principal Accountant’s Independence
Not applicable as the Registrant’s principal accountant has not provided non-audit services to the registrant’s investment adviser and any entity controlling, controlled by, or under common control with the investment adviser that provides ongoing services to the registrant that were not pre-approved pursuant to Rule 2-01(c)(7)(ii) of Regulation S-X.
(i) Not applicable.
(j) Not applicable.
Item 5 – Audit Committee of Listed Registrants – Not applicable.
Item 6 – Schedule of Investments – The schedule is included as part of the report to shareholders filed under Item 1 of this Form.
Item 7 – Disclosure of Proxy Voting Policies and Procedures for Closed-End Management Investment Companies – Not applicable.
| | |
| Item 8 – | | Portfolio Managers of Closed-End Management Investment Companies – Not applicable. |
| | |
| Item 9 – | | Purchases of Equity Securities by Closed-End Management Investment Company and Affiliated Purchasers – Not applicable. |
| | |
| Item 10 – | | Submission of Matters to a Vote of Security Holders – There have been no material changes to these procedures. |
| | |
| Item 11 – | | Controls and Procedures |
| | (a) | It is the conclusion of the registrant’s principal executive officer and principal financial officer that the effectiveness of the registrant’s current disclosure controls and procedures (such disclosure controls and procedures having been evaluated within 90 days of the date of this filing) provide reasonable assurance that the information required to be disclosed by the registrant has been recorded, processed, summarized and reported within the time period specified in the Commission’s rules and forms and that the information required to be disclosed by the registrant has been accumulated and communicated to the registrant’s principal executive officer and principal financial officer in order to allow timely decisions regarding required disclosure. |
| | (b) | There has been no significant change in the registrant’s internal control over financial reporting (as defined in Rule 30a-3(d) under the Act (17 CFR 270.30a-3(d)) that occurred during the period covered by this report that has materially affected, or is reasonably likely to materially affect, the registrant’s internal control over financial reporting. |
Item 12 – Controls and Procedures - Disclosure of Securities Lending Activities for Closed-End Management Investment Companies – Not applicable.
Item 13 – Exhibits
SIGNATURES
Pursuant to the requirements of the Securities Exchange Act of 1934 and the Investment Company Act of 1940, the registrant has duly caused this report to be signed on its behalf by the undersigned, thereunto duly authorized.
| | |
| Registrant: | | Prudential World Fund, Inc. |
| |
| By: | | /s/ Andrew R. French |
| | Andrew R. French |
| | Secretary |
| |
| Date: | | December 19, 2022 |
Pursuant to the requirements of the Securities Exchange Act of 1934 and the Investment Company Act of 1940, this report has been signed below by the following persons on behalf of the registrant and in the capacities and on the dates indicated.
| | |
| By: | | /s/ Stuart S. Parker |
| | Stuart S. Parker |
| | President and Principal Executive Officer |
| |
| Date: | | December 19, 2022 |
| |
| By: | | /s/ Christian J. Kelly |
| | Christian J. Kelly |
| | Treasurer and Principal Financial and Accounting Officer |
| |
| Date: | | December 19, 2022 |