UNITED STATES
SECURITIES AND EXCHANGE COMMISSION
Washington, D.C. 20549
FORM N-CSR
CERTIFIED SHAREHOLDER REPORT OF REGISTERED MANAGEMENT INVESTMENT COMPANIES
| | |
| Investment Company Act file number: | | 811-03981 |
| |
| Exact name of registrant as specified in charter: | | Prudential World Fund, Inc. |
| |
| Address of principal executive offices: | | 655 Broad Street, 17th Floor |
| | | Newark, New Jersey 07102 |
| |
| Name and address of agent for service: | | Andrew R. French |
| | | 655 Broad Street, 17th Floor |
| | | Newark, New Jersey 07102 |
| |
| Registrant’s telephone number, including area code: | | 800-225-1852 |
| |
| Date of fiscal year end: | | 10/31/2021 |
| |
| Date of reporting period: | | 10/31/2021 |
Item 1 – Reports to Stockholders

PGIM QMA INTERNATIONAL EQUITY FUND
[Effective 12/29/21, fund name changes to PGIM Quant Solutions International Equity
Fund]
ANNUAL REPORT
OCTOBER 31, 2021

|
To enroll in e-delivery, go to pgim.com/investments/resource/edelivery |
Table of Contents
This report is not authorized for distribution to prospective investors unless preceded or accompanied by a current prospectus.
The views expressed in this report and information about the Fund’s portfolio holdings are for the period covered by this report and are subject to change thereafter.
Mutual funds are distributed by Prudential Investment Management Services LLC, a Prudential Financial company, member SIPC. PGIM Quantitative Solutions is the primary business name of PGIM Quantitative Solutions LLC (formerly known as QMA LLC), a wholly owned subsidiary of PGIM, Inc. (PGIM), a registered investment adviser and Prudential Financial company. © 2021 Prudential Financial, Inc. and its related entities. PGIM and the PGIM logo are service marks of Prudential Financial, Inc. and its related entities, registered in many jurisdictions worldwide.
| | |
| 2 | | Visit our website at pgim.com/investments |
Letter from the President
| | |
 | | Dear Shareholder: We hope you find the annual report for the PGIM QMA International Equity Fund informative and useful. The report covers performance for the 12-month period that ended October 31, 2021. The global economy and markets continued to recover throughout the period from the ongoing impact of the COVID-19 pandemic. The Federal Reserve slashed interest rates and kept them near zero to encourage borrowing. Congress passed stimulus bills worth several trillion dollars to help consumers and businesses. And several effective COVID-19 vaccines received regulatory approval. Those measures were enough to offset the |
fear of rising inflation and supply chain challenges that threatened to disrupt growth.
At the start of the period, stocks had recovered most of the steep losses they had suffered at the onset of the pandemic. Equities rallied as states reopened their economies but became more volatile as investors worried that a surge in COVID-19 infections would stall the recovery. However, rising corporate profits and economic growth, the resolution of the US presidential election, and the global rollout of approved vaccines lifted equity markets to record levels, helping stocks around the globe post gains for the full period.
Throughout this volatile period, investors sought safety in fixed income.
Investment-grade bonds in the US and the overall global bond market declined slightly during the period as the economy recovered, but emerging market debt rose. While the 10-year US Treasury yield hovered near record lows early in the period after a significant rally in interest rates, rates moved higher later on as investors began to focus on stronger economic growth and the prospects of higher inflation. The Fed also took several aggressive actions to keep the bond markets running smoothly, implementing many of the relief programs that proved to be successful in helping end the global financial crisis in 2008-09.
Regarding your investments with PGIM, we believe it is important to maintain a diversified portfolio of funds consistent with your tolerance for risk, time horizon, and financial goals. Your financial advisor can help you create a diversified investment plan that may include funds covering all the basic asset classes and that reflects your personal investor profile and risk tolerance. However, diversification and asset allocation strategies do not assure a profit or protect against loss in declining markets.
At PGIM Investments, we consider it a great privilege and responsibility to help investors participate in opportunities across global markets while meeting their toughest investment challenges. PGIM is a top-10 global investment manager with more than $1.5 trillion in assets under management. This scale and investment expertise allow us to deliver actively managed funds and strategies to meet the needs of investors around the globe.
Thank you for choosing our family of funds.
Sincerely,

Stuart S. Parker, President
PGIM QMA International Equity Fund
December 15, 2021
| | | | |
PGIM QMA International Equity Fund | | | 3 | |
Your Fund’s Performance (unaudited)
Performance data quoted represent past performance. Past performance does not guarantee future results. The investment return and principal value of an investment will fluctuate so that an investor’s shares, when redeemed, may be worth more or less than their original cost. Current performance may be lower or higher than the past performance data quoted. An investor may obtain performance data as of the most recent month-end by visiting our website at pgim.com/investments or by calling (800) 225-1852.
| | | | | | | | |
| |
| | | Average Annual Total Returns as of 10/31/21 |
| | | One Year (%) | | Five Years (%) | | Ten Years (%) | | Since Inception (%) |
| | | | |
| Class A | | | | | | | | |
| | | | |
| (with sales charges) | | 22.17 | | 6.87 | | 5.75 | | — |
| | | | |
| (without sales charges) | | 29.28 | | 8.08 | | 6.35 | | — |
| | | | |
| Class C | | | | | | | | |
| | | | |
| (with sales charges) | | 26.89 | | 7.07 | | 5.47 | | — |
| | | | |
| (without sales charges) | | 27.89 | | 7.07 | | 5.47 | | — |
| | | | |
| Class Z | | | | | | | | |
| | | | |
| (without sales charges) | | 29.85 | | 8.49 | | 6.72 | | — |
| | | | |
| Class R6 | | | | | | | | |
| | | | |
| (without sales charges) | | 29.96 | | N/A | | N/A | | 9.29 (12/28/2016) |
| | | | |
| MSCI All Country World Ex-US Index | | | | | | | | |
| | | | |
| | | 29.66 | | 9.77 | | 6.66 | | — |
| | |
|
| Average Annual Total Returns as of 10/31/21 Since Inception (%) |
| |
| | | Class R6 |
| |
| | | (12/28/2016) |
| |
| MSCI All Country World Ex-US Index | | 10.08 |
Since Inception returns are provided for any share class with less than 10 fiscal years of returns. Since Inception returns for the Index are measured from the closest month-end to the class’ inception date.
| | |
| 4 | | Visit our website at pgim.com/investments |
Growth of a $10,000 Investment (unaudited)
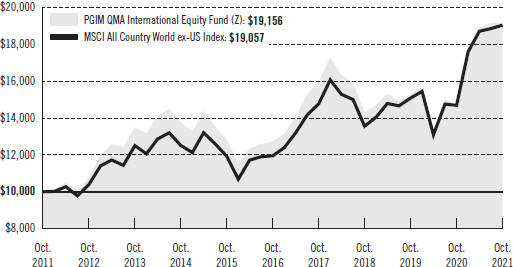
The graph compares a $10,000 investment in the Fund’s Class Z shares with a similar investment in the MSCI All Country World Ex-US Index by portraying the initial account values at the beginning of the 10-year period for Class Z shares (October 31, 2011) and the account values at the end of the current fiscal year (October 31, 2021), as measured on a quarterly basis. For purposes of the graph, and unless otherwise indicated, it has been assumed that (a) all recurring fees (including management fees) were deducted and (b) all dividends and distributions were reinvested. The line graph provides information for Class Z shares only. As indicated in the tables provided earlier, performance for other share classes will vary due to the differing fees and expenses applicable to each share class (as indicated in the following paragraphs). Without waiver of fees and/or expense reimbursements, if any, the returns would have been lower.
Past performance does not predict future performance. Total returns and the ending account values in the graph include changes in share price and reinvestment of dividends and capital gains distributions in a hypothetical investment for the periods shown. The Fund’s total returns do not reflect the deduction of income taxes on an individual’s investment. Taxes may reduce your actual investment returns on income or gains paid by the Fund or any gains you may realize if you sell your shares.
| | | | |
PGIM QMA International Equity Fund | | | 5 | |
Your Fund’s Performance (continued)
The returns in the tables do not reflect the deduction of taxes that a shareholder would pay on Fund distributions or following the redemption of Fund shares. The average annual total returns take into account applicable sales charges, which are described for each share class in the table below.
| | | | | | | | |
| | | | | |
| | | Class A | | Class C | | Class Z | | Class R6 |
| | | | | |
| Maximum initial sales charge | | 5.50% of the public offering price | | None | | None | | None |
| Contingent deferred sales charge (CDSC) (as a percentage of the lower of the original purchase price or the net asset value at redemption) | | 1.00% on sales of $1 million or more made within 12 months of purchase | | 1.00% on sales made within 12 months of purchase | | None | | None |
| Annual distribution and service (12b-1) fees (shown as a percentage of average daily net assets) | | 0.30% | | 1.00% | | None | | None |
Benchmark Definitions
MSCI All Country World Index ex-US Index—The Morgan Stanley Capital International All Country World ex-US Index (MSCI ACWI ex-US Index) is an unmanaged free float-adjusted market capitalization-weighted index that is designed to provide a broad measure of stock performance throughout the world, with the exception of US-based companies. The Index includes both developed and emerging markets.
Investors cannot invest directly in an index. The returns for the Index would be lower if they included the effects of sales charges, operating expenses of a mutual fund, or taxes that may be paid by an investor.
| | |
| 6 | | Visit our website at pgim.com/investments |
Presentation of Fund Holdings as of 10/31/21
| | | | | | |
| | | |
| Ten Largest Holdings | | Line of Business | | Country | | % of Net Assets |
| Taiwan Semiconductor Manufacturing Co. Ltd. | | Semiconductors & Semiconductor Equipment | | Taiwan | | 1.4% |
| ASML Holding NV | | Semiconductors & Semiconductor Equipment | | Netherlands | | 1.1% |
| iShares MSCI EAFE ETF | | Exchange Traded Funds | | United States | | 1.0% |
| Roche Holding AG | | Pharmaceuticals | | Switzerland | | 1.0% |
| Sanofi | | Pharmaceuticals | | France | | 0.9% |
| Unilever plc | | Personal Products | | United Kingdom | | 0.9% |
| Canadian Natural Resources Ltd. | | Oil, Gas & Consumable Fuels | | Canada | | 0.8% |
| Sberbank of Russia PJSC | | Banks | | Russia | | 0.8% |
| UBS Group AG | | Capital Markets | | Switzerland | | 0.8% |
| Tokyo Electron Ltd. | | Semiconductors & Semiconductor Equipment | | Japan | | 0.8% |
Holdings reflect only long-term investments and are subject to change.
| | | | |
PGIM QMA International Equity Fund | | | 7 | |
Strategy and Performance Overview (unaudited)
How did the Fund perform?
The PGIM QMA International Equity Fund’s Class Z shares returned 29.85% in the 12-month reporting period that ended October 31, 2021, outperforming the 29.66% return of the MSCI All Country World ex-US Index (the Index).
What were the market conditions?
| | ● | After a challenging 2020, equity markets bounced back sharply in the beginning of 2021. With the rollout and expansion of global vaccination programs signaling an imminent return to relative normality, the severe market volatility subsequent to the COVID-19 pandemic began to ease in favor of the broader markets as investors refocused their attention on company fundamentals. While value investments performed well in this environment, subsequent performance was more volatile with the global economic recovery still in doubt. Investor confidence surrounding global growth expectations ebbed and flowed with concerns about a new Delta variant, geopolitical stresses, rising interest rates, and inflationary pressures that were partly due to disruptions in the global supply chain. |
| | ● | In absolute terms, emerging markets underperformed developed markets during the reporting period, particularly among large-cap companies. China, the world’s second-largest economy, was one of the worst-performing international equity markets. With steep losses in July 2021, large-cap Chinese stocks plunged into negative territory as investors reacted harshly to increased regulatory pressures. |
What worked?
| | ● | The bounce back in value stocks during the reporting period, particularly in the beginning of 2021, was reinforced by the continued solid performance of growth stocks from the previous period. |
| | ● | Favoring reasonably priced, high-growth companies across the financials sector contributed to Fund returns relative to the Index during the period. The Fund tilted away from the Chinese consumer discretionary sector—particularly among Chinese internet businesses—that came under regulatory scrutiny during the second half of the period. |
What didn’t work?
| | ● | Higher-quality stocks detracted from Fund returns relative to the Index during the reporting period, as investor appetite for faster growth in lower-quality stocks superseded their appetite for companies with stronger balance sheets. |
| | ● | Favoring high-quality consumer discretionary companies was especially detrimental to Fund performance relative to the Index during the period. |
Did the Fund use derivatives?
The Fund held fully collateralized index futures during the period that were used for cash-management purposes. They had a negligible impact on performance.
| | |
| 8 | | Visit our website at pgim.com/investments |
Current outlook
| | ● | The global recovery from the pandemic-induced downturn was robust during the reporting period despite signs that economic activity may have hit a speed bump in the third quarter of 2021 as the Delta variant spread worldwide. Renewed lockdowns in certain countries and cautious behavior among consumers pushed down third-quarter growth expectations. |
| | ● | In China, economic growth was expected to slow during the second half of 2021 from the strong pace during the first half of the year following government regulatory crackdowns on certain sectors. However, China’s fiscal and monetary policies may become more supportive to protect growth, in PGIM Quantitative Solutions’ view. |
| | ● | Inflationary pressures weighed on investors and remained elevated during the period. Whether “transitory” or not, inflation may likely remain a concern in the near term. In addition, PGIM Quantitative Solutions believes pressures related to the pandemic may continue, and any monetary unwinding policies may be gradual in a market environment of strong consumer demand, lean inventories, and the normalization of service sector prices. |
| | ● | On the whole, the central banks of advanced economies maintained accommodative monetary policies, although there was a modest tilt toward a more hawkish position toward the end of the period. In emerging markets, central banks were divided between those hiking rates to address rising inflation—Russia, Brazil, Mexico, Peru, Pakistan, and Chile—and others supporting their economies from virus-related downside risks—India, China, and some southeast Asian countries. |
| | | | |
PGIM QMA International Equity Fund | | | 9 | |
Fees and Expenses (unaudited)
As a shareholder of the Fund, you incur two types of costs: (1) transaction costs, including sales charges (loads) on purchase payments and redemptions, as applicable, and (2) ongoing costs, including management fees, distribution and/or service (12b-1) fees, and other Fund expenses, as applicable. This example is intended to help you understand your ongoing costs (in dollars) of investing in the Fund and to compare these costs with the ongoing costs of investing in other mutual funds.
The example is based on an investment of $1,000 held through the six-month period ended October 31, 2021. The example is for illustrative purposes only; you should consult the Prospectus for information on initial and subsequent minimum investment requirements.
Actual Expenses
The first line for each share class in the table on the following page provides information about actual account values and actual expenses. You may use the information on this line, together with the amount you invested, to estimate the expenses that you paid over the period. Simply divide your account value by $1,000 (for example, an $8,600 account value ÷ $1,000 = 8.6), then multiply the result by the number on the first line under the heading “Expenses Paid During the Six-Month Period” to estimate the expenses you paid on your account during this period.
Hypothetical Example for Comparison Purposes
The second line for each share class in the table on the following page provides information about hypothetical account values and hypothetical expenses based on the Fund’s actual expense ratio and an assumed rate of return of 5% per year before expenses, which is not the Fund’s actual return. The hypothetical account values and expenses may not be used to estimate the actual ending account balance or expenses you paid for the period. You may use this information to compare the ongoing costs of investing in the Fund and other funds. To do so, compare this 5% hypothetical example with the 5% hypothetical examples that appear in the shareholder reports of the other funds.
The Fund’s transfer agent may charge additional fees to holders of certain accounts that are not included in the expenses shown in the table on the following page. These fees apply to individual retirement accounts (IRAs) and Section 403(b) accounts. As of the close of the six-month period covered by the table, IRA fees included an annual maintenance fee of $15 per account (subject to a maximum annual maintenance fee of $25 for all accounts held by the same shareholder). Section 403(b) accounts are charged an annual $25 fiduciary maintenance fee. Some of the fees may vary in amount, or may be waived, based on your total account balance or the number of PGIM funds, including the Fund, that you own. You should consider the additional fees that were charged to your Fund account over the six-month period when you estimate the total ongoing expenses paid over the period and the impact of these fees on your ending account value, as these additional expenses are not reflected in the information
| | |
| 10 | | Visit our website at pgim.com/investments |
provided in the expense table. Additional fees have the effect of reducing investment returns.
Please note that the expenses shown in the table are meant to highlight your ongoing costs only and do not reflect any transactional costs such as sales charges (loads). Therefore, the second line for each share class in the table is useful in comparing ongoing costs only and will not help you determine the relative total costs of owning different funds. In addition, if these transactional costs were included, your costs would have been higher.
| | | | | | | | | | |
| | | | |
PGIM QMA
International Equity Fund | | Beginning Account Value May 1, 2021 | | Ending Account Value October 31, 2021 | | Annualized
Expense
Ratio Based on
the Six-Month Period | | Expenses Paid
During the Six-Month Period* |
| Class A | | Actual | | $1,000.00 | | $1,009.40 | | 1.43% | | $ 7.24 |
| | Hypothetical | | $1,000.00 | | $1,018.00 | | 1.43% | | $ 7.27 |
| Class C | | Actual | | $1,000.00 | | $1,004.90 | | 2.55% | | $12.89 |
| | Hypothetical | | $1,000.00 | | $1,012.35 | | 2.55% | | $12.93 |
| Class Z | | Actual | | $1,000.00 | | $1,012.80 | | 1.02% | | $ 5.17 |
| | Hypothetical | | $1,000.00 | | $1,020.06 | | 1.02% | | $ 5.19 |
| Class R6 | | Actual | | $1,000.00 | | $1,012.80 | | 0.78% | | $ 3.96 |
| | | Hypothetical | | $1,000.00 | | $1,021.27 | | 0.78% | | $ 3.97 |
*Fund expenses (net of fee waivers or subsidies, if any) for each share class are equal to the annualized expense ratio for each share class (provided in the table), multiplied by the average account value over the period, multiplied by the 184 days in the six-month period ended October 31, 2021, and divided by the 365 days in the Fund’s fiscal year ended October 31, 2021 (to reflect the six-month period). Expenses presented in the table include the expenses of any underlying portfolios in which the Fund may invest.
| | | | |
PGIM QMA International Equity Fund | | | 11 | |
Schedule of Investments
as of October 31, 2021
| | | | | | | | |
| | |
Description | | Shares | | | Value | |
| | |
| LONG-TERM INVESTMENTS 97.9% | | | | | | |
| | |
| COMMON STOCKS 96.1% | | | | | | |
| | |
Australia 4.2% | | | | | | | | |
| | |
ARB Corp. Ltd. | | | 21,562 | | | $ | 790,406 | |
Australia & New Zealand Banking Group Ltd. | | | 25,521 | | | | 540,927 | |
BHP Group Ltd. | | | 26,938 | | | | 740,124 | |
BlueScope Steel Ltd. | | | 5,943 | | | | 92,690 | |
Charter Hall Group, REIT | | | 30,080 | | | | 393,373 | |
Dexus, REIT | | | 14,196 | | | | 116,459 | |
Fortescue Metals Group Ltd. | | | 90,554 | | | | 947,477 | |
Glencore PLC* | | | 91,744 | | | | 456,131 | |
Goodman Group, REIT | | | 39,487 | | | | 651,701 | |
JB Hi-Fi Ltd. | | | 14,097 | | | | 537,031 | |
Macquarie Group Ltd. | | | 4,894 | | | | 732,056 | |
Pinnacle Investment Management Group Ltd. | | | 65,696 | | | | 853,626 | |
Rio Tinto Ltd. | | | 3,792 | | | | 257,754 | |
Rio Tinto PLC | | | 25,628 | | | | 1,592,826 | |
Sonic Healthcare Ltd. | | | 30,903 | | | | 936,632 | |
Stockland, REIT | | | 163,588 | | | | 561,367 | |
Super Retail Group Ltd. | | | 49,600 | | | | 485,841 | |
West African Resources Ltd.* | | | 105,945 | | | | 102,626 | |
| | | | | | | | |
| | |
| | | | | | | 10,789,047 | |
| | |
Austria 0.6% | | | | | | | | |
| | |
OMV AG | | | 24,478 | | | | 1,491,156 | |
| | |
Belgium 0.2% | | | | | | | | |
| | |
Bekaert SA | | | 2,280 | | | | 99,568 | |
KBC Group NV | | | 2,356 | | | | 218,815 | |
Tessenderlo Group SA* | | | 4,801 | | | | 175,320 | |
| | | | | | | | |
| | |
| | | | | | | 493,703 | |
| | |
Brazil 1.0% | | | | | | | | |
| | |
Cia de Saneamento de Minas Gerais-COPASA | | | 207,100 | | | | 497,586 | |
Cia de Saneamento do Parana, UTS | | | 54,900 | | | | 177,916 | |
Petroleo Brasileiro SA | | | 33,100 | | | | 162,808 | |
Vale SA | | | 34,100 | | | | 433,818 | |
WEG SA | | | 182,500 | | | | 1,193,535 | |
| | | | | | | | |
| | |
| | | | | | | 2,465,663 | |
| | |
Canada 6.2% | | | | | | | | |
| | |
Alimentation Couche-Tard, Inc. (Class B Stock) | | | 36,000 | | | | 1,350,291 | |
Artis Real Estate Investment Trust, REIT | | | 14,000 | | | | 132,579 | |
See Notes to Financial Statements.
| | | | |
PGIM QMA International Equity Fund | | | 13 | |
Schedule of Investments (continued)
as of October 31, 2021
| | | | | | | | |
| | |
Description | | Shares | | | Value | |
| | |
| COMMON STOCKS (Continued) | | | | | | |
| | |
Canada (cont’d.) | | | | | | | | |
| | |
Bank of Montreal | | | 6,800 | | | $ | 738,297 | |
Canadian Imperial Bank of Commerce | | | 11,900 | | | | 1,443,942 | |
Canadian Natural Resources Ltd. | | | 50,000 | | | | 2,125,081 | |
Canadian Tire Corp. Ltd. (Class A Stock) | | | 700 | | | | 99,423 | |
Corus Entertainment, Inc. (Class B Stock) | | | 146,900 | | | | 665,893 | |
Fairfax Financial Holdings Ltd. | | | 300 | | | | 121,505 | |
Great-West Lifeco, Inc. | | | 3,400 | | | | 100,028 | |
Interfor Corp. | | | 41,400 | | | | 948,025 | |
Loblaw Cos. Ltd. | | | 3,900 | | | | 293,319 | |
Manulife Financial Corp. | | | 86,100 | | | | 1,677,336 | |
National Bank of Canada | | | 19,100 | | | | 1,581,275 | |
North West Co., Inc. (The) | | | 12,500 | | | | 339,670 | |
Royal Bank of Canada | | | 17,400 | | | | 1,811,141 | |
Thomson Reuters Corp. | | | 10,700 | | | | 1,287,095 | |
Toronto-Dominion Bank (The) | | | 16,700 | | | | 1,212,288 | |
| | | | | | | | |
| | |
| | | | | | | 15,927,188 | |
| | |
Chile 0.1% | | | | | | | | |
| | |
Banco Santander Chile | | | 2,377,221 | | | | 104,031 | |
Engie Energia Chile SA | | | 393,446 | | | | 228,740 | |
| | | | | | | | |
| | |
| | | | | | | 332,771 | |
| | |
China 10.2% | | | | | | | | |
| | |
Alibaba Group Holding Ltd.* | | | 67,000 | | | | 1,373,948 | |
Bank of Communications Co. Ltd. (Class H Stock) | | | 2,228,000 | | | | 1,326,818 | |
Baoshan Iron & Steel Co. Ltd. (Class A Stock) | | | 308,700 | | | | 342,684 | |
Beijing Enterprises Holdings Ltd. | | | 30,000 | | | | 115,727 | |
BYD Co. Ltd. (Class H Stock) | | | 32,500 | | | | 1,237,545 | |
China BlueChemical Ltd. (Class H Stock) | | | 1,792,000 | | | | 601,864 | |
China Construction Bank Corp. (Class H Stock) | | | 2,473,000 | | | | 1,683,895 | |
China Everbright Ltd. | | | 136,000 | | | | 153,333 | |
China Galaxy Securities Co. Ltd. (Class H Stock) | | | 178,500 | | | | 99,599 | |
China Hongqiao Group Ltd. | | | 592,500 | | | | 659,441 | |
China Medical System Holdings Ltd. | | | 498,000 | | | | 846,439 | |
China National Building Material Co. Ltd. (Class H Stock) | | | 72,000 | | | | 90,426 | |
China Petroleum & Chemical Corp. (Class H Stock) | | | 226,000 | | | | 111,144 | |
China Resources Sanjiu Medical & Pharmaceutical Co. Ltd. (Class A Stock) | | | 89,100 | | | | 335,513 | |
China Shenhua Energy Co. Ltd. (Class H Stock) | | | 570,000 | | | | 1,228,918 | |
Chlitina Holding Ltd. | | | 94,000 | | | | 809,612 | |
Chow Tai Fook Jewellery Group Ltd. | | | 672,600 | | | | 1,372,686 | |
CITIC Ltd. | | | 1,306,000 | | | | 1,310,965 | |
COFCO Joycome Foods Ltd.* | | | 390,000 | | | | 152,231 | |
See Notes to Financial Statements.
| | | | | | | | |
| | |
Description | | Shares | | | Value | |
| | |
| COMMON STOCKS (Continued) | | | | | | |
| | |
China (cont’d.) | | | | | | | | |
| | |
COSCO SHIPPING Holdings Co. Ltd. (Class H Stock)*(a) | | | 372,300 | | | $ | 578,759 | |
Country Garden Services Holdings Co. Ltd. | | | 14,000 | | | | 108,608 | |
CSPC Pharmaceutical Group Ltd. | | | 1,012,000 | | | | 1,062,332 | |
Daqo New Energy Corp., ADR* | | | 1,700 | | | | 132,243 | |
Ecovacs Robotics Co. Ltd. (Class A Stock) | | | 14,900 | | | | 399,556 | |
Industrial & Commercial Bank of China Ltd. (Class H Stock) | | | 534,000 | | | | 292,276 | |
Industrial Bank Co. Ltd. (Class A Stock) | | | 141,900 | | | | 413,487 | |
Intco Medical Technology Co. Ltd. (Class A Stock) | | | 36,564 | | | | 292,308 | |
Lenovo Group Ltd. | | | 656,000 | | | | 710,893 | |
Li Ning Co. Ltd. | | | 139,000 | | | | 1,543,987 | |
PetroChina Co. Ltd. (Class H Stock) | | | 2,004,000 | | | | 966,616 | |
Shaanxi Coal Industry Co. Ltd. (Class A Stock) | | | 172,900 | | | | 338,278 | |
Shanghai International Port Group Co. Ltd. (Class A Stock) | | | 402,600 | | | | 355,344 | |
SITC International Holdings Co. Ltd. | | | 26,000 | | | | 87,667 | |
Tencent Holdings Ltd. | | | 29,500 | | | | 1,793,551 | |
Wilmar International Ltd. | | | 320,700 | | | | 1,031,466 | |
Yunnan Baiyao Group Co. Ltd. (Class A Stock) | | | 27,900 | | | | 389,992 | |
Zhongsheng Group Holdings Ltd. | | | 153,500 | | | | 1,384,237 | |
Zhuzhou Kibing Group Co. Ltd. (Class A Stock) | | | 140,300 | | | | 348,478 | |
| | | | | | | | |
| | |
| | | | | | | 26,082,866 | |
| | |
Denmark 1.5% | | | | | | | | |
| | |
AP Moller - Maersk A/S (Class B Stock) | | | 545 | | | | 1,578,937 | |
Novo Nordisk A/S (Class B Stock) | | | 10,454 | | | | 1,145,738 | |
Pandora A/S | | | 925 | | | | 129,459 | |
Scandinavian Tobacco Group A/S, 144A | | | 45,256 | | | | 1,019,200 | |
| | | | | | | | |
| | |
| | | | | | | 3,873,334 | |
| | |
Finland 1.0% | | | | | | | | |
| | |
Fortum OYJ | | | 4,092 | | | | 121,706 | |
Nokia OYJ* | | | 50,112 | | | | 286,441 | |
Nordea Bank Abp | | | 154,917 | | | | 1,895,013 | |
Tokmanni Group Corp. | | | 8,643 | | | | 197,161 | |
| | | | | | | | |
| | |
| | | | | | | 2,500,321 | |
| | |
France 6.5% | | | | | | | | |
| | |
Amundi SA, 144A | | | 1,116 | | | | 99,557 | |
BNP Paribas SA | | | 27,363 | | | | 1,834,059 | |
Capgemini SE | | | 4,379 | | | | 1,022,931 | |
Cie de Saint-Gobain | | | 28,092 | | | | 1,940,382 | |
Cie Generale des Etablissements Michelin SCA | | | 8,405 | | | | 1,321,009 | |
Credit Agricole SA | | | 25,364 | | | | 382,788 | |
See Notes to Financial Statements.
| | | | |
PGIM QMA International Equity Fund | | | 15 | |
Schedule of Investments (continued)
as of October 31, 2021
| | | | | | | | |
| | |
Description | | Shares | | | Value | |
| | |
| COMMON STOCKS (Continued) | | | | | | |
| | |
France (cont’d.) | | | | | | | | |
| | |
Dassault Systemes SE | | | 24,752 | | | $ | 1,445,185 | |
Hermes International | | | 669 | | | | 1,062,777 | |
Ipsen SA | | | 12,270 | | | | 1,269,931 | |
IPSOS | | | 2,184 | | | | 102,245 | |
Kering SA | | | 692 | | | | 521,330 | |
LVMH Moet Hennessy Louis Vuitton SE | | | 1,106 | | | | 867,856 | |
Metropole Television SA | | | 7,770 | | | | 171,575 | |
Nexity SA | | | 3,317 | | | | 151,473 | |
Publicis Groupe SA | | | 2,300 | | | | 154,687 | |
Sanofi | | | 22,586 | | | | 2,263,727 | |
Sartorius Stedim Biotech | | | 336 | | | | 185,547 | |
Television Francaise 1 | | | 49,958 | | | | 536,358 | |
Trigano SA | | | 5,929 | | | | 1,112,539 | |
| | | | | | | | |
| | |
| | | | | | | 16,445,956 | |
| | |
Germany 5.0% | | | | | | | | |
| | |
Allianz SE | | | 3,529 | | | | 819,157 | |
Bayerische Motoren Werke AG | | | 2,990 | | | | 302,541 | |
Brenntag SE | | | 11,644 | | | | 1,110,576 | |
Covestro AG, 144A | | | 21,433 | | | | 1,378,614 | |
Deutsche Post AG | | | 28,630 | | | | 1,776,070 | |
E.ON SE | | | 47,725 | | | | 606,301 | |
Fresenius SE & Co. KGaA | | | 29,526 | | | | 1,341,611 | |
HeidelbergCement AG | | | 15,809 | | | | 1,190,845 | |
Merck KGaA | | | 8,039 | | | | 1,900,394 | |
ProSiebenSat.1 Media SE | | | 15,407 | | | | 258,702 | |
Puma SE | | | 1,000 | | | | 124,405 | |
SAP SE | | | 10,111 | | | | 1,463,516 | |
Secunet Security Networks AG | | | 234 | | | | 123,139 | |
Westwing Group AG* | | | 14,363 | | | | 451,796 | |
| | | | | | | | |
| | |
| | | | | | | 12,847,667 | |
| | |
Hong Kong 1.4% | | | | | | | | |
| | |
CK Asset Holdings Ltd. | | | 238,000 | | | | 1,471,312 | |
Link REIT, REIT | | | 11,500 | | | | 102,107 | |
Techtronic Industries Co. Ltd. | | | 64,000 | | | | 1,319,297 | |
Value Partners Group Ltd. | | | 947,000 | | | | 486,534 | |
Vinda International Holdings Ltd.(a) | | | 41,000 | | | | 113,295 | |
| | | | | | | | |
| | |
| | | | | | | 3,492,545 | |
| | |
India 3.1% | | | | | | | | |
| | |
Bajaj Consumer Care Ltd. | | | 210,926 | | | | 655,136 | |
See Notes to Financial Statements.
| | | | | | | | |
| | |
Description | | Shares | | | Value | |
| | |
| COMMON STOCKS (Continued) | | | | | | |
| | |
India (cont’d.) | | | | | | | | |
| | |
GAIL India Ltd. | | | 45,589 | | | $ | 91,195 | |
Indian Oil Corp. Ltd. | | | 63,147 | | | | 108,412 | |
NTPC Ltd. | | | 223,251 | | | | 397,349 | |
Oil & Natural Gas Corp. Ltd. | | | 825,061 | | | | 1,649,329 | |
Power Grid Corp. of India Ltd. | | | 530,365 | | | | 1,314,202 | |
Redington India Ltd. | | | 250,893 | | | | 484,581 | |
Sun Pharmaceutical Industries Ltd. | | | 10,710 | | | | 113,983 | |
Tata Steel Ltd. | | | 79,601 | | | | 1,406,403 | |
Tech Mahindra Ltd. | | | 74,796 | | | | 1,483,330 | |
Wipro Ltd. | | | 12,465 | | | | 107,884 | |
| | | | | | | | |
| | |
| | | | | | | 7,811,804 | |
| | |
Indonesia 0.4% | | | | | | | | |
| | |
Astra International Tbk PT | | | 233,100 | | | | 99,662 | |
First Pacific Co. Ltd. | | | 1,318,000 | | | | 527,801 | |
Telkom Indonesia Persero Tbk PT | | | 1,585,100 | | | | 425,896 | |
| | | | | | | | |
| | |
| | | | | | | 1,053,359 | |
| | |
Ireland 0.1% | | | | | | | | |
| | |
Kingspan Group PLC | | | 1,377 | | | | 157,853 | |
| | |
Israel 0.1% | | | | | | | | |
| | |
Bank Leumi Le-Israel BM | | | 13,684 | | | | 130,468 | |
| | |
Italy 1.3% | | | | | | | | |
| | |
Anima Holding SpA, 144A | | | 110,962 | | | | 586,958 | |
Buzzi Unicem SpA | | | 54,651 | | | | 1,271,341 | |
La Doria SpA | | | 9,811 | | | | 188,643 | |
Mediaset NV | | | 438,010 | | | | 1,231,057 | |
Poste Italiane SpA, 144A | | | 7,452 | | | | 106,138 | |
| | | | | | | | |
| | |
| | | | | | | 3,384,137 | |
| | |
Japan 15.0% | | | | | | | | |
| | |
Advantest Corp. | | | 1,800 | | | | 148,352 | |
Bridgestone Corp. | | | 32,100 | | | | 1,424,239 | |
Canon, Inc. | | | 63,300 | | | | 1,425,574 | |
Chugai Pharmaceutical Co. Ltd. | | | 37,200 | | | | 1,390,106 | |
Cosmo Energy Holdings Co. Ltd. | | | 8,800 | | | | 179,559 | |
Dai-ichi Life Holdings, Inc. | | | 80,000 | | | | 1,677,375 | |
Daiwa House Industry Co. Ltd. | | | 27,400 | | | | 904,547 | |
Digital Holdings, Inc. | | | 34,800 | | | | 534,659 | |
Fujitsu Ltd. | | | 9,400 | | | | 1,629,712 | |
See Notes to Financial Statements.
| | | | |
PGIM QMA International Equity Fund | | | 17 | |
Schedule of Investments (continued)
as of October 31, 2021
| | | | | | | | |
| | |
Description | | Shares | | | Value | |
| | |
| COMMON STOCKS (Continued) | | | | | | |
| | |
Japan (cont’d.) | | | | | | | | |
| | |
GungHo Online Entertainment, Inc. | | | 31,000 | | | $ | 583,217 | |
Hoya Corp. | | | 3,100 | | | | 457,960 | |
IDOM, Inc. | | | 36,500 | | | | 250,429 | |
Iida Group Holdings Co. Ltd. | | | 3,800 | | | | 93,897 | |
Isuzu Motors Ltd. | | | 39,300 | | | | 531,118 | |
ITmedia, Inc. | | | 5,200 | | | | 107,645 | |
ITOCHU Corp. | | | 54,300 | | | | 1,548,836 | |
Japan Post Bank Co. Ltd. | | | 12,000 | | | | 93,616 | |
Japan Post Holdings Co. Ltd. | | | 176,400 | | | | 1,351,828 | |
Japan Tobacco, Inc. | | | 75,100 | | | | 1,476,806 | |
KDDI Corp. | | | 20,700 | | | | 641,857 | |
Keyence Corp. | | | 200 | | | | 121,005 | |
KYB Corp. | | | 5,400 | | | | 144,803 | |
Marubeni Corp. | | | 22,700 | | | | 191,945 | |
McDonald’s Holdings Co. Japan Ltd. | | | 2,200 | | | | 98,331 | |
MCJ Co. Ltd. | | | 82,500 | | | | 930,989 | |
Medipal Holdings Corp. | | | 16,400 | | | | 296,715 | |
MISUMI Group, Inc. | | | 2,700 | | | | 113,196 | |
Mitsubishi Corp. | | | 11,400 | | | | 361,976 | |
Mitsubishi UFJ Financial Group, Inc. | | | 342,000 | | | | 1,863,526 | |
Mitsui & Co. Ltd. | | | 72,200 | | | | 1,647,473 | |
Mitsui Chemicals, Inc. | | | 2,900 | | | | 86,406 | |
MS&AD Insurance Group Holdings, Inc. | | | 4,100 | | | | 132,902 | |
Murata Manufacturing Co. Ltd. | | | 5,100 | | | | 390,102 | |
Nippon Telegraph & Telephone Corp. | | | 30,668 | | | | 859,932 | |
Nippon Yusen KK | | | 4,700 | | | | 339,535 | |
Nissha Co. Ltd. | | | 10,800 | | | | 177,052 | |
Nitto Kogyo Corp. | | | 8,400 | | | | 124,874 | |
Nomura Research Institute Ltd. | | | 2,900 | | | | 116,425 | |
NTT Data Corp. | | | 5,800 | | | | 116,514 | |
Oisix ra daichi, Inc.* | | | 9,300 | | | | 389,395 | |
Okamura Corp. | | | 37,800 | | | | 497,806 | |
Olympus Corp. | | | 10,600 | | | | 229,591 | |
Otsuka Holdings Co. Ltd. | | | 33,200 | | | | 1,314,631 | |
Panasonic Corp. | | | 123,800 | | | | 1,521,817 | |
Recruit Holdings Co. Ltd. | | | 12,100 | | | | 808,153 | |
Seiko Epson Corp. | | | 5,000 | | | | 89,290 | |
SG Holdings Co. Ltd. | | | 15,600 | | | | 391,195 | |
Shimadzu Corp. | | | 2,600 | | | | 105,888 | |
Shimamura Co. Ltd. | | | 2,000 | | | | 169,303 | |
Shimano, Inc. | | | 6,500 | | | | 1,814,438 | |
Shionogi & Co. Ltd. | | | 2,500 | | | | 162,774 | |
SMC Corp. | | | 600 | | | | 359,576 | |
Sony Group Corp. | | | 11,800 | | | | 1,365,010 | |
See Notes to Financial Statements.
| | | | | | | | |
| | |
Description | | Shares | | | Value | |
| | |
| COMMON STOCKS (Continued) | | | | | | |
| | |
Japan (cont’d.) | | | | | | | | |
| | |
Sumitomo Chemical Co. Ltd. | | | 19,800 | | | $ | 97,523 | |
Sumitomo Mitsui Financial Group, Inc. | | | 6,100 | | | | 199,078 | |
Tokyo Electron Ltd. | | | 4,300 | | | | 2,009,920 | |
Toyota Motor Corp. | | | 13,665 | | | | 242,017 | |
Transcosmos, Inc. | | | 4,400 | | | | 132,712 | |
Uchida Yoko Co. Ltd. | | | 4,400 | | | | 185,830 | |
Yamaha Motor Co. Ltd. | | | 34,800 | | | | 970,000 | |
YA-MAN Ltd. | | | 37,200 | | | | 395,459 | |
ZOZO, Inc. | | | 7,100 | | | | 228,757 | |
| | | | | | | | |
| | |
| | | | | | | 38,245,196 | |
| | |
Luxembourg 1.2% | | | | | | | | |
| | |
ArcelorMittal SA | | | 42,916 | | | | 1,462,246 | |
Eurofins Scientific SE | | | 13,345 | | | | 1,575,895 | |
| | | | | | | | |
| | |
| | | | | | | 3,038,141 | |
| | |
Malaysia 0.2% | | | | | | | | |
| | |
Hartalega Holdings Bhd | | | 108,000 | | | | 153,046 | |
Top Glove Corp. Bhd | | | 612,000 | | | | 402,477 | |
| | | | | | | | |
| | |
| | | | | | | 555,523 | |
| | |
Malta 0.4% | | | | | | | | |
| | |
Kindred Group PLC, SDR | | | 63,693 | | | | 892,820 | |
| | |
Mexico 0.2% | | | | | | | | |
| | |
America Movil SAB de CV (Class L Stock) | | | 433,100 | | | | 385,600 | |
Grupo Mexico SAB de CV (Class B Stock) | | | 29,800 | | | | 130,588 | |
| | | | | | | | |
| | |
| | | | | | | 516,188 | |
| | |
Netherlands 4.4% | | | | | | | | |
| | |
Adyen NV, 144A* | | | 506 | | | | 1,534,661 | |
ASM International NV | | | 2,836 | | | | 1,287,268 | |
ASML Holding NV | | | 3,335 | | | | 2,708,770 | |
EXOR NV | | | 1,092 | | | | 103,041 | |
Koninklijke Ahold Delhaize NV | | | 54,020 | | | | 1,756,651 | |
Koninklijke BAM Groep NV* | | | 47,196 | | | | 137,263 | |
Koninklijke KPN NV | | | 32,466 | | | | 97,270 | |
NN Group NV | | | 28,449 | | | | 1,519,703 | |
See Notes to Financial Statements.
| | | | |
PGIM QMA International Equity Fund | | | 19 | |
Schedule of Investments (continued)
as of October 31, 2021
| | | | | | | | |
| | |
Description | | Shares | | | Value | |
| | |
| COMMON STOCKS (Continued) | | | | | | |
| | |
Netherlands (cont’d.) | | | | | | | | |
| | |
Randstad NV | | | 17,419 | | | $ | 1,252,285 | |
Royal Dutch Shell PLC (Class A Stock) | | | 38,571 | | | | 886,504 | |
| | | | | | | | |
| | |
| | | | | | | 11,283,416 | |
| | |
Nigeria 0.1% | | | | | | | | |
| | |
Airtel Africa PLC, 144A | | | 189,841 | | | | 286,630 | |
| | |
Norway 0.1% | | | | | | | | |
| | |
DNB Bank ASA | | | 6,206 | | | | 147,551 | |
Equinor ASA | | | 9,120 | | | | 231,416 | |
| | | | | | | | |
| | |
| | | | | | | 378,967 | |
| | |
Pakistan 0.2% | | | | | | | | |
| | |
Engro Fertilizers Ltd. | | | 397,359 | | | | 165,911 | |
Fauji Fertilizer Co. Ltd. | | | 536,500 | | | | 322,529 | |
| | | | | | | | |
| | |
| | | | | | | 488,440 | |
| | |
Poland 0.2% | | | | | | | | |
| | |
Polskie Gornictwo Naftowe i Gazownictwo SA | | | 291,189 | | | | 439,494 | |
| | |
Portugal 0.0% | | | | | | | | |
| | |
Sonae SGPS SA | | | 96,430 | | | | 106,261 | |
| | |
Qatar 0.5% | | | | | | | | |
| | |
Industries Qatar QSC | | | 304,106 | | | | 1,324,153 | |
| | |
Russia 2.1% | | | | | | | | |
| | |
Inter RAO UES PJSC | | | 13,660,000 | | | | 927,778 | |
LUKOIL PJSC | | | 10,464 | | | | 1,069,138 | |
Novolipetsk Steel PJSC | | | 32,980 | | | | 104,392 | |
Rosneft Oil Co. PJSC | | | 129,152 | | | | 1,162,285 | |
Sberbank of Russia PJSC | | | 412,269 | | | | 2,075,287 | |
| | | | | | | | |
| | |
| | | | | | | 5,338,880 | |
| | |
Saudi Arabia 0.1% | | | | | | | | |
| | |
Riyad Bank | | | 43,643 | | | | 344,229 | |
| | |
Singapore 0.9% | | | | | | | | |
| | |
BW LPG Ltd., 144A | | | 44,089 | | | | 235,489 | |
See Notes to Financial Statements.
| | | | | | | | |
| | |
Description | | Shares | | | Value | |
| | |
| COMMON STOCKS (Continued) | | | | | | |
| | |
Singapore (cont’d.) | | | | | | | | |
| | |
DBS Group Holdings Ltd. | | | 80,000 | | | $ | 1,873,772 | |
Oversea-Chinese Banking Corp. Ltd. | | | 31,100 | | | | 272,798 | |
| | | | | | | | |
| | |
| | | | | | | 2,382,059 | |
| | |
South Africa 0.4% | | | | | | | | |
| | |
FirstRand Ltd. | | | 46,722 | | | | 177,613 | |
Impala Platinum Holdings Ltd. | | | 47,172 | | | | 614,472 | |
Sasol Ltd.* | | | 5,840 | | | | 98,151 | |
| | | | | | | | |
| | |
| | | | | | | 890,236 | |
| | |
South Korea 4.3% | | | | | | | | |
| | |
AfreecaTV Co. Ltd. | | | 1,288 | | | | 213,349 | |
BNK Financial Group, Inc. | | | 55,149 | | | | 415,961 | |
Hana Financial Group, Inc. | | | 39,518 | | | | 1,521,271 | |
Hankook Tire & Technology Co. Ltd. | | | 14,838 | | | | 526,221 | |
KB Financial Group, Inc. | | | 29,982 | | | | 1,451,173 | |
Kia Corp. | | | 20,503 | | | | 1,502,247 | |
Kumho Petrochemical Co. Ltd. | | | 2,784 | | | | 412,843 | |
LG Innotek Co. Ltd. | | | 1,872 | | | | 339,207 | |
MegaStudyEdu Co. Ltd. | | | 3,618 | | | | 238,550 | |
POSCO | | | 5,156 | | | | 1,309,058 | |
Samsung Electro-Mechanics Co. Ltd. | | | 672 | | | | 92,358 | |
Samsung Electronics Co. Ltd. | | | 22,822 | | | | 1,369,466 | |
Samsung Securities Co. Ltd. | | | 5,502 | | | | 224,068 | |
SK Telecom Co. Ltd. | | | 5,282 | | | | 1,401,091 | |
| | | | | | | | |
| | |
| | | | | | | 11,016,863 | |
| | |
Spain 0.6% | | | | | | | | |
| | |
Endesa SA | | | 45,884 | | | | 1,058,495 | |
Industria de Diseno Textil SA | | | 10,336 | | | | 373,961 | |
Telefonica SA | | | 48,222 | | | | 210,265 | |
| | | | | | | | |
| | |
| | | | | | | 1,642,721 | |
| | |
Sweden 1.9% | | | | | | | | |
| | |
Atlas Copco AB (Class B Stock) | | | 3,502 | | | | 189,992 | |
Evolution AB, 144A | | | 2,998 | | | | 485,969 | |
Industrivarden AB (Class C Stock) | | | 2,898 | | | | 94,152 | |
Skandinaviska Enskilda Banken AB (Class A Stock) | | | 81,694 | | | | 1,276,447 | |
Svenska Handelsbanken AB (Class A Stock) | | | 41,040 | | | | 470,441 | |
Swedbank AB (Class A Stock) | | | 68,354 | | | | 1,481,916 | |
See Notes to Financial Statements.
| | | | |
PGIM QMA International Equity Fund | | | 21 | |
Schedule of Investments (continued)
as of October 31, 2021
| | | | | | | | |
| | |
Description | | Shares | | | Value | |
| | |
| COMMON STOCKS (Continued) | | | | | | |
| | |
Sweden (cont’d.) | | | | | | | | |
| | |
Swedish Match AB | | | 64,712 | | | $ | 569,938 | |
Telefonaktiebolaget LM Ericsson (Class B Stock) | | | 17,214 | | | | 188,718 | |
| | | | | | | | |
| | | | | | | 4,757,573 | |
| | |
Switzerland 5.5% | | | | | | | | |
| | |
ALSO Holding AG* | | | 465 | | | | 137,523 | |
Chocoladefabriken Lindt & Spruengli AG | | | 1 | | | | 119,835 | |
Comet Holding AG | | | 546 | | | | 203,561 | |
Geberit AG | | | 1,944 | | | | 1,522,412 | |
Julius Baer Group Ltd. | | | 2,054 | | | | 148,794 | |
Kuehne + Nagel International AG | | | 4,316 | | | | 1,361,797 | |
Nestle SA | | | 13,388 | | | | 1,767,968 | |
Novartis AG | | | 5,637 | | | | 466,518 | |
Roche Holding AG | | | 6,321 | | | | 2,444,793 | |
Sensirion Holding AG, 144A* | | | 2,776 | | | | 400,135 | |
Sonova Holding AG | | | 3,811 | | | | 1,578,849 | |
STMicroelectronics NV | | | 15,760 | | | | 749,406 | |
Swisscom AG | | | 2,191 | | | | 1,193,480 | |
UBS Group AG | | | 111,696 | | | | 2,030,745 | |
| | | | | | | | |
| | |
| | | | | | | 14,125,816 | |
| | |
Taiwan 4.8% | | | | | | | | |
| | |
Asustek Computer, Inc. | | | 108,000 | | | | 1,378,172 | |
Cathay Financial Holding Co. Ltd. | | | 716,000 | | | | 1,495,233 | |
Chunghwa Telecom Co. Ltd. | | | 25,000 | | | | 99,347 | |
CTBC Financial Holding Co. Ltd. | | | 120,000 | | | | 100,238 | |
Evergreen Marine Corp. Taiwan Ltd. | | | 76,000 | | | | 275,996 | |
Fubon Financial Holding Co. Ltd. | | | 613,447 | | | | 1,624,035 | |
Giant Manufacturing Co. Ltd. | | | 9,000 | | | | 104,746 | |
Kindom Development Co. Ltd. | | | 159,000 | | | | 220,468 | |
MediaTek, Inc. | | | 43,000 | | | | 1,416,544 | |
momo.com, Inc. | | | 6,000 | | | | 388,542 | |
Nan Ya Plastics Corp. | | | 42,000 | | | | 128,801 | |
Nan Ya Printed Circuit Board Corp. | | | 8,000 | | | | 142,630 | |
Nantex Industry Co. Ltd. | | | 31,000 | | | | 91,452 | |
Novatek Microelectronics Corp. | | | 6,000 | | | | 90,569 | |
Realtek Semiconductor Corp. | | | 5,000 | | | | 90,351 | |
Taita Chemical Co. Ltd. | | | 279,600 | | | | 350,346 | |
Taiwan Semiconductor Manufacturing Co. Ltd. | | | 167,000 | | | | 3,548,932 | |
United Microelectronics Corp. | | | 324,000 | | | | 681,253 | |
Yuanta Financial Holding Co. Ltd. | | | 120,000 | | | | 106,888 | |
| | | | | | | | |
| | |
| | | | | | | 12,334,543 | |
See Notes to Financial Statements.
| | | | | | | | |
| | |
Description | | Shares | | | Value | |
| | |
| COMMON STOCKS (Continued) | | | | | | |
| | |
Thailand 0.0% | | | | | | | | |
| | |
AP Thailand PCL | | | 432,400 | | | $ | 115,586 | |
| | |
Turkey 1.1% | | | | | | | | |
| | |
Anadolu Efes Biracilik Ve Malt Sanayii A/S | | | 95,874 | | | | 221,259 | |
Coca-Cola Icecek A/S | | | 107,736 | | | | 955,493 | |
Enerjisa Enerji A/S, 144A | | | 674,021 | | | | 826,713 | |
Haci Omer Sabanci Holding A/S | | | 91,266 | | | | 105,887 | |
Kardemir Karabuk Demir Celik Sanayi ve Ticaret A/S (Class D Stock)* | | | 772,310 | | | | 599,695 | |
| | | | | | | | |
| | |
| | | | | | | 2,709,047 | |
| | |
Ukraine 0.1% | | | | | | | | |
| | |
Ferrexpo PLC | | | 55,720 | | | | 237,251 | |
| | |
United Arab Emirates 0.2% | | | | | | | | |
| | |
Aldar Properties PJSC | | | 99,225 | | | | 109,280 | |
Emirates Telecommunications Group Co. PJSC | | | 38,755 | | | | 270,366 | |
| | | | | | | | |
| | |
| | | | | | | 379,646 | |
| | |
United Kingdom 7.3% | | | | | | | | |
| | |
3i Group PLC | | | 77,042 | | | | 1,440,529 | |
888 Holdings PLC | | | 165,905 | | | | 872,199 | |
abrdn PLC | | | 26,817 | | | | 93,453 | |
Ashtead Group PLC | | | 7,831 | | | | 652,801 | |
Barratt Developments PLC | | | 11,151 | | | | 101,219 | |
British American Tobacco PLC | | | 54,329 | | | | 1,899,180 | |
CNH Industrial NV | | | 86,734 | | | | 1,489,098 | |
DCC PLC | | | 1,260 | | | | 104,921 | |
Dunelm Group PLC | | | 29,789 | | | | 521,346 | |
GlaxoSmithKline PLC | | | 46,470 | | | | 964,491 | |
Halfords Group PLC | | | 60,592 | | | | 222,965 | |
Imperial Brands PLC | | | 67,957 | | | | 1,437,412 | |
JD Sports Fashion PLC | | | 8,631 | | | | 128,512 | |
Kingfisher PLC | | | 282,954 | | | | 1,299,706 | |
Lloyds Banking Group PLC | | | 661,575 | | | | 454,697 | |
Man Group PLC | | | 171,027 | | | | 542,950 | |
Next PLC | | | 1,288 | | | | 139,880 | |
Persimmon PLC | | | 2,976 | | | | 110,684 | |
Reach PLC | | | 89,628 | | | | 388,557 | |
Safestore Holdings PLC, REIT | | | 32,233 | | | | 531,707 | |
SSE PLC | | | 9,243 | | | | 208,720 | |
Tesco PLC | | | 152,242 | | | | 563,877 | |
See Notes to Financial Statements.
| | | | |
PGIM QMA International Equity Fund | | | 23 | |
Schedule of Investments (continued)
as of October 31, 2021
| | | | | | | | |
| | |
Description | | Shares | | | Value | |
| | |
| COMMON STOCKS (Continued) | | | | | | |
| | |
United Kingdom (cont’d.) | | | | | | | | |
| | |
Unilever PLC | | | 40,752 | | | $ | 2,174,299 | |
Vodafone Group PLC | | | 697,359 | | | | 1,029,683 | |
WPP PLC | | | 83,348 | | | | 1,201,299 | |
| | | | | | | | |
| | |
| | | | | | | 18,574,185 | |
| | |
United States 1.4% | | | | | | | | |
| | |
Ferguson PLC | | | 13,213 | | | | 1,984,147 | |
JBS SA | | | 195,200 | | | | 1,354,758 | |
Schneider Electric SE | | | 594 | | | | 102,562 | |
| | | | | | | | |
| | |
| | | | | | | 3,441,467 | |
| | | | | | | | |
| | |
TOTAL COMMON STOCKS
(cost $214,737,098) | | | | | | | 245,125,169 | |
| | | | | | | | |
| | |
| EXCHANGE-TRADED FUND 1.0% | | | | | | |
| | |
United States | | | | | | | | |
| | |
iShares MSCI EAFE ETF
(cost $2,559,679) | | | 31,600 | | | | 2,543,484 | |
| | |
| PREFERRED STOCKS 0.8% | | | | | | |
| | |
Brazil 0.5% | | | | | | | | |
| | |
Cia Energetica de Minas Gerais (PRFC) | | | 266,900 | | | | 605,323 | |
Cia Paranaense de Energia (PRFC B) | | | 232,000 | | | | 244,176 | |
Petroleo Brasileiro SA (PRFC) | | | 120,400 | | | | 581,328 | |
| | | | | | | | |
| | | | | | | 1,430,827 | |
| | |
Germany 0.1% | | | | | | | | |
| | |
Sartorius AG (PRFC) | | | 248 | | | | 161,722 | |
| | |
South Korea 0.2% | | | | | | | | |
| | |
Samsung Electronics Co. Ltd. (PRFC) | | | 7,571 | | | | 416,032 | |
| | | | | | | | |
| | |
TOTAL PREFERRED STOCKS
(cost $1,777,939) | | | | | | | 2,008,581 | |
| | | | | | | | |
See Notes to Financial Statements.
| | | | | | | | | | | | | | | | |
| | | | |
Description | | | | | | | | Units | | | Value | |
| | |
| WARRANTS* 0.0% | | | | | | | |
| | |
| Malaysia | | | | | | | |
Comfort Glove Bhd, expiring 06/26/26 | | | | | | | | | |
(cost $0) | | | | 57,420 | | | $ | 3,328 | |
| | | | | | | | | | | | | | | | |
| | |
TOTAL LONG-TERM INVESTMENTS
(cost $219,074,716) | | | | | | | | 249,680,562 | |
| | | | | | | | | | | | | | | | |
| | | | |
| | | | | | | | | Shares | | | | |
| |
| SHORT-TERM INVESTMENTS 1.3% | | | | |
| |
| AFFILIATED MUTUAL FUNDS 1.1% | | | | |
PGIM Core Ultra Short Bond Fund(wa) | | | | 1,978,232 | | | | 1,978,232 | |
PGIM Institutional Money Market Fund
(cost $691,865; includes $691,840 of cash collateral for securities on loan)(b)(wa) | | | | 692,280 | | | | 691,865 | |
| | | | | | | | | | | | | | | | |
| | |
TOTAL AFFILIATED MUTUAL FUNDS
(cost $2,670,097) | | | | | | | | 2,670,097 | |
| | | | | | | | | | | | | | | | |
| | | | |
| | | Interest
Rate | | | Maturity
Date | | | Principal
Amount
(000)# | | | | |
| |
| U.S. TREASURY OBLIGATION(k)(n) 0.2% | | | | |
U.S. Treasury Bills
(cost $549,979) | | | 0.036 | % | | | 12/09/21 | | | | 550 | | | | 549,961 | |
| | | | | | | | | | | | | | | | |
| | | | |
TOTAL SHORT-TERM INVESTMENTS
(cost $3,220,076) | | | | | | | | | | | | | | | 3,220,058 | |
| | | | | | | | | | | | | | | | |
| | | | |
TOTAL INVESTMENTS 99.2%
(cost $222,294,792) | | | | | | | | | | | | | | | 252,900,620 | |
Other assets in excess of liabilities(z) 0.8% | | | | | | | | | | | | | | | 2,032,927 | |
| | | | | | | | | | | | | | | | |
| | | | |
NET ASSETS 100.0% | | | | | | | | | | | | | | $ | 254,933,547 | |
| | | | | | | | | | | | | | | | |
Below is a list of the abbreviation(s) used in the annual report:
USD—US Dollar
144A—Security was purchased pursuant to Rule 144A under the Securities Act of 1933 and, pursuant to the requirements of Rule 144A, may not be resold except to qualified institutional buyers.
ADR—American Depositary Receipt
EAFE—Europe, Australasia, Far East
ETF—Exchange-Traded Fund
LIBOR—London Interbank Offered Rate
MSCI—Morgan Stanley Capital International
PJSC—Public Joint-Stock Company
See Notes to Financial Statements.
| | | | |
PGIM QMA International Equity Fund | | | 25 | |
Schedule of Investments (continued)
as of October 31, 2021
PRFC—Preference Shares
REITs—Real Estate Investment Trust
SDR—Sweden Depositary Receipt
UTS—Unit Trust Security
| * | Non-income producing security. |
| # | Principal amount is shown in U.S. dollars unless otherwise stated. |
| (a) | All or a portion of security is on loan. The aggregate market value of such securities, including those sold and pending settlement, is $630,450; cash collateral of $691,840 (included in liabilities) was received with which the Fund purchased highly liquid short-term investments. In the event of significant appreciation in value of securities on loan on the last business day of the reporting period, the Fund may reflect a collateral value that is less than the market value of the loaned securities and such shortfall is remedied the following business day. |
| (b) | Represents security, or portion thereof, purchased with cash collateral received for securities on loan and includes dividend reinvestment. |
| (k) | Represents security, or a portion thereof, segregated as collateral for centrally cleared/exchange-traded derivatives. |
| (n) | Rate shown reflects yield to maturity at purchased date. |
| (wa) | PGIM Investments LLC, the manager of the Fund, also serves as manager of the PGIM Core Ultra Short Bond Fund and PGIM Institutional Money Market Fund, if applicable. |
| (z) | Includes net unrealized appreciation/(depreciation) and/or market value of the below holdings which are excluded from the Schedule of Investments: |
Futures contracts outstanding at October 31, 2021:
| | | | | | | | | | | | | | | | | | | | | | | | |
Number
of
Contracts | | | Type | | Expiration
Date | | | Current
Notional
Amount | | | Value /
Unrealized
Appreciation
(Depreciation) | |
| | | | | |
| | Long Positions: | | | | | | | | | | | | | | | | | | | | |
| | 27 | | | Mini MSCI EAFE Index | | | Dec. 2021 | | | $ | 3,158,460 | | | | | | | $ | (34,824 | ) | | | | |
| | 34 | | | Mini MSCI Emerging Markets Index | | | Dec. 2021 | | | | 2,145,400 | | | | | | | | (46,721 | ) | | | | |
| | | | | | | | | | | | | | | | | | | | | | | | |
| | | | | | | | | | | | | | | | | | $ | (81,545 | ) | | | | |
| | | | | | | | | | | | | | | | | | | | | | | | |
Summary of Collateral for Centrally Cleared/Exchange-traded Derivatives:
Cash and securities segregated as collateral, including pending settlement for closed positions, to cover requirements for centrally cleared/exchange-traded derivatives are listed by broker as follows:
| | | | | | | | | | | | | | | | | | | | | | |
Broker | | Cash and/or Foreign Currency | | | Securities Market Value | |
| Goldman Sachs & Co. LLC | | | | | | $ | — | | | | �� | | | | | | | $549,962 | | | | |
| | | | | | | | | | | | | | | | | | | | | | |
Fair Value Measurements:
Various inputs are used in determining the value of the Fund’s investments. These inputs are summarized in the three broad levels listed below.
Level 1—unadjusted quoted prices generally in active markets for identical securities.
Level 2—quoted prices for similar securities, interest rates and yield curves, prepayment speeds, foreign currency exchange rates and other observable inputs.
Level 3—unobservable inputs for securities valued in accordance with Board approved fair valuation procedures.
See Notes to Financial Statements.
The following is a summary of the inputs used as of October 31, 2021 in valuing such portfolio securities:
| | | | | | | | | | |
| | | Level 1 | | | Level 2 | | | Level 3 |
| Investments in Securities | | | | | | | | |
| Assets | | | | | | | | |
| Long-Term Investments | | | | | | | | |
| Common Stocks | | | | | | | | |
Australia | | | $ — | | | | $ 10,789,047 | | | $— |
Austria | | | — | | | | 1,491,156 | | | — |
Belgium | | | — | | | | 493,703 | | | — |
Brazil | | | 2,465,663 | | | | — | | | — |
Canada | | | 15,927,188 | | | | — | | | — |
Chile | | | 332,771 | | | | — | | | — |
China | | | 132,243 | | | | 25,950,623 | | | — |
Denmark | | | — | | | | 3,873,334 | | | — |
Finland | | | — | | | | 2,500,321 | | | — |
France | | | — | | | | 16,445,956 | | | — |
Germany | | | — | | | | 12,847,667 | | | — |
Hong Kong | | | — | | | | 3,492,545 | | | — |
India | | | — | | | | 7,811,804 | | | — |
Indonesia | | | — | | | | 1,053,359 | | | — |
Ireland | | | — | | | | 157,853 | | | — |
Israel | | | — | | | | 130,468 | | | — |
Italy | | | — | | | | 3,384,137 | | | — |
Japan | | | — | | | | 38,245,196 | | | — |
Luxembourg | | | — | | | | 3,038,141 | | | — |
Malaysia | | | — | | | | 555,523 | | | — |
Malta | | | — | | | | 892,820 | | | — |
Mexico | | | 516,188 | | | | — | | | — |
Netherlands | | | — | | | | 11,283,416 | | | — |
Nigeria | | | — | | | | 286,630 | | | — |
Norway | | | — | | | | 378,967 | | | — |
Pakistan | | | — | | | | 488,440 | | | — |
Poland | | | — | | | | 439,494 | | | — |
Portugal | | | — | | | | 106,261 | | | — |
Qatar | | | — | | | | 1,324,153 | | | — |
Russia | | | — | | | | 5,338,880 | | | — |
Saudi Arabia | | | — | | | | 344,229 | | | — |
Singapore | | | — | | | | 2,382,059 | | | — |
South Africa | | | — | | | | 890,236 | | | — |
South Korea | | | — | | | | 11,016,863 | | | — |
Spain | | | — | | | | 1,642,721 | | | — |
Sweden | | | — | | | | 4,757,573 | | | — |
Switzerland | | | — | | | | 14,125,816 | | | — |
Taiwan | | | — | | | | 12,334,543 | | | — |
Thailand | | | — | | | | 115,586 | | | — |
Turkey | | | — | | | | 2,709,047 | | | — |
Ukraine | | | — | | | | 237,251 | | | — |
United Arab Emirates | | | — | | | | 379,646 | | | — |
United Kingdom | | | — | | | | 18,574,185 | | | — |
United States | | | 1,354,758 | | | | 2,086,709 | | | — |
See Notes to Financial Statements.
| | | | |
PGIM QMA International Equity Fund | | | 27 | |
Schedule of Investments (continued)
as of October 31, 2021
| | | | | | | | | | |
| | | Level 1 | | | Level 2 | | | Level 3 |
| Investments in Securities (continued) | | | | | | | | |
| Assets (continued) | | | | | | | | |
| Long-Term Investments (continued) | | | | | | | | |
| Exchange-Traded Fund | | | | | | | | |
United States | | $ | 2,543,484 | | | $ | — | | | $— |
| Preferred Stocks | | | | | | | | |
Brazil | | | 1,430,827 | | | | — | | | — |
Germany | | | — | | | | 161,722 | | | — |
South Korea | | | — | | | | 416,032 | | | — |
| Warrants | | | | | | | | |
Malaysia | | | 3,328 | | | | — | | | — |
| Short-Term Investments | | | | | | | | |
Affiliated Mutual Funds | | | 2,670,097 | | | | — | | | — |
U.S. Treasury Obligation | | | — | | | | 549,961 | | | — |
| | | | | | | | | | |
Total | | $ | 27,376,547 | | | $ | 225,524,073 | | | $— |
| | | | | | | | | | |
| | | |
| Other Financial Instruments* | | | | | | | | |
| Liabilities | | | | | | | | |
Futures Contracts | | $ | (81,545 | ) | | $ | — | | | $— |
| | | | | | | | | | |
| * | Other financial instruments are derivative instruments not reflected in the Schedule of Investments, such as futures, forwards and centrally cleared swap contracts, which are recorded at the unrealized appreciation (depreciation) on the instrument, and OTC swap contracts which are recorded at fair value. |
Industry Classification:
The industry classification of investments and other assets in excess of liabilities shown as a percentage of net assets as of October 31, 2021 were as follows (unaudited):
| | | | |
Banks | | | 11.6 | % |
Pharmaceuticals | | | 6.2 | |
Semiconductors & Semiconductor Equipment | | | 5.2 | |
Oil, Gas & Consumable Fuels | | | 5.1 | |
Metals & Mining | | | 4.5 | |
Insurance | | | 4.1 | |
Trading Companies & Distributors | | | 2.9 | |
Capital Markets | | | 2.9 | |
Specialty Retail | | | 2.6 | |
IT Services | | | 2.5 | |
Tobacco | | | 2.5 | |
Technology Hardware, Storage & Peripherals | | | 2.5 | |
Automobiles | | | 2.3 | |
Electric Utilities | | | 2.2 | |
Media | | | 2.2 | |
Food Products | | | 2.0 | |
Textiles, Apparel & Luxury Goods | | | 1.7 | |
| | | | |
Auto Components | | | 1.7 | % |
Personal Products | | | 1.7 | |
Food & Staples Retailing | | | 1.6 | |
Building Products | | | 1.6 | |
Marine | | | 1.5 | |
Wireless Telecommunication Services | | | 1.5 | |
Chemicals | | | 1.4 | |
Household Durables | | | 1.3 | |
Machinery | | | 1.3 | |
Professional Services | | | 1.3 | |
Health Care Equipment & Supplies | | | 1.3 | |
Real Estate Management & Development | | | 1.3 | |
Diversified Telecommunication Services | | | 1.2 | |
Software | | | 1.2 | |
Internet & Direct Marketing Retail | | | 1.2 | |
See Notes to Financial Statements.
Industry Classification (continued):
| | | | |
Affiliated Mutual Funds (0.3% represents investments purchased with collateral from securities on loan) | | | 1.1 | % |
Industrial Conglomerates | | | 1.0 | |
Health Care Providers & Services | | | 1.0 | |
Construction Materials | | | 1.0 | |
Exchange-Traded Fund | | | 1.0 | |
Equity Real Estate Investment Trusts (REITs) | | | 1.0 | |
Electronic Equipment, Instruments & Components | | | 0.9 | |
Hotels, Restaurants & Leisure | | | 0.9 | |
Air Freight & Logistics | | | 0.9 | |
Interactive Media & Services | | | 0.8 | |
Leisure Products | | | 0.7 | |
Life Sciences Tools & Services | | | 0.7 | |
Electrical Equipment | | | 0.7 | |
Beverages | | | 0.5 | |
Paper & Forest Products | | | 0.4 | |
Water Utilities | | | 0.3 | |
Diversified Financial Services | | | 0.3 | |
| | | | |
Multi-Utilities | | | 0.2 | % |
Entertainment | | | 0.2 | |
U.S. Treasury Obligation | | | 0.2 | |
Commercial Services & Supplies | | | 0.2 | |
Communications Equipment | | | 0.2 | |
Multiline Retail | | | 0.2 | |
Independent Power & Renewable Electricity Producers | | | 0.2 | |
Transportation Infrastructure | | | 0.1 | |
Diversified Consumer Services | | | 0.1 | |
Gas Utilities | | | 0.1 | |
Construction & Engineering | | | 0.1 | |
Household Products | | | 0.1 | |
| | | | |
| | | 99.2 | |
Other assets in excess of liabilities | | | 0.8 | |
| | | | |
| | | 100.0 | % |
| | | | |
Effects of Derivative Instruments on the Financial Statements and Primary Underlying Risk Exposure:
The Fund invested in derivative instruments during the reporting period. The primary type of risk associated with these derivative instruments is equity contracts risk. See the Notes to Financial Statements for additional detail regarding these derivative instruments and their risks. The effect of such derivative instruments on the Fund’s financial position and financial performance as reflected in the Statement of Assets and Liabilities and Statement of Operations is presented in the summary below.
Fair values of derivative instruments as of October 31, 2021 as presented in the Statement of Assets and Liabilities:
| | | | | | | | | | | | | | | | | |
| | | Asset Derivatives | | Liability Derivatives |
Derivatives not accounted for as hedging instruments, carried at fair value | | Statement of
Assets and
Liabilities Location | | Fair
Value | | Statement of Assets and Liabilities Location | | Fair
Value |
Equity contracts | | | | — | | | | $ | — | | | Due from/to broker-variation margin futures | | | $ | 81,545 | * |
| | | | | | | | | | | | | | | | | |
| * | Includes cumulative appreciation (depreciation) as reported in the schedule of open futures and centrally cleared swap contracts. Only unsettled variation margin receivable (payable) is reported within the Statement of Assets and Liabilities. |
See Notes to Financial Statements.
| | | | |
PGIM QMA International Equity Fund | | | 29 | |
Schedule of Investments (continued)
as of October 31, 2021
The effects of derivative instruments on the Statement of Operations for the year ended October 31, 2021 are as follows:
| | |
Amount of Realized Gain (Loss) on Derivatives Recognized in Income |
Derivatives not accounted for as hedging instruments, carried at fair value | | Futures |
Equity contracts | | $53,301 |
|
Change in Unrealized Appreciation (Depreciation) on Derivatives Recognized in Income |
Derivatives not accounted for as hedging instruments, carried at fair value | | Futures |
| |
Equity contracts | | $(81,545) |
For the year ended October 31, 2021, the Fund’s average volume of derivative activities is as follows:
| | | | |
| | | Futures Contracts— Long Positions(1) | | |
| | $4,315,315 |
| (1) | Notional Amount in USD. |
Average volume is based on average quarter end balances as noted for the year ended October 31, 2021.
Financial Instruments/Transactions—Summary of Offsetting and Netting Arrangements:
The Fund entered into financial instruments/transactions during the reporting period that are either offset in accordance with current requirements or are subject to enforceable master netting arrangements or similar agreements that permit offsetting. The information about offsetting and related netting arrangements for financial instruments/transactions where the legal right to set-off exists is presented in the summary below.
Offsetting of financial instrument/transaction assets and liabilities:
| | | | | | | | | | | | | | | |
Description | | Gross Market
Value of
Recognized
Assets/(Liabilities) | | Collateral
Pledged/(Received)(1) | | Net
Amount |
Securities on Loan | | | $ | 630,450 | | | | $ | (630,450 | ) | | | $ | — | |
| | | | | | | | | | | | | | | |
| (1) | Collateral amount disclosed by the Fund is limited to the market value of financial instruments/transactions. |
See Notes to Financial Statements.
Statement of Assets and Liabilities
as of October 31, 2021
| | | | | |
Assets | | | | | |
Investments at value, including securities on loan of $630,450: | | | | | |
Unaffiliated investments (cost $219,624,695) | | | $ | 250,230,523 | |
Affiliated investments (cost $2,670,097) | | | | 2,670,097 | |
Foreign currency, at value (cost $791,641) | | | | 789,993 | |
Receivable for investments sold | | | | 11,053,983 | |
Tax reclaim receivable | | | | 719,026 | |
Dividends receivable | | | | 570,501 | |
Receivable for Fund shares sold | | | | 117,003 | |
Prepaid expenses | | | | 2,561 | |
| | | | | |
Total Assets | | | | 266,153,687 | |
| | | | | |
| |
| Liabilities | | |
Payable for investments purchased | | | | 9,705,929 | |
Payable to broker for collateral for securities on loan | | | | 691,840 | |
Accrued expenses and other liabilities | | | | 191,183 | |
Foreign capital gains tax liability accrued | | | | 187,739 | |
Payable for Fund shares purchased | | | | 161,174 | |
Management fee payable | | | | 133,198 | |
Affiliated transfer agent fee payable | | | | 62,610 | |
Distribution fee payable | | | | 46,856 | |
Due to broker—variation margin futures | | | | 38,627 | |
Directors’ fees payable | | | | 984 | |
| | | | | |
Total Liabilities | | | | 11,220,140 | |
| | | | | |
| |
Net Assets | | | $ | 254,933,547 | |
| | | | | |
| | | | | |
Net assets were comprised of: | | | | | |
Common stock, at par | | | $ | 296 | |
Paid-in capital in excess of par | | | | 201,091,327 | |
Total distributable earnings (loss) | | | | 53,841,924 | |
| | | | | |
Net assets, October 31, 2021 | | | $ | 254,933,547 | |
| | | | | |
See Notes to Financial Statements.
| | | | |
PGIM QMA International Equity Fund | | | 31 | |
Statement of Assets and Liabilities
as of October 31, 2021
| | | | | |
Class A | | | | | |
Net asset value and redemption price per share,
($176,479,220 ÷ 20,538,471 shares of common stock issued and outstanding) | | | $ | 8.59 | |
Maximum sales charge (5.50% of offering price) | | | | 0.50 | |
| | | | | |
Maximum offering price to public | | | $ | 9.09 | |
| | | | | |
| |
Class C | | | | | |
Net asset value, offering price and redemption price per share,
($2,335,097 ÷ 287,371 shares of common stock issued and outstanding) | | | $ | 8.13 | |
| | | | | |
| |
Class Z | | | | | |
Net asset value, offering price and redemption price per share,
($16,561,602 ÷ 1,906,959 shares of common stock issued and outstanding) | | | $ | 8.68 | |
| | | | | |
| |
Class R6 | | | | | |
Net asset value, offering price and redemption price per share,
($59,557,628 ÷ 6,843,110 shares of common stock issued and outstanding) | | | $ | 8.70 | |
| | | | | |
See Notes to Financial Statements.
Statement of Operations
Year Ended October 31, 2021
| | | | | |
Net Investment Income (Loss) | | | | | |
| |
Income | | | | | |
Unaffiliated dividend income (net of $826,530 foreign withholding tax) | | | $ | 8,343,894 | |
Income from securities lending, net (including affiliated income of $1,062) | | | | 31,656 | |
Affiliated dividend income | | | | 3,711 | |
| | | | | |
Total income | | | | 8,379,261 | |
| | | | | |
| |
Expenses | | | | | |
Management fee | | | | 1,759,233 | |
Distribution fee(a) | | | | 554,691 | |
Transfer agent’s fees and expenses (including affiliated expense of $318,999)(a) | | | | 631,034 | |
Custodian and accounting fees | | | | 184,253 | |
Registration fees(a) | | | | 52,988 | |
Shareholders’ reports | | | | 33,431 | |
Audit fee | | | | 32,133 | |
Legal fees and expenses | | | | 20,523 | |
Directors’ fees | | | | 12,451 | |
Miscellaneous | | | | 80,140 | |
| | | | | |
Total expenses | | | | 3,360,877 | |
Less: Fee waiver and/or expense reimbursement(a) | | | | (304,262 | ) |
| | | | | |
Net expenses | | | | 3,056,615 | |
| | | | | |
Net investment income (loss) | | | | 5,322,646 | |
| | | | | |
| |
| Realized And Unrealized Gain (Loss) On Investment And Foreign Currency Transactions | | |
Net realized gain (loss) on: | | | | | |
Investment transactions (including affiliated of $387) (net of foreign capital gains taxes $(258,359)) | | | | 30,675,370 | |
Futures transactions | | | | 53,301 | |
Foreign currency transactions | | | | (40,423 | ) |
| | | | | |
| | | | 30,688,248 | |
| | | | | |
Net change in unrealized appreciation (depreciation) on: | | | | | |
Investments (including affiliated of $(883)) (net of change in foreign capital gains taxes $(187,739)) | | | | 16,340,204 | |
Futures | | | | (81,545 | ) |
Foreign currencies | | | | (25,514 | ) |
| | | | | |
| | | | 16,233,145 | |
| | | | | |
Net gain (loss) on investment and foreign currency transactions | | | | 46,921,393 | |
| | | | | |
Net Increase (Decrease) In Net Assets Resulting From Operations | | | $ | 52,244,039 | |
| | | | | |
| (a) | Class specific expenses and waivers were as follows: |
| | | | | | | | | | | | | | | | |
| | | Class A | | | Class C | | | Class Z | | | Class R6 | |
Distribution fee | | | 530,252 | | | | 24,439 | | | | — | | | | — | |
Transfer agent’s fees and expenses | | | 592,074 | | | | 8,950 | | | | 28,207 | | | | 1,803 | |
Registration fees | | | 17,147 | | | | 11,218 | | | | 11,468 | | | | 13,155 | |
Fee waiver and/or expense reimbursement | | | (217,998 | ) | | | (3,014 | ) | | | (21,497 | ) | | | (61,753 | ) |
See Notes to Financial Statements.
| | | | |
PGIM QMA International Equity Fund | | | 33 | |
Statements of Changes in Net Assets
| | | | | | | | | | |
| |
| | | Year Ended
October 31, |
| | |
| | | 2021 | | 2020 |
| | |
Increase (Decrease) in Net Assets | | | | | | | | | | |
| | |
Operations | | | | | | | | | | |
Net investment income (loss) | | | $ | 5,322,646 | | | | $ | 3,174,147 | |
Net realized gain (loss) on investment and foreign currency transactions | | | | 30,688,248 | | | | | (4,689,465 | ) |
Net change in unrealized appreciation (depreciation) on investments and foreign currencies | | | | 16,233,145 | | | | | (8,409,553 | ) |
| | | | | | | | | | |
Net increase (decrease) in net assets resulting from operations | | | | 52,244,039 | | | | | (9,924,871 | ) |
| | | | | | | | | | |
| | |
Dividends and Distributions | | | | | | | | | | |
Distributions from distributable earnings | | | | | | | | | | |
Class A | | | | (2,396,047 | ) | | | | (4,101,945 | ) |
Class B | | | | — | | | | | (14,282 | ) |
Class C | | | | (9,676 | ) | | | | (50,447 | ) |
Class Z | | | | (272,737 | ) | | | | (386,163 | ) |
Class R6 | | | | (439,796 | ) | | | | (550,823 | ) |
| | | | | | | | | | |
| | | | (3,118,256 | ) | | | | (5,103,660 | ) |
| | | | | | | | | | |
Fund share transactions (Net of share conversions) | | | | | | | | | | |
Net proceeds from shares sold | | | | 61,325,609 | | | | | 37,395,853 | |
Net asset value of shares issued in reinvestment of dividends and distributions | | | | 3,075,128 | | | | | 5,027,591 | |
Cost of shares purchased | | | | (40,318,009 | ) | | | | (42,989,953 | ) |
| | | | | | | | | | |
Net increase (decrease) in net assets from Fund share transactions | | | | 24,082,728 | | | | | (566,509 | ) |
| | | | | | | | | | |
Total increase (decrease) | | | | 73,208,511 | | | | | (15,595,040 | ) |
| | |
Net Assets: | | | | | | | | | | |
Beginning of year | | | | 181,725,036 | | | | | 197,320,076 | |
| | | | | | | | | | |
End of year | | | $ | 254,933,547 | | | | $ | 181,725,036 | |
| | | | | | | | | | |
See Notes to Financial Statements.
Financial Highlights
| | | | | | | | | | | | | | | | | | | | |
| Class A Shares | |
| | | | | | Year Ended October 31, | | | | |
| | | 2021 | | | 2020 | | | 2019 | | | 2018 | | | 2017 | |
| Per Share Operating Performance(a): | | | | | | | | | | | | | | | | | | | | |
| Net Asset Value, Beginning of Year | | | $6.74 | | | | $7.19 | | | | $6.96 | | | | $7.95 | | | | $6.48 | |
| Income (loss) from investment operations: | | | | | | | | | | | | | | | | | | | | |
| Net investment income (loss) | | | 0.18 | | | | 0.11 | | | | 0.15 | | | | 0.16 | | | | 0.11 | |
| Net realized and unrealized gain (loss) on investment and foreign currency transactions | | | 1.78 | | | | (0.39 | ) | | | 0.28 | | | | (1.00 | ) | | | 1.49 | |
| Total from investment operations | | | 1.96 | | | | (0.28 | ) | | | 0.43 | | | | (0.84 | ) | | | 1.60 | |
| Less Dividends and Distributions: | | | | | | | | | | | | | | | | | | | | |
| Dividends from net investment income | | | (0.11 | ) | | | (0.17 | ) | | | (0.17 | ) | | | (0.15 | ) | | | (0.13 | ) |
| Distributions from net realized gains | | | - | | | | - | | | | (0.03 | ) | | | - | | | | - | |
| Total dividends and distributions | | | (0.11 | ) | | | (0.17 | ) | | | (0.20 | ) | | | (0.15 | ) | | | (0.13 | ) |
| Net asset value, end of year | | | $8.59 | | | | $6.74 | | | | $7.19 | | | | $6.96 | | | | $7.95 | |
| Total Return(b): | | | 29.28 | % | | | (4.07 | )% | | | 6.53 | % | | | (10.81 | )% | | | 25.17 | % |
| | | | | | | | | | | | | | | | | | | | | |
| Ratios/Supplemental Data: | | | | | | | | | | | | | | | |
| Net assets, end of year (000) | | | $176,479 | | | | $147,445 | | | | $173,103 | | | | $171,326 | | | | $207,626 | |
| Average net assets (000) | | | $176,751 | | | | $156,952 | | | | $172,031 | | | | $200,255 | | | | $192,517 | |
| Ratios to average net assets(c)(d): | | | | | | | | | | | | | | | | | | | | |
| Expenses after waivers and/or expense reimbursement | | | 1.43 | % | | | 1.47 | % | | | 1.48 | % | | | 1.34 | % | | | 1.58 | % |
| Expenses before waivers and/or expense reimbursement | | | 1.55 | % | | | 1.64 | % | | | 1.62 | % | | | 1.47 | % | | | 1.59 | % |
| Net investment income (loss) | | | 2.12 | % | | | 1.58 | % | | | 2.19 | % | | | 2.08 | % | | | 1.62 | % |
| Portfolio turnover rate(e) | | | 104 | % | | | 128 | % | | | 94 | % | | | 114 | % | | | 105 | % |
| (a) | Calculated based on average shares outstanding during the year. |
| (b) | Total return does not consider the effects of sales loads. Total return is calculated assuming a purchase of a share on the first day and a sale on the last day of each year reported and includes reinvestment of dividends and distributions, if any. Total returns may reflect adjustments to conform to GAAP. |
| (c) | Does not include expenses of the underlying portfolios in which the Fund invests. |
| (d) | Effective August 1, 2017, class specific expenses include transfer agent fees and expenses and registration fees, which are charged to their respective share class. |
| (e) | The Fund’s portfolio turnover rate is calculated in accordance with regulatory requirements, without regard to transactions involving short-term investments and certain derivatives. If such transactions were included, the Fund’s portfolio turnover rate may be higher. |
See Notes to Financial Statements.
| | | | |
PGIM QMA International Equity Fund | | | 35 | |
Financial Highlights (continued)
| | | | | | | | | | | | | | | | | | | | |
| Class C Shares | |
| | | | | | Year Ended October 31, | | | | |
| | | 2021 | | | 2020 | | | 2019 | | | 2018 | | | 2017 | |
| Per Share Operating Performance(a): | | | | | | | | | | | | | | | | | | | | |
| Net Asset Value, Beginning of Year | | | $6.38 | | | | $6.86 | | | | $6.64 | | | | $7.60 | | | | $6.20 | |
| Income (loss) from investment operations: | | | | | | | | | | | | | | | | | | | | |
| Net investment income (loss) | | | 0.07 | | | | 0.02 | | | | 0.07 | | | | 0.10 | | | | 0.06 | |
| Net realized and unrealized gain (loss) on investment and foreign currency transactions | | | 1.71 | | | | (0.38 | ) | | | 0.30 | | | | (0.97 | ) | | | 1.43 | |
| Total from investment operations | | | 1.78 | | | | (0.36 | ) | | | 0.37 | | | | (0.87 | ) | | | 1.49 | |
| Less Dividends and Distributions: | | | | | | | | | | | | | | | | | | | | |
| Dividends from net investment income | | | (0.03 | ) | | | (0.12 | ) | | | (0.12 | ) | | | (0.09 | ) | | | (0.09 | ) |
| Distributions from net realized gains | | | - | | | | - | | | | (0.03 | ) | | | - | | | | - | |
| Total dividends and distributions | | | (0.03 | ) | | | (0.12 | ) | | | (0.15 | ) | | | (0.09 | ) | | | (0.09 | ) |
| Net asset value, end of year | | | $8.13 | | | | $6.38 | | | | $6.86 | | | | $6.64 | | | | $7.60 | |
| Total Return(b): | | | 27.89 | % | | | (5.42 | )% | | | 5.77 | % | | | (11.52 | )% | | | 24.33 | % |
| | | | | | | | | | | | | | | | | | | | |
| Ratios/Supplemental Data: | |
| Net assets, end of year (000) | | | $2,335 | | | | $2,381 | | | | $2,928 | | | | $12,530 | | | | $16,661 | |
| Average net assets (000) | | | $2,444 | | | | $2,640 | | | | $7,163 | | | | $15,626 | | | | $15,736 | |
| Ratios to average net assets(c)(d): | | | | | | | | | | | | | | | | | | | | |
| Expenses after waivers and/or expense reimbursement | | | 2.61 | % | | | 2.81 | % | | | 2.25 | % | | | 2.10 | % | | | 2.32 | % |
| Expenses before waivers and/or expense reimbursement | | | 2.73 | % | | | 2.98 | % | | | 2.39 | % | | | 2.23 | % | | | 2.33 | % |
| Net investment income (loss) | | | 0.84 | % | | | 0.24 | % | | | 1.09 | % | | | 1.32 | % | | | 0.86 | % |
| Portfolio turnover rate(e) | | | 104 | % | | | 128 | % | | | 94 | % | | | 114 | % | | | 105 | % |
| (a) | Calculated based on average shares outstanding during the year. |
| (b) | Total return does not consider the effects of sales loads. Total return is calculated assuming a purchase of a share on the first day and a sale on the last day of each year reported and includes reinvestment of dividends and distributions, if any. Total returns may reflect adjustments to conform to GAAP. |
| (c) | Does not include expenses of the underlying portfolios in which the Fund invests. |
| (d) | Effective August 1, 2017, class specific expenses include transfer agent fees and expenses and registration fees, which are charged to their respective share class. |
| (e) | The Fund’s portfolio turnover rate is calculated in accordance with regulatory requirements, without regard to transactions involving short-term investments and certain derivatives. If such transactions were included, the Fund’s portfolio turnover rate may be higher. |
See Notes to Financial Statements.
| | | | | | | | | | | | | | | | | | | | |
| Class Z Shares | |
| | | | | | Year Ended October 31, | | | | |
| | | 2021 | | | 2020 | | | 2019 | | | 2018 | | | 2017 | |
| Per Share Operating Performance(a): | | | | | | | | | | | | | | | | | | | | |
| Net Asset Value, Beginning of Year | | | $6.81 | | | | $7.26 | | | | $7.02 | | | | $8.02 | | | | $6.54 | |
| Income (loss) from investment operations: | | | | | | | | | | | | | | | | | | | | |
| Net investment income (loss) | | | 0.22 | | | | 0.13 | | | | 0.18 | | | | 0.19 | | | | 0.11 | |
| Net realized and unrealized gain (loss) on investment and foreign currency transactions | | | 1.79 | | | | (0.37 | ) | | | 0.29 | | | | (1.02 | ) | | | 1.52 | |
| Total from investment operations | | | 2.01 | | | | (0.24 | ) | | | 0.47 | | | | (0.83 | ) | | | 1.63 | |
| Less Dividends and Distributions: | | | | | | | | | | | | | | | | | | | | |
| Dividends from net investment income | | | (0.14 | ) | | | (0.21 | ) | | | (0.20 | ) | | | (0.17 | ) | | | (0.15 | ) |
| Distributions from net realized gains | | | - | | | | - | | | | (0.03 | ) | | | - | | | | - | |
| Total dividends and distributions | | | (0.14 | ) | | | (0.21 | ) | | | (0.23 | ) | | | (0.17 | ) | | | (0.15 | ) |
| Net asset value, end of year | | | $8.68 | | | | $6.81 | | | | $7.26 | | | | $7.02 | | | | $8.02 | |
| Total Return(b): | | | 29.85 | % | | | (3.61 | )% | | | 7.05 | % | | | (10.59 | )% | | | 25.46 | % |
| | | | | | | | | | | | | | | | | | | | |
| Ratios/Supplemental Data: | |
| Net assets, end of year (000) | | | $16,562 | | | | $13,062 | | | | $14,753 | | | | $13,901 | | | | $17,344 | |
| Average net assets (000) | | | $17,429 | | | | $12,955 | | | | $13,815 | | | | $17,055 | | | | $21,567 | |
| Ratios to average net assets(c)(d): | | | | | | | | | | | | | | | | | | | | |
| Expenses after waivers and/or expense reimbursement | | | 1.01 | % | | | 1.09 | % | | | 1.03 | % | | | 1.00 | % | | | 1.31 | % |
| Expenses before waivers and/or expense reimbursement | | | 1.13 | % | | | 1.26 | % | | | 1.17 | % | | | 1.13 | % | | | 1.32 | % |
| Net investment income (loss) | | | 2.60 | % | | | 1.97 | % | | | 2.58 | % | | | 2.44 | % | | | 1.57 | % |
| Portfolio turnover rate(e) | | | 104 | % | | | 128 | % | | | 94 | % | | | 114 | % | | | 105 | % |
| (a) | Calculated based on average shares outstanding during the year. |
| (b) | Total return is calculated assuming a purchase of a share on the first day and a sale on the last day of each year reported and includes reinvestment of dividends and distributions, if any. Total returns may reflect adjustments to conform to GAAP. |
| (c) | Does not include expenses of the underlying portfolios in which the Fund invests. |
| (d) | Effective August 1, 2017, class specific expenses include transfer agent fees and expenses and registration fees, which are charged to their respective share class. |
| (e) | The Fund’s portfolio turnover rate is calculated in accordance with regulatory requirements, without regard to transactions involving short-term investments and certain derivatives. If such transactions were included, the Fund’s portfolio turnover rate may be higher. |
See Notes to Financial Statements.
| | | | |
PGIM QMA International Equity Fund | | | 37 | |
Financial Highlights (continued)
| | | | | | | | | | | | | | | | | | | | | | | | | | | | |
| Class R6 Shares | | | | |
| | | Year Ended October 31, | | | | | | December 28, 2016(a)
through October 31, 2017 | | | | |
| | | 2021 | | | 2020 | | | 2019 | | | 2018 | | | | | | | |
| Per Share Operating Performance(b): | | | | | | | | | | | | | | | | | | | | | | | | | | | | |
| Net Asset Value, Beginning of Period | | | $6.83 | | | | $7.27 | | | | $7.03 | | | | $8.04 | | | | | | | | $6.32 | | | | | |
| Income (loss) from investment operations: | | | | | | | | | | | | | | | | | | | | | | | | | | | | |
| Net investment income (loss) | | | 0.25 | | | | 0.16 | | | | 0.21 | | | | 0.21 | | | | | | | | 0.15 | | | | | |
| Net realized and unrealized gain (loss) on investment and foreign currency transactions | | | 1.78 | | | | (0.38 | ) | | | 0.27 | | | | (1.03 | ) | | | | | | | 1.57 | | | | | |
| Total from investment operations | | | 2.03 | | | | (0.22 | ) | | | 0.48 | | | | (0.82 | ) | | | | | | | 1.72 | | | | | |
| Less Dividends and Distributions: | | | | | | | | | | | | | | | | | | | | | | | | | | | | |
| Dividends from net investment income | | | (0.16 | ) | | | (0.22 | ) | | | (0.21 | ) | | | (0.19 | ) | | | | | | | - | | | | | |
| Distributions from net realized gains | | | - | | | | - | | | | (0.03 | ) | | | - | | | | | | | | - | | | | | |
| Total dividends and distributions | | | (0.16 | ) | | | (0.22 | ) | | | (0.24 | ) | | | (0.19 | ) | | | | | | | - | | | | | |
| Net asset value, end of period | | | $8.70 | | | | $6.83 | | | | $7.27 | | | | $7.03 | | | | | | | | $8.04 | | | | | |
| Total Return(c): | | | 29.96 | % | | | (3.26 | )% | | | 7.33 | % | | | (10.43 | )% | | | | | | | 27.22 | % | | | | |
| | | | | | | | | | | | | | | | | | | | | | | | | | | | |
| Ratios/Supplemental Data: | | | | | | | | | | | | | | | | | | | | | |
| Net assets, end of period (000) | | | $59,558 | | | | $18,837 | | | | $5,487 | | | | $36,552 | | | | | | | | $39,379 | | | | | |
| Average net assets (000) | | | $37,941 | | | | $18,273 | | | | $23,216 | | | | $38,947 | | | | | | | | $37,891 | | | | | |
| Ratios to average net assets(d)(e): | | | | | | | | | | | | | | | | | | | | | | | | | | | | |
| Expenses after waivers and/or expense reimbursement | | | 0.78 | % | | | 0.78 | % | | | 0.78 | % | | | 0.78 | % | | | | | | | 0.95 | %(f) | | | | |
| Expenses before waivers and/or expense reimbursement | | | 0.94 | % | | | 1.05 | % | | | 0.95 | % | | | 0.95 | % | | | | | | | 0.99 | %(f) | | | | |
| Net investment income (loss) | | | 2.92 | % | | | 2.33 | % | | | 3.06 | % | | | 2.61 | % | | | | | | | 2.45 | %(f) | | | | |
| Portfolio turnover rate(g) | | | 104 | % | | | 128 | % | | | 94 | % | | | 114 | % | | | | | | | 105 | % | | | | |
| (a) | Commencement of offering. |
| (b) | Calculated based on average shares outstanding during the period. |
| (c) | Total return is calculated assuming a purchase of a share on the first day and a sale on the last day of each period reported and includes reinvestment of dividends and distributions, if any. Total returns may reflect adjustments to conform to GAAP. Total returns for periods less than one full year are not annualized. |
| (d) | Does not include expenses of the underlying portfolios in which the Fund invests. |
| (e) | Effective August 1, 2017, class specific expenses include transfer agent fees and expenses and registration fees, which are charged to their respective share class. |
| (g) | The Fund’s portfolio turnover rate is calculated in accordance with regulatory requirements, without regard to transactions involving short-term investments and certain derivatives. If such transactions were included, the Fund’s portfolio turnover rate may be higher. |
See Notes to Financial Statements.
Notes to Financial Statements
1. Organization
Prudential World Fund, Inc. (the “Registered Investment Company” or “RIC”) is registered under the Investment Company Act of 1940, as amended (“1940 Act”), as an open-end management investment company. The RIC is organized as a Maryland Corporation and currently consists of seven separate funds: PGIM Emerging Markets Debt Hard Currency Fund, PGIM Emerging Markets Debt Local Currency Fund, PGIM Jennison Emerging Markets Equity Opportunities Fund, PGIM Jennison Global Infrastructure Fund, PGIM Jennison Global Opportunities Fund, PGIM Jennison International Opportunities Fund and PGIM QMA International Equity Fund. These financial statements relate only to the PGIM QMA International Equity Fund (the “Fund”). The Fund is classified as a diversified fund for purposes of the 1940 Act.
The investment objective of the Fund is to seek long-term growth of capital.
2. Accounting Policies
The Fund follows the investment company accounting and reporting guidance of the Financial Accounting Standards Board (“FASB”) Accounting Standard Codification (“ASC”) Topic 946 Financial Services — Investment Companies. The following is a summary of significant accounting policies followed by the Fund in the preparation of its financial statements. The policies conform to U.S. generally accepted accounting principles (“GAAP”). The Fund consistently follows such policies in the preparation of its financial statements.
Securities Valuation: The Fund holds securities and other assets and liabilities that are fair valued as of the close of each day (generally, 4:00 PM Eastern time) the New York Stock Exchange (“NYSE”) is open for trading. As described in further detail below, the Fund’s investments are valued daily based on a number of factors, including the type of investment and whether market quotations are readily available. The RIC’s Board of Directors (the “Board”) has adopted valuation procedures for security valuation under which fair valuation responsibilities have been delegated to PGIM Investments LLC (“PGIM Investments” or the “Manager”). Pursuant to the Board’s delegation, the Manager has established a Valuation Committee responsible for supervising the fair valuation of portfolio securities and other assets and liabilities. The valuation procedures permit the Fund to utilize independent pricing vendor services, quotations from market makers, and alternative valuation methods when market quotations are either not readily available or not deemed representative of fair value. Fair value is the price that would be received to sell an asset or paid to transfer a liability in an orderly transaction between market participants on the measurement date. A record of the Valuation Committee’s actions is subject to the Board’s review at its first quarterly meeting following the quarter in which such actions take place.
| | | | |
PGIM QMA International Equity Fund | | | 39 | |
Notes to Financial Statements (continued)
For the fiscal reporting year-end, securities and other assets and liabilities were fair valued at the close of the last U.S. business day. Trading in certain foreign securities may occur when the NYSE is closed (including weekends and holidays). Because such foreign securities trade in markets that are open on weekends and U.S. holidays, the values of some of the Fund’s foreign investments may change on days when investors cannot purchase or redeem Fund shares.
Various inputs determine how the Fund’s investments are valued, all of which are categorized according to the three broad levels (Level 1, 2, or 3) detailed in the Schedule of Investments and referred to herein as the “fair value hierarchy” in accordance with FASB ASC Topic 820 - Fair Value Measurements and Disclosures.
Common or preferred stocks, exchange-traded funds and derivative instruments, if applicable, that are traded on a national securities exchange are valued at the last sale price as of the close of trading on the applicable exchange where the security principally trades. Securities traded via NASDAQ are valued at the NASDAQ official closing price. To the extent these securities are valued at the last sale price or NASDAQ official closing price, they are classified as Level 1 in the fair value hierarchy. In the event that no sale or official closing price on valuation date exists, these securities are generally valued at the mean between the last reported bid and ask prices, or at the last bid price in the absence of an ask price. These securities are classified as Level 2 in the fair value hierarchy.
Foreign equities traded on foreign securities exchanges are generally valued using pricing vendor services that provide model prices derived using adjustment factors based on information such as local closing price, relevant general and sector indices, currency fluctuations, depositary receipts, and futures, as applicable. Securities valued using such model prices are classified as Level 2 in the fair value hierarchy. The models generate an evaluated adjustment factor for each security, which is applied to the local closing price to adjust it for post closing market movements up to the time the Fund is valued. Utilizing that evaluated adjustment factor, the vendor provides an evaluated price for each security. If the vendor does not provide an evaluated price, securities are valued in accordance with exchange-traded common and preferred stock valuation policies discussed above.
Investments in open-end funds (other than exchange-traded funds) are valued at their net asset values as of the close of the NYSE on the date of valuation. These securities are classified as Level 1 in the fair value hierarchy since they may be purchased or sold at their net asset values on the date of valuation.
Securities and other assets that cannot be priced according to the methods described above are valued based on pricing methodologies approved by the Board. In the event that unobservable inputs are used when determining such valuations, the securities will be
classified as Level 3 in the fair value hierarchy. Altering one or more unobservable inputs may result in a significant change to a Level 3 security’s fair value measurement.
When determining the fair value of securities, some of the factors influencing the valuation include: the nature of any restrictions on disposition of the securities; assessment of the general liquidity of the securities; the issuer’s financial condition and the markets in which it does business; the cost of the investment; the size of the holding and the capitalization of the issuer; the prices of any recent transactions or bids/offers for such securities or any comparable securities; any available analyst media or other reports or information deemed reliable by the Manager regarding the issuer or the markets or industry in which it operates. Using fair value to price securities may result in a value that is different from a security’s most recent closing price and from the price used by other unaffiliated mutual funds to calculate their net asset values.
Foreign Currency Translation: The books and records of the Fund are maintained in U.S. dollars. Foreign currency amounts are translated into U.S. dollars on the following basis:
(i) market value of investment securities, other assets and liabilities — at the exchange rate as of the valuation date;
(ii) purchases and sales of investment securities, income and expenses — at the rates of exchange prevailing on the respective dates of such transactions.
Although the net assets of the Fund are presented at the foreign exchange rates and market values at the close of the period, the Fund does not generally isolate that portion of the results of operations arising as a result of changes in the foreign exchange rates from the fluctuations arising from changes in the market prices of long-term portfolio securities held at the end of the period. Similarly, the Fund does not isolate the effect of changes in foreign exchange rates from the fluctuations arising from changes in the market prices of long-term portfolio securities sold during the period. Accordingly, holding period unrealized and realized foreign currency gains (losses) are included in the reported Net change in unrealized appreciation (depreciation) on investments and Net realized gains (losses) on investment transactions on the Statements of Operations.
Net realized gains (losses) on foreign currency transactions represent net foreign exchange gains (losses) from the disposition of holdings of foreign currencies, currency gains (losses) realized between the trade and settlement dates on investment transactions, and the difference between the amounts of interest, dividends and foreign withholding taxes recorded on the Fund’s books and the U.S. dollar equivalent amounts actually received or paid. Net unrealized currency gains (losses) arise from valuing foreign currency denominated assets and liabilities (other than investments) at period end exchange rates.
Financial Futures Contracts: A financial futures contract is an agreement to purchase (long) or sell (short) an agreed amount of securities at a set price for delivery on a future date. Upon entering into a financial futures contract, the Fund is required to pledge to the broker
| | | | |
PGIM QMA International Equity Fund | | | 41 | |
Notes to Financial Statements (continued)
an amount of cash and/or other assets equal to a certain percentage of the contract amount. This amount is known as the “initial margin.” Subsequent payments, known as “variation margin,” are made or received by the Fund each day, depending on the daily fluctuations in the value of the underlying security. Such variation margin is recorded for financial statement purposes on a daily basis as unrealized gain (loss). When the contract expires or is closed, the gain (loss) is realized and is presented in the Statement of Operations as net realized gain (loss) on futures transactions.
The Fund invested in financial futures contracts in order to hedge its existing portfolio securities, or securities the Fund intends to purchase, against fluctuations in value caused by changes in prevailing interest rates. Should interest rates move unexpectedly, the Fund may not achieve the anticipated benefits of the financial futures contracts and may realize a loss. The use of futures transactions involves the risk of imperfect correlation in movements in the price of futures contracts, interest rates and the underlying hedged assets. Since futures contracts are exchange-traded, there is minimal counterparty credit risk to the Fund since the exchanges’ clearinghouse acts as counterparty to all exchange-traded futures and guarantees the futures contracts against default.
Master Netting Arrangements: The RIC, on behalf of the Fund, is subject to various Master Agreements, or netting arrangements, with select counterparties. These are agreements which a subadviser may have negotiated and entered into on behalf of all or a portion of the Fund. A master netting arrangement between the Fund and the counterparty permits the Fund to offset amounts payable by the Fund to the same counterparty against amounts to be received; and by the receipt of collateral from the counterparty by the Fund to cover the Fund’s exposure to the counterparty. However, there is no assurance that such mitigating factors are easily enforceable. In addition to master netting arrangements, the right to set-off exists when all the conditions are met such that each of the parties owes the other determinable amounts, the reporting party has the right to set-off the amount owed with the amount owed by the other party, the reporting party intends to set-off and the right of set-off is enforceable by law.
Warrants: The Fund held warrants acquired either through a direct purchase or pursuant to corporate actions. Warrants entitle the holder to buy a proportionate amount of common stock, or such other security that the issuer may specify, at a specific price and time through the expiration dates. Such warrants are held as long positions by the Fund until exercised, sold or expired. Warrants are valued at fair value in accordance with the Board approved fair valuation procedures.
Securities Lending: The Fund lends its portfolio securities to banks and broker-dealers. The loans are secured by collateral at least equal to the market value of the securities loaned. Collateral pledged by each borrower is invested in an affiliated money market fund and is
marked to market daily, based on the previous day’s market value, such that the value of the collateral exceeds the value of the loaned securities. In the event of significant appreciation in value of securities on loan on the last business day of the reporting period, the financial statements may reflect a collateral value that is less than the market value of the loaned securities. Such shortfall is remedied as described above. Loans are subject to termination at the option of the borrower or the Fund. Upon termination of the loan, the borrower will return to the Fund securities identical to the loaned securities. The remaining maturities of the securities lending transactions are considered overnight and continuous. Should the borrower of the securities fail financially, the Fund has the right to repurchase the securities in the open market using the collateral.
The Fund recognizes income, net of any rebate and securities lending agent fees, for lending its securities in the form of fees or interest on the investment of any cash received as collateral. The borrower receives all interest and dividends from the securities loaned and such payments are passed back to the lender in amounts equivalent thereto, which are reflected in interest income or unaffiliated dividend income based on the nature of the payment on the Statement of Operations. The Fund also continues to recognize any unrealized gain (loss) in the market price of the securities loaned and on the change in the value of the collateral invested that may occur during the term of the loan. In addition, realized gain (loss) is recognized on changes in the value of the collateral invested upon liquidation of the collateral. Net earnings from securities lending are disclosed in the Statement of Operations.
Securities Transactions and Net Investment Income: Securities transactions are recorded on the trade date. Realized gains (losses) from investment and currency transactions are calculated on the specific identification method. Dividend income is recorded on the ex-date, or for certain foreign securities, when the Fund becomes aware of such dividends. Expenses are recorded on an accrual basis, which may require the use of certain estimates by management that may differ from actual. Net investment income or loss (other than class specific expenses and waivers, which are allocated as noted below) and unrealized and realized gains (losses) are allocated daily to each class of shares based upon the relative proportion of adjusted net assets of each class at the beginning of the day. Class specific expenses and waivers, where applicable, are charged to the respective share classes. Such class specific expenses and waivers include distribution fees and distribution fee waivers, shareholder servicing fees, transfer agent’s fees and expenses, registration fees and fee waivers and/or expense reimbursements, as applicable.
Taxes: It is the Fund’s policy to continue to meet the requirements of the Internal Revenue Code applicable to regulated investment companies and to distribute all of its taxable net investment income and capital gains, if any, to its shareholders. Therefore, no federal income tax provision is required. Withholding taxes on foreign dividends, interest and capital gains, if any, are recorded, net of reclaimable amounts, at the time the related income is earned.
| | | | |
PGIM QMA International Equity Fund | | | 43 | |
Notes to Financial Statements (continued)
The Fund is subject to foreign income taxes imposed by certain countries in which it invests. Additionally, capital gains realized upon disposition of securities issued in or by certain foreign countries are subject to capital gains tax imposed by those countries. All taxes are computed in accordance with the applicable foreign tax law, and, to the extent permitted, capital losses are used to offset capital gains. Taxes attributable to income are accrued by the Fund as a reduction of income. Current and deferred tax expense attributable to capital gains is reflected as a component of realized or change in unrealized gain/loss on securities in the accompanying financial statements. To the extent that the Fund has country specific capital loss carryforwards, such carryforwards are applied against net unrealized gains when determining the deferred tax liability. Any deferred tax liability incurred by the Fund is included in either Other liabilities or Deferred tax liability on the accompanying Statement of Assets and Liabilities.
Dividends and Distributions: The Fund expects to pay dividends from net investment income and distributions from net realized capital and currency gains, if any, annually. Dividends and distributions to shareholders, which are determined in accordance with federal income tax regulations and which may differ from GAAP, are recorded on the ex-date. Permanent book/tax differences relating to income and gain (loss) are reclassified between total distributable earnings (loss) and paid-in capital in excess of par, as appropriate.
Estimates: The preparation of financial statements requires management to make estimates and assumptions that affect the reported amounts and disclosures in the financial statements. Actual results could differ from those estimates.
The RIC, on behalf of the Fund, has a management agreement with the Manager. Pursuant to this agreement, the Manager has responsibility for all investment advisory services and supervises the subadviser’s performance of such services.
The Manager has entered into a subadvisory agreement with PGIM Quantitative Solutions LLC (formerly known as QMA LLC) (“PGIM Quantitative Solutions” or the “subadviser”). The Manager pays for the services of PGIM Quantitative Solutions.
The management fee paid to the Manager is accrued daily and payable monthly at an annual rate of 0.75% of the Fund’s average daily net assets up to $2 billion, 0.70% of the next $3 billion and 0.69% of the Fund’s average daily net assets over $5 billion. The effective management fee rate before any waivers and/or expense reimbursements was 0.75% for the year ended October 31, 2021.
The Manager has contractually agreed, through February 28, 2023, to limit total annual operating expenses after fee waivers and/or expense reimbursements to 0.78% of average daily net assets for Class R6 shares. This contractual waiver excludes interest, brokerage, taxes (such as income and foreign withholding taxes, stamp duty and deferred tax expenses), acquired fund fees and expenses, extraordinary expenses, and certain other Fund expenses such as dividend and interest expense and broker charges on short sales.
Where applicable, the Manager agrees to waive management fees or shared operating expenses on any share class to the same extent that it waives such expenses on any other share class. In addition, total annual operating expenses for Class R6 shares will not exceed total annual operating expenses for Class Z shares. Fees and/or expenses waived and/or reimbursed by the Manager may be recouped by the Manager within the same fiscal year during which such waiver/reimbursement is made if such recoupment can be realized without exceeding the expense limit in effect at the time of the recoupment for that fiscal year.
The RIC, on behalf of the Fund, has a distribution agreement with Prudential Investment Management Services LLC (“PIMS”), which acts as the distributor of the Class A, Class C, Class Z and Class R6 shares of the Fund. The Fund compensates PIMS for distributing and servicing the Fund’s Class A and Class C shares, pursuant to the plans of distribution (the “Distribution Plans”), regardless of expenses actually incurred by PIMS.
Pursuant to the Distribution Plans, the Fund compensates PIMS for distribution related activities at an annual rate of up to 0.30% and 1% of the average daily net assets of the Class A and Class C shares, respectively. The distribution fees are accrued daily and payable monthly. No distribution or service fees are paid to PIMS as distributor of the Class Z and Class R6 shares of the Fund.
For the year ended October 31, 2021, PIMS received $45,931 in front-end sales charges resulting from sales of Class A shares. Additionally, for the year ended October 31, 2021, PIMS received $500 and $51 in contingent deferred sales charges imposed upon redemptions by certain Class A and Class C shareholders, respectively. From these fees, PIMS paid such sales charges to broker-dealers, who in turn paid commissions to salespersons and incurred other distribution costs.
PGIM Investments, PIMS and PGIM Quantitative Solutions are indirect, wholly-owned subsidiaries of Prudential Financial, Inc. (“Prudential”).
| 4. | Other Transactions with Affiliates |
Prudential Mutual Fund Services LLC (“PMFS”), an affiliate of PGIM Investments and an indirect, wholly-owned subsidiary of Prudential, serves as the Fund’s transfer agent. Transfer agent’s fees and expenses in the Statement of Operations include certain out-of-pocket expenses paid to non-affiliates, where applicable.
| | | | |
PGIM QMA International Equity Fund | | | 45 | |
Notes to Financial Statements (continued)
The Fund may invest its overnight sweep cash in the PGIM Core Ultra Short Bond Fund (the “Core Fund”), and its securities lending cash collateral in the PGIM Institutional Money Market Fund (the “Money Market Fund”), each a fund of Prudential Investment Portfolios 2, registered under the 1940 Act and managed by PGIM Investments. PGIM Investments and/or its affiliates are paid fees or reimbursed for providing their services to the Core Fund and the Money Market Fund. In addition to the realized and unrealized gains on investments in the Core Fund and Money Market Fund, earnings from such investments are disclosed on the Statement of Operations as “Affiliated dividend income” and “Income from securities lending, net”, respectively.
The Fund may enter into certain securities purchase or sale transactions under Board approved Rule 17a-7 procedures. Rule 17a-7 is an exemptive rule under the 1940 Act, that subject to certain conditions, permits purchase and sale transactions among affiliated investment companies, or between an investment company and a person that is affiliated solely by reason of having a common (or affiliated) investment adviser, common directors/trustees, and/or common officers. For the year ended October 31, 2021, no 17a-7 transactions were entered into by the Fund.
The aggregate cost of purchases and proceeds from sales of portfolio securities (excluding short-term investments and U.S. Government securities) for the year ended October 31, 2021, were $256,137,345 and $234,553,613, respectively.
A summary of the cost of purchases and proceeds from sales of shares of affiliated mutual funds for the year ended October 31, 2021, is presented as follows:
| | | | | | | | | | | | | | | | | | | | | | | | | | | | | | | | | | | | | | |
Value,
Beginning
of Year | | Cost of
Purchases | | Proceeds
from Sales | | Change in
Unrealized
Gain
(Loss) | | Realized
Gain
(Loss) | | Value, End of Year | | Shares, End of Year | | Income |
|
| Short-Term Investments - Affiliated Mutual Funds: |
|
| PGIM Core Ultra Short Bond Fund (1)(wa) |
| | $ | — | | | | $ | 77,541,280 | | | | $ | 75,563,048 | | | | $ | — | | | | $ | — | | | | $ | 1,978,232 | | | | | 1,978,232 | | | | $ | 3,711 | |
|
| PGIM Institutional Money Market Fund (1)(b)(wa) |
| | | 2,142,391 | | | | | 44,060,235 | | | | | 45,510,265 | | | | | (883 | ) | | | | 387 | | | | | 691,865 | | | | | 692,280 | | | | | 1,062 | (2) |
| | | | | | | | | | | | | | | | | | | | | | | | | | | | | | | | | | | | | | | |
| | $ | 2,142,391 | | | | $ | 121,601,515 | | | | $ | 121,073,313 | | | | $ | (883 | ) | | | $ | 387 | | | | $ | 2,670,097 | | | | | | | | | $ | 4,773 | |
| | | | | | | | | | | | | | | | | | | | | | | | | | | | | | | | | | | | | | | |
| (1) | The Fund did not have any capital gain distributions during the reporting period. |
| (2) | The amount, or a portion thereof, represents the affiliated securities lending income shown on the Statement of Operations. |
| (b) | Represents security, or portion thereof, purchased with cash collateral received for securities on loan and includes dividend reinvestment. |
| (wa) | PGIM Investments LLC, the manager of the Fund, also serves as manager of the PGIM Core Ultra Short Bond Fund and PGIM Institutional Money Market Fund, if applicable. |
| 6. | Distributions and Tax Information |
Distributions to shareholders, which are determined in accordance with federal income tax regulations and which may differ from GAAP, are recorded on the ex-date.
For the year ended October 31, 2021, the tax character of dividends paid by the Fund was $3,118,256 of ordinary income. For the year ended October 31, 2020, the tax character of dividends paid by the Fund was $5,103,660 of ordinary income.
As of October 31, 2021, the accumulated undistributed earnings on a tax basis were $5,897,249 of ordinary income and $18,404,639 of long-term capital gains.
The United States federal income tax basis of the Fund’s investments and the net unrealized appreciation as of October 31, 2021 were as follows:
| | | | | | |
| Tax Basis | | Gross Unrealized Appreciation | | Gross Unrealized Depreciation | | Net Unrealized Appreciation |
|
| $223,279,039 | | $42,659,684 | | $(13,119,648) | | $29,540,036 |
The difference between GAAP and tax basis were primarily due to deferred losses on wash sales, investments in passive foreign investment companies and other cost basis differences between financial and tax accounting.
The Fund utilized approximately $11,135,000 of its capital loss carryforward to offset net taxable gains realized in the fiscal year ended October 31, 2021.
The Manager has analyzed the Fund’s tax positions taken on federal, state and local income tax returns for all open tax years and has concluded that no provision for income tax is required in the Fund’s financial statements for the current reporting period. Since tax authorities can examine previously filed tax returns, the Fund’s U.S. federal and state tax returns for each of the four fiscal years up to the most recent fiscal year ended October 31, 2021 are subject to such review.
The Fund offers Class A, Class C, Class Z and Class R6 shares. Class A shares are sold with a maximum front-end sales charge of 5.50%. Investors who purchase $1 million or more of Class A shares and sell these shares within 12 months of purchase are subject to a contingent deferred sales charge (“CDSC”) of 1%, although they are not subject to an initial sales charge. The Class A CDSC is waived for certain retirement and/or benefit plans. A special exchange privilege is also available for shareholders who qualified to purchase Class A shares at net asset value. Class C shares are sold with a CDSC of 1% on sales made
| | | | |
PGIM QMA International Equity Fund | | | 47 | |
Notes to Financial Statements (continued)
within 12 months of purchase. Class C shares will automatically convert to Class A shares on a monthly basis approximately eight years (ten years prior to January 22, 2021) after purchase. Class Z and Class R6 shares are not subject to any sales or redemption charges and are available exclusively for sale to a limited group of investors.
Under certain circumstances, an exchange may be made from specified share classes of the Fund to one or more other share classes of the Fund as presented in the table of transactions in shares of common stock, below.
The RIC is authorized to issue 10,225,000,000 shares of common stock, $0.00001 par value per share, 700,000,000 of which are designated as shares of the Fund. The authorized shares of the Fund are currently classified and designated as follows:
| | | | |
Class A | | | 100,000,000 | |
Class B | | | 5,000,000 | |
Class C | | | 100,000,000 | |
Class Z | | | 180,000,000 | |
Class T | | | 135,000,000 | |
Class R6 | | | 180,000,000 | |
The Fund currently does not have any Class B or Class T shares outstanding.
As of October 31, 2021, Prudential, through its affiliated entities, including affiliated funds (if applicable), owned shares of the Fund as follows:
| | | | |
| | | Number of Shares | | Percentage of
Outstanding Shares |
Class A | | 25,997 | | 0.1% |
Class Z | | 59,594 | | 3.1% |
Class R6 | | 4,151,316 | | 60.7% |
At the reporting period end, the number of shareholders holding greater than 5% of the Fund are as follows:
| | | | | | |
| Affiliated | | Unaffiliated |
Number of
Shareholders | | Percentage of
Outstanding Shares | | Number of
Shareholders | | Percentage of
Outstanding Shares |
1 | | 14.2% | | 2 | | 28.6% |
Transactions in shares of common stock were as follows:
| | | | | | | | |
Class A | | Shares | | | Amount | |
Year ended October 31, 2021: | | | | | | | | |
Shares sold | | | 522,326 | | | $ | 4,350,877 | |
Shares issued in reinvestment of dividends and distributions | | | 303,876 | | | | 2,355,040 | |
Shares purchased | | | (2,142,395 | ) | | | (17,663,059 | ) |
| | | | | | | | |
Net increase (decrease) in shares outstanding before conversion | | | (1,316,193 | ) | | | (10,957,142 | ) |
Shares issued upon conversion from other share class(es) | | | 76,135 | | | | 638,374 | |
Shares purchased upon conversion into other share class(es) | | | (83,956 | ) | | | (687,747 | ) |
| | | | | | | | |
Net increase (decrease) in shares outstanding | | | (1,324,014 | ) | | $ | (11,006,515 | ) |
| | | | | | | | |
Year ended October 31, 2020: | | | | | | | | |
Shares sold | | | 363,428 | | | $ | 2,502,991 | |
Shares issued in reinvestment of dividends and distributions | | | 543,821 | | | | 4,029,714 | |
Shares purchased | | | (3,165,455 | ) | | | (21,483,425 | ) |
| | | | | | | | |
Net increase (decrease) in shares outstanding before conversion | | | (2,258,206 | ) | | | (14,950,720 | ) |
Shares issued upon conversion from other share class(es) | | | 161,310 | | | | 1,060,950 | |
Shares purchased upon conversion into other share class(es) | | | (115,083 | ) | | | (742,300 | ) |
| | | | | | | | |
Net increase (decrease) in shares outstanding | | | (2,211,979 | ) | | $ | (14,632,070 | ) |
| | | | | | | | |
| | |
Class B | | | | | | |
Period ended June 26, 2020*: | | | | | | | | |
Shares sold | | | 1,146 | | | $ | 8,082 | |
Shares issued in reinvestment of dividends and distributions | | | 2,005 | | | | 14,254 | |
Shares purchased | | | (11,027 | ) | | | (74,364 | ) |
| | | | | | | | |
Net increase (decrease) in shares outstanding before conversion | | | (7,876 | ) | | | (52,028 | ) |
Shares purchased upon conversion into other share class(es) | | | (145,104 | ) | | | (906,295 | ) |
| | | | | | | | |
Net increase (decrease) in shares outstanding | | | (152,980 | ) | | $ | (958,323 | ) |
| | | | | | | | |
| | |
Class C | | | | | | |
Year ended October 31, 2021: | | | | | | | | |
Shares sold | | | 63,864 | | | $ | 500,477 | |
Shares issued in reinvestment of dividends and distributions | | | 1,308 | | | | 9,676 | |
Shares purchased | | | (78,344 | ) | | | (603,675 | ) |
| | | | | | | | |
Net increase (decrease) in shares outstanding before conversion | | | (13,172 | ) | | | (93,522 | ) |
Shares purchased upon conversion into other share class(es) | | | (72,437 | ) | | | (578,256 | ) |
| | | | | | | | |
Net increase (decrease) in shares outstanding | | | (85,609 | ) | | $ | (671,778 | ) |
| | | | | | | | |
Year ended October 31, 2020: | | | | | | | | |
Shares sold | | | 40,927 | | | $ | 274,529 | |
Shares issued in reinvestment of dividends and distributions | | | 7,008 | | | | 49,758 | |
Shares purchased | | | (78,307 | ) | | | (518,507 | ) |
| | | | | | | | |
Net increase (decrease) in shares outstanding before conversion | | | (30,372 | ) | | | (194,220 | ) |
Shares purchased upon conversion into other share class(es) | | | (23,655 | ) | | | (154,655 | ) |
| | | | | | | | |
Net increase (decrease) in shares outstanding | | | (54,027 | ) | | $ | (348,875 | ) |
| | | | | | | | |
| | | | |
PGIM QMA International Equity Fund | | | 49 | |
Notes to Financial Statements (continued)
| | | | | | | | |
Class Z | | Shares | | | Amount | |
Year ended October 31, 2021: | | | | | | | | |
Shares sold | | | 775,378 | | | $ | 6,613,085 | |
Shares issued in reinvestment of dividends and distributions | | | 34,694 | | | | 270,616 | |
Shares purchased | | | (312,006 | ) | | | (2,648,533 | ) |
| | | | | | | | |
Net increase (decrease) in shares outstanding before conversion | | | 498,066 | | | | 4,235,168 | |
Shares issued upon conversion from other share class(es) | | | 77,788 | | | | 642,192 | |
Shares purchased upon conversion into other share class(es) | | | (587,122 | ) | | | (5,149,861 | ) |
| | | | | | | | |
Net increase (decrease) in shares outstanding | | | (11,268 | ) | | $ | (272,501 | ) |
| | | | | | | | |
Year ended October 31, 2020: | | | | | | | | |
Shares sold | | | 483,883 | | | $ | 3,262,094 | |
Shares issued in reinvestment of dividends and distributions | | | 51,415 | | | | 383,042 | |
Shares purchased | | | (712,115 | ) | | | (4,770,026 | ) |
| | | | | | | | |
Net increase (decrease) in shares outstanding before conversion | | | (176,817 | ) | | | (1,124,890 | ) |
Shares issued upon conversion from other share class(es) | | | 67,705 | | | | 447,052 | |
Shares purchased upon conversion into other share class(es) | | | (4,131 | ) | | | (24,558 | ) |
| | | | | | | | |
Net increase (decrease) in shares outstanding | | | (113,243 | ) | | $ | (702,396 | ) |
| | | | | | | | |
| | |
Class R6 | | | | | | |
Year ended October 31, 2021: | | | | | | | | |
Shares sold | | | 5,725,833 | | | $ | 49,861,170 | |
Shares issued in reinvestment of dividends and distributions | | | 56,384 | | | | 439,796 | |
Shares purchased | | | (2,282,912 | ) | | | (19,402,742 | ) |
| | | | | | | | |
Net increase (decrease) in shares outstanding before conversion | | | 3,499,305 | | | | 30,898,224 | |
Shares issued upon conversion from other share class(es) | | | 584,743 | | | | 5,135,298 | |
| | | | | | | | |
Net increase (decrease) in shares outstanding | | | 4,084,048 | | | $ | 36,033,522 | |
| | | | | | | | |
Year ended October 31, 2020: | | | | | | | | |
Shares sold | | | 4,369,581 | | | $ | 31,348,157 | |
Shares issued in reinvestment of dividends and distributions | | | 73,936 | | | | 550,823 | |
Shares purchased | | | (2,489,567 | ) | | | (16,143,631 | ) |
| | | | | | | | |
Net increase (decrease) in shares outstanding before conversion | | | 1,953,950 | | | | 15,755,349 | |
Shares issued upon conversion from other share class(es) | | | 50,529 | | | | 319,806 | |
| | | | | | | | |
Net increase (decrease) in shares outstanding | | | 2,004,479 | | | $ | 16,075,155 | |
| | | | | | | | |
| * | Effective June 26, 2020, all of the issued and outstanding Class B shares of the Fund converted into Class A shares. |
The RIC, on behalf of the Fund, along with other affiliated registered investment companies (the “Participating Funds”), is a party to a Syndicated Credit Agreement (“SCA”) with a group of banks. The purpose of the SCA is to provide an alternative source of temporary funding for capital share redemptions. The table below provides details of the current SCA in effect at the reporting period-end as well as the prior SCA.
| | | | |
| | | Current SCA | | Prior SCA |
Term of Commitment | | 10/1/2021 – 9/29/2022 | | 10/2/2020 – 9/30/2021 |
Total Commitment | | $ 1,200,000,000 | | $ 1,200,000,000 |
| | | | |
| | | Current SCA | | Prior SCA |
| Annualized Commitment Fee on the Unused Portion of the SCA | | 0.15% | | 0.15% |
| | | |
| Annualized Interest Rate on Borrowings | | 1.20% plus the higher of (1) the effective federal funds rate, (2) the one-month LIBOR rate or (3) zero
percent | | 1.30% plus the higher of (1) the effective federal funds rate, (2) the one-month LIBOR rate or (3) zero
percent |
Certain affiliated registered investment companies that are parties to the SCA include portfolios that are subject to a predetermined mathematical formula used to manage certain benefit guarantees offered under variable annuity contracts. The formula may result in large scale asset flows into and out of these portfolios. Consequently, these portfolios may be more likely to utilize the SCA for purposes of funding redemptions. It may be possible for those portfolios to fully exhaust the committed amount of the SCA, thereby requiring the Manager to allocate available funding per a Board-approved methodology designed to treat the Participating Funds in the SCA equitably.
The Fund utilized the SCA during the year ended October 31, 2021. The average daily balance for the 39 days that the Fund had loans outstanding during the period was approximately $953,436, borrowed at a weighted average interest rate of 1.42%. The maximum loan outstanding amount during the period was $4,989,000. At October 31, 2021, the Fund did not have an outstanding loan amount.
| 9. | Risks of Investing in the Fund |
The Fund’s risks include, but are not limited to, some or all of the risks discussed below. For further information on the Fund’s risks, please refer to the Fund’s Prospectus and Statement of Additional Information.
Active Trading Risk: The Fund actively and frequently trades its portfolio securities. High portfolio turnover results in higher transaction costs, which can affect the Fund’s performance and have adverse tax consequences. In addition, high portfolio turnover may also mean that a proportionately greater amount of distributions to shareholders will be taxed as ordinary income rather than long-term capital gains compared to investment companies with lower portfolio turnover.
Core Style Risk: The Fund’s core investment style may subject the Fund to risks of both value and growth investing. The portion of the Fund’s portfolio that makes investments pursuant to a growth strategy may be subject to above-average fluctuations as a result of seeking higher than average capital growth. The portion of the portfolio that makes investments pursuant to a value strategy may be subject to the risk that the market may not recognize a security’s intrinsic value for long periods of time or that a stock judged to be undervalued may actually be appropriately priced. Issuers of value stocks may have experienced adverse business developments or may be subject to special risks that have caused the stock to be out of favor. If the Fund’s assessment of market conditions or a
| | | | |
PGIM QMA International Equity Fund | | | 51 | |
Notes to Financial Statements (continued)
company’s value is inaccurate, the Fund could suffer losses or produce poor performance relative to other funds. Historically, growth stocks have performed best during later stages of economic expansion and value stocks have performed best during periods of economic recovery. Therefore, both styles over time go in and out of favor with the markets. At times when a style is out of favor, that portion of the portfolio may lag the other portion of the portfolio, which may cause the Fund to underperform the market in general, its benchmark and other mutual funds. Growth and value stocks have historically produced similar long-term results, though each category has periods when it outperforms the other.
Currency Risk: The Fund’s net asset value could decline as a result of changes in exchange rates, which could adversely affect the Fund’s investments in currencies, or in securities that trade in, and receive revenues related to, currencies, or in derivatives that provide exposure to currencies. Certain foreign countries may impose restrictions on the ability of issuers of foreign securities to make payment of principal and interest or dividends to investors located outside the country, due to blockage of foreign currency exchanges or otherwise.
Economic and Market Events Risk: Events in the U.S. and global financial markets, including actions taken by the U.S. Federal Reserve or foreign central banks to stimulate or stabilize economic growth or the functioning of the securities markets, may at times result in unusually high market volatility, which could negatively impact performance. Relatively reduced liquidity in credit and fixed income markets could adversely affect issuers worldwide.
Emerging Markets Risk: The risks of foreign investments are greater for investments in or exposed to emerging markets. Emerging market countries typically have economic and political systems that are less fully developed, and can be expected to be less stable, than those of more developed countries. For example, the economies of such countries can be subject to rapid and unpredictable rates of inflation or deflation. Low trading volumes may result in a lack of liquidity and price volatility. Emerging market countries may have policies that restrict investment by non-U.S. investors, or that prevent non-U.S. investors from withdrawing their money at will.
The Fund may invest in some emerging markets that subject it to risks such as those associated with illiquidity, custody of assets, different settlement and clearance procedures and asserting legal title under a developing legal and regulatory regime to a greater degree than in developed markets or even in other emerging markets.
Equity and Equity-Related Securities Risk: Equity and equity-related securities may be subject to changes in value, and their values may be more volatile than those of other asset classes. In addition to an individual security losing value, the value of the equity markets or a
sector in which the Fund invests could go down. Different parts of a market can react differently to adverse issuer, market, regulatory, political and economic developments.
Foreign Securities Risk: Investments in securities of non-U.S. issuers (including those denominated in U.S. dollars) may involve more risk than investing in securities of U.S. issuers. Foreign political, economic and legal systems, especially those in developing and emerging market countries, may be less stable and more volatile than in the United States. Foreign legal systems generally have fewer regulatory requirements than the U.S. legal system, particularly those of emerging markets. In general, less information is publicly available with respect to non-U.S. companies than U.S. companies. Non-U.S. companies generally are not subject to the same accounting, auditing, and financial reporting standards as are U.S. companies. Additionally, the changing value of foreign currencies and changes in exchange rates could also affect the value of the assets the Fund holds and the Fund’s performance. Certain foreign countries may impose restrictions on the ability of issuers of foreign securities to make payment of principal and interest or dividends to investors located outside the country, due to blockage of foreign currency exchanges or otherwise. Investments in emerging markets are subject to greater volatility and price declines.
In addition, the Fund’s investments in non-U.S. securities may be subject to the risks of nationalization or expropriation of assets, imposition of currency exchange controls or restrictions on the repatriation of non-U.S. currency, confiscatory taxation and adverse diplomatic developments. Special U.S. tax considerations may apply.
Geographic Concentration Risk: The Fund’s performance may be closely tied to the market, economic, political, regulatory or other conditions in the countries or regions in which the Fund invests. This can result in more pronounced risks based upon conditions that impact one or more countries or regions more or less than other countries or regions.
Illiquid Investments Risk: The Fund may invest in instruments that trade in lower volumes and may make investments that may be less liquid than other investments. Illiquid investments risk exists when particular investments made by the Fund are difficult to purchase or sell. The Fund may make investments that may become less liquid in response to market developments or adverse investor perceptions. If the Fund is forced to sell these investments to pay redemption proceeds or for other reasons, the Fund may lose money. In addition, when there is no willing buyer and investments cannot be readily sold at the desired time or price, the Fund may have to accept a lower price or may not be able to sell the instrument at all. An inability to sell a portfolio position can adversely affect the Fund’s value or prevent the Fund from being able to take advantage of other investment opportunities.
Increase in Expenses Risk: Your actual cost of investing in the Fund may be higher than the expenses shown in the expense table in the Fund’s prospectus for a variety of reasons. For example, expense ratios may be higher than those shown if average net assets decrease.
| | | | |
PGIM QMA International Equity Fund | | | 53 | |
Notes to Financial Statements (continued)
Net assets are more likely to decrease and Fund expense ratios are more likely to increase when markets are volatile. Active and frequent trading of Fund securities can increase expenses.
Investments in China Risk: Investments in China subject the Fund to risks specific to China and may make it more volatile than other funds. Over the last few decades, the Chinese government has undertaken reform of economic and market practices and has expanded the sphere of private ownership of property in China. However, Chinese markets generally continue to experience inefficiency, volatility and pricing anomalies resulting from governmental influence, a lack of publicly available information and/or political and social instability. Internal social unrest or confrontations with other neighboring countries, including military conflicts in response to such events, may also disrupt economic development in China and result in a greater risk of currency fluctuations, currency non-convertibility, interest rate fluctuations and higher rates of inflation.
China has experienced security concerns, such as terrorism and strained international relations. Incidents involving China’s or the region’s security may cause uncertainty in Chinese markets and may adversely affect the Chinese economy and the Fund’s investments. Export growth continues to be a major driver of China’s rapid economic growth. Reduction in spending on Chinese products and services, institution of additional tariffs or other trade barriers, including as a result of heightened trade tensions between China and the U.S., or a downturn in any of the economies of China’s key trading partners may have an adverse impact on the Chinese economy or the Fund. For example, a series of executive orders issued between November 2020 and June 2021 prohibit the Fund from investing in certain companies identified by the U.S. government as “Chinese Military Industrial Complex Companies.” The restrictions in these executive orders may force the subadviser to sell certain positions and may restrict the Fund from future investments the subadviser deems otherwise attractive.
Chinese companies, including Chinese companies that are listed on U.S. exchanges, are not subject to the same degree of regulatory requirements, accounting standards or auditor oversight as companies in more developed countries, and as a result, information about the Chinese securities in which the Fund invests may be less reliable or complete. There may be significant obstacles to obtaining information necessary for investigations into or litigation against Chinese companies and shareholders may have limited legal remedies.
Large Shareholder and Large Scale Redemption Risk: Certain individuals, accounts, funds (including funds affiliated with the Manager) or institutions, including the Manager and its affiliates, may from time to time own or control a substantial amount of the Fund’s shares. There is no requirement that these entities maintain their investment in the Fund. There is a risk that such large shareholders or that the Fund’s shareholders generally may redeem all
or a substantial portion of their investments in the Fund in a short period of time, which could have a significant negative impact on the Fund’s NAV, liquidity, and brokerage costs. Large redemptions could also result in tax consequences to shareholders and impact the Fund’s ability to implement its investment strategy. The Fund’s ability to pursue its investment objective after one or more large scale redemptions may be impaired and, as a result, the Fund may invest a larger portion of its assets in cash or cash equivalents.
Management Risk: Actively managed mutual funds are subject to management risk. The subadviser will apply investment techniques and risk analyses in making investment decisions for the Fund, but there can be no guarantee that these techniques will produce the desired results. Additionally, the investments selected by the subadviser may underperform the markets in general, the Fund’s benchmark and other mutual funds with similar investment objectives.
Market Capitalization Risk: The Fund may invest in companies of any market capitalization. Generally, the stock prices of small- and mid-cap companies are less stable than the prices of large-cap stocks and may present greater risks. Large capitalization companies as a group could fall out of favor with the market, causing the Fund to underperform compared to investments that focus on smaller capitalized companies.
Market Disruption and Geopolitical Risks: International wars or conflicts and geopolitical developments in foreign countries, along with instability in regions such as Asia, Eastern Europe, and the Middle East, possible terrorist attacks in the United States or around the world, public health epidemics such as the outbreak of infectious diseases like the outbreak of COVID-19 globally in 2020 or the 2014–2016 outbreak in West Africa of the Ebola virus, and other similar events could adversely affect the U.S. and foreign financial markets, including increases in market volatility, reduced liquidity in the securities markets and government intervention, and may cause further long-term economic uncertainties in the United States and worldwide generally. The coronavirus pandemic and the related governmental and public responses have had and may continue to have an impact on the Fund’s investments and net asset value and have led and may continue to lead to increased market volatility and the potential for illiquidity in certain classes of securities and sectors of the market. Preventative or protective actions that governments may take in respect of pandemic or epidemic diseases may result in periods of business disruption, business closures, inability to obtain raw materials, supplies and component parts, and reduced or disrupted operations for the issuers in which the Fund invests. Government intervention in markets may impact interest rates, market volatility and security pricing. The occurrence, reoccurrence and pendency of such diseases could adversely affect the economies (including through changes in business activity and increased unemployment) and financial markets either in specific countries or worldwide.
| 10. | Recent Regulatory Developments |
On December 3, 2020, the SEC announced that it voted to adopt a new rule that establishes an updated regulatory framework for fund valuation practices (the “Rule”). The Rule, in
| | | | |
PGIM QMA International Equity Fund | | | 55 | |
Notes to Financial Statements (continued)
part, provides (i) a framework for determining fair value in good faith and (ii) provides for a fund Board’s assignment of its responsibility for the execution of valuation-related activities to a fund’s investment adviser. Further, the SEC is rescinding previously issued guidance on related issues. The Rule took effect on March 8, 2021, with a compliance date of September 8, 2022. Management is currently evaluating the Rule and its impact to the Fund.
Effective December 29, 2021, the Fund’s name will change from PGIM QMA International Equity Fund to PGIM Quant Solutions International Equity Fund.
Report of Independent Registered Public Accounting Firm
To the Board of Directors of Prudential World Fund, Inc. and Shareholders of PGIM QMA International Equity Fund
Opinion on the Financial Statements
We have audited the accompanying statement of assets and liabilities, including the schedule of investments, of PGIM QMA International Equity Fund (one of the funds constituting Prudential World Fund, Inc., referred to hereafter as the “Fund”) as of October 31, 2021, the related statement of operations for the year ended October 31, 2021, the statement of changes in net assets for each of the two years in the period ended October 31, 2021, including the related notes, and financial highlights for each of the two years in the period ended October 31, 2021 (collectively referred to as the “financial statements”). In our opinion, the financial statements present fairly, in all material respects, the financial position of the Fund as of October 31, 2021, the results of its operations for the year then ended, and the changes in its net assets and the financial highlights for each of the two years in the period ended October 31, 2021 in conformity with accounting principles generally accepted in the United States of America.
The financial statements of the Fund as of and for the year ended October 31, 2019 and the financial highlights for each of the periods ended on or prior to October 31, 2019 (not presented herein, other than the financial highlights) were audited by other auditors whose report dated December 16, 2019 expressed an unqualified opinion on those financial statements and financial highlights.
Basis for Opinion
These financial statements are the responsibility of the Fund’s management. Our responsibility is to express an opinion on the Fund’s financial statements based on our audits. We are a public accounting firm registered with the Public Company Accounting Oversight Board (United States) (PCAOB) and are required to be independent with respect to the Fund in accordance with the U.S. federal securities laws and the applicable rules and regulations of the Securities and Exchange Commission and the PCAOB.
We conducted our audits of these financial statements in accordance with the standards of the PCAOB. Those standards require that we plan and perform the audit to obtain reasonable assurance about whether the financial statements are free of material misstatement, whether due to error or fraud.
Our audits included performing procedures to assess the risks of material misstatement of the financial statements, whether due to error or fraud, and performing procedures that respond to those risks. Such procedures included examining, on a test basis, evidence regarding the amounts and disclosures in the financial statements. Our audits also included evaluating the accounting principles used and significant estimates made by management, as well as evaluating the overall presentation of the financial statements. Our procedures included confirmation of securities owned as of October 31, 2021 by correspondence with the custodian, transfer agent and brokers; when replies were not received from brokers, we performed other auditing procedures. We believe that our audits provide a reasonable basis for our opinion.
/s/PricewaterhouseCoopers LLP
New York, New York
December 16, 2021
We have served as the auditor of one or more investment companies in the PGIM Retail Funds complex since 2020.
| | | | |
PGIM QMA International Equity Fund | | | 57 | |
Tax Information (unaudited)
For the year ended October 31, 2021, the Fund reports, the maximum amount allowable under Section 854 of the Internal Revenue Code, but not less than, the following percentage of the ordinary income dividends paid as qualified dividend income (QDI):
| | | | |
| | | QDI | |
PGIM QMA International Equity Fund | | | 98.42% | |
For the year ended October 31, 2021, the Fund made an election to pass through the maximum amount of the portion of the ordinary income dividends paid derived from foreign source income as well as any foreign taxes paid by the Fund in accordance with Section 853 of the Internal Revenue Code of the following amounts: $701,618 foreign tax credit from recognized foreign source income of $9,044,335.
In January 2022, you will be advised on IRS Form 1099-DIV or substitute 1099-DIV as to the federal tax status of dividends received by you in calendar year 2021.
INFORMATION ABOUT BOARD MEMBERS AND OFFICERS (unaudited)
Information about Board Members and Officers of the Fund is set forth below. Board Members who are not deemed to be “interested persons” of the Fund, as defined in the 1940 Act, are referred to as “Independent Board Members.” Board Members who are deemed to be “interested persons” of the Fund are referred to as “Interested Board Members.” The Board Members are responsible for the overall supervision of the operations of the Fund and perform the various duties imposed on the directors of investment companies by the 1940 Act. The Board in turn elects the Officers, who are responsible for administering the day-to-day operations of the Fund.
| | | | | | |
| Independent Board Members |
| | | | |
Name Year of Birth Position(s) Portfolios Overseen | | Principal Occupation(s) During Past Five Years | | Other Directorships Held During Past Five Years | | Length of Board Service |
| | | | |
Ellen S. Alberding 1958 Board Member Portfolios Overseen: 95 | | President and Board Member, The Joyce Foundation (charitable foundation) (since 2002); formerly Vice Chair, City Colleges of Chicago (community college system) (2011-2015); Trustee, National Park Foundation (charitable foundation for national park system) (2009-2018); Trustee, Economic Club of Chicago (2009-2016); Trustee, Loyola University (since 2018). | | None. | | Since September 2013 |
| | | | |
Kevin J. Bannon 1952 Board Member Portfolios Overseen: 95 | | Retired; formerly Managing Director (April 2008-May 2015) and Chief Investment Officer (October 2008-November 2013) of Highmount Capital LLC (registered investment adviser); formerly Executive Vice President and Chief Investment Officer (April 1993-August 2007) of Bank of New York Company; President (May 2003-May 2007) of BNY Hamilton Family of Mutual Funds. | | Director of Urstadt Biddle Properties (equity real estate investment trust) (since September 2008). | | Since July 2008 |
PGIM QMA International Equity Fund
| | | | | | |
| Independent Board Members |
| | | | |
Name Year of Birth Position(s) Portfolios Overseen | | Principal Occupation(s) During Past Five Years | | Other Directorships Held During Past Five Years | | Length of Board Service |
| | | | |
Linda W. Bynoe 1952 Board Member Portfolios Overseen: 92 | | President and Chief Executive Officer (since March 1995) and formerly Chief Operating Officer (December 1989-February 1995) of Telemat Limited LLC (formerly Telemat Ltd) (management consulting); formerly Vice President (January 1985-June 1989) at Morgan Stanley & Co. (broker-dealer). | | Trustee of Equity Residential (residential real estate) (since December 2009); Director of Northern Trust Corporation (financial services) (since April 2006); formerly Director of Anixter International, Inc. (communication products distributor) (January 2006-June 2020). | | Since March 2005 |
| | | | |
Barry H. Evans 1960 Board Member Portfolios Overseen: 94 | | Retired; formerly President (2005-2016), Global Chief Operating Officer (2014-2016), Chief Investment Officer - Global Head of Fixed Income (1998-2014), and various portfolio manager roles (1986-2006), Manulife Asset Management (asset management). | | Formerly Director, Manulife Trust Company (2011-2018); formerly Director, Manulife Asset Management Limited (2015-2017); formerly Chairman of the Board of Directors of Manulife Asset Management U.S. (2005-2016); formerly Chairman of the Board, Declaration Investment Management and Research (2008-2016). | | Since September 2017 |
| | | | |
Keith F. Hartstein 1956 Board Member & Independent Chair Portfolios Overseen: 95 | | Retired; Executive Committee of the Independent Directors Council (IDC) Board of Governors (since October 2019); Member (since November 2014) of the Governing Council of the IDC (organization of independent mutual fund directors); formerly President and Chief Executive Officer (2005-2012), Senior Vice President (2004-2005), Senior Vice President of Sales and Marketing (1997-2004), and various executive management positions (1990-1997), John Hancock Funds, LLC (asset management); Chairman, Investment Company Institute’s Sales Force Marketing Committee (2003-2008). | | None. | | Since September 2013 |
Visit our website at pgim.com/investments
| | | | | | |
| Independent Board Members |
| | | | |
Name Year of Birth Position(s) Portfolios Overseen | | Principal Occupation(s) During Past Five Years | | Other Directorships Held During Past Five Years | | Length of Board Service |
| | | | |
Laurie Simon Hodrick 1962 Board Member Portfolios Overseen: 91 | | A. Barton Hepburn Professor Emerita of Economics in the Faculty of Business, Columbia Business School (since 2018); Visiting Fellow at the Hoover Institution, Stanford University (since 2015); Sole Member, ReidCourt LLC (since 2008) (a consulting firm); formerly Visiting Professor of Law, Stanford Law School (2015-2021); formerly A. Barton Hepburn Professor of Economics in the Faculty of Business, Columbia Business School (1996-2017); formerly Managing Director, Global Head of Alternative Investment Strategies, Deutsche Bank (2006-2008). | | Independent Director, Roku (since December 2020) (communication services); formerly Independent Director, Synnex Corporation (2019-2021) (information technology); formerly Independent Director, Kabbage, Inc. (2018-2020) (financial services); formerly Independent Director, Corporate Capital Trust (2017-2018) (a business development company). | | Since September 2017 |
| | | | |
Brian K. Reid 1961 Board Member Portfolios Overseen: 94 | | Retired; formerly Chief Economist for the Investment Company Institute (ICI) (2005-2017); formerly Senior Economist and Director of Industry and Financial Analysis at the ICI (1998-2004); formerly Senior Economist, Industry and Financial Analysis at the ICI (1996-1998); formerly Staff Economist at the Federal Reserve Board (1989-1996); Director, ICI Mutual Insurance Company (2012-2017). | | None. | | Since March 2018 |
PGIM QMA International Equity Fund
| | | | | | |
| Independent Board Members |
| | | | |
Name Year of Birth Position(s) Portfolios Overseen | | Principal Occupation(s) During Past Five Years | | Other Directorships Held During Past Five Years | | Length of Board Service |
| | | | |
Grace C. Torres 1959 Board Member Portfolios Overseen: 94 | | Retired; formerly Treasurer and Principal Financial and Accounting Officer of the PGIM Funds, Target Funds, Advanced Series Trust, Prudential Variable Contract Accounts and The Prudential Series Fund (1998-June 2014); Assistant Treasurer (March 1999-June 2014) and Senior Vice President (September 1999-June 2014) of PGIM Investments LLC; Assistant Treasurer (May 2003-June 2014) and Vice President (June 2005-June 2014) of AST Investment Services, Inc.; Senior Vice President and Assistant Treasurer (May 2003-June 2014) of Prudential Annuities Advisory Services, Inc. | | Director (since January 2018) of OceanFirst Financial Corp. and OceanFirst Bank; formerly Director (July 2015-January 2018) of Sun Bancorp, Inc. N.A. and Sun National Bank. | | Since November 2014 |
| | | | | | |
| Interested Board Members |
| | | | |
Name Year of Birth Position(s) Portfolios Overseen | | Principal Occupation(s) During Past Five Years | | Other Directorships Held During Past Five Years | | Length of Board Service |
| | | | |
Stuart S. Parker 1962 Board Member & President Portfolios Overseen: 94 | | President, Chief Executive Officer, Chief Operating Officer and Officer in Charge of PGIM Investments LLC (formerly known as Prudential Investments LLC) (since January 2012); formerly Executive Vice President of Jennison Associates LLC and Head of Retail Distribution of PGIM Investments LLC (June 2005-December 2011); Investment Company Institute - Board of Governors (since May 2012). | | None. | | Since January 2012 |
Visit our website at pgim.com/investments
| | | | | | |
| Interested Board Members |
| | | | |
Name Year of Birth Position(s) Portfolios Overseen | | Principal Occupation(s) During Past Five Years | | Other Directorships Held During Past Five Years | | Length of Board Service |
| | | | |
Scott E. Benjamin 1973 Board Member & Vice President Portfolios Overseen: 95 | | Executive Vice President (since May 2009) of PGIM Investments LLC; Vice President (since June 2012) of Prudential Investment Management Services LLC; Executive Vice President (since September 2009) of AST Investment Services, Inc.; Senior Vice President of Product Development and Marketing, PGIM Investments (since February 2006); formerly Vice President of Product Development and Product Management, PGIM Investments LLC (2003-2006). | | None. | | Since March 2010 |
(1) The year that each Board Member joined the Board is as follows:
Ellen S. Alberding, 2013; Kevin J. Bannon, 2008; Linda W. Bynoe, 2005; Barry H. Evans, 2017; Keith F. Hartstein, 2013; Laurie Simon Hodrick, 2017; Michael S. Hyland, 2008; Richard A. Redeker, 1993; Stephen G. Stoneburn, 2003; Stuart S. Parker, Board Member since 2012 and President since 2012; Scott E. Benjamin, Board Member since 2010 and Vice President since 2009; Grace C. Torres, 2014.
| | | | |
| Fund Officers(a) | | | | |
| | | |
Name Year of Birth Fund Position | | Principal Occupation(s) During Past Five Years | | Length of Service as Fund Officer |
| | | |
Claudia DiGiacomo 1974 Chief Legal Officer | | Chief Legal Officer, Executive Vice President and Secretary of PGIM Investments LLC (since August 2020); Chief Legal Officer of Prudential Mutual Fund Services LLC (since August 2020); Chief Legal Officer of PIFM Holdco, LLC (since August 2020); Vice President and Corporate Counsel (since January 2005) of Prudential; and Corporate Counsel of AST Investment Services, Inc. (since August 2020); formerly Vice President and Assistant Secretary of PGIM Investments LLC (2005-2020); formerly Associate at Sidley Austin Brown & Wood LLP (1999-2004). | | Since December 2005 |
PGIM QMA International Equity Fund
| | | | |
| Fund Officers(a) | | | | |
| | | |
Name Year of Birth Fund Position | | Principal Occupation(s) During Past Five Years | | Length of Service as Fund Officer |
| | | |
Dino Capasso 1974 Chief Compliance Officer | | Chief Compliance Officer (since July 2019) of PGIM Investments LLC; Chief Compliance Officer (since July 2019) of the PGIM Funds, Target Funds, Advanced Series Trust, The Prudential Series Fund, Prudential’s Gibraltar Fund, Inc., PGIM Global High Yield Fund, Inc., PGIM High Yield Bond Fund, Inc., and PGIM Short Duration High Yield Opportunities Fund; Vice President and Deputy Chief Compliance Officer (June 2017-2019) of PGIM Investments LLC; formerly Senior Vice President and Senior Counsel (January 2016-June 2017), and Vice President and Counsel (February 2012-December 2015) of Pacific Investment Management Company LLC. | | Since July 2019 |
| | | |
Andrew R. French 1962 Secretary | | Vice President (since December 2018) of PGIM Investments LLC; formerly Vice President and Corporate Counsel (2010-2018) of Prudential; formerly Director and Corporate Counsel (2006-2010) of Prudential; Vice President and Assistant Secretary (since January 2007) of PGIM Investments LLC; Vice President and Assistant Secretary (since January 2007) of Prudential Mutual Fund Services LLC. | | Since October 2006 |
| | | |
Diana N. Huffman 1982 Assistant Secretary | | Vice President and Corporate Counsel (since September 2015) of Prudential; Vice President and Assistant Secretary (since August 2020) of PGIM Investments LLC; formerly Associate at Willkie Farr & Gallagher LLP (2009-2015). | | Since March 2019 |
| | | |
Melissa Gonzalez 1980 Assistant Secretary | | Vice President and Corporate Counsel (since September 2018) of Prudential; Vice President and Assistant Secretary (since August 2020) of PGIM Investments LLC; formerly Director and Corporate Counsel (March 2014-September 2018) of Prudential. | | Since March 2020 |
| | | |
Patrick E. McGuinness 1986 Assistant Secretary | | Vice President and Assistant Secretary (since August 2020) of PGIM Investments LLC; Director and Corporate Counsel (since February 2017) of Prudential; and Corporate Counsel (2012-2017) of IIL, Inc. | | Since June 2020 |
| | | |
Debra Rubano 1975 Assistant Secretary | | Vice President and Corporate Counsel (since November 2020) of Prudential; formerly Director and Senior Counsel of Allianz Global Investors U.S. Holdings LLC (2010-2020) and Assistant Secretary of numerous funds in the Allianz fund complex (2015-2020). | | Since December 2020 |
| | | |
Kelly A. Coyne 1968 Assistant Secretary | | Director, Investment Operations of Prudential Mutual Fund Services LLC (since 2010). | | Since March 2015 |
Visit our website at pgim.com/investments
| | | | |
| Fund Officers(a) | | | | |
| | | |
Name Year of Birth Fund Position | | Principal Occupation(s) During Past Five Years | | Length of Service as Fund Officer |
| | | |
Christian J. Kelly 1975 Treasurer and Principal Financial and Accounting Officer | | Vice President, Head of Fund Administration of PGIM Investments LLC (since November 2018); formerly Director of Fund Administration of Lord Abbett & Co. LLC (2009-2018), Treasurer and Principal Accounting Officer of the Lord Abbett Family of Funds (2017-2018); Director of Accounting, Avenue Capital Group (2008-2009); Senior Manager, Investment Management Practice of Deloitte & Touche LLP (1998-2007). | | Since January 2019 |
| | | |
Lana Lomuti 1967 Assistant Treasurer | | Vice President (since 2007) and Director (2005-2007), within PGIM Investments Fund Administration; formerly Assistant Treasurer (December 2007-February 2014) of The Greater China Fund, Inc. | | Since April 2014 |
| | | |
Russ Shupak 1973 Assistant Treasurer | | Vice President (since 2017) and Director (2013-2017), within PGIM Investments Fund Administration. | | Since September 2019 |
| | | |
Deborah Conway 1969 Assistant Treasurer | | Vice President (since 2017) and Director (2007-2017), within PGIM Investments Fund Administration. | | Since September 2019 |
| | | |
Elyse M. McLaughlin 1974 Assistant Treasurer | | Vice President (since 2017) and Director (2011-2017), within PGIM Investments Fund Administration. | | Since September 2019 |
| | | |
Jonathan Corbett 1983 Anti-Money Laundering Compliance Officer | | Vice President, Corporate Compliance, Global Compliance Programs and Compliance Risk Management (since August 2019) of Prudential; formerly Vice President and Head of Key Risk Areas Compliance (March 2016 to July 2019), Chief Privacy Officer (March 2016 to July 2019) and Head of Global Financial Crimes Unit (April 2014 to March 2016) at MetLife. | | Since October 2021 |
(a) Excludes Mr. Parker and Mr. Benjamin, interested Board Members who also serve as President and Vice President, respectively.
Explanatory Notes to Tables:
| ∎ | | Board Members are deemed to be “Interested,” as defined in the 1940 Act, by reason of their affiliation with PGIM Investments LLC and/or an affiliate of PGIM Investments LLC. |
| ∎ | | Unless otherwise noted, the address of all Board Members and Officers is c/o PGIM Investments LLC, 655 Broad Street, Newark, New Jersey 07102-4410. |
| ∎ | | There is no set term of office for Board Members or Officers. The Board Members have adopted a retirement policy, which calls for the retirement of Board Members on December 31 of the year in which they reach the age of 75. |
| ∎ | | “Other Directorships Held” includes all directorships of companies required to register or file reports with the SEC under the 1934 Act (that is, “public companies”) or other investment companies registered under the 1940 Act. |
| ∎ | | “Portfolios Overseen” includes all investment companies managed by PGIM Investments LLC. The investment companies for which PGIM Investments LLC serves as manager include the PGIM Funds, Target Funds, The Prudential Variable Contract Accounts, PGIM ETF Trust, PGIM High Yield Bond Fund, Inc., PGIM Global High Yield Fund, Inc., PGIM Short Duration High Yield Opportunities Fund, The Prudential Series Fund, Prudential’s Gibraltar Fund, Inc. and the Advanced Series Trust. |
| ∎ | | As used in the Fund Officers table “Prudential” means The Prudential Insurance Company of America. |
PGIM QMA International Equity Fund
Approval of Advisory Agreements (unaudited)
The Fund’s Board of Directors
The Board of Directors (the “Board”) of PGIM QMA International Equity Fund (the “Fund”)1 consists of ten individuals, eight of whom are not “interested persons” of the Fund, as defined in the Investment Company Act of 1940, as amended (the “1940 Act”) (the “Independent Directors”). The Board is responsible for the oversight of the Fund and its operations, and performs the various duties imposed on the directors of investment companies by the 1940 Act. The Independent Directors have retained independent legal counsel to assist them in connection with their duties. The Chair of the Board is an Independent Director. The Board has established four standing committees: the Audit Committee, the Nominating and Governance Committee, and two Investment Committees. Each committee is chaired by, and composed of, Independent Directors.
Annual Approval of the Fund’s Advisory Agreements
As required under the 1940 Act, the Board determines annually whether to renew the Fund’s management agreement with PGIM Investments LLC (“PGIM Investments”) and the Fund’s subadvisory agreement with QMA LLC (“QMA”). In considering the renewal of the agreements, the Board, including all of the Independent Directors, met on June 7-10, 2021 and approved the renewal of the agreements through July 31, 2022, after concluding that the renewal of the agreements was in the best interests of the Fund and its shareholders.
In advance of the meetings, the Board requested and received materials relating to the agreements, and had the opportunity to ask questions and request further information in connection with its consideration. Among other things, the Board considered comparative fee information from PGIM Investments and QMA. Also, the Board considered comparisons with other mutual funds in relevant Peer Universes and Peer Groups, as is further discussed below.
In approving the agreements, the Board, including the Independent Directors advised by independent legal counsel, considered the factors it deemed relevant, including the nature, quality and extent of services provided by PGIM Investments and the subadviser, the performance of the Fund, the profitability of PGIM Investments and its affiliates, expenses and fees, and the potential for economies of scale that may be shared with the Fund and its shareholders as the Fund’s assets grow. In their deliberations, the Directors did not identify any single factor which alone was responsible for the Board’s decision to approve the agreements with respect to the Fund. In connection with its deliberations, the Board considered information provided by PGIM Investments throughout the year at regular Board meetings, presentations from portfolio managers and other information, as well as information furnished at or in advance of the meetings on June 7-10, 2021.
The Directors determined that the overall arrangements between the Fund and PGIM Investments, which serves as the Fund’s investment manager pursuant to a
| 1 | PGIM QMA International Equity Fund is a series of Prudential World Fund, Inc. |
PGIM QMA International Equity Fund
Approval of Advisory Agreements (continued)
management agreement, and between PGIM Investments and QMA, which serves as the Fund’s subadviser pursuant to the terms of a subadvisory agreement with PGIM Investments, are in the best interests of the Fund and its shareholders in light of the services performed, fees charged and such other matters as the Directors considered relevant in the exercise of their business judgment.
The material factors and conclusions that formed the basis for the Directors’ reaching their determinations to approve the continuance of the agreements are separately discussed below.
Nature, Quality and Extent of Services
The Board received and considered information regarding the nature, quality and extent of services provided to the Fund by PGIM Investments and QMA. The Board noted that QMA is affiliated with PGIM Investments. The Board considered the services provided by PGIM Investments, including but not limited to the oversight of the subadviser for the Fund, as well as the provision of fund recordkeeping, compliance and other services to the Fund, and PGIM Investments’ role as administrator for the Fund’s liquidity risk management program. With respect to PGIM Investments’ oversight of the subadviser, the Board noted that PGIM Investments’ Strategic Investment Research Group (“SIRG”), which is a business unit of PGIM Investments, is responsible for monitoring and reporting to PGIM Investments’ senior management on the performance and operations of the subadviser. The Board also considered that PGIM Investments pays the salaries of all of the officers and interested Directors of the Fund who are part of Fund management. The Board also considered the investment subadvisory services provided by QMA, including investment research and security selection, as well as adherence to the Fund’s investment restrictions and compliance with applicable Fund policies and procedures. The Board considered PGIM Investments’ evaluation of the subadviser, as well as PGIM Investments’ recommendation, based on its review of the subadviser, to renew the subadvisory agreement.
The Board considered the qualifications, backgrounds and responsibilities of PGIM Investments’ senior management responsible for the oversight of the Fund and QMA, and also considered the qualifications, backgrounds and responsibilities of QMA’s portfolio managers who are responsible for the day-to-day management of the Fund’s portfolio. The Board was provided with information pertaining to PGIM Investments’ and QMA’s organizational structure, senior management, investment operations, and other relevant information pertaining to both PGIM Investments and QMA. The Board also noted that it received favorable compliance reports from the Fund’s Chief Compliance Officer (“CCO”) as to both PGIM Investments and QMA.
The Board concluded that it was satisfied with the nature, extent and quality of the investment management services provided by PGIM Investments and the subadvisory services provided to the Fund by QMA, and that there was a reasonable basis on which to conclude that the Fund benefits from the services provided by PGIM Investments and QMA under the management and subadvisory agreements.
| | |
| Visit our website at pgim.com/investments | | |
Costs of Services and Profits Realized by PGIM Investments
The Board was provided with information on the profitability of PGIM Investments and its affiliates in serving as the Fund’s investment manager. The Board discussed with PGIM Investments the methodology utilized in assembling the information regarding profitability and considered its reasonableness. The Board recognized that it is difficult to make comparisons of profitability from fund management contracts because comparative information is not generally publicly available and is affected by numerous factors, including the structure of the particular adviser, the types of funds it manages, its business mix, numerous assumptions regarding allocations and the adviser’s capital structure and cost of capital. Taking these factors into account, the Board concluded that the profitability of PGIM Investments and its affiliates in relation to the services rendered was not unreasonable.
Economies of Scale
The Board received and discussed information concerning economies of scale that PGIM Investments may realize as the Fund’s assets grow beyond current levels. The Board noted that the management fee schedule for the Fund includes breakpoints. During the course of time, the Board has considered information regarding the launch date of the Fund, the management fees of the Fund compared to those of similarly managed funds and PGIM Investments’ investment in the Fund over time. The Board noted that economies of scale can be shared with the Fund in other ways, including low management fees from inception, additional technological and personnel investments to enhance shareholder services, and maintaining existing expense structures in the face of a rising cost environment. The Board also considered PGIM Investments’ assertion that it continually evaluates the management fee schedule of the Fund and the potential to share economies of scale through breakpoints or fee waivers as asset levels increase.
The Board recognized the inherent limitations of any analysis of economies of scale, stemming largely from the Board’s understanding that most of PGIM Investments’ costs are not specific to individual funds, but rather are incurred across a variety of products and services.
Other Benefits to PGIM Investments and QMA
The Board considered potential ancillary benefits that might be received by PGIM Investments, QMA and their affiliates as a result of their relationship with the Fund. The Board concluded that potential benefits to be derived by PGIM Investments included transfer agency fees received by the Fund’s transfer agent (which is affiliated with PGIM Investments), and benefits to its reputation as well as other intangible benefits resulting from PGIM Investments’ association with the Fund. The Board concluded that the potential benefits to be derived by QMA included its ability to use soft dollar credits, as well as the potential benefits consistent with those generally resulting from an increase in assets under management, specifically, potential access to additional research resources and benefits to its reputation. The Board concluded that the benefits derived
PGIM QMA International Equity Fund
Approval of Advisory Agreements (continued)
by PGIM Investments and QMA were consistent with the types of benefits generally derived by investment managers and subadvisers to mutual funds.
Performance of the Fund / Fees and Expenses
The Board considered certain additional factors and made related conclusions relating to the historical performance of the Fund for the one-, three-, five- and ten-year periods ended December 31, 2020.
The Board also considered the Fund’s actual management fee, as well as the Fund’s net total expense ratio, for the fiscal year ended October 31, 2020. The Board considered the management fee for the Fund as compared to the management fee charged by PGIM Investments to other funds and the fee charged by other advisers to comparable mutual funds in a Peer Group. The actual management fee represents the fee rate actually paid by Fund shareholders and includes any fee waivers or reimbursements. The net total expense ratio for the Fund represents the actual expense ratio incurred by Fund shareholders.
The mutual funds included in the Peer Universe, which was used to consider performance, and the Peer Group, which was used to consider expenses and fees, were objectively determined by Broadridge, an independent provider of mutual fund data. In certain circumstances, PGIM Investments also provided supplemental Peer Universe or Peer Group information for reasons addressed with the Board. The comparisons placed the Fund in various quartiles over various periods, with the first quartile being the best 25% of the mutual funds (for performance, the best performing mutual funds and, for expenses, the lowest cost mutual funds).
The section below summarizes key factors considered by the Board and the Board’s conclusions regarding the Fund’s performance, fees and overall expenses. The table sets forth net performance comparisons (which reflect the impact on performance of fund expenses, or any subsidies, expense caps or waivers that may be applicable) with the Peer Universe, actual management fees with the Peer Group (which reflect the impact of any subsidies or fee waivers), and net total expenses with the Peer Group, each of which were key factors considered by the Board.
| | | | | | | | |
| | | | | |
| Net Performance | | 1 Year | | 3 Years | | 5 Years | | 10 Years |
| |
3rd Quartile | | 4th Quartile | | 3rd Quartile | | 3rd Quartile |
Actual Management Fees: 1st Quartile |
Net Total Expenses: 3rd Quartile |
| | ● | The Board noted that the Fund underperformed its benchmark index over all periods. |
Visit our website at pgim.com/investments
| | ● | The Board considered PGIM Investments’ assertions that it expects relative returns to improve as markets normalize. In this regard, the Board also considered that the Fund outperformed its benchmark index and peer group (ranking in the 19th percentile) for the first quarter of 2021 and that the Fund outperformed its benchmark index for the one-, five- and ten-year periods and ranked in the second quartile for the one-year period ended March 31, 2021. |
| | ● | The Board noted the Fund’s recent portfolio management changes and improving performance. |
| | ● | The Board and PGIM Investments agreed to retain the Fund’s existing contractual expense cap, which (exclusive of certain fees and expenses) caps total annual operating expenses at 0.78% for Class R6 shares through February 28, 2022. |
| | ● | In addition, PGIM Investments will waive management fees or shared operating expenses on any share class to the same extent that it waives such expenses on any other share class, and has agreed that total annual fund operating expenses for Class R6 shares will not exceed total annual fund operating expenses for Class Z shares. |
| | ● | The Board concluded that, in light of the above, it would be in the best interests of the Fund and its shareholders to renew the agreements. |
| | ● | The Board concluded that the management fees (including subadvisory fees) and total expenses were reasonable in light of the services provided. |
* * *
After full consideration of these factors, the Board concluded that approval of the agreements was in the best interests of the Fund and its shareholders.
PGIM QMA International Equity Fund
| | | | |
| | | |
| ∎ MAIL | | ∎ TELEPHONE | | ∎ WEBSITE |
655 Broad Street Newark, NJ 07102 | | (800) 225-1852 | | pgim.com/investments |
|
| |
| PROXY VOTING |
| The Board of Directors of the Fund has delegated to the Fund’s subadviser the responsibility for voting any proxies and maintaining proxy recordkeeping with respect to the Fund. A description of these proxy voting policies and procedures is available without charge, upon request, by calling (800) 225-1852 or by visiting the Securities and Exchange Commission’s website at sec.gov. Information regarding how the Fund voted proxies relating to portfolio securities during the most recent 12-month period ended June 30 is available on the Fund’s website and on the Securities and Exchange Commission’s website. |
|
| |
| DIRECTORS |
| Ellen S. Alberding ● Kevin J. Bannon ● Scott E. Benjamin ● Linda W. Bynoe ● Barry H. Evans ● Keith F. Hartstein ● Laurie Simon Hodrick ● Stuart S. Parker ● Brian K. Reid ● Grace C. Torres |
|
| |
| OFFICERS |
| Stuart S. Parker, President ● Scott E. Benjamin, Vice President ● Christian J. Kelly, Treasurer and Principal Financial and Accounting Officer ● Claudia DiGiacomo, Chief Legal Officer ● Dino Capasso, Chief Compliance Officer ● Jonathan Corbett, Anti-Money Laundering Compliance Officer ● Andrew R. French, Secretary ● Melissa Gonzalez, Assistant Secretary ● Diana N. Huffman, Assistant Secretary ● Kelly A. Coyne, Assistant Secretary ● Patrick E. McGuinness, Assistant Secretary ● Debra Rubano, Assistant Secretary ● Lana Lomuti, Assistant Treasurer ● Russ Shupak, Assistant Treasurer ● Elyse M. McLaughlin, Assistant Treasurer ● Deborah Conway, Assistant Treasurer |
| | | | |
| MANAGER | | PGIM Investments LLC | | 655 Broad Street |
| | | | Newark, NJ 07102 |
|
| SUBADVISER | | PGIM Quantitative Solutions LLC | | Gateway Center Two 100 Mulberry Street |
| | | | Newark, NJ 07102 |
|
| DISTRIBUTOR | | Prudential Investment | | 655 Broad Street |
| | Management Services LLC | | Newark, NJ 07102 |
|
| CUSTODIAN | | The Bank of New York Mellon | | 240 Greenwich Street |
| | New York, NY 10286 |
|
| TRANSFER AGENT | | Prudential Mutual Fund | | PO Box 9658 |
| | Services LLC | | Providence, RI 02940 |
|
| INDEPENDENT REGISTERED | | PricewaterhouseCoopers LLP | | 300 Madison Avenue |
| PUBLIC ACCOUNTING FIRM | | New York, NY 10017 |
|
| FUND COUNSEL | | Willkie Farr & Gallagher LLP | | 787 Seventh Avenue |
| | New York, NY 10019 |
|
|
| An investor should consider the investment objectives, risks, charges, and expenses of the Fund carefully before investing. The prospectus and summary prospectus contain this and other information about the Fund. An investor may obtain the prospectus and summary prospectus by visiting our website at pgim.com/investments or by calling (800) 225-1852. The prospectus and summary prospectus should be read carefully before investing. |
|
| E-DELIVERY |
| |
| To receive your mutual fund documents online, go to pgim.com/investments/resource/edelivery and enroll. Instead of receiving printed documents by mail, you will receive notification via email when new materials are available. You can cancel your enrollment or change your email address at any time by visiting the website address above. |
|
| SHAREHOLDER COMMUNICATIONS WITH DIRECTORS |
| |
| Shareholders can communicate directly with the Board of Directors by writing to the Chair of the Board, PGIM QMA International Equity Fund, PGIM Investments, Attn: Board of Directors, 655 Broad Street, Newark, NJ 07102. Shareholders can communicate directly with an individual Director by writing to that Director at the same address. Communications are not screened before being delivered to the addressee. |
|
| AVAILABILITY OF PORTFOLIO HOLDINGS |
| |
| The Fund files its complete schedule of portfolio holdings with the Securities and Exchange Commission for the first and third quarters of each fiscal year as an exhibit to its reports on Form N-PORT. The Fund’s Form N-PORT filings are available on the Commission’s website at sec.gov. |
|
| The Fund’s Statement of Additional Information contains additional information about the Fund’s Directors and is available without charge, upon request, by calling (800) 225-1852. |
Mutual Funds:
| | | | |
ARE NOT INSURED BY THE FDIC OR ANY
FEDERAL GOVERNMENT AGENCY | | MAY LOSE VALUE | | ARE NOT A DEPOSIT OF OR GUARANTEED
BY ANY BANK OR ANY BANK AFFILIATE |

PGIM QMA INTERNATIONAL EQUITY FUND
| | | | | | | | |
| SHARE CLASS | | A | | C | | Z | | R6 |
| NASDAQ | | PJRAX | | PJRCX | | PJIZX | | PJRQX |
| CUSIP | | 743969859 | | 743969875 | | 743969883 | | 743969578 |
MF190E

PGIM EMERGING MARKETS DEBT LOCAL
CURRENCY FUND
ANNUAL REPORT
OCTOBER 31, 2021

|
|
To enroll in e-delivery, go to pgim.com/investments/resource/edelivery |
Table of Contents
This report is not authorized for distribution to prospective investors unless preceded or accompanied by a current prospectus.
The views expressed in this report and information about the Fund’s portfolio holdings are for the period covered by this report and are subject to change thereafter.
Mutual funds are distributed by Prudential Investment Management Services LLC (PIMS), member SIPC. PGIM Fixed Income is a unit of PGIM, Inc. (PGIM), a registered investment adviser. PIMS and PGIM are Prudential Financial companies. © 2021 Prudential Financial, Inc. and its related entities. PGIM and the PGIM logo are service marks of Prudential Financial, Inc. and its related entities, registered in many jurisdictions worldwide.
| | |
| 2 | | Visit our website at pgim.com/investments |
Letter from the President
| | |
 | | Dear Shareholder: |
| | We hope you find the annual report for the PGIM Emerging Markets Debt Local Currency Fund informative and useful. The report covers performance for the 12-month period that ended October 31, 2021. |
| | The global economy and markets continued to recover throughout the period from the ongoing impact of the COVID-19 pandemic. The Federal Reserve slashed interest rates and kept them near zero to encourage borrowing. Congress passed stimulus bills worth several trillion dollars to help consumers and businesses. And several effective COVID-19 |
| vaccines received regulatory approval. Those measures were enough to offset the fear of rising inflation and supply chain challenges that threatened to disrupt growth. |
At the start of the period, stocks had recovered most of the steep losses they had suffered at the onset of the pandemic. Equities rallied as states reopened their economies but became more volatile as investors worried that a surge in COVID-19 infections would stall the recovery. However, rising corporate profits and economic growth, the resolution of the US presidential election, and the global rollout of approved vaccines lifted equity markets to record levels, helping stocks around the globe post gains for the full period.
Throughout this volatile period, investors sought safety in fixed income. Investment-grade bonds in the US and the overall global bond market declined slightly during the period as the economy recovered, but emerging market debt rose. While the 10-year US Treasury yield hovered near record lows early in the period after a significant rally in interest rates, rates moved higher later on as investors began to focus on stronger economic growth and the prospects of higher inflation. The Fed also took several aggressive actions to keep the bond markets running smoothly, implementing many of the relief programs that proved to be successful in helping end the global financial crisis in 2008-09.
Regarding your investments with PGIM, we believe it is important to maintain a diversified portfolio of funds consistent with your tolerance for risk, time horizon, and financial goals. Your financial advisor can help you create a diversified investment plan that may include funds covering all the basic asset classes and that reflects your personal investor profile and risk tolerance. However, diversification and asset allocation strategies do not assure a profit or protect against loss in declining markets.
At PGIM Investments, we consider it a great privilege and responsibility to help investors participate in opportunities across global markets while meeting their toughest investment challenges. PGIM is a top-10 global investment manager with more than $1.5 trillion in assets under management. This scale and investment expertise allow us to deliver actively managed funds and strategies to meet the needs of investors around the globe.
Thank you for choosing our family of funds.
Sincerely,

Stuart S. Parker, President
PGIM Emerging Markets Debt Local Currency Fund
December 15, 2021
| | |
| PGIM Emerging Markets Debt Local Currency Fund | | 3 |
Your Fund’s Performance (unaudited)
Performance data quoted represent past performance. Past performance does not guarantee future results. The investment return and principal value of an investment will fluctuate so that an investor’s shares, when redeemed, may be worth more or less than their original cost. Current performance may be lower or higher than the past performance data quoted. An investor may obtain performance data as of the most recent month-end by visiting our website at pgim.com/investments or by calling (800) 225-1852.
| | | | | | |
| |
| | | Average Annual Total Returns as of 10/31/21 |
| | | One Year (%) | | Five Years (%) | | Ten Years (%) |
| | | |
Class A | | | | | | |
(with sales charges) | | -1.13 | | 1.24 | | -0.05 |
(without sales charges) | | 2.19 | | 1.91 | | 0.28 |
| | | |
Class C | | | | | | |
(with sales charges) | | 0.46 | | 1.11 | | -0.48 |
(without sales charges) | | 1.44 | | 1.11 | | -0.48 |
Class Z | | | | | | |
(without sales charges) | | 2.63 | | 2.18 | | 0.61 |
| | | |
Class R6 | | | | | | |
(without sales charges) | | 2.70 | | 2.27 | | 0.68 |
| |
JP Morgan Government Bond Index-Emerging Markets Global Diversified Index | | |
| | | 0.84 | | 1.96 | | 0.37 |
| | |
| 4 | | Visit our website at pgim.com/investments |
Growth of a $10,000 Investment (unaudited)
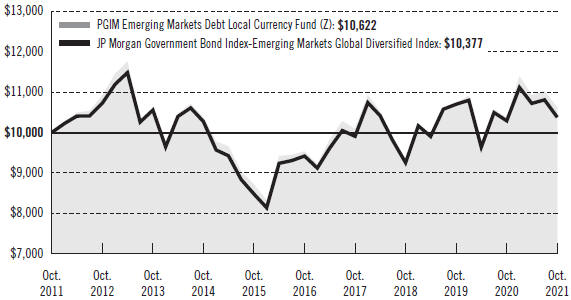
The graph compares a $10,000 investment in the Fund’s Class Z shares with a similar investment in the JP Morgan Government Bond Index-Emerging Markets Global Diversified Index by portraying the initial account values at the beginning of the 10-year period (October 31, 2011) and the account values at the end of the current fiscal year (October 31, 2021), as measured on a quarterly basis. For purposes of the graph, and unless otherwise indicated, it has been assumed that (a) all recurring fees (including management fees) were deducted and (b) all dividends and distributions were reinvested. The line graph provides information for Class Z shares only. As indicated in the tables provided earlier, performance for other share classes will vary due to the differing fees and expenses applicable to each share class (as indicated in the following paragraphs). Without waiver of fees and/or expense reimbursements, if any, the returns would have been lower.
Past performance does not predict future performance. Total returns and the ending account values in the graph include changes in share price and reinvestment of dividends and capital gains distributions in a hypothetical investment for the periods shown. The Fund’s total returns do not reflect the deduction of income taxes on an individual’s investment. Taxes may reduce your actual investment returns on income or gains paid by the Fund or any gains you may realize if you sell your shares.
| | |
| PGIM Emerging Markets Debt Local Currency Fund | | 5 |
Your Fund’s Performance (continued)
The returns in the tables do not reflect the deduction of taxes that a shareholder would pay on Fund distributions or following the redemption of Fund shares. The average annual total returns take into account applicable sales charges, which are described for each share class in the table below.
| | | | | | | | |
| | | | |
| | | Class A | | Class C | | Class Z | | Class R6 |
| | | | | |
Maximum initial sales charge | | 3.25% of the public offering price | | None | | None | | None |
Contingent deferred sales charge (CDSC) (as a percentage of the lower of the original purchase price or the net asset value at redemption) | | 1.00% on sales of $500,000 or more made within 12 months of purchase | | 1.00% on sales made within 12 months of purchase | | None | | None |
Annual distribution and service (12b-1) fees (shown as a percentage of average daily net assets) | | 0.25% | | 1.00% | | None | | None |
Benchmark Definitions
JP Morgan Government Bond Index-Emerging Markets Global Diversified Index—The JP Morgan Government Bond Index-Emerging Markets Global Diversified Index, an unmanaged index, is a comprehensive emerging markets debt benchmark that tracks local currency bonds issued by emerging market governments.
Investors cannot invest directly in an index. The returns for the Index would be lower if they included the effects of sales charges, operating expenses of a mutual fund, or taxes that may be paid by an investor.
| | |
| 6 | | Visit our website at pgim.com/investments |
| | | | | | |
|
| Distributions and Yields as of 10/31/21 |
| | | |
| | | Total Distributions Paid for 12 Months ($) | | SEC 30-Day Subsidized Yield* (%) | | SEC 30-Day Unsubsidized Yield** (%) |
| | | |
Class A | | 0.25 | | 4.37 | | 4.51 |
| | | |
Class C | | 0.21 | | 3.74 | | 6.39 |
| | | |
Class Z | | 0.28 | | 4.93 | | 4.20 |
| | | |
Class R6 | | 0.28 | | 5.00 | | 4.00 |
*SEC 30-Day Subsidized Yield (%)—A standardized yield calculation created by the Securities and Exchange Commission, it reflects the income earned during a 30-day period, after the deduction of the Fund’s net expenses (net of any expense waivers or reimbursements). The investor experience is represented by the SEC 30-Day Subsidized Yield.
**SEC 30-Day Unsubsidized Yield (%)—A standardized yield calculation created by the Securities and Exchange Commission, it reflects the income earned during a 30-day period, after the deduction of the Fund’s gross expenses. The investor experience is represented by the SEC 30-Day Subsidized Yield.
| | | | |
|
| Credit Quality expressed as a percentage of total investments as of 10/31/21 (%) | |
| |
AAA | | | 1.6 | |
| |
AA | | | 2.5 | |
| |
A | | | 36.9 | |
| |
BBB | | | 32.9 | |
| |
BB | | | 16.4 | |
| |
B | | | 3.8 | |
| |
CCC | | | 0.9 | |
| |
Not Rated | | | 2.7 | |
| |
Cash/Cash Equivalents | | | 2.3 | |
| | |
| Total | | | 100.0 | |
Credit ratings reflect the highest rating assigned by a nationally recognized statistical rating organization (NRSRO) such as Moody’s Investors Service, Inc. (Moody’s), S&P Global Ratings (S&P), or Fitch, Inc. (Fitch). Credit ratings reflect the common nomenclature used by both S&P and Fitch. Where applicable, ratings are converted to the comparable S&P/Fitch rating tier nomenclature. These rating agencies are independent and are widely used. The Not Rated category consists of securities that have not been rated by an NRSRO. Credit ratings are subject to change.
| | |
| PGIM Emerging Markets Debt Local Currency Fund | | 7 |
Strategy and Performance Overview (unaudited)
How did the Fund perform?
The PGIM Emerging Markets Debt Local Currency Fund’s Class Z shares returned 2.63% in the 12-month reporting period that ended October 31, 2021, outperforming the 0.84% return of the JP Morgan Government Bond Index–Emerging Markets Global Diversified Index (the Index).
What were the market conditions?
| · | | Following 2020’s abrupt sell-off and subsequent strong recovery, the first 10 months of 2021 produced mixed results for emerging market debt. As economies responded to the unprecedented monetary and fiscal stimulus programs, investor appetite for risk assets generally remained strong, and credit spreads continued to decline as higher beta countries’ yield levels brought investors searching for yields. (Higher beta means having more risk than the market in general.) However, rising inflation concerns entering 2021 resulted in higher US Treasury rates, which weighed on performance as markets priced in the stronger-than-anticipated US growth and the impact that fiscal stimulus and monetary policy would have on longer-term inflation dynamics. |
| · | | In the first quarter of 2021, local rates produced negative returns, driven by a bear steepening (i.e., interest rates on long-term bonds rising faster than rates on short-term bonds) of the US yield curve and aggressive rate hikes by select emerging market central banks. (A yield curve is a line graph that illustrates the relationship between the yields and maturities of fixed income securities. It is created by plotting the yields of different maturities for the same type of bonds.) Higher energy and food prices, along with the depreciation of many emerging market currencies, put additional pressure on the front, or short-term, end of yield curves. Meanwhile, emerging market currencies declined on the back of the US and global yield curve steepening and a slowdown in emerging market local inflows. A slower-than-expected COVID-19 vaccine administration in the European Union and virus flare-ups across Latin America also contributed to emerging market currency weakness. |
| · | | The emerging market debt sector then benefited from renewed momentum in the second quarter of 2021. Local rates and emerging market currencies recovered on a weaker US dollar and a shifting focus from US growth to growth momentum in the rest of the world. However, the outlook for local rates grew less clear following the June Federal Open Market Committee meeting, with uncertainty around the timing of the Federal Reserve’s (the Fed’s) tapering of its monthly bond purchases requiring an extra risk premium while becoming more vulnerable to currency depreciation. |
| · | | In the third quarter of 2021, emerging market debt performance was mixed against the backdrop of growing concerns around a regulatory crackdown in China, the potential for economic slowdowns triggered by the COVID-19 Delta variant, and contagion from the China property sector. In the final week of August, markets were buoyed by supportive economic measures from China and a dovish tone from Fed Chairman Jerome Powell, who clearly differentiated a rate-hiking cycle from a tapering of bond purchases, making it clear that conditions needed for raising the federal |
| | |
| 8 | | Visit our website at pgim.com/investments |
| | funds rate would be more stringent than those needed for tapering. Most local rate markets witnessed a relief rally in July and August before underperforming in September due, in part, to high inflation prints and continued central bank hawkishness. Emerging market currencies saw a continuation of declines in July and the first three weeks of August, with commodity and cyclical currencies underperforming, but rallied after Powell failed to provide a timeline for tapering at the Fed’s Jackson Hole Economic Symposium. Emerging market currencies then weakened in September amid concerns over slowing global growth, an uncertain Fed policy, and inflation in both developed and emerging economies. |
| · | | Over the last month of the reporting period, most emerging market countries outside of Asia continued to underperform, in part due to high inflation prints and central bank hawkishness. Meanwhile, emerging market currencies saw a soft rebound in October 2021 versus the US dollar on higher commodities and lower US real yields. |
What worked?
| · | | Overall country selection and issue selection both contributed to the Fund’s performance over the reporting period. Long duration positioning in Indonesia sovereign bonds—along with short duration positioning in South Africa, Brazil, and Colombia sovereign bonds—contributed to performance. Sovereign bond positioning in Mexico, South Africa, and Brazil also contributed. (Duration measures the sensitivity of the price—the value of principal—of a bond to a change in interest rates.) |
| · | | The Fund’s allocation to out-of-Index hard currency bonds was also positive, with positioning in Angola, Mexico, Gabon, and South Africa sovereign bonds contributing to returns. |
| · | | Overall currency selection was positive, with overweight positioning to the Russian ruble, Turkish lira, Mexican peso, and Indonesian rupiah relative to the Index contributing. |
What didn’t work?
| · | | Long duration positioning in Russia, Mexico, Turkey, and South Korea sovereign bonds detracted from the Fund’s returns over the reporting period. |
| · | | Sovereign bond positioning in Indonesia, Malaysia, and Poland also detracted from performance. |
| · | | Within currencies, underweight positioning in the South African rand and Colombian peso, along with overweight positioning in the Brazilian real, relative to the Index detracted from returns. |
Did the Fund use derivatives?
Currency positioning in the Fund was partially facilitated by the use of currency forward and option contracts. During the reporting period, the Fund’s currency positioning contributed to relative performance. The Fund also used futures and interest rate swaps,
| | |
| PGIM Emerging Markets Debt Local Currency Fund | | 9 |
Strategy and Performance Overview (continued)
in part, to help manage duration and yield curve exposure, which collectively had a negative impact on performance.
Current outlook
| · | | While PGIM Fixed Income continues to expect differentiated performance across both emerging market debt sectors and issuers, given a post-Delta variant recovery in the growth outlook, some relief from supply-chain backlogs, and the near-term avoidance of a Fed policy mistake, its base case is that emerging market debt assets should, at worst, move sideways. Emerging market growth will slow in 2022, in PGIM Fixed Income’s view, due to fiscal, political, and China headwinds, making bottom-up fundamental credit selection all the more critical. |
| · | | Emerging market hard currency assets remain PGIM Fixed Income’s highest conviction, as it continues to emphasize a “barbell,” consisting of overweight positioning to front-end/higher-yielding credits and long-end/higher-quality credits to ensure it has the right mix of assets that can potentially perform well in varying market scenarios. |
| · | | In local bonds, PGIM Fixed Income’s base case is that dispersion in countries will continue and that it is too early for emerging market central banks to become less hawkish. That said, given the recent repricing of emerging market rates, it is looking for signals to become more constructive. |
| · | | PGIM Fixed Income believes the bar is high for emerging market currencies to see sustained strength as the Fed begins to taper its asset purchases and global growth slows. |
| | |
| 10 | | Visit our website at pgim.com/investments |
Fees and Expenses (unaudited)
As a shareholder of the Fund, you incur two types of costs: (1) transaction costs, including sales charges (loads) on purchase payments and redemptions, as applicable, and (2) ongoing costs, including management fees, distribution and/or service (12b-1) fees, and other Fund expenses, as applicable. This example is intended to help you understand your ongoing costs (in dollars) of investing in the Fund and to compare these costs with the ongoing costs of investing in other mutual funds.
The example is based on an investment of $1,000 held through the six-month period ended October 31, 2021. The example is for illustrative purposes only; you should consult the Prospectus for information on initial and subsequent minimum investment requirements.
Actual Expenses
The first line for each share class in the table on the following page provides information about actual account values and actual expenses. You may use the information on this line, together with the amount you invested, to estimate the expenses that you paid over the period. Simply divide your account value by $1,000 (for example, an $8,600 account value ÷ $1,000 = 8.6), then multiply the result by the number on the first line under the heading “Expenses Paid During the Six-Month Period” to estimate the expenses you paid on your account during this period.
Hypothetical Example for Comparison Purposes
The second line for each share class in the table on the following page provides information about hypothetical account values and hypothetical expenses based on the Fund’s actual expense ratio and an assumed rate of return of 5% per year before expenses, which is not the Fund’s actual return. The hypothetical account values and expenses may not be used to estimate the actual ending account balance or expenses you paid for the period. You may use this information to compare the ongoing costs of investing in the Fund and other funds. To do so, compare this 5% hypothetical example with the 5% hypothetical examples that appear in the shareholder reports of the other funds.
The Fund’s transfer agent may charge additional fees to holders of certain accounts that are not included in the expenses shown in the table on the following page. These fees apply to individual retirement accounts (IRAs) and Section 403(b) accounts. As of the close of the six-month period covered by the table, IRA fees included an annual maintenance fee of $15 per account (subject to a maximum annual maintenance fee of $25 for all accounts held by the same shareholder). Section 403(b) accounts are charged an annual $25 fiduciary maintenance fee. Some of the fees may vary in amount, or may be waived, based on your total account balance or the number of PGIM funds, including the Fund, that you own. You should consider the additional fees that were charged to your Fund account over the six-month period when you estimate the total ongoing expenses paid over the period and the impact of these fees on your ending account value, as these additional expenses are not reflected in the information
| | |
| PGIM Emerging Markets Debt Local Currency Fund | | 11 |
Fees and Expenses (continued)
provided in the expense table. Additional fees have the effect of reducing investment returns.
Please note that the expenses shown in the table are meant to highlight your ongoing costs only and do not reflect any transactional costs such as sales charges (loads). Therefore, the second line for each share class in the table is useful in comparing ongoing costs only and will not help you determine the relative total costs of owning different funds. In addition, if these transactional costs were included, your costs would have been higher.
| | | | | | | | | | |
| | | | |
PGIM Emerging Markets Debt Local Currency Fund | | Beginning Account Value May 1, 2021 | | Ending Account Value October 31, 2021 | | Annualized Expense Ratio Based on the Six-Month Period | | Expenses Paid During the Six-Month Period* |
| | | | | |
Class A | | Actual | | $1,000.00 | | $ 972.00 | | 1.13% | | $5.62 |
| | | | | |
| | Hypothetical | | $1,000.00 | | $1,019.51 | | 1.13% | | $5.75 |
| | | | | |
Class C | | Actual | | $1,000.00 | | $ 968.70 | | 1.88% | | $9.33 |
| | | | | |
| | Hypothetical | | $1,000.00 | | $1,015.73 | | 1.88% | | $9.55 |
| | | | | |
Class Z | | Actual | | $1,000.00 | | $ 972.70 | | 0.72% | | $3.58 |
| | | | | |
| | Hypothetical | | $1,000.00 | | $1,021.58 | | 0.72% | | $3.67 |
| | | | | |
Class R6 | | Actual | | $1,000.00 | | $ 974.80 | | 0.65% | | $3.24 |
| | | | | |
| | | Hypothetical | | $1,000.00 | | $1,021.93 | | 0.65% | | $3.31 |
*Fund expenses (net of fee waivers or subsidies, if any) for each share class are equal to the annualized expense ratio for each share class (provided in the table), multiplied by the average account value over the period, multiplied by the 184 days in the six-month period ended October 31, 2021, and divided by the 365 days in the Fund’s fiscal year ended October 31, 2021 (to reflect the six-month period). Expenses presented in the table include the expenses of any underlying portfolios in which the Fund may invest.
| | |
| 12 | | Visit our website at pgim.com/investments |
Schedule of Investments
as of October 31, 2021
| | | | | | | | | | | | | | | | | | | | |
| | | | |
| Description | | Interest
Rate | | | Maturity
Date | | | Principal Amount (000)# | | | Value | |
| | | | | |
LONG-TERM INVESTMENTS 95.9% | | | | | | | | | | | | | | | | | | | | |
| | | | | |
CORPORATE BONDS 7.4% | | | | | | | | | | | | | | | | | | | | |
| | | | | |
Brazil 0.3% | | | | | | | | | | | | | | | | | | | | |
| | | | | |
JSM Global Sarl,
Gtd. Notes, 144A | | | 4.750% | | | | 10/20/30 | | | | | | | | 200 | | | $ | 190,300 | |
| | | | | |
Jamaica 0.4% | | | | | | | | | | | | | | | | | | | | |
| | | | | |
Digicel Ltd.,
Gtd. Notes | | | 6.750 | | | | 03/01/23 | | | | | | | | 235 | | | | 227,267 | |
| | | | | |
Malaysia 0.4% | | | | | | | | | | | | | | | | | | | | |
| | | | | |
Gohl Capital Ltd.,
Gtd. Notes | | | 4.250 | | | | 01/24/27 | | | | | | | | 200 | | | | 207,698 | |
| | | | | |
Mexico 1.9% | | | | | | | | | | | | | | | | | | | | |
| | | | | |
America Movil SAB de CV,
Sr. Unsec’d. Notes | | | 6.450 | | | | 12/05/22 | | | | MXN | | | | 14,250 | | | | 689,066 | |
Petroleos Mexicanos, | | | | | | | | | | | | | | | | | | | | |
Gtd. Notes | | | 6.490 | | | | 01/23/27 | | | | | | | | 55 | | | | 58,526 | |
Gtd. Notes | | | 6.500 | | | | 03/13/27 | | | | | | | | 80 | | | | 85,280 | |
Gtd. Notes, MTN | | | 6.875 | | | | 08/04/26 | | | | | | | | 195 | | | | 212,954 | |
| | | | | | | | | | | | | | | | | | | | |
| | | | | |
| | | | | | | | | | | | | | | | | | | 1,045,826 | |
| | | | | |
Russia 2.2% | | | | | | | | | | | | | | | | | | | | |
| | | | | |
Gazprom Capital OOO, | | | | | | | | | | | | | | | | | | | | |
Gtd. Notes, Series BO03 | | | 7.150(cc) | | | | 02/15/28 | | | | RUB | | | | 45,000 | | | | 608,188 | |
Gtd. Notes, Series BO05 | | | 8.900(cc) | | | | 02/03/27 | | | | RUB | | | | 42,000 | | | | 600,698 | |
| | | | | | | | | | | | | | | | | | | | |
| | | | | |
| | | | | | | | | | | | | | | | | | | 1,208,886 | |
| | | | | |
South Africa 0.7% | | | | | | | | | | | | | | | | | | | | |
| | | | | |
Eskom Holdings SOC Ltd.,
Sr. Unsec’d. Notes, 144A, MTN | | | 6.750 | | | | 08/06/23 | | | | | | | | 200 | | | | 206,553 | |
Sasol Financing USA LLC,
Gtd. Notes | | | 5.875 | | | | 03/27/24 | | | | | | | | 200 | | | | 211,094 | |
| | | | | | | | | | | | | | | | | | | | |
| | | | | |
| | | | | | | | | | | | | | | | | | | 417,647 | |
| | | | | |
Supranational Bank 1.5% | | | | | | | | | | | | | | | | | | | | |
| | | | | |
European Bank for Reconstruction & Development, | | | | | | | | | | | | | | | | | | | | |
Sr. Unsec’d. Notes, EMTN | | | 7.500 | | | | 05/15/22 | | | | IDR | | | | 900,000 | | | | 64,490 | |
Sr. Unsec’d. Notes, GMTN | | | 6.450 | | | | 12/13/22 | | | | IDR | | | | 7,500,000 | | | | 540,504 | |
See Notes to Financial Statements.
PGIM Emerging Markets Debt Local Currency Fund 13
Schedule of Investments (continued)
as of October 31, 2021
| | | | | | | | | | | | | | | | | | | | |
| | | | |
| Description | | Interest
Rate | | | Maturity
Date | | | Principal Amount (000)# | | | Value | |
| | | | | |
CORPORATE BONDS (Continued) | | | | | | | | | | | | | | | | | | | | |
| | | | | |
Supranational Bank (cont’d.) | | | | | | | | | | | | | | | | | | | | |
| | | | | |
European Investment Bank, | | | | | | | | | | | | | | | | | | | | |
Sr. Unsec’d. Notes, EMTN | | | 12.576%(s) | | | | 09/05/22 | | | | TRY | | | | 1,260 | | | $ | 114,288 | |
Sr. Unsec’d. Notes, EMTN | | | 3.000 | | | | 05/24/24 | | | | PLN | | | | 600 | | | | 152,853 | |
| | | | | | | | | | | | | | | | | | | | |
| | | | | |
| | | | | | | | | | | | | | | | | | | 872,135 | |
| | | | | | | | | | | | | | | | | | | | |
| | | | | |
TOTAL CORPORATE BONDS
(cost $4,500,122) | | | | | | | | | | | | | | | | | | | 4,169,759 | |
| | | | | | | | | | | | | | | | | | | | |
| | | | | |
FOREIGN TREASURY OBLIGATION 1.1% | | | | | | | | | | | | | | | | | | | | |
| | | | | |
Brazil | | | | | | | | | | | | | | | | | | | | |
| | | | | |
Brazil Letras do Tesouro Nacional,
(cost $700,637) | | | 6.144(s) | | | | 01/01/24 | | | | BRL | | | | 4,318 | | | | 595,330 | |
| | | | | | | | | | | | | | | | | | | | |
| | | | | |
SOVEREIGN BONDS 87.4% | | | | | | | | | | | | | | | | | | | | |
| | | | | |
Angola 0.8% | | | | | | | | | | | | | | | | | | | | |
| | | | | |
Angolan Government International Bond,
Sr. Unsec’d. Notes | | | 9.500 | | | | 11/12/25 | | | | | | | | 400 | | | | 433,555 | |
| | | | | |
Argentina 0.6% | | | | | | | | | | | | | | | | | | | | |
| | | | | |
Argentine Republic Government International Bond,
Sr. Unsec’d. Notes | | | 0.500(cc) | | | | 07/09/30 | | | | | | | | 466 | | | | 159,611 | |
Sr. Unsec’d. Notes | | | 1.000 | | | | 07/09/29 | | | | | | | | 24 | | | | 8,640 | |
Provincia de Buenos Aires,
Sr. Unsec’d. Notes, 144A, MTN | | | 3.900(cc) | | | | 09/01/37 | | | | | | | | 332 | | | | 146,810 | |
| | | | | | | | | | | | | | | | | | | | |
| | | | | |
| | | | | | | | | | | | | | | | | | | 315,061 | |
| | | | | |
Brazil 3.5% | | | | | | | | | | | | | | | | | | | | |
| | | | | |
Brazil Minas SPE via State of Minas Gerais,
Gov’t. Gtd. Notes | | | 5.333 | | | | 02/15/28 | | | | | | | | 165 | | | | 174,496 | |
Brazil Notas do Tesouro Nacional, | | | | | | | | | | | | | | | | | | | | |
Notes, Series B | | | 6.000 | | | | 08/15/30 | | | | BRL | | | | 1,725 | | | | 315,244 | |
Notes, Series NTNF | | | 10.000 | | | | 01/01/23 | | | | BRL | | | | 3,422 | | | | 592,277 | |
Notes, Series NTNF | | | 10.000 | | | | 01/01/25 | | | | BRL | | | | 3,843 | | | | 643,878 | |
Notes, Series NTNF | | | 10.000 | | | | 01/01/27 | | | | BRL | | | | 1,214 | | | | 198,208 | |
Notes, Series NTNF | | | 10.000 | | | | 01/01/31 | | | | BRL | | | | 200 | | | | 31,379 | |
Brazilian Government International Bond,
Sr. Unsec’d. Notes | | | 8.500 | | | | 01/05/24 | | | | BRL | | | | 54 | | | | 9,149 | |
| | | | | | | | | | | | | | | | | | | | |
| | | | | |
| | | | | | | | | | | | | | | | | | | 1,964,631 | |
See Notes to Financial Statements.
14
| | | | | | | | | | | | | | | | | | | | |
| | | | |
| Description | | Interest
Rate | | | Maturity
Date | | | Principal Amount (000)# | | | Value | |
| | | | | |
SOVEREIGN BONDS (Continued) | | | | | | | | | | | | | | | | | | | | |
| | | | | |
Chile 2.2% | | | | | | | | | | | | | | | | | | | | |
| | | | | |
Bonos de la Tesoreria de la Republica en pesos, | | | | | | | | | | | | | | | | | | | | |
Bonds | | | 4.500% | | | | 03/01/26 | | | | CLP | | | | 280,000 | | | $ | 328,241 | |
Bonds | | | 5.000 | | | | 03/01/35 | | | | CLP | | | | 115,000 | | | | 125,773 | |
Bonds, 144A | | | 5.000 | | | | 10/01/28 | | | | CLP | | | | 110,000 | | | | 127,891 | |
Bonds, Series 30YR | | | 6.000 | | | | 01/01/43(a) | | | | CLP | | | | 135,000 | | | | 158,070 | |
Unsec’d. Notes, 144A | | | 2.300 | | | | 10/01/28 | | | | CLP | | | | 175,000 | | | | 170,952 | |
Unsec’d. Notes, 144A | | | 2.800 | | | | 10/01/33 | | | | CLP | | | | 50,000 | | | | 43,970 | |
Unsec’d. Notes, 144A | | | 4.700 | | | | 09/01/30 | | | | CLP | | | | 250,000 | | | | 280,377 | |
| | | | | | | | | | | | | | | | | | | | |
| | | | | |
| | | | | | | | | | | | | | | | | | | 1,235,274 | |
| | | | | |
China 10.7% | | | | | | | | | | | | | | | | | | | | |
| | | | | |
China Government Bond, | | | | | | | | | | | | | | | | | | | | |
Bonds, Series 1906 | | | 3.290 | | | | 05/23/29 | | | | CNH | | | | 3,690 | | | | 588,670 | |
Bonds, Series 1910 | | | 3.860 | | | | 07/22/49 | | | | CNH | | | | 1,610 | | | | 264,974 | |
Bonds, Series INBK | | | 1.990 | | | | 04/09/25 | | | | CNH | | | | 6,500 | | | | 988,352 | |
Bonds, Series INBK | | | 2.680 | | | | 05/21/30 | | | | CNH | | | | 7,700 | | | | 1,165,878 | |
Bonds, Series INBK | | | 2.850 | | | | 06/04/27 | | | | CNH | | | | 10,500 | | | | 1,634,538 | |
Bonds, Series INBK | | | 3.010 | | | | 05/13/28 | | | | CNH | | | | 2,000 | | | | 313,241 | |
Bonds, Series INBK | | | 3.270 | | | | 11/19/30 | | | | CNH | | | | 3,000 | | | | 478,102 | |
Unsec’d. Notes, Series INBK | | | 3.030 | | | | 03/11/26 | | | | CNH | | | | 2,500 | | | | 393,658 | |
Unsec’d. Notes, Series INBK | | | 3.810 | | | | 09/14/50 | | | | CNH | | | | 1,000 | | | | 163,694 | |
| | | | | | | | | | | | | | | | | | | | |
| | | | | |
| | | | | | | | | | | | | | | | | | | 5,991,107 | |
| | | | | |
Colombia 3.8% | | | | | | | | | | | | | | | | | | | | |
| | | | | |
Colombian TES, | | | | | | | | | | | | | | | | | | | | |
Bonds, Series B | | | 5.750 | | | | 11/03/27 | | | | COP | | | | 250,000 | | | | 61,041 | |
Bonds, Series B | | | 6.000 | | | | 04/28/28 | | | | COP | | | | 2,121,000 | | | | 517,248 | |
Bonds, Series B | | | 6.250 | | | | 11/26/25 | | | | COP | | | | 1,000,000 | | | | 259,884 | |
Bonds, Series B | | | 7.000 | | | | 06/30/32 | | | | COP | | | | 1,637,900 | | | | 400,930 | |
Bonds, Series B | | | 7.250 | | | | 10/18/34 | | | | COP | | | | 777,800 | | | | 190,735 | |
Bonds, Series B | | | 7.250 | | | | 10/26/50 | | | | COP | | | | 210,000 | | | | 48,034 | |
Bonds, Series B | | | 7.500 | | | | 08/26/26 | | | | COP | | | | 1,150,900 | | | | 309,700 | |
Bonds, Series B | | | 7.750 | | | | 09/18/30 | | | | COP | | | | 500,000 | | | | 132,328 | |
Bonds, Series G | | | 7.000 | | | | 03/26/31 | | | | COP | | | | 601,800 | | | | 149,118 | |
Sr. Unsec’d. Notes | | | 3.750 | | | | 06/16/49 | | | | COP | | | | 186,781 | | | | 47,429 | |
| | | | | | | | | | | | | | | | | | | | |
| | | | | |
| | | | | | | | | | | | | | | | | | | 2,116,447 | |
| | | | | |
Czech Republic 2.5% | | | | | | | | | | | | | | | | | | | | |
| | | | | |
Czech Republic Government Bond, | | | | | | | | | | | | | | | | | | | | |
Bonds, Series 049 | | | 4.200 | | | | 12/04/36 | | | | CZK | | | | 2,000 | | | | 107,015 | |
See Notes to Financial Statements.
PGIM Emerging Markets Debt Local Currency Fund 15
Schedule of Investments (continued)
as of October 31, 2021
| | | | | | | | | | | | | | | | | | | | |
| | | | |
| Description | | Interest
Rate | | | Maturity
Date | | | Principal Amount (000)# | | | Value | |
| | | | | |
SOVEREIGN BONDS (Continued) | | | | | | | | | | | | | | | | | | | | |
| | | | | |
Czech Republic (cont’d.) | | | | | | | | | | | | | | | | | | | | |
| | | | | |
Czech Republic Government Bond, (cont’d.) | | | | | | | | | | | | | | | | | | | | |
Bonds, Series 078 | | | 2.500% | | | | 08/25/28 | | | | CZK | | | | 2,100 | | | $ | 93,056 | |
Bonds, Series 094 | | | 0.950 | | | | 05/15/30 | | | | CZK | | | | 8,230 | | | | 321,258 | |
Bonds, Series 095 | | | 1.000 | | | | 06/26/26 | | | | CZK | | | | 3,000 | | | | 124,581 | |
Bonds, Series 100 | | | 0.250 | | | | 02/10/27 | | | | CZK | | | | 6,210 | | | | 245,193 | |
Bonds, Series 103 | | | 2.000 | | | | 10/13/33 | | | | CZK | | | | 4,790 | | | | 200,544 | |
Bonds, Series 105 | | | 2.750 | | | | 07/23/29 | | | | CZK | | | | 3,500 | | | | 157,847 | |
Bonds, Series 121 | | | 1.200 | | | | 03/13/31 | | | | CZK | | | | 3,300 | | | | 130,373 | |
| | | | | | | | | | | | | | | | | | | | |
| | | | | |
| | | | | | | | | | | | | | | | | | | 1,379,867 | |
| | | | | |
Dominican Republic 0.3% | | | | | | | | | | | | | | | | | | | | |
| | | | | |
Dominican Republic International Bond, | | | | | | | | | | | | | | | | | | | | |
Sr. Unsec’d. Notes | | | 9.750 | | | | 06/05/26 | | | | DOP | | | | 8,000 | | | | 166,313 | |
| | | | | |
Hungary 3.3% | | | | | | | | | | | | | | | | | | | | |
| | | | | |
Hungary Government Bond, | | | | | | | | | | | | | | | | | | | | |
Bonds, Series 25/B | | | 5.500 | | | | 06/24/25 | | | | HUF | | | | 175,530 | | | | 613,798 | |
Bonds, Series 26/D | | | 2.750 | | | | 12/22/26 | | | | HUF | | | | 70,000 | | | | 218,543 | |
Bonds, Series 26/E | | | 1.500 | | | | 04/22/26 | | | | HUF | | | | 115,000 | | | | 343,708 | |
Bonds, Series 27/A | | | 3.000 | | | | 10/27/27 | | | | HUF | | | | 42,680 | | | | 133,366 | |
Bonds, Series 28/A | | | 6.750 | | | | 10/22/28 | | | | HUF | | | | 76,680 | | | | 293,730 | |
Bonds, Series 34/A | | | 2.250 | | | | 06/22/34 | | | | HUF | | | | 24,810 | | | | 65,449 | |
Bonds, Series 38/A | | | 3.000 | | | | 10/27/38 | | | | HUF | | | | 21,890 | | | | 59,659 | |
Bonds, Series 51/G | | | 4.000 | | | | 04/28/51 | | | | HUF | | | | 29,330 | | | | 90,132 | |
| | | | | | | | | | | | | | | | | | | | |
| | | | | |
| | | | | | | | | | | | | | | | | | | 1,818,385 | |
| | | | | |
Indonesia 11.5% | | | | | | | | | | | | | | | | | | | | |
| | | | | |
Indonesia Treasury Bond, | | | | | | | | | | | | | | | | | | | | |
Bonds, Series 056 | | | 8.375 | | | | 09/15/26 | | | | IDR | | | | 8,632,000 | | | | 692,242 | |
Bonds, Series 059 | | | 7.000 | | | | 05/15/27 | | | | IDR | | | | 7,065,000 | | | | 536,277 | |
Bonds, Series 064 | | | 6.125 | | | | 05/15/28 | | | | IDR | | | | 2,400,000 | | | | 173,423 | |
Bonds, Series 065 | | | 6.625 | | | | 05/15/33 | | | | IDR | | | | 3,200,000 | | | | 227,637 | |
Bonds, Series 068 | | | 8.375 | | | | 03/15/34 | | | | IDR | | | | 6,268,000 | | | | 500,206 | |
Bonds, Series 070 | | | 8.375 | | | | 03/15/24 | | | | IDR | | | | 1,410,000 | | | | 108,798 | |
Bonds, Series 071 | | | 9.000 | | | | 03/15/29 | | | | IDR | | | | 4,952,000 | | | | 409,091 | |
Bonds, Series 072 | | | 8.250 | | | | 05/15/36 | | | | IDR | | | | 3,816,000 | | | | 303,284 | |
Bonds, Series 073 | | | 8.750 | | | | 05/15/31 | | | | IDR | | | | 4,940,000 | | | | 409,167 | |
Bonds, Series 075 | | | 7.500 | | | | 05/15/38 | | | | IDR | | | | 4,496,000 | | | | 333,300 | |
Bonds, Series 077 | | | 8.125 | | | | 05/15/24 | | | | IDR | | | | 3,500,000 | | | | 270,135 | |
Bonds, Series 078 | | | 8.250 | | | | 05/15/29 | | | | IDR | | | | 5,050,000 | | | | 401,696 | |
Bonds, Series 079 | | | 8.375 | | | | 04/15/39 | | | | IDR | | | | 400,000 | | | | 31,903 | |
See Notes to Financial Statements.
16
| | | | | | | | | | | | | | | | | | | | |
| | | | |
| Description | | Interest
Rate | | | Maturity
Date | | | Principal Amount (000)# | | | Value | |
| | | | | |
SOVEREIGN BONDS (Continued) | | | | | | | | | | | | | | | | | | | | |
| | | | | |
Indonesia (cont’d.) | | | | | | | | | | | | | | | | | | | | |
| | | | | |
Indonesia Treasury Bond, (cont’d.) | | | | | | | | | | | | | | | | | | | | |
Bonds, Series 080 | | | 7.500% | | | | 06/15/35 | | | | IDR | | | | 3,870,000 | | | $ | 289,705 | |
Bonds, Series 081 | | | 6.500 | | | | 06/15/25 | | | | IDR | | | | 7,400,000 | | | | 550,853 | |
Bonds, Series 082 | | | 7.000 | | | | 09/15/30 | | | | IDR | | | | 6,515,000 | | | | 485,138 | |
Bonds, Series 083 | | | 7.500 | | | | 04/15/40 | | | | IDR | | | | 3,040,000 | | | | 225,383 | |
Bonds, Series 087 | | | 6.500 | | | | 02/15/31 | | | | IDR | | | | 7,023,000 | | | | 507,287 | |
| | | | | | | | | | | | | | | | | | | | |
| | | | | |
| | | | | | | | | | | | | | | | | | | 6,455,525 | |
| | | | | |
Ivory Coast 0.2% | | | | | | | | | | | | | | | | | | | | |
| | | | | |
Ivory Coast Government International Bond, | | | | | | | | | | | | | | | | | | | | |
Sr. Unsec’d. Notes | | | 5.250 | | | | 03/22/30 | | | | EUR | | | | 115 | | | | 136,697 | |
| | | | | |
Malaysia 9.4% | | | | | | | | | | | | | | | | | | | | |
| | | | | |
1MDB Global Investments Ltd., | | | | | | | | | | | | | | | | | | | | |
Sr. Unsec’d. Notes | | | 4.400 | | | | 03/09/23 | | | | | | | | 1,000 | | | | 1,004,326 | |
Malaysia Government Bond, | | | | | | | | | | | | | | | | | | | | |
Bonds, Series 0115 | | | 3.955 | | | | 09/15/25 | | | | MYR | | | | 1,650 | | | | 412,268 | |
Bonds, Series 0118 | | | 3.882 | | | | 03/14/25 | | | | MYR | | | | 1,977 | | | | 492,297 | |
Bonds, Series 0217 | | | 4.059 | | | | 09/30/24 | | | | MYR | | | | 335 | | | | 83,895 | |
Bonds, Series 0219 | | | 3.885 | | | | 08/15/29 | | | | MYR | | | | 2,200 | | | | 541,170 | |
Bonds, Series 0307 | | | 3.502 | | | | 05/31/27 | | | | MYR | | | | 500 | | | | 121,722 | |
Bonds, Series 0310 | | | 4.498 | | | | 04/15/30 | | | | MYR | | | | 400 | | | | 102,173 | |
Bonds, Series 0311 | | | 4.392 | | | | 04/15/26 | | | | MYR | | | | 285 | | | | 72,406 | |
Bonds, Series 0316 | | | 3.900 | | | | 11/30/26 | | | | MYR | | | | 2,625 | | | | 653,600 | |
Bonds, Series 0317 | | | 4.762 | | | | 04/07/37 | | | | MYR | | | | 1,022 | | | | 261,122 | |
Bonds, Series 0411 | | | 4.232 | | | | 06/30/31 | | | | MYR | | | | 280 | | | | 70,034 | |
Bonds, Series 0413 | | | 3.844 | | | | 04/15/33 | | | | MYR | | | | 390 | | | | 92,907 | |
Bonds, Series 0415 | | | 4.254 | | | | 05/31/35 | | | | MYR | | | | 700 | | | | 172,714 | |
Bonds, Series 0417 | | | 3.899 | | | | 11/16/27 | | | | MYR | | | | 1,370 | | | | 340,197 | |
Bonds, Series 0419 | | | 3.828 | | | | 07/05/34 | | | | MYR | | | | 500 | | | | 116,992 | |
Bonds, Series 0513 | | | 3.733 | | | | 06/15/28 | | | | MYR | | | | 1,480 | | | | 362,902 | |
Bonds, Series 0519 | | | 3.757 | | | | 05/22/40 | | | | MYR | | | | 900 | | | | 205,303 | |
Malaysia Government Investment Issue, | | | | | | | | | | | | | | | | | | | | |
Bonds, Series 0617 | | | 4.724 | | | | 06/15/33 | | | | MYR | | | | 600 | | | | 154,389 | |
| | | | | | | | | | | | | | | | | | | | |
| | | | | |
| | | | | | | | | | | | | | | | | | | 5,260,417 | |
| | | | | |
Mexico 4.1% | | | | | | | | | | | | | | | | | | | | |
| | | | | |
Mexican Bonos, | | | | | | | | | | | | | | | | | | | | |
Bonds, Series M | | | 7.750 | | | | 05/29/31 | | | | MXN | | | | 8,210 | | | | 405,581 | |
Bonds, Series M | | | 8.000 | | | | 11/07/47 | | | | MXN | | | | 8,628 | | | | 421,653 | |
Bonds, Series M20 | | | 7.500 | | | | 06/03/27 | | | | MXN | | | | 6,264 | | | | 305,891 | |
See Notes to Financial Statements.
PGIM Emerging Markets Debt Local Currency Fund 17
Schedule of Investments (continued)
as of October 31, 2021
| | | | | | | | | | | | | | | | | | | | |
| | | | |
| Description | | Interest
Rate | | | Maturity
Date | | | Principal
Amount (000)# | | | Value | |
| | | | | |
SOVEREIGN BONDS (Continued) | | | | | | | | | | | | | | | | | | | | |
| | | | | |
Mexico (cont’d.) | | | | | | | | | | | | | | | | | | | | |
| | | | | |
Mexican Bonos, (cont’d.) | | | | | | | | | | | | | | | | | | | | |
Bonds, Series M30 | | | 10.000% | | | | 11/20/36 | | | | MXN | | | | 2,355 | | | $ | 138,261 | |
Sr. Unsec’d. Notes, Series M | | | 7.750 | | | | 11/13/42 | | | | MXN | | | | 5,400 | | | | 257,871 | |
Sr. Unsec’d. Notes, Series M20 | | | 8.500 | | | | 05/31/29 | | | | MXN | | | | 2,500 | | | | 128,787 | |
Sr. Unsec’d. Notes, Series M30 | | | 8.500 | | | | 11/18/38 | | | | MXN | | | | 7,000 | | | | 359,345 | |
Mexican Udibonos, | | | | | | | | | | | | | | | | | | | | |
Bonds, Series S | | | 2.750 | | | | 11/27/31 | | | | MXN | | | | 2,956 | | | | 141,544 | |
Bonds, Series S | | | 4.500 | | | | 12/04/25 | | | | MXN | | | | 3,015 | | | | 159,025 | |
| | | | | | | | | | | | | | | | | | | | |
| | | | | |
| | | | | | | | | | | | | | | | | | | 2,317,958 | |
| | | | | |
Nigeria 0.4% | | | | | | | | | | | | | | | | | | | | |
| | | | | |
Nigeria Government International Bond,
Sr. Unsec’d. Notes | | | 7.625 | | | | 11/21/25 | | | | | | | | 200 | | | | 217,651 | |
| | | | | |
Pakistan 1.1% | | | | | | | | | | | | | | | | | | | | |
| | | | | |
Pakistan Government International Bond,
Sr. Unsec’d. Notes | | | 8.250 | | | | 09/30/25 | | | | | | | | 200 | | | | 217,415 | |
Third Pakistan International Sukuk Co. Ltd. (The),
Sr. Unsec’d. Notes, 144A | | | 5.625 | | | | 12/05/22 | | | | | | | | 400 | | | | 409,760 | |
| | | | | | | | | | | | | | | | | | | | |
| | | | | |
| | | | | | | | | | | | | | | | | | | 627,175 | |
| | | | | |
Peru 2.5% | | | | | | | | | | | | | | | | | | | | |
| | | | | |
Peru Government Bond, | | | | | | | | | | | | | | | | | | | | |
Bonds | | | 5.940 | | | | 02/12/29 | | | | PEN | | | | 1,360 | | | | 351,905 | |
Bonds | | | 6.950 | | | | 08/12/31 | | | | PEN | | | | 190 | | | | 51,422 | |
Sr. Unsec’d. Notes | | | 5.350 | | | | 08/12/40 | | | | PEN | | | | 1,000 | | | | 211,816 | |
Sr. Unsec’d. Notes | | | 5.400 | | | | 08/12/34 | | | | PEN | | | | 580 | | | | 132,753 | |
Sr. Unsec’d. Notes | | | 6.150 | | | | 08/12/32 | | | | PEN | | | | 855 | | | | 216,352 | |
Peruvian Government International Bond, | | | | | | | | | | | | | | | | | | | | |
Sr. Unsec’d. Notes | | | 6.350 | | | | 08/12/28 | | | | PEN | | | | 435 | | | | 115,503 | |
Sr. Unsec’d. Notes | | | 6.850 | | | | 02/12/42 | | | | PEN | | | | 245 | | | | 61,205 | |
Sr. Unsec’d. Notes | | | 6.900 | | | | 08/12/37 | | | | PEN | | | | 521 | | | | 132,056 | |
Sr. Unsec’d. Notes | | | 6.950 | | | | 08/12/31 | | | | PEN | | | | 478 | | | | 129,478 | |
| | | | | | | | | | | | | | | | | | | | |
| | | | | |
| | | | | | | | | | | | | | | | | | | 1,402,490 | |
| | | | | |
Philippines 0.2% | | | | | | | | | | | | | | | | | | | | |
| | | | | |
Philippine Government Bond,
Bonds, Series 1060 | | | 3.625 | | | | 09/09/25 | | | | PHP | | | | 5,600 | | | | 112,496 | |
See Notes to Financial Statements.
18
| | | | | | | | | | | | | | | | | | | | |
| | | | |
| Description | | Interest
Rate | | | Maturity
Date | | | Principal
Amount
(000)# | | | Value | |
| | | | | |
SOVEREIGN BONDS (Continued) | | | | | | | | | | | | | | | | | | | | |
| | | | | |
Poland 4.6% | | | | | | | | | | | | | | | | | | | | |
| | | | | |
Republic of Poland Government Bond, | | | | | | | | | | | | | | | | | | | | |
Bonds, Series 0428 | | | 2.750% | | | | 04/25/28 | | | | PLN | | | | 1,480 | | | $ | 376,830 | |
Bonds, Series 0725 | | | 3.250 | | | | 07/25/25 | | | | PLN | | | | 761 | | | | 197,828 | |
Bonds, Series 0726 | | | 2.500 | | | | 07/25/26 | | | | PLN | | | | 3,740 | | | | 945,734 | |
Bonds, Series 0727 | | | 2.500 | | | | 07/25/27 | | | | PLN | | | | 1,600 | | | | 402,847 | |
Bonds, Series 1026 | | | 0.250 | | | | 10/25/26 | | | | PLN | | | | 280 | | | | 63,209 | |
Bonds, Series 1029 | | | 2.750 | | | | 10/25/29 | | | | PLN | | | | 1,740 | | | | 439,883 | |
Bonds, Series 1030 | | | 1.250 | | | | 10/25/30 | | | | PLN | | | | 750 | | | | 166,284 | |
| | | | | | | | | | | | | | | | | | | | |
| | | | | |
| | | | | | | | | | | | | | | | | | | 2,592,615 | |
| | | | | |
Romania 2.2% | | | | | | | | | | | | | | | | | | | | |
| | | | | |
Romania Government Bond, | | | | | | | | | | | | | | | | | | | | |
Bonds, Series 05YR | | | 3.650 | | | | 07/28/25 | | | | RON | | | | 1,000 | | | | 227,740 | |
Bonds, Series 05YR | | | 4.250 | | | | 06/28/23 | | | | RON | | | | 1,145 | | | | 269,157 | |
Bonds, Series 07YR | | | 3.250 | | | | 04/29/24 | | | | RON | | | | 750 | | | | 172,106 | |
Bonds, Series 07YR | | | 4.850 | | | | 04/22/26 | | | | RON | | | | 980 | | | | 232,330 | |
Bonds, Series 10YR | | | 5.000 | | | | 02/12/29 | | | | RON | | | | 500 | | | | 117,929 | |
Bonds, Series 10YR | | | 5.850 | | | | 04/26/23 | | | | RON | | | | 460 | | | | 110,572 | |
Bonds, Series 15YR | | | 3.650 | | | | 09/24/31 | | | | RON | | | | 590 | | | | 124,731 | |
| | | | | | | | | | | | | | | | | | | | |
| | | | | |
| | | | | | | | | | | | | | | | | | �� | 1,254,565 | |
| | | | | |
Russia 4.8% | | | | | | | | | | | | | | | | | | | | |
| | | | | |
Russian Federal Bond - OFZ, | | | | | | | | | | | | | | | | | | | | |
Bonds, Series 6212 | | | 7.050 | | | | 01/19/28 | | | | RUB | | | | 15,495 | | | | 206,946 | |
Bonds, Series 6218 | | | 8.500 | | | | 09/17/31 | | | | RUB | | | | 16,712 | | | | 242,783 | |
Bonds, Series 6219 | | | 7.750 | | | | 09/16/26 | | | | RUB | | | | 12,000 | | | | 165,975 | |
Bonds, Series 6221 | | | 7.700 | | | | 03/23/33 | | | | RUB | | | | 14,280 | | | | 196,601 | |
Bonds, Series 6224 | | | 6.900 | | | | 05/23/29 | | | | RUB | | | | 27,635 | | | | 364,420 | |
Bonds, Series 6228 | | | 7.650 | | | | 04/10/30 | | | | RUB | | | | 22,600 | | | | 310,858 | |
Bonds, Series 6229 | | | 7.150 | | | | 11/12/25 | | | | RUB | | | | 7,500 | | | | 101,605 | |
Bonds, Series 6230 | | | 7.700 | | | | 03/16/39 | | | | RUB | | | | 13,030 | | | | 178,939 | |
Bonds, Series 6232 | | | 6.000 | | | | 10/06/27 | | | | RUB | | | | 8,500 | | | | 107,958 | |
Bonds, Series 6235 | | | 5.900 | | | | 03/12/31 | | | | RUB | | | | 56,110 | | | | 680,633 | |
Russian Federal Inflation Linked Bond,
Unsec’d. Notes, Series 2003 | | | 2.500 | | | | 07/17/30 | | | | RUB | | | | 8,205 | | | | 110,792 | |
| | | | | | | | | | | | | | | | | | | | |
| | | | | |
| | | | | | | | | | | | | | | | | | | 2,667,510 | |
See Notes to Financial Statements.
PGIM Emerging Markets Debt Local Currency Fund 19
Schedule of Investments (continued)
as of October 31, 2021
| | | | | | | | | | | | | | | | | | | | |
| | | | |
| Description | | Interest
Rate | | | Maturity
Date | | | Principal Amount (000)# | | | Value | |
| | | | | |
SOVEREIGN BONDS (Continued) | | | | | | | | | | | | | | | | | | | | |
| | | | | |
Serbia 0.3% | | | | | | | | | | | | | | | | | | | | |
| | | | | |
Serbia Treasury Bonds, | | | | | | | | | | | | | | | | | | | | |
Bonds, Series 07YR | | | 4.500% | | | | 01/11/26 | | | | RSD | | | | 9,460 | | | $ | 97,878 | |
Bonds, Series 12.5 | | | 4.500 | | | | 08/20/32 | | | | RSD | | | | 6,240 | | | | 63,614 | |
| | | | | | | | | | | | | | | | | | | | |
| | | | | |
| | | | | | | | | | | | | | | | | | | 161,492 | |
| | | | | |
South Africa 8.8% | | | | | | | | | | | | | | | | | | | | |
| | | | | |
Republic of South Africa Government Bond, | | | | | | | | | | | | | | | | | | | | |
Sr. Unsec’d. Notes, Series 2023 | | | 7.750 | | | | 02/28/23 | | | | ZAR | | | | 1,500 | | | | 100,878 | |
Sr. Unsec’d. Notes, Series 2030 | | | 8.000 | | | | 01/31/30 | | | | ZAR | | | | 11,395 | | | | 677,309 | |
Sr. Unsec’d. Notes, Series 2032 | | | 8.250 | | | | 03/31/32 | | | | ZAR | | | | 8,470 | | | | 486,217 | |
Sr. Unsec’d. Notes, Series 2035 | | | 8.875 | | | | 02/28/35 | | | | ZAR | | | | 7,825 | | | | 451,799 | |
Sr. Unsec’d. Notes, Series 2037 | | | 8.500 | | | | 01/31/37 | | | | ZAR | | | | 6,520 | | | | 355,266 | |
Sr. Unsec’d. Notes, Series 2040 | | | 9.000 | | | | 01/31/40 | | | | ZAR | | | | 4,130 | | | | 230,615 | |
Sr. Unsec’d. Notes, Series 2044 | | | 8.750 | | | | 01/31/44 | | | | ZAR | | | | 5,485 | | | | 295,412 | |
Sr. Unsec’d. Notes, Series 2048 | | | 8.750 | | | | 02/28/48 | | | | ZAR | | | | 10,375 | | | | 557,142 | |
Sr. Unsec’d. Notes, Series R186 | | | 10.500 | | | | 12/21/26 | | | | ZAR | | | | 13,661 | | | | 979,531 | |
Sr. Unsec’d. Notes, Series R209 | | | 6.250 | | | | 03/31/36 | | | | ZAR | | | | 3,850 | | | | 173,149 | |
Sr. Unsec’d. Notes, Series R213 | | | 7.000 | | | | 02/28/31 | | | | ZAR | | | | 7,550 | | | | 406,326 | |
Sr. Unsec’d. Notes, Series R214 | | | 6.500 | | | | 02/28/41 | | | | ZAR | | | | 4,470 | | | | 190,045 | |
| | | | | | | | | | | | | | | | | | | | |
| | | | | |
| | | | | | | | | | | | | | | | | | | 4,903,689 | |
| | | | | |
Thailand 7.3% | | | | | | | | | | | | | | | | | | | | |
| | | | | |
Thailand Government Bond, | | | | | | | | | | | | | | | | | | | | |
Bonds | | | 1.600 | | | | 12/17/29 | | | | THB | | | | 12,605 | | | | 377,080 | |
Bonds | | | 2.000 | | | | 06/17/42 | | | | THB | | | | 3,240 | | | | 86,361 | |
Bonds | | | 2.875 | | | | 12/17/28 | | | | THB | | | | 19,480 | | | | 639,221 | |
Bonds | | | 2.875 | | | | 06/17/46 | | | | THB | | | | 6,065 | | | | 184,804 | |
Bonds | | | 3.300 | | | | 06/17/38 | | | | THB | | | | 10,300 | | | | 338,391 | |
Bonds | | | 3.400 | | | | 06/17/36 | | | | THB | | | | 9,585 | | | | 318,219 | |
Sr. Unsec’d. Notes | | | 1.600 | | | | 06/17/35 | | | | THB | | | | 7,100 | | | | 194,347 | |
Sr. Unsec’d. Notes | | | 1.875 | | | | 06/17/49 | | | | THB | | | | 1,063 | | | | 26,379 | |
Sr. Unsec’d. Notes | | | 2.000 | | | | 12/17/31 | | | | THB | | | | 8,410 | | | | 253,926 | |
Sr. Unsec’d. Notes | | | 2.125 | | | | 12/17/26 | | | | THB | | | | 17,450 | | | | 550,004 | |
Sr. Unsec’d. Notes | | | 3.625 | | | | 06/16/23 | | | | THB | | | | 8,530 | | | | 269,520 | |
Sr. Unsec’d. Notes | | | 3.650 | | | | 06/20/31 | | | | THB | | | | 11,335 | | | | 392,892 | |
Sr. Unsec’d. Notes | | | 3.775 | | | | 06/25/32 | | | | THB | | | | 13,125 | | | | 457,537 | |
| | | | | | | | | | | | | | | | | | | | |
| | | | | |
| | | | | | | | | | | | | | | | | | | 4,088,681 | |
See Notes to Financial Statements.
20
| | | | | | | | | | | | | | | | | | | | |
| | | | |
| Description | | Interest
Rate | | | Maturity
Date | | | Principal Amount (000)# | | | Value | |
| | | | | |
SOVEREIGN BONDS (Continued) | | | | | | | | | | | | | | | | | | | | |
| | | | | |
Turkey 1.1% | | | | | | | | | | | | | | | | | | | | |
| | | | | |
Turkey Government Bond, | | | | | | | | | | | | | | | | | | | | |
Bonds | | | 8.500% | | | | 09/14/22 | | | | TRY | | | | 395 | | | $ | 38,385 | |
Bonds | | | 8.800 | | | | 09/27/23 | | | | TRY | | | | 500 | | | | 44,728 | |
Bonds | | | 9.000 | | | | 07/24/24 | | | | TRY | | | | 2,700 | | | | 226,364 | |
Bonds | | | 12.200 | | | | 01/18/23 | | | | TRY | | | | 2,315 | | | | 227,013 | |
Bonds | | | 12.400 | | | | 03/08/28 | | | | TRY | | | | 1,000 | | | | 78,436 | |
| | | | | | | | | | | | | | | | | | | | |
| | | | | |
| | | | | | | | | | | | | | | | | | | 614,926 | |
| | | | | |
Ukraine 1.0% | | | | | | | | | | | | | | | | | | | | |
| | | | | |
Ukraine Government International Bond, | | | | | | | | | | | | | | | | | | | | |
Bonds | | | 17.000 | | | | 05/11/22 | | | | UAH | | | | 500 | | | | 19,559 | |
Bonds, 144A | | | 11.670 | | | | 11/22/23 | | | | UAH | | | | 2,414 | | | | 89,980 | |
Sr. Unsec’d. Notes | | | 6.750 | | | | 06/20/26 | | | | EUR | | | | 150 | | | | 186,613 | |
Sr. Unsec’d. Notes | | | 7.750 | | | | 09/01/24 | | | | | | | | 222 | | | | 239,375 | |
Unsec’d. Notes, 144A | | | 17.250 | | | | 01/05/22 | | | | UAH | | | | 1,328 | | | | 51,054 | |
| | | | | | | | | | | | | | | | | | | | |
| | | | | |
| | | | | | | | | | | | | | | | | | | 586,581 | |
| | | | | |
Uruguay 0.2% | | | | | | | | | | | | | | | | | | | | |
| | | | | |
Uruguay Government International Bond, | | | | | | | | | | | | | | | | | | | | |
Sr. Unsec’d. Notes | | | 9.875 | | | | 06/20/22 | | | | UYU | | | | 3,260 | | | | 75,003 | |
Sr. Unsec’d. Notes, 144A | | | 8.500 | | | | 03/15/28 | | | | UYU | | | | 1,870 | | | | 43,620 | |
| | | | | | | | | | | | | | | | | | | | |
| | | | | |
| | | | | | | | | | | | | | | | | | | 118,623 | |
| | | | | | | | | | | | | | | | | | | | |
| | | | | |
TOTAL SOVEREIGN BONDS
(cost $51,529,348) | | | | | | | | | | | | | | | | | | | 48,939,731 | |
| | | | | | | | | | | | | | | | | | | | |
| | | | | |
TOTAL LONG-TERM INVESTMENTS
(cost $56,730,107) | | | | | | | | | | | | | | | | | | | 53,704,820 | |
| | | | | | | | | | | | | | | | | | | | |
| | | | |
| | | | | | | | | Shares | | | | |
| | | | | |
SHORT-TERM INVESTMENTS 1.7% | | | | | | | | | | | | | | | | | | | | |
| | | | | |
AFFILIATED MUTUAL FUNDS 1.4% | | | | | | | | | | | | | | | | | | | | |
PGIM Core Ultra Short Bond Fund(wa) | | | | | | | | | | | | | | | 586,842 | | | | 586,842 | |
See Notes to Financial Statements.
PGIM Emerging Markets Debt Local Currency Fund 21
Schedule of Investments (continued)
as of October 31, 2021
| | | | | | | | |
| | |
| Description | | Shares | | | Value | |
| | |
AFFILIATED MUTUAL FUNDS (Continued) | | | | | | | | |
PGIM Institutional Money Market Fund
(cost $219,283; includes $219,273 of cash collateral for securities on loan)(b)(wa) | | | 219,395 | | | $ | 219,262 | |
| | | | | | | | |
| | |
TOTAL AFFILIATED MUTUAL FUNDS
(cost $806,125) | | | | | | | 806,104 | |
| | | | | | | | |
| | |
OPTIONS PURCHASED*~ 0.3%
(cost $125,914) | | | | | | | 136,000 | |
| | | | | | | | |
| | |
TOTAL SHORT-TERM INVESTMENTS
(cost $932,039) | | | | | | | 942,104 | |
| | | | | | | | |
| | |
TOTAL INVESTMENTS, BEFORE OPTIONS WRITTEN 97.6%
(cost $57,662,146) | | | | | | | 54,646,924 | |
| | | | | | | | |
| | |
OPTIONS WRITTEN*~ (0.1)% | | | | | | | | |
(premiums received $85,437) | | | | | | | (85,449 | ) |
| | | | | | | | |
| | |
TOTAL INVESTMENTS, NET OF OPTIONS WRITTEN 97.5% | | | | | | | | |
(cost $57,576,709) | | | | | | | 54,561,475 | |
| | |
Other assets in excess of liabilities(z) 2.5% | | | | | | | 1,421,872 | |
| | | | | | | | |
| | |
NET ASSETS 100.0% | | | | | | $ | 55,983,347 | |
| | | | | | | | |
Below is a list of the abbreviation(s) used in the annual report:
AUD—Australian Dollar
BRL—Brazilian Real
CLP—Chilean Peso
CNH—Chinese Renminbi
COP—Colombian Peso
CZK—Czech Koruna
DOP—Dominican Peso
EUR—Euro
HUF—Hungarian Forint
IDR—Indonesian Rupiah
ILS—Israeli Shekel
INR—Indian Rupee
JPY—Japanese Yen
KRW—South Korean Won
MXN—Mexican Peso
MYR—Malaysian Ringgit
PEN—Peruvian Nuevo Sol
PHP—Philippine Peso
PLN—Polish Zloty
RON—Romanian Leu
RUB—Russian Ruble
SGD—Singapore Dollar
THB—Thai Baht
See Notes to Financial Statements.
22
TRY—Turkish Lira
TWD—New Taiwanese Dollar
UAH—Ukraine Hryvna
USD—US Dollar
UYU—Uruguayan Peso
ZAR—South African Rand
144A—Security was purchased pursuant to Rule 144A under the Securities Act of 1933 and, pursuant to the requirements of Rule 144A, may not be resold except to qualified institutional buyers.
A—Annual payment frequency for swaps
BROIS—Brazil Overnight Index Swap
BUBOR—Budapest Interbank Offered Rate
CLOIS—Sinacofi Chile Interbank Rate Average
COOIS—Colombia Overnight Interbank Reference Rate
EMTN—Euro Medium Term Note
GMTN—Global Medium Term Note
JIBAR—Johannesburg Interbank Agreed Rate
KLIBOR—Kuala Lumpur Interbank Offered Rate
KWCDC—Korean Won Certificate of Deposit
LIBOR—London Interbank Offered Rate
M—Monthly payment frequency for swaps
MIBOR—Mumbai Interbank Offered Rate
MosPRIME—Moscow Prime Offered Rate
MTN—Medium Term Note
OFZ—Obligatsyi Federal’novo Zaima (Federal Loan Obligations)
OTC—Over-the-counter
PRIBOR—Prague Interbank Offered Rate
Q—Quarterly payment frequency for swaps
S—Semiannual payment frequency for swaps
T—Swap payment upon termination
THBFIX—Thai Baht Interest Rate Fixing
WIBOR—Warsaw Interbank Offered Rate
| * | Non-income producing security. |
| # | Principal or notional amount is shown in U.S. dollars unless otherwise stated. |
| ~ | See tables subsequent to the Schedule of Investments for options detail. |
| (a) | All or a portion of security is on loan. The aggregate market value of such securities, including those sold and pending settlement, is $159,312; cash collateral of $219,273 (included in liabilities) was received with which the Fund purchased highly liquid short-term investments. In the event of significant appreciation in value of securities on loan on the last business day of the reporting period, the Fund may reflect a collateral value that is less than the market value of the loaned securities and such shortfall is remedied the following business day. |
| (b) | Represents security, or portion thereof, purchased with cash collateral received for securities on loan and includes dividend reinvestment. |
| (cc) | Variable rate instrument. The rate shown is based on the latest available information as of October 31, 2021. Certain variable rate securities are not based on a published reference rate and spread but are determined by the issuer or agent and are based on current market conditions. These securities do not indicate a reference rate and spread in their description. |
| (s) | Represents zero coupon bond or principal only security. Rate represents yield to maturity at purchase date. |
| (wa) | PGIM Investments LLC, the manager of the Fund, also serves as manager of the PGIM Core Ultra Short Bond Fund and PGIM Institutional Money Market Fund, if applicable. |
| (z) | Includes net unrealized appreciation/(depreciation) and/or market value of the below holdings which are excluded from the Schedule of Investments: |
See Notes to Financial Statements.
PGIM Emerging Markets Debt Local Currency Fund 23
Schedule of Investments (continued)
as of October 31, 2021
Options Purchased:
OTC Traded
| | | | | | | | | | | | | | | | | | | | | | |
Description | | Call/
Put | | Counterparty | | Expiration
Date | | | Strike | | | Contracts | | Notional
Amount
(000)# | | | Value | |
| | | | | | | |
Currency Option USD vs IDR | | Call | | Morgan Stanley & Co. International PLC | | | 04/28/22 | | | | 16,500.00 | | | — | | | 684 | | | $ | 1,733 | |
Currency Option USD vs IDR | | Call | | JPMorgan Chase Bank, N.A. | | | 04/28/22 | | | | 24,500.00 | | | — | | | 684 | | | | 57 | |
Currency Option USD vs MXN | | Call | | Morgan Stanley & Co. International PLC | | | 12/10/21 | | | | 21.00 | | | — | | | 851 | | | | 7,082 | |
Currency Option USD vs MXN | | Call | | Morgan Stanley & Co. International PLC | | | 01/04/22 | | | | 21.00 | | | — | | | 1,400 | | | | 13,923 | |
Currency Option USD vs RUB | | Call | | JPMorgan Chase Bank, N.A. | | | 11/19/21 | | | | 75.00 | | | — | | | 455 | | | | 505 | |
Currency Option USD vs RUB | | Call | | JPMorgan Chase Bank, N.A. | | | 01/11/22 | | | | 81.00 | | | — | | | 2,240 | | | | 3,436 | |
Currency Option USD vs TRY | | Call | | Goldman Sachs International | | | 12/22/21 | | | | 9.00 | | | — | | | 455 | | | | 40,670 | |
Currency Option USD vs TRY | | Call | | Goldman Sachs International | | | 01/11/22 | | | | 9.75 | | | — | | | 284 | | | | 12,486 | |
Currency Option USD vs ZAR | | Call | | Goldman Sachs International | | | 11/04/21 | | | | 15.50 | | | — | | | 519 | | | | 1,735 | |
Currency Option USD vs ZAR | | Call | | Goldman Sachs International | | | 01/18/22 | | | | 15.50 | | | — | | | 1,037 | | | | 28,131 | |
Currency Option USD vs ZAR | | Call | | Morgan Stanley & Co. International PLC | | | 01/18/22 | | | | 16.00 | | | — | | | 1,037 | | | | 17,016 | |
Currency Option USD vs IDR | | Put | | JPMorgan Chase Bank, N.A. | | | 04/28/22 | | | | 14,300.00 | | | — | | | 684 | | | | 9,131 | |
Currency Option USD vs MXN | | Put | | Morgan Stanley & Co. International PLC | | | 11/09/21 | | | | 17.80 | | | — | | | 1,223 | | | | — | |
Currency Option USD vs RUB | | Put | | JPMorgan Chase Bank, N.A. | | | 11/19/21 | | | | 67.00 | | | — | | | 606 | | | | 53 | |
Currency Option USD vs TRY | | Put | | Goldman Sachs International | | | 11/04/21 | | | | 7.80 | | | — | | | 181 | | | | — | |
Currency Option USD vs TRY | | Put | | JPMorgan Chase Bank, N.A. | | | 11/04/21 | | | | 8.00 | | | — | | | 568 | | | | — | |
Currency Option USD vs TRY | | Put | | JPMorgan Chase Bank, N.A. | | | 11/19/21 | | | | 8.00 | | | — | | | 284 | | | | 8 | |
Currency Option USD vs TRY | | Put | | Goldman Sachs International | | | 01/11/22 | | | | 7.60 | | | — | | | 284 | | | | 34 | |
Currency Option USD vs ZAR | | Put | | JPMorgan Chase Bank, N.A. | | | 11/12/21 | | | | 12.50 | | | — | | | 1,037 | | | | — | |
| | | | | | | | | | | | | | | | | | | | | | |
| | | | | |
Total Options Purchased (cost $125,914) | | | | | | | | | | | | | | | | $ | 136,000 | |
| | | | | | | | | | | | | | | | | | | | | | |
See Notes to Financial Statements.
24
Options Written:
OTC Traded
| | | | | | | | | | | | | | | | | | | | |
Description | | Call/
Put | | Counterparty | | Expiration
Date | | Strike | | | Contracts | | Notional
Amount
(000)# | | | Value | |
| | | | | | | |
Currency Option USD vs IDR | | Call | | JPMorgan Chase Bank, N.A. | | 04/28/22 | | | 16,500.00 | | | — | | | 684 | | | $ | (1,733 | ) |
Currency Option USD vs MXN | | Call | | Morgan Stanley & Co. International PLC | | 12/10/21 | | | 22.00 | | | — | | | 851 | | | | (1,624 | ) |
Currency Option USD vs MXN | | Call | | Morgan Stanley & Co. International PLC | | 01/04/22 | | | 22.00 | | | — | | | 1,400 | | | | (4,123 | ) |
Currency Option USD vs TRY | | Call | | Goldman Sachs International | | 12/22/21 | | | 10.00 | | | — | | | 455 | | | | (10,801 | ) |
Currency Option USD vs TRY | | Call | | Goldman Sachs International | | 01/11/22 | | | 10.25 | | | — | | | 284 | | | | (7,120 | ) |
Currency Option USD vs ZAR | | Call | | JPMorgan Chase Bank, N.A. | | 11/04/21 | | | 15.50 | | | — | | | 519 | | | | (1,735 | ) |
Currency Option USD vs ZAR | | Call | | Goldman Sachs International | | 01/18/22 | | | 16.00 | | | — | | | 1,037 | | | | (17,016 | ) |
Currency Option USD vs ZAR | | Call | | Goldman Sachs International | | 01/18/22 | | | 16.50 | | | — | | | 1,037 | | | | (10,294 | ) |
Currency Option USD vs IDR | | Put | | Morgan Stanley & Co. International PLC | | 04/28/22 | | | 14,300.00 | | | — | | | 684 | | | | (9,131 | ) |
Currency Option USD vs RUB | | Put | | JPMorgan Chase Bank, N.A. | | 11/19/21 | | | 72.00 | | | — | | | 606 | | | | (10,269 | ) |
Currency Option USD vs TRY | | Put | | Goldman Sachs International | | 11/04/21 | | | 8.80 | | | — | | | 181 | | | | (1 | ) |
Currency Option USD vs TRY | | Put | | JPMorgan Chase Bank, N.A. | | 11/04/21 | | | 8.90 | | | — | | | 284 | | | | (4 | ) |
Currency Option USD vs TRY | | Put | | JPMorgan Chase Bank, N.A. | | 11/19/21 | | | 10.00 | | | — | | | 284 | | | | (11,022 | ) |
Currency Option USD vs TRY | | Put | | Goldman Sachs International | | 01/11/22 | | | 8.80 | | | — | | | 284 | | | | (576 | ) |
| | | | | | | | | | | | | | | | | | | | |
| | | | | |
Total Options Written (premiums received $85,437) | | | | | | | | | | | | | | $ | (85,449 | ) |
| | | | | | | | | | | | | | | | | | | | |
Futures contracts outstanding at October 31, 2021:
| | | | | | | | | | | | | | | | | | | | | | |
Number of Contracts | | Type | | Expiration Date | | | | Current
Notional
Amount | | Value / Unrealized Appreciation (Depreciation) |
| | | | |
| Short Positions: | | | | | | | | | | | | | | | | | | | | |
8 | | 2 Year U.S. Treasury Notes | | | | Dec. 2021 | | | | | | | | | $ | 1,754,000 | | | | $ | 7,396 | |
3 | | 5 Year Euro-Bobl | | | | Dec. 2021 | | | | | | | | | | 463,880 | | | | | 7,072 | |
12 | | 5 Year U.S. Treasury Notes | | | | Dec. 2021 | | | | | | | | | | 1,461,000 | | | | | 19,487 | |
4 | | 10 Year U.S. Treasury Notes | | | | Dec. 2021 | | | | | | | | | | 522,812 | | | | | 10,706 | |
1 | | Euro Schatz Index | | | | Dec. 2021 | | | | | | | | | | 129,426 | | | | | 386 | |
| | | | | | | | | | | | | | | | | | | | | | |
| | | | | |
| | | | | | | | | | | | | | | | | | | | $ | 45,047 | |
| | | | | | | | | | | | | | | | | | | | | | |
See Notes to Financial Statements.
PGIM Emerging Markets Debt Local Currency Fund 25
Schedule of Investments (continued)
as of October 31, 2021
Forward foreign currency exchange contracts outstanding at October 31, 2021:
| | | | | | | | | | | | | | | | | | | | | | | | | | |
Purchase Contracts | | Counterparty | | Notional
Amount
(000) | | | Value at
Settlement
Date | | | Current
Value | | | Unrealized
Appreciation | | Unrealized
Depreciation |
| | | | | |
OTC Forward Foreign Currency Exchange Contracts: | | | | | | | | | | | | | | | | | | | | | |
Australian Dollar, | | | | | | | | | | | | | | | | | | | | | | | | | | |
Expiring 01/19/22 | | HSBC Bank PLC | | | AUD | | | | 196 | | | $ | 144,171 | | | $ | 147,441 | | | | $ 3,270 | | | | $ — | |
Brazilian Real, | | | | | | | | | | | | | | | | | | | | | | | | | | |
Expiring 11/03/21 | | Credit Suisse International | | | BRL | | | | 14,139 | | | | 2,655,524 | | | | 2,502,753 | | | | — | | | | (152,771 | ) |
Expiring 11/03/21 | | Deutsche Bank AG | | | BRL | | | | 523 | | | | 94,000 | | | | 92,568 | | | | — | | | | (1,432 | ) |
Expiring 11/03/21 | | Goldman Sachs International | | | BRL | | | | 254 | | | | 46,000 | | | | 45,018 | | | | — | | | | (982 | ) |
Expiring 11/03/21 | | JPMorgan Chase Bank, N.A. | | | BRL | | | | 554 | | | | 102,000 | | | | 98,109 | | | | — | | | | (3,891 | ) |
Expiring 11/03/21 | | JPMorgan Chase Bank, N.A. | | | BRL | | | | 356 | | | | 67,000 | | | | 63,011 | | | | — | | | | (3,989 | ) |
Expiring 12/02/21 | | Credit Suisse International | | | BRL | | | | 15,339 | | | | 2,695,428 | | | | 2,699,650 | | | | 4,222 | | | | — | |
Expiring 12/02/21 | | JPMorgan Chase Bank, N.A. | | | BRL | | | | 1,454 | | | | 256,314 | | | | 255,928 | | | | — | | | | (386 | ) |
Chilean Peso, | | | | | | | | | | | | | | | | | | | | | | | | | | |
Expiring 12/15/21 | | Barclays Bank PLC | | | CLP | | | | 128,802 | | | | 158,000 | | | | 157,492 | | | | — | | | | (508 | ) |
Expiring 12/15/21 | | BNP Paribas S.A. | | | CLP | | | | 101,776 | | | | 123,000 | | | | 124,447 | | | | 1,447 | | | | — | |
Expiring 12/15/21 | | BNP Paribas S.A. | | | CLP | | | | 92,611 | | | | 113,355 | | | | 113,240 | | | | — | | | | (115 | ) |
Expiring 12/15/21 | | BNP Paribas S.A. | | | CLP | | | | 53,456 | | | | 64,000 | | | | 65,363 | | | | 1,363 | | | | — | |
Expiring 12/15/21 | | Citibank, N.A. | | | CLP | | | | 97,121 | | | | 122,000 | | | | 118,755 | | | | — | | | | (3,245 | ) |
Expiring 12/15/21 | | Citibank, N.A. | | | CLP | | | | 72,138 | | | | 90,000 | | | | 88,206 | | | | — | | | | (1,794 | ) |
Expiring 12/15/21 | | UBS AG | | | CLP | | | | 105,677 | | | | 132,000 | | | | 129,216 | | | | — | | | | (2,784 | ) |
Chinese Renminbi, | | | | | | | | | | | | | | | | | | | | | | | | | | |
Expiring 11/18/21 | | JPMorgan Chase Bank, N.A. | | | CNH | | | | 11,464 | | | | 1,756,471 | | | | 1,786,539 | | | | 30,068 | | | | — | |
Expiring 11/18/21 | | JPMorgan Chase Bank, N.A. | | | CNH | | | | 1,412 | | | | 219,000 | | | | 220,113 | | | | 1,113 | | | | — | |
Expiring 11/18/21 | | JPMorgan Chase Bank, N.A. | | | CNH | | | | 1,392 | | | | 216,000 | | | | 216,899 | | | | 899 | | | | — | |
Expiring 11/18/21 | | JPMorgan Chase Bank, N.A. | | | CNH | | | | 1,013 | | | | 157,000 | | | | 157,930 | | | | 930 | | | | — | |
Expiring 11/18/21 | | Morgan Stanley & Co. International PLC | | | CNH | | | | 1,438 | | | | 222,000 | | | | 224,155 | | | | 2,155 | | | | — | |
Expiring 11/18/21 | | Standard Chartered Bank | | | CNH | | | | 1,947 | | | | 304,000 | | | | 303,368 | | | | — | | | | (632 | ) |
Colombian Peso, | | | | | | | | | | | | | | | | | | | | | | | | | | |
Expiring 12/15/21 | | Goldman Sachs International | | | COP | | | | 356,704 | | | | 94,000 | | | | 94,420 | | | | 420 | | | | — | |
Expiring 12/15/21 | | Goldman Sachs International | | | COP | | | | 103,000 | | | | 27,566 | | | | 27,264 | | | | — | | | | (302 | ) |
Expiring 12/15/21 | | JPMorgan Chase Bank, N.A. | | | COP | | | | 437,916 | | | | 115,907 | | | | 115,916 | | | | 9 | | | | — | |
Czech Koruna, | | | | | | | | | | | | | | | | | | | | | | | | | | |
Expiring 01/19/22 | | Barclays Bank PLC | | | CZK | | | | 17,858 | | | | 810,067 | | | | 801,821 | | | | — | | | | (8,246 | ) |
See Notes to Financial Statements.
26
Forward foreign currency exchange contracts outstanding at October 31, 2021 (continued):
| | | | | | | | | | | | | | | | | | | | | | | | | | |
Purchase Contracts | | Counterparty | | Notional
Amount
(000) | | | Value at
Settlement
Date | | | Current
Value | | | Unrealized
Appreciation | | Unrealized
Depreciation |
| | | | |
OTC Forward Foreign Currency Exchange Contracts (cont’d.): | | | | | | | | | | | | | | | | | |
Czech Koruna (cont’d.), | | | | | | | | | | | | | | | | | | | | | | | | |
Expiring 01/19/22 | | BNP Paribas S.A. | | | CZK | | | | 2,597 | | | $ | 117,000 | | | $ | 116,581 | | | | $ — | | | | $ (419 | ) |
Expiring 01/19/22 | | JPMorgan Chase Bank, N.A. | | | CZK | | | | 1,796 | | | | 80,730 | | | | 80,626 | | | | — | | | | (104 | ) |
Hungarian Forint, | | | | | | | | | | | | | | | | | | | | | | | | | | |
Expiring 01/19/22 | | Citibank, N.A. | | | HUF | | | | 69,411 | | | | 223,698 | | | | 222,229 | | | | — | | | | (1,469 | ) |
Expiring 01/19/22 | | Goldman Sachs International | | | HUF | | | | 37,599 | | | | 121,000 | | | | 120,378 | | | | — | | | | (622 | ) |
Expiring 01/19/22 | | HSBC Bank PLC | | | HUF | | | | 41,030 | | | | 132,000 | | | | 131,364 | | | | — | | | | (636 | ) |
Expiring 01/19/22 | | HSBC Bank PLC | | | HUF | | | | 39,955 | | | | 128,000 | | | | 127,920 | | | | — | | | | (80 | ) |
Indian Rupee, | | | | | | | | | | | | | | | | | | | | | | | | | | |
Expiring 12/15/21 | | Citibank, N.A. | | | INR | | | | 29,141 | | | | 394,697 | | | | 386,523 | | | | — | | | | (8,174 | ) |
Expiring 12/15/21 | | Citibank, N.A. | | | INR | | | | 14,971 | | | | 203,000 | | | | 198,575 | | | | — | | | | (4,425 | ) |
Expiring 12/15/21 | | HSBC Bank PLC | | | INR | | | | 14,679 | | | | 199,000 | | | | 194,699 | | | | — | | | | (4,301 | ) |
Expiring 12/15/21 | | HSBC Bank PLC | | | INR | | | | 13,870 | | | | 188,000 | | | | 183,969 | | | | — | | | | (4,031 | ) |
Expiring 12/15/21 | | JPMorgan Chase Bank, N.A. | | | INR | | | | 11,369 | | | | 153,000 | | | | 150,790 | | | | — | | | | (2,210 | ) |
Expiring 12/15/21 | | JPMorgan Chase Bank, N.A. | | | INR | | | | 11,301 | | | | 152,000 | | | | 149,896 | | | | — | | | | (2,104 | ) |
Expiring 12/15/21 | | Morgan Stanley & Co. International PLC | | | INR | | | | 20,007 | | | | 267,000 | | | | 265,371 | | | | — | | | | (1,629 | ) |
Expiring 12/15/21 | | Morgan Stanley & Co. International PLC | | | INR | | | | 12,382 | | | | 165,000 | | | | 164,232 | | | | — | | | | (768 | ) |
Expiring 12/15/21 | | Morgan Stanley & Co. International PLC | | | INR | | | | 11,554 | | | | 153,000 | | | | 153,245 | | | | 245 | | | | — | |
Expiring 12/15/21 | | Morgan Stanley & Co. International PLC | | | INR | | | | 11,532 | | | | 153,000 | | | | 152,959 | | | | — | | | | (41 | ) |
Expiring 12/15/21 | | Standard Chartered Bank | | | INR | | | | 18,480 | | | | 245,000 | | | | 245,114 | | | | 114 | | | | — | |
Expiring 12/15/21 | | UBS AG | | | INR | | | | 21,221 | | | | 285,000 | | | | 281,468 | | | | — | | | | (3,532 | ) |
Indonesian Rupiah, | | | | | | | | | | | | | | | | | | | | | | | | | | |
Expiring 12/15/21 | | Citibank, N.A. | | | IDR | | | | 2,725,916 | | | | 186,873 | | | | 190,682 | | | | 3,809 | | | | — | |
Expiring 12/15/21 | | Goldman Sachs International | | | IDR | | | | 2,754,984 | | | | 191,000 | | | | 192,716 | | | | 1,716 | | | | — | |
Expiring 12/15/21 | | HSBC Bank PLC | | | IDR | | | | 3,358,812 | | | | 233,000 | | | | 234,954 | | | | 1,954 | | | | — | |
Expiring 12/15/21 | | JPMorgan Chase Bank, N.A. | | | IDR | | | | 6,117,319 | | | | 427,635 | | | | 427,916 | | | | 281 | | | | — | |
Expiring 12/15/21 | | JPMorgan Chase Bank, N.A. | | | IDR | | | | 1,952,552 | | | | 136,000 | | | | 136,584 | | | | 584 | | | | — | |
Expiring 12/15/21 | | Morgan Stanley & Co. International PLC | | | IDR | | | | 3,133,750 | | | | 218,000 | | | | 219,211 | | | | 1,211 | | | | — | |
Expiring 12/15/21 | | Morgan Stanley & Co. International PLC | | | IDR | | | | 2,357,746 | | | | 164,000 | | | | 164,928 | | | | 928 | | | | — | |
See Notes to Financial Statements.
PGIM Emerging Markets Debt Local Currency Fund 27
Schedule of Investments (continued)
as of October 31, 2021
Forward foreign currency exchange contracts outstanding at October 31, 2021 (continued):
| | | | | | | | | | | | | | | | | | | | | | | | | | |
Purchase Contracts | | Counterparty | | Notional
Amount
(000) | | | Value at
Settlement
Date | | | Current
Value | | | Unrealized
Appreciation | | Unrealized
Depreciation |
| | | | |
OTC Forward Foreign Currency Exchange Contracts (cont’d.): | | | | | | | | | | | | | | | | | |
Indonesian Rupiah (cont’d.), | | | | | | | | | | | | | | | | | | | | | | | | |
Expiring 12/15/21 | | Morgan Stanley & Co. International PLC | | | IDR | | | | 1,921,115 | | | $ | 131,000 | | | $ | 134,385 | | | $ | 3,385 | | | $ | — | |
Israeli Shekel, | | | | | | | | | | | | | | | | | | | | | | | | | | |
Expiring 12/15/21 | | Barclays Bank PLC | | | ILS | | | | 538 | | | | 168,000 | | | | 170,058 | | | | 2,058 | | | | — | |
Japanese Yen, | | | | | | | | | | | | | | | | | | | | | | | | | | |
Expiring 01/19/22 | | Barclays Bank PLC | | | JPY | | | | 33,131 | | | | 291,561 | | | | 290,994 | | | | — | | | | (567 | ) |
Malaysian Ringgit, | | | | | | | | | | | | | | | | | | | | | | | | | | |
Expiring 12/15/21 | | Barclays Bank PLC | | | MYR | | | | 673 | | | | 161,554 | | | | 162,101 | | | | 547 | | | | — | |
Expiring 12/15/21 | | Barclays Bank PLC | | | MYR | | | | 305 | | | | 73,494 | | | | 73,500 | | | | 6 | | | | — | |
Expiring 12/15/21 | | Barclays Bank PLC | | | MYR | | | | 56 | | | | 13,355 | | | | 13,552 | | | | 197 | | | | — | |
Expiring 12/15/21 | | Morgan Stanley & Co. International PLC | | | MYR | | | | 972 | | | | 231,000 | | | | 233,939 | | | | 2,939 | | | | — | |
Mexican Peso, | | | | | | | | | | | | | | | | | | | | | | | | | | |
Expiring 12/15/21 | | BNP Paribas S.A. | | | MXN | | | | 3,669 | | | | 180,225 | | | | 176,917 | | | | — | | | | (3,308 | ) |
Expiring 12/15/21 | | BNP Paribas S.A. | | | MXN | | | | 2,111 | | | | 105,000 | | | | 101,783 | | | | — | | | | (3,217 | ) |
Expiring 12/15/21 | | Citibank, N.A. | | | MXN | | | | 3,210 | | | | 158,000 | | | | 154,778 | | | | — | | | | (3,222 | ) |
Expiring 12/15/21 | | Citibank, N.A. | | | MXN | | | | 2,698 | | | | 128,000 | | | | 130,113 | | | | 2,113 | | | | — | |
Expiring 12/15/21 | | Goldman Sachs International | | | MXN | | | | 26,508 | | | | 1,310,046 | | | | 1,278,236 | | | | — | | | | (31,810 | ) |
Expiring 12/15/21 | | Goldman Sachs International | | | MXN | | | | 3,799 | | | | 187,000 | | | | 183,185 | | | | — | | | | (3,815 | ) |
Expiring 12/15/21 | | Goldman Sachs International | | | MXN | | | | 3,640 | | | | 174,625 | | | | 175,546 | | | | 921 | | | | — | |
Expiring 12/15/21 | | Goldman Sachs International | | | MXN | | | | 2,954 | | | | 145,000 | | | | 142,451 | | | | — | | | | (2,549 | ) |
Expiring 12/15/21 | | Goldman Sachs International | | | MXN | | | | 2,790 | | | | 134,000 | | | | 134,525 | | | | 525 | | | | — | |
Expiring 12/15/21 | | Goldman Sachs International | | | MXN | | | | 1,832 | | | | 89,000 | | | | 88,352 | | | | — | | | | (648 | ) |
Expiring 12/15/21 | | JPMorgan Chase Bank, N.A. | | | MXN | | | | 3,096 | | | | 149,000 | | | | 149,307 | | | | 307 | | | | — | |
Expiring 12/15/21 | | JPMorgan Chase Bank, N.A. | | | MXN | | | | 1,936 | | | | 96,000 | | | | 93,347 | | | | — | | | | (2,653 | ) |
Expiring 12/15/21 | | Morgan Stanley & Co. International PLC | | | MXN | | | | 26,508 | | | | 1,309,347 | | | | 1,278,236 | | | | — | | | | (31,111 | ) |
New Taiwanese Dollar, | | | | | | | | | | | | | | | | | | | | | | | | |
Expiring 12/15/21 | | Standard Chartered Bank | | | TWD | | | | 7,998 | | | | 289,354 | | | | 288,065 | | | | — | | | | (1,289 | ) |
Expiring 12/15/21 | | UBS AG | | | TWD | | | | 5,253 | | | | 191,000 | | | | 189,206 | | | | — | | | | (1,794 | ) |
Peruvian Nuevo Sol, | | | | | | | | | | | | | | | | | | | | | | | | | | |
Expiring 12/15/21 | | Citibank, N.A. | | | PEN | | | | 436 | | | | 105,000 | | | | 108,953 | | | | 3,953 | | | | — | |
Expiring 12/15/21 | | Goldman Sachs International | | | PEN | | | | 548 | | | | 133,000 | | | | 137,018 | | | | 4,018 | | | | — | |
See Notes to Financial Statements.
28
Forward foreign currency exchange contracts outstanding at October 31, 2021 (continued):
| | | | | | | | | | | | | | | | | | | | | | | | | | |
Purchase Contracts | | Counterparty | | Notional
Amount
(000) | | | Value at
Settlement
Date | | | Current
Value | | | Unrealized
Appreciation | | Unrealized
Depreciation |
| | | | |
OTC Forward Foreign Currency Exchange Contracts (cont’d.): | | | | | | | | | | | | | | | | | |
Philippine Peso, | | | | | | | | | | | | | | | | | | | | | | | | | | |
Expiring 12/15/21 | | HSBC Bank PLC | | | PHP | | | | 9,446 | | | $ | 185,000 | | | $ | 186,490 | | | $ | 1,490 | | | $ | — | |
Expiring 12/15/21 | | HSBC Bank PLC | | | PHP | | | | 9,233 | | | | 181,000 | | | | 182,279 | | | | 1,279 | | | | — | |
Expiring 12/15/21 | | JPMorgan Chase Bank, N.A. | | | PHP | | | | 20,639 | | | | 409,304 | | | | 407,470 | | | | — | | | | (1,834 | ) |
Expiring 12/15/21 | | JPMorgan Chase Bank, N.A. | | | PHP | | | | 12,749 | | | | 249,000 | | | | 251,694 | | | | 2,694 | | | | — | |
Expiring 12/15/21 | | JPMorgan Chase Bank, N.A. | | | PHP | | | | 9,477 | | | | 186,000 | | | | 187,098 | | | | 1,098 | | | | — | |
Expiring 12/15/21 | | Morgan Stanley & Co. International PLC | | | PHP | | | | 8,026 | | | | 156,000 | | | | 158,458 | | | | 2,458 | | | | — | |
Expiring 12/15/21 | | Standard Chartered Bank | | | PHP | | | | 12,722 | | | | 249,000 | | | | 251,163 | | | | 2,163 | | | | — | |
Polish Zloty, | | | | | | | | | | | | | | | | | | | | | | | | | | |
Expiring 01/19/22 | | Barclays Bank PLC | | | PLN | | | | 4,851 | | | | 1,218,721 | | | | 1,213,549 | | | | — | | | | (5,172 | ) |
Expiring 01/19/22 | | Barclays Bank PLC | | | PLN | | | | 46 | | | | 11,647 | | | | 11,592 | | | | — | | | | (55 | ) |
Expiring 01/19/22 | | Citibank, N.A. | | | PLN | | | | 592 | | | | 150,000 | | | | 148,162 | | | | — | | | | (1,838 | ) |
Expiring 01/19/22 | | Morgan Stanley & Co. International PLC | | | PLN | | | | 485 | | | | 123,000 | | | | 121,428 | | | | — | | | | (1,572 | ) |
Romanian Leu, | | | | | | | | | | | | | | | | | | | | | | | | | | |
Expiring 01/19/22 | | Barclays Bank PLC | | | RON | | | | 1,878 | | | | 434,565 | | | | 435,899 | | | | 1,334 | | | | — | |
Russian Ruble, | | | | | | | | | | | | | | | | | | | | | | | | | | |
Expiring 12/15/21 | | Barclays Bank PLC | | | RUB | | | | 58,825 | | | | 789,867 | | | | 820,706 | | | | 30,839 | | | | — | |
Expiring 12/15/21 | | Citibank, N.A. | | | RUB | | | | 21,132 | | | | 295,000 | | | | 294,833 | | | | — | | | | (167 | ) |
Expiring 12/15/21 | | Citibank, N.A. | | | RUB | | | | 2,937 | | | | 39,912 | | | | 40,979 | | | | 1,067 | | | | — | |
Expiring 12/15/21 | | Citibank, N.A. | | | RUB | | | | 1,230 | | | | 17,017 | | | | 17,156 | | | | 139 | | | | — | |
Expiring 12/15/21 | | Credit Suisse International | | | RUB | | | | 10,360 | | | | 140,000 | | | | 144,543 | | | | 4,543 | | | | — | |
Expiring 12/15/21 | | HSBC Bank PLC | | | RUB | | | | 15,184 | | | | 205,000 | | | | 211,849 | | | | 6,849 | | | | — | |
Expiring 12/15/21 | | Morgan Stanley & Co. International PLC | | | RUB | | | | 58,825 | | | | 793,521 | | | | 820,706 | | | | 27,185 | | | | — | |
Singapore Dollar, | | | | | | | | | | | | | | | | | | | | | | | | | | |
Expiring 12/15/21 | | Goldman Sachs International | | | SGD | | | | 149 | | | | 109,647 | | | | 110,377 | | | | 730 | | | | — | |
Expiring 12/15/21 | | JPMorgan Chase Bank, N.A. | | | SGD | | | | 275 | | | | 205,000 | | | | 204,080 | | | | — | | | | (920 | ) |
Expiring 12/15/21 | | JPMorgan Chase Bank, N.A. | | | SGD | | | | 270 | | | | 199,000 | | | | 200,069 | | | | 1,069 | | | | — | |
South African Rand, | | | | | | | | | | | | | | | | | | | | | | | | | | |
Expiring 12/15/21 | | Bank of America, N.A. | | | ZAR | | | | 2,895 | | | | 190,692 | | | | 188,434 | | | | — | | | | (2,258 | ) |
Expiring 12/15/21 | | Barclays Bank PLC | | | ZAR | | | | 1,810 | | | | 121,000 | | | | 117,826 | | | | — | | | | (3,174 | ) |
Expiring 12/15/21 | | Barclays Bank PLC | | | ZAR | | | | 1,376 | | | | 93,000 | | | | 89,572 | | | | — | | | | (3,428 | ) |
Expiring 12/15/21 | | Goldman Sachs International | | | ZAR | | | | 1,431 | | | | 98,000 | | | | 93,137 | | | | — | | | | (4,863 | ) |
See Notes to Financial Statements.
PGIM Emerging Markets Debt Local Currency Fund 29
Schedule of Investments (continued)
as of October 31, 2021
Forward foreign currency exchange contracts outstanding at October 31, 2021 (continued):
| | | | | | | | | | | | | | | | | | | | | | | | | | | | | | |
Purchase Contracts | | Counterparty | | Notional Amount (000) | | Value at Settlement Date | | | Current Value | | | Unrealized Appreciation | | | Unrealized Depreciation | |
| | | | | | | | | | | | | | | | | | | | | | | | | |
| | |
OTC Forward Foreign Currency Exchange Contracts (cont’d.): | | | | | | | |
South African Rand (cont’d.), | | | | | | | | | | | | | | | | | | | | | | | | | | | | |
Expiring 12/15/21 | | Goldman Sachs International | | ZAR | | 1,005 | | $ | 68,000 | | | $ | 65,380 | | | | $— | | | | | | | | $ (2,620 | ) | | | | |
Expiring 12/15/21 | | JPMorgan Chase Bank, N.A. | | ZAR | | 2,268 | | | 153,000 | | | | 147,587 | | | | — | | | | | | | | (5,413 | ) | | | | |
Expiring 12/15/21 | | JPMorgan Chase Bank, N.A. | | ZAR | | 2,126 | | | 140,000 | | | | 138,388 | | | | — | | | | | | | | (1,612 | ) | | | | |
Expiring 12/15/21 | | JPMorgan Chase Bank, N.A. | | ZAR | | 1,815 | | | 121,000 | | | | 118,130 | | | | — | | | | | | | | (2,870 | ) | | | | |
Expiring 12/15/21 | | JPMorgan Chase Bank, N.A. | | ZAR | | 1,371 | | | 90,000 | | | | 89,209 | | | | — | | | | | | | | (791 | ) | | | | |
Expiring 12/15/21 | | JPMorgan Chase Bank, N.A. | | ZAR | | 966 | | | 64,000 | | | | 62,855 | | | | — | | | | | | | | (1,145 | ) | | | | |
Expiring 12/15/21 | | Morgan Stanley & Co. International PLC | | ZAR | | 1,827 | | | 120,489 | | | | 118,927 | | | | — | | | | | | | | (1,562 | ) | | | | |
Expiring 12/15/21 | | Morgan Stanley & Co. International PLC | | ZAR | | 470 | | | 31,169 | | | | 30,569 | | | | — | | | | | | | | (600 | ) | | | | |
South Korean Won, | | | | | | | | | | | | | | | | | | | | | | | | | | | | | | |
Expiring 12/15/21 | | HSBC Bank PLC | | KRW | | 192,547 | | | 163,000 | | | | 163,742 | | | | 742 | | | | | | | | — | | | | | |
Expiring 12/15/21 | | Morgan Stanley & Co. International PLC | | KRW | | 1,334,463 | | | 1,139,456 | | | | 1,134,826 | | | | — | | | | | | | | (4,630 | ) | | | | |
Expiring 12/15/21 | | Standard Chartered Bank | | KRW | | 313,528 | | | 268,000 | | | | 266,624 | | | | — | | | | | | | | (1,376 | ) | | | | |
Thai Baht, | | | | | | | | | | | | | | | | | | | | | | | | | | | | | | |
Expiring 12/15/21 | | Goldman Sachs International | | THB | | 5,392 | | | 160,000 | | | | 162,449 | | | | 2,449 | | | | | | | | — | | | | | |
Expiring 12/15/21 | | HSBC Bank PLC | | THB | | 9,485 | | | 288,000 | | | | 285,753 | | | | — | | | | | | | | (2,247 | ) | | | | |
Expiring 12/15/21 | | Standard Chartered Bank | | THB | | 5,330 | | | 158,000 | | | | 160,571 | | | | 2,571 | | | | | | | | — | | | | | |
Expiring 12/15/21 | | Standard Chartered Bank | | THB | | 4,381 | | | 134,000 | | | | 131,973 | | | | — | | | | | | | | (2,027 | ) | | | | |
Expiring 12/15/21 | | UBS AG | | THB | | 4,690 | | | 141,000 | | | | 141,304 | | | | 304 | | | | | | | | — | | | | | |
Turkish Lira, | | | | | | | | | | | | | | | | | | | | | | | | | | | | | | |
Expiring 12/15/21 | | Barclays Bank PLC | | TRY | | 3,175 | | | 344,975 | | | | 322,752 | | | | — | | | | | | | | (22,223 | ) | | | | |
Expiring 12/15/21 | | Citibank, N.A. | | TRY | | 90 | | | 10,143 | | | | 9,117 | | | | — | | | | | | | | (1,026 | ) | | | | |
Ukraine Hryvna, | | | | | | | | | | | | | | | | | | | | | | | | | | | | | | |
Expiring 11/04/21 | | Morgan Stanley & Co. International PLC | | UAH | | 4,574 | | | 172,920 | | | | 173,603 | | | | 683 | | | | | | | | — | | | | | |
| | | | | | | | | | | | | | | | | | | | | | | | | | | | | | |
| | | | | | | | | |
| | | | | | | | $ | 32,272,042 | | | $ | 32,064,407 | | | | 169,393 | | | | | | | | (377,028 | ) | | | | |
| | | | | | | | | | | | | | | | | | | | | | | | | | | | | | |
See Notes to Financial Statements.
30
Forward foreign currency exchange contracts outstanding at October 31, 2021 (continued):
| | | | | | | | | | | | | | | | | | | | | | | | | | |
Sale Contracts | | Counterparty | | Notional
Amount
(000) | | | Value at
Settlement
Date | | | Current
Value | | | Unrealized
Appreciation | | Unrealized
Depreciation |
| | | | | |
OTC Forward Foreign Currency Exchange Contracts: | | | | | | | | | | | | | | | | | | | | | |
Australian Dollar, | | | | | | | | | | | | | | | | | | | | | | | | | | |
Expiring 01/19/22 | | Morgan Stanley & Co. International PLC | | | AUD | | | | 631 | | | $ | 464,706 | | | $ | 474,469 | | | | $ — | | | | $ (9,763 | ) |
Brazilian Real, | | | | | | | | | | | | | | | | | | | | | | | | | | |
Expiring 11/03/21 | | Citibank, N.A. | | | BRL | | | | 488 | | | | 89,000 | | | | 86,400 | | | | 2,600 | | | | — | |
Expiring 11/03/21 | | Credit Suisse International | | | BRL | | | | 15,339 | | | | 2,710,048 | | | | 2,715,060 | | | | — | | | | (5,012 | ) |
Chilean Peso, | | | | | | | | | | | | | | | | | | | | | | | | | | |
Expiring 12/15/21 | | BNP Paribas S.A. | | | CLP | | | | 550,577 | | | | 703,712 | | | | 673,218 | | | | 30,494 | | | | — | |
Expiring 12/15/21 | | Morgan Stanley & Co. International PLC | | | CLP | | | | 98,730 | | | | 121,000 | | | | 120,722 | | | | 278 | | | | — | |
Expiring 12/15/21 | | UBS AG | | | CLP | | | | 122,099 | | | | 151,000 | | | | 149,296 | | | | 1,704 | | | | — | |
Chinese Renminbi, | | | | | | | | | | | | | | | | | | | | | | | | | | |
Expiring 11/18/21 | | Citibank, N.A. | | | CNH | | | | 1,473 | | | | 226,000 | | | | 229,541 | | | | — | | | | (3,541 | ) |
Expiring 11/18/21 | | Citibank, N.A. | | | CNH | | | | 1,337 | | | | 206,000 | | | | 208,352 | | | | — | | | | (2,352 | ) |
Expiring 11/18/21 | | Citibank, N.A. | | | CNH | | | | 1,072 | | | | 165,000 | | | | 167,027 | | | | — | | | | (2,027 | ) |
Expiring 11/18/21 | | Citibank, N.A. | | | CNH | | | | 440 | | | | 67,189 | | | | 68,499 | | | | — | | | | (1,310 | ) |
Expiring 11/18/21 | | HSBC Bank PLC | | | CNH | | | | 1,920 | | | | 300,000 | | | | 299,196 | | | | 804 | | | | — | |
Expiring 11/18/21 | | HSBC Bank PLC | | | CNH | | | | 1,010 | | | | 156,000 | | | | 157,438 | | | | — | | | | (1,438 | ) |
Expiring 11/18/21 | | JPMorgan Chase Bank, N.A. | | | CNH | | | | 3,261 | | | | 503,746 | | | | 508,174 | | | | — | | | | (4,428 | ) |
Expiring 11/18/21 | | JPMorgan Chase Bank, N.A. | | | CNH | | | | 1,952 | | | | 299,000 | | | | 304,183 | | | | — | | | | (5,183 | ) |
Expiring 11/18/21 | | JPMorgan Chase Bank, N.A. | | | CNH | | | | 1,265 | | | | 195,000 | | | | 197,095 | | | | — | | | | (2,095 | ) |
Expiring 11/18/21 | | JPMorgan Chase Bank, N.A. | | | CNH | | | | 544 | | | | 84,924 | | | | 84,840 | | | | 84 | | | | — | |
Expiring 11/18/21 | | Morgan Stanley & Co. International PLC | | | CNH | | | | 1,308 | | | | 200,000 | | | | 203,891 | | | | — | | | | (3,891 | ) |
Colombian Peso, | | | | | | | | | | | | | | | | | | | | | | | | | | |
Expiring 12/15/21 | | BNP Paribas S.A. | | | COP | | | | 516,216 | | | | 137,000 | | | | 136,643 | | | | 357 | | | | — | |
Expiring 12/15/21 | | BNP Paribas S.A. | | | COP | | | | 381,853 | | | | 99,000 | | | | 101,077 | | | | — | | | | (2,077 | ) |
Expiring 12/15/21 | | Citibank, N.A. | | | COP | | | | 635,725 | | | | 165,000 | | | | 168,277 | | | | — | | | | (3,277 | ) |
Expiring 12/15/21 | | Citibank, N.A. | | | COP | | | | 601,494 | | | | 158,101 | | | | 159,216 | | | | — | | | | (1,115 | ) |
Expiring 12/15/21 | | Goldman Sachs International | | | COP | | | | 446,807 | | | | 118,000 | | | | 118,270 | | | | — | | | | (270 | ) |
Expiring 12/15/21 | | Morgan Stanley & Co. International PLC | | | COP | | | | 537,388 | | | | 139,000 | | | | 142,247 | | | | — | | | | (3,247 | ) |
Expiring 12/15/21 | | Morgan Stanley & Co. International PLC | | | COP | | | | 385,517 | | | | 100,000 | | | | 102,047 | | | | — | | | | (2,047 | ) |
Expiring 12/15/21 | | Morgan Stanley & Co. International PLC | | | COP | | | | 236,644 | | | | 61,803 | | | | 62,640 | | | | — | | | | (837 | ) |
Expiring 12/15/21 | | UBS AG | | | COP | | | | 636,768 | | | | 165,000 | | | | 168,553 | | | | — | | | | (3,553 | ) |
See Notes to Financial Statements.
PGIM Emerging Markets Debt Local Currency Fund 31
Schedule of Investments (continued)
as of October 31, 2021
Forward foreign currency exchange contracts outstanding at October 31, 2021 (continued):
| | | | | | | | | | | | | | | | | | | | | | | | | | |
Sale Contracts | | Counterparty | | Notional
Amount
(000) | | | Value at
Settlement
Date | | | Current
Value | | | Unrealized
Appreciation | | Unrealized
Depreciation |
| | | | |
OTC Forward Foreign Currency Exchange Contracts (cont’d.): | | | | | | | | | | | | | | | | | |
Colombian Peso (cont’d.), | | | | | | | | | | | | | | | | | | | | | | | | |
Expiring 12/15/21 | | UBS AG | | | COP | | | | 468,043 | | | $ | 124,000 | | | $ | 123,891 | | | $ | 109 | | | $ | — | |
Expiring 12/15/21 | | UBS AG | | | COP | | | | 253,440 | | | | 66,000 | | | | 67,086 | | | | — | | | | (1,086 | ) |
Expiring 12/15/21 | | UBS AG | | | COP | | | | 253,242 | | | | 66,000 | | | | 67,033 | | | | — | | | | (1,033 | ) |
Euro, | | | | | | | | | | | | | | | | | | | | | | | | | | |
Expiring 01/19/22 | | Morgan Stanley & Co. International PLC | | | EUR | | | | 265 | | | | 307,091 | | | | 307,078 | | | | 13 | | | | — | |
Hungarian Forint, | | | | | | | | | | | | | | | | | | | | | | | | | | |
Expiring 11/02/21 | | Citibank, N.A. | | | HUF | | | | 69,411 | | | | 224,378 | | | | 222,960 | | | | 1,418 | | | | — | |
Expiring 01/19/22 | | Goldman Sachs International | | | HUF | | | | 239,761 | | | | 766,573 | | | | 767,626 | | | | — | | | | (1,053 | ) |
Expiring 01/19/22 | | HSBC Bank PLC | | | HUF | | | | 239,761 | | | | 766,843 | | | | 767,627 | | | | — | | | | (784 | ) |
Indian Rupee, | | | | | | | | | | | | | | | | | | | | | | | | | | |
Expiring 12/15/21 | | Citibank, N.A. | | | INR | | | | 14,190 | | | | 190,000 | | | | 188,215 | | | | 1,785 | | | | — | |
Expiring 12/15/21 | | Credit Suisse International | | | INR | | | | 11,467 | | | | 152,000 | | | | 152,094 | | | | — | | | | (94 | ) |
Expiring 12/15/21 | | Credit Suisse International | | | INR | | | | 9,385 | | | | 124,000 | | | | 124,480 | | | | — | | | | (480 | ) |
Expiring 12/15/21 | | HSBC Bank PLC | | | INR | | | | 18,714 | | | | 247,000 | | | | 248,219 | | | | — | | | | (1,219 | ) |
Expiring 12/15/21 | | JPMorgan Chase Bank, N.A. | | | INR | | | | 14,290 | | | | 188,000 | | | | 189,542 | | | | — | | | | (1,542 | ) |
Expiring 12/15/21 | | JPMorgan Chase Bank, N.A. | | | INR | | | | 11,251 | | | | 150,000 | | | | 149,235 | | | | 765 | | | | — | |
Expiring 12/15/21 | | JPMorgan Chase Bank, N.A. | | | INR | | | | 11,147 | | | | 149,000 | | | | 147,853 | | | | 1,147 | | | | — | |
Expiring 12/15/21 | | Morgan Stanley & Co. International PLC | | | INR | | | | 16,170 | | | | 213,000 | | | | 214,479 | | | | — | | | | (1,479 | ) |
Expiring 12/15/21 | | Morgan Stanley & Co. International PLC | | | INR | | | | 6,530 | | | | 87,338 | | | | 86,616 | | | | 722 | | | | — | |
Expiring 12/15/21 | | Standard Chartered Bank | | | INR | | | | 11,710 | | | | 154,000 | | | | 155,316 | | | | — | | | | (1,316 | ) |
Expiring 12/15/21 | | UBS AG | | | INR | | | | 11,716 | | | | 156,000 | | | | 155,393 | | | | 607 | | | | — | |
Indonesian Rupiah, | | | | | | | | | | | | | | | | | | | | | | | | | | |
Expiring 12/15/21 | | Citibank, N.A. | | | IDR | | | | 18,539,230 | | | | 1,270,158 | | | | 1,296,848 | | | | — | | | | (26,690 | ) |
Expiring 12/15/21 | | HSBC Bank PLC | | | IDR | | | | 3,310,930 | | | | 233,000 | | | | 231,605 | | | | 1,395 | | | | — | |
Expiring 12/15/21 | | JPMorgan Chase Bank, N.A. | | | IDR | | | | 6,404,835 | | | | 443,702 | | | | 448,028 | | | | — | | | | (4,326 | ) |
Expiring 12/15/21 | | JPMorgan Chase Bank, N.A. | | | IDR | | | | 2,310,861 | | | | 161,599 | | | | 161,648 | | | | — | | | | (49 | ) |
Expiring 12/15/21 | | Standard Chartered Bank | | | IDR | | | | 2,198,763 | | | | 153,000 | | | | 153,807 | | | | — | | | | (807 | ) |
Israeli Shekel, | | | | | | | | | | | | | | | | | | | | | | | | | | |
Expiring 12/15/21 | | Bank of America, N.A. | | | ILS | | | | 521 | | | | 162,000 | | | | 164,737 | | | | — | | | | (2,737 | ) |
Expiring 12/15/21 | | Barclays Bank PLC | | | ILS | | | | 1,002 | | | | 311,000 | | | | 316,908 | | | | — | | | | (5,908 | ) |
Expiring 12/15/21 | | Barclays Bank PLC | | | ILS | | | | 482 | | | | 150,000 | | | | 152,299 | | | | — | | | | (2,299 | ) |
See Notes to Financial Statements.
32
Forward foreign currency exchange contracts outstanding at October 31, 2021 (continued):
| | | | | | | | | | | | | | | | | | | | | | | | |
Sale Contracts | | Counterparty | | Notional Amount (000) | | | Value at
Settlement
Date | | | Current
Value | | | Unrealized
Appreciation | | Unrealized
Depreciation |
| | | | |
OTC Forward Foreign Currency Exchange Contracts (cont’d.): | | | | | | | | | | | | | | | | | |
Israeli Shekel (cont’d.), | | | | | | | | | | | | | | | | | |
Expiring 12/15/21 | | BNP Paribas S.A. | | ILS | | | 346 | | | $ | 107,664 | | | $ | 109,490 | | | $ | — | | | $ | (1,826 | ) |
Expiring 12/15/21 | | Citibank, N.A. | | ILS | | | 675 | | | | 210,000 | | | | 213,438 | | | | — | | | | (3,438 | ) |
Expiring 12/15/21 | | Citibank, N.A. | | ILS | | | 606 | | | | 188,000 | | | | 191,585 | | | | — | | | | (3,585 | ) |
Expiring 12/15/21 | | JPMorgan Chase Bank, N.A. | | ILS | | | 703 | | | | 217,000 | | | | 222,158 | | | | — | | | | (5,158 | ) |
Malaysian Ringgit, | | | | | | | | | | | | | | | | | | | | | | | | |
Expiring 12/15/21 | | Goldman Sachs International | | MYR | | | 871 | | | | 207,522 | | | | 209,663 | | | | — | | | | (2,141 | ) |
Mexican Peso, | | | | | | | | | | | | | | | | | | | | | | | | |
Expiring 12/15/21 | | Goldman Sachs International | | MXN | | | 5,431 | | | | 261,538 | | | | 261,872 | | | | — | | | | (334 | ) |
Expiring 12/15/21 | | JPMorgan Chase Bank, N.A. | | MXN | | | 3,099 | | | | 153,000 | | | | 149,432 | | | | 3,568 | | | | — | |
Expiring 12/15/21 | | JPMorgan Chase Bank, N.A. | | MXN | | | 3,099 | | | | 152,000 | | | | 149,441 | | | | 2,559 | | | | — | |
Expiring 12/15/21 | | JPMorgan Chase Bank, N.A. | | MXN | | | 3,084 | | | | 153,000 | | | | 148,731 | | | | 4,269 | | | | — | |
New Taiwanese Dollar, | | | | | | | | | | | | | | | | | |
Expiring 12/15/21 | | Credit Suisse International | | TWD | | | 4,237 | | | | 153,000 | | | | 152,610 | | | | 390 | | | | — | |
Expiring 12/15/21 | | Goldman Sachs International | | TWD | | | 4,281 | | | | 154,000 | | | | 154,196 | | | | — | | | | (196 | ) |
Expiring 12/15/21 | | JPMorgan Chase Bank, N.A. | | TWD | | | 8,391 | | | | 302,000 | | | | 302,220 | | | | — | | | | (220 | ) |
Expiring 12/15/21 | | JPMorgan Chase Bank, N.A. | | TWD | | | 7,545 | | | | 272,000 | | | | 271,758 | | | | 242 | | | | — | |
Expiring 12/15/21 | | Morgan Stanley & Co. International PLC | | TWD | | | 583 | | | | 21,031 | | | | 21,009 | | | | 22 | | | | — | |
Peruvian Nuevo Sol, | | | | | | | | | | | | | | | | | | | | | | | | |
Expiring 12/15/21 | | Bank of America, N.A. | | PEN | | | 247 | | | | 60,357 | | | | 61,783 | | | | — | | | | (1,426 | ) |
Expiring 12/15/21 | | Citibank, N.A. | | PEN | | | 1,379 | | | | 335,586 | | | | 345,037 | | | | — | | | | (9,451 | ) |
Expiring 12/15/21 | | Standard Chartered Bank | | PEN | | | 364 | | | | 92,000 | | | | 91,065 | | | | 935 | | | | — | |
Philippine Peso, | | | | | | | | | | | | | | | | | | | | | | | | |
Expiring 12/15/21 | | Citibank, N.A. | | PHP | | | 10,757 | | | | 211,000 | | | | 212,375 | | | | — | | | | (1,375 | ) |
Expiring 12/15/21 | | Citibank, N.A. | | PHP | | | 10,209 | | | | 203,000 | | | | 201,549 | | | | 1,451 | | | | — | |
Expiring 12/15/21 | | Goldman Sachs International | | PHP | | | 8,336 | | | | 165,000 | | | | 164,570 | | | | 430 | | | | — | |
Expiring 12/15/21 | | JPMorgan Chase Bank, N.A. | | PHP | | | 9,922 | | | | 196,000 | | | | 195,876 | | | | 124 | | | | — | |
Russian Ruble, | | | | | | | | | | | | | | | | | | | | | | | | |
Expiring 12/15/21 | | Bank of America, N.A. | | RUB | | | 6,850 | | | | 93,000 | | | | 95,570 | | | | — | | | | (2,570 | ) |
Expiring 12/15/21 | | Citibank, N.A. | | RUB | | | 12,623 | | | | 171,000 | | | | 176,120 | | | | — | | | | (5,120 | ) |
See Notes to Financial Statements.
PGIM Emerging Markets Debt Local Currency Fund 33
Schedule of Investments (continued)
as of October 31, 2021
Forward foreign currency exchange contracts outstanding at October 31, 2021 (continued):
| | | | | | | | | | | | | | | | | | | | | | | | |
Sale Contracts | | Counterparty | | Notional Amount (000) | | | Value at
Settlement
Date | | | Current
Value | | | Unrealized
Appreciation | | Unrealized
Depreciation |
| | | | |
OTC Forward Foreign Currency Exchange Contracts (cont’d.): | | | | | | | | | | | | | | | | | |
Russian Ruble (cont’d.), | | | | | | | | | | | | | | | | | |
Expiring 12/15/21 | | Citibank, N.A. | | RUB | | | 11,102 | | | $ | 150,000 | | | $ | 154,889 | | | $ | — | | | $ | (4,889 | ) |
Expiring 12/15/21 | | Citibank, N.A. | | RUB | | | 10,998 | | | | 149,000 | | | | 153,439 | | | | — | | | | (4,439 | ) |
Expiring 12/15/21 | | Citibank, N.A. | | RUB | | | 1,771 | | | | 24,000 | | | | 24,715 | | | | — | | | | (715 | ) |
Expiring 12/15/21 | | Credit Suisse International | | RUB | | | 17,487 | | | | 237,000 | | | | 243,975 | | | | — | | | | (6,975 | ) |
Expiring 12/15/21 | | Credit Suisse International | | RUB | | | 9,020 | | | | 123,999 | | | | 125,848 | | | | — | | | | (1,849 | ) |
Expiring 12/15/21 | | Morgan Stanley & Co. International PLC | | RUB | | | 13,150 | | | | 185,000 | | | | 183,469 | | | | 1,531 | | | | — | |
Expiring 12/15/21 | | Morgan Stanley & Co. International PLC | | RUB | | | 9,909 | | | | 134,000 | | | | 138,251 | | | | — | | | | (4,251 | ) |
Expiring 12/15/21 | | Standard Chartered Bank | | RUB | | | 9,110 | | | | 124,000 | | | | 127,095 | | | | — | | | | (3,095 | ) |
Singapore Dollar, | | | | | | | | | | | | | | | | | | | | | | | | |
Expiring 12/15/21 | | BNP Paribas S.A. | | SGD | | | 217 | | | | 160,000 | | | | 160,662 | | | | — | | | | (662 | ) |
Expiring 12/15/21 | | Citibank, N.A. | | SGD | | | 280 | | | | 207,000 | | | | 207,364 | | | | — | | | | (364 | ) |
Expiring 12/15/21 | | Goldman Sachs International | | SGD | | | 2,748 | | | | 2,043,983 | | | | 2,037,061 | | | | 6,922 | | | | — | |
Expiring 12/15/21 | | Goldman Sachs International | | SGD | | | 218 | | | | 162,000 | | | | 161,410 | | | | 590 | | | | — | |
Expiring 12/15/21 | | JPMorgan Chase Bank, N.A. | | SGD | | | 255 | | | | 189,000 | | | | 188,900 | | | | 100 | | | | — | |
Expiring 12/15/21 | | JPMorgan Chase Bank, N.A. | | SGD | | | 193 | | | | 142,000 | | | | 143,293 | | | | — | | | | (1,293 | ) |
Expiring 12/15/21 | | JPMorgan Chase Bank, N.A. | | SGD | | | 192 | | | | 142,000 | | | | 142,660 | | | | — | | | | (660 | ) |
Expiring 12/15/21 | | UBS AG | | SGD | | | 425 | | | | 316,000 | | | | 315,226 | | | | 774 | | | | — | |
Expiring 12/15/21 | | UBS AG | | SGD | | | 353 | | | | 260,000 | | | | 261,510 | | | | — | | | | (1,510 | ) |
South African Rand, | | | | | | | | | | | | | | | | | | | | | | | | |
Expiring 12/15/21 | | Barclays Bank PLC | | ZAR | | | 17,009 | | | | 1,164,873 | | | | 1,107,020 | | | | 57,853 | | | | — | |
Expiring 12/15/21 | | Citibank, N.A. | | ZAR | | | 9,866 | | | | 682,435 | | | | 642,121 | | | | 40,314 | | | | — | |
Expiring 12/15/21 | | Goldman Sachs International | | ZAR | | | 775 | | | | 51,000 | | | | 50,433 | | | | 567 | | | | — | |
Expiring 12/15/21 | | HSBC Bank PLC | | ZAR | | | 17,770 | | | | 1,231,767 | | | | 1,156,538 | | | | 75,229 | | | | — | |
Expiring 12/15/21 | | JPMorgan Chase Bank, N.A. | | ZAR | | | 2,173 | | | | 143,000 | | | | 141,433 | | | | 1,567 | | | | — | |
Expiring 12/15/21 | | JPMorgan Chase Bank, N.A. | | ZAR | | | 2,170 | | | | 142,000 | | | | 141,251 | | | | 749 | | | | — | |
Expiring 12/15/21 | | Morgan Stanley & Co. International PLC | | ZAR | | | 836 | | | | 56,729 | | | | 54,378 | | | | 2,351 | | | | — | |
South Korean Won, | | | | | | | | | | | | | | | | | | | | | | | | |
Expiring 12/15/21 | | Morgan Stanley & Co. International PLC | | KRW | | | 79,592 | | | | 67,163 | | | | 67,685 | | | | — | | | | (522 | ) |
See Notes to Financial Statements.
34
Forward foreign currency exchange contracts outstanding at October 31, 2021 (continued):
| | | | | | | | | | | | | | | | | | | | | | | | | | | | | | | | | | | | | | | |
Sale Contracts | | Counterparty | | Notional Amount (000) | | Value at Settlement Date | | Current Value | | Unrealized
Appreciation | | Unrealized Depreciation |
| | | | | | |
OTC Forward Foreign Currency Exchange Contracts (cont’d.): | | | | | | | | | | | | | | | | | | | | | | | | | | | | | | | |
Thai Baht, | | | | | | | | | | | | | | | | | | | | | | | | | | | | | | | | | | | | | | | |
Expiring 12/15/21 | | Citibank, N.A. | | THB | | | | 4,238 | | | | $ | 129,000 | | | | $ | 127,683 | | | | $ | 1,317 | | | | | | | | | $ | — | | | | | | |
Expiring 12/15/21 | | Credit Suisse International | | THB | | | | 1,057 | | | | | 31,610 | | | | | 31,838 | | | | | — | | | | | | | | | | (228 | ) | | | | | |
Expiring 12/15/21 | | HSBC Bank PLC | | THB | | | | 12,271 | | | | | 377,708 | | | | | 369,698 | | | | | 8,010 | | | | | | | | | | — | | | | | | |
Expiring 12/15/21 | | JPMorgan Chase Bank, N.A. | | THB | | | | 5,487 | | | | | 164,000 | | | | | 165,302 | | | | | — | | | | | | | | | | (1,302 | ) | | | | | |
Expiring 12/15/21 | | JPMorgan Chase Bank, N.A. | | THB | | | | 4,509 | | | | | 137,000 | | | | | 135,832 | | | | | 1,168 | | | | | | | | | | — | | | | | | |
Expiring 12/15/21 | | JPMorgan Chase Bank, N.A. | | THB | | | | 4,408 | | | | | 132,000 | | | | | 132,792 | | | | | — | | | | | | | | | | (792 | ) | | | | | |
Expiring 12/15/21 | | JPMorgan Chase Bank, N.A. | | THB | | | | 4,324 | | | | | 127,000 | | | | | 130,270 | | | | | — | | | | | | | | | | (3,270 | ) | | | | | |
Expiring 12/15/21 | | Morgan Stanley & Co. International PLC | | THB | | | | 3,791 | | | | | 113,390 | | | | | 114,195 | | | | | — | | | | | | | | | | (805 | ) | | | | | |
Expiring 12/15/21 | | Standard Chartered Bank | | THB | | | | 10,137 | | | | | 310,000 | | | | | 305,387 | | | | | 4,613 | | | | | | | | | | — | | | | | | |
Expiring 12/15/21 | | Standard Chartered Bank | | THB | | | | 7,371 | | | | | 220,000 | | | | | 222,068 | | | | | — | | | | | | | | | | (2,068 | ) | | | | | |
Expiring 12/15/21 | | Standard Chartered Bank | | THB | | | | 6,239 | | | | | 193,000 | | | | | 187,965 | | | | | 5,035 | | | | | | | | | | — | | | | | | |
Expiring 12/15/21 | | Standard Chartered Bank | | THB | | | | 5,534 | | | | | 170,969 | | | | | 166,727 | | | | | 4,242 | | | | | | | | | | — | | | | | | |
Expiring 12/15/21 | | UBS AG | | THB | | | | 1,802 | | | | | 54,912 | | | | | 54,280 | | | | | 632 | | | | | | | | | | — | | | | | | |
Turkish Lira, | | | | | | | | | | | | | | | | | | | | | | | | | | | | | | | | | | | | | | | |
Expiring 12/15/21 | | Goldman Sachs International | | TRY | | | | 252 | | | | | 27,290 | | | | | 25,641 | | | | | 1,649 | | | | | | | | | | — | | | | | | |
Expiring 12/15/21 | | Morgan Stanley & Co. International PLC | | TRY | | | | 626 | | | | | 71,724 | | | | | 63,691 | | | | | 8,033 | | | | | | | | | | — | | | | | | |
Ukraine Hryvna, | | | | | | | | | | | | | | | | | | | | | | | | | | | | | | | | | | | | | | | |
Expiring 11/04/21 | | Goldman Sachs International | | UAH | | | | 4,574 | | | | | 169,901 | | | | | 173,603 | | | | | — | | | | | | | | | | (3,702 | ) | | | | | |
Expiring 12/06/21 | | Morgan Stanley & Co. International PLC | | UAH | | | | 4,574 | | | | | 171,000 | | | | | 171,490 | | | | | — | | | | | | | | | | (490 | ) | | | | | |
| | | | | | | | | | | | | | | | | | | | | | | | | | | | | | | | | | | | | | | |
| | | | | | | | | |
| | | | | | | | | | | | $ | 29,768,062 | | | | $ | 29,677,630 | | | | | 281,518 | | | | | | | | | | (191,086 | ) | | | | | |
| | | | | | | | | | | | | | | | | | | | | | | | | | | | | | | | | | | | | | | |
| | | | | | | | | |
| | | | | | | | | | | | | | | | | | | | | | $ | 450,911 | | | | | | | | | $ | (568,114 | ) | | | | | |
| | | | | | | | | | | | | | | | | | | | | | | | | | | | | | | | | | | | | | | |
Interest rate swap agreements outstanding at October 31, 2021:
| | | | | | | | | | | | | | | | | | | | | | | | | | | | |
Notional Amount (000)# | | Termination Date | | Fixed Rate | | | | Floating Rate | | Value at
Trade Date | | Value at
October 31,
2021 | | Unrealized
Appreciation
(Depreciation) |
| | | | | | | | | | | | | | | | | |
| | | | | | | | | | | | | | | | | |
Centrally Cleared Interest Rate Swap Agreements: | | | | | |
BRL | | | | 3,324 | | | 01/02/23 | | 6.450%(T) | | | | 1 Day BROIS(2)(T) | | | $ | — | | | | $ | (29,097 | ) | | | $ | (29,097 | ) |
BRL | | | | 1,374 | | | 01/02/24 | | 4.590%(T) | | | | 1 Day BROIS(2)(T) | | | | — | | | | | (31,300 | ) | | | | (31,300 | ) |
See Notes to Financial Statements.
PGIM Emerging Markets Debt Local Currency Fund 35
Schedule of Investments (continued)
as of October 31, 2021
Interest rate swap agreements outstanding at October 31, 2021 (continued):
| | | | | | | | | | | | | | | | | | | | | | | | | | | | |
Notional Amount (000)# | | Termination Date | | Fixed Rate | | | | Floating Rate | | Value at
Trade Date | | Value at
October 31,
2021 | | Unrealized
Appreciation
(Depreciation) |
| | | | | | | | | | | | | | | | | |
Centrally Cleared Interest Rate Swap Agreements (cont’d.): | | | | | |
BRL | | | | 3,769 | | | 01/02/25 | | 5.755%(T) | | | | 1 Day BROIS(2)(T) | | | $ | — | | | | $ | (93,598 | ) | | | $ | (93,598 | ) |
BRL | | | | 1,478 | | | 01/02/25 | | 5.840%(T) | | | | 1 Day BROIS(2)(T) | | | | — | | | | | (34,841 | ) | | | | (34,841 | ) |
BRL | | | | 2,354 | | | 01/02/25 | | 7.950%(T) | | | | 1 Day BROIS(2)(T) | | | | — | | | | | (42,651 | ) | | | | (42,651 | ) |
BRL | | | | 2,540 | | | 01/02/25 | | 8.140%(T) | | | | 1 Day BROIS(1)(T) | | | | — | | | | | 40,836 | | | | | 40,836 | |
BRL | | | | 1,190 | | | 01/02/25 | | 8.250%(T) | | | | 1 Day BROIS(1)(T) | | | | — | | | | | 18,286 | | | | | 18,286 | |
BRL | | | | 3,723 | | | 01/02/25 | | 9.070%(T) | | | | 1 Day BROIS(1)(T) | | | | — | | | | | 49,830 | | | | | 49,830 | |
BRL | | | | 668 | | | 01/04/27 | | 6.325%(T) | | | | 1 Day BROIS(2)(T) | | | | — | | | | | (25,141 | ) | | | | (25,141 | ) |
BRL | | | | 1,056 | | | 01/04/27 | | 6.529%(T) | | | | 1 Day BROIS(2)(T) | | | | — | | | | | (37,641 | ) | | | | (37,641 | ) |
BRL | | | | 2,414 | | | 01/04/27 | | 7.060%(T) | | | | 1 Day BROIS(1)(T) | | | | 20,737 | | | | | 85,540 | | | | | 64,803 | |
BRL | | | | 1,885 | | | 01/04/27 | | 7.745%(T) | | | | 1 Day BROIS(1)(T) | | | | — | | | | | 57,048 | | | | | 57,048 | |
BRL | | | | 1,366 | | | 01/04/27 | | 8.020%(T) | | | | 1 Day BROIS(2)(T) | | | | — | | | | | (40,088 | ) | | | | (40,088 | ) |
BRL | | | | 1,954 | | | 01/04/27 | | 8.565%(T) | | | | 1 Day BROIS(2)(T) | | | | — | | | | | (47,918 | ) | | | | (47,918 | ) |
BRL | | | | 1,372 | | | 01/04/27 | | 8.570%(T) | | | | 1 Day BROIS(1)(T) | | | | — | | | | | 32,160 | | | | | 32,160 | |
BRL | | | | 744 | | | 01/04/27 | | 9.300%(T) | | | | 1 Day BROIS(1)(T) | | | | — | | | | | 14,924 | | | | | 14,924 | |
BRL | | | | 1,788 | | | 01/04/27 | | 10.250%(T) | | | | 1 Day BROIS(1)(T) | | | | — | | | | | 22,816 | | | | | 22,816 | |
BRL | | | | 4,739 | | | 01/04/27 | | 10.490%(T) | | | | 1 Day BROIS(1)(T) | | | | (3,603 | ) | | | | 53,082 | | | | | 56,685 | |
BRL | | | | 1,688 | | | 01/04/27 | | 11.755%(T) | | | | 1 Day BROIS(2)(T) | | | | — | | | | | (2,132 | ) | | | | (2,132 | ) |
BRL | | | | 1,601 | | | 01/04/27 | | 12.200%(T) | | | | 1 Day BROIS(2)(T) | | | | — | | | | | 3,846 | | | | | 3,846 | |
CLP | | | | 708,900 | | | 09/15/23 | | 3.853%(S) | | | | 1 Day CLOIS(1)(S) | | | | — | | | | | 18,889 | | | | | 18,889 | |
CLP | | | | 646,420 | | | 10/13/23 | | 4.920%(S) | | | | 1 Day CLOIS(1)(S) | | | | — | | | | | 2,972 | | | | | 2,972 | |
CLP | | | | 288,400 | | | 06/23/26 | | 3.165%(S) | | | | 1 Day CLOIS(1)(S) | | | | — | | | | | 29,836 | | | | | 29,836 | |
CLP | | | | 268,200 | | | 07/12/26 | | 3.505%(S) | | | | 1 Day CLOIS(2)(S) | | | | — | | | | | (23,575 | ) | | | | (23,575 | ) |
CLP | | | | 294,290 | | | 09/15/26 | | 4.705%(S) | | | | 1 Day CLOIS(1)(S) | | | | — | | | | | 9,420 | | | | | 9,420 | |
CLP | | | | 333,190 | | | 10/26/26 | | 5.750%(S) | | | | 1 Day CLOIS(1)(S) | | | | — | | | | | (6,605 | ) | | | | (6,605 | ) |
CLP | | | | 220,800 | | | 05/03/31 | | 3.680%(S) | | | | 1 Day CLOIS(1)(S) | | | | — | | | | | 35,249 | | | | | 35,249 | |
CLP | | | | 147,120 | | | 10/04/31 | | 5.420%(S) | | | | 1 Day CLOIS(1)(S) | | | | — | | | | | 2,119 | | | | | 2,119 | |
CNH | | | | 2,100 | | | 06/15/25 | | 2.175%(Q) | | | | 7 Day China Fixing Repo Rates(2)(Q) | | | | (2 | ) | | | | (4,358 | ) | | | | (4,356 | ) |
CNH | | | | 3,515 | | | 06/19/25 | | 2.200%(Q) | | | | 7 Day China Fixing Repo Rates(2)(Q) | | | | (5 | ) | | | | (6,862 | ) | | | | (6,857 | ) |
CNH | | | | 3,085 | | | 10/30/25 | | 2.535%(Q) | | | | 7 Day China Fixing Repo Rates(2)(Q) | | | | 20 | | | | | (582 | ) | | | | (602 | ) |
CNH | | | | 5,800 | | | 07/12/26 | | 2.640%(Q) | | | | 7 Day China Fixing Repo Rates(2)(Q) | | | | — | | | | | 743 | | | | | 743 | |
CNH | | | | 2,360 | | | 07/27/26 | | 2.553%(Q) | | | | 7 Day China Fixing Repo Rates(2)(Q) | | | | — | | | | | (1,235 | ) | | | | (1,235 | ) |
COP | | | | 3,423,100 | | | 09/15/23 | | 4.185%(Q) | | | | 1 Day COOIS(1)(Q) | | | | — | | | | | 16,910 | | | | | 16,910 | |
COP | | | | 950,000 | | | 12/12/23 | | 5.530%(Q) | | | | 1 Day COOIS(2)(Q) | | | | — | | | | | 1,371 | | | | | 1,371 | |
COP | | | | 3,400,000 | | | 09/30/26 | | 5.830%(Q) | | | | 1 Day COOIS(1)(Q) | | | | 4,764 | | | | | 5,708 | | | | | 944 | |
COP | | | | 1,771,750 | | | 10/06/26 | | 5.785%(Q) | | | | 1 Day COOIS(1)(Q) | | | | — | | | | | 4,258 | | | | | 4,258 | |
CZK | | | | 7,610 | | | 09/22/26 | | 2.360%(A) | | | | 6 Month PRIBOR(2)(S) | | | | — | | | | | (10,594 | ) | | | | (10,594 | ) |
See Notes to Financial Statements.
36
Interest rate swap agreements outstanding at October 31, 2021 (continued):
| | | | | | | | | | | | | | | | | | | | | | | | | | | | |
Notional Amount (000)# | | Termination Date | | Fixed Rate | | | | Floating Rate | | Value at
Trade Date | | Value at
October 31,
2021 | | Unrealized
Appreciation
(Depreciation) |
| | | | | | | | | | | | | | | | | |
Centrally Cleared Interest Rate Swap Agreements (cont’d.): | | | | | |
CZK | | | | 6,507 | | | 06/15/31 | | 1.730%(A) | | | | 6 Month PRIBOR(2)(S) | | | $ | — | | | | $ | (23,984 | ) | | | $ | (23,984 | ) |
CZK | | | | 4,060 | | | 10/08/31 | | 2.450%(A) | | | | 6 Month PRIBOR(2)(S) | | | | — | | | | | (4,156 | ) | | | | (4,156 | ) |
HUF | | | | 157,860 | | | 09/03/26 | | 2.660%(A) | | | | 6 Month BUBOR(1)(S) | | | | 5,523 | | | | | 21,070 | | | | | 15,547 | |
INR | | | | 129,000 | | | 10/07/22 | | 4.065%(T) | | | | 1 Day MIBOR(1)(T) | | | | — | | | | | 3,902 | | | | | 3,902 | |
KRW | | | | 1,300,000 | | | 03/12/26 | | 1.407%(Q) | | | | 3 Month KWCDC(2)(Q) | | | | (2,314 | ) | | | | (36,683 | ) | | | | (34,369 | ) |
KRW | | | | 1,000,000 | | | 10/07/26 | | 1.958%(Q) | | | | 3 Month KWCDC(2)(Q) | | | | 874 | | | | | (9,614 | ) | | | | (10,488 | ) |
MXN | | | | 10,150 | | | 09/23/24 | | 6.540%(M) | | | | 28 Day Mexican Interbank Rate(1)(M) | | | | — | | | | | 11,217 | | | | | 11,217 | |
MXN | | | | 7,470 | | | 05/02/25 | | 5.285%(M) | | | | 28 Day Mexican Interbank Rate(2)(M) | | | | 16 | | | | | (24,813 | ) | | | | (24,829 | ) |
MXN | | | | 14,446 | | | 03/11/26 | | 4.845%(M) | | | | 28 Day Mexican Interbank Rate(2)(M) | | | | (13,391 | ) | | | | (71,176 | ) | | | | (57,785 | ) |
MXN | | | | 9,380 | | | 06/10/26 | | 5.800%(M) | | | | 28 Day Mexican Interbank Rate(1)(M) | | | | — | | | | | 31,054 | | | | | 31,054 | |
MXN | | | | 18,698 | | | 07/02/26 | | 6.800%(M) | | | | 28 Day Mexican Interbank Rate(2)(M) | | | | 424 | | | | | (26,458 | ) | | | | (26,882 | ) |
MXN | | | | 9,180 | | | 07/14/26 | | 6.465%(M) | | | | 28 Day Mexican Interbank Rate(2)(M) | | | | (24 | ) | | | | (18,870 | ) | | | | (18,846 | ) |
MXN | | | | 4,160 | | | 07/15/26 | | 6.430%(M) | | | | 28 Day Mexican Interbank Rate(2)(M) | | | | (10 | ) | | | | (8,855 | ) | | | | (8,845 | ) |
MXN | | | | 4,800 | | | 08/24/26 | | 6.418%(M) | | | | 28 Day Mexican Interbank Rate(2)(M) | | | | (10 | ) | | | | (10,701 | ) | | | | (10,691 | ) |
MXN | | | | 13,870 | | | 10/14/26 | | 7.340%(M) | | | | 28 Day Mexican Interbank Rate(1)(M) | | | | — | | | | | 5,177 | | | | | 5,177 | |
MXN | | | | 2,040 | | | 01/28/30 | | 6.640%(M) | | | | 28 Day Mexican Interbank Rate(2)(M) | | | | — | | | | | (5,964 | ) | | | | (5,964 | ) |
See Notes to Financial Statements.
PGIM Emerging Markets Debt Local Currency Fund 37
Schedule of Investments (continued)
as of October 31, 2021
Interest rate swap agreements outstanding at October 31, 2021 (continued):
| | | | | | | | | | | | | | | | | | | | | | | | | | | | |
Notional Amount (000)# | | Termination Date | | Fixed Rate | �� | | | Floating Rate | | Value at
Trade Date | | Value at
October 31,
2021 | | Unrealized
Appreciation
(Depreciation) |
| | | | | | | | | | | | | | | | | |
Centrally Cleared Interest Rate Swap Agreements (cont’d.): | | | | | |
MXN | | | | 5,320 | | | 04/28/31 | | 6.660%(M) | | | | 28 Day Mexican Interbank Rate(2)(M) | | | $ | (17 | ) | | | | $(17,247 | ) | | | $ | (17,230 | ) |
MXN | | | | 4,500 | | | 05/14/31 | | 6.915%(M) | | | | 28 Day Mexican Interbank Rate(2)(M) | | | | (17 | ) | | | | (10,580 | ) | | | | (10,563 | ) |
MXN | | | | 4,450 | | | 07/24/31 | | 6.780%(M) | | | | 28 Day Mexican Interbank Rate(2)(M) | | | | — | | | | | (12,937 | ) | | | | (12,937 | ) |
MXN | | | | 6,300 | | | 09/10/31 | | 7.145%(M) | | | | 28 Day Mexican Interbank Rate(2)(M) | | | | — | | | | | (10,369 | ) | | | | (10,369 | ) |
PLN | | | | 2,450 | | | 10/05/23 | | 1.350%(A) | | | | 6 Month WIBOR(1)(S) | | | | — | | | | | 9,840 | | | | | 9,840 | |
PLN | | | | 2,450 | | | 10/05/23 | | 1.375%(A) | | | | 6 Month WIBOR(1)(S) | | | | — | | | | | 9,540 | | | | | 9,540 | |
PLN | | | | 3,180 | | | 11/02/23 | | 2.255%(A) | | | | 6 Month WIBOR(1)(S) | | | | — | | | | | — | | | | | — | |
PLN | | | | 2,360 | | | 12/15/23 | | 2.400%(A) | | | | 6 Month WIBOR(1)(S) | | | | — | | | | | 1,563 | | | | | 1,563 | |
PLN | | | | 2,700 | | | 07/24/24 | | 1.798%(A) | | | | 6 Month WIBOR(2)(S) | | | | — | | | | | (9,475 | ) | | | | (9,475 | ) |
PLN | | | | 2,730 | | | 09/08/25 | | 0.637%(A) | | | | 6 Month WIBOR(2)(S) | | | | (2,842 | ) | | | | (48,410 | ) | | | | (45,568 | ) |
PLN | | | | 3,239 | | | 08/06/26 | | 1.300%(A) | | | | 6 Month WIBOR(2)(S) | | | | (13,147 | ) | | | | (46,760 | ) | | | | (33,613 | ) |
PLN | | | | 1,980 | | | 09/03/26 | | 1.570%(A) | | | | 6 Month WIBOR(1)(S) | | | | — | | | | | 23,017 | | | | | 23,017 | |
PLN | | | | 2,539 | | | 10/21/26 | | 2.545%(A) | | | | 6 Month WIBOR(2)(S) | | | | 411 | | | | | (3,581 | ) | | | | (3,992 | ) |
PLN | | | | 1,980 | | | 12/15/26 | | 1.816%(A) | | | | 6 Month WIBOR(1)(S) | | | | — | | | | | 21,317 | | | | | 21,317 | |
PLN | | | | 1,400 | | | 12/15/26 | | 2.433%(A) | | | | 6 Month WIBOR(1)(S) | | | | — | | | | | 4,985 | | | | | 4,985 | |
PLN | | | | 700 | | | 06/17/31 | | 1.745%(A) | | | | 6 Month WIBOR(1)(S) | | | | — | | | | | 14,097 | | | | | 14,097 | |
THB | | | | 18,200 | | | 12/15/26 | | 1.405%(S) | | | | 6 Month THBFIX(1)(S) | | | | — | | | | | 125 | | | | | 125 | |
THB | | | | 6,860 | | | 12/15/31 | | 1.787%(S) | | | | 6 Month THBFIX(1)(S) | | | | — | | | | | 223 | | | | | 223 | |
ZAR | | | | 4,500 | | | 06/25/25 | | 5.010%(Q) | | | | 3 Month JIBAR(2)(Q) | | | | (21 | ) | | | | (13,215 | ) | | | | (13,194 | ) |
See Notes to Financial Statements.
38
Interest rate swap agreements outstanding at October 31, 2021 (continued):
| | | | | | | | | | | | | | | | | | | | | | | | | | | | |
Notional Amount (000)# | | Termination Date | | Fixed Rate | | | | Floating Rate | | Value at
Trade Date | | Value at
October 31,
2021 | | Unrealized
Appreciation
(Depreciation) |
| | | | | | | | | | | | | | | | | |
Centrally Cleared Interest Rate Swap Agreements (cont’d.): | | | | | |
ZAR | | | | 5,156 | | | 08/21/25 | | 4.978%(Q) | | | | 3 Month JIBAR(1)(Q) | | | $ | (3,535 | ) | | | $ | 16,374 | | | | $ | 19,909 | |
ZAR | | | | 30,303 | | | 03/24/26 | | 6.010%(Q) | | | | 3 Month JIBAR(1)(Q) | | | | (14,146 | ) | | | | 46,507 | | | | | 60,653 | |
ZAR | | | | 2,472 | | | 04/15/26 | | 5.605%(Q) | | | | 3 Month JIBAR(2)(Q) | | | | (33 | ) | | | | (6,748 | ) | | | | (6,715 | ) |
ZAR | | | | 10,410 | | | 09/29/26 | | 6.245%(Q) | | | | 3 Month JIBAR(1)(Q) | | | | 2,242 | | | | | 15,533 | | | | | 13,291 | |
ZAR | | | | 5,388 | | | 12/15/26 | | 6.863%(Q) | | | | 3 Month JIBAR(1)(Q) | | | | — | | | | | 2,073 | | | | | 2,073 | |
ZAR | | | | 3,244 | | | 04/09/31 | | 7.535%(Q) | | | | 3 Month JIBAR(1)(Q) | | | | 94 | | | | | 3,423 | | | | | 3,329 | |
ZAR | | | | 3,244 | | | 04/13/31 | | 7.530%(Q) | | | | 3 Month JIBAR(2)(Q) | | | | (45 | ) | | | | (3,624 | ) | | | | (3,579 | ) |
ZAR | | | | 6,680 | | | 07/13/31 | | 7.415%(Q) | | | | 3 Month JIBAR(1)(Q) | | | | 93 | | | | | 12,290 | | | | | 12,197 | |
ZAR | | | | 13,240 | | | 09/27/31 | | 7.493%(Q) | | | | 3 Month JIBAR(1)(Q) | | | | 1,711 | | | | | 20,401 | | | | | 18,690 | |
| | | | | | | | | | | | | | | | | | | | | | | | | | | | |
| | | | | | | | |
| | | | | | | | | | | | | | | | $ | (16,253 | ) | | | $ | (82,867 | ) | | | $ | (66,614 | ) |
| | | | | | | | | | | | | | | | | | | | | | | | | | | | |
| | | | | | | | | | | | | | | | | | | | | | | | | | | | |
Notional Amount (000)# | | Termination
Date | | Fixed Rate | | Floating Rate | | Fair
Value | | Upfront
Premiums
Paid(Received) | | Unrealized
Appreciation
(Depreciation) | | Counterparty |
| | | | | | | | | | | | | | | | | |
OTC Interest Rate Swap Agreements: | | | | |
MYR | | | | 1,900 | | | 04/08/26 | | 2.650%(Q) | | 3 Month KLIBOR(1)(Q) | | | $ | 7,026 | | | | $ | 36 | | | | $ | 6,990 | | | Morgan Stanley & Co. International PLC |
MYR | | | | 2,800 | | | 04/21/26 | | 2.595%(Q) | | 3 Month KLIBOR(1)(Q) | | | | 12,300 | | | | | 24 | | | | | 12,276 | | | HSBC Bank PLC |
MYR | | | | 1,800 | | | 04/27/26 | | 2.668%(Q) | | 3 Month KLIBOR(1)(Q) | | | | 6,650 | | | | | 26 | | | | | 6,624 | | | HSBC Bank PLC |
MYR | | | | 1,900 | | | 10/06/26 | | 2.839%(Q) | | 3 Month KLIBOR(1)(Q) | | | | 4,721 | | | | | 11 | | | | | 4,710 | | | Bank of America, N.A. |
RUB | | | | 96,500 | | | 12/15/26 | | 7.290%(A) | | 3 Month MosPRIME(2)(Q) | | | | (85,602 | ) | | | | — | | | | | (85,602 | ) | | Goldman Sachs International |
RUB | | | | 21,000 | | | 12/15/26 | | 7.995%(A) | | 3 Month MosPRIME(2)(Q) | | | | (10,303 | ) | | | | — | | | | | (10,303 | ) | | Morgan Stanley & Co. International PLC |
| | | | | | | | | | | | | | | | | | | | | | | | | | | | |
| | | | | | | | |
| | | | | | | | | | | | | | $ | (65,208 | ) | | | $ | 97 | | | | $ | (65,305 | ) | | |
| | | | | | | | | | | | | | | | | | | | | | | | | | | | |
| (1) | The Fund pays the fixed rate and receives the floating rate. |
| (2) | The Fund pays the floating rate and receives the fixed rate. |
See Notes to Financial Statements.
PGIM Emerging Markets Debt Local Currency Fund 39
Schedule of Investments (continued)
as of October 31, 2021
Balances Reported in the Statement of Assets and Liabilities for OTC Swap Agreements:
| | | | | | | | |
| | | Premiums Paid | | Premiums Received | | Unrealized
Appreciation | | Unrealized
Depreciation |
| | | | |
OTC Swap Agreements | | $97 | | $— | | $30,600 | | $(95,905) |
Summary of Collateral for Centrally Cleared/Exchange-traded Derivatives:
Cash and securities segregated as collateral, including pending settlement for closed positions, to cover requirements for centrally cleared/exchange-traded derivatives are listed by broker as follows:
| | | | | | | | | | |
Broker | | Cash and/or Foreign Currency | | Securities Market Value |
| | |
Citigroup Global Markets, Inc. | | | $ | 550,000 | | | | $ | — | |
J.P. Morgan Securities LLC | | | | 170,000 | | | | | — | |
| | | | | | | | | | |
| | |
Total | | | $ | 720,000 | | | | $ | — | |
| | | | | | | | | | |
Fair Value Measurements:
Various inputs are used in determining the value of the Fund’s investments. These inputs are summarized in the three broad levels listed below.
Level 1—unadjusted quoted prices generally in active markets for identical securities.
Level 2—quoted prices for similar securities, interest rates and yield curves, prepayment speeds, foreign currency exchange rates and other observable inputs.
Level 3—unobservable inputs for securities valued in accordance with Board approved fair valuation procedures.
The following is a summary of the inputs used as of October 31, 2021 in valuing such portfolio securities:
| | | | | | | | | | |
| | | Level 1 | | | Level 2 | | | Level 3 |
| | | |
Investments in Securities | | | | | | | | | | |
Assets | | | | | | | | | | |
Long-Term Investments | | | | | | | | | | |
Corporate Bonds | | | | | | | | | | |
Brazil | | $ | — | | | $ | 190,300 | | | $— |
Jamaica | | | — | | | | 227,267 | | | — |
Malaysia | | | — | | | | 207,698 | | | — |
Mexico | | | — | | | | 1,045,826 | | | — |
Russia | | | — | | | | 1,208,886 | | | — |
South Africa | | | — | | | | 417,647 | | | — |
Supranational Bank | | | — | | | | 872,135 | | | — |
Foreign Treasury Obligation | | | | | | | | | | |
Brazil | | | — | | | | 595,330 | | | — |
Sovereign Bonds | | | | | | | | | | |
Angola | | | — | | | | 433,555 | | | — |
Argentina | | | — | | | | 315,061 | | | — |
Brazil | | | — | | | | 1,964,631 | | | — |
Chile | | | — | | | | 1,235,274 | | | — |
See Notes to Financial Statements.
40
| | | | | | | | | | |
| | | Level 1 | | | Level 2 | | | Level 3 |
| | | |
Investments in Securities (continued) | | | | | | | | | | |
Assets (continued) | | | | | | | | | | |
Long-Term Investments (continued) | | | | | | | | | | |
Sovereign Bonds (continued) | | | | | | | | | | |
China | | $ | — | | | $ | 5,991,107 | | | $— |
Colombia | | | — | | | | 2,116,447 | | | — |
Czech Republic | | | — | | | | 1,379,867 | | | — |
Dominican Republic | | | — | | | | 166,313 | | | — |
Hungary | | | — | | | | 1,818,385 | | | — |
Indonesia | | | — | | | | 6,455,525 | | | — |
Ivory Coast | | | — | | | | 136,697 | | | — |
Malaysia | | | — | | | | 5,260,417 | | | — |
Mexico | | | — | | | | 2,317,958 | | | — |
Nigeria | | | — | | | | 217,651 | | | — |
Pakistan | | | — | | | | 627,175 | | | — |
Peru | | | — | | | | 1,402,490 | | | — |
Philippines | | | — | | | | 112,496 | | | — |
Poland | | | — | | | | 2,592,615 | | | — |
Romania | | | — | | | | 1,254,565 | | | — |
Russia | | | — | | | | 2,667,510 | | | — |
Serbia | | | — | | | | 161,492 | | | — |
South Africa | | | — | | | | 4,903,689 | | | — |
Thailand | | | — | | | | 4,088,681 | | | — |
Turkey | | | — | | | | 614,926 | | | — |
Ukraine | | | — | | | | 586,581 | | | — |
Uruguay | | | — | | | | 118,623 | | | — |
Short-Term Investments | | | | | | | | | | |
Affiliated Mutual Funds | | | 806,104 | | | | — | | | — |
Options Purchased | | | — | | | | 136,000 | | | — |
| | | | | | | | | | |
| | | |
Total | | $ | 806,104 | | | $ | 53,840,820 | | | $— |
| | | | | | | | | | |
| | | |
Liabilities | | | | | | | | | | |
Options Written | | $ | — | | | $ | (85,449 | ) | | $— |
| | | | | | | | | | |
| | | |
Other Financial Instruments* | | | | | | | | | | |
Assets | | | | | | | | | | |
Futures Contracts | | $ | 45,047 | | | $ | — | | | $— |
OTC Forward Foreign Currency Exchange Contracts | | | — | | | | 450,911 | | | — |
Centrally Cleared Interest Rate Swap Agreements | | | — | | | | 765,691 | | | — |
OTC Interest Rate Swap Agreements | | | — | | | | 30,697 | | | — |
| | | | | | | | | | |
| | | |
Total | | $ | 45,047 | | | $ | 1,247,299 | | | $— |
| | | | | | | | | | |
| | | |
Liabilities | | | | | | | | | | |
OTC Forward Foreign Currency Exchange Contracts | | $ | — | | | $ | (568,114 | ) | | $— |
See Notes to Financial Statements.
PGIM Emerging Markets Debt Local Currency Fund 41
Schedule of Investments (continued)
as of October 31, 2021
| | | | | | | | | | |
| | | Level 1 | | | Level 2 | | | Level 3 |
| | | |
Other Financial Instruments* (continued) | | | | | | | | | | |
Liabilities (continued) | | | | | | | | | | |
Centrally Cleared Interest Rate Swap Agreements | | $ | — | | | $ | (832,305 | ) | | $— |
OTC Interest Rate Swap Agreements | | | — | | | | (95,905 | ) | | — |
| | | | | | | | | | |
| | | |
Total | | $ | — | | | $ | (1,496,324 | ) | | $— |
| | | | | | | | | | |
| * | Other financial instruments are derivative instruments not reflected in the Schedule of Investments, such as futures, forwards and centrally cleared swap contracts, which are recorded at the unrealized appreciation (depreciation) on the instrument, and OTC swap contracts which are recorded at fair value. |
Industry Classification:
The industry classification of investments and other assets in excess of liabilities shown as a percentage of net assets as of October 31, 2021 were as follows (unaudited):
| | | | |
Sovereign Bonds | | | 87.4 | % |
Investment Companies | | | 2.2 | |
Telecommunications | | | 1.6 | |
Multi-National | | | 1.5 | |
Affiliated Mutual Funds (0.4% represents investments purchased with collateral from securities on loan) | | | 1.4 | |
Foreign Treasury Obligation | | | 1.1 | |
Oil & Gas | | | 0.7 | |
Chemicals | | | 0.4 | |
Lodging | | | 0.4 | |
| | | | |
Electric | | | 0.3 | % |
Retail | | | 0.3 | |
Options Purchased | | | 0.3 | |
| | | | |
| |
| | | 97.6 | |
Options Written | | | (0.1 | ) |
Other assets in excess of liabilities | | | 2.5 | |
| | | | |
| |
| | | 100.0 | % |
| | | | |
Effects of Derivative Instruments on the Financial Statements and Primary Underlying Risk Exposure:
The Fund invested in derivative instruments during the reporting period. The primary types of risk associated with these derivative instruments are foreign exchange contracts risk and interest rate contracts risk. See the Notes to Financial Statements for additional detail regarding these derivative instruments and their risks. The effect of such derivative instruments on the Fund’s financial position and financial performance as reflected in the Statement of Assets and Liabilities and Statement of Operations is presented in the summary below.
Fair values of derivative instruments as of October 31, 2021 as presented in the Statement of Assets and Liabilities:
| | | | | | | | | | | | |
| | | Asset Derivatives | | | Liability Derivatives | |
| | | | |
Derivatives not accounted for as hedging instruments, carried at fair value | | Statement of Assets and Liabilities Location | | Fair
Value | | | Statement of Assets and Liabilities Location | | Fair
Value | |
| | | | |
| Foreign exchange contracts | | Unaffiliated investments | | $ | 136,000 | | | Options written outstanding, at value | | $ | 85,449 | |
See Notes to Financial Statements.
42
| | | | | | | | | | | | | | | | |
| | | Asset Derivatives | | | Liability Derivatives | |
| | | | | | |
| | | | | | |
Derivatives not accounted for as hedging instruments, carried at fair value | | Statement of Assets and Liabilities Location | | | | Fair
Value | | | Statement of Assets and Liabilities Location | | | | Fair
Value | |
| | | | | | |
| Foreign exchange contracts | | Unrealized appreciation on OTC forward foreign currency exchange contracts | | | | $ | 450,911 | | | Unrealized depreciation on OTC forward foreign currency exchange contracts | | | | $ | 568,114 | |
| Interest rate contracts | | Due from/to broker-variation margin futures | | | | | 45,047 | * | | — | | | | | — | |
| Interest rate contracts | | Due from/to broker-variation margin swaps | | | | | 765,691 | * | | Due from/to broker-variation margin swaps | | | | | 832,305 | * |
| Interest rate contracts | | Premiums paid for OTC swap agreements | | | | | 97 | | | — | | | | | — | |
| Interest rate contracts | | Unrealized appreciation on OTC swap agreements | | | | | 30,600 | | | Unrealized depreciation on OTC swap agreements | | | | | 95,905 | |
| | | | | | | | | | | | | | | | |
| | | | | | |
| | | | | | $ | 1,428,346 | | | | | | | $ | 1,581,773 | |
| | | | | | | | | | | | | | | | |
| * | Includes cumulative appreciation (depreciation) as reported in the schedule of open futures and centrally cleared swap contracts. Only unsettled variation margin receivable (payable) is reported within the Statement of Assets and Liabilities. |
The effects of derivative instruments on the Statement of Operations for the year ended October 31, 2021 are as follows:
| | | | | | | | | | | | | | | | | | | | | | | | | |
| Amount of Realized Gain (Loss) on Derivatives Recognized in Income |
| | | | | |
Derivatives not accounted for as hedging instruments, carried at fair value | | Options Purchased(1) | | Options Written | | Futures | | Forward & Cross Currency Exchange Contracts | | Swaps |
| | | | | |
Foreign exchange contracts | | | $ | (126,591 | ) | | | $ | 430,665 | | | | $ | — | | | | $ | 734,556 | | | | $ | — | |
Interest rate contracts | | | | — | | | | | — | | | | | 20,770 | | | | | — | | | | | 182,428 | |
| | | | | | | | | | | | | | | | | | | | | | | | | |
| | | | | |
Total | | | $ | (126,591 | ) | | | $ | 430,665 | | | | $ | 20,770 | | | | $ | 734,556 | | | | $ | 182,428 | |
| | | | | | | | | | | | | | | | | | | | | | | | | |
| (1) | Included in net realized gain (loss) on investment transactions in the Statement of Operations. |
See Notes to Financial Statements.
PGIM Emerging Markets Debt Local Currency Fund 43
Schedule of Investments (continued)
as of October 31, 2021
| | | | | | | | | | | | | | | | | | | | | | | | | |
| Change in Unrealized Appreciation (Depreciation) on Derivatives Recognized in Income |
| | | | | |
Derivatives not accounted for as hedging instruments, carried at fair value | | Options Purchased(2) | | Options Written | | Futures | | Forward & Cross Currency Exchange Contracts | | Swaps |
| | | | | |
Foreign exchange contracts | | | $ | 10,086 | | | | $ | 4,685 | | | | $ | — | | | | $ | (146,056 | ) | | | $ | — | |
Interest rate contracts | | | | — | | | | | — | | | | | 37,843 | | | | | — | | | | | (463,247 | ) |
| | | | | | | | | | | | | | | | | | | | | | | | | |
| | | | | |
Total | | | $ | 10,086 | | | | $ | 4,685 | | | | $ | 37,843 | | | | $ | (146,056 | ) | | | $ | (463,247 | ) |
| | | | | | | | | | | | | | | | | | | | | | | | | |
| (2) | Included in net change in unrealized appreciation (depreciation) on investments in the Statement of Operations. |
For the year ended October 31, 2021, the Fund’s average volume of derivative activities is as follows:
| | | | | | | | |
Options Purchased(1) | | Options Written(2) | | Futures Contracts— Long Positions(2) | | Futures Contracts— Short Positions(2) | | Forward Foreign Currency Exchange Contracts— Purchased(3) |
| | | | |
$48,502 | | $6,904,353 | | $98,831 | | $4,798,543 | | $47,103,368 |
| | | | | | | | |
Forward Foreign Currency Exchange Contracts - Sold(3) | | | | Cross Currency Exchange Contracts(4) | | | | Interest Rate Swap Agreements(2) |
| | | | |
$34,173,815 | | | | $373,046 | | | | $31,401,527 |
| (2) | Notional Amount in USD. |
| (3) | Value at Settlement Date. |
Average volume is based on average quarter end balances as noted for the year ended October 31, 2021.
Financial Instruments/Transactions—Summary of Offsetting and Netting Arrangements:
The Fund invested in OTC derivatives and entered into financial instruments/transactions during the reporting period that are either offset in accordance with current requirements or are subject to enforceable master netting arrangements or similar agreements that permit offsetting. The information about offsetting and related netting arrangements for OTC derivatives and financial instruments/transactions where the legal right to set-off exists is presented in the summary below.
Offsetting of financial instrument/transaction assets and liabilities:
| | | | | | | | | | | | | | | | | | | | | | | | | | |
Description | | | | Gross Market
Value of
Recognized
Assets/(Liabilities) | | | | Collateral
Pledged/(Received)(2) | | | | Net
Amount |
| | | | | | | | | | | | | |
Securities on Loan | | | | | | $159,312 | | | | | | | | | | $(159,312) | | | | | | | | $— | | |
| | | | | | | | | | | | | | | | | | | | | | | | | | |
See Notes to Financial Statements.
44
Offsetting of OTC derivative assets and liabilities:
| | | | | | | | | | | | | | | | | | | | | | | | | |
Counterparty | | Gross Amounts of Recognized Assets(1) | | Gross Amounts of Recognized Liabilities(1) | | Net Amounts of Recognized Assets/(Liabilities) | | Collateral Pledged/(Received)(2) | | Net Amount |
| | | | | |
Bank of America, N.A. | | | $ | 4,721 | | | | $ | (8,991 | ) | | | $ | (4,270 | ) | | | $ | — | | | | $ | (4,270 | ) |
Barclays Bank PLC | | | | 92,834 | | | | | (51,580 | ) | | | | 41,254 | | | | | — | | | | | 41,254 | |
BNP Paribas S.A. | | | | 33,661 | | | | | (11,624 | ) | | | | 22,037 | | | | | — | | | | | 22,037 | |
Citibank, N.A. | | | | 59,966 | | | | | (99,048 | ) | | | | (39,082 | ) | | | | — | | | | | (39,082 | ) |
Credit Suisse International | | | | 9,155 | | | | | (167,409 | ) | | | | (158,254 | ) | | | | — | | | | | (158,254 | ) |
Deutsche Bank AG | | | | — | | | | | (1,432 | ) | | | | (1,432 | ) | | | | — | | | | | (1,432 | ) |
Goldman Sachs International | | | | 103,993 | | | | | (187,317 | ) | | | | (83,324 | ) | | | | — | | | | | (83,324 | ) |
HSBC Bank PLC | | | | 119,972 | | | | | (14,736 | ) | | | | 105,236 | | | | | — | | | | | 105,236 | |
JPMorgan Chase Bank, N.A. | | | | 68,584 | | | | | (85,003 | ) | | | | (16,419 | ) | | | | — | | | | | (16,419 | ) |
Morgan Stanley & Co. International PLC | | | | 100,919 | | | | | (94,426 | ) | | | | 6,493 | | | | | — | | | | | 6,493 | |
Standard Chartered Bank | | | | 19,673 | | | | | (12,610 | ) | | | | 7,063 | | | | | — | | | | | 7,063 | |
UBS AG | | | | 4,130 | | | | | (15,292 | ) | | | | (11,162 | ) | | | | — | | | | | (11,162 | ) |
| | | | | | | | | | | | | | | | | | | | | | | | | |
| | | | | |
| | | $ | 617,608 | | | | $ | (749,468 | ) | | | $ | (131,860 | ) | | | $ | — | | | | $ | (131,860 | ) |
| | | | | | | | | | | | | | | | | | | | | | | | | |
| (1) | Includes unrealized appreciation/(depreciation) on swaps and forwards, premiums paid/(received) on swap agreements and market value of purchased and written options, as represented on the Statement of Assets and Liabilities. |
| (2) | Collateral amount disclosed by the Fund is limited to the market value of financial instruments/transactions and the Fund’s OTC derivative exposure by counterparty. |
See Notes to Financial Statements.
PGIM Emerging Markets Debt Local Currency Fund 45
Statement of Assets and Liabilities
as of October 31, 2021
| | | | |
| |
Assets | | | | |
| |
Investments at value, including securities on loan of $159,312: | | | | |
Unaffiliated investments (cost $56,856,021) | | $ | 53,840,820 | |
Affiliated investments (cost $806,125) | | | 806,104 | |
Cash | | | 28,825 | |
Foreign currency, at value (cost $136,665) | | | 136,859 | |
Dividends and interest receivable | | | 901,752 | |
Deposit with broker for centrally cleared/exchange-traded derivatives | | | 720,000 | |
Unrealized appreciation on OTC forward foreign currency exchange contracts | | | 450,911 | |
Receivable for investments sold | | | 208,375 | |
Receivable for Fund shares sold | | | 88,854 | |
Tax reclaim receivable | | | 84,895 | |
Unrealized appreciation on OTC swap agreements | | | 30,600 | |
Due from broker—variation margin swaps | | | 21,282 | |
Due from broker—variation margin futures | | | 1,709 | |
Due from Manager | | | 919 | |
Premiums paid for OTC swap agreements | | | 97 | |
Prepaid expenses and other assets | | | 9,202 | |
| | | | |
| |
Total Assets | | | 57,331,204 | |
| | | | |
| |
Liabilities | | | | |
| |
Unrealized depreciation on OTC forward foreign currency exchange contracts | | | 568,114 | |
Payable to broker for collateral for securities on loan | | | 219,273 | |
Payable for Fund shares purchased | | | 190,260 | |
Accrued expenses and other liabilities | | | 112,014 | |
Unrealized depreciation on OTC swap agreements | | | 95,905 | |
Options written outstanding, at value (premiums received $85,437) | | | 85,449 | |
Payable for investments purchased | | | 74,280 | |
Distribution fee payable | | | 926 | |
Directors’ fees payable | | | 923 | |
Affiliated transfer agent fee payable | | | 602 | |
Dividends payable | | | 111 | |
| | | | |
| |
Total Liabilities | | | 1,347,857 | |
| | | | |
| |
Net Assets | | $ | 55,983,347 | |
| | | | |
| |
| | | | | |
| |
Net assets were comprised of: | | | | |
Common stock, at par | | $ | 102 | |
Paid-in capital in excess of par | | | 65,373,379 | |
Total distributable earnings (loss) | | | (9,390,134 | ) |
| | | | |
| |
Net assets, October 31, 2021 | | $ | 55,983,347 | |
| | | | |
See Notes to Financial Statements.
46
| | | | | | | | |
| | |
Class A | | | | | | | | |
| | |
Net asset value and redemption price per share, ($ 3,488,852 ÷ 640,147 shares of common stock issued and outstanding) | | $ | 5.45 | | | | | |
Maximum sales charge (3.25% of offering price) | | | 0.18 | | | | | |
| | | | | | | | |
| | |
Maximum offering price to public | | $ | 5.63 | | | | | |
| | | | | | | | |
| | |
Class C | | | | | | | | |
| | |
Net asset value, offering price and redemption price per share, ($ 190,393 ÷ 34,688 shares of common stock issued and outstanding) | | $ | 5.49 | | | | | |
| | | | | | | | |
| | |
Class Z | | | | | | | | |
| | |
Net asset value, offering price and redemption price per share, ($ 49,067,311 ÷ 8,920,502 shares of common stock issued and outstanding) | | $ | 5.50 | | | | | |
| | | | | | | | |
| | |
Class R6 | | | | | | | | |
| | |
Net asset value, offering price and redemption price per share, ($ 3,236,791 ÷ 588,906 shares of common stock issued and outstanding) | | $ | 5.50 | | | | | |
| | | | | | | | |
See Notes to Financial Statements.
PGIM Emerging Markets Debt Local Currency Fund 47
Statement of Operations
Year Ended October 31, 2021
| | | | |
Net Investment Income (Loss) | | | | |
| |
Income | | | | |
Interest income (net of $132,152 foreign withholding tax) | | $ | 3,201,365 | |
Affiliated dividend income | | | 3,246 | |
Income from securities lending, net (including affiliated income of $250) | | | 617 | |
| | | | |
| |
Total income | | | 3,205,228 | |
| | | | |
| |
Expenses | | | | |
Management fee | | | 426,964 | |
Distribution fee(a) | | | 13,180 | |
Custodian and accounting fees | | | 91,844 | |
Transfer agent’s fees and expenses (including affiliated expense of $3,625)(a) | | | 87,900 | |
Audit fee | | | 65,732 | |
Registration fees(a) | | | 42,511 | |
Legal fees and expenses | | | 20,294 | |
Shareholders’ reports | | | 10,450 | |
Directors’ fees | | | 10,360 | |
Miscellaneous | | | 30,306 | |
| | | | |
| |
Total expenses | | | 799,541 | |
Less: Fee waiver and/or expense reimbursement(a) | | | (307,049 | ) |
| | | | |
| |
Net expenses | | | 492,492 | |
| | | | |
| |
Net investment income (loss) | | | 2,712,736 | |
| | | | |
| |
Realized And Unrealized Gain (Loss) On Investment And Foreign Currency Transactions | | | | |
| |
Net realized gain (loss) on: | | | | |
Investment transactions (including affiliated of $(96)) | | | (687,544 | ) |
Futures transactions | | | 20,770 | |
Forward and cross currency contract transactions | | | 734,556 | |
Options written transactions | | | 430,665 | |
Swap agreement transactions | | | 182,428 | |
Foreign currency transactions | | | (694,931 | ) |
| | | | |
| |
| | | (14,056 | ) |
| | | | |
Net change in unrealized appreciation (depreciation) on: | | | | |
Investments (including affiliated of $(21)) | | | (462,424 | ) |
Futures | | | 37,843 | |
Forward currency contracts | | | (146,056 | ) |
Options written | | | 4,685 | |
Swap agreements | | | (463,247 | ) |
Foreign currencies | | | 54,760 | |
| | | | |
| |
| | | (974,439 | ) |
| | | | |
| |
Net gain (loss) on investment and foreign currency transactions | | | (988,495 | ) |
| | | | |
| |
Net Increase (Decrease) In Net Assets Resulting From Operations | | $ | 1,724,241 | |
| | | | |
See Notes to Financial Statements.
48
| (a) | Class specific expenses and waivers were as follows: |
| | | | | | | | | | | | | | | | |
| | | Class A | | Class C | | Class Z | | Class R6 |
| | | | |
Distribution fee | | | 9,874 | | | | 3,306 | | | | — | | | | — | |
Transfer agent’s fees and expenses | | | 5,416 | | | | 893 | | | | 81,459 | | | | 132 | |
Registration fees | | | 11,177 | | | | 7,677 | | | | 13,480 | | | | 10,177 | |
Fee waiver and/or expense reimbursement | | | (21,271 | ) | | | (8,979 | ) | | | (260,976 | ) | | | (15,823 | ) |
See Notes to Financial Statements.
PGIM Emerging Markets Debt Local Currency Fund 49
Statements of Changes in Net Assets
| | | | | | | | |
| |
| | | Year Ended October 31, | |
| | | | |
| | |
| | | 2021 | | | 2020 | |
| | |
Increase (Decrease) in Net Assets | | | | | | | | |
| | |
Operations | | | | | | | | |
Net investment income (loss) | | $ | 2,712,736 | | | $ | 2,855,666 | |
Net realized gain (loss) on investment and foreign currency transactions | | | (14,056 | ) | | | (4,985,868 | ) |
Net change in unrealized appreciation (depreciation) on investments and foreign currencies | | | (974,439 | ) | | | (3,815,388 | ) |
| | | | | | | | |
| | |
Net increase (decrease) in net assets resulting from operations | | | 1,724,241 | | | | (5,945,590 | ) |
| | | | | | | | |
| | |
Dividends and Distributions | | | | | | | | |
Distributions from distributable earnings | | | | | | | | |
Class A | | | (171,094 | ) | | | — | |
Class C | | | (11,953 | ) | | | — | |
Class Z | | | (2,832,895 | ) | | | — | |
Class R6 | | | (77,566 | ) | | | — | |
| | | | | | | | |
| | |
| | | (3,093,508 | ) | | | — | |
| | | | | | | | |
Tax return of capital distributions | | | | | | | | |
Class A | | | — | | | | (167,490 | ) |
Class C | | | — | | | | (19,547 | ) |
Class Z | | | — | | | | (2,965,432 | ) |
Class R6 | | | — | | | | (2,195 | ) |
| | | | | | | | |
| | |
| | | — | | | | (3,154,664 | ) |
| | | | | | | | |
Fund share transactions (Net of share conversions) | | | | | | | | |
Net proceeds from shares sold | | | 18,589,941 | | | | 25,439,494 | |
Net asset value of shares issued in reinvestment of dividends and distributions | | | 3,084,833 | | | | 3,077,906 | |
Cost of shares purchased | | | (26,083,180 | ) | | | (30,057,181 | ) |
| | | | | | | | |
| | |
Net increase (decrease) in net assets from Fund share transactions | | | (4,408,406 | ) | | | (1,539,781 | ) |
| | | | | | | | |
| | |
Total increase (decrease) | | | (5,777,673 | ) | | | (10,640,035 | ) |
| | |
Net Assets: | | | | | | | | |
| | |
Beginning of year | | | 61,761,020 | | | | 72,401,055 | |
| | | | | | | | |
| | |
End of year | | $ | 55,983,347 | | | $ | 61,761,020 | |
| | | | | | | | |
See Notes to Financial Statements.
50
Financial Highlights
| | | | | | | | | | | | | | | | | | | | |
Class A Shares | |
| | | Year Ended October 31, | |
| | | | | | |
| | | 2021 | | | 2020 | | | 2019 | | | 2018 | | | 2017 | |
| | | | | | |
Per Share Operating Performance(a): | | | | | | | | | | | | | | | | | | | | |
Net Asset Value, Beginning of Year | | | $5.57 | | | | $6.07 | | | | $5.52 | | | | $6.40 | | | | $6.44 | |
Income (loss) from investment operations: | | | | | | | | | | | | | | | | | | | | |
Net investment income (loss) | | | 0.22 | | | | 0.24 | | | | 0.30 | | | | 0.33 | | | | 0.35 | |
Net realized and unrealized gain (loss) on investment and foreign currency transactions | | | (0.09 | ) | | | (0.47 | ) | | | 0.57 | | | | (0.86 | ) | | | (0.02 | ) |
Total from investment operations | | | 0.13 | | | | (0.23 | ) | | | 0.87 | | | | (0.53 | ) | | | 0.33 | |
Less Dividends and Distributions: | | | | | | | | | | | | | | | | | | | | |
Dividends from net investment income* | | | (0.25 | ) | | | - | | | | (0.31 | ) | | | - | | | | (0.15 | ) |
Tax return of capital distributions | | | - | | | | (0.27 | ) | | | (0.01 | ) | | | (0.35 | ) | | | (0.22 | ) |
Total dividends and distributions | | | (0.25 | ) | | | (0.27 | ) | | | (0.32 | ) | | | (0.35 | ) | | | (0.37 | ) |
Net asset value, end of year | | | $5.45 | | | | $5.57 | | | | $6.07 | | | | $5.52 | | | | $6.40 | |
Total Return(b): | | | 2.19 | % | | | (3.75 | )% | | | 16.14 | % | | | (8.68 | )% | | | 5.36 | % |
| | | | | | | | | | | | | | | | | | | | | |
Ratios/Supplemental Data: | | | | | | | | | | | | | | | | | | | | |
Net assets, end of year (000) | | | $3,489 | | | | $3,853 | | | | $3,692 | | | | $3,146 | | | | $3,085 | |
Average net assets (000) | | | $3,950 | | | | $3,518 | | | | $3,223 | | | | $4,105 | | | | $3,639 | |
Ratios to average net assets(c)(d): | | | | | | | | | | | | | | | | | | | | |
Expenses after waivers and/or expense reimbursement | | | 1.13 | % | | | 1.13 | % | | | 1.13 | % | | | 1.13 | % | | | 1.13 | % |
Expenses before waivers and/or expense reimbursement | | | 1.67 | % | | | 2.04 | % | | | 2.03 | % | | | 2.16 | % | | | 2.15 | % |
Net investment income (loss) | | | 3.75 | % | | | 4.24 | % | | | 5.13 | % | | | 5.34 | % | | | 5.42 | % |
Portfolio turnover rate(e) | | | 35 | % | | | 64 | % | | | 69 | % | | | 113 | % | | | 186 | % |
| * | Dividends from net investment income may include other items that are ordinary income for tax purposes. |
| (a) | Calculated based on average shares outstanding during the year. |
| (b) | Total return does not consider the effects of sales loads. Total return is calculated assuming a purchase of a share on the first day and a sale on the last day of each year reported and includes reinvestment of dividends and distributions, if any. Total returns may reflect adjustments to conform to GAAP. |
| (c) | Does not include expenses of the underlying funds in which the Fund invests. |
| (d) | Effective November 1, 2017, class specific expenses include transfer agent fees and expenses and registration fees, which are charged to their respective share class. |
| (e) | The Fund’s portfolio turnover rate is calculated in accordance with regulatory requirements, without regard to transactions involving short-term investments and certain derivatives. If such transactions were included, the Fund’s portfolio turnover rate may be higher. |
See Notes to Financial Statements.
PGIM Emerging Markets Debt Local Currency Fund 51
Financial Highlights (continued)
| | | | | | | | | | | | | | | | | | | | |
Class C Shares | |
| | | Year Ended October 31, | |
| | | | | | |
| | | 2021 | | | 2020 | | | 2019 | | | 2018 | | | 2017 | |
| | | | | | |
Per Share Operating Performance(a): | | | | | | | | | | | | | | | | | | | | |
Net Asset Value, Beginning of Year | | | $5.61 | | | | $6.11 | | | | $5.56 | | | | $6.46 | | | | $6.49 | |
Income (loss) from investment operations: | | | | | | | | | | | | | | | | | | | | |
Net investment income (loss) | | | 0.18 | | | | 0.20 | | | | 0.26 | | | | 0.29 | | | | 0.30 | |
Net realized and unrealized gain (loss) on investment and foreign currency transactions | | | (0.09 | ) | | | (0.47 | ) | | | 0.57 | | | | (0.88 | ) | | | (0.01 | ) |
Total from investment operations | | | 0.09 | | | | (0.27 | ) | | | 0.83 | | | | (0.59 | ) | | | 0.29 | |
Less Dividends and Distributions: | | | | | | | | | | | | | | | | | | | | |
Dividends from net investment income* | | | (0.21 | ) | | | - | | | | (0.27 | ) | | | - | | | | (0.13 | ) |
Tax return of capital distributions | | | - | | | | (0.23 | ) | | | (0.01 | ) | | | (0.31 | ) | | | (0.19 | ) |
Total dividends and distributions | | | (0.21 | ) | | | (0.23 | ) | | | (0.28 | ) | | | (0.31 | ) | | | (0.32 | ) |
Net asset value, end of year | | | $5.49 | | | | $5.61 | | | | $6.11 | | | | $5.56 | | | | $6.46 | |
Total Return(b): | | | 1.44 | % | | | (4.41 | )% | | | 15.18 | % | | | (9.61 | )% | | | 4.66 | % |
| | | | | | | | | | | | | | | | | |
Ratios/Supplemental Data: | | | | | | | | | | | | | | | | | | | | |
Net assets, end of year (000) | | | $190 | | | | $466 | | | | $579 | | | | $538 | | | | $718 | |
Average net assets (000) | | | $331 | | | | $484 | | | | $566 | | | | $672 | | | | $649 | |
Ratios to average net assets(c)(d): | | | | | | | | | | | | | | | | | | | | |
Expenses after waivers and/or expense reimbursement | | | 1.88 | % | | | 1.88 | % | | | 1.88 | % | | | 1.88 | % | | | 1.88 | % |
Expenses before waivers and/or expense reimbursement | | | 4.60 | % | | | 5.82 | % | | | 4.82 | % | | | 4.89 | % | | | 2.88 | % |
Net investment income (loss) | | | 3.00 | % | | | 3.54 | % | | | 4.37 | % | | | 4.56 | % | | | 4.63 | % |
Portfolio turnover rate(e) | | | 35 | % | | | 64 | % | | | 69 | % | | | 113 | % | | | 186 | % |
| * | Dividends from net investment income may include other items that are ordinary income for tax purposes. |
| (a) | Calculated based on average shares outstanding during the year. |
| (b) | Total return does not consider the effects of sales loads. Total return is calculated assuming a purchase of a share on the first day and a sale on the last day of each year reported and includes reinvestment of dividends and distributions, if any. Total returns may reflect adjustments to conform to GAAP. |
| (c) | Does not include expenses of the underlying funds in which the Fund invests. |
| (d) | Effective November 1, 2017, class specific expenses include transfer agent fees and expenses and registration fees, which are charged to their respective share class. |
| (e) | The Fund’s portfolio turnover rate is calculated in accordance with regulatory requirements, without regard to transactions involving short-term investments and certain derivatives. If such transactions were included, the Fund’s portfolio turnover rate may be higher. |
See Notes to Financial Statements.
52
| | | | | | | | | | | | | | | | | | | | |
| |
Class Z Shares | |
| | |
| | | Year Ended October 31, | |
| | | | | | |
| | | 2021 | | | 2020 | | | 2019 | | | 2018 | | | 2017 | |
| | | | | | |
Per Share Operating Performance(a): | | | | | | | | | | | | | | | | | | | | |
Net Asset Value, Beginning of Year | | | $5.62 | | | | $6.13 | | | | $5.57 | | | | $6.48 | | | | $6.50 | |
Income (loss) from investment operations: | | | | | | | | | | | | | | | | | | | | |
Net investment income (loss) | | | 0.24 | | | | 0.27 | | | | 0.32 | | | | 0.34 | | | | 0.36 | |
| Net realized and unrealized gain (loss) on investment and foreign currency transactions | | | (0.08 | ) | | | (0.48 | ) | | | 0.58 | | | | (0.88 | ) | | | 0.01 | |
Total from investment operations | | | 0.16 | | | | (0.21 | ) | | | 0.90 | | | | (0.54 | ) | | | 0.37 | |
Less Dividends and Distributions: | | | | | | | | | | | | | | | | | | | | |
Dividends from net investment income* | | | (0.28 | ) | | | - | | | | (0.33 | ) | | | - | | | | (0.16 | ) |
Tax return of capital distributions | | | - | | | | (0.30 | ) | | | (0.01 | ) | | | (0.37 | ) | | | (0.23 | ) |
Total dividends and distributions | | | (0.28 | ) | | | (0.30 | ) | | | (0.34 | ) | | | (0.37 | ) | | | (0.39 | ) |
Net asset value, end of year | | | $5.50 | | | | $5.62 | | | | $6.13 | | | | $5.57 | | | | $6.48 | |
Total Return(b): | | | 2.63 | % | | | (3.45 | )% | | | 16.50 | % | | | (8.83 | )% | | | 5.85 | % |
| | | | | | | | | | | | | | | | | | | | | |
Ratios/Supplemental Data: | | | | | | | | | | | | | | | | | | | | |
Net assets, end of year (000) | | | $49,067 | | | | $57,392 | | | | $68,101 | | | | $55,000 | | | | $27,020 | |
Average net assets (000) | | | $59,794 | | | | $56,989 | | | | $63,219 | | | | $49,644 | | | | $26,437 | |
Ratios to average net assets(c)(d): | | | | | | | | | | | | | | | | | | | | |
Expenses after waivers and/or expense reimbursement | | | 0.72 | % | | | 0.74 | % | | | 0.88 | % | | | 0.88 | % | | | 0.88 | % |
Expenses before waivers and/or expense reimbursement | | | 1.16 | % | | | 1.27 | % | | | 1.31 | % | | | 1.41 | % | | | 1.88 | % |
Net investment income (loss) | | | 4.16 | % | | | 4.72 | % | | | 5.35 | % | | | 5.50 | % | | | 5.58 | % |
Portfolio turnover rate(e) | | | 35 | % | | | 64 | % | | | 69 | % | | | 113 | % | | | 186 | % |
| * | Dividends from net investment income may include other items that are ordinary income for tax purposes. |
| (a) | Calculated based on average shares outstanding during the year. |
| (b) | Total return is calculated assuming a purchase of a share on the first day and a sale on the last day of each year reported and includes reinvestment of dividends and distributions, if any. Total returns may reflect adjustments to conform to GAAP. |
| (c) | Does not include expenses of the underlying funds in which the Fund invests. |
| (d) | Effective November 1, 2017, class specific expenses include transfer agent fees and expenses and registration fees, which are charged to their respective share class. |
| (e) | The Fund’s portfolio turnover rate is calculated in accordance with regulatory requirements, without regard to transactions involving short-term investments and certain derivatives. If such transactions were included, the Fund’s portfolio turnover rate may be higher. |
See Notes to Financial Statements.
PGIM Emerging Markets Debt Local Currency Fund 53
Financial Highlights (continued)
| | | | | | | | | | | | | | | | | | | | |
| |
Class R6 Shares | |
| | |
| | | Year Ended October 31, | |
| | | | | | |
| | | 2021 | | | 2020 | | | 2019 | | | 2018 | | | 2017 | |
| | | | | | |
Per Share Operating Performance(a): | | | | | | | | | | | | | | | | | | | | |
Net Asset Value, Beginning of Year | | | $5.62 | | | | $6.12 | | | | $5.56 | | | | $6.47 | | | | $6.50 | |
Income (loss) from investment operations: | | | | | | | | | | | | | | | | | | | | |
Net investment income (loss) | | | 0.25 | | | | 0.27 | | | | 0.31 | | | | 0.36 | | | | 0.37 | |
| Net realized and unrealized gain (loss) on investment and foreign currency transactions | | | (0.09 | ) | | | (0.47 | ) | | | 0.58 | | | | (0.89 | ) | | | - | (b) |
Total from investment operations | | | 0.16 | | | | (0.20 | ) | | | 0.89 | | | | (0.53 | ) | | | 0.37 | |
Less Dividends and Distributions: | | | | | | | | | | | | | | | | | | | | |
Dividends from net investment income* | | | (0.28 | ) | | | - | | | | (0.32 | ) | | | - | | | | (0.16 | ) |
Tax return of capital distributions | | | - | | | | (0.30 | ) | | | (0.01 | ) | | | (0.38 | ) | | | (0.24 | ) |
Total dividends and distributions | | | (0.28 | ) | | | (0.30 | ) | | | (0.33 | ) | | | (0.38 | ) | | | (0.40 | ) |
Net asset value, end of year | | | $5.50 | | | | $5.62 | | | | $6.12 | | | | $5.56 | | | | $6.47 | |
Total Return(c): | | | 2.70 | % | | | (3.24 | )% | | | 16.41 | % | | | (8.63 | )% | | | 5.82 | % |
| | | | | | | | | | | | | | | | | | | | | |
Ratios/Supplemental Data: | | | | | | | | | | | | | | | | | | | | |
Net assets, end of year (000) | | | $3,237 | | | | $50 | | | | $29 | | | | $1 | | | | $1 | |
Average net assets (000) | | | $1,613 | | | | $42 | | | | $15 | | | | $1 | | | | $1 | |
Ratios to average net assets(d)(e): | | | | | | | | | | | | | | | | | | | | |
Expenses after waivers and/or expense reimbursement | | | 0.65 | % | | | 0.67 | % | | | 0.88 | % | | | 0.88 | % | | | 0.88 | % |
Expenses before waivers and/or expense reimbursement | | | 1.63 | % | | | 40.50 | % | | | 92.22 | % | | | 1,595.87 | % | | | 1.83 | % |
Net investment income (loss) | | | 4.27 | % | | | 4.64 | % | | | 5.20 | % | | | 5.73 | % | | | 5.73 | % |
Portfolio turnover rate(f) | | | 35 | % | | | 64 | % | | | 69 | % | | | 113 | % | | | 186 | % |
| * | Dividends from net investment income may include other items that are ordinary income for tax purposes. |
| (a) | Calculated based on average shares outstanding during the year. |
| (b) | Amount rounds to zero. |
| (c) | Total return is calculated assuming a purchase of a share on the first day and a sale on the last day of each year reported and includes reinvestment of dividends and distributions, if any. Total returns may reflect adjustments to conform to GAAP. |
| (d) | Does not include expenses of the underlying funds in which the Fund invests. |
| (e) | Effective November 1, 2017, class specific expenses include transfer agent fees and expenses and registration fees, which are charged to their respective share class. |
| (f) | The Fund’s portfolio turnover rate is calculated in accordance with regulatory requirements, without regard to transactions involving short-term investments and certain derivatives. If such transactions were included, the Fund’s portfolio turnover rate may be higher. |
See Notes to Financial Statements.
54
Notes to Financial Statements
Prudential World Fund, Inc. (the “Registered Investment Company” or “RIC”) is registered under the Investment Company Act of 1940, as amended (“1940 Act”), as an open-end management investment company. The RIC is organized as a Maryland Corporation and currently consists of seven separate funds: PGIM Emerging Markets Debt Hard Currency Fund, PGIM Emerging Markets Debt Local Currency Fund, PGIM Jennison Emerging Markets Equity Opportunities Fund, PGIM Jennison Global Infrastructure Fund, PGIM Jennison Global Opportunities Fund, PGIM Jennison International Opportunities Fund and PGIM QMA International Equity Fund. These financial statements relate only to the PGIM Emerging Markets Debt Local Currency Fund (the “Fund”). The Fund is classified as a non-diversified fund for purposes of the 1940 Act.
The investment objective of the Fund is total return, through a combination of current income and capital appreciation.
The Fund follows the investment company accounting and reporting guidance of the Financial Accounting Standards Board (“FASB”) Accounting Standard Codification (“ASC”) Topic 946 Financial Services — Investment Companies. The following is a summary of significant accounting policies followed by the Fund in the preparation of its financial statements. The policies conform to U.S. generally accepted accounting principles (“GAAP”). The Fund consistently follows such policies in the preparation of its financial statements.
Securities Valuation: The Fund holds securities and other assets and liabilities that are fair valued as of the close of each day (generally, 4:00 PM Eastern time) the New York Stock Exchange (“NYSE”) is open for trading. As described in further detail below, the Fund’s investments are valued daily based on a number of factors, including the type of investment and whether market quotations are readily available. The RIC’s Board of Directors (the “Board”) has adopted valuation procedures for security valuation under which fair valuation responsibilities have been delegated to PGIM Investments LLC (“PGIM Investments” or the “Manager”). Pursuant to the Board’s delegation, the Manager has established a Valuation Committee responsible for supervising the fair valuation of portfolio securities and other assets and liabilities. The valuation procedures permit the Fund to utilize independent pricing vendor services, quotations from market makers, and alternative valuation methods when market quotations are either not readily available or not deemed representative of fair value. Fair value is the price that would be received to sell an asset or paid to transfer a liability in an orderly transaction between market participants on the measurement date. A record of the Valuation Committee’s actions is subject to the Board’s review at its first quarterly meeting following the quarter in which such actions take place.
PGIM Emerging Markets Debt Local Currency Fund 55
Notes to Financial Statements (continued)
For the fiscal reporting year-end, securities and other assets and liabilities were fair valued at the close of the last U.S. business day. Trading in certain foreign securities may occur when the NYSE is closed (including weekends and holidays). Because such foreign securities trade in markets that are open on weekends and U.S. holidays, the values of some of the Fund’s foreign investments may change on days when investors cannot purchase or redeem Fund shares.
Various inputs determine how the Fund’s investments are valued, all of which are categorized according to the three broad levels (Level 1, 2, or 3) detailed in the Schedule of Investments and referred to herein as the “fair value hierarchy” in accordance with FASB ASC Topic 820 - Fair Value Measurements and Disclosures.
Common or preferred stocks, exchange-traded funds and derivative instruments, if applicable, that are traded on a national securities exchange are valued at the last sale price as of the close of trading on the applicable exchange where the security principally trades. Securities traded via NASDAQ are valued at the NASDAQ official closing price. To the extent these securities are valued at the last sale price or NASDAQ official closing price, they are classified as Level 1 in the fair value hierarchy. In the event that no sale or official closing price on valuation date exists, these securities are generally valued at the mean between the last reported bid and ask prices, or at the last bid price in the absence of an ask price. These securities are classified as Level 2 in the fair value hierarchy.
Investments in open-end funds (other than exchange-traded funds) are valued at their net asset values as of the close of the NYSE on the date of valuation. These securities are classified as Level 1 in the fair value hierarchy since they may be purchased or sold at their net asset values on the date of valuation.
Fixed income securities traded in the OTC market are generally classified as Level 2 in the fair value hierarchy. Such fixed income securities are typically valued using the market approach which generally involves obtaining data from an approved independent third-party vendor source. The Fund utilizes the market approach as the primary method to value securities when market prices of identical or comparable instruments are available. The third-party vendors’ valuation techniques used to derive the evaluated bid price are based on evaluating observable inputs, including but not limited to, yield curves, yield spreads, credit ratings, deal terms, tranche level attributes, default rates, cash flows, prepayment speeds, broker/dealer quotations and reported trades. Certain Level 3 securities are also valued using the market approach when obtaining a single broker quote or when utilizing transaction prices for identical securities that have been used in excess of five business days. During the reporting period, there were no changes to report with respect to the valuation approach and/or valuation techniques discussed above.
56
OTC and centrally cleared derivative instruments are generally classified as Level 2 in the fair value hierarchy. Such derivative instruments are typically valued using the market approach and/or income approach which generally involves obtaining data from an approved independent third-party vendor source. The Fund utilizes the market approach when quoted prices in broker-dealer markets are available but also includes consideration of alternative valuation approaches, including the income approach. In the absence of reliable market quotations, the income approach is typically utilized for purposes of valuing derivatives such as interest rate swaps based on a discounted cash flow analysis whereby the value of the instrument is equal to the present value of its future cash inflows or outflows. Such analysis includes projecting future cash flows and determining the discount rate (including the present value factors that affect the discount rate) used to discount the future cash flows. In addition, the third-party vendors’ valuation techniques used to derive the evaluated derivative price is based on evaluating observable inputs, including but not limited to, underlying asset prices, indices, spreads, interest rates and exchange rates. Certain derivatives may be classified as Level 3 when valued using the market approach by obtaining a single broker quote or when utilizing unobservable inputs in the income approach. During the reporting period, there were no changes to report with respect to the valuation approach and/or valuation techniques discussed above.
Securities and other assets that cannot be priced according to the methods described above are valued based on pricing methodologies approved by the Board. In the event that unobservable inputs are used when determining such valuations, the securities will be classified as Level 3 in the fair value hierarchy. Altering one or more unobservable inputs may result in a significant change to a Level 3 security’s fair value measurement.
When determining the fair value of securities, some of the factors influencing the valuation include: the nature of any restrictions on disposition of the securities; assessment of the general liquidity of the securities; the issuer’s financial condition and the markets in which it does business; the cost of the investment; the size of the holding and the capitalization of the issuer; the prices of any recent transactions or bids/offers for such securities or any comparable securities; any available analyst media or other reports or information deemed reliable by the Manager regarding the issuer or the markets or industry in which it operates. Using fair value to price securities may result in a value that is different from a security’s most recent closing price and from the price used by other unaffiliated mutual funds to calculate their net asset values.
Foreign Currency Translation: The books and records of the Fund are maintained in U.S. dollars. Foreign currency amounts are translated into U.S. dollars on the following basis:
(i) market value of investment securities, other assets and liabilities — at the exchange rate as of the valuation date;
(ii) purchases and sales of investment securities, income and expenses — at the rates of exchange prevailing on the respective dates of such transactions.
PGIM Emerging Markets Debt Local Currency Fund 57
Notes to Financial Statements (continued)
Although the net assets of the Fund are presented at the foreign exchange rates and market values at the close of the period, the Fund does not generally isolate that portion of the results of operations arising as a result of changes in the foreign exchange rates from the fluctuations arising from changes in the market prices of long-term portfolio securities held at the end of the period. Similarly, the Fund does not isolate the effect of changes in foreign exchange rates from the fluctuations arising from changes in the market prices of long-term portfolio securities sold during the period. Accordingly, holding period unrealized and realized foreign currency gains (losses) are included in the reported Net change in unrealized appreciation (depreciation) on investments and Net realized gains (losses) on investment transactions on the Statements of Operations. Notwithstanding the above, the Fund does isolate the effect of fluctuations in foreign currency exchange rates when determining the gain (loss) upon the sale or maturity of foreign currency denominated debt obligations; such amounts are included in net realized gains (losses) on foreign currency transactions.
Additionally, net realized gains (losses) on foreign currency transactions represent net foreign exchange gains (losses) from the disposition of holdings of foreign currencies, currency gains (losses) realized between the trade and settlement dates on investment transactions, and the difference between the amounts of interest, dividends and foreign withholding taxes recorded on the Fund’s books and the U.S. dollar equivalent amounts actually received or paid. Net unrealized currency gains (losses) arise from valuing foreign currency denominated assets and liabilities (other than investments) at period end exchange rates.
Forward and Cross Currency Contracts: A forward currency contract is a commitment to purchase or sell a foreign currency at a future date at a negotiated forward rate. The Fund enters into forward currency contracts, as defined in the prospectus, in order to hedge its exposure to changes in foreign currency exchange rates on its foreign portfolio holdings or on specific receivables and payables denominated in a foreign currency and to gain exposure to certain currencies. The contracts are valued daily at current forward exchange rates and any unrealized gain (loss) is included in net unrealized appreciation or depreciation on forward and cross currency contracts. Gain (loss) is realized on the settlement date of the contract equal to the difference between the settlement value of the original and negotiated forward contracts. This gain (loss), if any, is included in net realized gain (loss) on forward and cross currency contract transactions. Risks may arise upon entering into these contracts from the potential inability of the counterparties to meet the terms of their contracts. Forward currency contracts involve risks from currency exchange rate and credit risk in excess of the amounts reflected on the Statement of Assets and Liabilities. The Fund’s maximum risk of loss from counterparty credit risk is the net value of the cash flows to be received from the counterparty at the end of the contract’s life. A cross
58
currency contract is a forward contract where a specified amount of one foreign currency will be exchanged for a specified amount of another foreign currency.
Options: The Fund purchased and/or wrote options in order to hedge against adverse market movements or fluctuations in value caused by changes in prevailing interest rates, value of equities or foreign currency exchange rates with respect to securities or financial instruments which the Fund currently owns or intends to purchase. The Fund may also use options to gain additional market exposure. The Fund’s principal reason for writing options is to realize, through receipt of premiums, a greater current return than would be realized on the underlying security alone. When the Fund purchases an option, it pays a premium and an amount equal to that premium is recorded as an asset. When the Fund writes an option, it receives a premium and an amount equal to that premium is recorded as a liability. The asset or liability is adjusted daily to reflect the current market value of the option. If an option expires unexercised, the Fund realizes a gain (loss) to the extent of the premium received or paid. If an option is exercised, the premium received or paid is recorded as an adjustment to the proceeds from the sale or the cost of the purchase in determining whether the Fund has realized a gain (loss). The difference between the premium and the amount received or paid at the closing of a purchase or sale transaction is also treated as a realized gain (loss). Gain (loss) on purchased options is included in net realized gain (loss) on investment transactions. Gain (loss) on written options is presented separately as net realized gain (loss) on options written transactions.
The Fund, as writer of an option, may have no control over whether the underlying securities or financial instruments may be sold (called) or purchased (put). As a result, the Fund bears the market risk of an unfavorable change in the price of the security or financial instrument underlying the written option. The Fund, as purchaser of an OTC option, bears the risk of the potential inability of the counterparties to meet the terms of their contracts. With exchange-traded options contracts, there is minimal counterparty credit risk to the Fund since the exchanges’ clearinghouse acts as counterparty to all exchange-traded options and guarantees the options contracts against default.
When the Fund writes an option on a swap, an amount equal to any premium received by the Fund is recorded as a liability and is subsequently adjusted to the current market value of the written option on the swap. If a call option on a swap is exercised, the Fund becomes obligated to pay a fixed interest rate (noted as the strike price) and receive a variable interest rate on a notional amount. If a put option on a swap is exercised, the Fund becomes obligated to pay a variable interest rate and receive a fixed interest rate (noted as the strike price) on a notional amount. Premiums received from writing options on swaps that expire or are exercised are treated as realized gains upon the expiration or exercise of such options on swaps. The risk associated with writing put and call options on swaps is that the Fund will be obligated to be party to a swap agreement if an option on a swap is exercised.
Financial Futures Contracts: A financial futures contract is an agreement to purchase (long) or sell (short) an agreed amount of securities at a set price for delivery on a future date. Upon entering into a financial futures contract, the Fund is required to pledge to the broker
PGIM Emerging Markets Debt Local Currency Fund 59
Notes to Financial Statements (continued)
an amount of cash and/or other assets equal to a certain percentage of the contract amount. This amount is known as the “initial margin.” Subsequent payments, known as “variation margin,” are made or received by the Fund each day, depending on the daily fluctuations in the value of the underlying security. Such variation margin is recorded for financial statement purposes on a daily basis as unrealized gain (loss). When the contract expires or is closed, the gain (loss) is realized and is presented in the Statement of Operations as net realized gain (loss) on futures transactions.
The Fund invested in financial futures contracts in order to hedge its existing portfolio securities, or securities the Fund intends to purchase, against fluctuations in value caused by changes in prevailing interest rates. Should interest rates move unexpectedly, the Fund may not achieve the anticipated benefits of the financial futures contracts and may realize a loss. The use of futures transactions involves the risk of imperfect correlation in movements in the price of futures contracts, interest rates and the underlying hedged assets. Since futures contracts are exchange-traded, there is minimal counterparty credit risk to the Fund since the exchanges’ clearinghouse acts as counterparty to all exchange-traded futures and guarantees the futures contracts against default.
Swap Agreements: The Fund entered into certain types of swap agreements detailed in the disclosures below. A swap agreement is an agreement to exchange the return generated by one instrument for the return generated by another instrument. Swap agreements are negotiated in the OTC market and may be executed either directly with a counterparty (“OTC-traded”) or through a central clearing facility, such as a registered exchange. Swap agreements are valued daily at current market value and any change in value is included in the net unrealized appreciation or depreciation on swap agreements. Centrally cleared swaps pay or receive an amount known as “variation margin”, based on daily changes in the valuation of the swap contract. For OTC-traded, upfront premiums paid and received are shown as swap premiums paid and swap premiums received in the Statement of Assets and Liabilities. Risk of loss may exceed amounts recognized on the Statement of Assets and Liabilities. Swap agreements outstanding at period end, if any, are listed on the Schedule of Investments.
Interest Rate Swaps: Interest rate swaps represent an agreement between counterparties to exchange cash flows based on the difference between two interest rates, applied to a notional principal amount for a specified period. The Fund is subject to interest rate risk exposure in the normal course of pursuing its investment objective. The Fund used interest rate swaps to maintain its ability to generate steady cash flow by receiving a stream of fixed rate payments or to increase exposure to prevailing market rates by receiving floating rate payments. The Fund’s maximum risk of loss from counterparty credit risk is the discounted net present value of the cash flows to be received from the counterparty over the contract’s remaining life.
60
Master Netting Arrangements: The RIC, on behalf of the Fund, is subject to various Master Agreements, or netting arrangements, with select counterparties. These are agreements which a subadviser may have negotiated and entered into on behalf of all or a portion of the Fund. A master netting arrangement between the Fund and the counterparty permits the Fund to offset amounts payable by the Fund to the same counterparty against amounts to be received; and by the receipt of collateral from the counterparty by the Fund to cover the Fund’s exposure to the counterparty. However, there is no assurance that such mitigating factors are easily enforceable. In addition to master netting arrangements, the right to set-off exists when all the conditions are met such that each of the parties owes the other determinable amounts, the reporting party has the right to set-off the amount owed with the amount owed by the other party, the reporting party intends to set-off and the right of set-off is enforceable by law.
The RIC, on behalf of the Fund, is a party to International Swaps and Derivatives Association, Inc. (“ISDA”) Master Agreements with certain counterparties that govern OTC derivative and foreign exchange contracts entered into from time to time. The Master Agreements may contain provisions regarding, among other things, the parties’ general obligations, representations, agreements, collateral requirements, events of default and early termination. With respect to certain counterparties, in accordance with the terms of the Master Agreements, collateral posted to the Fund is held in a segregated account by the Fund’s custodian and with respect to those amounts which can be sold or re-pledged, is presented in the Schedule of Investments. Collateral pledged by the Fund is segregated by the Fund’s custodian and identified in the Schedule of Investments. Collateral can be in the form of cash or debt securities issued by the U.S. Government or related agencies or other securities as agreed to by the Fund and the applicable counterparty. Collateral requirements are determined based on the Fund’s net position with each counterparty. Termination events applicable to the Fund may occur upon a decline in the Fund’s net assets below a specified threshold over a certain period of time. Termination events applicable to counterparties may occur upon a decline in the counterparty’s long-term and short-term credit ratings below a specified level. In each case, upon occurrence, the other party may elect to terminate early and cause settlement of all derivative and foreign exchange contracts outstanding, including the payment of any losses and costs resulting from such early termination, as reasonably determined by the terminating party. Any decision by one or more of the Fund’s counterparties to elect early termination could impact the Fund’s future derivative activity.
In addition to each instrument’s primary underlying risk exposure (e.g. interest rate, credit, equity or foreign exchange, etc.), swap agreements involve, to varying degrees, elements of credit, market and documentation risk. Such risks involve the possibility that no liquid market for these agreements will exist, the counterparty to the agreement may default on its obligation to perform or disagree on the contractual terms of the agreement, and changes in net interest rates will be unfavorable. In connection with these agreements, securities in the portfolio may be identified or received as collateral from the counterparty in accordance with the terms of the respective swap agreements to provide or receive assets of value and to serve as recourse in the event of default or bankruptcy/insolvency of either party. Such OTC derivative agreements include conditions which, when materialized, give the counterparty
PGIM Emerging Markets Debt Local Currency Fund 61
Notes to Financial Statements (continued)
the right to cause an early termination of the transactions under those agreements. Any election by the counterparty for early termination of the contract(s) may impact the amounts reported on financial statements.
Short sales and OTC contracts, including forward foreign currency exchange contracts, swaps, forward rate agreements and written options involve elements of both market and credit risk in excess of the amounts reflected on the Statement of Assets and Liabilities, if applicable. Such risks may be mitigated by engaging in master netting arrangements.
Securities Lending: The Fund lends its portfolio securities to banks and broker-dealers. The loans are secured by collateral at least equal to the market value of the securities loaned. Collateral pledged by each borrower is invested in an affiliated money market fund and is marked to market daily, based on the previous day’s market value, such that the value of the collateral exceeds the value of the loaned securities. In the event of significant appreciation in value of securities on loan on the last business day of the reporting period, the financial statements may reflect a collateral value that is less than the market value of the loaned securities. Such shortfall is remedied as described above. Loans are subject to termination at the option of the borrower or the Fund. Upon termination of the loan, the borrower will return to the Fund securities identical to the loaned securities. The remaining maturities of the securities lending transactions are considered overnight and continuous. Should the borrower of the securities fail financially, the Fund has the right to repurchase the securities in the open market using the collateral.
The Fund recognizes income, net of any rebate and securities lending agent fees, for lending its securities in the form of fees or interest on the investment of any cash received as collateral. The borrower receives all interest and dividends from the securities loaned and such payments are passed back to the lender in amounts equivalent thereto, which are reflected in interest income or unaffiliated dividend income based on the nature of the payment on the Statement of Operations. The Fund also continues to recognize any unrealized gain (loss) in the market price of the securities loaned and on the change in the value of the collateral invested that may occur during the term of the loan. In addition, realized gain (loss) is recognized on changes in the value of the collateral invested upon liquidation of the collateral. Net earnings from securities lending are disclosed in the Statement of Operations.
Securities Transactions and Net Investment Income: Securities transactions are recorded on the trade date. Realized gains (losses) from investment and currency transactions are calculated on the specific identification method. Dividend income is recorded on the ex-date, or for certain foreign securities, when the Fund becomes aware of such dividends. Interest income, including amortization of premium and accretion of discount on debt securities, as required, is recorded on the accrual basis. Expenses are recorded on an
62
accrual basis, which may require the use of certain estimates by management that may differ from actual. Net investment income or loss (other than class specific expenses and waivers, which are allocated as noted below) and unrealized and realized gains (losses) are allocated daily to each class of shares based upon the relative proportion of adjusted net assets of each class at the beginning of the day. Class specific expenses and waivers, where applicable, are charged to the respective share classes. Such class specific expenses and waivers include distribution fees and distribution fee waivers, shareholder servicing fees, transfer agent’s fees and expenses, registration fees and fee waivers and/or expense reimbursements, as applicable.
Taxes: It is the Fund’s policy to continue to meet the requirements of the Internal Revenue Code applicable to regulated investment companies and to distribute all of its taxable net investment income and capital gains, if any, to its shareholders. Therefore, no federal income tax provision is required. Withholding taxes on foreign dividends, interest and capital gains, if any, are recorded, net of reclaimable amounts, at the time the related income is earned.
Dividends and Distributions: The Fund expects to declare dividends of its net investment income daily and pay such dividends monthly. Distributions of net realized capital and currency gains, if any, are declared and paid at least annually. Dividends and distributions to shareholders, which are determined in accordance with federal income tax regulations and which may differ from GAAP, are recorded on the ex-date. Permanent book/tax differences relating to income and gain (loss) are reclassified between total distributable earnings (loss) and paid-in capital in excess of par, as appropriate.
Estimates: The preparation of financial statements requires management to make estimates and assumptions that affect the reported amounts and disclosures in the financial statements. Actual results could differ from those estimates.
The RIC, on behalf of the Fund, has a management agreement with the Manager. Pursuant to this agreement, the Manager has responsibility for all investment advisory services and supervises the subadvisers’ performance of such services.
The Manager has entered into a subadvisory agreement with PGIM, Inc., which provides subadvisory services to the Fund through its PGIM Fixed Income unit, and PGIM Limited (each a subadviser and collectively, the subadvisers). The Manager pays for the services of subadvisers.
The management fee paid to the Manager is accrued daily and payable monthly at an annual rate of 0.65% of the Fund’s average daily net assets up to and including $1 billion; 0.63% from $1 billion to $3 billion of average daily net assets; 0.61% from $3 billion to $5 billion of average daily net assets; 0.60% from $5 billion to $10 billion of average daily net assets; and 0.59% on average daily net assets exceeding $10 billion. The effective
PGIM Emerging Markets Debt Local Currency Fund 63
Notes to Financial Statements (continued)
management fee rate before any waivers and/or expense reimbursements was 0.65% for the year ended October 31, 2021.
The Manager has contractually agreed, through February 28, 2023, to limit total annual operating expenses after fee waivers and/or expense reimbursements to 1.13% of average daily net assets for Class A shares, 1.88% of average daily net assets for Class C shares, 0.72% of average daily net assets for Class Z shares and 0.65% of average daily net assets for Class R6 shares. This contractual waiver excludes interest, brokerage, taxes (such as income and foreign withholding taxes, stamp duty and deferred tax expenses), acquired fund fees and expenses, extraordinary expenses, and certain other Fund expenses such as dividend and interest expense and broker charges on short sales.
Where applicable, the Manager agrees to waive management fees or shared operating expenses on any share class to the same extent that it waives such expenses on any other share class. In addition, total annual operating expenses for Class R6 shares will not exceed total annual operating expenses for Class Z shares. Fees and/or expenses waived and/or reimbursed by the Manager may be recouped by the Manager within the same fiscal year during which such waiver and/or reimbursement is made if such recoupment can be realized without exceeding the expense limit in effect at the time of the recoupment for that fiscal year.
The RIC, on behalf of the Fund, has a distribution agreement with Prudential Investment Management Services LLC (“PIMS”), which acts as the distributor of the Class A, Class C, Class Z and Class R6 shares of the Fund. The Fund compensates PIMS for distributing and servicing the Fund’s Class A and Class C shares, pursuant to the plans of distribution (the “Distribution Plans”), regardless of expenses actually incurred by PIMS.
Pursuant to the Distribution Plans, the Fund compensates PIMS for distribution related activities at an annual rate of up to 0.25% and 1% of the average daily net assets of the Class A and Class C shares, respectively. The distribution fees are accrued daily and payable monthly. No distribution or service fees are paid to PIMS as distributor of the Class Z or Class R6 shares of the Fund.
For the year ended October 31, 2021, PIMS received $7,130 in front-end sales charges resulting from sales of Class A shares. Additionally, for the year ended October 31, 2021, PIMS received $36 in contingent deferred sales charges imposed upon redemptions by certain Class C shareholders. From these fees, PIMS paid such sales charges to broker-dealers, who in turn paid commissions to salespersons and incurred other distribution costs.
PGIM Investments, PGIM, Inc., PGIM Limited and PIMS are indirect, wholly-owned
64
subsidiaries of Prudential Financial, Inc. (“Prudential”).
| 4. | Other Transactions with Affiliates |
Prudential Mutual Fund Services LLC (“PMFS”), an affiliate of PGIM Investments and an indirect, wholly-owned subsidiary of Prudential, serves as the Fund’s transfer agent. Transfer agent’s fees and expenses in the Statement of Operations include certain out-of-pocket expenses paid to non-affiliates, where applicable.
The Fund may invest its overnight sweep cash in the PGIM Core Ultra Short Bond Fund (the “Core Fund”), and its securities lending cash collateral in the PGIM Institutional Money Market Fund (the “Money Market Fund”), each a fund of Prudential Investment Portfolios 2, registered under the 1940 Act and managed by PGIM Investments. PGIM Investments and/or its affiliates are paid fees or reimbursed for providing their services to the Core Fund. In addition to the realized and unrealized gains on investments in the Core Fund and Money Market Fund, earnings from such investments are disclosed on the Statement of Operations as “Affiliated dividend income” and “Income from securities lending, net”, respectively.
The Fund may enter into certain securities purchase or sale transactions under Board approved Rule 17a-7 procedures. Rule 17a-7 is an exemptive rule under the 1940 Act, that subject to certain conditions, permits purchase and sale transactions among affiliated investment companies, or between an investment company and a person that is affiliated solely by reason of having a common (or affiliated) investment adviser, common directors/trustees, and/or common officers. For the year ended October 31, 2021, no 17a-7 transactions were entered into by the Fund.
The aggregate cost of purchases and proceeds from sales of portfolio securities (excluding short-term investments and U.S. Government securities) for the year ended October 31, 2021, were $21,276,394 and $23,245,921, respectively.
A summary of the cost of purchases and proceeds from sales of shares of affiliated mutual funds for the year ended October 31, 2021, is presented as follows:
| | | | | | | | | | | | | | | | | | | | | | | | | | | | | | | | | | | |
Value, Beginning of Year | | Cost of Purchases | | Proceeds from Sales | | Change in Unrealized Gain (Loss) | | Realized Gain (Loss) | | Value, End of Year | | Shares, End of Year | | Income |
| |
Short-Term Investments - Affiliated Mutual Funds: | | | | | | |
| | | | | |
PGIM Core Ultra Short Bond Fund (1)(wa) | | | | | | | | | | | | | | | | | | | | | | | | | | |
$2,133,355 | | | | $22,518,046 | | | | | $24,064,559 | | | | | $— | | | | | $— | | | | | $586,842 | | | | | 586,842 | | | | | $3,246 | |
PGIM Emerging Markets Debt Local Currency Fund 65
Notes to Financial Statements (continued)
| | | | | | | | | | | | | | | | | | | | | | | | | | | | | | | | | | | |
Value, Beginning of Year | | Cost of Purchases | | Proceeds from Sales | | Change in Unrealized Gain (Loss) | | Realized Gain (Loss) | | Value, End of Year | | Shares, End of Year | | Income |
| |
PGIM Institutional Money Market Fund (1)(b)(wa) | | | | | | |
$ — | | | $ | 1,557,007 | | | | $ | 1,337,628 | | | | $ | (21 | ) | | | $ | (96 | ) | | | $ | 219,262 | | | | | 219,395 | | | | $ | 250 | (2) |
| | | | | | | | | | | | | | | | | | | | | | | | | | | | | | | | | | | |
| | | | | | | |
$2,133,355 | | | $ | 24,075,053 | | | | $ | 25,402,187 | | | | $ | (21 | ) | | | $ | (96 | ) | | | $ | 806,104 | | | | | | | | | $ | 3,496 | |
| | | | | | | | | | | | | | | | | | | | | | | | | | | | | | | | | | | |
| (1) | The Fund did not have any capital gain distributions during the reporting period. |
| (2) | The amount, or a portion thereof, represents the affiliated securities lending income shown on the Statement of Operations. |
| (b) | Represents security, or portion thereof, purchased with cash collateral received for securities on loan and includes dividend reinvestment. |
| (wa) | PGIM Investments LLC, the manager of the Fund, also serves as manager of the PGIM Core Ultra Short Bond Fund and PGIM Institutional Money Market Fund, if applicable. |
| 6. | Distributions and Tax Information |
Distributions to shareholders, which are determined in accordance with federal income tax regulations and which may differ from GAAP, are recorded on the ex-date.
For the year ended October 31, 2021, the tax character of dividends paid by the Fund was $3,093,508 of ordinary income. For the year ended October 31, 2020, the tax character of dividends paid by the Fund were $0 of ordinary income and $3,154,664 of tax return of capital.
As of October 31, 2021, the accumulated undistributed earnings on a tax basis was $486,591 of ordinary income.
The United States federal income tax basis of the Fund’s investments and the net unrealized depreciation as of October 31, 2021 were as follows:
| | | | | | |
| Tax Basis | | Gross Unrealized Appreciation | | Gross Unrealized Depreciation | | Net Unrealized Depreciation |
| | | |
| $58,911,195 | | $1,637,882 | | $(6,191,580) | | $(4,553,698) |
The difference between GAAP and tax basis is primarily attributable to the difference in the treatment of amortization of premiums, swaps, wash sales, straddle loss deferrals and other cost basis differences between GAAP and tax accounting.
For federal income tax purposes, the Fund had a capital loss carryforward as of October 31, 2021 of approximately $5,321,000 which can be carried forward for an unlimited period. No capital gains distributions are expected to be paid to shareholders until net gains have been realized in excess of such losses.
66
The Manager has analyzed the Fund’s tax positions taken on federal, state and local income tax returns for all open tax years and has concluded that no provision for income tax is required in the Fund’s financial statements for the current reporting period. Since tax authorities can examine previously filed tax returns, the Fund’s U.S. federal and state tax returns for each of the four fiscal years up to the most recent fiscal year ended October 31, 2021 are subject to such review.
The Fund offers Class A, Class C, Class Z and Class R6 shares. Class A shares are sold with a maximum front-end sales charge of 3.25%. Investors who purchase $500,000 or more of Class A shares and sell those shares within 12 months of purchase are subject to a contingent deferred sales charge (“CDSC”) of 1.00% on sales although these purchases are not subject to a front-end sales charge. The Class A CDSC is waived for certain retirement and/or benefit plans. A special exchange privilege is also available for shareholders who qualified to purchase Class A shares at net asset value. Class C shares are sold with a CDSC of 1% on sales made within 12 months of purchase. Class C shares will automatically convert to Class A shares on a monthly basis approximately eight years (ten years prior to January 22, 2021) after purchase. Class Z and Class R6 shares are not subject to any sales or redemption charges and are available exclusively for sale to a limited group of investors.
Under certain circumstances, an exchange may be made from specified share classes of the Fund to one or more other share classes of the Fund as presented in the table of transactions in shares of common stock, below.
The RIC is authorized to issue 10,225,000,000 shares of common stock, $0.00001 par value per share, 550,000,000 of which are designated as shares of the Fund. The authorized shares of the Fund are currently classified and designated as follows:
| | | | |
| | |
Class A | | | 10,000,000 | |
Class C | | | 50,000,000 | |
Class Z | | | 250,000,000 | |
Class T | | | 190,000,000 | |
Class R6 | | | 50,000,000 | |
The Fund currently does not have any Class T shares outstanding.
As of October 31, 2021, Prudential, through its affiliated entities, including affiliated funds (if applicable), owned shares of the Fund as follows:
| | | | |
| | | |
| | | Number of Shares | | Percentage of Outstanding Shares |
Class Z | | 3,634,129 | | 40.7% |
Class R6 | | 188 | | 0.1% |
PGIM Emerging Markets Debt Local Currency Fund 67
Notes to Financial Statements (continued)
At the reporting period end, the number of shareholders holding greater than 5% of the Fund are as follows:
| | | | | | |
| Affiliated | | Unaffiliated |
Number of Shareholders | | Percentage of Outstanding Shares | | Number of Shareholders | | Percentage of Outstanding Shares |
1 | | 35.7% | | 3 | | 57.2% |
Transactions in shares of common stock were as follows:
| | | | | | | | |
Class A | | Shares | | | Amount | |
| | |
Year ended October 31, 2021: | | | | | | | | |
Shares sold | | | 78,649 | | | $ | 458,123 | |
Shares issued in reinvestment of dividends and distributions | | | 29,019 | | | | 167,971 | |
Shares purchased | | | (181,591 | ) | | | (1,055,699 | ) |
| | | | | | | | |
| | |
Net increase (decrease) in shares outstanding before conversion | | | (73,923 | ) | | | (429,605 | ) |
Shares issued upon conversion from other share class(es) | | | 25,573 | | | | 154,504 | |
Shares purchased upon conversion into other share class(es) | | | (3,161 | ) | | | (18,144 | ) |
| | | | | | | | |
| | |
Net increase (decrease) in shares outstanding | | | (51,511 | ) | | $ | (293,245 | ) |
| | | | | | | | |
Year ended October 31, 2020: | | | | | | | | |
Shares sold | | | 151,614 | | | $ | 859,877 | |
Shares issued in reinvestment of dividends and distributions | | | 28,771 | | | | 163,559 | |
Shares purchased | | | (102,959 | ) | | | (560,731 | ) |
| | | | | | | | |
| | |
Net increase (decrease) in shares outstanding before conversion | | | 77,426 | | | | 462,705 | |
Shares issued upon conversion from other share class(es) | | | 5,898 | | | | 31,679 | |
| | | | | | | | |
| | |
Net increase (decrease) in shares outstanding | | | 83,324 | | | $ | 494,384 | |
| | | | | | | | |
| | |
Class C | | | | | | | | |
| | |
Year ended October 31, 2021: | | | | | | | | |
Shares sold | | | 3,485 | | | $ | 20,671 | |
Shares issued in reinvestment of dividends and distributions | | | 2,022 | | | | 11,886 | |
Shares purchased | | | (28,402 | ) | | | (163,996 | ) |
| | | | | | | | |
| | |
Net increase (decrease) in shares outstanding before conversion | | | (22,895 | ) | | | (131,439 | ) |
Shares purchased upon conversion into other share class(es) | | | (25,403 | ) | | | (154,504 | ) |
| | | | | | | | |
| | |
Net increase (decrease) in shares outstanding | | | (48,298 | ) | | $ | (285,943 | ) |
| | | | | | | | |
Year ended October 31, 2020: | | | | | | | | |
Shares sold | | | 8,600 | | | $ | 49,850 | |
Shares issued in reinvestment of dividends and distributions | | | 3,393 | | | | 19,430 | |
Shares purchased | | | (17,874 | ) | | | (104,373 | ) |
| | | | | | | | |
| | |
Net increase (decrease) in shares outstanding before conversion | | | (5,881 | ) | | | (35,093 | ) |
Shares purchased upon conversion into other share class(es) | | | (5,855 | ) | | | (31,679 | ) |
| | | | | | | | |
| | |
Net increase (decrease) in shares outstanding | | | (11,736 | ) | | $ | (66,772 | ) |
| | | | | | | | |
68
| | | | | | | | |
Class Z | | Shares | | | Amount | |
| | |
Year ended October 31, 2021: | | | | | | | | |
Shares sold | | | 2,987,759 | | | $ | 17,715,817 | |
Shares issued in reinvestment of dividends and distributions | | | 483,358 | | | | 2,827,410 | |
Shares purchased | | | (4,096,951 | ) | | | (23,917,712 | ) |
| | | | | | | | |
| | |
Net increase (decrease) in shares outstanding before conversion | | | (625,834 | ) | | | (3,374,485 | ) |
Shares issued upon conversion from other share class(es) | | | 3,128 | | | | 18,144 | |
Shares purchased upon conversion into other share class(es) | | | (661,948 | ) | | | (3,892,254 | ) |
| | | | | | | | |
| | |
Net increase (decrease) in shares outstanding | | | (1,284,654 | ) | | $ | (7,248,595 | ) |
| | | | | | | | |
Year ended October 31, 2020: | | | | | | | | |
Shares sold | | | 4,164,373 | | | $ | 24,507,148 | |
Shares issued in reinvestment of dividends and distributions | | | 504,320 | | | | 2,892,722 | |
Shares purchased | | | (5,579,432 | ) | | | (29,392,019 | ) |
| | | | | | | | |
| | |
Net increase (decrease) in shares outstanding | | | (910,739 | ) | | $ | (1,992,149 | ) |
| | | | | | | | |
| | |
Class R6 | | | | | | | | |
| | |
Year ended October 31, 2021: | | | | | | | | |
Shares sold | | | 68,180 | | | $ | 395,330 | |
Shares issued in reinvestment of dividends and distributions | | | 13,589 | | | | 77,566 | |
Shares purchased | | | (164,802 | ) | | | (945,773 | ) |
| | | | | | | | |
| | |
Net increase (decrease) in shares outstanding before conversion | | | (83,033 | ) | | | (472,877 | ) |
Shares issued upon conversion from other share class(es) | | | 663,076 | | | | 3,892,254 | |
| | | | | | | | |
| | |
Net increase (decrease) in shares outstanding | | | 580,043 | | | $ | 3,419,377 | |
| | | | | | | | |
Year ended October 31, 2020: | | | | | | | | |
Shares sold | | | 3,743 | | | $ | 22,619 | |
Shares issued in reinvestment of dividends and distributions | | | 386 | | | | 2,195 | |
Shares purchased | | | (9 | ) | | | (58 | ) |
| | | | | | | | |
| | |
Net increase (decrease) in shares outstanding | | | 4,120 | | | $ | 24,756 | |
| | | | | | | | |
The RIC, on behalf of the Fund, along with other affiliated registered investment companies (the “Participating Funds”), is a party to a Syndicated Credit Agreement (“SCA”) with a group of banks. The purpose of the SCA is to provide an alternative source of temporary funding for capital share redemptions. The table below provides details of the current SCA in effect at the reporting period-end as well as the prior SCA.
| | | | |
| | | Current SCA | | Prior SCA |
Term of Commitment | | 10/1/2021 – 9/29/2022 | | 10/2/2020 – 9/30/2021 |
Total Commitment | | $ 1,200,000,000 | | $ 1,200,000,000 |
Annualized Commitment Fee on the Unused Portion of the SCA | | 0.15% | | 0.15% |
Annualized Interest Rate on Borrowings | | 1.20% plus the higher of (1) the effective federal funds rate, (2) the one-month LIBOR rate or (3) zero percent | | 1.30% plus the higher of (1) the effective federal funds rate, (2) the one-month LIBOR rate or (3) zero percent |
Certain affiliated registered investment companies that are parties to the SCA include portfolios that are subject to a predetermined mathematical formula used to manage certain benefit guarantees offered under variable annuity contracts. The formula may result in large scale asset flows into and out of these portfolios. Consequently, these portfolios may be more
PGIM Emerging Markets Debt Local Currency Fund 69
Notes to Financial Statements (continued)
likely to utilize the SCA for purposes of funding redemptions. It may be possible for those portfolios to fully exhaust the committed amount of the SCA, thereby requiring the Manager to allocate available funding per a Board-approved methodology designed to treat the Participating Funds in the SCA equitably.
The Fund utilized the SCA during the year ended October 31, 2021. The average daily balance for the 11 days that the Fund had loans outstanding during the period was approximately $1,515,818, borrowed at a weighted average interest rate of 1.38%. The maximum loan outstanding amount during the period was $6,504,000. At October 31, 2021, the Fund did not have an outstanding loan amount.
| 9. | Risks of Investing in the Fund |
The Fund’s risks include, but are not limited to, some or all of the risks discussed below. For further information on the Fund’s risks, please refer to the Fund’s Prospectus and Statement of Additional Information.
Active Trading Risk: The Fund actively and frequently trades its portfolio securities. High portfolio turnover results in higher transaction costs, which can affect the Fund’s performance and have adverse tax consequences. In addition, high portfolio turnover may also mean that a proportionately greater amount of distributions to shareholders will be taxed as ordinary income rather than long-term capital gains compared to investment companies with lower portfolio turnover.
Credit Risk: Credit risk relates to the ability of the issuer of a fixed income instrument or the counterparty to a financial transaction with the Fund to meet interest and principal payments as they come due or to fulfill its obligations to the Fund. The value of the fixed income instruments held by the Fund will be adversely affected by any erosion in the ability of the relevant issuers to make interest and principal payments as they become due. The ratings given to a debt security by certain ratings agencies provide a generally useful guide as to such credit risk. The lower the rating of a debt security held by the Fund, the greater the degree of credit risk that is perceived to exist by the rating agency with respect to that security. Increasing the amount of Fund assets invested in lower-rated securities generally will increase the Fund’s income, but also will increase the credit risk to which the Fund is subject. The Fund generally enters into financial transactions with major dealers that are deemed acceptable to the subadviser from a credit perspective.
Currency Risk: The Fund’s assets may be invested in securities that are denominated in non-US currencies or directly in currencies. Such investments are subject to the risk that the value of a particular currency will change in relation to the US dollar or other currencies. The weakening of a country’s currency relative to the US dollar will negatively affect the
70
dollar value of the Fund’s assets. Among the factors that may affect currency values are trade balances, levels of short term interest rates, differences in relative values of similar assets in different currencies, long term opportunities for investment and capital appreciation, central bank policy, and political developments. The Fund may attempt to hedge such risks by selling or buying currencies in the forward market; selling or buying currency futures contracts, options or other securities thereon; borrowing fund denominated in particular currencies; or any combination thereof, depending on the availability of liquidity in the hedging instruments and their relative costs. There can be no assurance that such strategies will be implemented or, if implemented, will be effective. The Fund would incur additional costs from hedging.
Debt Obligations Risk: Debt obligations are subject to credit risk, market risk and interest rate risk. The Fund’s holdings, share price, yield and total return may also fluctuate in response to bond market movements. The value of bonds may decline for issuer-related reasons, including management performance, financial leverage and reduced demand for the issuer’s goods and services. Certain types of fixed income obligations also may be subject to “call and redemption risk,” which is the risk that the issuer may call a bond held by the Fund for redemption before it matures and the Fund may lose income.
Derivatives Risk: Derivatives involve special risks and costs and may result in losses to the Fund. The successful use of derivatives requires sophisticated management, and, to the extent that derivatives are used, the Fund will depend on the subadviser’s ability to analyze and manage derivatives transactions. The prices of derivatives may move in unexpected ways, especially in abnormal market conditions. Some derivatives are “leveraged” and therefore may magnify or otherwise increase investment losses to the Fund. The Fund’s use of derivatives may also increase the amount of taxes payable by shareholders. Other risks arise from the potential inability to terminate or sell derivatives positions. A liquid secondary market may not always exist for the Fund’s derivatives positions. In fact, many over-the-counter derivative instruments will not have liquidity beyond the counterparty to the instrument. Over-the-counter derivative instruments also involve the risk that the other party will not meet its obligations to the Fund. The U.S. Government and foreign governments have adopted (and may adopt further) regulations governing derivatives markets, including mandatory clearing of certain derivatives, margin and reporting requirements and risk exposure limitations. The ultimate impact of the regulations remains unclear. Additional regulation of derivatives may make derivatives more costly, limit their availability or utility, or otherwise adversely affect their performance or disrupt markets.
Economic and Market Events Risk: Events in the U.S. and global financial markets, including actions taken by the U.S. Federal Reserve or foreign central banks to stimulate or stabilize economic growth or the functioning of the securities markets, may at times result in unusually high market volatility, which could negatively impact performance. Relatively reduced liquidity in credit and fixed income markets could adversely affect issuers worldwide.
PGIM Emerging Markets Debt Local Currency Fund 71
Notes to Financial Statements (continued)
Emerging Markets Risk: The risks of foreign investments are greater for investments in or exposed to emerging markets. Emerging market countries typically have economic and political systems that are less fully developed, and can be expected to be less stable, than those of more developed countries. For example, the economies of such countries can be subject to rapid and unpredictable rates of inflation or deflation. Low trading volumes may result in a lack of liquidity and price volatility. Emerging market countries may have policies that restrict investment by non-U.S. investors, or that prevent non-U.S. investors from withdrawing their money at will.
The Fund may invest in some emerging markets that subject it to risks such as those associated with illiquidity, custody of assets, different settlement and clearance procedures and asserting legal title under a developing legal and regulatory regime to a greater degree than in developed markets or even in other emerging markets.
Foreign Securities Risk: Investments in securities of non-U.S. issuers (including those denominated in U.S. dollars) may involve more risk than investing in securities of U.S. issuers. Foreign political, economic and legal systems, especially those in developing and emerging market countries, may be less stable and more volatile than in the United States. Foreign legal systems generally have fewer regulatory requirements than the U.S. legal system, particularly those of emerging markets. In general, less information is publicly available with respect to non-U.S. companies than U.S. companies. Non-U.S. companies generally are not subject to the same accounting, auditing, and financial reporting standards as are U.S. companies. Additionally, the changing value of foreign currencies and changes in exchange rates could also affect the value of the assets the Fund holds and the Fund’s performance. Certain foreign countries may impose restrictions on the ability of issuers of foreign securities to make payment of principal and interest or dividends to investors located outside the country, due to blockage of foreign currency exchanges or otherwise. Investments in emerging markets are subject to greater volatility and price declines.
In addition, the Fund’s investments in non-U.S. securities may be subject to the risks of nationalization or expropriation of assets, imposition of currency exchange controls or restrictions on the repatriation of non-U.S. currency, confiscatory taxation and adverse diplomatic developments. Special U.S. tax considerations may apply.
Geographic Concentration Risk: The Fund’s performance may be closely tied to the market, economic, political, regulatory or other conditions in the countries or regions in which the Fund invests. This can result in more pronounced risks based upon conditions that impact one or more countries or regions more or less than other countries or regions.
Increase in Expenses Risk: Your actual cost of investing in the Fund may be higher than the expenses shown in the expense table in the Fund’s prospectus for a variety of reasons. For
72
example, expense ratios may be higher than those shown if average net assets decrease. Net assets are more likely to decrease and Fund expense ratios are more likely to increase when markets are volatile. Active and frequent trading of Fund securities can increase expenses.
Interest Rate Risk: The value of your investment may go down when interest rates rise. A rise in rates tends to have a greater impact on the prices of longer term or duration debt securities. For example, a fixed income security with a duration of three years is expected to decrease in value by approximately 3% if interest rates increase by 1%. This is referred to as “duration risk.” When interest rates fall, the issuers of debt obligations may prepay principal more quickly than expected, and the Fund may be required to reinvest the proceeds at a lower interest rate. This is referred to as “prepayment risk.” When interest rates rise, debt obligations may be repaid more slowly than expected, and the value of the Fund’s holdings may fall sharply. This is referred to as “extension risk.” The Fund may lose money if short-term or long-term interest rates rise sharply or in a manner not anticipated by the subadviser.
Investments in China Risk: Investments in China subject the Fund to risks specific to China and may make it more volatile than other funds. Over the last few decades, the Chinese government has undertaken reform of economic and market practices and has expanded the sphere of private ownership of property in China. However, Chinese markets generally continue to experience inefficiency, volatility and pricing anomalies resulting from governmental influence, a lack of publicly available information and/or political and social instability. Internal social unrest or confrontations with other neighboring countries, including military conflicts in response to such events, may also disrupt economic development in China and result in a greater risk of currency fluctuations, currency non-convertibility, interest rate fluctuations and higher rates of inflation.
China has experienced security concerns, such as terrorism and strained international relations. Incidents involving China’s or the region’s security may cause uncertainty in Chinese markets and may adversely affect the Chinese economy and the Fund’s investments. Export growth continues to be a major driver of China’s rapid economic growth. Reduction in spending on Chinese products and services, institution of additional tariffs or other trade barriers, including as a result of heightened trade tensions between China and the U.S., or a downturn in any of the economies of China’s key trading partners may have an adverse impact on the Chinese economy or the Fund. For example, a series of executive orders issued between November 2020 and June 2021 prohibit the Fund from investing in certain companies identified by the U.S. government as “Chinese Military Industrial Complex Companies.” The restrictions in these executive orders may force the subadviser to sell certain positions and may restrict the Fund from future investments the subadviser deems otherwise attractive.
Chinese companies, including Chinese companies that are listed on U.S. exchanges, are not subject to the same degree of regulatory requirements, accounting standards or auditor oversight as companies in more developed countries, and as a result, information about the
PGIM Emerging Markets Debt Local Currency Fund 73
Notes to Financial Statements (continued)
Chinese securities in which the Fund invests may be less reliable or complete. There may be significant obstacles to obtaining information necessary for investigations into or litigation against Chinese companies and shareholders may have limited legal remedies.
Junk Bonds Risk: High-yield, high-risk bonds have predominantly speculative characteristics, including particularly high credit risk. Junk bonds tend to have lower market liquidity than higher-rated securities. The liquidity of particular issuers or industries within a particular investment category may shrink or disappear suddenly and without warning. The non-investment grade bond market can experience sudden and sharp price swings and become illiquid due to a variety of factors, including changes in economic forecasts, stock market activity, large sustained sales by major investors, a high profile default or a change in the market’s psychology.
Large Shareholder and Large Scale Redemption Risk: Certain individuals, accounts, funds (including funds affiliated with the Manager) or institutions, including the Manager and its affiliates, may from time to time own or control a substantial amount of the Fund’s shares. There is no requirement that these entities maintain their investment in the Fund. There is a risk that such large shareholders or that the Fund’s shareholders generally may redeem all or a substantial portion of their investments in the Fund in a short period of time, which could have a significant negative impact on the Fund’s NAV, liquidity, and brokerage costs. Large redemptions could also result in tax consequences to shareholders and impact the Fund’s ability to implement its investment strategy. The Fund’s ability to pursue its investment objective after one or more large scale redemptions may be impaired and, as a result, the Fund may invest a larger portion of its assets in cash or cash equivalents.
Liquidity Risk: Liquidity risk is the risk that the Fund could not meet requests to redeem shares issued by the Fund without significant dilution of remaining investors’ interests in the Fund. The Fund may invest in instruments that trade in lower volumes and are more illiquid than other investments. If the Fund is forced to sell these investments to pay redemption proceeds or for other reasons, the Fund may lose money. In addition, when there is no willing buyer and investments cannot be readily sold at the desired time or price, the Fund may have to accept a lower price or may not be able to sell the instrument at all. An inability to sell a portfolio position can adversely affect the Fund’s value or prevent the Fund from being able to take advantage of other investment opportunities.
Management Risk: The value of your investment may decrease if judgments by the subadviser about the attractiveness, value or market trends affecting a particular security, industry or sector or about market movements are incorrect.
Market Disruption and Geopolitical Risks: International wars or conflicts and geopolitical developments in foreign countries, along with instability in regions such as Asia, Eastern
74
Europe, and the Middle East, possible terrorist attacks in the United States or around the world, public health epidemics such as the outbreak of infectious diseases like the outbreak of COVID-19 globally in 2020 or the 2014–2016 outbreak in West Africa of the Ebola virus, and other similar events could adversely affect the U.S. and foreign financial markets, including increases in market volatility, reduced liquidity in the securities markets and government intervention, and may cause further long-term economic uncertainties in the United States and worldwide generally. The coronavirus pandemic and the related governmental and public responses have had and may continue to have an impact on the Fund’s investments and net asset value and have led and may continue to lead to increased market volatility and the potential for illiquidity in certain classes of securities and sectors of the market. Preventative or protective actions that governments may take in respect of pandemic or epidemic diseases may result in periods of business disruption, business closures, inability to obtain raw materials, supplies and component parts, and reduced or disrupted operations for the issuers in which the Fund invests. Government intervention in markets may impact interest rates, market volatility and security pricing. The occurrence, reoccurrence and pendency of such diseases could adversely affect the economies (including through changes in business activity and increased unemployment) and financial markets either in specific countries or worldwide.
Market Risk: Securities markets may be volatile and the market prices of the Fund’s securities may decline. Securities fluctuate in price based on changes in an issuer’s financial condition and overall market and economic conditions. If the market prices of the securities owned by the Fund fall, the value of your investment in the Fund will decline.
Non-Diversified Investment Company Risk: The Fund is non-diversified for purposes of the Investment Company Act of 1940 (1940 Act). This means that the Fund may invest a greater percentage of its assets in the securities of a single company or other issuer than a diversified fund. Investing in a non-diversified fund involves greater risk than investing in a diversified fund because a loss resulting from the decline in value of any one security may represent a greater portion of the total assets of a non-diversified fund.
| 10. | Recent Accounting Pronouncement and Regulatory Developments |
In March 2020, the FASB issued Accounting Standard Update (“ASU”) No. 2020-04, which provides optional guidance for applying GAAP to contract modifications, hedging relationships and other transactions affected by the reference rate reform if certain criteria are met. ASU 2020-04 is elective and is effective on March 12, 2020 through December 31, 2022. At this time, management is evaluating the implications of certain provisions of the ASU and any impact on the financial statement disclosures has not yet been determined.
On December 3, 2020, the SEC announced that it voted to adopt a new rule that establishes an updated regulatory framework for fund valuation practices (the “Rule”). The Rule, in part, provides (i) a framework for determining fair value in good faith and (ii) provides for a fund Board’s assignment of its responsibility for the execution of valuation-related activities to a fund’s investment adviser. Further, the SEC is rescinding previously issued guidance on
PGIM Emerging Markets Debt Local Currency Fund 75
Notes to Financial Statements (continued)
related issues. The Rule took effect on March 8, 2021, with a compliance date of September 8, 2022. Management is currently evaluating the Rule and its impact to the Fund.
76
Report of Independent Registered Public Accounting Firm
To the Board of Directors of Prudential World Fund, Inc. and Shareholders of PGIM Emerging Markets Debt Local Currency Fund
Opinion on the Financial Statements
We have audited the accompanying statement of assets and liabilities, including the schedule of investments, of PGIM Emerging Markets Debt Local Currency Fund (one of the funds constituting Prudential World Fund, Inc., referred to hereafter as the “Fund”) as of October 31, 2021, the related statement of operations for the year ended October 31, 2021, the statement of changes in net assets for each of the two years in the period ended October 31, 2021, including the related notes, and financial highlights for each of the two years in the period ended October 31, 2021 (collectively referred to as the “financial statements”). In our opinion, the financial statements present fairly, in all material respects, the financial position of the Fund as of October 31, 2021, the results of its operations for the year then ended, and the changes in its net assets and the financial highlights for each of the two years in the period ended October 31, 2021 in conformity with accounting principles generally accepted in the United States of America.
The financial statements of the Fund as of and for the year ended October 31, 2019 and the financial highlights for each of the periods ended on or prior to October 31, 2019 (not presented herein, other than the financial highlights) were audited by other auditors whose report dated December 19, 2019 expressed an unqualified opinion on those financial statements and financial highlights.
Basis for Opinion
These financial statements are the responsibility of the Fund’s management. Our responsibility is to express an opinion on the Fund’s financial statements based on our audits. We are a public accounting firm registered with the Public Company Accounting Oversight Board (United States) (PCAOB) and are required to be independent with respect to the Fund in accordance with the U.S. federal securities laws and the applicable rules and regulations of the Securities and Exchange Commission and the PCAOB.
We conducted our audits of these financial statements in accordance with the standards of the PCAOB. Those standards require that we plan and perform the audit to obtain reasonable assurance about whether the financial statements are free of material misstatement, whether due to error or fraud.
Our audits included performing procedures to assess the risks of material misstatement of the financial statements, whether due to error or fraud, and performing procedures that respond to those risks. Such procedures included examining, on a test basis, evidence regarding the amounts and disclosures in the financial statements. Our audits also included evaluating the accounting principles used and significant estimates made by management, as well as evaluating the overall presentation of the financial statements. Our procedures included confirmation of securities owned as of October 31, 2021 by correspondence with the custodian, transfer agent and brokers; when replies were not received from brokers, we performed other auditing procedures. We believe that our audits provide a reasonable basis for our opinion.
/s/PricewaterhouseCoopers LLP
New York, New York
December 16, 2021
We have served as the auditor of one or more investment companies in the PGIM Retail Funds complex since 2020.
| | | | |
PGIM Emerging Markets Debt Local Currency Fund | | | 77 | |
Tax Information (unaudited)
For the year ended October 31, 2021, the Fund reports the maximum amount allowable but not less than 11.84% as interest-related dividends in accordance with Sections 871(k)(1) and 881(e)(1) of the Internal Revenue Code.
In January 2022, you will be advised on IRS Form 1099-DIV or substitute 1099-DIV as to the federal tax status of the dividends and distributions received by you in calendar year 2021.
call your financial adviser.
INFORMATION ABOUT BOARD MEMBERS AND OFFICERS (unaudited)
Information about Board Members and Officers of the Fund is set forth below. Board Members who are not deemed to be “interested persons” of the Fund, as defined in the 1940 Act, are referred to as “Independent Board Members.” Board Members who are deemed to be “interested persons” of the Fund are referred to as “Interested Board Members.” The Board Members are responsible for the overall supervision of the operations of the Fund and perform the various duties imposed on the directors of investment companies by the 1940 Act. The Board in turn elects the Officers, who are responsible for administering the day-to-day operations of the Fund.
| | | | | | |
| Independent Board Members | | | | |
| | | | |
Name Year of Birth Position(s) Portfolios Overseen | | Principal Occupation(s) During Past Five Years | | Other Directorships Held During Past Five Years | | Length of
Board Service |
| | | | |
Ellen S. Alberding 1958 Board Member Portfolios Overseen: 95 | | President and Board Member, The Joyce Foundation (charitable foundation) (since 2002); formerly Vice Chair, City Colleges of Chicago (community college system) (2011-2015); Trustee, National Park Foundation (charitable foundation for national park system) (2009-2018); Trustee, Economic Club of Chicago (2009-2016); Trustee, Loyola University (since 2018). | | None. | | Since September 2013 |
| | | | |
Kevin J. Bannon 1952 Board Member Portfolios Overseen: 95 | | Retired; formerly Managing Director (April 2008-May 2015) and Chief Investment Officer (October 2008-November 2013) of Highmount Capital LLC (registered investment adviser); formerly Executive Vice President and Chief Investment Officer (April 1993-August 2007) of Bank of New York Company; President (May 2003-May 2007) of BNY Hamilton Family of Mutual Funds. | | Director of Urstadt Biddle Properties (equity real estate investment trust) (since September 2008). | | Since July 2008 |
PGIM Emerging Markets Debt Local Currency Fund
| | | | | | |
| Independent Board Members | | | | |
| | | | |
Name Year of Birth Position(s) Portfolios Overseen | | Principal Occupation(s) During Past Five Years | | Other Directorships Held During Past Five Years | | Length of
Board Service |
| | | | |
Linda W. Bynoe 1952 Board Member Portfolios Overseen: 92 | | President and Chief Executive Officer (since March 1995) and formerly Chief Operating Officer (December 1989-February 1995) of Telemat Limited LLC (formerly Telemat Ltd) (management consulting); formerly Vice President (January 1985-June 1989) at Morgan Stanley & Co. (broker-dealer). | | Trustee of Equity Residential (residential real estate) (since December 2009); Director of Northern Trust Corporation (financial services) (since April 2006); formerly Director of Anixter International, Inc. (communication products distributor) (January 2006-June 2020). | | Since March 2005 |
| | | | |
Barry H. Evans 1960 Board Member Portfolios Overseen: 94 | | Retired; formerly President (2005-2016), Global Chief Operating Officer (2014-2016), Chief Investment Officer - Global Head of Fixed Income (1998-2014), and various portfolio manager roles (1986-2006), Manulife Asset Management (asset management). | | Formerly Director, Manulife Trust Company (2011-2018); formerly Director, Manulife Asset Management Limited (2015-2017); formerly Chairman of the Board of Directors of Manulife Asset Management U.S. (2005-2016); formerly Chairman of the Board, Declaration Investment Management and Research (2008-2016). | | Since September 2017 |
| | | | |
Keith F. Hartstein 1956 Board Member & Independent Chair Portfolios Overseen: 95 | | Retired; Executive Committee of the Independent Directors Council (IDC) Board of Governors (since October 2019); Member (since November 2014) of the Governing Council of the IDC (organization of independent mutual fund directors); formerly President and Chief Executive Officer (2005-2012), Senior Vice President (2004-2005), Senior Vice President of Sales and Marketing (1997-2004), and various executive management positions (1990-1997), John Hancock Funds, LLC (asset management); Chairman, Investment Company Institute’s Sales Force Marketing Committee (2003-2008). | | None. | | Since September 2013 |
Visit our website at pgim.com/investments
| | | | | | |
| Independent Board Members | | | | |
| | | | |
Name Year of Birth Position(s) Portfolios Overseen | | Principal Occupation(s) During Past Five Years | | Other Directorships Held During Past Five Years | | Length of
Board Service |
| | | | |
Laurie Simon Hodrick 1962 Board Member Portfolios Overseen: 91 | | A. Barton Hepburn Professor Emerita of Economics in the Faculty of Business, Columbia Business School (since 2018); Visiting Fellow at the Hoover Institution, Stanford University (since 2015); Sole Member, ReidCourt LLC (since 2008) (a consulting firm); formerly Visiting Professor of Law, Stanford Law School (2015-2021); formerly A. Barton Hepburn Professor of Economics in the Faculty of Business, Columbia Business School (1996-2017); formerly Managing Director, Global Head of Alternative Investment Strategies, Deutsche Bank (2006-2008). | | Independent Director, Roku (since December 2020) (communication services); formerly Independent Director, Synnex Corporation (2019-2021) (information technology); formerly Independent Director, Kabbage, Inc. (2018-2020) (financial services); formerly Independent Director, Corporate Capital Trust (2017-2018) (a business development company). | | Since September 2017 |
| | | | |
Brian K. Reid 1961 Board Member Portfolios Overseen: 94 | | Retired; formerly Chief Economist for the Investment Company Institute (ICI) (2005-2017); formerly Senior Economist and Director of Industry and Financial Analysis at the ICI (1998-2004); formerly Senior Economist, Industry and Financial Analysis at the ICI (1996-1998); formerly Staff Economist at the Federal Reserve Board (1989-1996); Director, ICI Mutual Insurance Company (2012-2017). | | None. | | Since March 2018 |
PGIM Emerging Markets Debt Local Currency Fund
| | | | | | |
| Independent Board Members | | | | |
| | | | |
Name Year of Birth Position(s) Portfolios Overseen | | Principal Occupation(s) During Past Five Years | | Other Directorships Held During Past Five Years | | Length of Board Service |
| | | | |
Grace C. Torres 1959 Board Member Portfolios Overseen: 94 | | Retired; formerly Treasurer and Principal Financial and Accounting Officer of the PGIM Funds, Target Funds, Advanced Series Trust, Prudential Variable Contract Accounts and The Prudential Series Fund (1998-June 2014); Assistant Treasurer (March 1999-June 2014) and Senior Vice President (September 1999-June 2014) of PGIM Investments LLC; Assistant Treasurer (May 2003-June 2014) and Vice President (June 2005-June 2014) of AST Investment Services, Inc.; Senior Vice President and Assistant Treasurer (May 2003-June 2014) of Prudential Annuities Advisory Services, Inc. | | Director (since January 2018) of OceanFirst Financial Corp. and OceanFirst Bank; formerly Director (July 2015-January 2018) of Sun Bancorp, Inc. N.A. and Sun National Bank. | | Since November 2014 |
| | | | | | |
| Interested Board Members | | | | |
| | | | |
Name Year of Birth Position(s) Portfolios Overseen | | Principal Occupation(s) During Past Five Years | | Other Directorships Held During Past Five Years | | Length of
Board Service |
| | | | |
Stuart S. Parker 1962 Board Member & President Portfolios Overseen: 94 | | President, Chief Executive Officer, Chief Operating Officer and Officer in Charge of PGIM Investments LLC (formerly known as Prudential Investments LLC) (since January 2012); formerly Executive Vice President of Jennison Associates LLC and Head of Retail Distribution of PGIM Investments LLC (June 2005-December 2011); Investment Company Institute - Board of Governors (since May 2012). | | None. | | Since January 2012 |
Visit our website at pgim.com/investments
| | | | | | |
Interested Board Members | | | | |
| | | | |
Name Year of Birth Position(s) Portfolios Overseen | | Principal Occupation(s) During Past Five Years | | Other Directorships Held During Past Five Years | | Length of
Board Service |
| | | | |
Scott E. Benjamin 1973 Board Member & Vice President Portfolios Overseen: 95 | | Executive Vice President (since May 2009) of PGIM Investments LLC; Vice President (since June 2012) of Prudential Investment Management Services LLC; Executive Vice President (since September 2009) of AST Investment Services, Inc.; Senior Vice President of Product Development and Marketing, PGIM Investments (since February 2006); formerly Vice President of Product Development and Product Management, PGIM Investments LLC (2003-2006). | | None. | | Since March 2010 |
(1) The year that each Board Member joined the Board is as follows:
Ellen S. Alberding, 2013; Kevin J. Bannon, 2008; Linda W. Bynoe, 2005; Barry H. Evans, 2017; Keith F. Hartstein, 2013; Laurie Simon Hodrick, 2017; Michael S. Hyland, 2008; Richard A. Redeker, 1993; Stephen G. Stoneburn, 2003; Stuart S. Parker, Board Member since 2012 and President since 2012; Scott E. Benjamin, Board Member since 2010 and Vice President since 2009; Grace C. Torres, 2014.
| | | | |
| Fund Officers(a) | | | | |
| | | |
Name Year of Birth Fund Position | | Principal Occupation(s) During Past Five Years | | Length of
Service as Fund
Officer |
| | | |
Claudia DiGiacomo 1974 Chief Legal Officer | | Chief Legal Officer, Executive Vice President and Secretary of PGIM Investments LLC (since August 2020); Chief Legal Officer of Prudential Mutual Fund Services LLC (since August 2020); Chief Legal Officer of PIFM Holdco, LLC (since August 2020); Vice President and Corporate Counsel (since January 2005) of Prudential; and Corporate Counsel of AST Investment Services, Inc. (since August 2020); formerly Vice President and Assistant Secretary of PGIM Investments LLC (2005-2020); formerly Associate at Sidley Austin Brown & Wood LLP (1999-2004). | | Since December 2005 |
PGIM Emerging Markets Debt Local Currency Fund
| | | | |
| Fund Officers(a) | | | | |
| | | |
Name Year of Birth Fund Position | | Principal Occupation(s) During Past Five Years | | Length of Service as Fund Officer |
| | | |
Dino Capasso 1974 Chief Compliance Officer | | Chief Compliance Officer (since July 2019) of PGIM Investments LLC; Chief Compliance Officer (since July 2019) of the PGIM Funds, Target Funds, Advanced Series Trust, The Prudential Series Fund, Prudential’s Gibraltar Fund, Inc., PGIM Global High Yield Fund, Inc., PGIM High Yield Bond Fund, Inc., and PGIM Short Duration High Yield Opportunities Fund; Vice President and Deputy Chief Compliance Officer (June 2017-2019) of PGIM Investments LLC; formerly Senior Vice President and Senior Counsel (January 2016-June 2017), and Vice President and Counsel (February 2012-December 2015) of Pacific Investment Management Company LLC. | | Since July 2019 |
| | | |
Andrew R. French 1962 Secretary | | Vice President (since December 2018) of PGIM Investments LLC; formerly Vice President and Corporate Counsel (2010-2018) of Prudential; formerly Director and Corporate Counsel (2006-2010) of Prudential; Vice President and Assistant Secretary (since January 2007) of PGIM Investments LLC; Vice President and Assistant Secretary (since January 2007) of Prudential Mutual Fund Services LLC. | | Since October 2006 |
| | | |
Diana N. Huffman 1982 Assistant Secretary | | Vice President and Corporate Counsel (since September 2015) of Prudential; Vice President and Assistant Secretary (since August 2020) of PGIM Investments LLC; formerly Associate at Willkie Farr & Gallagher LLP (2009-2015). | | Since March 2019 |
| | | |
Melissa Gonzalez 1980 Assistant Secretary | | Vice President and Corporate Counsel (since September 2018) of Prudential; Vice President and Assistant Secretary (since August 2020) of PGIM Investments LLC; formerly Director and Corporate Counsel (March 2014-September 2018) of Prudential. | | Since March 2020 |
| | | |
Patrick E. McGuinness 1986 Assistant Secretary | | Vice President and Assistant Secretary (since August 2020) of PGIM Investments LLC; Director and Corporate Counsel (since February 2017) of Prudential; and Corporate Counsel (2012-2017) of IIL, Inc. | | Since June 2020 |
| | | |
Debra Rubano 1975 Assistant Secretary | | Vice President and Corporate Counsel (since November 2020) of Prudential; formerly Director and Senior Counsel of Allianz Global Investors U.S. Holdings LLC (2010-2020) and Assistant Secretary of numerous funds in the Allianz fund complex (2015-2020). | | Since December 2020 |
| | | |
Kelly A. Coyne 1968 Assistant Secretary | | Director, Investment Operations of Prudential Mutual Fund Services LLC (since 2010). | | Since March 2015 |
Visit our website at pgim.com/investments
| | | | |
| Fund Officers(a) | | | | |
| | | |
Name Year of Birth Fund Position | | Principal Occupation(s) During Past Five Years | | Length of Service as Fund Officer |
| | | |
Christian J. Kelly 1975 Treasurer and Principal Financial and Accounting Officer | | Vice President, Head of Fund Administration of PGIM Investments LLC (since November 2018); formerly Director of Fund Administration of Lord Abbett & Co. LLC (2009-2018), Treasurer and Principal Accounting Officer of the Lord Abbett Family of Funds (2017-2018); Director of Accounting, Avenue Capital Group (2008-2009); Senior Manager, Investment Management Practice of Deloitte & Touche LLP (1998-2007). | | Since January 2019 |
| | | |
Lana Lomuti 1967 Assistant Treasurer | | Vice President (since 2007) and Director (2005-2007), within PGIM Investments Fund Administration; formerly Assistant Treasurer (December 2007-February 2014) of The Greater China Fund, Inc. | | Since April 2014 |
| | | |
Russ Shupak 1973 Assistant Treasurer | | Vice President (since 2017) and Director (2013-2017), within PGIM Investments Fund Administration. | | Since September 2019 |
| | | |
Deborah Conway 1969 Assistant Treasurer | | Vice President (since 2017) and Director (2007-2017), within PGIM Investments Fund Administration. | | Since September 2019 |
| | | |
Elyse M. McLaughlin 1974 Assistant Treasurer | | Vice President (since 2017) and Director (2011-2017), within PGIM Investments Fund Administration. | | Since September 2019 |
| | | |
Jonathan Corbett 1983 Anti-Money Laundering Compliance Officer | | Vice President, Corporate Compliance, Global Compliance Programs and Compliance Risk Management (since August 2019) of Prudential; formerly Vice President and Head of Key Risk Areas Compliance (March 2016 to July 2019), Chief Privacy Officer (March 2016 to July 2019) and Head of Global Financial Crimes Unit (April 2014 to March 2016) at MetLife. | | Since October 2021 |
(a) Excludes Mr. Parker and Mr. Benjamin, interested Board Members who also serve as President and Vice President, respectively.
Explanatory Notes to Tables:
| ∎ | | Board Members are deemed to be “Interested,” as defined in the 1940 Act, by reason of their affiliation with PGIM Investments LLC and/or an affiliate of PGIM Investments LLC. |
| ∎ | | Unless otherwise noted, the address of all Board Members and Officers is c/o PGIM Investments LLC, 655 Broad Street, Newark, New Jersey 07102-4410. |
| ∎ | | There is no set term of office for Board Members or Officers. The Board Members have adopted a retirement policy, which calls for the retirement of Board Members on December 31 of the year in which they reach the age of 75. |
| ∎ | | “Other Directorships Held” includes all directorships of companies required to register or file reports with the SEC under the 1934 Act (that is, “public companies”) or other investment companies registered under the 1940 Act. |
| ∎ | | “Portfolios Overseen” includes all investment companies managed by PGIM Investments LLC. The investment companies for which PGIM Investments LLC serves as manager include the PGIM Funds, Target Funds, The Prudential Variable Contract Accounts, PGIM ETF Trust, PGIM High Yield Bond Fund, Inc., PGIM Global High Yield Fund, Inc., PGIM Short Duration High Yield Opportunities Fund, The Prudential Series Fund, Prudential’s Gibraltar Fund, Inc. and the Advanced Series Trust. |
| ∎ | | As used in the Fund Officers table “Prudential” means The Prudential Insurance Company of America. |
PGIM Emerging Markets Debt Local Currency Fund
Approval of Advisory Agreements (unaudited)
The Fund’s Board of Directors
The Board of Directors (the “Board”) of PGIM Emerging Markets Debt Local Currency Fund (the “Fund”)1 consists of ten individuals, eight of whom are not “interested persons” of the Fund, as defined in the Investment Company Act of 1940, as amended (the “1940 Act”) (the “Independent Directors”). The Board is responsible for the oversight of the Fund and its operations, and performs the various duties imposed on the directors of investment companies by the 1940 Act. The Independent Directors have retained independent legal counsel to assist them in connection with their duties. The Chair of the Board is an Independent Director. The Board has established four standing committees: the Audit Committee, the Nominating and Governance Committee, and two Investment Committees. Each committee is chaired by, and composed of, Independent Directors.
Annual Approval of the Fund’s Advisory Agreements
As required under the 1940 Act, the Board determines annually whether to renew the Fund’s management agreement with PGIM Investments LLC (“PGIM Investments”), the Fund’s subadvisory agreement with PGIM, Inc. (“PGIM”) on behalf of its PGIM Fixed Income unit (“PGIM Fixed Income”), and the Fund’s sub-subadvisory agreement with PGIM Limited (“PGIML”). In considering the renewal of the agreements, the Board, including all of the Independent Directors, met on June 7-10, 2021 and approved the renewal of the agreements through July 31, 2022, after concluding that the renewal of the agreements was in the best interests of the Fund and its shareholders.
In advance of the meetings, the Board requested and received materials relating to the agreements, and had the opportunity to ask questions and request further information in connection with its consideration. Among other things, the Board considered comparative fee information from PGIM Investments, PGIM, and, where appropriate, affiliates of PGIM. Also, the Board considered comparisons with other mutual funds in relevant Peer Universes and Peer Groups, as is further discussed below.
In approving the agreements, the Board, including the Independent Directors advised by independent legal counsel, considered the factors it deemed relevant, including the nature, quality and extent of services provided by PGIM Investments, the subadviser, and, as relevant, its affiliates, the performance of the Fund, the profitability of PGIM Investments and its affiliates, expenses and fees, and the potential for economies of scale that may be shared with the Fund and its shareholders as the Fund’s assets grow. In their deliberations, the Directors did not identify any single factor which alone was responsible for the Board’s decision to approve the agreements with respect to the Fund. In connection with its deliberations, the Board considered information provided by PGIM Investments throughout the year at regular Board meetings, presentations from portfolio managers and other information, as well as information furnished at or in advance of the meetings on June 7-10, 2021.
| 1 | PGIM Emerging Markets Debt Local Currency Fund is a series of Prudential World Fund, Inc. |
PGIM Emerging Markets Debt Local Currency Fund
Approval of Advisory Agreements (continued)
The Directors determined that the overall arrangements between the Fund and PGIM Investments, which serves as the Fund’s investment manager pursuant to a management agreement, between PGIM Investments and PGIM, which, through its PGIM Fixed Income unit, serves as the Fund’s subadviser pursuant to the terms of a subadvisory agreement with PGIM Investments, and between PGIM and PGIML, which serves as the Fund’s sub-subadviser pursuant to the terms of a sub-subadvisory agreement with PGIM, are in the best interests of the Fund and its shareholders in light of the services performed, fees charged and such other matters as the Directors considered relevant in the exercise of their business judgment.
The material factors and conclusions that formed the basis for the Directors’ reaching their determinations to approve the continuance of the agreements are separately discussed below.
Nature, Quality and Extent of Services
The Board received and considered information regarding the nature, quality and extent of services provided to the Fund by PGIM Investments, PGIM Fixed Income, and PGIML. The Board noted that PGIM Fixed Income and PGIML are affiliated with PGIM Investments. The Board considered the services provided by PGIM Investments, including but not limited to the oversight of the subadviser and sub-subadviser for the Fund, as well as the provision of fund recordkeeping, compliance and other services to the Fund, and PGIM Investments’ role as administrator for the Fund’s liquidity risk management program. With respect to PGIM Investments’ oversight of the subadviser and sub-subadviser, the Board noted that PGIM Investments’ Strategic Investment Research Group (“SIRG”), which is a business unit of PGIM Investments, is responsible for monitoring and reporting to PGIM Investments’ senior management on the performance and operations of the subadviser and sub-subadviser. The Board also considered that PGIM Investments pays the salaries of all of the officers and interested Directors of the Fund who are part of Fund management. The Board also considered the investment subadvisory services provided by PGIM Fixed Income and PGIML, including investment research and security selection, as well as adherence to the Fund’s investment restrictions and compliance with applicable Fund policies and procedures. The Board considered PGIM Investments’ evaluation of the subadviser and sub-subadviser, as well as PGIM Investments’ recommendation, based on its review of the subadviser and sub-subadviser, to renew the subadvisory and sub-subadvisory agreements.
The Board considered the qualifications, backgrounds and responsibilities of PGIM Investments’ senior management responsible for the oversight of the Fund, PGIM, and PGIML, and also considered the qualifications, backgrounds and responsibilities of PGIM Fixed Income’s portfolio managers who are responsible for the day-to-day management of the Fund’s portfolio. The Board was provided with information pertaining to PGIM Investments, PGIM Fixed Income’s, and PGIML’s organizational structure, senior management, investment operations, and other relevant information
|
| Visit our website at pgim.com/investments |
pertaining to PGIM Investments, PGIM Fixed Income, and PGIML. The Board also noted that it received favorable compliance reports from the Fund’s Chief Compliance Officer (“CCO”) as to PGIM Investments, PGIM Fixed Income, and PGIML.
The Board concluded that it was satisfied with the nature, extent and quality of the investment management services provided by PGIM Investments, the subadvisory services provided to the Fund by PGIM Fixed Income, and the sub-subadvisory services provided by PGIML, and that there was a reasonable basis on which to conclude that the Fund benefits from the services provided by PGIM Investments, PGIM Fixed Income, and PGIML under the management, subadvisory and sub-subadvisory agreements.
Costs of Services and Profits Realized by PGIM Investments
The Board was provided with information on the profitability of PGIM Investments and its affiliates in serving as the Fund’s investment manager. The Board discussed with PGIM Investments the methodology utilized in assembling the information regarding profitability and considered its reasonableness. The Board recognized that it is difficult to make comparisons of profitability from fund management contracts because comparative information is not generally publicly available and is affected by numerous factors, including the structure of the particular adviser, the types of funds it manages, its business mix, numerous assumptions regarding allocations and the adviser’s capital structure and cost of capital. However, the Board considered that the cost of services provided by PGIM Investments for the year ended December 31, 2020 exceeded the management fees received by PGIM Investments, resulting in an operating loss to PGIM Investments. Taking these factors into account, the Board concluded that the profitability of PGIM Investments and its affiliates in relation to the services rendered was not unreasonable.
Economies of Scale
The Board received and discussed information concerning economies of scale that PGIM Investments may realize as the Fund’s assets grow beyond current levels. The Board noted that the management fee schedule for the Fund includes breakpoints, which have the effect of decreasing the fee rate as assets increase. During the course of time, the Board has considered information regarding the launch date of the Fund, the management fees of the Fund compared to those of similarly managed funds and PGIM Investments investment in the Fund over time. The Board noted that economies of scale may be shared with the Fund in several ways, including low management fees from inception, additional technological and personnel investments to enhance shareholder services, and maintaining existing expense structures in the face of a rising cost environment. The Board considered PGIM Investments’ assertion that it continually evaluates the management fee schedule of the Fund and the potential to share economies of scale through breakpoints or fee waivers as asset levels increase.
PGIM Emerging Markets Debt Local Currency Fund
Approval of Advisory Agreements (continued)
The Board recognized the inherent limitations of any analysis of economies of scale, stemming largely from the Board’s understanding that most of PGIM Investments’ costs are not specific to individual funds, but rather are incurred across a variety of products and services.
Other Benefits to PGIM Investments, PGIM Fixed Income, and PGIML
The Board considered potential ancillary benefits that might be received by PGIM Investments, PGIM Fixed Income, PGIML and their affiliates as a result of their relationship with the Fund. The Board concluded that potential benefits to be derived by PGIM Investments included transfer agency fees received by the Fund’s transfer agent (which is affiliated with PGIM Investments), as well as benefits to its reputation or other intangible benefits resulting from PGIM Investments’ association with the Fund. The Board concluded that the potential benefits to be derived by PGIM Fixed Income and PGIML included the ability to use soft dollar credits, as well as the potential benefits consistent with those generally resulting from an increase in assets under management, specifically, potential access to additional research resources and benefits to their reputations. The Board concluded that the benefits derived by PGIM Investments, PGIM Fixed Income, and PGIML were consistent with the types of benefits generally derived by investment managers and subadvisers to mutual funds.
Performance of the Fund / Fees and Expenses
The Board considered certain additional factors and made related conclusions relating to the historical performance of the Fund for the one-, three- and five-year periods ended December 31, 2020.
The Board also considered the Fund’s actual management fee, as well as the Fund’s net total expense ratio, for the fiscal year ended October 31, 2020. The Board considered the management fee for the Fund as compared to the management fee charged by PGIM Investments to other funds and the fee charged by other advisers to comparable mutual funds in a Peer Group. The actual management fee represents the fee rate actually paid by Fund shareholders and includes any fee waivers or reimbursements. The net total expense ratio for the Fund represents the actual expense ratio incurred by Fund shareholders.
The mutual funds included in the Peer Universe, which was used to consider performance, and the Peer Group, which was used to consider fees and expenses, were objectively determined by Broadridge, an independent provider of mutual fund data. In certain circumstances, PGIM Investments also provided supplemental Peer Universe or Peer Group information, for reasons addressed with the Board. The comparisons placed the Fund in various quartiles over various periods, with the first quartile being the best 25% of the mutual funds (for performance, the best performing mutual funds and, for expenses, the lowest cost mutual funds).
The section below summarizes key factors considered by the Board and the Board’s conclusions regarding the Fund’s performance, fees and overall expenses. The table
|
| Visit our website at pgim.com/investments |
sets forth net performance comparisons (which reflect the impact on performance of fund expenses, or any subsidies, expense caps or waivers that may be applicable) with the Peer Universe, actual management fees with the Peer Group (which reflect the impact of any subsidies or fee waivers), and net total expenses with the Peer Group, each of which were key factors considered by the Board.
| | | | | | | | |
| | | | | |
| Net Performance | | 1 Year | | 3 Years | | 5 Years | | 10 Years |
| | | | | |
| | | 1st Quartile | | 1st Quartile | | 2nd Quartile | | N/A |
| | | |
| Actual Management Fees: 1st Quartile | | | | |
| | |
| Net Total Expenses: 1st Quartile | | |
| | · | | The Board noted that the Fund outperformed its benchmark index over all periods. |
| | · | | The Board and PGIM Investments agreed to retain the existing contractual expense cap that (exclusive of other fees and expenses) caps the Fund’s annual operating expenses at 1.13% for Class A shares, 1.88% for Class C shares, 0.65% for Class R6 shares, and 0.72% for Class Z shares through February 28, 2022. |
| | · | | In addition, PGIM Investments will waive management fees or shared operating expenses on any share class to the same extent that it waives such expenses on any other share class, and has agreed that total annual fund operating expenses for Class R6 shares will not exceed total annual fund operating expenses for Class Z shares. |
| | · | | The Board concluded that, in light of the above, it would be in the best interests of the Fund and its shareholders to renew the agreements. |
| | · | | The Board concluded that the management fees (including subadvisory fees) and total expenses were reasonable in light of the services provided. |
* * *
After full consideration of these factors, the Board concluded that the approval of the agreements was in the best interests of the Fund and its shareholders.
PGIM Emerging Markets Debt Local Currency Fund
| | | | |
∎ MAIL | | ∎ TELEPHONE | | ∎ WEBSITE |
655 Broad Street | | (800) 225-1852 | | pgim.com/investments |
Newark, NJ 07102 | | | | |
|
PROXY VOTING The Board of Directors of the Fund has delegated to the Fund’s subadviser the responsibility for voting any proxies and maintaining proxy recordkeeping with respect to the Fund. A description of these proxy voting policies and procedures is available without charge, upon request, by calling (800) 225-1852 or by visiting the Securities and Exchange Commission’s website at sec.gov. Information regarding how the Fund voted proxies relating to portfolio securities during the most recent 12-month period ended June 30 is available on the Fund’s website and on the Securities and Exchange Commission’s website. |
|
DIRECTORS Ellen S. Alberding · Kevin J. Bannon · Scott E. Benjamin · Linda W. Bynoe · Barry H. Evans · Keith F. Hartstein · Laurie Simon Hodrick · Stuart S. Parker · Brian K. Reid · Grace C. Torres |
|
OFFICERS Stuart S. Parker, President · Scott E. Benjamin, Vice President · Christian J. Kelly, Treasurer and Principal Financial and Accounting Officer · Claudia DiGiacomo, Chief Legal Officer · Dino Capasso, Chief Compliance Officer · Jonathan Corbett, Anti-Money Laundering Compliance Officer · Andrew R. French, Secretary · Melissa Gonzalez, Assistant Secretary · Diana N. Huffman, Assistant Secretary · Kelly A. Coyne, Assistant Secretary · Patrick E. McGuinness, Assistant Secretary · Debra Rubano, Assistant Secretary · Lana Lomuti, Assistant Treasurer · Russ Shupak, Assistant Treasurer · Elyse M. McLaughlin, Assistant Treasurer · Deborah Conway, Assistant Treasurer |
| | | | |
| | |
| MANAGER | | PGIM Investments LLC | | 655 Broad Street Newark, NJ 07102 |
| | |
| SUBADVISER | | PGIM Fixed Income | | 655 Broad Street Newark, NJ 07102 |
| | |
| DISTRIBUTOR | | Prudential Investment
Management Services LLC | | 655 Broad Street Newark, NJ 07102 |
| | |
| CUSTODIAN | | The Bank of New York
Mellon | | 240 Greenwich Street New York, NY 10286 |
| | |
| TRANSFER AGENT | | Prudential Mutual Fund
Services LLC | | PO Box 9658 Providence, RI 02940 |
| | |
INDEPENDENT REGISTERED
PUBLIC ACCOUNTING FIRM | | PricewaterhouseCoopers
LLP | | 300 Madison Avenue New York, NY 10017 |
| | |
| FUND COUNSEL | | Willkie Farr & Gallagher
LLP | | 787 Seventh Avenue New York, NY 10019 |
|
An investor should consider the investment objectives, risks, charges, and expenses of the Fund carefully before investing. The prospectus and summary prospectus contain this and other information about the Fund. An investor may obtain the prospectus and summary prospectus by visiting our website at pgim.com/investments or by calling (800) 225-1852. The prospectus and summary prospectus should be read carefully before investing. |
|
E-DELIVERY To receive your mutual fund documents online, go to pgim.com/investments/resource/edelivery and enroll. Instead of receiving printed documents by mail, you will receive notification via email when new materials are available. You can cancel your enrollment or change your email address at any time by visiting the website address above. |
|
SHAREHOLDER COMMUNICATIONS WITH DIRECTORS Shareholders can communicate directly with the Board of Directors by writing to the Chair of the Board, PGIM Emerging Markets Debt Local Currency Fund, PGIM Investments, Attn: Board of Directors, 655 Broad Street, Newark, NJ 07102. Shareholders can communicate directly with an individual Director by writing to that Director at the same address. Communications are not screened before being delivered to the addressee. |
|
AVAILABILITY OF PORTFOLIO HOLDINGS The Fund files its complete schedule of portfolio holdings with the Securities and Exchange Commission for the first and third quarters of each fiscal year as an exhibit to its reports on Form N-PORT. The Fund’s Form N-PORT filings are available on the Commission’s website at sec.gov. |
|
The Fund’s Statement of Additional Information contains additional information about the Fund’s Directors and is available without charge, upon request, by calling (800) 225-1852. |
Mutual Funds:
| | | | |
| | | |
ARE NOT INSURED BY THE FDIC OR ANY FEDERAL GOVERNMENT AGENCY | | MAY LOSE VALUE | | ARE NOT A DEPOSIT OF OR GUARANTEED BY ANY BANK OR ANY BANK AFFILIATE |
| | | | | | | | | | | | |
| PGIM EMERGING MARKETS DEBT LOCAL CURRENCY FUND | | | | | |
| | | | | | | | |
| | | | |
SHARE CLASS | | A | | C | | | Z | | | | R6 | |
| | | | |
NASDAQ | | EMDAX | | EMDCX | | | EMDZX | | | | EMDQX | |
| | | | |
CUSIP | | 743969750 | | 743969743 | | | 743969727 | | | | 743969735 | |
MF212E

PGIM JENNISON EMERGING MARKETS EQUITY
OPPORTUNITIES FUND
ANNUAL REPORT
OCTOBER 31, 2021

|
|
| To enroll in e-delivery, go to pgim.com/investments/resource/edelivery |
Table of Contents
This report is not authorized for distribution to prospective investors unless preceded or accompanied by a current prospectus.
The views expressed in this report and information about the Fund’s portfolio holdings are for the period covered by this report and are subject to change thereafter.
Mutual funds are distributed by Prudential Investment Management Services LLC, member SIPC. Jennison Associates LLC is a registered investment adviser. Both are Prudential Financial companies. © 2021 Prudential Financial, Inc. and its related entities. Jennison Associates, Jennison, PGIM, and the PGIM logo are service marks of Prudential Financial, Inc. and its related entities, registered in many jurisdictions worldwide.
2 Visit our website at pgim.com/investments
Letter from the President
|
 Dear Shareholder: Dear Shareholder:
We hope you find the annual report for the PGIM Jennison Emerging Markets Equity Opportunities Fund informative and useful. The report covers performance for the 12-month period that ended October 31, 2021. The global economy and markets continued to recover throughout the period from the ongoing impact of the COVID-19 pandemic. The Federal Reserve slashed interest rates and kept them near zero to encourage borrowing. Congress passed stimulus bills worth several trillion dollars to help consumers and businesses. And several effective COVID-19 vaccines received regulatory approval. Those measures were enough to offset the fear of rising inflation and supply chain challenges that threatened to disrupt growth. |
At the start of the period, stocks had recovered most of the steep losses they had suffered at the onset of the pandemic. Equities rallied as states reopened their economies but became more volatile as investors worried that a surge in COVID-19 infections would stall the recovery. However, rising corporate profits and economic growth, the resolution of the US presidential election, and the global rollout of approved vaccines lifted equity markets to record levels, helping stocks around the globe post gains for the full period.
Throughout this volatile period, investors sought safety in fixed income. Investment-grade bonds in the US and the overall global bond market declined slightly during the period as the economy recovered, but emerging market debt rose. While the 10-year US Treasury yield hovered near record lows early in the period after a significant rally in interest rates, rates moved higher later on as investors began to focus on stronger economic growth and the prospects of higher inflation. The Fed also took several aggressive actions to keep the bond markets running smoothly, implementing many of the relief programs that proved to be successful in helping end the global financial crisis in 2008-09.
Regarding your investments with PGIM, we believe it is important to maintain a diversified portfolio of funds consistent with your tolerance for risk, time horizon, and financial goals. Your financial advisor can help you create a diversified investment plan that may include funds covering all the basic asset classes and that reflects your personal investor profile and risk tolerance. However, diversification and asset allocation strategies do not assure a profit or protect against loss in declining markets.
At PGIM Investments, we consider it a great privilege and responsibility to help investors participate in opportunities across global markets while meeting their toughest investment challenges. PGIM is a top-10 global investment manager with more than $1.5 trillion in assets under management. This scale and investment expertise allow us to deliver actively managed funds and strategies to meet the needs of investors around the globe.
Thank you for choosing our family of funds.
Sincerely,

Stuart S. Parker, President
PGIM Jennison Emerging Markets Equity Opportunities Fund
December 15, 2021
PGIM Jennison Emerging Markets Equity Opportunities Fund 3
Your Fund’s Performance (unaudited)
Performance data quoted represent past performance. Past performance does not guarantee future results. The investment return and principal value of an investment will fluctuate so that an investor’s shares, when redeemed, may be worth more or less than their original cost. Current performance may be lower or higher than the past performance data quoted. An investor may obtain performance data as of the most recent month-end by visiting our website at pgim.com/investments or by calling (800) 225-1852.
| | | | | | |
| |
| | | Average Annual Total Returns as of 10/31/21 |
| | | One Year (%) | | Five Years (%) | | Since Inception (%) |
| | | |
Class A | | | | | | |
| | | |
(with sales charges) | | 26.61 | | 19.07 | | 11.95 (09/16/2014) |
| | | |
(without sales charges) | | 33.98 | | 20.43 | | 12.84 (09/16/2014) |
| | | |
Class C | | | | | | |
| | | |
(with sales charges) | | 31.96 | | 19.51 | | 12.00 (09/16/2014) |
| | | |
(without sales charges) | | 32.96 | | 19.51 | | 12.00 (09/16/2014) |
| | | |
Class Z | | | | | | |
| | | |
(without sales charges) | | 34.24 | | 20.72 | | 13.12 (09/16/2014) |
| | | |
Class R6 | | | | | | |
| | | |
(without sales charges) | | 34.30 | | 20.73 | | 13.13 (09/16/2014) |
| | | |
MSCI Emerging Markets Index | | | | | | |
| | | |
| | | 16.96 | | 9.39 | | 5.69 |
Since Inception returns are provided since the Fund has less than 10 fiscal years of returns. Since Inception returns for the Index are measured from the closest month-end to the Fund’s inception date.
4 Visit our website at pgim.com/investments
Growth of a $10,000 Investment (unaudited)
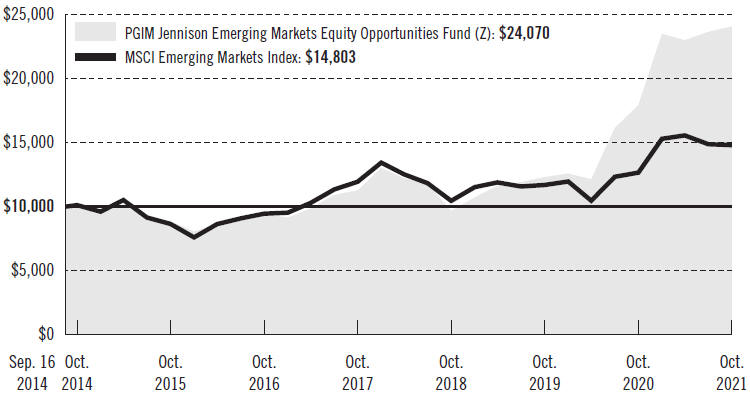
The graph compares a $10,000 investment in the Fund’s Class Z shares with a similar investment in the MSCI Emerging Markets Index, by portraying the initial account values at the commencement of operations for Class Z shares (September 16, 2014) and the account values at the end of the current fiscal year (October 31, 2021), as measured on a quarterly basis. For purposes of the graph, and unless otherwise indicated, it has been assumed that (a) all recurring fees (including management fees) were deducted and (b) all dividends and distributions were reinvested. The line graph provides information for Class Z shares only. As indicated in the tables provided earlier, performance for other share classes will vary due to the differing fees and expenses applicable to each share class (as indicated in the following paragraphs). Without waiver of fees and/or expense reimbursements, if any, the returns would have been lower.
Past performance does not predict future performance. Total returns and the ending account values in the graph include changes in share price and reinvestment of dividends and capital gains distributions in a hypothetical investment for the periods shown. The Fund’s total returns do not reflect the deduction of income taxes on an individual’s investment. Taxes may reduce your actual investment returns on income or gains paid by the Fund or any gains you may realize if you sell your shares.
PGIM Jennison Emerging Markets Equity Opportunities Fund 5
Your Fund’s Performance (continued)
The returns in the tables do not reflect the deduction of taxes that a shareholder would pay on Fund distributions or following the redemption of Fund shares. The average annual total returns take into account applicable sales charges, which are described for each share class in the table below.
| | | | | | | | |
| | | | | |
| | | Class A | | Class C | | Class Z | | Class R6 |
| | | | | |
| Maximum initial sales charge | | 5.50% of the public offering price | | None | | None | | None |
| Contingent deferred sales charge (CDSC) (as a percentage of the lower of the original purchase price or the net asset value at redemption) | | 1.00% on sales of $1 million or more made within 12 months of purchase | | 1.00% on sales made within 12 months of purchase | | None | | None |
| Annual distribution and service (12b-1) fees (shown as a percentage of average daily net assets) | | 0.30% (0.25% currently) | | 1.00% | | None | | None |
Benchmark Definitions
MSCI Emerging Markets Index—The MSCI Emerging Markets Index is an unmanaged free float-adjusted market capitalization-weighted index that is designed to measure equity market performance of emerging markets. It consists of the following 27 emerging market country indexes: Argentina, Brazil, Chile, China, Colombia, the Czech Republic, Egypt, Greece, Hungary, India, Indonesia, Korea, Kuwait Malaysia, Mexico, Pakistan, Peru, the Philippines, Poland, Qatar, Russia, Saudi Arabia, South Africa, Taiwan, Thailand, Turkey, and the United Arab Emirates.
Investors cannot invest directly in an index. The returns for the Index would be lower if they included the effects of sales charges, operating expenses of a mutual fund, or taxes that may be paid by an investor.
6 Visit our website at pgim.com/investments
Presentation of Fund Holdings as of 10/31/21
| | | | | | |
| | | |
| Ten Largest Holdings | | Line of Business | | Country | | % of Net Assets |
| | | |
Sea Ltd., ADR | | Entertainment | | Taiwan | | 10.3% |
| | | |
Silergy Corp. | | Semiconductors & Semiconductor Equipment | | China | | 5.4% |
| | | |
Contemporary Amperex Technology Co. Ltd. (Class A Stock) | | Electrical Equipment | | China | | 4.8% |
| | | |
Taiwan Semiconductor Manufacturing Co. Ltd., ADR | | Semiconductors & Semiconductor Equipment | | Taiwan | | 4.6% |
| | | |
Globant SA | | IT Services | | United States | | 4.1% |
| | | |
Samsung SDI Co. Ltd. | | Electronic Equipment, Instruments & Components | | South Korea | | 3.8% |
| | | |
MercadoLibre, Inc. | | Internet & Direct Marketing Retail | | Argentina | | 3.7% |
| | | |
Ashok Leyland Ltd. | | Machinery | | India | | 3.7% |
| | | |
HDFC Bank Ltd., ADR | | Banks | | India | | 3.5% |
| | | |
NAVER Corp. | | Interactive Media & Services | | South Korea | | 2.9% |
Holdings reflect only long-term investments and are subject to change.
PGIM Jennison Emerging Markets Equity Opportunities Fund 7
Strategy and Performance Overview (unaudited)
How did the Fund perform?
The PGIM Jennison Emerging Markets Equity Opportunities Fund’s Class Z shares returned
34.24% in the 12-month reporting period that ended October 31, 2021, outperforming the 16.96% return of the MSCI Emerging Markets Index (the Index).
What were the market conditions?
| · | | In early fall 2020, investors began to favor areas of the market that were most exposed to an economic recovery and most debilitated by the COVID-19 pandemic. This rotation extended into the first quarter of 2021, boosting valuations of cyclical companies and reducing the earnings multiples of secular growth companies. |
| · | | June 2021 marked a turning point in the US economic reopening and reflation outlook, as the Federal Reserve’s comments began to reflect concerns about labor shortages and rising prices. |
| · | | Corporate profit growth through the end of the reporting period was strong, highlighting the expanding recovery and boosting business confidence to its highest level since the early days of the pandemic. |
| · | | The Chinese government took further steps during the period to rein in the activities of many of its largest consumer-facing companies, citing concerns over privacy, unintended usage of consumer data, and the deleterious health effects of excessive amounts of time spent online. Chinese stocks sold off sharply after these moves and the elevated risk of further intervention. |
| · | | In the Index, there was significant disparity among sector returns during the period. The energy, materials, financials, and information technology sectors posted the largest gains. The consumer discretionary, real estate, and communication services sectors had negative returns. |
What worked?
| · | | Stock selection was very strong during the reporting period and added to the Fund’s relative returns in nearly every sector. Reflecting the broad outperformance of the Fund relative to the Index, the largest positive contributors were found among a variety of sectors. |
| | · | | Sea Ltd. drove relative outperformance in the communication services sector, as the company continued to execute and deliver strong gains during the period. Earning results demonstrated significant top-line growth in gaming and e-commerce. The company’s e-commerce opportunity in Southeast Asia continues to offer long-term growth potential for the business, with possible future growth opportunities in Latin America. |
| | · | | Contemporary Amperex Technology Co. is a Chinese battery manufacturer that specializes in the manufacturing of lithium-ion batteries for electric vehicles (EV) and energy storage systems (ESS). Jennison believes the company will benefit |
8 Visit our website at pgim.com/investments
| | from strong secular growth in the EV market as it continues to strengthen its market leadership. The company has enjoyed healthy demand in its three major business lines – EV battery, ESS, and battery materials. |
| | · | | Silergy Corp. is a Taiwan-based analog semiconductor company with operational headquarters in China. Jennison believes that Silergy will benefit from the growth of China’s domestic analog semiconductor industry, which was previously dominated by Western analog companies. Jennison is impressed by management’s track record of innovation, recruiting, and scaling the business, which is difficult for new industry entrants due to high entry barriers related to intellectual property, talent, and customer acquisition. |
| | · | | Li Ning Co. is one of the leading sports brand companies in China that makes professional and leisure footwear, apparel, equipment, and accessories. Jennison believed the company would benefit from several secular growth trends, such as increasing consumer spending power, growing sports participation, and the popularity of athleisure clothing (i.e., hybrid clothing that can be worn playing sports or in non-sports settings). Despite a strong demand rebound and rising domestic brand popularity, Jennison eliminated the Fund’s position in the stock during the period because of the changing regulatory environment in China. |
| | · | | Wuxi Biologics discovers, researches, develops, and manufactures biologics services. As a contract research organization based in China, Jennison thinks Wuxi can benefit from several trends, including increasing research and development outsourcing activities from drug companies, biologics being favored over chemical drugs, and a biotech boom in China. The company enjoyed strong business performance during the period, with better-than-expected contributions from COVID-19 projects. |
What didn’t work?
| | · | | The financials sector detracted most from the Fund’s relative performance due to stock selection and a significantly underweight position in the sector. Less exposure than the Index to the materials sector and a lack of exposure to the energy sector were other sources of weakness. |
| | · | | Several China-based holdings were notable detractors from performance amid investor concerns about the country’s changing regulatory environment. After a crackdown on internet platforms, other industries have become the target of the Chinese government’s heightened scrutiny in 2021, including education and real estate. Although the Fund had no exposure to these industries, Jennison believed that the investing landscape in China could be permanently altered as the government focuses on what it calls “Common Prosperity,” a concept of moderate wealth for all citizens. As Chinese authorities examine sectors of the economy that they deem to have levied an undue burden on the average Chinese citizen, “three big mountains” have been identified, namely property, education, and healthcare. In Jennison’s view, this changing environment led to the underperformance of |
PGIM Jennison Emerging Markets Equity Opportunities Fund 9
Strategy and Performance Overview (continued)
| | several Fund holdings, most notably Alibaba Group Holding Ltd., Galaxy Entertainment Group, Agora Inc., and Meituan. These positions were eliminated during the period, as Jennison’s investment thesis was altered by the changing investment landscape. |
| | · | | Brazil-based VTEX, a new Fund position entered into during the reporting period, is an e-commerce enabler focused on large enterprises. Jennison likes the company because of its position as the leading SaaS (software as a service) digital commerce platform in Latin America, a region with low e-commerce penetration rates. Jennison believes VTEX is well-positioned to capture demand of a growing number of companies looking to execute direct-to-consumer strategies. The company’s share price fell in the brief time after the holding was added to the Fund, but there was no specific catalyst, in Jennison’s view. |
Current outlook
| | · | | As fundamental investors focused on a company’s unique competitive advantage, growth drivers, and addressable markets, Jennison believes it must be keenly aware of the operating environment. Policy changes can have a major impact on a company’s long-term fundamental outlook and equity valuation. During these times, the advantages of an Index-agnostic approach are often evident, in Jennison’s view, allowing the Fund to be nimble and decisive in adjusting portfolio exposures in response to country or regional concerns. |
| | · | | As mentioned previously, the Fund significantly cut back its exposure to China during the reporting period. Jennison is carefully monitoring the regulatory environment in China and will continue to modify the Fund’s positioning in individual companies as needed. As of October 31, 2021, the Fund now has an underweight allocation to China relative to the Index. China is the second-largest country by weight in the portfolio, behind India. |
| | · | | Despite the Fund’s strong performance during the period, Jennison remains comfortable with portfolio-level valuations, along with the reasons behind their expansion. The growth profiles of the companies held by the Fund remain attractive, in Jennison’s opinion, especially secular growth stocks relative to other segments of the market. |
| | · | | Many of the Fund’s long-term holdings continue to have solid and resilient fundamentals and, in Jennison’s view, should see their business models and brands succeed over time. Jennison believes overall market and economic conditions generally favor the Fund’s investment strategy and that a bottom-up approach to stock selection is the best way to navigate market volatility. |
10 Visit our website at pgim.com/investments
Fees and Expenses (unaudited)
As a shareholder of the Fund, you incur two types of costs: (1) transaction costs, including sales charges (loads) on purchase payments and redemptions, as applicable, and (2) ongoing costs, including management fees, distribution and/or service (12b-1) fees, and other Fund expenses, as applicable. This example is intended to help you understand your ongoing costs (in dollars) of investing in the Fund and to compare these costs with the ongoing costs of investing in other mutual funds.
The example is based on an investment of $1,000 held through the six-month period ended October 31, 2021. The example is for illustrative purposes only; you should consult the Prospectus for information on initial and subsequent minimum investment requirements.
Actual Expenses
The first line for each share class in the table on the following page provides information about actual account values and actual expenses. You may use the information on this line, together with the amount you invested, to estimate the expenses that you paid over the period. Simply divide your account value by $1,000 (for example, an $8,600 account value ÷ $1,000 = 8.6), then multiply the result by the number on the first line under the heading “Expenses Paid During the Six-Month Period” to estimate the expenses you paid on your account during this period.
Hypothetical Example for Comparison Purposes
The second line for each share class in the table on the following page provides information about hypothetical account values and hypothetical expenses based on the Fund’s actual expense ratio and an assumed rate of return of 5% per year before expenses, which is not the Fund’s actual return. The hypothetical account values and expenses may not be used to estimate the actual ending account balance or expenses you paid for the period. You may use this information to compare the ongoing costs of investing in the Fund and other funds. To do so, compare this 5% hypothetical example with the 5% hypothetical examples that appear in the shareholder reports of the other funds.
The Fund’s transfer agent may charge additional fees to holders of certain accounts that are not included in the expenses shown in the table on the following page. These fees apply to individual retirement accounts (IRAs) and Section 403(b) accounts. As of the close of the six-month period covered by the table, IRA fees included an annual maintenance fee of $15 per account (subject to a maximum annual maintenance fee of $25 for all accounts held by the same shareholder). Section 403(b) accounts are charged an annual $25 fiduciary maintenance fee. Some of the fees may vary in amount, or may be waived, based on your total account balance or the number of PGIM funds, including the Fund, that you own. You should consider the additional fees that were charged to your Fund account over the six-month period when you estimate the total ongoing expenses paid over the period and the impact of these fees on your ending account value, as these additional expenses are not reflected in the information
PGIM Jennison Emerging Markets Equity Opportunities Fund 11
Fees and Expenses (continued)
provided in the expense table. Additional fees have the effect of reducing investment returns.
Please note that the expenses shown in the table are meant to highlight your ongoing costs only and do not reflect any transactional costs such as sales charges (loads). Therefore, the second line for each share class in the table is useful in comparing ongoing costs only and will not help you determine the relative total costs of owning different funds. In addition, if these transactional costs were included, your costs would have been higher.
| | | | | | | | | | |
| | | | |
PGIM Jennison Emerging Markets Equity Opportunities Fund | | Beginning Account Value May 1, 2021 | | Ending Account Value October 31, 2021 | | Annualized Expense Ratio Based on the Six-Month Period | | Expenses Paid During the Six-Month Period* |
| | | | | |
Class A | | Actual | | $1,000.00 | | $1,045.50 | | 1.30% | | $ 6.70 |
| | | | | |
| | Hypothetical | | $1,000.00 | | $1,018.65 | | 1.30% | | $ 6.61 |
| | | | | |
Class C | | Actual | | $1,000.00 | | $1,041.30 | | 2.05% | | $10.55 |
| | | | | |
| | Hypothetical | | $1,000.00 | | $1,014.87 | | 2.05% | | $10.41 |
| | | | | |
Class Z | | Actual | | $1,000.00 | | $1,046.50 | | 1.05% | | $ 5.42 |
| | | | | |
| | Hypothetical | | $1,000.00 | | $1,019.91 | | 1.05% | | $ 5.35 |
| | | | | |
Class R6 | | Actual | | $1,000.00 | | $1,047.00 | | 0.98% | | $ 5.06 |
| | | | | |
| | | Hypothetical | | $1,000.00 | | $1,020.27 | | 0.98% | | $ 4.99 |
*Fund expenses (net of fee waivers or subsidies, if any) for each share class are equal to the annualized expense ratio for each share class (provided in the table), multiplied by the average account value over the period, multiplied by the 184 days in the six-month period ended October 31, 2021, and divided by the 365 days in the Fund’s fiscal year ended October 31, 2021 (to reflect the six-month period). Expenses presented in the table include the expenses of any underlying portfolios in which the Fund may invest.
12 Visit our website at pgim.com/investments
Schedule of Investments
as of October 31, 2021
| | | | | | | | |
| | |
| Description | | Shares | | | Value | |
| | |
LONG-TERM INVESTMENTS 93.7% | | | | | | | | |
| | |
COMMON STOCKS | | | | | | | | |
| | |
Argentina 3.7% | | | | | | | | |
| | |
MercadoLibre, Inc.* | | | 25,524 | | | $ | 37,801,554 | |
| | |
Brazil 1.0% | | | | | | | | |
| | |
VTEX (Class A Stock)*(a) | | | 652,307 | | | | 10,417,343 | |
| | |
China 18.9% | | | | | | | | |
| | |
Contemporary Amperex Technology Co. Ltd. (Class A Stock) | | | 485,017 | | | | 48,421,401 | |
Innovent Biologics, Inc., 144A* | | | 1,238,979 | | | | 11,093,111 | |
JD.com, Inc., ADR* | | | 266,019 | | | | 20,823,967 | |
LONGi Green Energy Technology Co. Ltd. (Class A Stock) | | | 1,045,229 | | | | 15,940,615 | |
Pharmaron Beijing Co. Ltd. (Class H Stock), 144A | | | 924,051 | | | | 20,025,165 | |
Silergy Corp. | | | 329,810 | | | | 54,715,746 | |
Wuxi Biologics Cayman, Inc., 144A* | | | 1,292,797 | | | | 19,629,722 | |
| | | | | | | | |
| | |
| | | | | | | 190,649,727 | |
| | |
India 28.2% | | | | | | | | |
| | |
Apollo Hospitals Enterprise Ltd. | | | 271,765 | | | | 15,520,781 | |
Ashok Leyland Ltd. | | | 19,306,330 | | | | 36,939,551 | |
Asian Paints Ltd. | | | 505,187 | | | | 20,993,349 | |
Avenue Supermarts Ltd., 144A* | | | 298,422 | | | | 18,566,610 | |
Divi’s Laboratories Ltd. | | | 303,890 | | | | 20,960,782 | |
Dr. Lal PathLabs Ltd., 144A | | | 280,196 | | | | 13,188,333 | |
HDFC Bank Ltd., ADR | | | 490,347 | | | | 35,260,853 | |
HDFC Life Insurance Co. Ltd., 144A | | | 2,417,889 | | | | 22,043,423 | |
Hindustan Unilever Ltd. | | | 536,297 | | | | 17,182,910 | |
MakeMyTrip Ltd.*(a) | | | 872,036 | | | | 27,617,380 | |
Titan Co. Ltd. | | | 885,537 | | | | 28,317,145 | |
Zomato Ltd.* | | | 16,058,398 | | | | 28,351,250 | |
| | | | | | | | |
| | |
| | | | | | | 284,942,367 | |
| | |
Indonesia 4.8% | | | | | | | | |
| | |
Bank Central Asia Tbk PT | | | 47,391,452 | | | | 25,082,255 | |
Bank Jago Tbk PT* | | | 21,841,068 | | | | 23,923,390 | |
| | | | | | | | |
| | |
| | | | | | | 49,005,645 | |
| | |
South Korea 9.4% | | | | | | | | |
| | |
Coupang, Inc.* | | | 518,413 | | | | 15,427,971 | |
NAVER Corp. | | | 83,213 | | | | 29,245,063 | |
See Notes to Financial Statements.
PGIM Jennison Emerging Markets Equity Opportunities Fund 13
Schedule of Investments (continued)
as of October 31, 2021
| | | | | | | | |
| | |
| Description | | Shares | | | Value | |
| | |
COMMON STOCKS (Continued) | | | | | | | | |
| | |
South Korea (cont’d.) | | | | | | | | |
| | |
Samsung Biologics Co. Ltd., 144A* | | | 16,200 | | | $ | 12,117,403 | |
Samsung SDI Co. Ltd. | | | 60,298 | | | | 38,191,214 | |
| | | | | | | | |
| | |
| | | | | | | 94,981,651 | |
| | |
Taiwan 14.9% | | | | | | | | |
| | |
Sea Ltd., ADR* | | | 303,854 | | | | 104,395,119 | |
Taiwan Semiconductor Manufacturing Co. Ltd., ADR | | | 404,570 | | | | 45,999,609 | |
| | | | | | | | |
| | |
| | | | | | | 150,394,728 | |
| | |
Thailand 4.5% | | | | | | | | |
| | |
Airports of Thailand PCL | | | 10,880,427 | | | | 21,210,039 | |
Minor International PCL* | | | 24,851,315 | | | | 24,654,030 | |
| | | | | | | | |
| | |
| | | | | | | 45,864,069 | |
| | |
United States 6.4% | | | | | | | | |
| | |
Freshworks, Inc. (Class A Stock)* | | | 450,128 | | | | 22,618,932 | |
Globant SA* | | | 130,240 | | | | 41,571,306 | |
| | | | | | | | |
| | |
| | | | | | | 64,190,238 | |
| | |
Uruguay 1.9% | | | | | | | | |
| | |
Dlocal Ltd.* | | | 394,383 | | | | 19,131,519 | |
| | | | | | | | |
| | |
TOTAL LONG-TERM INVESTMENTS
(cost $855,428,100) | | | | | | | 947,378,841 | |
| | | | | | | | |
| | |
SHORT-TERM INVESTMENTS 7.4% | | | | | | | | |
| | |
AFFILIATED MUTUAL FUNDS | | | | | | | | |
PGIM Core Ultra Short Bond Fund(wa) | | | 68,436,389 | | | | 68,436,389 | |
PGIM Institutional Money Market Fund
(cost $6,077,913; includes $6,077,657 of cash collateral for securities on loan)(b)(wa) | | | 6,081,562 | | | | 6,077,913 | |
| | | | | | | | |
| | |
TOTAL SHORT-TERM INVESTMENTS
(cost $74,514,302) | | | | | | | 74,514,302 | |
| | | | | | | | |
| | |
TOTAL INVESTMENTS 101.1%
(cost $929,942,402) | | | | | | | 1,021,893,143 | |
Liabilities in excess of other assets (1.1)% | | | | | | | (11,537,163 | ) |
| | | | | | | | |
| | |
NET ASSETS 100.0% | | | | | | $ | 1,010,355,980 | |
| | | | | | | | |
See Notes to Financial Statements.
14
Below is a list of the abbreviation(s) used in the annual report:
144A—Security was purchased pursuant to Rule 144A under the Securities Act of 1933 and, pursuant to the requirements of Rule 144A, may not be resold except to qualified institutional buyers.
ADR—American Depositary Receipt
LIBOR—London Interbank Offered Rate
| * | Non-income producing security. |
| (a) | All or a portion of security is on loan. The aggregate market value of such securities, including those sold and pending settlement, is $5,441,666; cash collateral of $6,077,657 (included in liabilities) was received with which the Fund purchased highly liquid short-term investments. In the event of significant appreciation in value of securities on loan on the last business day of the reporting period, the Fund may reflect a collateral value that is less than the market value of the loaned securities and such shortfall is remedied the following business day. |
| (b) | Represents security, or portion thereof, purchased with cash collateral received for securities on loan and includes dividend reinvestment. |
| (wa) | PGIM Investments LLC, the manager of the Fund, also serves as manager of the PGIM Core Ultra Short Bond Fund and |
PGIM Institutional Money Market Fund, if applicable.
Fair Value Measurements:
Various inputs are used in determining the value of the Fund’s investments. These inputs are summarized in the three broad levels listed below.
Level 1—unadjusted quoted prices generally in active markets for identical securities.
Level 2—quoted prices for similar securities, interest rates and yield curves, prepayment speeds, foreign currency exchange rates and other observable inputs.
Level 3—unobservable inputs for securities valued in accordance with Board approved fair valuation procedures.
The following is a summary of the inputs used as of October 31, 2021 in valuing such portfolio securities:
| | | | | | | | | | | | | | | | | | | | |
| | | Level 1 | | | Level 2 | | | Level 3 | |
| | | | | |
Investments in Securities | | | | | | | | | | | | | | | | | | | | |
Assets | | | | | | | | | | | | | | | | | | | | |
Long-Term Investments | | | | | | | | | | | | | | | | | | | | |
Common Stocks | | | | | | | | | | | | | | | | | | | | |
Argentina | | $ | 37,801,554 | | | $ | — | | | | | | | | $— | | | | | |
Brazil | | | 10,417,343 | | | | — | | | | | | | | — | | | | | |
China | | | 20,823,967 | | | | 169,825,760 | | | | | | | | — | | | | | |
India | | | 62,878,233 | | | | 222,064,134 | | | | | | | | — | | | | | |
Indonesia | | | — | | | | 49,005,645 | | | | | | | | — | | | | | |
South Korea | | | 15,427,971 | | | | 79,553,680 | | | | | | | | — | | | | | |
Taiwan | | | 150,394,728 | | | | — | | | | | | | | — | | | | | |
Thailand. | | | — | | | | 45,864,069 | | | | | | | | — | | | | | |
United States | | | 64,190,238 | | | | — | | | | | | | | — | | | | | |
Uruguay | | | 19,131,519 | | | | — | | | | | | | | — | | | | | |
Short-Term Investments | | | | | | | | | | | | | | | | | | | | |
Affiliated Mutual Funds. | | | 74,514,302 | | | | — | | | | | | | | — | | | | | |
| | | | | | | | | | | | | | | | | | | | |
| | | | | |
Total | | $ | 455,579,855 | | | $ | 566,313,288 | | | | | | | | $— | | | | | |
| | | | | | | | | | | | |
See Notes to Financial Statements.
PGIM Jennison Emerging Markets Equity Opportunities Fund 15
Schedule of Investments (continued)
as of October 31, 2021
Industry Classification:
The industry classification of investments and liabilities in excess of other assets shown as a percentage of net assets as of October 31, 2021 were as follows (unaudited):
| | | | |
Semiconductors & Semiconductor Equipment | | | 11.6 | % |
Entertainment | | | 10.3 | |
Internet & Direct Marketing Retail | | | 10.1 | |
Banks | | | 8.3 | |
Affiliated Mutual Funds (0.6% represents investments purchased with collateral from securities on loan) | | | 7.4 | |
Life Sciences Tools & Services | | | 7.2 | |
IT Services | | | 6.0 | |
Hotels, Restaurants & Leisure | | | 5.1 | |
Electrical Equipment | | | 4.8 | |
Interactive Media & Services | | | 3.9 | |
Electronic Equipment, Instruments & Components | | | 3.8 | |
Machinery | | | 3.7 | |
Health Care Providers & Services | | | 2.8 | |
| | | | |
Textiles, Apparel & Luxury Goods | | | 2.8 | % |
Software | | | 2.3 | |
Insurance | | | 2.2 | |
Transportation Infrastructure | | | 2.1 | |
Chemicals | | | 2.1 | |
Food & Staples Retailing | | | 1.8 | |
Household Products | | | 1.7 | |
Biotechnology | | | 1.1 | |
| | | | |
| |
| | | 101.1 | |
Liabilities in excess of other assets | | | (1.1 | ) |
| | | | |
| |
| | | 100.0 | % |
| | | | |
Financial Instruments/Transactions—Summary of Offsetting and Netting Arrangements:
The Fund entered into financial instruments/transactions during the reporting period that are either offset in accordance with current requirements or are subject to enforceable master netting arrangements or similar agreements that permit offsetting. The information about offsetting and related netting arrangements for financial instruments/transactions where the legal right to set-off exists is presented in the summary below.
Offsetting of financial instrument/transaction assets and liabilities:
| | | | | | | | | | | | | | | |
Description | | Gross Market Value of Recognized Assets/(Liabilities) | | Collateral Pledged/(Received)(1) | | Net Amount |
| | | |
Securities on Loan | | | $ | 5,441,666 | | | | $ | (5,441,666 | ) | | | $ | — | |
| | | | | | | | | | | | | | | |
| (1) | Collateral amount disclosed by the Fund is limited to the market value of financial instruments/transactions. |
See Notes to Financial Statements.
16
Statement of Assets and Liabilities
as of October 31, 2021
| | | | | | |
Assets | | | | | | |
| | |
Investments at value, including securities on loan of $5,441,666: | | | | | | |
Unaffiliated investments (cost $855,428,100) | | $ | 947,378,841 | | | |
Affiliated investments (cost $74,514,302) | | | 74,514,302 | | | |
Foreign currency, at value (cost $927,814) | | | 924,766 | | | |
Receivable for Fund shares sold | | | 24,066,263 | | | |
Receivable for investments sold | | | 399,092 | | | |
Dividends receivable | | | 104,496 | | | |
Prepaid expenses | | | 3,977 | | | |
| | | | | | |
| | |
Total Assets | | | 1,047,391,737 | | | |
| | | | | | |
| | |
Liabilities | | | | | | |
| | |
Payable for Fund shares purchased | | | 15,157,656 | | | |
Payable for investments purchased | | | 12,704,394 | | | |
Payable to broker for collateral for securities on loan | | | 6,077,657 | | | |
Foreign capital gains tax liability accrued | | | 2,338,185 | | | |
Management fee payable | | | 413,190 | | | |
Accrued expenses and other liabilities | | | 323,497 | | | |
Distribution fee payable | | | 14,362 | | | |
Affiliated transfer agent fee payable | | | 5,527 | | | |
Directors’ fees payable | | | 1,289 | | | |
| | | | | | |
| | |
Total Liabilities | | | 37,035,757 | | | |
| | | | | | |
| | |
Net Assets | | $ | 1,010,355,980 | | | |
| | | | | | |
| | |
| | | | | | | |
| | |
Net assets were comprised of: | | | | | | |
Common stock, at par | | $ | 420 | | | |
Paid-in capital in excess of par | | | 956,673,693 | | | |
Total distributable earnings (loss) | | | 53,681,867 | | | |
| | | | | | |
| | |
Net assets, October 31, 2021 | | $ | 1,010,355,980 | | | |
| | | | | | |
See Notes to Financial Statements.
PGIM Jennison Emerging Markets Equity Opportunities Fund 17
Statement of Assets and Liabilities
as of October 31, 2021
| | | | | | |
| | |
Class A | | | | | | |
| | |
Net asset value and redemption price per share, ($47,683,066 ÷ 2,015,401 shares of common stock issued and outstanding) | | $ | 23.66 | | | |
Maximum sales charge (5.50% of offering price) | | | 1.38 | | | |
| | | | | | |
| | |
Maximum offering price to public | | $ | 25.04 | | | |
| | | | | | |
| | |
Class C | | | | | | |
| | |
Net asset value, offering price and redemption price per share, ($5,880,803 ÷ 262,130 shares of common stock issued and outstanding) | | $ | 22.43 | | | |
| | | | | | |
| | |
Class Z | | | | | | |
| | |
Net asset value, offering price and redemption price per share, ($642,315,737 ÷ 26,679,788 shares of common stock issued and outstanding) | | $ | 24.07 | | | |
| | | | | | |
| | |
Class R6 | | | | | | |
| | |
Net asset value, offering price and redemption price per share, ($314,476,374 ÷ 13,057,445 shares of common stock issued and outstanding) | | $ | 24.08 | | | |
| | | | | | |
See Notes to Financial Statements.
18
Statement of Operations
Year Ended October 31, 2021
| | | | |
| |
Net Investment Income (Loss) | | | | |
| |
Income | | | | |
Unaffiliated dividend income (net of $252,410 foreign withholding tax) | | $ | 1,406,978 | |
Income from securities lending, net (including affiliated income of $10,433) | | | 211,109 | |
Affiliated dividend income | | | 24,421 | |
| | | | |
| |
Total income | | | 1,642,508 | |
| | | | |
| |
Expenses | | | | |
Management fee | | | 4,345,071 | |
Distribution fee(a) | | | 119,702 | |
Transfer agent’s fees and expenses (including affiliated expense of $24,736)(a) | | | 443,280 | |
Custodian and accounting fees | | | 320,288 | |
Registration fees(a) | | | 215,098 | |
SEC registration fees | | | 73,056 | |
Shareholders’ reports | | | 47,592 | |
Audit fee | | | 31,033 | |
Legal fees and expenses | | | 21,346 | |
Directors’ fees | | | 13,806 | |
Miscellaneous | | | 63,382 | |
| | | | |
| |
Total expenses | | | 5,693,654 | |
Less: Fee waiver and/or expense reimbursement(a) | | | (861,952 | ) |
Distribution fee waiver(a) | | | (13,155 | ) |
| | | | |
| |
Net expenses | | | 4,818,547 | |
| | | | |
| |
Net investment income (loss) | | | (3,176,039 | ) |
| | | | |
| |
Realized And Unrealized Gain (Loss) On Investment And Foreign Currency Transactions | | | | |
| |
Net realized gain (loss) on: | | | | |
Investment transactions (including affiliated of $(4,794)) (net of foreign capital gains taxes $(5,220)) | | | (31,725,949 | ) |
Foreign currency transactions | | | (297,561 | ) |
| | | | |
| |
| | | (32,023,510 | ) |
| | | | |
Net change in unrealized appreciation (depreciation) on: | | | | |
Investments (including affiliated of $(602)) (net of change in foreign capital gains taxes $(2,334,158)) | | | 71,374,928 | |
Foreign currencies | | | (2,241 | ) |
| | | | |
| |
| | | 71,372,687 | |
| | | | |
| |
Net gain (loss) on investment and foreign currency transactions | | | 39,349,177 | |
| | | | |
| |
Net Increase (Decrease) In Net Assets Resulting From Operations | | $ | 36,173,138 | |
| | | | |
| (a) | Class specific expenses and waivers were as follows: |
| | | | | | | | | | | | | | | | |
| | | Class A | | | Class C | | | Class Z | | | Class R6 | |
| | | | |
Distribution fee | | | 78,927 | | | | 40,775 | | | | — | | | | — | |
Transfer agent’s fees and expenses | | | 36,709 | | | | 6,027 | | | | 400,005 | | | | 539 | |
Registration fees | | | 23,988 | | | | 15,625 | | | | 104,911 | | | | 70,574 | |
Fee waiver and/or expense reimbursement | | | (67,357) | | | | (22,488) | | | | (585,401) | | | | (186,706) | |
Distribution fee waiver | | | (13,155) | | | | — | | | | — | | | | — | |
See Notes to Financial Statements.
PGIM Jennison Emerging Markets Equity Opportunities Fund 19
Statements of Changes in Net Assets
| | | | | | | | |
| |
| | | Year Ended | |
| | | October 31, | |
| | | | |
| | |
| | | 2021 | | | 2020 | |
| | |
Increase (Decrease) in Net Assets | | | | | | | | |
| | |
Operations | | | | | | | | |
Net investment income (loss) | | $ | (3,176,039 | ) | | $ | (263,560 | ) |
Net realized gain (loss) on investment and foreign currency transactions | | | (32,023,510 | ) | | | 700,191 | |
Net change in unrealized appreciation (depreciation) on investments and foreign currencies | | | 71,372,687 | | | | 12,802,353 | |
| | | | | | | | |
| | |
Net increase (decrease) in net assets resulting from operations | | | 36,173,138 | | | | 13,238,984 | |
| | | | | | | | |
| | |
Fund share transactions (Net of share conversions) | | | | | | | | |
Net proceeds from shares sold | | | 1,123,848,738 | | | | 33,021,175 | |
Cost of shares purchased | | | (210,706,003 | ) | | | (4,808,707 | ) |
| | | | | | | | |
| | |
Net increase (decrease) in net assets from Fund share transactions | | | 913,142,735 | | | | 28,212,468 | |
| | | | | | | | |
| | |
Total increase (decrease) | | | 949,315,873 | | | | 41,451,452 | |
| | |
Net Assets: | | | | | | | | |
Beginning of year | | | 61,040,107 | | | | 19,588,655 | |
| | | | | | | | |
| | |
End of year | | $ | 1,010,355,980 | | | $ | 61,040,107 | |
| | | | | | | | |
See Notes to Financial Statements.
20
Financial Highlights
| | | | | | | | | | | | | | | | | | | | |
| |
Class A Shares | |
| | | Year Ended October 31, | |
| | | | | | |
| | | 2021 | | | 2020 | | | 2019 | | | 2018 | | | 2017 | |
| | | | | |
| Per Share Operating Performance(a): | | | | | | | | | | | | | | | | | | | | |
| Net Asset Value, Beginning of Year | | | $17.66 | | | | $12.16 | | | | $9.58 | | | | $11.19 | | | | $9.34 | |
Income (loss) from investment operations: | | | | | | | | | | | | | | | | | | | | |
Net investment income (loss) | | | (0.23 | ) | | | (0.14 | ) | | | (0.04 | ) | | | (0.04 | ) | | | (0.04 | ) |
| Net realized and unrealized gain (loss) on investment and foreign currency transactions | | | 6.23 | | | | 5.64 | | | | 2.62 | | | | (1.57 | ) | | | 1.89 | |
Total from investment operations | | | 6.00 | | | | 5.50 | | | | 2.58 | | | | (1.61 | ) | | | 1.85 | |
Net asset value, end of year | | | $23.66 | | | | $17.66 | | | | $12.16 | | | | $9.58 | | | | $11.19 | |
Total Return(b): | | | 33.98 | % | | | 45.23 | % | | | 26.93 | % | | | (14.39 | )% | | | 19.81 | % |
| | | | | | | | | | | | | | | | | | | | | |
| |
Ratios/Supplemental Data: | |
Net assets, end of year (000) | | | $47,683 | | | | $6,144 | | | | $3,806 | | | | $2,316 | | | | $2,204 | |
Average net assets (000) | | | $26,309 | | | | $4,507 | | | | $3,074 | | | | $2,956 | | | | $1,363 | |
Ratios to average net assets(c)(d): | | | | | | | | | | | | | | | | | | | | |
Expenses after waivers and/or expense reimbursement | | | 1.33 | % | | | 1.45 | % | | | 1.45 | % | | | 1.45 | % | | | 1.45 | % |
Expenses before waivers and/or expense reimbursement | | | 1.64 | % | | | 2.61 | % | | | 3.35 | % | | | 3.27 | % | | | 3.28 | % |
Net investment income (loss) | | | (0.98 | )% | | | (0.99 | )% | | | (0.37 | )% | | | (0.35 | )% | | | (0.35 | )% |
Portfolio turnover rate(e) | | | 78 | % | | | 58 | % | | | 33 | % | | | 23 | % | | | 45 | % |
| (a) | Calculated based on average shares outstanding during the year. |
| (b) | Total return does not consider the effects of sales loads. Total return is calculated assuming a purchase of a share on the first day and a sale on the last day of each year reported and includes reinvestment of dividends and distributions, if any. Total returns may reflect adjustments to conform to GAAP. |
| (c) | Does not include expenses of the underlying funds in which the Fund invests. |
| (d) | Effective November 1, 2017, class specific expenses include transfer agent fees and expenses and registration fees, which are charged to their respective share class. |
| (e) | The Fund’s portfolio turnover rate is calculated in accordance with regulatory requirements, without regard to transactions involving short-term investments and certain derivatives. If such transactions were included, the Fund’s portfolio turnover rate may be higher. |
See Notes to Financial Statements.
PGIM Jennison Emerging Markets Equity Opportunities Fund 21
Financial Highlights (continued)
| | | | | | | | | | | | | | | | | | | | |
| |
Class C Shares | |
| | | Year Ended October 31, | |
| | | | | | |
| | | 2021 | | | 2020 | | | 2019 | | | 2018 | | | 2017 | |
| | | | | |
| Per Share Operating Performance(a): | | | | | | | | | | | | | | | | | | | | |
| Net Asset Value, Beginning of Year | | | $16.88 | | | | $11.71 | | | | $9.29 | | | | $10.93 | | | | $9.20 | |
Income (loss) from investment operations: | | | | | | | | | | | | | | | | | | | | |
Net investment income (loss) | | | (0.39 | ) | | | (0.23 | ) | | | (0.11 | ) | | | (0.13 | ) | | | (0.11 | ) |
| Net realized and unrealized gain (loss) on investment and foreign currency transactions | | | 5.94 | | | | 5.40 | | | | 2.53 | | | | (1.51 | ) | | | 1.84 | |
Total from investment operations | | | 5.55 | | | | 5.17 | | | | 2.42 | | | | (1.64 | ) | | | 1.73 | |
Net asset value, end of year | | | $22.43 | | | | $16.88 | | | | $11.71 | | | | $9.29 | | | | $10.93 | |
Total Return(b): | | | 32.96 | % | | | 44.06 | % | | | 26.05 | % | | | (15.00 | )% | | | 18.80 | % |
| | | | | | | | | | | | | | | | | | | | | |
| |
Ratios/Supplemental Data: | |
Net assets, end of year (000) | | | $5,881 | | | | $1,563 | | | | $1,107 | | | | $1,363 | | | | $1,516 | |
Average net assets (000) | | | $4,077 | | | | $1,244 | | | | $1,438 | | | | $1,775 | | | | $973 | |
Ratios to average net assets(c)(d): | | | | | | | | | | | | | | | | | | | | |
Expenses after waivers and/or expense reimbursement | | | 2.09 | % | | | 2.20 | % | | | 2.20 | % | | | 2.20 | % | | | 2.20 | % |
Expenses before waivers and/or expense reimbursement | | | 2.65 | % | | | 4.15 | % | | | 4.23 | % | | | 4.20 | % | | | 4.00 | % |
Net investment income (loss) | | | (1.76 | )% | | | (1.73 | )% | | | (1.05 | )% | | | (1.14 | )% | | | (1.17 | )% |
Portfolio turnover rate(e) | | | 78 | % | | | 58 | % | | | 33 | % | | | 23 | % | | | 45 | % |
| (a) | Calculated based on average shares outstanding during the year. |
| (b) | Total return does not consider the effects of sales loads. Total return is calculated assuming a purchase of a share on the first day and a sale on the last day of each year reported and includes reinvestment of dividends and distributions, if any. Total returns may reflect adjustments to conform to GAAP. |
| (c) | Does not include expenses of the underlying funds in which the Fund invests. |
| (d) | Effective November 1, 2017, class specific expenses include transfer agent fees and expenses and registration fees, which are charged to their respective share class. |
| (e) | The Fund’s portfolio turnover rate is calculated in accordance with regulatory requirements, without regard to transactions involving short-term investments and certain derivatives. If such transactions were included, the Fund’s portfolio turnover rate may be higher. |
See Notes to Financial Statements.
22
| | | | | | | | | | | | | | | | | | | | |
| |
| Class Z Shares | |
| | | Year Ended October 31, | |
| | | | | | |
| | | 2021 | | | 2020 | | | 2019 | | | 2018 | | | 2017 | |
| | | | | |
| Per Share Operating Performance(a): | | | | | | | | | | | | | | | | | | | | |
| Net Asset Value, Beginning of Year | | | $17.93 | | | | $12.31 | | | | $9.67 | | | | $11.27 | | | | $9.39 | |
| Income (loss) from investment operations: | | | | | | | | | | | | | | | | | | | | |
| Net investment income (loss) | | | (0.17 | ) | | | (0.13 | ) | | | (0.01 | ) | | | (0.01 | ) | | | (0.02 | ) |
| Net realized and unrealized gain (loss) on investment and foreign currency transactions | | | 6.31 | | | | 5.75 | | | | 2.65 | | | | (1.59 | ) | | | 1.90 | |
| Total from investment operations | | | 6.14 | | | | 5.62 | | | | 2.64 | | | | (1.60 | ) | | | 1.88 | |
| Net asset value, end of year | | | $24.07 | | | | $17.93 | | | | $12.31 | | | | $9.67 | | | | $11.27 | |
| Total Return(b): | | | 34.24 | % | | | 45.65 | % | | | 27.30 | % | | | (14.20 | )% | | | 20.02 | % |
| | | | | | | | | | | | | | | | | | | | | |
| |
| Ratios/Supplemental Data: | |
| Net assets, end of year (000) | | | $642,316 | | | | $34,993 | | | | $2,357 | | | | $1,215 | | | | $980 | |
| Average net assets (000) | | | $293,229 | | | | $11,195 | | | | $1,866 | | | | $1,443 | | | | $490 | |
| Ratios to average net assets(c)(d): | | | | | | | | | | | | | | | | | | | | |
| Expenses after waivers and/or expense reimbursement | | | 1.08 | % | | | 1.20 | % | | | 1.20 | % | | | 1.20 | % | | | 1.20 | % |
| Expenses before waivers and/or expense reimbursement | | | 1.28 | % | | | 1.93 | % | | | 3.17 | % | | | 3.56 | % | | | 2.94 | % |
| Net investment income (loss) | | | (0.72 | )% | | | (0.83 | )% | | | (0.08 | )% | | | (0.13 | )% | | | (0.19 | )% |
| Portfolio turnover rate(e) | | | 78 | % | | | 58 | % | | | 33 | % | | | 23 | % | | | 45 | % |
| (a) | Calculated based on average shares outstanding during the year. |
| (b) | Total return is calculated assuming a purchase of a share on the first day and a sale on the last day of each year reported and includes reinvestment of dividends and distributions, if any. Total returns may reflect adjustments to conform to GAAP. |
| (c) | Does not include expenses of the underlying funds in which the Fund invests. |
| (d) | Effective November 1, 2017, class specific expenses include transfer agent fees and expenses and registration fees, which are charged to their respective share class. |
| (e) | The Fund’s portfolio turnover rate is calculated in accordance with regulatory requirements, without regard to transactions involving short-term investments and certain derivatives. If such transactions were included, the Fund’s portfolio turnover rate may be higher. |
See Notes to Financial Statements.
PGIM Jennison Emerging Markets Equity Opportunities Fund 23
Financial Highlights (continued)
| | | | | | | | | | | | | | | | | | | | |
| |
| Class R6 Shares | |
| | | Year Ended October 31, | |
| | | | | | |
| | | 2021 | | | 2020 | | | 2019 | | | 2018 | | | 2017 | |
| | | | | |
| Per Share Operating Performance(a): | | | | | | | | | | | | | | | | | | | | |
| Net Asset Value, Beginning of Year | | | $17.93 | | | | $12.31 | | | | $9.67 | | | | $11.27 | | | | $9.39 | |
| Income (loss) from investment operations: | | | | | | | | | | | | | | | | | | | | |
| Net investment income (loss) | | | (0.15 | ) | | | (0.10 | ) | | | (0.01 | ) | | | (0.02 | ) | | | (0.01 | ) |
| Net realized and unrealized gain (loss) on investment and foreign currency transactions | | | 6.30 | | | | 5.72 | | | | 2.65 | | | | (1.58 | ) | | | 1.89 | |
| Total from investment operations | | | 6.15 | | | | 5.62 | | | | 2.64 | | | | (1.60 | ) | | | 1.88 | |
| Net asset value, end of year | | | $24.08 | | | | $17.93 | | | | $12.31 | | | | $9.67 | | | | $11.27 | |
| Total Return(b): | | | 34.30 | % | | | 45.65 | % | | | 27.30 | % | | | (14.20 | )% | | | 20.02 | % |
| | | | | | | | | | | | | | | | | | | | | |
| |
| Ratios/Supplemental Data: | |
| Net assets, end of year (000) | | | $314,476 | | | | $18,340 | | | | $12,319 | | | | $9,675 | | | | $11,271 | |
| Average net assets (000) | | | $121,398 | | | | $14,144 | | | | $11,249 | | | | $11,852 | | | | $9,893 | |
| Ratios to average net assets(c)(d): | | | | | | | | | | | | | | | | | | | | |
| Expenses after waivers and/or expense reimbursement | | | 1.01 | % | | | 1.20 | % | | | 1.20 | % | | | 1.20 | % | | | 1.20 | % |
| Expenses before waivers and/or expense reimbursement | | | 1.16 | % | | | 1.80 | % | | | 2.41 | % | | | 2.32 | % | | | 2.78 | % |
| Net investment income (loss) | | | (0.62 | )% | | | (0.74 | )% | | | (0.11 | )% | | | (0.17 | )% | | | (0.13 | )% |
| Portfolio turnover rate(e) | | | 78 | % | | | 58 | % | | | 33 | % | | | 23 | % | | | 45 | % |
| (a) | Calculated based on average shares outstanding during the year. |
| (b) | Total return is calculated assuming a purchase of a share on the first day and a sale on the last day of each year reported and includes reinvestment of dividends and distributions, if any. Total returns may reflect adjustments to conform to GAAP. |
| (c) | Does not include expenses of the underlying funds in which the Fund invests. |
| (d) | Effective November 1, 2017, class specific expenses include transfer agent fees and expenses and registration fees, which are charged to their respective share class. |
| (e) | The Fund’s portfolio turnover rate is calculated in accordance with regulatory requirements, without regard to transactions involving short-term investments and certain derivatives. If such transactions were included, the Fund’s portfolio turnover rate may be higher. |
See Notes to Financial Statements.
24
Notes to Financial Statements
Prudential World Fund, Inc. (the “Registered Investment Company” or “RIC”) is registered under the Investment Company Act of 1940, as amended (“1940 Act”), as an open-end management investment company. The RIC is organized as a Maryland Corporation and currently consists of seven separate funds: PGIM Emerging Markets Debt Hard Currency Fund, PGIM Emerging Markets Debt Local Currency Fund, PGIM Jennison Emerging Markets Equity Opportunities Fund, PGIM Jennison Global Infrastructure Fund, PGIM Jennison Global Opportunities Fund, PGIM Jennison International Opportunities Fund and PGIM QMA International Equity Fund. These financial statements relate only to the PGIM Jennison Emerging Markets Equity Opportunities Fund (the “Fund”). The Fund is classified as a diversified fund for purposes of the 1940 Act.
The investment objective of the Fund is to seek long-term growth of capital.
The Fund follows the investment company accounting and reporting guidance of the Financial Accounting Standards Board (“FASB”) Accounting Standard Codification (“ASC”) Topic 946 Financial Services — Investment Companies. The following is a summary of significant accounting policies followed by the Fund in the preparation of its financial statements. The policies conform to U.S. generally accepted accounting principles (“GAAP”). The Fund consistently follows such policies in the preparation of its financial statements.
Securities Valuation: The Fund holds securities and other assets and liabilities that are fair valued as of the close of each day (generally, 4:00 PM Eastern time) the New York Stock Exchange (“NYSE”) is open for trading. As described in further detail below, the Fund’s investments are valued daily based on a number of factors, including the type of investment and whether market quotations are readily available. The RIC’s Board of Directors (the “Board”) has adopted valuation procedures for security valuation under which fair valuation responsibilities have been delegated to PGIM Investments LLC (“PGIM Investments” or the “Manager”). Pursuant to the Board’s delegation, the Manager has established a Valuation Committee responsible for supervising the fair valuation of portfolio securities and other assets and liabilities. The valuation procedures permit the Fund to utilize independent pricing vendor services, quotations from market makers, and alternative valuation methods when market quotations are either not readily available or not deemed representative of fair value. Fair value is the price that would be received to sell an asset or paid to transfer a liability in an orderly transaction between market participants on the measurement date. A record of the Valuation Committee’s actions is subject to the Board’s review at its first quarterly meeting following the quarter in which such actions take place.
PGIM Jennison Emerging Markets Equity Opportunities Fund 25
Notes to Financial Statements (continued)
For the fiscal reporting year-end, securities and other assets and liabilities were fair valued at the close of the last U.S. business day. Trading in certain foreign securities may occur when the NYSE is closed (including weekends and holidays). Because such foreign securities trade in markets that are open on weekends and U.S. holidays, the values of some of the Fund’s foreign investments may change on days when investors cannot purchase or redeem Fund shares.
Various inputs determine how the Fund’s investments are valued, all of which are categorized according to the three broad levels (Level 1, 2, or 3) detailed in the Schedule of Investments and referred to herein as the “fair value hierarchy” in accordance with FASB ASC Topic 820 - Fair Value Measurements and Disclosures.
Common or preferred stocks, exchange-traded funds and derivative instruments, if applicable, that are traded on a national securities exchange are valued at the last sale price as of the close of trading on the applicable exchange where the security principally trades. Securities traded via NASDAQ are valued at the NASDAQ official closing price. To the extent these securities are valued at the last sale price or NASDAQ official closing price, they are classified as Level 1 in the fair value hierarchy. In the event that no sale or official closing price on valuation date exists, these securities are generally valued at the mean between the last reported bid and ask prices, or at the last bid price in the absence of an ask price. These securities are classified as Level 2 in the fair value hierarchy.
Foreign equities traded on foreign securities exchanges are generally valued using pricing vendor services that provide model prices derived using adjustment factors based on information such as local closing price, relevant general and sector indices, currency fluctuations, depositary receipts, and futures, as applicable. Securities valued using such model prices are classified as Level 2 in the fair value hierarchy. The models generate an evaluated adjustment factor for each security, which is applied to the local closing price to adjust it for post closing market movements up to the time the Fund is valued. Utilizing that evaluated adjustment factor, the vendor provides an evaluated price for each security. If the vendor does not provide an evaluated price, securities are valued in accordance with exchange-traded common and preferred stock valuation policies discussed above.
Investments in open-end funds (other than exchange-traded funds) are valued at their net asset values as of the close of the NYSE on the date of valuation. These securities are classified as Level 1 in the fair value hierarchy since they may be purchased or sold at their net asset values on the date of valuation.
Securities and other assets that cannot be priced according to the methods described above are valued based on pricing methodologies approved by the Board. In the event that unobservable inputs are used when determining such valuations, the securities will be
26
classified as Level 3 in the fair value hierarchy. Altering one or more unobservable inputs may result in a significant change to a Level 3 security’s fair value measurement.
When determining the fair value of securities, some of the factors influencing the valuation include: the nature of any restrictions on disposition of the securities; assessment of the general liquidity of the securities; the issuer’s financial condition and the markets in which it does business; the cost of the investment; the size of the holding and the capitalization of the issuer; the prices of any recent transactions or bids/offers for such securities or any comparable securities; any available analyst media or other reports or information deemed reliable by the Manager regarding the issuer or the markets or industry in which it operates. Using fair value to price securities may result in a value that is different from a security’s most recent closing price and from the price used by other unaffiliated mutual funds to calculate their net asset values.
Foreign Currency Translation: The books and records of the Fund are maintained in U.S. dollars. Foreign currency amounts are translated into U.S. dollars on the following basis:
(i) market value of investment securities, other assets and liabilities — at the exchange rate as of the valuation date;
(ii) purchases and sales of investment securities, income and expenses — at the rates of exchange prevailing on the respective dates of such transactions.
Although the net assets of the Fund are presented at the foreign exchange rates and market values at the close of the period, the Fund does not generally isolate that portion of the results of operations arising as a result of changes in the foreign exchange rates from the fluctuations arising from changes in the market prices of long-term portfolio securities held at the end of the period. Similarly, the Fund does not isolate the effect of changes in foreign exchange rates from the fluctuations arising from changes in the market prices of long-term portfolio securities sold during the period. Accordingly, holding period unrealized and realized foreign currency gains (losses) are included in the reported Net change in unrealized appreciation (depreciation) on investments and Net realized gains (losses) on investment transactions on the Statements of Operations.
Net realized gains (losses) on foreign currency transactions represent net foreign exchange gains (losses) from the disposition of holdings of foreign currencies, currency gains (losses) realized between the trade and settlement dates on investment transactions, and the difference between the amounts of interest, dividends and foreign withholding taxes recorded on the Fund’s books and the U.S. dollar equivalent amounts actually received or paid. Net unrealized currency gains (losses) arise from valuing foreign currency denominated assets and liabilities (other than investments) at period end exchange rates.
Master Netting Arrangements: The RIC, on behalf of the Fund, is subject to various Master Agreements, or netting arrangements, with select counterparties. These are agreements which a subadviser may have negotiated and entered into on behalf of all or a portion of the
PGIM Jennison Emerging Markets Equity Opportunities Fund 27
Notes to Financial Statements (continued)
Fund. A master netting arrangement between the Fund and the counterparty permits the Fund to offset amounts payable by the Fund to the same counterparty against amounts to be received; and by the receipt of collateral from the counterparty by the Fund to cover the Fund’s exposure to the counterparty. However, there is no assurance that such mitigating factors are easily enforceable. In addition to master netting arrangements, the right to set-off exists when all the conditions are met such that each of the parties owes the other determinable amounts, the reporting party has the right to set-off the amount owed with the amount owed by the other party, the reporting party intends to set-off and the right of set-off is enforceable by law.
Securities Lending: The Fund lends its portfolio securities to banks and broker-dealers. The loans are secured by collateral at least equal to the market value of the securities loaned. Collateral pledged by each borrower is invested in an affiliated money market fund and is marked to market daily, based on the previous day’s market value, such that the value of the collateral exceeds the value of the loaned securities. In the event of significant appreciation in value of securities on loan on the last business day of the reporting period, the financial statements may reflect a collateral value that is less than the market value of the loaned securities. Such shortfall is remedied as described above. Loans are subject to termination at the option of the borrower or the Fund. Upon termination of the loan, the borrower will return to the Fund securities identical to the loaned securities. The remaining maturities of the securities lending transactions are considered overnight and continuous. Should the borrower of the securities fail financially, the Fund has the right to repurchase the securities in the open market using the collateral.
The Fund recognizes income, net of any rebate and securities lending agent fees, for lending its securities in the form of fees or interest on the investment of any cash received as collateral. The borrower receives all interest and dividends from the securities loaned and such payments are passed back to the lender in amounts equivalent thereto, which are reflected in interest income or unaffiliated dividend income based on the nature of the payment on the Statement of Operations. The Fund also continues to recognize any unrealized gain (loss) in the market price of the securities loaned and on the change in the value of the collateral invested that may occur during the term of the loan. In addition, realized gain (loss) is recognized on changes in the value of the collateral invested upon liquidation of the collateral. Net earnings from securities lending are disclosed in the Statement of Operations.
Securities Transactions and Net Investment Income: Securities transactions are recorded on the trade date. Realized gains (losses) from investment and currency transactions are calculated on the specific identification method. Dividend income is recorded on the ex-date, or for certain foreign securities, when the Fund becomes aware of such dividends. Expenses are recorded on an accrual basis, which may require the use of certain estimates
28
by management that may differ from actual. Net investment income or loss (other than class specific expenses and waivers, which are allocated as noted below) and unrealized and realized gains (losses) are allocated daily to each class of shares based upon the relative proportion of adjusted net assets of each class at the beginning of the day. Class specific expenses and waivers, where applicable, are charged to the respective share classes. Such class specific expenses and waivers include distribution fees and distribution fee waivers, shareholder servicing fees, transfer agent’s fees and expenses, registration fees and fee waivers and/or expense reimbursements, as applicable.
Taxes: It is the Fund’s policy to continue to meet the requirements of the Internal Revenue Code applicable to regulated investment companies and to distribute all of its taxable net investment income and capital gains, if any, to its shareholders. Therefore, no federal income tax provision is required. Withholding taxes on foreign dividends, interest and capital gains, if any, are recorded, net of reclaimable amounts, at the time the related income is earned.
The Fund is subject to foreign income taxes imposed by certain countries in which it invests. Additionally, capital gains realized upon disposition of securities issued in or by certain foreign countries are subject to capital gains tax imposed by those countries. All taxes are computed in accordance with the applicable foreign tax law, and, to the extent permitted, capital losses are used to offset capital gains. Taxes attributable to income are accrued by the Fund as a reduction of income. Current and deferred tax expense attributable to capital gains is reflected as a component of realized or change in unrealized gain/loss on securities in the accompanying financial statements. To the extent that the Fund has country specific capital loss carryforwards, such carryforwards are applied against net unrealized gains when determining the deferred tax liability. Any deferred tax liability incurred by the Fund is included in either Other liabilities or Deferred tax liability on the accompanying Statement of Assets and Liabilities.
Dividends and Distributions: The Fund expects to pay dividends from net investment income and distributions from net realized capital and currency gains, if any, annually. Dividends and distributions to shareholders, which are determined in accordance with federal income tax regulations and which may differ from GAAP, are recorded on the ex-date. Permanent book/tax differences relating to income and gain (loss) are reclassified between total distributable earnings (loss) and paid-in capital in excess of par, as appropriate.
Estimates: The preparation of financial statements requires management to make estimates and assumptions that affect the reported amounts and disclosures in the financial statements. Actual results could differ from those estimates.
PGIM Jennison Emerging Markets Equity Opportunities Fund 29
Notes to Financial Statements (continued)
The RIC, on behalf of the Fund, has a management agreement with the Manager. Pursuant to this agreement, the Manager has responsibility for all investment advisory services and supervises the subadviser’s performance of such services.
The Manager has entered into a subadvisory agreement with Jennison Associates LLC (“Jennison” or the “subadviser”). The Manager pays for the services of Jennison.
Effective May 14, 2021, the management fee paid to the Manager is accrued daily and payable monthly at an annual rate of 0.95% of the Fund’s average daily net assets up to $5 billion and 0.925% of the Fund’s average daily net assets in excess of $5 billion. Prior to May 14, 2021, the management fee paid to the Manager was accrued daily and payable monthly at an annual rate of 1.05% of the Fund’s average daily net assets up to $5 billion and 1.025% of the Fund’s average daily net assets in excess of $5 billion. The effective management fee rate before any waivers and/or expense reimbursements was 0.98% for the year ended October 31, 2021.
Effective April 7, 2021, the Manager has contractually agreed, through February 28, 2023, to limit total annual operating expenses after fee waivers and/or expense reimbursements to 1.30% of average daily net assets for Class A shares, 2.05% of average daily net assets for Class C shares, 1.05% of average daily net assets for Class Z shares and 0.98% of average daily net assets for Class R6 shares. Prior to April 7, 2021, the Manager had contractually agreed, to limit total annual operating expenses after fee waivers and/or expense reimbursements to 1.45% of average daily net assets for Class A shares, 2.20% of average daily net assets for Class C shares, 1.20% of average daily net assets for Class Z shares and 1.20% of average daily net assets for Class R6 shares. The contractual waiver excludes interest, brokerage, taxes (such as income and foreign withholding taxes, stamp duty and deferred tax expenses), acquired fund fees and expenses, extra ordinary expenses and certain other Fund expenses such as dividend and interest expense and broker charges on short sales.
Where applicable, the Manager agrees to waive management fees or shared operating expenses on any share class to the same extent that it waives such expenses on any other share class. In addition, total annual operating expenses for Class R6 shares will not exceed total annual operating expenses for Class Z shares. Fees and/or expenses waived and/or reimbursed by the Manager may be recouped by the Manager within the same fiscal year during which such waiver and/or reimbursement is made if such recoupment can be realized without exceeding the expense limit in effect at the time of the recoupment for that fiscal year.
30
The RIC, on behalf of the Fund, has a distribution agreement with Prudential Investment Management Services LLC (“PIMS”), which acts as the distributor of the Class A, Class C, Class Z and Class R6 shares of the Fund. The Fund compensates PIMS for distributing and servicing the Fund’s Class A and Class C shares, pursuant to the plans of distribution (the “Distribution Plans”), regardless of expenses actually incurred by PIMS.
Pursuant to the Distribution Plans, the Fund compensates PIMS for distribution related activities at an annual rate of up to 0.30% and 1% of the average daily net assets of the Class A and Class C shares, respectively. PIMS has contractually agreed through February 28, 2023 to limit such fee to 0.25% of the average daily net assets of the Class A shares. The distribution fees are accrued daily and payable monthly. No distribution or service fees are paid to PIMS as distributor of the Class Z and Class R6 shares of the Fund.
For the year ended October 31, 2021, PIMS received $571,095 in front-end sales charges resulting from sales of Class A shares. Additionally, for the year ended October 31, 2021, PIMS received $141 and $1,341 in contingent deferred sales charges imposed upon redemptions by certain Class A and Class C shareholders, respectively. From these fees, PIMS paid such sales charges to broker-dealers, who in turn paid commissions to salespersons and incurred other distribution costs.
PGIM Investments, PIMS and Jennison are indirect, wholly-owned subsidiaries of Prudential Financial, Inc. (“Prudential”).
| 4. | Other Transactions with Affiliates |
Prudential Mutual Fund Services LLC (“PMFS”), an affiliate of PGIM Investments and an indirect, wholly-owned subsidiary of Prudential, serves as the Fund’s transfer agent. Transfer agent’s fees and expenses in the Statement of Operations include certain out-of-pocket expenses paid to non-affiliates, where applicable.
The Fund may invest its overnight sweep cash in the PGIM Core Ultra Short Bond Fund (the “Core Fund”), and its securities lending cash collateral in the PGIM Institutional Money Market Fund (the “Money Market Fund”), each a fund of Prudential Investment Portfolios 2, registered under the 1940 Act and managed by PGIM Investments. PGIM Investments and/or its affiliates are paid fees or reimbursed for providing their services. In addition to the realized and unrealized gains on investments in the Core Fund and Money Market Fund, earnings from such investments are disclosed on the Statement of Operations as “Affiliated dividend income” and “Income from securities lending, net”, respectively.
The Fund may enter into certain securities purchase or sale transactions under Board approved Rule 17a-7 procedures. Rule 17a-7 is an exemptive rule under the 1940 Act, that subject to certain conditions, permits purchase and sale transactions among affiliated investment companies, or between an investment company and a person that is affiliated solely by reason of having a common (or affiliated) investment adviser, common directors/trustees, and/or common officers. For the year ended October 31, 2021, no 17a-7
PGIM Jennison Emerging Markets Equity Opportunities Fund 31
Notes to Financial Statements (continued)
transactions were entered into by the Fund.
The aggregate cost of purchases and proceeds from sales of portfolio securities (excluding short-term investments and U.S. Government securities) for the year ended October 31, 2021, were $1,184,994,438 and $336,768,571, respectively.
A summary of the cost of purchases and proceeds from sales of shares of affiliated mutual funds for the year ended October 31, 2021, is presented as follows:
| | | | | | | | | | | | | | | | | | | | | | | | | | | | | | | | | | | | | | | | | | | | | | |
Value, Beginning of Year | | Cost of Purchases | | | Proceeds from Sales | | | Change in Unrealized Gain (Loss) | | Realized Gain (Loss) | | Value, End of Year | | Shares, End of Year | | | Income | |
|
Short-Term Investments - Affiliated Mutual Funds: | |
|
PGIM Core Ultra Short Bond Fund (1)(wa) | |
$5,578,205 | | | | $ | 432,206,004 | | | | | $ | 369,347,820 | | | | | $ | — | | | | | | | $ | — | | | | | | | $ | 68,436,389 | | | | | | 68,436,389 | | | | | $ | 24,421 | |
|
PGIM Institutional Money Market Fund (1)(b)(wa) | |
4,072,761 | | | | | 220,748,381 | | | | | | 218,737,833 | | | | | | (602 | ) | | | | | | | (4,794 | ) | | | | | | | 6,077,913 | | | | | | 6,081,562 | | | | | | 10,433 | (2) |
| | | | | | | | | | | | | | | | | | | | | | | | | | | | | | | | | | | | | | | | | | | | | | |
| | | | | | | | | | | | | | | | |
$9,650,966 | | | | $ | 652,954,385 | | | | | $ | 588,085,653 | | | | | $ | (602 | ) | | | | | | $ | (4,794 | ) | | | | | | $ | 74,514,302 | | | | | | | | | | | $ | 34,854 | |
| | | | | | | | | | | | | | | | | | | | | | | | | | | | | | | | | | | | | | | | | | | | | | |
| (1) | The Fund did not have any capital gain distributions during the reporting period. |
| (2) | The amount, or a portion thereof, represents the affiliated securities lending income shown on the Statement of Operations. |
| (b) | Represents security, or portion thereof, purchased with cash collateral received for securities on loan and includes dividend reinvestment. |
| (wa) | PGIM Investments LLC, the manager of the Fund, also serves as manager of the PGIM Core Ultra Short Bond Fund and PGIM Institutional Money Market Fund, if applicable. |
| 6. | Distributions and Tax Information |
Distributions to shareholders, which are determined in accordance with federal income tax regulations and which may differ from GAAP, are recorded on the ex-date. In order to present total distributable earnings (loss) and paid-in capital in excess of par on the Statement of Assets and Liabilities that more closely represent their tax character, certain adjustments have been made to total distributable earnings (loss) and paid-in capital in excess of par. For the tax year ended October 31, 2021, the adjustments were to increase total distributable earnings and decrease paid-in capital in excess of par by $693,074 due to a net operating loss. Net investment income, net realized gain (loss) on investments and foreign currency transactions and net assets were not affected by this change.
For the fiscal years ended October 31, 2021, and October 31, 2020, there were no distributions paid by the Fund.
32
As of October 31, 2021, there were no accumulated undistributed earnings on a tax basis.
The United States federal income tax basis of the Fund’s investments and the net unrealized appreciation as of October 31, 2021 were as follows:
| | | | | | |
| Tax Basis | | Gross Unrealized Appreciation | | Gross Unrealized Depreciation | | Net Unrealized Appreciation |
| | | |
$937,268,778 | | $114,442,205 | | $(29,817,840) | | $84,624,365 |
The book basis may differ from tax basis due to deferred losses on wash sales.
For federal income tax purposes, the Fund had a capital loss carryforward as of October 31, 2021 of approximately $27,916,000 which can be carried forward for an unlimited period. No capital gains distributions are expected to be paid to shareholders until net gains have been realized in excess of such losses.
The Fund elected to treat late year ordinary income losses of approximately $3,026,000 as having been incurred in the following fiscal year (October 31, 2021).
The Manager has analyzed the Fund’s tax positions taken on federal, state and local income tax returns for all open tax years and has concluded that no provision for income tax is required in the Fund’s financial statements for the current reporting period. Since tax authorities can examine previously filed tax returns, the Fund’s U.S. federal and state tax returns for each of the four fiscal years up to the most recent fiscal year ended October 31, 2021 are subject to such review.
The Fund offers Class A, Class C, Class Z and Class R6 shares. Class A shares are sold with a maximum front-end sales charge of 5.50%. Investors who purchase $1 million or more of Class A shares and sell these shares within 12 months of purchase are subject to a contingent deferred sales charge (“CDSC”) of 1%, although they are not subject to an initial sales charge. The Class A CDSC is waived for certain retirement and/or benefit plans. A special exchange privilege is also available for shareholders who qualified to purchase Class A shares at net asset value. Class C shares are sold with a CDSC of 1% on sales made within 12 months of purchase. Class C shares will automatically convert to Class A shares on a monthly basis approximately eight years (ten years prior to January 22, 2021) after purchase. Class Z and Class R6 shares are not subject to any sales or redemption charges and are available exclusively for sale to a limited group of investors.
Under certain circumstances, an exchange may be made from specified share classes of the Fund to one or more other share classes of the Fund as presented in the table of transactions in shares of common stock, below.
PGIM Jennison Emerging Markets Equity Opportunities Fund 33
Notes to Financial Statements (continued)
The RIC is authorized to issue 10,225,000,000 shares of common stock, $0.00001 par value per share, 865,000,000 of which are designated as shares of the Fund. The authorized shares of the Fund are currently classified and designated as follows:
| | | | |
Class A | | | 25,000,000 | |
Class C | | | 65,000,000 | |
Class Z | | | 300,000,000 | |
Class T | | | 225,000,000 | |
Class R6 | | | 250,000,000 | |
The Fund currently does not have any Class T shares outstanding.
As of October 31, 2021, Prudential, through its affiliated entities, including affiliated funds (if applicable), owned shares of the Fund as follows:
| | | | |
| | | Number of Shares | | Percentage of
Outstanding Shares |
Class A | | 17,167 | | 0.9% |
At the reporting period end, the number of shareholders holding greater than 5% of the Fund are as follows:
| | | | | | |
| Affiliated | | Unaffiliated |
Number of Shareholders | | Percentage of
Outstanding Shares | | Number of
Shareholders | | Percentage of Outstanding Shares |
— | | —% | | 5 | | 83.8% |
Transactions in shares of common stock were as follows:
| | | | | | | | |
Class A | | Shares | | | Amount | |
Year ended October 31, 2021: | | | | | | | | |
Shares sold | | | 2,255,202 | | | $ | 51,550,059 | |
Shares purchased | | | (580,724 | ) | | | (12,973,518 | ) |
| | | | | | | | |
| | |
Net increase (decrease) in shares outstanding before conversion | | | 1,674,478 | | | | 38,576,541 | |
Shares issued upon conversion from other share class(es) | | | 4,431 | | | | 112,936 | |
Shares purchased upon conversion into other share class(es) | | | (11,348 | ) | | | (248,795 | ) |
| | | | | | | | |
| | |
Net increase (decrease) in shares outstanding | | | 1,667,561 | | | $ | 38,440,682 | |
| | | | | | | | |
| | |
Year ended October 31, 2020: | | | | | | | | |
Shares sold | | | 103,935 | | | $ | 1,518,736 | |
Shares purchased | | | (71,824 | ) | | | (955,318 | ) |
| | | | | | | | |
| | |
Net increase (decrease) in shares outstanding before conversion | | | 32,111 | | | | 563,418 | |
Shares issued upon conversion from other share class(es) | | | 3,633 | | | | 54,429 | |
Shares purchased upon conversion into other share class(es) | | | (902 | ) | | | (11,761 | ) |
| | | | | | | | |
| | |
Net increase (decrease) in shares outstanding | | | 34,842 | | | $ | 606,086 | |
| | | | | | | | |
34
| | | | | | | | |
Class C | | Shares | | | Amount | |
Year ended October 31, 2021: | | | | | | | | |
Shares sold | | | 217,144 | | | $ | 4,807,891 | |
Shares purchased | | | (39,846 | ) | | | (888,017 | ) |
| | | | | | | | |
| | |
Net increase (decrease) in shares outstanding before conversion | | | 177,298 | | | | 3,919,874 | |
Shares purchased upon conversion into other share class(es) | | | (7,817 | ) | | | (182,875 | ) |
| | | | | | | | |
Net increase (decrease) in shares outstanding | | | 169,481 | | | $ | 3,736,999 | |
| | | | | | | | |
| | |
Year ended October 31, 2020: | | | | | | | | |
Shares sold | | | 13,233 | | | $ | 188,787 | |
Shares purchased | | | (11,358 | ) | | | (155,204 | ) |
| | | | | | | | |
| | |
Net increase (decrease) in shares outstanding before conversion | | | 1,875 | | | | 33,583 | |
Shares purchased upon conversion into other share class(es) | | | (3,792 | ) | | | (54,429 | ) |
| | | | | | | | |
Net increase (decrease) in shares outstanding | | | (1,917 | ) | | $ | (20,846 | ) |
| | | | | | | | |
| | |
Class Z | | | | | | | | |
Year ended October 31, 2021: | | | | | | | | |
Shares sold | | | 31,445,686 | | | $ | 744,637,683 | |
Shares purchased | | | (6,723,022 | ) | | | (157,898,994 | ) |
| | | | | | | | |
| | |
Net increase (decrease) in shares outstanding before conversion | | | 24,722,664 | | | | 586,738,689 | |
Shares issued upon conversion from other share class(es) | | | 13,165 | | | | 295,170 | |
Shares purchased upon conversion into other share class(es) | | | (7,805 | ) | | | (191,186 | ) |
| | | | | | | | |
Net increase (decrease) in shares outstanding | | | 24,728,024 | | | $ | 586,842,673 | |
| | | | | | | | |
| | |
Year ended October 31, 2020: | | | | | | | | |
Shares sold | | | 2,007,443 | | | $ | 30,937,061 | |
Shares purchased | | | (247,957 | ) | | | (3,693,491 | ) |
| | | | | | | | |
| | |
Net increase (decrease) in shares outstanding before conversion | | | 1,759,486 | | | | 27,243,570 | |
Shares issued upon conversion from other share class(es) | | | 890 | | | | 11,761 | |
| | | | | | | | |
Net increase (decrease) in shares outstanding | | | 1,760,376 | | | $ | 27,255,331 | |
| | | | | | | | |
| | |
Class R6 | | | | | | | | |
Year ended October 31, 2021: | | | | | | | | |
Shares sold | | | 13,708,513 | | | $ | 322,853,105 | |
Shares purchased | | | (1,682,763 | ) | | | (38,945,474 | ) |
| | | | | | | | |
| | |
Net increase (decrease) in shares outstanding before conversion | | | 12,025,750 | | | | 283,907,631 | |
Shares issued upon conversion from other share class(es) | | | 8,764 | | | | 214,750 | |
| | | | | | | | |
Net increase (decrease) in shares outstanding | | | 12,034,514 | | | $ | 284,122,381 | |
| | | | | | | | |
| | |
Year ended October 31, 2020: | | | | | | | | |
Shares sold | | | 22,744 | | | $ | 376,591 | |
Shares purchased | | | (328 | ) | | | (4,694 | ) |
| | | | | | | | |
Net increase (decrease) in shares outstanding | | | 22,416 | | | $ | 371,897 | |
| | | | | | | | |
The RIC, on behalf of the Fund, along with other affiliated registered investment companies (the “Participating Funds”), is a party to a Syndicated Credit Agreement (“SCA”) with a group of banks. The purpose of the SCA is to provide an alternative source of temporary funding for capital share redemptions. The table below provides details of the current SCA in effect at the reporting period-end as well as the prior SCA.
| | | | |
| | Current SCA | | Prior SCA |
Term of Commitment | | 10/1/2021 – 9/29/2022 | | 10/2/2020 – 9/30/2021 |
PGIM Jennison Emerging Markets Equity Opportunities Fund 35
Notes to Financial Statements (continued)
| | | | |
| | | Current SCA | | Prior SCA |
Total Commitment | | $1,200,000,000 | | $1,200,000,000 |
| Annualized Commitment Fee on the Unused Portion of the SCA | | 0.15% | | 0.15% |
| Annualized Interest Rate on Borrowings | | 1.20% plus the higher of (1) the effective federal funds rate, (2) the one-month LIBOR rate or (3) zero percent | | 1.30% plus the higher of (1) the effective federal funds rate, (2) the one-month LIBOR rate or (3) zero percent |
Certain affiliated registered investment companies that are parties to the SCA include portfolios that are subject to a predetermined mathematical formula used to manage certain benefit guarantees offered under variable annuity contracts. The formula may result in large scale asset flows into and out of these portfolios. Consequently, these portfolios may be more likely to utilize the SCA for purposes of funding redemptions. It may be possible for those portfolios to fully exhaust the committed amount of the SCA, thereby requiring the Manager to allocate available funding per a Board-approved methodology designed to treat the Participating Funds in the SCA equitably.
The Fund did not utilize the SCA during the year ended October 31, 2021.
| 9. | Risks of Investing in the Fund |
The Fund’s risks include, but are not limited to, some or all of the risks discussed below. For further information on the Fund’s risks, please refer to the Fund’s Prospectus and Statement of Additional Information.
Country Risk: Changes in the business environment may adversely affect operating profits or the value of assets in a specific country. For example, financial factors such as currency controls, devaluation or regulatory changes or stability factors such as mass riots, civil war and other potential events may contribute to companies’ operational risks.
Currency Risk: The Fund’s net asset value could decline as a result of changes in exchange rates, which could adversely affect the Fund’s investments in currencies, or in securities that trade in, and receive revenues related to, currencies, or in derivatives that provide exposure to currencies. Certain foreign countries may impose restrictions on the ability of issuers of foreign securities to make payment of principal and interest or dividends to investors located outside the country, due to blockage of foreign currency exchanges or otherwise.
Cyber Security Risk: Failures or breaches of the electronic systems of the Fund, the Fund’s manager, subadviser, distributor, and other service providers, or the issuers of securities in which the Fund invests have the ability to cause disruptions and negatively impact the Fund’s business operations, potentially resulting in financial losses to the Fund and its
36
shareholders. While the Fund has established business continuity plans and risk management systems seeking to address system breaches or failures, there are inherent limitations in such plans and systems. Furthermore, the Fund cannot control the cyber security plans and systems of the Fund’s service providers or issuers of securities in which the Fund invests.
Economic and Market Events Risk: Events in the U.S. and global financial markets, including actions taken by the U.S. Federal Reserve or foreign central banks to stimulate or stabilize economic growth or the functioning of the securities markets, may at times result in unusually high market volatility, which could negatively impact performance. Relatively reduced liquidity in credit and fixed income markets could adversely affect issuers worldwide.
Emerging Markets Risk: The risks of foreign investments are greater for investments in or exposed to emerging markets. Emerging market countries typically have economic and political systems that are less fully developed, and can be expected to be less stable, than those of more developed countries. For example, the economies of such countries can be subject to rapid and unpredictable rates of inflation or deflation. Low trading volumes may result in a lack of liquidity and price volatility. Emerging market countries may have policies that restrict investment by non-U.S. investors, or that prevent non-U.S. investors from withdrawing their money at will. The Fund may invest in some emerging markets that subject it to risks such as those associated with illiquidity, custody of assets, different settlement and clearance procedures and asserting legal title under a developing legal and regulatory regime to a greater degree than in developed markets or even in other emerging markets.
Equity and Equity-Related Securities Risk: Equity and equity-related securities may be subject to changes in value, and their values may be more volatile than those of other asset classes. In addition to an individual security losing value, the value of the equity markets or a sector in which the Fund invests could go down. Different parts of a market can react differently to adverse issuer, market, regulatory, political and economic developments.
Foreign Securities Risk: Investments in securities of non-U.S. issuers (including those denominated in U.S. dollars) may involve more risk than investing in securities of U.S. issuers. Foreign political, economic and legal systems, especially those in developing and emerging market countries, may be less stable and more volatile than in the United States. Foreign legal systems generally have fewer regulatory requirements than the U.S. legal system, particularly those of emerging markets. In general, less information is publicly available with respect to non-U.S. companies than U.S. companies. Non-U.S. companies generally are not subject to the same accounting, auditing, and financial reporting standards as are U.S. companies. Additionally, the changing value of foreign currencies and changes in exchange rates could also affect the value of the assets the Fund holds and the Fund’s performance. Certain foreign countries may impose restrictions on the ability of issuers of foreign securities to make payment of principal and interest or dividends to investors located
PGIM Jennison Emerging Markets Equity Opportunities Fund 37
Notes to Financial Statements (continued)
outside the country, due to blockage of foreign currency exchanges or otherwise. Investments in emerging markets are subject to greater volatility and price declines.
In addition, the Fund’s investments in non-U.S. securities may be subject to the risks of nationalization or expropriation of assets, imposition of currency exchange controls or restrictions on the repatriation of non-U.S. currency, confiscatory taxation and adverse diplomatic developments. Special U.S. tax considerations may apply.
Geographic Concentration Risk: The Fund’s performance may be closely tied to the market, economic, political, regulatory or other conditions in the countries or regions in which the Fund invests. This can result in more pronounced risks based upon conditions that impact one or more countries or regions more or less than other countries or regions.
Increase in Expenses Risk: Your actual cost of investing in the Fund may be higher than the expenses shown in the expense table in the Fund’s prospectus for a variety of reasons. For example, expense ratios may be higher than those shown if average net assets decrease. Net assets are more likely to decrease and Fund expense ratios are more likely to increase when markets are volatile. Active and frequent trading of Fund securities can increase expenses.
Investments in China Risk: Investments in China subject the Fund to risks specific to China and may make it more volatile than other funds. Over the last few decades, the Chinese government has undertaken reform of economic and market practices and has expanded the sphere of private ownership of property in China. However, Chinese markets generally continue to experience inefficiency, volatility and pricing anomalies resulting from governmental influence, a lack of publicly available information and/or political and social instability. Internal social unrest or confrontations with other neighboring countries, including military conflicts in response to such events, may also disrupt economic development in China and result in a greater risk of currency fluctuations, currency non-convertibility, interest rate fluctuations and higher rates of inflation.
China has experienced security concerns, such as terrorism and strained international relations. Incidents involving China’s or the region’s security may cause uncertainty in Chinese markets and may adversely affect the Chinese economy and the Fund’s investments. Export growth continues to be a major driver of China’s rapid economic growth. Reduction in spending on Chinese products and services, institution of additional tariffs or other trade barriers, including as a result of heightened trade tensions between China and the U.S., or a downturn in any of the economies of China’s key trading partners may have an adverse impact on the Chinese economy or the Fund. For example, a series of executive orders issued between November 2020 and June 2021 prohibit the Fund from investing in certain companies identified by the U.S. government as “Chinese Military Industrial
38
Complex Companies.” The restrictions in these executive orders may force the subadviser to sell certain positions and may restrict the Fund from future investments the subadviser deems otherwise attractive.
Chinese companies, including Chinese companies that are listed on U.S. exchanges, are not subject to the same degree of regulatory requirements, accounting standards or auditor oversight as companies in more developed countries, and as a result, information about the Chinese securities in which the Fund invests may be less reliable or complete. There may be significant obstacles to obtaining information necessary for investigations into or litigation against Chinese companies and shareholders may have limited legal remedies.
Large Shareholder and Large Scale Redemption Risk: Certain individuals, accounts, funds (including funds affiliated with the Manager) or institutions, including the Manager and its affiliates, may from time to time own or control a substantial amount of the Fund’s shares. There is no requirement that these entities maintain their investment in the Fund. There is a risk that such large shareholders or that the Fund’s shareholders generally may redeem all or a substantial portion of their investments in the Fund in a short period of time, which could have a significant negative impact on the Fund’s NAV, liquidity, and brokerage costs. Large redemptions could also result in tax consequences to shareholders and impact the Fund’s ability to implement its investment strategy. The Fund’s ability to pursue its investment objective after one or more large scale redemptions may be impaired and, as a result, the Fund may invest a larger portion of its assets in cash or cash equivalents.
Liquidity Risk: Liquidity risk is the risk that the Fund could not meet requests to redeem shares issued by the Fund without significant dilution of remaining investors’ interests in the Fund. The Fund may invest in instruments that trade in lower volumes and are more illiquid than other investments. If the Fund is forced to sell these investments to pay redemption proceeds or for other reasons, the Fund may lose money. In addition, when there is no willing buyer and investments cannot be readily sold at the desired time or price, the Fund may have to accept a lower price or may not be able to sell the instrument at all. An inability to sell a portfolio position can adversely affect the Fund’s value or prevent the Fund from being able to take advantage of other investment opportunities.
Management Risk: The value of your investment may decrease if judgments by the subadviser about the attractiveness, value or market trends affecting a particular security, industry or sector or about market movements are incorrect.
Market Capitalization Risk: The Fund may invest in companies of any market capitalization. Generally, the stock prices of small- and mid-cap companies are less stable than the prices of large-cap stocks and may present greater risks. Large capitalization companies as a group could fall out of favor with the market, causing the Fund to underperform compared to investments that focus on smaller capitalized companies.
Market Disruption and Geopolitical Risks: International wars or conflicts and geopolitical developments in foreign countries, along with instability in regions such as Asia, Eastern
PGIM Jennison Emerging Markets Equity Opportunities Fund 39
Notes to Financial Statements (continued)
Europe, and the Middle East, possible terrorist attacks in the United States or around the world, public health epidemics such as the outbreak of infectious diseases like the outbreak of COVID-19 globally in 2020 or the 2014–2016 outbreak in West Africa of the Ebola virus, and other similar events could adversely affect the U.S. and foreign financial markets, including increases in market volatility, reduced liquidity in the securities markets and government intervention, and may cause further long-term economic uncertainties in the United States and worldwide generally. The coronavirus pandemic and the related governmental and public responses have had and may continue to have an impact on the Fund’s investments and net asset value and have led and may continue to lead to increased market volatility and the potential for illiquidity in certain classes of securities and sectors of the market. Preventative or protective actions that governments may take in respect of pandemic or epidemic diseases may result in periods of business disruption, business closures, inability to obtain raw materials, supplies and component parts, and reduced or disrupted operations for the issuers in which the Fund invests. Government intervention in markets may impact interest rates, market volatility and security pricing. The occurrence, reoccurrence and pendency of such diseases could adversely affect the economies (including through changes in business activity and increased unemployment) and financial markets either in specific countries or worldwide.
Market Risk: Securities markets may be volatile and the market prices of the Fund’s securities may decline. Securities fluctuate in price based on changes in an issuer’s financial condition and overall market and economic conditions. If the market prices of the securities owned by the Fund fall, the value of your investment in the Fund will decline.
| 10. | Recent Regulatory Developments |
On December 3, 2020, the SEC announced that it voted to adopt a new rule that establishes an updated regulatory framework for fund valuation practices (the “Rule”). The Rule, in part, provides (i) a framework for determining fair value in good faith and (ii) provides for a fund Board’s assignment of its responsibility for the execution of valuation-related activities to a fund’s investment adviser. Further, the SEC is rescinding previously issued guidance on related issues. The Rule took effect on March 8, 2021, with a compliance date of September 8, 2022. Management is currently evaluating the Rule and its impact to the Fund.
40
Report of Independent Registered Public Accounting Firm
To the Board of Directors of Prudential World Fund, Inc. and Shareholders
of PGIM Jennison Emerging Markets Equity Opportunities Fund
Opinion on the Financial Statements
We have audited the accompanying statement of assets and liabilities, including the schedule of investments, of PGIM Jennison Emerging Markets Equity Opportunities Fund (one of the funds constituting Prudential World Fund, Inc., referred to hereafter as the “Fund”) as of October 31, 2021, the related statement of operations for the year ended October 31, 2021, the statement of changes in net assets for each of the two years in the period ended October 31, 2021, including the related notes, and financial highlights for each of the two years in the period ended October 31, 2021 (collectively referred to as the “financial statements”). In our opinion, the financial statements present fairly, in all material respects, the financial position of the Fund as of October 31, 2021, the results of its operations for the year then ended, and the changes in its net assets and the financial highlights for each of the two years in the period ended October 31, 2021 in conformity with accounting principles generally accepted in the United States of America.
The financial statements of the Fund as of and for the year ended October 31, 2019 and the financial highlights for each of the periods ended on or prior to October 31, 2019 (not presented herein, other than the financial highlights) were audited by other auditors whose report dated December 19, 2019 expressed an unqualified opinion on those financial statements and financial highlights.
Basis for Opinion
These financial statements are the responsibility of the Fund’s management. Our responsibility is to express an opinion on the Fund’s financial statements based on our audits. We are a public accounting firm registered with the Public Company Accounting Oversight Board (United States) (PCAOB) and are required to be independent with respect to the Fund in accordance with the U.S. federal securities laws and the applicable rules and regulations of the Securities and Exchange Commission and the PCAOB.
We conducted our audits of these financial statements in accordance with the standards of the PCAOB. Those standards require that we plan and perform the audit to obtain reasonable assurance about whether the financial statements are free of material misstatement, whether due to error or fraud.
Our audits included performing procedures to assess the risks of material misstatement of the financial statements, whether due to error or fraud, and performing procedures that respond to those risks. Such procedures included examining, on a test basis, evidence regarding the amounts and disclosures in the financial statements. Our audits also included evaluating the accounting principles used and significant estimates made by management, as well as evaluating the overall presentation of the financial statements. Our procedures included confirmation of securities owned as of October 31, 2021 by correspondence with the custodian, transfer agent and brokers; when replies were not received from brokers, we performed other auditing procedures. We believe that our audits provide a reasonable basis for our opinion.
/s/PricewaterhouseCoopers LLP
New York, New York
December 17, 2021
We have served as the auditor of one or more investment companies in the PGIM Retail Funds complex since 2020.
| | | | |
PGIM Jennison Emerging Markets Equity Opportunities Fund | | | 41 | |
INFORMATION ABOUT BOARD MEMBERS AND OFFICERS (unaudited)
Information about Board Members and Officers of the Fund is set forth below. Board Members who are not deemed to be “interested persons” of the Fund, as defined in the 1940 Act, are referred to as “Independent Board Members.” Board Members who are deemed to be “interested persons” of the Fund are referred to as “Interested Board Members.” The Board Members are responsible for the overall supervision of the operations of the Fund and perform the various duties imposed on the directors of investment companies by the 1940 Act. The Board in turn elects the Officers, who are responsible for administering the day-to-day operations of the Fund.
| | | | | | |
| Independent Board Members |
| | | | |
Name Year of Birth Position(s) Portfolios Overseen | | Principal Occupation(s) During Past Five Years | | Other Directorships Held During Past Five Years | | Length of Board Service |
| | | | |
Ellen S. Alberding 1958 Board Member Portfolios Overseen: 95 | | President and Board Member, The Joyce Foundation (charitable foundation) (since 2002); formerly Vice Chair, City Colleges of Chicago (community college system) (2011-2015); Trustee, National Park Foundation (charitable foundation for national park system) (2009-2018); Trustee, Economic Club of Chicago (2009-2016); Trustee, Loyola University (since 2018). | | None. | | Since September 2013 |
| | | | |
Kevin J. Bannon 1952 Board Member Portfolios Overseen: 95 | | Retired; formerly Managing Director (April 2008-May 2015) and Chief Investment Officer (October 2008-November 2013) of Highmount Capital LLC (registered investment adviser); formerly Executive Vice President and Chief Investment Officer (April 1993-August 2007) of Bank of New York Company; President (May 2003-May 2007) of BNY Hamilton Family of Mutual Funds. | | Director of Urstadt Biddle Properties (equity real estate investment trust) (since September 2008). | | Since July 2008 |
PGIM Jennison Emerging Markets Equity Opportunities Fund
| | | | | | |
| Independent Board Members |
| | | | |
Name Year of Birth Position(s) Portfolios Overseen | | Principal Occupation(s) During Past Five Years | | Other Directorships Held During Past Five Years | | Length of Board Service |
| | | | |
Linda W. Bynoe 1952 Board Member Portfolios Overseen: 92 | | President and Chief Executive Officer (since March 1995) and formerly Chief Operating Officer (December 1989-February 1995) of Telemat Limited LLC (formerly Telemat Ltd) (management consulting); formerly Vice President (January 1985-June 1989) at Morgan Stanley & Co. (broker-dealer). | | Trustee of Equity Residential (residential real estate) (since December 2009); Director of Northern Trust Corporation (financial services) (since April 2006); formerly Director of Anixter International, Inc. (communication products distributor) (January 2006-June 2020). | | Since March 2005 |
| | | | |
Barry H. Evans 1960 Board Member Portfolios Overseen: 94 | | Retired; formerly President (2005-2016), Global Chief Operating Officer (2014-2016), Chief Investment Officer - Global Head of Fixed Income (1998-2014), and various portfolio manager roles (1986-2006), Manulife Asset Management (asset management). | | Formerly Director, Manulife Trust Company (2011-2018); formerly Director, Manulife Asset Management Limited (2015-2017); formerly Chairman of the Board of Directors of Manulife Asset Management U.S. (2005-2016); formerly Chairman of the Board, Declaration Investment Management and Research (2008-2016). | | Since September 2017 |
| | | | |
Keith F. Hartstein 1956 Board Member & Independent Chair Portfolios Overseen: 95 | | Retired; Executive Committee of the Independent Directors Council (IDC) Board of Governors (since October 2019); Member (since November 2014) of the Governing Council of the IDC (organization of independent mutual fund directors); formerly President and Chief Executive Officer (2005-2012), Senior Vice President (2004-2005), Senior Vice President of Sales and Marketing (1997-2004), and various executive management positions (1990-1997), John Hancock Funds, LLC (asset management); Chairman, Investment Company Institute’s Sales Force Marketing Committee (2003-2008). | | None. | | Since September 2013 |
Visit our website at pgim.com/investments
| | | | | | |
| Independent Board Members |
| | | | |
Name Year of Birth Position(s) Portfolios Overseen | | Principal Occupation(s) During Past Five Years | | Other Directorships Held During Past Five Years | | Length of Board Service |
| | | | |
Laurie Simon Hodrick 1962 Board Member Portfolios Overseen: 91 | | A. Barton Hepburn Professor Emerita of Economics in the Faculty of Business, Columbia Business School (since 2018); Visiting Fellow at the Hoover Institution, Stanford University (since 2015); Sole Member, ReidCourt LLC (since 2008) (a consulting firm); formerly Visiting Professor of Law, Stanford Law School (2015-2021); formerly A. Barton Hepburn Professor of Economics in the Faculty of Business, Columbia Business School (1996-2017); formerly Managing Director, Global Head of Alternative Investment Strategies, Deutsche Bank (2006-2008). | | Independent Director, Roku (since December 2020) (communication services); formerly Independent Director, Synnex Corporation (2019-2021) (information technology); formerly Independent Director, Kabbage, Inc. (2018-2020) (financial services); formerly Independent Director, Corporate Capital Trust (2017-2018) (a business development company). | | Since September 2017 |
| | | | |
Brian K. Reid 1961 Board Member Portfolios Overseen: 94 | | Retired; formerly Chief Economist for the Investment Company Institute (ICI) (2005-2017); formerly Senior Economist and Director of Industry and Financial Analysis at the ICI (1998-2004); formerly Senior Economist, Industry and Financial Analysis at the ICI (1996-1998); formerly Staff Economist at the Federal Reserve Board (1989-1996); Director, ICI Mutual Insurance Company (2012-2017). | | None. | | Since March 2018 |
PGIM Jennison Emerging Markets Equity Opportunities Fund
| | | | | | |
| Independent Board Members |
| | | | |
Name Year of Birth Position(s) Portfolios Overseen | | Principal Occupation(s) During Past Five Years | | Other Directorships Held During Past Five Years | | Length of Board Service |
| | | | |
Grace C. Torres 1959 Board Member Portfolios Overseen: 94 | | Retired; formerly Treasurer and Principal Financial and Accounting Officer of the PGIM Funds, Target Funds, Advanced Series Trust, Prudential Variable Contract Accounts and The Prudential Series Fund (1998-June 2014); Assistant Treasurer (March 1999-June 2014) and Senior Vice President (September 1999-June 2014) of PGIM Investments LLC; Assistant Treasurer (May 2003-June 2014) and Vice President (June 2005-June 2014) of AST Investment Services, Inc.; Senior Vice President and Assistant Treasurer (May 2003-June 2014) of Prudential Annuities Advisory Services, Inc. | | Director (since January 2018) of OceanFirst Financial Corp. and OceanFirst Bank; formerly Director (July 2015-January 2018) of Sun Bancorp, Inc. N.A. and Sun National Bank. | | Since November 2014 |
| | | | | | |
| Interested Board Members |
| | | | |
Name Year of Birth Position(s) Portfolios Overseen | | Principal Occupation(s) During Past Five Years | | Other Directorships Held During Past Five Years | | Length of Board Service |
| | | | |
Stuart S. Parker 1962 Board Member & President Portfolios Overseen: 94 | | President, Chief Executive Officer, Chief Operating Officer and Officer in Charge of PGIM Investments LLC (formerly known as Prudential Investments LLC) (since January 2012); formerly Executive Vice President of Jennison Associates LLC and Head of Retail Distribution of PGIM Investments LLC (June 2005-December 2011); Investment Company Institute - Board of Governors (since May 2012). | | None. | | Since January 2012 |
Visit our website at pgim.com/investments
| | | | | | |
| Interested Board Members |
| | | | |
Name Year of Birth Position(s) Portfolios Overseen | | Principal Occupation(s) During Past Five Years | | Other Directorships Held During Past Five Years | | Length of Board Service |
| | | | |
Scott E. Benjamin 1973 Board Member & Vice President Portfolios Overseen: 95 | | Executive Vice President (since May 2009) of PGIM Investments LLC; Vice President (since June 2012) of Prudential Investment Management Services LLC; Executive Vice President (since September 2009) of AST Investment Services, Inc.; Senior Vice President of Product Development and Marketing, PGIM Investments (since February 2006); formerly Vice President of Product Development and Product Management, PGIM Investments LLC (2003-2006). | | None. | | Since March 2010 |
(1) The year that each Board Member joined the Board is as follows:
Ellen S. Alberding, 2013; Kevin J. Bannon, 2008; Linda W. Bynoe, 2005; Barry H. Evans, 2017; Keith F. Hartstein, 2013; Laurie Simon Hodrick, 2017; Michael S. Hyland, 2008; Richard A. Redeker, 1993; Stephen G. Stoneburn, 2003; Stuart S. Parker, Board Member since 2012 and President since 2012; Scott E. Benjamin, Board Member since 2010 and Vice President since 2009; Grace C. Torres, 2014.
| | | | |
| Fund Officers(a) | | | | |
| | | |
Name Year of Birth Fund Position | | Principal Occupation(s) During Past Five Years | | Length of Service as Fund Officer |
| | | |
Claudia DiGiacomo 1974 Chief Legal Officer | | Chief Legal Officer, Executive Vice President and Secretary of PGIM Investments LLC (since August 2020); Chief Legal Officer of Prudential Mutual Fund Services LLC (since August 2020); Chief Legal Officer of PIFM Holdco, LLC (since August 2020); Vice President and Corporate Counsel (since January 2005) of Prudential; and Corporate Counsel of AST Investment Services, Inc. (since August 2020); formerly Vice President and Assistant Secretary of PGIM Investments LLC (2005-2020); formerly Associate at Sidley Austin Brown & Wood LLP (1999-2004). | | Since December 2005 |
PGIM Jennison Emerging Markets Equity Opportunities Fund
| | | | |
| Fund Officers(a) | | | | |
| | | |
Name Year of Birth Fund Position | | Principal Occupation(s) During Past Five Years | | Length of Service as Fund Officer |
| | | |
Dino Capasso 1974 Chief Compliance Officer | | Chief Compliance Officer (since July 2019) of PGIM Investments LLC; Chief Compliance Officer (since July 2019) of the PGIM Funds, Target Funds, Advanced Series Trust, The Prudential Series Fund, Prudential’s Gibraltar Fund, Inc., PGIM Global High Yield Fund, Inc., PGIM High Yield Bond Fund, Inc., and PGIM Short Duration High Yield Opportunities Fund; Vice President and Deputy Chief Compliance Officer (June 2017-2019) of PGIM Investments LLC; formerly Senior Vice President and Senior Counsel (January 2016-June 2017), and Vice President and Counsel (February 2012-December 2015) of Pacific Investment Management Company LLC. | | Since July 2019 |
| | | |
Andrew R. French 1962 Secretary | | Vice President (since December 2018) of PGIM Investments LLC; formerly Vice President and Corporate Counsel (2010-2018) of Prudential; formerly Director and Corporate Counsel (2006-2010) of Prudential; Vice President and Assistant Secretary (since January 2007) of PGIM Investments LLC; Vice President and Assistant Secretary (since January 2007) of Prudential Mutual Fund Services LLC. | | Since October 2006 |
| | | |
Diana N. Huffman 1982 Assistant Secretary | | Vice President and Corporate Counsel (since September 2015) of Prudential; Vice President and Assistant Secretary (since August 2020) of PGIM Investments LLC; formerly Associate at Willkie Farr & Gallagher LLP (2009-2015). | | Since March 2019 |
| | | |
Melissa Gonzalez 1980 Assistant Secretary | | Vice President and Corporate Counsel (since September 2018) of Prudential; Vice President and Assistant Secretary (since August 2020) of PGIM Investments LLC; formerly Director and Corporate Counsel (March 2014-September 2018) of Prudential. | | Since March 2020 |
| | | |
Patrick E. McGuinness 1986 Assistant Secretary | | Vice President and Assistant Secretary (since August 2020) of PGIM Investments LLC; Director and Corporate Counsel (since February 2017) of Prudential; and Corporate Counsel (2012-2017) of IIL, Inc. | | Since June 2020 |
| | | |
Debra Rubano 1975 Assistant Secretary | | Vice President and Corporate Counsel (since November 2020) of Prudential; formerly Director and Senior Counsel of Allianz Global Investors U.S. Holdings LLC (2010-2020) and Assistant Secretary of numerous funds in the Allianz fund complex (2015-2020). | | Since December 2020 |
| | | |
Kelly A. Coyne 1968 Assistant Secretary | | Director, Investment Operations of Prudential Mutual Fund Services LLC (since 2010). | | Since March 2015 |
Visit our website at pgim.com/investments
| | | | |
| Fund Officers(a) | | | | |
| | | |
Name Year of Birth Fund Position | | Principal Occupation(s) During Past Five Years | | Length of Service as Fund Officer |
| | | |
Christian J. Kelly 1975 Treasurer and Principal Financial and Accounting Officer | | Vice President, Head of Fund Administration of PGIM Investments LLC (since November 2018); formerly Director of Fund Administration of Lord Abbett & Co. LLC (2009-2018), Treasurer and Principal Accounting Officer of the Lord Abbett Family of Funds (2017-2018); Director of Accounting, Avenue Capital Group (2008-2009); Senior Manager, Investment Management Practice of Deloitte & Touche LLP (1998-2007). | | Since January 2019 |
| | | |
Lana Lomuti 1967 Assistant Treasurer | | Vice President (since 2007) and Director (2005-2007), within PGIM Investments Fund Administration; formerly Assistant Treasurer (December 2007-February 2014) of The Greater China Fund, Inc. | | Since April 2014 |
| | | |
Russ Shupak 1973 Assistant Treasurer | | Vice President (since 2017) and Director (2013-2017), within PGIM Investments Fund Administration. | | Since September 2019 |
| | | |
Deborah Conway 1969 Assistant Treasurer | | Vice President (since 2017) and Director (2007-2017), within PGIM Investments Fund Administration. | | Since September 2019 |
| | | |
Elyse M. McLaughlin 1974 Assistant Treasurer | | Vice President (since 2017) and Director (2011-2017), within PGIM Investments Fund Administration. | | Since September 2019 |
| | | |
Jonathan Corbett 1983 Anti-Money Laundering Compliance Officer | | Vice President, Corporate Compliance, Global Compliance Programs and Compliance Risk Management (since August 2019) of Prudential; formerly Vice President and Head of Key Risk Areas Compliance (March 2016 to July 2019), Chief Privacy Officer (March 2016 to July 2019) and Head of Global Financial Crimes Unit (April 2014 to March 2016) at MetLife. | | Since October 2021 |
(a) Excludes Mr. Parker and Mr. Benjamin, interested Board Members who also serve as President and Vice President, respectively.
Explanatory Notes to Tables:
| ∎ | | Board Members are deemed to be “Interested,” as defined in the 1940 Act, by reason of their affiliation with PGIM Investments LLC and/or an affiliate of PGIM Investments LLC. |
| ∎ | | Unless otherwise noted, the address of all Board Members and Officers is c/o PGIM Investments LLC, 655 Broad Street, Newark, New Jersey 07102-4410. |
| ∎ | | There is no set term of office for Board Members or Officers. The Board Members have adopted a retirement policy, which calls for the retirement of Board Members on December 31 of the year in which they reach the age of 75. |
| ∎ | | “Other Directorships Held” includes all directorships of companies required to register or file reports with the SEC under the 1934 Act (that is, “public companies”) or other investment companies registered under the 1940 Act. |
| ∎ | | “Portfolios Overseen” includes all investment companies managed by PGIM Investments LLC. The investment companies for which PGIM Investments LLC serves as manager include the PGIM Funds, Target Funds, The Prudential Variable Contract Accounts, PGIM ETF Trust, PGIM High Yield Bond Fund, Inc., PGIM Global High Yield Fund, Inc., PGIM Short Duration High Yield Opportunities Fund, The Prudential Series Fund, Prudential’s Gibraltar Fund, Inc. and the Advanced Series Trust. |
| ∎ | | As used in the Fund Officers table “Prudential” means The Prudential Insurance Company of America. |
PGIM Jennison Emerging Markets Equity Opportunities Fund
Approval of Advisory Agreements (unaudited)
The Fund’s Board of Directors
The Board of Directors (the “Board”) of PGIM Jennison Emerging Markets Equity Opportunities Fund (the “Fund”)1 consists of ten individuals, eight of whom are not “interested persons” of the Fund, as defined in the Investment Company Act of 1940, as amended (the “1940 Act”) (the “Independent Directors”). The Board is responsible for the oversight of the Fund and its operations, and performs the various duties imposed on the directors of investment companies by the 1940 Act. The Independent Directors have retained independent legal counsel to assist them in connection with their duties. The Chair of the Board is an Independent Director. The Board has established four standing committees: the Audit Committee, the Nominating and Governance Committee, and two Investment Committees. Each committee is chaired by, and composed of, Independent Directors.
Annual Approval of the Fund’s Advisory Agreements
As required under the 1940 Act, the Board determines annually whether to renew the Fund’s management agreement with PGIM Investments LLC (“PGIM Investments”) and the Fund’s subadvisory agreement with Jennison Associates LLC (“Jennison”). In considering the renewal of the agreements, the Board, including all of the Independent Directors, met on June 7-10, 2021 and approved the renewal of the agreements through July 31, 2022, after concluding that the renewal of the agreements was in the best interests of the Fund and its shareholders.
In advance of the meetings, the Board requested and received materials relating to the agreements, and had the opportunity to ask questions and request further information in connection with its consideration. Among other things, the Board considered comparative fee information from PGIM Investments and Jennison. Also, the Board considered comparisons with other mutual funds in relevant Peer Universes and Peer Groups, as is further discussed below.
In approving the agreements, the Board, including the Independent Directors advised by independent legal counsel, considered the factors it deemed relevant, including the nature, quality and extent of services provided by PGIM Investments and the subadviser, the performance of the Fund, the profitability of PGIM Investments and its affiliates, expenses and fees, and the potential for economies of scale that may be shared with the Fund and its shareholders as the Fund’s assets grow. In their deliberations, the Directors did not identify any single factor which alone was responsible for the Board’s decision to approve the agreements with respect to the Fund. In connection with its deliberations, the Board considered information provided by PGIM Investments throughout the year at regular Board meetings, presentations from portfolio managers and other information, as well as information furnished at or in advance of the meetings on June 7-10, 2021.
The Directors determined that the overall arrangements between the Fund and PGIM Investments, which serves as the Fund’s investment manager pursuant to a
| 1 | PGIM Jennison Emerging Markets Equity Opportunities Fund is a series of Prudential World Fund, Inc. |
PGIM Jennison Emerging Markets Equity Opportunities Fund
Approval of Advisory Agreements (continued)
management agreement, and between PGIM Investments and Jennison, which serves as the Fund’s subadviser pursuant to the terms of a subadvisory agreement with PGIM Investments, are in the best interests of the Fund and its shareholders in light of the services performed, fees charged and such other matters as the Directors considered relevant in the exercise of their business judgment.
The material factors and conclusions that formed the basis for the Directors’ determinations to approve the renewal of the agreements are discussed separately below.
Nature, Quality and Extent of Services
The Board received and considered information regarding the nature, quality and extent of services provided to the Fund by PGIM Investments and Jennison. The Board noted that Jennison is affiliated with PGIM Investments. The Board considered the services provided by PGIM Investments, including but not limited to the oversight of the subadviser for the Fund, as well as the provision of fund recordkeeping, compliance and other services to the Fund, and PGIM Investments’ role as administrator for the Fund’s liquidity risk management program. With respect to PGIM Investments’ oversight of the subadviser, the Board noted that PGIM Investments’ Strategic Investment Research Group (“SIRG”), a business unit of PGIM Investments, is responsible for monitoring and reporting to PGIM Investments’ senior management on the performance and operations of the subadviser. The Board also considered that PGIM Investments pays the salaries of all of the officers and interested Directors of the Fund who are part of Fund management. The Board also considered the investment subadvisory services provided by Jennison, including investment research and security selection, as well as compliance with the Fund’s investment restrictions, policies and procedures. The Board considered PGIM Investments’ evaluation of Jennison as well as PGIM Investments’ recommendation, based on its review of Jennison, to renew the subadvisory agreement.
The Board considered the qualifications, backgrounds and responsibilities of PGIM Investments’ senior management responsible for the oversight of the Fund and Jennison, and also considered the qualifications, backgrounds and responsibilities of Jennison’s portfolio managers who are responsible for the day-to-day management of the Fund’s portfolio. The Board was provided with information pertaining to PGIM Investments’ and Jennison’s organizational structure, senior management, investment operations, and other relevant information pertaining to both PGIM Investments and Jennison. The Board also noted that it received favorable compliance reports from the Fund’s Chief Compliance Officer (“CCO”) as to both PGIM Investments and Jennison.
The Board concluded that it was satisfied with the nature, extent and quality of the investment management services provided by PGIM Investments and the subadvisory services provided to the Fund by Jennison, and that there was a reasonable basis on which to conclude that the Fund benefits from the services provided by PGIM Investments and Jennison under the management and subadvisory agreements.
Visit our website at pgim.com/investments
Costs of Services and Profits Realized by PGIM Investments
The Board was provided with information on the profitability of PGIM Investments and its affiliates in serving as the Fund’s investment manager. The Board discussed with PGIM Investments the methodology utilized in assembling the information regarding profitability and considered its reasonableness. The Board recognized that it is difficult to make comparisons of profitability from fund management contracts because comparative information is not generally publicly available and is affected by numerous factors, including the structure of the particular adviser, the types of funds it manages, its business mix, numerous assumptions regarding allocations and the adviser’s capital structure and cost of capital. However, the Board considered that the cost of services provided by PGIM Investments for the year ended December 31, 2019 exceeded the management fees received by PGIM Investments, resulting in an operating loss to PGIM Investments. Taking these factors into account, the Board concluded that the profitability of PGIM Investments and its affiliates in relation to the services rendered was not unreasonable.
Economies of Scale
The Board received and discussed information concerning economies of scale that PGIM Investments may realize as the Fund’s assets grow beyond current levels. The Board noted that the management fee schedule for the Fund includes breakpoints, which have the effect of decreasing the fee rate as assets increase. During the course of time, the Board has considered information regarding the launch date of the Fund, the management fees of the Fund compared to those of similarly managed funds and PGIM Investments’ investment in the Fund over time. The Board noted that economies of scale can be shared with the Fund in other ways, including low management fees from inception, additional technological and personnel investments to enhance shareholder services, and maintaining existing expense structures in the face of a rising cost environment. The Board also considered PGIM Investments’ assertion that it continually evaluates the management fee schedule of the Fund and the potential to share economies of scale through breakpoints or fee waivers as asset levels increase.
The Board recognized the inherent limitations of any analysis of economies of scale, stemming largely from the Board’s understanding that most of PGIM Investments’ costs are not specific to individual funds, but rather are incurred across a variety of products and services.
Other Benefits to PGIM Investments and Jennison
The Board considered potential ancillary benefits that might be received by PGIM Investments and Jennison and their affiliates as a result of their relationship with the Fund. The Board concluded that potential benefits to be derived by PGIM Investments included transfer agency fees received by the Fund’s transfer agent (which is affiliated with PGIM Investments), as well as benefits to its reputation or other intangible benefits resulting from PGIM Investments’ association with the Fund. The Board concluded that the potential benefits to be derived by Jennison included its ability to use soft dollar
PGIM Jennison Emerging Markets Equity Opportunities Fund
Approval of Advisory Agreements (continued)
credits, as well as the potential benefits consistent with those generally resulting from an increase in assets under management, specifically, potential access to additional research resources and benefits to its reputation. The Board concluded that the benefits derived by PGIM Investments and Jennison were consistent with the types of benefits generally derived by investment managers and subadvisers to mutual funds.
Performance of the Fund / Fees and Expenses
The Board considered certain additional factors and made related conclusions relating to the historical performance of the Fund for the one-, three- and five-year periods ended December 31, 2020. The Board considered that the Fund commenced operations on September 16, 2014 and that longer-term performance was not yet available.
The Board also considered the Fund’s actual management fee, as well as the Fund’s net total expense ratio, for the fiscal year ended October 31, 2020. The Board considered the management fee for the Fund as compared to the management fee charged by PGIM Investments to other funds and the fee charged by other advisers to comparable mutual funds in a Peer Group. The actual management fee represents the fee rate actually paid by Fund shareholders and includes any fee waivers or reimbursements. The net total expense ratio for the Fund represents the actual expense ratio incurred by Fund shareholders.
The mutual funds included in the Peer Universe, which was used to consider performance, and the Peer Group, which was used to consider fees and expenses, were objectively determined by Broadridge, an independent provider of mutual fund data. In certain circumstances, PGIM Investments also provided supplemental Peer Universe or Peer Group information, for reasons addressed with the Board. The comparisons placed the Fund in various quartiles over various periods, with the first quartile being the best 25% of the mutual funds (for performance, the best performing mutual funds and, for expenses, the lowest cost mutual funds).
The section below summarizes key factors considered by the Board and the Board’s conclusions regarding the Fund’s performance, fees and overall expenses. The table sets forth net performance comparisons (which reflect the impact on performance of fund expenses, or any subsidies, expense caps or waivers that may be applicable) with the Peer Universe, actual management fees with the Peer Group (which reflect the impact of any subsidies or fee waivers), and net total expenses with the Peer Group, each of which were key factors considered by the Board.
| | | | | | | | |
| | | | | |
| Net Performance | | 1 Year | | 3 Years | | 5 Years | | 10 Years |
| | 1st Quartile | | 1st Quartile | | 1st Quartile | | N/A |
| |
| Actual Management Fees: 1st Quartile |
| |
Net Total Expenses: 4th Quartile |
| | · | | The Board noted that the Fund outperformed its benchmark index over all periods. |
Visit our website at pgim.com/investments
| | · | | The Board and PGIM Investments agreed to a contractual expense cap, which (exclusive of certain fees and expenses) caps the Fund’s annual operating expenses at 1.30% for Class A shares, 2.05% for Class C shares, 0.98% for Class R6 shares, and 1.05% for Class Z shares through February 28, 2023. |
| | · | | In addition, PGIM Investments will waive management fees or shared operating expenses on any share class to the same extent that it waives such expenses on any other share class, and has agreed that total annual fund operating expenses for Class R6 shares will not exceed total annual fund operating expenses for Class Z shares. |
| | · | | The Board concluded that, in light of the above, it would be in the best interests of the Fund and its shareholders to renew the agreements. |
| | · | | The Board concluded that the management fees (including subadvisory fees) and total expenses were reasonable in light of the services provided. |
* * *
After full consideration of these factors, the Board concluded that approval of the agreements was in the best interests of the Fund and its shareholders.
PGIM Jennison Emerging Markets Equity Opportunities Fund
| | | | |
| | | |
∎ MAIL | | ∎ TELEPHONE | | ∎ WEBSITE |
655 Broad Street | | (800) 225-1852 | | pgim.com/investments |
Newark, NJ 07102 | | | | |
PROXY VOTING
The Board of Directors of the Fund has delegated to the Fund’s subadviser the responsibility for voting any proxies and maintaining proxy recordkeeping with respect to the Fund. A description of these proxy voting policies and procedures is available without charge, upon request, by calling (800) 225-1852 or by visiting the Securities and Exchange Commission’s website at sec.gov. Information regarding how the Fund voted proxies relating to portfolio securities during the most recent 12-month period ended June 30 is available on the Fund’s website and on the Securities and Exchange Commission’s website.
DIRECTORS
Ellen S. Alberding · Kevin J. Bannon · Scott E. Benjamin · Linda W. Bynoe · Barry H. Evans · Keith F. Hartstein · Laurie Simon Hodrick
· Stuart S. Parker · Brian K. Reid · Grace C. Torres
OFFICERS
Stuart S. Parker, President · Scott E. Benjamin, Vice President · Christian J. Kelly, Treasurer and Principal Financial and Accounting Officer
· Claudia DiGiacomo, Chief Legal Officer · Dino Capasso, Chief Compliance Officer · Jonathan Corbett, Anti-Money Laundering Compliance Officer
· Andrew R. French, Secretary · Melissa Gonzalez, Assistant Secretary · Diana N. Huffman, Assistant Secretary · Kelly A. Coyne, Assistant Secretary
· Patrick E. McGuinness, Assistant Secretary · Debra Rubano, Assistant Secretary · Lana Lomuti, Assistant Treasurer · Russ Shupak, Assistant Treasurer · Elyse M. McLaughlin, Assistant Treasurer · Deborah Conway, Assistant Treasurer
| | | | |
| | |
MANAGER | | PGIM Investments LLC | | 655 Broad Street Newark, NJ 07102 |
| | |
SUBADVISER | | Jennison Associates LLC | | 466 Lexington Avenue New York, NY 10017 |
| | |
DISTRIBUTOR | | Prudential Investment Management Services LLC | | 655 Broad Street Newark, NJ 07102 |
| | |
CUSTODIAN | | The Bank of New York Mellon | | 240 Greenwich Street New York, NY 10286 |
| | |
TRANSFER AGENT | | Prudential Mutual Fund Services LLC | | PO Box 9658 Providence, RI 02940 |
| | |
| INDEPENDENT REGISTERED PUBLIC ACCOUNTING FIRM | | PricewaterhouseCoopers LLP | | 300 Madison Avenue New York, NY 10017 |
| | |
FUND COUNSEL | | Willkie Farr & Gallagher LLP | | 787 Seventh Avenue New York, NY 10019 |
An investor should consider the investment objectives, risks, charges, and expenses of the Fund carefully before investing. The prospectus and summary prospectus contain this and other information about the Fund. An investor may obtain the prospectus and summary prospectus by visiting our website at pgim.com/investments or by calling (800) 225-1852. The prospectus and summary prospectus should be read carefully before investing.
E-DELIVERY
To receive your mutual fund documents online, go to pgim.com/investments/resource/edelivery and enroll. Instead of receiving printed documents by mail, you will receive notification via email when new materials are available. You can cancel your enrollment or change your email address at any time by visiting the website address above.
SHAREHOLDER COMMUNICATIONS WITH DIRECTORS
Shareholders can communicate directly with the Board of Directors by writing to the Chair of the Board, PGIM Jennison Emerging Markets Equity Opportunities Fund, PGIM Investments, Attn: Board of Directors, 655 Broad Street, Newark, NJ 07102. Shareholders can communicate directly with an individual Director by writing to that Director at the same address. Communications are not screened before being delivered to the addressee.
AVAILABILITY OF PORTFOLIO HOLDINGS
The Fund files its complete schedule of portfolio holdings with the Securities and Exchange Commission for the first and third quarters of each fiscal year as an exhibit to its reports on Form N-PORT. The Fund’s Form N-PORT filings are available on the Commission’s website at sec.gov.
The Fund’s Statement of Additional Information contains additional information about the Fund’s Directors and is available without charge, upon request, by calling (800) 225-1852.
| | | | |
| Mutual Funds: | | | | |
| | | |
ARE NOT INSURED BY THE FDIC OR ANY FEDERAL GOVERNMENT AGENCY | | MAY LOSE VALUE | | ARE NOT A DEPOSIT OF OR GUARANTEED BY ANY BANK OR ANY BANK AFFILIATE |

PGIM JENNISON EMERGING MARKETS EQUITY OPPORTUNITIES FUND
| | | | | | | | |
| | | | |
SHARE CLASS | | A | | C | | Z | | R6 |
| | | | |
NASDAQ | | PDEAX | | PDECX | | PDEZX | | PDEQX |
| | | | |
CUSIP | | 743969644 | | 743969636 | | 743969610 | | 743969628 |
MF225E

PGIM JENNISON GLOBAL OPPORTUNITIES FUND
ANNUAL REPORT
OCTOBER 31, 2021

To enroll in e-delivery, go to pgim.com/investments/resource/edelivery
Table of Contents
| | | | |
| |
Letter from the President | |
| 3
|
|
| |
Your Fund’s Performance | |
| 4
|
|
| |
Growth of a $10,000 Investment | |
| 5
|
|
| |
Strategy and Performance Overview | |
| 8
|
|
| |
Fees and Expenses | |
| 11
|
|
| |
Holdings and Financial Statements | |
| 13
|
|
| |
Approval of Advisory Agreements | | | | |
This report is not authorized for distribution to prospective investors unless preceded or accompanied by a current prospectus.
The views expressed in this report and information about the Fund’s portfolio holdings are for the period covered by this report and are subject to change thereafter.
Mutual funds are distributed by Prudential Investment Management Services LLC, member SIPC. Jennison Associates LLC is a registered investment adviser. Both are Prudential Financial companies. © 2021 Prudential Financial, Inc. and its related entities. Jennison Associates, Jennison, PGIM, and the PGIM logo are service marks of Prudential Financial, Inc. and its related entities, registered in many jurisdictions worldwide.
| | |
| 2 | | Visit our website at pgim.com/investments |
Letter from the President
| | |
 | | Dear Shareholder: We hope you find the annual report for the PGIM Jennison Global Opportunities Fund informative and useful. The report covers performance for the 12-month period that ended October 31, 2021. The global economy and markets continued to recover throughout the period from the ongoing impact of the COVID-19 pandemic. The Federal Reserve slashed interest rates and kept them near zero to encourage borrowing. Congress passed stimulus bills worth several trillion dollars to help consumers and businesses. And several effective COVID-19 vaccines received regulatory approval. Those measures were enough to offset the fear of rising |
inflation and supply chain challenges that threatened to disrupt growth.
At the start of the period, stocks had recovered most of the steep losses they had suffered at the onset of the pandemic. Equities rallied as states reopened their economies but became more volatile as investors worried that a surge in COVID-19 infections would stall the recovery. However, rising corporate profits and economic growth, the resolution of the US presidential election, and the global rollout of approved vaccines lifted equity markets to record levels, helping stocks around the globe post gains for the full period.
Throughout this volatile period, investors sought safety in fixed income.
Investment-grade bonds in the US and the overall global bond market declined slightly during the period as the economy recovered, but emerging market debt rose. While the 10-year US Treasury yield hovered near record lows early in the period after a significant rally in interest rates, rates moved higher later on as investors began to focus on stronger economic growth and the prospects of higher inflation. The Fed also took several aggressive actions to keep the bond markets running smoothly, implementing many of the relief programs that proved to be successful in helping end the global financial crisis in 2008-09.
Regarding your investments with PGIM, we believe it is important to maintain a diversified portfolio of funds consistent with your tolerance for risk, time horizon, and financial goals. Your financial advisor can help you create a diversified investment plan that may include funds covering all the basic asset classes and that reflects your personal investor profile and risk tolerance. However, diversification and asset allocation strategies do not assure a profit or protect against loss in declining markets.
At PGIM Investments, we consider it a great privilege and responsibility to help investors participate in opportunities across global markets while meeting their toughest investment challenges. PGIM is a top-10 global investment manager with more than $1.5 trillion in assets under management. This scale and investment expertise allow us to deliver actively managed funds and strategies to meet the needs of investors around the globe.
Thank you for choosing our family of funds.
Sincerely,

Stuart S. Parker, President
PGIM Jennison Global Opportunities Fund
December 15, 2021
| | | | |
PGIM Jennison Global Opportunities Fund | | | 3 | |
Your Fund’s Performance (unaudited)
Performance data quoted represent past performance. Past performance does not guarantee future results. The investment return and principal value of an investment will fluctuate so that an investor’s shares, when redeemed, may be worth more or less than their original cost. Current performance may be lower or higher than the past performance data quoted. An investor may obtain performance data as of the most recent month-end by visiting our website at pgim.com/investments or by calling (800) 225-1852.
| | | | | | |
| |
| | | Average Annual Total Returns as of 10/31/21 |
| | | One Year (%) | | Five Years (%) | | Since Inception (%) |
| | | |
| Class A | | | | | | |
| | | |
| (with sales charges) | | 30.17 | | 27.05 | | 18.21 (03/14/2012) |
| | | |
| (without sales charges) | | 37.75 | | 28.49 | | 18.91 (03/14/2012) |
| | | |
| Class C | | | | | | |
| | | |
| (with sales charges) | | 35.63 | | 27.46 | | 17.97 (03/14/2012) |
| | | |
| (without sales charges) | | 36.63 | | 27.46 | | 17.97 (03/14/2012) |
| | | |
| Class Z | | | | | | |
| | | |
| (without sales charges) | | 37.96 | | 28.74 | | 19.16 (03/14/2012) |
| | | |
| Class R2 | | | | | | |
| (without sales charges) | | 37.45 | | N/A | | 40.06 (12/27/2018) |
| | | |
| Class R4 | | | | | | |
| | | |
| (without sales charges) | | 37.76 | | N/A | | 40.44 (12/27/2018) |
| | | |
| Class R6 | | | | | | |
| | | |
| (without sales charges) | | 38.08 | | 28.87 | | 21.71 (12/22/2014) |
| | | |
| MSCI All Country World ND Index | | | | | | |
| | | 37.28 | | 14.72 | | — |
| | | | | | |
| |
| Average Annual Total Returns as of 10/31/21 Since Inception (%) | | |
| | | Class A, Class C, Class Z | | Class R2, Class R4 | | Class R6 |
| | | (03/14/2012) | | (12/27/2018) | | (12/22/2014) |
| | | |
MSCI All Country World ND Index | | 10.89 | | 21.07 | | 10.94 |
Since Inception returns are provided for any share class with less than 10 fiscal years of returns. Since Inception returns for the Index are measured from the closest month-end to the class’ inception date.
| | |
| 4 | | Visit our website at pgim.com/investments |
Growth of a $10,000 Investment (unaudited)
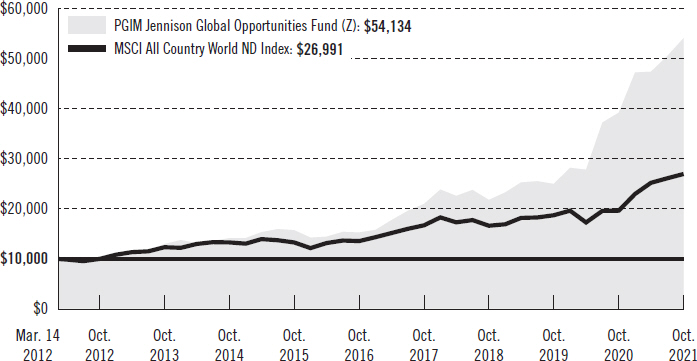
The graph compares a $10,000 investment in the Fund’s Class Z shares with a similar investment in the MSCI ACWI ND Index by portraying the initial account values at the commencement of operations for Class Z shares (March 14, 2012) and the account values at the end of the current fiscal year (October 31, 2021), as measured on a quarterly basis. For purposes of the graph, and unless otherwise indicated, it has been assumed that (a) all recurring fees (including management fees) were deducted and (b) all dividends and distributions were reinvested. The line graph provides information for Class Z shares only. As indicated in the tables provided earlier, performance for other share classes will vary due to the differing fees and expenses applicable to each share class (as indicated in the following paragraphs). Without waiver of fees and/or expense reimbursements, if any, the returns would have been lower.
Past performance does not predict future performance. Total returns and the ending account values in the graph include changes in share price and reinvestment of dividends and capital gains distributions in a hypothetical investment for the periods shown. The Fund’s total returns do not reflect the deduction of income taxes on an individual’s investment. Taxes may reduce your actual investment returns on income or gains paid by the Fund or any gains you may realize if you sell your shares.
| | | | |
PGIM Jennison Global Opportunities Fund | | | 5 | |
Your Fund’s Performance (continued)
The returns in the tables do not reflect the deduction of taxes that a shareholder would pay on Fund distributions or following the redemption of Fund shares. The average annual total returns take into account applicable sales charges, which are described for each share class in the table below.
| | | | | | | | | | | | |
| | | | | | | |
| | | Class A | | Class C | | Class Z | | Class R2 | | Class R4 | | Class R6 |
| | | | | | | |
Maximum initial sales charge | | 5.50% of the public offering price | | None | | None | | None | | None | | None |
| Contingent deferred sales charge (CDSC) (as a percentage of the lower of the original purchase price or the net asset value at redemption) | | 1.00% on sales of $1 million or more made within 12 months of purchase | | 1.00% on sales made within 12 months of purchase | | None | | None | | None | | None |
| Annual distribution or distribution and service (12b-1) fees (shown as a percentage of average daily net assets) | | 0.30% (0.25% currently) | | 1.00% | | None | | 0.25% | | None | | None |
Shareholder services fees | | None | | None | | None | | 0.10% | | 0.10% | | None |
Benchmark Definitions
MSCI All Country World ND Index—The MSCI All Country World Index is an unmanaged free float-adjusted market capitalization-weighted index that is designed to measure the equity market performance of developed and emerging markets. The MSCI ACWI ND Index consists of 47 country indexes comprising 23 developed and 27 emerging market country indexes. The ND version of the MSCI ACWI Index reflects the impact of the maximum withholding taxes on reinvested dividends. The MSCI ACWI ND Index is unmanaged and the total return includes the reinvestment of all dividends.
Investors cannot invest directly in an index. The returns for the Index would be lower if they included the effects of sales charges, operating expenses of a mutual fund, or taxes that may be paid by an investor.
| | |
| 6 | | Visit our website at pgim.com/investments |
Presentation of Fund Holdings as of 10/31/21
| | | | | | |
| | | |
Ten Largest Holdings | | Line of Business | | Country | | % of Net Assets |
| | | |
Tesla, Inc. | | Automobiles | | United States | | 8.5% |
| | | |
Sea Ltd., ADR | | Entertainment | | Taiwan | | 5.3% |
| | | |
Adyen NV, 144A | | IT Services | | Netherlands | | 4.8% |
| | | |
Apple, Inc. | | Technology Hardware, Storage & Peripherals | | United States | | 4.8% |
| | | |
NVIDIA Corp. | | Semiconductors & Semiconductor Equipment | | United States | | 4.7% |
| | | |
Shopify, Inc. (Class A Stock) | | IT Services | | Canada | | 4.1% |
| | | |
LVMH Moet Hennessy Louis Vuitton SE | | Textiles, Apparel & Luxury Goods | | France | | 4.1% |
| | | |
Atlassian Corp. PLC (Class A Stock) | | Software | | United States | | 3.8% |
| | | |
Alphabet, Inc. (Class A Stock) | | Interactive Media & Services | | United States | | 3.7% |
| | | |
ASML Holding NV | | Semiconductors & Semiconductor Equipment | | Netherlands | | 3.2% |
Holdings reflect only long-term investments and are subject to change.
| | | | |
PGIM Jennison Global Opportunities Fund | | | 7 | |
Strategy and Performance Overview (unaudited)
How did the Fund perform?
The PGIM Jennison Global Opportunities Fund’s Class Z shares returned 37.96% in the 12-month reporting period that ended October 31, 2021, slightly outperforming the 37.28% return of the MSCI All Country World Net Dividends Index (the Index).
What were the market conditions?
| ● | In early fall 2020, investors began to favor areas of the market that were most exposed to an economic recovery and most debilitated by the COVID-19 pandemic. This rotation extended into the first quarter of 2021, boosting valuations of cyclical companies and reducing the earnings multiples of secular growth companies. |
| ● | June 2021 marked a turning point in the US economic reopening and reflation outlook, as the Federal Reserve’s comments began to reflect concerns about labor shortages and rising prices. |
| ● | Corporate profit growth through the end of the reporting period was strong, highlighting the expanding recovery and boosting business confidence to its highest level since the early days of the pandemic. |
| ● | The Chinese government took further steps during the period to rein in the activities of many of its largest consumer-facing companies, citing concerns over privacy, unintended usage of consumer data, and the deleterious health effects of excessive amounts of time spent online. Chinese stocks sold off sharply after these moves and the elevated risk of further intervention. |
| ● | All sectors in the Index generated positive returns for the period. The energy, financials, and information technology sectors posted the largest gains. Returns for defensive sectors such as utilities and consumer staples were comparatively modest. |
What worked?
| ● | In the consumer discretionary sector: |
| | ● | Shares of electric-vehicle maker Tesla, Inc. continued to surge during the reporting period on a host of impressive financial results made possible by solid production, increased capacity, and strong execution. Jennison believes the company’s technology, scale, and low-cost advantage make it not only the breakaway leader in the electric-vehicle market but also position it to disrupt the overall automotive industry. |
| | ● | LVMH Moët Hennessy Louis Vuitton SE is the world’s largest luxury goods company, with operations in wines and spirits, perfumes and cosmetics, fashion and leather goods, watches and jewelry, and selective retailing. The Fund holds the stock because of the consistent performance of LVMH’s flagship brand, Louis Vuitton, the company’s well-diversified portfolio, growth opportunities in emerging Asia, and what Jennison considers a strong management team. The company’s mega brands (Louis Vuitton and Christian Dior) have continued to drive earnings growth, but its smaller brands have continued to gain momentum. |
| | |
| 8 | | Visit our website at pgim.com/investments |
| ● | In the information technology sector: |
| | ● | The success of Adyen NV was attributed to its single platform that supports global omni-channel commerce with dynamic, reliable, end-to-end processing, and risk management services. |
| | ● | Ever-growing demand for Nvidia Corp.’s cloud storage has fueled robust spending by the company’s largest customers and has been a source of high-margin revenue strength. Continued growth in the firm’s large gaming sector business and a growing automotive pipeline are other key factors in Jennison’s positive outlook for the company. Nvidia is focused on key high-growth markets where it can leverage its graphics semiconductor expertise to offer high value-added solutions. |
| ● | Wuxi Biologics—which discovers, researches, develops, and manufactures biologics services—drove performance in the healthcare sector during the period. As a contract research organization based in China, Wuxi benefited from several trends, including increasing research and development outsourcing activities from drug companies, biologics being favored over chemical drugs, and a biotech boom in China. However, the Fund eliminated the position during the period due to the regulatory environment in China. |
What didn’t work?
| ● | On a sector level, the absence of financials and energy sector stocks from the Fund hurt performance as they were the Index’s best-performing sectors during the reporting period. |
| ● | Individual holdings with disappointing performance included: |
| | ● | Tencent Holdings Ltd. and Meituan, both based in China, were notable detractors from performance due the country’s changing regulatory environment. Tencent is the largest video game publisher in the world by revenue but is best known in China for its WeChat and QQ messaging and mobile-payment apps. Meituan is a Chinese consumer services marketplace website. Both positions were eliminated during the period due to the heightened risk brought on by the regulatory changes. |
| | ● | Zoom Video Communications Inc. shares fell after falling short of the market’s heightened expectations. The position was sold from the Fund during the period. |
| | ● | Snowflake Inc. is a cloud-based data warehousing company, and Wix.com Ltd. is an Israeli software company that provides cloud-based web-development services. The Fund sold both positions during the period in a very volatile market in favor of stocks in which it had higher near-term conviction. |
Current outlook
| ● | Investors are facing a complex economic landscape heading into the end of 2021. Interest rates are responding to elevated wage and goods price inflation, exacerbated by supply-chain bottlenecks and shortages of critical components. Jennison expects corporate profit growth to return to pre-COVID-19 trend levels over the next year. |
| | | | |
PGIM Jennison Global Opportunities Fund | | | 9 | |
Strategy and Performance Overview (continued)
While these levels are respectable in absolute terms, in Jennison’s view, they represent a meaningful slowdown from the COVID-19-driven highs reached over the previous 18 months.
| • | | Many companies that reported strong operating results during the pandemic due to a broad shift toward online shopping and work-from-home business models are now facing challenging financial results comparisons to the previous reporting period. While this may be a headwind for share prices in the short term, Jennison believes that developments during the past 18 months have accelerated trends in consumer and enterprise behavior that were already in place before COVID-19 and that the step-up in growth demand in these areas may persist for some time. |
| • | | Jennison remains optimistic that the Fund’s portfolio holdings are well positioned to navigate this complex landscape. While the Fund’s investments are not insulated from the macro-economic backdrop, Jennison believes their market-leading positions, strong cash flow generation and reinvestment, and often-disruptive business models should allow them to deliver growth that exceeds current market expectations, leading to potential share price outperformance over the long-term investment horizon. |
| | |
| 10 | | Visit our website at pgim.com/investments |
Fees and Expenses (unaudited)
As a shareholder of the Fund, you incur two types of costs: (1) transaction costs, including sales charges (loads) on purchase payments and redemptions, as applicable, and (2) ongoing costs, including management fees, distribution and/or service (12b-1) fees, and other Fund expenses, as applicable. This example is intended to help you understand your ongoing costs (in dollars) of investing in the Fund and to compare these costs with the ongoing costs of investing in other mutual funds.
The example is based on an investment of $1,000 held through the six-month period ended October 31, 2021. The example is for illustrative purposes only; you should consult the Prospectus for information on initial and subsequent minimum investment requirements.
Actual Expenses
The first line for each share class in the table on the following page provides information about actual account values and actual expenses. You may use the information on this line, together with the amount you invested, to estimate the expenses that you paid over the period. Simply divide your account value by $1,000 (for example, an $8,600 account value ÷ $1,000 = 8.6), then multiply the result by the number on the first line under the heading “Expenses Paid During the Six-Month Period” to estimate the expenses you paid on your account during this period.
Hypothetical Example for Comparison Purposes
The second line for each share class in the table on the following page provides information about hypothetical account values and hypothetical expenses based on the Fund’s actual expense ratio and an assumed rate of return of 5% per year before expenses, which is not the Fund’s actual return. The hypothetical account values and expenses may not be used to estimate the actual ending account balance or expenses you paid for the period. You may use this information to compare the ongoing costs of investing in the Fund and other funds. To do so, compare this 5% hypothetical example with the 5% hypothetical examples that appear in the shareholder reports of the other funds.
The Fund’s transfer agent may charge additional fees to holders of certain accounts that are not included in the expenses shown in the table on the following page. These fees apply to individual retirement accounts (IRAs) and Section 403(b) accounts. As of the close of the six-month period covered by the table, IRA fees included an annual maintenance fee of $15 per account (subject to a maximum annual maintenance fee of $25 for all accounts held by the same shareholder). Section 403(b) accounts are charged an annual $25 fiduciary maintenance fee. Some of the fees may vary in amount, or may be waived, based on your total account balance or the number of PGIM funds, including the Fund, that you own. You should consider the additional fees that were charged to your Fund account over the six-month period when you estimate the total ongoing expenses paid over the period and the impact of these fees on your ending account value, as these additional expenses are not reflected in the information
| | | | |
PGIM Jennison Global Opportunities Fund | | | 11 | |
Fees and Expenses (continued)
provided in the expense table. Additional fees have the effect of reducing investment returns.
Please note that the expenses shown in the table are meant to highlight your ongoing costs only and do not reflect any transactional costs such as sales charges (loads). Therefore, the second line for each share class in the table is useful in comparing ongoing costs only and will not help you determine the relative total costs of owning different funds. In addition, if these transactional costs were included, your costs would have been higher.
| | | | | | | | | | |
| | | | | |
PGIM Jennison Global Opportunities Fund | | Beginning
Account Value
May 1, 2021 | | Ending Account Value
October 31, 2021 | | Annualized
Expense
Ratio Based on
the
Six-Month Period | | Expenses Paid
During the
Six-Month Period* |
| Class A | | Actual | | $1,000.00 | | $1,140.60 | | 1.08% | | $ 5.83 |
| | Hypothetical | | $1,000.00 | | $1,019.76 | | 1.08% | | $ 5.50 |
| Class C | | Actual | | $1,000.00 | | $1,136.00 | | 1.91% | | $10.28 |
| | Hypothetical | | $1,000.00 | | $1,015.58 | | 1.91% | | $ 9.70 |
| Class Z | | Actual | | $1,000.00 | | $1,141.50 | | 0.93% | | $ 5.02 |
| | Hypothetical | | $1,000.00 | | $1,020.52 | | 0.93% | | $ 4.74 |
| Class R2 | | Actual | | $1,000.00 | | $1,139.00 | | 1.39% | | $ 7.49 |
| | Hypothetical | | $1,000.00 | | $1,018.20 | | 1.39% | | $ 7.07 |
| Class R4 | | Actual | | $1,000.00 | | $1,140.40 | | 1.09% | | $ 5.88 |
| | Hypothetical | | $1,000.00 | | $1,019.71 | | 1.09% | | $ 5.55 |
| Class R6 | | Actual | | $1,000.00 | | $1,142.10 | | 0.83% | | $ 4.48 |
| | | Hypothetical | | $1,000.00 | | $1,021.02 | | 0.83% | | $ 4.23 |
*Fund expenses (net of fee waivers or subsidies, if any) for each share class are equal to the annualized expense ratio for each share class (provided in the table), multiplied by the average account value over the period, multiplied by the 184 days in the six-month period ended October 31, 2021, and divided by the 365 days in the Fund’s fiscal year ended October 31, 2021 (to reflect the six-month period). Expenses presented in the table include the expenses of any underlying portfolios in which the Fund may invest.
| | |
| 12 | | Visit our website at pgim.com/investments |
Schedule of Investments
as of October 31, 2021
| | | | | | | | |
| | |
| Description | | Shares | | | Value | |
| | |
| LONG-TERM INVESTMENTS 99.0% | | | | | | |
| | |
| COMMON STOCKS | | | | | | |
| | |
| Argentina 2.8% | | | | | | |
| | |
MercadoLibre, Inc.* | | | 176,380 | | | $ | 261,222,308 | |
| | |
| Canada 4.1% | | | | | | |
| | |
Shopify, Inc. (Class A Stock)* | | | 263,245 | | | | 386,109,339 | |
| | |
| France 14.7% | | | | | | |
| | |
Hermes International | | | 176,921 | | | | 281,057,806 | |
Kering SA | | | 146,161 | | | | 110,112,822 | |
L’Oreal SA | | | 624,459 | | | | 285,627,111 | |
LVMH Moet Hennessy Louis Vuitton SE | | | 491,677 | | | | 385,809,212 | |
Pernod Ricard SA | | | 840,206 | | | | 193,261,944 | |
Remy Cointreau SA | | | 638,304 | | | | 128,904,273 | |
| | | | | | | | |
| | |
| | | | | | | 1,384,773,168 | |
| | |
| Germany 1.7% | | | | | | |
| | |
BioNTech SE, ADR* | | | 554,294 | | | | 154,498,367 | |
| | |
| Hong Kong 2.3% | | | | | | |
| | |
Techtronic Industries Co. Ltd. | | | 10,501,674 | | | | 216,481,602 | |
| | |
| Italy 2.3% | | | | | | |
| | |
Ferrari NV | | | 922,552 | | | | 218,721,902 | |
| | |
| Netherlands 8.0% | | | | | | |
| | |
Adyen NV, 144A* | | | 148,675 | | | | 450,920,526 | |
ASML Holding NV | | | 374,389 | | | | 304,088,072 | |
| | | | | | | | |
| | |
| | | | | | | 755,008,598 | |
| | |
| Switzerland 4.8% | | | | | | |
Cie Financiere Richemont SA (Class A Stock) | | | 1,095,427 | | | | 135,718,768 | |
Givaudan SA | | | 32,652 | | | | 153,681,567 | |
Straumann Holding AG | | | 79,246 | | | | 165,088,792 | |
| | | | | | | | |
| | |
| | | | | | | 454,489,127 | |
| | |
| Taiwan 5.3% | | | | | | |
Sea Ltd., ADR* | | | 1,453,137 | | | | 499,254,279 | |
| | |
| United States 52.1% | | | | | | |
Airbnb, Inc. (Class A Stock)* | | | 1,677,841 | | | | 286,340,345 | |
See Notes to Financial Statements.
| | | | |
PGIM Jennison Global Opportunities Fund | | | 13 | |
Schedule of Investments (continued)
as of October 31, 2021
| | | | | | | | |
| | |
| Description | | Shares | | | Value | |
| | |
| COMMON STOCKS (Continued) | | | | | | |
| | |
| United States (cont’d.) | | | | | | |
Align Technology, Inc.* | | | 278,716 | | | $ | 174,021,909 | |
Alphabet, Inc. (Class A Stock)* | | | 116,305 | | | | 344,369,801 | |
Amazon.com, Inc.* | | | 85,945 | | | | 289,843,496 | |
Apple, Inc. | | | 2,992,834 | | | | 448,326,533 | |
Atlassian Corp. PLC (Class A Stock)* | | | 783,275 | | | | 358,841,776 | |
Crowdstrike Holdings, Inc. (Class A Stock)* | | | 631,496 | | | | 177,955,573 | |
DocuSign, Inc.* | | | 690,593 | | | | 192,185,126 | |
Dynatrace, Inc.* | | | 2,999,740 | | | | 224,980,500 | |
Home Depot, Inc. (The) | | | 199,428 | | | | 74,135,365 | |
HubSpot, Inc.* | | | 349,876 | | | | 283,480,031 | |
Match Group, Inc.* | | | 795,897 | | | | 120,005,350 | |
Netflix, Inc.* | | | 150,880 | | | | 104,153,973 | |
NIKE, Inc. (Class B Stock) | | | 465,245 | | | | 77,830,836 | |
NVIDIA Corp. | | | 1,729,212 | | | | 442,107,632 | |
Okta, Inc.* | | | 404,253 | | | | 99,923,256 | |
Snap, Inc. (Class A Stock)* | | | 2,659,838 | | | | 139,854,282 | |
Square, Inc. (Class A Stock)*(a) | | | 1,055,728 | | | | 268,682,776 | |
Tesla, Inc.* | | | 716,493 | | | | 798,173,202 | |
| | | | | | | | |
| | |
| | | | | | | 4,905,211,762 | |
| | |
| Uruguay 0.9% | | | | | | |
| | |
Dlocal Ltd.* | | | 1,698,107 | | | | 82,375,171 | |
| | | | | | | | |
| | |
TOTAL LONG-TERM INVESTMENTS
(cost $5,663,536,509) | | | | | | | 9,318,145,623 | |
| | | | | | | | |
| | |
SHORT-TERM INVESTMENTS 0.7% | | | | | | | | |
| | |
AFFILIATED MUTUAL FUNDS | | | | | | | | |
PGIM Core Ultra Short Bond Fund(wa) | | | 46,760,862 | | | | 46,760,862 | |
PGIM Institutional Money Market Fund
(cost $16,154,794; includes $16,153,536 of cash collateral for securities on loan)(b)(wa) | | | 16,164,492 | | | | 16,154,794 | |
| | | | | | | | |
| | |
TOTAL SHORT-TERM INVESTMENTS
(cost $62,915,656) | | | | | | | 62,915,656 | |
| | | | | | | | |
| | |
TOTAL INVESTMENTS 99.7%
(cost $5,726,452,165) | | | | | | | 9,381,061,279 | |
Other assets in excess of liabilities 0.3% | | | | | | | 28,801,851 | |
| | | | | | | | |
| | |
NET ASSETS 100.0% | | | | | | $ | 9,409,863,130 | |
| | | | | | | | |
See Notes to Financial Statements.
Below is a list of the abbreviation(s) used in the annual report:
144A—Security was purchased pursuant to Rule 144A under the Securities Act of 1933 and, pursuant to the requirements of Rule 144A, may not be resold except to qualified institutional buyers.
ADR—American Depositary Receipt
LIBOR—London Interbank Offered Rate
| * | Non-income producing security. |
| (a) | All or a portion of security is on loan. The aggregate market value of such securities, including those sold and pending settlement, is $15,422,700; cash collateral of $16,153,536 (included in liabilities) was received with which the Fund purchased highly liquid short-term investments. In the event of significant appreciation in value of securities on loan on the last business day of the reporting period, the Fund may reflect a collateral value that is less than the market value of the loaned securities and such shortfall is remedied the following business day. |
| (b) | Represents security, or portion thereof, purchased with cash collateral received for securities on loan and includes dividend reinvestment. |
| (wa) | PGIM Investments LLC, the manager of the Fund, also serves as manager of the PGIM Core Ultra Short Bond Fund and PGIM Institutional Money Market Fund, if applicable. |
Fair Value Measurements:
Various inputs are used in determining the value of the Fund’s investments. These inputs are summarized in the three broad levels listed below.
Level 1—unadjusted quoted prices generally in active markets for identical securities.
Level 2—quoted prices for similar securities, interest rates and yield curves, prepayment speeds, foreign currency exchange rates and other observable inputs.
Level 3—unobservable inputs for securities valued in accordance with Board approved fair valuation procedures.
The following is a summary of the inputs used as of October 31, 2021 in valuing such portfolio securities:
| | | | | | | | | | | | |
| | | Level 1 | | | Level 2 | | | Level 3 | |
Investments in Securities | | | | | | | | | | | | |
Assets | | | | | | | | | | | | |
Long-Term Investments | | | | | | | | | | | | |
Common Stocks | | | | | | | | | | | | |
Argentina | | $ | 261,222,308 | | | $ | — | | | | $— | |
Canada | | | 386,109,339 | | | | — | | | | — | |
France | | | — | | | | 1,384,773,168 | | | | — | |
Germany | | | 154,498,367 | | | | — | | | | — | |
Hong Kong | | | — | | | | 216,481,602 | | | | — | |
Italy | | | — | | | | 218,721,902 | | | | — | |
Netherlands | | | — | | | | 755,008,598 | | | | — | |
Switzerland | | | — | | | | 454,489,127 | | | | — | |
Taiwan | | | 499,254,279 | | | | — | | | | — | |
United States | | | 4,905,211,762 | | | | — | | | | — | |
Uruguay | | | 82,375,171 | | | | — | | | | — | |
Short-Term Investments | | | | | | | | | | | | |
Affiliated Mutual Funds | | | 62,915,656 | | | | — | | | | — | |
| | | | | | | | | | | | |
Total | | $ | 6,351,586,882 | | | $ | 3,029,474,397 | | | | $— | |
| | | | | | | | | | | | |
See Notes to Financial Statements.
| | | | |
PGIM Jennison Global Opportunities Fund | | | 15 | |
Schedule of Investments (continued)
as of October 31, 2021
Industry Classification:
The industry classification of investments and other assets in excess of liabilities shown as a percentage of net assets as of October 31, 2021 were as follows (unaudited):
| | | | |
IT Services | | | 13.7 | % |
Software | | | 13.1 | |
Automobiles | | | 10.8 | |
Textiles, Apparel & Luxury Goods | | | 10.5 | |
Semiconductors & Semiconductor Equipment | | | 7.9 | |
Interactive Media & Services | | | 6.5 | |
Entertainment | | | 6.4 | |
Internet & Direct Marketing Retail | | | 5.9 | |
Technology Hardware, Storage & Peripherals | | | 4.8 | |
Health Care Equipment & Supplies | | | 3.6 | |
Beverages | | | 3.4 | |
Hotels, Restaurants & Leisure | | | 3.0 | |
Personal Products | | | 3.0 | |
| | | | |
Machinery | | | 2.3 | % |
Biotechnology | | | 1.7 | |
Chemicals | | | 1.6 | |
Specialty Retail | | | 0.8 | |
Affiliated Mutual Funds (0.2% represents investments purchased with collateral from securities on loan) | | | 0.7 | |
| | | | |
| | | 99.7 | |
Other assets in excess of liabilities | | | 0.3 | |
| | | | |
| |
| | | 100.0 | % |
| | | | |
Financial Instruments/Transactions—Summary of Offsetting and Netting Arrangements:
The Fund entered into financial instruments/transactions during the reporting period that are either offset in accordance with current requirements or are subject to enforceable master netting arrangements or similar agreements that permit offsetting. The information about offsetting and related netting arrangements for financial instruments/transactions where the legal right to set-off exists is presented in the summary below.
Offsetting of financial instrument/transaction assets and liabilities:
| | | | | | | | | | | | |
Description | | Gross Market
Value of
Recognized
Assets/(Liabilities) | | | Collateral
Pledged/(Received)(1) | | | Net
Amount | |
| Securities on Loan | | $ | 15,422,700 | | | $ | (15,422,700 | ) | | $ | — | |
| | | | | | | | | | | | |
| (1) | Collateral amount disclosed by the Fund is limited to the market value of financial instruments/transactions. |
See Notes to Financial Statements.
Statement of Assets and Liabilities
as of October 31, 2021
| | | | | |
Assets | | | | | |
Investments at value, including securities on loan of $15,422,700: | | | | | |
Unaffiliated investments (cost $5,663,536,509) | | | $ | 9,318,145,623 | |
Affiliated investments (cost $62,915,656) | | | | 62,915,656 | |
Foreign currency, at value (cost $146,895) | | | | 146,914 | |
Receivable for investments sold | | | | 50,880,424 | |
Receivable for Fund shares sold | | | | 26,513,245 | |
Tax reclaim receivable | | | | 2,826,658 | |
Dividends receivable | | | | 198 | |
Prepaid expenses | | | | 50,516 | |
| | | | | |
| |
Total Assets | | | | 9,461,479,234 | |
| | | | | |
| |
Liabilities | | | | | |
Payable for Fund shares purchased | | | | 24,108,065 | |
Payable to broker for collateral for securities on loan | | | | 16,153,536 | |
Management fee payable | | | | 6,073,203 | |
Payable for investments purchased | | | | 3,729,504 | |
Accrued expenses and other liabilities | | | | 919,338 | |
Distribution fee payable | | | | 569,368 | |
Affiliated transfer agent fee payable | | | | 56,457 | |
Directors’ fees payable | | | | 6,633 | |
| | | | | |
Total Liabilities | | | | 51,616,104 | |
| | | | | |
| |
Net Assets | | | $ | 9,409,863,130 | |
| | | | | |
| |
| | | | | | |
Net assets were comprised of: | | | | | |
Common stock, at par | | | $ | 1,776 | |
Paid-in capital in excess of par | | | | 4,945,554,507 | |
Total distributable earnings (loss) | | | | 4,464,306,847 | |
| | | | | |
| |
Net assets, October 31, 2021 | | | $ | 9,409,863,130 | |
| | | | | |
See Notes to Financial Statements.
| | | | |
PGIM Jennison Global Opportunities Fund | | | 17 | |
Statement of Assets and Liabilities
as of October 31, 2021
| | | | |
Class A | | | | |
Net asset value and redemption price per share, ($797,091,017 ÷ 15,285,127 shares of common stock issued and outstanding) | | $ | 52.15 | |
Maximum sales charge (5.50% of offering price) | | | 3.04 | |
| | | | |
Maximum offering price to public | | $ | 55.19 | |
| | | | |
| |
Class C | | | | |
Net asset value, offering price and redemption price per share, ($496,435,134 ÷ 10,285,303 shares of common stock issued and outstanding) | | $ | 48.27 | |
| | | | |
| |
Class Z | | | | |
Net asset value, offering price and redemption price per share, ($4,792,804,518 ÷ 90,003,746 shares of common stock issued and outstanding) | | $ | 53.25 | |
| | | | |
| |
Class R2 | | | | |
Net asset value, offering price and redemption price per share, ($21,615,461 ÷ 408,942 shares of common stock issued and outstanding) | | $ | 52.86 | |
| | | | |
| |
Class R4 | | | | |
Net asset value, offering price and redemption price per share, ($332,281 ÷ 6,237 shares of common stock issued and outstanding) | | $ | 53.27 | |
| | | | |
| |
Class R6 | | | | |
Net asset value, offering price and redemption price per share, ($3,301,584,719 ÷ 61,599,911 shares of common stock issued and outstanding) | | $ | 53.60 | |
| | | | |
Net Asset Values Per Share may not recalculate due to rounding.
See Notes to Financial Statements.
Statement of Operations
Year Ended October 31, 2021
| | | | |
Net Investment Income (Loss) | | | | |
| |
Income | | | | |
Unaffiliated dividend income (net of $2,838,980 foreign withholding tax) | | $ | 22,477,582 | |
Income from securities lending, net (including affiliated income of $224,869) | | | 516,794 | |
Affiliated dividend income | | | 137,403 | |
| | | | |
Total income | | | 23,131,779 | |
| | | | |
| |
Expenses | | | | |
Management fee | | | 65,388,405 | |
Distribution fee(a) | | | 6,584,071 | |
Shareholder servicing fees(a) | | | 13,476 | |
Transfer agent’s fees and expenses (including affiliated expense of $316,882)(a) | | | 5,053,903 | |
Custodian and accounting fees | | | 660,930 | |
Shareholders’ reports | | | 396,757 | |
Registration fees(a) | | | 378,925 | |
SEC registration fees | | | 135,000 | |
Directors’ fees | | | 98,950 | |
Legal fees and expenses | | | 52,734 | |
Audit fee | | | 29,133 | |
Miscellaneous | | | 89,192 | |
| | | | |
Total expenses | | | 78,881,476 | |
Less: Fee waiver and/or expense reimbursement(a) | | | (552,871 | ) |
Distribution fee waiver(a) | | | (342,284 | ) |
| | | | |
Net expenses | | | 77,986,321 | |
| | | | |
Net investment income (loss) | | | (54,854,542 | ) |
| | | | |
| |
| Realized And Unrealized Gain (Loss) On Investment And Foreign Currency Transactions | | | |
Net realized gain (loss) on: | | | | |
Investment transactions (including affiliated of $98,341) | | | 901,317,860 | |
Foreign currency transactions | | | (757,134 | ) |
| | | | |
| | | 900,560,726 | |
| | | | |
| |
Net change in unrealized appreciation (depreciation) on: | | | | |
Investments (including affiliated of $(192,834)) | | | 1,589,288,518 | |
Foreign currencies | | | 44,704 | |
| | | | |
| | | 1,589,333,222 | |
| | | | |
Net gain (loss) on investment and foreign currency transactions | | | 2,489,893,948 | |
| | | | |
Net Increase (Decrease) In Net Assets Resulting From Operations | | $ | 2,435,039,406 | |
| | | | |
| (a) | Class specific expenses and waivers were as follows: |
| | | | | | | | | | | | | | | | | | | | | | | | |
| | | Class A | | | Class C | | | Class Z | | | Class R2 | | | Class R4 | | | Class R6 | |
Distribution fee | | | 2,053,706 | | | | 4,498,698 | | | | — | | | | 31,667 | | | | — | | | | — | |
Shareholder servicing fees | | | — | | | | — | | | | — | | | | 12,953 | | | | 523 | | | | — | |
Transfer agent’s fees and expenses | | | 554,075 | | | | 349,756 | | | | 4,105,855 | | | | 19,875 | | | | 1,028 | | | | 23,314 | |
Registration fees | | | 45,540 | | | | 31,520 | | | | 108,815 | | | | 7,924 | | | | 7,924 | | | | 177,202 | |
Fee waiver and/or expense reimbursement | | | (538,348 | ) | | | — | | | | — | | | | (6,730 | ) | | | (7,793 | ) | | | — | |
Distribution fee waiver | | | (342,284 | ) | | | — | | | | — | | | | — | | | | — | | | | — | |
See Notes to Financial Statements.
| | | | |
PGIM Jennison Global Opportunities Fund | | | 19 | |
Statements of Changes in Net Assets
| | | | | | | | |
| | | Year Ended
October 31, | |
| | | 2021 | | | 2020 | |
| | |
Increase (Decrease) in Net Assets | | | | | | | | |
| | |
Operations | | | | | | | | |
Net investment income (loss) | | $ | (54,854,542 | ) | | $ | (24,110,346 | ) |
Net realized gain (loss) on investment and foreign currency transactions | | | 900,560,726 | | | | 185,878,039 | |
Net change in unrealized appreciation (depreciation) on investments and foreign currencies | | | 1,589,333,222 | | | | 1,677,114,199 | |
| | | | | | | | |
Net increase (decrease) in net assets resulting from operations | | | 2,435,039,406 | | | | 1,838,881,892 | |
| | | | | | | | |
| | |
Dividends and Distributions | | | | | | | | |
Distributions from distributable earnings | | | | | | | | |
Class A | | | (9,958,088 | ) | | | — | |
Class C | | | (7,632,427 | ) | | | — | |
Class Z | | | (66,508,567 | ) | | | — | |
Class R2 | | | (7,434 | ) | | | — | |
Class R4 | | | (9,579 | ) | | | — | |
Class R6 | | | (36,320,678 | ) | | | — | |
| | | | | | | | |
| | | (120,436,773 | ) | | | — | |
| | | | | | | | |
| | |
Fund share transactions (Net of share conversions) | | | | | | | | |
Net proceeds from shares sold | | | 3,048,592,811 | | | | 2,869,534,185 | |
Net asset value of shares issued in reinvestment of dividends and distributions | | | 117,629,727 | | | | — | |
Cost of shares purchased | | | (2,124,201,273 | ) | | | (1,210,949,163 | ) |
| | | | | | | | |
Net increase (decrease) in net assets from Fund share transactions | | | 1,042,021,265 | | | | 1,658,585,022 | |
| | | | | | | | |
Total increase (decrease) | | | 3,356,623,898 | | | | 3,497,466,914 | |
| | |
Net Assets: | | | | | | | | |
| | |
Beginning of year | | | 6,053,239,232 | | | | 2,555,772,318 | |
| | | | | | | | |
End of year | | $ | 9,409,863,130 | | | $ | 6,053,239,232 | |
| | | | | | | | |
See Notes to Financial Statements.
Financial Highlights
| | | | | | | | | | | | | | | | | | | | |
| Class A Shares | |
| | | Year Ended October 31, | |
| | | 2021 | | | 2020 | | | 2019 | | | 2018 | | | 2017 | |
| Per Share Operating Performance(a): | | | | | | | | | | | | | | | | | | | | |
| Net Asset Value, Beginning of Year | | | $38.50 | | | | $24.58 | | | | $21.47 | | | | $20.72 | | | | $15.14 | |
| Income (loss) from investment operations: | | | | | | | | | | | | | | | | | | | | |
| Net investment income (loss) | | | (0.37 | ) | | | (0.22 | ) | | | (0.11 | ) | | | (0.13 | ) | | | (0.09 | ) |
| Net realized and unrealized gain (loss) on investment and foreign currency transactions | | | 14.76 | | | | 14.14 | | | | 3.22 | | | | 0.88 | | | | 5.67 | |
| Total from investment operations | | | 14.39 | | | | 13.92 | | | | 3.11 | | | | 0.75 | | | | 5.58 | |
| Less Dividends and Distributions: | | | | | | | | | | | | | | | | | | | | |
| Distributions from net realized gains | | | (0.74 | ) | | | - | | | | - | | | | - | | | | - | |
| Net asset value, end of year | | | $52.15 | | | | $38.50 | | | | $24.58 | | | | $21.47 | | | | $20.72 | |
| Total Return(b): | | | 37.75 | % | | | 56.63 | % | | | 14.49 | % | | | 3.62 | % | | | 36.86 | % |
| | | | | | | | | | | | | | | | | | | | | |
| Ratios/Supplemental Data: | | | | | | | | | | | | | | | |
| Net assets, end of year (000) | | | $797,091 | | | | $494,173 | | | | $236,118 | | | | $164,764 | | | | $90,247 | |
| Average net assets (000) | | | $684,569 | | | | $344,283 | | | | $205,653 | | | | $142,313 | | | | $70,810 | |
| Ratios to average net assets(c)(d): | | | | | | | | | | | | | | | | | | | | |
| Expenses after waivers and/or expense reimbursement | | | 1.08 | % | | | 1.08 | % | | | 1.08 | % | | | 1.14 | % | | | 1.19 | % |
| Expenses before waivers and/or expense reimbursement | | | 1.21 | % | | | 1.24 | % | | | 1.28 | % | | | 1.30 | % | | | 1.33 | % |
| Net investment income (loss) | | | (0.80 | )% | | | (0.69 | )% | | | (0.45 | )% | | | (0.55 | )% | | | (0.55 | )% |
| Portfolio turnover rate(e) | | | 62 | % | | | 57 | % | | | 52 | % | | | 62 | % | | | 79 | % |
| (a) | Calculated based on average shares outstanding during the year. |
| (b) | Total return does not consider the effects of sales loads. Total return is calculated assuming a purchase of a share on the first day and a sale on the last day of each year reported and includes reinvestment of dividends and distributions, if any. Total returns may reflect adjustments to conform to GAAP. |
| (c) | Does not include expenses of the underlying funds in which the Fund invests. |
| (d) | Effective November 1, 2017, class specific expenses include transfer agent fees and expenses and registration fees, which are charged to their respective share class. |
| (e) | The Fund’s portfolio turnover rate is calculated in accordance with regulatory requirements, without regard to transactions involving short-term investments and certain derivatives. If such transactions were included, the Fund’s portfolio turnover rate may be higher. |
See Notes to Financial Statements.
| | | | |
PGIM Jennison Global Opportunities Fund | | | 21 | |
Financial Highlights (continued)
| | | | | | | | | | | | | | | | | | | | |
| Class C Shares | |
| | | Year Ended October 31, | |
| | | 2021 | | | 2020 | | | 2019 | | | 2018 | | | 2017 | |
| Per Share Operating Performance(a): | | | | | | | | | | | | | | | | | | | | |
| Net Asset Value, Beginning of Year | | | $35.98 | | | | $23.16 | | | | $20.41 | | | | $19.85 | | | | $14.61 | |
| Income (loss) from investment operations: | | | | | | | | | | | | | | | | | | | | |
| Net investment income (loss) | | | (0.70 | ) | | | (0.45 | ) | | | (0.29 | ) | | | (0.30 | ) | | | (0.22 | ) |
| Net realized and unrealized gain (loss) on investment and foreign currency transactions | | | 13.73 | | | | 13.27 | | | | 3.04 | | | | 0.86 | | | | 5.46 | |
| Total from investment operations | | | 13.03 | | | | 12.82 | | | | 2.75 | | | | 0.56 | | | | 5.24 | |
| Less Dividends and Distributions: | | | | | | | | | | | | | | | | | | | | |
| Distributions from net realized gains | | | (0.74 | ) | | | - | | | | - | | | | - | | | | - | |
| Net asset value, end of year | | | $48.27 | | | | $35.98 | | | | $23.16 | | | | $20.41 | | | | $19.85 | |
| Total Return(b): | | | 36.63 | % | | | 55.31 | % | | | 13.47 | % | | | 2.82 | % | | | 35.87 | % |
| | | | | | | | | | | | | | | | | | | | | |
| Ratios/Supplemental Data: | | | | | | | | | | | | | | | |
| Net assets, end of year (000) | | | $496,435 | | | | $364,557 | | | | $211,290 | | | | $168,587 | | | | $79,531 | |
| Average net assets (000) | | | $449,870 | | | | $279,272 | | | | $198,518 | | | | $136,788 | | | | $55,922 | |
| Ratios to average net assets(c)(d): | | | | | | | | | | | | | | | | | | | | |
| Expenses after waivers and/or expense reimbursement | | | 1.91 | % | | | 1.93 | % | | | 1.94 | % | | | 1.94 | % | | | 1.94 | % |
| Expenses before waivers and/or expense reimbursement | | | 1.91 | % | | | 1.93 | % | | | 1.97 | % | | | 1.99 | % | | | 2.03 | % |
| Net investment income (loss) | | | (1.62 | )% | | | (1.53 | )% | | | (1.31 | )% | | | (1.35 | )% | | | (1.28 | )% |
| Portfolio turnover rate(e) | | | 62 | % | | | 57 | % | | | 52 | % | | | 62 | % | | | 79 | % |
| (a) | Calculated based on average shares outstanding during the year. |
| (b) | Total return does not consider the effects of sales loads. Total return is calculated assuming a purchase of a share on the first day and a sale on the last day of each year reported and includes reinvestment of dividends and distributions, if any. Total returns may reflect adjustments to conform to GAAP. |
| (c) | Does not include expenses of the underlying funds in which the Fund invests. |
| (d) | Effective November 1, 2017, class specific expenses include transfer agent fees and expenses and registration fees, which are charged to their respective share class. |
| (e) | The Fund’s portfolio turnover rate is calculated in accordance with regulatory requirements, without regard to transactions involving short-term investments and certain derivatives. If such transactions were included, the Fund’s portfolio turnover rate may be higher. |
See Notes to Financial Statements.
| | | | | | | | | | | | | | | | | | | | |
| Class Z Shares | |
| | | Year Ended October 31, | |
| | | 2021 | | | 2020 | | | 2019 | | | 2018 | | | 2017 | |
| Per Share Operating Performance(a): | | | | | | | | | | | | | | | | | | | | |
| Net Asset Value, Beginning of Year | | | $39.24 | | | | $25.01 | | | | $21.82 | | | | $21.00 | | | | $15.31 | |
| Income (loss) from investment operations: | | | | | | | | | | | | | | | | | | | | |
| Net investment income (loss) | | | (0.30 | ) | | | (0.17 | ) | | | (0.07 | ) | | | (0.08 | ) | | | (0.05 | ) |
| Net realized and unrealized gain (loss) on investment and foreign currency transactions | | | 15.05 | | | | 14.40 | | | | 3.26 | | | | 0.90 | | | | 5.74 | |
| Total from investment operations | | | 14.75 | | | | 14.23 | | | | 3.19 | | | | 0.82 | | | | 5.69 | |
| Less Dividends and Distributions: | | | | | | | | | | | | | | | | | | | | |
| Distributions from net realized gains | | | (0.74 | ) | | | - | | | | - | | | | - | | | | - | |
| Net asset value, end of year | | | $53.25 | | | | $39.24 | | | | $25.01 | | | | $21.82 | | | | $21.00 | |
| Total Return(b): | | | 37.96 | % | | | 56.90 | % | | | 14.62 | % | | | 3.90 | % | | | 37.17 | % |
| | | | | | | | | | | | | | | | | | | | | |
| Ratios/Supplemental Data: | | | | | | | | | | | | | | | |
| Net assets, end of year (000) | | | $4,792,805 | | | | $3,390,006 | | | | $1,466,571 | | | | $927,492 | | | | $334,783 | |
| Average net assets (000) | | | $4,303,934 | | | | $2,338,060 | | | | $1,228,375 | | | | $693,749 | | | | $193,977 | |
| Ratios to average net assets(c)(d): | | | | | | | | | | | | | | | | | | | | |
| Expenses after waivers and/or expense reimbursement | | | 0.92 | % | | | 0.93 | % | | | 0.94 | % | | | 0.93 | % | | | 0.94 | % |
| Expenses before waivers and/or expense reimbursement | | | 0.92 | % | | | 0.93 | % | | | 0.96 | % | | | 0.97 | % | | | 1.02 | % |
| Net investment income (loss) | | | (0.64 | )% | | | (0.54 | )% | | | (0.31 | )% | | | (0.35 | )% | | | (0.28 | )% |
| Portfolio turnover rate(e) | | | 62 | % | | | 57 | % | | | 52 | % | | | 62 | % | | | 79 | % |
| (a) | Calculated based on average shares outstanding during the year. |
| (b) | Total return is calculated assuming a purchase of a share on the first day and a sale on the last day of each year reported and includes reinvestment of dividends and distributions, if any. Total returns may reflect adjustments to conform to GAAP. |
| (c) | Does not include expenses of the underlying funds in which the Fund invests. |
| (d) | Effective November 1, 2017, class specific expenses include transfer agent fees and expenses and registration fees, which are charged to their respective share class. |
| (e) | The Fund’s portfolio turnover rate is calculated in accordance with regulatory requirements, without regard to transactions involving short-term investments and certain derivatives. If such transactions were included, the Fund’s portfolio turnover rate may be higher. |
See Notes to Financial Statements.
| | | | |
PGIM Jennison Global Opportunities Fund | | | 23 | |
Financial Highlights (continued)
| | | | | | | | | | | | | | | | | | | | |
Class R2 Shares | |
| | | Year Ended October 31, | | | | | | December 27, 2018(a)
through October 31,
2019 | | | | |
| | | 2021 | | | 2020 | | | | | | | |
| Per Share Operating Performance(b): | | | | | | | | | | | | | | | | | | | | |
| Net Asset Value, Beginning of Period | | | $39.10 | | | | $25.02 | | | | | | | | $20.59 | | | | | |
| Income (loss) from investment operations: | | | | | | | | | | | | | | | | | | | | |
| Net investment income (loss) | | | (0.48 | ) | | | (0.31 | ) | | | | | | | (0.12 | ) | | | | |
| Net realized and unrealized gain (loss) on investment and foreign currency transactions | | | 14.98 | | | | 14.39 | | | | | | | | 4.55 | | | | | |
| Total from investment operations | | | 14.50 | | | | 14.08 | | | | | | | | 4.43 | | | | | |
| Less Dividends and Distributions: | | | | | | | | | | | | | | | | | | | | |
| Distributions from net realized gains | | | (0.74 | ) | | | - | | | | | | | | - | | | | | |
| Net asset value, end of period | | | $52.86 | | | | $39.10 | | | | | | | | $25.02 | | | | | |
| Total Return(c): | | | 37.45 | % | | | 56.27 | % | | | | | | | 21.52 | % | | | | |
| | | | | | | | | | | | | | | | | | | | | |
| Ratios/Supplemental Data: | | | | | | | | | | | | | | | |
| Net assets, end of period (000) | | | $21,615 | | | | $377 | | | | | | | | $12 | | | | | |
| Average net assets (000) | | | $12,667 | | | | $221 | | | | | | | | $13 | | | | | |
| Ratios to average net assets(d): | | | | | | | | | | | | | | | | | | | | |
| Expenses after waivers and/or expense reimbursement | | | 1.34 | % | | | 1.33 | % | | | | | | | 1.34 | %(e) | | | | |
| Expenses before waivers and/or expense reimbursement | | | 1.39 | % | | | 7.68 | % | | | | | | | 216.05 | %(e) | | | | |
| Net investment income (loss) | | | (1.00 | )% | | | (0.92 | )% | | | | | | | (0.58 | )%(e) | | | | |
| Portfolio turnover rate(f) | | | 62 | % | | | 57 | % | | | | | | | 52 | % | | | | |
| (a) | Commencement of offering. |
| (b) | Calculated based on average shares outstanding during the period. |
| (c) | Total return is calculated assuming a purchase of a share on the first day and a sale on the last day of each period reported and includes reinvestment of dividends and distributions, if any. Total returns may reflect adjustments to conform to GAAP. Total returns for periods less than one full year are not annualized. |
| (d) | Does not include expenses of the underlying funds in which the Fund invests. |
| (f) | The Fund’s portfolio turnover rate is calculated in accordance with regulatory requirements, without regard to transactions involving short-term investments and certain derivatives. If such transactions were included, the Fund’s portfolio turnover rate may be higher. |
See Notes to Financial Statements.
| | | | | | | | | | | | | | | | | | | | |
Class R4 Shares | |
| | | Year Ended October 31, | | | | | | December 27, 2018(a)
through October 31,
2019 | | | | |
| | | 2021 | | | 2020 | | | | | | | |
| Per Share Operating Performance(b): | | | | | | | | | | | | | | | | | | | | |
| Net Asset Value, Beginning of Period | | | $39.31 | | | | $25.08 | | | | | | | | $20.59 | | | | | |
| Income (loss) from investment operations: | | | | | | | | | | | | | | | | | | | | |
| Net investment income (loss) | | | (0.37 | ) | | | (0.19 | ) | | | | | | | (0.10 | ) | | | | |
| Net realized and unrealized gain (loss) on investment and foreign currency transactions | | | 15.07 | | | | 14.42 | | | | | | | | 4.59 | | | | | |
| Total from investment operations | | | 14.70 | | | | 14.23 | | | | | | | | 4.49 | | | | | |
| Less Dividends and Distributions: | | | | | | | | | | | | | | | | | | | | |
| Distributions from net realized gains | | | (0.74 | ) | | | - | | | | | | | | - | | | | | |
| Net asset value, end of period | | | $53.27 | | | | $39.31 | | | | | | | | $25.08 | | | | | |
| Total Return(c): | | | 37.76 | % | | | 56.74 | % | | | | | | | 21.81 | % | | | | |
| | | | | | | | | | | | | | | | | | | | | |
| Ratios/Supplemental Data: | | | | | | | | | | | | | | | |
| Net assets, end of period (000) | | | $332 | | | | $505 | | | | | | | | $362 | | | | | |
| Average net assets (000) | | | $696 | | | | $433 | | | | | | | | $122 | | | | | |
| Ratios to average net assets(d): | | | | | | | | | | | | | | | | | | | | |
| Expenses after waivers and/or expense reimbursement | | | 1.06 | % | | | 1.02 | % | | | | | | | 0.97 | %(e) | | | | |
| Expenses before waivers and/or expense reimbursement | | | 2.18 | % | | | 4.28 | % | | | | | | | 23.67 | %(e) | | | | |
| Net investment income (loss) | | | (0.78 | )% | | | (0.60 | )% | | | | | | | (0.46 | )%(e) | | | | |
| Portfolio turnover rate(f) | | | 62 | % | | | 57 | % | | | | | | | 52 | % | | | | |
| (a) | Commencement of offering. |
| (b) | Calculated based on average shares outstanding during the period. |
| (c) | Total return is calculated assuming a purchase of a share on the first day and a sale on the last day of each period reported and includes reinvestment of dividends and distributions, if any. Total returns may reflect adjustments to conform to GAAP. Total returns for periods less than one full year are not annualized. |
| (d) | Does not include expenses of the underlying funds in which the Fund invests. |
| (f) | The Fund’s portfolio turnover rate is calculated in accordance with regulatory requirements, without regard to transactions involving short-term investments and certain derivatives. If such transactions were included, the Fund’s portfolio turnover rate may be higher. |
See Notes to Financial Statements.
| | | | |
PGIM Jennison Global Opportunities Fund | | | 25 | |
Financial Highlights (continued)
| | | | | | | | | | | | | | | | | | | | |
| Class R6 Shares | |
| | | Year Ended October 31, | |
| | | 2021 | | | 2020 | | | 2019 | | | 2018 | | | 2017 | |
| Per Share Operating Performance(a): | | | | | | | | | | | | | | | | | | | | |
| Net Asset Value, Beginning of Year | | | $39.46 | | | | $25.13 | | | | $21.90 | | | | $21.06 | | | | $15.33 | |
| Income (loss) from investment operations: | | | | | | | | | | | | | | | | | | | | |
| Net investment income (loss) | | | (0.26 | ) | | | (0.15 | ) | | | (0.06 | ) | | | (0.06 | ) | | | (0.04 | ) |
| Net realized and unrealized gain (loss) on investment and foreign currency transactions | | | 15.14 | | | | 14.48 | | | | 3.29 | | | | 0.90 | | | | 5.77 | |
| Total from investment operations | | | 14.88 | | | | 14.33 | | | | 3.23 | | | | 0.84 | | | | 5.73 | |
| Less Dividends and Distributions: | | | | | | | | | | | | | | | | | | | | |
| Distributions from net realized gains | | | (0.74 | ) | | | - | | | | - | | | | - | | | | - | |
| Net asset value, end of year | | | $53.60 | | | | $39.46 | | | | $25.13 | | | | $21.90 | | | | $21.06 | |
| Total Return(b): | | | 38.08 | % | | | 57.02 | % | | | 14.75 | % | | | 3.99 | % | | | 37.38 | % |
| | | | | | | | | | | | | | | | | | | | | |
| Ratios/Supplemental Data: | | | | | | | | | | | | | | | |
| Net assets, end of year (000) | | | $3,301,585 | | | | $1,803,620 | | | | $641,419 | | | | $253,010 | | | | $29,023 | |
| Average net assets (000) | | | $2,690,566 | | | | $1,074,262 | | | | $448,178 | | | | $133,984 | | | | $14,700 | |
| Ratios to average net assets(c)(d): | | | | | | | | | | | | | | | | | | | | |
| Expenses after waivers and/or expense reimbursement | | | 0.83 | % | | | 0.84 | % | | | 0.84 | % | | | 0.84 | % | | | 0.84 | % |
| Expenses before waivers and/or expense reimbursement | | | 0.83 | % | | | 0.84 | % | | | 0.87 | % | | | 0.90 | % | | | 0.92 | % |
| Net investment income (loss) | | | (0.54 | )% | | | (0.46 | )% | | | (0.23 | )% | | | (0.26 | )% | | | (0.23 | )% |
| Portfolio turnover rate(e) | | | 62 | % | | | 57 | % | | | 52 | % | | | 62 | % | | | 79 | % |
| (a) | Calculated based on average shares outstanding during the year. |
| (b) | Total return is calculated assuming a purchase of a share on the first day and a sale on the last day of each year reported and includes reinvestment of dividends and distributions, if any. Total returns may reflect adjustments to conform to GAAP. |
| (c) | Does not include expenses of the underlying funds in which the Fund invests. |
| (d) | Effective November 1, 2017, class specific expenses include transfer agent fees and expenses and registration fees, which are charged to their respective share class. |
| (e) | The Fund’s portfolio turnover rate is calculated in accordance with regulatory requirements, without regard to transactions involving short-term investments and certain derivatives. If such transactions were included, the Fund’s portfolio turnover rate may be higher. |
See Notes to Financial Statements.
Notes to Financial Statements
1. Organization
Prudential World Fund, Inc. (the “Registered Investment Company” or “RIC”) is registered under the Investment Company Act of 1940, as amended (“1940 Act”), as an open-end management investment company. The RIC is organized as a Maryland Corporation and currently consists of seven separate funds: PGIM Emerging Markets Debt Hard Currency Fund, PGIM Emerging Markets Debt Local Currency Fund, PGIM Jennison Emerging Markets Equity Opportunities Fund, PGIM Jennison Global Infrastructure Fund, PGIM Jennison Global Opportunities Fund, PGIM Jennison International Opportunities Fund and PGIM QMA International Equity Fund. These financial statements relate only to the PGIM Jennison Global Opportunities Fund (the “Fund”). The Fund is classified as a diversified fund for purposes of the 1940 Act.
The investment objective of the Fund is to seek long-term growth of capital.
2. Accounting Policies
The Fund follows the investment company accounting and reporting guidance of the Financial Accounting Standards Board (“FASB”) Accounting Standard Codification (“ASC”) Topic 946 Financial Services — Investment Companies. The following is a summary of significant accounting policies followed by the Fund in the preparation of its financial statements. The policies conform to U.S. generally accepted accounting principles (“GAAP”). The Fund consistently follows such policies in the preparation of its financial statements.
Securities Valuation: The Fund holds securities and other assets and liabilities that are fair valued as of the close of each day (generally, 4:00 PM Eastern time) the New York Stock Exchange (“NYSE”) is open for trading. As described in further detail below, the Fund’s investments are valued daily based on a number of factors, including the type of investment and whether market quotations are readily available. The RIC’s Board of Directors (the “Board”) has adopted valuation procedures for security valuation under which fair valuation responsibilities have been delegated to PGIM Investments LLC (“PGIM Investments” or the “Manager”). Pursuant to the Board’s delegation, the Manager has established a Valuation Committee responsible for supervising the fair valuation of portfolio securities and other assets and liabilities. The valuation procedures permit the Fund to utilize independent pricing vendor services, quotations from market makers, and alternative valuation methods when market quotations are either not readily available or not deemed representative of fair value. Fair value is the price that would be received to sell an asset or paid to transfer a liability in an orderly transaction between market participants on the measurement date. A record of the Valuation Committee’s actions is subject to the Board’s review at its first quarterly meeting following the quarter in which such actions take place.
| | | | |
PGIM Jennison Global Opportunities Fund | | | 27 | |
Notes to Financial Statements (continued)
For the fiscal reporting year-end, securities and other assets and liabilities were fair valued at the close of the last U.S. business day. Trading in certain foreign securities may occur when the NYSE is closed (including weekends and holidays). Because such foreign securities trade in markets that are open on weekends and U.S. holidays, the values of some of the Fund’s foreign investments may change on days when investors cannot purchase or redeem Fund shares.
Various inputs determine how the Fund’s investments are valued, all of which are categorized according to the three broad levels (Level 1, 2, or 3) detailed in the Schedule of Investments and referred to herein as the “fair value hierarchy” in accordance with FASB ASC Topic 820 - Fair Value Measurements and Disclosures.
Common or preferred stocks, exchange-traded funds and derivative instruments, if applicable, that are traded on a national securities exchange are valued at the last sale price as of the close of trading on the applicable exchange where the security principally trades. Securities traded via NASDAQ are valued at the NASDAQ official closing price. To the extent these securities are valued at the last sale price or NASDAQ official closing price, they are classified as Level 1 in the fair value hierarchy. In the event that no sale or official closing price on valuation date exists, these securities are generally valued at the mean between the last reported bid and ask prices, or at the last bid price in the absence of an ask price. These securities are classified as Level 2 in the fair value hierarchy.
Foreign equities traded on foreign securities exchanges are generally valued using pricing vendor services that provide model prices derived using adjustment factors based on information such as local closing price, relevant general and sector indices, currency fluctuations, depositary receipts, and futures, as applicable. Securities valued using such model prices are classified as Level 2 in the fair value hierarchy. The models generate an evaluated adjustment factor for each security, which is applied to the local closing price to adjust it for post closing market movements up to the time the Fund is valued. Utilizing that evaluated adjustment factor, the vendor provides an evaluated price for each security. If the vendor does not provide an evaluated price, securities are valued in accordance with exchange-traded common and preferred stock valuation policies discussed above.
Investments in open-end funds (other than exchange-traded funds) are valued at their net asset values as of the close of the NYSE on the date of valuation. These securities are classified as Level 1 in the fair value hierarchy since they may be purchased or sold at their net asset values on the date of valuation.
Securities and other assets that cannot be priced according to the methods described above are valued based on pricing methodologies approved by the Board. In the event that unobservable inputs are used when determining such valuations, the securities will be
classified as Level 3 in the fair value hierarchy. Altering one or more unobservable inputs may result in a significant change to a Level 3 security’s fair value measurement.
When determining the fair value of securities, some of the factors influencing the valuation include: the nature of any restrictions on disposition of the securities; assessment of the general liquidity of the securities; the issuer’s financial condition and the markets in which it does business; the cost of the investment; the size of the holding and the capitalization of the issuer; the prices of any recent transactions or bids/offers for such securities or any comparable securities; any available analyst media or other reports or information deemed reliable by the Manager regarding the issuer or the markets or industry in which it operates. Using fair value to price securities may result in a value that is different from a security’s most recent closing price and from the price used by other unaffiliated mutual funds to calculate their net asset values.
Foreign Currency Translation: The books and records of the Fund are maintained in U.S. dollars. Foreign currency amounts are translated into U.S. dollars on the following basis:
(i) market value of investment securities, other assets and liabilities — at the exchange rate as of the valuation date;
(ii) purchases and sales of investment securities, income and expenses — at the rates of exchange prevailing on the respective dates of such transactions.
Although the net assets of the Fund are presented at the foreign exchange rates and market values at the close of the period, the Fund does not generally isolate that portion of the results of operations arising as a result of changes in the foreign exchange rates from the fluctuations arising from changes in the market prices of long-term portfolio securities held at the end of the period. Similarly, the Fund does not isolate the effect of changes in foreign exchange rates from the fluctuations arising from changes in the market prices of long-term portfolio securities sold during the period. Accordingly, holding period unrealized and realized foreign currency gains (losses) are included in the reported Net change in unrealized appreciation (depreciation) on investments and Net realized gains (losses) on investment transactions on the Statements of Operations.
Net realized gains (losses) on foreign currency transactions represent net foreign exchange gains (losses) from the disposition of holdings of foreign currencies, currency gains (losses) realized between the trade and settlement dates on investment transactions, and the difference between the amounts of interest, dividends and foreign withholding taxes recorded on the Fund’s books and the U.S. dollar equivalent amounts actually received or paid. Net unrealized currency gains (losses) arise from valuing foreign currency denominated assets and liabilities (other than investments) at period end exchange rates.
Master Netting Arrangements: The RIC, on behalf of the Fund, is subject to various Master Agreements, or netting arrangements, with select counterparties. These are agreements which a subadviser may have negotiated and entered into on behalf of all or a portion of the
| | | | |
PGIM Jennison Global Opportunities Fund | | | 29 | |
Notes to Financial Statements (continued)
Fund. A master netting arrangement between the Fund and the counterparty permits the Fund to offset amounts payable by the Fund to the same counterparty against amounts to be received; and by the receipt of collateral from the counterparty by the Fund to cover the Fund’s exposure to the counterparty. However, there is no assurance that such mitigating factors are easily enforceable. In addition to master netting arrangements, the right to set-off exists when all the conditions are met such that each of the parties owes the other determinable amounts, the reporting party has the right to set-off the amount owed with the amount owed by the other party, the reporting party intends to set-off and the right of set-off is enforceable by law.
Securities Lending: The Fund lends its portfolio securities to banks and broker-dealers. The loans are secured by collateral at least equal to the market value of the securities loaned. Collateral pledged by each borrower is invested in an affiliated money market fund and is marked to market daily, based on the previous day’s market value, such that the value of the collateral exceeds the value of the loaned securities. In the event of significant appreciation in value of securities on loan on the last business day of the reporting period, the financial statements may reflect a collateral value that is less than the market value of the loaned securities. Such shortfall is remedied as described above. Loans are subject to termination at the option of the borrower or the Fund. Upon termination of the loan, the borrower will return to the Fund securities identical to the loaned securities. The remaining maturities of the securities lending transactions are considered overnight and continuous. Should the borrower of the securities fail financially, the Fund has the right to repurchase the securities in the open market using the collateral.
The Fund recognizes income, net of any rebate and securities lending agent fees, for lending its securities in the form of fees or interest on the investment of any cash received as collateral. The borrower receives all interest and dividends from the securities loaned and such payments are passed back to the lender in amounts equivalent thereto, which are reflected in interest income or unaffiliated dividend income based on the nature of the payment on the Statement of Operations. The Fund also continues to recognize any unrealized gain (loss) in the market price of the securities loaned and on the change in the value of the collateral invested that may occur during the term of the loan. In addition, realized gain (loss) is recognized on changes in the value of the collateral invested upon liquidation of the collateral. Net earnings from securities lending are disclosed in the Statement of Operations.
Securities Transactions and Net Investment Income: Securities transactions are recorded on the trade date. Realized gains (losses) from investment and currency transactions are calculated on the specific identification method. Dividend income is recorded on the ex-date, or for certain foreign securities, when the Fund becomes aware of such dividends. Expenses are recorded on an accrual basis, which may require the use of certain estimates
by management that may differ from actual. Net investment income or loss (other than class specific expenses and waivers, which are allocated as noted below) and unrealized and realized gains (losses) are allocated daily to each class of shares based upon the relative proportion of adjusted net assets of each class at the beginning of the day. Class specific expenses and waivers, where applicable, are charged to the respective share classes. Such class specific expenses and waivers include distribution fees and distribution fee waivers, shareholder servicing fees, transfer agent’s fees and expenses, registration fees and fee waivers and/or expense reimbursements, as applicable.
Taxes: It is the Fund’s policy to continue to meet the requirements of the Internal Revenue Code applicable to regulated investment companies and to distribute all of its taxable net investment income and capital gains, if any, to its shareholders. Therefore, no federal income tax provision is required. Withholding taxes on foreign dividends, interest and capital gains, if any, are recorded, net of reclaimable amounts, at the time the related income is earned.
Dividends and Distributions: The Fund expects to pay dividends from net investment income and distributions from net realized capital and currency gains, if any, annually. Dividends and distributions to shareholders, which are determined in accordance with federal income tax regulations and which may differ from GAAP, are recorded on the ex-date. Permanent book/tax differences relating to income and gain (loss) are reclassified between total distributable earnings (loss) and paid-in capital in excess of par, as appropriate.
Estimates: The preparation of financial statements requires management to make estimates and assumptions that affect the reported amounts and disclosures in the financial statements. Actual results could differ from those estimates.
3. Agreements
The RIC, on behalf of the Fund, has a management agreement with the Manager. Pursuant to this agreement, the Manager has responsibility for all investment advisory services and supervises the subadviser’s performance of such services.
The Manager has entered into a subadvisory agreement with Jennison Associates LLC (“Jennison” or the “subadviser”). The Manager pays for the services of Jennison.
The management fee paid to the Manager is accrued daily and payable monthly at an annual rate of 0.825% of the Fund’s average daily net assets up to $1 billion and 0.800% of such assets in excess of $1 billion. The effective management fee rate before any waivers and/or expense reimbursements was 0.803% for the year ended October 31, 2021.
The Manager has contractually agreed, through February 28, 2023, to limit net annual operating expenses (exclusive of distribution and service (12b-1) fees, shareholder service fee, and transfer agency expenses (including sub-transfer agency and networking fees)), of
| | | | |
PGIM Jennison Global Opportunities Fund | | | 31 | |
Notes to Financial Statements (continued)
each class of shares to 0.84% of the Fund’s average daily net assets, and to limit transfer agency, shareholder servicing, sub-transfer agency, and blue sky fees, as applicable, to the extent that such fees cause the net annual operating expenses to exceed 1.34% of average daily net assets for Class R2 shares or 1.09% of average daily net assets for Class R4 shares. Additionally, the Manager has contractually agreed, through February 28, 2023, to limit total annual operating expenses after fee waivers and/or expense reimbursements to 1.08% of average daily net assets for Class A shares. These contractual waivers and expense limitation exclude interest, brokerage, taxes (such as income and foreign withholding taxes, stamp duty and deferred tax expenses), acquired fund fees and expenses, extraordinary expenses, and certain other Fund expenses such as dividend and interest expense and broker charges on short sales.
Where applicable, the Manager agrees to waive management fees or shared operating expenses on any share class to the same extent that it waives such expenses on any other share class. In addition, total annual operating expenses for Class R6 shares will not exceed total annual operating expenses for Class Z shares. Fees and/or expenses waived and/or reimbursed by the Manager may be recouped by the Manager within the same fiscal year during which such waiver and/or reimbursement is made if such recoupment can be realized without exceeding the expense limit in effect at the time of the recoupment for that fiscal year.
The RIC, on behalf of the Fund, has a distribution agreement with Prudential Investment Management Services LLC (“PIMS”), which acts as the distributor of the Class A, Class C, Class Z, Class R2, Class R4 and Class R6 shares of the Fund. The Fund compensates PIMS for distributing and servicing the Fund’s Class A, Class C and Class R2 shares, pursuant to the plans of distribution (the “Distribution Plans”), regardless of expenses actually incurred by PIMS.
Pursuant to the Distribution Plans, the Fund compensates PIMS for distribution related activities at an annual rate of up to 0.30%, 1% and 0.25% of the average daily net assets of the Class A, Class C and Class R2 shares, respectively. PIMS has contractually agreed through February 28, 2023 to limit such fees to 0.25% of the average daily net assets of the Class A shares. The distribution fees are accrued daily and payable monthly. No distribution or service fees are paid to PIMS as distributor of the Class Z, Class R4 and Class R6 shares of the Fund.
The Fund has adopted a Shareholder Services Plan with respect to Class R2 and Class R4 shares. Under the terms of the Shareholder Services Plan, Class R2 and Class R4 shares are authorized to pay to Prudential Mutual Fund Services LLC (“PMFS”), its affiliates or third-party service providers, as compensation for services rendered to the shareholders of such Class R2 or Class R4 shares, a shareholder service fee at an annual rate of up to
0.10% of the average daily net assets attributable to Class R2 and Class R4 shares. The shareholder service fee is accrued daily and paid monthly, as applicable.
For the year ended October 31, 2021, PIMS received $3,576,428 in front-end sales charges resulting from sales of Class A shares. Additionally, for the year ended October 31, 2021, PIMS received $13,352 and $44,493 in contingent deferred sales charges imposed upon redemptions by certain Class A and Class C shareholders, respectively. From these fees, PIMS paid such sales charges to broker-dealers, who in turn paid commissions to salespersons and incurred other distribution costs.
PGIM Investments, PIMS, PMFS and Jennison are indirect, wholly-owned subsidiaries of Prudential Financial, Inc. (“Prudential”).
4. Other Transactions with Affiliates
PMFS serves as the Fund’s transfer agent. Transfer agent’s fees and expenses in the Statement of Operations include certain out-of-pocket expenses paid to non-affiliates, where applicable.
The Fund may invest its overnight sweep cash in the PGIM Core Ultra Short Bond Fund (the “Core Fund”), and its securities lending cash collateral in the PGIM Institutional Money Market Fund (the “Money Market Fund”), each a fund of Prudential Investment Portfolios 2, registered under the 1940 Act and managed by PGIM Investments. PGIM Investments and/or its affiliates are paid fees or reimbursed for providing their services to the Core Fund and the Money Market Fund. In addition to the realized and unrealized gains on investments in the Core Fund and Money Market Fund, earnings from such investments are disclosed on the Statement of Operations as “Affiliated dividend income” and “Income from securities lending, net”, respectively.
The Fund may enter into certain securities purchase or sale transactions under Board approved Rule 17a-7 procedures. Rule 17a-7 is an exemptive rule under the 1940 Act, that subject to certain conditions, permits purchase and sale transactions among affiliated investment companies, or between an investment company and a person that is affiliated solely by reason of having a common (or affiliated) investment adviser, common directors/trustees, and/or common officers. For the year ended October 31, 2021, no 17a-7 transactions were entered into by the Fund.
5. Portfolio Securities
The aggregate cost of purchases and proceeds from sales of portfolio securities (excluding short-term investments and U.S. Government securities) for the year ended October 31, 2021, were $5,893,871,911 and $4,955,065,994, respectively.
A summary of the cost of purchases and proceeds from sales of shares of affiliated mutual funds for the year ended October 31, 2021, is presented as follows:
| | | | |
PGIM Jennison Global Opportunities Fund | | | 33 | |
Notes to Financial Statements (continued)
| | | | | | | | | | | | | | | | | | | | | | | | | | | | | | |
Value, Beginning of Year | | | Cost of
Purchases | | | Proceeds
from Sales | | | Change in
Unrealized
Gain
(Loss) | | | Realized
Gain
(Loss) | | | Value,
End of Year | | | Shares,
End
of Year | | | Income | |
|
| | Short-Term Investments - Affiliated Mutual Funds: | |
|
| | PGIM Core Ultra Short Bond Fund (1)(wa) | |
| $ | 179,094,560 | | | $ | 2,554,239,583 | | | $ | 2,686,573,281 | | | $ | — | | | $ | — | | | $ | 46,760,862 | | | | 46,760,862 | | | $ | 137,403 | |
|
| | PGIM Institutional Money Market Fund (1)(b)(wa) | |
| | 462,551,442 | | | | 2,870,279,807 | | | | 3,316,581,962 | | | | (192,834 | ) | | | 98,341 | | | | 16,154,794 | | | | 16,164,492 | | | | 224,869 | (2) |
| | | | | | | | | | | | | | | | | | | | | | | | | | | | | | |
| $ | 641,646,002 | | | $ | 5,424,519,390 | | | $ | 6,003,155,243 | | | $ | (192,834 | ) | | $ | 98,341 | | | $ | 62,915,656 | | | | | | | $ | 362,272 | |
| | | | | | | | | | | | | | | | | | | | | | | | | | | | | | |
| (1) | The Fund did not have any capital gain distributions during the reporting period. |
| (2) | The amount, or a portion thereof, represents the affiliated securities lending income shown on the Statement of Operations. |
| (b) | Represents security, or portion thereof, purchased with cash collateral received for securities on loan and includes dividend reinvestment. |
| (wa) | PGIM Investments LLC, the manager of the Fund, also serves as manager of the PGIM Core Ultra Short Bond Fund and PGIM Institutional Money Market Fund, if applicable. |
6. Distributions and Tax Information
Distributions to shareholders, which are determined in accordance with federal income tax regulations and which may differ from GAAP, are recorded on the ex-date.
For the year ended October 31, 2021, the tax character of dividends paid by the Fund were $883,669 of ordinary income and $119,553,104 of long-term capital gains. For the year ended October 31, 2020, there were no distributions paid by the Fund.
As of October 31, 2021, the accumulated undistributed earnings on a tax basis were $57,821,230 of ordinary income and $772,933,495 of long-term capital gains.
The United States federal income tax basis of the Fund’s investments and the net unrealized appreciation as of October 31, 2021 were as follows:
| | | | | | |
| Tax Basis | | Gross Unrealized Appreciation | | Gross Unrealized Depreciation | | Net Unrealized Appreciation |
| $5,747,505,710 | | $3,719,309,815 | | $(85,754,246) | | $3,633,555,569 |
The difference between GAAP and tax basis were primarily due to deferred losses on wash sales and corporate spin-off adjustment.
The Manager has analyzed the Fund’s tax positions taken on federal, state and local income tax returns for all open tax years and has concluded that no provision for income tax is
required in the Fund’s financial statements for the current reporting period. Since tax authorities can examine previously filed tax returns, the Fund’s U.S. federal and state tax returns for each of the four fiscal years up to the most recent fiscal year ended October 31, 2021 are subject to such review.
7. Capital and Ownership
The Fund offers Class A, Class C, Class Z, Class R2, Class R4 and Class R6 shares. Class A shares are sold with a maximum front-end sales charge of 5.50%. Investors who purchase $1 million or more of Class A shares and sell these shares within 12 months of purchase are subject to a contingent deferred sales charge (“CDSC”) of 1%, although they are not subject to an initial sales charge. The Class A CDSC is waived for certain retirement and/or benefit plans. A special exchange privilege is also available for shareholders who qualified to purchase Class A shares at net asset value. Class C shares are sold with a CDSC of 1% on sales made within 12 months of purchase. Class C shares will automatically convert to Class A shares on a monthly basis approximately eight years (ten years prior to January 22, 2021) after purchase. Class Z, Class R2, Class R4 and Class R6 shares are not subject to any sales or redemption charges and are available exclusively for sale to a limited group of investors.
Under certain circumstances, an exchange may be made from specified share classes of the Fund to one or more other share classes of the Fund as presented in the table of transactions in shares of common stock, below.
The RIC is authorized to issue 10,225,000,000 shares of common stock, $0.00001 par value per share, 3,450,000,000 of which are designated as shares of the Fund. The authorized shares of the Fund are currently classified and designated as follows:
| | |
Class A | | 150,000,000 |
Class C | | 100,000,000 |
Class Z | | 2,000,000,000 |
Class R2 | | 100,000,000 |
Class R4 | | 100,000,000 |
Class R6 | | 1,000,000,000 |
As of October 31, 2021, Prudential, through its affiliated entities, including affiliated funds (if applicable), owned shares of the Fund as follows:
| | | | |
| | | Number of Shares | | Percentage of
Outstanding Shares |
Class R2 | | 494 | | 0.1% |
Class R4 | | 494 | | 7.9% |
| | | | |
PGIM Jennison Global Opportunities Fund | | | 35 | |
Notes to Financial Statements (continued)
At the reporting period end, the number of shareholders holding greater than 5% of the Fund are as follows:
| | | | | | |
| Affiliated | | Unaffiliated |
Number of Shareholders | | Percentage of
Outstanding Shares | | Number of
Shareholders | | Percentage of
Outstanding Shares |
| — | | —% | | 6 | | 77.8% |
Transactions in shares of common stock were as follows:
| | | | | | | | |
Class A | | Shares | | | Amount | |
Year ended October 31, 2021: | | | | | | | | |
Shares sold | | | 4,665,660 | | | $ | 213,839,272 | |
Shares issued in reinvestment of dividends and distributions | | | 222,928 | | | | 9,777,601 | |
Shares purchased | | | (2,530,691 | ) | | | (115,823,612 | ) |
| | | | | | | | |
Net increase (decrease) in shares outstanding before conversion | | | 2,357,897 | | | | 107,793,261 | |
Shares issued upon conversion from other share class(es) | | | 828,473 | | | | 39,228,444 | |
Shares purchased upon conversion into other share class(es) | | | (735,700 | ) | | | (34,462,946 | ) |
| | | | | | | | |
Net increase (decrease) in shares outstanding | | | 2,450,670 | | | $ | 112,558,759 | |
| | | | | | | | |
Year ended October 31, 2020: | | | | | | | | |
Shares sold | | | 5,738,717 | | | $ | 181,584,437 | |
Shares purchased | | | (2,465,079 | ) | | | (74,149,989 | ) |
| | | | | | | | |
Net increase (decrease) in shares outstanding before conversion | | | 3,273,638 | | | | 107,434,448 | |
Shares issued upon conversion from other share class(es) | | | 428,288 | | | | 13,295,901 | |
Shares purchased upon conversion into other share class(es) | | | (474,524 | ) | | | (15,077,525 | ) |
| | | | | | | | |
Net increase (decrease) in shares outstanding | | | 3,227,402 | | | $ | 105,652,824 | |
| | | | | | | | |
Class C | | | | | | |
Year ended October 31, 2021: | | | | | | | | |
Shares sold | | | 2,081,043 | | | $ | 89,155,627 | |
Shares issued in reinvestment of dividends and distributions | | | 184,797 | | | | 7,556,334 | |
Shares purchased | | | (1,174,050 | ) | | | (50,022,440 | ) |
| | | | | | | | |
Net increase (decrease) in shares outstanding before conversion | | | 1,091,790 | | | | 46,689,521 | |
Shares purchased upon conversion into other share class(es) | | | (939,783 | ) | | | (41,669,710 | ) |
| | | | | | | | |
Net increase (decrease) in shares outstanding | | | 152,007 | | | $ | 5,019,811 | |
| | | | | | | | |
Year ended October 31, 2020: | | | | | | | | |
Shares sold | | | 3,153,742 | | | $ | 91,465,665 | |
Shares purchased | | | (1,559,131 | ) | | | (43,284,069 | ) |
| | | | | | | | |
Net increase (decrease) in shares outstanding before conversion | | | 1,594,611 | | | | 48,181,596 | |
Shares purchased upon conversion into other share class(es) | | | (584,386 | ) | | | (16,711,305 | ) |
| | | | | | | | |
Net increase (decrease) in shares outstanding | | | 1,010,225 | | | $ | 31,470,291 | |
| | | | | | | | |
| | | | | | | | |
Class Z | | Shares | | | Amount | |
Year ended October 31, 2021: | | | | | | | | |
Shares sold | | | 30,640,507 | | | $ | 1,428,980,779 | |
Shares issued in reinvestment of dividends and distributions | | | 1,448,278 | | | | 64,781,489 | |
Shares purchased | | | (28,647,396 | ) | | | (1,335,254,028 | ) |
| | | | | | | | |
Net increase (decrease) in shares outstanding before conversion | | | 3,441,389 | | | | 158,508,240 | |
Shares issued upon conversion from other share class(es) | | | 1,137,547 | | | | 54,251,524 | |
Shares purchased upon conversion into other share class(es) | | | (961,974 | ) | | | (47,587,111 | ) |
| | | | | | | | |
Net increase (decrease) in shares outstanding | | | 3,616,962 | | | $ | 165,172,653 | |
| | | | | | | | |
Year ended October 31, 2020: | | | | | | | | |
Shares sold | | | 54,820,204 | | | $ | 1,691,528,205 | |
Shares purchased | | | (27,602,817 | ) | | | (875,896,188 | ) |
| | | | | | | | |
Net increase (decrease) in shares outstanding before conversion | | | 27,217,387 | | | | 815,632,017 | |
Shares issued upon conversion from other share class(es) | | | 853,698 | | | | 26,946,718 | |
Shares purchased upon conversion into other share class(es) | | | (323,337 | ) | | | (10,207,454 | ) |
| | | | | | | | |
Net increase (decrease) in shares outstanding | | | 27,747,748 | | | $ | 832,371,281 | |
| | | | | | | | |
Class R2 | | | | | | |
Year ended October 31, 2021: | | | | | | | | |
Shares sold | | | 439,431 | | | $ | 19,563,751 | |
Shares issued in reinvestment of dividends and distributions | | | 167 | | | | 7,434 | |
Shares purchased | | | (40,294 | ) | | | (1,961,619 | ) |
| | | | | | | | |
Net increase (decrease) in shares outstanding | | | 399,304 | | | $ | 17,609,566 | |
| | | | | | | | |
Year ended October 31, 2020: | | | | | | | | |
Shares sold | | | 9,568 | | | $ | 296,916 | |
Shares purchased | | | (416 | ) | | | (15,390 | ) |
| | | | | | | | |
Net increase (decrease) in shares outstanding | | | 9,152 | | | $ | 281,526 | |
| | | | | | | | |
Class R4 | | | | | | |
Year ended October 31, 2021: | | | | | | | | |
Shares sold | | | 5,135 | | | $ | 253,565 | |
Shares issued in reinvestment of dividends and distributions | | | 214 | | | | 9,579 | |
Shares purchased | | | (11,968 | ) | | | (626,649 | ) |
| | | | | | | | |
Net increase (decrease) in shares outstanding | | | (6,619 | ) | | $ | (363,505 | ) |
| | | | | | | | |
Year ended October 31, 2020: | | | | | | | | |
Shares sold | | | 1,345 | | | $ | 40,198 | |
Shares purchased | | | (2,925 | ) | | | (101,382 | ) |
| | | | | | | | |
Net increase (decrease) in shares outstanding | | | (1,580 | ) | | $ | (61,184 | ) |
| | | | | | | | |
| | | | |
PGIM Jennison Global Opportunities Fund | | | 37 | |
Notes to Financial Statements (continued)
| | | | | | | | |
Class R6 | | Shares | | | Amount | |
Year ended October 31, 2021: | | | | | | | | |
Shares sold | | | 27,540,278 | | | $ | 1,296,799,817 | |
Shares issued in reinvestment of dividends and distributions | | | 789,179 | | | | 35,497,290 | |
Shares purchased | | | (13,025,359 | ) | | | (620,512,925 | ) |
| | | | | | | | |
Net increase (decrease) in shares outstanding before conversion | | | 15,304,098 | | | | 711,784,182 | |
Shares issued upon conversion from other share class(es) | | | 618,209 | | | | 31,764,888 | |
Shares purchased upon conversion into other share class(es) | | | (32,207 | ) | | | (1,525,089 | ) |
| | | | | | | | |
Net increase (decrease) in shares outstanding | | | 15,890,100 | | | $ | 742,023,981 | |
| | | | | | | | |
Year ended October 31, 2020: | | | | | | | | |
Shares sold | | | 26,781,782 | | | $ | 904,618,764 | |
Shares purchased | | | (6,652,807 | ) | | | (217,502,145 | ) |
| | | | | | | | |
Net increase (decrease) in shares outstanding before conversion | | | 20,128,975 | | | | 687,116,619 | |
Shares issued upon conversion from other share class(es) | | | 59,984 | | | | 1,964,598 | |
Shares purchased upon conversion into other share class(es) | | | (6,636 | ) | | | (210,933 | ) |
| | | | | | | | |
Net increase (decrease) in shares outstanding | | | 20,182,323 | | | $ | 688,870,284 | |
| | | | | | | | |
8. Borrowings
The RIC, on behalf of the Fund, along with other affiliated registered investment companies (the “Participating Funds”), is a party to a Syndicated Credit Agreement (“SCA”) with a group of banks. The purpose of the SCA is to provide an alternative source of temporary funding for capital share redemptions. The table below provides details of the current SCA in effect at the reporting period-end as well as the prior SCA.
| | | | |
| | | |
| | | Current SCA | | Prior SCA |
Term of Commitment | | 10/1/2021 – 9/29/2022 | | 10/2/2020 – 9/30/2021 |
| | | |
Total Commitment | | $ 1,200,000,000 | | $ 1,200,000,000 |
| | | |
Annualized Commitment Fee on the
Unused Portion of the SCA | | 0.15% | | 0.15% |
| | | |
Annualized Interest Rate on
Borrowings | | 1.20% plus the higher of (1)
the effective federal funds
rate, (2) the one-month
LIBOR rate or (3) zero
percent | | 1.30% plus the higher of (1)
the effective federal funds
rate, (2) the one-month
LIBOR rate or (3) zero
percent |
Certain affiliated registered investment companies that are parties to the SCA include portfolios that are subject to a predetermined mathematical formula used to manage certain benefit guarantees offered under variable annuity contracts. The formula may result in large scale asset flows into and out of these portfolios. Consequently, these portfolios may be more likely to utilize the SCA for purposes of funding redemptions. It may be possible for those portfolios to fully exhaust the committed amount of the SCA, thereby requiring the Manager to allocate available funding per a Board-approved methodology designed to treat the Participating Funds in the SCA equitably.
The Fund did not utilize the SCA during the year ended October 31, 2021.
9. Risks of Investing in the Fund
The Fund’s risks include, but are not limited to, some or all of the risks discussed below. For further information on the Fund’s risks, please refer to the Fund’s Prospectus and Statement of Additional Information.
Country Risk: Changes in the business environment may adversely affect operating profits or the value of assets in a specific country. For example, financial factors such as currency controls, devaluation or regulatory changes or stability factors such as mass riots, civil war and other potential events may contribute to companies’ operational risks.
Currency Risk: The Fund’s net asset value could decline as a result of changes in exchange rates, which could adversely affect the Fund’s investments in currencies, or in securities that trade in, and receive revenues related to, currencies, or in derivatives that provide exposure to currencies. Certain foreign countries may impose restrictions on the ability of issuers of foreign securities to make payment of principal and interest or dividends to investors located outside the country, due to blockage of foreign currency exchanges or otherwise.
Economic and Market Events Risk: Events in the U.S. and global financial markets, including actions taken by the U.S. Federal Reserve or foreign central banks to stimulate or stabilize economic growth or the functioning of the securities markets, may at times result in unusually high market volatility, which could negatively impact performance. Relatively reduced liquidity in credit and fixed income markets could adversely affect issuers worldwide.
Emerging Markets Risk: The risks of foreign investments are greater for investments in or exposed to emerging markets. Emerging market countries typically have economic and political systems that are less fully developed, and can be expected to be less stable, than those of more developed countries. For example, the economies of such countries can be subject to rapid and unpredictable rates of inflation or deflation. Low trading volumes may result in a lack of liquidity and price volatility. Emerging market countries may have policies that restrict investment by non-U.S. investors, or that prevent non-U.S. investors from withdrawing their money at will.
The Fund may invest in some emerging markets that subject it to risks such as those associated with illiquidity, custody of assets, different settlement and clearance procedures and asserting legal title under a developing legal and regulatory regime to a greater degree than in developed markets or even in other emerging markets.
Equity and Equity-Related Securities Risk: Equity and equity-related securities may be subject to changes in value, and their values may be more volatile than those of other asset classes. In addition to an individual security losing value, the value of the equity markets or a sector in which the Fund invests could go down. Different parts of a market can react differently to adverse issuer, market, regulatory, political and economic developments.
| | | | |
PGIM Jennison Global Opportunities Fund | | | 39 | |
Notes to Financial Statements (continued)
Foreign Securities Risk: Investments in securities of non-U.S. issuers (including those denominated in U.S. dollars) may involve more risk than investing in securities of U.S. issuers. Foreign political, economic and legal systems, especially those in developing and emerging market countries, may be less stable and more volatile than in the United States. Foreign legal systems generally have fewer regulatory requirements than the U.S. legal system, particularly those of emerging markets. In general, less information is publicly available with respect to non-U.S. companies than U.S. companies. Non-U.S. companies generally are not subject to the same accounting, auditing, and financial reporting standards as are U.S. companies. Additionally, the changing value of foreign currencies and changes in exchange rates could also affect the value of the assets the Fund holds and the Fund’s performance. Certain foreign countries may impose restrictions on the ability of issuers of foreign securities to make payment of principal and interest or dividends to investors located outside the country, due to blockage of foreign currency exchanges or otherwise. Investments in emerging markets are subject to greater volatility and price declines.
In addition, the Fund’s investments in non-U.S. securities may be subject to the risks of nationalization or expropriation of assets, imposition of currency exchange controls or restrictions on the repatriation of non-U.S. currency, confiscatory taxation and adverse diplomatic developments. Special U.S. tax considerations may apply.
Geographic Concentration Risk: The Fund’s performance may be closely tied to the market, economic, political, regulatory or other conditions in the countries or regions in which the Fund invests. This can result in more pronounced risks based upon conditions that impact one or more countries or regions more or less than other countries or regions.
Growth Style Risk: The Fund’s growth style may subject the Fund to above-average fluctuations as a result of seeking higher than average capital growth. Historically, growth stocks have performed best during later stages of economic expansion and value stocks have performed best during periods of economic recovery. Since the Fund follows a growth investment style, there is the risk that the growth investment style may be out of favor for long periods of time. At times when the style is out of favor, the Fund may underperform the market in general, its benchmark and other mutual funds.
Increase in Expenses Risk: Your actual cost of investing in the Fund may be higher than the expenses shown in the expense table in the Fund’s prospectus for a variety of reasons. For example, expense ratios may be higher than those shown if average net assets decrease. Net assets are more likely to decrease and Fund expense ratios are more likely to increase when markets are volatile. Active and frequent trading of Fund securities can increase expenses.
Large Shareholder and Large Scale Redemption Risk: Certain individuals, accounts, funds (including funds affiliated with the Manager) or institutions, including the Manager and its affiliates, may from time to time own or control a substantial amount of the Fund’s shares. There is no requirement that these entities maintain their investment in the Fund. There is a risk that such large shareholders or that the Fund’s shareholders generally may redeem all or a substantial portion of their investments in the Fund in a short period of time, which could have a significant negative impact on the Fund’s NAV, liquidity, and brokerage costs. Large redemptions could also result in tax consequences to shareholders and impact the Fund’s ability to implement its investment strategy. The Fund’s ability to pursue its investment objective after one or more large scale redemptions may be impaired and, as a result, the Fund may invest a larger portion of its assets in cash or cash equivalents.
Liquidity Risk: Liquidity risk is the risk that the Fund could not meet requests to redeem shares issued by the Fund without significant dilution of remaining investors’ interests in the Fund. The Fund may invest in instruments that trade in lower volumes and are more illiquid than other investments. If the Fund is forced to sell these investments to pay redemption proceeds or for other reasons, the Fund may lose money. In addition, when there is no willing buyer and investments cannot be readily sold at the desired time or price, the Fund may have to accept a lower price or may not be able to sell the instrument at all. An inability to sell a portfolio position can adversely affect the Fund’s value or prevent the Fund from being able to take advantage of other investment opportunities.
Management Risk: The value of your investment may decrease if judgments by the subadviser about the attractiveness, value or market trends affecting a particular security, industry or sector or about market movements are incorrect.
Market Capitalization Risk: The Fund may invest in companies of any market capitalization. Generally, the stock prices of small- and mid-cap companies are less stable than the prices of large-cap stocks and may present greater risks. Large capitalization companies as a group could fall out of favor with the market, causing the Fund to underperform compared to investments that focus on smaller capitalized companies.
Market Disruption and Geopolitical Risks: International wars or conflicts and geopolitical developments in foreign countries, along with instability in regions such as Asia, Eastern Europe, and the Middle East, possible terrorist attacks in the United States or around the world, public health epidemics such as the outbreak of infectious diseases like the outbreak of COVID-19 globally in 2020 or the 2014–2016 outbreak in West Africa of the Ebola virus, and other similar events could adversely affect the U.S. and foreign financial markets, including increases in market volatility, reduced liquidity in the securities markets and government intervention, and may cause further long-term economic uncertainties in the United States and worldwide generally. The coronavirus pandemic and the related governmental and public responses have had and may continue to have an impact on the Fund’s investments and net asset value and have led and may continue to lead to increased market volatility and the potential for illiquidity in certain classes of securities and sectors of the market. Preventative or protective actions that governments may take in respect of
| | | | |
PGIM Jennison Global Opportunities Fund | | | 41 | |
Notes to Financial Statements (continued)
pandemic or epidemic diseases may result in periods of business disruption, business closures, inability to obtain raw materials, supplies and component parts, and reduced or disrupted operations for the issuers in which the Fund invests. Government intervention in markets may impact interest rates, market volatility and security pricing. The occurrence, reoccurrence and pendency of such diseases could adversely affect the economies (including through changes in business activity and increased unemployment) and financial markets either in specific countries or worldwide.
Market Risk: Securities markets may be volatile, and the market prices of the Fund’s securities may decline. Securities fluctuate in price based on changes in an issuer’s financial condition and overall market and economic conditions. If the market prices of the securities owned by the Fund fall, the value of your investment in the Fund will decline.
10. Recent Regulatory Developments
On December 3, 2020, the SEC announced that it voted to adopt a new rule that establishes an updated regulatory framework for fund valuation practices (the “Rule”). The Rule, in part, provides (i) a framework for determining fair value in good faith and (ii) provides for a fund Board’s assignment of its responsibility for the execution of valuation-related activities to a fund’s investment adviser. Further, the SEC is rescinding previously issued guidance on related issues. The Rule took effect on March 8, 2021, with a compliance date of September 8, 2022. Management is currently evaluating the Rule and its impact to the Fund.
Report of Independent Registered Public Accounting Firm
To the Board of Directors of Prudential World Fund, Inc. and Shareholders of PGIM Jennison Global Opportunities Fund
Opinion on the Financial Statements
We have audited the accompanying statement of assets and liabilities, including the schedule of investments, of PGIM Jennison Global Opportunities Fund (one of the funds constituting Prudential World Fund, Inc., referred to hereafter as the “Fund”) as of October 31, 2021, the related statement of operations for the year ended October 31, 2021, the statement of changes in net assets for each of the two years in the period ended October 31, 2021, including the related notes, and financial highlights for each of the two years in the period ended October 31, 2021 (collectively referred to as the “financial statements”). In our opinion, the financial statements present fairly, in all material respects, the financial position of the Fund as of October 31, 2021, the results of its operations for the year then ended, and the changes in its net assets and the financial highlights for each of the two years in the period ended October 31, 2021 in conformity with accounting principles generally accepted in the United States of America.
The financial statements of the Fund as of and for the year ended October 31, 2019 and the financial highlights for each of the periods ended on or prior to October 31, 2019 (not presented herein, other than the financial highlights) were audited by other auditors whose report dated December 16, 2019 expressed an unqualified opinion on those financial statements and financial highlights.
Basis for Opinion
These financial statements are the responsibility of the Fund’s management. Our responsibility is to express an opinion on the Fund’s financial statements based on our audits. We are a public accounting firm registered with the Public Company Accounting Oversight Board (United States) (PCAOB) and are required to be independent with respect to the Fund in accordance with the U.S. federal securities laws and the applicable rules and regulations of the Securities and Exchange Commission and the PCAOB.
We conducted our audits of these financial statements in accordance with the standards of the PCAOB. Those standards require that we plan and perform the audit to obtain reasonable assurance about whether the financial statements are free of material misstatement, whether due to error or fraud.
Our audits included performing procedures to assess the risks of material misstatement of the financial statements, whether due to error or fraud, and performing procedures that respond to those risks. Such procedures included examining, on a test basis, evidence regarding the amounts and disclosures in the financial statements. Our audits also included evaluating the accounting principles used and significant estimates made by management, as well as evaluating the overall presentation of the financial statements. Our procedures included confirmation of securities owned as of October 31, 2021 by correspondence with the custodian, transfer agent and broker. We believe that our audits provide a reasonable basis for our opinion.
/s/PricewaterhouseCoopers LLP
New York, New York
December 16, 2021
We have served as the auditor of one or more investment companies in the PGIM Retail Funds complex since 2020.
| | | | |
PGIM Jennison Global Opportunities Fund | | | 43 | |
Tax Information (unaudited)
We are advising you that during the fiscal year ended October 31, 2021, the Fund reports the maximum amount allowed per share, but not less than $0.74 for Class A, C, Z, R2, R4 and R6 shares as a capital gain distribution in accordance with Section 852(b)(3)(C) of the Internal Revenue Code.
For the year ended October 31, 2021, the Fund reports, in accordance with Section 854 of the Internal Revenue Code, the following percentages of the ordinary income dividends paid as 1) qualified dividend income (QDI); and 2) eligible for corporate dividends received deduction (DRD):
| | | | | | | | |
| | | QDI | | | DRD | |
PGIM Jennison Global Opportunities Fund | | | 99.74% | | | | 99.60% | |
In January 2022, you will be advised on IRS Form 1099-DIV or substitute 1099-DIV, as to the federal tax status of distributions received by you in calendar year 2021.
INFORMATION ABOUT BOARD MEMBERS AND OFFICERS (unaudited)
Information about Board Members and Officers of the Fund is set forth below. Board Members who are not deemed to be “interested persons” of the Fund, as defined in the 1940 Act, are referred to as “Independent Board Members.” Board Members who are deemed to be “interested persons” of the Fund are referred to as “Interested Board Members.” The Board Members are responsible for the overall supervision of the operations of the Fund and perform the various duties imposed on the directors of investment companies by the 1940 Act. The Board in turn elects the Officers, who are responsible for administering the day-to-day operations of the Fund.
| | | | | | |
| Independent Board Members |
| | | | |
Name Year of Birth Position(s) Portfolios Overseen | | Principal Occupation(s) During Past Five Years | | Other Directorships Held During Past Five Years | | Length of Board Service |
| | | | |
Ellen S. Alberding 1958 Board Member Portfolios Overseen: 95 | | President and Board Member, The Joyce Foundation (charitable foundation) (since 2002); formerly Vice Chair, City Colleges of Chicago (community college system) (2011-2015); Trustee, National Park Foundation (charitable foundation for national park system) (2009-2018); Trustee, Economic Club of Chicago (2009-2016); Trustee, Loyola University (since 2018). | | None. | | Since September 2013 |
| | | | |
Kevin J. Bannon 1952 Board Member Portfolios Overseen: 95 | | Retired; formerly Managing Director (April 2008-May 2015) and Chief Investment Officer (October 2008-November 2013) of Highmount Capital LLC (registered investment adviser); formerly Executive Vice President and Chief Investment Officer (April 1993-August 2007) of Bank of New York Company; President (May 2003-May 2007) of BNY Hamilton Family of Mutual Funds. | | Director of Urstadt Biddle Properties (equity real estate investment trust) (since September 2008). | | Since July 2008 |
PGIM Jennison Global Opportunities Fund
| | | | | | |
| Independent Board Members |
| | | | |
Name Year of Birth Position(s) Portfolios Overseen | | Principal Occupation(s) During Past Five Years | | Other Directorships Held During Past Five Years | | Length of Board Service |
| | | | |
Linda W. Bynoe 1952 Board Member Portfolios Overseen: 92 | | President and Chief Executive Officer (since March 1995) and formerly Chief Operating Officer (December 1989-February 1995) of Telemat Limited LLC (formerly Telemat Ltd) (management consulting); formerly Vice President (January 1985-June 1989) at Morgan Stanley & Co. (broker-dealer). | | Trustee of Equity Residential (residential real estate) (since December 2009); Director of Northern Trust Corporation (financial services) (since April 2006); formerly Director of Anixter International, Inc. (communication products distributor) (January 2006-June 2020). | | Since March 2005 |
| | | | |
Barry H. Evans 1960 Board Member Portfolios Overseen: 94 | | Retired; formerly President (2005-2016), Global Chief Operating Officer (2014-2016), Chief Investment Officer - Global Head of Fixed Income (1998-2014), and various portfolio manager roles (1986-2006), Manulife Asset Management (asset management). | | Formerly Director, Manulife Trust Company (2011-2018); formerly Director, Manulife Asset Management Limited (2015-2017); formerly Chairman of the Board of Directors of Manulife Asset Management U.S. (2005-2016); formerly Chairman of the Board, Declaration Investment Management and Research (2008-2016). | | Since September 2017 |
| | | | |
Keith F. Hartstein 1956 Board Member & Independent Chair Portfolios Overseen: 95 | | Retired; Executive Committee of the Independent Directors Council (IDC) Board of Governors (since October 2019); Member (since November 2014) of the Governing Council of the IDC (organization of independent mutual fund directors); formerly President and Chief Executive Officer (2005-2012), Senior Vice President (2004-2005), Senior Vice President of Sales and Marketing (1997-2004), and various executive management positions (1990-1997), John Hancock Funds, LLC (asset management); Chairman, Investment Company Institute’s Sales Force Marketing Committee (2003-2008). | | None. | | Since September 2013 |
Visit our website at pgim.com/investments
| | | | | | |
| Independent Board Members |
| | | | |
Name Year of Birth Position(s) Portfolios Overseen | | Principal Occupation(s) During Past Five Years | | Other Directorships Held During Past Five Years | | Length of Board Service |
| | | | |
Laurie Simon Hodrick 1962 Board Member Portfolios Overseen: 91 | | A. Barton Hepburn Professor Emerita of Economics in the Faculty of Business, Columbia Business School (since 2018); Visiting Fellow at the Hoover Institution, Stanford University (since 2015); Sole Member, ReidCourt LLC (since 2008) (a consulting firm); formerly Visiting Professor of Law, Stanford Law School (2015-2021); formerly A. Barton Hepburn Professor of Economics in the Faculty of Business, Columbia Business School (1996-2017); formerly Managing Director, Global Head of Alternative Investment Strategies, Deutsche Bank (2006-2008). | | Independent Director, Roku (since December 2020) (communication services); formerly Independent Director, Synnex Corporation (2019-2021) (information technology); formerly Independent Director, Kabbage, Inc. (2018-2020) (financial services); formerly Independent Director, Corporate Capital Trust (2017-2018) (a business development company). | | Since September 2017 |
| | | | |
Brian K. Reid 1961 Board Member Portfolios Overseen: 94 | | Retired; formerly Chief Economist for the Investment Company Institute (ICI) (2005-2017); formerly Senior Economist and Director of Industry and Financial Analysis at the ICI (1998-2004); formerly Senior Economist, Industry and Financial Analysis at the ICI (1996-1998); formerly Staff Economist at the Federal Reserve Board (1989-1996); Director, ICI Mutual Insurance Company (2012-2017). | | None. | | Since March 2018 |
PGIM Jennison Global Opportunities Fund
| | | | | | |
| Independent Board Members |
| | | | |
Name Year of Birth Position(s) Portfolios Overseen | | Principal Occupation(s) During Past Five Years | | Other Directorships Held During Past Five Years | | Length of Board Service |
| | | | |
Grace C. Torres 1959 Board Member Portfolios Overseen: 94 | | Retired; formerly Treasurer and Principal Financial and Accounting Officer of the PGIM Funds, Target Funds, Advanced Series Trust, Prudential Variable Contract Accounts and The Prudential Series Fund (1998-June 2014); Assistant Treasurer (March 1999-June 2014) and Senior Vice President (September 1999-June 2014) of PGIM Investments LLC; Assistant Treasurer (May 2003-June 2014) and Vice President (June 2005-June 2014) of AST Investment Services, Inc.; Senior Vice President and Assistant Treasurer (May 2003-June 2014) of Prudential Annuities Advisory Services, Inc. | | Director (since January 2018) of OceanFirst Financial Corp. and OceanFirst Bank; formerly Director (July 2015-January 2018) of Sun Bancorp, Inc. N.A. and Sun National Bank. | | Since November 2014 |
| | | | | | |
| Interested Board Members |
| | | | |
Name Year of Birth Position(s) Portfolios Overseen | | Principal Occupation(s) During Past Five Years | | Other Directorships Held During Past Five Years | | Length of Board Service |
| | | | |
Stuart S. Parker 1962 Board Member & President Portfolios Overseen: 94 | | President, Chief Executive Officer, Chief Operating Officer and Officer in Charge of PGIM Investments LLC (formerly known as Prudential Investments LLC) (since January 2012); formerly Executive Vice President of Jennison Associates LLC and Head of Retail Distribution of PGIM Investments LLC (June 2005-December 2011); Investment Company Institute - Board of Governors (since May 2012). | | None. | | Since January 2012 |
Visit our website at pgim.com/investments
| | | | | | |
| Interested Board Members |
| | | | |
Name Year of Birth Position(s) Portfolios Overseen | | Principal Occupation(s) During Past Five Years | | Other Directorships Held During Past Five Years | | Length of Board Service |
| | | | |
Scott E. Benjamin 1973 Board Member & Vice President Portfolios Overseen: 95 | | Executive Vice President (since May 2009) of PGIM Investments LLC; Vice President (since June 2012) of Prudential Investment Management Services LLC; Executive Vice President (since September 2009) of AST Investment Services, Inc.; Senior Vice President of Product Development and Marketing, PGIM Investments (since February 2006); formerly Vice President of Product Development and Product Management, PGIM Investments LLC (2003-2006). | | None. | | Since March 2010 |
(1) The year that each Board Member joined the Board is as follows:
Ellen S. Alberding, 2013; Kevin J. Bannon, 2008; Linda W. Bynoe, 2005; Barry H. Evans, 2017; Keith F. Hartstein, 2013; Laurie Simon Hodrick, 2017; Michael S. Hyland, 2008; Richard A. Redeker, 1993; Stephen G. Stoneburn, 2003; Stuart S. Parker, Board Member since 2012 and President since 2012; Scott E. Benjamin, Board Member since 2010 and Vice President since 2009; Grace C. Torres, 2014.
| | | | |
| Fund Officers(a) | | | | |
| | | |
Name Year of Birth Fund Position | | Principal Occupation(s) During Past Five Years | | Length of Service as Fund Officer |
| | | |
Claudia DiGiacomo 1974 Chief Legal Officer | | Chief Legal Officer, Executive Vice President and Secretary of PGIM Investments LLC (since August 2020); Chief Legal Officer of Prudential Mutual Fund Services LLC (since August 2020); Chief Legal Officer of PIFM Holdco, LLC (since August 2020); Vice President and Corporate Counsel (since January 2005) of Prudential; and Corporate Counsel of AST Investment Services, Inc. (since August 2020); formerly Vice President and Assistant Secretary of PGIM Investments LLC (2005-2020); formerly Associate at Sidley Austin Brown & Wood LLP (1999-2004). | | Since December 2005 |
PGIM Jennison Global Opportunities Fund
| | | | |
| Fund Officers(a) | | | | |
| | | |
Name Year of Birth Fund Position | | Principal Occupation(s) During Past Five Years | | Length of Service as Fund Officer |
| | | |
Dino Capasso 1974 Chief Compliance Officer | | Chief Compliance Officer (since July 2019) of PGIM Investments LLC; Chief Compliance Officer (since July 2019) of the PGIM Funds, Target Funds, Advanced Series Trust, The Prudential Series Fund, Prudential’s Gibraltar Fund, Inc., PGIM Global High Yield Fund, Inc., PGIM High Yield Bond Fund, Inc., and PGIM Short Duration High Yield Opportunities Fund; Vice President and Deputy Chief Compliance Officer (June 2017-2019) of PGIM Investments LLC; formerly Senior Vice President and Senior Counsel (January 2016-June 2017), and Vice President and Counsel (February 2012-December 2015) of Pacific Investment Management Company LLC. | | Since July 2019 |
| | | |
Andrew R. French 1962 Secretary | | Vice President (since December 2018) of PGIM Investments LLC; formerly Vice President and Corporate Counsel (2010-2018) of Prudential; formerly Director and Corporate Counsel (2006-2010) of Prudential; Vice President and Assistant Secretary (since January 2007) of PGIM Investments LLC; Vice President and Assistant Secretary (since January 2007) of Prudential Mutual Fund Services LLC. | | Since October 2006 |
| | | |
Diana N. Huffman 1982 Assistant Secretary | | Vice President and Corporate Counsel (since September 2015) of Prudential; Vice President and Assistant Secretary (since August 2020) of PGIM Investments LLC; formerly Associate at Willkie Farr & Gallagher LLP (2009-2015). | | Since March 2019 |
| | | |
Melissa Gonzalez 1980 Assistant Secretary | | Vice President and Corporate Counsel (since September 2018) of Prudential; Vice President and Assistant Secretary (since August 2020) of PGIM Investments LLC; formerly Director and Corporate Counsel (March 2014-September 2018) of Prudential. | | Since March 2020 |
| | | |
Patrick E. McGuinness 1986 Assistant Secretary | | Vice President and Assistant Secretary (since August 2020) of PGIM Investments LLC; Director and Corporate Counsel (since February 2017) of Prudential; and Corporate Counsel (2012-2017) of IIL, Inc. | | Since June 2020 |
| | | |
Debra Rubano 1975 Assistant Secretary | | Vice President and Corporate Counsel (since November 2020) of Prudential; formerly Director and Senior Counsel of Allianz Global Investors U.S. Holdings LLC (2010-2020) and Assistant Secretary of numerous funds in the Allianz fund complex (2015-2020). | | Since December 2020 |
| | | |
Kelly A. Coyne 1968 Assistant Secretary | | Director, Investment Operations of Prudential Mutual Fund Services LLC (since 2010). | | Since March 2015 |
Visit our website at pgim.com/investments
| | | | |
| Fund Officers(a) | | | | |
| | | |
Name Year of Birth Fund Position | | Principal Occupation(s) During Past Five Years | | Length of Service as Fund Officer |
| | | |
Christian J. Kelly 1975 Treasurer and Principal Financial and Accounting Officer | | Vice President, Head of Fund Administration of PGIM Investments LLC (since November 2018); formerly Director of Fund Administration of Lord Abbett & Co. LLC (2009-2018), Treasurer and Principal Accounting Officer of the Lord Abbett Family of Funds (2017-2018); Director of Accounting, Avenue Capital Group (2008-2009); Senior Manager, Investment Management Practice of Deloitte & Touche LLP (1998-2007). | | Since January 2019 |
| | | |
Lana Lomuti 1967 Assistant Treasurer | | Vice President (since 2007) and Director (2005-2007), within PGIM Investments Fund Administration; formerly Assistant Treasurer (December 2007-February 2014) of The Greater China Fund, Inc. | | Since April 2014 |
| | | |
Russ Shupak 1973 Assistant Treasurer | | Vice President (since 2017) and Director (2013-2017), within PGIM Investments Fund Administration. | | Since September 2019 |
| | | |
Deborah Conway 1969 Assistant Treasurer | | Vice President (since 2017) and Director (2007-2017), within PGIM Investments Fund Administration. | | Since September 2019 |
| | | |
Elyse M. McLaughlin 1974 Assistant Treasurer | | Vice President (since 2017) and Director (2011-2017), within PGIM Investments Fund Administration. | | Since September 2019 |
| | | |
Jonathan Corbett 1983 Anti-Money Laundering Compliance Officer | | Vice President, Corporate Compliance, Global Compliance Programs and Compliance Risk Management (since August 2019) of Prudential; formerly Vice President and Head of Key Risk Areas Compliance (March 2016 to July 2019), Chief Privacy Officer (March 2016 to July 2019) and Head of Global Financial Crimes Unit (April 2014 to March 2016) at MetLife. | | Since October 2021 |
(a) Excludes Mr. Parker and Mr. Benjamin, interested Board Members who also serve as President and Vice President, respectively.
Explanatory Notes to Tables:
| ∎ | | Board Members are deemed to be “Interested,” as defined in the 1940 Act, by reason of their affiliation with PGIM Investments LLC and/or an affiliate of PGIM Investments LLC. |
| ∎ | | Unless otherwise noted, the address of all Board Members and Officers is c/o PGIM Investments LLC, 655 Broad Street, Newark, New Jersey 07102-4410. |
| ∎ | | There is no set term of office for Board Members or Officers. The Board Members have adopted a retirement policy, which calls for the retirement of Board Members on December 31 of the year in which they reach the age of 75. |
| ∎ | | “Other Directorships Held” includes all directorships of companies required to register or file reports with the SEC under the 1934 Act (that is, “public companies”) or other investment companies registered under the 1940 Act. |
| ∎ | | “Portfolios Overseen” includes all investment companies managed by PGIM Investments LLC. The investment companies for which PGIM Investments LLC serves as manager include the PGIM Funds, Target Funds, The Prudential Variable Contract Accounts, PGIM ETF Trust, PGIM High Yield Bond Fund, Inc., PGIM Global High Yield Fund, Inc., PGIM Short Duration High Yield Opportunities Fund, The Prudential Series Fund, Prudential’s Gibraltar Fund, Inc. and the Advanced Series Trust. |
| ∎ | | As used in the Fund Officers table “Prudential” means The Prudential Insurance Company of America. |
PGIM Jennison Global Opportunities Fund
Approval of Advisory Agreements (unaudited)
The Fund’s Board of Directors
The Board of Directors (the “Board”) of PGIM Jennison Global Opportunities Fund (the “Fund”)1 consists of ten individuals, eight of whom are not “interested persons” of the Fund, as defined in the Investment Company Act of 1940, as amended (the “1940 Act”) (the “Independent Directors”). The Board is responsible for the oversight of the Fund and its operations, and performs the various duties imposed on the directors of investment companies by the 1940 Act. The Independent Directors have retained independent legal counsel to assist them in connection with their duties. The Chair of the Board is an Independent Director. The Board has established four standing committees: the Audit Committee, the Nominating and Governance Committee, and two Investment Committees. Each committee is chaired by, and composed of, Independent Directors.
Annual Approval of the Fund’s Advisory Agreements
As required under the 1940 Act, the Board determines annually whether to renew the Fund’s management agreement with PGIM Investments LLC (“PGIM Investments”) and the Fund’s subadvisory agreement with Jennison Associates LLC (“Jennison”). In considering the renewal of the agreements, the Board, including all of the Independent Directors, met on June 7-10, 2021 and approved the renewal of the agreements through July 31, 2022, after concluding that the renewal of the agreements was in the best interests of the Fund and its shareholders.
In advance of the meetings, the Board requested and received materials relating to the agreements, and had the opportunity to ask questions and request further information in connection with its consideration. Among other things, the Board considered comparative fee information from PGIM Investments and Jennison. Also, the Board considered comparisons with other mutual funds in relevant Peer Universes and Peer Groups, as is further discussed below.
In approving the agreements, the Board, including the Independent Directors advised by independent legal counsel, considered the factors it deemed relevant, including the nature, quality and extent of services provided by PGIM Investments and the subadviser, the performance of the Fund, the profitability of PGIM Investments and its affiliates, expenses and fees, and the potential for economies of scale that may be shared with the Fund and its shareholders as the Fund’s assets grow. In their deliberations, the Directors did not identify any single factor which alone was responsible for the Board’s decision to approve the agreements with respect to the Fund. In connection with its deliberations, the Board considered information provided by PGIM Investments throughout the year at regular Board meetings, presentations from portfolio managers and other information, as well as information furnished at or in advance of the meetings on June 7-10, 2021.
The Directors determined that the overall arrangements between the Fund and PGIM Investments, which serves as the Fund’s investment manager pursuant to a
| 1 | PGIM Jennison Global Opportunities Fund is a series of Prudential World Fund, Inc. |
|
PGIM Jennison Global Opportunities Fund |
Approval of Advisory Agreements (continued)
management agreement, and between PGIM Investments and Jennison, which serves as the Fund’s subadviser pursuant to the terms of a subadvisory agreement with PGIM Investments, are in the best interests of the Fund and its shareholders in light of the services performed, fees charged and such other matters as the Directors considered relevant in the exercise of their business judgment.
The material factors and conclusions that formed the basis for the Directors’ reaching their determinations to approve the continuance of the agreements are separately discussed below.
Nature, Quality and Extent of Services
The Board received and considered information regarding the nature, quality and extent of services provided to the Fund by PGIM Investments and Jennison. The Board noted that Jennison is affiliated with PGIM Investments. The Board considered the services provided by PGIM Investments, including but not limited to the oversight of the subadviser for the Fund, as well as the provision of fund recordkeeping, compliance and other services to the Fund, and PGIM Investments’ role as administrator for the Fund’s liquidity risk management program. With respect to PGIM Investments’ oversight of the subadviser, the Board noted that PGIM Investments’ Strategic Investment Research Group (“SIRG”), which is a business unit of PGIM Investments, is responsible for monitoring and reporting to PGIM Investments’ senior management on the performance and operations of the subadviser. The Board also considered that PGIM Investments pays the salaries of all of the officers and interested Directors of the Fund who are part of Fund management. The Board also considered the investment subadvisory services provided by Jennison, including investment research and security selection, as well as adherence to the Fund’s investment restrictions and compliance with applicable Fund policies and procedures. The Board considered PGIM Investments’ evaluation of the subadviser, as well as PGIM Investments’ recommendation, based on its review of the subadviser, to renew the subadvisory agreement.
The Board considered the qualifications, backgrounds and responsibilities of PGIM Investments’ senior management responsible for the oversight of the Fund and Jennison, and also considered the qualifications, backgrounds and responsibilities of Jennison’s portfolio managers who are responsible for the day-to-day management of the Fund’s portfolio. The Board was provided with information pertaining to PGIM Investments’ and Jennison’s organizational structure, senior management, investment operations, and other relevant information pertaining to both PGIM Investments and Jennison. The Board also noted that it received favorable compliance reports from the Fund’s Chief Compliance Officer (“CCO”) as to both PGIM Investments and Jennison.
The Board concluded that it was satisfied with the nature, extent and quality of the investment management services provided by PGIM Investments and the subadvisory services provided to the Fund by Jennison, and that there was a reasonable basis on which to conclude that the Fund benefits from the services provided by PGIM Investments and Jennison under the management and subadvisory agreements.
|
Visit our website at pgim.com/investments |
Costs of Services and Profits Realized by PGIM Investments
The Board was provided with information on the profitability of PGIM Investments and its affiliates in serving as the Fund’s investment manager. The Board discussed with PGIM Investments the methodology utilized in assembling the information regarding profitability and considered its reasonableness. The Board recognized that it is difficult to make comparisons of profitability from fund management contracts because comparative information is not generally publicly available and is affected by numerous factors, including the structure of the particular adviser, the types of funds it manages, its business mix, numerous assumptions regarding allocations and the adviser’s capital structure and cost of capital. Taking these factors into account, the Board concluded that the profitability of PGIM Investments and its affiliates in relation to the services rendered was not unreasonable.
Economies of Scale
The Board received and discussed information concerning economies of scale that PGIM Investments may realize as the Fund’s assets grow beyond current levels. The Board noted that the management fee schedule for the Fund includes breakpoints, which have the effect of decreasing the fee rate as assets increase. During the course of time, the Board has considered information regarding the launch date of the Fund, the management fees of the Fund compared to those of similarly managed funds and PGIM Investments’ investment in the Fund over time. The Board noted that economies of scale may be shared with the Fund in several ways, including low management fees from inception, additional technological and personnel investments to enhance shareholder services, and maintaining existing expense structures in the face of a rising cost environment. The Board considered PGIM Investments’ assertion that it continually evaluates the management fee schedule of the Fund and the potential to share economies of scale through breakpoints or fee waivers as asset levels increase.
The Board recognized the inherent limitations of any analysis of economies of scale, stemming largely from the Board’s understanding that most of PGIM Investments’ costs are not specific to individual funds, but rather are incurred across a variety of products and services.
Other Benefits to PGIM Investments and Jennison
The Board considered potential ancillary benefits that might be received by PGIM Investments, Jennison and their affiliates as a result of their relationship with the Fund. The Board concluded that potential benefits to be derived by PGIM Investments included transfer agency fees received by the Fund’s transfer agent (which is affiliated with PGIM Investments), as well as benefits to its reputation or other intangible benefits resulting from PGIM Investments’ association with the Fund. The Board concluded that the potential benefits to be derived by Jennison included the ability to use soft dollar credits, as well as the potential benefits consistent with those generally resulting from an increase in assets under management, specifically, potential access to additional research resources and benefits to its reputation. The Board concluded that the benefits
|
PGIM Jennison Global Opportunities Fund |
Approval of Advisory Agreements (continued)
derived by PGIM Investments and Jennison were consistent with the types of benefits generally derived by investment managers and subadvisers to mutual funds.
Performance of the Fund / Fees and Expenses
The Board considered certain additional factors and made related conclusions relating to the historical performance of the Fund for the one-, three- and five-year periods ended December 31, 2020.
The Board also considered the Fund’s actual management fee, as well as the Fund’s net total expense ratio, for the fiscal year ended October 31, 2020. The Board considered the management fee for the Fund as compared to the management fee charged by PGIM Investments to other funds and the fee charged by other advisers to comparable mutual funds in a Peer Group. The actual management fee represents the fee rate actually paid by Fund shareholders and includes any fee waivers or reimbursements. The net total expense ratio for the Fund represents the actual expense ratio incurred by Fund shareholders.
The mutual funds included in the Peer Universe, which was used to consider performance, and the Peer Group, which was used to consider fees and expenses, were objectively determined by Broadridge, an independent provider of mutual fund data. In certain circumstances, PGIM Investments also provided supplemental Peer Universe or Peer Group information for reasons addressed with the Board. The comparisons placed the Fund in various quartiles over various periods, with the first quartile being the best 25% of the mutual funds (for performance, the best performing mutual funds and, for expenses, the lowest cost mutual funds).
The section below summarizes key factors considered by the Board and the Board’s conclusions regarding the Fund’s performance, fees and overall expenses. The table sets forth net performance comparisons (which reflect the impact on performance of fund expenses, or any subsidies, expense caps or waivers that may be applicable) with the Peer Universe, actual management fees with the Peer Group (which reflect the impact of any subsidies or fee waivers), and net total expenses with the Peer Group, each of which were key factors considered by the Board.
| | | | | | | | |
| Net Performance | | 1 Year | | 3 Years | | 5 Years | | 10 Years |
| | 1st Quartile | | 1st Quartile | | 1st Quartile | | N/A |
| Actual Management Fees: 2nd Quartile |
Net Total Expenses: 2nd Quartile |
| | • | | The Board noted that Fund outperformed its benchmark index over all periods. |
| | • | | The Board and PGIM Investments agreed to retain the Fund’s existing contractual expense cap that (exclusive of certain fees and expenses) limits total annual operating expenses at 0.84% for each class of the Fund’s shares, and limits |
|
Visit our website at pgim.com/investments |
transfer agency, shareholder servicing, sub-transfer agency and blue sky fees to the extent that such fees cause net annual Fund operating expenses to exceed 1.34% for Class R2 shares or 1.09% for Class R4 shares through February 28, 2022.
| | • | | The Board and PGIM Investments has also agreed to retain the Fund’s existing contractual expense cap with respect to Class A shares, which (exclusive of certain fees and expenses) limits total annual fund operating expenses to 1.08% for Class A shares through February 28, 2022. |
| | • | | In addition, PGIM Investments will waive management fees or shared operating expenses on any share class to the same extent that it waives such expenses on any other share class, and has agreed that total annual fund operating expenses for Class R6 shares will not exceed total annual fund operating expenses for Class Z shares. |
| | • | | The Board concluded that, in light of the above, it would be in the best interests of the Fund and its shareholders to renew the agreements. |
| | • | | The Board concluded that the management fees (including subadvisory fees) and total expenses were reasonable in light of the services provided. |
* * *
After full consideration of these factors, the Board concluded that the approval of the agreements was in the best interests of the Fund and its shareholders.
PGIM Jennison Global Opportunities Fund
| | | | |
| | | |
| ∎ MAIL | | ∎ TELEPHONE | | ∎ WEBSITE |
655 Broad Street Newark, NJ 07102 | | (800) 225-1852 | | pgim.com/investments |
|
| PROXY VOTING |
| The Board of Directors of the Fund has delegated to the Fund’s subadviser the responsibility for voting any proxies and maintaining proxy recordkeeping with respect to the Fund. A description of these proxy voting policies and procedures is available without charge, upon request, by calling (800) 225-1852 or by visiting the Securities and Exchange Commission’s website at sec.gov. Information regarding how the Fund voted proxies relating to portfolio securities during the most recent 12-month period ended June 30 is available on the Fund’s website and on the Securities and Exchange Commission’s website. |
|
| DIRECTORS |
| Ellen S. Alberding • Kevin J. Bannon • Scott E. Benjamin • Linda W. Bynoe • Barry H. Evans • Keith F. Hartstein • Laurie Simon Hodrick • Stuart S. Parker • Brian K. Reid • Grace C. Torres |
|
| OFFICERS |
| Stuart S. Parker, President • Scott E. Benjamin, Vice President • Christian J. Kelly, Treasurer and Principal Financial and Accounting Officer • Claudia DiGiacomo, Chief Legal Officer • Dino Capasso, Chief Compliance Officer • Jonathan Corbett, Anti-Money Laundering Compliance Officer • Andrew R. French, Secretary • Melissa Gonzalez, Assistant Secretary • Diana N. Huffman, Assistant Secretary • Kelly A. Coyne, Assistant Secretary • Patrick E. McGuinness, Assistant Secretary • Debra Rubano, Assistant Secretary • Lana Lomuti, Assistant Treasurer • Russ Shupak, Assistant Treasurer • Elyse M. McLaughlin, Assistant Treasurer • Deborah Conway, Assistant Treasurer |
| | | | |
| MANAGER | | PGIM Investments LLC | | 655 Broad Street
Newark, NJ 07102 |
|
| SUBADVISER | | Jennison Associates LLC | | 466 Lexington Avenue
New York, NY 10017 |
|
| DISTRIBUTOR | | Prudential Investment Management Services LLC | | 655 Broad Street
Newark, NJ 07102 |
|
| CUSTODIAN | | The Bank of New York
Mellon | | 240 Greenwich Street
New York, NY 10286 |
|
| TRANSFER AGENT | | Prudential Mutual Fund Services LLC | | PO Box 9658
Providence, RI 02940 |
|
INDEPENDENT REGISTERED
PUBLIC ACCOUNTING FIRM | | PricewaterhouseCoopers LLP | | 300 Madison Avenue
New York, NY 10017 |
|
| FUND COUNSEL | | Willkie Farr & Gallagher LLP | | 787 Seventh Avenue
New York, NY 10019 |
|
|
| An investor should consider the investment objectives, risks, charges, and expenses of the Fund carefully before investing. The prospectus and summary prospectus contain this and other information about the Fund. An investor may obtain the prospectus and summary prospectus by visiting our website at pgim.com/investments or by calling (800) 225-1852. The prospectus and summary prospectus should be read carefully before investing. |
|
| E-DELIVERY |
| To receive your mutual fund documents online, go to pgim.com/investments/resource/edelivery and enroll. Instead of receiving printed documents by mail, you will receive notification via email when new materials are available. You can cancel your enrollment or change your email address at any time by visiting the website address above. |
|
| SHAREHOLDER COMMUNICATIONS WITH DIRECTORS |
| Shareholders can communicate directly with the Board of Directors by writing to the Chair of the Board, PGIM Jennison Global Opportunities Fund, PGIM Investments, Attn: Board of Directors, 655 Broad Street, Newark, NJ 07102. Shareholders can communicate directly with an individual Director by writing to that Director at the same address. Communications are not screened before being delivered to the addressee. |
|
| AVAILABILITY OF PORTFOLIO HOLDINGS |
| The Fund files its complete schedule of portfolio holdings with the Securities and Exchange Commission for the first and third quarters of each fiscal year as an exhibit to its reports on Form N-PORT. The Fund’s Form N-PORT filings are available on the Commission’s website at sec.gov. |
|
| The Fund’s Statement of Additional Information contains additional information about the Fund’s Directors and is available without charge, upon request, by calling (800) 225-1852. |
Mutual Funds:
| | | | |
| ARE NOT INSURED BY THE FDIC OR ANY FEDERAL GOVERNMENT AGENCY | | MAY LOSE VALUE | | ARE NOT A DEPOSIT OF OR GUARANTEED
BY ANY BANK OR ANY BANK AFFILIATE |
| | | | | | | | | | | | |
PGIM JENNISON GLOBAL OPPORTUNITIES FUND |
| SHARE CLASS | | A | | C | | Z | | R2 | | R4 | | R6 |
| NASDAQ | | PRJAX | | PRJCX | | PRJZX | | PRJBX | | PRJDX | | PRJQX |
| CUSIP | | 743969719 | | 743969693 | | 743969685 | | 743969438 | | 743969420 | | 743969594 |
MF214E

PGIM JENNISON INTERNATIONAL
OPPORTUNITIES FUND
ANNUAL REPORT
OCTOBER 31, 2021

|
|
To enroll in e-delivery, go to pgim.com/investments/resource/edelivery |
Table of Contents
This report is not authorized for distribution to prospective investors unless preceded or accompanied by a current prospectus.
The views expressed in this report and information about the Fund’s portfolio holdings are for the period covered by this report and are subject to change thereafter.
Mutual funds are distributed by Prudential Investment Management Services LLC, member SIPC. Jennison Associates LLC is a registered investment adviser. Both are Prudential Financial companies. © 2021 Prudential Financial, Inc. and its related entities. Jennison Associates, Jennison, PGIM, and the PGIM logo are service marks of Prudential Financial, Inc. and its related entities, registered in many jurisdictions worldwide.
| | |
| 2 | | Visit our website at pgim.com/investments |
Letter from the President
| | |
 | | Dear Shareholder: We hope you find the annual report for the PGIM Jennison International Opportunities Fund informative and useful. The report covers performance for the 12-month period that ended October 31, 2021. The global economy and markets continued to recover throughout the period from the ongoing impact of the COVID-19 pandemic. The Federal Reserve slashed interest rates and kept them near zero to encourage borrowing. Congress passed stimulus bills worth several trillion dollars to help consumers and businesses. And several effective COVID-19 |
vaccines received regulatory approval. Those measures were enough to offset the fear of rising inflation and supply chain challenges that threatened to disrupt growth.
At the start of the period, stocks had recovered most of the steep losses they had suffered at the onset of the pandemic. Equities rallied as states reopened their economies but became more volatile as investors worried that a surge in COVID-19 infections would stall the recovery. However, rising corporate profits and economic growth, the resolution of the US presidential election, and the global rollout of approved vaccines lifted equity markets to record levels, helping stocks around the globe post gains for the full period.
Throughout this volatile period, investors sought safety in fixed income.
Investment-grade bonds in the US and the overall global bond market declined slightly during the period as the economy recovered, but emerging market debt rose. While the 10-year US Treasury yield hovered near record lows early in the period after a significant rally in interest rates, rates moved higher later on as investors began to focus on stronger economic growth and the prospects of higher inflation. The Fed also took several aggressive actions to keep the bond markets running smoothly, implementing many of the relief programs that proved to be successful in helping end the global financial crisis in 2008-09.
Regarding your investments with PGIM, we believe it is important to maintain a diversified portfolio of funds consistent with your tolerance for risk, time horizon, and financial goals. Your financial advisor can help you create a diversified investment plan that may include funds covering all the basic asset classes and that reflects your personal investor profile and risk tolerance. However, diversification and asset allocation strategies do not assure a profit or protect against loss in declining markets.
At PGIM Investments, we consider it a great privilege and responsibility to help investors participate in opportunities across global markets while meeting their toughest investment challenges. PGIM is a top-10 global investment manager with more than $1.5 trillion in assets under management. This scale and investment expertise allow us to deliver actively managed funds and strategies to meet the needs of investors around the globe.
Thank you for choosing our family of funds.
Sincerely,

Stuart S. Parker, President
PGIM Jennison International Opportunities Fund
December 15, 2021
| | | | |
PGIM Jennison International Opportunities Fund | | | 3 | |
Your Fund’s Performance (unaudited)
Performance data quoted represent past performance. Past performance does not guarantee future results. The investment return and principal value of an investment will fluctuate so that an investor’s shares, when redeemed, may be worth more or less than their original cost. Current performance may be lower or higher than the past performance data quoted. An investor may obtain performance data as of the most recent month-end by visiting our website at pgim.com/investments or by calling (800) 225-1852.
| | | | | | | | | | | | | | | |
| |
| | | Average Annual Total Returns as of 10/31/21 |
| | | One Year (%) | | Five Years (%) | | Since Inception (%) |
| | | |
Class A | | | | | | |
| | | |
(with sales charges) | | 29.37 | | 24.11 | | 15.21 (06/05/2012) |
| | | |
(without sales charges) | | 36.90 | | 25.52 | | 15.90 (06/05/2012) |
| | | |
Class C | | | | | | |
| | | |
(with sales charges) | | 34.84 | | 24.53 | | 15.02 (06/05/2012) |
| | | |
(without sales charges) | | 35.84 | | 24.53 | | 15.02 (06/05/2012) |
| | | |
Class R | | | | | | |
| | | |
(without sales charges) | | 36.42 | | N/A | | 21.63 (11/20/2017) |
| | | |
Class Z | | | | | | |
| | | |
(without sales charges) | | 37.15 | | 25.78 | | 16.17 (06/05/2012) |
| | | |
Class R2 | | | | | | |
| | | |
(without sales charges) | | 36.58 | | N/A | | 39.20 (12/27/2018) |
| | | |
Class R4 | | | | | | |
| | | |
(without sales charges) | | 36.97 | | N/A | | 39.56 (12/27/2018) |
| | | |
Class R6 | | | | | | |
| | | |
(without sales charges) | | 37.25 | | 25.87 | | 20.49 (12/23/2015) |
| | | |
MSCI All Country World Ex-US Index | | | | | | |
| | | |
| | | 29.66 | | 9.77 | | — |
| | | | | | | | |
|
| Average Annual Total Returns as of 10/31/21 Since Inception (%) |
| | | Class A, Class C, Class Z | | Class R | | Class R2, Class R4 | | Class R6 |
| | | (06/05/2012) | | (11/20/2017) | | (12/27/2018) | | (12/23/2015) |
| | | | |
MSCI All Country World Ex-US Index | | 8.16 | | 6.48 | | 14.23 | | 9.11 |
Since Inception returns are provided since the Fund has less than 10 fiscal years of returns. Since Inception returns for the Index are measured from the closest month-end to the class’ inception date.
| | |
| 4 | | Visit our website at pgim.com/investments |
Growth of a $10,000 Investment (unaudited)
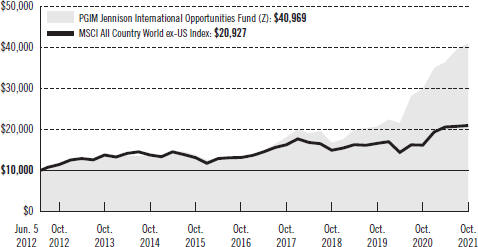
The graph compares a $10,000 investment in the Fund’s Class Z shares with a similar investment in the MSCI ACWI ex-US Index by portraying the initial account values at the commencement of operations for Class Z shares (June 5, 2012) and the account values at the end of the current fiscal year (October 31, 2021), as measured on a quarterly basis. For purposes of the graph, and unless otherwise indicated, it has been assumed that (a) all recurring fees (including management fees) were deducted and (b) all dividends and distributions were reinvested. The line graph provides information for Class Z shares only. As indicated in the tables provided earlier, performance for other share classes will vary due to the differing fees and expenses applicable to each share class (as indicated in the following paragraphs). Without waiver of fees and/or expense reimbursements, if any, the returns would have been lower.
Past performance does not predict future performance. Total returns and the ending account values in the graph include changes in share price and reinvestment of dividends and capital gains distributions in a hypothetical investment for the periods shown. The Fund’s total returns do not reflect the deduction of income taxes on an individual’s investment. Taxes may reduce your actual investment returns on income or gains paid by the Fund or any gains you may realize if you sell your shares.
| | | | |
PGIM Jennison International Opportunities Fund | | | 5 | |
Your Fund’s Performance (continued)
The returns in the tables do not reflect the deduction of taxes that a shareholder would pay on Fund distributions or following the redemption of Fund shares. The average annual total returns take into account applicable sales charges, which are described for each share class in the table below.
| | | | | | | | | | | | | | |
| | | | | | | | |
| | | Class A | | Class C | | Class R | | Class Z | | Class R2 | | Class R4 | | Class R6 |
| | | | | | | | |
| Maximum initial sales charge | | 5.50% of the public offering price | | None | | None | | None | | None | | None | | None |
| | | | | | | | |
| Contingent deferred sales charge (CDSC) (as a percentage of the lower of the original purchase price or the net asset value at redemption) | | 1.00% on sales of $1 million or more made within 12 months of purchase | | 1.00% on sales made within 12 months of purchase | | None | | None | | None | | None | | None |
| | | | | | | | |
| Annual distribution or distribution and service (12b-1) fees (shown as a percentage of average daily net assets) | | 0.30% (0.25% currently) | | 1.00% | | 0.75% (0.50% currently) | | None | | 0.25% | | None | | None |
| | | | | | | | |
| Shareholder services fees | | None | | None | | None | | None | | 0.10%* | | 0.10%* | | None |
*Shareholder service fee reflects maximum allowable fees under a shareholder services plan.
Benchmark Definitions
MSCI All Country World Index ex-US Index—The Morgan Stanley Capital International All Country World ex-US Index (MSCI ACWI ex-US Index) is an unmanaged free float-adjusted market capitalization-weighted index that is designed to provide a broad measure of stock performance throughout the world, with the exception of US-based companies. The Index includes both developed and emerging markets.
Investors cannot invest directly in an index. The returns for the Index would be lower if they included the effects of sales charges, operating expenses of a mutual fund, or taxes that may be paid by an investor.
| | |
| 6 | | Visit our website at pgim.com/investments |
Presentation of Fund Holdings as of 10/31/21
| | | | | | |
| | | |
| Ten Largest Holdings | | Line of Business | | Country | | % of Net Assets |
| | | |
| Adyen NV, 144A | | IT Services | | Netherlands | | 7.3% |
| | | |
| Sea Ltd., ADR | | Entertainment | | Taiwan | | 6.6% |
| | | |
| Atlassian Corp. PLC (Class A Stock) | | Software | | United States | | 5.1% |
| | | |
| Shopify, Inc. (Class A Stock) | | IT Services | | Canada | | 5.0% |
| | | |
| Sartorius AG (PRFC) | | Health Care Equipment & Supplies | | Germany | | 4.5% |
| | | |
| LVMH Moet Hennessy Louis Vuitton SE | | Textiles, Apparel & Luxury Goods | | France | | 4.1% |
| | | |
| ASML Holding NV | | Semiconductors & Semiconductor Equipment | | Netherlands | | 3.9% |
| | | |
| MercadoLibre, Inc. | | Internet & Direct Marketing Retail | | Argentina | | 3.7% |
| | | |
| Techtronic Industries Co. Ltd. | | Machinery | | Hong Kong | | 3.7% |
| | | |
| Straumann Holding AG | | Health Care Equipment & Supplies | | Switzerland | | 3.5% |
Holdings reflect only long-term investments and are subject to change.
| | | | |
PGIM Jennison International Opportunities Fund | | | 7 | |
Strategy and Performance Overview (unaudited)
How did the Fund perform?
The PGIM Jennison International Opportunities Fund’s Class Z shares returned 37.15% in the 12-month reporting period that ended October 31, 2021, outperforming the 29.66% return of the MSCI All Country World ex-US Index (the Index).
What were the market conditions?
| ● | In early fall 2020, investors began to favor areas of the market that were most exposed to an economic recovery and most debilitated by the COVID-19 pandemic. This rotation extended into the first quarter of 2021, boosting valuations of cyclical companies and reducing the earnings multiples of secular growth companies. |
| ● | June 2021 marked a turning point in the US economic reopening and reflation outlook, as the Federal Reserve’s comments began to reflect concerns about labor shortages and rising prices. |
| ● | Corporate profit growth through the end of the reporting period was strong, highlighting the expanding recovery and boosting business confidence to its highest level since the early days of the pandemic. |
| ● | The Chinese government took further steps during the period to rein in the activities of many of its largest consumer-facing companies, citing concerns over privacy, unintended usage of consumer data, and the deleterious health effects of excessive amounts of time spent online. Chinese stocks sold off sharply after these moves and the elevated risk of further intervention. |
| ● | All sectors in the Index generated positive returns for the period. The energy, financials, and information technology sectors posted the largest gains. Returns for the communication services and consumer discretionary sectors were comparatively modest. |
What worked?
| ● | Stock selection was very strong during the reporting period and benefited the Fund’s performance in nearly every sector. |
| ● | In the information technology sector: |
| | ● | Adyen NV, a payments-processing company based in the Netherlands, grew volumes and revenues meaningfully in the first half of 2021, supported by growth globally. More than 80% of growth was driven by existing merchants. Adyen continues to benefit from increasing global demand for its unified commerce solutions. |
| | ● | Demand for Shopify Inc.’s e-commerce services continued to grow during the period. The opening of economies around the world continued to highlight that a robust e-commerce presence has become a necessity for small, medium, and large companies. Shopify’s fully hosted cloud-based platform is helping democratize online commerce. Its infrastructure tools enable users to create, grow, and scale their e-commerce operations globally and across channels. |
| | |
| 8 | | Visit our website at pgim.com/investments |
| | ● | Atlassian is a leading provider of collaboration software that helps software teams organize, discuss, and complete projects. Jennison views Atlassian as a unique software as a service (SaaS) company with an enormous addressable market and long-term opportunities to add new customers and upsell its existing customers. Quarterly results were strong and included impressive year over year growth in subscription revenue, a key metric for the company. |
| ● | Sea Ltd. drove performance in the communication services sector as the company continued to execute and deliver significant topline growth in gaming and e-commerce. Sea’s e-commerce opportunity in Southeast Asia continues to offer long-term growth for the business, with potential for future growth opportunities in Latin America. |
| ● | Wuxi Biologics—which discovers, researches, develops, and manufactures biologics services—drove performance in the healthcare sector during the period. As a contract research organization based in China, Wuxi benefited from several trends, including increasing research and development outsourcing activities from drug companies, biologics being favored over chemical drugs, and a biotech boom in China. However, the Fund eliminated the position during the period due to the changing regulatory environment in China. |
What didn’t work?
| ● | Several China-based holdings were notable detractors from the Fund’s performance during the reporting period due to investor concerns over the changing regulatory environment in the country. Shares of Alibaba Group Holding Ltd., Bilibili Inc., and Tencent Holdings Ltd. declined during the period as regulators specifically targeted internet platforms. All three holdings were eliminated from the Fund during the period. |
| ● | Wix.com Ltd. is an Israeli software company that provides cloud-based web-development services, and Farfetch is a British-Portuguese online luxury fashion retailer. Both positions were also eliminated during the period in favor of other secular growth opportunities. |
Current outlook
| ● | Investors are facing a complex economic landscape heading into the end of 2021. Interest rates are responding to elevated wage and goods price inflation, exacerbated by supply-chain bottlenecks and shortages of critical components. Jennison expects corporate profit growth to return to pre-COVID-19 trend levels over the next year. While these levels are respectable in absolute terms, in Jennison’s view, they represent a meaningful slowdown from the COVID-19-driven highs reached over the previous 18 months. |
| ● | Many companies that reported strong operating results during the pandemic due to a broad shift toward online shopping and work-from-home business models are now facing challenging financial results comparisons to the previous reporting period. While this may be a headwind for share prices in the short term, Jennison believes |
| | | | |
PGIM Jennison International Opportunities Fund | | | 9 | |
Strategy and Performance Overview (continued)
| | that developments during the past 18 months have accelerated trends in consumer and enterprise behavior that were already in place before COVID-19 and that the step-up in growth demand in these areas may persist for some time. |
| ● | Jennison remains optimistic that the Fund’s portfolio holdings are well positioned to navigate this complex landscape. While the Fund’s investments are not insulated from the macro backdrop, Jennison believes their market-leading positions, strong cash flow generation and reinvestment, and often-disruptive business models should allow them to deliver growth that exceeds current market expectations, leading to potential share price outperformance over the long-term investment horizon. |
| | |
| 10 | | Visit our website at pgim.com/investments |
Fees and Expenses (unaudited)
As a shareholder of the Fund, you incur two types of costs: (1) transaction costs, including sales charges (loads) on purchase payments and redemptions, as applicable, and (2) ongoing costs, including management fees, distribution and/or service (12b-1) fees, and other Fund expenses, as applicable. This example is intended to help you understand your ongoing costs (in dollars) of investing in the Fund and to compare these costs with the ongoing costs of investing in other mutual funds.
The example is based on an investment of $1,000 held through the six-month period ended October 31, 2021. The example is for illustrative purposes only; you should consult the Prospectus for information on initial and subsequent minimum investment requirements.
Actual Expenses
The first line for each share class in the table on the following page provides information about actual account values and actual expenses. You may use the information on this line, together with the amount you invested, to estimate the expenses that you paid over the period. Simply divide your account value by $1,000 (for example, an $8,600 account value ÷ $1,000 = 8.6), then multiply the result by the number on the first line under the heading “Expenses Paid During the Six-Month Period” to estimate the expenses you paid on your account during this period.
Hypothetical Example for Comparison Purposes
The second line for each share class in the table on the following page provides information about hypothetical account values and hypothetical expenses based on the Fund’s actual expense ratio and an assumed rate of return of 5% per year before expenses, which is not the Fund’s actual return. The hypothetical account values and expenses may not be used to estimate the actual ending account balance or expenses you paid for the period. You may use this information to compare the ongoing costs of investing in the Fund and other funds. To do so, compare this 5% hypothetical example with the 5% hypothetical examples that appear in the shareholder reports of the other funds.
The Fund’s transfer agent may charge additional fees to holders of certain accounts that are not included in the expenses shown in the table on the following page. These fees apply to individual retirement accounts (IRAs) and Section 403(b) accounts. As of the close of the six-month period covered by the table, IRA fees included an annual maintenance fee of $15 per account (subject to a maximum annual maintenance fee of $25 for all accounts held by the same shareholder). Section 403(b) accounts are charged an annual $25 fiduciary maintenance fee. Some of the fees may vary in amount, or may be waived, based on your total account balance or the number of PGIM funds, including the Fund, that you own. You should consider the additional fees that were charged to your Fund account over the six-month period when you estimate the total ongoing expenses paid over the period and the impact of these fees on your ending account value, as these additional expenses are not reflected in the information
| | | | |
PGIM Jennison International Opportunities Fund | | | 11 | |
Fees and Expenses (continued)
provided in the expense table. Additional fees have the effect of reducing investment returns.
Please note that the expenses shown in the table are meant to highlight your ongoing costs only and do not reflect any transactional costs such as sales charges (loads). Therefore, the second line for each share class in the table is useful in comparing ongoing costs only and will not help you determine the relative total costs of owning different funds. In addition, if these transactional costs were included, your costs would have been higher.
| | | | | | | | | | |
| | | | |
PGIM Jennison International Opportunities Fund | | Beginning
Account Value
May 1, 2021 | | Ending
Account Value
October 31, 2021 | | Annualized
Expense
Ratio Based on
the
Six-Month Period | | Expenses Paid
During the
Six-Month Period* |
| | | | | |
| Class A | | Actual | | $1,000.00 | | $1,125.00 | | 1.09% | | $ 5.84 |
| | Hypothetical | | $1,000.00 | | $1,019.71 | | 1.09% | | $ 5.55 |
| Class C | | Actual | | $1,000.00 | | $1,120.80 | | 1.90% | | $10.16 |
| | Hypothetical | | $1,000.00 | | $1,015.63 | | 1.90% | | $ 9.65 |
| Class R | | Actual | | $1,000.00 | | $1,123.00 | | 1.48% | | $ 7.92 |
| | Hypothetical | | $1,000.00 | | $1,017.74 | | 1.48% | | $ 7.53 |
| Class Z | | Actual | | $1,000.00 | | $1,126.20 | | 0.90% | | $ 4.82 |
| | Hypothetical | | $1,000.00 | | $1,020.67 | | 0.90% | | $ 4.58 |
| Class R2 | | Actual | | $1,000.00 | | $1,123.60 | | 1.36% | | $ 7.28 |
| | Hypothetical | | $1,000.00 | | $1,018.35 | | 1.36% | | $ 6.92 |
| Class R4 | | Actual | | $1,000.00 | | $1,124.90 | | 1.14% | | $ 6.11 |
| | Hypothetical | | $1,000.00 | | $1,019.46 | | 1.14% | | $ 5.80 |
| Class R6 | | Actual | | $1,000.00 | | $1,126.60 | | 0.84% | | $ 4.50 |
| | | Hypothetical | | $1,000.00 | | $1,020.97 | | 0.84% | | $ 4.28 |
*Fund expenses (net of fee waivers or subsidies, if any) for each share class are equal to the annualized expense ratio for each share class (provided in the table), multiplied by the average account value over the period, multiplied by the 184 days in the six-month period ended October 31, 2021, and divided by the 365 days in the Fund’s fiscal year ended October 31, 2021 (to reflect the six-month period). Expenses presented in the table include the expenses of any underlying portfolios in which the Fund may invest.
| | |
| 12 | | Visit our website at pgim.com/investments |
Schedule of Investments
as of October 31, 2021
| | | | | | | | |
| | |
| Description | | Shares | | | Value | |
| | |
| LONG-TERM INVESTMENTS 98.4% | | | | | | |
| | |
| COMMON STOCKS 93.9% | | | | | | |
| | |
| Argentina 3.7% | | | | | | |
MercadoLibre, Inc.* | | | 157,281 | | | $ | 232,936,307 | |
| | |
| Canada 5.0% | | | | | | |
Shopify, Inc. (Class A Stock)* | | | 213,604 | | | | 313,299,395 | |
| | |
| China 4.0% | | | | | | |
Contemporary Amperex Technology Co. Ltd. (Class A Stock) | | | 1,867,512 | | | | 186,442,016 | |
Wuxi Biologics Cayman, Inc., 144A* | | | 4,287,511 | | | | 65,101,211 | |
| | | | | | | | |
| | |
| | | | | | | 251,543,227 | |
| | |
| France 18.3% | | | | | | |
Dassault Systemes SE | | | 3,195,671 | | | | 186,584,414 | |
Hermes International | | | 105,363 | | | | 167,380,320 | |
Kering SA | | | 100,000 | | | | 75,336,665 | |
L’Oreal SA | | | 438,071 | | | | 200,373,370 | |
LVMH Moet Hennessy Louis Vuitton SE | | | 329,198 | | | | 258,315,156 | |
Pernod Ricard SA | | | 741,767 | | | | 170,619,268 | |
Remy Cointreau SA | | | 429,802 | | | | 86,797,693 | |
| | | | | | | | |
| | |
| | | | | | | 1,145,406,886 | |
| | |
| Germany 1.7% | | | | | | |
BioNTech SE, ADR*(a) | | | 374,127 | | | | 104,280,419 | |
| | |
| Hong Kong 3.7% | | | | | | |
Techtronic Industries Co. Ltd. | | | 11,098,621 | | | | 228,787,073 | |
| | |
| Italy 5.3% | | | | | | |
Amplifon SpA | | | 1,208,649 | | | | 61,460,872 | |
Brunello Cucinelli SpA* | | | 1,459,288 | | | | 88,412,226 | |
Ferrari NV | | | 771,732 | | | | 182,964,961 | |
| | | | | | | | |
| | |
| | | | | | | 332,838,059 | |
| | |
| Japan 5.3% | | | | | | |
GMO Payment Gateway, Inc. | | | 728,985 | | | | 92,963,885 | |
Keyence Corp. | | | 259,094 | | | | 156,757,766 | |
Menicon Co. Ltd. | | | 2,234,476 | | | | 83,988,257 | |
| | | | | | | | |
| | |
| | | | | | | 333,709,908 | |
See Notes to Financial Statements.
| | | | |
PGIM Jennison International Opportunities Fund | | | 13 | |
Schedule of Investments (continued)
as of October 31, 2021
| | | | | | | | |
| | |
| Description | | Shares | | | Value | |
| | |
| COMMON STOCKS (Continued) | | | | | | |
| | |
| Luxembourg 2.0% | | | | | | |
Eurofins Scientific SE | | | 1,029,540 | | | $ | 121,577,105 | |
| | |
| Netherlands 12.7% | | | | | | |
Adyen NV, 144A* | | | 150,756 | | | | 457,232,049 | |
Argenx SE, ADR* | | | 321,837 | | | | 97,181,901 | |
ASML Holding NV | | | 297,702 | | | | 241,800,980 | |
| | | | | | | | |
| | |
| | | | | | | 796,214,930 | |
| | |
| Sweden 1.7% | | | | | | |
Evolution AB, 144A | | | 654,752 | | | | 106,133,856 | |
| | |
| Switzerland 9.2% | | | | | | |
Alcon, Inc. | | | 507,035 | | | | 41,942,336 | |
Givaudan SA | | | 31,630 | | | | 148,871,370 | |
Lonza Group AG | | | 203,793 | | | | 167,270,965 | |
Straumann Holding AG | | | 105,331 | | | | 219,430,224 | |
| | | | | | | | |
| | |
| | | | | | | 577,514,895 | |
| | |
| Taiwan 9.9% | | | | | | |
Sea Ltd., ADR* | | | 1,190,612 | | | | 409,058,565 | |
Taiwan Semiconductor Manufacturing Co. Ltd., ADR | | | 1,832,025 | | | | 208,301,242 | |
| | | | | | | | |
| | |
| | | | | | | 617,359,807 | |
| | |
| United Kingdom 2.8% | | | | | | |
Ashtead Group PLC | | | 2,078,378 | | | | 173,255,896 | |
| | |
| United States 7.3% | | | | | | |
Atlassian Corp. PLC (Class A Stock)* | | | 704,152 | | | | 322,593,156 | |
Globant SA* | | | 424,972 | | | | 135,646,812 | |
| | | | | | | | |
| | |
| | | | | | | 458,239,968 | |
| | |
| Uruguay 1.3% | | | | | | |
Dlocal Ltd.* | | | 1,666,368 | | | | 80,835,512 | |
| | | | | | | | |
| | |
TOTAL COMMON STOCKS
(cost $4,160,981,421) | | | | | | | 5,873,933,243 | |
| | | | | | | | |
See Notes to Financial Statements.
| | | | | | | | |
| | |
| Description | | Shares | | | Value | |
| | |
| PREFERRED STOCK 4.5% | | | | | | |
| | |
| Germany | | | | | | |
Sartorius AG (PRFC)
(cost $160,802,068) | | | 433,783 | | | $ | 282,872,448 | |
| | | | | | | | |
| | |
TOTAL LONG-TERM INVESTMENTS
(cost $4,321,783,489) | | | | | | | 6,156,805,691 | |
| | | | | | | | |
| | |
| SHORT-TERM INVESTMENTS 2.4% | | | | | | |
| | |
| AFFILIATED MUTUAL FUNDS | | | | | | |
PGIM Core Ultra Short Bond Fund(wa) | | | 101,909,396 | | | | 101,909,396 | |
PGIM Institutional Money Market Fund
(cost $45,167,306; includes $45,165,104 of cash collateral for securities on loan)(b)(wa) | | | 45,194,657 | | | | 45,167,540 | |
| | | | | | | | |
| | |
TOTAL SHORT-TERM INVESTMENTS
(cost $147,076,702) | | | | | | | 147,076,936 | |
| | | | | | | | |
| | |
TOTAL INVESTMENTS 100.8%
(cost $4,468,860,191) | | | | | | | 6,303,882,627 | |
Liabilities in excess of other assets (0.8)% | | | | | | | (49,166,379 | ) |
| | | | | | | | |
| | |
NET ASSETS 100.0% | | | | | | $ | 6,254,716,248 | |
| | | | | | | | |
Below is a list of the abbreviation(s) used in the annual report:
144A—Security was purchased pursuant to Rule 144A under the Securities Act of 1933 and, pursuant to the requirements of Rule 144A, may not be resold except to qualified institutional buyers.
ADR—American Depositary Receipt
LIBOR—London Interbank Offered Rate
PRFC—Preference Shares
| * | Non-income producing security. |
| (a) | All or a portion of security is on loan. The aggregate market value of such securities, including those sold and pending settlement, is $43,454,007; cash collateral of $45,165,104 (included in liabilities) was received with which the Fund purchased highly liquid short-term investments. In the event of significant appreciation in value of securities on loan on the last business day of the reporting period, the Fund may reflect a collateral value that is less than the market value of the loaned securities and such shortfall is remedied the following business day. |
| (b) | Represents security, or portion thereof, purchased with cash collateral received for securities on loan and includes dividend reinvestment. |
| (wa) | PGIM Investments LLC, the manager of the Fund, also serves as manager of the PGIM Core Ultra Short Bond Fund and PGIM Institutional Money Market Fund, if applicable. |
See Notes to Financial Statements.
| | | | |
PGIM Jennison International Opportunities Fund | | | 15 | |
Schedule of Investments (continued)
as of October 31, 2021
Fair Value Measurements:
Various inputs are used in determining the value of the Fund’s investments. These inputs are summarized in the three broad levels listed below.
Level 1—unadjusted quoted prices generally in active markets for identical securities.
Level 2—quoted prices for similar securities, interest rates and yield curves, prepayment speeds, foreign currency exchange rates and other observable inputs.
Level 3—unobservable inputs for securities valued in accordance with Board approved fair valuation procedures.
The following is a summary of the inputs used as of October 31, 2021 in valuing such portfolio securities:
| | | | | | | | | | | | | | | |
| | | Level 1 | | Level 2 | | Level 3 |
| Investments in Securities | | | | | | |
| Assets | | | | | | |
| Long-Term Investments | | | | | | |
| Common Stocks | | | | | | |
Argentina | | | $ | 232,936,307 | | | | $ | — | | | | $ | — | |
Canada | | | | 313,299,395 | | | | | — | | | | | — | |
China | | | | — | | | | | 251,543,227 | | | | | — | |
France | | | | — | | | | | 1,145,406,886 | | | | | — | |
Germany | | | | 104,280,419 | | | | | — | | | | | — | |
Hong Kong | | | | — | | | | | 228,787,073 | | | | | — | |
Italy | | | | — | | | | | 332,838,059 | | | | | — | |
Japan | | | | — | | | | | 333,709,908 | | | | | — | |
Luxembourg | | | | — | | | | | 121,577,105 | | | | | — | |
Netherlands | | | | 97,181,901 | | | | | 699,033,029 | | | | | — | |
Sweden | | | | — | | | | | 106,133,856 | | | | | — | |
Switzerland | | | | — | | | | | 577,514,895 | | | | | — | |
Taiwan | | | | 617,359,807 | | | | | — | | | | | — | |
United Kingdom | | | | — | | | | | 173,255,896 | | | | | — | |
United States | | | | 458,239,968 | | | | | — | | | | | — | |
Uruguay | | | | 80,835,512 | | | | | — | | | | | — | |
| Preferred Stock | | | | | | |
Germany | | | | — | | | | | 282,872,448 | | | | | — | |
| Short-Term Investments | | | | | | |
Affiliated Mutual Funds | | | | 147,076,936 | | | | | — | | | | | — | |
| | | | | | | | | | | | | | | |
Total | | | $ | 2,051,210,245 | | | | $ | 4,252,672,382 | | | | $ | — | |
| | | | | | | | | | | | | | | |
See Notes to Financial Statements.
Industry Classification:
The industry classification of investments and liabilities in excess of other assets shown as a percentage of net assets as of October 31, 2021 were as follows (unaudited):
| | | | |
IT Services | | | 17.3 | % |
Health Care Equipment & Supplies | | | 9.9 | |
Textiles, Apparel & Luxury Goods | | | 9.4 | |
Software | | | 8.1 | |
Semiconductors & Semiconductor Equipment | | | 7.2 | |
Entertainment | | | 6.6 | |
Life Sciences Tools & Services | | | 5.7 | |
Beverages | | | 4.1 | |
Internet & Direct Marketing Retail | | | 3.7 | |
Machinery | | | 3.7 | |
Biotechnology | | | 3.2 | |
Personal Products | | | 3.2 | |
Electrical Equipment | | | 3.0 | |
Automobiles | | | 2.9 | |
| | | | |
Trading Companies & Distributors | | | 2.8 | % |
Electronic Equipment, Instruments & Components | | | 2.5 | |
Chemicals | | | 2.4 | |
Affiliated Mutual Funds (0.7% represents investments purchased with collateral from securities on loan) | | | 2.4 | |
Hotels, Restaurants & Leisure | | | 1.7 | |
Health Care Providers & Services | | | 1.0 | |
| | | | |
| | | 100.8 | |
Liabilities in excess of other assets | | | (0.8 | ) |
| | | | |
| | | 100.0 | % |
| | | | |
Financial Instruments/Transactions—Summary of Offsetting and Netting Arrangements:
The Fund entered into financial instruments/transactions during the reporting period that are either offset in accordance with current requirements or are subject to enforceable master netting arrangements or similar agreements that permit offsetting. The information about offsetting and related netting arrangements for financial instruments/transactions where the legal right to set-off exists is presented in the summary below.
Offsetting of financial instrument/transaction assets and liabilities:
| | | | | | | | | | | | | | | |
Description | | Gross Market
Value of
Recognized
Assets/(Liabilities) | | Collateral Pledged/(Received)(1) | | Net Amount |
| Securities on Loan | | | $ | 43,454,007 | | | | $ | (43,454,007 | ) | | | $ | — | |
| | | | | | | | | | | | | | | |
| (1) | Collateral amount disclosed by the Fund is limited to the market value of financial instruments/transactions. |
See Notes to Financial Statements.
| | | | |
PGIM Jennison International Opportunities Fund | | | 17 | |
Statement of Assets and Liabilities
as of October 31, 2021
| | | | |
Assets | | | | |
Investments at value, including securities on loan of $43,454,007: | | | | |
Unaffiliated investments (cost $4,321,783,489) | | $ | 6,156,805,691 | |
Affiliated investments (cost $147,076,702) | | | 147,076,936 | |
Foreign currency, at value (cost $897,436) | | | 892,781 | |
Receivable for Fund shares sold | | | 41,319,507 | |
Tax reclaim receivable | | | 2,080,987 | |
Dividends receivable | | | 457,327 | |
Prepaid expenses | | | 29,343 | |
| | | | |
Total Assets | | | 6,348,662,572 | |
| | | | |
| |
| Liabilities | | | |
Payable to broker for collateral for securities on loan | | | 45,165,104 | |
Payable for Fund shares purchased | | | 24,330,362 | |
Payable for investments purchased | | | 19,602,295 | |
Management fee payable | | | 3,752,595 | |
Accrued expenses and other liabilities | | | 759,244 | |
Distribution fee payable | | | 223,738 | |
Affiliated transfer agent fee payable | | | 107,097 | |
Directors’ fees payable | | | 4,453 | |
Affiliated shareholder servicing fees payable | | | 1,436 | |
| | | | |
Total Liabilities | | | 93,946,324 | |
| | | | |
| |
Net Assets | | $ | 6,254,716,248 | |
| | | | |
| |
| | | | | |
Net assets were comprised of: | | | | |
Common stock, at par | | $ | 1,600 | |
Paid-in capital in excess of par | | | 4,454,518,088 | |
Total distributable earnings (loss) | | | 1,800,196,560 | |
| | | | |
Net assets, October 31, 2021 | | $ | 6,254,716,248 | |
| | | | |
See Notes to Financial Statements.
| | | | |
Class A | | | | |
Net asset value and redemption price per share,
($208,515,273 ÷ 5,413,906 shares of common stock issued and outstanding) | | $ | 38.51 | |
Maximum sales charge (5.50% of offering price) | | | 2.24 | |
| | | | |
Maximum offering price to public | | $ | 40.75 | |
| | | | |
| |
| Class C | | | |
Net asset value, offering price and redemption price per share,
($40,127,792 ÷ 1,120,357 shares of common stock issued and outstanding) | | $ | 35.82 | |
| | | | |
| |
| Class R | | | |
Net asset value, offering price and redemption price per share,
($358,284,107 ÷ 9,387,683 shares of common stock issued and outstanding) | | $ | 38.17 | |
| | | | |
| |
| Class Z | | | |
Net asset value, offering price and redemption price per share,
($3,481,109,878 ÷ 88,869,606 shares of common stock issued and outstanding) | | $ | 39.17 | |
| | | | |
| |
| Class R2 | | | |
Net asset value, offering price and redemption price per share,
($13,101,114 ÷ 338,365 shares of common stock issued and outstanding) | | $ | 38.72 | |
| | | | |
| |
| Class R4 | | | |
Net asset value, offering price and redemption price per share,
($16,892,470 ÷ 433,053 shares of common stock issued and outstanding) | | $ | 39.01 | |
| | | | |
| |
| Class R6 | | | |
Net asset value, offering price and redemption price per share,
($2,136,685,614 ÷ 54,452,467 shares of common stock issued and outstanding) | | $ | 39.24 | |
| | | | |
See Notes to Financial Statements.
| | | | |
PGIM Jennison International Opportunities Fund | | | 19 | |
Statement of Operations
Year Ended October 31, 2021
| | | | |
Net Investment Income (Loss) | | | | |
Income | | | | |
Unaffiliated dividend income (net of $2,816,247 foreign withholding tax) | | $ | 16,659,337 | |
Income from securities lending, net (including affiliated income of $37,328) | | | 220,956 | |
Affiliated dividend income | | | 120,364 | |
| | | | |
Total income | | | 17,000,657 | |
| | | | |
| |
Expenses | | | | |
Management fee | | | 35,702,609 | |
Distribution fee(a) | | | 3,296,135 | |
Shareholder servicing fees (including affiliated expense of $12,189)(a) | | | 19,094 | |
Transfer agent’s fees and expenses (including affiliated expense of $545,226)(a) | | | 3,144,301 | |
Custodian and accounting fees | | | 580,219 | |
Registration fees(a) | | | 349,287 | |
SEC registration fees | | | 296,240 | |
Shareholders’ reports | | | 246,022 | |
Directors’ fees | | | 55,570 | |
Legal fees and expenses | | | 36,614 | |
Audit fee | | | 28,533 | |
Miscellaneous | | | 46,321 | |
| | | | |
Total expenses | | | 43,800,945 | |
Less: Fee waiver and/or expense reimbursement(a) | | | (1,310,218 | ) |
Distribution fee waiver(a) | | | (923,786 | ) |
| | | | |
Net expenses | | | 41,566,941 | |
| | | | |
Net investment income (loss) | | | (24,566,284 | ) |
| | | | |
| |
| Realized And Unrealized Gain (Loss) On Investment And Foreign Currency Transactions | | | |
Net realized gain (loss) on: | | | | |
Investment transactions (including affiliated of $54,350) | | | 19,520,488 | |
Foreign currency transactions | | | (1,364,922 | ) |
| | | | |
| | | 18,155,566 | |
| | | | |
Net change in unrealized appreciation (depreciation) on: | | | | |
Investments (including affiliated of $(75,652)) | | | 1,213,379,447 | |
Foreign currencies | | | (19,980 | ) |
| | | | |
| | | 1,213,359,467 | |
| | | | |
Net gain (loss) on investment and foreign currency transactions | | | 1,231,515,033 | |
| | | | |
Net Increase (Decrease) In Net Assets Resulting From Operations | | $ | 1,206,948,749 | |
| | | | |
See Notes to Financial Statements.
| (a) | Class specific expenses and waivers were as follows: |
| | | | | | | | | | | | | | | | | | | | | | | | | | | | |
| | | Class A | | | Class C | | | Class R | | | Class Z | | | Class R2 | | | Class R4 | | | Class R6 | |
Distribution fee | | | 427,924 | | | | 288,843 | | | | 2,557,396 | | | | — | | | | 21,972 | | | | — | | | | — | |
Shareholder servicing fees | | | — | | | | — | | | | — | | | | — | | | | 7,896 | | | | 11,198 | | | | — | |
Transfer agent’s fees and expenses | | | 156,202 | | | | 24,234 | | | | 442,374 | | | | 2,481,979 | | | | 13,441 | | | | 17,660 | | | | 8,411 | |
Registration fees | | | 31,048 | | | | 16,019 | | | | 7,723 | | | | 148,881 | | | | 7,473 | | | | 7,473 | | | | 130,670 | |
Fee waiver and/or expense reimbursement | | | (179,909 | ) | | | (21,398 | ) | | | — | | | | (1,029,070 | ) | | | (7,031 | ) | | | (6,889 | ) | | | (65,921 | ) |
Distribution fee waiver | | | (71,321 | ) | | | — | | | | (852,465 | ) | | | — | | | | — | | | | — | | | | — | |
See Notes to Financial Statements.
| | | | |
PGIM Jennison International Opportunities Fund | | | 21 | |
Statements of Changes in Net Assets
| | | | | | | | |
| |
| | | Year Ended
October 31, | |
| | |
| | | 2021 | | | 2020 | |
| | |
Increase (Decrease) in Net Assets | | | | | | | | |
Operations | | | | | | | | |
Net investment income (loss) | | $ | (24,566,284 | ) | | $ | (6,212,110 | ) |
Net realized gain (loss) on investment and foreign currency transactions | | | 18,155,566 | | | | (4,015,917 | ) |
Net change in unrealized appreciation (depreciation) on investments and foreign currencies | | | 1,213,359,467 | | | | 502,180,663 | |
| | | | | | | | |
Net increase (decrease) in net assets resulting from operations | | | 1,206,948,749 | | | | 491,952,636 | |
| | | | | | | | |
| | |
Fund share transactions (Net of share conversions) | | | | | | | | |
Net proceeds from shares sold | | | 3,741,129,832 | | | | 1,727,331,268 | |
Cost of shares purchased | | | (1,121,686,711 | ) | | | (415,033,423 | ) |
| | | | | | | | |
Net increase (decrease) in net assets from Fund share transactions | | | 2,619,443,121 | | | | 1,312,297,845 | |
| | | | | | | | |
Total increase (decrease) | | | 3,826,391,870 | | | | 1,804,250,481 | |
| | |
| Net Assets: | | | | | | |
Beginning of year | | | 2,428,324,378 | | | | 624,073,897 | |
| | | | | | | | |
End of year | | $ | 6,254,716,248 | | | $ | 2,428,324,378 | |
| | | | | | | | |
See Notes to Financial Statements.
Financial Highlights
| | | | | | | | | | | | | | | | | | | | |
| Class A Shares | |
| | | Year Ended October 31, | |
| | | 2021 | | | 2020 | | | 2019 | | | 2018 | | | 2017 | |
| | | | | | |
| Per Share Operating Performance(a): | | | | | | | | | | | | | | | | | | | | |
| Net Asset Value, Beginning of Year | | | $28.14 | | | | $19.51 | | | | $15.82 | | | | $17.10 | | | | $12.36 | |
| Income (loss) from investment operations: | | | | | | | | | | | | | | | | | | | | |
| Net investment income (loss) | | | (0.25 | ) | | | (0.12 | ) | | | 0.01 | | | | (0.06 | ) | | | (0.01 | ) |
| Net realized and unrealized gain (loss) on investment and foreign currency transactions | | | 10.62 | | | | 8.75 | | | | 3.68 | | | | (1.22 | ) | | | 4.75 | |
| Total from investment operations | | | 10.37 | | | | 8.63 | | | | 3.69 | | | | (1.28 | ) | | | 4.74 | |
| Net asset value, end of year | | | $38.51 | | | | $28.14 | | | | $19.51 | | | | $15.82 | | | | $17.10 | |
| Total Return(b): | | | 36.90 | % | | | 44.11 | % | | | 23.39 | % | | | (7.49 | )% | | | 38.35 | % |
| | | | | | | | | | | | | | | | | | | | |
| Ratios/Supplemental Data: | |
| Net assets, end of year (000) | | | $208,515 | | | | $76,093 | | | | $26,778 | | | | $14,496 | | | | $5,303 | |
| Average net assets (000) | | | $142,641 | | | | $46,059 | | | | $20,599 | | | | $10,393 | | | | $3,121 | |
| Ratios to average net assets(c)(d): | | | | | | | | | | | | | | | | | | | | |
| Expenses after waivers and/or expense reimbursement | | | 1.09 | % | | | 1.09 | % | | | 1.09 | % | | | 1.13 | % | | | 1.15 | % |
| Expenses before waivers and/or expense reimbursement | | | 1.27 | % | | | 1.34 | % | | | 1.46 | % | | | 1.55 | % | | | 1.63 | % |
| Net investment income (loss) | | | (0.71 | )% | | | (0.52 | )% | | | 0.04 | % | | | (0.32 | )% | | | (0.07 | )% |
| Portfolio turnover rate(e) | | | 41 | % | | | 43 | % | | | 53 | % | | | 59 | % | | | 69 | % |
| (a) | Calculated based on average shares outstanding during the year. |
| (b) | Total return does not consider the effects of sales loads. Total return is calculated assuming a purchase of a share on the first day and a sale on the last day of each year reported and includes reinvestment of dividends and distributions, if any. Total returns may reflect adjustments to conform to GAAP. |
| (c) | Does not include expenses of the underlying funds in which the Fund invests. |
| (d) | Effective November 1, 2017, class specific expenses include transfer agent fees and expenses and registration fees, which are charged to their respective share class. |
| (e) | The Fund’s portfolio turnover rate is calculated in accordance with regulatory requirements, without regard to transactions involving short-term investments and certain derivatives. If such transactions were included, the Fund’s portfolio turnover rate may be higher. |
See Notes to Financial Statements.
| | | | |
PGIM Jennison International Opportunities Fund | | | 23 | |
Financial Highlights (continued)
| | | | | | | | | | | | | | | | | | | | |
| Class C Shares | |
| | | Year Ended October 31, | |
| | | 2021 | | | 2020 | | | 2019 | | | 2018 | | | 2017 | |
| | | | | | |
| Per Share Operating Performance(a): | | | | | | | | | | | | | | | | | | | | |
| Net Asset Value, Beginning of Year | | | $26.38 | | | | $18.44 | | | | $15.08 | | | | $16.43 | | | | $11.96 | |
| Income (loss) from investment operations: | | | | | | | | | | | | | | | | | | | | |
| Net investment income (loss) | | | (0.50 | ) | | | (0.29 | ) | | | (0.13 | ) | | | (0.18 | ) | | | (0.11 | ) |
| Net realized and unrealized gain (loss) on investment and foreign currency transactions | | | 9.94 | | | | 8.23 | | | | 3.49 | | | | (1.17 | ) | | | 4.58 | |
| Total from investment operations | | | 9.44 | | | | 7.94 | | | | 3.36 | | | | (1.35 | ) | | | 4.47 | |
| Net asset value, end of year | | | $35.82 | | | | $26.38 | | | | $18.44 | | | | $15.08 | | | | $16.43 | |
| Total Return(b): | | | 35.84 | % | | | 43.00 | % | | | 22.28 | % | | | (8.22 | )% | | | 37.37 | % |
| | | | | | | | | | | | | | | | | | | | |
| Ratios/Supplemental Data: | |
| Net assets, end of year (000) | | | $40,128 | | | | $16,411 | | | | $5,302 | | | | $3,800 | | | | $1,759 | |
| Average net assets (000) | | | $28,884 | | | | $9,894 | | | | $4,683 | | | | $3,449 | | | | $1,080 | |
| Ratios to average net assets(c)(d): | | | | | | | | | | | | | | | | | | | | |
| Expenses after waivers and/or expense reimbursement | | | 1.90 | % | | | 1.90 | % | | | 1.91 | % | | | 1.92 | % | | | 1.89 | % |
| Expenses before waivers and/or expense reimbursement | | | 1.97 | % | | | 2.15 | % | | | 2.33 | % | | | 2.54 | % | | | 2.32 | % |
| Net investment income (loss) | | | (1.52 | )% | | | (1.32 | )% | | | (0.80 | )% | | | (1.05 | )% | | | (0.80 | )% |
| Portfolio turnover rate(e) | | | 41 | % | | | 43 | % | | | 53 | % | | | 59 | % | | | 69 | % |
| (a) | Calculated based on average shares outstanding during the year. |
| (b) | Total return does not consider the effects of sales loads. Total return is calculated assuming a purchase of a share on the first day and a sale on the last day of each year reported and includes reinvestment of dividends and distributions, if any. Total returns may reflect adjustments to conform to GAAP. |
| (c) | Does not include expenses of the underlying funds in which the Fund invests. |
| (d) | Effective November 1, 2017, class specific expenses include transfer agent fees and expenses and registration fees, which are charged to their respective share class. |
| (e) | The Fund’s portfolio turnover rate is calculated in accordance with regulatory requirements, without regard to transactions involving short-term investments and certain derivatives. If such transactions were included, the Fund’s portfolio turnover rate may be higher. |
See Notes to Financial Statements.
| | | | | | | | | | | | | | | | | | | | | | | | |
| Class R Shares | |
| | | Year Ended October 31, | | | | | | November 20, 2017(a)
through October 31, 2018 | |
| | | 2021 | | | 2020 | | | 2019 | | | | |
| Per Share Operating Performance(b): | | | | | | | | | | | | | | | | | | | | | | | | |
| Net Asset Value, Beginning of Period | | | $27.98 | | | | $19.48 | | | | $15.86 | | | | | | | | $17.62 | | | | | |
| Income (loss) from investment operations: | | | | | | | | | | | | | | | | | | | | | | | | |
| Net investment income (loss) | | | (0.37 | ) | | | (0.20 | ) | | | (0.06 | ) | | | | | | | (0.09 | ) | | | | |
| Net realized and unrealized gain (loss) on investment and foreign currency transactions | | | 10.56 | | | | 8.70 | | | | 3.68 | | | | | | | | (1.67 | ) | | | | |
| Total from investment operations | | | 10.19 | | | | 8.50 | | | | 3.62 | | | | | | | | (1.76 | ) | | | | |
| Net asset value, end of period | | | $38.17 | | | | $27.98 | | | | $19.48 | | | | | | | | $15.86 | | | | | |
| Total Return(c): | | | 36.42 | % | | | 43.56 | % | | | 22.89 | % | | | | | | | (9.99 | )% | | | | |
| | | | | | | | | | | | | | | | | | | | | | | | |
| Ratios/Supplemental Data: | |
| Net assets, end of period (000) | | | $358,284 | | | | $291,162 | | | | $280,311 | | | | | | | | $266,294 | | | | | |
| Average net assets (000) | | | $340,986 | | | | $281,238 | | | | $278,086 | | | | | | | | $299,955 | | | | | |
| Ratios to average net assets(d): | | | | | | | | | | | | | | | | | | | | | | | | |
| Expenses after waivers and/or expense reimbursement | | | 1.47 | % | | | 1.47 | % | | | 1.47 | % | | | | | | | 1.46 | %(e) | | | | |
| Expenses before waivers and/or expense reimbursement | | | 1.72 | % | | | 1.77 | % | | | 1.81 | % | | | | | | | 1.80 | %(e) | | | | |
| Net investment income (loss) | | | (1.08 | )% | | | (0.87 | )% | | | (0.36 | )% | | | | | | | (0.53 | )%(e) | | | | |
| Portfolio turnover rate(f) | | | 41 | % | | | 43 | % | | | 53 | % | | | | | | | 59 | % | | | | |
| (a) | Commencement of offering. |
| (b) | Calculated based on average shares outstanding during the period. |
| (c) | Total return is calculated assuming a purchase of a share on the first day and a sale on the last day of each period reported and includes reinvestment of dividends and distributions, if any. Total returns may reflect adjustments to conform to GAAP. Total returns for periods less than one full year are not annualized. |
| (d) | Does not include expenses of the underlying funds in which the Fund invests. |
| (f) | The Fund’s portfolio turnover rate is calculated in accordance with regulatory requirements, without regard to transactions involving short-term investments and certain derivatives. If such transactions were included, the Fund’s portfolio turnover rate may be higher. |
See Notes to Financial Statements.
| | | | |
PGIM Jennison International Opportunities Fund | | | 25 | |
Financial Highlights (continued)
| | | | | | | | | | | | | | | | | | | | |
| Class Z Shares | | | | | | | | | | | | | | | |
| | | Year Ended October 31, | |
| | | 2021 | | | 2020 | | | 2019 | | | 2018 | | | 2017 | |
| Per Share Operating Performance(a): | | | | | | | | | | | | | | | | | | | | |
| Net Asset Value, Beginning of Year | | | $28.56 | | | | $19.77 | | | | $16.01 | | | | $17.29 | | | | $12.50 | |
| Income (loss) from investment operations: | | | | | | | | | | | | | | | | | | | | |
| Net investment income (loss) | | | (0.18 | ) | | | (0.10 | ) | | | 0.03 | | | | (0.01 | ) | | | 0.03 | |
| Net realized and unrealized gain (loss) on investment and foreign currency transactions | | | 10.79 | | | | 8.89 | | | | 3.74 | | | | (1.24 | ) | | | 4.79 | |
| Total from investment operations | | | 10.61 | | | | 8.79 | | | | 3.77 | | | | (1.25 | ) | | | 4.82 | |
| Less Dividends and Distributions: | | | | | | | | | | | | | | | | | | | | |
| Dividends from net investment income | | | - | | | | - | | | | (0.01 | ) | | | (0.03 | ) | | | (0.03 | ) |
| Net asset value, end of year | | | $39.17 | | | | $28.56 | | | | $19.77 | | | | $16.01 | | | | $17.29 | |
| Total Return(b): | | | 37.15 | % | | | 44.46 | % | | | 23.56 | % | | | (7.24 | )% | | | 38.65 | % |
| | | | | | | | | | | | | | | | | | | | | |
| Ratios/Supplemental Data: | |
| Net assets, end of year (000) | | | $3,481,110 | | | | $1,364,899 | | | | $208,629 | | | | $104,113 | | | | $28,612 | |
| Average net assets (000) | | | $2,452,905 | | | | $639,223 | | | | $139,982 | | | | $75,711 | | | | $21,756 | |
| Ratios to average net assets(c)(d): | | | | | | | | | | | | | | | | | | | | |
| Expenses after waivers and/or expense reimbursement | | | 0.90 | % | | | 0.90 | % | | | 0.90 | % | | | 0.89 | % | | | 0.89 | % |
| Expenses before waivers and/or expense reimbursement | | | 0.94 | % | | | 0.99 | % | | | 1.04 | % | | | 1.04 | % | | | 1.34 | % |
| Net investment income (loss) | | | (0.51 | )% | | | (0.38 | )% | | | 0.15 | % | | | (0.08 | )% | | | 0.23 | % |
| Portfolio turnover rate(e) | | | 41 | % | | | 43 | % | | | 53 | % | | | 59 | % | | | 69 | % |
| (a) | Calculated based on average shares outstanding during the year. |
| (b) | Total return is calculated assuming a purchase of a share on the first day and a sale on the last day of each year reported and includes reinvestment of dividends and distributions, if any. Total returns may reflect adjustments to conform to GAAP. |
| (c) | Does not include expenses of the underlying funds in which the Fund invests. |
| (d) | Effective November 1, 2017, class specific expenses include transfer agent fees and expenses and registration fees, which are charged to their respective share class. |
| (e) | The Fund’s portfolio turnover rate is calculated in accordance with regulatory requirements, without regard to transactions involving short-term investments and certain derivatives. If such transactions were included, the Fund’s portfolio turnover rate may be higher. |
See Notes to Financial Statements.
| | | | | | | | | | | | | | | | | | | | | | | | | |
| Class R2 Shares | | | | | | | | | | |
| | | Year Ended October 31, | | | | December 27, 2018(a) through October 31, | | |
| | | 2021 | | 2020 | | | | 2019 |
| Per Share Operating Performance(b): | | | | | | | | | | | | | | | |
| Net Asset Value, Beginning of Period | | | | $28.35 | | | | | $19.70 | | | | | | | | | | $15.10 | | | | | | |
| Income (loss) from investment operations: | | | | | | | | | | | | | | | | | | | | | | | | | |
| Net investment income (loss) | | | | (0.33 | ) | | | | (0.29 | ) | | | | | | | | | (0.12 | ) | | | | | |
| Net realized and unrealized gain (loss) on investment and foreign currency transactions | | | | 10.70 | | | | | 8.94 | | | | | | | | | | 4.72 | | | | | | |
| Total from investment operations | | | | 10.37 | | | | | 8.65 | | | | | | | | | | 4.60 | | | | | | |
| Net asset value, end of period | | | | $38.72 | | | | | $28.35 | | | | | | | | | | $19.70 | | | | | | |
| Total Return(c): | | | | 36.58 | % | | | | 43.91 | % | | | | | | | | | 30.46 | % | | | | | |
| | | | | | | | | | | | | | | | | | | | | | | | | | |
| Ratios/Supplemental Data: | | | | | | | | | | |
| Net assets, end of period (000) | | | | $13,101 | | | | | $4,664 | | | | | | | | | | $233 | | | | | | |
| Average net assets (000) | | | | $8,789 | | | | | $1,557 | | | | | | | | | | $44 | | | | | | |
| Ratios to average net assets(d): | | | | | | | | | | | | | | | | | | | | | | | | | |
| Expenses after waivers and/or expense reimbursement | | | | 1.33 | % | | | | 1.32 | % | | | | | | | | | 1.26 | %(e) | | | | | |
| Expenses before waivers and/or expense reimbursement | | | | 1.41 | % | | | | 2.23 | % | | | | | | | | | 64.97 | %(e) | | | | | |
| Net investment income (loss) | | | | (0.92 | )% | | | | (1.06 | )% | | | | | | | | | (0.76 | )%(e) | | | | | |
| Portfolio turnover rate(f) | | | | 41 | % | | | | 43 | % | | | | | | | | | 53 | % | | | | | |
| (a) | Commencement of offering. |
| (b) | Calculated based on average shares outstanding during the period. |
| (c) | Total return is calculated assuming a purchase of a share on the first day and a sale on the last day of each period reported and includes reinvestment of dividends and distributions, if any. Total returns may reflect adjustments to conform to GAAP. Total returns for periods less than one full year are not annualized. |
| (d) | Does not include expenses of the underlying funds in which the Fund invests. |
| (f) | The Fund’s portfolio turnover rate is calculated in accordance with regulatory requirements, without regard to transactions involving short-term investments and certain derivatives. If such transactions were included, the Fund’s portfolio turnover rate may be higher. |
See Notes to Financial Statements.
| | | | |
PGIM Jennison International Opportunities Fund | | | 27 | |
Financial Highlights (continued)
| | | | | | | | | | | | | | | | | | | | | | | | | |
| Class R4 Shares | | | | | | | | | | |
| | | Year Ended October 31, | | | | December 27, 2018(a) through October 31, | | |
| | | 2021 | | 2020 | | | | 2019 |
| Per Share Operating Performance(b): | | | | | | | | | | | | | | | |
| Net Asset Value, Beginning of Period | | | | $28.49 | | | | | $19.75 | | | | | | | | | | $15.10 | | | | | | |
| Income (loss) from investment operations: | | | | | | | | | | | | | | | | | | | | | | | | | |
| Net investment income (loss) | | | | (0.25 | ) | | | | (0.11 | ) | | | | | | | | | (0.02 | ) | | | | | |
| Net realized and unrealized gain (loss) on investment and foreign currency transactions | | | | 10.77 | | | | | 8.85 | | | | | | | | | | 4.67 | | | | | | |
| Total from investment operations | | | | 10.52 | | | | | 8.74 | | | | | | | | | | 4.65 | | | | | | |
| Net asset value, end of period | | | | $39.01 | | | | | $28.49 | | | | | | | | | | $19.75 | | | | | | |
| Total Return(c): | | | | 36.97 | % | | | | 44.20 | % | | | | | | | | | 30.79 | % | | | | | |
| | | | | | | | | | | | | | | | | | | | | | | | | | |
| Ratios/Supplemental Data: | | | | | | | | | | |
| Net assets, end of period (000) | | | | $16,892 | | | | | $1,359 | | | | | | | | | | $846 | | | | | | |
| Average net assets (000) | | | | $11,907 | | | | | $1,023 | | | | | | | | | | $293 | | | | | | |
| Ratios to average net assets(d): | | | | | | | | | | | | | | | | | | | | | | | | | |
| Expenses after waivers and/or expense reimbursement | | | | 1.08 | % | | | | 1.04 | % | | | | | | | | | 0.95 | %(e) | | | | | |
| Expenses before waivers and/or expense reimbursement | | | | 1.14 | % | | | | 2.47 | % | | | | | | | | | 10.65 | %(e) | | | | | |
| Net investment income (loss) | | | | (0.69 | )% | | | | (0.46 | )% | | | | | | | | | (0.11 | )%(e) | | | | | |
| Portfolio turnover rate(f) | | | | 41 | % | | | | 43 | % | | | | | | | | | 53 | % | | | | | |
| (a) | Commencement of offering. |
| (b) | Calculated based on average shares outstanding during the period. |
| (c) | Total return is calculated assuming a purchase of a share on the first day and a sale on the last day of each period reported and includes reinvestment of dividends and distributions, if any. Total returns may reflect adjustments to conform to GAAP. Total returns for periods less than one full year are not annualized. |
| (d) | Does not include expenses of the underlying funds in which the Fund invests. |
| (f) | The Fund’s portfolio turnover rate is calculated in accordance with regulatory requirements, without regard to transactions involving short-term investments and certain derivatives. If such transactions were included, the Fund’s portfolio turnover rate may be higher. |
See Notes to Financial Statements.
| | | | | | | | | | | | | | | | | | | | |
| Class R6 Shares | | | | | | | | | | | | | | | |
| | | Year Ended October 31, | |
| | | 2021 | | | 2020 | | | 2019 | | | 2018 | | | 2017 | |
| Per Share Operating Performance(a): | | | | | | | | | | | | | | | | | | | | |
| Net Asset Value, Beginning of Year | | | $28.59 | | | | $19.78 | | | | $16.02 | | | | $17.29 | | | | $12.50 | |
| Income (loss) from investment operations: | | | | | | | | | | | | | | | | | | | | |
| Net investment income (loss) | | | (0.16 | ) | | | (0.08 | ) | | | 0.04 | | | | (0.01 | ) | | | 0.04 | |
| Net realized and unrealized gain (loss) on investment and foreign currency transactions | | | 10.81 | | | | 8.89 | | | | 3.74 | | | | (1.22 | ) | | | 4.79 | |
| Total from investment operations | | | 10.65 | | | | 8.81 | | | | 3.78 | | | | (1.23 | ) | | | 4.83 | |
| Less Dividends and Distributions: | | | | | | | | | | | | | | | | | | | | |
| Dividends from net investment income | | | - | | | | - | | | | (0.02 | ) | | | (0.04 | ) | | | (0.04 | ) |
| Net asset value, end of year | | | $39.24 | | | | $28.59 | | | | $19.78 | | | | $16.02 | | | | $17.29 | |
| Total Return(b): | | | 37.25 | % | | | 44.54 | % | | | 23.72 | % | | | (7.15 | )% | | | 38.75 | % |
| | | | | | | | | | | | | | | | | | | | | |
| Ratios/Supplemental Data: | |
| Net assets, end of year (000) | | | $2,136,686 | | | | $673,736 | | | | $101,975 | | | | $35,141 | | | | $26,252 | |
| Average net assets (000) | | | $1,445,464 | | | | $295,968 | | | | $54,900 | | | | $26,736 | | | | $24,927 | |
| Ratios to average net assets(c)(d): | | | | | | | | | | | | | | | | | | | | |
| Expenses after waivers and/or expense reimbursement | | | 0.84 | % | | | 0.84 | % | | | 0.84 | % | | | 0.84 | % | | | 0.84 | % |
| Expenses before waivers and/or expense reimbursement | | | 0.84 | % | | | 0.91 | % | | | 0.98 | % | | | 1.00 | % | | | 1.30 | % |
| Net investment income (loss) | | | (0.46 | )% | | | (0.32 | )% | | | 0.20 | % | | | (0.05 | )% | | | 0.28 | % |
| Portfolio turnover rate(e) | | | 41 | % | | | 43 | % | | | 53 | % | | | 59 | % | | | 69 | % |
| (a) | Calculated based on average shares outstanding during the year. |
| (b) | Total return is calculated assuming a purchase of a share on the first day and a sale on the last day of each year reported and includes reinvestment of dividends and distributions, if any. Total returns may reflect adjustments to conform to GAAP. |
| (c) | Does not include expenses of the underlying funds in which the Fund invests. |
| (d) | Effective November 1, 2017, class specific expenses include transfer agent fees and expenses and registration fees, which are charged to their respective share class. |
| (e) | The Fund’s portfolio turnover rate is calculated in accordance with regulatory requirements, without regard to transactions involving short-term investments and certain derivatives. If such transactions were included, the Fund’s portfolio turnover rate may be higher. |
See Notes to Financial Statements.
| | | | |
PGIM Jennison International Opportunities Fund | | | 29 | |
Notes to Financial Statements
1. Organization
Prudential World Fund, Inc. (the “Registered Investment Company” or “RIC”) is registered under the Investment Company Act of 1940, as amended (“1940 Act”), as an open-end management investment company. The RIC is organized as a Maryland Corporation and currently consists of seven separate funds: PGIM Emerging Markets Debt Hard Currency Fund, PGIM Emerging Markets Debt Local Currency Fund, PGIM Jennison Emerging Markets Equity Opportunities Fund, PGIM Jennison Global Infrastructure Fund, PGIM Jennison Global Opportunities Fund, PGIM Jennison International Opportunities Fund and PGIM QMA International Equity Fund. These financial statements relate only to the PGIM Jennison International Opportunities Fund (the “Fund”). The Fund is classified as a diversified fund for purposes of the 1940 Act.
The investment objective of the Fund is to seek long-term growth of capital.
2. Accounting Policies
The Fund follows the investment company accounting and reporting guidance of the Financial Accounting Standards Board (“FASB”) Accounting Standard Codification (“ASC”) Topic 946 Financial Services — Investment Companies. The following is a summary of significant accounting policies followed by the Fund in the preparation of its financial statements. The policies conform to U.S. generally accepted accounting principles (“GAAP”). The Fund consistently follows such policies in the preparation of its financial statements.
Securities Valuation: The Fund holds securities and other assets and liabilities that are fair valued as of the close of each day (generally, 4:00 PM Eastern time) the New York Stock Exchange (“NYSE”) is open for trading. As described in further detail below, the Fund’s investments are valued daily based on a number of factors, including the type of investment and whether market quotations are readily available. The RIC’s Board of Directors (the “Board”) has adopted valuation procedures for security valuation under which fair valuation responsibilities have been delegated to PGIM Investments LLC (“PGIM Investments” or the “Manager”). Pursuant to the Board’s delegation, the Manager has established a Valuation Committee responsible for supervising the fair valuation of portfolio securities and other assets and liabilities. The valuation procedures permit the Fund to utilize independent pricing vendor services, quotations from market makers, and alternative valuation methods when market quotations are either not readily available or not deemed representative of fair value. Fair value is the price that would be received to sell an asset or paid to transfer a liability in an orderly transaction between market participants on the measurement date. A record of the Valuation Committee’s actions is subject to the Board’s review at its first quarterly meeting following the quarter in which such actions take place.
For the fiscal reporting year-end, securities and other assets and liabilities were fair valued at the close of the last U.S. business day. Trading in certain foreign securities may occur when the NYSE is closed (including weekends and holidays). Because such foreign securities trade in markets that are open on weekends and U.S. holidays, the values of some of the Fund’s foreign investments may change on days when investors cannot purchase or redeem Fund shares.
Various inputs determine how the Fund’s investments are valued, all of which are categorized according to the three broad levels (Level 1, 2, or 3) detailed in the Schedule of Investments and referred to herein as the “fair value hierarchy” in accordance with FASB ASC Topic 820 - Fair Value Measurements and Disclosures.
Common or preferred stocks, exchange-traded funds and derivative instruments, if applicable, that are traded on a national securities exchange are valued at the last sale price as of the close of trading on the applicable exchange where the security principally trades. Securities traded via NASDAQ are valued at the NASDAQ official closing price. To the extent these securities are valued at the last sale price or NASDAQ official closing price, they are classified as Level 1 in the fair value hierarchy. In the event that no sale or official closing price on valuation date exists, these securities are generally valued at the mean between the last reported bid and ask prices, or at the last bid price in the absence of an ask price. These securities are classified as Level 2 in the fair value hierarchy.
Foreign equities traded on foreign securities exchanges are generally valued using pricing vendor services that provide model prices derived using adjustment factors based on information such as local closing price, relevant general and sector indices, currency fluctuations, depositary receipts, and futures, as applicable. Securities valued using such model prices are classified as Level 2 in the fair value hierarchy. The models generate an evaluated adjustment factor for each security, which is applied to the local closing price to adjust it for post closing market movements up to the time the Fund is valued. Utilizing that evaluated adjustment factor, the vendor provides an evaluated price for each security. If the vendor does not provide an evaluated price, securities are valued in accordance with exchange-traded common and preferred stock valuation policies discussed above.
Investments in open-end funds (other than exchange-traded funds) are valued at their net asset values as of the close of the NYSE on the date of valuation. These securities are classified as Level 1 in the fair value hierarchy since they may be purchased or sold at their net asset values on the date of valuation.
Securities and other assets that cannot be priced according to the methods described above are valued based on pricing methodologies approved by the Board. In the event that unobservable inputs are used when determining such valuations, the securities will be classified as Level 3 in the fair value hierarchy. Altering one or more unobservable inputs may result in a significant change to a Level 3 security’s fair value measurement.
| | | | |
PGIM Jennison International Opportunities Fund | | | 31 | |
Notes to Financial Statements (continued)
When determining the fair value of securities, some of the factors influencing the valuation include: the nature of any restrictions on disposition of the securities; assessment of the general liquidity of the securities; the issuer’s financial condition and the markets in which it does business; the cost of the investment; the size of the holding and the capitalization of the issuer; the prices of any recent transactions or bids/offers for such securities or any comparable securities; any available analyst media or other reports or information deemed reliable by the Manager regarding the issuer or the markets or industry in which it operates. Using fair value to price securities may result in a value that is different from a security’s most recent closing price and from the price used by other unaffiliated mutual funds to calculate their net asset values.
Foreign Currency Translation: The books and records of the Fund are maintained in U.S. dollars. Foreign currency amounts are translated into U.S. dollars on the following basis:
(i) market value of investment securities, other assets and liabilities — at the exchange rate as of the valuation date;
(ii) purchases and sales of investment securities, income and expenses — at the rates of exchange prevailing on the respective dates of such transactions.
Although the net assets of the Fund are presented at the foreign exchange rates and market values at the close of the period, the Fund does not generally isolate that portion of the results of operations arising as a result of changes in the foreign exchange rates from the fluctuations arising from changes in the market prices of long-term portfolio securities held at the end of the period. Similarly, the Fund does not isolate the effect of changes in foreign exchange rates from the fluctuations arising from changes in the market prices of long-term portfolio securities sold during the period. Accordingly, holding period unrealized and realized foreign currency gains (losses) are included in the reported Net change in unrealized appreciation (depreciation) on investments and Net realized gains (losses) on investment transactions on the Statements of Operations.
Net realized gains (losses) on foreign currency transactions represent net foreign exchange gains (losses) from the disposition of holdings of foreign currencies, currency gains (losses) realized between the trade and settlement dates on investment transactions, and the difference between the amounts of interest, dividends and foreign withholding taxes recorded on the Fund’s books and the U.S. dollar equivalent amounts actually received or paid. Net unrealized currency gains (losses) arise from valuing foreign currency denominated assets and liabilities (other than investments) at period end exchange rates.
Master Netting Arrangements: The RIC, on behalf of the Fund, is subject to various Master Agreements, or netting arrangements, with select counterparties. These are agreements
which a subadviser may have negotiated and entered into on behalf of all or a portion of the Fund. A master netting arrangement between the Fund and the counterparty permits the Fund to offset amounts payable by the Fund to the same counterparty against amounts to be received; and by the receipt of collateral from the counterparty by the Fund to cover the Fund’s exposure to the counterparty. However, there is no assurance that such mitigating factors are easily enforceable. In addition to master netting arrangements, the right to set-off exists when all the conditions are met such that each of the parties owes the other determinable amounts, the reporting party has the right to set-off the amount owed with the amount owed by the other party, the reporting party intends to set-off and the right of set-off is enforceable by law.
Securities Lending: The Fund lends its portfolio securities to banks and broker-dealers. The loans are secured by collateral at least equal to the market value of the securities loaned. Collateral pledged by each borrower is invested in an affiliated money market fund and is marked to market daily, based on the previous day’s market value, such that the value of the collateral exceeds the value of the loaned securities. In the event of significant appreciation in value of securities on loan on the last business day of the reporting period, the financial statements may reflect a collateral value that is less than the market value of the loaned securities. Such shortfall is remedied as described above. Loans are subject to termination at the option of the borrower or the Fund. Upon termination of the loan, the borrower will return to the Fund securities identical to the loaned securities. The remaining maturities of the securities lending transactions are considered overnight and continuous. Should the borrower of the securities fail financially, the Fund has the right to repurchase the securities in the open market using the collateral.
The Fund recognizes income, net of any rebate and securities lending agent fees, for lending its securities in the form of fees or interest on the investment of any cash received as collateral. The borrower receives all interest and dividends from the securities loaned and such payments are passed back to the lender in amounts equivalent thereto, which are reflected in interest income or unaffiliated dividend income based on the nature of the payment on the Statement of Operations. The Fund also continues to recognize any unrealized gain (loss) in the market price of the securities loaned and on the change in the value of the collateral invested that may occur during the term of the loan. In addition, realized gain (loss) is recognized on changes in the value of the collateral invested upon liquidation of the collateral. Net earnings from securities lending are disclosed in the Statement of Operations.
Securities Transactions and Net Investment Income: Securities transactions are recorded on the trade date. Realized gains (losses) from investment and currency transactions are calculated on the specific identification method. Dividend income is recorded on the ex-date, or for certain foreign securities, when the Fund becomes aware of such dividends. Expenses are recorded on an accrual basis, which may require the use of certain estimates by management that may differ from actual. Net investment income or loss (other than class specific expenses and waivers, which are allocated as noted below) and unrealized and realized gains (losses) are allocated daily to each class of shares based upon the relative
| | | | |
PGIM Jennison International Opportunities Fund | | | 33 | |
Notes to Financial Statements (continued)
proportion of adjusted net assets of each class at the beginning of the day. Class specific expenses and waivers, where applicable, are charged to the respective share classes. Such class specific expenses and waivers include distribution fees and distribution fee waivers, shareholder servicing fees, transfer agent’s fees and expenses, registration fees and fee waivers and/or expense reimbursements, as applicable.
Taxes: It is the Fund’s policy to continue to meet the requirements of the Internal Revenue Code applicable to regulated investment companies and to distribute all of its taxable net investment income and capital gains, if any, to its shareholders. Therefore, no federal income tax provision is required. Withholding taxes on foreign dividends, interest and capital gains, if any, are recorded, net of reclaimable amounts, at the time the related income is earned.
Dividends and Distributions: The Fund expects to pay dividends from net investment income and distributions from net realized capital and currency gains, if any, annually. Dividends and distributions to shareholders, which are determined in accordance with federal income tax regulations and which may differ from GAAP, are recorded on the ex-date. Permanent book/tax differences relating to income and gain (loss) are reclassified between total distributable earnings (loss) and paid-in capital in excess of par, as appropriate.
Estimates: The preparation of financial statements requires management to make estimates and assumptions that affect the reported amounts and disclosures in the financial statements. Actual results could differ from those estimates.
3. Agreements
The RIC, on behalf of the Fund, has a management agreement with the Manager. Pursuant to this agreement, the Manager has responsibility for all investment advisory services and supervises the subadviser’s performance of such services.
The Manager has entered into a subadvisory agreement with Jennison Associates LLC (“Jennison” or the “subadviser”). The Manager pays for the services of Jennison.
The management fee paid to the Manager is accrued daily and payable monthly at an annual rate of 0.825% of the Fund’s average daily net assets up to and including $1 billion and 0.800% of such assets in excess of $1 billion. The effective management fee rate before any waivers and/or expense reimbursements was 0.806% for the year ended October 31, 2021.
The Manager has contractually agreed, through February 28, 2023, to limit net annual operating expenses (exclusive of distribution and service (12b-1) fees, shareholder service fee, and transfer agency expenses (including sub-transfer agency and networking fees)), of each class of shares to 0.84% of the Fund’s average daily net assets, and to limit transfer agency, shareholder servicing, sub-transfer agency, and blue sky fees, as applicable, to the extent that such fees cause the net annual operating expenses to exceed 1.34% of average daily net assets for Class R2 shares or 1.09% of average daily net assets for Class R4 shares. Additionally, the Manager has contractually agreed, through February 28, 2023, to limit total annual operating expenses after fee waivers and/or expense reimbursements to 1.09% of average daily net assets for Class A shares. Separately, the Manager has contractually agreed to waive and/or reimburse up to 0.06% of certain other expenses on an annualized basis, through February 28, 2023, to the extent that the total net annual operating expenses exceed 1.90% of average daily net assets for Class C shares, 1.48% of average daily net assets for Class R shares. 0.90% of average daily net assets for Class Z shares and 0.84% of average daily net assets for Class R6 shares. The contractual waivers and expense limitation above exclude interest, brokerage, taxes (such as income and foreign withholding taxes, stamp duty and deferred tax expenses), acquired fund fees and expenses, extraordinary expenses, and certain other Fund expenses such as dividend and interest expense and broker charges on short sales.
Where applicable, the Manager agrees to waive management fees or shared operating expenses on any share class to the same extent that it waives such expenses on any other share class. In addition, total annual operating expenses for Class R6 shares will not exceed total annual operating expenses for Class Z shares. Fees and/or expenses waived and/or reimbursed by the Manager may be recouped by the Manager within the same fiscal year during which such waiver and/or reimbursement is made if such recoupment can be realized without exceeding the expense limit in effect at the time of the recoupment for the fiscal year.
The RIC, on behalf of the Fund, has a distribution agreement with Prudential Investment Management Services LLC (“PIMS”), which acts as the distributor of the Class A, Class C, Class R, Class Z, Class R2, Class R4 and Class R6 shares of the Fund. The Fund compensates PIMS for distributing and servicing the Fund’s Class A, Class C, Class R and Class R2 shares, pursuant to the plans of distribution (the “Distribution Plans”), regardless of expenses actually incurred by PIMS.
Pursuant to the Distribution Plans, the Fund compensates PIMS for distribution related activities at an annual rate of up to 0.30%, 1%, 0.75% and 0.25% of the average daily net assets of the Class A, Class C, Class R and Class R2 shares, respectively. PIMS has contractually agreed through February 28, 2023 to limit such fees to 0.25% and 0.50% of the average daily net assets of the Class A and Class R shares, respectively.
The Fund has adopted a Shareholder Services Plan with respect to Class R2 and Class R4 shares. Under the terms of the Shareholder Services Plan, Class R2 and Class R4 shares are authorized to pay to Prudential Mutual Fund Services LLC (“PMFS”), its affiliates or
| | | | |
PGIM Jennison International Opportunities Fund | | | 35 | |
Notes to Financial Statements (continued)
third-party service providers, as compensation for services rendered to the shareholders of such Class R2 or Class R4 shares, a shareholder service fee at an annual rate of up to 0.10% of the average daily net assets attributable to Class R2 and Class R4 shares. The shareholder service fee is accrued daily and paid monthly, as applicable. The distribution fees are accrued daily and payable monthly. No distribution or service fees are paid to PIMS as distributor of the Class Z, Class R4 and Class R6 shares of the Fund.
For the year ended October 31, 2021, PIMS received $1,034,720 in front-end sales charges resulting from sales of Class A shares. Additionally, for the year ended October 31, 2021, PIMS received $3,797 and $3,373 in contingent deferred sales charges imposed upon redemptions by certain Class A and Class C shareholders, respectively. From these fees, PIMS paid such sales charges to broker-dealers, who in turn paid commissions to salespersons and incurred other distribution costs.
PGIM Investments, PIMS, PMFS and Jennison are indirect, wholly-owned subsidiaries of Prudential Financial, Inc. (“Prudential”).
4. Other Transactions with Affiliates
PMFS serves as the Fund’s transfer agent. Transfer agent’s fees and expenses in the Statement of Operations include certain out-of-pocket expenses paid to non-affiliates, where applicable.
The Fund may invest its overnight sweep cash in the PGIM Core Ultra Short Bond Fund (the “Core Fund”), and its securities lending cash collateral in the PGIM Institutional Money Market Fund (the “Money Market Fund”), each a fund of Prudential Investment Portfolios 2, registered under the 1940 Act and managed by PGIM Investments. PGIM Investments and/or its affiliates are paid fees or reimbursed for providing their services to the Core Fund and the Money Market Fund. In addition to the realized and unrealized gains on investments in the Core Fund and Money Market Fund, earnings from such investments are disclosed on the Statement of Operations as “Affiliated dividend income” and “Income from securities lending, net”, respectively.
The Fund may enter into certain securities purchase or sale transactions under Board approved Rule 17a-7 procedures. Rule 17a-7 is an exemptive rule under the 1940 Act, that subject to certain conditions, permits purchase and sale transactions among affiliated investment companies, or between an investment company and a person that is affiliated solely by reason of having a common (or affiliated) investment adviser, common directors/trustees, and/or common officers. For the year ended October 31, 2021, no 17a-7 transactions were entered into by the Fund.
5. Portfolio Securities
The aggregate cost of purchases and proceeds from sales of portfolio securities (excluding short-term investments and U.S. Government securities) for the year ended October 31, 2021, were $4,399,884,836 and $1,774,981,996, respectively.
A summary of the cost of purchases and proceeds from sales of shares of affiliated mutual funds for the year ended October 31, 2021, is presented as follows:
| | | | | | | | | | | | | | | | | | | | | | | | | | | | |
Value,
Beginning
of Year | | Cost of
Purchases | | | Proceeds
from Sales | | | Change in
Unrealized
Gain
(Loss) | | | Realized
Gain
(Loss) | | | Value,
End of Year | | | Shares,
End
of Year | | | Income | |
| | |
| Short-Term Investments - Affiliated Mutual Funds: | | | | | | | | | |
| | |
| PGIM Core Ultra Short Bond Fund (1)(wa) | | | | | | | | | |
| $103,564,166 | | $ | 1,850,166,542 | | | $ | 1,851,821,312 | | | $ | — | | | $ | — | | | $ | 101,909,396 | | | | 101,909,396 | | | $ | 120,364 | |
| | |
| PGIM Institutional Money Market Fund (1)(b)(wa) | | | | | | | | | |
| 39,573,646 | | | 686,217,588 | | | | 680,602,392 | | | | (75,652 | ) | | | 54,350 | | | | 45,167,540 | | | | 45,194,657 | | | | 37,328 | (2) |
| | | | | | | | | | | | | | | | | | | | | | | | | | | | |
| $143,137,812 | | $ | 2,536,384,130 | | | $ | 2,532,423,704 | | | $ | (75,652 | ) | | $ | 54,350 | | | $ | 147,076,936 | | | | | | | $ | 157,692 | |
| | | | | | | | | | | | | | | | | | | | | | | | | | | | |
| (1) | The Fund did not have any capital gain distributions during the reporting period. |
| (2) | The amount, or a portion thereof, represents the affiliated securities lending income shown on the Statement of Operations. |
| (b) | Represents security, or portion thereof, purchased with cash collateral received for securities on loan and includes dividend reinvestment. |
| (wa) | PGIM Investments LLC, the manager of the Fund, also serves as manager of the PGIM Core Ultra Short Bond Fund and PGIM Institutional Money Market Fund, if applicable. |
6. Distributions and Tax Information
Distributions to shareholders, which are determined in accordance with federal income tax regulations and which may differ from GAAP, are recorded on the ex-date. In order to present total distributable earnings (loss) and paid-in-capital in excess of par on the Statement of Assets and Liabilities that more closely represent their tax character, certain adjustments have been made to total distributable earnings (loss) and paid-in capital in excess of par. For the year ended October 31, 2021, the adjustments were to increase total distributable earnings and decrease paid-in capital in excess of par by $4,502,526 primarily due to a net operating loss. Net investment income, net realized gain (loss) on investments and foreign currency transactions and net assets were not affected by this change.
For the years ended October 31, 2021, and October 31, 2020, there were no distributions paid by the Fund.
As of October 31, 2021, the accumulated undistributed earnings on a tax basis was $5,535,994 of long-term capital gains.
| | | | |
PGIM Jennison International Opportunities Fund | | | 37 | |
Notes to Financial Statements (continued)
The United States federal income tax basis of the Fund’s investments and the net unrealized appreciation as of October 31, 2021 were as follows:
| | | | | | |
| Tax Basis | | Gross Unrealized Appreciation | | Gross Unrealized Depreciation | | Net Unrealized Appreciation |
| $4,487,793,246 | | $1,914,435,191 | | $(98,345,810) | | $1,816,089,381 |
The difference between GAAP basis and tax basis were primarily attributable to deferred losses on wash sales and corporate spin-offs.
The Fund utilized approximately $22,985,000 of its capital loss carryforward to offset net taxable gains realized in the fiscal year ended October 31, 2021.
The Fund elected to treat late year ordinary income losses of approximately $21,429,000 as having been incurred in the following fiscal year (October 31, 2022).
The Manager has analyzed the Fund’s tax positions taken on federal, state and local income tax returns for all open tax years and has concluded that no provision for income tax is required in the Fund’s financial statements for the current reporting period. Since tax authorities can examine previously filed tax returns, the Fund’s U.S. federal and state tax returns for each of the four fiscal years up to the most recent fiscal year ended October 31, 2021 are subject to such review.
7. Capital and Ownership
The Fund offers Class A, Class C, Class R, Class Z, Class R2, Class R4 and Class R6 shares. Class A shares are sold with a maximum front-end sales charge of 5.50%. Investors who purchase $1 million or more of Class A shares and sell these shares within 12 months of purchase are subject to a contingent deferred sales charge (“CDSC”) of 1%, although they are not subject to an initial sales charge. The Class A CDSC is waived for certain retirement and/or benefit plans. A special exchange privilege is also available for shareholders who qualified to purchase Class A shares at net asset value. Class C shares are sold with a CDSC of 1% on sales made within 12 months of purchase. Class C shares will automatically convert to Class A shares on a monthly basis approximately eight years (ten years prior to January 22, 2021) after purchase. Class R, Class Z, Class R2, Class R4 and Class R6 shares are not subject to any sales or redemption charges and are available exclusively for sale to a limited group of investors.
Under certain circumstances, an exchange may be made from specified share classes of the Fund to one or more other share classes of the Fund as presented in the table of transactions in shares of common stock, below.
The RIC is authorized to issue 10,225,000,000 shares of common stock, $0.00001 par value per share, 3,550,000,000 of which are designated as shares of the Fund. The authorized shares of the Fund are currently classified and designated as follows:
| | | | |
Class A | | | 150,000,000 | |
Class C | | | 100,000,000 | |
Class R | | | 100,000,000 | |
Class Z | | | 2,000,000,000 | |
Class R2 | | | 100,000,000 | |
Class R4 | | | 100,000,000 | |
Class R6 | | | 1,000,000,000 | |
As of October 31, 2021, Prudential, through its affiliated entities, including affiliated funds (if applicable), owned shares of the Fund as follows:
| | | | | | | | | | |
| | | Number of Shares | | Percentage of
Outstanding Shares |
Class C | | | | 180 | | | | | 0.1 | % |
Class R | | | | 9,387,683 | | | | | 100.0 | % |
Class Z | | | | 250 | | | | | 0.1 | % |
Class R2 | | | | 662 | | | | | 0.2 | % |
Class R4 | | | | 11,288 | | | | | 2.6 | % |
Class R6 | | | | 250 | | | | | 0.1 | % |
At the reporting period end, the number of shareholders holding greater than 5% of the Fund are as follows:
| | | | | | |
| Affiliated | | Unaffiliated |
Number of Shareholders | | Percentage of
Outstanding Shares | | Number of Shareholders | | Percentage of
Outstanding Shares |
1 | | 5.7% | | 5 | | 71.9% |
Transactions in shares of common stock were as follows:
| | | | | | | | |
Class A | | Shares | | | Amount | |
Year ended October 31, 2021: | | | | | | | | |
Shares sold | | | 3,295,095 | | | $ | 113,856,416 | |
Shares purchased | | | (645,468 | ) | | | (22,275,031 | ) |
| | | | | | | | |
Net increase (decrease) in shares outstanding before conversion | | | 2,649,627 | | | | 91,581,385 | |
Shares issued upon conversion from other share class(es) | | | 231,486 | | | | 8,009,475 | |
Shares purchased upon conversion into other share class(es) | | | (171,779 | ) | | | (6,016,914 | ) |
| | | | | | | | |
Net increase (decrease) in shares outstanding | | | 2,709,334 | | | $ | 93,573,946 | |
| | | | | | | | |
Year ended October 31, 2020: | | | | | | | | |
Shares sold | | | 1,695,560 | | | $ | 40,214,421 | |
Shares purchased | | | (420,360 | ) | | | (9,438,204 | ) |
| | | | | | | | |
Net increase (decrease) in shares outstanding before conversion | | | 1,275,200 | | | | 30,776,217 | |
Shares issued upon conversion from other share class(es) | | | 95,713 | | | | 2,224,143 | |
Shares purchased upon conversion into other share class(es) | | | (38,524 | ) | | | (927,812 | ) |
| | | | | | | | |
Net increase (decrease) in shares outstanding | | | 1,332,389 | | | $ | 32,072,548 | |
| | | | | | | | |
| | | | |
PGIM Jennison International Opportunities Fund | | | 39 | |
Notes to Financial Statements (continued)
| | | | | | | | |
Class C | | Shares | | | Amount | |
Year ended October 31, 2021: | | | | | | | | |
Shares sold | | | 671,538 | | | $ | 21,597,459 | |
Shares purchased | | | (72,681 | ) | | | (2,330,925 | ) |
| | | | | | | | |
Net increase (decrease) in shares outstanding before conversion | | | 598,857 | | | | 19,266,534 | |
Shares purchased upon conversion into other share class(es) | | | (100,679 | ) | | | (3,132,283 | ) |
| | | | | | | | |
Net increase (decrease) in shares outstanding | | | 498,178 | | | $ | 16,134,251 | |
| | | | | | | | |
Year ended October 31, 2020: | | | | | | | | |
Shares sold | | | 410,402 | | | $ | 9,190,379 | |
Shares purchased | | | (62,287 | ) | | | (1,217,976 | ) |
| | | | | | | | |
Net increase (decrease) in shares outstanding before conversion | | | 348,115 | | | | 7,972,403 | |
Shares purchased upon conversion into other share class(es) | | | (13,404 | ) | | | (290,342 | ) |
| | | | | | | | |
Net increase (decrease) in shares outstanding | | | 334,711 | | | $ | 7,682,061 | |
| | | | | | | | |
Class R | | | | | | |
Year ended October 31, 2021: | | | | | | | | |
Shares sold | | | 757,793 | | | $ | 24,410,460 | |
Shares purchased | | | (1,774,362 | ) | | | (60,549,305 | ) |
| | | | | | | | |
Net increase (decrease) in shares outstanding | | | (1,016,569 | ) | | $ | (36,138,845 | ) |
| | | | | | | | |
Year ended October 31, 2020: | | | | | | | | |
Shares sold | | | 378,910 | | | $ | 7,835,637 | |
Shares purchased | | | (4,361,022 | ) | | | (97,013,298 | ) |
| | | | | | | | |
Net increase (decrease) in shares outstanding | | | (3,982,112 | ) | | $ | (89,177,661 | ) |
| | | | | | | | |
Class Z | | | | | | |
Year ended October 31, 2021: | | | | | | | | |
Shares sold | | | 65,487,151 | | | $ | 2,317,934,026 | |
Shares purchased | | | (20,037,303 | ) | | | (704,435,367 | ) |
| | | | | | | | |
Net increase (decrease) in shares outstanding before conversion | | | 45,449,848 | | | | 1,613,498,659 | |
Shares issued upon conversion from other share class(es) | | | 246,910 | | | | 8,620,461 | |
Shares purchased upon conversion into other share class(es) | | | (4,617,431 | ) | | | (161,788,669 | ) |
| | | | | | | | |
Net increase (decrease) in shares outstanding | | | 41,079,327 | | | $ | 1,460,330,451 | |
| | | | | | | | |
Year ended October 31, 2020: | | | | | | | | |
Shares sold | | | 47,468,230 | | | $ | 1,144,158,328 | |
Shares purchased | | | (10,173,878 | ) | | | (246,291,300 | ) |
| | | | | | | | |
Net increase (decrease) in shares outstanding before conversion | | | 37,294,352 | | | | 897,867,028 | |
Shares issued upon conversion from other share class(es) | | | 44,259 | | | | 1,069,933 | |
Shares purchased upon conversion into other share class(es) | | | (99,914 | ) | | | (2,358,141 | ) |
| | | | | | | | |
Net increase (decrease) in shares outstanding | | | 37,238,697 | | | $ | 896,578,820 | |
| | | | | | | | |
| | | | | | | | |
Class R2 | | Shares | | | Amount | |
Year ended October 31, 2021: | | | | | | | | |
Shares sold | | | 249,628 | | | $ | 8,603,079 | |
Shares purchased | | | (73,779 | ) | | | (2,605,355 | ) |
| | | | | | | | |
Net increase (decrease) in shares outstanding before conversion | | | 175,849 | | | | 5,997,724 | |
Shares purchased upon conversion into other share class(es) | | | (2,016 | ) | | | (73,177 | ) |
| | | | | | | | |
Net increase (decrease) in shares outstanding | | | 173,833 | | | $ | 5,924,547 | |
| | | | | | | | |
Year ended October 31, 2020: | | | | | | | | |
Shares sold | | | 163,996 | | | $ | 4,301,050 | |
Shares purchased | | | (11,299 | ) | | | (312,729 | ) |
| | | | | | | | |
Net increase (decrease) in shares outstanding | | | 152,697 | | | $ | 3,988,321 | |
| | | | | | | | |
Class R4 | | | | | | |
Year ended October 31, 2021: | | | | | | | | |
Shares sold | | | 720,254 | | | $ | 24,255,406 | |
Shares purchased | | | (334,901 | ) | | | (11,278,535 | ) |
| | | | | | | | |
Net increase (decrease) in shares outstanding | | | 385,353 | | | $ | 12,976,871 | |
| | | | | | | | |
Year ended October 31, 2020: | | | | | | | | |
Shares sold | | | 11,923 | | | $ | 287,951 | |
Shares purchased | | | (7,067 | ) | | | (150,270 | ) |
| | | | | | | | |
Net increase (decrease) in shares outstanding | | | 4,856 | | | $ | 137,681 | |
| | | | | | | | |
Class R6 | | | | | | |
Year ended October 31, 2021: | | | | | | | | |
Shares sold | | | 35,440,308 | | | $ | 1,230,472,986 | |
Shares purchased | | | (8,950,166 | ) | | | (318,212,193 | ) |
| | | | | | | | |
Net increase (decrease) in shares outstanding before conversion | | | 26,490,142 | | | | 912,260,793 | |
Shares issued upon conversion from other share class(es) | | | 4,411,797 | | | | 154,824,965 | |
Shares purchased upon conversion into other share class(es) | | | (12,007 | ) | | | (443,858 | ) |
| | | | | | | | |
Net increase (decrease) in shares outstanding | | | 30,889,932 | | | $ | 1,066,641,900 | |
| | | | | | | | |
Year ended October 31, 2020: | | | | | | | | |
Shares sold | | | 20,878,982 | | | $ | 521,343,502 | |
Shares purchased | | | (2,482,915 | ) | | | (60,609,646 | ) |
| | | | | | | | |
Net increase (decrease) in shares outstanding before conversion | | | 18,396,067 | | | | 460,733,856 | |
Shares issued upon conversion from other share class(es) | | | 13,891 | | | | 331,285 | |
Shares purchased upon conversion into other share class(es) | | | (2,198 | ) | | | (49,066 | ) |
| | | | | | | | |
Net increase (decrease) in shares outstanding | | | 18,407,760 | | | $ | 461,016,075 | |
| | | | | | | | |
8. Borrowings
The RIC, on behalf of the Fund, along with other affiliated registered investment companies (the “Participating Funds”), is a party to a Syndicated Credit Agreement (“SCA”) with a group of banks. The purpose of the SCA is to provide an alternative source of temporary funding for capital share redemptions. The table below provides details of the current SCA in effect at the reporting period-end as well as the prior SCA.
| | | | |
| | | Current SCA | | Prior SCA |
Term of Commitment | | 10/1/2021 – 9/29/2022 | | 10/2/2020 – 9/30/2021 |
| | | |
Total Commitment | | $ 1,200,000,000 | | $ 1,200,000,000 |
| | | |
| Annualized Commitment Fee on the Unused Portion of the SCA | | 0.15% | | 0.15% |
| | | | |
PGIM Jennison International Opportunities Fund | | | 41 | |
Notes to Financial Statements (continued)
| | | | |
| | | Current SCA | | Prior SCA |
| Annualized Interest Rate on Borrowings | | 1.20% plus the higher of (1) the effective federal funds rate, (2) the one-month LIBOR rate or (3) zero percent | | 1.30% plus the higher of (1) the effective federal funds rate, (2) the one-month LIBOR rate or (3) zero percent |
Certain affiliated registered investment companies that are parties to the SCA include portfolios that are subject to a predetermined mathematical formula used to manage certain benefit guarantees offered under variable annuity contracts. The formula may result in large scale asset flows into and out of these portfolios. Consequently, these portfolios may be more likely to utilize the SCA for purposes of funding redemptions. It may be possible for those portfolios to fully exhaust the committed amount of the SCA, thereby requiring the Manager to allocate available funding per a Board-approved methodology designed to treat the Participating Funds in the SCA equitably.
The Fund did not utilize the SCA during the year ended October 31, 2021.
9. Risks of Investing in the Fund
The Fund’s risks include, but are not limited to, some or all of the risks discussed below. For further information on the Fund’s risks, please refer to the Fund’s Prospectus and Statement of Additional Information.
Country Risk: Changes in the business environment may adversely affect operating profits or the value of assets in a specific country. For example, financial factors such as currency controls, devaluation or regulatory changes or stability factors such as mass riots, civil war and other potential events may contribute to companies’ operational risks.
Currency Risk: The Fund’s net asset value could decline as a result of changes in exchange rates, which could adversely affect the Fund’s investments in currencies, or in securities that trade in, and receive revenues related to, currencies, or in derivatives that provide exposure to currencies. Certain foreign countries may impose restrictions on the ability of issuers of foreign securities to make payment of principal and interest or dividends to investors located outside the country, due to blockage of foreign currency exchanges or otherwise.
Economic and Market Events Risk: Events in the U.S. and global financial markets, including actions taken by the U.S. Federal Reserve or foreign central banks to stimulate or stabilize economic growth or the functioning of the securities markets, may at times result in unusually high market volatility, which could negatively impact performance. Relatively reduced liquidity in credit and fixed income markets could adversely affect issuers worldwide.
Emerging Markets Risk: The risks of foreign investments are greater for investments in or exposed to emerging markets. Emerging market countries typically have economic and political systems that are less fully developed, and can be expected to be less stable, than those of more developed countries. For example, the economies of such countries can be subject to rapid and unpredictable rates of inflation or deflation. Low trading volumes may result in a lack of liquidity and price volatility. Emerging market countries may have policies that restrict investment by non-U.S. investors, or that prevent non-U.S. investors from withdrawing their money at will.
The Fund may invest in some emerging markets that subject it to risks such as those associated with illiquidity, custody of assets, different settlement and clearance procedures and asserting legal title under a developing legal and regulatory regime to a greater degree than in developed markets or even in other emerging markets.
Equity and Equity-Related Securities Risk: Equity and equity-related securities may be subject to changes in value, and their values may be more volatile than those of other asset classes. In addition to an individual security losing value, the value of the equity markets or a sector in which the Fund invests could go down. Different parts of a market can react differently to adverse issuer, market, regulatory, political and economic developments.
Foreign Securities Risk: Investments in securities of non-U.S. issuers (including those denominated in U.S. dollars) may involve more risk than investing in securities of U.S. issuers. Foreign political, economic and legal systems, especially those in developing and emerging market countries, may be less stable and more volatile than in the United States. Foreign legal systems generally have fewer regulatory requirements than the U.S. legal system, particularly those of emerging markets. In general, less information is publicly available with respect to non-U.S. companies than U.S. companies. Non-U.S. companies generally are not subject to the same accounting, auditing, and financial reporting standards as are U.S. companies. Additionally, the changing value of foreign currencies and changes in exchange rates could also affect the value of the assets the Fund holds and the Fund’s performance. Certain foreign countries may impose restrictions on the ability of issuers of foreign securities to make payment of principal and interest or dividends to investors located outside the country, due to blockage of foreign currency exchanges or otherwise.
Investments in emerging markets are subject to greater volatility and price declines.
In addition, the Fund’s investments in non-U.S. securities may be subject to the risks of nationalization or expropriation of assets, imposition of currency exchange controls or restrictions on the repatriation of non-U.S. currency, confiscatory taxation and adverse diplomatic developments. Special U.S. tax considerations may apply.
Geographic Concentration Risk: The Fund’s performance may be closely tied to the market, economic, political, regulatory or other conditions in the countries or regions in which the Fund invests. This can result in more pronounced risks based upon conditions that impact one or more countries or regions more or less than other countries or regions.
| | | | |
PGIM Jennison International Opportunities Fund | | | 43 | |
Notes to Financial Statements (continued)
Growth Style Risk: The Fund’s growth style may subject the Fund to above-average fluctuations as a result of seeking higher than average capital growth. Historically, growth stocks have performed best during later stages of economic expansion and value stocks have performed best during periods of economic recovery. Since the Fund follows a growth investment style, there is the risk that the growth investment style may be out of favor for long periods of time. At times when the style is out of favor, the Fund may underperform the market in general, its benchmark and other mutual funds.
Increase in Expenses Risk: Your actual cost of investing in the Fund may be higher than the expenses shown in the expense table in the Fund’s prospectus for a variety of reasons. For example, expense ratios may be higher than those shown if average net assets decrease. Net assets are more likely to decrease and Fund expense ratios are more likely to increase when markets are volatile. Active and frequent trading of Fund securities can increase expenses.
Investments in China Risk: Investments in China subject the Fund to risks specific to China and may make it more volatile than other funds. Over the last few decades, the Chinese government has undertaken reform of economic and market practices and has expanded the sphere of private ownership of property in China. However, Chinese markets generally continue to experience inefficiency, volatility and pricing anomalies resulting from governmental influence, a lack of publicly available information and/or political and social instability. Internal social unrest or confrontations with other neighboring countries, including military conflicts in response to such events, may also disrupt economic development in China and result in a greater risk of currency fluctuations, currency non-convertibility, interest rate fluctuations and higher rates of inflation.
China has experienced security concerns, such as terrorism and strained international relations. Incidents involving China’s or the region’s security may cause uncertainty in Chinese markets and may adversely affect the Chinese economy and the Fund’s investments. Export growth continues to be a major driver of China’s rapid economic growth. Reduction in spending on Chinese products and services, institution of additional tariffs or other trade barriers, including as a result of heightened trade tensions between China and the U.S., or a downturn in any of the economies of China’s key trading partners may have an adverse impact on the Chinese economy or the Fund. For example, a series of executive orders issued between November 2020 and June 2021 prohibit the Fund from investing in certain companies identified by the U.S. government as “Chinese Military Industrial Complex Companies.” The restrictions in these executive orders may force the subadviser to sell certain positions and may restrict the Fund from future investments the subadviser deems otherwise attractive.
Chinese companies, including Chinese companies that are listed on U.S. exchanges, are not subject to the same degree of regulatory requirements, accounting standards or auditor oversight as companies in more developed countries, and as a result, information about the Chinese securities in which the Fund invests may be less reliable or complete. There may be significant obstacles to obtaining information necessary for investigations into or litigation against Chinese companies and shareholders may have limited legal remedies.
Large Shareholder and Large Scale Redemption Risk: Certain individuals, accounts, funds (including funds affiliated with the Manager) or institutions, including the Manager and its affiliates, may from time to time own or control a substantial amount of the Fund’s shares. There is no requirement that these entities maintain their investment in the Fund. There is a risk that such large shareholders or that the Fund’s shareholders generally may redeem all or a substantial portion of their investments in the Fund in a short period of time, which could have a significant negative impact on the Fund’s NAV, liquidity, and brokerage costs. Large redemptions could also result in tax consequences to shareholders and impact the Fund’s ability to implement its investment strategy. The Fund’s ability to pursue its investment objective after one or more large scale redemptions may be impaired and, as a result, the Fund may invest a larger portion of its assets in cash or cash equivalents.
Liquidity Risk: Liquidity risk is the risk that the Fund could not meet requests to redeem shares issued by the Fund without significant dilution of remaining investors’ interests in the Fund. The Fund may invest in instruments that trade in lower volumes and are more illiquid than other investments. If the Fund is forced to sell these investments to pay redemption proceeds or for other reasons, the Fund may lose money. In addition, when there is no willing buyer and investments cannot be readily sold at the desired time or price, the Fund may have to accept a lower price or may not be able to sell the instrument at all. An inability to sell a portfolio position can adversely affect the Fund’s value or prevent the Fund from being able to take advantage of other investment opportunities.
Management Risk: The value of your investment may decrease if judgments by the subadviser about the attractiveness, value or market trends affecting a particular security, industry or sector or about market movements are incorrect.
Market Capitalization Risk: The Fund may invest in companies of any market capitalization. Generally, the stock prices of small- and mid-cap companies are less stable than the prices of large-cap stocks and may present greater risks. Large capitalization companies as a group could fall out of favor with the market, causing the Fund to underperform compared to investments that focus on smaller capitalized companies.
Market Disruption and Geopolitical Risks: International wars or conflicts and geopolitical developments in foreign countries, along with instability in regions such as Asia, Eastern Europe, and the Middle East, possible terrorist attacks in the United States or around the world, public health epidemics such as the outbreak of infectious diseases like the outbreak of COVID-19 globally in 2020 or the 2014–2016 outbreak in West Africa of the Ebola virus, and other similar events could adversely affect the U.S. and foreign financial markets,
| | | | |
PGIM Jennison International Opportunities Fund | | | 45 | |
Notes to Financial Statements (continued)
including increases in market volatility, reduced liquidity in the securities markets and government intervention, and may cause further long-term economic uncertainties in the United States and worldwide generally. The coronavirus pandemic and the related governmental and public responses have had and may continue to have an impact on the Fund’s investments and net asset value and have led and may continue to lead to increased market volatility and the potential for illiquidity in certain classes of securities and sectors of the market. Preventative or protective actions that governments may take in respect of pandemic or epidemic diseases may result in periods of business disruption, business closures, inability to obtain raw materials, supplies and component parts, and reduced or disrupted operations for the issuers in which the Fund invests. Government intervention in markets may impact interest rates, market volatility and security pricing. The occurrence, reoccurrence and pendency of such diseases could adversely affect the economies (including through changes in business activity and increased unemployment) and financial markets either in specific countries or worldwide.
Market Risk: Securities markets may be volatile and the market prices of the Fund’s securities may decline. Securities fluctuate in price based on changes in an issuer’s financial condition and overall market and economic conditions. If the market prices of the securities owned by the Fund fall, the value of your investment in the Fund will decline.
10. Recent Regulatory Developments
On December 3, 2020, the SEC announced that it voted to adopt a new rule that establishes an updated regulatory framework for fund valuation practices (the “Rule”). The Rule, in part, provides (i) a framework for determining fair value in good faith and (ii) provides for a fund Board’s assignment of its responsibility for the execution of valuation-related activities to a fund’s investment adviser. Further, the SEC is rescinding previously issued guidance on related issues. The Rule took effect on March 8, 2021, with a compliance date of September 8, 2022. Management is currently evaluating the Rule and its impact to the Fund.
Report of Independent Registered Public Accounting Firm
To the Board of Directors of Prudential World Fund, Inc. and Shareholders of PGIM Jennison International Opportunities Fund
Opinion on the Financial Statements
We have audited the accompanying statement of assets and liabilities, including the schedule of investments, of PGIM Jennison International Opportunities Fund (one of the funds constituting Prudential World Fund, Inc., referred to hereafter as the “Fund”) as of October 31, 2021, the related statement of operations for the year ended October 31, 2021, the statement of changes in net assets for each of the two years in the period ended October 31, 2021, including the related notes, and financial highlights for each of the two years in the period ended October 31, 2021 (collectively referred to as the “financial statements”). In our opinion, the financial statements present fairly, in all material respects, the financial position of the Fund as of October 31, 2021, the results of its operations for the year then ended, and the changes in its net assets and the financial highlights for each of the two years in the period ended October 31, 2021 in conformity with accounting principles generally accepted in the United States of America.
The financial statements of the Fund as of and for the year ended October 31, 2019 and the financial highlights for each of the periods ended on or prior to October 31, 2019 (not presented herein, other than the financial highlights) were audited by other auditors whose report dated December 16, 2019 expressed an unqualified opinion on those financial statements and financial highlights.
Basis for Opinion
These financial statements are the responsibility of the Fund’s management. Our responsibility is to express an opinion on the Fund’s financial statements based on our audits. We are a public accounting firm registered with the Public Company Accounting Oversight Board (United States) (PCAOB) and are required to be independent with respect to the Fund in accordance with the U.S. federal securities laws and the applicable rules and regulations of the Securities and Exchange Commission and the PCAOB.
We conducted our audits of these financial statements in accordance with the standards of the PCAOB. Those standards require that we plan and perform the audit to obtain reasonable assurance about whether the financial statements are free of material misstatement, whether due to error or fraud.
Our audits included performing procedures to assess the risks of material misstatement of the financial statements, whether due to error or fraud, and performing procedures that respond to those risks. Such procedures included examining, on a test basis, evidence regarding the amounts and disclosures in the financial statements. Our audits also included evaluating the accounting principles used and significant estimates made by management, as well as evaluating the overall presentation of the financial statements. Our procedures included confirmation of securities owned as of October 31, 2021 by correspondence with the custodian, transfer agent and brokers; when replies were not received from brokers, we performed other auditing procedures. We believe that our audits provide a reasonable basis for our opinion.
/s/PricewaterhouseCoopers LLP
New York, New York
December 16, 2021
We have served as the auditor of one or more investment companies in the PGIM Retail Funds complex since 2020.
| | | | |
PGIM Jennison International Opportunities Fund | | | 47 | |
INFORMATION ABOUT BOARD MEMBERS AND OFFICERS (unaudited)
Information about Board Members and Officers of the Fund is set forth below. Board Members who are not deemed to be “interested persons” of the Fund, as defined in the 1940 Act, are referred to as “Independent Board Members.” Board Members who are deemed to be “interested persons” of the Fund are referred to as “Interested Board Members.” The Board Members are responsible for the overall supervision of the operations of the Fund and perform the various duties imposed on the directors of investment companies by the 1940 Act. The Board in turn elects the Officers, who are responsible for administering the day-to-day operations of the Fund.
| | | | | | |
| |
| Independent Board Members |
| | | | |
Name Year of Birth Position(s) Portfolios Overseen | | Principal Occupation(s) During Past Five Years | | Other Directorships Held During Past Five Years | | Length of
Board Service |
| | | | |
Ellen S. Alberding 1958 Board Member Portfolios Overseen: 95 | | President and Board Member, The Joyce Foundation (charitable foundation) (since 2002); formerly Vice Chair, City Colleges of Chicago (community college system) (2011-2015); Trustee, National Park Foundation (charitable foundation for national park system) (2009-2018); Trustee, Economic Club of Chicago (2009-2016); Trustee, Loyola University (since 2018). | | None. | | Since September 2013 |
| | | | |
Kevin J. Bannon 1952 Board Member Portfolios Overseen: 95 | | Retired; formerly Managing Director (April 2008-May 2015) and Chief Investment Officer (October 2008-November 2013) of Highmount Capital LLC (registered investment adviser); formerly Executive Vice President and Chief Investment Officer (April 1993-August 2007) of Bank of New York Company; President (May 2003-May 2007) of BNY Hamilton Family of Mutual Funds. | | Director of Urstadt Biddle Properties (equity real estate investment trust) (since September 2008). | | Since July 2008 |
PGIM Jennison International Opportunities Fund
| | | | | | |
| |
Independent Board Members |
| | | | |
Name Year of Birth Position(s) Portfolios Overseen | | Principal Occupation(s) During Past Five Years | | Other Directorships Held During Past Five Years | | Length of Board Service |
| | | | |
Linda W. Bynoe 1952 Board Member Portfolios Overseen: 92 | | President and Chief Executive Officer (since March 1995) and formerly Chief Operating Officer (December 1989-February 1995) of Telemat Limited LLC (formerly Telemat Ltd) (management consulting); formerly Vice President (January 1985-June 1989) at Morgan Stanley & Co. (broker-dealer). | | Trustee of Equity Residential (residential real estate) (since December 2009); Director of Northern Trust Corporation (financial services) (since April 2006); formerly Director of Anixter International, Inc. (communication products distributor) (January 2006-June 2020). | | Since March 2005 |
| | | | |
Barry H. Evans 1960 Board Member Portfolios Overseen: 94 | | Retired; formerly President (2005-2016), Global Chief Operating Officer (2014-2016), Chief Investment Officer - Global Head of Fixed Income (1998-2014), and various portfolio manager roles (1986-2006), Manulife Asset Management (asset management). | | Formerly Director, Manulife Trust Company (2011-2018); formerly Director, Manulife Asset Management Limited (2015-2017); formerly Chairman of the Board of Directors of Manulife Asset Management U.S. (2005-2016); formerly Chairman of the Board, Declaration Investment Management and Research (2008-2016). | | Since September 2017 |
| | | | |
Keith F. Hartstein 1956 Board Member & Independent Chair Portfolios Overseen: 95 | | Retired; Executive Committee of the Independent Directors Council (IDC) Board of Governors (since October 2019); Member (since November 2014) of the Governing Council of the IDC (organization of independent mutual fund directors); formerly President and Chief Executive Officer (2005-2012), Senior Vice President (2004-2005), Senior Vice President of Sales and Marketing (1997-2004), and various executive management positions (1990-1997), John Hancock Funds, LLC (asset management); Chairman, Investment Company Institute’s Sales Force Marketing Committee (2003-2008). | | None. | | Since September 2013 |
Visit our website at pgim.com/investments
| | | | | | |
| | | |
| Independent Board Members | | | | |
| | | | |
Name Year of Birth Position(s) Portfolios Overseen | | Principal Occupation(s) During Past Five Years | | Other Directorships Held During Past Five Years | | Length of
Board Service |
| | | | |
Laurie Simon Hodrick 1962 Board Member Portfolios Overseen: 91 | | A. Barton Hepburn Professor Emerita of Economics in the Faculty of Business, Columbia Business School (since 2018); Visiting Fellow at the Hoover Institution, Stanford University (since 2015); Sole Member, ReidCourt LLC (since 2008) (a consulting firm); formerly Visiting Professor of Law, Stanford Law School (2015-2021); formerly A. Barton Hepburn Professor of Economics in the Faculty of Business, Columbia Business School (1996-2017); formerly Managing Director, Global Head of Alternative Investment Strategies, Deutsche Bank (2006-2008). | | Independent Director, Roku (since December 2020) (communication services); formerly Independent Director, Synnex Corporation (2019-2021) (information technology); formerly Independent Director, Kabbage, Inc. (2018-2020) (financial services); formerly Independent Director, Corporate Capital Trust (2017-2018) (a business development company). | | Since September 2017 |
| | | | |
Brian K. Reid 1961 Board Member Portfolios Overseen: 94 | | Retired; formerly Chief Economist for the Investment Company Institute (ICI) (2005-2017); formerly Senior Economist and Director of Industry and Financial Analysis at the ICI (1998-2004); formerly Senior Economist, Industry and Financial Analysis at the ICI (1996-1998); formerly Staff Economist at the Federal Reserve Board (1989-1996); Director, ICI Mutual Insurance Company (2012-2017). | | None. | | Since March 2018 |
PGIM Jennison International Opportunities Fund
| | | | | | |
| | | |
| Independent Board Members | | | | |
| | | | |
Name Year of Birth Position(s) Portfolios Overseen | | Principal Occupation(s) During Past Five Years | | Other Directorships Held During Past Five Years | | Length of Board Service |
| | | | |
Grace C. Torres 1959 Board Member Portfolios Overseen: 94 | | Retired; formerly Treasurer and Principal Financial and Accounting Officer of the PGIM Funds, Target Funds, Advanced Series Trust, Prudential Variable Contract Accounts and The Prudential Series Fund (1998-June 2014); Assistant Treasurer (March 1999-June 2014) and Senior Vice President (September 1999-June 2014) of PGIM Investments LLC; Assistant Treasurer (May 2003-June 2014) and Vice President (June 2005-June 2014) of AST Investment Services, Inc.; Senior Vice President and Assistant Treasurer (May 2003-June 2014) of Prudential Annuities Advisory Services, Inc. | | Director (since January 2018) of OceanFirst Financial Corp. and OceanFirst Bank; formerly Director (July 2015-January 2018) of Sun Bancorp, Inc. N.A. and Sun National Bank. | | Since November 2014 |
| | | | | | |
| | | |
| Interested Board Members | | | | |
| | | | |
Name Year of Birth Position(s) Portfolios Overseen | | Principal Occupation(s) During Past Five Years | | Other Directorships Held During Past Five Years | | Length of Board Service |
| | | | |
Stuart S. Parker 1962 Board Member & President Portfolios Overseen: 94 | | President, Chief Executive Officer, Chief Operating Officer and Officer in Charge of PGIM Investments LLC (formerly known as Prudential Investments LLC) (since January 2012); formerly Executive Vice President of Jennison Associates LLC and Head of Retail Distribution of PGIM Investments LLC (June 2005-December 2011); Investment Company Institute - Board of Governors (since May 2012). | | None. | | Since January 2012 |
Visit our website at pgim.com/investments
| | | | | | |
| | | |
| Interested Board Members | | | | |
| | | | |
Name Year of Birth Position(s) Portfolios Overseen | | Principal Occupation(s) During Past Five Years | | Other Directorships Held During Past Five Years | | Length of Board Service |
| | | | |
Scott E. Benjamin 1973 Board Member & Vice President Portfolios Overseen: 95 | | Executive Vice President (since May 2009) of PGIM Investments LLC; Vice President (since June 2012) of Prudential Investment Management Services LLC; Executive Vice President (since September 2009) of AST Investment Services, Inc.; Senior Vice President of Product Development and Marketing, PGIM Investments (since February 2006); formerly Vice President of Product Development and Product Management, PGIM Investments LLC (2003-2006). | | None. | | Since March 2010 |
(1) The year that each Board Member joined the Board is as follows:
Ellen S. Alberding, 2013; Kevin J. Bannon, 2008; Linda W. Bynoe, 2005; Barry H. Evans, 2017; Keith F. Hartstein, 2013; Laurie Simon Hodrick, 2017; Michael S. Hyland, 2008; Richard A. Redeker, 1993; Stephen G. Stoneburn, 2003; Stuart S. Parker, Board Member since 2012 and President since 2012; Scott E. Benjamin, Board Member since 2010 and Vice President since 2009; Grace C. Torres, 2014.
| | | | |
| | | |
| Fund Officers(a) | | | | |
| | | |
Name Year of Birth Fund Position | | Principal Occupation(s) During Past Five Years | | Length of
Service as Fund
Officer |
| | | |
Claudia DiGiacomo 1974 Chief Legal Officer | | Chief Legal Officer, Executive Vice President and Secretary of PGIM Investments LLC (since August 2020); Chief Legal Officer of Prudential Mutual Fund Services LLC (since August 2020); Chief Legal Officer of PIFM Holdco, LLC (since August 2020); Vice President and Corporate Counsel (since January 2005) of Prudential; and Corporate Counsel of AST Investment Services, Inc. (since August 2020); formerly Vice President and Assistant Secretary of PGIM Investments LLC (2005-2020); formerly Associate at Sidley Austin Brown & Wood LLP (1999-2004). | | Since December 2005 |
PGIM Jennison International Opportunities Fund
| | | | |
| | | |
| Fund Officers(a) | | | | |
| | | |
Name Year of Birth Fund Position | | Principal Occupation(s) During Past Five Years | | Length of Service as Fund Officer |
| | | |
Dino Capasso 1974 Chief Compliance Officer | | Chief Compliance Officer (since July 2019) of PGIM Investments LLC; Chief Compliance Officer (since July 2019) of the PGIM Funds, Target Funds, Advanced Series Trust, The Prudential Series Fund, Prudential’s Gibraltar Fund, Inc., PGIM Global High Yield Fund, Inc., PGIM High Yield Bond Fund, Inc., and PGIM Short Duration High Yield Opportunities Fund; Vice President and Deputy Chief Compliance Officer (June 2017-2019) of PGIM Investments LLC; formerly Senior Vice President and Senior Counsel (January 2016-June 2017), and Vice President and Counsel (February 2012-December 2015) of Pacific Investment Management Company LLC. | | Since July 2019 |
| | | |
Andrew R. French 1962 Secretary | | Vice President (since December 2018) of PGIM Investments LLC; formerly Vice President and Corporate Counsel (2010-2018) of Prudential; formerly Director and Corporate Counsel (2006-2010) of Prudential; Vice President and Assistant Secretary (since January 2007) of PGIM Investments LLC; Vice President and Assistant Secretary (since January 2007) of Prudential Mutual Fund Services LLC. | | Since October 2006 |
| | | |
Diana N. Huffman 1982 Assistant Secretary | | Vice President and Corporate Counsel (since September 2015) of Prudential; Vice President and Assistant Secretary (since August 2020) of PGIM Investments LLC; formerly Associate at Willkie Farr & Gallagher LLP (2009-2015). | | Since March 2019 |
| | | |
Melissa Gonzalez 1980 Assistant Secretary | | Vice President and Corporate Counsel (since September 2018) of Prudential; Vice President and Assistant Secretary (since August 2020) of PGIM Investments LLC; formerly Director and Corporate Counsel (March 2014-September 2018) of Prudential. | | Since March 2020 |
| | | |
Patrick E. McGuinness 1986 Assistant Secretary | | Vice President and Assistant Secretary (since August 2020) of PGIM Investments LLC; Director and Corporate Counsel (since February 2017) of Prudential; and Corporate Counsel (2012-2017) of IIL, Inc. | | Since June 2020 |
| | | |
Debra Rubano 1975 Assistant Secretary | | Vice President and Corporate Counsel (since November 2020) of Prudential; formerly Director and Senior Counsel of Allianz Global Investors U.S. Holdings LLC (2010-2020) and Assistant Secretary of numerous funds in the Allianz fund complex (2015-2020). | | Since December 2020 |
| | | |
Kelly A. Coyne 1968 Assistant Secretary | | Director, Investment Operations of Prudential Mutual Fund Services LLC (since 2010). | | Since March 2015 |
Visit our website at pgim.com/investments
| | | | |
| | | |
| Fund Officers(a) | | | | |
| | | |
Name Year of Birth Fund Position | | Principal Occupation(s) During Past Five Years | | Length of Service as Fund Officer |
| | | |
Christian J. Kelly 1975 Treasurer and Principal Financial and Accounting Officer | | Vice President, Head of Fund Administration of PGIM Investments LLC (since November 2018); formerly Director of Fund Administration of Lord Abbett & Co. LLC (2009-2018), Treasurer and Principal Accounting Officer of the Lord Abbett Family of Funds (2017-2018); Director of Accounting, Avenue Capital Group (2008-2009); Senior Manager, Investment Management Practice of Deloitte & Touche LLP (1998-2007). | | Since January 2019 |
| | | |
Lana Lomuti 1967 Assistant Treasurer | | Vice President (since 2007) and Director (2005-2007), within PGIM Investments Fund Administration; formerly Assistant Treasurer (December 2007-February 2014) of The Greater China Fund, Inc. | | Since April 2014 |
| | | |
Russ Shupak 1973 Assistant Treasurer | | Vice President (since 2017) and Director (2013-2017), within PGIM Investments Fund Administration. | | Since September 2019 |
| | | |
Deborah Conway 1969 Assistant Treasurer | | Vice President (since 2017) and Director (2007-2017), within PGIM Investments Fund Administration. | | Since September 2019 |
| | | |
Elyse M. McLaughlin 1974 Assistant Treasurer | | Vice President (since 2017) and Director (2011-2017), within PGIM Investments Fund Administration. | | Since September 2019 |
| | | |
Jonathan Corbett 1983 Anti-Money Laundering Compliance Officer | | Vice President, Corporate Compliance, Global Compliance Programs and Compliance Risk Management (since August 2019) of Prudential; formerly Vice President and Head of Key Risk Areas Compliance (March 2016 to July 2019), Chief Privacy Officer (March 2016 to July 2019) and Head of Global Financial Crimes Unit (April 2014 to March 2016) at MetLife. | | Since October 2021 |
(a) Excludes Mr. Parker and Mr. Benjamin, interested Board Members who also serve as President and Vice President, respectively.
Explanatory Notes to Tables:
| ∎ | | Board Members are deemed to be “Interested,” as defined in the 1940 Act, by reason of their affiliation with PGIM Investments LLC and/or an affiliate of PGIM Investments LLC. |
| ∎ | | Unless otherwise noted, the address of all Board Members and Officers is c/o PGIM Investments LLC, 655 Broad Street, Newark, New Jersey 07102-4410. |
| ∎ | | There is no set term of office for Board Members or Officers. The Board Members have adopted a retirement policy, which calls for the retirement of Board Members on December 31 of the year in which they reach the age of 75. |
| ∎ | | “Other Directorships Held” includes all directorships of companies required to register or file reports with the SEC under the 1934 Act (that is, “public companies”) or other investment companies registered under the 1940 Act. |
| ∎ | | “Portfolios Overseen” includes all investment companies managed by PGIM Investments LLC. The investment companies for which PGIM Investments LLC serves as manager include the PGIM Funds, Target Funds, The Prudential Variable Contract Accounts, PGIM ETF Trust, PGIM High Yield Bond Fund, Inc., PGIM Global High Yield Fund, Inc., PGIM Short Duration High Yield Opportunities Fund, The Prudential Series Fund, Prudential’s Gibraltar Fund, Inc. and the Advanced Series Trust. |
| ∎ | | As used in the Fund Officers table “Prudential” means The Prudential Insurance Company of America. |
PGIM Jennison International Opportunities Fund
Approval of Advisory Agreements (unaudited)
The Fund’s Board of Directors
The Board of Directors (the “Board”) of PGIM Jennison International Opportunities Fund (the “Fund”)1 consists of ten individuals, eight of whom are not “interested persons” of the Fund, as defined in the Investment Company Act of 1940, as amended (the “1940 Act”) (the “Independent Directors”). The Board is responsible for the oversight of the Fund and its operations, and performs the various duties imposed on the directors of investment companies by the 1940 Act. The Independent Directors have retained independent legal counsel to assist them in connection with their duties. The Chair of the Board is an Independent Director. The Board has established four standing committees: the Audit Committee, the Nominating and Governance Committee, and two Investment Committees. Each committee is chaired by, and composed of, Independent Directors.
Annual Approval of the Fund’s Advisory Agreements
As required under the 1940 Act, the Board determines annually whether to renew the Fund’s management agreement with PGIM Investments LLC (“PGIM Investments”) and the Fund’s subadvisory agreement with Jennison Associates LLC (“Jennison”). In considering the renewal of the agreements, the Board, including all of the Independent Directors, met on June 7-10, 2021 and approved the renewal of the agreements through July 31, 2022, after concluding that the renewal of the agreements was in the best interests of the Fund and its shareholders.
In advance of the meetings, the Board requested and received materials relating to the agreements, and had the opportunity to ask questions and request further information in connection with its consideration. Among other things, the Board considered comparative fee information from PGIM Investments and Jennison. Also, the Board considered comparisons with other mutual funds in relevant Peer Universes and Peer Groups, as is further discussed below.
In approving the agreements, the Board, including the Independent Directors advised by independent legal counsel, considered the factors it deemed relevant, including the nature, quality and extent of services provided by PGIM Investments and the subadviser, the performance of the Fund, the profitability of PGIM Investments and its affiliates, expenses and fees, and the potential for economies of scale that may be shared with the Fund and its shareholders as the Fund’s assets grow. In their deliberations, the Directors did not identify any single factor which alone was responsible for the Board’s decision to approve the agreements with respect to the Fund. In connection with its deliberations, the Board considered information provided by PGIM Investments throughout the year at regular Board meetings, presentations from portfolio managers and other information, as well as information furnished at or in advance of the meetings on June 7-10, 2021.
The Directors determined that the overall arrangements between the Fund and PGIM Investments, which serves as the Fund’s investment manager pursuant to a
| 1 | PGIM Jennison International Opportunities Fund is a series of Prudential World Fund, Inc. |
PGIM Jennison International Opportunities Fund
Approval of Advisory Agreements (continued)
management agreement, and between PGIM Investments and Jennison, which serves as the Fund’s subadviser pursuant to the terms of a subadvisory agreement with PGIM Investments, are in the best interests of the Fund and its shareholders in light of the services performed, fees charged and such other matters as the Directors considered relevant in the exercise of their business judgment.
The material factors and conclusions that formed the basis for the Directors’ reaching their determinations to approve the continuance of the agreements are separately discussed below.
Nature, Quality and Extent of Services
The Board received and considered information regarding the nature, quality and extent of services provided to the Fund by PGIM Investments and Jennison. The Board noted that Jennison is affiliated with PGIM Investments. The Board considered the services provided by PGIM Investments, including but not limited to the oversight of the subadviser for the Fund, as well as the provision of fund recordkeeping, compliance and other services to the Fund, and PGIM Investments’ role as administrator for the Fund’s liquidity risk management program. With respect to PGIM Investments’ oversight of the subadviser, the Board noted that PGIM Investments’ Strategic Investment Research Group (“SIRG”), which is a business unit of PGIM Investments, is responsible for monitoring and reporting to PGIM Investments’ senior management on the performance and operations of the subadviser. The Board also considered that PGIM Investments pays the salaries of all of the officers and interested Directors of the Fund who are part of Fund management. The Board also considered the investment subadvisory services provided by Jennison, including investment research and security selection, as well as adherence to the Fund’s investment restrictions and compliance with applicable Fund policies and procedures. The Board considered PGIM Investments’ evaluation of the subadviser, as well as PGIM Investments’ recommendation, based on its review of the subadviser, to renew the subadvisory agreement.
The Board considered the qualifications, backgrounds and responsibilities of PGIM Investments’ senior management responsible for the oversight of the Fund and Jennison, and also considered the qualifications, backgrounds and responsibilities of Jennison’s portfolio managers who are responsible for the day-to-day management of the Fund’s portfolio. The Board was provided with information pertaining to PGIM Investments’ and Jennison’s organizational structure, senior management, investment operations, and other relevant information pertaining to both PGIM Investments and Jennison. The Board also noted that it received favorable compliance reports from the Fund’s Chief Compliance Officer (“CCO”) as to both PGIM Investments and Jennison.
The Board concluded that it was satisfied with the nature, extent and quality of the investment management services provided by PGIM Investments and the subadvisory services provided to the Fund by Jennison, and that there was a reasonable basis on which to conclude that the Fund benefits from the services provided by PGIM Investments and Jennison under the management and subadvisory agreements.
Visit our website at pgim.com/investments
Costs of Services and Profits Realized by PGIM Investments
The Board was provided with information on the profitability of PGIM Investments and its affiliates in serving as the Fund’s investment manager. The Board discussed with PGIM Investments the methodology utilized in assembling the information regarding profitability and considered its reasonableness. The Board recognized that it is difficult to make comparisons of profitability from fund management contracts because comparative information is not generally publicly available and is affected by numerous factors, including the structure of the particular adviser, the types of funds it manages, its business mix, numerous assumptions regarding allocations and the adviser’s capital structure and cost of capital. Taking these factors into account, the Board concluded that the profitability of PGIM Investments and its affiliates in relation to the services rendered was not unreasonable.
Economies of Scale
The Board received and discussed information concerning economies of scale that PGIM Investments may realize as the Fund’s assets grow beyond current levels. The Board noted that the management fee schedule for the Fund includes breakpoints, which have the effect of reducing the fee rate as assets increase. During the course of time, the Board has considered information regarding the launch date of the Fund, the management fees of the Fund compared to those of similarly managed funds, and PGIM Investments’ investment in the Fund over time. The Board noted that economies of scale may be shared with the Fund in several ways, including low management fees from inception, additional technological and personnel investments to enhance shareholder services, and maintaining existing expense structures in the face of a rising cost environment. The Board considered PGIM Investments’ assertion that it continually evaluates the management fee schedule of the Fund and the potential to share economies of scale through breakpoints or fee waivers as asset levels increase.
The Board recognized the inherent limitations of any analysis of economies of scale, stemming largely from the Board’s understanding that most of PGIM Investments’ costs are not specific to individual funds, but rather are incurred across a variety of products and services.
Other Benefits to PGIM Investments and Jennison
The Board considered potential ancillary benefits that might be received by PGIM Investments, Jennison and their affiliates as a result of their relationship with the Fund. The Board concluded that potential benefits to be derived by PGIM Investments included transfer agency fees received by the Fund’s transfer agent (which is affiliated with PGIM Investments), as well as benefits to its reputation or other intangible benefits resulting from PGIM Investments’ association with the Fund. The Board concluded that the potential benefits to be derived by Jennison included the ability to use soft dollar credits, as well as the potential benefits consistent with those generally resulting from an increase in assets under management, specifically, potential access to additional research resources and benefits to its reputation. The Board concluded that the benefits
PGIM Jennison International Opportunities Fund
Approval of Advisory Agreements (continued)
derived by PGIM Investments and Jennison were consistent with the types of benefits generally derived by investment managers and subadvisers to mutual funds.
Performance of the Fund / Fees and Expenses
The Board considered certain additional factors and made related conclusions relating to the historical performance of the Fund for the one-, three- and five-year periods ended December 31, 2020.
The Board also considered the Fund’s actual management fee, as well as the Fund’s net total expense ratio, for the fiscal year ended October 31, 2020. The Board considered the management fee for the Fund as compared to the management fee charged by PGIM Investments to other funds and the fee charged by other advisers to comparable mutual funds in a Peer Group. The actual management fee represents the fee rate actually paid by Fund shareholders and includes any fee waivers or reimbursements. The net total expense ratio for the Fund represents the actual expense ratio incurred by Fund shareholders.
The mutual funds included in the Peer Universe, which was used to consider performance, and the Peer Group, which was used to consider fees and expenses, were objectively determined by Broadridge, an independent provider of mutual fund data. In certain circumstances, PGIM Investments also provided supplemental Peer Universe or Peer Group information for reasons addressed with the Board. The comparisons placed the Fund in various quartiles over various periods, with the first quartile being the best 25% of the mutual funds (for performance, the best performing mutual funds and, for expenses, the lowest cost mutual funds).
The section below summarizes key factors considered by the Board and the Board’s conclusions regarding the Fund’s performance, fees and overall expenses. The table sets forth net performance comparisons (which reflect the impact on performance of fund expenses, or any subsidies, expense caps or waivers that may be applicable) with the Peer Universe, actual management fees with the Peer Group (which reflect the impact of any subsidies or fee waivers), and net total expenses with the Peer Group, each of which were key factors considered by the Board.
| | | | | | | | |
| Net Performance | | 1 Year | | 3 Years | | 5 Years | | 10 Years |
| | | 1st Quartile | | 1st Quartile | | 1st Quartile | | N/A |
| Actual Management Fees: 2nd Quartile |
| Net Total Expenses: 2nd Quartile |
| ● | The Board noted that Fund outperformed its benchmark index over all periods. |
| ● | The Board and PGIM Investments agreed to retain the Fund’s existing contractual expense cap that (exclusive of certain fees and expenses) caps net annual operating expenses at 0.84% for each class of the Fund’s shares, and that limits transfer agency, shareholder servicing, sub-transfer agency and blue sky fees, as |
Visit our website at pgim.com/investments
| | applicable, to the extent that such fees cause the net annual operating expenses to exceed 1.34% of average daily net assets for Class R2 shares or 1.09% of average daily net assets for Class R4 shares through February 28, 2022. |
| ● | The Board and PGIM Investments agreed to retain the Fund’s existing contractual expense cap with respect to Class A shares, pursuant to which (exclusive of certain fees and expenses) PGIM Investments agrees to limit total annual operating expenses for Class A shares to 1.09% through February 28, 2022. |
| ● | The Board and PGIM Investments agreed to retain the Fund’s existing contractual expense waiver, pursuant to which (exclusive of certain fees and expenses) PGIM Investments waives and/or reimburses up to 0.06% of certain other expenses through February 28, 2022 to the extent that total annual operating expenses exceed 1.90% for Class C shares, 1.48% for Class R shares, 0.90% for Class Z shares, and 0.84% for Class R6 shares. |
| ● | In addition, PGIM Investments will waive management fees or shared operating expenses on any share class to the same extent that it waives such expenses on any other share class, and has agreed that total annual fund operating expenses for Class R6 shares will not exceed total annual fund operating expenses for Class Z shares. |
| ● | The Board concluded that, in light of the above, it would be in the best interests of the Fund and its shareholders to renew the agreements. |
| ● | The Board concluded that the management fees (including subadvisory fees) and total expenses were reasonable in light of the services provided. |
* * *
After full consideration of these factors, the Board concluded that the approval of the agreements was in the best interests of the Fund and its shareholders.
PGIM Jennison International Opportunities Fund
| | | | |
| | | |
| ∎ MAIL | | ∎ TELEPHONE | | ∎ WEBSITE |
655 Broad Street Newark, NJ 07102 | | (800) 225-1852 | | pgim.com/investments |
|
| PROXY VOTING |
| The Board of Directors of the Fund has delegated to the Fund’s subadviser the responsibility for voting any proxies and maintaining proxy recordkeeping with respect to the Fund. A description of these proxy voting policies and procedures is available without charge, upon request, by calling (800) 225-1852 or by visiting the Securities and Exchange Commission’s website at sec.gov. Information regarding how the Fund voted proxies relating to portfolio securities during the most recent 12-month period ended June 30 is available on the Fund’s website and on the Securities and Exchange Commission’s website. |
|
| DIRECTORS |
| Ellen S. Alberding ● Kevin J. Bannon ● Scott E. Benjamin ● Linda W. Bynoe ● Barry H. Evans ● Keith F. Hartstein ● Laurie Simon Hodrick ● Stuart S. Parker ● Brian K. Reid ● Grace C. Torres |
|
| OFFICERS |
| Stuart S. Parker, President ● Scott E. Benjamin, Vice President ● Christian J. Kelly, Treasurer and Principal Financial and Accounting Officer ● Claudia DiGiacomo, Chief Legal Officer ● Dino Capasso, Chief Compliance Officer ● Jonathan Corbett, Anti-Money Laundering Compliance Officer ● Andrew R. French, Secretary ● Melissa Gonzalez, Assistant Secretary ● Diana N. Huffman, Assistant Secretary ● Kelly A. Coyne, Assistant Secretary ● Patrick E. McGuinness, Assistant Secretary ● Debra Rubano, Assistant Secretary ● Lana Lomuti, Assistant Treasurer ● Russ Shupak, Assistant Treasurer ● Elyse M. McLaughlin, Assistant Treasurer ● Deborah Conway, Assistant Treasurer |
| | | | |
| MANAGER | | PGIM Investments LLC | | 655 Broad Street Newark, NJ 07102 |
|
| SUBADVISER | | Jennison Associates LLC | | 466 Lexington Avenue New York, NY 10017 |
|
| DISTRIBUTOR | | Prudential Investment Management Services LLC | | 655 Broad Street Newark, NJ 07102 |
|
| CUSTODIAN | | The Bank of New York Mellon | | 240 Greenwich Street New York, NY 10286 |
|
| TRANSFER AGENT | | Prudential Mutual Fund Services LLC | | PO Box 9658 Providence, RI 02940 |
|
| INDEPENDENT REGISTERED PUBLIC ACCOUNTING FIRM | | PricewaterhouseCoopers LLP | | 300 Madison Avenue New York, NY 10017 |
|
| FUND COUNSEL | | Willkie Farr & Gallagher LLP | | 787 Seventh Avenue New York, NY 10019 |
|
|
| |
| An investor should consider the investment objectives, risks, charges, and expenses of the Fund carefully before investing. The prospectus and summary prospectus contain this and other information about the Fund. An investor may obtain the prospectus and summary prospectus by visiting our website at pgim.com/investments or by calling (800) 225-1852. The prospectus and summary prospectus should be read carefully before investing. |
|
| E-DELIVERY |
| |
| To receive your mutual fund documents online, go to pgim.com/investments/resource/edelivery and enroll. Instead of receiving printed documents by mail, you will receive notification via email when new materials are available. You can cancel your enrollment or change your email address at any time by visiting the website address above. |
|
| SHAREHOLDER COMMUNICATIONS WITH DIRECTORS |
| |
| Shareholders can communicate directly with the Board of Directors by writing to the Chair of the Board, PGIM Jennison International Opportunities Fund, PGIM Investments, Attn: Board of Directors, 655 Broad Street, Newark, NJ 07102. Shareholders can communicate directly with an individual Director by writing to that Director at the same address. Communications are not screened before being delivered to the addressee. |
|
| AVAILABILITY OF PORTFOLIO HOLDINGS |
| |
| The Fund files its complete schedule of portfolio holdings with the Securities and Exchange Commission for the first and third quarters of each fiscal year as an exhibit to its reports on Form N-PORT. The Fund’s Form N-PORT filings are available on the Commission’s website at sec.gov. |
|
| The Fund’s Statement of Additional Information contains additional information about the Fund’s Directors and is available without charge, upon request, by calling (800) 225-1852. |
Mutual Funds:
| | | | |
| | | |
| ARE NOT INSURED BY THE FDIC OR ANY FEDERAL GOVERNMENT AGENCY | | MAY LOSE VALUE | | ARE NOT A DEPOSIT OF OR GUARANTEED BY ANY BANK OR ANY BANK AFFILIATE |

PGIM JENNISON INTERNATIONAL OPPORTUNITIES FUND
| | | | | | | | | | | | | | |
| | | | | | | |
| SHARE CLASS | | A | | C | | R | | Z | | R2 | | R4 | | R6 |
| | | | | | | |
| NASDAQ | | PWJAX | | PWJCX | | PWJRX | | PWJZX | | PWJBX | | PWJDX | | PWJQX |
| | | | | | | |
| CUSIP | | 743969677 | | 743969669 | | 743969487 | | 743969651 | | 743969412 | | 743969396 | | 743969586 |
MF215E

PGIM JENNISON GLOBAL INFRASTRUCTURE FUND
ANNUAL REPORT
OCTOBER 31, 2021

To enroll in e-delivery, go to pgim.com/investments/resource/edelivery
Table of Contents
This report is not authorized for distribution to prospective investors unless preceded or accompanied by a current prospectus.
The views expressed in this report and information about the Fund’s portfolio holdings are for the period covered by this report and are subject to change thereafter.
Mutual funds are distributed by Prudential Investment Management Services LLC, member SIPC. Jennison Associates LLC is a registered investment adviser. Both are Prudential Financial companies. © 2021 Prudential Financial, Inc. and its related entities. Jennison Associates, Jennison, PGIM, and the PGIM logo are service marks of Prudential Financial, Inc. and its related entities, registered in many jurisdictions worldwide.
| | |
| 2 | | Visit our website at pgim.com/investments |
Letter from the President
| | |
 | | Dear Shareholder: We hope you find the annual report for the PGIM Jennison Global Infrastructure Fund informative and useful. The report covers performance for the 12-month period that ended October 31, 2021. The global economy and markets continued to recover throughout the period from the ongoing impact of the COVID-19 pandemic. The Federal Reserve slashed interest rates and kept them near zero to encourage borrowing. Congress passed stimulus bills worth several trillion dollars to help consumers and businesses. And several effective COVID-19 vaccines received regulatory approval. Those measures were enough to offset the fear of rising |
inflation and supply chain challenges that threatened to disrupt growth.
At the start of the period, stocks had recovered most of the steep losses they had suffered at the onset of the pandemic. Equities rallied as states reopened their economies but became more volatile as investors worried that a surge in COVID-19 infections would stall the recovery. However, rising corporate profits and economic growth, the resolution of the US presidential election, and the global rollout of approved vaccines lifted equity markets to record levels, helping stocks around the globe post gains for the full period.
Throughout this volatile period, investors sought safety in fixed income. Investment-grade bonds in the US and the overall global bond market declined slightly during the period as the economy recovered, but emerging market debt rose. While the 10-year US Treasury yield hovered near record lows early in the period after a significant rally in interest rates, rates moved higher later on as investors began to focus on stronger economic growth and the prospects of higher inflation. The Fed also took several aggressive actions to keep the bond markets running smoothly, implementing many of the relief programs that proved to be successful in helping end the global financial crisis in 2008-09.
Regarding your investments with PGIM, we believe it is important to maintain a diversified portfolio of funds consistent with your tolerance for risk, time horizon, and financial goals. Your financial advisor can help you create a diversified investment plan that may include funds covering all the basic asset classes and that reflects your personal investor profile and risk tolerance. However, diversification and asset allocation strategies do not assure a profit or protect against loss in declining markets.
At PGIM Investments, we consider it a great privilege and responsibility to help investors participate in opportunities across global markets while meeting their toughest investment challenges. PGIM is a top-10 global investment manager with more than $1.5 trillion in assets under management. This scale and investment expertise allow us to deliver actively managed funds and strategies to meet the needs of investors around the globe.
Thank you for choosing our family of funds.
Sincerely,

Stuart S. Parker, President
PGIM Jennison Global Infrastructure Fund
December 15, 2021
| | | | |
PGIM Jennison Global Infrastructure Fund | | | 3 | |
Your Fund’s Performance (unaudited)
Performance data quoted represent past performance. Past performance does not guarantee future results. The investment return and principal value of an investment will fluctuate so that an investor’s shares, when redeemed, may be worth more or less than their original cost. Current performance may be lower or higher than the past performance data quoted. An investor may obtain performance data as of the most recent month-end by visiting our website at pgim.com/investments or by calling (800) 225-1852.
| | | | | | |
| |
| | | Average Annual Total Returns as of 10/31/21 |
| | | One Year (%) | | Five Years (%) | | Since Inception (%) |
| | | |
| Class A | | | | | | |
| | | |
| (with sales charges) | | 18.16 | | 8.23 | | 7.40 (09/25/2013) |
| | | |
| (without sales charges) | | 25.04 | | 9.46 | | 8.15 (09/25/2013) |
| | | |
| Class C | | | | | | |
| | | |
| (with sales charges) | | 23.10 | | 8.64 | | 7.33 (09/25/2013) |
| | | |
| (without sales charges) | | 24.10 | | 8.64 | | 7.33 (09/25/2013) |
| | | |
| Class Z | | | | | | |
| | | |
| (without sales charges) | | 25.42 | | 9.79 | | 8.45 (09/25/2013) |
| | | |
| Class R6 | | | | | | |
| | | |
| (without sales charges) | | 25.44 | | N/A | | 10.40 (12/28/2016) |
| | | |
| S&P Global Infrastructure Index | | | | | | |
| | 27.93 | | 6.37 | | — |
| | | |
| S&P 500 Index | | | | | | |
| | | |
| | | 42.90 | | 18.92 | | — |
| | | | |
|
| Average Annual Total Returns as of 10/31/21 Since Inception (%) |
| | | Class A, Class C, Class Z | | Class R6 |
| | | (09/25/2013) | | (12/28/2016) |
| | |
| S&P Global Infrastructure Index | | 5.84 | | 6.93 |
| S&P 500 Index | | 15.50 | | 18.26 |
Since Inception returns are provided since the Fund has less than 10 fiscal years of returns. Since Inception returns for the Indexes are measured from the closest month-end to the class’ inception date.
| | |
| 4 | | Visit our website at pgim.com/investments |
Growth of a $10,000 Investment (unaudited)
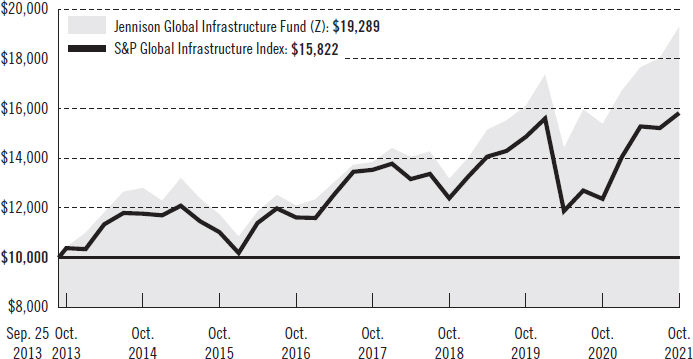
The graph compares a $10,000 investment in the Fund’s Class Z shares with a similar investment in the S&P Global Infrastructure Index by portraying the initial account values at the commencement of operations of Class Z shares (September 25, 2013) and the account values at the end of the current fiscal year (October 31, 2021), as measured on a quarterly basis. For purposes of the graph, and unless otherwise indicated, it has been assumed that (a) all recurring fees (including management fees) were deducted and (b) all dividends and distributions were reinvested. The line graph provides information for Class Z shares only. As indicated in the tables provided earlier, performance for other share classes will vary due to the differing fees and expenses applicable to each share class (as indicated in the following paragraphs). Without waiver of fees and/or expense reimbursements, if any, the returns would have been lower.
Past performance does not predict future performance. Total returns and the ending account values in the graphs include changes in share price and reinvestment of dividends and capital gains distributions in a hypothetical investment for the periods shown. The Fund’s total returns do not reflect the deduction of income taxes on an individual’s investment. Taxes may reduce your actual investment returns on income or gains paid by the Fund or any gains you may realize if you sell your shares.
| | | | |
PGIM Jennison Global Infrastructure Fund | | | 5 | |
Your Fund’s Performance (continued)
The returns in the tables do not reflect the deduction of taxes that a shareholder would pay on Fund distributions or following the redemption of Fund shares. The average annual total returns take into account applicable sales charges, which are described for each share class in the table below.
| | | | | | | | |
| | | | | |
| | | Class A | | Class C | | Class Z | | Class R6 |
| | | | | |
| Maximum initial sales charge | | 5.50% of the public offering price | | None | | None | | None |
| | | | | |
| Contingent deferred sales charge (CDSC) (as a percentage of the lower of the original purchase price or the net asset value at redemption) | | 1.00% on sales of $1 million or more made within 12 months of purchase | | 1.00% on sales made within 12 months of purchase | | None | | None |
| | | | | |
| Annual distribution and service (12b-1) fees (shown as a percentage of average daily net assets) | | 0.30% (0.25% currently) | | 1.00% | | None | | None |
Benchmark Definitions
S&P Global Infrastructure Index—The S&P Global Infrastructure Index is an unmanaged index that consists of 75 companies from around the world that represent the listed infrastructure universe. To create diversified exposure across the global listed infrastructure market, the Index has balanced weights across three distinct infrastructure clusters: Utilities, Transportation, and Energy.
S&P 500 Index*—The S&P 500 Index is an unmanaged index of over 500 stocks of large US public companies. It gives a broad look at how stock prices in the United States have performed.
*The S&P 500 Index (“Index”) is a product of S&P Dow Jones Indices LLC and/or its affiliates and has been licensed for use by PGIM, Inc. and/or its affiliates. Copyright © 2021 S&P Dow Jones Indices LLC, a division of S&P Global, Inc., and/or its affiliates. All rights reserved. Redistribution or reproduction in whole or in part are prohibited without written permission of S&P Dow Jones Indices LLC. For more information on any of S&P Dow Jones Indices LLC’s indices please visit www.spdji.com. S&P® is a registered trademark of S&P Global and Dow Jones® is a registered trademark of Dow Jones Trademark Holdings LLC.
Investors cannot invest directly in an index. The returns for the Indexes would be lower if they included the effects of sales charges, operating expenses of a mutual fund, or taxes that may be paid by an investor.
| | |
| 6 | | Visit our website at pgim.com/investments |
Presentation of Fund Holdings as of 10/31/21
| | | | | | |
| | | |
| Ten Largest Holdings | | Line of Business | | Country | | % of Net Assets |
| | | |
| Cheniere Energy, Inc. | | Oil, Gas & Consumable Fuels | | United States | | 5.2% |
| | | |
| NextEra Energy, Inc. | | Electric Utilities | | United States | | 4.3% |
| | | |
| CenterPoint Energy, Inc. | | Multi-Utilities | | United States | | 4.0% |
| | | |
| Ferrovial SA | | Construction & Engineering | | Spain | | 4.0% |
| | | |
| Norfolk Southern Corp. | | Road & Rail | | United States | | 3.9% |
| | | |
| Targa Resources Corp. | | Oil, Gas & Consumable Fuels | | United States | | 3.8% |
| | | |
| Eiffage SA | | Construction & Engineering | | France | | 3.4% |
| | | |
| Cellnex Telecom SA, 144A | | Diversified Telecommunication Services | | Spain | | 3.3% |
| | | |
| Union Pacific Corp. | | Road & Rail | | United States | | 3.3% |
| | | |
| Canadian National Railway Co. | | Road & Rail | | Canada | | 3.2% |
Holdings reflect only long-term investments and are subject to change.
| | | | |
PGIM Jennison Global Infrastructure Fund | | | 7 | |
Strategy and Performance Overview (unaudited)
How did the Fund perform?
The PGIM Jennison Global Infrastructure Fund’s Class Z shares returned 25.42% in the 12-month reporting period that ended October 31, 2021, underperforming the 27.93% return of the S&P Global Infrastructure Index (the Index).
What were the market conditions?
| ● | After a tumultuous performance in early 2020 due to the impacts of the COVID-19 pandemic, global equity markets recovered in late 2020 and continued to climb through much of 2021. Markets were led higher by sectors and industries that benefited the most from a cyclical economic recovery. |
| ● | By the middle of 2021, growth-oriented companies also began to drive the broad market higher. Despite concerns of another wave of global shutdowns due to new variants of COVID-19, markets maintained strong performance through the end of the reporting period. |
| ● | Global infrastructure stocks, as represented by the Index, also rebounded strongly during the period but underperformed the broader global equity markets. Energy infrastructure securities led the positive performance, as well as transportation stocks. Utility stocks, although positive performers as a group, lagged all major sectors of the Index. |
What worked?
| ● | The Fund benefited from strong stock selection across many of the infrastructure sectors in the Index during the reporting period. |
| ● | Energy infrastructure contributed most to the positive returns, including holdings in Targa Resources Corp., Cheniere Energy Inc., Enbridge Inc., and The Williams Companies Inc. |
| ● | Within transportation, the Fund benefited from the strong performance of railroad, toll-road, and environmental services stocks, including Norfolk Southern Corp., Union Pacific Corp., Eiffage SA, and GFL Environmental Inc. |
What didn’t work?
| ● | Despite its strong, positive absolute return, the Fund underperformed the Index during the reporting period because of its underweight relative position in the top-performing energy infrastructure sector. |
| ● | The Fund’s holdings in telecommunications infrastructure, which is not represented in the Index, also hurt relative performance as this sector lagged the Index during the period. |
| ● | Notable performance detractors included some of the Fund’s investments in utilities stocks that were held for a portion of the period, including PG&E Corp., Ameren Corp., Aliant Energy Corp., and American Electric Power. |
| | |
| 8 | | Visit our website at pgim.com/investments |
Current outlook
| ● | Jennison’s short- and long-term outlooks for the global infrastructure group remain positive, and the Fund continues to be well-diversified. It has exposure to infrastructure companies that should thrive in a demand-led economic recovery, in Jennison’s view, as well as companies with resilient business models that can perform well through all phases of an economic cycle. |
| ● | Broadly speaking, utility fundamentals were healthy at the end of the reporting period, and Jennison believes that the sector could potentially generate mid-to-high single-digit earnings growth with commensurate dividend growth, supported by highly visible capital expenditure trajectories and improving regulatory environments. In Jennison’s view, utilities are particularly well-positioned to capitalize on the clean energy transition. The quest for cleaner power sources is driving demand for renewable energy, and Jennison believes the energy grid infrastructure investment needed to modernize aging networks and absorb the intermittent nature of renewable power generation should drive the sector’s growth. From a positioning standpoint, Jennison favors utilities with solid and sustainable dividend yields and above-average projected earnings and/or dividend growth that are operating in constructive regulatory environments that support timely and attractive returns on capital deployed. Jennison continues to seek companies that can mitigate the impact on customer billing by focusing on operating efficiencies instead of the traditional strategy of serial requests to increase utility rates. Regarding renewable energy, Jennison thinks any project setback due to supply-chain disruptions or regulatory permitting issues is unlikely to be a major driver of long-term shareholder return. In Jennison’s opinion, the clean energy transition investment is supported by two broad and enduring themes: 1) pronounced reductions in the cost of renewable energy, driven by continued technological advancement and 2) increasing public policy support, driven by concerns about greenhouse gas emissions, energy security, and (most recently) job creation. Finally, Jennison expects ESG (environmental, social, and governance) factors to keep growing in importance. |
| ● | In energy infrastructure, many large, diversified companies reported results well above market expectations during the period, and investor sentiment within the overall energy sector continues to improve. This, coupled with continued capital discipline by company management teams, has led Jennison to selectively increase the Fund’s exposure to energy infrastructure companies with assets that could significantly benefit from improved demand for refined energy products once consumers return to their pre-COVID-19 traveling habits and crude-oil drilling activity recovers. In Jennison’s view, energy companies with strong balance sheets and integrated asset systems, as well as companies that have transparency and strong ESG metrics, should continue to fare well going forward. |
| ● | Transportation infrastructure continues to see mixed trends across geographies and end markets; but at a high level, global gross domestic product growth and COVID-19 vaccine proliferation are positive indicators for this sector. Toll-road traffic trends have continued to normalize and, in some geographies, have fully recovered to |
| | | | |
PGIM Jennison Global Infrastructure Fund | | | 9 | |
Strategy and Performance Overview (continued)
| | pre-COVID-19 levels. International air traffic remains weak, but progress on lifting travel restrictions sets the stage for additional growth in 2022. Although underlying consumer and industrial trends are constructive for rail volumes, recent results were impacted by congestion and supply-chain-related problems. Jennison views these issues as transitory and believes the situation is likely to improve in 2022 alongside accelerating pricing. North American waste and pricing trends remain robust. Jennison continues to favor both waste and rail stocks that stand to benefit from strong pricing and volume trends in 2022. Specifically, Jennison prefers to invest in railroads with a cost improvement story and a solid revenue outlook. Jennison favors toll-road exposure over airport exposure and continues to like French and North American toll-road operators that could benefit from a faster-than-expected recovery in construction activity. The Fund’s airport positioning still reflects a preference for short-haul leisure demand in Mexico and Europe. Jennison expects reduced restrictions to enable improved mobility trends into 2022. |
| ● | Lastly, regarding communications infrastructure, Jennison continues to favor wireless towers and data center operators. Jennison does not expect any material impact from COVID-19 on tower companies as they have long-term contracts with wireless operators, which Jennison considers low counter-party risk. In Europe, Jennison continues to see compelling growth potential through mergers and acquisitions in the independent tower sector, alongside the organic secular growth opportunity. In the data center space, the critical nature of cloud-hosting services was highlighted by the COVID-19 pandemic, as more employers moved to the “work-from-home” environment. With employees starting to return to the office, most companies are seeking to maintain flexible work practices going forward. Jennison anticipates that demand will persist and continue to grow. Fundamentally, both industries capitalize on exponential data demand growth around the world. |
| | |
| 10 | | Visit our website at pgim.com/investments |
Fees and Expenses (unaudited)
As a shareholder of the Fund, you incur two types of costs: (1) transaction costs, including sales charges (loads) on purchase payments and redemptions, as applicable, and (2) ongoing costs, including management fees, distribution and/or service (12b-1) fees, and other Fund expenses, as applicable. This example is intended to help you understand your ongoing costs (in dollars) of investing in the Fund and to compare these costs with the ongoing costs of investing in other mutual funds.
The example is based on an investment of $1,000 held through the six-month period ended October 31, 2021. The example is for illustrative purposes only; you should consult the Prospectus for information on initial and subsequent minimum investment requirements.
Actual Expenses
The first line for each share class in the table on the following page provides information about actual account values and actual expenses. You may use the information on this line, together with the amount you invested, to estimate the expenses that you paid over the period. Simply divide your account value by $1,000 (for example, an $8,600 account value ÷ $1,000 = 8.6), then multiply the result by the number on the first line under the heading “Expenses Paid During the Six-Month Period” to estimate the expenses you paid on your account during this period.
Hypothetical Example for Comparison Purposes
The second line for each share class in the table on the following page provides information about hypothetical account values and hypothetical expenses based on the Fund’s actual expense ratio and an assumed rate of return of 5% per year before expenses, which is not the Fund’s actual return. The hypothetical account values and expenses may not be used to estimate the actual ending account balance or expenses you paid for the period. You may use this information to compare the ongoing costs of investing in the Fund and other funds. To do so, compare this 5% hypothetical example with the 5% hypothetical examples that appear in the shareholder reports of the other funds.
The Fund’s transfer agent may charge additional fees to holders of certain accounts that are not included in the expenses shown in the table on the following page. These fees apply to individual retirement accounts (IRAs) and Section 403(b) accounts. As of the close of the six-month period covered by the table, IRA fees included an annual maintenance fee of $15 per account (subject to a maximum annual maintenance fee of $25 for all accounts held by the same shareholder). Section 403(b) accounts are charged an annual $25 fiduciary maintenance fee. Some of the fees may vary in amount, or may be waived, based on your total account balance or the number of PGIM funds, including the Fund, that you own. You should consider the additional fees that were charged to your Fund account over the six-month period when you estimate the total ongoing expenses paid over the period and the impact of these fees on your ending account value, as these additional expenses are not reflected in the information
| | | | |
PGIM Jennison Global Infrastructure Fund | | | 11 | |
Fees and Expenses (continued)
provided in the expense table. Additional fees have the effect of reducing investment returns.
Please note that the expenses shown in the table are meant to highlight your ongoing costs only and do not reflect any transactional costs such as sales charges (loads). Therefore, the second line for each share class in the table is useful in comparing ongoing costs only and will not help you determine the relative total costs of owning different funds. In addition, if these transactional costs were included, your costs would have been higher.
| | | | | | | | | | |
| | | | |
Jennison Global Infrastructure Fund | | Beginning Account Value
May 1, 2021 | | Ending
Account Value
October 31, 2021 | | Annualized
Expense
Ratio Based on
the
Six-Month Period | | Expenses Paid
During the
Six-Month Period* |
| Class A | | Actual | | $1,000.00 | | $1,090.30 | | 1.50% | | $ 7.90 |
| | Hypothetical | | $1,000.00 | | $1,017.64 | | 1.50% | | $ 7.63 |
| Class C | | Actual | | $1,000.00 | | $1,086.10 | | 2.25% | | $11.83 |
| | Hypothetical | | $1,000.00 | | $1,013.86 | | 2.25% | | $11.42 |
| Class Z | | Actual | | $1,000.00 | | $1,092.00 | | 1.17% | | $ 6.17 |
| | Hypothetical | | $1,000.00 | | $1,019.31 | | 1.17% | | $ 5.96 |
| Class R6 | | Actual | | $1,000.00 | | $1,092.10 | | 1.17% | | $ 6.17 |
| | | Hypothetical | | $1,000.00 | | $1,019.31 | | 1.17% | | $ 5.96 |
*Fund expenses (net of fee waivers or subsidies, if any) for each share class are equal to the annualized expense ratio for each share class (provided in the table), multiplied by the average account value over the period, multiplied by the 184 days in the six-month period ended October 31, 2021, and divided by the 365 days in the Fund’s fiscal year ended October 31, 2021 (to reflect the six-month period). Expenses presented in the table include the expenses of any underlying portfolios in which the Fund may invest.
| | |
| 12 | | Visit our website at pgim.com/investments |
Schedule of Investments
as of October 31, 2021
| | | | | | | | |
| | |
| Description | | Shares | | | Value | |
| | |
| LONG-TERM INVESTMENTS 98.4% | | | | | | |
| | |
| COMMON STOCKS 93.3% | | | | | | |
| | |
| Australia 3.1% | | | | | | |
| | |
Spark Infrastructure Group | | | 357,076 | | | $ | 755,486 | |
| | |
Sydney Airport* | | | 69,943 | | | | 431,757 | |
| | |
Transurban Group | | | 53,245 | | | | 541,145 | |
| | | | | | | | |
| | |
| | | | | | | 1,728,388 | |
| | |
| Canada 4.7% | | | | | | |
| | |
Canadian National Railway Co. | | | 13,399 | | | | 1,780,861 | |
| | |
Enbridge, Inc. | | | 18,829 | | | | 788,700 | |
| | |
TC Energy Corp. | | | 210 | | | | 11,361 | |
| | | | | | | | |
| | |
| | | | | | | 2,580,922 | |
| | |
| China 1.6% | | | | | | |
| | |
China Longyuan Power Group Corp. Ltd. (Class H Stock) | | | 383,250 | | | | 900,962 | |
| | |
| France 9.9% | | | | | | |
| | |
Eiffage SA | | | 18,080 | | | | 1,862,292 | |
| | |
Getlink SE | | | 32,028 | | | | 493,064 | |
| | |
Veolia Environnement SA | | | 46,761 | | | | 1,527,045 | |
| | |
Vinci SA | | | 14,900 | | | | 1,593,388 | |
| | | | | | | | |
| | |
| | | | | | | 5,475,789 | |
| | |
| Germany 1.5% | | | | | | |
| | |
RWE AG | | | 20,680 | | | | 796,475 | |
| | |
| India 1.0% | | | | | | |
| | |
Power Grid Corp. of India Ltd. | | | 227,686 | | | | 564,188 | |
| | |
| Italy 1.9% | | | | | | |
| | |
Atlantia SpA* | | | 54,361 | | | | 1,045,345 | |
| | |
| Mexico 2.4% | | | | | | |
| | |
Grupo Aeroportuario del Pacifico SAB de CV (Class B Stock)* | | | 60,388 | | | | 762,623 | |
| | |
Grupo Aeroportuario del Sureste SAB de CV (Class B Stock) | | | 27,869 | | | | 562,970 | |
| | | | | | | | |
| | |
| | | | | | | 1,325,593 | |
| | |
| New Zealand 1.0% | | | | | | |
| | |
Auckland International Airport Ltd.* | | | 97,318 | | | | 556,600 | |
See Notes to Financial Statements.
| | | | |
PGIM Jennison Global Infrastructure Fund | | | 13 | |
Schedule of Investments (continued)
as of October 31, 2021
| | | | | | | | |
| | |
| Description | | Shares | | | Value | |
| | |
| COMMON STOCKS (Continued) | | | | | | |
| | |
| Spain 10.7% | | | | | | |
Aena SME SA, 144A* | | | 6,893 | | | $ | 1,131,474 | |
Cellnex Telecom SA, 144A | | | 29,721 | | | | 1,830,171 | |
EDP Renovaveis SA | | | 25,419 | | | | 709,998 | |
Ferrovial SA | | | 69,735 | | | | 2,201,223 | |
| | | | | | | | |
| | |
| | | | | | | 5,872,866 | |
| | |
| United Kingdom 1.4% | | | | | | |
National Grid PLC | | | 60,341 | | | | 776,283 | |
| | |
| United States 54.1% | | | | | | |
American Tower Corp., REIT | | | 2,812 | | | | 792,900 | |
American Water Works Co., Inc. | | | 6,042 | | | | 1,052,395 | |
CenterPoint Energy, Inc. | | | 85,090 | | | | 2,215,743 | |
Cheniere Energy, Inc.* | | | 27,831 | | | | 2,877,725 | |
CMS Energy Corp. | | | 16,864 | | | | 1,017,742 | |
Dominion Energy, Inc. | | | 21,803 | | | | 1,655,502 | |
DT Midstream, Inc. | | | 30,028 | | | | 1,440,143 | |
Essential Utilities, Inc. | | | 11,580 | | | | 545,071 | |
Eversource Energy | | | 11,081 | | | | 940,777 | |
Exelon Corp. | | | 27,104 | | | | 1,441,662 | |
NextEra Energy Partners LP | | | 9,270 | | | | 800,001 | |
NextEra Energy, Inc. | | | 27,496 | | | | 2,346,234 | |
Norfolk Southern Corp. | | | 7,393 | | | | 2,166,519 | |
Public Service Enterprise Group, Inc. | | | 25,302 | | | | 1,614,267 | |
SBA Communications Corp., REIT | | | 4,505 | | | | 1,555,712 | |
Targa Resources Corp. | | | 38,549 | | | | 2,107,474 | |
Union Pacific Corp. | | | 7,432 | | | | 1,794,085 | |
Waste Connections, Inc. | | | 6,635 | | | | 902,426 | |
Williams Cos., Inc. (The) | | | 53,242 | | | | 1,495,568 | |
Xcel Energy, Inc. | | | 16,729 | | | | 1,080,526 | |
| | | | | | | | |
| | |
| | | | | | | 29,842,472 | |
| | | | | | | | |
| | |
TOTAL COMMON STOCKS
(cost $39,851,625) | | | | | | | 51,465,883 | |
| | | | | | | | |
| | |
| PREFERRED STOCKS 5.1% | | | | | | |
| | |
| Canada 3.0% | | | | | | |
| | |
GFL Environmental, Inc., CVT, 6.000%, Maturing 03/15/23 | | | 17,821 | | | | 1,681,233 | |
See Notes to Financial Statements.
| | | | | | | | |
| | |
| Description | | Shares | | | Value | |
| | |
| PREFERRED STOCKS (Continued) | | | | | | |
| | |
| United States 2.1% | | | | | | |
AES Corp. (The), CVT, 6.875%, Maturing 02/15/24 | | | 4,480 | | | $ | 452,525 | |
NextEra Energy, Inc., CVT, 6.219%, Maturing 09/01/23 | | | 13,060 | | | | 715,688 | |
| | | | | | | | |
| | |
| | | | | | | 1,168,213 | |
| | | | | | | | |
| | |
TOTAL PREFERRED STOCKS
(cost $2,107,158) | | | | | | | 2,849,446 | |
| | | | | | | | |
| | |
TOTAL LONG-TERM INVESTMENTS
(cost $41,958,783) | | | | | | | 54,315,329 | |
| | | | | | | | |
| | |
SHORT-TERM INVESTMENT 1.8% | | | | | | | | |
| | |
AFFILIATED MUTUAL FUND | | | | | | | | |
PGIM Core Ultra Short Bond Fund
(cost $956,348)(wa) | | | 956,348 | | | | 956,348 | |
| | | | | | | | |
| | |
TOTAL INVESTMENTS 100.2%
(cost $42,915,131) | | | | | | | 55,271,677 | |
Liabilities in excess of other assets (0.2)% | | | | | | | (90,175 | ) |
| | | | | | | | |
| | |
NET ASSETS 100.0% | | | | | | $ | 55,181,502 | |
| | | | | | | | |
Below is a list of the abbreviation(s) used in the annual report:
144A—Security was purchased pursuant to Rule 144A under the Securities Act of 1933 and, pursuant to the requirements of Rule 144A, may not be resold except to qualified institutional buyers.
CVT—Convertible Security
LIBOR—London Interbank Offered Rate
LP—Limited Partnership
REITs—Real Estate Investment Trust
| * | Non-income producing security. |
| (wa) | PGIM Investments LLC, the manager of the Fund, also serves as manager of the PGIM Core Ultra Short Bond Fund and PGIM Institutional Money Market Fund, if applicable. |
Fair Value Measurements:
Various inputs are used in determining the value of the Fund’s investments. These inputs are summarized in the three broad levels listed below.
Level 1—unadjusted quoted prices generally in active markets for identical securities.
Level 2—quoted prices for similar securities, interest rates and yield curves, prepayment speeds, foreign currency exchange rates and other observable inputs.
Level 3—unobservable inputs for securities valued in accordance with Board approved fair valuation procedures.
See Notes to Financial Statements.
| | | | |
PGIM Jennison Global Infrastructure Fund | | | 15 | |
Schedule of Investments (continued)
as of October 31, 2021
The following is a summary of the inputs used as of October 31, 2021 in valuing such portfolio securities:
| | | | | | | | | | | | |
| | | Level 1 | | | Level 2 | | | Level 3 | |
Investments in Securities | | | | | | | | | | | | |
Assets | | | | | | | | | | | | |
Long-Term Investments | | | | | | | | | | | | |
Common Stocks | | | | | | | | | | | | |
Australia | | $ | — | | | $ | 1,728,388 | | | | $— | |
Canada | | | 2,580,922 | | | | — | | | | — | |
China | | | — | | | | 900,962 | | | | — | |
France | | | — | | | | 5,475,789 | | | | — | |
Germany | | | — | | | | 796,475 | | | | — | |
India | | | — | | | | 564,188 | | | | — | |
Italy | | | — | | | | 1,045,345 | | | | — | |
Mexico | | | 1,325,593 | | | | — | | | | — | |
New Zealand | | | — | | | | 556,600 | | | | — | |
Spain | | | — | | | | 5,872,866 | | | | — | |
United Kingdom | | | — | | | | 776,283 | | | | — | |
United States | | | 29,842,472 | | | | — | | | | — | |
Preferred Stocks | | | | | | | | | | | | |
Canada | | | 1,681,233 | | | | — | | | | — | |
United States | | | 1,168,213 | | | | — | | | | — | |
Short-Term Investment | | | | | | | | | | | | |
Affiliated Mutual Fund | | | 956,348 | | | | — | | | | — | |
| | | | | | | | | | | | |
Total | | $ | 37,554,781 | | | $ | 17,716,896 | | | | $— | |
| | | | | | | | | | | | |
Industry Classification:
The industry classification of investments and liabilities in excess of other assets shown as a percentage of net assets as of October 31, 2021 were as follows (unaudited):
| | | | |
Multi-Utilities | | | 17.4 | % |
Oil, Gas & Consumable Fuels | | | 15.8 | |
Electric Utilities | | | 14.2 | |
Road & Rail | | | 10.4 | |
Construction & Engineering | | | 10.3 | |
Transportation Infrastructure | | | 10.1 | |
Independent Power & Renewable Electricity
Producers | | | 5.2 | |
Commercial Services & Supplies | | | 4.6 | |
| | | | |
Equity Real Estate Investment Trusts (REITs) | | | 4.2 | % |
Diversified Telecommunication Services | | | 3.3 | |
Water Utilities | | | 2.9 | |
Affiliated Mutual Fund | | | 1.8 | |
| | | | |
| | | 100.2 | |
Liabilities in excess of other assets | | | (0.2 | ) |
| | | | |
| |
| | | 100.0 | % |
| | | | |
See Notes to Financial Statements.
Statement of Assets and Liabilities
as of October 31, 2021
| | | | |
Assets | | | | |
Investments at value: | | | | |
Unaffiliated investments (cost $41,958,783) | | $ | 54,315,329 | |
Affiliated investments (cost $956,348) | | | 956,348 | |
Foreign currency, at value (cost $46) | | | 46 | |
Tax reclaim receivable | | | 36,983 | |
Receivable for Fund shares sold | | | 26,767 | |
Dividends receivable | | | 13,071 | |
Prepaid expenses | | | 1,209 | |
| | | | |
| |
Total Assets | | | 55,349,753 | |
| | | | |
| |
Liabilities | | | | |
Payable for Fund shares purchased | | | 50,412 | |
Management fee payable | | | 43,722 | |
Audit fee payable | | | 28,001 | |
Accrued expenses and other liabilities | | | 20,929 | |
Custodian and accounting fees payable | | | 17,352 | |
Distribution fee payable | | | 5,250 | |
Affiliated transfer agent fee payable | | | 1,622 | |
Directors’ fees payable | | | 963 | |
| | | | |
Total Liabilities | | | 168,251 | |
| | | | |
| |
Net Assets | | $ | 55,181,502 | |
| | | | |
| |
| | | | | |
Net assets were comprised of: | | | | |
Common stock, at par | | $ | 32 | |
Paid-in capital in excess of par | | | 39,659,602 | |
Total distributable earnings (loss) | | | 15,521,868 | |
| | | | |
| |
Net assets, October 31, 2021 | | $ | 55,181,502 | |
| | | | |
See Notes to Financial Statements.
| | | | |
PGIM Jennison Global Infrastructure Fund | | | 17 | |
Statement of Assets and Liabilities
as of October 31, 2021
| | | | |
Class A | | | | |
| |
Net asset value and redemption price per share, ($ 8,153,258 ÷ 475,482 shares of common stock issued and outstanding) | | $ | 17.15 | |
Maximum sales charge (5.50% of offering price) | | | 1.00 | |
| | | | |
| |
Maximum offering price to public | | $ | 18.15 | |
| | | | |
| |
Class C | | | | |
| |
Net asset value, offering price and redemption price per share, ($4,335,937 ÷ 256,513 shares of common stock issued and outstanding) | | $ | 16.90 | |
| | | | |
| |
Class Z | | | | |
| |
Net asset value, offering price and redemption price per share, ($25,429,343 ÷ 1,482,228 shares of common stock issued and outstanding) | | $ | 17.16 | |
| | | | |
| |
Class R6 | | | | |
| |
Net asset value, offering price and redemption price per share, ($17,262,964 ÷ 1,006,570 shares of common stock issued and outstanding) | | $ | 17.15 | |
| | | | |
See Notes to Financial Statements.
Statement of Operations
Year Ended October 31, 2021
| | | | |
Net Investment Income (Loss) | | | | |
| |
Income | | | | |
Unaffiliated dividend income (net of $62,801 foreign withholding tax) | | $ | 949,882 | |
Affiliated dividend income | | | 1,602 | |
Income from securities lending, net (including affiliated income of $12) | | | 43 | |
| | | | |
Total income | | | 951,527 | |
| | | | |
| |
Expenses | | | | |
Management fee | | | 467,244 | |
Distribution fee(a) | | | 58,662 | |
Custodian and accounting fees | | | 64,945 | |
Transfer agent’s fees and expenses (including affiliated expense of $9,577)(a) | | | 53,434 | |
Registration fees(a) | | | 48,424 | |
Audit fee | | | 29,532 | |
Legal fees and expenses | | | 19,993 | |
Directors’ fees | | | 10,106 | |
Shareholders’ reports | | | 9,269 | |
Miscellaneous | | | 22,471 | |
| | | | |
Total expenses | | | 784,080 | |
Less: Fee waiver and/or expense reimbursement(a) | | | (169,983 | ) |
Distribution fee waiver(a) | | | (3,577 | ) |
| | | | |
Net expenses | | | 610,520 | |
| | | | |
| |
Net investment income (loss) | | | 341,007 | |
| | | | |
| |
| Realized And Unrealized Gain (Loss) On Investment And Foreign Currency Transactions | | | |
| |
Net realized gain (loss) on: | | | | |
Investment transactions | | | 3,943,811 | |
Foreign currency transactions | | | (2,937 | ) |
| | | | |
| | | 3,940,874 | |
| | | | |
| |
Net change in unrealized appreciation (depreciation) on: | | | | |
Investments | | | 5,698,115 | |
Foreign currencies | | | (1,183 | ) |
| | | | |
| | | 5,696,932 | |
| | | | |
Net gain (loss) on investment and foreign currency transactions | | | 9,637,806 | |
| | | | |
Net Increase (Decrease) In Net Assets Resulting From Operations | | $ | 9,978,813 | |
| | | | |
| (a) | Class specific expenses and waivers were as follows: |
| | | | | | | | | | | | | | | | |
| | | Class A | | | Class C | | | Class Z | | | Class R6 | |
Distribution fee | | | 21,460 | | | | 37,202 | | | | — | | | | — | |
Transfer agent’s fees and expenses | | | 13,082 | | | | 5,180 | | | | 35,080 | | | | 92 | |
Registration fees | | | 12,460 | | | | 11,860 | | | | 16,185 | | | | 7,919 | |
Fee waiver and/or expense reimbursement | | | (31,628 | ) | | | (20,232 | ) | | | (92,124 | ) | | | (25,999 | ) |
Distribution fee waiver | | | (3,577 | ) | | | — | | | | — | | | | — | |
See Notes to Financial Statements.
| | | | |
PGIM Jennison Global Infrastructure Fund | | | 19 | |
Statements of Changes in Net Assets
| | | | | | | | |
| | | Year Ended
October 31, | |
| | | 2021 | | | 2020 | |
| | |
Increase (Decrease) in Net Assets | | | | | | | | |
| | |
Operations | | | | | | | | |
Net investment income (loss) | | $ | 341,007 | | | $ | 446,665 | |
Net realized gain (loss) on investment and foreign currency transactions | | | 3,940,874 | | | | 649,332 | |
Net change in unrealized appreciation (depreciation) on investments and foreign currencies | | | 5,696,932 | | | | (3,570,052 | ) |
| | | | | | | | |
Net increase (decrease) in net assets resulting from operations | | | 9,978,813 | | | | (2,474,055 | ) |
| | | | | | | | |
| | |
Dividends and Distributions | | | | | | | | |
Distributions from distributable earnings | | | | | | | | |
Class A | | | (43,709 | ) | | | (61,847 | ) |
Class C | | | (3,222 | ) | | | (15,905 | ) |
Class Z | | | (226,472 | ) | | | (253,973 | ) |
Class R6 | | | (113,926 | ) | | | (102,001 | ) |
| | | | | | | | |
| | | (387,329 | ) | | | (433,726 | ) |
| | | | | | | | |
Tax return of capital distributions | | | | | | | | |
Class A | | | — | | | | (6,071 | ) |
Class C | | | — | | | | (1,561 | ) |
Class Z | | | — | | | | (24,932 | ) |
Class R6 | | | — | | | | (10,013 | ) |
| | | | | | | | |
| | | — | | | | (42,577 | ) |
| | | | | | | | |
| | |
Fund share transactions (Net of share conversions) | | | | | | | | |
Net proceeds from shares sold | | | 20,222,493 | | | | 7,990,286 | |
Net asset value of shares issued in reinvestment of dividends and distributions | | | 386,793 | | | | 473,968 | |
Cost of shares purchased | | | (10,006,347 | ) | | | (16,121,559 | ) |
| | | | | | | | |
Net increase (decrease) in net assets from Fund share transactions | | | 10,602,939 | | | | (7,657,305 | ) |
| | | | | | | | |
Total increase (decrease) | | | 20,194,423 | | | | (10,607,663 | ) |
| | |
Net Assets: | | | | | | | | |
| | |
Beginning of year | | | 34,987,079 | | | | 45,594,742 | |
| | | | | | | | |
| | |
End of year | | $ | 55,181,502 | | | $ | 34,987,079 | |
| | | | | | | | |
See Notes to Financial Statements.
Financial Highlights
| | | | | | | | | | | | | | | | | | | | |
| Class A Shares | |
| | | Year Ended October 31, | |
| | | 2021 | | | 2020 | | | 2019 | | | 2018 | | | 2017 | |
| Per Share Operating Performance(a): | | | | | | | | | | | | | | | | | | | | |
| Net Asset Value, Beginning of Year | | | $13.80 | | | | $14.66 | | | | $12.21 | | | | $13.05 | | | | $11.61 | |
| Income (loss) from investment operations: | | | | | | | | | | | | | | | | | | | | |
| Net investment income (loss) | | | 0.09 | | | | 0.14 | | | | 0.18 | | | | 0.16 | | | | 0.14 | |
| Net realized and unrealized gain (loss) on investment and foreign currency transactions | | | 3.36 | | | | (0.86 | ) | | | 2.49 | | | | (0.81 | ) | | | 1.49 | |
| Total from investment operations | | | 3.45 | | | | (0.72 | ) | | | 2.67 | | | | (0.65 | ) | | | 1.63 | |
| Less Dividends and Distributions: | | | | | | | | | | | | | | | | | | | | |
| Dividends from net investment income | | | (0.10 | ) | | | (0.12 | ) | | | (0.21 | ) | | | (0.19 | ) | | | (0.13 | ) |
| Tax return of capital distributions | | | - | | | | (0.02 | ) | | | (0.01 | ) | | | - | | | | (0.06 | ) |
| Total dividends and distributions | | | (0.10 | ) | | | (0.14 | ) | | | (0.22 | ) | | | (0.19 | ) | | | (0.19 | ) |
| Net asset value, end of year | | | $17.15 | | | | $13.80 | | | | $14.66 | | | | $12.21 | | | | $13.05 | |
| Total Return(b): | | | 25.04 | % | | | (4.93 | )% | | | 22.01 | % | | | (5.10 | )% | | | 14.15 | % |
| | | | | | | | | | | | | | | | | | | | | |
| Ratios/Supplemental Data: | | | | | | | | | | | | | | | |
| Net assets, end of year (000) | | | $8,153 | | | | $5,961 | | | | $7,637 | | | | $8,073 | | | | $11,689 | |
| Average net assets (000) | | | $7,154 | | | | $6,859 | | | | $7,718 | | | | $10,218 | | | | $11,433 | |
| Ratios to average net assets(c)(d): | | | | | | | | | | | | | | | | | | | | |
| Expenses after waivers and/or expense reimbursement | | | 1.50 | % | | | 1.50 | % | | | 1.50 | % | | | 1.50 | % | | | 1.50 | % |
| Expenses before waivers and/or expense reimbursement | | | 1.99 | % | | | 2.20 | % | | | 2.10 | % | | | 2.00 | % | | | 1.81 | % |
| Net investment income (loss) | | | 0.55 | % | | | 0.95 | % | | | 1.34 | % | | | 1.21 | % | | | 1.10 | % |
| Portfolio turnover rate(e) | | | 72 | % | | | 62 | % | | | 62 | % | | | 75 | % | | | 80 | % |
| (a) | Calculated based on average shares outstanding during the year. |
| (b) | Total return does not consider the effects of sales loads. Total return is calculated assuming a purchase of a share on the first day and a sale on the last day of each year reported and includes reinvestment of dividends and distributions, if any. Total returns may reflect adjustments to conform to GAAP. |
| (c) | Does not include expenses of the underlying funds in which the Fund invests. |
| (d) | Effective November 1, 2017, class specific expenses include transfer agent fees and expenses and registration fees, which are charged to their respective share class. |
| (e) | The Fund’s portfolio turnover rate is calculated in accordance with regulatory requirements, without regard to transactions involving short-term investments and certain derivatives. If such transactions were included, the Fund’s portfolio turnover rate may be higher. |
See Notes to Financial Statements.
| | | | |
PGIM Jennison Global Infrastructure Fund | | | 21 | |
Financial Highlights (continued)
| | | | | | | | | | | | | | | | | | | | |
| Class C Shares | |
| | | Year Ended October 31, | |
| | | 2021 | | | 2020 | | | 2019 | | | 2018 | | | 2017 | |
| Per Share Operating Performance(a): | | | | | | | | | | | | | | | | | | | | |
| Net Asset Value, Beginning of Year | | | $13.63 | | | | $14.51 | | | | $12.12 | | | | $12.97 | | | | $11.55 | |
| Income (loss) from investment operations: | | | | | | | | | | | | | | | | | | | | |
| Net investment income (loss) | | | (0.03 | )(b) | | | 0.03 | | | | 0.08 | | | | 0.06 | | | | 0.04 | |
| Net realized and unrealized gain (loss) on investment and foreign currency transactions | | | 3.31 | | | | (0.84 | ) | | | 2.45 | | | | (0.81 | ) | | | 1.50 | |
| Total from investment operations | | | 3.28 | | | | (0.81 | ) | | | 2.53 | | | | (0.75 | ) | | | 1.54 | |
| Less Dividends and Distributions: | | | | | | | | | | | | | | | | | | | | |
| Dividends from net investment income | | | (0.01 | ) | | | (0.05 | ) | | | (0.13 | ) | | | (0.10 | ) | | | (0.08 | ) |
| Tax return of capital distributions | | | - | | | | (0.02 | ) | | | (0.01 | ) | | | - | | | | (0.04 | ) |
| Total dividends and distributions | | | (0.01 | ) | | | (0.07 | ) | | | (0.14 | ) | | | (0.10 | ) | | | (0.12 | ) |
| Net asset value, end of year | | | $16.90 | | | | $13.63 | | | | $14.51 | | | | $12.12 | | | | $12.97 | |
| Total Return(c): | | | 24.10 | % | | | (5.63 | )% | | | 21.01 | % | | | (5.82 | )% | | | 13.39 | % |
| | | | | | | | | | | | | | | | | | | | | |
| Ratios/Supplemental Data: | | | | | | | | | | | | | | | |
| Net assets, end of year (000) | | | $4,336 | | | | $3,242 | | | | $4,135 | | | | $4,162 | | | | $6,101 | |
| Average net assets (000) | | | $3,720 | | | | $3,771 | | | | $4,131 | | | | $5,464 | | | | $6,111 | |
| Ratios to average net assets(d)(e): | | | | | | | | | | | | | | | | | | | | |
| Expenses after waivers and/or expense reimbursement | | | 2.25 | % | | | 2.25 | % | | | 2.25 | % | | | 2.25 | % | | | 2.25 | % |
| Expenses before waivers and/or expense reimbursement | | | 2.79 | % | | | 3.05 | % | | | 2.90 | % | | | 2.81 | % | | | 2.51 | % |
| Net investment income (loss) | | | (0.21 | )% | | | 0.21 | % | | | 0.59 | % | | | 0.48 | % | | | 0.34 | % |
| Portfolio turnover rate(f) | | | 72 | % | | | 62 | % | | | 62 | % | | | 75 | % | | | 80 | % |
| (a) | Calculated based on average shares outstanding during the year. |
| (b) | The per share amount of net investment income (loss) does not directly correlate to the amounts reported in the Statement of Operations due to class specific expenses. |
| (c) | Total return does not consider the effects of sales loads. Total return is calculated assuming a purchase of a share on the first day and a sale on the last day of each year reported and includes reinvestment of dividends and distributions, if any. Total returns may reflect adjustments to conform to GAAP. |
| (d) | Does not include expenses of the underlying funds in which the Fund invests. |
| (e) | Effective November 1, 2017, class specific expenses include transfer agent fees and expenses and registration fees, which are charged to their respective share class. |
| (f) | The Fund’s portfolio turnover rate is calculated in accordance with regulatory requirements, without regard to transactions involving short-term investments and certain derivatives. If such transactions were included, the Fund’s portfolio turnover rate may be higher. |
See Notes to Financial Statements.
| | | | | | | | | | | | | | | | | | | | |
| Class Z Shares | |
| | | Year Ended October 31, | |
| | | 2021 | | | 2020 | | | 2019 | | | 2018 | | | 2017 | |
| Per Share Operating Performance(a): | | | | | | | | | | | | | | | | | | | | |
| Net Asset Value, Beginning of Year | | | $13.80 | | | | $14.66 | | | | $12.21 | | | | $13.06 | | | | $11.61 | |
| Income (loss) from investment operations: | | | | | | | | | | | | | | | | | | | | |
| Net investment income (loss) | | | 0.14 | | | | 0.18 | | | | 0.23 | | | | 0.19 | | | | 0.18 | |
| Net realized and unrealized gain (loss) on investment and foreign currency transactions | | | 3.37 | | | | (0.85 | ) | | | 2.48 | | | | (0.82 | ) | | | 1.49 | |
| Total from investment operations | | | 3.51 | | | | (0.67 | ) | | | 2.71 | | | | (0.63 | ) | | | 1.67 | |
| Less Dividends and Distributions: | | | | | | | | | | | | | | | | | | | | |
| Dividends from net investment income | | | (0.15 | ) | | | (0.17 | ) | | | (0.25 | ) | | | (0.22 | ) | | | (0.14 | ) |
| Tax return of capital distributions | | | - | | | | (0.02 | ) | | | (0.01 | ) | | | - | | | | (0.08 | ) |
| Total dividends and distributions | | | (0.15 | ) | | | (0.19 | ) | | | (0.26 | ) | | | (0.22 | ) | | | (0.22 | ) |
| Net asset value, end of year | | | $17.16 | | | | $13.80 | | | | $14.66 | | | | $12.21 | | | | $13.06 | |
| Total Return(b): | | | 25.42 | % | | | (4.56 | )% | | | 22.30 | % | | | (4.94 | )% | | | 14.51 | % |
| | | | | | | | | | | | | | | | | | | | | |
| Ratios/Supplemental Data: | | | | | | | | | | | | | | | |
| Net assets, end of year (000) | | | $25,429 | | | | $20,148 | | | | $21,868 | | | | $23,074 | | | | $28,831 | |
| Average net assets (000) | | | $24,462 | | | | $21,048 | | | | $21,608 | | | | $27,549 | | | | $29,597 | |
| Ratios to average net assets(c)(d): | | | | | | | | | | | | | | | | | | | | |
| Expenses after waivers and/or expense reimbursement | | | 1.17% | | | | 1.17% | | | | 1.17% | | | | 1.25% | | | | 1.25% | |
| Expenses before waivers and/or expense reimbursement | | | 1.55% | | | | 1.66% | | | | 1.57% | | | | 1.52% | | | | 1.51% | |
| Net investment income (loss) | | | 0.92% | | | | 1.25% | | | | 1.66% | | | | 1.45% | | | | 1.49% | |
| Portfolio turnover rate(e) | | | 72% | | | | 62% | | | | 62% | | | | 75% | | | | 80% | |
| (a) | Calculated based on average shares outstanding during the year. |
| (b) | Total return is calculated assuming a purchase of a share on the first day and a sale on the last day of each year reported and includes reinvestment of dividends and distributions, if any. Total returns may reflect adjustments to conform to GAAP. |
| (c) | Does not include expenses of the underlying funds in which the Fund invests. |
| (d) | Effective November 1, 2017, class specific expenses include transfer agent fees and expenses and registration fees, which are charged to their respective share class. |
| (e) | The Fund’s portfolio turnover rate is calculated in accordance with regulatory requirements, without regard to transactions involving short-term investments and certain derivatives. If such transactions were included, the Fund’s portfolio turnover rate may be higher. |
See Notes to Financial Statements.
| | | | |
PGIM Jennison Global Infrastructure Fund | | | 23 | |
Financial Highlights (continued)
| | | | | | | | | | | | | | | | | | | | | | | | | | | | |
| Class R6 Shares | |
| | | Year Ended October 31, | | | | | | December 28, 2016(a)
through October 31, 2017 | | | | |
|
| | | 2021 | | | 2020 | | | 2019 | | | 2018 | |
| Per Share Operating Performance(b): | | | | | | | | | | | | | | | | | | | | | | | | | | | | |
| Net Asset Value, Beginning of Period | | | $13.80 | | | | $14.66 | | | | $12.21 | | | | $13.06 | | | | | | | | $11.39 | | | | | |
| Income (loss) from investment operations: | | | | | | | | | | | | | | | | | | | | | | | | | | | | |
| Net investment income (loss) | | | 0.12 | | | | 0.18 | | | | 0.23 | | | | 0.18 | | | | | | | | 0.11 | | | | | |
| Net realized and unrealized gain (loss) on investment and foreign currency transactions | | | 3.38 | | | | (0.85 | ) | | | 2.48 | | | | (0.81 | ) | | | | | | | 1.71 | | | | | |
| Total from investment operations | | | 3.50 | | | | (0.67 | ) | | | 2.71 | | | | (0.63 | ) | | | | | | | 1.82 | | | | | |
| Less Dividends and Distributions: | | | | | | | | | | | | | | | | | | | | | | | | | | | | |
| Dividends from net investment income | | | (0.15 | ) | | | (0.17 | ) | | | (0.25 | ) | | | (0.22 | ) | | | | | | | (0.10) | | | | | |
| Tax return of capital distributions | | | - | | | | (0.02 | ) | | | (0.01 | ) | | | - | | | | | | | | (0.05) | | | | | |
| Total dividends and distributions | | | (0.15 | ) | | | (0.19 | ) | | | (0.26 | ) | | | (0.22 | ) | | | | | | | (0.15) | | | | | |
| Net asset value, end of period | | | $17.15 | | | | $13.80 | | | | $14.66 | | | | $12.21 | | | | | | | | $13.06 | | | | | |
| Total Return(c): | | | 25.44 | % | | | (4.62 | )% | | | 22.40 | % | | | (4.94 | )% | | | | | | | 16.02% | | | | | |
| | | | | | | | | | | | | | | | | | | | | | | | | | | | | |
| Ratios/Supplemental Data: | | | | | | | | | | | | | | | | | | | | | |
| Net assets, end of period (000) | | | $17,263 | | | | $5,636 | | | | $11,954 | | | | $13,912 | | | | | | | | $21,979 | | | | | |
| Average net assets (000) | | | $11,389 | | | | $8,565 | | | | $13,787 | | | | $17,657 | | | | | | | | $19,274 | | | | | |
| Ratios to average net assets(d)(e): | | | | | | | | | | | | | | | | | | | | | | | | | | | | |
| Expenses after waivers and/or expense reimbursement | | | 1.17% | | | | 1.17% | | | | 1.17% | | | | 1.25% | | | | | | | | 1.25%(f) | | | | | |
| Expenses before waivers and/or expense reimbursement | | | 1.40% | | | | 1.66% | | | | 1.48% | | | | 1.44% | | | | | | | | 1.40%(f) | | | | | |
| Net investment income (loss) | | | 0.74% | | | | 1.28% | | | | 1.70% | | | | 1.39% | | | | | | | | 1.00%(f) | | | | | |
| Portfolio turnover rate(g) | | | 72% | | | | 62% | | | | 62% | | | | 75% | | | | | | | | 80% | | | | | |
| (a) | Commencement of offering. |
| (b) | Calculated based on average shares outstanding during the period. |
| (c) | Total return is calculated assuming a purchase of a share on the first day and a sale on the last day of each period reported and includes reinvestment of dividends and distributions, if any. Total returns may reflect adjustments to conform to GAAP. Total returns for periods less than one full year are not annualized. |
| (d) | Does not include expenses of the underlying funds in which the Fund invests. |
| (e) | Effective November 1, 2017, class specific expenses include transfer agent fees and expenses and registration fees, which are charged to their respective share class. |
| (g) | The Fund’s portfolio turnover rate is calculated in accordance with regulatory requirements, without regard to transactions involving short-term investments and certain derivatives. If such transactions were included, the Fund’s portfolio turnover rate may be higher. |
See Notes to Financial Statements.
Notes to Financial Statements
1. Organization
Prudential World Fund, Inc. (the “Registered Investment Company” or “RIC”) is registered under the Investment Company Act of 1940, as amended (“1940 Act”), as an open-end management investment company. The RIC is organized as a Maryland Corporation and currently consists of seven separate funds: PGIM Emerging Markets Debt Hard Currency Fund, PGIM Emerging Markets Debt Local Currency Fund, PGIM Jennison Emerging Markets Equity Opportunities Fund, PGIM Jennison Global Infrastructure Fund, PGIM Jennison Global Opportunities Fund, PGIM Jennison International Opportunities Fund and PGIM QMA International Equity Fund. These financial statements relate only to the PGIM Jennison Global Infrastructure Fund (the “Fund”). The Fund is classified as a diversified fund for purposes of the 1940 Act.
The investment objective of the Fund is to seek total return.
2. Accounting Policies
The Fund follows the investment company accounting and reporting guidance of the Financial Accounting Standards Board (“FASB”) Accounting Standard Codification (“ASC”) Topic 946 Financial Services — Investment Companies. The following is a summary of significant accounting policies followed by the Fund in the preparation of its financial statements. The policies conform to U.S. generally accepted accounting principles (“GAAP”). The Fund consistently follows such policies in the preparation of its financial statements.
Securities Valuation: The Fund holds securities and other assets and liabilities that are fair valued as of the close of each day (generally, 4:00 PM Eastern time) the New York Stock Exchange (“NYSE”) is open for trading. As described in further detail below, the Fund’s investments are valued daily based on a number of factors, including the type of investment and whether market quotations are readily available. The RIC’s Board of Directors (the “Board”) has adopted valuation procedures for security valuation under which fair valuation responsibilities have been delegated to PGIM Investments LLC (“PGIM Investments” or the “Manager”). Pursuant to the Board’s delegation, the Manager has established a Valuation Committee responsible for supervising the fair valuation of portfolio securities and other assets and liabilities. The valuation procedures permit the Fund to utilize independent pricing vendor services, quotations from market makers, and alternative valuation methods when market quotations are either not readily available or not deemed representative of fair value. Fair value is the price that would be received to sell an asset or paid to transfer a liability in an orderly transaction between market participants on the measurement date. A record of the Valuation Committee’s actions is subject to the Board’s review at its first quarterly meeting following the quarter in which such actions take place.
| | | | |
PGIM Jennison Global Infrastructure Fund | | | 25 | |
Notes to Financial Statements (continued)
For the fiscal reporting year-end, securities and other assets and liabilities were fair valued at the close of the last U.S. business day. Trading in certain foreign securities may occur when the NYSE is closed (including weekends and holidays). Because such foreign securities trade in markets that are open on weekends and U.S. holidays, the values of some of the Fund’s foreign investments may change on days when investors cannot purchase or redeem Fund shares.
Various inputs determine how the Fund’s investments are valued, all of which are categorized according to the three broad levels (Level 1, 2, or 3) detailed in the Schedule of Investments and referred to herein as the “fair value hierarchy” in accordance with FASB ASC Topic 820 - Fair Value Measurements and Disclosures.
Common or preferred stocks, exchange-traded funds and derivative instruments, if applicable, that are traded on a national securities exchange are valued at the last sale price as of the close of trading on the applicable exchange where the security principally trades. Securities traded via NASDAQ are valued at the NASDAQ official closing price. To the extent these securities are valued at the last sale price or NASDAQ official closing price, they are classified as Level 1 in the fair value hierarchy. In the event that no sale or official closing price on valuation date exists, these securities are generally valued at the mean between the last reported bid and ask prices, or at the last bid price in the absence of an ask price. These securities are classified as Level 2 in the fair value hierarchy.
Foreign equities traded on foreign securities exchanges are generally valued using pricing vendor services that provide model prices derived using adjustment factors based on information such as local closing price, relevant general and sector indices, currency fluctuations, depositary receipts, and futures, as applicable. Securities valued using such model prices are classified as Level 2 in the fair value hierarchy. The models generate an evaluated adjustment factor for each security, which is applied to the local closing price to adjust it for post closing market movements up to the time the Fund is valued. Utilizing that evaluated adjustment factor, the vendor provides an evaluated price for each security. If the vendor does not provide an evaluated price, securities are valued in accordance with exchange-traded common and preferred stock valuation policies discussed above.
Investments in open-end funds (other than exchange-traded funds) are valued at their net asset values as of the close of the NYSE on the date of valuation. These securities are classified as Level 1 in the fair value hierarchy since they may be purchased or sold at their net asset values on the date of valuation.
Securities and other assets that cannot be priced according to the methods described above are valued based on pricing methodologies approved by the Board. In the event that unobservable inputs are used when determining such valuations, the securities will be
classified as Level 3 in the fair value hierarchy. Altering one or more unobservable inputs may result in a significant change to a Level 3 security’s fair value measurement.
When determining the fair value of securities, some of the factors influencing the valuation include: the nature of any restrictions on disposition of the securities; assessment of the general liquidity of the securities; the issuer’s financial condition and the markets in which it does business; the cost of the investment; the size of the holding and the capitalization of the issuer; the prices of any recent transactions or bids/offers for such securities or any comparable securities; any available analyst media or other reports or information deemed reliable by the Manager regarding the issuer or the markets or industry in which it operates. Using fair value to price securities may result in a value that is different from a security’s most recent closing price and from the price used by other unaffiliated mutual funds to calculate their net asset values.
Foreign Currency Translation: The books and records of the Fund are maintained in U.S. dollars. Foreign currency amounts are translated into U.S. dollars on the following basis:
(i) market value of investment securities, other assets and liabilities — at the exchange rate as of the valuation date;
(ii) purchases and sales of investment securities, income and expenses — at the rates of exchange prevailing on the respective dates of such transactions.
Although the net assets of the Fund are presented at the foreign exchange rates and market values at the close of the period, the Fund does not generally isolate that portion of the results of operations arising as a result of changes in the foreign exchange rates from the fluctuations arising from changes in the market prices of long-term portfolio securities held at the end of the period. Similarly, the Fund does not isolate the effect of changes in foreign exchange rates from the fluctuations arising from changes in the market prices of long-term portfolio securities sold during the period. Accordingly, holding period unrealized and realized foreign currency gains (losses) are included in the reported Net change in unrealized appreciation (depreciation) on investments and Net realized gains (losses) on investment transactions on the Statements of Operations.
Net realized gains (losses) on foreign currency transactions represent net foreign exchange gains (losses) from the disposition of holdings of foreign currencies, currency gains (losses) realized between the trade and settlement dates on investment transactions, and the difference between the amounts of interest, dividends and foreign withholding taxes recorded on the Fund’s books and the U.S. dollar equivalent amounts actually received or paid. Net unrealized currency gains (losses) arise from valuing foreign currency denominated assets and liabilities (other than investments) at period end exchange rates.
Master Netting Arrangements: The RIC, on behalf of the Fund, is subject to various Master Agreements, or netting arrangements, with select counterparties. These are agreements which a subadviser may have negotiated and entered into on behalf of all or a portion of the
| | | | |
PGIM Jennison Global Infrastructure Fund | | | 27 | |
Notes to Financial Statements (continued)
Fund. A master netting arrangement between the Fund and the counterparty permits the Fund to offset amounts payable by the Fund to the same counterparty against amounts to be received; and by the receipt of collateral from the counterparty by the Fund to cover the Fund’s exposure to the counterparty. However, there is no assurance that such mitigating factors are easily enforceable. In addition to master netting arrangements, the right to set-off exists when all the conditions are met such that each of the parties owes the other determinable amounts, the reporting party has the right to set-off the amount owed with the amount owed by the other party, the reporting party intends to set-off and the right of set-off is enforceable by law.
Securities Lending: The Fund lends its portfolio securities to banks and broker-dealers. The loans are secured by collateral at least equal to the market value of the securities loaned. Collateral pledged by each borrower is invested in an affiliated money market fund and is marked to market daily, based on the previous day’s market value, such that the value of the collateral exceeds the value of the loaned securities. In the event of significant appreciation in value of securities on loan on the last business day of the reporting period, the financial statements may reflect a collateral value that is less than the market value of the loaned securities. Such shortfall is remedied as described above. Loans are subject to termination at the option of the borrower or the Fund. Upon termination of the loan, the borrower will return to the Fund securities identical to the loaned securities. The remaining maturities of the securities lending transactions are considered overnight and continuous. Should the borrower of the securities fail financially, the Fund has the right to repurchase the securities in the open market using the collateral.
The Fund recognizes income, net of any rebate and securities lending agent fees, for lending its securities in the form of fees or interest on the investment of any cash received as collateral. The borrower receives all interest and dividends from the securities loaned and such payments are passed back to the lender in amounts equivalent thereto, which are reflected in interest income or unaffiliated dividend income based on the nature of the payment on the Statement of Operations. The Fund also continues to recognize any unrealized gain (loss) in the market price of the securities loaned and on the change in the value of the collateral invested that may occur during the term of the loan. In addition, realized gain (loss) is recognized on changes in the value of the collateral invested upon liquidation of the collateral. Net earnings from securities lending are disclosed in the Statement of Operations.
Equity and Mortgage Real Estate Investment Trusts (collectively REITs): The Fund invested in REITs, which report information on the source of their distributions annually. Based on current and historical information, a portion of distributions received from REITs during the period is estimated to be dividend income, capital gain or return of capital and recorded
accordingly. When material, these estimates are adjusted periodically when the actual source of distributions is disclosed by the REITs.
Securities Transactions and Net Investment Income: Securities transactions are recorded on the trade date. Realized gains (losses) from investment and currency transactions are calculated on the specific identification method. Dividend income is recorded on the ex-date, or for certain foreign securities, when the Fund becomes aware of such dividends. Expenses are recorded on an accrual basis, which may require the use of certain estimates by management that may differ from actual. Net investment income or loss (other than class specific expenses and waivers, which are allocated as noted below) and unrealized and realized gains (losses) are allocated daily to each class of shares based upon the relative proportion of adjusted net assets of each class at the beginning of the day. Class specific expenses and waivers, where applicable, are charged to the respective share classes. Such class specific expenses and waivers include distribution fees and distribution fee waivers, shareholder servicing fees, transfer agent’s fees and expenses, registration fees and fee waivers and/or expense reimbursements, as applicable.
Taxes: It is the Fund’s policy to continue to meet the requirements of the Internal Revenue Code applicable to regulated investment companies and to distribute all of its taxable net investment income and capital gains, if any, to its shareholders. Therefore, no federal income tax provision is required. Withholding taxes on foreign dividends, interest and capital gains, if any, are recorded, net of reclaimable amounts, at the time the related income is earned.
Dividends and Distributions: The Fund expects to pay dividends from net investment income quarterly. Distributions from net realized capital and currency gains, if any, are declared and paid annually. Dividends and distributions to shareholders, which are determined in accordance with federal income tax regulations and which may differ from GAAP, are recorded on the ex-date. Permanent book/tax differences relating to income and gain (loss) are reclassified between total distributable earnings (loss) and paid-in capital in excess of par, as appropriate.
Estimates: The preparation of financial statements requires management to make estimates and assumptions that affect the reported amounts and disclosures in the financial statements. Actual results could differ from those estimates.
3. Agreements
The RIC, on behalf of the Fund, has a management agreement with the Manager. Pursuant to this agreement, the Manager has responsibility for all investment advisory services and supervises the subadviser’s performance of such services.
The Manager has entered into a subadvisory agreement with Jennison Associates LLC (“Jennison” or the “subadviser”). The Manager pays for the services of Jennison.
| | | | |
PGIM Jennison Global Infrastructure Fund | | | 29 | |
Notes to Financial Statements (continued)
The management fee paid to the Manager is accrued daily and payable monthly at an annual rate of 1.00% of the Fund’s average daily net assets up to $1 billion, 0.98% of the next $2 billion, 0.96% of the next $2 billion, 0.95% of the next $5 billion and 0.94% of the Fund’s average daily net in excess of $10 billion. The effective management fee rate before any waivers and/or expense reimbursements was 1.00% for the year ended October 31, 2021.
The Manager has contractually agreed, through February 28, 2023, to limit total annual operating expenses after fee waivers and/or expense reimbursements to 1.50% of average daily net assets for Class A shares, 2.25% of average daily net assets for Class C shares, 1.17% of average daily net assets for Class Z shares and 1.17% of average daily net assets for Class R6 shares. This contractual waiver excludes interest, brokerage, taxes (such as income and foreign withholding taxes, stamp duty and deferred tax expenses), acquired fund fees and expenses, extraordinary expenses, and certain other Fund expenses such as dividend and interest expense and broker charges on short sales.
Where applicable, the Manager agrees to waive management fees or shared operating expenses on any share class to the same extent that it waives similar expenses on any other share class. In addition, total annual operating expenses for Class R6 shares will not exceed total annual operating expenses for Class Z shares. Fees and/or expenses waived and/or reimbursed by the Manager may be recouped by the Manager within the same fiscal year during which such waiver and/or reimbursement is made if such recoupment can be realized without exceeding the expense limit in effect at the time of the recoupment for the fiscal year.
The RIC, on behalf of the Fund, has a distribution agreement with Prudential Investment Management Services LLC (“PIMS”), which acts as the distributor of the Class A, Class C, Class Z and Class R6 shares of the Fund. The Fund compensates PIMS for distributing and servicing the Fund’s Class A and Class C shares, pursuant to the plans of distribution (the “Distribution Plans”), regardless of expenses actually incurred by PIMS.
Pursuant to the Distribution Plans, the Fund compensates PIMS for distribution related activities at an annual rate of up to 0.30%, and 1% of the average daily net assets of the Class A and Class C shares, respectively. PIMS has contractually agreed through February 28, 2023 to limit such fees to 0.25% of the average daily net assets of the Class A shares.
The distribution fees are accrued daily and payable monthly. No distribution or service fees are paid to PIMS as distributor of the Class Z and Class R6 shares of the Fund.
For the year ended October 31, 2021, PIMS received $34,339 in front-end sales charges resulting from sales of Class A shares. Additionally, for the year ended October 31, 2021, PIMS received $182 in contingent deferred sales charges imposed upon redemptions by certain Class C shareholders. From these fees, PIMS paid such sales charges to broker-dealers, who in turn paid commissions to salespersons and incurred other distribution costs.
PGIM Investments, PIMS and Jennison are indirect, wholly-owned subsidiaries of Prudential Financial, Inc. (“Prudential”).
4. Other Transactions with Affiliates
Prudential Mutual Fund Services LLC (“PMFS”), an affiliate of PGIM Investments and an indirect, wholly-owned subsidiary of Prudential, serves as the Fund’s transfer agent. Transfer agent’s fees and expenses in the Statement of Operations include certain out-of-pocket expenses paid to non-affiliates, where applicable.
The Fund may invest its overnight sweep cash in the PGIM Core Ultra Short Bond Fund (the “Core Fund”), and its securities lending cash collateral in the PGIM Institutional Money Market Fund (the “Money Market Fund”), each a fund of Prudential Investment Portfolios 2, registered under the 1940 Act and managed by PGIM Investments. PGIM Investments and/or its affiliates are paid fees or reimbursed for providing their services to the Core Fund. In addition to the realized and unrealized gains on investments in the Core Fund and Money Market Fund, earnings from such investments are disclosed on the Statement of Operations as “Affiliated dividend income” and “Income from securities lending, net”, respectively.
The Fund may enter into certain securities purchase or sale transactions under Board approved Rule 17a-7 procedures. Rule 17a-7 is an exemptive rule under the 1940 Act, that subject to certain conditions, permits purchase and sale transactions among affiliated investment companies, or between an investment company and a person that is affiliated solely by reason of having a common (or affiliated) investment adviser, common directors/trustees, and/or common officers. For the year ended October 31, 2021, no 17a-7 transactions were entered into by the Fund.
5. Portfolio Securities
The aggregate cost of purchases and proceeds from sales of portfolio securities (excluding short-term investments and U.S. Government securities) for the year ended October 31, 2021, were $42,941,792 and $32,255,701, respectively.
A summary of the cost of purchases and proceeds from sales of shares of affiliated mutual funds for the year ended October 31, 2021, is presented as follows:
| | | | |
PGIM Jennison Global Infrastructure Fund | | | 31 | |
Notes to Financial Statements (continued)
| | | | | | | | | | | | | | | | | | | | | | | | | | |
Value,
Beginning
of Year | | | Cost of
Purchases | | | Proceeds
from Sales | | | Change in
Unrealized
Gain
(Loss) | | Realized
Gain
(Loss) | | Value,
End of Year | | | Shares,
End
of Year | | | Income | |
| | | | | | | | | | | | | | | | | | | | | | | | | | |
|
| | Short-Term Investments - Affiliated Mutual Funds: | |
|
| | PGIM Core Ultra Short Bond Fund (1)(wa) | |
| | $665,468 | | | | $30,312,130 | | | | $30,021,250 | | | $— | | $— | | | $956,348 | | | | 956,348 | | | | $1,602 | |
|
| | PGIM Institutional Money Market Fund (1)(b)(wa) | |
| | — | | | | 1,604,049 | | | | 1,604,049 | | | — | | — | | | — | | | | — | | | | 12 | (2) |
| | | | | | | | | | | | | | | | | | | | | | | | | | |
| | $665,468 | | | | $31,916,179 | | | | $31,625,299 | | | $— | | $— | | | $956,348 | | | | | | | | $1,614 | |
| | | | | | | | | | | | | | | | | | | | | | | | | | |
| (1) | The Fund did not have any capital gain distributions during the reporting period. |
| (2) | The amount, or a portion thereof, represents the affiliated securities lending income shown on the Statement of Operations. |
| (b) | Represents security, or portion thereof, purchased with cash collateral received for securities on loan and includes dividend reinvestment. |
| (wa) | PGIM Investments LLC, the manager of the Fund, also serves as manager of the PGIM Core Ultra Short Bond Fund and PGIM Institutional Money Market Fund, if applicable. |
6. Distributions and Tax Information
Distributions to shareholders, which are determined in accordance with federal income tax regulations and which may differ from GAAP, are recorded on the ex-date.
For the year ended October 31, 2021, the tax character of dividends paid by the Fund were $338,070 of ordinary income and $49,259 of long-term capital gains. For the year ended October 31, 2020, the tax character of dividends paid by the Fund were $433,726 of ordinary income and $42,577 of tax return of capital.
As of October 31, 2021, the accumulated undistributed earnings on a tax basis was $3,319,305 of long-term capital gains.
The United States federal income tax basis of the Fund’s investments and the net unrealized appreciation as of October 31, 2021 were as follows:
| | | | | | |
| Tax Basis | | Gross Unrealized Appreciation | | Gross Unrealized Depreciation | | Net Unrealized Appreciation |
| $43,069,114 | | $12,763,113 | | $(560,550) | | $12,202,563 |
The difference between GAAP and tax basis was primarily due to deferred losses on wash sales.
The Fund utilized approximately $518,000 of its capital loss carryforward to offset net taxable gains realized in the fiscal year ended October 31, 2021.
The Manager has analyzed the Fund’s tax positions taken on federal, state and local income tax returns for all open tax years and has concluded that no provision for income tax is required in the Fund’s financial statements for the current reporting period. Since tax authorities can examine previously filed tax returns, the Fund’s U.S. federal and state tax returns for each of the four fiscal years up to the most recent fiscal year ended October 31, 2021 are subject to such review.
7. Capital and Ownership
The Fund offers Class A, Class C, Class Z and Class R6 shares. Class A shares are sold with a maximum front-end sales charge of 5.50%. Investors who purchase $1 million or more of Class A shares and sell these shares within 12 months of purchase are subject to a contingent deferred sales charge (“CDSC”) of 1%, although they are not subject to an initial sales charge. The Class A CDSC is waived for certain retirement and/or benefit plans. A special exchange privilege is also available for shareholders who qualified to purchase Class A shares at net asset value. Class C shares are sold with a CDSC of 1% on sales made within 12 months of purchase. Class C shares will automatically convert to Class A shares on a monthly basis approximately eight years (ten years prior to January 22, 2021) after purchase. Class Z and Class R6 shares are not subject to any sales or redemption charges and are available exclusively for sale to a limited group of investors.
Under certain circumstances, an exchange may be made from specified share classes of the Fund to one or more other share classes of the Fund as presented in the table of transactions in shares of common stock, below.
The RIC is authorized to issue 10,225,000,000 shares of common stock, $0.00001 par value per share, 510,000,000 of which are designated as shares of the Fund. The authorized shares of the Fund are currently classified and designated as follows:
| | | | |
Class A | | | 20,000,000 | |
Class C | | | 100,000,000 | |
Class Z | | | 150,000,000 | |
Class T | | | 115,000,000 | |
Class R6 | | | 125,000,000 | |
The Fund currently does not have any Class T shares outstanding.
As of October 31, 2021, Prudential, through its affiliated entities, including affiliated funds (if applicable), owned shares of the Fund as follows:
| | | | | | | | | | |
| | | Number of Shares | | Percentage of Outstanding Shares |
Class Z | | | | 562,035 | | | | | 37.9% | |
Class R6 | | | | 718,792 | | | | | 71.4% | |
| | | | |
PGIM Jennison Global Infrastructure Fund | | | 33 | |
Notes to Financial Statements (continued)
At the reporting period end, the number of shareholders holding greater than 5% of the Fund are as follows:
| | | | | | |
| Affiliated | | Unaffiliated |
Number of Shareholders | | Percentage of
Outstanding Shares | | Number of
Shareholders | | Percentage of
Outstanding Shares |
| 2 | | 39.8% | | 4 | | 47.5% |
Transactions in shares of common stock were as follows:
| | | | | | | | |
Class A | | Shares | | | Amount | |
Year ended October 31, 2021: | | | | | | | | |
Shares sold | | | 89,522 | | | $ | 1,405,312 | |
Shares issued in reinvestment of dividends and distributions | | | 2,766 | | | | 43,504 | |
Shares purchased | | | (57,473 | ) | | | (897,912 | ) |
| | | | | | | | |
Net increase (decrease) in shares outstanding before conversion | | | 34,815 | | | | 550,904 | |
Shares issued upon conversion from other share class(es) | | | 10,887 | | | | 171,733 | |
Shares purchased upon conversion into other share class(es) | | | (2,205 | ) | | | (36,384 | ) |
| | | | | | | | |
Net increase (decrease) in shares outstanding | | | 43,497 | | | $ | 686,253 | |
| | | | | | | | |
Year ended October 31, 2020: | | | | | | | | |
Shares sold | | | 40,098 | | | $ | 569,464 | |
Shares issued in reinvestment of dividends and distributions | | | 4,619 | | | | 67,705 | |
Shares purchased | | | (137,855 | ) | | | (1,881,572 | ) |
| | | | | | | | |
Net increase (decrease) in shares outstanding before conversion | | | (93,138 | ) | | | (1,244,403 | ) |
Shares issued upon conversion from other share class(es) | | | 4,972 | | | | 68,903 | |
Shares purchased upon conversion into other share class(es) | | | (878 | ) | | | (13,161 | ) |
| | | | | | | | |
Net increase (decrease) in shares outstanding | | | (89,044 | ) | | $ | (1,188,661 | ) |
| | | | | | | | |
Class C | | | | | | |
Year ended October 31, 2021: | | | | | | | | |
Shares sold | | | 66,892 | | | $ | 1,050,863 | |
Shares issued in reinvestment of dividends and distributions | | | 202 | | | | 3,137 | |
Shares purchased | | | (30,598 | ) | | | (473,603 | ) |
| | | | | | | | |
Net increase (decrease) in shares outstanding before conversion | | | 36,496 | | | | 580,397 | |
Shares purchased upon conversion into other share class(es) | | | (17,810 | ) | | | (276,678 | ) |
| | | | | | | | |
Net increase (decrease) in shares outstanding | | | 18,686 | | | $ | 303,719 | |
| | | | | | | | |
Year ended October 31, 2020: | | | | | | | | |
Shares sold | | | 6,868 | | | $ | 98,374 | |
Shares issued in reinvestment of dividends and distributions | | | 1,083 | | | | 15,727 | |
Shares purchased | | | (48,016 | ) | | | (671,692 | ) |
| | | | | | | | |
Net increase (decrease) in shares outstanding before conversion | | | (40,065 | ) | | | (557,591 | ) |
Shares purchased upon conversion into other share class(es) | | | (7,028 | ) | | | (100,339 | ) |
| | | | | | | | |
Net increase (decrease) in shares outstanding | | | (47,093 | ) | | $ | (657,930 | ) |
| | | | | | | | |
| | | | | | | | |
Class Z | | Shares | | | Amount | |
Year ended October 31, 2021: | | | | | | | | |
Shares sold | | | 582,606 | | | $ | 8,944,074 | |
Shares issued in reinvestment of dividends and distributions | | | 14,369 | | | | 226,226 | |
Shares purchased | | | (436,186 | ) | | | (6,746,807 | ) |
| | | | | | | | |
Net increase (decrease) in shares outstanding before conversion | | | 160,789 | | | | 2,423,493 | |
Shares issued upon conversion from other share class(es) | | | 8,893 | | | | 141,329 | |
Shares purchased upon conversion into other share class(es) | | | (146,971 | ) | | | (2,357,668 | ) |
| | | | | | | | |
Net increase (decrease) in shares outstanding | | | 22,711 | | | $ | 207,154 | |
| | | | | | | | |
Year ended October 31, 2020: | | | | | | | | |
Shares sold | | | 246,053 | | | $ | 3,526,924 | |
Shares issued in reinvestment of dividends and distributions | | | 19,133 | | | | 278,522 | |
Shares purchased | | | (299,875 | ) | | | (4,159,893 | ) |
| | | | | | | | |
Net increase (decrease) in shares outstanding before conversion | | | (34,689 | ) | | | (354,447 | ) |
Shares issued upon conversion from other share class(es) | | | 2,853 | | | | 44,597 | |
| | | | | | | | |
Net increase (decrease) in shares outstanding | | | (31,836 | ) | | $ | (309,850 | ) |
| | | | | | | | |
Class R6 | | | | | | |
Year ended October 31, 2021: | | | | | | | | |
Shares sold | | | 562,092 | | | $ | 8,822,244 | |
Shares issued in reinvestment of dividends and distributions | | | 7,162 | | | | 113,926 | |
Shares purchased | | | (118,014 | ) | | | (1,888,025 | ) |
| | | | | | | | |
Net increase (decrease) in shares outstanding before conversion | | | 451,240 | | | | 7,048,145 | |
Shares issued upon conversion from other share class(es) | | | 146,971 | | | | 2,357,668 | |
| | | | | | | | |
Net increase (decrease) in shares outstanding | | | 598,211 | | | $ | 9,405,813 | |
| | | | | | | | |
Year ended October 31, 2020: | | | | | | | | |
Shares sold | | | 261,907 | | | $ | 3,795,524 | |
Shares issued in reinvestment of dividends and distributions | | | 7,666 | | | | 112,014 | |
Shares purchased | | | (676,564 | ) | | | (9,408,402 | ) |
| | | | | | | | |
Net increase (decrease) in shares outstanding | | | (406,991 | ) | | $ | (5,500,864 | ) |
| | | | | | | | |
8. Borrowings
The RIC, on behalf of the Fund, along with other affiliated registered investment companies (the “Participating Funds”), is a party to a Syndicated Credit Agreement (“SCA”) with a group of banks. The purpose of the SCA is to provide an alternative source of temporary funding for capital share redemptions. The table below provides details of the current SCA in effect at the reporting period-end as well as the prior SCA.
| | | | |
| | | Current SCA | | Prior SCA |
Term of Commitment | | 10/1/2021 – 9/29/2022 | | 10/2/2020 – 9/30/2021 |
| | | |
Total Commitment | | $ 1,200,000,000 | | $ 1,200,000,000 |
| | | |
| Annualized Commitment Fee on the Unused Portion of the SCA | | 0.15% | | 0.15% |
| | | |
| Annualized Interest Rate on Borrowings | | 1.20% plus the higher of (1) the effective federal funds rate, (2) the one-month LIBOR rate or (3) zero percent | | 1.30% plus the higher of (1) the effective federal funds rate, (2) the one-month LIBOR rate or (3) zero percent |
Certain affiliated registered investment companies that are parties to the SCA include portfolios that are subject to a predetermined mathematical formula used to manage certain
| | | | |
PGIM Jennison Global Infrastructure Fund | | | 35 | |
Notes to Financial Statements (continued)
benefit guarantees offered under variable annuity contracts. The formula may result in large scale asset flows into and out of these portfolios. Consequently, these portfolios may be more likely to utilize the SCA for purposes of funding redemptions. It may be possible for those portfolios to fully exhaust the committed amount of the SCA, thereby requiring the Manager to allocate available funding per a Board-approved methodology designed to treat the Participating Funds in the SCA equitably.
The Fund utilized the SCA during the year ended October 31, 2021. The average daily balance for the 6 days that the Fund had loans outstanding during the period was approximately $257,333, borrowed at a weighted average interest rate of 1.41%. The maximum loan outstanding amount during the period was $285,000. At October 31, 2021, the Fund did not have an outstanding loan amount.
9. Risks of Investing in the Fund
The Fund’s risks include, but are not limited to, some or all of the risks discussed below. For further information on the Fund’s risks, please refer to the Fund’s Prospectus and Statement of Additional Information.
Blend Style Risk: The Fund’s blend investment style may subject the Fund to risks of both value and growth investing. The portion of the Fund’s portfolio that makes investments pursuant to a growth strategy may be subject to above-average fluctuations as a result of seeking higher than average capital growth. The portion of the Fund’s portfolio that makes investments pursuant to a value strategy may be subject to the risk that the market may not recognize a security’s intrinsic value for long periods of time or at all, or that a stock judged to be undervalued may actually be appropriately priced or overvalued. Issuers of value stocks may have experienced adverse business developments or may be subject to special risks that have caused the stock to be out of favor. If the Fund’s assessment of market conditions or a company’s value is inaccurate, the Fund could suffer losses or produce poor performance relative to other funds. Historically, growth stocks have performed best during later stages of economic expansion and value stocks have performed best during periods of economic recovery. Therefore, both styles may over time go in and out of favor with the markets. At times when a style is out of favor, that portion of the portfolio may lag the other portion of the portfolio, which may cause the Fund to underperform the market in general, its benchmark and other mutual funds. Growth and value stocks have historically produced similar long-term results, though each category has periods when it outperforms the other.
Cyber Security Risk: Failures or breaches of the electronic systems of the Fund, the Fund’s manager, subadviser, distributor, and other service providers, or the issuers of securities in which the Fund invests have the ability to cause disruptions and negatively impact the Fund’s business operations, potentially resulting in financial losses to the Fund and its
shareholders. While the Fund has established business continuity plans and risk management systems seeking to address system breaches or failures, there are inherent limitations in such plans and systems. Furthermore, the Fund cannot control the cyber security plans and systems of the Fund’s service providers or issuers of securities in which the Fund invests.
Distribution Risk: The Fund’s distributions may consist of net investment income, if any, and net realized gains, if any, from the sale of investments and/or return of capital. The Fund will provide to shareholders early in each calendar year the final tax character of the Fund’s distributions for the previous year. Also, at such time that the Fund distribution is expected to be from sources other than current or accumulated net income, a notice to shareholders may be required.
Economic Risk and Market Events Risk: Events in the U.S. and global financial markets, including actions taken by the U.S. Federal Reserve or foreign central banks to stimulate or stabilize economic growth or the functioning of the securities markets, may at times result in unusually high market volatility, which could negatively impact performance. Relatively reduced liquidity in credit and fixed income markets could adversely affect issuers worldwide.
Emerging Markets Risk: The risks of foreign investments are greater for investments in or exposed to emerging markets. Emerging market countries typically have economic and political systems that are less fully developed, and can be expected to be less stable, than those of more developed countries. For example, the economies of such countries can be subject to rapid and unpredictable rates of inflation or deflation. Low trading volumes may result in a lack of liquidity and price volatility. Emerging market countries may have policies that restrict investment by non-U.S. investors, or that prevent non-U.S. investors from withdrawing their money at will.
The Fund may invest in some emerging markets that subject it to risks such as those associated with illiquidity, custody of assets, different settlement and clearance procedures and asserting legal title under a developing legal and regulatory regime to a greater degree than in developed markets or even in other emerging markets.
Equity and Equity-Related Securities Risk: Equity and equity-related securities may be subject to changes in value, and their values may be more volatile than those of other asset classes. In addition to an individual security losing value, the value of the equity markets or a sector in which the Fund invests could go down. Different parts of a market can react differently to adverse issuer, market, regulatory, political and economic developments.
Foreign Securities Risk: Investments in securities of non-U.S. issuers (including those denominated in U.S. dollars) may involve more risk than investing in securities of U.S. issuers. Foreign political, economic and legal systems, especially those in developing and emerging market countries, may be less stable and more volatile than in the United States. Foreign legal systems generally have fewer regulatory requirements than the U.S. legal
| | | | |
PGIM Jennison Global Infrastructure Fund | | | 37 | |
Notes to Financial Statements (continued)
system, particularly those of emerging markets. In general, less information is publicly available with respect to non-U.S. companies than U.S. companies. Non-U.S. companies generally are not subject to the same accounting, auditing, and financial reporting standards as are U.S. companies. Additionally, the changing value of foreign currencies and changes in exchange rates could also affect the value of the assets the Fund holds and the Fund’s performance. Certain foreign countries may impose restrictions on the ability of issuers of foreign securities to make payment of principal and interest or dividends to investors located outside the country, due to blockage of foreign currency exchanges or otherwise. Investments in emerging markets are subject to greater volatility and price declines.
In addition, the Fund’s investments in non-U.S. securities may be subject to the risks of nationalization or expropriation of assets, imposition of currency exchange controls or restrictions on the repatriation of non-U.S. currency, confiscatory taxation and adverse diplomatic developments. Special U.S. tax considerations may apply.
Increase in Expenses Risk: Your actual cost of investing in the Fund may be higher than the expenses shown in the expense table in the Fund’s prospectus for a variety of reasons. For example, expense ratios may be higher than those shown if average net assets decrease. Net assets are more likely to decrease and Fund expense ratios are more likely to increase when markets are volatile. Active and frequent trading of Fund securities can increase expenses.
Infrastructure Companies Risk: Securities of infrastructure companies are more susceptible to adverse economic, social, political and regulatory occurrences affecting their industries. Infrastructure companies may be subject to a variety of factors that may adversely affect their business or operations, including high interest costs in connection with capital construction programs, high leverage, costs associated with environmental and other regulations, the effects of economic slowdown, surplus capacity, insufficient supply of necessary resources, increased competition from other providers of similar services, uncertainties concerning the availability of fuel at reasonable prices, the effects of energy conservation policies and other factors. Certain infrastructure companies may operate in limited areas or have few sources of revenue. Infrastructure companies may also be affected by or subject to:
∎ regulation by various government authorities;
∎ government regulation of rates charged to customers;
∎ service interruption due to environmental, operational or other mishaps as well as political and social unrest;
∎ the imposition of special tariffs and changes in tax laws, regulatory policies and accounting standards; and
∎ general changes in market sentiment towards the assets of infrastructure companies.
Large Shareholder and Large Scale Redemption Risk: Certain individuals, accounts, funds (including funds affiliated with the Manager) or institutions, including the Manager and its affiliates, may from time to time own or control a substantial amount of the Fund’s shares. There is no requirement that these entities maintain their investment in the Fund. There is a risk that such large shareholders or that the Fund’s shareholders generally may redeem all or a substantial portion of their investments in the Fund in a short period of time, which could have a significant negative impact on the Fund’s NAV, liquidity, and brokerage costs. Large redemptions could also result in tax consequences to shareholders and impact the Fund’s ability to implement its investment strategy. The Fund’s ability to pursue its investment objective after one or more large scale redemptions may be impaired and, as a result, the Fund may invest a larger portion of its assets in cash or cash equivalents.
Liquidity Risk: Liquidity risk is the risk that the Fund could not meet requests to redeem shares issued by the Fund without significant dilution of remaining investors’ interests in the Fund. The Fund may invest in instruments that trade in lower volumes and are more illiquid than other investments. If the Fund is forced to sell these investments to pay redemption proceeds or for other reasons, the Fund may lose money. In addition, when there is no willing buyer and investments cannot be readily sold at the desired time or price, the Fund may have to accept a lower price or may not be able to sell the instrument at all. An inability to sell a portfolio position can adversely affect the Fund’s value or prevent the Fund from being able to take advantage of other investment opportunities.
Management Risk: The value of your investment may decrease if judgments by the subadviser about the attractiveness, value or market trends affecting a particular security, industry or sector or about market movements are incorrect.
Market Capitalization Risk: The Fund may invest in companies of any market capitalization. Generally, the stock prices of small- and mid-cap companies are less stable than the prices of large-cap stocks and may present greater risks. Large capitalization companies as a group could fall out of favor with the market, causing the Fund to underperform compared to investments that focus on smaller capitalized companies.
Market Disruption and Geopolitical Risks: International wars or conflicts and geopolitical developments in foreign countries, along with instability in regions such as Asia, Eastern Europe, and the Middle East, possible terrorist attacks in the United States or around the world, public health epidemics such as the outbreak of infectious diseases like the outbreak of COVID-19 globally in 2020 or the 2014–2016 outbreak in West Africa of the Ebola virus, and other similar events could adversely affect the U.S. and foreign financial markets, including increases in market volatility, reduced liquidity in the securities markets and government intervention, and may cause further long-term economic uncertainties in the United States and worldwide generally. The coronavirus pandemic and the related governmental and public responses have had and may continue to have an impact on the Fund’s investments and net asset value and have led and may continue to lead to increased
| | | | |
PGIM Jennison Global Infrastructure Fund | | | 39 | |
Notes to Financial Statements (continued)
market volatility and the potential for illiquidity in certain classes of securities and sectors of the market. Preventative or protective actions that governments may take in respect of pandemic or epidemic diseases may result in periods of business disruption, business closures, inability to obtain raw materials, supplies and component parts, and reduced or disrupted operations for the issuers in which the Fund invests. Government intervention in markets may impact interest rates, market volatility and security pricing. The occurrence, reoccurrence and pendency of such diseases could adversely affect the economies (including through changes in business activity and increased unemployment) and financial markets either in specific countries or worldwide.
Market Risk: Securities markets may be volatile and the market prices of the Fund’s securities may decline. Securities fluctuate in price based on changes in an issuer’s financial condition and overall market and economic conditions. If the market prices of the securities owned by the Fund fall, the value of your investment in the Fund will decline.
Master Limited Partnerships Risk: The risks of investing in an MLP are generally those involved in investing in a partnership as opposed to a corporation. For example, state law governing partnerships is often less restrictive than state law governing corporations. Accordingly, there may be fewer protections afforded investors in an MLP than investors in a corporation. Investments held by MLPs may be relatively illiquid, limiting the MLPs’ ability to vary their portfolios promptly in response to changes in economic or other conditions. MLPs may have limited financial resources, their securities may trade infrequently and in limited volume, and they may be subject to more abrupt or erratic price movements than securities of larger or more broadly-based companies. The Fund’s investment in MLPs also subjects the Fund to the risks associated with the specific industry or industries in which the MLPs invest, risks related to limited control and limited rights to vote on matters affecting the MLP, risks related to potential conflicts of interest between the MLP and the MLP’s general partner, cash flow risks, dilution risks and risks related to the general partner’s right to require unit-holders to sell their common units at an undesirable time or price. MLPs are generally considered interest-rate sensitive investments. During periods of interest rate volatility, these investments may not provide attractive returns. Since MLPs generally conduct business in multiple states, the Fund may be subject to income or franchise tax in each of the states in which the partnership does business. The additional cost of preparing and filing the tax returns and paying the related taxes may adversely impact the Fund’s return on its investment in MLPs.
Real Estate Investment Trust (REIT) Risk: Investing in REITs involves certain unique risks in addition to those risks associated with investing in the real estate industry in general. REITs may be affected by changes in the value of the underlying property owned by the REITs, while mortgage REITs may be affected by the quality of any credit extended. REITs are dependent upon management skills, may not be diversified geographically or by
property/mortgage asset type, and are subject to heavy cash flow dependency, default by borrowers and self-liquidation. REITs may be more volatile and/or more illiquid than other types of equity securities. REITs (especially mortgage REITs) are subject to interest rate risks. REITs may incur significant amounts of leverage. The Fund will indirectly bear a portion of the expenses, including management fees, paid by each REIT in which it invests, in addition to the expenses of the Fund.
REITs must also meet certain requirements under the Internal Revenue Code of 1986, as amended (the Code) to avoid entity level tax and be eligible to pass-through certain tax attributes of their income to shareholders. REITs are consequently subject to the risk of failing to meet these requirements for favorable tax treatment and of failing to maintain their exemptions from registration under the Investment Company Act of 1940. REITs are subject to the risks of changes in the Code affecting their tax status.
10. Recent Regulatory Developments
On December 3, 2020, the SEC announced that it voted to adopt a new rule that establishes an updated regulatory framework for fund valuation practices (the “Rule”). The Rule, in part, provides (i) a framework for determining fair value in good faith and (ii) provides for a fund Board’s assignment of its responsibility for the execution of valuation-related activities to a fund’s investment adviser. Further, the SEC is rescinding previously issued guidance on related issues. The Rule took effect on March 8, 2021, with a compliance date of September 8, 2022. Management is currently evaluating the Rule and its impact to the Fund.
| | | | |
PGIM Jennison Global Infrastructure Fund | | | 41 | |
Report of Independent Registered Public
Accounting Firm
To the Board of Directors of Prudential World Fund, Inc. and Shareholders of PGIM Jennison Global Infrastructure Fund
Opinion on the Financial Statements
We have audited the accompanying statement of assets and liabilities, including the schedule of investments, of PGIM Jennison Global Infrastructure Fund (one of the funds constituting Prudential World Fund, Inc., referred to hereafter as the “Fund”) as of October 31, 2021, the related statement of operations for the year ended October 31, 2021, the statement of changes in net assets for each of the two years in the period ended October 31, 2021, including the related notes, and financial highlights for each of the two years in the period ended October 31, 2021 (collectively referred to as the “financial statements”). In our opinion, the financial statements present fairly, in all material respects, the financial position of the Fund as of October 31, 2021, the results of its operations for the year then ended, and the changes in its net assets and the financial highlights for each of the two years in the period ended October 31, 2021 in conformity with accounting principles generally accepted in the United States of America.
The financial statements of the Fund as of and for the year ended October 31, 2019 and the financial highlights for each of the periods ended on or prior to October 31, 2019 (not presented herein, other than the financial highlights) were audited by other auditors whose report dated December 19, 2019 expressed an unqualified opinion on those financial statements and financial highlights.
Basis for Opinion
These financial statements are the responsibility of the Fund’s management. Our responsibility is to express an opinion on the Fund’s financial statements based on our audits. We are a public accounting firm registered with the Public Company Accounting Oversight Board (United States) (PCAOB) and are required to be independent with respect to the Fund in accordance with the U.S. federal securities laws and the applicable rules and regulations of the Securities and Exchange Commission and the PCAOB.
We conducted our audits of these financial statements in accordance with the standards of the PCAOB. Those standards require that we plan and perform the audit to obtain reasonable assurance about whether the financial statements are free of material misstatement, whether due to error or fraud.
Our audits included performing procedures to assess the risks of material misstatement of the financial statements, whether due to error or fraud, and performing procedures that respond to those risks. Such procedures included examining, on a test basis, evidence regarding the amounts and disclosures in the financial statements. Our audits also included evaluating the accounting principles used and significant estimates made by management, as well as evaluating the overall presentation of the financial statements. Our procedures included confirmation of securities owned as of October 31, 2021 by correspondence with the custodian and transfer agent. We believe that our audits provide a reasonable basis for our opinion.
/s/PricewaterhouseCoopers LLP
New York, New York
December 16, 2021
We have served as the auditor of one or more investment companies in the PGIM Retail Funds complex since 2020.
Tax Information (unaudited)
For the year ended October 31, 2021, the Series reports under Section 854 of the Internal Revenue Code, the following percentages of the ordinary income dividends paid as 1) qualified dividend income (QDI); and 2) eligible for corporate dividends received deduction (DRD):
| | | | | | | | |
| | | QDI | | | DRD | |
PGIM Jennison Global Infrastructure Fund | | | 100.00 | % | | | 89.69 | % |
In January 2022, you will be advised on IRS Form 1099-DIV or substitute 1099-DIV, as to the federal tax status of dividends and distributions received by you in calendar year 2021.
| | | | |
PGIM Jennison Global Infrastructure Fund | | | 43 | |
INFORMATION ABOUT BOARD MEMBERS AND OFFICERS (unaudited)
Information about Board Members and Officers of the Fund is set forth below. Board Members who are not deemed to be “interested persons” of the Fund, as defined in the 1940 Act, are referred to as “Independent Board Members.” Board Members who are deemed to be “interested persons” of the Fund are referred to as “Interested Board Members.” The Board Members are responsible for the overall supervision of the operations of the Fund and perform the various duties imposed on the directors of investment companies by the 1940 Act. The Board in turn elects the Officers, who are responsible for administering the day-to-day operations of the Fund.
| | | | | | |
| Independent Board Members | | | | |
| | | | |
Name Year of Birth Position(s) Portfolios Overseen | | Principal Occupation(s) During Past Five Years | | Other Directorships Held During Past Five Years | | Length of Board Service |
| | | | |
Ellen S. Alberding 1958 Board Member Portfolios Overseen: 95 | | President and Board Member, The Joyce Foundation (charitable foundation) (since 2002); formerly Vice Chair, City Colleges of Chicago (community college system) (2011-2015); Trustee, National Park Foundation (charitable foundation for national park system) (2009-2018); Trustee, Economic Club of Chicago (2009-2016); Trustee, Loyola University (since 2018). | | None. | | Since September 2013 |
| | | | |
Kevin J. Bannon 1952 Board Member Portfolios Overseen: 95 | | Retired; formerly Managing Director (April 2008-May 2015) and Chief Investment Officer (October 2008-November 2013) of Highmount Capital LLC (registered investment adviser); formerly Executive Vice President and Chief Investment Officer (April 1993-August 2007) of Bank of New York Company; President (May 2003-May 2007) of BNY Hamilton Family of Mutual Funds. | | Director of Urstadt Biddle Properties (equity real estate investment trust) (since September 2008). | | Since July 2008 |
PGIM Jennison Global Infrastructure Fund
| | | | | | |
Independent Board Members | | | | |
| | | | |
Name Year of Birth Position(s) Portfolios Overseen | | Principal Occupation(s) During Past Five Years | | Other Directorships Held During Past Five Years | | Length of
Board Service |
| | | | |
Linda W. Bynoe 1952 Board Member Portfolios Overseen: 92 | | President and Chief Executive Officer (since March 1995) and formerly Chief Operating Officer (December 1989-February 1995) of Telemat Limited LLC (formerly Telemat Ltd) (management consulting); formerly Vice President (January 1985-June 1989) at Morgan Stanley & Co. (broker-dealer). | | Trustee of Equity Residential (residential real estate) (since December 2009); Director of Northern Trust Corporation (financial services) (since April 2006); formerly Director of Anixter International, Inc. (communication products distributor) (January 2006-June 2020). | | Since March 2005 |
| | | | |
Barry H. Evans 1960 Board Member Portfolios Overseen: 94 | | Retired; formerly President (2005-2016), Global Chief Operating Officer (2014-2016), Chief Investment Officer - Global Head of Fixed Income (1998-2014), and various portfolio manager roles (1986-2006), Manulife Asset Management (asset management). | | Formerly Director, Manulife Trust Company (2011-2018); formerly Director, Manulife Asset Management Limited (2015-2017); formerly Chairman of the Board of Directors of Manulife Asset Management U.S. (2005-2016); formerly Chairman of the Board, Declaration Investment Management and Research (2008-2016). | | Since September 2017 |
| | | | |
Keith F. Hartstein 1956 Board Member & Independent Chair Portfolios Overseen: 95 | | Retired; Executive Committee of the Independent Directors Council (IDC) Board of Governors (since October 2019); Member (since November 2014) of the Governing Council of the IDC (organization of independent mutual fund directors); formerly President and Chief Executive Officer (2005-2012), Senior Vice President (2004-2005), Senior Vice President of Sales and Marketing (1997-2004), and various executive management positions (1990-1997), John Hancock Funds, LLC (asset management); Chairman, Investment Company Institute’s Sales Force Marketing Committee (2003-2008). | | None. | | Since September 2013 |
Visit our website at pgim.com/investments
| | | | | | |
Independent Board Members | | | | |
| | | | |
Name Year of Birth Position(s) Portfolios Overseen | | Principal Occupation(s) During Past Five Years | | Other Directorships Held During Past Five Years | | Length of
Board Service |
| | | | |
Laurie Simon Hodrick 1962 Board Member Portfolios Overseen: 91 | | A. Barton Hepburn Professor Emerita of Economics in the Faculty of Business, Columbia Business School (since 2018); Visiting Fellow at the Hoover Institution, Stanford University (since 2015); Sole Member, ReidCourt LLC (since 2008) (a consulting firm); formerly Visiting Professor of Law, Stanford Law School (2015-2021); formerly A. Barton Hepburn Professor of Economics in the Faculty of Business, Columbia Business School (1996-2017); formerly Managing Director, Global Head of Alternative Investment Strategies, Deutsche Bank (2006-2008). | | Independent Director, Roku (since December 2020) (communication services); formerly Independent Director, Synnex Corporation (2019-2021) (information technology); formerly Independent Director, Kabbage, Inc. (2018-2020) (financial services); formerly Independent Director, Corporate Capital Trust (2017-2018) (a business development company). | | Since September 2017 |
| | | | |
Brian K. Reid 1961 Board Member Portfolios Overseen: 94 | | Retired; formerly Chief Economist for the Investment Company Institute (ICI) (2005-2017); formerly Senior Economist and Director of Industry and Financial Analysis at the ICI (1998-2004); formerly Senior Economist, Industry and Financial Analysis at the ICI (1996-1998); formerly Staff Economist at the Federal Reserve Board (1989-1996); Director, ICI Mutual Insurance Company (2012-2017). | | None. | | Since March 2018 |
PGIM Jennison Global Infrastructure Fund
| | | | | | |
| Independent Board Members | | | | |
| | | | |
Name Year of Birth Position(s) Portfolios Overseen | | Principal Occupation(s) During Past Five Years | | Other Directorships Held During Past Five Years | | Length of
Board Service |
| | | | |
Grace C. Torres 1959 Board Member Portfolios Overseen: 94 | | Retired; formerly Treasurer and Principal Financial and Accounting Officer of the PGIM Funds, Target Funds, Advanced Series Trust, Prudential Variable Contract Accounts and The Prudential Series Fund (1998-June 2014); Assistant Treasurer (March 1999-June 2014) and Senior Vice President (September 1999-June 2014) of PGIM Investments LLC; Assistant Treasurer (May 2003-June 2014) and Vice President (June 2005-June 2014) of AST Investment Services, Inc.; Senior Vice President and Assistant Treasurer (May 2003-June 2014) of Prudential Annuities Advisory Services, Inc. | | Director (since January 2018) of OceanFirst Financial Corp. and OceanFirst Bank; formerly Director (July 2015-January 2018) of Sun Bancorp, Inc. N.A. and Sun National Bank. | | Since November 2014 |
| | | | | | |
| Interested Board Members | | | | |
| | | | |
Name Year of Birth Position(s) Portfolios Overseen | | Principal Occupation(s) During Past Five Years | | Other Directorships Held During Past Five Years | | Length of
Board Service |
| | | | |
Stuart S. Parker 1962 Board Member & President Portfolios Overseen: 94 | | President, Chief Executive Officer, Chief Operating Officer and Officer in Charge of PGIM Investments LLC (formerly known as Prudential Investments LLC) (since January 2012); formerly Executive Vice President of Jennison Associates LLC and Head of Retail Distribution of PGIM Investments LLC (June 2005-December 2011); Investment Company Institute - Board of Governors (since May 2012). | | None. | | Since January 2012 |
Visit our website at pgim.com/investments
| | | | | | |
| Interested Board Members | | | | |
| | | | |
Name Year of Birth Position(s) Portfolios Overseen | | Principal Occupation(s) During Past Five Years | | Other Directorships Held During Past Five Years | | Length of
Board Service |
| | | | |
Scott E. Benjamin 1973 Board Member & Vice President Portfolios Overseen: 95 | | Executive Vice President (since May 2009) of PGIM Investments LLC; Vice President (since June 2012) of Prudential Investment Management Services LLC; Executive Vice President (since September 2009) of AST Investment Services, Inc.; Senior Vice President of Product Development and Marketing, PGIM Investments (since February 2006); formerly Vice President of Product Development and Product Management, PGIM Investments LLC (2003-2006). | | None. | | Since March 2010 |
(1) The year that each Board Member joined the Board is as follows:
Ellen S. Alberding, 2013; Kevin J. Bannon, 2008; Linda W. Bynoe, 2005; Barry H. Evans, 2017; Keith F. Hartstein, 2013; Laurie Simon Hodrick, 2017; Michael S. Hyland, 2008; Richard A. Redeker, 1993; Stephen G. Stoneburn, 2003; Stuart S. Parker, Board Member since 2012 and President since 2012; Scott E. Benjamin, Board Member since 2010 and Vice President since 2009; Grace C. Torres, 2014.
| | | | |
| Fund Officers(a) | | | | |
| | | |
Name Year of Birth Fund Position | | Principal Occupation(s) During Past Five Years | | Length of
Service as Fund
Officer |
| | | |
Claudia DiGiacomo 1974 Chief Legal Officer | | Chief Legal Officer, Executive Vice President and Secretary of PGIM Investments LLC (since August 2020); Chief Legal Officer of Prudential Mutual Fund Services LLC (since August 2020); Chief Legal Officer of PIFM Holdco, LLC (since August 2020); Vice President and Corporate Counsel (since January 2005) of Prudential; and Corporate Counsel of AST Investment Services, Inc. (since August 2020); formerly Vice President and Assistant Secretary of PGIM Investments LLC (2005-2020); formerly Associate at Sidley Austin Brown & Wood LLP (1999-2004). | | Since December 2005 |
PGIM Jennison Global Infrastructure Fund
| | | | |
| Fund Officers(a) | | | | |
| | | |
Name Year of Birth Fund Position | | Principal Occupation(s) During Past Five Years | | Length of
Service as Fund
Officer |
| | | |
Dino Capasso 1974 Chief Compliance Officer | | Chief Compliance Officer (since July 2019) of PGIM Investments LLC; Chief Compliance Officer (since July 2019) of the PGIM Funds, Target Funds, Advanced Series Trust, The Prudential Series Fund, Prudential’s Gibraltar Fund, Inc., PGIM Global High Yield Fund, Inc., PGIM High Yield Bond Fund, Inc., and PGIM Short Duration High Yield Opportunities Fund; Vice President and Deputy Chief Compliance Officer (June 2017-2019) of PGIM Investments LLC; formerly Senior Vice President and Senior Counsel (January 2016-June 2017), and Vice President and Counsel (February 2012-December 2015) of Pacific Investment Management Company LLC. | | Since July 2019 |
| | | |
Andrew R. French 1962 Secretary | | Vice President (since December 2018) of PGIM Investments LLC; formerly Vice President and Corporate Counsel (2010-2018) of Prudential; formerly Director and Corporate Counsel (2006-2010) of Prudential; Vice President and Assistant Secretary (since January 2007) of PGIM Investments LLC; Vice President and Assistant Secretary (since January 2007) of Prudential Mutual Fund Services LLC. | | Since October 2006 |
| | | |
Diana N. Huffman 1982 Assistant Secretary | | Vice President and Corporate Counsel (since September 2015) of Prudential; Vice President and Assistant Secretary (since August 2020) of PGIM Investments LLC; formerly Associate at Willkie Farr & Gallagher LLP (2009-2015). | | Since March 2019 |
| | | |
Melissa Gonzalez 1980 Assistant Secretary | | Vice President and Corporate Counsel (since September 2018) of Prudential; Vice President and Assistant Secretary (since August 2020) of PGIM Investments LLC; formerly Director and Corporate Counsel (March 2014-September 2018) of Prudential. | | Since March 2020 |
| | | |
Patrick E. McGuinness 1986 Assistant Secretary | | Vice President and Assistant Secretary (since August 2020) of PGIM Investments LLC; Director and Corporate Counsel (since February 2017) of Prudential; and Corporate Counsel (2012-2017) of IIL, Inc. | | Since June 2020 |
| | | |
Debra Rubano 1975 Assistant Secretary | | Vice President and Corporate Counsel (since November 2020) of Prudential; formerly Director and Senior Counsel of Allianz Global Investors U.S. Holdings LLC (2010-2020) and Assistant Secretary of numerous funds in the Allianz fund complex (2015-2020). | | Since December 2020 |
| | | |
Kelly A. Coyne 1968 Assistant Secretary | | Director, Investment Operations of Prudential Mutual Fund Services LLC (since 2010). | | Since March 2015 |
Visit our website at pgim.com/investments
| | | | |
| Fund Officers(a) | | | | |
| | | |
Name Year of Birth Fund Position | | Principal Occupation(s) During Past Five Years | | Length of
Service as Fund
Officer |
| | | |
Christian J. Kelly 1975 Treasurer and Principal Financial and Accounting Officer | | Vice President, Head of Fund Administration of PGIM Investments LLC (since November 2018); formerly Director of Fund Administration of Lord Abbett & Co. LLC (2009-2018), Treasurer and Principal Accounting Officer of the Lord Abbett Family of Funds (2017-2018); Director of Accounting, Avenue Capital Group (2008-2009); Senior Manager, Investment Management Practice of Deloitte & Touche LLP (1998-2007). | | Since January 2019 |
| | | |
Lana Lomuti 1967 Assistant Treasurer | | Vice President (since 2007) and Director (2005-2007), within PGIM Investments Fund Administration; formerly Assistant Treasurer (December 2007-February 2014) of The Greater China Fund, Inc. | | Since April 2014 |
| | | |
Russ Shupak 1973 Assistant Treasurer | | Vice President (since 2017) and Director (2013-2017), within PGIM Investments Fund Administration. | | Since September 2019 |
| | | |
Deborah Conway 1969 Assistant Treasurer | | Vice President (since 2017) and Director (2007-2017), within PGIM Investments Fund Administration. | | Since September 2019 |
| | | |
Elyse M. McLaughlin 1974 Assistant Treasurer | | Vice President (since 2017) and Director (2011-2017), within PGIM Investments Fund Administration. | | Since September 2019 |
| | | |
Jonathan Corbett 1983 Anti-Money Laundering Compliance Officer | | Vice President, Corporate Compliance, Global Compliance Programs and Compliance Risk Management (since August 2019) of Prudential; formerly Vice President and Head of Key Risk Areas Compliance (March 2016 to July 2019), Chief Privacy Officer (March 2016 to July 2019) and Head of Global Financial Crimes Unit (April 2014 to March 2016) at MetLife. | | Since October 2021 |
(a) Excludes Mr. Parker and Mr. Benjamin, interested Board Members who also serve as President and Vice President, respectively.
Explanatory Notes to Tables:
| ∎ | | Board Members are deemed to be “Interested,” as defined in the 1940 Act, by reason of their affiliation with PGIM Investments LLC and/or an affiliate of PGIM Investments LLC. |
| ∎ | | Unless otherwise noted, the address of all Board Members and Officers is c/o PGIM Investments LLC, 655 Broad Street, Newark, New Jersey 07102-4410. |
| ∎ | | There is no set term of office for Board Members or Officers. The Board Members have adopted a retirement policy, which calls for the retirement of Board Members on December 31 of the year in which they reach the age of 75. |
| ∎ | | “Other Directorships Held” includes all directorships of companies required to register or file reports with the SEC under the 1934 Act (that is, “public companies”) or other investment companies registered under the 1940 Act. |
| ∎ | | “Portfolios Overseen” includes all investment companies managed by PGIM Investments LLC. The investment companies for which PGIM Investments LLC serves as manager include the PGIM Funds, Target Funds, The Prudential Variable Contract Accounts, PGIM ETF Trust, PGIM High Yield Bond Fund, Inc., PGIM Global High Yield Fund, Inc., PGIM Short Duration High Yield Opportunities Fund, The Prudential Series Fund, Prudential’s Gibraltar Fund, Inc. and the Advanced Series Trust. |
| ∎ | | As used in the Fund Officers table “Prudential” means The Prudential Insurance Company of America. |
PGIM Jennison Global Infrastructure Fund
Approval of Advisory Agreements (unaudited)
The Fund’s Board of Directors
The Board of Directors (the “Board”) of PGIM Jennison Global Infrastructure Fund (the “Fund”)1 consists of ten individuals, eight of whom are not “interested persons” of the Fund, as defined in the Investment Company Act of 1940, as amended (the “1940 Act”) (the “Independent Directors”). The Board is responsible for the oversight of the Fund and its operations, and performs the various duties imposed on the directors of investment companies by the 1940 Act. The Independent Directors have retained independent legal counsel to assist them in connection with their duties. The Chair of the Board is an Independent Director. The Board has established four standing committees: the Audit Committee, the Nominating and Governance Committee, and two Investment Committees. Each committee is chaired by, and composed of, Independent Directors.
Annual Approval of the Fund’s Advisory Agreements
As required under the 1940 Act, the Board determines annually whether to renew the Fund’s management agreement with PGIM Investments LLC (“PGIM Investments”) and the Fund’s subadvisory agreement with Jennison Associates LLC (“Jennison”). In considering the renewal of the agreements, the Board, including all of the Independent Directors, met on June 7-10, 2021 and approved the renewal of the agreements through July 31, 2022, after concluding that the renewal of the agreements was in the best interests of the Fund and its shareholders.
In advance of the meetings, the Board requested and received materials relating to the agreements, and had the opportunity to ask questions and request further information in connection with its consideration. Among other things, the Board considered comparative fee information from PGIM Investments and Jennison. Also, the Board considered comparisons with other mutual funds in relevant Peer Universes and Peer Groups, as is further discussed below.
In approving the agreements, the Board, including the Independent Directors advised by independent legal counsel, considered the factors it deemed relevant, including the nature, quality and extent of services provided by PGIM Investments and the subadviser, the performance of the Fund, the profitability of PGIM Investments and its affiliates, expenses and fees, and the potential for economies of scale that may be shared with the Fund and its shareholders as the Fund’s assets grow. In their deliberations, the Directors did not identify any single factor which alone was responsible for the Board’s decision to approve the agreements with respect to the Fund. In connection with its deliberations, the Board considered information provided by PGIM Investments throughout the year at regular Board meetings, presentations from portfolio managers and other information, as well as information furnished at or in advance of the meetings on June 7-10, 2021.
The Directors determined that the overall arrangements between the Fund and PGIM Investments, which serves as the Fund’s investment manager pursuant to a
| 1 | PGIM Jennison Global Infrastructure Fund is a series of Prudential World Fund, Inc. |
PGIM Jennison Global Infrastructure Fund
Approval of Advisory Agreements (continued)
management agreement, and between PGIM Investments and Jennison, which serves as the Fund’s subadviser pursuant to the terms of a subadvisory agreement with PGIM Investments, are in the best interests of the Fund and its shareholders in light of the services performed, fees charged and such other matters as the Directors considered relevant in the exercise of their business judgment.
The material factors and conclusions that formed the basis for the Directors’ reaching their determinations to approve the continuance of the agreements are separately discussed below.
Nature, Quality and Extent of Services
The Board received and considered information regarding the nature, quality and extent of services provided to the Fund by PGIM Investments and Jennison. The Board noted that Jennison is affiliated with PGIM Investments. The Board considered the services provided by PGIM Investments, including but not limited to the oversight of the subadviser for the Fund, as well as the provision of fund recordkeeping, compliance and other services to the Fund, and PGIM Investments’ role as administrator for the Fund’s liquidity risk management program. With respect to PGIM Investments’ oversight of the subadviser, the Board noted that PGIM Investments’ Strategic Investment Research Group (“SIRG”), which is a business unit of PGIM Investments, is responsible for monitoring and reporting to PGIM Investments’ senior management on the performance and operations of the subadviser. The Board also considered that PGIM Investments pays the salaries of all of the officers and interested Directors of the Fund who are part of Fund management. The Board also considered the investment subadvisory services provided by Jennison, including investment research and security selection, as well as adherence to the Fund’s investment restrictions and compliance with applicable Fund policies and procedures. The Board considered PGIM Investments’ evaluation of the subadviser, as well as PGIM Investments’ recommendation, based on its review of the subadviser, to renew the subadvisory agreement.
The Board considered the qualifications, backgrounds and responsibilities of PGIM Investments’ senior management responsible for the oversight of the Fund and Jennison, and also considered the qualifications, backgrounds and responsibilities of Jennison’s portfolio managers who are responsible for the day-to-day management of the Fund’s portfolio. The Board was provided with information pertaining to PGIM Investments’ and Jennison’s organizational structure, senior management, investment operations, and other relevant information pertaining to both PGIM Investments and Jennison. The Board also noted that it received favorable compliance reports from the Fund’s Chief Compliance Officer (“CCO”) as to both PGIM Investments and Jennison.
The Board concluded that it was satisfied with the nature, extent and quality of the investment management services provided by PGIM Investments and the subadvisory services provided to the Fund by Jennison, and that there was a reasonable basis on which to conclude that the Fund benefits from the services provided by PGIM Investments and Jennison under the management and subadvisory agreements.
|
Visit our website at pgim.com/investments |
Costs of Services and Profits Realized by PGIM Investments
The Board was provided with information on the profitability of PGIM Investments and its affiliates in serving as the Fund’s investment manager. The Board discussed with PGIM Investments the methodology utilized in assembling the information regarding profitability and considered its reasonableness. The Board recognized that it is difficult to make comparisons of profitability from fund management contracts because comparative information is not generally publicly available and is affected by numerous factors, including the structure of the particular adviser, the types of funds it manages, its business mix, numerous assumptions regarding allocations and the adviser’s capital structure and cost of capital. However, the Board considered that the cost of services provided by PGIM Investments to the Fund during the year ended December 31, 2020 exceeded the management fees paid by the Fund, resulting in an operating loss to PGIM Investments. Taking these factors into account, the Board concluded that the profitability of PGIM Investments and its affiliates in relation to the services rendered was not unreasonable.
Economies of Scale
The Board received and discussed information concerning economies of scale that PGIM Investments may realize as the Fund’s assets grow beyond current levels. The Board noted that the management fee schedule for the Fund includes breakpoints, which have the effect of decreasing the fee rate as assets increase. During the course of time, the Board has considered information regarding the launch date of the Fund, the management fees of the Fund compared to those of similarly managed funds and PGIM Investments’ investment in the Fund over time. The Board noted that economies of scale may be shared with the Fund in several ways, including low management fees from inception, additional technological and personnel investments to enhance shareholder services, and maintaining existing expense structures in the face of a rising cost environment. The Board considered PGIM Investments’ assertion that it continually evaluates the management fee schedule of the Fund and the potential to share economies of scale through breakpoints or fee waivers as asset levels increase.
The Board recognized the inherent limitations of any analysis of economies of scale, stemming largely from the Board’s understanding that most of PGIM Investments’ costs are not specific to individual funds, but rather are incurred across a variety of products and services.
Other Benefits to PGIM Investments and Jennison
The Board considered potential ancillary benefits that might be received by PGIM Investments and Jennison and their affiliates as a result of their relationship with the Fund. The Board concluded that potential benefits to be derived by PGIM Investments included transfer agency fees received by the Fund’s transfer agent (which is affiliated with PGIM Investments), benefits to its reputation as well as other intangible benefits resulting from PGIM Investments’ association with the Fund. The Board concluded that the potential benefits to be derived by Jennison included its ability to use soft dollar
PGIM Jennison Global Infrastructure Fund
Approval of Advisory Agreements (continued)
credits, as well as the potential benefits consistent with those generally resulting from an increase in assets under management, specifically, potential access to additional research resources and benefits to its reputation. The Board concluded that the benefits derived by PGIM Investments and Jennison were consistent with the types of benefits generally derived by investment managers and subadvisers to mutual funds.
Performance of the Fund / Fees and Expenses
The Board considered certain additional factors and made related conclusions relating to the historical performance of the Fund for the one-, three- and five-year periods ended December 31, 2020.
The Board also considered the Fund’s actual management fee, as well as the Fund’s net total expense ratio, for the fiscal year ended October 31, 2020. The Board considered the management fee for the Fund as compared to the management fee charged by PGIM Investments to other funds and the fee charged by other advisers to comparable mutual funds in a Peer Group. The actual management fee represents the fee rate actually paid by Fund shareholders and includes any fee waivers or reimbursements. The net total expense ratio for the Fund represents the actual expense ratio incurred by Fund shareholders.
The mutual funds included in the Peer Universe, which was used to consider performance, and the Peer Group, which was used to consider fees and expenses, were objectively determined by Broadridge, an independent provider of mutual fund data. In certain circumstances, PGIM Investments also provided supplemental Peer Universe or Peer Group information for reasons addressed with the Board. The comparisons placed the Fund in various quartiles over various periods, with the first quartile being the best 25% of the mutual funds (for performance, the best performing mutual funds and, for expenses, the lowest cost mutual funds).
The section below summarizes key factors considered by the Board and the Board’s conclusions regarding the Fund’s performance, fees and overall expenses. The table sets forth net performance comparisons (which reflect the impact on performance of fund expenses, or any subsidies, expense caps or waivers that may be applicable) with the Peer Universe, actual management fees with the Peer Group (which reflect the impact of any subsidies or fee waivers), and net total expenses with the Peer Group, each of which were key factors considered by the Board.
| | | | | | | | |
| Net Performance | | 1 Year | | 3 Years | | 5 Years | | 10 Years |
| | 1st Quartile | | 1st Quartile | | 1st Quartile | | N/A |
| Actual Management Fees: 1st Quartile |
Net Total Expenses: 4th Quartile |
| | ● | | The Board noted that the Fund outperformed its benchmark index over all periods. |
Visit our website at pgim.com/investments
| | ● | | The Board and PGIM Investments agreed to retain the Fund’s existing contractual expense cap that (exclusive of certain fees and expenses) caps total annual operating expenses at 1.50% for Class A shares, 2.25% for Class C shares, 1.17% for Class R6 shares, and 1.17% for Class Z shares through February 28, 2022. |
| | ● | | In addition, PGIM Investments will waive management fees or shared operating expenses on any share class to the same extent that it waives such expenses on any other share class, and has agreed that total annual fund operating expenses for Class R6 shares will not exceed total annual fund operating expenses for Class Z shares. |
| | ● | | The Board concluded that, in light of the above, it would be in the best interests of the Fund and its shareholders to renew the agreements. |
| | ● | | The Board concluded that the management fees (including subadvisory fees) and total expenses were reasonable in light of the services provided. |
* * *
After full consideration of these factors, the Board concluded that approval of the agreements was in the best interests of the Fund and its shareholders.
PGIM Jennison Global Infrastructure Fund
| | | | |
| | | |
| ∎ MAIL | | ∎ TELEPHONE | | ∎ WEBSITE |
655 Broad Street Newark, NJ 07102 | | (800) 225-1852 | | pgim.com/investments |
|
| PROXY VOTING |
| The Board of Directors of the Fund has delegated to the Fund’s subadviser the responsibility for voting any proxies and maintaining proxy recordkeeping with respect to the Fund. A description of these proxy voting policies and procedures is available without charge, upon request, by calling (800) 225-1852 or by visiting the Securities and Exchange Commission’s website at sec.gov. Information regarding how the Fund voted proxies relating to portfolio securities during the most recent 12-month period ended June 30 is available on the Fund’s website and on the Securities and Exchange Commission’s website. |
|
| DIRECTORS |
| Ellen S. Alberding • Kevin J. Bannon • Scott E. Benjamin • Linda W. Bynoe • Barry H. Evans • Keith F. Hartstein • Laurie Simon Hodrick • Stuart S. Parker • Brian K. Reid • Grace C. Torres |
|
| OFFICERS |
| Stuart S. Parker, President • Scott E. Benjamin, Vice President • Christian J. Kelly, Treasurer and Principal Financial and Accounting Officer • Claudia DiGiacomo, Chief Legal Officer • Dino Capasso, Chief Compliance Officer • Jonathan Corbett, Anti-Money Laundering Compliance Officer • Andrew R. French, Secretary • Melissa Gonzalez, Assistant Secretary • Diana N. Huffman, Assistant Secretary • Kelly A. Coyne, Assistant Secretary • Patrick E. McGuinness, Assistant Secretary • Debra Rubano, Assistant Secretary • Lana Lomuti, Assistant Treasurer • Russ Shupak, Assistant Treasurer • Elyse M. McLaughlin, Assistant Treasurer • Deborah Conway, Assistant Treasurer |
| | | | |
| MANAGER | | PGIM Investments LLC | | 655 Broad Street Newark, NJ 07102 |
|
| SUBADVISER | | Jennison Associates LLC | | 466 Lexington Avenue New York, NY 10017 |
|
| DISTRIBUTOR | | Prudential Investment Management Services LLC | | 655 Broad Street Newark, NJ 07102 |
|
| CUSTODIAN | | The Bank of New York Mellon | | 240 Greenwich Street New York, NY 10286 |
|
| TRANSFER AGENT | | Prudential Mutual Fund Services LLC | | PO Box 9658 Providence, RI 02940 |
|
| INDEPENDENT REGISTERED PUBLIC ACCOUNTING FIRM | | PricewaterhouseCoopers LLP | | 300 Madison Avenue New York, NY 10017 |
|
| FUND COUNSEL | | Willkie Farr & Gallagher LLP | | 787 Seventh Avenue New York, NY 10019 |
|
|
| An investor should consider the investment objectives, risks, charges, and expenses of the Fund carefully before investing. The prospectus and summary prospectus contain this and other information about the Fund. An investor may obtain the prospectus and summary prospectus by visiting our website at pgim.com/investments or by calling (800) 225-1852. The prospectus and summary prospectus should be read carefully before investing. |
|
| E-DELIVERY |
| To receive your mutual fund documents online, go to pgim.com/investments/resource/edelivery and enroll. Instead of receiving printed documents by mail, you will receive notification via email when new materials are available. You can cancel your enrollment or change your email address at any time by visiting the website address above. |
|
| SHAREHOLDER COMMUNICATIONS WITH DIRECTORS |
| Shareholders can communicate directly with the Board of Directors by writing to the Chair of the Board, PGIM Jennison Global Infrastructure Fund, PGIM Investments, Attn: Board of Directors, 655 Broad Street, Newark, NJ 07102. Shareholders can communicate directly with an individual Director by writing to that Director at the same address. Communications are not screened before being delivered to the addressee. |
|
| AVAILABILITY OF PORTFOLIO HOLDINGS |
| The Fund files its complete schedule of portfolio holdings with the Securities and Exchange Commission for the first and third quarters of each fiscal year as an exhibit to its reports on Form N-PORT. The Fund’s Form N-PORT filings are available on the Commission’s website at sec.gov. |
|
| The Fund’s Statement of Additional Information contains additional information about the Fund’s Directors and is available without charge, upon request, by calling (800) 225-1852. |
Mutual Funds:
| | | | |
| ARE NOT INSURED BY THE FDIC OR ANY FEDERAL GOVERNMENT AGENCY | | MAY LOSE VALUE | | ARE NOT A DEPOSIT OF OR GUARANTEED
BY ANY BANK OR ANY BANK AFFILIATE |
| | | | | | | | |
PGIM JENNISON GLOBAL INFRASTRUCTURE FUND |
| SHARE CLASS | | A | | C | | Z | | R6 |
| NASDAQ | | PGJAX | | PGJCX | | PGJZX | | PGJQX |
| CUSIP | | 743969792 | | 743969784 | | 743969776 | | 743969560 |
MF217E

PGIM EMERGING MARKETS DEBT HARD
CURRENCY FUND
ANNUAL REPORT
OCTOBER 31, 2021

|
|
| To enroll in e-delivery, go to pgim.com/investments/resource/edelivery |
Table of Contents
This report is not authorized for distribution to prospective investors unless preceded or accompanied by a current prospectus.
The views expressed in this report and information about the Fund’s portfolio holdings are for the period covered by this report and are subject to change thereafter.
Mutual funds are distributed by Prudential Investment Management Services LLC (PIMS), member SIPC. PGIM Fixed Income is a unit of PGIM, Inc. (PGIM), a registered investment adviser. PIMS and PGIM are Prudential Financial companies. © 2021 Prudential Financial, Inc. and its related entities. PGIM and the PGIM logo are service marks of Prudential Financial, Inc. and its related entities, registered in many jurisdictions worldwide.
| | |
| 2 | | Visit our website at pgim.com/investments |
Letter from the President
| | |
 | | Dear Shareholder: We hope you find the annual report for the PGIM Emerging Markets Debt Hard Currency Fund informative and useful. The report covers performance for the 12-month period that ended October 31, 2021. The global economy and markets continued to recover throughout the period from the ongoing impact of the COVID-19 pandemic. The Federal Reserve slashed interest rates and kept them near zero to encourage borrowing. Congress passed stimulus bills worth several trillion dollars to help consumers and businesses. And several effective COVID-19 vaccines received regulatory approval. Those measures were enough to offset the fear of rising inflation and supply chain challenges that threatened to disrupt growth. |
At the start of the period, stocks had recovered most of the steep losses they had suffered at the onset of the pandemic. Equities rallied as states reopened their economies but became more volatile as investors worried that a surge in COVID-19 infections would stall the recovery. However, rising corporate profits and economic growth, the resolution of the US presidential election, and the global rollout of approved vaccines lifted equity markets to record levels, helping stocks around the globe post gains for the full period.
Throughout this volatile period, investors sought safety in fixed income. Investment-grade bonds in the US and the overall global bond market declined slightly during the period as the economy recovered, but emerging market debt rose. While the 10-year US Treasury yield hovered near record lows early in the period after a significant rally in interest rates, rates moved higher later on as investors began to focus on stronger economic growth and the prospects of higher inflation. The Fed also took several aggressive actions to keep the bond markets running smoothly, implementing many of the relief programs that proved to be successful in helping end the global financial crisis in 2008-09.
Regarding your investments with PGIM, we believe it is important to maintain a diversified portfolio of funds consistent with your tolerance for risk, time horizon, and financial goals. Your financial advisor can help you create a diversified investment plan that may include funds covering all the basic asset classes and that reflects your personal investor profile and risk tolerance. However, diversification and asset allocation strategies do not assure a profit or protect against loss in declining markets.
At PGIM Investments, we consider it a great privilege and responsibility to help investors participate in opportunities across global markets while meeting their toughest investment challenges. PGIM is a top-10 global investment manager with more than $1.5 trillion in assets under management. This scale and investment expertise allow us to deliver actively managed funds and strategies to meet the needs of investors around the globe.
Thank you for choosing our family of funds.
Sincerely,

Stuart S. Parker, President
PGIM Emerging Markets Debt Hard Currency Fund
December 15, 2021
| | |
| PGIM Emerging Markets Debt Hard Currency Fund | | 3 |
Your Fund’s Performance (unaudited)
Performance data quoted represent past performance. Past performance does not guarantee future results. The investment return and principal value of an investment will fluctuate so that an investor’s shares, when redeemed, may be worth more or less than their original cost. Current performance may be lower or higher than the past performance data quoted. An investor may obtain performance data as of the most recent month-end by visiting our website at pgim.com/investments or by calling (800) 225-1852.
| | | | |
| |
| | | Average Annual Total Returns as of 10/31/21 |
| | |
| | | One Year (%) | | Since Inception (%) |
| | |
Class A | | | | |
| | |
(with sales charges) | | 3.44 | | 1.75 (12/12/2017) |
| | |
(without sales charges) | | 6.91 | | 2.62 (12/12/2017) |
| | |
Class C | | | | |
| | |
(with sales charges) | | 5.11 | | 1.86 (12/12/2017) |
| | |
(without sales charges) | | 6.11 | | 1.86 (12/12/2017) |
| | |
Class Z | | | | |
| | |
(without sales charges) | | 7.11 | | 2.89 (12/12/2017) |
| | |
Class R6 | | | | |
| | |
(without sales charges) | | 7.34 | | 2.98 (12/12/2017) |
| | |
JP Morgan Emerging Markets Bond Index Global Diversified Index | | 4.41 | | 3.68 |
Since Inception returns are provided since the Fund has less than 10 fiscal years of returns. Since Inception returns for the Index are measured from the closest month-end to the Fund’s inception date.
| | |
| 4 | | Visit our website at pgim.com/investments |
Growth of a $10,000 Investment (unaudited)
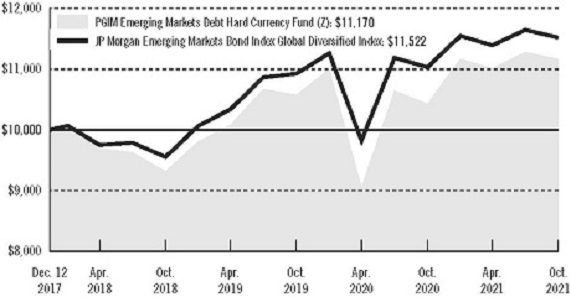
The graph compares a $10,000 investment in the Fund’s Class Z shares with a similar investment in the JP Morgan EMBI Global Diversified Index by portraying the initial account values at the commencement of operations for Class Z shares (December 12, 2017) and the account values at the end of the current fiscal year (October 31, 2021), as measured on a quarterly basis. For purposes of the graph, and unless otherwise indicated, it has been assumed that (a) all recurring fees (including management fees) were deducted and (b) all dividends and distributions were reinvested. The line graph provides information for Class Z shares only. As indicated in the tables provided earlier, performance for other share classes will vary due to the differing fees and expenses applicable to each share class (as indicated in the following paragraphs). Without waiver of fees and/or expense reimbursements, if any, the returns would have been lower.
Past performance does not predict future performance. Total returns and the ending account values in the graph include changes in share price and reinvestment of dividends and capital gains distributions in a hypothetical investment for the periods shown. The Fund’s total returns do not reflect the deduction of income taxes on an individual’s investment. Taxes may reduce your actual investment returns on income or gains paid by the Fund or any gains you may realize if you sell your shares.
| | |
| PGIM Emerging Markets Debt Hard Currency Fund | | 5 |
Your Fund’s Performance (continued)
The returns in the tables do not reflect the deduction of taxes that a shareholder would pay on Fund distributions or following the redemption of Fund shares. The average annual total returns take into account applicable sales charges, which are described for each share class in the table below.
| | | | | | | | |
| | | | | |
| | | Class A | | Class C | | Class Z | | Class R6 |
| | | | | |
| Maximum initial sales charge | | 3.25% of the public offering price | | None | | None | | None |
| Contingent deferred sales charge (CDSC) (as a percentage of the lower of the original purchase price or the net asset value at redemption) | | 1.00% on sales of $500,000 or more made within 12 months of purchase | | 1.00% on sales made within 12 months of purchase | | None | | None |
| Annual distribution and service (12b-1) fees (shown as a percentage of average daily net assets) | | 0.25% | | 1.00% | | None | | None |
Benchmark Definitions
JP Morgan Emerging Markets Bond Index Global Diversified Index—The JP Morgan Emerging Markets Bond Index Global Diversified Index tracks total returns for USD-denominated debt instruments issued by emerging market sovereign and quasi-sovereign entities: Brady bonds, loans, and eurobonds. It limits the weights of those index countries with larger debt stocks by only including specified portions of these countries’ eligible current face amounts of debt outstanding.
Investors cannot invest directly in an index. The returns for the Index would be lower if they included the effects of sales charges, operating expenses of a mutual fund, or taxes that may be paid by an investor.
| | |
| 6 | | Visit our website at pgim.com/investments |
| | | | | | |
|
| Distributions and Yields as of 10/31/21 |
| | | |
| | | Total Distributions
Paid for 12 Months ($) | | SEC 30-Day
Subsidized
Yield* (%) | | SEC 30-Day
Unsubsidized
Yield** (%) |
| | | |
Class A | | 0.41 | | 3.76 | | –3.09 |
| | | |
Class C | | 0.34 | | 3.15 | | –28.94 |
| | | |
Class Z | | 0.44 | | 4.21 | | 4.34 |
| | | |
Class R6 | | 0.45 | | 4.29 | | 4.17 |
*SEC 30-Day Subsidized Yield (%)—A standardized yield calculation created by the Securities and Exchange Commission, it reflects the income earned during a 30-day period, after the deduction of the Fund’s net expenses (net of any expense waivers or reimbursements). The investor experience is represented by the SEC 30-Day Subsidized Yield.
**SEC 30-Day Unsubsidized Yield (%)—A standardized yield calculation created by the Securities and Exchange Commission, it reflects the income earned during a 30-day period, after the deduction of the Fund’s gross expenses. The investor experience is represented by the SEC 30-Day Subsidized Yield.
| | | | |
|
| Credit Quality expressed as a percentage of total investments as of 10/31/21 (%) | |
| |
AA | | | 4.8 | |
| |
A | | | 5.7 | |
| |
BBB | | | 32.4 | |
| |
BB | | | 22.7 | |
| |
B | | | 21.9 | |
| |
CCC | | | 3.9 | |
| |
CC | | | 0.7 | |
| |
C | | | 0.3 | |
| |
Not Rated | | | 2.3 | |
| |
Cash/Cash Equivalents | | | 5.3 | |
| | |
| Total | | | 100.0 | |
Credit ratings reflect the highest rating assigned by a nationally recognized statistical rating organization (NRSRO) such as Moody’s Investors Service, Inc. (Moody’s), S&P Global Ratings (S&P), or Fitch, Inc. (Fitch). Credit ratings reflect the common nomenclature used by both S&P and Fitch. Where applicable, ratings are converted to the comparable S&P/Fitch rating tier nomenclature. These rating agencies are independent and are widely used. The Not Rated category consists of securities that have not been rated by an NRSRO. Credit ratings are subject to change.
| | |
| PGIM Emerging Markets Debt Hard Currency Fund | | 7 |
Strategy and Performance Overview (unaudited)
How did the Fund perform?
The PGIM Emerging Markets Debt Hard Currency Fund’s Class Z shares returned 7.11% in the 12-month reporting period that ended October 31, 2021, outperforming the 4.41% return of the JP Morgan Emerging Markets Bond Index Global Diversified Index (the Index).
What were the market conditions?
| · | | Following 2020’s abrupt sell-off and subsequent strong recovery, the first 10 months of 2021 produced mixed results for emerging market debt. As economies responded to the unprecedented monetary and fiscal stimulus programs, investor appetite for risk assets generally remained strong, and credit spreads continued to decline as higher beta countries’ yield levels brought investors searching for yields. (Higher beta means having more risk than the market in general.) However, rising inflation concerns entering 2021 resulted in higher US Treasury rates, which weighed on performance as markets priced in the stronger-than-anticipated US growth and the impact that fiscal stimulus and monetary policy would have on longer-term inflation dynamics. |
| · | | In the first quarter of 2021, spreads proved resilient and curves flattened despite US Treasury volatility, but performance overall remained differentiated and country specific. In emerging market sovereigns, negative total returns in the first quarter of 2021 were mostly the result of US Treasuries, while spread resilience in higher-grade credits and select high yield credits drove performance. With commodity prices and flows supportive for most of the period, the attractive relative spread and optimism on growth helped the positive spread momentum. Overall, commodity-sensitive countries performed well on the back of stable commodity prices, reflecting the growth rebound and constrained supply. Emerging market corporates held up relatively well in the first quarter of 2021, with valuation support from the segment’s lower duration, improving fundamentals, and favorable technicals that included manageable net supply and inflows into the asset class. (Duration measures the sensitivity of the price—the value of principal—of a bond to a change in interest rates.) Local rates produced negative returns in the first quarter of 2021, driven by a bear steepening (i.e., interest rates on long-term bonds rising faster than rates on short-term bonds) of the US yield curve and aggressive rate hikes by select emerging market central banks. (A yield curve is a line graph that illustrates the relationship between the yields and maturities of fixed income securities. It is created by plotting the yields of different maturities for the same type of bonds.) Higher energy and food prices, along with the depreciation of many emerging market currencies, put additional pressure on the front, or short-term, end of yield curves. Meanwhile, emerging market currencies declined on the back of the US and global yield curve steepening and a slowdown in emerging market local inflows. A slower-than-expected COVID-19 vaccine administration in the European Union and virus flare-ups across Latin America also contributed to emerging market currency weakness. |
| · | | The emerging market debt sector then benefited from renewed momentum in the second quarter of 2021 as long-duration, high-quality assets performed well amid the |
| | |
| 8 | | Visit our website at pgim.com/investments |
| | stabilization and consolidation in US Treasury yields, while higher beta, hard currency bonds (particularly those from commodity-sensitive issuers) outperformed. (Beta is a measure of the volatility or risk of a security or portfolio compared to the market or index.) Emerging market corporate performance remained strong on the back of a favorable outlook for fundamentals, manageable net supply, and positive inflows. Local rates and emerging market currencies also recovered on a weaker US dollar and a shifting focus from US growth to growth momentum in the rest of the world. However, the outlook for local rates grew less clear following the June Federal Open Market Committee meeting, with uncertainty around the timing of the Federal Reserve’s (the Fed’s) tapering of its monthly bond purchases requiring an extra risk premium while becoming more vulnerable to currency depreciation. |
| · | | In the third quarter of 2021, emerging market debt market performance was mixed against the backdrop of growing concerns around a regulatory crackdown in China, the potential for economic slowdowns triggered by the COVID-19 Delta variant, and contagion from the China property sector. Emerging market hard currency returns were positive as lower US Treasury yields more than offset higher spreads. In the final week of August, markets were buoyed by supportive economic measures from China and a dovish tone from Fed Chairman Jerome Powell, who clearly differentiated a rate-hiking cycle from a tapering of bond purchases, making it clear that conditions needed for raising the federal funds rate would be more stringent than those needed for tapering. Most local rate markets witnessed a relief rally in July and August before underperforming in September due, in part, to high inflation prints and continued central bank hawkishness. Emerging market currencies saw a continuation of declines in July and the first three weeks of August, with commodity and cyclical currencies underperforming, but rallied after Powell failed to provide a timeline for tapering at the Fed’s Jackson Hole Economic Symposium. Emerging market currencies then weakened in September amid concerns over slowing global growth, an uncertain Fed policy, and inflation in both developed and emerging economies. |
| · | | Over the last month of the reporting period, emerging market hard currency spreads were flat to slightly wider, although dispersion among regions and rating buckets remained. Distressed issues underperformed, while oil exporters continued to do well on the back of rising commodity prices. In local rates, most emerging market countries outside of Asia continued to underperform, in part due to high inflation data and central bank hawkishness. Meanwhile, emerging market currencies saw a soft rebound in October 2021 versus the US dollar on higher commodities and lower US real yields. |
What worked?
| · | | Overall country selection and issue selection both contributed to the Fund’s performance during the reporting period. Long spread duration in Ukraine, Ivory Coast, Angola, and Romania sovereign bonds contributed to performance. Sovereign bond positioning in Zambia, Mexico, and Brazil also contributed. |
| | |
| PGIM Emerging Markets Debt Hard Currency Fund | | 9 |
Strategy and Performance Overview (continued)
| · | | Corporate and quasi-sovereign positioning in Mexico (Petroleos Mexicanos), South Africa (Eskom), Argentina (Buenos Aires), and Brazil (Petroleo Brasileiro Sa Petrobras) contributed to performance. |
| · | | In out-of-Index local currency, long positioning in China contributed to performance. |
| · | | Within currencies, overweight positioning in the Indonesian rupiah, Turkish lira, and Russian ruble relative to the Index contributed. |
What didn’t work?
| · | | Short spread duration in Chile, Bahrain, and China sovereign bonds detracted from the Fund’s performance over the reporting period. Sovereign bond positioning in the Ivory Coast and Romania detracted. |
| · | | Corporate and quasi-sovereign positioning in China (China Haohua Chemical Group, China Petroleum & Chemical Corp., and Sunac China Holdings Ltd.) detracted from performance. |
| · | | In out-of-Index local currency, long duration in Mexico detracted from performance. |
| · | | Within currencies, underweight positioning in the South African rand and Colombian peso, as well as overweight positioning in the Brazilian real, relative to the Index detracted. |
Did the Fund use derivatives?
Currency positioning in the Fund was partially facilitated by the use of currency forward and option contracts. During the reporting period, the Fund’s currency positioning added to relative performance. The Fund also used futures and interest rate swaps, in part, to help manage duration and yield curve exposure, which collectively had a positive impact to performance.
Current outlook
| · | | While PGIM Fixed Income continues to expect differentiated performance across both emerging market debt sectors and issuers, given a post-Delta variant recovery in the growth outlook, some relief from supply-chain backlogs, and the near-term avoidance of a Fed policy mistake, its base case is that emerging market debt assets should, at worst, move sideways. Emerging market growth will slow in 2022, in PGIM Fixed Income’s view, due to fiscal, political, and China headwinds, making bottom-up fundamental credit selection all the more critical. |
| · | | Emerging market hard currency assets remain PGIM Fixed Income’s highest conviction, as it continues to emphasize a “barbell,” consisting of overweight positioning to front-end/higher-yielding credits and long-end/higher-quality credits to ensure it has the right mix of assets that can potentially perform well in varying market scenarios. |
| · | | In local bonds, PGIM Fixed Income’s base case is that dispersion in countries will continue and that it is too early for emerging market central banks to become less hawkish. That said, given the recent repricing of emerging market rates, it is looking for signals to become more constructive. |
| | |
| 10 | | Visit our website at pgim.com/investments |
| · | | PGIM Fixed Income believes the bar is high for emerging market currencies to see sustained strength as the Fed begins to taper its asset purchases and global growth slows. |
| | |
| PGIM Emerging Markets Debt Hard Currency Fund | | 11 |
Fees and Expenses (unaudited)
As a shareholder of the Fund, you incur two types of costs: (1) transaction costs, including sales charges (loads) on purchase payments and redemptions, as applicable, and (2) ongoing costs, including management fees, distribution and/or service (12b-1) fees, and other Fund expenses, as applicable. This example is intended to help you understand your ongoing costs (in dollars) of investing in the Fund and to compare these costs with the ongoing costs of investing in other mutual funds.
The example is based on an investment of $1,000 held through the six-month period ended October 31, 2021. The example is for illustrative purposes only; you should consult the Prospectus for information on initial and subsequent minimum investment requirements.
Actual Expenses
The first line for each share class in the table on the following page provides information about actual account values and actual expenses. You may use the information on this line, together with the amount you invested, to estimate the expenses that you paid over the period. Simply divide your account value by $1,000 (for example, an $8,600 account value ÷ $1,000 = 8.6), then multiply the result by the number on the first line under the heading “Expenses Paid During the Six-Month Period” to estimate the expenses you paid on your account during this period.
Hypothetical Example for Comparison Purposes
The second line for each share class in the table on the following page provides information about hypothetical account values and hypothetical expenses based on the Fund’s actual expense ratio and an assumed rate of return of 5% per year before expenses, which is not the Fund’s actual return. The hypothetical account values and expenses may not be used to estimate the actual ending account balance or expenses you paid for the period. You may use this information to compare the ongoing costs of investing in the Fund and other funds. To do so, compare this 5% hypothetical example with the 5% hypothetical examples that appear in the shareholder reports of the other funds.
The Fund’s transfer agent may charge additional fees to holders of certain accounts that are not included in the expenses shown in the table on the following page. These fees apply to individual retirement accounts (IRAs) and Section 403(b) accounts. As of the close of the six-month period covered by the table, IRA fees included an annual maintenance fee of $15 per account (subject to a maximum annual maintenance fee of $25 for all accounts held by the same shareholder). Section 403(b) accounts are charged an annual $25 fiduciary maintenance fee. Some of the fees may vary in amount, or may be waived, based on your total account balance or the number of PGIM funds, including the Fund, that you own. You should consider the additional fees that were charged to your Fund account over the six-month period when you estimate the total ongoing expenses paid over the period and the impact of these fees on your ending account value, as these additional expenses are not reflected in the information
| | |
| 12 | | Visit our website at pgim.com/investments |
provided in the expense table. Additional fees have the effect of reducing investment returns.
Please note that the expenses shown in the table are meant to highlight your ongoing costs only and do not reflect any transactional costs such as sales charges (loads). Therefore, the second line for each share class in the table is useful in comparing ongoing costs only and will not help you determine the relative total costs of owning different funds. In addition, if these transactional costs were included, your costs would have been higher.
| | | | | | | | | | |
| | | | |
PGIM Emerging Markets Debt Hard Currency Fund | | Beginning
Account Value
May 1, 2021 | | Ending
Account Value
October 31, 2021 | | Annualized
Expense
Ratio Based on
the Six-Month Period | | Expenses Paid
During the
Six-Month Period* |
| | | | | |
Class A | | Actual | | $1,000.00 | | $1,013.60 | | 1.05% | | $5.33 |
| | | | | |
| | Hypothetical | | $1,000.00 | | $1,019.91 | | 1.05% | | $5.35 |
| | | | | |
Class C | | Actual | | $1,000.00 | | $1,009.80 | | 1.80% | | $9.12 |
| | | | | |
| | Hypothetical | | $1,000.00 | | $1,016.13 | | 1.80% | | $9.15 |
| | | | | |
Class Z | | Actual | | $1,000.00 | | $1,014.00 | | 0.75% | | $3.81 |
| | | | | |
| | Hypothetical | | $1,000.00 | | $1,021.42 | | 0.75% | | $3.82 |
| | | | | |
Class R6 | | Actual | | $1,000.00 | | $1,014.60 | | 0.65% | | $3.30 |
| | | | | |
| | | Hypothetical | | $1,000.00 | | $1,021.93 | | 0.65% | | $3.31 |
*Fund expenses (net of fee waivers or subsidies, if any) for each share class are equal to the annualized expense ratio for each share class (provided in the table), multiplied by the average account value over the period, multiplied by the 184 days in the six-month period ended October 31, 2021, and divided by the 365 days in the Fund’s fiscal year ended October 31, 2021 (to reflect the six-month period). Expenses presented in the table include the expenses of any underlying portfolios in which the Fund may invest.
| | |
| PGIM Emerging Markets Debt Hard Currency Fund | | 13 |
Schedule of Investments
as of October 31, 2021
| | | | | | | | | | | | | | | | |
| | | | | |
| Description | | Interest
Rate | | Maturity
Date | | | | | Principal
Amount
(000)# | | | Value | |
| | | | | |
LONG-TERM INVESTMENTS 90.7% | | | | | | | | | | | | | | | | |
| | | | | |
CORPORATE BONDS 25.1% | | | | | | | | | | | | | | | | |
| | | | | |
Azerbaijan 0.7% | | | | | | | | | | | | | | | | |
Southern Gas Corridor CJSC, | | | | | | | | | | | | | | | | |
Gov’t. Gtd. Notes | | 6.875% | | 03/24/26 | | | | | | | 650 | | | $ | 761,966 | |
State Oil Co. of the Azerbaijan Republic, | | | | | | | | | | | | | | | | |
Sr. Unsec’d. Notes | | 6.950 | | 03/18/30 | | | | | | | 200 | | | | 244,887 | |
| | | | | | | | | | | | | | | | |
| | | | | |
| | | | | | | | | | | | | | | 1,006,853 | |
| | | | | |
Bahrain 0.4% | | | | | | | | | | | | | | | | |
Oil & Gas Holding Co. BSCC (The), | | | | | | | | | | | | | | | | |
Sr. Unsec’d. Notes | | 7.625 | | 11/07/24 | | | | | | | 400 | | | | 437,651 | |
Sr. Unsec’d. Notes | | 8.375 | | 11/07/28 | | | | | | | 200 | | | | 230,727 | |
| | | | | | | | | | | | | | | | |
| | | | | |
| | | | | | | | | | | | | | | 668,378 | |
| | | | | |
Brazil 1.5% | | | | | | | | | | | | | | | | |
Globo Comunicacao e Participacoes SA, | | | | | | | | | | | | | | | | |
Sr. Unsec’d. Notes | | 4.875 | | 01/22/30 | | | | | | | 200 | | | | 194,002 | |
JSM Global Sarl, | | | | | | | | | | | | | | | | |
Gtd. Notes, 144A | | 4.750 | | 10/20/30 | | | | | | | 400 | | | | 380,600 | |
Nexa Resources SA, | | | | | | | | | | | | | | | | |
Gtd. Notes, 144A | | 5.375 | | 05/04/27 | | | | | | | 210 | | | | 222,967 | |
Petrobras Global Finance BV, | | | | | | | | | | | | | | | | |
Gtd. Notes | | 5.093 | | 01/15/30 | | | | | | | 367 | | | | 374,640 | |
Gtd. Notes | | 5.375 | | 10/01/29 | | | GBP | | | | 100 | | | | 146,338 | |
Gtd. Notes | | 5.600 | | 01/03/31 | | | | | | | 459 | | | | 480,865 | |
Gtd. Notes | | 6.900 | | 03/19/49 | | | | | | | 150 | | | | 156,793 | |
Gtd. Notes | | 7.375 | | 01/17/27 | | | | | | | 66 | | | | 77,410 | |
Suzano Austria GmbH, | | | | | | | | | | | | | | | | |
Gtd. Notes | | 3.750 | | 01/15/31 | | | | | | | 150 | | | | 150,037 | |
Vale Overseas Ltd., | | | | | | | | | | | | | | | | |
Gtd. Notes | | 3.750 | | 07/08/30 | | | | | | | 90 | | | | 91,927 | |
| | | | | | | | | | | | | | | | |
| | | | | |
| | | | | | | | | | | | | | | 2,275,579 | |
| | | | | |
Chile 1.1% | | | | | | | | | | | | | | | | |
Alfa Desarrollo SpA, | | | | | | | | | | | | | | | | |
Sr. Sec’d. Notes, 144A | | 4.550 | | 09/27/51 | | | | | | | 200 | | | | 195,411 | |
Corp. Nacional del Cobre de Chile, | | | | | | | | | | | | | | | | |
Sr. Unsec’d. Notes | | 4.875 | | 11/04/44 | | | | | | | 600 | | | | 711,520 | |
Sr. Unsec’d. Notes, 144A | | 4.875 | | 11/04/44 | | | | | | | 200 | | | | 237,174 | |
See Notes to Financial Statements.
PGIM Emerging Markets Debt Hard Currency Fund 15
Schedule of Investments (continued)
as of October 31, 2021
| | | | | | | | | | | | | | | | |
| | | | | |
| Description | | Interest
Rate | | Maturity
Date | | | | | Principal
Amount
(000)# | | | Value | |
| | | | | |
CORPORATE BONDS (Continued) | | | | | | | | | | | | | | | | |
| | | | | |
Chile (cont’d.) | | | | | | | | | | | | | | | | |
Empresa Nacional del Petroleo, | | | | | | | | | | | | | | | | |
Sr. Unsec’d. Notes, 144A | | 3.450% | | 09/16/31 | | | | | | | 200 | | | $ | 190,786 | |
Interchile SA, | | | | | | | | | | | | | | | | |
Sr. Sec’d. Notes, 144A | | 4.500 | | 06/30/56 | | | | | | | 200 | | | | 211,126 | |
VTR Finance NV, | | | | | | | | | | | | | | | | |
Sr. Unsec’d. Notes | | 6.375 | | 07/15/28 | | | | | | | 200 | | | | 213,798 | |
| | | | | | | | | | | | | | | | |
| | | | | |
| | | | | | | | | | | | | | | 1,759,815 | |
| | | | | |
China 1.7% | | | | | | | | | | | | | | | | |
Agile Group Holdings Ltd., | | | | | | | | | | | | | | | | |
Sr. Sec’d. Notes | | 6.050 | | 10/13/25 | | | | | | | 200 | | | | 154,348 | |
CNAC HK Finbridge Co. Ltd., | | | | | | | | | | | | | | | | |
Gtd. Notes | | 3.875 | | 06/19/29 | | | | | | | 500 | | | | 532,193 | |
Gtd. Notes | | 5.125 | | 03/14/28 | | | | | | | 200 | | | | 227,447 | |
Country Garden Holdings Co. Ltd., | | | | | | | | | | | | | | | | |
Sr. Sec’d. Notes | | 4.200 | | 02/06/26 | | | | | | | 210 | | | | 198,544 | |
ENN Clean Energy International Investment Ltd., | | | | | | | | | | | | | | | | |
Gtd. Notes, 144A | | 3.375 | | 05/12/26 | | | | | | | 200 | | | | 198,491 | |
New Metro Global Ltd., | | | | | | | | | | | | | | | | |
Gtd. Notes | | 4.800 | | 12/15/24 | | | | | | | 200 | | | | 175,347 | |
Sinopec Group Overseas Development 2012 Ltd., | | | | | | | | | | | | | | | | |
Gtd. Notes | | 4.875 | | 05/17/42 | | | | | | | 200 | | | | 250,190 | |
Sinopec Group Overseas Development 2017 Ltd., | | | | | | | | | | | | | | | | |
Gtd. Notes | | 4.000 | | 09/13/47 | | | | | | | 200 | | | | 228,938 | |
Sinopec Group Overseas Development 2018 Ltd., | | | | | | | | | | | | | | | | |
Gtd. Notes, 144A | | 3.680 | | 08/08/49 | | | | | | | 400 | | | | 436,967 | |
Sunac China Holdings Ltd., | | | | | | | | | | | | | | | | |
Sr. Sec’d. Notes | | 6.500 | | 01/10/25 | | | | | | | 200 | | | | 143,098 | |
| | | | | | | | | | | | | | | | |
| | | | | |
| | | | | | | | | | | | | | | 2,545,563 | |
| | | | | |
Colombia 0.2% | | | | | | | | | | | | | | | | |
Ecopetrol SA, | | | | | | | | | | | | | | | | |
Sr. Unsec’d. Notes | | 4.625 | | 11/02/31 | | | | | | | 140 | | | | 138,848 | |
Grupo Aval Ltd., | | | | | | | | | | | | | | | | |
Gtd. Notes, 144A | | 4.375 | | 02/04/30 | | | | | | | 200 | | | | 195,500 | |
| | | | | | | | | | | | | | | | |
| | | | | |
| | | | | | | | | | | | | | | 334,348 | |
| | | | | |
Costa Rica 0.1% | | | | | | | | | | | | | | | | |
Instituto Costarricense de Electricidad, | | | | | | | | | | | | | | | | |
Sr. Unsec’d. Notes, 144A | | 6.750 | | 10/07/31 | | | | | | | 200 | | | | 201,464 | |
See Notes to Financial Statements.
16
| | | | | | | | | | | | | | | | |
| | | | | |
| Description | | Interest
Rate | | Maturity
Date | | | | | Principal
Amount
(000)# | | | Value | |
| | | | | |
CORPORATE BONDS (Continued) | | | | | | | | | | | | | | | | |
| | | | | |
Ghana 0.1% | | | | | | | | | | | | | | | | |
Tullow Oil PLC,
Sr. Sec’d. Notes, 144A | | 10.250% | | 05/15/26 | | | | | | | 200 | | | $ | 210,249 | |
| | | | | |
Guatemala 0.1% | | | | | | | | | | | | | | | | |
Energuate Trust,
Gtd. Notes | | 5.875 | | 05/03/27 | | | | | | | 200 | | | | 204,550 | |
| | | | | |
India 1.5% | | | | | | | | | | | | | | | | |
Adani Ports & Special Economic Zone Ltd.,
Sr. Unsec’d. Notes, 144A | | 5.000 | | 08/02/41 | | | | | | | 200 | | | | 209,947 | |
Azure Power Solar Energy Pvt. Ltd.,
Sr. Sec’d. Notes, 144A, MTN | | 5.650 | | 12/24/24 | | | | | | | 200 | | | | 210,018 | |
GMR Hyderabad International Airport Ltd.,
Sr. Sec’d. Notes | | 4.250 | | 10/27/27 | | | | | | | 200 | | | | 193,362 | |
HPCL-Mittal Energy Ltd.,
Sr. Unsec’d. Notes | | 5.250 | | 04/28/27 | | | | | | | 200 | | | | 206,246 | |
NTPC Ltd.,
Sr. Unsec’d. Notes, EMTN | | 2.750 | | 02/01/27 | | | EUR | | | | 100 | | | | 122,650 | |
Periama Holdings LLC,
Gtd. Notes | | 5.950 | | 04/19/26 | | | | | | | 200 | | | | 216,610 | |
Power Finance Corp. Ltd., | | | | | | | | | | | | | | | | |
Sr. Unsec’d. Notes | | 4.500 | | 06/18/29 | | | | | | | 400 | | | | 426,344 | |
Sr. Unsec’d. Notes, 144A, MTN | | 6.150 | | 12/06/28 | | | | | | | 200 | | | | 235,294 | |
Summit Digitel Infrastructure Pvt Ltd.,
Sr. Sec’d. Notes, 144A | | 2.875 | | 08/12/31 | | | | | | | 235 | | | | 225,126 | |
TML Holdings Pte Ltd.,
Sr. Unsec’d. Notes | | 5.500 | | 06/03/24 | | | | | | | 200 | | | | 208,720 | |
| | | | | | | | | | | | | | | | |
| | | | | |
| | | | | | | | | | | | | | | 2,254,317 | |
| | | | | |
Indonesia 2.3% | | | | | | | | | | | | | | | | |
Cikarang Listrindo Tbk PT,
Sr. Unsec’d. Notes, 144A | | 4.950 | | 09/14/26 | | | | | | | 200 | | | | 204,719 | |
Indonesia Asahan Aluminium Persero PT, | | | | | | | | | | | | | | | | |
Sr. Unsec’d. Notes | | 5.450 | | 05/15/30 | | | | | | | 700 | | | | 801,980 | |
Sr. Unsec’d. Notes | | 6.530 | | 11/15/28 | | | | | | | 220 | | | | 265,338 | |
Sr. Unsec’d. Notes, 144A | | 4.750 | | 05/15/25 | | | | | | | 200 | | | | 214,743 | |
Pertamina Persero PT, | | | | | | | | | | | | | | | | |
Sr. Unsec’d. Notes | | 6.000 | | 05/03/42 | | | | | | | 200 | | | | 248,576 | |
Sr. Unsec’d. Notes, EMTN | | 4.700 | | 07/30/49 | | | | | | | 200 | | | | 220,429 | |
Sr. Unsec’d. Notes, EMTN | | 6.500 | | 11/07/48 | | | | | | | 200 | | | | 269,297 | |
See Notes to Financial Statements.
PGIM Emerging Markets Debt Hard Currency Fund 17
Schedule of Investments (continued)
as of October 31, 2021
| | | | | | | | | | | | | | | | |
| | | | | |
| Description | | Interest
Rate | | Maturity
Date | | | | | Principal
Amount
(000)# | | | Value | |
| | | | | |
CORPORATE BONDS (Continued) | | | | | | | | | | | | | | | | |
| | | | | |
Indonesia (cont’d.) | | | | | | | | | | | | | | | | |
Perusahaan Listrik Negara PT, | | | | | | | | | | | | | | | | |
Sr. Unsec’d. Notes | | 1.875% | | 11/05/31 | | | EUR | | | | 100 | | | $ | 112,396 | |
Sr. Unsec’d. Notes | | 2.875 | | 10/25/25 | | | EUR | | | | 200 | | | | 246,538 | |
Perusahaan Perseroan Persero PT Perusahaan Listrik Negara, | | | | | | | | | | | | | | | | |
Sr. Unsec’d. Notes, 144A, MTN | | 5.450 | | 05/21/28 | | | | | | | 420 | | | | 485,746 | |
Sr. Unsec’d. Notes, 144A, MTN | | 6.150 | | 05/21/48 | | | | | | | 200 | | | | 249,336 | |
Sr. Unsec’d. Notes, EMTN | | 4.125 | | 05/15/27 | | | | | | | 250 | | | | 269,739 | |
| | | | | | | | | | | | | | | | |
| | | | | |
| | | | | | | | | | | | | | | 3,588,837 | |
| | | | | |
Israel 0.4% | | | | | | | | | | | | | | | | |
Energean Israel Finance Ltd., | | | | | | | | | | | | | | | | |
Sr. Sec’d. Notes, 144A | | 4.875 | | 03/30/26 | | | | | | | 75 | | | | 76,301 | |
Sr. Sec’d. Notes, 144A | | 5.375 | | 03/30/28 | | | | | | | 115 | | | | 116,442 | |
Sr. Sec’d. Notes, 144A | | 5.875 | | 03/30/31 | | | | | | | 115 | | | | 116,450 | |
Leviathan Bond Ltd., | | | | | | | | | | | | | | | | |
Sr. Sec’d. Notes, 144A | | 6.125 | | 06/30/25 | | | | | | | 200 | | | | 215,574 | |
| | | | | | | | | | | | | | | | |
| | | | | |
| | | | | | | | | | | | | | | 524,767 | |
| | | | | |
Jamaica 0.1% | | | | | | | | | | | | | | | | |
Digicel International Finance Ltd./Digicel International Holdings Ltd., | | | | | | | | | | | | | | | | |
Gtd. Notes, 144A | | 8.000 | | 12/31/26 | | | | | | | 39 | | | | 37,729 | |
Gtd. Notes, 144A, Cash coupon 6.000% and PIK 7.000% | | 13.000 | | 12/31/25 | | | | | | | 53 | | | | 54,500 | |
Sr. Sec’d. Notes, 144A | | 8.750 | | 05/25/24 | | | | | | | 97 | | | | 100,569 | |
| | | | | | | | | | | | | | | | |
| | | | | |
| | | | | | | | | | | | | | | 192,798 | |
| | | | | |
Kazakhstan 1.3% | | | | | | | | | | | | | | | | |
Kazakhstan Temir Zholy Finance BV, | | | | | | | | | | | | | | | | |
Gtd. Notes | | 6.950 | | 07/10/42 | | | | | | | 400 | | | | 544,999 | |
KazMunayGas National Co. JSC, | | | | | | | | | | | | | | | | |
Sr. Unsec’d. Notes | | 5.375 | | 04/24/30 | | | | | | | 400 | | | | 470,552 | |
Sr. Unsec’d. Notes | | 5.750 | | 04/19/47 | | | | | | | 400 | | | | 488,823 | |
Sr. Unsec’d. Notes | | 6.375 | | 10/24/48 | | | | | | | 400 | | | | 519,783 | |
| | | | | | | | | | | | | | | | |
| | | | | |
| | | | | | | | | | | | | | | 2,024,157 | |
See Notes to Financial Statements.
18
| | | | | | | | | | | | | | | | |
| | | | | |
| Description | | Interest
Rate | | Maturity
Date | | | | | Principal
Amount
(000)# | | | Value | |
| | | | | |
CORPORATE BONDS (Continued) | | | | | | | | | | | | | | | | |
| | | | | |
Kuwait 0.3% | | | | | | | | | | | | | | | | |
MEGlobal Canada ULC, | | | | | | | | | | | | | | | | |
Gtd. Notes, 144A, MTN | | 5.875% | | 05/18/30 | | | | | | | 400 | | | $ | 486,418 | |
| | | | | |
Malaysia 1.1% | | | | | | | | | | | | | | | | |
Genm Capital Labuan Ltd., | | | | | | | | | | | | | | | | |
Gtd. Notes | | 3.882 | | 04/19/31 | | | | | | | 200 | | | | 196,200 | |
Gohl Capital Ltd., | | | | | | | | | | | | | | | | |
Gtd. Notes | | 4.250 | | 01/24/27 | | | | | | | 250 | | | | 259,622 | |
Petronas Capital Ltd., | | | | | | | | | | | | | | | | |
Gtd. Notes, 144A, MTN | | 4.550 | | 04/21/50 | | | | | | | 800 | | | | 1,006,256 | |
Gtd. Notes, EMTN | | 4.550 | | 04/21/50 | | | | | | | 200 | | | | 251,564 | |
| | | | | | | | | | | | | | | | |
| | | | | |
| | | | | | | | | | | | | | | 1,713,642 | |
| | | | | |
Mexico 4.7% | | | | | | | | | | | | | | | | |
Cemex SAB de CV, | | | | | | | | | | | | | | | | |
Gtd. Notes | | 5.450 | | 11/19/29 | | | | | | | 400 | | | | 433,081 | |
FEL Energy VI Sarl, | | | | | | | | | | | | | | | | |
Sr. Sec’d. Notes, 144A | | 5.750 | | 12/01/40 | | | | | | | 234 | | | | 231,341 | |
Fermaca Enterprises S de RL de CV, | | | | | | | | | | | | | | | | |
Sr. Sec’d. Notes | | 6.375 | | 03/30/38 | | | | | | | 221 | | | | 253,545 | |
Mexico City Airport Trust, | | | | | | | | | | | | | | | | |
Sr. Sec’d. Notes | | 4.250 | | 10/31/26 | | | | | | | 360 | | | | 385,022 | |
Sr. Sec’d. Notes | | 5.500 | | 07/31/47 | | | | | | | 600 | | | | 609,470 | |
Petroleos Mexicanos, | | | | | | | | | | | | | | | | |
Gtd. Notes | | 5.350 | | 02/12/28 | | | | | | | 507 | | | | 506,050 | |
Gtd. Notes | | 5.950 | | 01/28/31 | | | | | | | 180 | | | | 177,139 | |
Gtd. Notes | | 6.350 | | 02/12/48 | | | | | | | 376 | | | | 320,300 | |
Gtd. Notes | | 6.490 | | 01/23/27 | | | | | | | 305 | | | | 324,554 | |
Gtd. Notes | | 6.500 | | 03/13/27 | | | | | | | 883 | | | | 941,278 | |
Gtd. Notes | | 6.500 | | 01/23/29 | | | | | | | 650 | | | | 676,793 | |
Gtd. Notes | | 6.500 | | 06/02/41 | | | | | | | 410 | | | | 370,616 | |
Gtd. Notes | | 6.840 | | 01/23/30 | | | | | | | 618 | | | | 645,681 | |
Gtd. Notes | | 7.690 | | 01/23/50 | | | | | | | 550 | | | | 525,508 | |
Gtd. Notes, EMTN | | 3.750 | | 04/16/26 | | | EUR | | | | 285 | | | | 329,467 | |
Gtd. Notes, MTN | | 6.875 | | 08/04/26 | | | | | | | 455 | | | | 496,893 | |
| | | | | | | | | | | | | | | | |
| | | | | |
| | | | | | | | | | | | | | | 7,226,738 | |
| | | | | |
Mongolia 0.1% | | | | | | | | | | | | | | | | |
Development Bank of Mongolia LLC, | | | | | | | | | | | | | | | | |
Unsec’d. Notes | | 7.250 | | 10/23/23 | | | | | | | 200 | | | | 212,880 | |
See Notes to Financial Statements.
PGIM Emerging Markets Debt Hard Currency Fund 19
Schedule of Investments (continued)
as of October 31, 2021
| | | | | | | | | | | | | | | | |
| | | | | |
| Description | | Interest
Rate | | Maturity
Date | | | | | Principal
Amount
(000)# | | | Value | |
| | | | | |
CORPORATE BONDS (Continued) | | | | | | | | | | | | | | | | |
| | | | | |
Netherlands 0.1% | | | | | | | | | | | | | | | | |
| | | | | |
VEON Holdings BV, | | | | | | | | | | | | | | | | |
Sr. Unsec’d. Notes, 144A | | 3.375% | | 11/25/27 | | | | | | | 200 | | | $ | 199,868 | |
| | | | | |
Panama 0.1% | | | | | | | | | | | | | | | | |
| | | | | |
Aeropuerto Internacional de Tocumen SA, | | | | | | | | | | | | | | | | |
Sr. Sec’d. Notes, 144A | | 5.125 | | 08/11/61 | | | | | | | 200 | | | | 208,408 | |
| | | | | |
Peru 0.3% | | | | | | | | | | | | | | | | |
| | | | | |
Corp. Financiera de Desarrollo SA, | | | | | | | | | | | | | | | | |
Sr. Unsec’d. Notes | | 2.400 | | 09/28/27 | | | | | | | 200 | | | | 196,742 | |
Petroleos del Peru SA, | | | | | | | | | | | | | | | | |
Sr. Unsec’d. Notes | | 4.750 | | 06/19/32 | | | | | | | 200 | | | | 211,502 | |
| | | | | | | | | | | | | | | | |
| | | | | |
| | | | | | | | | | | | | | | 408,244 | |
| | | | | |
Philippines 0.1% | | | | | | | | | | | | | | | | |
| | | | | |
Globe Telecom, Inc., | | | | | | | | | | | | | | | | |
Sr. Unsec’d. Notes | | 3.000 | | 07/23/35 | | | | | | | 200 | | | | 183,817 | |
| | | | | |
Qatar 0.4% | | | | | | | | | | | | | | | | |
| | | | | |
Qatar Energy, | | | | | | | | | | | | | | | | |
Sr. Unsec’d. Notes | | 3.300 | | 07/12/51 | | | | | | | 200 | | | | 205,073 | |
Sr. Unsec’d. Notes, 144A | | 3.125 | | 07/12/41 | | | | | | | 400 | | | | 406,031 | |
| | | | | | | | | | | | | | | | |
| | | | | |
| | | | | | | | | | | | | | | 611,104 | |
| | | | | |
Russia 1.3% | | | | | | | | | | | | | | | | |
| | | | | |
Gazprom PJSC Via Gaz Capital SA, | | | | | | | | | | | | | | | | |
Sr. Unsec’d. Notes | | 4.950 | | 02/06/28 | | | | | | | 400 | | | | 440,207 | |
Sr. Unsec’d. Notes, EMTN | | 7.288 | | 08/16/37 | | | | | | | 300 | | | | 405,289 | |
Sr. Unsec’d. Notes, EMTN | | 8.625 | | 04/28/34 | | | | | | | 465 | | | | 670,012 | |
Lukoil Securities BV, | | | | | | | | | | | | | | | | |
Gtd. Notes | | 3.875 | | 05/06/30 | | | | | | | 400 | | | | 414,921 | |
| | | | | | | | | | | | | | | | |
| | | | | |
| | | | | | | | | | | | | | | 1,930,429 | |
| | | | | |
Saudi Arabia 0.3% | | | | | | | | | | | | | | | | |
| | | | | |
Arabian Centres Sukuk Ltd., | | | | | | | | | | | | | | | | |
Gtd. Notes | | 5.375 | | 11/26/24 | | | | | | | 200 | | | | 208,379 | |
Saudi Arabian Oil Co., | | | | | | | | | | | | | | | | |
Sr. Unsec’d. Notes, EMTN | | 4.250 | | 04/16/39 | | | | | | | 200 | | | | 224,963 | |
| | | | | | | | | | | | | | | | |
| | | | | |
| | | | | | | | | | | | | | | 433,342 | |
See Notes to Financial Statements.
20
| | | | | | | | | | | | | | | | |
| | | | | |
| Description | | Interest
Rate | | Maturity
Date | | | | | Principal
Amount
(000)# | | | Value | |
| | | | | |
CORPORATE BONDS (Continued) | | | | | | | | | | | | | | | | |
| | | | | |
South Africa 1.9% | | | | | | | | | | | | | | | | |
Eskom Holdings SOC Ltd., | | | | | | | | | | | | | | | | |
Gov’t. Gtd. Notes, MTN | | 6.350% | | 08/10/28 | | | | | | | 600 | | | $ | 646,765 | |
Sr. Unsec’d. Notes | | 7.125 | | 02/11/25 | | | | | | | 600 | | | | 625,928 | |
Sr. Unsec’d. Notes, EMTN | | 6.750 | | 08/06/23 | | | | | | | 400 | | | | 413,106 | |
Sr. Unsec’d. Notes, MTN | | 8.450 | | 08/10/28 | | | | | | | 660 | | | | 723,576 | |
| | | | | |
MTN Mauritius Investments Ltd., | | | | | | | | | | | | | | | | |
Gtd. Notes, 144A | | 6.500 | | 10/13/26 | | | | | | | 200 | | | | 226,831 | |
Sasol Financing USA LLC, | | | | | | | | | | | | | | | | |
Gtd. Notes | | 6.500 | | 09/27/28 | | | | | | | 300 | | | | 332,507 | |
| | | | | | | | | | | | | | | | |
| | | | | |
| | | | | | | | | | | | | | | 2,968,713 | |
| | | | | |
Thailand 0.1% | | | | | | | | | | | | | | | | |
Thaioil Treasury Center Co. Ltd., | | | | | | | | | | | | | | | | |
Gtd. Notes, 144A, MTN | | 3.750 | | 06/18/50 | | | | | | | 200 | | | | 186,147 | |
| | | | | |
Trinidad & Tobago 0.1% | | | | | | | | | | | | | | | | |
Trinidad Petroleum Holdings Ltd., | | | | | | | | | | | | | | | | |
Sr. Sec’d. Notes, 144A | | 9.750 | | 06/15/26 | | | | | | | 166 | | | | 184,862 | |
| | | | | |
Turkey 0.3% | | | | | | | | | | | | | | | | |
Aydem Yenilenebilir Enerji A/S, | | | | | | | | | | | | | | | | |
Sr. Sec’d. Notes, 144A | | 7.750 | | 02/02/27 | | | | | | | 200 | | | | 190,111 | |
Turkiye Sinai Kalkinma Bankasi A/S, | | | | | | | | | | | | | | | | |
Sr. Unsec’d. Notes, 144A | | 6.000 | | 01/23/25 | | | | | | | 200 | | | | 200,806 | |
| | | | | | | | | | | | | | | | |
| | | | | |
| | | | | | | | | | | | | | | 390,917 | |
| | | | | |
Ukraine 0.4% | | | | | | | | | | | | | | | | |
NAK Naftogaz Ukraine via Kondor Finance PLC, | | | | | | | | | | | | | | | | |
Sr. Unsec’d. Notes | | 7.125 | | 07/19/24 | | | EUR | | | | 420 | | | | 485,917 | |
State Savings Bank of Ukraine Via SSB #1 PLC, | | | | | | | | | | | | | | | | |
Sr. Unsec’d. Notes | | 9.625 | | 03/20/25 | | | | | | | 70 | | | | 75,227 | |
| | | | | | | | | | | | | | | | |
| | | | | |
| | | | | | | | | | | | | | | 561,144 | |
| | | | | |
United Arab Emirates 1.6% | | | | | | | | | | | | | | | | |
Abu Dhabi Crude Oil Pipeline LLC, | | | | | | | | | | | | | | | | |
Sr. Sec’d. Notes | | 3.650 | | 11/02/29 | | | | | | | 200 | | | | 221,514 | |
Sr. Sec’d. Notes | | 4.600 | | 11/02/47 | | | | | | | 200 | | | | 232,525 | |
| | | | | |
Abu Dhabi National Energy Co. PJSC, | | | | | | | | | | | | | | | | |
Sr. Unsec’d. Notes, 144A | | 4.000 | | 10/03/49 | | | | | | | 200 | | | | 228,108 | |
See Notes to Financial Statements.
PGIM Emerging Markets Debt Hard Currency Fund 21
Schedule of Investments (continued)
as of October 31, 2021
| | | | | | | | | | | | | | |
| | | | | |
| Description | | Interest
Rate | | Maturity
Date | | | | Principal
Amount
(000)# | | | Value | |
| | | | | |
CORPORATE BONDS (Continued) | | | | | | | | | | | | | | |
| | | | | |
United Arab Emirates (cont’d.) | | | | | | | | | | | | | | |
DP World PLC, | | | | | | | | | | | | | | |
Sr. Unsec’d. Notes, EMTN | | 6.850% | | 07/02/37 | | | | | 600 | | | $ | 793,313 | |
Galaxy Pipeline Assets Bidco Ltd., | | | | | | | | | | | | | | |
Sr. Sec’d. Notes, 144A | | 2.940 | | 09/30/40 | | | | | 600 | | | | 591,058 | |
ICD Funding Ltd., | | | | | | | | | | | | | | |
Gtd. Notes | | 4.625 | | 05/21/24 | | | | | 200 | | | | 212,152 | |
ICD Sukuk Co. Ltd., | | | | | | | | | | | | | | |
Sr. Unsec’d. Notes, EMTN | | 5.000 | | 02/01/27 | | | | | 200 | | | | 218,873 | |
| | | | | | | | | | | | | | |
| | | | | |
| | | | | | | | | | | | | 2,497,543 | |
| | | | | |
United States 0.1% | | | | | | | | | | | | | | |
JBS USA Food Co., | | | | | | | | | | | | | | |
Gtd. Notes, 144A | | 5.750 | | 01/15/28 | | | | | 200 | | | | 208,805 | |
| | | | | |
Venezuela 0.1% | | | | | | | | | | | | | | |
Petroleos de Venezuela SA, | | | | | | | | | | | | | | |
Gtd. Notes | | 5.375 | | 04/12/27(d) | | | | | 205 | | | | 11,553 | |
Gtd. Notes | | 6.000 | | 05/16/24(d) | | | | | 45 | | | | 2,254 | |
Gtd. Notes | | 6.000 | | 11/15/26(d) | | | | | 65 | | | | 3,528 | |
Sr. Sec’d. Notes | | 8.500 | | 10/27/20(d) | | | | | 205 | | | | 55,075 | |
| | | | | | | | | | | | | | |
| | | | | |
| | | | | | | | | | | | | 72,410 | |
| | | | | |
Vietnam 0.2% | | | | | | | | | | | | | | |
Mong Duong Finance Holdings BV, | | | | | | | | | | | | | | |
Sr. Sec’d. Notes | | 5.125 | | 05/07/29 | | | | | 250 | | | | 248,674 | |
| | | | | | | | | | | | | | |
| | | | | |
TOTAL CORPORATE BONDS
(cost $38,448,629) | | | | | | | | | | | | | 38,725,780 | |
| | | | | | | | | | | | | | |
| | | | | |
SOVEREIGN BONDS 65.6% | | | | | | | | | | | | | | |
| | | | | |
Angola 2.0% | | | | | | | | | | | | | | |
Angolan Government International Bond, | | | | | | | | | | | | | | |
Sr. Unsec’d. Notes | | 8.250 | | 05/09/28 | | | | | 800 | | | | 804,507 | |
Sr. Unsec’d. Notes | | 9.375 | | 05/08/48 | | | | | 400 | | | | 397,660 | |
Sr. Unsec’d. Notes | | 9.500 | | 11/12/25 | | | | | 1,150 | | | | 1,246,470 | |
Sr. Unsec’d. Notes, 144A | | 9.375 | | 05/08/48 | | | | | 200 | | | | 198,830 | |
Sr. Unsec’d. Notes, EMTN | | 8.000 | | 11/26/29 | | | | | 400 | | | | 397,250 | |
| | | | | | | | | | | | | | |
| | | | | |
| | | | | | | | | | | | | 3,044,717 | |
See Notes to Financial Statements.
22
| | | | | | | | | | | | | | |
| | | | | |
| Description | | Interest
Rate | | Maturity
Date | | | | Principal
Amount
(000)# | | | Value | |
| | | | | |
SOVEREIGN BONDS (Continued) | | | | | | | | | | | | | | |
| | | | | |
Argentina 1.3% | | | | | | | | | | | | | | |
Argentina Bonar Bonds, | | | | | | | | | | | | | | |
Bonds | | 0.500%(cc) | | 07/09/30 | | | | | 2 | | | $ | 539 | |
Unsec’d. Notes | | 1.000 | | 07/09/29 | | | | | 12 | | | | 3,946 | |
Argentine Republic Government International Bond, | | | | | | | | | | | | | | |
Sr. Unsec’d. Notes | | 0.500(cc) | | 07/09/30 | | | | | 2,080 | | | | 713,076 | |
Sr. Unsec’d. Notes | | 1.000 | | 07/09/29 | | | | | 254 | | | | 92,429 | |
Sr. Unsec’d. Notes | | 1.125(cc) | | 07/09/35 | | | | | 102 | | | | 31,462 | |
Sr. Unsec’d. Notes | | 1.125(cc) | | 07/09/46 | | | | | 335 | | | | 105,678 | |
Sr. Unsec’d. Notes | | 2.000(cc) | | 01/09/38 | | | | | 1,620 | | | | 591,847 | |
Sr. Unsec’d. Notes | | 2.500(cc) | | 07/09/41 | | | | | 597 | | | | 206,369 | |
| | | | | |
Provincia de Buenos Aires, | | | | | | | | | | | | | | |
| | | | | |
Sr. Unsec’d. Notes, 144A, MTN | | 3.900(cc) | | 09/01/37 | | | | | 637 | | | | 281,883 | |
| | | | | | | | | | | | | | |
| | | | | |
| | | | | | | | | | | | | 2,027,229 | |
| | | | | |
Bahrain 1.4% | | | | | | | | | | | | | | |
Bahrain Government International Bond, | | | | | | | | | | | | | | |
Sr. Unsec’d. Notes | | 6.750 | | 09/20/29 | | | | | 400 | | | | 431,792 | |
Sr. Unsec’d. Notes | | 7.000 | | 10/12/28 | | | | | 600 | | | | 658,103 | |
Sr. Unsec’d. Notes | | 7.375 | | 05/14/30 | | | | | 720 | | | | 802,302 | |
Sr. Unsec’d. Notes | | 7.500 | | 09/20/47 | | | | | 200 | | | | 207,002 | |
| | | | | | | | | | | | | | |
| | | | | |
| | | | | | | | | | | | | 2,099,199 | |
| | | | | |
Belarus 0.6% | | | | | | | | | | | | | | |
Republic of Belarus International Bond, | | | | | | | | | | | | | | |
Sr. Unsec’d. Notes | | 5.875 | | 02/24/26 | | | | | 200 | | | | 184,237 | |
Sr. Unsec’d. Notes | | 6.200 | | 02/28/30 | | | | | 200 | | | | 173,421 | |
Sr. Unsec’d. Notes | | 6.875 | | 02/28/23 | | | | | 200 | | | | 200,770 | |
Sr. Unsec’d. Notes | | 7.625 | | 06/29/27 | | | | | 425 | | | | 412,087 | |
| | | | | | | | | | | | | | |
| | | | | |
| | | | | | | | | | | | | 970,515 | |
| | | | | |
Bermuda 0.2% | | | | | | | | | | | | | | |
Bermuda Government International Bond, | | | | | | | | | | | | | | |
Sr. Unsec’d. Notes | | 2.375 | | 08/20/30 | | | | | 270 | | | | 268,084 | |
| | | | | |
Brazil 2.2% | | | | | | | | | | | | | | |
Brazil Minas SPE via State of Minas Gerais, | | | | | | | | | | | | | | |
Gov’t. Gtd. Notes | | 5.333 | | 02/15/28 | | | | | 200 | | | | 211,622 | |
Brazilian Government International Bond, | | | | | | | | | | | | | | |
Sr. Unsec’d. Notes | | 4.500 | | 05/30/29 | | | | | 300 | | | | 300,178 | |
Sr. Unsec’d. Notes | | 5.000 | | 01/27/45 | | | | | 200 | | | | 179,879 | |
See Notes to Financial Statements.
PGIM Emerging Markets Debt Hard Currency Fund 23
Schedule of Investments (continued)
as of October 31, 2021
| | | | | | | | | | | | | | |
| | | | | |
| Description | | Interest
Rate | | Maturity
Date | | | | Principal
Amount
(000)# | | | Value | |
| | | | | |
SOVEREIGN BONDS (Continued) | | | | | | | | | | | | | | |
| | | | | |
Brazil (cont’d.) | | | | | | | | | | | | | | |
Brazilian Government International Bond, (cont’d.) | | | | | | | | | | | | | | |
Sr. Unsec’d. Notes | | 5.625% | | 01/07/41 | | | | | 405 | | | $ | 396,508 | |
Sr. Unsec’d. Notes | | 7.125 | | 01/20/37 | | | | | 950 | | | | 1,112,216 | |
Sr. Unsec’d. Notes | | 8.250 | | 01/20/34 | | | | | 923 | | | | 1,191,457 | |
| | | | | | | | | | | | | | |
| | | | | |
| | | | | | | | | | | | | 3,391,860 | |
| | | | | |
Bulgaria 0.1% | | | | | | | | | | | | | | |
Bulgaria Government International Bond, | | | | | | | | | | | | | | |
Sr. Unsec’d. Notes | | 1.375 | | 09/23/50 | | EUR | | | 180 | | | | 194,852 | |
| | | | | |
Cameroon 0.3% | | | | | | | | | | | | | | |
Republic of Cameroon International Bond, | | | | | | | | | | | | | | |
Sr. Unsec’d. Notes | | 9.500 | | 11/19/25 | | | | | 400 | | | | 442,557 | |
| | | | | |
Colombia 2.3% | | | | | | | | | | | | | | |
Colombia Government International Bond, | | | | | | | | | | | | | | |
Sr. Unsec’d. Notes | | 3.875 | | 04/25/27 | | | | | 200 | | | | 207,370 | |
Sr. Unsec’d. Notes | | 4.500 | | 03/15/29 | | | | | 800 | | | | 845,772 | |
Sr. Unsec’d. Notes | | 6.125 | | 01/18/41 | | | | | 780 | | | | 864,409 | |
Sr. Unsec’d. Notes | | 7.375 | | 09/18/37 | | | | | 1,115 | | | | 1,378,204 | |
Sr. Unsec’d. Notes | | 10.375 | | 01/28/33 | | | | | 200 | | | | 294,189 | |
| | | | | | | | | | | | | | |
| | | | | |
| | | | | | | | | | | | | 3,589,944 | |
| | | | | |
Congo (Republic) 0.1% | | | | | | | | | | | | | | |
Congolese International Bond, | | | | | | | | | | | | | | |
Sr. Unsec’d. Notes | | 6.000 | | 06/30/29 | | | | | 242 | | | | 195,250 | |
| | | | | |
Costa Rica 0.8% | | | | | | | | | | | | | | |
Costa Rica Government International Bond, | | | | | | | | | | | | | | |
Sr. Unsec’d. Notes | | 4.375 | | 04/30/25 | | | | | 800 | | | | 820,609 | |
Sr. Unsec’d. Notes | | 6.125 | | 02/19/31 | | | | | 200 | | | | 204,940 | |
Sr. Unsec’d. Notes | | 7.000 | | 04/04/44 | | | | | 200 | | | | 199,565 | |
| | | | | | | | | | | | | | |
| | | | | |
| | | | | | | | | | | | | 1,225,114 | |
| | | | | |
Croatia 0.1% | | | | | | | | | | | | | | |
Croatia Government International Bond, | | | | | | | | | | | | | | |
Unsec’d. Notes | | 1.500 | | 06/17/31 | | EUR | | | 175 | | | | 210,126 | |
See Notes to Financial Statements.
24
| | | | | | | | | | | | | | |
| | | | | |
| Description | | Interest
Rate | | Maturity
Date | | | | Principal
Amount
(000)# | | | Value | |
| | | | | |
SOVEREIGN BONDS (Continued) | | | | | | | | | | | | | | |
| | | | | |
Dominican Republic 2.9% | | | | | | | | | | | | | | |
Dominican Republic International Bond, | | | | | | | | | | | | | | |
Sr. Unsec’d. Notes | | 4.500% | | 01/30/30 | | | | | 335 | | | $ | 338,676 | |
Sr. Unsec’d. Notes | | 5.500 | | 01/27/25 | | | | | 100 | | | | 108,706 | |
Sr. Unsec’d. Notes | | 5.875 | | 04/18/24 | | | | | 425 | | | | 447,661 | |
Sr. Unsec’d. Notes | | 5.950 | | 01/25/27 | | | | | 200 | | | | 223,217 | |
Sr. Unsec’d. Notes | | 6.850 | | 01/27/45 | | | | | 290 | | | | 323,465 | |
Sr. Unsec’d. Notes | | 6.875 | | 01/29/26 | | | | | 400 | | | | 459,122 | |
Sr. Unsec’d. Notes | | 7.450 | | 04/30/44 | | | | | 1,400 | | | | 1,672,506 | |
Sr. Unsec’d. Notes, 144A | | 4.875 | | 09/23/32 | | | | | 150 | | | | 152,173 | |
Sr. Unsec’d. Notes, 144A | | 5.300 | | 01/21/41 | | | | | 150 | | | | 149,507 | |
Sr. Unsec’d. Notes, 144A | | 5.875 | | 01/30/60 | | | | | 225 | | | | 219,755 | |
Sr. Unsec’d. Notes, 144A | | 6.000 | | 07/19/28 | | | | | 320 | | | | 359,303 | |
| | | | | | | | | | | | | | |
| | | | | |
| | | | | | | | | | | | | 4,454,091 | |
| | | | | |
Ecuador 1.5% | | | | | | | | | | | | | | |
Ecuador Government International Bond, | | | | | | | | | | | | | | |
Sr. Unsec’d. Notes | | 5.000(cc) | | 07/31/30 | | | | | 270 | | | | 224,298 | |
Sr. Unsec’d. Notes, 144A | | 0.500(cc) | | 07/31/40 | | | | | 1,111 | | | | 669,583 | |
Sr. Unsec’d. Notes, 144A | | 1.000(cc) | | 07/31/35 | | | | | 1,105 | | | | 730,414 | |
Sr. Unsec’d. Notes, 144A | | 5.000(cc) | | 07/31/30 | | | | | 639 | | | | 530,792 | |
Sr. Unsec’d. Notes, 144A | | 7.187(s) | | 07/31/30 | | | | | 179 | | | | 95,688 | |
| | | | | | | | | | | | | | |
| | | | | |
| | | | | | | | | | | | | 2,250,775 | |
| | | | | | | | | | | | | | |
| | | | | |
Egypt 1.3% | | | | | | | | | | | | | | |
Egypt Government International Bond, | | | | | | | | | | | | | | |
Sr. Unsec’d. Notes | | 8.875 | | 05/29/50 | | | | | 200 | | | | 188,668 | |
Sr. Unsec’d. Notes, 144A | | 8.700 | | 03/01/49 | | | | | 210 | | | | 195,974 | |
Sr. Unsec’d. Notes, 144A, MTN | | 4.750 | | 04/16/26 | | EUR | | | 100 | | | | 113,288 | |
Sr. Unsec’d. Notes, 144A, MTN | | 6.375 | | 04/11/31 | | EUR | | | 420 | | | | 457,456 | |
Sr. Unsec’d. Notes, 144A, MTN | | 8.500 | | 01/31/47 | | | | | 255 | | | | 235,360 | |
Sr. Unsec’d. Notes, EMTN | | 4.750 | | 04/16/26 | | EUR | | | 100 | | | | 113,288 | |
Sr. Unsec’d. Notes, EMTN | | 5.625 | | 04/16/30 | | EUR | | | 200 | | | | 212,991 | |
Sr. Unsec’d. Notes, EMTN | | 6.375 | | 04/11/31 | | EUR | | | 100 | | | | 108,918 | |
Sr. Unsec’d. Notes, MTN | | 7.500 | | 01/31/27 | | | | | 200 | | | | 207,416 | |
Sr. Unsec’d. Notes, MTN | | 8.500 | | 01/31/47 | | | | | 250 | | | | 230,746 | |
| | | | | | | | | | | | | | |
| | | | | |
| | | | | | | | | | | | | 2,064,105 | |
| | | | | |
El Salvador 0.8% | | | | | | | | | | | | | | |
El Salvador Government International Bond, | | | | | | | | | | | | | | |
Sr. Unsec’d. Notes | | 5.875 | | 01/30/25 | | | | | 355 | | | | 281,224 | |
See Notes to Financial Statements.
PGIM Emerging Markets Debt Hard Currency Fund 25
Schedule of Investments (continued)
as of October 31, 2021
| | | | | | | | | | | | | | | | |
| | | | | |
| Description | | Interest
Rate | | Maturity
Date | | | | | Principal
Amount
(000)# | | | Value | |
| | | | | |
SOVEREIGN BONDS (Continued) | | | | | | | | | | | | | | | | |
| | | | | |
El Salvador (cont’d.) | | | | | | | | | | | | | | | | |
El Salvador Government International Bond, (cont’d.) | | | | | | | | | | | | | | | | |
Sr. Unsec’d. Notes | | 6.375% | | 01/18/27 | | | | | | | 235 | | | $ | 177,200 | |
Sr. Unsec’d. Notes | | 7.625 | | 02/01/41 | | | | | | | 150 | | | | 110,042 | |
Sr. Unsec’d. Notes | | 7.650 | | 06/15/35 | | | | | | | 57 | | | | 42,765 | |
Sr. Unsec’d. Notes | | 7.750 | | 01/24/23 | | | | | | | 295 | | | | 259,916 | |
Sr. Unsec’d. Notes | | 8.250 | | 04/10/32 | | | | | | | 425 | | | | 331,625 | |
| | | | | | | | | | | | | | | | |
| | | | | |
| | | | | | | | | | | | | | | 1,202,772 | |
| | | | | |
Gabon 0.7% | | | | | | | | | | | | | | | | |
Gabon Government International Bond, | | | | | | | | | | | | | | | | |
Bonds | | 6.375 | | 12/12/24 | | | | | | | 200 | | | | 212,064 | |
Sr. Unsec’d. Notes | | 6.625 | | 02/06/31 | | | | | | | 200 | | | | 199,481 | |
Sr. Unsec’d. Notes | | 6.950 | | 06/16/25 | | | | | | | 400 | | | | 429,976 | |
Sr. Unsec’d. Notes, 144A | | 6.625 | | 02/06/31 | | | | | | | 215 | | | | 214,442 | |
| | | | | | | | | | | | | | | | |
| | | | | |
| | | | | | | | | | | | | | | 1,055,963 | |
| | | | | |
Ghana 1.0% | | | | | | | | | | | | | | | | |
Ghana Government International Bond, | | | | | | | | | | | | | | | | |
Bank Gtd. Notes | | 10.750 | | 10/14/30 | | | | | | | 400 | | | | 462,384 | |
Sr. Unsec’d. Notes | | 7.750 | | 04/07/29 | | | | | | | 200 | | | | 178,442 | |
Sr. Unsec’d. Notes | | 7.875 | | 03/26/27 | | | | | | | 400 | | | | 371,264 | |
Sr. Unsec’d. Notes | | 8.125 | | 01/18/26 | | | | | | | 400 | | | | 385,933 | |
Sr. Unsec’d. Notes, 144A | | 8.950 | | 03/26/51 | | | | | | | 205 | | | | 176,157 | |
| | | | | | | | | | | | | | | | |
| | | | | |
| | | | | | | | | | | | | | | 1,574,180 | |
| | | | | |
Guatemala 0.7% | | | | | | | | | | | | | | | | |
Guatemala Government Bond, | | | | | | | | | | | | | | | | |
Sr. Unsec’d. Notes | | 4.875 | | 02/13/28 | | | | | | | 400 | | | | 434,026 | |
Sr. Unsec’d. Notes | | 6.125 | | 06/01/50 | | | | | | | 400 | | | | 469,525 | |
Sr. Unsec’d. Notes, 144A | | 4.650 | | 10/07/41 | | | | | | | 200 | | | | 203,920 | |
| | | | | | | | | | | | | | | | |
| | | | | |
| | | | | | | | | | | | | | | 1,107,471 | |
| | | | | |
Honduras 0.5% | | | | | | | | | | | | | | | | |
Honduras Government International Bond, | | | | | | | | | | | | | | | | |
Sr. Unsec’d. Notes | | 6.250 | | 01/19/27 | | | | | | | 550 | | | | 575,553 | |
Sr. Unsec’d. Notes | | 7.500 | | 03/15/24 | | | | | | | 200 | | | | 209,491 | |
| | | | | | | | | | | | | | | | |
| | | | | |
| | | | | | | | | | | | | | | 785,044 | |
See Notes to Financial Statements.
26
| | | | | | | | | | | | | | | | |
| | | | | |
| Description | | Interest
Rate | | Maturity
Date | | | | | Principal
Amount
(000)# | | | Value | |
| | | | | |
SOVEREIGN BONDS (Continued) | | | | | | | | | | | | | | | | |
| | | | | |
Hungary 1.2% | | | | | | | | | | | | | | | | |
Hungary Government International Bond, | | | | | | | | | | | | | | | | |
Sr. Unsec’d. Notes | | 1.750% | | 06/05/35 | | | EUR | | | | 605 | | | $ | 726,754 | |
Sr. Unsec’d. Notes | | 7.625 | | 03/29/41 | | | | | | | 546 | | | | 901,652 | |
Sr. Unsec’d. Notes, 144A | | 3.125 | | 09/21/51 | | | | | | | 255 | | | | 249,328 | |
| | | | | | | | | | | | | | | | |
| | | | | |
| | | | | | | | | | | | | | | 1,877,734 | |
| | | | | |
India 0.3% | | | | | | | | | | | | | | | | |
Export-Import Bank of India, | | | | | | | | | | | | | | | | |
Sr. Unsec’d. Notes, 144A, MTN | | 3.250 | | 01/15/30 | | | | | | | 400 | | | | 406,524 | |
| | | | | |
Indonesia 2.2% | | | | | | | | | | | | | | | | |
Indonesia Government International Bond, | | | | | | | | | | | | | | | | |
Sr. Unsec’d. Notes | | 1.100 | | 03/12/33 | | | EUR | | | | 300 | | | | 332,926 | |
Sr. Unsec’d. Notes | | 1.400 | | 10/30/31 | | | EUR | | | | 100 | | | | 115,651 | |
Sr. Unsec’d. Notes | | 1.450 | �� | 09/18/26 | | | EUR | | | | 100 | | | | 119,068 | |
Sr. Unsec’d. Notes | | 6.625 | | 02/17/37 | | | | | | | 150 | | | | 206,605 | |
Sr. Unsec’d. Notes | | 7.750 | | 01/17/38 | | | | | | | 360 | | | | 542,258 | |
Sr. Unsec’d. Notes | | 8.500 | | 10/12/35 | | | | | | | 450 | | | | 709,449 | |
Sr. Unsec’d. Notes, 144A | | 6.625 | | 02/17/37 | | | | | | | 110 | | | | 151,510 | |
Sr. Unsec’d. Notes, EMTN | | 3.750 | | 06/14/28 | | | EUR | | | | 100 | | | | 134,674 | |
Sr. Unsec’d. Notes, EMTN | | 4.625 | | 04/15/43 | | | | | | | 200 | | | | 230,148 | |
Sr. Unsec’d. Notes, EMTN | | 4.750 | | 07/18/47 | | | | | | | 230 | | | | 275,966 | |
Sr. Unsec’d. Notes, EMTN | | 5.125 | | 01/15/45 | | | | | | | 200 | | | | 245,585 | |
Sr. Unsec’d. Notes, EMTN | | 5.250 | | 01/17/42 | | | | | | | 200 | | | | 247,733 | |
Sr. Unsec’d. Notes, EMTN | | 6.750 | | 01/15/44 | | | | | | | 100 | | | | 145,797 | |
| | | | | | | | | | | | | | | | |
| | | | | |
| | | | | | | | | | | | | | | 3,457,370 | |
| | | | | |
Iraq 0.8% | | | | | | | | | | | | | | | | |
Iraq International Bond, | | | | | | | | | | | | | | | | |
Sr. Unsec’d. Notes | | 5.800 | | 01/15/28 | | | | | | | 406 | | | | 395,731 | |
Sr. Unsec’d. Notes | | 6.752 | | 03/09/23 | | | | | | | 800 | | | | 817,029 | |
| | | | | | | | | | | | | | | | |
| | | | | |
| | | | | | | | | | | | | | | 1,212,760 | |
| | | | | |
Israel 0.4% | | | | | | | | | | | | | | | | |
Israel Government International Bond, | | | | | | | | | | | | | | | | |
Sr. Unsec’d. Notes | | 4.500 | | 04/03/2120 | | | | | | | 500 | | | | 625,252 | |
| | | | | |
Ivory Coast 1.2% | | | | | | | | | | | | | | | | |
Ivory Coast Government International Bond, | | | | | | | | | | | | | | | | |
Sr. Unsec’d. Notes | | 5.250 | | 03/22/30 | | | EUR | | | | 300 | | | | 356,602 | |
See Notes to Financial Statements.
PGIM Emerging Markets Debt Hard Currency Fund 27
Schedule of Investments (continued)
as of October 31, 2021
| | | | | | | | | | | | | | | | |
| | | | | |
| Description | | Interest
Rate | | Maturity
Date | | | | | Principal
Amount
(000)# | | | Value | |
| | | | | |
SOVEREIGN BONDS (Continued) | | | | | | | | | | | | | | | | |
| | | | | |
Ivory Coast (cont’d.) | | | | | | | | | | | | | | | | |
Ivory Coast Government International Bond, (cont’d.) | | | | | | | | | | | | | | | | |
Sr. Unsec’d. Notes | | 5.875% | | 10/17/31 | | | EUR | | | | 400 | | | $ | 479,740 | |
Sr. Unsec’d. Notes | | 6.375 | | 03/03/28 | | | | | | | 400 | | | | 437,238 | |
Sr. Unsec’d. Notes | | 6.625 | | 03/22/48 | | | EUR | | | | 140 | | | | 161,586 | |
Sr. Unsec’d. Notes | | 6.875 | | 10/17/40 | | | EUR | | | | 350 | | | | 424,389 | |
| | | | | | | | | | | | | | | | |
| | | | | |
| | | | | | | | | | | | | | | 1,859,555 | |
| | | | | |
Jamaica 0.7% | | | | | | | | | | | | | | | | |
Jamaica Government International Bond, | | | | | | | | | | | | | | | | |
Sr. Unsec’d. Notes | | 7.625 | | 07/09/25 | | | | | | | 225 | | | | 257,167 | |
Sr. Unsec’d. Notes | | 7.875 | | 07/28/45 | | | | | | | 200 | | | | 283,081 | |
Sr. Unsec’d. Notes | | 8.000 | | 03/15/39 | | | | | | | 200 | | | | 282,632 | |
Sr. Unsec’d. Notes | | 9.250 | | 10/17/25 | | | | | | | 200 | | | | 239,398 | |
| | | | | | | | | | | | | | | | |
| | | | | |
| | | | | | | | | | | | | | | 1,062,278 | |
| | | | | |
Jordan 0.4% | | | | | | | | | | | | | | | | |
Jordan Government International Bond, | | | | | | | | | | | | | | | | |
Sr. Unsec’d. Notes | | 5.850 | | 07/07/30 | | | | | | | 200 | | | | 206,025 | |
Sr. Unsec’d. Notes | | 6.125 | | 01/29/26 | | | | | | | 200 | | | | 215,706 | |
Sr. Unsec’d. Notes | | 7.375 | | 10/10/47 | | | | | | | 200 | | | | 207,160 | |
| | | | | | | | | | | | | | | | |
| | | | | |
| | | | | | | | | | | | | | | 628,891 | |
| | | | | |
Kazakhstan 0.2% | | | | | | | | | | | | | | | | |
Kazakhstan Government International Bond, | | | | | | | | | | | | | | | | |
Sr. Unsec’d. Notes, EMTN | | 6.500 | | 07/21/45 | | | | | | | 200 | | | | 290,777 | |
| | | | | |
Kenya 0.4% | | | | | | | | | | | | | | | | |
Republic of Kenya Government International Bond, | | | | | | | | | | | | | | | | |
Sr. Unsec’d. Notes | | 7.000 | | 05/22/27 | | | | | | | 400 | | | | 423,963 | |
Sr. Unsec’d. Notes | | 8.000 | | 05/22/32 | | | | | | | 200 | | | | 217,310 | |
| | | | | | | | | | | | | | | | |
| | | | | |
| | | | | | | | | | | | | | | 641,273 | |
| | | | | |
Lebanon 0.3% | | | | | | | | | | | | | | | | |
Lebanon Government International Bond, | | | | | | | | | | | | | | | | |
Sr. Unsec’d. Notes | | 6.000 | | 01/27/23(d) | �� | | | | | | 191 | | | | 29,508 | |
Sr. Unsec’d. Notes | | 6.650 | | 04/22/24(d) | | | | | | | 172 | | | | 26,684 | |
Sr. Unsec’d. Notes | | 6.750 | | 11/29/27(d) | | | | | | | 170 | | | | 25,663 | |
Sr. Unsec’d. Notes | | 6.850 | | 03/23/27(d) | | | | | | | 30 | | | | 4,539 | |
Sr. Unsec’d. Notes | | 7.000 | | 04/22/31(d) | | | | | | | 115 | | | | 17,250 | |
See Notes to Financial Statements.
28
| | | | | | | | | | | | | | | | |
| | | | | |
| Description | | Interest
Rate | | Maturity
Date | | | | | Principal
Amount
(000)# | | | Value | |
| | | | | |
SOVEREIGN BONDS (Continued) | | | | | | | | | | | | | | | | |
| | | | | |
Lebanon (cont’d.) | | | | | | | | | | | | | | | | |
Lebanon Government International Bond, (cont’d.) | | | | | | | | | | | | | | | | |
Sr. Unsec’d. Notes, EMTN | | 6.100% | | 10/04/22(d) | | | | | | | 75 | | | $ | 11,432 | |
Sr. Unsec’d. Notes, EMTN | | 6.850 | | 05/25/29(d) | | | | | | | 335 | | | | 50,436 | |
Sr. Unsec’d. Notes, GMTN | | 6.250 | | 05/27/22(d) | | | | | | | 245 | | | | 37,874 | |
Sr. Unsec’d. Notes, GMTN | | 6.250 | | 11/04/24(d) | | | | | | | 320 | | | | 48,871 | |
Sr. Unsec’d. Notes, GMTN | | 6.375 | | 03/09/20(d) | | | | | | | 220 | | | | 33,239 | |
Sr. Unsec’d. Notes, GMTN | | 6.400 | | 05/26/23(d) | | | | | | | 250 | | | | 37,603 | |
Sr. Unsec’d. Notes, GMTN | | 6.650 | | 02/26/30(d) | | | | | | | 715 | | | | 108,722 | |
Sr. Unsec’d. Notes, GMTN | | 7.150 | | 11/20/31(d) | | | | | | | 415 | | | | 62,340 | |
| | | | | | | | | | | | | | | | |
| | | | | |
| | | | | | | | | | | | | | | 494,161 | |
| | | | | |
Malaysia 1.3% | | | | | | | | | | | | | | | | |
1MDB Global Investments Ltd., | | | | | | | | | | | | | | | | |
Sr. Unsec’d. Notes | | 4.400 | | 03/09/23 | | | | | | | 2,000 | | | | 2,008,652 | |
| | | | | |
Mexico 1.2% | | | | | | | | | | | | | | | | |
Mexico Government International Bond, | | | | | | | | | | | | | | | | |
Sr. Unsec’d. Notes, GMTN | | 5.750 | | 10/12/2110 | | | | | | | 358 | | | | 414,662 | |
Sr. Unsec’d. Notes, MTN | | 6.050 | | 01/11/40 | | | | | | | 988 | | | | 1,233,373 | |
Sr. Unsec’d. Notes, Series A, MTN | | 6.750 | | 09/27/34 | | | | | | | 203 | | | | 269,964 | |
| | | | | | | | | | | | | | | | |
| | | | | |
| | | | | | | | | | | | | | | 1,917,999 | |
| | | | | |
Mongolia 0.3% | | | | | | | | | | | | | | | | |
Mongolia Government International Bond, | | | | | | | | | | | | | | | | |
Sr. Unsec’d. Notes, EMTN | | 8.750 | | 03/09/24 | | | | | | | 400 | | | | 449,338 | |
| | | | | |
Morocco 0.7% | | | | | | | | | | | | | | | | |
Morocco Government International Bond, | | | | | | | | | | | | | | | | |
Sr. Unsec’d. Notes | | 1.500 | | 11/27/31 | | | EUR | | | | 100 | | | | 106,028 | |
Sr. Unsec’d. Notes | | 2.000 | | 09/30/30 | | | EUR | | | | 500 | | | | 558,360 | |
Sr. Unsec’d. Notes, 144A | | 3.000 | | 12/15/32 | | | | | | | 400 | | | | 379,455 | |
| | | | | | | | | | | | | | | | |
| | | | | |
| | | | | | | | | | | | | | | 1,043,843 | |
| | | | | |
Mozambique 0.3% | | | | | | | | | | | | | | | | |
Mozambique International Bond, | | | | | | | | | | | | | | | | |
Unsec’d. Notes | | 5.000(cc) | | 09/15/31 | | | | | | | 400 | | | | 341,515 | |
Unsec’d. Notes, 144A | | 5.000(cc) | | 09/15/31 | | | | | | | 200 | | | | 170,757 | |
| | | | | | | | | | | | | | | | |
| | | | | |
| | | | | | | | | | | | | | | 512,272 | |
See Notes to Financial Statements.
PGIM Emerging Markets Debt Hard Currency Fund 29
Schedule of Investments (continued)
as of October 31, 2021
| | | | | | | | | | | | | | | | |
| | | | | |
| Description | | Interest
Rate | | Maturity
Date | | | | | Principal
Amount
(000)# | | | Value | |
| | | | | |
SOVEREIGN BONDS (Continued) | | | | | | | | | | | | | | | | |
| | | | | |
Namibia 0.1% | | | | | | | | | | | | | | | | |
Namibia International Bonds, | | | | | | | | | | | | | | | | |
Sr. Unsec’d. Notes | | 5.250% | | 10/29/25 | | | | | | | 200 | | | $ | 212,982 | |
| | | | | |
Nigeria 2.2% | | | | | | | | | | | | | | | | |
Nigeria Government International Bond, | | | | | | | | | | | | | | | | |
Sr. Unsec’d. Notes | | 7.143 | | 02/23/30 | | | | | | | 200 | | | | 201,465 | |
Sr. Unsec’d. Notes | | 7.625 | | 11/21/25 | | | | | | | 300 | | | | 326,476 | |
Sr. Unsec’d. Notes | | 7.696 | | 02/23/38 | | | | | | | 200 | | | | 193,028 | |
Sr. Unsec’d. Notes | | 7.875 | | 02/16/32 | | | | | | | 400 | | | | 407,426 | |
Sr. Unsec’d. Notes | | 8.747 | | 01/21/31 | | | | | | | 1,100 | | | | 1,183,524 | |
Sr. Unsec’d. Notes | | 9.248 | | 01/21/49 | | | | | | | 200 | | | | 212,629 | |
Sr. Unsec’d. Notes, 144A | | 7.696 | | 02/23/38 | | | | | | | 200 | | | | 193,028 | |
Sr. Unsec’d. Notes, 144A, MTN | | 6.125 | | 09/28/28 | | | | | | | 200 | | | | 198,507 | |
Sr. Unsec’d. Notes, 144A, MTN | | 7.375 | | 09/28/33 | | | | | | | 200 | | | | 197,949 | |
Sr. Unsec’d. Notes, EMTN | | 6.500 | | 11/28/27 | | | | | | | 200 | | | | 203,554 | |
| | | | | | | | | | | | | | | | |
| | | | | |
| | | | | | | | | | | | | | | 3,317,586 | |
| | | | | |
Oman 2.2% | | | | | | | | | | | | | | | | |
Oman Government International Bond, | | | | | | | | | | | | | | | | |
Sr. Unsec’d. Notes | | 4.750 | | 06/15/26 | | | | | | | 630 | | | | 647,979 | |
Sr. Unsec’d. Notes | | 5.375 | | 03/08/27 | | | | | | | 200 | | | | 210,138 | |
Sr. Unsec’d. Notes | | 5.625 | | 01/17/28 | | | | | | | 200 | | | | 210,565 | |
Sr. Unsec’d. Notes | | 6.500 | | 03/08/47 | | | | | | | 225 | | | | 223,197 | |
Sr. Unsec’d. Notes | | 6.750 | | 10/28/27 | | | | | | | 600 | | | | 671,749 | |
Sr. Unsec’d. Notes | | 6.750 | | 01/17/48 | | | | | | | 200 | | | | 203,247 | |
Sr. Unsec’d. Notes | | 7.375 | | 10/28/32 | | | | | | | 460 | | | | 531,535 | |
Sr. Unsec’d. Notes, 144A | | 6.750 | | 01/17/48 | | | | | | | 200 | | | | 203,247 | |
Sr. Unsec’d. Notes, 144A, MTN | | 4.875 | | 02/01/25 | | | | | | | 200 | | | | 208,652 | |
Sr. Unsec’d. Notes, EMTN | | 6.000 | | 08/01/29 | | | | | | | 200 | | | | 214,573 | |
| | | | | | | | | | | | | | | | |
| | | | | |
| | | | | | | | | | | | | | | 3,324,882 | |
| | | | | |
Pakistan 1.3% | | | | | | | | | | | | | | | | |
Pakistan Government International Bond, | | | | | | | | | | | | | | | | |
Sr. Unsec’d. Notes | | 6.875 | | 12/05/27 | | | | | | | 600 | | | | 614,400 | |
Sr. Unsec’d. Notes | | 8.250 | | 04/15/24 | | | | | | | 400 | | | | 427,123 | |
Sr. Unsec’d. Notes | | 8.250 | | 09/30/25 | | | | | | | 770 | | | | 837,046 | |
Sr. Unsec’d. Notes, 144A, MTN | | 7.375 | | 04/08/31 | | | | | | | 200 | | | | 203,247 | |
| | | | | | | | | | | | | | | | |
| | | | | |
| | | | | | | | | | | | | | | 2,081,816 | |
See Notes to Financial Statements.
30
| | | | | | | | | | | | | | | | |
| | | | | |
| Description | | Interest
Rate | | Maturity
Date | | | | | Principal
Amount
(000)# | | | Value | |
| | | | | |
SOVEREIGN BONDS (Continued) | | | | | | | | | | | | | | | | |
| | | | | |
Panama 1.4% | | | | | | | | | | | | | | | | |
Panama Government International Bond, | | | | | | | | | | | | | | | | |
Sr. Unsec’d. Notes | | 3.870% | | 07/23/60 | | | | | | | 200 | | | $ | 199,377 | |
Sr. Unsec’d. Notes | | 4.500 | | 04/16/50 | | | | | | | 400 | | | | 439,826 | |
Sr. Unsec’d. Notes | | 4.500 | | 04/01/56 | | | | | | | 200 | | | | 219,446 | |
Sr. Unsec’d. Notes | | 6.700 | | 01/26/36 | | | | | | | 760 | | | | 1,013,879 | |
Sr. Unsec’d. Notes | | 9.375 | | 04/01/29 | | | | | | | 165 | | | | 239,313 | |
| | | | | | | | | | | | | | | | |
| | | | | |
| | | | | | | | | | | | | | | 2,111,841 | |
| | | | | |
Papua New Guinea 0.1% | | | | | | | | | | | | | | | | |
Papua New Guinea Government International Bond, | | | | | | | | | | | | | | | | |
Sr. Unsec’d. Notes, 144A | | 8.375 | | 10/04/28 | | | | | | | 200 | | | | 202,558 | |
| | | | | |
Paraguay 0.6% | | | | | | | | | | | | | | | | |
Paraguay Government International Bond, | | | | | | | | | | | | | | | | |
Sr. Unsec’d. Notes | | 4.700 | | 03/27/27 | | | | | | | 200 | | | | 220,333 | |
Sr. Unsec’d. Notes | | 4.950 | | 04/28/31 | | | | | | | 200 | | | | 224,245 | |
Sr. Unsec’d. Notes | | 6.100 | | 08/11/44 | | | | | | | 400 | | | | 481,174 | |
| | | | | | | | | | | | | | | | |
| | | | | |
| | | | | | | | | | | | | | | 925,752 | |
| | | | | |
Peru 1.9% | | | | | | | | | | | | | | | | |
Peruvian Government International Bond, | | | | | | | | | | | | | | | | |
Sr. Unsec’d. Notes | | 2.780 | | 12/01/60 | | | | | | | 370 | | | | 319,189 | |
Sr. Unsec’d. Notes | | 2.783 | | 01/23/31 | | | | | | | 500 | | | | 498,486 | |
Sr. Unsec’d. Notes | | 3.000 | | 01/15/34 | | | | | | | 170 | | | | 168,133 | |
Sr. Unsec’d. Notes | | 3.230 | | 07/28/2121 | | | | | | | 110 | | | | 93,432 | |
Sr. Unsec’d. Notes | | 5.625 | | 11/18/50 | | | | | | | 232 | | | | 317,284 | |
Sr. Unsec’d. Notes | | 6.550 | | 03/14/37 | | | | | | | 225 | | | | 306,159 | |
Sr. Unsec’d. Notes | | 8.750 | | 11/21/33 | | | | | | | 780 | | | | 1,208,424 | |
| | | | | | | | | | | | | | | | |
| | | | | |
| | | | | | | | | | | | | | | 2,911,107 | |
| | | | | |
Philippines 1.9% | | | | | | | | | | | | | | | | |
Philippine Government International Bond, | | | | | | | | | | | | | | | | |
Sr. Unsec’d. Notes | | 0.700 | | 02/03/29 | | | EUR | | | | 300 | | | | 343,145 | |
Sr. Unsec’d. Notes | | 1.750 | | 04/28/41 | | | EUR | | | | 165 | | | | 186,051 | |
Sr. Unsec���d. Notes | | 2.650 | | 12/10/45 | | | | | | | 200 | | | | 190,903 | |
Sr. Unsec’d. Notes | | 2.950 | | 05/05/45 | | | | | | | 200 | | | | 198,263 | |
Sr. Unsec’d. Notes | | 3.700 | | 03/01/41 | | | | | | | 400 | | | | 434,449 | |
Sr. Unsec’d. Notes | | 3.950 | | 01/20/40 | | | | | | | 700 | | | | 782,253 | |
See Notes to Financial Statements.
PGIM Emerging Markets Debt Hard Currency Fund 31
Schedule of Investments (continued)
as of October 31, 2021
| | | | | | | | | | | | | | | | |
| | | | | |
| Description | | Interest
Rate | | Maturity
Date | | | | | Principal
Amount
(000)# | | | Value | |
| | | | | |
SOVEREIGN BONDS (Continued) | | | | | | | | | | | | | | | | |
| | | | | |
Philippines (cont’d.) | | | | | | | | | | | | | | | | |
Philippine Government International Bond, (cont’d.) | | | | | | | | | | | | | | | | |
Sr. Unsec’d. Notes | | 6.375% | | 10/23/34 | | | | | | | 100 | | | $ | 138,121 | |
Sr. Unsec’d. Notes | | 7.750 | | 01/14/31 | | | | | | | 420 | | | | 604,840 | |
| | | | | | | | | | | | | | | | |
| | | | | |
| | | | | | | | | | | | | | | 2,878,025 | |
| | | | | |
Qatar 2.6% | | | | | | | | | | | | | | | | |
Qatar Government International Bond, | | | | | | | | | | | | | | | | |
Sr. Unsec’d. Notes | | 4.400 | | 04/16/50 | | | | | | | 200 | | | | 244,040 | |
Sr. Unsec’d. Notes | | 4.817 | | 03/14/49 | | | | | | | 200 | | | | 257,861 | |
Sr. Unsec’d. Notes | | 5.103 | | 04/23/48 | | | | | | | 1,600 | | | | 2,130,163 | |
Sr. Unsec’d. Notes | | 6.400 | | 01/20/40 | | | | | | | 100 | | | | 146,144 | |
Sr. Unsec’d. Notes, 144A | | 4.817 | | 03/14/49 | | | | | | | 810 | | | | 1,044,335 | |
Sr. Unsec’d. Notes, 144A | | 5.103 | | 04/23/48 | | | | | | | 200 | | | | 266,270 | |
| | | | | | | | | | | | | | | | |
| | | | | |
| | | | | | | | | | | | | | | 4,088,813 | |
| | | | | |
Romania 1.4% | | | | | | | | | | | | | | | | |
Romanian Government International Bond, | | | | | | | | | | | | | | | | |
Sr. Unsec’d. Notes | | 5.125 | | 06/15/48 | | | | | | | 144 | | | | 169,828 | |
Sr. Unsec’d. Notes, 144A, MTN | | 4.625 | | 04/03/49 | | | EUR | | | | 51 | | | | 68,402 | |
Sr. Unsec’d. Notes, EMTN | | 3.875 | | 10/29/35 | | | EUR | | | | 350 | | | | 440,262 | |
Sr. Unsec’d. Notes, EMTN | | 4.125 | | 03/11/39 | | | EUR | | | | 310 | | | | 392,400 | |
Sr. Unsec’d. Notes, EMTN | | 4.625 | | 04/03/49 | | | EUR | | | | 370 | | | | 496,248 | |
Sr. Unsec’d. Notes, EMTN | | 6.125 | | 01/22/44 | | | | | | | 284 | | | | 370,721 | |
Unsec’d. Notes, 144A | | 2.750 | | 04/14/41 | | | EUR | | | | 170 | | | | 180,887 | |
| | | | | | | | | | | | | | | | |
| | | | | |
| | | | | | | | | | | | | | | 2,118,748 | |
| | | | | |
Russia 2.5% | | | | | | | | | | | | | | | | |
Russian Federal Bond - OFZ, | | | | | | | | | | | | | | | | |
Bonds, Series 6235 | | 5.900 | | 03/12/31 | | | RUB | | | | 38,350 | | | | 465,199 | |
Russian Foreign Bond - Eurobond, | | | | | | | | | | | | | | | | |
Sr. Unsec’d. Notes | | 1.850 | | 11/20/32 | | | EUR | | | | 300 | | | | 345,566 | |
Sr. Unsec’d. Notes | | 2.650 | | 05/27/36 | | | EUR | | | | 300 | | | | 353,128 | |
Sr. Unsec’d. Notes | | 5.100 | | 03/28/35 | | | | | | | 1,000 | | | | 1,196,291 | |
Sr. Unsec’d. Notes | | 5.625 | | 04/04/42 | | | | | | | 1,000 | | | | 1,301,188 | |
Sr. Unsec’d. Notes | | 12.750 | | 06/24/28 | | | | | | | 140 | | | | 230,304 | |
| | | | | | | | | | | | | | | | |
| | | | | |
| | | | | | | | | | | | | | | 3,891,676 | |
See Notes to Financial Statements.
32
| | | | | | | | | | | | | | | | |
| | | | | |
| Description | | Interest
Rate | | Maturity
Date | | | | | Principal
Amount
(000)# | | | Value | |
| | | | | |
SOVEREIGN BONDS (Continued) | | | | | | | | | | | | | | | | |
| | | | | |
Saudi Arabia 2.6% | | | | | | | | | | | | | | | | |
Saudi Government International Bond, | | | | | | | | | | | | | | | | |
Sr. Unsec’d. Notes | | 5.250% | | 01/16/50 | | | | | | | 200 | | | $ | 259,831 | |
Sr. Unsec’d. Notes, 144A | | 5.250 | | 01/16/50 | | | | | | | 400 | | | | 519,662 | |
Sr. Unsec’d. Notes, EMTN | | 4.500 | | 04/17/30 | | | | | | | 260 | | | | 302,301 | |
Sr. Unsec’d. Notes, EMTN | | 4.500 | | 10/26/46 | | | | | | | 1,650 | | | | 1,910,622 | |
Sr. Unsec’d. Notes, EMTN | | 4.625 | | 10/04/47 | | | | | | | 400 | | | | 472,478 | |
Sr. Unsec’d. Notes, EMTN | | 5.000 | | 04/17/49 | | | | | | | 400 | | | | 500,672 | |
| | | | | | | | | | | | | | | | |
| | | | | |
| | | | | | | | | | | | | | | 3,965,566 | |
| | | | | |
Senegal 0.3% | | | | | | | | | | | | | | | | |
Senegal Government International Bond, | | | | | | | | | | | | | | | | |
Sr. Unsec’d. Notes | | 4.750 | | 03/13/28 | | | EUR | | | | 200 | | | | 236,197 | |
Sr. Unsec’d. Notes, 144A | | 5.375 | | 06/08/37 | | | EUR | | | | 150 | | | | 166,505 | |
| | | | | | | | | | | | | | | | |
| | | | | |
| | | | | | | | | | | | | | | 402,702 | |
| | | | | |
Serbia 0.9% | | | | | | | | | | | | | | | | |
Serbia International Bond, | | | | | | | | | | | | | | | | |
Sr. Unsec’d. Notes | | 1.500 | | 06/26/29 | | | EUR | | | | 700 | | | | 793,333 | |
Sr. Unsec’d. Notes, 144A | | 1.650 | | 03/03/33 | | | EUR | | | | 225 | | | | 244,191 | |
Sr. Unsec’d. Notes, 144A | | 2.125 | | 12/01/30 | | | | | | | 230 | | | | 214,420 | |
Sr. Unsec’d. Notes, 144A | | 3.125 | | 05/15/27 | | | EUR | | | | 100 | | | | 125,426 | |
| | | | | | | | | | | | | | | | |
| | | | | |
| | | | | | | | | | | | | | | 1,377,370 | |
| | | | | |
South Africa 0.8% | | | | | | | | | | | | | | | | |
Republic of South Africa Government International Bond, | | | | | | | | | | | | | | | | |
Sr. Unsec’d. Notes | | 4.300 | | 10/12/28 | | | | | | | 200 | | | | 201,861 | |
Sr. Unsec’d. Notes | | 4.850 | | 09/30/29 | | | | | | | 400 | | | | 410,364 | |
Sr. Unsec’d. Notes | | 5.650 | | 09/27/47 | | | | | | | 200 | | | | 190,073 | |
Sr. Unsec’d. Notes | | 5.750 | | 09/30/49 | | | | | | | 200 | | | | 191,500 | |
Sr. Unsec’d. Notes | | 6.250 | | 03/08/41 | | | | | | | 300 | | | | 314,298 | |
| | | | | | | | | | | | | | | | |
| | | | | |
| | | | | | | | | | | | | | | 1,308,096 | |
| | | | | |
Sri Lanka 0.7% | | | | | | | | | | | | | | | | |
Sri Lanka Government International Bond, | | | | | | | | | | | | | | | | |
Sr. Unsec’d. Notes | | 5.750 | | 04/18/23 | | | | | | | 200 | | | | 137,557 | |
Sr. Unsec’d. Notes | | 6.200 | | 05/11/27 | | | | | | | 200 | | | | 125,542 | |
Sr. Unsec’d. Notes | | 6.350 | | 06/28/24 | | | | | | | 200 | | | | 130,979 | |
Sr. Unsec’d. Notes | | 6.850 | | 11/03/25 | | | | | | | 350 | | | | 225,324 | |
See Notes to Financial Statements.
PGIM Emerging Markets Debt Hard Currency Fund 33
Schedule of Investments (continued)
as of October 31, 2021
| | | | | | | | | | | | | | | | |
| | | | | |
| Description | | Interest
Rate | | Maturity
Date | | | | | Principal
Amount
(000)# | | | Value | |
| | | | | |
SOVEREIGN BONDS (Continued) | | | | | | | | | | | | | | | | |
| | | | | |
Sri Lanka (cont’d.) | | | | | | | | | | | | | | | | |
Sri Lanka Government International Bond, (cont’d.) | | | | | | | | | | | | | | | | |
Sr. Unsec’d. Notes | | 7.850% | | 03/14/29 | | | | | | | 250 | | | $ | 158,056 | |
Sr. Unsec’d. Notes, 144A | | 6.750 | | 04/18/28 | | | | | | | 200 | | | | 125,647 | |
Sr. Unsec’d. Notes, 144A | | 6.850 | | 03/14/24 | | | | | | | 265 | | | | 173,564 | |
| | | | | | | | | | | | | | | | |
| | | | | |
| | | | | | | | | | | | | | | 1,076,669 | |
| | | | | |
Turkey 3.1% | | | | | | | | | | | | | | | | |
Turkey Government International Bond, | | | | | | | | | | | | | | | | |
Sr. Unsec’d. Notes | | 4.250 | | 04/14/26 | | | | | | | 400 | | | | 374,461 | |
Sr. Unsec’d. Notes | | 4.875 | | 10/09/26 | | | | | | | 300 | | | | 284,914 | |
Sr. Unsec’d. Notes | | 5.600 | | 11/14/24 | | | | | | | 320 | | | | 322,382 | |
Sr. Unsec’d. Notes | | 5.750 | | 03/22/24 | | | | | | | 200 | | | | 203,775 | |
Sr. Unsec’d. Notes | | 5.950 | | 01/15/31 | | | | | | | 200 | | | | 187,162 | |
Sr. Unsec’d. Notes | | 6.000 | | 03/25/27 | | | | | | | 580 | | | | 573,507 | |
Sr. Unsec’d. Notes | | 6.000 | | 01/14/41 | | | | | | | 200 | | | | 172,770 | |
Sr. Unsec’d. Notes | | 6.125 | | 10/24/28 | | | | | | | 620 | | | | 607,674 | |
Sr. Unsec’d. Notes | | 6.350 | | 08/10/24 | | | | | | | 400 | | | | 411,998 | |
Sr. Unsec’d. Notes | | 6.375 | | 10/14/25 | | | | | | | 200 | | | | 203,293 | |
Sr. Unsec’d. Notes | | 6.500 | | 09/20/33 | | | | | | | 200 | | | | 190,263 | |
Sr. Unsec’d. Notes | | 6.875 | | 03/17/36 | | | | | | | 104 | | | | 100,730 | |
Sr. Unsec’d. Notes | | 7.375 | | 02/05/25 | | | | | | | 575 | | | | 607,321 | |
Sr. Unsec’d. Notes | | 7.625 | | 04/26/29 | | | | | | | 280 | | | | 294,739 | |
Turkiye Ihracat Kredi Bankasi A/S, | | | | | | | | | | | | | | | | |
Sr. Unsec’d. Notes | | 8.250 | | 01/24/24 | | | | | | | 200 | | | | 212,415 | |
| | | | | | | | | | | | | | | | |
| | | | | |
| | | | | | | | | | | | | | | 4,747,404 | |
| | | | | |
Ukraine 3.2% | | | | | | | | | | | | | | | | |
Ukraine Government International Bond, | | | | | | | | | | | | | | | | |
Sr. Unsec’d. Notes | | 1.258(cc) | | 05/31/40 | | | | | | | 145 | | | | 152,722 | |
Sr. Unsec’d. Notes | | 4.375 | | 01/27/30 | | | EUR | | | | 410 | | | | 441,368 | |
Sr. Unsec’d. Notes | | 6.750 | | 06/20/26 | | | EUR | | | | 580 | | | | 721,571 | |
Sr. Unsec’d. Notes | | 7.375 | | 09/25/32 | | | | | | | 200 | | | | 205,603 | |
Sr. Unsec’d. Notes | | 7.750 | | 09/01/24 | | | | | | | 510 | | | | 549,915 | |
Sr. Unsec’d. Notes | | 7.750 | | 09/01/25 | | | | | | | 250 | | | | 269,957 | |
Sr. Unsec’d. Notes | | 7.750 | | 09/01/26 | | | | | | | 500 | | | | 538,829 | |
Sr. Unsec’d. Notes | | 7.750 | | 09/01/27 | | | | | | | 520 | | | | 559,873 | |
Sr. Unsec’d. Notes | | 8.994 | | 02/01/24 | | | | | | | 200 | | | | 218,795 | |
Sr. Unsec’d. Notes | | 9.750 | | 11/01/28 | | | | | | | 965 | | | | 1,120,263 | |
Sr. Unsec’d. Notes, 144A | | 4.375 | | 01/27/30 | | | EUR | | | | 100 | | | | 107,651 | |
See Notes to Financial Statements.
34
| | | | | | | | | | | | | | | | |
| | | | | |
| Description | | Interest
Rate | | Maturity
Date | | | | | Principal
Amount
(000)# | | | Value | |
| | | | | |
SOVEREIGN BONDS (Continued) | | | | | | | | | | | | | | | | |
| | | | | |
Ukraine (cont’d.) | | | | | | | | | | | | | | | | |
Ukreximbank Via Biz Finance PLC, | | | | | | | | | | | | | | | | |
Sr. Unsec’d. Notes | | 9.750% | | 01/22/25 | | | | | | | 88 | | | $ | 93,902 | |
| | | | | | | | | | | | | | | | |
| | | | | |
| | | | | | | | | | | | | | | 4,980,449 | |
| | | | | |
United Arab Emirates 1.1% | | | | | | | | | | | | | | | | |
Abu Dhabi Government International Bond, | | | | | | | | | | | | | | | | |
Sr. Unsec’d. Notes | | 3.125 | | 09/30/49 | | | | | | | 200 | | | | 202,364 | |
Sr. Unsec’d. Notes, 144A | | 3.125 | | 09/30/49 | | | | | | | 200 | | | | 202,364 | |
Sr. Unsec’d. Notes, 144A, MTN | | 3.875 | | 04/16/50 | | | | | | | 200 | | | | 230,815 | |
Emirate of Dubai Government International Bonds, | | | | | | | | | | | | | | | | |
Sr. Unsec’d. Notes, EMTN | | 5.250 | | 01/30/43 | | | | | | | 600 | | | | 688,457 | |
Finance Department Government of Sharjah, | | | | | | | | | | | | | | | | |
Sr. Unsec’d. Notes, 144A, MTN | | 4.000 | | 07/28/50 | | | | | | | 200 | | | | 181,481 | |
Sr. Unsec’d. Notes, MTN | | 4.000 | | 07/28/50 | | | | | | | 200 | | | | 181,481 | |
| | | | | | | | | | | | | | | | |
| | | | | |
| | | | | | | | | | | | | | | 1,686,962 | |
| | | | | |
Uruguay 1.4% | | | | | | | | | | | | | | | | |
Uruguay Government International Bond, | | | | | | | | | | | | | | | | |
Sr. Unsec’d. Notes | | 4.125 | | 11/20/45 | | | | | | | 120 | | | | 141,395 | |
Sr. Unsec’d. Notes | | 4.975 | | 04/20/55 | | | | | | | 420 | | | | 539,213 | |
Sr. Unsec’d. Notes | | 5.100 | | 06/18/50 | | | | | | | 420 | | | | 547,813 | |
Sr. Unsec’d. Notes | | 7.625 | | 03/21/36 | | | | | | | 590 | | | | 886,938 | |
| | | | | | | | | | | | | | | | |
| | | | | |
| | | | | | | | | | | | | | | 2,115,359 | |
| | | | | |
Venezuela 0.0% | | | | | | | | | | | | | | | | |
Venezuela Government International Bond, | | | | | | | | | | | | | | | | |
Sr. Unsec’d. Notes | | 12.750 | | 08/23/22(d) | | | | | | | 180 | | | | 18,988 | |
| | | | | |
Zambia 0.6% | | | | | | | | | | | | | | | | |
Zambia Government International Bond, | | | | | | | | | | | | | | | | |
Sr. Unsec’d. Notes | | 8.500 | | 04/14/24(d) | | | | | | | 600 | | | | 476,706 | |
See Notes to Financial Statements.
PGIM Emerging Markets Debt Hard Currency Fund 35
Schedule of Investments (continued)
as of October 31, 2021
| | | | | | | | | | | | | | | | |
| | | | | |
| Description | | Interest
Rate | | Maturity
Date | | | | | Principal
Amount
(000)# | | | Value | |
| | | | | |
SOVEREIGN BONDS (Continued) | | | | | | | | | | | | | | | | |
| | | | | |
Zambia (cont’d.) | | | | | | | | | | | | | | | | |
Zambia Government International Bond, (cont’d.) | | | | | | | | | | | | | | | | |
Sr. Unsec’d. Notes | | 8.970% | | 07/30/27(d) | | | | | | | 400 | | | $ | 314,031 | |
Unsec’d. Notes | | 5.375 | | 09/20/22(d) | | | | | | | 200 | | | | 150,583 | |
| | | | | | | | | | | | | | | | |
| | | | | |
| | | | | | | | | | | | | | | 941,320 | |
| | | | | | | | | | | | | | | | |
| | | | | |
TOTAL SOVEREIGN BONDS
(cost $103,016,795) | | | | | | | | | | | | | | | 101,329,198 | |
| | | | | | | | | | | | | | | | |
| | | | | |
TOTAL LONG-TERM INVESTMENTS
(cost $141,465,424) | | | | | | | | | | | | | | | 140,054,978 | |
| | | | | | | | | | | | | | | | |
| | | | | |
| | | | | | | | | | | Shares | | | | | |
| | | | | |
SHORT-TERM INVESTMENTS 8.2% | | | | | | | | | | | | | | | | |
| | | | | |
AFFILIATED MUTUAL FUND 8.1% | | | | | | | | | | | | | | | | |
PGIM Core Ultra Short Bond Fund
(cost $12,463,160)(wa) | | | | | | | | | | | 12,463,160 | | | | 12,463,160 | |
| | | | | | | | | | | | | | | | |
| | | | | |
OPTIONS PURCHASED*~ 0.1%
(cost $140,092) | | | | | | | | | | | | | | | 151,408 | |
| | | | | | | | | | | | | | | | |
| | | | | |
TOTAL SHORT-TERM INVESTMENTS
(cost $12,603,252) | | | | | | | | | | | | | | | 12,614,568 | |
| | | | | | | | | | | | | | | | |
| | | | | |
TOTAL INVESTMENTS, BEFORE OPTIONS WRITTEN 98.9%
(cost $154,068,676) | | | | | | | | | | | | | | | 152,669,546 | |
| | | | | | | | | | | | | | | | |
| | | | | |
OPTIONS WRITTEN*~ (0.1)%
(premiums received $93,937) | | | | | | | | | | | | | | | (94,391 | ) |
| | | | | | | | | | | | | | | | |
| | | | | |
TOTAL INVESTMENTS, NET OF OPTIONS WRITTEN 98.8%
(cost $153,974,739) | | | | | | | | | | | | | | | 152,575,155 | |
Other assets in excess of liabilities(z) 1.2% | | | | | | | | | | | | | | | 1,848,181 | |
| | | | | | | | | | | | | | | | |
| | | | | |
NET ASSETS 100.0% | | | | | | | | | | | | | | $ | 154,423,336 | |
| | | | | | | | | | | | | | | | |
Below is a list of the abbreviation(s) used in the annual report:
AUD—Australian Dollar
BRL—Brazilian Real
CLP—Chilean Peso
CNH—Chinese Renminbi
COP—Colombian Peso
CZK—Czech Koruna
See Notes to Financial Statements.
36
EUR—Euro
GBP—British Pound
HUF—Hungarian Forint
IDR—Indonesian Rupiah
ILS—Israeli Shekel
INR—Indian Rupee
JPY—Japanese Yen
KRW—South Korean Won
MXN—Mexican Peso
PEN—Peruvian Nuevo Sol
PHP—Philippine Peso
PLN—Polish Zloty
RUB—Russian Ruble
SGD—Singapore Dollar
THB—Thai Baht
TRY—Turkish Lira
TWD—New Taiwanese Dollar
USD—US Dollar
ZAR—South African Rand
144A—Security was purchased pursuant to Rule 144A under the Securities Act of 1933 and, pursuant to the requirements of Rule 144A, may not be resold except to qualified institutional buyers.
CDX—Credit Derivative Index
EMTN—Euro Medium Term Note
GMTN—Global Medium Term Note
LIBOR—London Interbank Offered Rate
M—Monthly payment frequency for swaps
MTN—Medium Term Note
OFZ—Obligatsyi Federal’novo Zaima (Federal Loan Obligations)
OTC—Over-the-counter
PIK—Payment-in-Kind
PJSC—Public Joint-Stock Company
Q—Quarterly payment frequency for swaps
| * | Non-income producing security. |
| # | Principal or notional amount is shown in U.S. dollars unless otherwise stated. |
| ~ | See tables subsequent to the Schedule of Investments for options detail. |
| (cc) | Variable rate instrument. The rate shown is based on the latest available information as of October 31, 2021. Certain variable rate securities are not based on a published reference rate and spread but are determined by the issuer or agent and are based on current market conditions. These securities do not indicate a reference rate and spread in their description. |
| (d) | Represents issuer in default on interest payments and/or principal repayment. Non-income producing security. Such securities may be post-maturity. |
| (s) | Represents zero coupon bond or principal only security. Rate represents yield to maturity at purchase date. |
| (wa) | PGIM Investments LLC, the manager of the Fund, also serves as manager of the PGIM Core Ultra Short Bond Fund and PGIM Institutional Money Market Fund, if applicable. |
| (z) | Includes net unrealized appreciation/(depreciation) and/or market value of the below holdings which are excluded from the Schedule of Investments: |
See Notes to Financial Statements.
PGIM Emerging Markets Debt Hard Currency Fund 37
Schedule of Investments (continued)
as of October 31, 2021
Options Purchased:
OTC Traded
| | | | | | | | | | | | | | | | | | | | | | | | | | |
Description | | Call/
Put | | | Counterparty | | Expiration
Date | | | Strike | | | Contracts | | | Notional
Amount
(000)# | | | Value | |
Currency Option USD vs IDR | | | Call | | | Morgan Stanley & Co. International PLC | | | 04/28/22 | | | | 16,500.00 | | | | — | | | | 658 | | | $ | 1,667 | |
Currency Option USD vs IDR | | | Call | | | JPMorgan Chase Bank, N.A. | | | 04/28/22 | | | | 24,500.00 | | | | — | | | | 658 | | | | 55 | |
Currency Option USD vs MXN | | | Call | | | Morgan Stanley & Co. International PLC | | | 12/10/21 | | | | 21.00 | | | | — | | | | 1,058 | | | | 8,804 | |
Currency Option USD vs MXN | | | Call | | | Morgan Stanley & Co. International PLC | | | 01/04/22 | | | | 21.00 | | | | — | | | | 1,791 | | | | 17,812 | |
Currency Option USD vs RUB | | | Call | | | JPMorgan Chase Bank, N.A. | | | 11/19/21 | | | | 75.00 | | | | — | | | | 540 | | | | 600 | |
Currency Option USD vs RUB | | | Call | | | JPMorgan Chase Bank, N.A. | | | 01/11/22 | | | | 81.00 | | | | — | | | | 2,658 | | | | 4,078 | |
Currency Option USD vs TRY | | | Call | | | Goldman Sachs International | | | 12/22/21 | | | | 9.00 | | | | — | | | | 540 | | | | 48,267 | |
Currency Option USD vs TRY | | | Call | | | Goldman Sachs International | | | 01/11/22 | | | | 9.75 | | | | — | | | | 354 | | | | 15,563 | |
Currency Option USD vs ZAR | | | Call | | | Goldman Sachs International | | | 11/04/21 | | | | 15.50 | | | | — | | | | 505 | | | | 1,690 | |
Currency Option USD vs ZAR | | | Call | | | Goldman Sachs International | | | 01/18/22 | | | | 15.50 | | | | — | | | | 1,010 | | | | 27,398 | |
Currency Option USD vs ZAR | | | Call | | | Morgan Stanley & Co. International PLC | | | 01/18/22 | | | | 16.00 | | | | — | | | | 1,010 | | | | 16,573 | |
Currency Option USD vs IDR | | | Put | | | JPMorgan Chase Bank, N.A. | | | 04/28/22 | | | | 14,300.00 | | | | — | | | | 658 | | | | 8,784 | |
Currency Option USD vs MXN | | | Put | | | Morgan Stanley & Co. International PLC | | | 11/09/21 | | | | 17.80 | | | | — | | | | 1,398 | | | | — | |
Currency Option USD vs RUB | | | Put | | | JPMorgan Chase Bank, N.A. | | | 11/19/21 | | | | 67.00 | | | | — | | | | 720 | | | | 63 | |
Currency Option USD vs TRY | | | Put | | | Goldman Sachs International | | | 11/04/21 | | | | 7.80 | | | | — | | | | 167 | | | | — | |
Currency Option USD vs TRY | | | Put | | | JPMorgan Chase Bank, N.A. | | | 11/04/21 | | | | 8.00 | | | | — | | | | 708 | | | | — | |
Currency Option USD vs TRY | | | Put | | | JPMorgan Chase Bank, N.A. | | | 11/19/21 | | | | 8.00 | | | | — | | | | 354 | | | | 11 | |
Currency Option USD vs TRY | | | Put | | | Goldman Sachs International | | | 01/11/22 | | | | 7.60 | | | | — | | | | 354 | | | | 43 | |
Currency Option USD vs ZAR | | | Put | | | JPMorgan Chase Bank, N.A. | | | 11/12/21 | | | | 12.50 | | | | — | | | | 1,010 | | | | — | |
| | | | | | | | | | | | | | | | | | | | | | | | | | |
Total Options Purchased (cost $140,092) | | | | | | | | | | | | | | | | | | $ | 151,408 | |
| | | | | | | | | | | | | | | | | | | | | | | | | | |
| | | | | | | | | | | | | | | | | | | | | | | | | | |
See Notes to Financial Statements.
38
Options Written:
OTC Traded
| | | | | | | | | | | | | | | | | | | | | | | | | | |
Description | | Call/
Put | | | Counterparty | | Expiration
Date | | | Strike | | | Contracts | | | Notional
Amount
(000)# | | | Value | |
Currency Option USD vs IDR | | | Call | | | JPMorgan Chase Bank, N.A. | | | 04/28/22 | | | | 16,500.00 | | | | — | | | | 658 | | | $ | (1,667 | ) |
Currency Option USD vs MXN | | | Call | | | Morgan Stanley & Co. International PLC | | | 12/10/21 | | | | 22.00 | | | | — | | | | 1,058 | | | | (2,019 | ) |
Currency Option USD vs MXN | | | Call | | | Morgan Stanley & Co. International PLC | | | 01/04/22 | | | | 22.00 | | | | — | | | | 1,791 | | | | (5,274 | ) |
Currency Option USD vs TRY | | | Call | | | Goldman Sachs International | | | 12/22/21 | | | | 10.00 | | | | — | | | | 540 | | | | (12,818 | ) |
Currency Option USD vs TRY | | | Call | | | Goldman Sachs International | | | 01/11/22 | | | | 10.25 | | | | — | | | | 354 | | | | (8,875 | ) |
Currency Option USD vs ZAR | | | Call | | | JPMorgan Chase Bank, N.A. | | | 11/04/21 | | | | 15.50 | | | | — | | | | 505 | | | | (1,690 | ) |
Currency Option USD vs ZAR | | | Call | | | Goldman Sachs International | | | 01/18/22 | | | | 16.00 | | | | — | | | | 1,010 | | | | (16,574 | ) |
Currency Option USD vs ZAR | | | Call | | | Goldman Sachs International | | | 01/18/22 | | | | 16.50 | | | | — | | | | 1,010 | | | | (10,026 | ) |
Currency Option USD vs IDR | | | Put | | | Morgan Stanley & Co. International PLC | | | 04/28/22 | | | | 14,300.00 | | | | — | | | | 658 | | | | (8,784 | ) |
Currency Option USD vs RUB | | | Put | | | JPMorgan Chase Bank, N.A. | | | 11/19/21 | | | | 72.00 | | | | — | | | | 720 | | | | (12,201 | ) |
Currency Option USD vs TRY | | | Put | | | Goldman Sachs International | | | 11/04/21 | | | | 8.80 | | | | — | | | | 167 | | | | (1 | ) |
Currency Option USD vs TRY | | | Put | | | JPMorgan Chase Bank, N.A. | | | 11/04/21 | | | | 8.90 | | | | — | | | | 354 | | | | (5 | ) |
Currency Option USD vs TRY | | | Put | | | JPMorgan Chase Bank, N.A. | | | 11/19/21 | | | | 10.00 | | | | — | | | | 354 | | | | (13,739 | ) |
Currency Option USD vs TRY | | | Put | | | Goldman Sachs International | | | 01/11/22 | | | | 8.80 | | | | — | | | | 354 | | | | (718 | ) |
| | | | | | | | | | | | | | | | | | | | | | | | | | |
Total Options Written (premiums received $93,937) | | | | | | | | | | | | | | | | | | $ | (94,391 | ) |
| | | | | | | | | | | | | | | | | | | | | | | | | | |
| | | | | | | | | | | | | | | | | | | | | | | | | | |
Futures contracts outstanding at October 31, 2021:
| | | | | | | | | | | | | | | | | |
Number
of
Contracts | | Type | | Expiration
Date | | Current
Notional
Amount | | Value /
Unrealized
Appreciation
(Depreciation) |
| | | |
Long Positions: | | | | | | | | | | | | | | | |
33 | | 2 Year U.S. Treasury Notes | | | | Dec. 2021 | | | | $ | 7,235,250 | | | | $ | (27,305 | ) |
52 | | 5 Year U.S. Treasury Notes | | | | Dec. 2021 | | | | | 6,331,000 | | | | | (74,737 | ) |
61 | | 10 Year U.S. Treasury Notes | | | | Dec. 2021 | | | | | 7,972,891 | | | | | (112,115 | ) |
27 | | 30 Year U.S. Ultra Treasury Bonds | | | | Dec. 2021 | | | | | 5,302,969 | | | | | 9,737 | |
| | | | | | | | | | | | | | | | | |
| | | | | | | | | | | | | | | | (204,420 | ) |
| | | | | | | | | | | | | | | | | |
See Notes to Financial Statements.
PGIM Emerging Markets Debt Hard Currency Fund 39
Schedule of Investments (continued)
as of October 31, 2021
| | | | | | | | | | | | | | |
|
| Futures contracts outstanding at October 31, 2021 (continued): | |
| | | | |
Number of Contracts | | Type | | Expiration
Date | | | Current
Notional
Amount | | | Value /
Unrealized
Appreciation
(Depreciation) | |
| | | |
| Short Positions: | | | | | | | | | | | | |
19 | | 5 Year Euro-Bobl | | | Dec. 2021 | | | $ | 2,937,904 | | | $ | 44,489 | |
51 | | 10 Year Euro-Bund | | | Dec. 2021 | | | | 9,911,683 | | | | 266,980 | |
39 | | 20 Year U.S. Treasury Bonds | | | Dec. 2021 | | | | 6,272,906 | | | | 20,741 | |
5 | | Euro Schatz Index | | | Dec. 2021 | | | | 647,129 | | | | 1,915 | |
| | | | | | | | | | | | | | |
| | | | | | | | | | | | | 334,125 | |
| | | | | | | | | | | | | | |
| | | | | | | | | | | | $ | 129,705 | |
| | | | | | | | | | | | | | |
Forward foreign currency exchange contracts outstanding at October 31, 2021:
| | | | | | | | | | | | | | | | | | | | | | | | | | |
Purchase Contracts | | Counterparty | | Notional
Amount
(000) | | | Value at
Settlement
Date | | | Current
Value | | | Unrealized
Appreciation | | Unrealized
Depreciation |
|
| OTC Forward Foreign Currency Exchange Contracts: | |
Australian Dollar, | |
Expiring 01/19/22 | | HSBC Bank PLC | | | AUD | | | | 244 | | | $ | 179,707 | | | $ | 183,783 | | | $ | 4,076 | | | $ | — | |
Brazilian Real, | | | | | | | | | | | | | | | | | | | | | | | | | | |
Expiring 11/03/21 | | Credit Suisse International | | | BRL | | | | 2,436 | | | | 457,533 | | | | 431,211 | | | | — | | | | (26,322 | ) |
Expiring 11/03/21 | | Deutsche Bank AG | | | BRL | | | | 662 | | | | 119,000 | | | | 117,187 | | | | — | | | | (1,813 | ) |
Expiring 11/03/21 | | JPMorgan Chase Bank, N.A. | | | BRL | | | | 652 | | | | 120,000 | | | | 115,422 | | | | — | | | | (4,578 | ) |
Expiring 11/03/21 | | JPMorgan Chase Bank, N.A. | | | BRL | | | | 425 | | | | 80,000 | | | | 75,237 | | | | — | | | | (4,763 | ) |
Expiring 12/02/21 | | Credit Suisse International | | | BRL | | | | 4,175 | | | | 733,714 | | | | 734,863 | | | | 1,149 | | | | — | |
Chilean Peso, | | | | | | | | | | | | | | | | | | | | | | | | | | |
Expiring 12/15/21 | | Barclays Bank PLC | | | CLP | | | | 159,779 | | | | 196,000 | | | | 195,370 | | | | — | | | | (630 | ) |
Expiring 12/15/21 | | BNP Paribas S.A. | | | CLP | | | | 126,600 | | | | 153,000 | | | | 154,800 | | | | 1,800 | | | | — | |
Expiring 12/15/21 | | BNP Paribas S.A. | | | CLP | | | | 95,589 | | | | 117,000 | | | | 116,881 | | | | — | | | | (119 | ) |
Expiring 12/15/21 | | BNP Paribas S.A. | | | CLP | | | | 66,820 | | | | 80,000 | | | | 81,704 | | | | 1,704 | | | | — | |
Expiring 12/15/21 | | BNP Paribas S.A. | | | CLP | | | | 62,266 | | | | 77,000 | | | | 76,136 | | | | — | | | | (864 | ) |
Expiring 12/15/21 | | Citibank, N.A. | | | CLP | | | | 114,635 | | | | 144,000 | | | | 140,170 | | | | — | | | | (3,830 | ) |
Expiring 12/15/21 | | Citibank, N.A. | | | CLP | | | | 85,763 | | | | 107,000 | | | | 104,867 | | | | — | | | | (2,133 | ) |
Expiring 12/15/21 | | JPMorgan Chase Bank, N.A. | | | CLP | | | | 64,132 | | | | 81,000 | | | | 78,417 | | | | — | | | | (2,583 | ) |
Expiring 12/15/21 | | UBS AG | | | CLP | | | | 148,107 | | | | 185,000 | | | | 181,098 | | | | — | | | | (3,902 | ) |
Chinese Renminbi, | | | | | | | | | | | | | | | | | | | | | | | | | | |
Expiring 11/18/21 | | JPMorgan Chase Bank, N.A. | | | CNH | | | | 12,640 | | | | 1,936,634 | | | | 1,969,786 | | | | 33,152 | | | | — | |
Expiring 11/18/21 | | JPMorgan Chase Bank, N.A. | | | CNH | | | | 1,767 | | | | 274,001 | | | | 275,393 | | | | 1,392 | | | | — | |
Expiring 11/18/21 | | JPMorgan Chase Bank, N.A. | | | CNH | | | | 1,746 | | | | 271,000 | | | | 272,127 | | | | 1,127 | | | | — | |
See Notes to Financial Statements.
40
| | | | | | | | | | | | | | | | | | | | | | | | | | |
|
| Forward foreign currency exchange contracts outstanding at October 31, 2021 (continued): | |
| | | | | | |
Purchase Contracts | | Counterparty | | Notional
Amount
(000) | | | Value at
Settlement
Date | | | Current
Value | | | Unrealized
Appreciation | | Unrealized
Depreciation |
|
| OTC Forward Foreign Currency Exchange Contracts (cont’d.): | |
Chinese Renminbi (cont’d.), | |
Expiring 11/18/21 | | JPMorgan Chase Bank, N.A. | | | CNH | | | | 1,265 | | | $ | 196,000 | | | $ | 197,161 | | | $ | 1,161 | | | $ | — | |
Expiring 11/18/21 | | Morgan Stanley & Co. International PLC | | | CNH | | | | 920 | | | | 142,000 | | | | 143,378 | | | | 1,378 | | | | — | |
Expiring 11/18/21 | | Standard Chartered Bank | | | CNH | | | | 2,446 | | | | 382,000 | | | | 381,206 | | | | — | | | | (794 | ) |
Colombian Peso, | | | | | | | | | | | | | | | | | | | | | | | | | | |
Expiring 12/15/21 | | BNP Paribas S.A. | | | COP | | | | 741,809 | | | | 195,000 | | | | 196,357 | | | | 1,357 | | | | — | |
Expiring 12/15/21 | | Goldman Sachs International | | | COP | | | | 440,188 | | | | 116,000 | | | | 116,518 | | | | 518 | | | | — | |
Czech Koruna, | | | | | | | | | | | | | | | | | | | | | | | | | | |
Expiring 01/19/22 | | BNP Paribas S.A. | | | CZK | | | | 3,262 | | | | 147,000 | | | | 146,474 | | | | — | | | | (526 | ) |
Euro, | | | | | | | | | | | | | | | | | | | | | | | | | | |
Expiring 01/19/22 | | JPMorgan Chase Bank, N.A. | | | EUR | | | | 249 | | | | 289,849 | | | | 288,663 | | | | — | | | | (1,186 | ) |
Expiring 01/19/22 | | JPMorgan Chase Bank, N.A. | | | EUR | | | | 204 | | | | 236,807 | | | | 236,089 | | | | — | | | | (718 | ) |
Hungarian Forint, | | | | | | | | | | | | | | | | | | | | | | | | | | |
Expiring 01/19/22 | | Goldman Sachs International | | | HUF | | | | 47,232 | | | | 152,000 | | | | 151,218 | | | | — | | | | (782 | ) |
Expiring 01/19/22 | | HSBC Bank PLC | | | HUF | | | | 51,599 | | | | 166,000 | | | | 165,200 | | | | — | | | | (800 | ) |
Expiring 01/19/22 | | HSBC Bank PLC | | | HUF | | | | 49,943 | | | | 160,000 | | | | 159,900 | | | | — | | | | (100 | ) |
Indian Rupee, | | | | | | | | | | | | | | | | | | | | | | | | | | |
Expiring 12/15/21 | | Citibank, N.A. | | | INR | | | | 34,591 | | | | 468,510 | | | | 458,807 | | | | — | | | | (9,703 | ) |
Expiring 12/15/21 | | Citibank, N.A. | | | INR | | | | 17,626 | | | | 239,000 | | | | 233,790 | | | | — | | | | (5,210 | ) |
Expiring 12/15/21 | | HSBC Bank PLC | | | INR | | | | 16,966 | | | | 230,000 | | | | 225,029 | | | | — | | | | (4,971 | ) |
Expiring 12/15/21 | | HSBC Bank PLC | | | INR | | | | 16,083 | | | | 218,000 | | | | 213,326 | | | | — | | | | (4,674 | ) |
Expiring 12/15/21 | | JPMorgan Chase Bank, N.A. | | | INR | | | | 13,449 | | | | 181,000 | | | | 178,386 | | | | — | | | | (2,614 | ) |
Expiring 12/15/21 | | JPMorgan Chase Bank, N.A. | | | INR | | | | 13,309 | | | | 179,000 | | | | 176,523 | | | | — | | | | (2,477 | ) |
Expiring 12/15/21 | | Morgan Stanley & Co. International PLC | | | INR | | | | 23,304 | | | | 311,000 | | | | 309,103 | | | | — | | | | (1,897 | ) |
Expiring 12/15/21 | | Morgan Stanley & Co. International PLC | | | INR | | | | 14,574 | | | | 193,000 | | | | 193,309 | | | | 309 | | | | — | |
Expiring 12/15/21 | | Morgan Stanley & Co. International PLC | | | INR | | | | 14,558 | | | | 194,000 | | | | 193,097 | | | | — | | | | (903 | ) |
Expiring 12/15/21 | | Morgan Stanley & Co. International PLC | | | INR | | | | 14,547 | | | | 193,000 | | | | 192,948 | | | | — | | | | (52 | ) |
Expiring 12/15/21 | | Morgan Stanley & Co. International PLC | | | INR | | | | 10,848 | | | | 146,000 | | | | 143,883 | | | | — | | | | (2,117 | ) |
Expiring 12/15/21 | | Standard Chartered Bank | | | INR | | | | 23,383 | | | | 310,000 | | | | 310,144 | | | | 144 | | | | — | |
Expiring 12/15/21 | | UBS AG | | | INR | | | | 14,445 | | | | 194,000 | | | | 191,596 | | | | — | | | | (2,404 | ) |
See Notes to Financial Statements.
PGIM Emerging Markets Debt Hard Currency Fund 41
Schedule of Investments (continued)
as of October 31, 2021
| | | | | | | | | | | | | | | | | | | | | | | | | | |
|
| Forward foreign currency exchange contracts outstanding at October 31, 2021 (continued): | |
| | | | | | |
Purchase Contracts | | Counterparty | | Notional
Amount
(000) | | | Value at
Settlement
Date | | | Current
Value | | | Unrealized
Appreciation | | Unrealized
Depreciation |
|
| OTC Forward Foreign Currency Exchange Contracts (cont’d.): | |
Indonesian Rupiah, | |
Expiring 12/15/21 | | Barclays Bank PLC | | | IDR | | | | 3,227,728 | | | $ | 224,000 | | | $ | 225,785 | | | | $ 1,785 | | | | $ — | |
Expiring 12/15/21 | | Citibank, N.A. | | | IDR | | | | 4,130,933 | | | | 283,018 | | | | 288,965 | | | | 5,947 | | | | — | |
Expiring 12/15/21 | | Goldman Sachs International | | | IDR | | | | 1,695,660 | | | | 118,000 | | | | 118,614 | | | | 614 | | | | — | |
Expiring 12/15/21 | | HSBC Bank PLC | | | IDR | | | | 2,364,142 | | | | 164,000 | | | | 165,376 | | | | 1,376 | | | | — | |
Expiring 12/15/21 | | JPMorgan Chase Bank, N.A. | | | IDR | | | | 2,311,477 | | | | 161,000 | | | | 161,692 | | | | 692 | | | | — | |
Expiring 12/15/21 | | JPMorgan Chase Bank, N.A. | | | IDR | | | | 1,610,112 | | | | 112,000 | | | | 112,630 | | | | 630 | | | | — | |
Expiring 12/15/21 | | Morgan Stanley & Co. International PLC | | | IDR | | | | 2,760,288 | | | | 192,000 | | | | 193,087 | | | | 1,087 | | | | — | |
Expiring 12/15/21 | | Morgan Stanley & Co. International PLC | | | IDR | | | | 2,256,875 | | | | 157,000 | | | | 157,872 | | | | 872 | | | | — | |
Expiring 12/15/21 | | Morgan Stanley & Co. International PLC | | | IDR | | | | 2,243,745 | | | | 153,000 | | | | 156,954 | | | | 3,954 | | | | — | |
Expiring 12/15/21 | | Morgan Stanley & Co. International PLC | | | IDR | | | | 1,749,602 | | | | 122,000 | | | | 122,387 | | | | 387 | | | | — | |
Expiring 12/15/21 | | Morgan Stanley & Co. International PLC | | | IDR | | | | 796,830 | | | | 55,990 | | | | 55,739 | | | | — | | | | (251 | ) |
Israeli Shekel, | | | | | | | | | | | | | | | | | | | | | | | | | | |
Expiring 12/15/21 | | Barclays Bank PLC | | | ILS | | | | 631 | | | | 197,000 | | | | 199,413 | | | | 2,413 | | | | — | |
Japanese Yen, | | | | | | | | | | | | | | | | | | | | | | | | | | |
Expiring 01/19/22 | | Barclays Bank PLC | | | JPY | | | | 38,993 | | | | 343,142 | | | | 342,475 | | | | — | | | | (667 | ) |
Mexican Peso, | | | | | | | | | | | | | | | | | | | | | | | | | | |
Expiring 12/15/21 | | BNP Paribas S.A. | | | MXN | | | | 2,513 | | | | 125,000 | | | | 121,171 | | | | — | | | | (3,829 | ) |
Expiring 12/15/21 | | Citibank, N.A. | | | MXN | | | | 4,104 | | | | 202,000 | | | | 197,880 | | | | — | | | | (4,120 | ) |
Expiring 12/15/21 | | Citibank, N.A. | | | MXN | | | | 3,352 | | | | 159,000 | | | | 161,624 | | | | 2,624 | | | | — | |
Expiring 12/15/21 | | Goldman Sachs International | | | MXN | | | | 15,014 | | | | 742,002 | | | | 723,985 | | | | — | | | | (18,017 | ) |
Expiring 12/15/21 | | Goldman Sachs International | | | MXN | | | | 4,733 | | | | 233,000 | | | | 228,246 | | | | — | | | | (4,754 | ) |
Expiring 12/15/21 | | Goldman Sachs International | | | MXN | | | | 3,688 | | | | 181,000 | | | | 177,818 | | | | — | | | | (3,182 | ) |
Expiring 12/15/21 | | Goldman Sachs International | | | MXN | | | | 3,477 | | | | 167,000 | | | | 167,654 | | | | 654 | | | | — | |
Expiring 12/15/21 | | Goldman Sachs International | | | MXN | | �� | | 2,326 | | | | 113,000 | | | | 112,177 | | | | — | | | | (823 | ) |
Expiring 12/15/21 | | JPMorgan Chase Bank, N.A. | | | MXN | | | | 3,678 | | | | 177,000 | | | | 177,364 | | | | 364 | | | | — | |
Expiring 12/15/21 | | JPMorgan Chase Bank, N.A. | | | MXN | | | | 2,238 | | | | 111,000 | | | | 107,933 | | | | — | | | | (3,067 | ) |
See Notes to Financial Statements.
42
| | | | | | | | | | | | | | | | | | | | | | | | | | |
|
| Forward foreign currency exchange contracts outstanding at October 31, 2021 (continued): | |
| | | | | | |
Purchase Contracts | | Counterparty | | Notional
Amount
(000) | | | Value at
Settlement
Date | | | Current
Value | | | Unrealized
Appreciation | | Unrealized
Depreciation |
| | | |
| OTC Forward Foreign Currency Exchange Contracts (cont’d.): | | | | | | | | | | | | | |
Mexican Peso (cont’d.), | |
Expiring 12/15/21 | | Morgan Stanley & Co. International PLC | | | MXN | | | | 15,014 | | | $ | 741,606 | | | $ | 723,985 | | | | $ — | | | | $ (17,621 | ) |
Expiring 12/15/21 | | UBS AG | | | MXN | | | | 1,643 | | | | 80,251 | | | | 79,220 | | | | — | | | | (1,031 | ) |
New Taiwanese Dollar, | |
Expiring 12/15/21 | | Standard Chartered Bank | | | TWD | | | | 9,164 | | | | 331,541 | | | | 330,064 | | | | — | | | | (1,477 | ) |
Expiring 12/15/21 | | UBS AG | | | TWD | | | | 6,078 | | | | 221,000 | | | | 218,925 | | | | — | | | | (2,075 | ) |
Peruvian Nuevo Sol, | |
Expiring 12/15/21 | | Goldman Sachs International | | | PEN | | | | 647 | | | | 157,000 | | | | 161,744 | | | | 4,744 | | | | — | |
Philippine Peso, | | | | | | | | | | | | | | | | | | | | | | | | | | |
Expiring 12/15/21 | | HSBC Bank PLC | | | PHP | | | | 11,744 | | | | 230,000 | | | | 231,853 | | | | 1,853 | | | | — | |
Expiring 12/15/21 | | HSBC Bank PLC | | | PHP | | | | 11,528 | | | | 226,000 | | | | 227,597 | | | | 1,597 | | | | — | |
Expiring 12/15/21 | | JPMorgan Chase Bank, N.A. | | | PHP | | | | 29,257 | | | | 580,216 | | | | 577,616 | | | | — | | | | (2,600 | ) |
Expiring 12/15/21 | | JPMorgan Chase Bank, N.A. | | | PHP | | | | 15,923 | | | | 311,001 | | | | 314,365 | | | | 3,364 | | | | — | |
Expiring 12/15/21 | | JPMorgan Chase Bank, N.A. | | | PHP | | | | 11,872 | | | | 233,000 | | | | 234,375 | | | | 1,375 | | | | — | |
Expiring 12/15/21 | | Morgan Stanley & Co. International PLC | | | PHP | | | | 10,033 | | | | 195,000 | | | | 198,072 | | | | 3,072 | | | | — | |
Expiring 12/15/21 | | Standard Chartered Bank | | | PHP | | | | 15,839 | | | | 310,000 | | | | 312,693 | | | | 2,693 | | | | — | |
Polish Zloty, | | | | | | | | | | | | | | | | | | | | | | | | | | |
Expiring 01/19/22 | | Citibank, N.A. | | | PLN | | | | 746 | | | | 189,000 | | | | 186,683 | | | | — | | | | (2,317 | ) |
Expiring 01/19/22 | | Morgan Stanley & Co. International PLC | | | PLN | | | | 608 | | | | 154,000 | | | | 152,032 | | | | — | | | | (1,968 | ) |
Russian Ruble, | | | | | | | | | | | | | | | | | | | | | | | | | | |
Expiring 12/15/21 | | Barclays Bank PLC | | | RUB | | | | 48,245 | | | | 647,808 | | | | 673,101 | | | | 25,293 | | | | — | |
Expiring 12/15/21 | | Barclays Bank PLC | | | RUB | | | | 5,651 | | | | 76,000 | | | | 78,840 | | | | 2,840 | | | | — | |
Expiring 12/15/21 | | Credit Suisse International | | | RUB | | | | 6,512 | | | | 88,000 | | | | 90,856 | | | | 2,856 | | | | — | |
Expiring 12/15/21 | | Morgan Stanley & Co. International PLC | | | RUB | | | | 48,245 | | | | 650,806 | | | | 673,102 | | | | 22,296 | | | | — | |
Singapore Dollar, | |
Expiring 12/15/21 | | JPMorgan Chase Bank, N.A. | | | SGD | | | | 324 | | | | 241,000 | | | | 239,919 | | | | — | | | | (1,081 | ) |
Expiring 12/15/21 | | JPMorgan Chase Bank, N.A. | | | SGD | | | | 172 | | | | 127,000 | | | | 127,682 | | | | 682 | | | | — | |
South African Rand, | |
Expiring 12/15/21 | | Barclays Bank PLC | | | ZAR | | | | 2,169 | | | | 145,000 | | | | 141,196 | | | | — | | | | (3,804 | ) |
Expiring 12/15/21 | | Barclays Bank PLC | | | ZAR | | | | 1,717 | | | | 116,000 | | | | 111,724 | | | | — | | | | (4,276 | ) |
Expiring 12/15/21 | | Goldman Sachs International | | | ZAR | | | | 1,694 | | | | 116,000 | | | | 110,244 | | | | — | | | | (5,756 | ) |
See Notes to Financial Statements.
PGIM Emerging Markets Debt Hard Currency Fund 43
Schedule of Investments (continued)
as of October 31, 2021
| | | | | | | | | | | | | | | | | | | | | | | | | | | | | | | | | | |
|
| Forward foreign currency exchange contracts outstanding at October 31, 2021 (continued): | |
| | | | | | |
Purchase Contracts | | Counterparty | | Notional
Amount
(000) | | | Value at
Settlement
Date | | | Current
Value | | | Unrealized Appreciation | | | Unrealized Depreciation | |
|
| OTC Forward Foreign Currency Exchange Contracts (cont’d.): | |
South African Rand (cont’d.), | |
Expiring 12/15/21 | | Goldman Sachs International | | | ZAR | | | | 1,182 | | | $ | 80,000 | | | $ | 76,917 | | | | | | | $ | — | | | | | | | $ | (3,083 | ) |
Expiring 12/15/21 | | JPMorgan Chase Bank, N.A. | | | ZAR | | | | 2,719 | | | | 179,000 | | | | 176,939 | | | | | | | | — | | | | | | | | (2,061 | ) |
Expiring 12/15/21 | | JPMorgan Chase Bank, N.A. | | | ZAR | | | | 2,683 | | | | 181,000 | | | | 174,596 | | | | | | | | — | | | | | | | | (6,404 | ) |
Expiring 12/15/21 | | JPMorgan Chase Bank, N.A. | | | ZAR | | | | 2,160 | | | | 144,000 | | | | 140,584 | | | | | | | | — | | | | | | | | (3,416 | ) |
Expiring 12/15/21 | | JPMorgan Chase Bank, N.A. | | | ZAR | | | | 1,630 | | | | 107,000 | | | | 106,060 | | | | | | | | — | | | | | | | | (940 | ) |
Expiring 12/15/21 | | JPMorgan Chase Bank, N.A. | | | ZAR | | | | 1,207 | | | | 80,000 | | | | 78,569 | | | | | | | | — | | | | | | | | (1,431 | ) |
South Korean Won, | | | | | | | | | | | | | | | | | | | | | | | | | | | | | | | | |
Expiring 12/15/21 | | Goldman Sachs International | | | KRW | | | | 137,411 | | | | 117,000 | | | | 116,854 | | | | | | | | — | | | | | | | | (146 | ) |
Expiring 12/15/21 | | HSBC Bank PLC | | | KRW | | | | 230,348 | | | | 195,000 | | | | 195,887 | | | | | | | | 887 | | | | | | | | — | |
Expiring 12/15/21 | | Morgan Stanley & Co. International PLC | | | KRW | | | | 1,483,198 | | | | 1,266,456 | | | | 1,261,309 | | | | | | | | — | | | | | | | | (5,147 | ) |
Expiring 12/15/21 | | Morgan Stanley & Co. International PLC | | | KRW | | | | 77,291 | | | | 66,090 | | | | 65,728 | | | | | | | | — | | | | | | | | (362 | ) |
Expiring 12/15/21 | | Standard Chartered Bank | | | KRW | | | | 231,636 | | | | 198,000 | | | | 196,983 | | | | | | | | — | | | | | | | | (1,017 | ) |
Thai Baht, | | | | | | | | | | | | | | | | | | | | | | | | | | | | | | | | | | |
Expiring 12/15/21 | | HSBC Bank PLC | | | THB | | | | 6,784 | | | | 206,000 | | | | 204,393 | | | | | | | | — | | | | | | | | (1,607 | ) |
Expiring 12/15/21 | | JPMorgan Chase Bank, N.A. | | | THB | | | | 4,478 | | | | 136,000 | | | | 134,898 | | | | | | | | — | | | | | | | | (1,102 | ) |
Expiring 12/15/21 | | Standard Chartered Bank | | | THB | | | | 6,679 | | | | 198,000 | | | | 201,222 | | | | | | | | 3,222 | | | | | | | | — | |
Expiring 12/15/21 | | Standard Chartered Bank | | | THB | | | | 5,132 | | | | 157,000 | | | | 154,625 | | | | | | | | — | | | | | | | | (2,375 | ) |
Expiring 12/15/21 | | UBS AG | | | THB | | | | 5,954 | | | | 179,000 | | | | 179,386 | | | | | | | | 386 | | | | | | | | — | |
| | | | | | | | | | | | | | | | | | | | | | | | | | | | | | | | | | |
| | | | | | | | | |
| | | | | | | | | | | | $ | 24,699,682 | | | $ | 24,644,236 | | | | | | | | 149,826 | | | | | | | | (205,272 | ) |
| | | | | | | | | | | | | | | | | | | | | | | | | | | | | | | | | | |
| | | | | | |
Sale Contracts | | Counterparty | | Notional
Amount
(000) | | | Value at
Settlement
Date | | | Current
Value | | | Unrealized Appreciation | | | Unrealized Depreciation | |
|
| OTC Forward Foreign Currency Exchange Contracts: | |
Australian Dollar, | |
Expiring 01/19/22 | | Morgan Stanley & Co. International PLC | | | AUD | | | | 738 | | | $ | 543,908 | | | $ | 555,335 | | | | | | | $ | — | | | | | | | $ | (11,427 | ) |
Brazilian Real, | | | | | | | | | | | | | | | | | | | | | | | | | | | | | | | | | | |
Expiring 11/03/21 | | Credit Suisse International | | | BRL | | | | 4,175 | | | | 737,694 | | | | 739,059 | | | | | | | | — | | | | | | | | (1,365 | ) |
See Notes to Financial Statements.
44
| | | | | | | | | | | | | | | | | | | | | | | | | | |
| Forward foreign currency exchange contracts outstanding at October 31, 2021 (continued): | |
| | | | | | |
Sale Contracts | | Counterparty | | Notional
Amount
(000) | | | Value at
Settlement
Date | | | Current
Value | | | Unrealized
Appreciation | | Unrealized
Depreciation |
|
OTC Forward Foreign Currency Exchange Contracts (cont’d.): | |
British Pound, | | | | | | | | | | | | | | | | | | | | | | | | | | |
Expiring 01/19/22 | | Barclays Bank PLC | | | GBP | | | | 113 | | | $ | 153,556 | | | $ | 154,611 | | | $ | — | | | $ | (1,055 | ) |
Chilean Peso, | | | | | | | | | | | | | | | | | | | | | | | | | | |
Expiring 12/15/21 | | BNP Paribas S.A. | | | CLP | | | | 520,830 | | | | 665,691 | | | | 636,844 | | | | 28,847 | | | | — | |
Expiring 12/15/21 | | Citibank, N.A. | | | CLP | | | | 63,987 | | | | 81,000 | | | | 78,240 | | | | 2,760 | | | | — | |
Expiring 12/15/21 | | Morgan Stanley & Co. International PLC | | | CLP | | | | 131,368 | | | | 161,000 | | | | 160,630 | | | | 370 | | | | — | |
Expiring 12/15/21 | | UBS AG | | | CLP | | | | 155,251 | | | | 192,000 | | | | 189,833 | | | | 2,167 | | | | — | |
Chinese Renminbi, | | | | | | | | | | | | | | | | | | | | | | | | | | |
Expiring 11/18/21 | | Citibank, N.A. | | | CNH | | | | 1,753 | | | | 269,000 | | | | 273,215 | | | | — | | | | (4,215 | ) |
Expiring 11/18/21 | | Citibank, N.A. | | | CNH | | | | 1,577 | | | | 243,000 | | | | 245,774 | | | | — | | | | (2,774 | ) |
Expiring 11/18/21 | | Citibank, N.A. | | | CNH | | | | 1,241 | | | | 191,000 | | | | 193,347 | | | | — | | | | (2,347 | ) |
Expiring 11/18/21 | | Citibank, N.A. | | | CNH | | | | 1,182 | | | | 185,000 | | | | 184,211 | | | | 789 | | | | — | |
Expiring 11/18/21 | | HSBC Bank PLC | | | CNH | | | | 1,263 | | | | 195,000 | | | | 196,797 | | | | — | | | | (1,797 | ) |
Expiring 11/18/21 | | HSBC Bank PLC | | | CNH | | | | 1,248 | | | | 195,000 | | | | 194,477 | | | | 523 | | | | — | |
Expiring 11/18/21 | | JPMorgan Chase Bank, N.A. | | | CNH | | | | 2,246 | | | | 344,000 | | | | 349,963 | | | | — | | | | (5,963 | ) |
Expiring 11/18/21 | | JPMorgan Chase Bank, N.A. | | | CNH | | | | 1,505 | | | | 232,000 | | | | 234,493 | | | | — | | | | (2,493 | ) |
Expiring 11/18/21 | | Morgan Stanley & Co. International PLC | | | CNH | | | | 1,524 | | | | 233,000 | | | | 237,533 | | | | — | | | | (4,533 | ) |
Colombian Peso, | | | | | | | | | | | | | | | | | | | | | | | | | | |
Expiring 12/15/21 | | BNP Paribas S.A. | | | COP | | | | 644,328 | | | | 171,000 | | | | 170,554 | | | | 446 | | | | — | |
Expiring 12/15/21 | | BNP Paribas S.A. | | | COP | | | | 447,424 | | | | 116,000 | | | | 118,433 | | | | — | | | | (2,433 | ) |
Expiring 12/15/21 | | Citibank, N.A. | | | COP | | | | 751,311 | | | | 195,000 | | | | 198,873 | | | | — | | | | (3,873 | ) |
Expiring 12/15/21 | | Goldman Sachs International | | | COP | | | | 556,616 | | | | 147,000 | | | | 147,337 | | | | — | | | | (337 | ) |
Expiring 12/15/21 | | JPMorgan Chase Bank, N.A. | | | COP | | | | 2,215,340 | | | | 586,356 | | | | 586,402 | | | | — | | | | (46 | ) |
Expiring 12/15/21 | | Morgan Stanley & Co. International PLC | | | COP | | | | 634,040 | | | | 164,000 | | | | 167,831 | | | | — | | | | (3,831 | ) |
Expiring 12/15/21 | | Morgan Stanley & Co. International PLC | | | COP | | | | 454,910 | | | | 118,000 | | | | 120,415 | | | | — | | | | (2,415 | ) |
Expiring 12/15/21 | | Morgan Stanley & Co. International PLC | | | COP | | | | 266,680 | | | | 70,704 | | | | 70,590 | | | | 114 | | | | — | |
Expiring 12/15/21 | | UBS AG | | | COP | | | | 744,826 | | | | 193,000 | | | | 197,156 | | | | — | | | | (4,156 | ) |
Expiring 12/15/21 | | UBS AG | | | COP | | | | 588,828 | | | | 156,000 | | | | 155,863 | | | | 137 | | | | — | |
Expiring 12/15/21 | | UBS AG | | | COP | | | | 299,286 | | | | 78,000 | | | | 79,221 | | | | — | | | | (1,221 | ) |
Expiring 12/15/21 | | UBS AG | | | COP | | | | 295,680 | | | | 77,000 | | | | 78,267 | | | | — | | | | (1,267 | ) |
Czech Koruna, | | | | | | | | | | | | | | | | | | | | | | | | | | |
Expiring 01/19/22 | | Barclays Bank PLC | | | CZK | | | | 7,628 | | | | 346,008 | | | | 342,486 | | | | 3,522 | | | | — | |
Euro, | | | | | | | | | | | | | | | | | | | | | | | | | | |
Expiring 01/19/22 | | Barclays Bank PLC | | | EUR | | | | 351 | | | | 405,980 | | | | 406,040 | | | | — | | | | (60 | ) |
See Notes to Financial Statements.
PGIM Emerging Markets Debt Hard Currency Fund 45
Schedule of Investments (continued)
as of October 31, 2021
| | | | | | | | | | | | | | | | | | | | | | | | | | |
Forward foreign currency exchange contracts outstanding at October 31, 2021 (continued): | |
| | | | | | |
Sale Contracts | | Counterparty | | Notional
Amount
(000) | | | Value at
Settlement
Date | | | Current
Value | | | Unrealized
Appreciation | | Unrealized
Depreciation |
|
OTC Forward Foreign Currency Exchange Contracts (cont’d.): | |
Euro (cont’d.), | | | | | | | | | | | | | | | | | | | | | | | | | | |
Expiring 01/19/22 | | Goldman Sachs International | | | EUR | | | | 2,805 | | | $ | 3,247,343 | | | $ | 3,249,145 | | | $ | — | | | $ | (1,802 | ) |
Expiring 01/19/22 | | HSBC Bank PLC | | | EUR | | | | 3,160 | | | | 3,659,388 | | | | 3,660,884 | | | | — | | | | (1,496 | ) |
Expiring 01/19/22 | | UBS AG | | | EUR | | | | 3,126 | | | | 3,622,484 | | | | 3,621,560 | | | | 924 | | | | — | |
Expiring 01/19/22 | | UBS AG | | | EUR | | | | 1,878 | | | | 2,175,703 | | | | 2,175,276 | | | | 427 | | | | — | |
Hungarian Forint, | | | | | | | | | | | | | | | | | | | | | | | | | | |
Expiring 01/19/22 | | Goldman Sachs International | | | HUF | | | | 276,189 | | | | 883,043 | | | | 884,256 | | | | — | | | | (1,213 | ) |
Expiring 01/19/22 | | HSBC Bank PLC | | | HUF | | | | 276,189 | | | | 883,353 | | | | 884,256 | | | | — | | | | (903 | ) |
Indian Rupee, | | | | | | | | | | | | | | | | | | | | | | | | | | |
Expiring 12/15/21 | | Citibank, N.A. | | | INR | | | | 17,551 | | | | 235,000 | | | | 232,792 | | | | 2,208 | | | | — | |
Expiring 12/15/21 | | Credit Suisse International | | | INR | | | | 14,334 | | | | 190,000 | | | | 190,117 | | | | — | | | | (117 | ) |
Expiring 12/15/21 | | Credit Suisse International | | | INR | | | | 11,655 | | | | 154,000 | | | | 154,596 | | | | — | | | | (596 | ) |
Expiring 12/15/21 | | HSBC Bank PLC | | | INR | | | | 23,336 | | | | 308,000 | | | | 309,520 | | | | — | | | | (1,520 | ) |
Expiring 12/15/21 | | JPMorgan Chase Bank, N.A. | | | INR | | | | 17,711 | | | | 233,000 | | | | 234,912 | | | | — | | | | (1,912 | ) |
Expiring 12/15/21 | | JPMorgan Chase Bank, N.A. | | | INR | | | | 14,102 | | | | 188,000 | | | | 187,041 | | | | 959 | | | | — | |
Expiring 12/15/21 | | JPMorgan Chase Bank, N.A. | | | INR | | | | 13,317 | | | | 178,000 | | | | 176,630 | | | | 1,370 | | | | — | |
Expiring 12/15/21 | | Morgan Stanley & Co. International PLC | | | INR | | | | 20,270 | | | | 267,000 | | | | 268,854 | | | | — | | | | (1,854 | ) |
Expiring 12/15/21 | | Standard Chartered Bank | | | INR | | | | 14,751 | | | | 194,000 | | | | 195,658 | | | | — | | | | (1,658 | ) |
Expiring 12/15/21 | | UBS AG | | | INR | | | | 14,569 | | | | 194,000 | | | | 193,245 | | | | 755 | | | | — | |
Indonesian Rupiah, | | | | | | | | | | | | | | | | | | | | | | | | | | |
Expiring 12/15/21 | | HSBC Bank PLC | | | IDR | | | | 1,619,940 | | | | 114,000 | | | | 113,317 | | | | 683 | | | | — | |
Expiring 12/15/21 | | Standard Chartered Bank | | | IDR | | | | 2,586,780 | | | | 180,000 | | | | 180,949 | | | | — | | | | (949 | ) |
Israeli Shekel, | | | | | | | | | | | | | | | | | | | | | | | | | | |
Expiring 12/15/21 | | Bank of America, N.A. | | | ILS | | | | 621 | | | | 193,000 | | | | 196,261 | | | | — | | | | (3,261 | ) |
Expiring 12/15/21 | | Barclays Bank PLC | | | ILS | | | | 1,254 | | | | 389,000 | | | | 396,390 | | | | — | | | | (7,390 | ) |
Expiring 12/15/21 | | Barclays Bank PLC | | | ILS | | | | 607 | | | | 189,000 | | | | 191,896 | | | | — | | | | (2,896 | ) |
Expiring 12/15/21 | | BNP Paribas S.A. | | | ILS | | | | 387 | | | | 120,238 | | | | 122,277 | | | | — | | | | (2,039 | ) |
Expiring 12/15/21 | | Citibank, N.A. | | | ILS | | | | 855 | | | | 266,000 | | | | 270,355 | | | | — | | | | (4,355 | ) |
Expiring 12/15/21 | | Citibank, N.A. | | | ILS | | | | 751 | | | | 233,000 | | | | 237,443 | | | | — | | | | (4,443 | ) |
Expiring 12/15/21 | | JPMorgan Chase Bank, N.A. | | | ILS | | | | 878 | | | | 271,000 | | | | 277,441 | | | | — | | | | (6,441 | ) |
Mexican Peso, | | | | | | | | | | | | | | | | | | | | | | | | | | |
Expiring 12/15/21 | | JPMorgan Chase Bank, N.A. | | | MXN | | | | 3,666 | | | | 181,000 | | | | 176,779 | | | | 4,221 | | | | — | |
Expiring 12/15/21 | | JPMorgan Chase Bank, N.A. | | | MXN | | | | 3,650 | | | | 179,000 | | | | 175,986 | | | | 3,014 | | | | — | |
See Notes to Financial Statements.
46
| | | | | | | | | | | | | | | | | | | | | | | | | | |
| Forward foreign currency exchange contracts outstanding at October 31, 2021 (continued): | |
| | | | | | |
Sale Contracts | | Counterparty | | Notional
Amount
(000) | | | Value at
Settlement
Date | | | Current
Value | | | Unrealized
Appreciation | | Unrealized
Depreciation |
|
OTC Forward Foreign Currency Exchange Contracts (cont’d.): | |
Mexican Peso (cont’d.), | | | | | | | | | | | | | | | | | | | | | | | | |
Expiring 12/15/21 | | JPMorgan Chase Bank, N.A. | | | MXN | | | | 3,649 | | | $ | 181,000 | | | $ | 175,950 | | | $ | 5,050 | | | $ | — | |
New Taiwanese Dollar, | | | | | | | | | | | | | | | | | | | | | | | | | | |
Expiring 12/15/21 | | Credit Suisse International | | | TWD | | | | 5,345 | | | | 193,000 | | | | 192,508 | | | | 492 | | | | — | |
Expiring 12/15/21 | | Goldman Sachs International | | | TWD | | | | 5,393 | | | | 194,000 | | | | 194,245 | | | | — | | | | (245 | ) |
Expiring 12/15/21 | | JPMorgan Chase Bank, N.A. | | | TWD | | | | 10,531 | | | | 379,000 | | | | 379,277 | | | | — | | | | (277 | ) |
Expiring 12/15/21 | | JPMorgan Chase Bank, N.A. | | | TWD | | | | 9,376 | | | | 338,000 | | | | 337,699 | | | | 301 | | | | — | |
Peruvian Nuevo Sol, | | | | | | | | | | | | | | | | | | | | | | | | | | |
Expiring 12/15/21 | | Citibank, N.A. | | | PEN | | | | 166 | | | | 40,299 | | | | 41,434 | | | | — | | | | (1,135 | ) |
Expiring 12/15/21 | | Standard Chartered Bank | | | PEN | | | | 451 | | | | 114,000 | | | | 112,842 | | | | 1,158 | | | | — | |
Philippine Peso, | | | | | | | | | | | | | | | | | | | | | | | | | | |
Expiring 12/15/21 | | Citibank, N.A. | | | PHP | | | | 13,408 | | | | 263,000 | | | | 264,713 | | | | — | | | | (1,713 | ) |
Expiring 12/15/21 | | Citibank, N.A. | | | PHP | | | | 12,019 | | | | 239,000 | | | | 237,292 | | | | 1,708 | | | | — | |
Expiring 12/15/21 | | Goldman Sachs International | | | PHP | | | | 9,952 | | | | 197,000 | | | | 196,487 | | | | 513 | | | | — | |
Expiring 12/15/21 | | JPMorgan Chase Bank, N.A. | | | PHP | | | | 11,845 | | | | 234,000 | | | | 233,852 | | | | 148 | | | | — | |
Polish Zloty, | | | | | | | | | | | | | | | | | | | | | | | | | | |
Expiring 01/19/22 | | Barclays Bank PLC | | | PLN | | | | 796 | | | | 199,914 | | | | 199,066 | | | | 848 | | | | — | |
Russian Ruble, | | | | | | | | | | | | | | | | | | | | | | | | | | |
Expiring 12/15/21 | | Bank of America, N.A. | | | RUB | | | | 8,176 | | | | 111,000 | | | | 114,067 | | | | — | | | | (3,067 | ) |
Expiring 12/15/21 | | Bank of America, N.A. | | | RUB | | | | 5,750 | | | | 79,000 | | | | 80,229 | | | | — | | | | (1,229 | ) |
Expiring 12/15/21 | | Citibank, N.A. | | | RUB | | | | 13,803 | | | | 187,000 | | | | 192,571 | | | | — | | | | (5,571 | ) |
Expiring 12/15/21 | | Citibank, N.A. | | | RUB | | | | 9,006 | | | | 122,000 | | | | 125,653 | | | | — | | | | (3,653 | ) |
Expiring 12/15/21 | | Credit Suisse International | | | RUB | | | | 14,831 | | | | 201,000 | | | | 206,916 | | | | — | | | | (5,916 | ) |
Expiring 12/15/21 | | Credit Suisse International | | | RUB | | | | 11,203 | | | | 154,000 | | | | 156,296 | | | | — | | | | (2,296 | ) |
Expiring 12/15/21 | | Morgan Stanley & Co. International PLC | | | RUB | | | | 11,610 | | | | 157,000 | | | | 161,981 | | | | — | | | | (4,981 | ) |
Expiring 12/15/21 | | Morgan Stanley & Co. International PLC | | | RUB | | | | 10,805 | | | | 152,000 | | | | 150,742 | | | | 1,258 | | | | — | |
Expiring 12/15/21 | | Standard Chartered Bank | | | RUB | | | | 11,314 | | | | 154,000 | | | | 157,844 | | | | — | | | | (3,844 | ) |
Expiring 12/15/21 | | Standard Chartered Bank | | | RUB | | | | 5,977 | | | | 81,000 | | | | 83,395 | | | | — | | | | (2,395 | ) |
Singapore Dollar, | | | | | | | | | | | | | | | | | | | | | | | | | | |
Expiring 12/15/21 | | BNP Paribas S.A. | | | SGD | | | | 256 | | | | 189,000 | | | | 189,782 | | | | — | | | | (782 | ) |
Expiring 12/15/21 | | Citibank, N.A. | | | SGD | | | | 332 | | | | 246,000 | | | | 246,433 | | | | — | | | | (433 | ) |
Expiring 12/15/21 | | Goldman Sachs International | | | SGD | | | | 3,107 | | | | 2,311,245 | | | | 2,303,418 | | | | 7,827 | | | | — | |
Expiring 12/15/21 | | Goldman Sachs International | | | SGD | | | | 271 | | | | 202,000 | | | | 201,264 | | | | 736 | | | | — | |
See Notes to Financial Statements.
PGIM Emerging Markets Debt Hard Currency Fund 47
Schedule of Investments (continued)
as of October 31, 2021
| | | | | | | | | | | | | | | | | | | | | | | | | | | | | | | | | | | | | | | | | | |
Forward foreign currency exchange contracts outstanding at October 31, 2021 (continued): | | | | |
Sale Contracts | | Counterparty | | Notional
Amount (000) | | | Value at
Settlement
Date | | | Current
Value | | | Unrealized
Appreciation | | | Unrealized
Depreciation | |
| | | | |
OTC Forward Foreign Currency Exchange Contracts (cont’d.): | | | | | | | | | | | | | | | | | |
Singapore Dollar (cont’d.), | | | | | | | | | | | | | | | | | | | | | | | | | | | | | | | | | | | | | | | | |
Expiring 12/15/21 | | JPMorgan Chase Bank, N.A. | | | SGD | | | | 318 | | | $ | 236,000 | | | $ | 235,875 | | | | | | | $ | 125 | | | | | | | | | | | $ | — | | | | | |
Expiring 12/15/21 | | JPMorgan Chase Bank, N.A. | | | SGD | | | | 241 | | | | 177,000 | | | | 178,611 | | | | | | | | — | | | | | | | | | | | | (1,611 | ) | | | | |
Expiring 12/15/21 | | JPMorgan Chase Bank, N.A. | | | SGD | | | | 238 | | | | 176,000 | | | | 176,818 | | | | | | | | — | | | | | | | | | | | | (818 | ) | | | | |
Expiring 12/15/21 | | Standard Chartered Bank | | | SGD | | | | 204 | | | | 152,040 | | | | 151,571 | | | | | | | | 469 | | | | | | | | | | | | — | | | | | |
Expiring 12/15/21 | | UBS AG | | | SGD | | | | 496 | | | | 369,000 | | | | 368,096 | | | | | | | | 904 | | | | | | | | | | | | — | | | | | |
Expiring 12/15/21 | | UBS AG | | | SGD | | | | 441 | | | | 325,000 | | | | 326,887 | | | | | | | | — | | | | | | | | | | | | (1,887 | ) | | | | |
South African Rand, | | | | | | | | | | | | | | | | | | | | | | | | | | | | | | | | | | | | | | | | |
Expiring 12/15/21 | | Barclays Bank PLC | | | ZAR | | | | 12,730 | | | | 871,801 | | | | 828,503 | | | | | | | | 43,298 | | | | | | | | | | | | — | | | | | |
Expiring 12/15/21 | | Citibank, N.A. | | | ZAR | | | | 7,738 | | | | 535,236 | | | | 503,618 | | | | | | | | 31,618 | | | | | | | | | | | | — | | | | | |
Expiring 12/15/21 | | Credit Suisse International | | | ZAR | | | | 1,176 | | | | 77,558 | | | | 76,557 | | | | | | | | 1,001 | | | | | | | | | | | | — | | | | | |
Expiring 12/15/21 | | HSBC Bank PLC | | | ZAR | | | | 13,937 | | | | 966,078 | | | | 907,076 | | | | | | | | 59,002 | | | | | | | | | | | | — | | | | | |
Expiring 12/15/21 | | JPMorgan Chase Bank, N.A. | | | ZAR | | | | 2,705 | | | | 178,000 | | | | 176,049 | | | | | | | | 1,951 | | | | | | | | | | | | — | | | | | |
Expiring 12/15/21 | | JPMorgan Chase Bank, N.A. | | | ZAR | | | | 2,705 | | | | 177,000 | | | | 176,066 | | | | | | | | 934 | | | | | | | | | | | | — | | | | | |
Thai Baht, | | | | | | | | | | | | | | | | | | | | | | | | | | | | | | | | | | | | | | | | | | |
Expiring 12/15/21 | | Citibank, N.A. | | | THB | | | | 4,994 | | | | 152,000 | | | | 150,448 | | | | | | | | 1,552 | | | | | | | | | | | | — | | | | | |
Expiring 12/15/21 | | Credit Suisse International | | | THB | | | | 1,326 | | | | 39,676 | | | | 39,962 | | | | | | | | — | | | | | | | | | | | | (286 | ) | | | | |
Expiring 12/15/21 | | Goldman Sachs International | | | THB | | | | 3,134 | | | | 94,215 | | | | 94,411 | | | | | | | | — | | | | | | | | | | | | (196 | ) | | | | |
Expiring 12/15/21 | | HSBC Bank PLC | | | THB | | | | 41,739 | | | | 1,284,704 | | | | 1,257,459 | | | | | | | | 27,245 | | | | | | | | | | | | — | | | | | |
Expiring 12/15/21 | | JPMorgan Chase Bank, N.A. | | | THB | | | | 6,524 | | | | 195,000 | | | | 196,548 | | | | | | | | — | | | | | | | | | | | | (1,548 | ) | | | | |
Expiring 12/15/21 | | JPMorgan Chase Bank, N.A. | | | THB | | | | 5,233 | | | | 159,000 | | | | 157,645 | | | | | | | | 1,355 | | | | | | | | | | | | — | | | | | |
Expiring 12/15/21 | | JPMorgan Chase Bank, N.A. | | | THB | | | | 5,142 | | | | 154,000 | | | | 154,924 | | | | | | | | — | | | | | | | | | | | | (924 | ) | | | | |
Expiring 12/15/21 | | JPMorgan Chase Bank, N.A. | | | THB | | | | 5,107 | | | | 150,000 | | | | 153,862 | | | | | | | | — | | | | | | | | | | | | (3,862 | ) | | | | |
Expiring 12/15/21 | | Morgan Stanley & Co. International PLC | | | THB | | | | 4,758 | | | | 142,324 | | | | 143,336 | | | | | | | | — | | | | | | | | | | | | (1,012 | ) | | | | |
Expiring 12/15/21 | | Standard Chartered Bank | | | THB | | | | 11,739 | | | | 359,000 | | | | 353,658 | | | | | | | | 5,342 | | | | | | | | | | | | — | | | | | |
Expiring 12/15/21 | | Standard Chartered Bank | | | THB | | | | 9,247 | | | | 276,000 | | | | 278,595 | | | | | | | | — | | | | | | | | | | | | (2,595 | ) | | | | |
Expiring 12/15/21 | | Standard Chartered Bank | | | THB | | | | 9,031 | | | | 279,000 | | | | 272,078 | | | | | | | | 6,922 | | | | | | | | | | | | — | | | | | |
Expiring 12/15/21 | | Standard Chartered Bank | | | THB | | | | 7,274 | | | | 225,000 | | | | 219,130 | | | | | | | | 5,870 | | | | | | | | | | | | — | | | | | |
| | | | | | | | | | | | | | | | | | | | | | | | | | | | | | | | | | | | | | | | | | |
| | | | | | | | | | | |
| | | | | | | | | | | | $ | 41,042,539 | | | $ | 40,935,405 | | | | | | | | 261,863 | | | | | | | | | | | | (154,729 | ) | | | | |
| | | | | | | | | | | | | | | | | | | | | | | | | | | | | | | | | | | | | | | | | | |
| | | | | | | | | | | | | | | | | | | | | | | | $ | 411,689 | | | | | | | | | | | $ | (360,001 | ) | | | | |
| | | | | | | | | | | | | | | | | | | | | | | | | | | | | | | | | | | | | | | | | | |
See Notes to Financial Statements.
48
Credit default swap agreements outstanding at October 31, 2021:
| | | | | | | | | | | | | | | | | | | | | | | | | | | | | | | | | | | |
Reference Entity/ Obligation | | Termination
Date | | Fixed
Rate | | Notional
Amount
(000)#(3) | | Fair
Value | | Upfront
Premiums
Paid
(Received) | | Unrealized
Appreciation
(Depreciation) | | Counterparty |
| | | | | | | | | | | | | | | |
|
| OTC Credit Default Swap Agreement on corporate and/or sovereign issues - Buy Protection(1): | |
Federative Republic of Brazil | | | | 12/20/26 | | | | | 1.000%(Q) | | | | | 750 | | | | $ | 51,206 | | | | $ | 51,272 | | | | $ | (66 | ) | | | | Barclays Bank PLC | |
| | | | | | | | | | | | | | | | | | | | | | | | | | | | | | | | | | | |
| | | | | | | | | | | | | | | | | | | | | | | | | | | | | | |
Reference Entity/ Obligation | | Termination
Date | | Fixed
Rate | | Notional
Amount
(000)#(3) | | Value at
Trade Date | | Value at
October 31,
2021 | | Unrealized
Appreciation
(Depreciation) |
| | | | | | | | | | | | | |
|
| Centrally Cleared Credit Default Swap Agreement on credit indices - Buy Protection(1): | |
CDX.EM.36.V1 | | | | 12/20/26 | | | | | 1.000%(Q) | | | | | 3,010 | | | | $ | 106,297 | | | | $ | 121,080 | | | | $ | 14,783 | |
| | | | | | | | | | | | | | | | | | | | | | | | | | | | | | |
The Fund entered into credit default swaps (“CDS”) to provide a measure of protection against defaults or to take an active long or short position with respect to the likelihood of a particular issuer’s default or the reference entity’s credit soundness. CDS contracts generally trade based on a spread which represents the cost a protection buyer has to pay the protection seller. The protection buyer is said to be short the credit as the value of the contract rises the more the credit deteriorates. The value of the CDS contract increases for the protection buyer if the spread increases.
| (1) | If the Fund is a buyer of protection, it pays the fixed rate. When a credit event occurs, as defined under the terms of that particular swap agreement, the Fund will either (i) receive from the seller of protection an amount equal to the notional amount of the swap and make delivery of the referenced obligation or underlying securities comprising the referenced index or (ii) receive a net settlement amount in the form of cash or securities equal to the notional amount of the swap less the recovery value of the referenced obligation or underlying securities comprising the referenced index. |
| (2) | If the Fund is a seller of protection, it receives the fixed rate. When a credit event occurs, as defined under the terms of that particular swap agreement, the Fund will either (i) pay to the buyer of protection an amount equal to the notional amount of the swap and take delivery of the referenced obligation or underlying securities comprising the referenced index or (ii) pay a net settlement amount in the form of cash or securities equal to the notional amount of the swap less the recovery value of the referenced obligation or underlying securities comprising the referenced index. |
| (3) | Notional amount represents the maximum potential amount the Fund could be required to pay as a seller of credit protection or receive as a buyer of credit protection if a credit event occurs as defined under the terms of that particular swap agreement. |
| (4) | Implied credit spreads, represented in absolute terms, utilized in determining the fair value of credit default swap agreements where the Fund is the seller of protection as of the reporting date serve as an indicator of the current status of the payment/ performance risk and represent the likelihood of risk of default for the credit derivative. The implied credit spread of a particular referenced entity reflects the cost of buying/selling protection and may include up-front payments required to be made to enter into the agreement. Wider credit spreads represent a deterioration of the referenced entity’s credit soundness and a greater likelihood of risk of default or other credit event occurring as defined |
See Notes to Financial Statements.
PGIM Emerging Markets Debt Hard Currency Fund 49
Schedule of Investments (continued)
as of October 31, 2021
under the terms of the agreement.
Interest rate swap agreements outstanding at October 31, 2021:
| | | | | | | | | | | | | | | | | | | | | | | | | | | | | | | | | | | | | | | | | | | | | | | | | | |
Notional
Amount
(000)# | | Termination
Date | | | Fixed
Rate | | | | | | Floating Rate | | Value at
Trade Date | | | Value at
October 31,
2021 | | | Unrealized
Appreciation
(Depreciation) | |
| | | | | | | |
Centrally Cleared Interest Rate Swap Agreements: | | | | | | | | | | | | | | | | | | | | | | | | | | | | | |
| CNH 2,200 | | | 05/11/25 | | | | 1.900%(Q) | | | | | | | 7 Day China Fixing Repo Rates(2)(Q) | | | | | | $ | (2 | ) | | | | | | | | | | $ | (7,727 | ) | | | | | | | | | | $ | (7,725 | ) | | | | |
| CNH 2,200 | | | 05/29/25 | | | | 2.020%(Q) | | | | | | | 7 Day China Fixing Repo Rates(2)(Q) | | | | | | | 4 | | | | | | | | | | | | (6,383 | ) | | | | | | | | | | | (6,387 | ) | | | | |
| CNH 7,600 | | | 07/24/25 | | | | 2.525%(Q) | | | | | | | 7 Day China Fixing Repo Rates(2)(Q) | | | | | | | (3,773 | ) | | | | | | | | | | | (1,750 | ) | | | | | | | | | | | 2,023 | | | | | |
| CNH 7,300 | | | 07/15/26 | | | | 2.570%(Q) | | | | | | | 7 Day China Fixing Repo Rates(2)(Q) | | | | | | | (10 | ) | | | | | | | | | | | (2,722 | ) | | | | | | | | | | | (2,712 | ) | | | | |
| MXN 14,920 | | | 04/28/27 | | | | 5.930%(M) | | | | | | | 28 Day Mexican Interbank Rate(2)(M) | | | | | | | 18,469 | | | | | | | | | | | | (54,064 | ) | | | | | | | | | | | (72,533 | ) | | | | |
| | | | | | | | | | | | | | | | | | | | | | | | | | | | | | | | | | | | | | | | | | | | | | | | | | |
| | | | | | | | | | | | | | | | | | | | $ | 14,688 | | | | | | | | | | | $ | (72,646 | ) | | | | | | | | | | $ | (87,334 | ) | | | | |
| | | | | | | | | | | | | | | | | | | | | | | | | | | | | | | | | | | | | | | | | | | | | | | | | | |
| (1) | The Fund pays the fixed rate and receives the floating rate. |
| (2) | The Fund pays the floating rate and receives the fixed rate. |
| | | | | | | | |
| Balances Reported in the Statement of Assets and Liabilities for OTC Swap Agreements: | | |
| | | | | | | | |
| | | | |
| | | Premiums Paid | | Premiums Received | | Unrealized
Appreciation | | Unrealized
Depreciation |
| | | | |
OTC Swap Agreements | | $51,272 | | $— | | $— | | $(66) |
Summary of Collateral for Centrally Cleared/Exchange-traded Derivatives:
Cash and securities segregated as collateral, including pending settlement for closed positions, to cover requirements for centrally cleared/exchange-traded derivatives are listed by broker as follows:
| | | | | | | | | | | | |
Broker | | Cash and/or Foreign Currency | | Securities Market Value |
| | | | | | |
J.P. Morgan Securities LLC | | | | $700,000 | | | | | | $— | | |
| | | | | | | | | | | | |
Fair Value Measurements:
Various inputs are used in determining the value of the Fund’s investments. These inputs are summarized in the three broad levels listed below.
Level 1—unadjusted quoted prices generally in active markets for identical securities.
Level 2—quoted prices for similar securities, interest rates and yield curves, prepayment speeds, foreign currency exchange rates and other observable inputs.
Level 3—unobservable inputs for securities valued in accordance with Board approved fair valuation procedures.
See Notes to Financial Statements.
50
The following is a summary of the inputs used as of October 31, 2021 in valuing such portfolio securities:
| | | | | | | | | | |
| | | Level 1 | | | Level 2 | | | Level 3 |
Investments in Securities | | | | | | | | | | |
Assets | | | | | | | | | | |
Long-Term Investments | | | | | | | | | | |
Corporate Bonds | | | | | | | | | | |
Azerbaijan | | $ | — | | | $ | 1,006,853 | | | $— |
Bahrain | | | — | | | | 668,378 | | | — |
Brazil | | | — | | | | 2,275,579 | | | — |
Chile | | | — | | | | 1,759,815 | | | — |
China | | | — | | | | 2,545,563 | | | — |
Colombia | | | — | | | | 334,348 | | | — |
Costa Rica | | | — | | | | 201,464 | | | — |
Ghana | | | — | | | | 210,249 | | | — |
Guatemala | | | — | | | | 204,550 | | | — |
India | | | — | | | | 2,254,317 | | | — |
Indonesia | | | — | | | | 3,588,837 | | | — |
Israel | | | — | | | | 524,767 | | | — |
Jamaica | | | — | | | | 192,798 | | | — |
Kazakhstan | | | — | | | | 2,024,157 | | | — |
Kuwait | | | — | | | | 486,418 | | | — |
Malaysia | | | — | | | | 1,713,642 | | | — |
Mexico | | | — | | | | 7,226,738 | | | — |
Mongolia | | | — | | | | 212,880 | | | — |
Netherlands | | | — | | | | 199,868 | | | — |
Panama | | | — | | | | 208,408 | | | — |
Peru | | | — | | | | 408,244 | | | — |
Philippine | | | — | | | | 183,817 | | | — |
Qatar | | | — | | | | 611,104 | | | — |
Russia | | | — | | | | 1,930,429 | | | — |
Saudi Arabia | | | — | | | | 433,342 | | | — |
South Africa | | | — | | | | 2,968,713 | | | — |
Thailand | | | — | | | | 186,147 | | | — |
Trinidad & Tobago | | | — | | | | 184,862 | | | — |
Turkey | | | — | | | | 390,917 | | | — |
Ukraine | | | — | | | | 561,144 | | | — |
United Arab Emirates | | | — | | | | 2,497,543 | | | — |
United States | | | — | | | | 208,805 | | | — |
Venezuela | | | — | | | | 72,410 | | | — |
Vietnam | | | — | | | | 248,674 | | | — |
Sovereign Bonds | | | | | | | | | | |
Angola | | | — | | | | 3,044,717 | | | — |
Argentina | | | — | | | | 2,027,229 | | | — |
Bahrain | | | — | | | | 2,099,199 | | | — |
Belarus | �� | | — | | | | 970,515 | | | — |
Bermuda | | | — | | | | 268,084 | | | — |
Brazil | | | — | | | | 3,391,860 | | | — |
Bulgaria | | | — | | | | 194,852 | | | — |
Cameroon | | | — | | | | 442,557 | | | — |
Colombia | | | — | | | | 3,589,944 | | | — |
See Notes to Financial Statements.
PGIM Emerging Markets Debt Hard Currency Fund 51
Schedule of Investments (continued)
as of October 31, 2021
| | | | | | | | | | |
| | | Level 1 | | | Level 2 | | | Level 3 |
Investments in Securities (continued) | | | | | | | | | | |
Assets (continued) | | | | | | | | | | |
Long-Term Investments (continued) | | | | | | | | | | |
Sovereign Bonds (continued) | | | | | | | | | | |
Congo (Republic) | | $ | — | | | $ | 195,250 | | | $— |
Costa Rica | | | — | | | | 1,225,114 | | | — |
Croatia | | | — | | | | 210,126 | | | — |
Dominican Republic | | | — | | | | 4,454,091 | | | — |
Ecuador | | | — | | | | 2,250,775 | | | — |
Egypt | | | — | | | | 2,064,105 | | | — |
El Salvador | | | — | | | | 1,202,772 | | | — |
Gabon | | | — | | | | 1,055,963 | | | — |
Ghana | | | — | | | | 1,574,180 | | | — |
Guatemala | | | — | | | | 1,107,471 | | | — |
Honduras | | | — | | | | 785,044 | | | — |
Hungary | | | — | | | | 1,877,734 | | | — |
India | | | — | | | | 406,524 | | | — |
Indonesia | | | — | | | | 3,457,370 | | | — |
Iraq | | | — | | | | 1,212,760 | | | — |
Israel | | | — | | | | 625,252 | | | — |
Ivory Coast | | | — | | | | 1,859,555 | | | — |
Jamaica | | | — | | | | 1,062,278 | | | — |
Jordan | | | — | | | | 628,891 | | | — |
Kazakhstan | | | — | | | | 290,777 | | | — |
Kenya | | | — | | | | 641,273 | | | — |
Lebanon | | | — | | | | 494,161 | | | — |
Malaysia | | | — | | | | 2,008,652 | | | — |
Mexico | | | — | | | | 1,917,999 | | | — |
Mongolia | | | — | | | | 449,338 | | | — |
Morocco | | | — | | | | 1,043,843 | | | — |
Mozambique | | | — | | | | 512,272 | | | — |
Namibia | | | — | | | | 212,982 | | | — |
Nigeria | | | — | | | | 3,317,586 | | | — |
Oman | | | — | | | | 3,324,882 | | | — |
Pakistan | | | — | | | | 2,081,816 | | | — |
Panama | | | — | | | | 2,111,841 | | | — |
Papua New Guinea | | | — | | | | 202,558 | | | — |
Paraguay | | | — | | | | 925,752 | | | — |
Peru | | | — | | | | 2,911,107 | | | — |
Philippines. | | | — | | | | 2,878,025 | | | — |
Qatar | | | — | | | | 4,088,813 | | | — |
Romania | | | — | | | | 2,118,748 | | | — |
Russia | | | — | | | | 3,891,676 | | | — |
Saudi Arabia | | | — | | | | 3,965,566 | | | — |
Senegal | | | — | | | | 402,702 | | | — |
Serbia | | | — | | | | 1,377,370 | | | — |
South Africa | | | — | | | | 1,308,096 | | | — |
Sri Lanka | | | — | | | | 1,076,669 | | | — |
Turkey | | | — | | | | 4,747,404 | | | — |
See Notes to Financial Statements.
52
| | | | | | | | | | |
| | | Level 1 | | | Level 2 | | | Level 3 |
Investments in Securities (continued) | | | | | | | | | | |
Assets (continued) | | | | | | | | | | |
Long-Term Investments (continued) | | | | | | | | | | |
Sovereign Bonds (continued) | | | | | | | | | | |
Ukraine | | $ | — | | | $ | 4,980,449 | | | $— |
United Arab Emirates | | | — | | | | 1,686,962 | | | — |
Uruguay | | | — | | | | 2,115,359 | | | — |
Venezuela | | | — | | | | 18,988 | | | — |
Zambia | | | — | | | | 941,320 | | | — |
Short-Term Investments | | | | | | | | | | |
Affiliated Mutual Fund | | | 12,463,160 | | | | — | | | — |
Options Purchased | | | — | | | | 151,408 | | | — |
| | | | | | | | | | |
| | | |
Total | | $ | 12,463,160 | | | $ | 140,206,386 | | | $— |
| | | | | | | | | | |
| | | |
Liabilities | | | | | | | | | | |
Options Written | | $ | — | | | $ | (94,391 | ) | | $— |
| | | | | | | | | | |
| | | |
Other Financial Instruments* | | | | | | | | | | |
Assets | | | | | | | | | | |
Futures Contracts | | $ | 343,862 | | | $ | — | | | $— |
OTC Forward Foreign Currency Exchange Contracts | | | — | | | | 411,689 | | | — |
Centrally Cleared Credit Default Swap Agreement | | | — | | | | 14,783 | | | — |
OTC Credit Default Swap Agreement | | | — | | | | 51,206 | | | — |
Centrally Cleared Interest Rate Swap Agreement | | | — | | | | 2,023 | | | — |
| | | | | | | | | | |
| | | |
Total | | $ | 343,862 | | | $ | 479,701 | | | $— |
| | | | | | | | | | |
| | | |
Liabilities | | | | | | | | | | |
Futures Contracts | | $ | (214,157 | ) | | $ | — | | | $— |
OTC Forward Foreign Currency Exchange Contracts | | | — | | | | (360,001 | ) | | — |
Centrally Cleared Interest Rate Swap Agreements | | | — | | | | (89,357 | ) | | — |
| | | | | | | | | | |
| | | |
Total | | $ | (214,157 | ) | | $ | (449,358 | ) | | $— |
| | | | | | | | | | |
| * | Other financial instruments are derivative instruments not reflected in the Schedule of Investments, such as futures, forwards and centrally cleared swap contracts, which are recorded at the unrealized appreciation (depreciation) on the instrument, and OTC swap contracts which are recorded at fair value. |
Industry Classification:
The industry classification of investments and other assets in excess of liabilities shown as a percentage of net assets as of October 31, 2021 were as follows (unaudited):
| | | | |
Sovereign Bonds | | | 65.6 | % |
Oil & Gas | | | 11.1 | |
Affiliated Mutual Fund | | | 8.1 | |
Electric | | | 3.6 | |
Mining | | | 1.6 | |
| | | | |
Pipelines | | | 1.4 | % |
Engineering & Construction | | | 1.2 | |
Chemicals | | | 1.0 | |
Commercial Services | | | 0.6 | |
Banks | | | 0.6 | |
See Notes to Financial Statements.
PGIM Emerging Markets Debt Hard Currency Fund 53
Schedule of Investments (continued)
as of October 31, 2021
Industry Classification (continued):
| | | | |
Diversified Financial Services | | | 0.6 | % |
Real Estate | | | 0.5 | |
Telecommunications | | | 0.4 | |
Transportation | | | 0.4 | |
Building Materials | | | 0.3 | |
Retail | | | 0.3 | |
Iron/Steel | | | 0.3 | |
Media | | | 0.2 | |
Energy-Alternate Sources | | | 0.2 | |
Lodging | | | 0.2 | |
Investment Companies | | | 0.1 | |
Foods | | | 0.1 | |
| | | | |
Auto Manufacturers | | | 0.1 | % |
Gas | | | 0.1 | |
Entertainment | | | 0.1 | |
Options Purchased | | | 0.1 | |
Forest Products & Paper | | | 0.1 | |
| | | | |
| |
| | | 98.9 | |
Options Written | | | (0.1 | ) |
Other assets in excess of liabilities | | | 1.2 | |
| | | | |
| |
| | | 100.0 | % |
| | | | |
Effects of Derivative Instruments on the Financial Statements and Primary Underlying Risk Exposure:
The Fund invested in derivative instruments during the reporting period. The primary types of risk associated with these derivative instruments are credit contracts risk, foreign exchange contracts risk and interest rate contracts risk. See the Notes to Financial Statements for additional detail regarding these derivative instruments and their risks. The effect of such derivative instruments on the Fund’s financial position and financial performance as reflected in the Statement of Assets and Liabilities and Statement of Operations is presented in the summary below.
Fair values of derivative instruments as of October 31, 2021 as presented in the Statement of Assets and Liabilities:
| | | | | | | | | | | | |
| | | Asset Derivatives | | | Liability Derivatives | |
| | | | |
Derivatives not accounted for as
hedging instruments, carried at fair value | | Statement of Assets and Liabilities Location | | Fair
Value | | | Statement of Assets and Liabilities Location | | Fair
Value | |
Credit contracts | | Due from/to broker-variation margin swaps | | $ | 14,783* | | | — | | $ | — | |
Credit contracts | | Premiums paid for OTC swap agreements | | | 51,272 | | | — | | | — | |
Credit contracts | | — | | | — | | | Unrealized depreciation on OTC swap agreements | | | 66 | |
Foreign exchange contracts | | Unaffiliated investments | | | 151,408 | | | Options written outstanding, at value | | | 94,391 | |
Foreign exchange contracts | | Unrealized appreciation on OTC forward foreign currency exchange contracts | | | 411,689 | | | Unrealized depreciation on OTC forward foreign currency exchange contracts | | | 360,001 | |
Interest rate contracts | | Due from/to broker-variation margin futures | | | 343,862 | * | | Due from/to broker-variation margin futures | | | 214,157 | * |
See Notes to Financial Statements.
54
| | | | | | | | | | | | |
| | | Asset Derivatives | | | Liability Derivatives | |
Derivatives not accounted for as hedging instruments, carried at fair value | | Statement of Assets and Liabilities Location | | Fair Value | | | Statement of Assets and Liabilities Location | | Fair Value | |
| | | | |
Interest rate contracts | | Due from/to broker-variation margin
swaps | | $ | 2,023 | * | | Due from/to broker-variation margin swaps | | $ | 89,357 | * |
| | | | | | | | | | | | |
| | | | |
| | | | $ | 975,037 | | | | | $ | 757,972 | |
| | | | | | | | | | | | |
| * | Includes cumulative appreciation (depreciation) as reported in the schedule of open futures and centrally cleared swap contracts. Only unsettled variation margin receivable (payable) is reported within the Statement of Assets and Liabilities. |
The effects of derivative instruments on the Statement of Operations for the year ended October 31, 2021 are as follows:
| | | | | | | | | | | | | | | | | | | | | | | | | |
Amount of Realized Gain (Loss) on Derivatives Recognized in Income | |
| | | | | |
Derivatives not accounted for as hedging instruments, carried at fair value | | Options Purchased(1) | | Options Written | | Futures | | Forward & Cross Currency Exchange Contracts | | Swaps |
| | | | | |
Credit contracts | | | $ | — | | | | $ | — | | | | $ | — | | | | $ | — | | | | $ | (1,536 | ) |
Foreign exchange contracts | | | | (116,910 | ) | | | | 401,164 | | | | | — | | | | | 988,946 | | | | | — | |
Interest rate contracts | | | | — | | | | | — | | | | | 80,069 | | | | | — | | | | | (66,958 | ) |
| | | | | | | | | | | | | | | | | | | | | | | | | |
| | | | | |
Total | | | $ | (116,910 | ) | | | $ | 401,164 | | | | $ | 80,069 | | | | $ | 988,946 | | | | $ | (68,494 | ) |
| | | | | | | | | | | | | | | | | | | | | | | | | |
| (1) | Included in net realized gain (loss) on investment transactions in the Statement of Operations. |
| | | | | | | | | | | | | | | | | | | | | | | | | |
Change in Unrealized Appreciation (Depreciation) on Derivatives Recognized in Income | |
| | | | | |
Derivatives not accounted for as hedging instruments, carried at fair value | | Options Purchased(2) | | Options Written | | Futures | | Forward & Cross Currency Exchange Contracts | | Swaps |
| | | | | |
Credit contracts | | | $ | — | | | | $ | — | | | | $ | — | | | | $ | — | | | | $ | 14,717 | |
Foreign exchange contracts | | | | 11,317 | | | | | (551 | ) | | | | — | | | | | (84,104 | ) | | | | — | |
Interest rate contracts | | | | — | | | | | — | | | | | 160,391 | | | | | — | | | | | (78,141 | ) |
| | | | | | | | | | | | | | | | | | | | | | | | | |
| | | | | |
Total | | | $ | 11,317 | | | | $ | (551 | ) | | | $ | 160,391 | | | | $ | (84,104 | ) | | | $ | (63,424 | ) |
| | | | | | | | | | | | | | | | | | | | | | | | | |
| (2) | Included in net change in unrealized appreciation (depreciation) on investments in the Statement of Operations. |
See Notes to Financial Statements.
PGIM Emerging Markets Debt Hard Currency Fund 55
Schedule of Investments (continued)
as of October 31, 2021
For the year ended October 31, 2021, the Fund’s average volume of derivative activities is as follows:
| | | | | | | | |
Options Purchased(1) | | Options Written(2) | | Futures Contracts— Long Positions(2) | | Futures Contracts— Short Positions(2) | | Forward Foreign Currency Exchange Contracts—Purchased(3) |
| | | | |
$49,864 | | $6,657,984 | | $17,559,982 | | $18,715,922 | | $28,965,145 |
| | | | | | | | | | | | |
Forward Foreign Currency Exchange Contracts - Sold(3) | | | | Cross Currency Exchange Contracts(4) | | | | Interest Rate Swap Agreements(2) | | | | Credit Default Swap Agreements— Buy Protection(2) |
| | | | | | |
$33,900,687 | | | | $343,948 | | | | $3,850,317 | | | | $752,000 |
| (2) | Notional Amount in USD. |
| (3) | Value at Settlement Date. |
Average volume is based on average quarter end balances as noted for the year ended October 31, 2021.
Financial Instruments/Transactions—Summary of Offsetting and Netting Arrangements:
The Fund invested in OTC derivatives during the reporting period that are either offset in accordance with current requirements or are subject to enforceable master netting arrangements or similar agreements that permit offsetting. The information about offsetting and related netting arrangements for OTC derivatives where the legal right to set-off exists is presented in the summary below.
Offsetting of OTC derivative assets and liabilities:
| | | | | | | | | | | | | | | | | | | | | | | | | | | | | | | | | | | | | | | | | | | | | | | | | | | | | | |
Counterparty | | Gross Amounts of
Recognized
Assets(1) | | | Gross Amounts of
Recognized
Liabilities(1) | | | Net Amounts of
Recognized
Assets/(Liabilities) | | | Collateral
Pledged/(Received)(2) | | Net Amount | |
| | | | | | | | | | | | | | | |
Bank of America, N.A. | | | | | | $ | — | | | | | | | | | | | $ | (7,557 | ) | | | | | | | | | | $ | (7,557 | ) | | | | | | | | | | $— | | | | | | $ | (7,557 | ) | | | | |
| | | | | | | | | | | | | | | |
Barclays Bank PLC | | | | | | | 131,271 | | | | | | | | | | | | (20,844 | ) | | | | | | | | | | | 110,427 | | | | | | | | | | | — | | | | | | | 110,427 | | | | | |
| | | | | | | | | | | | | | | |
BNP Paribas S.A. | | | | | | | 34,154 | | | | | | | | | | | | (10,592 | ) | | | | | | | | | | | 23,562 | | | | | | | | | | | — | | | | | | | 23,562 | | | | | |
| | | | | | | | | | | | | | | |
Citibank, N.A. | | | | | | | 49,206 | | | | | | | | | | | | (61,825 | ) | | | | | | | | | | | (12,619 | ) | | | | | | | | | | — | | | | | | | (12,619 | ) | | | | |
| | | | | | | | | | | | | | | |
Credit Suisse International | | | | | | | 5,498 | | | | | | | | | | | | (36,898 | ) | | | | | | | | | | | (31,400 | ) | | | | | | | | | | — | | | | | | | (31,400 | ) | | | | |
| | | | | | | | | | | | | | | |
Deutsche Bank AG | | | | | | | — | | | | | | | | | | | | (1,813 | ) | | | | | | | | | | | (1,813 | ) | | | | | | | | | | — | | | | | | | (1,813 | ) | | | | |
| | | | | | | | | | | | | | | |
Goldman Sachs International | | | | | | | 108,567 | | | | | | | | | | | | (89,348 | ) | | | | | | | | | | | 19,219 | | | | | | | | | | | — | | | | | | | 19,219 | | | | | |
| | | | | | | | | | | | | | | |
HSBC Bank PLC | | | | | | | 97,242 | | | | | | | | | | | | (17,868 | ) | | | | | | | | | | | 79,374 | | | | | | | | | | | — | | | | | | | 79,374 | | | | | |
| | | | | | | | | | | | | | | |
JPMorgan Chase Bank, N.A. | | | | | | | 76,958 | | | | | | | | | | | | (96,218 | ) | | | | | | | | | | | (19,260 | ) | | | | | | | | | | — | | | | | | | (19,260 | ) | | | | |
See Notes to Financial Statements.
56
| | | | | | | | | | | | | | | | | | | | | | | | | | | | | | | | | | | | | | | | | | | | | | | | | | | | | | | | | | | | |
Counterparty | | Gross Amounts of
Recognized
Assets(1) | | | Gross Amounts of
Recognized
Liabilities(1) | | | Net Amounts of
Recognized
Assets/(Liabilities) | | | Collateral
Pledged/(Received)(2) | | | Net Amount | |
| | | | | | | | | | | | | | | |
| Morgan Stanley & Co. International PLC | | | | | | $ | 79,953 | | | | | | | | | | | $ | (76,448 | ) | | | | | | | | | | $ | 3,505 | | | | | | | | | | | $ | — | | | | | | | | | | | $ | 3,505 | | | | | |
| | | | | | | | | | | | | | | |
Standard Chartered Bank | | | | | | | 25,820 | | | | | | | | | | | | (17,104 | ) | | | | | | | | | | | 8,716 | | | | | | | | | | | | — | | | | | | | | | | | | 8,716 | | | | | |
| | | | | | | | | | | | | | | |
UBS AG | | | | | | | 5,700 | | | | | | | | | | | | (17,943 | ) | | | | | | | | | | | (12,243 | ) | | | | | | | | | | | — | | | | | | | | | | | | (12,243 | ) | | | | |
| | | | | | | | | | | | | | | | | | | | | | | | | | | | | | | | | | | | | | | | | | | | | | | | | | | | | | | | | | | | |
| | | | | | $ | 614,369 | | | | | | | | | | | $ | (454,458 | ) | | | | | | | | | | $ | 159,911 | | | | | | | | | | | $ | — | | | | | | | | | | | $ | 159,911 | | | | | |
| | | | | | | | | | | | | | | | | | | | | | | | | | | | | | | | | | | | | | | | | | | | | | | | | | | | | | | | | | | | |
| (1) | Includes unrealized appreciation/(depreciation) on swaps and forwards, premiums paid/(received) on swap agreements and market value of purchased and written options, as represented on the Statement of Assets and Liabilities. |
| (2) | Collateral amount disclosed by the Fund is limited to the market value of financial instruments/transactions and the Fund’s OTC derivative exposure by counterparty. |
See Notes to Financial Statements.
PGIM Emerging Markets Debt Hard Currency Fund 57
Statement of Assets and Liabilities
as of October 31, 2021
| | | | |
| |
Assets | | | | |
| |
Investments at value: | | | | |
Unaffiliated investments (cost $141,605,516) | | $ | 140,206,386 | |
Affiliated investments (cost $12,463,160) | | | 12,463,160 | |
Foreign currency, at value (cost $44,796) | | | 44,998 | |
Receivable for Fund shares sold | | | 5,446,631 | |
Dividends and interest receivable | | | 1,854,788 | |
Deposit with broker for centrally cleared/exchange-traded derivatives | | | 700,000 | |
Unrealized appreciation on OTC forward foreign currency exchange contracts | | | 411,689 | |
Due from broker—variation margin futures | | | 62,757 | |
Premiums paid for OTC swap agreements | | | 51,272 | |
Due from broker—variation margin swaps | | | 6,899 | |
Receivable for investments sold | | | 5,334 | |
Prepaid expenses and other assets | | | 17,713 | |
| | | | |
| |
Total Assets | | | 161,271,627 | |
| | | | |
| |
Liabilities | | | | |
| |
Payable for investments purchased | | | 4,730,407 | |
Payable for Fund shares purchased | | | 1,480,332 | |
Unrealized depreciation on OTC forward foreign currency exchange contracts | | | 360,001 | |
Options written outstanding, at value (premiums received $93,937) | | | 94,391 | |
Accrued expenses and other liabilities | | | 90,248 | |
Management fee payable | | | 65,760 | |
Dividends payable | | | 24,495 | |
Affiliated transfer agent fee payable | | | 1,671 | |
Directors’ fees payable | | | 899 | |
Unrealized depreciation on OTC swap agreements | | | 66 | |
Distribution fee payable | | | 21 | |
| | | | |
| |
Total Liabilities | | | 6,848,291 | |
| | | | |
| |
Net Assets | | $ | 154,423,336 | |
| | | | |
| |
| | | | | |
| |
Net assets were comprised of: | | | | |
Common stock, at par | | $ | 170 | |
Paid-in capital in excess of par | | | 157,514,218 | |
Total distributable earnings (loss) | | | (3,091,052 | ) |
| | | | |
| |
Net assets, October 31, 2021 | | $ | 154,423,336 | |
| | | | |
See Notes to Financial Statements.
58
| | | | |
| |
Class A | | | | |
| |
Net asset value, offering price and redemption price per share, ($58,830 ÷ 6,496 shares of beneficial interest issued and outstanding) | | $ | 9.06 | |
Maximum sales charge (3.25% of offering price) | | | 0.30 | |
| | | | |
Maximum offering price to public | | $ | 9.36 | |
| | | | |
| |
Class C | | | | |
| |
Net asset value, offering price and redemption price per share, ($10,735 ÷ 1,186 shares of beneficial interest issued and outstanding) | | $ | 9.06 | |
| | | | |
| |
Class Z | | | | |
| |
Net asset value, offering price and redemption price per share, ($18,068,633 ÷ 1,993,821 shares of beneficial interest issued and outstanding) | | $ | 9.06 | |
| | | | |
| |
Class R6 | | | | |
| |
Net asset value, offering price and redemption price per share, ($136,285,138 ÷ 15,046,091 shares of beneficial interest issued and outstanding) | | $ | 9.06 | |
| | | | |
Net Asset Values Per Share may not recalculate due to rounding.
See Notes to Financial Statements.
PGIM Emerging Markets Debt Hard Currency Fund 59
Statement of Operations
Year Ended October 31, 2021
| | | | |
| |
Net Investment Income (Loss) | | | | |
| |
Income | | | | |
Interest income (net of $12,298 foreign withholding tax) | | $ | 6,518,300 | |
Affiliated dividend income | | | 5,026 | |
Affiliated income from securities lending, net | | | 121 | |
| | | | |
| |
Total income | | | 6,523,447 | |
| | | | |
Expenses | | | | |
Management fee | | | 868,308 | |
Distribution fee(a) | | | 226 | |
Custodian and accounting fees | | | 78,694 | |
Transfer agent’s fees and expenses (including affiliated expense of $10,113)(a) | | | 55,495 | |
Registration fees(a) | | | 41,138 | |
Audit fee | | | 39,531 | |
Legal fees and expenses | | | 20,732 | |
Shareholders’ reports | | | 19,119 | |
Directors’ fees | | | 11,520 | |
SEC registration fees | | | 4,963 | |
Miscellaneous | | | 21,693 | |
| | | | |
| |
Total expenses | | | 1,161,419 | |
Less: Fee waiver and/or expense reimbursement(a) | | | (267,237 | ) |
| | | | |
| |
Net expenses | | | 894,182 | |
| | | | |
| |
Net investment income (loss) | | | 5,629,265 | |
| | | | |
| |
Realized And Unrealized Gain (Loss) On Investment And Foreign Currency Transactions | | | | |
| |
Net realized gain (loss) on: | | | | |
Investment transactions (including affiliated of $(201)) | | | (404,709 | ) |
Futures transactions | | | 80,069 | |
Forward and cross currency contract transactions | | | 988,946 | |
Options written transactions | | | 401,164 | |
Swap agreement transactions | | | (68,494 | ) |
Foreign currency transactions | | | (151,459 | ) |
| | | | |
| |
| | | 845,517 | |
| | | | |
Net change in unrealized appreciation (depreciation) on: | | | | |
Investments | | | 1,845,760 | |
Futures | | | 160,391 | |
Forward and cross currency contracts | | | (84,104 | ) |
Options written | | | (551 | ) |
Swap agreements | | | (63,424 | ) |
Foreign currencies | | | 33,557 | |
| | | | |
| |
| | | 1,891,629 | |
| | | | |
| |
Net gain (loss) on investment and foreign currency transactions | | | 2,737,146 | |
| | | | |
| |
Net Increase (Decrease) In Net Assets Resulting From Operations | | $ | 8,366,411 | |
| | | | |
See Notes to Financial Statements.
60
| (a) | Class specific expenses and waivers were as follows: |
| | | | | | | | | | | | | | | | | | | | |
| | | Class A | | Class C | | Class Z | | Class R6 |
Distribution fee | | | | 118 | | | | | 108 | | | | | — | | | | | — | |
Transfer agent’s fees and expenses | | | | 308 | | | | | 43 | | | | | 54,827 | | | | | 317 | |
Registration fees | | | | 8,231 | | | | | 8,231 | | | | | 16,346 | | | | | 8,330 | |
Fee waiver and/or expense reimbursement | | | | (8,538 | ) | | | | (8,274 | ) | | | | (82,965 | ) | | | | (167,460 | ) |
See Notes to Financial Statements.
PGIM Emerging Markets Debt Hard Currency Fund 61
Statements of Changes in Net Assets
| | | | | | | | |
| |
| | | Year Ended October 31, | |
| | | | |
| | |
| | | 2021 | | | 2020 | |
| | |
Increase (Decrease) in Net Assets | �� | | | | | | | |
| | |
Operations | | | | | | | | |
Net investment income (loss) | | $ | 5,629,265 | | | $ | 1,898,277 | |
Net realized gain (loss) on investment and foreign currency transactions | | | 845,517 | | | | (968,569 | ) |
Net change in unrealized appreciation (depreciation) on investments and foreign currencies | | | 1,891,629 | | | | (2,644,924 | ) |
| | | | | | | | |
| | |
Net increase (decrease) in net assets resulting from operations | | | 8,366,411 | | | | (1,715,216 | ) |
| | | | | | | | |
| | |
Dividends and Distributions | | | | | | | | |
Distributions from distributable earnings | | | | | | | | |
Class A | | | (2,106 | ) | | | (875 | ) |
Class C | | | (397 | ) | | | (450 | ) |
Class Z | | | (1,206,404 | ) | | | (567,453 | ) |
Class R6 | | | (5,228,489 | ) | | | (1,662,605 | ) |
| | | | | | | | |
| | |
| | | (6,437,396 | ) | | | (2,231,383 | ) |
| | | | | | | | |
| | |
Fund share transactions (Net of share conversions) | | | | | | | | |
Net proceeds from shares sold | | | 81,696,730 | | | | 92,242,382 | |
Net asset value of shares issued in reinvestment of dividends and distributions | | | 6,292,008 | | | | 2,227,284 | |
Cost of shares purchased | | | (52,285,699 | ) | | | (6,029,574 | ) |
| | | | | | | | |
| | |
Net increase (decrease) in net assets from Fund share transactions | | | 35,703,039 | | | | 88,440,092 | |
| | | | | | | | |
Total increase (decrease) | | | 37,632,054 | | | | 84,493,493 | |
| | |
Net Assets: | | | | | | | | |
| | |
Beginning of year | | | 116,791,282 | | | | 32,297,789 | |
| | | | | | | | |
| | |
End of year | | $ | 154,423,336 | | | $ | 116,791,282 | |
| | | | | | | | |
See Notes to Financial Statements.
62
Financial Highlights
| | | | | | | | | | | | | | | | | | | | | | | | | | | |
| | | | | | | |
Class A Shares | | | | | | | | | | | | | | | | | | | | | | | | | | | |
| | | Year Ended October 31, | | | | December 12, 2017(a)
through October 31,
2018 | | |
| | | 2021 | | 2020 | | 2019 | | | | |
| | | | | | | |
Per Share Operating Performance(b): | | | | | | | | | | | | | | | | | | | | | | | | | | | |
| | | | | | | |
Net Asset Value, Beginning of Period | | | | $8.86 | | | | | $9.51 | | | | | $8.88 | | | | | | | $10.00 | | | | | | |
| | | | | | | |
Income (loss) from investment operations: | | | | | | | | | | | | | | | | | | | | | | | | | | | |
| | | | | | | |
Net investment income (loss) | | | | 0.36 | | | | | 0.38 | | | | | 0.46 | | | | | | | 0.38 | | | �� | | | |
| | | | | | | |
| Net realized and unrealized gain (loss) on investment and foreign currency transactions | | | | 0.25 | | | | | (0.56 | ) | | | | 0.69 | | | | | | | (1.06 | ) | | | | | |
| | | | | | | |
Total from investment operations | | | | 0.61 | | | | | (0.18 | ) | | | | 1.15 | | | | | | | (0.68 | ) | | | | | |
| | | | | | | |
Less Dividends and Distributions: | | | | | | | | | | | | | | | | | | | | | | | | | | | |
| | | | | | | |
Dividends from net investment income | | | | (0.41 | ) | | | | (0.47 | ) | | | | (0.52 | ) | | | | | | (0.43 | ) | | | | | |
| | | | | | | |
Tax return of capital distributions | | | | - | | | | | - | | | | | - | | | | | | | (0.01 | ) | | | | | |
| | | | | | | |
Total dividends and distributions | | | | (0.41 | ) | | | | (0.47 | ) | | | | (0.52 | ) | | | | | | (0.44 | ) | | | | | |
| | | | | | | |
Net asset value, end of period | | | | $9.06 | | | | | $8.86 | | | | | $9.51 | | | | | | | $8.88 | | | | | | |
| | | | | | | |
Total Return(c): | | | | 6.91 | % | | | | (1.82 | )% | | | | 13.23 | % | | | | | | (6.97 | )% | | | | | |
| | | | | | | |
| | | | | | | | | | | | | | | | | | | | | | | | | | | | |
| | | | | | | |
Ratios/Supplemental Data: | | | | | | | | | | | | | | | | | | | | | | | | | | | |
| | | | | | | |
Net assets, end of period (000) | | | | $59 | | | | | $28 | | | | | $13 | | | | | | | $9 | | | | | | |
| | | | | | | |
Average net assets (000) | | | | $47 | | | | | $18 | | | | | $12 | | | | | | | $10 | | | | | | |
| | | | | | | |
Ratios to average net assets(d): | | | | | | | | | | | | | | | | | | | | | | | | | | | |
| | | | | | | |
Expenses after waivers and/or expense reimbursement | | | | 1.05 | % | | | | 1.05 | % | | | | 1.05 | % | | | | | | 1.05 | %(e) | | | | | |
| | | | | | | |
Expenses before waivers and/or expense reimbursement | | | | 19.07 | % | | | | 66.11 | % | | | | 115.95 | % | | | | | | 358.14 | %(e) | | | | | |
| | | | | | | |
Net investment income (loss) | | | | 3.84 | % | | | | 4.19 | % | | | | 4.95 | % | | | | | | 4.49 | %(e) | | | | | |
| | | | | | | |
Portfolio turnover rate(f)(g) | | | | 20 | % | | | | 23 | % | | | | 33 | % | | | | | | 17 | % | | | | | |
| (a) | Commencement of operations. |
| (b) | Calculated based on average shares outstanding during the period. |
| (c) | Total return does not consider the effects of sales loads. Total return is calculated assuming a purchase of a share on the first day and a sale on the last day of each period reported and includes reinvestment of dividends and distributions, if any. Total returns may reflect adjustments to conform to GAAP. Total returns for periods less than one full year are not annualized. |
| (d) | Does not include expenses of the underlying funds in which the Fund invests. |
| (f) | The Fund’s portfolio turnover rate is calculated in accordance with regulatory requirements, without regard to transactions involving short-term investments and certain derivatives. If such transactions were included, the Fund’s portfolio turnover rate may be higher. |
| (g) | Portfolio turnover excludes the value of portfolio securities received or delivered as a result of in-kind fund share transactions (if any). |
See Notes to Financial Statements.
PGIM Emerging Markets Debt Hard Currency Fund 63
Financial Highlights (continued)
| | | | | | | | | | | | | | | | | | | | | | | | | | | |
| | | | | | | |
Class C Shares | | | | | | | | | | | | | | | | | | | | | | | | | | | |
| | | Year Ended October 31, | | | | December 12, 2017(a)
through October 31,
2018 | | |
| | | 2021 | | 2020 | | 2019 | | | | |
| | | | | | | |
Per Share Operating Performance(b): | | | | | | | | | | | | | | | | | | | | | | | | | | | |
| | | | | | | |
Net Asset Value, Beginning of Period | | | | $8.86 | | | | | $9.51 | | | | | $8.88 | | | | | | | $10.00 | | | | | | |
| | | | | | | |
Income (loss) from investment operations: | | | | | | | | | | | | | | | | | | | | | | | | | | | |
| | | | | | | |
Net investment income (loss) | | | | 0.28 | | | | | 0.32 | | | | | 0.39 | | | | | | | 0.31 | | | | | | |
| | | | | | | |
| Net realized and unrealized gain (loss) on investment and foreign currency transactions | | | | 0.26 | | | | | (0.57 | ) | | | | 0.69 | | | | | | | (1.05 | ) | | | | | |
| | | | | | | |
Total from investment operations | | | | 0.54 | | | | | (0.25 | ) | | | | 1.08 | | | | | | | (0.74 | ) | | | | | |
| | | | | | | |
Less Dividends and Distributions: | | | | | | | | | | | | | | | | | | | | | | | | | | | |
| | | | | | | |
Dividends from net investment income | | | | (0.34 | ) | | | | (0.40 | ) | | | | (0.45 | ) | | | | | | (0.37 | ) | | | | | |
| | | | | | | |
Tax return of capital distributions | | | | - | | | | | - | | | | | - | | | | | | | (0.01 | ) | | | | | |
| | | | | | | |
Total dividends and distributions | | | | (0.34 | ) | | | | (0.40 | ) | | | | (0.45 | ) | | | | | | (0.38 | ) | | | | | |
| | | | | | | |
Net asset value, end of period | | | | $9.06 | | | | | $8.86 | | | | | $9.51 | | | | | | | $8.88 | | | | | | |
| | | | | | | |
Total Return(c): | | | | 6.11 | % | | | | (2.55 | )% | | | | 12.40 | % | | | | | | (7.58 | )% | | | | | |
| | | | | | | |
| | | | | | | | | | | | | | | | | | | | | | | | | | | | |
| | | | | | | |
Ratios/Supplemental Data: | | | | | | | | | | | | | | | | | | | | | | | | | | | |
| | | | | | | |
Net assets, end of period (000) | | | | $11 | | | | | $10 | | | | | $10 | | | | | | | $9 | | | | | | |
| | | | | | | |
Average net assets (000) | | | | $11 | | | | | $10 | | | | | $10 | | | | | | | $10 | | | | | | |
| | | | | | | |
Ratios to average net assets(d): | | | | | | | | | | | | | | | | | | | | | | | | | | | |
| | | | | | | |
Expenses after waivers and/or expense reimbursement | | | | 1.80 | % | | | | 1.80 | % | | | | 1.80 | % | | | | | | 1.80 | %(e) | | | | | |
| | | | | | | |
Expenses before waivers and/or expense reimbursement | | | | 78.90 | % | | | | 114.46 | % | | | | 139.02 | % | | | | | | 359.95 | %(e) | | | | | |
| | | | | | | |
Net investment income (loss) | | | | 3.08 | % | | | | 3.56 | % | | | | 4.22 | % | | | | | | 3.73 | %(e) | | | | | |
| | | | | | | |
Portfolio turnover rate(f)(g) | | | | 20 | % | | | | 23 | % | | | | 33 | % | | | | | | 17 | % | | | | | |
| (a) | Commencement of operations. |
| (b) | Calculated based on average shares outstanding during the period. |
| (c) | Total return does not consider the effects of sales loads. Total return is calculated assuming a purchase of a share on the first day and a sale on the last day of each period reported and includes reinvestment of dividends and distributions, if any. Total returns may reflect adjustments to conform to GAAP. Total returns for periods less than one full year are not annualized. |
| (d) | Does not include expenses of the underlying funds in which the Fund invests. |
| (f) | The Fund’s portfolio turnover rate is calculated in accordance with regulatory requirements, without regard to transactions involving short-term investments and certain derivatives. If such transactions were included, the Fund’s portfolio turnover rate may be higher. |
| (g) | Portfolio turnover excludes the value of portfolio securities received or delivered as a result of in-kind fund share transactions (if any). |
See Notes to Financial Statements.
64
| | | | | | | | | | | | | | | | | | | | | | | | | | | |
| | | | | | | |
Class Z Shares | | | | | | | | | | | | | | | | | | | | | | | | | | | |
| | | Year Ended October 31, | | | | December 12, 2017(a)
through October 31,
2018 | | |
| | | 2021 | | 2020 | | 2019 | | | | |
| | | | | | | |
Per Share Operating Performance(b): | | | | | | | | | | | | | | | | | | | | | | | | | | | |
Net Asset Value, Beginning of Period | | | | $8.87 | | | | | $9.51 | | | | | $8.88 | | | | | | | $10.00 | | | | | | |
| | | | | | | |
Income (loss) from investment operations: | | | | | | | | | | | | | | | | | | | | | | | | | | | |
| | | | | | | |
Net investment income (loss) | | | | 0.38 | | | | | 0.40 | | | | | 0.48 | | | | | | | 0.39 | | | | | | |
| | | | | | | |
| Net realized and unrealized gain (loss) on investment and foreign currency transactions | | | | 0.25 | | | | | (0.54 | ) | | | | 0.69 | | | | | | | (1.05 | ) | | | | | |
| | | | | | | |
Total from investment operations | | | | 0.63 | | | | | (0.14 | ) | | | | 1.17 | | | | | | | (0.66 | ) | | | | | |
| | | | | | | |
Less Dividends and Distributions: | | | | | | | | | | | | | | | | | | | | | | | | | | | |
| | | | | | | |
Dividends from net investment income | | | | (0.44 | ) | | | | (0.50 | ) | | | | (0.54 | ) | | | | | | (0.45 | ) | | | | | |
| | | | | | | |
Tax return of capital distributions | | | | - | | | | | - | | | | | - | | | | | | | (0.01 | ) | | | | | |
| | | | | | | |
Total dividends and distributions | | | | (0.44 | ) | | | | (0.50 | ) | | | | (0.54 | ) | | | | | | (0.46 | ) | | | | | |
| | | | | | | |
Net asset value, end of period | | | | $9.06 | | | | | $8.87 | | | | | $9.51 | | | | | | | $8.88 | | | | | | |
| | | | | | | |
Total Return(c): | | | | 7.11 | % | | | | (1.43 | )% | | | | 13.51 | % | | | | | | (6.79 | )% | | | | | |
| | | | | | | |
| | | | | | | | | | | | | | | | | | | | | | | | | | | | |
| | | | | | | |
Ratios/Supplemental Data: | | | | | | | | | | | | | | | | | | | | | | | | | | | |
| | | | | | | |
Net assets, end of period (000) | | | | $18,069 | | | | | $18,982 | | | | | $5,782 | | | | | | | $2,234 | | | | | | |
| | | | | | | |
Average net assets (000) | | | | $25,561 | | | | | $10,951 | | | | | $3,498 | | | | | | | $766 | | | | | | |
| | | | | | | |
Ratios to average net assets(d): | | | | | | | | | | | | | | | | | | | | | | | | | | | |
| | | | | | | |
Expenses after waivers and/or expense reimbursement | | | | 0.75 | % | | | | 0.75 | % | | | | 0.80 | % | | | | | | 0.80 | %(e) | | | | | |
| | | | | | | |
Expenses before waivers and/or expense reimbursement | | | | 1.07 | % | | | | 1.53 | % | | | | 2.41 | % | | | | | | 6.65 | %(e) | | | | | |
| | | | | | | |
Net investment income (loss) | | | | 4.12 | % | | | | 4.45 | % | | | | 5.12 | % | | | | | | 4.83 | %(e) | | | | | |
| | | | | | | |
Portfolio turnover rate(f)(g) | | | | 20 | % | | | | 23 | % | | | | 33 | % | | | | | | 17 | % | | | | | |
| (a) | Commencement of operations. |
| (b) | Calculated based on average shares outstanding during the period. |
| (c) | Total return is calculated assuming a purchase of a share on the first day and a sale on the last day of each period reported and includes reinvestment of dividends and distributions, if any. Total returns may reflect adjustments to conform to GAAP. Total returns for periods less than one full year are not annualized. |
| (d) | Does not include expenses of the underlying funds in which the Fund invests. |
| (f) | The Fund’s portfolio turnover rate is calculated in accordance with regulatory requirements, without regard to transactions involving short-term investments and certain derivatives. If such transactions were included, the Fund’s portfolio turnover rate may be higher. |
| (g) | Portfolio turnover excludes the value of portfolio securities received or delivered as a result of in-kind fund share transactions (if any). |
See Notes to Financial Statements.
PGIM Emerging Markets Debt Hard Currency Fund 65
Financial Highlights (continued)
| | | | | | | | | | | | | | | | | | | | | | | | | | | |
| | |
Class R6 Shares | | | | | | |
| | | | | |
| | | Year Ended October 31, | | | | December 12, 2017(a)
through October 31,
2018 | | |
| | | 2021 | | 2020 | | 2019 | | | | |
| | | | | | | |
Per Share Operating Performance(b): | | | | | | | | | | | | | | | | | | | | | | | | | | | |
| | | | | | | |
Net Asset Value, Beginning of Period | | | | $8.86 | | | | | $9.51 | | | | | $8.88 | | | | | | | $10.00 | | | | | | |
| | | | | | | |
Income (loss) from investment operations: | | | | | | | | | | | | | | | | | | | | | | | | | | | |
| | | | | | | |
Net investment income (loss) | | | | 0.39 | | | | | 0.43 | | | | | 0.49 | | | | | | | 0.40 | | | | | | |
| | | | | | | |
| Net realized and unrealized gain (loss) on investment and foreign currency transactions | | | | 0.26 | | | | | (0.57 | ) | | | | 0.69 | | | | | | | (1.06 | ) | | | | | |
| | | | | | | |
Total from investment operations | | | | 0.65 | | | | | (0.14 | ) | | | | 1.18 | | | | | | | (0.66 | ) | | | | | |
Less Dividends and Distributions: | | | | | | | | | | | | | | | | | | | | | | | | | | | |
| | | | | | | |
Dividends from net investment income | | | | (0.45 | ) | | | | (0.51 | ) | | | | (0.55 | ) | | | | | | (0.45 | ) | | | | | |
| | | | | | | |
Tax return of capital distributions | | | | - | | | | | - | | | | | - | | | | | | | (0.01 | ) | | | | | |
| | | | | | | |
Total dividends and distributions | | | | (0.45 | ) | | | | (0.51 | ) | | | | (0.55 | ) | | | | | | (0.46 | ) | | | | | |
| | | | | | | |
Net asset value, end of period | | | | $9.06 | | | | | $8.86 | | | | | $9.51 | | | | | | | $8.88 | | | | | | |
| | | | | | | |
Total Return(c): | | | | 7.34 | % | | | | (1.44 | )% | | | | 13.58 | % | | | | | | (6.72 | )% | | | | | |
| | | | | | | | | | | | | | | | | | | | | | | | | | | | |
| | | | | | | |
Ratios/Supplemental Data: | | | | | | | | | | | | | | | | | | | | | | | | | | | |
| | | | | | | |
Net assets, end of period (000) | | | | $136,285 | | | | | $97,771 | | | | | $26,493 | | | | | | | $23,333 | | | | | | |
| | | | | | | |
Average net assets (000) | | | | $107,966 | | | | | $30,037 | | | | | $25,144 | | | | | | | $24,014 | | | | | | |
| | | | | | | |
Ratios to average net assets(d): | | | | | | | | | | | | | | | | | | | | | | | | | | | |
| | | | | | | |
Expenses after waivers and/or expense reimbursement | | | | 0.65 | % | | | | 0.66 | % | | | | 0.74 | % | | | | | | 0.74 | %(e) | | | | | |
| | | | | | | |
Expenses before waivers and/or expense reimbursement | | | | 0.81 | % | | | | 1.16 | % | | | | 1.49 | % | | | | | | 1.76 | %(e) | | | | | |
| | | | | | | |
Net investment income (loss) | | | | 4.24 | % | | | | 4.69 | % | | | | 5.27 | % | | | | | | 4.82 | %(e) | | | | | |
| | | | | | | |
Portfolio turnover rate(f)(g) | | | | 20 | % | | | | 23 | % | | | | 33 | % | | | | | | 17 | % | | | | | |
| (a) | Commencement of operations. |
| (b) | Calculated based on average shares outstanding during the period. |
| (c) | Total return is calculated assuming a purchase of a share on the first day and a sale on the last day of each period reported and includes reinvestment of dividends and distributions, if any. Total returns may reflect adjustments to conform to GAAP. Total returns for periods less than one full year are not annualized. |
| (d) | Does not include expenses of the underlying funds in which the Fund invests. |
| (f) | The Fund’s portfolio turnover rate is calculated in accordance with regulatory requirements, without regard to transactions involving short-term investments and certain derivatives. If such transactions were included, the Fund’s portfolio turnover rate may be higher. |
| (g) | Portfolio turnover excludes the value of portfolio securities received or delivered as a result of in-kind fund share transactions (if any). |
See Notes to Financial Statements.
66
Notes to Financial Statements
Prudential World Fund, Inc. (the “Registered Investment Company” or “RIC”) is registered under the Investment Company Act of 1940, as amended (“1940 Act”), as an open-end management investment company. The RIC is organized as a Maryland Corporation and currently consists of seven separate funds: PGIM Emerging Markets Debt Hard Currency Fund, PGIM Emerging Markets Debt Local Currency Fund, PGIM Jennison Emerging Markets Equity Opportunities Fund, PGIM Jennison Global Infrastructure Fund, PGIM Jennison Global Opportunities Fund, PGIM Jennison International Opportunities Fund and PGIM QMA International Equity Fund. These financial statements relate only to the PGIM Emerging Markets Debt Hard Currency Fund (the “Fund”). The Fund is classified as a diversified fund for purposes of the 1940 Act.
The investment objective of the Fund is total return, through a combination of current income and capital appreciation.
The Fund follows the investment company accounting and reporting guidance of the Financial Accounting Standards Board (“FASB”) Accounting Standard Codification (“ASC”) Topic 946 Financial Services — Investment Companies. The following is a summary of significant accounting policies followed by the Fund in the preparation of its financial statements. The policies conform to U.S. generally accepted accounting principles (“GAAP”). The Fund consistently follows such policies in the preparation of its financial statements.
Securities Valuation: The Fund holds securities and other assets and liabilities that are fair valued as of the close of each day (generally, 4:00 PM Eastern time) the New York Stock Exchange (“NYSE”) is open for trading. As described in further detail below, the Fund’s investments are valued daily based on a number of factors, including the type of investment and whether market quotations are readily available. The RIC’s Board of Directors (the “Board”) has adopted valuation procedures for security valuation under which fair valuation responsibilities have been delegated to PGIM Investments LLC (“PGIM Investments” or the “Manager”). Pursuant to the Board’s delegation, the Manager has established a Valuation Committee responsible for supervising the fair valuation of portfolio securities and other assets and liabilities. The valuation procedures permit the Fund to utilize independent pricing vendor services, quotations from market makers, and alternative valuation methods when market quotations are either not readily available or not deemed representative of fair value. Fair value is the price that would be received to sell an asset or paid to transfer a liability in an orderly transaction between market participants on the measurement date. A record of the Valuation Committee’s actions is subject to the Board’s review at its first quarterly meeting following the quarter in which such actions take place.
PGIM Emerging Markets Debt Hard Currency Fund 67
Notes to Financial Statements (continued)
For the fiscal reporting year-end, securities and other assets and liabilities were fair valued at the close of the last U.S. business day. Trading in certain foreign securities may occur when the NYSE is closed (including weekends and holidays). Because such foreign securities trade in markets that are open on weekends and U.S. holidays, the values of some of the Fund’s foreign investments may change on days when investors cannot purchase or redeem Fund shares.
Various inputs determine how the Fund’s investments are valued, all of which are categorized according to the three broad levels (Level 1, 2, or 3) detailed in the Schedule of Investments and referred to herein as the “fair value hierarchy” in accordance with FASB ASC Topic 820 - Fair Value Measurements and Disclosures.
Common or preferred stocks, exchange-traded funds and derivative instruments, if applicable, that are traded on a national securities exchange are valued at the last sale price as of the close of trading on the applicable exchange where the security principally trades. Securities traded via NASDAQ are valued at the NASDAQ official closing price. To the extent these securities are valued at the last sale price or NASDAQ official closing price, they are classified as Level 1 in the fair value hierarchy. In the event that no sale or official closing price on valuation date exists, these securities are generally valued at the mean between the last reported bid and ask prices, or at the last bid price in the absence of an ask price. These securities are classified as Level 2 in the fair value hierarchy.
Investments in open-end funds (other than exchange-traded funds) are valued at their net asset values as of the close of the NYSE on the date of valuation. These securities are classified as Level 1 in the fair value hierarchy since they may be purchased or sold at their net asset values on the date of valuation.
Fixed income securities traded in the OTC market are generally classified as Level 2 in the fair value hierarchy. Such fixed income securities are typically valued using the market approach which generally involves obtaining data from an approved independent third-party vendor source. The Fund utilizes the market approach as the primary method to value securities when market prices of identical or comparable instruments are available. The third-party vendors’ valuation techniques used to derive the evaluated bid price are based on evaluating observable inputs, including but not limited to, yield curves, yield spreads, credit ratings, deal terms, tranche level attributes, default rates, cash flows, prepayment speeds, broker/dealer quotations and reported trades. Certain Level 3 securities are also valued using the market approach when obtaining a single broker quote or when utilizing transaction prices for identical securities that have been used in excess of five business days. During the reporting period, there were no changes to report with respect to the valuation approach and/or valuation techniques discussed above.
68
OTC and centrally cleared derivative instruments are generally classified as Level 2 in the fair value hierarchy. Such derivative instruments are typically valued using the market approach and/or income approach which generally involves obtaining data from an approved independent third-party vendor source. The Fund utilizes the market approach when quoted prices in broker-dealer markets are available but also includes consideration of alternative valuation approaches, including the income approach. In the absence of reliable market quotations, the income approach is typically utilized for purposes of valuing derivatives such as interest rate swaps based on a discounted cash flow analysis whereby the value of the instrument is equal to the present value of its future cash inflows or outflows. Such analysis includes projecting future cash flows and determining the discount rate (including the present value factors that affect the discount rate) used to discount the future cash flows. In addition, the third-party vendors’ valuation techniques used to derive the evaluated derivative price is based on evaluating observable inputs, including but not limited to, underlying asset prices, indices, spreads, interest rates and exchange rates. Certain derivatives may be classified as Level 3 when valued using the market approach by obtaining a single broker quote or when utilizing unobservable inputs in the income approach. During the reporting period, there were no changes to report with respect to the valuation approach and/or valuation techniques discussed above.
Securities and other assets that cannot be priced according to the methods described above are valued based on pricing methodologies approved by the Board. In the event that unobservable inputs are used when determining such valuations, the securities will be classified as Level 3 in the fair value hierarchy. Altering one or more unobservable inputs may result in a significant change to a Level 3 security’s fair value measurement.
When determining the fair value of securities, some of the factors influencing the valuation include: the nature of any restrictions on disposition of the securities; assessment of the general liquidity of the securities; the issuer’s financial condition and the markets in which it does business; the cost of the investment; the size of the holding and the capitalization of the issuer; the prices of any recent transactions or bids/offers for such securities or any comparable securities; any available analyst media or other reports or information deemed reliable by the Manager regarding the issuer or the markets or industry in which it operates. Using fair value to price securities may result in a value that is different from a security’s most recent closing price and from the price used by other unaffiliated mutual funds to calculate their net asset values.
Foreign Currency Translation: The books and records of the Fund are maintained in U.S. dollars. Foreign currency amounts are translated into U.S. dollars on the following basis:
(i) market value of investment securities, other assets and liabilities — at the exchange rate as of the valuation date;
(ii) purchases and sales of investment securities, income and expenses — at the rates of exchange prevailing on the respective dates of such transactions.
PGIM Emerging Markets Debt Hard Currency Fund 69
Notes to Financial Statements (continued)
Although the net assets of the Fund are presented at the foreign exchange rates and market values at the close of the period, the Fund does not generally isolate that portion of the results of operations arising as a result of changes in the foreign exchange rates from the fluctuations arising from changes in the market prices of long-term portfolio securities held at the end of the period. Similarly, the Fund does not isolate the effect of changes in foreign exchange rates from the fluctuations arising from changes in the market prices of long-term portfolio securities sold during the period. Accordingly, holding period unrealized and realized foreign currency gains (losses) are included in the reported Net change in unrealized appreciation (depreciation) on investments and Net realized gains (losses) on investment transactions on the Statements of Operations. Notwithstanding the above, the Fund does isolate the effect of fluctuations in foreign currency exchange rates when determining the gain (loss) upon the sale or maturity of foreign currency denominated debt obligations; such amounts are included in net
Additionally, net realized gains (losses) on foreign currency transactions represent net foreign exchange gains (losses) from the disposition of holdings of foreign currencies, currency gains (losses) realized between the trade and settlement dates on investment transactions, and the difference between the amounts of interest, dividends and foreign withholding taxes recorded on the Fund’s books and the U.S. dollar equivalent amounts actually received or paid. Net unrealized currency gains (losses) arise from valuing foreign currency denominated assets and liabilities (other than investments) at period end exchange rates.
Forward and Cross Currency Contracts: A forward currency contract is a commitment to purchase or sell a foreign currency at a future date at a negotiated forward rate. The Fund enters into forward currency contracts, as defined in the prospectus, in order to hedge its exposure to changes in foreign currency exchange rates on its foreign portfolio holdings or on specific receivables and payables denominated in a foreign currency and to gain exposure to certain currencies. The contracts are valued daily at current forward exchange rates and any unrealized gain (loss) is included in net unrealized appreciation or depreciation on forward and cross currency contracts. Gain (loss) is realized on the settlement date of the contract equal to the difference between the settlement value of the original and negotiated forward contracts. This gain (loss), if any, is included in net realized gain (loss) on forward and cross currency contract transactions. Risks may arise upon entering into these contracts from the potential inability of the counterparties to meet the terms of their contracts. Forward currency contracts involve risks from currency exchange rate and credit risk in excess of the amounts reflected on the Statement of Assets and Liabilities. The Fund’s maximum risk of loss from counterparty credit risk is the net value of the cash flows to be received from the counterparty at the end of the contract’s life. A cross currency contract is a forward contract where a specified amount of one foreign currency will be exchanged for a specified amount of another foreign currency.
70
Options: The Fund purchased and/or wrote options in order to hedge against adverse market movements or fluctuations in value caused by changes in prevailing interest rates, value of equities or foreign currency exchange rates with respect to securities or financial instruments which the Fund currently owns or intends to purchase. The Fund may also use options to gain additional market exposure. The Fund’s principal reason for writing options is to realize, through receipt of premiums, a greater current return than would be realized on the underlying security alone. When the Fund purchases an option, it pays a premium and an amount equal to that premium is recorded as an asset. When the Fund writes an option, it receives a premium and an amount equal to that premium is recorded as a liability. The asset or liability is adjusted daily to reflect the current market value of the option. If an option expires unexercised, the Fund realizes a gain (loss) to the extent of the premium received or paid. If an option is exercised, the premium received or paid is recorded as an adjustment to the proceeds from the sale or the cost of the purchase in determining whether the Fund has realized a gain (loss). The difference between the premium and the amount received or paid at the closing of a purchase or sale transaction is also treated as a realized gain (loss). Gain (loss) on purchased options is included in net realized gain (loss) on investment transactions. Gain (loss) on written options is presented separately as net realized gain (loss) on options written transactions.
The Fund, as writer of an option, may have no control over whether the underlying securities or financial instruments may be sold (called) or purchased (put). As a result, the Fund bears the market risk of an unfavorable change in the price of the security or financial instrument underlying the written option. The Fund, as purchaser of an OTC option, bears the risk of the potential inability of the counterparties to meet the terms of their contracts. With exchange-traded options contracts, there is minimal counterparty credit risk to the Fund since the exchanges’ clearinghouse acts as counterparty to all exchange-traded options and guarantees the options contracts against default.
When the Fund writes an option on a swap, an amount equal to any premium received by the Fund is recorded as a liability and is subsequently adjusted to the current market value of the written option on the swap. If a call option on a swap is exercised, the Fund becomes obligated to pay a fixed interest rate (noted as the strike price) and receive a variable interest rate on a notional amount. If a put option on a swap is exercised, the Fund becomes obligated to pay a variable interest rate and receive a fixed interest rate (noted as the strike price) on a notional amount. Premiums received from writing options on swaps that expire or are exercised are treated as realized gains upon the expiration or exercise of such options on swaps. The risk associated with writing put and call options on swaps is that the Fund will be obligated to be party to a swap agreement if an option on a swap is exercised.
Financial Futures Contracts: A financial futures contract is an agreement to purchase (long) or sell (short) an agreed amount of securities at a set price for delivery on a future date. Upon entering into a financial futures contract, the Fund is required to pledge to the broker an amount of cash and/or other assets equal to a certain percentage of the contract amount. This amount is known as the “initial margin.” Subsequent payments, known as “variation margin,” are made or received by the Fund each day, depending on the daily fluctuations in
PGIM Emerging Markets Debt Hard Currency Fund 71
Notes to Financial Statements (continued)
the value of the underlying security. Such variation margin is recorded for financial statement purposes on a daily basis as unrealized gain (loss). When the contract expires or is closed, the gain (loss) is realized and is presented in the Statement of Operations as net realized gain (loss) on futures transactions.
The Fund invested in financial futures contracts in order to hedge its existing portfolio securities, or securities the Fund intends to purchase, against fluctuations in value caused by changes in prevailing interest rates. Should interest rates move unexpectedly, the Fund may not achieve the anticipated benefits of the financial futures contracts and may realize a loss. The use of futures transactions involves the risk of imperfect correlation in movements in the price of futures contracts, interest rates and the underlying hedged assets. Since futures contracts are exchange-traded, there is minimal counterparty credit risk to the Fund since the exchanges’ clearinghouse acts as counterparty to all exchange-traded futures and guarantees the futures contracts against default.
Swap Agreements: The Fund entered into certain types of swap agreements detailed in the disclosures below. A swap agreement is an agreement to exchange the return generated by one instrument for the return generated by another instrument. Swap agreements are negotiated in the OTC market and may be executed either directly with a counterparty (“OTC-traded”) or through a central clearing facility, such as a registered exchange. Swap agreements are valued daily at current market value and any change in value is included in the net unrealized appreciation or depreciation on swap agreements. Centrally cleared swaps pay or receive an amount known as “variation margin”, based on daily changes in the valuation of the swap contract. For OTC-traded, upfront premiums paid and received are shown as swap premiums paid and swap premiums received in the Statement of Assets and Liabilities. Risk of loss may exceed amounts recognized on the Statement of Assets and Liabilities. Swap agreements outstanding at period end, if any, are listed on the Schedule of Investments.
Interest Rate Swaps: Interest rate swaps represent an agreement between counterparties to exchange cash flows based on the difference between two interest rates, applied to a notional principal amount for a specified period. The Fund is subject to interest rate risk exposure in the normal course of pursuing its investment objective. The Fund used interest rate swaps to maintain its ability to generate steady cash flow by receiving a stream of fixed rate payments or to increase exposure to prevailing market rates by receiving floating rate payments. The Fund’s maximum risk of loss from counterparty credit risk is the discounted net present value of the cash flows to be received from the counterparty over the contract’s remaining life.
Credit Default Swaps (“CDS”): CDS involve one party (the protection buyer) making a stream of payments to another party (the protection seller) in exchange for the right to receive a
72
specified payment in the event of a default or as a result of a default (collectively a “credit event”) for the referenced entity (typically corporate issues or sovereign issues of an emerging country) on its obligation; or in the event of a write-down, principal shortfall, interest shortfall or default of all or part of the referenced entities comprising a credit index.
The Fund is subject to credit risk in the normal course of pursuing its investment objectives, and as such, has entered into CDS contracts to provide a measure of protection against defaults or to take an active long or short position with respect to the likelihood of a particular issuer’s default or the reference entity’s credit soundness. CDS contracts generally trade based on a spread which represents the cost a protection buyer has to pay the protection seller. The protection buyer is said to be short the credit as the value of the contract rises the more the credit deteriorates. The value of the CDS contract increases for the protection buyer if the spread increases. The Fund’s maximum risk of loss from counterparty credit risk for purchased CDS is the inability of the counterparty to honor the contract up to the notional value due to a credit event.
As a seller of protection on credit default swap agreements, the Fund generally receives an agreed upon payment from the buyer of protection throughout the term of the swap, provided no credit event occurs. As the seller, the Fund effectively increases its investment risk because, in addition to its total net assets, the Fund may be subject to investment exposure on the notional amount of the swap.
The maximum amount of the payment that the Fund, as a seller of protection, could be required to make under a credit default swap agreement would be equal to the notional amount of the underlying security or index contract as a result of a credit event. This potential amount will be partially offset by any recovery values of the respective referenced obligations, or net amounts received from the settlement of buy protection credit default swap agreements which the Fund entered into for the same referenced entity or index. As a buyer of protection, the Fund generally receives an amount up to the notional value of the swap if a credit event occurs.
Implied credit spreads, represented in absolute terms, utilized in determining the market value of credit default swap agreements where the Fund is the seller of protection as of period end are disclosed in the footnotes to the Schedule of Investments, if applicable. These spreads serve as indicators of the current status of the payment/performance risk and represent the likelihood of default risk for the credit derivative. The implied credit spread of a particular referenced entity reflects the cost of buying/selling protection and may include upfront payments required to enter into the agreement. Wider credit spreads and increased market value in absolute terms, when compared to the notional amount of the swap, represent a deterioration of the referenced entity’s credit soundness and a greater likelihood of risk of default or other credit event occurring as defined under the terms of the agreement.
Master Netting Arrangements: The RIC, on behalf of the Fund, is subject to various Master Agreements, or netting arrangements, with select counterparties. These are agreements
PGIM Emerging Markets Debt Hard Currency Fund 73
Notes to Financial Statements (continued)
which a subadviser may have negotiated and entered into on behalf of all or a portion of the Fund. A master netting arrangement between the Fund and the counterparty permits the Fund to offset amounts payable by the Fund to the same counterparty against amounts to be received; and by the receipt of collateral from the counterparty by the Fund to cover the Fund’s exposure to the counterparty. However, there is no assurance that such mitigating factors are easily enforceable. In addition to master netting arrangements, the right to set-off exists when all the conditions are met such that each of the parties owes the other determinable amounts, the reporting party has the right to set-off the amount owed with the amount owed by the other party, the reporting party intends to set-off and the right of set-off is enforceable by law.
The RIC, on behalf of the Fund, is a party to International Swaps and Derivatives Association, Inc. (“ISDA”) Master Agreements with certain counterparties that govern OTC derivative and foreign exchange contracts entered into from time to time. The Master Agreements may contain provisions regarding, among other things, the parties’ general obligations, representations, agreements, collateral requirements, events of default and early termination. With respect to certain counterparties, in accordance with the terms of the Master Agreements, collateral posted to the Fund is held in a segregated account by the Fund’s custodian and with respect to those amounts which can be sold or re-pledged, is presented in the Schedule of Investments. Collateral pledged by the Fund is segregated by the Fund’s custodian and identified in the Schedule of Investments. Collateral can be in the form of cash or debt securities issued by the U.S. Government or related agencies or other securities as agreed to by the Fund and the applicable counterparty. Collateral requirements are determined based on the Fund’s net position with each counterparty. Termination events applicable to the Fund may occur upon a decline in the Fund’s net assets below a specified threshold over a certain period of time. Termination events applicable to counterparties may occur upon a decline in the counterparty’s long-term and short-term credit ratings below a specified level. In each case, upon occurrence, the other party may elect to terminate early and cause settlement of all derivative and foreign exchange contracts outstanding, including the payment of any losses and costs resulting from such early termination, as reasonably determined by the terminating party. Any decision by one or more of the Fund’s counterparties to elect early termination could impact the Fund’s future derivative activity.
In addition to each instrument’s primary underlying risk exposure (e.g. interest rate, credit, equity or foreign exchange, etc.), swap agreements involve, to varying degrees, elements of credit, market and documentation risk. Such risks involve the possibility that no liquid market for these agreements will exist, the counterparty to the agreement may default on its obligation to perform or disagree on the contractual terms of the agreement, and changes in net interest rates will be unfavorable. In connection with these agreements, securities in the portfolio may be identified or received as collateral from the counterparty in accordance with the terms of the respective swap agreements to provide or receive assets of value and to
74
serve as recourse in the event of default or bankruptcy/insolvency of either party. Such OTC derivative agreements include conditions which, when materialized, give the counterparty the right to cause an early termination of the transactions under those agreements. Any election by the counterparty for early termination of the contract(s) may impact the amounts reported on financial statements.
Short sales and OTC contracts, including forward foreign currency exchange contracts, swaps, forward rate agreements and written options involve elements of both market and credit risk in excess of the amounts reflected on the Statement of Assets and Liabilities, if applicable. Such risks may be mitigated by engaging in master netting arrangements.
Payment-In-Kind: The Fund invested in the open market or received pursuant to debt restructuring, securities that pay-in-kind (PIK) the interest due on such debt instruments. The PIK interest, computed at the contractual rate specified, is added to the existing principal balance of the debt when issued bonds have same terms as the bond or recorded as a separate bond when terms are different from the existing debt, and is recorded as interest income.
Securities Lending: The Fund lends its portfolio securities to banks and broker-dealers. The loans are secured by collateral at least equal to the market value of the securities loaned. Collateral pledged by each borrower is invested in an affiliated money market fund and is marked to market daily, based on the previous day’s market value, such that the value of the collateral exceeds the value of the loaned securities. In the event of significant appreciation in value of securities on loan on the last business day of the reporting period, the financial statements may reflect a collateral value that is less than the market value of the loaned securities. Such shortfall is remedied as described above. Loans are subject to termination at the option of the borrower or the Fund. Upon termination of the loan, the borrower will return to the Fund securities identical to the loaned securities. The remaining maturities of the securities lending transactions are considered overnight and continuous. Should the borrower of the securities fail financially, the Fund has the right to repurchase the securities in the open market using the collateral.
The Fund recognizes income, net of any rebate and securities lending agent fees, for lending its securities in the form of fees or interest on the investment of any cash received as collateral. The borrower receives all interest and dividends from the securities loaned and such payments are passed back to the lender in amounts equivalent thereto, which are reflected in interest income or unaffiliated dividend income based on the nature of the payment on the Statement of Operations. The Fund also continues to recognize any unrealized gain (loss) in the market price of the securities loaned and on the change in the value of the collateral invested that may occur during the term of the loan. In addition, realized gain (loss) is recognized on changes in the value of the collateral invested upon liquidation of the collateral. Net earnings from securities lending are disclosed in the Statement of Operations.
PGIM Emerging Markets Debt Hard Currency Fund 75
Notes to Financial Statements (continued)
Securities Transactions and Net Investment Income: Securities transactions are recorded on the trade date. Realized gains (losses) from investment and currency transactions are calculated on the specific identification method. Dividend income is recorded on the ex-date, or for certain foreign securities, when the Fund becomes aware of such dividends. Interest income, including amortization of premium and accretion of discount on debt securities, as required, is recorded on the accrual basis. Expenses are recorded on an accrual basis, which may require the use of certain estimates by management that may differ from actual. Net investment income or loss (other than class specific expenses and waivers, which are allocated as noted below) and unrealized and realized gains (losses) are allocated daily to each class of shares based upon the relative proportion of adjusted net assets of each class at the beginning of the day. Class specific expenses and waivers, where applicable, are charged to the respective share classes. Such class specific expenses and waivers include distribution fees and distribution fee waivers, shareholder servicing fees, transfer agent’s fees and expenses, registration fees and fee waivers and/or expense reimbursements, as applicable.
Taxes: It is the Fund’s policy to continue to meet the requirements of the Internal Revenue Code applicable to regulated investment companies and to distribute all of its taxable net investment income and capital gains, if any, to its shareholders. Therefore, no federal income tax provision is required. Withholding taxes on foreign dividends, interest and capital gains, if any, are recorded, net of reclaimable amounts, at the time the related income is earned.
Dividends and Distributions: The Fund expects to declare dividends of its net investment income daily and pay such dividends monthly. Distributions of net realized capital and currency gains, if any, are declared and paid at least annually. Dividends and distributions to shareholders, which are determined in accordance with federal income tax regulations and which may differ from GAAP, are recorded on the ex-date. Permanent book/tax differences relating to income and gain (loss) are reclassified between total distributable earnings (loss) and paid-in capital in excess of par, as appropriate.
Estimates: The preparation of financial statements requires management to make estimates and assumptions that affect the reported amounts and disclosures in the financial statements. Actual results could differ from those estimates.
The RIC, on behalf of the Fund, has a management agreement with the Manager. Pursuant to this agreement, the Manager has responsibility for all investment advisory services and supervises the subadvisers’ performance of such services.
76
The Manager has entered into a subadvisory agreement with PGIM, Inc., which provides subadvisory services to the Fund through its business unit PGIM Fixed Income, and PGIM Limited (each a “subadviser” and collectively the “subadvisers”). The Manager pays for the services of the subadvisers.
The management fee paid to the Manager is accrued daily and payable monthly at an annual rate of 0.65% of the Fund’s average daily net assets up to and including $1 billion; 0.63% from $1 billion to $3 billion of average daily net assets; 0.61% from $3 billion to $5 billion of average daily net assets; 0.60% from $5 billion to $10 billion of average daily net assets; and 0.59% of the average daily net exceeding $10 billion. The effective management fee rate before any waivers and/or expense reimbursements was 0.65% for the year ended October 31, 2021.
The Manager has contractually agreed, through February 28, 2023, to limit total annual operating expenses after fee waivers and/or expense reimbursements to 1.05% of average daily net assets for Class A shares, 1.80% of average daily net assets for Class C shares, 0.75% of average daily net assets for Class Z shares and 0.65% of average daily net assets for Class R6 shares. This contractual waiver excludes interest, brokerage, taxes (such as income and foreign withholding taxes, stamp duty and deferred tax expenses), acquired fund fees and expenses, extraordinary expenses, and certain other Fund expenses such as dividend and interest expense and broker charges on short sales.
Where applicable, the Manager agrees to waive management fees or shared operating expenses on any share class to the same extent that it waives such expenses on any other share class. In addition, total annual operating expenses for Class R6 shares will not exceed total annual operating expenses for Class Z shares. Fees and/or expenses waived and/or reimbursed by the Manager may be recouped by the Manager within the same fiscal year during which such waiver and/or reimbursement is made if such recoupment can be realized without exceeding the expense limit in effect at the time of the recoupment for that fiscal year.
The RIC, on behalf of the Fund, has a distribution agreement with Prudential Investment Management Services LLC (“PIMS”), which acts as the distributor of the Class A, Class C, Class Z and Class R6 shares of the Fund. The Fund compensates PIMS for distributing and servicing the Fund’s Class A and Class C shares, pursuant to the plans of distribution (the “Distribution Plans”), regardless of expenses actually incurred by PIMS.
Pursuant to the Distribution Plans, the Fund compensates PIMS for distribution related activities at an annual rate of up to 0.25% and 1% of the average daily net assets of the Class A and Class C shares, respectively. The distribution fees are accrued daily and payable monthly. No distribution or service fees are paid to PIMS as distributor of the Class Z or Class R6 shares of the Fund.
For the year ended October 31, 2021, PIMS has not received any front-end sales charges resulting from sales of Class A shares. Additionally, for the year ended October 31, 2021,
PGIM Emerging Markets Debt Hard Currency Fund 77
Notes to Financial Statements (continued)
PIMS did not receive any contingent deferred sales charges imposed upon redemptions by certain Class A and Class C shareholders.
PGIM Investments, PGIM, Inc., PGIM Limited and PIMS are indirect, wholly-owned subsidiaries of Prudential Financial, Inc. (“Prudential”).
| 4. | Other Transactions with Affiliates |
Prudential Mutual Fund Services LLC (“PMFS”), an affiliate of PGIM Investments and an indirect, wholly-owned subsidiary of Prudential, serves as the Fund’s transfer agent. Transfer agent’s fees and expenses in the Statement of Operations include certain out-of-pocket expenses paid to non-affiliates, where applicable.
The Fund may invest its overnight sweep cash in the PGIM Core Ultra Short Bond Fund (the “Core Fund”), and its securities lending cash collateral in the PGIM Institutional Money Market Fund (the “Money Market Fund”), each a fund of Prudential Investment Portfolios 2, registered under the 1940 Act and managed by PGIM Investments. PGIM Investments and/or its affiliates are paid fees or reimbursed for providing their services to the Core Fund and the Money Market Fund. In addition to the realized and unrealized gains on investments in the Core Fund and Money Market Fund, earnings from such investments are disclosed on the Statement of Operations as “Affiliated dividend income” and “Income from securities lending, net”, respectively.
The Fund may enter into certain securities purchase or sale transactions under Board approved Rule 17a-7 procedures. Rule 17a-7 is an exemptive rule under the 1940 Act, that subject to certain conditions, permits purchase and sale transactions among affiliated investment companies, or between an investment company and a person that is affiliated solely by reason of having a common (or affiliated) investment adviser, common directors/trustees, and/or common officers. For the year ended October 31, 2021, no 17a-7 transactions were entered into by the Fund.
The aggregate cost of purchases and proceeds from sales of portfolio securities (excluding short-term investments and U.S. Government securities) for the year ended October 31, 2021, were $53,115,474 and $25,425,368, respectively.
A summary of the cost of purchases and proceeds from sales of shares of an affiliated mutual fund for the year ended October 31, 2021, is presented as follows:
78
| | | | | | | | | | | | | | | | | | | | | | | | | | | | | | | | | | | | | | | | | | | | | | | | | | | | | | | | | | | | | | | | | | | | | | | | | | |
Value, Beginning of Year | | Cost of Purchases | | | Proceeds from Sales | | | Change in Unrealized Gain (Loss) | | Realized Gain (Loss) | | | Value, End of Year | | | Shares, End of Year | | | Income | |
| | | |
| Short-Term Investments - Affiliated Mutual Funds: | | | | | | | | | | | | | |
|
| PGIM Core Ultra Short Bond Fund (1)(wa) | |
| $ 3,839,427 | | | | | | $ | 52,977,321 | | | | | | | | | | | $ | 44,353,588 | | | | | | | | | | | $— | | | | | | $ | — | | | | | | | | | | | $ | 12,463,160 | | | | | | | | | | | | 12,463,160 | | | | | | | | | | | $ | 5,026 | |
|
| PGIM Institutional Money Market Fund (1)(b)(wa) | |
1,047,645 | | | | | | | 1,026,258 | | | | | | | | | | | | 2,073,702 | | | | | | | | | | | — | | | | | | | (201 | ) | | | | | | | | | | | — | | | | | | | | | | | | — | | | | | | | | | | | | 121 | (2) |
| | | | | | | | | | | | | | | | | | | | | | | | | | | | | | | | | | | | | | | | | | | | | | | | | | | | | | | | | | | | | | | | | | | | | | | | | | |
$ 4,887,072 | | | | | | $ | 54,003,579 | | | | | | | | | | | $ | 46,427,290 | | | | | | | | | | | $— | | | | | | $ | (201 | ) | | | | | | | | | | $ | 12,463,160 | | | | | | | | | | | | | | | | | | | | | | | $ | 5,147 | |
| | | | | | | | | | | | | | | | | | | | | | | | | | | | | | | | | | | | | | | | | | | | | | | | | | | | | | | | | | | | | | | | | | | | | | | | | | |
| (1) | The Fund did not have any capital gain distributions during the reporting period. |
| (2) | The amount, or a portion thereof, represents the affiliated securities lending income shown on the Statement of Operations. |
| (b) | Represents security, or portion thereof, purchased with cash collateral received for securities on loan and includes dividend reinvestment. |
| (wa) | PGIM Investments LLC, the manager of the Fund, also serves as manager of the PGIM Core Ultra Short Bond Fund and PGIM Institutional Money Market Fund, if applicable. |
| 6. | Distributions and Tax Information |
Distributions to shareholders, which are determined in accordance with federal income tax regulations and which may differ from GAAP, are recorded on the ex-date.
For the year ended October 31, 2021, the tax character of dividends paid by the Fund was $6,437,396 of ordinary income. For the year ended October 31, 2020, the tax character of dividends paid by the Fund was $2,231,383 of ordinary income.
As of October 31, 2021, the accumulated undistributed earnings on a tax basis was $1,083,543 of ordinary income.
The United States federal income tax basis of the Fund’s investments and the net unrealized depreciation as of October 31, 2021 were as follows:
| | | | | | |
| Tax Basis | | Gross
Unrealized
Appreciation | | Gross
Unrealized
Depreciation | | Net
Unrealized
Depreciation |
| | | |
| $155,588,530 | | $3,938,835 | | $(6,792,162) | | $(2,853,327) |
The difference between GAAP and tax basis were primarily due to deferred losses on wash sales, amortization of bond premium, foreign currency forwards, defaulted securities and other book to tax differences.
For federal income tax purposes, the Fund had a capital loss carryforward as of October 31, 2021 of approximately $1,297,000 which can be carried forward for an unlimited period. No capital gains distributions are expected to be paid to shareholders until net gains have been realized in excess of such losses.
PGIM Emerging Markets Debt Hard Currency Fund 79
Notes to Financial Statements (continued)
The Manager has analyzed the Fund’s tax positions taken on federal, state and local income tax returns for all open tax years and has concluded that no provision for income tax is required in the Fund’s financial statements for the current reporting period. Since tax authorities can examine previously filed tax returns, the Fund’s U.S. federal and state tax returns for each of the four fiscal years up to the most recent fiscal year ended October 31, 2021 are subject to such review.
The Fund offers Class A, Class C, Class Z and Class R6 shares. Class A shares are sold with a maximum front-end sales charge of 3.25%. Investors who purchase $500,000 or more of Class A shares and sell those shares within 12 months of purchase are subject to a contingent deferred sales charge (“CDSC”) of 1.00% on sales although these purchases are not subject to a front-end sales charge. The Class A CDSC is waived for certain retirement and/or benefit plans. A special exchange privilege is also available for shareholders who qualified to purchase Class A shares at net asset value. Class C shares are sold with a CDSC of 1% on sales made within 12 months of purchase. Class C shares will automatically convert to Class A shares on a monthly basis approximately eight years (ten years prior to January 22, 2021) after purchase. Class Z and Class R6 shares are not subject to any sales or redemption charges and are available exclusively for sale to a limited group of investors.
Under certain circumstances, an exchange may be made from specified share classes of the Fund to one or more other share classes of the Fund as presented in the table of transactions in shares of common stock, below.
The RIC is authorized to issue 10,225,000,000 shares of common stock, $0.00001 par value per share, 600,000,000 of which are designated as shares of the Fund. The authorized shares of the Fund are currently classified and designated as follows:
| | | | |
Class A | | | 100,000,000 | |
Class C | | | 100,000,000 | |
Class Z | | | 200,000,000 | |
Class R6 | | | 200,000,000 | |
As of October 31, 2021, Prudential, through its affiliated entities, including affiliated funds (if applicable), owned shares of the Fund as follows:
| | | | |
| | | Number of Shares | | Percentage of
Outstanding Shares |
Class A | | 1,220 | | 18.8% |
Class C | | 1,186 | | 100.0% |
Class R6 | | 7,030,566 | | 46.7% |
80
At the reporting period end, the number of shareholders holding greater than 5% of the Fund are as follows:
| | | | | | |
| | |
| Affiliated | | Unaffiliated |
Number of Shareholders | | Percentage of Outstanding Shares | | Number of Shareholders | | Percentage of Outstanding Shares |
1 | | 41.9% | | 2 | | 47.0% |
Transactions in shares of common stock were as follows:
| | | | | | | | |
Class A | | Shares | | | Amount | |
Year ended October 31, 2021: | | | | | | | | |
Shares sold | | | 3,166 | | | $ | 28,994 | |
Shares issued in reinvestment of dividends and distributions | | | 228 | | | | 2,106 | |
Shares purchased | | | (63 | ) | | | (581 | ) |
| | | | | | | | |
| | |
Net increase (decrease) in shares outstanding | | | 3,331 | | | $ | 30,519 | |
| | | | | | | | |
| | |
Year ended October 31, 2020: | | | | | | | | |
Shares sold | | | 1,688 | | | $ | 15,061 | |
Shares issued in reinvestment of dividends and distributions | | | 98 | | | | 875 | |
Shares purchased | | | (12 | ) | | | (114 | ) |
| | | | | | | | |
| | |
Net increase (decrease) in shares outstanding | | | 1,774 | | | $ | 15,822 | |
| | | | | | | | |
Class C | | | | | | | | |
Year ended October 31, 2021: | | | | | | | | |
Shares issued in reinvestment of dividends and distributions | | | 43 | | | $ | 395 | |
| | | | | | | | |
| | |
Net increase (decrease) in shares outstanding | | | 43 | | | $ | 395 | |
| | | | | | | | |
Year ended October 31, 2020: | | | | | | | | |
Shares issued in reinvestment of dividends and distributions | | | 51 | | | $ | 451 | |
| | | | | | | | |
| | |
Net increase (decrease) in shares outstanding | | | 51 | | | $ | 451 | |
| | | | | | | | |
Class Z | | | | | | | | |
Year ended October 31, 2021: | | | | | | | | |
Shares sold | | | 4,468,483 | | | $ | 41,307,258 | |
Shares issued in reinvestment of dividends and distributions | | | 115,282 | | | | 1,064,840 | |
Shares purchased | | | (1,031,335 | ) | | | (9,474,853 | ) |
| | | | | | | | |
Net increase (decrease) in shares outstanding before conversion | | | 3,552,430 | | | | 32,897,245 | |
Shares issued upon conversion from other share class(es) | | | 14,250 | | | | 132,076 | |
Shares purchased upon conversion into other share class(es) | | | (3,713,016 | ) | | | (34,383,477 | ) |
| | | | | | | | |
| | |
Net increase (decrease) in shares outstanding | | | (146,336 | ) | | $ | (1,354,156 | ) |
| | | | | | | | |
| | |
Year ended October 31, 2020: | | | | | | | | |
Shares sold | | | 2,197,725 | | | $ | 19,583,643 | |
Shares issued in reinvestment of dividends and distributions | | | 63,662 | | | | 566,499 | |
Shares purchased | | | (729,035 | ) | | | (6,023,373 | ) |
| | | | | | | | |
| | |
Net increase (decrease) in shares outstanding | | | 1,532,352 | | | $ | 14,126,769 | |
| | | | | | | | |
PGIM Emerging Markets Debt Hard Currency Fund 81
Notes to Financial Statements (continued)
| | | | | | | | |
Class R6 | | Shares | | | Amount | |
Year ended October 31, 2021: | | | | | | | | |
Shares sold | | | 4,369,851 | | | $ | 40,360,478 | |
Shares issued in reinvestment of dividends and distributions | | | 566,570 | | | | 5,224,667 | |
Shares purchased | | | (4,623,318 | ) | | | (42,810,265 | ) |
| | | | | | | | |
Net increase (decrease) in shares outstanding before conversion | | | 313,103 | | | | 2,774,880 | |
Shares issued upon conversion from other share class(es) | | | 3,717,030 | | | | 34,383,477 | |
Shares purchased upon conversion into other share class(es) | | | (14,263 | ) | | | (132,076 | ) |
| | | | | | | | |
Net increase (decrease) in shares outstanding | | | 4,015,870 | | | $ | 37,026,281 | |
| | | | | | | | |
Year ended October 31, 2020: | | | | | | | | |
Shares sold | | | 8,059,230 | | | $ | 72,643,678 | |
Shares issued in reinvestment of dividends and distributions | | | 185,305 | | | | 1,659,459 | |
Shares purchased | | | (643 | ) | | | (6,087 | ) |
| | | | | | | | |
Net increase (decrease) in shares outstanding | | | 8,243,892 | | | $ | 74,297,050 | |
| | | | | | | | |
The RIC, on behalf of the Fund, along with other affiliated registered investment companies (the “Participating Funds”), is a party to a Syndicated Credit Agreement (“SCA”) with a group of banks. The purpose of the SCA is to provide an alternative source of temporary funding for capital share redemptions. The table below provides details of the current SCA in effect at the reporting period-end as well as the prior SCA.
| | | | |
| | | |
| | | Current SCA | | Prior SCA |
| | | |
| Term of Commitment | | 10/1/2021 – 9/29/2022 | | 10/2/2020 – 9/30/2021 |
| | | |
| Total Commitment | | $1,200,000,000 | | $1,200,000,000 |
| | | |
| Annualized Commitment Fee on the Unused Portion of the SCA | | 0.15% | | 0.15% |
| | | |
| Annualized Interest Rate on Borrowings | | 1.20% plus the higher of (1) the effective federal funds rate, (2) the one-month LIBOR rate or (3) zero percent | | 1.30% plus the higher of (1) the effective federal funds rate, (2) the one-month LIBOR rate or (3) zero percent |
Certain affiliated registered investment companies that are parties to the SCA include portfolios that are subject to a predetermined mathematical formula used to manage certain benefit guarantees offered under variable annuity contracts. The formula may result in large scale asset flows into and out of these portfolios. Consequently, these portfolios may be more likely to utilize the SCA for purposes of funding redemptions. It may be possible for those portfolios to fully exhaust the committed amount of the SCA, thereby requiring the Manager to allocate available funding per a Board-approved methodology designed to treat the Participating Funds in the SCA equitably.
The Fund did not utilize the SCA during the year ended October 31, 2021.
82
| 9. | Risks of Investing in the Fund |
The Fund’s risks include, but are not limited to, some or all of the risks discussed below. For further information on the Fund’s risks, please refer to the Fund’s Prospectus and Statement of Additional Information.
Credit Risk: Credit risk relates to the ability of the issuer of a fixed income instrument or the counterparty to a financial transaction with the Fund to meet interest and principal payments as they come due or to fulfill its obligations to the Fund. The value of the fixed income instruments held by the Fund will be adversely affected by any erosion in the ability of the relevant issuers to make interest and principal payments as they become due. The ratings given to a debt security by certain ratings agencies provide a generally useful guide as to such credit risk. The lower the rating of a debt security held by the Fund, the greater the degree of credit risk that is perceived to exist by the rating agency with respect to that security. Increasing the amount of Fund assets invested in lower-rated securities generally will increase the Fund’s income, but also will increase the credit risk to which the Fund is subject. The Fund generally enters into financial transactions with major dealers that are deemed acceptable to the subadviser from a credit perspective.
Currency Risk: The Fund’s assets may be invested in securities that are denominated in non-US currencies or directly in currencies. Such investments are subject to the risk that the value of a particular currency will change in relation to the US dollar or other currencies. The weakening of a country’s currency relative to the US dollar will negatively affect the dollar value of the Fund’s assets. Among the factors that may affect currency values are trade balances, levels of short term interest rates, differences in relative values of similar assets in different currencies, long term opportunities for investment and capital appreciation, central bank policy, and political developments. The Fund may attempt to hedge such risks by selling or buying currencies in the forward market; selling or buying currency futures contracts, options or other securities thereon; borrowing funds denominated in particular currencies; or any combination thereof, depending on the availability of liquidity in the hedging instruments and their relative costs. There can be no assurance that such strategies will be implemented or, if implemented, will be effective. The Fund would incur additional costs from hedging.
Debt Obligations Risk: Debt obligations are subject to credit risk, market risk and interest rate risk. The Fund’s holdings, share price, yield and total return may also fluctuate in response to bond market movements. The value of bonds may decline for issuer-related reasons, including management performance, financial leverage and reduced demand for the issuer’s goods and services. Certain types of fixed income obligations also may be subject to “call and redemption risk,” which is the risk that the issuer may call a bond held by the Fund for redemption before it matures and the Fund may lose income.
Derivatives Risk: Derivatives involve special risks and costs and may result in losses to the Fund. The successful use of derivatives requires sophisticated management, and, to the extent that derivatives are used, the Fund will depend on the subadviser’s ability to analyze and manage derivatives transactions. The prices of derivatives may move in unexpected
PGIM Emerging Markets Debt Hard Currency Fund 83
Notes to Financial Statements (continued)
ways, especially in abnormal market conditions. Some derivatives are “leveraged” and therefore may magnify or otherwise increase investment losses to the Fund. The Fund’s use of derivatives may also increase the amount of taxes payable by shareholders. Other risks arise from the potential inability to terminate or sell derivatives positions. A liquid secondary market may not always exist for the Fund’s derivatives positions. In fact, many over-the-counter derivative instruments will not have liquidity beyond the counterparty to the instrument. Over-the-counter derivative instruments also involve the risk that the other party will not meet its obligations to the Fund.
The U.S. Government and foreign governments have adopted (and may adopt further) regulations governing derivatives markets, including mandatory clearing of certain derivatives, margin and reporting requirements and risk exposure limitations. The ultimate impact of the regulations remains unclear. Additional regulation of derivatives may make derivatives more costly, limit their availability or utility, or otherwise adversely affect their performance or disrupt markets.
Economic and Market Events Risk: Events in the U.S. and global financial markets, including actions taken by the U.S. Federal Reserve or foreign central banks to stimulate or stabilize economic growth or the functioning of the securities markets, may at times result in unusually high market volatility, which could negatively impact performance. Relatively reduced liquidity in credit and fixed income markets could adversely affect issuers worldwide.
Emerging Markets Risk: The risks of foreign investments are greater for investments in or exposed to emerging markets. Emerging market countries typically have economic and political systems that are less fully developed, and can be expected to be less stable, than those of more developed countries. For example, the economies of such countries can be subject to rapid and unpredictable rates of inflation or deflation. Low trading volumes may result in a lack of liquidity and price volatility. Emerging market countries may have policies that restrict investment by non-U.S. investors, or that prevent non-U.S. investors from withdrawing their money at will.
The Fund may invest in some emerging markets that subject it to risks such as those associated with illiquidity, custody of assets, different settlement and clearance procedures and asserting legal title under a developing legal and regulatory regime to a greater degree than in developed markets or even in other emerging markets.
Foreign Securities Risk: Investments in securities of non-U.S. issuers (including those denominated in U.S. dollars) may involve more risk than investing in securities of U.S. issuers. Foreign political, economic and legal systems, especially those in developing and emerging market countries, may be less stable and more volatile than in the United States.
84
Foreign legal systems generally have fewer regulatory requirements than the U.S. legal system, particularly those of emerging markets. In general, less information is publicly available with respect to non-U.S. companies than U.S. companies. Non-U.S. companies generally are not subject to the same accounting, auditing, and financial reporting standards as are U.S. companies. Additionally, the changing value of foreign currencies and changes in exchange rates could also affect the value of the assets the Fund holds and the Fund’s performance. Certain foreign countries may impose restrictions on the ability of issuers of foreign securities to make payment of principal and interest or dividends to investors located outside the country, due to blockage of foreign currency exchanges or otherwise.
Investments in emerging markets are subject to greater volatility and price declines.
In addition, the Fund’s investments in non-U.S. securities may be subject to the risks of nationalization or expropriation of assets, imposition of currency exchange controls or restrictions on the repatriation of non-U.S. currency, confiscatory taxation and adverse diplomatic developments. Special U.S. tax considerations may apply.
Geographic Concentration Risk: The Fund’s performance may be closely tied to the market, economic, political, regulatory or other conditions in the countries or regions in which the Fund invests. This can result in more pronounced risks based upon conditions that impact one or more countries or regions more or less than other countries or regions.
Increase in Expenses Risk: Your actual cost of investing in the Fund may be higher than the expenses shown in the expense table in the Fund’s prospectus for a variety of reasons. For example, expense ratios may be higher than those shown if average net assets decrease. Net assets are more likely to decrease and Fund expense ratios are more likely to increase when markets are volatile. Active and frequent trading of Fund securities can increase expenses.
Interest Rate Risk: The value of your investment may go down when interest rates rise. A rise in rates tends to have a greater impact on the prices of longer term or duration debt securities. For example, a fixed income security with a duration of three years is expected to decrease in value by approximately 3% if interest rates increase by 1%. This is referred to as “duration risk.” When interest rates fall, the issuers of debt obligations may prepay principal more quickly than expected, and the Fund may be required to reinvest the proceeds at a lower interest rate. This is referred to as “prepayment risk.” When interest rates rise, debt obligations may be repaid more slowly than expected, and the value of the Fund’s holdings may fall sharply. This is referred to as “extension risk.” The Fund may lose money if short-term or long-term interest rates rise sharply or in a manner not anticipated by the subadviser.
Junk Bonds Risk: High-yield, high-risk bonds have predominantly speculative characteristics, including particularly high credit risk. Junk bonds tend to have lower market liquidity than higher-rated securities. The liquidity of particular issuers or industries within a particular investment category may shrink or disappear suddenly and without warning. The non-investment grade bond market can experience sudden and sharp price swings and
PGIM Emerging Markets Debt Hard Currency Fund 85
Notes to Financial Statements (continued)
become illiquid due to a variety of factors, including changes in economic forecasts, stock market activity, large sustained sales by major investors, a high profile default or a change in the market’s psychology.
Large Shareholder and Large Scale Redemption Risk: Certain individuals, accounts, funds (including funds affiliated with the Manager) or institutions, including the Manager and its affiliates, may from time to time own or control a substantial amount of the Fund’s shares. There is no requirement that these entities maintain their investment in the Fund. There is a risk that such large shareholders or that the Fund’s shareholders generally may redeem all or a substantial portion of their investments in the Fund in a short period of time, which could have a significant negative impact on the Fund’s NAV, liquidity, and brokerage costs. Large redemptions could also result in tax consequences to shareholders and impact the Fund’s ability to implement its investment strategy. The Fund’s ability to pursue its investment objective after one or more large scale redemptions may be impaired and, as a result, the Fund may invest a larger portion of its assets in cash or cash equivalents.
Liquidity Risk: Liquidity risk is the risk that the Fund could not meet requests to redeem shares issued by the Fund without significant dilution of remaining investors’ interests in the Fund. The Fund may invest in instruments that trade in lower volumes and are more illiquid than other investments. If the Fund is forced to sell these investments to pay redemption proceeds or for other reasons, the Fund may lose money. In addition, when there is no willing buyer and investments cannot be readily sold at the desired time or price, the Fund may have to accept a lower price or may not be able to sell the instrument at all. An inability to sell a portfolio position can adversely affect the Fund’s value or prevent the Fund from being able to take advantage of other investment opportunities.
Management Risk: The value of your investment may decrease if judgments by the subadviser about the attractiveness, value or market trends affecting a particular security, industry or sector or about market movements are incorrect.
Market Disruption and Geopolitical Risks: International wars or conflicts and geopolitical developments in foreign countries, along with instability in regions such as Asia, Eastern Europe, and the Middle East, possible terrorist attacks in the United States or around the world, public health epidemics such as the outbreak of infectious diseases like the outbreak of COVID-19 globally in 2020 or the 2014–2016 outbreak in West Africa of the Ebola virus, and other similar events could adversely affect the U.S. and foreign financial markets, including increases in market volatility, reduced liquidity in the securities markets and government intervention, and may cause further long-term economic uncertainties in the United States and worldwide generally. The coronavirus pandemic and the related governmental and public responses have had and may continue to have an impact on the Fund’s investments and net asset value and have led and may continue to lead to increased
86
market volatility and the potential for illiquidity in certain classes of securities and sectors of the market. Preventative or protective actions that governments may take in respect of pandemic or epidemic diseases may result in periods of business disruption, business closures, inability to obtain raw materials, supplies and component parts, and reduced or disrupted operations for the issuers in which the Fund invests. Government intervention in markets may impact interest rates, market volatility and security pricing. The occurrence, reoccurrence and pendency of such diseases could adversely affect the economies (including through changes in business activity and increased unemployment) and financial markets either in specific countries or worldwide.
Market Risk: Securities markets may be volatile and the market prices of the Fund’s securities may decline. Securities fluctuate in price based on changes in an issuer’s financial condition and overall market and economic conditions. If the market prices of the securities owned by the Fund fall, the value of your investment in the Fund will decline.
| 10. | Recent Accounting Pronouncement and Regulatory Developments |
In March 2020, the FASB issued Accounting Standard Update (“ASU”) No. 2020-04, which provides optional guidance for applying GAAP to contract modifications, hedging relationships and other transactions affected by the reference rate reform if certain criteria are met. ASU 2020-04 is elective and is effective on March 12, 2020 through December 31, 2022. At this time, management is evaluating the implications of certain provisions of the ASU and any impact on the financial statement disclosures has not yet been determined.
On December 3, 2020, the SEC announced that it voted to adopt a new rule that establishes an updated regulatory framework for fund valuation practices (the “Rule”). The Rule, in part, provides (i) a framework for determining fair value in good faith and (ii) provides for a fund Board’s assignment of its responsibility for the execution of valuation-related activities to a fund’s investment adviser. Further, the SEC is rescinding previously issued guidance on related issues. The Rule took effect on March 8, 2021, with a compliance date of September 8, 2022. Management is currently evaluating the Rule and its impact to the Fund.
PGIM Emerging Markets Debt Hard Currency Fund 87
Report of Independent Registered Public Accounting Firm
To the Board of Directors of Prudential World Fund, Inc. and Shareholders of PGIM Emerging Markets Debt Hard Currency Fund
Opinion on the Financial Statements
We have audited the accompanying statement of assets and liabilities, including the schedule of investments, of PGIM Emerging Markets Debt Hard Currency Fund (one of the funds constituting Prudential World Fund, Inc., referred to hereafter as the “Fund”) as of October 31, 2021, the related statement of operations for the year ended October 31, 2021, the statement of changes in net assets for each of the two years in the period ended October 31, 2021, including the related notes, and financial highlights for each of the two years in the period ended October 31, 2021 (collectively referred to as the “financial statements”). In our opinion, the financial statements present fairly, in all material respects, the financial position of the Fund as of October 31, 2021, the results of its operations for the year then ended, and the changes in its net assets and the financial highlights for each of the two years in the period ended October 31, 2021 in conformity with accounting principles generally accepted in the United States of America.
The financial statements of the Fund as of and for the year ended October 31, 2019 and the financial highlights for each of the periods ended on or prior to October 31, 2019 (not presented herein, other than the financial highlights) were audited by other auditors whose report dated December 19, 2019 expressed an unqualified opinion on those financial statements and financial highlights.
Basis for Opinion
These financial statements are the responsibility of the Fund’s management. Our responsibility is to express an opinion on the Fund’s financial statements based on our audits. We are a public accounting firm registered with the Public Company Accounting Oversight Board (United States) (PCAOB) and are required to be independent with respect to the Fund in accordance with the U.S. federal securities laws and the applicable rules and regulations of the Securities and Exchange Commission and the PCAOB.
We conducted our audits of these financial statements in accordance with the standards of the PCAOB. Those standards require that we plan and perform the audit to obtain reasonable assurance about whether the financial statements are free of material misstatement, whether due to error or fraud.
Our audits included performing procedures to assess the risks of material misstatement of the financial statements, whether due to error or fraud, and performing procedures that respond to those risks. Such procedures included examining, on a test basis, evidence regarding the amounts and disclosures in the financial statements. Our audits also included evaluating the accounting principles used and significant estimates made by management, as well as evaluating the overall presentation of the financial statements. Our procedures included confirmation of securities owned as of October 31, 2021 by correspondence with the custodian, transfer agent and brokers; when replies were not received from brokers, we performed other auditing procedures. We believe that our audits provide a reasonable basis for our opinion.
/s/PricewaterhouseCoopers LLP
New York, New York
December 16, 2021
We have served as the auditor of one or more investment companies in the PGIM Retail Funds complex since 2020.
INFORMATION ABOUT BOARD MEMBERS AND OFFICERS (unaudited)
Information about Board Members and Officers of the Fund is set forth below. Board Members who are not deemed to be “interested persons” of the Fund, as defined in the 1940 Act, are referred to as “Independent Board Members.” Board Members who are deemed to be “interested persons” of the Fund are referred to as “Interested Board Members.” The Board Members are responsible for the overall supervision of the operations of the Fund and perform the various duties imposed on the directors of investment companies by the 1940 Act. The Board in turn elects the Officers, who are responsible for administering the day-to-day operations of the Fund.
| | | | | | |
| Independent Board Members |
| | | | |
Name Year of Birth Position(s) Portfolios Overseen | | Principal Occupation(s) During Past Five Years | | Other Directorships Held During Past Five Years | | Length of Board Service |
| | | | |
Ellen S. Alberding 1958 Board Member Portfolios Overseen: 95 | | President and Board Member, The Joyce Foundation (charitable foundation) (since 2002); formerly Vice Chair, City Colleges of Chicago (community college system) (2011-2015); Trustee, National Park Foundation (charitable foundation for national park system) (2009-2018); Trustee, Economic Club of Chicago (2009-2016); Trustee, Loyola University (since 2018). | | None. | | Since September 2013 |
| | | | |
Kevin J. Bannon 1952 Board Member Portfolios Overseen: 95 | | Retired; formerly Managing Director (April 2008-May 2015) and Chief Investment Officer (October 2008-November 2013) of Highmount Capital LLC (registered investment adviser); formerly Executive Vice President and Chief Investment Officer (April 1993-August 2007) of Bank of New York Company; President (May 2003-May 2007) of BNY Hamilton Family of Mutual Funds. | | Director of Urstadt Biddle Properties (equity real estate investment trust) (since September 2008). | | Since July 2008 |
PGIM Emerging Markets Debt Hard Currency Fund
| | | | | | |
| Independent Board Members |
| | | | |
Name Year of Birth Position(s) Portfolios Overseen | | Principal Occupation(s) During Past Five Years | | Other Directorships Held During Past Five Years | | Length of Board Service |
| | | | |
Linda W. Bynoe 1952 Board Member Portfolios Overseen: 92 | | President and Chief Executive Officer (since March 1995) and formerly Chief Operating Officer (December 1989-February 1995) of Telemat Limited LLC (formerly Telemat Ltd) (management consulting); formerly Vice President (January 1985-June 1989) at Morgan Stanley & Co. (broker-dealer). | | Trustee of Equity Residential (residential real estate) (since December 2009); Director of Northern Trust Corporation (financial services) (since April 2006); formerly Director of Anixter International, Inc. (communication products distributor) (January 2006-June 2020). | | Since March 2005 |
| | | | |
Barry H. Evans 1960 Board Member Portfolios Overseen: 94 | | Retired; formerly President (2005-2016), Global Chief Operating Officer (2014-2016), Chief Investment Officer - Global Head of Fixed Income (1998-2014), and various portfolio manager roles (1986-2006), Manulife Asset Management (asset management). | | Formerly Director, Manulife Trust Company (2011-2018); formerly Director, Manulife Asset Management Limited (2015-2017); formerly Chairman of the Board of Directors of Manulife Asset Management U.S. (2005-2016); formerly Chairman of the Board, Declaration Investment Management and Research (2008-2016). | | Since September 2017 |
| | | | |
Keith F. Hartstein 1956 Board Member & Independent Chair Portfolios Overseen: 95 | | Retired; Executive Committee of the Independent Directors Council (IDC) Board of Governors (since October 2019); Member (since November 2014) of the Governing Council of the IDC (organization of independent mutual fund directors); formerly President and Chief Executive Officer (2005-2012), Senior Vice President (2004-2005), Senior Vice President of Sales and Marketing (1997-2004), and various executive management positions (1990-1997), John Hancock Funds, LLC (asset management); Chairman, Investment Company Institute’s Sales Force Marketing Committee (2003-2008). | | None. | | Since September 2013 |
Visit our website at pgim.com/investments
| | | | | | |
| Independent Board Members |
| | | | |
Name Year of Birth Position(s) Portfolios Overseen | | Principal Occupation(s) During Past Five Years | | Other Directorships Held During Past Five Years | | Length of Board Service |
| | | | |
Laurie Simon Hodrick 1962 Board Member Portfolios Overseen: 91 | | A. Barton Hepburn Professor Emerita of Economics in the Faculty of Business, Columbia Business School (since 2018); Visiting Fellow at the Hoover Institution, Stanford University (since 2015); Sole Member, ReidCourt LLC (since 2008) (a consulting firm); formerly Visiting Professor of Law, Stanford Law School (2015-2021); formerly A. Barton Hepburn Professor of Economics in the Faculty of Business, Columbia Business School (1996-2017); formerly Managing Director, Global Head of Alternative Investment Strategies, Deutsche Bank (2006-2008). | | Independent Director, Roku (since December 2020) (communication services); formerly Independent Director, Synnex Corporation (2019-2021) (information technology); formerly Independent Director, Kabbage, Inc. (2018-2020) (financial services); formerly Independent Director, Corporate Capital Trust (2017-2018) (a business development company). | | Since September 2017 |
| | | | |
Brian K. Reid 1961 Board Member Portfolios Overseen: 94 | | Retired; formerly Chief Economist for the Investment Company Institute (ICI) (2005-2017); formerly Senior Economist and Director of Industry and Financial Analysis at the ICI (1998-2004); formerly Senior Economist, Industry and Financial Analysis at the ICI (1996-1998); formerly Staff Economist at the Federal Reserve Board (1989-1996); Director, ICI Mutual Insurance Company (2012-2017). | | None. | | Since March 2018 |
PGIM Emerging Markets Debt Hard Currency Fund
| | | | | | |
| Independent Board Members |
| | | | |
Name Year of Birth Position(s) Portfolios Overseen | | Principal Occupation(s) During Past Five Years | | Other Directorships Held During Past Five Years | | Length of Board Service |
| | | | |
Grace C. Torres 1959 Board Member Portfolios Overseen: 94 | | Retired; formerly Treasurer and Principal Financial and Accounting Officer of the PGIM Funds, Target Funds, Advanced Series Trust, Prudential Variable Contract Accounts and The Prudential Series Fund (1998-June 2014); Assistant Treasurer (March 1999-June 2014) and Senior Vice President (September 1999-June 2014) of PGIM Investments LLC; Assistant Treasurer (May 2003-June 2014) and Vice President (June 2005-June 2014) of AST Investment Services, Inc.; Senior Vice President and Assistant Treasurer (May 2003-June 2014) of Prudential Annuities Advisory Services, Inc. | | Director (since January 2018) of OceanFirst Financial Corp. and OceanFirst Bank; formerly Director (July 2015-January 2018) of Sun Bancorp, Inc. N.A. and Sun National Bank. | | Since November 2014 |
| | | | | | |
| Interested Board Members |
| | | | |
Name Year of Birth Position(s) Portfolios Overseen | | Principal Occupation(s) During Past Five Years | | Other Directorships Held During Past Five Years | | Length of Board Service |
| | | | |
Stuart S. Parker 1962 Board Member & President Portfolios Overseen: 94 | | President, Chief Executive Officer, Chief Operating Officer and Officer in Charge of PGIM Investments LLC (formerly known as Prudential Investments LLC) (since January 2012); formerly Executive Vice President of Jennison Associates LLC and Head of Retail Distribution of PGIM Investments LLC (June 2005-December 2011); Investment Company Institute - Board of Governors (since May 2012). | | None. | | Since January 2012 |
Visit our website at pgim.com/investments
| | | | | | |
| Interested Board Members |
| | | | |
Name Year of Birth Position(s) Portfolios Overseen | | Principal Occupation(s) During Past Five Years | | Other Directorships Held During Past Five Years | | Length of Board Service |
| | | | |
Scott E. Benjamin 1973 Board Member & Vice President Portfolios Overseen: 95 | | Executive Vice President (since May 2009) of PGIM Investments LLC; Vice President (since June 2012) of Prudential Investment Management Services LLC; Executive Vice President (since September 2009) of AST Investment Services, Inc.; Senior Vice President of Product Development and Marketing, PGIM Investments (since February 2006); formerly Vice President of Product Development and Product Management, PGIM Investments LLC (2003-2006). | | None. | | Since March 2010 |
(1) The year that each Board Member joined the Board is as follows:
Ellen S. Alberding, 2013; Kevin J. Bannon, 2008; Linda W. Bynoe, 2005; Barry H. Evans, 2017; Keith F. Hartstein, 2013; Laurie Simon Hodrick, 2017; Michael S. Hyland, 2008; Richard A. Redeker, 1993; Stephen G. Stoneburn, 2003; Stuart S. Parker, Board Member since 2012 and President since 2012; Scott E. Benjamin, Board Member since 2010 and Vice President since 2009; Grace C. Torres, 2014.
| | | | |
| Fund Officers(a) | | | | |
| | | |
Name Year of Birth Fund Position | | Principal Occupation(s) During Past Five Years | | Length of Service as Fund Officer |
| | | |
Claudia DiGiacomo 1974 Chief Legal Officer | | Chief Legal Officer, Executive Vice President and Secretary of PGIM Investments LLC (since August 2020); Chief Legal Officer of Prudential Mutual Fund Services LLC (since August 2020); Chief Legal Officer of PIFM Holdco, LLC (since August 2020); Vice President and Corporate Counsel (since January 2005) of Prudential; and Corporate Counsel of AST Investment Services, Inc. (since August 2020); formerly Vice President and Assistant Secretary of PGIM Investments LLC (2005-2020); formerly Associate at Sidley Austin Brown & Wood LLP (1999-2004). | | Since December 2005 |
PGIM Emerging Markets Debt Hard Currency Fund
| | | | |
| Fund Officers(a) | | | | |
| | | |
Name Year of Birth Fund Position | | Principal Occupation(s) During Past Five Years | | Length of Service as Fund Officer |
| | | |
Dino Capasso 1974 Chief Compliance Officer | | Chief Compliance Officer (since July 2019) of PGIM Investments LLC; Chief Compliance Officer (since July 2019) of the PGIM Funds, Target Funds, Advanced Series Trust, The Prudential Series Fund, Prudential’s Gibraltar Fund, Inc., PGIM Global High Yield Fund, Inc., PGIM High Yield Bond Fund, Inc., and PGIM Short Duration High Yield Opportunities Fund; Vice President and Deputy Chief Compliance Officer (June 2017-2019) of PGIM Investments LLC; formerly Senior Vice President and Senior Counsel (January 2016-June 2017), and Vice President and Counsel (February 2012-December 2015) of Pacific Investment Management Company LLC. | | Since July 2019 |
| | | |
Andrew R. French 1962 Secretary | | Vice President (since December 2018) of PGIM Investments LLC; formerly Vice President and Corporate Counsel (2010-2018) of Prudential; formerly Director and Corporate Counsel (2006-2010) of Prudential; Vice President and Assistant Secretary (since January 2007) of PGIM Investments LLC; Vice President and Assistant Secretary (since January 2007) of Prudential Mutual Fund Services LLC. | | Since October 2006 |
| | | |
Diana N. Huffman 1982 Assistant Secretary | | Vice President and Corporate Counsel (since September 2015) of Prudential; Vice President and Assistant Secretary (since August 2020) of PGIM Investments LLC; formerly Associate at Willkie Farr & Gallagher LLP (2009-2015). | | Since March 2019 |
| | | |
Melissa Gonzalez 1980 Assistant Secretary | | Vice President and Corporate Counsel (since September 2018) of Prudential; Vice President and Assistant Secretary (since August 2020) of PGIM Investments LLC; formerly Director and Corporate Counsel (March 2014-September 2018) of Prudential. | | Since March 2020 |
| | | |
Patrick E. McGuinness 1986 Assistant Secretary | | Vice President and Assistant Secretary (since August 2020) of PGIM Investments LLC; Director and Corporate Counsel (since February 2017) of Prudential; and Corporate Counsel (2012-2017) of IIL, Inc. | | Since June 2020 |
| | | |
Debra Rubano 1975 Assistant Secretary | | Vice President and Corporate Counsel (since November 2020) of Prudential; formerly Director and Senior Counsel of Allianz Global Investors U.S. Holdings LLC (2010-2020) and Assistant Secretary of numerous funds in the Allianz fund complex (2015-2020). | | Since December 2020 |
| | | |
Kelly A. Coyne 1968 Assistant Secretary | | Director, Investment Operations of Prudential Mutual Fund Services LLC (since 2010). | | Since March 2015 |
Visit our website at pgim.com/investments
| | | | |
| Fund Officers(a) | | | | |
| | | |
Name Year of Birth Fund Position | | Principal Occupation(s) During Past Five Years | | Length of Service as Fund Officer |
| | | |
Christian J. Kelly 1975 Treasurer and Principal Financial and Accounting Officer | | Vice President, Head of Fund Administration of PGIM Investments LLC (since November 2018); formerly Director of Fund Administration of Lord Abbett & Co. LLC (2009-2018), Treasurer and Principal Accounting Officer of the Lord Abbett Family of Funds (2017-2018); Director of Accounting, Avenue Capital Group (2008-2009); Senior Manager, Investment Management Practice of Deloitte & Touche LLP (1998-2007). | | Since January 2019 |
| | | |
Lana Lomuti 1967 Assistant Treasurer | | Vice President (since 2007) and Director (2005-2007), within PGIM Investments Fund Administration; formerly Assistant Treasurer (December 2007-February 2014) of The Greater China Fund, Inc. | | Since April 2014 |
| | | |
Russ Shupak 1973 Assistant Treasurer | | Vice President (since 2017) and Director (2013-2017), within PGIM Investments Fund Administration. | | Since September 2019 |
| | | |
Deborah Conway 1969 Assistant Treasurer | | Vice President (since 2017) and Director (2007-2017), within PGIM Investments Fund Administration. | | Since September 2019 |
| | | |
Elyse M. McLaughlin 1974 Assistant Treasurer | | Vice President (since 2017) and Director (2011-2017), within PGIM Investments Fund Administration. | | Since September 2019 |
| | | |
Jonathan Corbett 1983 Anti-Money Laundering Compliance Officer | | Vice President, Corporate Compliance, Global Compliance Programs and Compliance Risk Management (since August 2019) of Prudential; formerly Vice President and Head of Key Risk Areas Compliance (March 2016 to July 2019), Chief Privacy Officer (March 2016 to July 2019) and Head of Global Financial Crimes Unit (April 2014 to March 2016) at MetLife. | | Since October 2021 |
(a) Excludes Mr. Parker and Mr. Benjamin, interested Board Members who also serve as President and Vice President, respectively.
Explanatory Notes to Tables:
| ∎ | | Board Members are deemed to be “Interested,” as defined in the 1940 Act, by reason of their affiliation with PGIM Investments LLC and/or an affiliate of PGIM Investments LLC. |
| ∎ | | Unless otherwise noted, the address of all Board Members and Officers is c/o PGIM Investments LLC, 655 Broad Street, Newark, New Jersey 07102-4410. |
| ∎ | | There is no set term of office for Board Members or Officers. The Board Members have adopted a retirement policy, which calls for the retirement of Board Members on December 31 of the year in which they reach the age of 75. |
| ∎ | | “Other Directorships Held” includes all directorships of companies required to register or file reports with the SEC under the 1934 Act (that is, “public companies”) or other investment companies registered under the 1940 Act. |
| ∎ | | “Portfolios Overseen” includes all investment companies managed by PGIM Investments LLC. The investment companies for which PGIM Investments LLC serves as manager include the PGIM Funds, Target Funds, The Prudential Variable Contract Accounts, PGIM ETF Trust, PGIM High Yield Bond Fund, Inc., PGIM Global High Yield Fund, Inc., PGIM Short Duration High Yield Opportunities Fund, The Prudential Series Fund, Prudential’s Gibraltar Fund, Inc. and the Advanced Series Trust. |
| ∎ | | As used in the Fund Officers table “Prudential” means The Prudential Insurance Company of America. |
PGIM Emerging Markets Debt Hard Currency Fund
Approval of Advisory Agreements (unaudited)
The Fund’s Board of Trustees
The Board of Trustees (the “Board”) of PGIM Emerging Markets Debt Hard Currency Fund (the “Fund”)1 consists of ten individuals, eight of whom are not “interested persons” of the Fund, as defined in the Investment Company Act of 1940, as amended (the “1940 Act”) (the “Independent Trustees”). The Board is responsible for the oversight of the Fund and its operations, and performs the various duties imposed on the directors of investment companies by the 1940 Act. The Independent Trustees have retained independent legal counsel to assist them in connection with their duties. The Chair of the Board is an Independent Trustee. The Board has established four standing committees: the Audit Committee, the Nominating and Governance Committee, and two Investment Committees. Each committee is chaired by, and composed of, Independent Trustees.
Annual Approval of the Fund’s Advisory Agreements
As required under the 1940 Act, the Board determines annually whether to renew the Fund’s management agreement with PGIM Investments LLC (“PGIM Investments”) and the Fund’s subadvisory agreement with PGIM, Inc. (“PGIM”) on behalf of its PGIM Fixed Income unit (“PGIM Fixed Income”) and PGIM Limited (“PGIML”). In considering the renewal of the agreements, the Board, including all of the Independent Trustees, met on June 7-10, 2021 and approved the renewal of the agreements through July 31, 2022, after concluding that the renewal of the agreements was in the best interests of the Fund and its shareholders.
In advance of the meetings, the Board requested and received materials relating to the agreements, and had the opportunity to ask questions and request further information in connection with its consideration. Among other things, the Board considered comparative fee information from PGIM Investments, PGIM Fixed Income and PGIML. Also, the Board considered comparisons with other mutual funds in relevant Peer Universes and Peer Groups, as is further discussed below.
In approving the agreements, the Board, including the Independent Trustees advised by independent legal counsel, considered the factors it deemed relevant, including the nature, quality and extent of services provided by PGIM Investments and the subadvisers, the performance of the Fund, the profitability of PGIM Investments and its affiliates, expenses and fees, and the potential for economies of scale that may be shared with the Fund and its shareholders as the Fund’s assets grow. In their deliberations, the Trustees did not identify any single factor which alone was responsible for the Board’s decision to approve the agreements with respect to the Fund. In connection with its deliberations, the Board considered information provided by PGIM Investments throughout the year at regular Board meetings, presentations from portfolio managers and other information, as well as information furnished at or in advance of the meetings on June 7-10, 2021.
| 1 | PGIM Emerging Markets Debt Hard Currency Fund is a series of Prudential World Fund, Inc. |
PGIM Emerging Markets Debt Hard Currency Fund
Approval of Advisory Agreements (continued)
The Trustees determined that the overall arrangements between the Fund and PGIM Investments, which serves as the Fund’s investment manager pursuant to a management agreement, and between each of PGIM Investments and PGIM, which, through its PGIM Fixed Income unit, and PGIML, which serve as the Fund’s subadvisers pursuant to the terms of a subadvisory agreement with PGIM Investments, are in the best interests of the Fund and its shareholders in light of the services performed, fees charged and such other matters as the Trustees considered relevant in the exercise of their business judgment.
The material factors and conclusions that formed the basis for the Trustees’ reaching their determinations to approve the continuance of the agreements are separately discussed below.
Nature, Quality and Extent of Services
The Board received and considered information regarding the nature, quality and extent of services provided to the Fund by PGIM Investments, PGIM Fixed Income, and PGIML. The Board noted that PGIM Fixed Income and PGIML are affiliated with PGIM Investments. The Board considered the services provided by PGIM Investments, including but not limited to the oversight of the subadvisers for the Fund, as well as the provision of fund recordkeeping, compliance and other services to the Fund, and PGIM Investments’ role as administrator for the Fund’s liquidity risk management program. With respect to PGIM Investments’ oversight of the subadvisers, the Board noted that PGIM Investments’ Strategic Investment Research Group (“SIRG”), which is a business unit of PGIM Investments, is responsible for monitoring and reporting to PGIM Investments senior management on the performance and operations of the subadvisers. The Board also considered that PGIM Investments pays the salaries of all of the officers and interested Trustees of the Fund who are part of Fund management. The Board also considered the investment subadvisory services provided by PGIM Fixed Income and PGIML, including investment research and security selection, as well as adherence to the Fund’s investment restrictions and compliance with applicable Fund policies and procedures. The Board considered PGIM Investments’ evaluation of the subadvisers, as well as PGIM Investments’ recommendation, based on its review of the subadvisers, to renew the subadvisory agreement.
The Board considered the qualifications, backgrounds and responsibilities of PGIM Investments’ senior management responsible for the oversight of the Fund, PGIM Fixed Income, and PGIML, and also considered the qualifications, backgrounds and responsibilities of PGIM Fixed Income’s portfolio managers who are responsible for the day-to-day management of the Fund’s portfolio. The Board was provided with information pertaining to PGIM Investments’, PGIM Fixed Income’s, and PGIML’s organizational structure, senior management, investment operations, and other relevant information pertaining to PGIM Investments, PGIM Fixed Income, and PGIML. The Board also noted that it received favorable compliance reports from the Fund’s Chief Compliance Officer (“CCO”) as to PGIM Investments, PGIM Fixed Income, and PGIML.
|
| Visit our website at pgim.com/investments |
The Board concluded that it was satisfied with the nature, extent and quality of the investment management services provided by PGIM Investments, the subadvisory services provided to the Fund by PGIM Fixed Income and PGIML, and that there was a reasonable basis on which to conclude that the Fund benefits from the services provided by PGIM Investments, PGIM Fixed Income, and PGIML under the management and subadvisory agreements.
Costs of Services and Profits Realized by PGIM Investments
The Board was provided with information on the profitability of PGIM Investments and its affiliates in serving as the Fund’s investment manager. The Board discussed with PGIM Investments the methodology utilized in assembling the information regarding profitability and considered its reasonableness. The Board recognized that it is difficult to make comparisons of profitability from fund management contracts because comparative information is not generally publicly available and is affected by numerous factors, including the structure of the particular adviser, the types of funds it manages, its business mix, numerous assumptions regarding allocations and the adviser’s capital structure and cost of capital. Taking these factors into account, the Board concluded that the profitability of PGIM Investments and its affiliates in relation to the services rendered was not unreasonable.
Economies of Scale
The Board received and discussed information concerning economies of scale that PGIM Investments may realize as the Fund’s assets grow beyond current levels. The Board noted that the management fee schedule for the Fund includes breakpoints, which have the effect of decreasing the fee rate as assets increase. During the course of time, the Board has considered information regarding the launch date of the Fund, the management fees of the Fund compared to those of similarly managed funds and PGIM Investments’ investment in the Fund over time. The Board noted that economies of scale can be shared with the Fund in other ways, including low management fees from inception, additional technological and personnel investments to enhance shareholder services, and maintaining existing expense structures in the face of a rising cost environment. The Board also considered PGIM Investments’ assertion that it continually evaluates the management fee schedule of the Fund and the potential to share economies of scale through breakpoints or fee waivers as asset levels increase.
The Board recognized the inherent limitations of any analysis of economies of scale, stemming largely from the Board’s understanding that most of PGIM Investments’ costs are not specific to individual funds, but rather are incurred across a variety of products and services.
Other Benefits to PGIM Investments, PGIM Fixed Income, and PGIML
The Board considered potential ancillary benefits that might be received by PGIM Investments, PGIM Fixed Income, PGIML and their affiliates as a result of their relationship with the Fund. The Board concluded that potential benefits to be derived by PGIM Investments included transfer agency fees received by the Fund’s transfer agent
PGIM Emerging Markets Debt Hard Currency Fund
Approval of Advisory Agreements (continued)
(which is affiliated with PGIM Investments), as well as benefits to its reputation or other intangible benefits resulting from PGIM Investments’ association with the Fund. The Board concluded that the potential benefits to be derived by PGIM Fixed Income and PGIML included the ability to use soft dollar credits, as well as the potential benefits consistent with those generally resulting from an increase in assets under management, specifically, potential access to additional research resources and benefits to their reputations. The Board concluded that the benefits derived by PGIM Investments, PGIM Fixed Income, and PGIML were consistent with the types of benefits generally derived by investment managers and subadvisers to mutual funds.
Performance of the Fund / Fees and Expenses
The Board considered certain additional factors and made related conclusions relating to the historical performance of the Fund for the one- and three-year periods ended December 31, 2020. The Board considered that the Fund commenced operations on December 12, 2017 and that longer-term performance was not yet available.
The Board also considered the Fund’s actual management fee, as well as the Fund’s net total expense ratio, for the fiscal period ended October 31, 2020. The Board considered the management fee for the Fund as compared to the management fee charged by PGIM Investments to other funds and the fee charged by other advisers to comparable mutual funds in a Peer Group. The actual management fee represents the fee rate actually paid by Fund shareholders and includes any fee waivers or reimbursements. The net total expense ratio for the Fund represents the actual expense ratio incurred by Fund shareholders.
The mutual funds included in the Peer Universe, which was used to consider performance, and the Peer Group, which was used to consider expenses and fees, were objectively determined by Broadridge, an independent provider of mutual fund data. In certain circumstances, PGIM Investments also provided supplemental Peer Universe or Peer Group information, for reasons addressed with the Board. The comparisons placed the Fund in various quartiles over various periods, with the first quartile being the best 25% of the mutual funds (for performance, the best performing mutual funds and, for expenses, the lowest cost mutual funds).
The section below summarizes key factors considered by the Board and the Board’s conclusions regarding the Fund’s performance, fees and overall expenses. The table sets forth net performance comparisons (which reflect the impact on performance of fund expenses, or any subsidies, expense caps or waivers that may be applicable) with the Peer Universe, actual management fees with the Peer Group (which reflect the impact of any subsidies or fee waivers), and net total expenses with the Peer Group, each of which were key factors considered by the Board.
|
| Visit our website at pgim.com/investments |
| | | | | | | | |
| | | | | |
Net Performance | | 1 Year | | 3 Years | | 5 Years | | 10 Years |
| | | | | |
| | | 3rd Quartile | | 3rd Quartile | | N/A | | N/A |
| | |
Actual Management Fees: 1st Quartile | | |
| |
Net Total Expenses: 1st Quartile |
| | · | | The Board noted that the Fund underperformed its benchmark index over the one-year and the three-year period. |
| | · | | The Board considered PGIM Investments’ assertion that the Fund’s performance was largely temporary and attributable to 2020. In that regard, the Board noted that when it evaluated the Fund’s performance one year prior (as of December 31, 2019), the Fund had outperformed its benchmark index and had ranked in the first quartile of its peer group over the one-year period. The Board also considered the Fund’s improved performance, noting that the Fund outperformed its benchmark index and peer group for the one-year period ended March 31, 2021. |
| | · | | The Board noted that the Fund does not yet have a five-year performance record and that, therefore, the subadviser should have more time to develop that record. |
| | · | | The Board and PGIM Investments agreed to retain the existing contractual expense cap that (exclusive of certain fees and expenses) caps total annual operating expenses at 1.05% for Class A shares, 1.80% for Class C shares, 0.75% for Class Z shares and 0.65% for Class R6 shares through February 28, 2022. |
| | · | | In addition, PGIM Investments will waive management fees or shared operating expenses on any share class to the same extent that it waives such expenses on any other share class, and has agreed that total annual fund operating expenses for Class R6 shares will not exceed total annual fund operating expenses for Class Z shares. |
| | · | | The Board concluded that, in light of the above, it would be in the best interests of the Fund and its shareholders to continue to allow the Fund to create a longer-term performance record, and to renew the agreements. |
| | · | | The Board concluded that the management fees (including subadvisory fees) and total expenses were reasonable in light of the services provided. |
* * *
After full consideration of these factors, the Board concluded that the approval of the agreements was in the best interests of the Fund and its shareholders.
PGIM Emerging Markets Debt Hard Currency Fund
| | | | |
| | | |
∎ MAIL | | ∎ TELEPHONE | | ∎ WEBSITE |
655 Broad Street | | (800) 225-1852 | | pgim.com/investments |
| | | |
Newark, NJ 07102 | | | | |
PROXY VOTING
The Board of Directors of the Fund has delegated to the Fund’s subadvisers the responsibility for voting any proxies and maintaining proxy recordkeeping with respect to the Fund. A description of these proxy voting policies and procedures is available without charge, upon request, by calling (800) 225-1852 or by visiting the Securities and Exchange Commission’s website at sec.gov. Information regarding how the Fund voted proxies relating to portfolio securities during the most recent 12-month period ended June 30 is available on the Fund’s website and on the Securities and Exchange Commission’s website.
DIRECTORS
Ellen S. Alberding · Kevin J. Bannon · Scott E. Benjamin · Linda W. Bynoe · Barry H. Evans · Keith F. Hartstein · Laurie Simon Hodrick · Stuart S. Parker · Brian K. Reid · Grace C. Torres
OFFICERS
Stuart S. Parker, President · Scott E. Benjamin, Vice President · Christian J. Kelly, Treasurer and Principal Financial and Accounting Officer · Claudia DiGiacomo, Chief Legal Officer · Dino Capasso, Chief Compliance Officer · Jonathan Corbett, Anti-Money Laundering Compliance Officer · Andrew R. French, Secretary · Melissa Gonzalez, Assistant Secretary · Diana N. Huffman, Assistant Secretary · Kelly A. Coyne, Assistant Secretary · Patrick E. McGuinness, Assistant Secretary · Debra Rubano, Assistant Secretary · Lana Lomuti, Assistant Treasurer · Russ Shupak, Assistant Treasurer · Elyse M. McLaughlin, Assistant Treasurer · Deborah Conway, Assistant Treasurer
| | | | |
| | |
| MANAGER | | PGIM Investments LLC | | 655 Broad Street Newark, NJ 07102 |
| | |
| SUBADVISERS | | PGIM Fixed Income | | 655 Broad Street Newark, NJ 07102 |
| | |
| | | PGIM Limited | | Grand Buildings, 1-3 Strand Trafalgar Square London, WC2N 5HR United Kingdom |
| | |
| DISTRIBUTOR | | Prudential Investment Management Services LLC | | 655 Broad Street Newark, NJ 07102 |
| | |
| CUSTODIAN | | The Bank of New York Mellon | | 240 Greenwich Street New York, NY 10286 |
| | |
| TRANSFER AGENT | | Prudential Mutual Fund Services LLC | | PO Box 9658 Providence, RI 02940 |
| | |
| INDEPENDENT REGISTERED PUBLIC ACCOUNTING FIRM | | PricewaterhouseCoopers LLP | | 300 Madison Avenue New York, NY 10017 |
| | |
| FUND COUNSEL | | Willkie Farr & Gallagher LLP | | 787 Seventh Avenue New York, NY 10019 |
An investor should consider the investment objectives, risks, charges, and expenses of the Fund carefully before investing. The prospectus and summary prospectus contain this and other information about the Fund. An investor may obtain the prospectus and summary prospectus by visiting our website at pgim.com/investments or by calling (800) 225-1852. The prospectus and summary prospectus should be read carefully before investing.
E-DELIVERY
To receive your mutual fund documents online, go to pgim.com/investments/resource/edelivery and enroll. Instead of receiving printed documents by mail, you will receive notification via email when new materials are available. You can cancel your enrollment or change your email address at any time by visiting the website address above.
SHAREHOLDER COMMUNICATIONS WITH DIRECTORS
Shareholders can communicate directly with the Board of Directors by writing to the Chair of the Board, PGIM Emerging Markets Debt Hard Currency Fund, PGIM Investments, Attn: Board of Directors, 655 Broad Street, Newark, NJ 07102. Shareholders can communicate directly with an individual Director by writing to that Director at the same address. Communications are not screened before being delivered to the addressee.
AVAILABILITY OF PORTFOLIO HOLDINGS
The Fund files its complete schedule of portfolio holdings with the Securities and Exchange Commission for the first and third quarters of each fiscal year as an exhibit to its reports on Form N-PORT. The Fund’s Form N-PORT filings are available on the Commission’s website at sec.gov.
The Fund’s Statement of Additional Information contains additional information about the Fund’s Directors and is available without charge, upon request, by calling (800) 225-1852.
Mutual Funds:
| | | | |
| | | |
ARE NOT INSURED BY THE FDIC OR ANY FEDERAL GOVERNMENT AGENCY | | MAY LOSE VALUE | | ARE NOT A DEPOSIT OF OR GUARANTEED BY ANY BANK OR ANY BANK AFFILIATE |

PGIM EMERGING MARKETS DEBT HARD CURRENCY FUND
| | | | | | | | |
| | | | |
SHARE CLASS | | A | | C | | Z | | R6 |
| | | | |
NASDAQ | | PDHAX | | PDHCX | | PDHVX | | PDHQX |
| | | | |
CUSIP | | 743969479 | | 743969461 | | 743969446 | | 743969453 |
MF239E
Item 2 – Code of Ethics — See Exhibit (a)
As of the end of the period covered by this report, the registrant has adopted a code of ethics (the “Section 406 Standards for Investment Companies – Ethical Standards for Principal Executive and Financial Officers”) that applies to the registrant’s Principal Executive Officer and Principal Financial Officer; the registrant’s Principal Financial Officer also serves as the Principal Accounting Officer.
The registrant hereby undertakes to provide any person, without charge, upon request, a copy of the code of ethics. To request a copy of the code of ethics, contact the registrant 800-225-1852, and ask for a copy of the Section 406 Standards for Investment Companies - Ethical Standards for Principal Executive and Financial Officers.
Item 3 – Audit Committee Financial Expert –
The registrant’s Board has determined that Ms. Grace C. Torres, member of the Board’s Audit Committee is an “audit committee financial expert,” and that she is “independent,” for purposes of this item.
Item 4 – Principal Accountant Fees and Services –
(a) Audit Fees
For the fiscal year ended October 31, 2021 and October 31, 2020, PricewaterhouseCoopers LLP (“PwC”), the Registrant’s principal accountant, billed the Registrant $244,900 and $244,900 respectively, for professional services rendered for the audit of the Registrant’s annual financial statements or services that are normally provided in connection with statutory and regulatory filings.
(b) Audit-Related Fees
For the fiscal years ended October 31, 2021 and October 31, 2020, PwC did not bill the Registrant for audit-related services.
For the fiscal year ended October 31, 2020, fees of $11,860 were billed to the Registrant for services rendered by KPMG LLP (the Registrant’s prior principal accountant) in connection with the auditor transition.
(c) Tax Fees
For the fiscal years ended October 31, 2021 and October 31, 2020: none.
(d) All Other Fees
For the fiscal years ended October 31, 2021 and October 31, 2020: none.
(e) (1) Audit Committee Pre-Approval Policies and Procedures
THE PGIM MUTUAL FUNDS
AUDIT COMMITTEE POLICY
on
Pre-Approval of Services Provided by the Independent
Accountants
The Audit Committee of each PGIM Mutual Fund is charged with the responsibility to monitor the independence of the Fund’s independent accountants. As part of this responsibility, the Audit Committee must pre-approve the independent accounting firm’s engagement to render audit and/or permissible non-audit services, as required by law. In evaluating a proposed engagement of the independent accountants, the Audit Committee will assess the effect that the engagement might reasonably be expected to have on the accountant’s independence. The Committee’s evaluation will be based on:
| | • | | a review of the nature of the professional services expected to be provided, |
| | • | | a review of the safeguards put into place by the accounting firm to safeguard independence, and |
| | • | | periodic meetings with the accounting firm. |
Policy for Audit and Non-Audit Services Provided to the Funds
On an annual basis, the scope of audits for each Fund, audit fees and expenses, and audit-related and non-audit services (and fees proposed in respect thereof) proposed to be performed by the Fund’s independent accountants will be presented by the Treasurer and the independent accountants to the Audit Committee for review and, as appropriate, approval prior to the initiation of such services.
Such presentation shall be accompanied by confirmation by both the Treasurer and the independent accountants that the proposed
non-audit services will not adversely affect the independence of the independent accountants. Such proposed non-audit services shall be described in sufficient detail to enable the Audit Committee to assess the appropriateness of such services and fees, and the compatibility of the provision of such services with the auditor’s independence. The Committee shall receive periodic reports on the progress of the audit and other services which are approved by the Committee or by the Committee Chair pursuant to authority delegated in this Policy.
The categories of services enumerated under “Audit Services”, “Audit-related Services”, and “Tax Services” are intended to provide guidance to the Treasurer and the independent accountants as to those categories of services which the Committee believes are generally consistent with the independence of the independent accountants and which the Committee (or the Committee Chair) would expect upon the presentation of specific proposals to pre-approve. The enumerated categories are not intended as an exclusive list of audit, audit-related or tax services, which the Committee (or the Committee Chair) would consider for pre-approval.
Audit Services
The following categories of audit services are considered to be consistent with the role of the Fund’s independent accountants:
| | • | | Annual Fund financial statement audits |
| | • | | Seed audits (related to new product filings, as required) |
| | • | | SEC and regulatory filings and consents |
Audit-related Services
The following categories of audit-related services are considered to be consistent with the role of the Fund’s independent accountants:
| | • | | Accounting consultations |
| | • | | Fund merger support services |
| | • | | Agreed Upon Procedure Reports |
| | • | | Other Internal Control Reports |
Individual audit-related services that fall within one of these categories (except for fund merger support services) and are not presented to the Audit Committee as part of the annual pre-approval process are subject to an authorized pre-approval by the Audit Committee so long as the estimated fee for those services does not exceed $30,000. Any services provided under such pre-approval will be reported to the Audit Committee at its next regular meeting. Should the amount of such services exceed $30,000 any additional fees will be subject to pre-approval by the Committee Chair (or any other Committee member on whom this responsibility has been delegated). Fees related to fund merger support services are subject to a separate authorized pre-approval by the Audit Committee with fees determined on a per occurrence and merger complexity basis.
Tax Services
The following categories of tax services are considered to be consistent with the role of the Fund’s independent accountants:
| | • | | Tax compliance services related to the filing or amendment of the following: |
| | • | | Federal, state and local income tax compliance; and, |
| | • | | Sales and use tax compliance |
| | • | | Timely RIC qualification reviews |
| | • | | Tax distribution analysis and planning |
| | • | | Tax authority examination services |
| | • | | Tax appeals support services |
| | • | | Accounting methods studies |
| | • | | Fund merger support services |
| | • | | Tax consulting services and related projects |
Individual tax services that fall within one of these categories and are not presented to the Audit Committee as part of the annual pre-approval process are subject to an authorized pre-approval by the Audit Committee so long as the estimated fee for those services does not exceed $30,000. Any services provided under such pre-approval will be reported to the Audit Committee at its next regular meeting. Should the amount of such services exceed $30,000 any additional fees will be subject to pre-approval by the Committee Chair (or any other Committee member on whom this responsibility has been delegated).
Other Non-Audit Services
Certain non-audit services that the independent accountants are legally permitted to render will be subject to pre-approval by the Committee or by one or more Committee members to whom the Committee has delegated this authority and who will report to the full Committee any pre-approval decisions made pursuant to this Policy. Non-audit services presented for pre-approval pursuant to this paragraph will be accompanied by a confirmation from both the Treasurer and the independent accountants that the proposed services will not adversely affect the independence of the independent accountants.
Proscribed Services
The Fund’s independent accountants will not render services in the following categories of non-audit services:
| | • | | Bookkeeping or other services related to the accounting records or financial statements of the Fund |
| | • | | Financial information systems design and implementation |
| | • | | Appraisal or valuation services, fairness opinions, or contribution-in-kind reports |
| | • | | Internal audit outsourcing services |
| | • | | Management functions or human resources |
| | • | | Broker or dealer, investment adviser, or investment banking services |
| | • | | Legal services and expert services unrelated to the audit |
| | • | | Any other service that the Public Company Accounting Oversight Board determines, by regulation, is impermissible. |
Pre-approval of Non-Audit Services Provided to Other Entities Within the PGIM Fund Complex
Certain non-audit services provided to PGIM Investments LLC or any of its affiliates that also provide ongoing services to the PGIM Mutual Funds will be subject to pre-approval by the Audit Committee. The only non-audit services provided to these entities that will require pre-approval are those related directly to the operations and financial reporting of the Funds. Individual projects that are not presented to the Audit Committee as part of the annual pre-approval process will be subject to pre-approval by the Committee Chair (or any other Committee member on whom this responsibility has been delegated) so long as the estimated fee for those services does not exceed $30,000. Services presented for pre-approval pursuant to this
paragraph will be accompanied by a confirmation from both the Treasurer and the independent accountants that the proposed services will not adversely affect the independence of the independent accountants.
Although the Audit Committee will not pre-approve all services provided to PGIM Investments LLC and its affiliates, the Committee will receive an annual report from the Fund’s independent accounting firm showing the aggregate fees for all services provided to PGIM Investments and its affiliates.
(e) (2) Percentage of services referred to in 4(b) – 4(d) that were approved by the audit committee –
For the fiscal years ended October 31, 2021 and October 31, 2020, 100% of the services referred to in Item 4(b) was approved by the audit committee.
(f) Percentage of hours expended attributable to work performed by other than full time employees of principal accountant if greater than 50%.
The percentage of hours expended on the principal accountant’s engagement to audit the registrant’s financial statements for the most recent fiscal year that were attributed to work performed by persons other than the principal accountant’s full-time, permanent employees was 0%.
(g) Non-Audit Fees
The aggregate non-audit fees billed by the Registrant’s principal accountant for services rendered to the registrant’s investment adviser and any entity controlling, controlled by, or under common control with the investment adviser that provides ongoing services to the registrant for the fiscal years ended October 31, 2021 and October 31, 2020 was $0 and $0, respectively.
(h) Principal Accountant’s Independence
Not applicable as the Registrant’s principal accountant has not provided non-audit services to the registrant’s investment adviser and any entity controlling, controlled by, or under common control with the investment adviser that provides ongoing services to the registrant that were not pre-approved pursuant to Rule 2-01(c)(7)(ii) of Regulation S-X.
| | |
| Item 5 – | | Audit Committee of Listed Registrants – Not applicable. |
| | |
| Item 6 – | | Schedule of Investments – The schedule is included as part of the report to shareholders filed under Item 1 of this Form. |
| | |
| Item 7 – | | Disclosure of Proxy Voting Policies and Procedures for Closed-End Management Investment Companies – Not applicable. |
| | |
| Item 8 – | | Portfolio Managers of Closed-End Management Investment Companies – Not applicable. |
| | |
| Item 9 – | | Purchases of Equity Securities by Closed-End Management Investment Company and Affiliated Purchasers – Not applicable. |
| | |
| Item 10 – | | Submission of Matters to a Vote of Security Holders – There have been no material changes to these procedures. |
| | |
| Item 11 – | | Controls and Procedures |
| | (a) | It is the conclusion of the registrant’s principal executive officer and principal financial officer that the effectiveness of the registrant’s current disclosure controls and procedures (such disclosure controls and procedures having been evaluated within 90 days of the date of this filing) provide reasonable assurance that the information required to be disclosed by the registrant has been recorded, processed, summarized and reported within the time period specified in the Commission’s rules and forms and that the information required to be disclosed by the registrant has been accumulated and communicated to the registrant’s principal executive officer and principal financial officer in order to allow timely decisions regarding required |
| | (b) | There has been no significant change in the registrant’s internal control over financial reporting that occurred during the registrant’s most recent fiscal quarter of the period covered by this report that has materially affected, or is likely to materially affect, the registrant’s internal control over financial reporting. |
Item 12 – Controls and Procedures - Disclosure of Securities Lending Activities for Closed-End Management Investment Companies – Not applicable.
Item 13 – Exhibits
SIGNATURES
Pursuant to the requirements of the Securities Exchange Act of 1934 and the Investment Company Act of 1940, the registrant has duly caused this report to be signed on its behalf by the undersigned, thereunto duly authorized.
| | |
| Registrant: | | Prudential World Fund, Inc. |
| |
| By: | | /s/ Andrew R. French |
| | Andrew R. French |
| | Secretary |
| |
| Date: | | December 17, 2021 |
Pursuant to the requirements of the Securities Exchange Act of 1934 and the Investment Company Act of 1940, this report has been signed below by the following persons on behalf of the registrant and in the capacities and on the dates indicated.
| | |
| By: | | /s/ Stuart S. Parker |
| | Stuart S. Parker |
| | President and Principal Executive Officer |
| |
| Date: | | December 17, 2021 |
| |
| By: | | /s/ Christian J. Kelly |
| | Christian J. Kelly |
| | Treasurer and Principal Financial and Accounting Officer |
| |
| Date: | | December 17, 2021 |